Embed Size (px)
Citation preview

2013Financial Statementson EIB activity in Africa, the Caribbean and Pacific, and the overseas territories
2013
Fin
anci
al S
tate
men
ts o
n E
IB a
ctiv
ity
in A
fric
a, t
he
Car
ibb
ean
an
d P
acifi
c, a
nd
th
e o
vers
eas
terr
ito
ries


12013 Financial Statements on EIB activity in Africa, the Caribbean and Pacific, and the overseas territories
Financial Statements
Financial Statements
3 Independent auditor’s report
4 Statement of the Audit Committee
5 Statement of financial position
6 Statement of profit or loss and other comprehensive income
7 Statement of changes in contributors’ resources
8 Statement of cash flows
10 Notes to the financial statements


32013 Financial Statements on EIB activity in Africa, the Caribbean and Pacific, and the overseas territories
Financial Statements
Report of the Réviseur d'Entreprise Agréé
We have audited the accompanying financial statements of the Investment Facility, which comprise the statement of fi-nancial position as at 31 December 2013 and the statements of profit or loss and other comprehensive income, changes in contributors’ resources and cash flow for the year then end-ed, and a summary of significant accounting policies and other explanatory information.
EUROPEAN INVESTMENT BANK Management’s responsibility for the financial statements
The EUROPEAN INVESTMENT BANK’s Management is respon-sible for the preparation and fair presentation of these finan-cial statements in accordance with International Financial Reporting Standards as adopted by the European Union, and for such internal control as the EUROPEAN INVESTMENT BANK’s Management determines is necessary to enable the preparation of financial statements that are free from materi-al misstatement, whether due to fraud or error.
Responsibility of the Réviseur d’Entreprises agréé
Our responsibility is to express an opinion on these financial statements based on our audit. We conducted our audit in accordance with International Standards on Auditing as adopted for Luxembourg by the Commission de Surveillance du Secteur Financier. Those standards require that we com-ply with ethical requirements and plan and perform the audit to obtain reasonable assurance about whether the financial statements are free from material misstatement.
An audit involves performing procedures to obtain audit evi-dence about the amounts and disclosures in the financial statements. The procedures selected depend on the judge-ment of the Réviseur d’Entreprises agréé, including the as-sessment of the risks of material misstatement of the financial statements, whether due to fraud or error. In making those risk assessments, the Réviseur d’Entreprises agréé considers internal control relevant to the entity’s preparation and fair presentation of the financial statements in order to design audit procedures that are appropriate in the circumstances, but not for the purpose of expressing an opinion on the ef-fectiveness of the entity’s internal control. An audit also in-cludes evaluating the appropriateness of accounting policies used and the reasonableness of accounting estimates made by the EUROPEAN INVESTMENT BANK’s Management, as well as evaluating the overall presentation of the financial state-ments.
We believe that the audit evidence we have obtained is suffi-cient and appropriate to provide a basis for our audit opinion.
Opinion
In our opinion, the financial statements give a true and fair view of the financial position of the Investment Facility as of 31 December 2013, and of its financial performance and its cash flows for the year then ended in accordance with Inter-national Financial Reporting Standards as adopted by the Euro pean Union.
To the Chairman of the Audit Committee of EUROPEAN INVESTMENT BANK98-100, Boulevard Konrad AdenauerL-2950 LUXEMBOURG
Luxembourg, 13 March 2014 KPMG Luxembourg S.à r.l. Cabinet de révision agréé
Emmanuel Dollé

4 Financial Statements on EIB activity in Africa, the Caribbean and Pacific, and the overseas territories 2013
Statement of the Audit Committee
The Financial Regulation applicable to the 10th European De-velopment Fund in Article 134 with regard to the operations managed by the European Investment Bank states that these operations shall be subject to the audit and discharge proce-dures laid down in the Statute of the Bank for all of its opera-tions. On this basis, the Audit Committee issues this statement.
Statement by the Audit Committee on the Investment Fa-cility’s financial statements prepared in accordance with International Financial Reporting Standards as adopted by the EU (IFRS)
The Committee, instituted in pursuance of Article 12 of the Statute and Chapter V of the Rules of Procedure of the Euro-pean Investment Bank for the purpose of verifying that the operations of the Bank are conducted and its books kept in a proper manner, having
– designated KPMG as external auditors, reviewed their audit planning process, examined and discussed their reports,
– noted that, in accordance with Article 7, paragraph 3 of the “Investment Facility Management Agreement”, the Bank shall prepare financial statements guided by International Public Sector Accounting or International Accounting Standards as appropriate,
– noted the opinion of KPMG on the financial statements of the Investment Facility for the year ended 31 December 2013,
– convened on a regular basis with the Heads of Directo-rates and relevant services, and studied the documents which it deemed necessary to examine in the discharge of its duties,
– received assurance from the Management Committee concerning the effectiveness of the internal control struc-ture and internal administration,
and considering
– the financial statements for the financial year ended 31 De-cember 2013 as drawn up by the Board of Directors at its meeting on 13 March 2014,
– that the foregoing provides a reasonable basis for its state-ment and,
– Articles 24, 25 and 26 of the Rules of Procedure,
to the best of its knowledge and judgement:
– confirms that the activities of the Investment Facility are conducted in a proper manner, in particular with regard to risk management and monitoring;
– has verified that the operations of the Investment Facility have been conducted and its books kept in a proper man-ner and that to this end, it has verified that the Investment Facility’s operations have been carried out in compliance with the formalities and procedures laid down by the Stat-ute and Rules of Procedure;
– confirms that the financial statements, comprising the bal-ance sheet, the income statement, the statement of changes in contributors’ resources, the cash flow state-ment and a summary of significant accounting policies and other explanatory information give a true and fair view of the financial position of the Investment Facility as at 31 December 2013 in respect of its assets and liabilities, and of the results of its operations for the year then ended, in accordance with IFRS.
Luxembourg, 13 March 2014
The Audit Committee
M. MATEJ M. ÜÜRIKE
B. JAKOBSEN J. N SCHAUS D. PITTA FERRAZ
52013 Financial Statements on EIB activity in Africa, the Caribbean and Pacific, and the overseas territories
Financial Statements
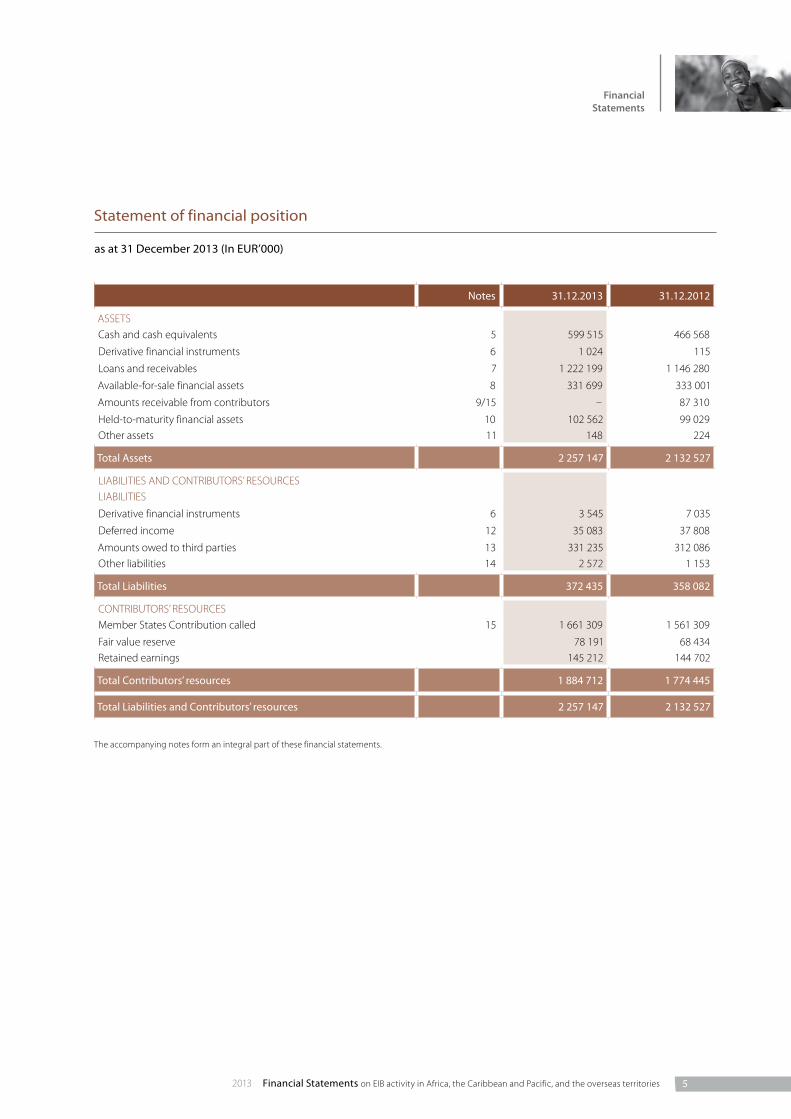
Statement of financial position
as at 31 December 2013 (In EUR’000)
Notes 31.12.2013 31.12.2012
ASSETSCash and cash equivalents 5 599 515 466 568
Derivative financial instruments 6 1 024 115
Loans and receivables 7 1 222 199 1 146 280
Available-for-sale financial assets 8 331 699 333 001
Amounts receivable from contributors 9/15 – 87 310
Held-to-maturity financial assets 10 102 562 99 029Other assets 11 148 224
Total Assets 2 257 147 2 132 527
LIABILITIES AND CONTRIBUTORS’ RESOURCESLIABILITIES
Derivative financial instruments 6 3 545 7 035
Deferred income 12 35 083 37 808
Amounts owed to third parties 13 331 235 312 086Other liabilities 14 2 572 1 153
Total Liabilities 372 435 358 082
CONTRIBUTORS’ RESOURCESMember States Contribution called 15 1 661 309 1 561 309
Fair value reserve 78 191 68 434Retained earnings 145 212 144 702
Total Contributors’ resources 1 884 712 1 774 445
Total Liabilities and Contributors’ resources 2 257 147 2 132 527
The accompanying notes form an integral part of these financial statements.

6 Financial Statements on EIB activity in Africa, the Caribbean and Pacific, and the overseas territories 2013
Notes From 01.01.2013to 31.12.2013
From 01.01.2012to 31.12.202
Interest and similar income 17 68 270 67 503Interest and similar expenses 17 -1 175 -1 114
Net interest and similar income 67 095 66 389Fee and commission income 18 4 051 1 934
Fee and commission expenses 18 -43 -292
Net fee and commission income 4 008 1 642 Fair value change of derivative financial instruments 4 399 5 348
Net realised gains on available-for-sale financial assets 19 5 294 1 045
Net foreign exchange loss -6 925 -10 575
Net result on financial operations 2 768 -4 182 Change in impairment on loans and receivables, net of reversal 7 -27 334 597
Impairment on available-for-sale financial assets 8 -8 176 -8 927
Impairment on other assets 20 - -337General administrative expenses 21 -37 851 -36 202
Profit for the year 510 18 980
Other comprehensive income:Items that are or may be reclassified to profit or loss:
Available-for-sale financial assets – Fair value reserve 8
1. Net change in fair value of available-for-sale financial assets 12 350 18 551
2. Net amount transferred to profit or loss -2 593 8 133
Total available-for-sale financial assets 9 757 26 684Total other comprehensive income 9 757 26 684
Total comprehensive income for the year 10 267 45 664
Statement of profit or loss and other comprehensive income
for the year ended 31 December 2013 (In EUR’000)
The accompanying notes form an integral part of these financial statements.

72013 Financial Statements on EIB activity in Africa, the Caribbean and Pacific, and the overseas territories
Financial Statements
Statement of changes in contributors’ resources
For the year ended 31 December 2013 (In EUR’000)
Notes Contribution called
Fair Value Reserve
Retained earnings
Total
At 1 January 2013 1 561 309 68 434 144 702 1 774 445
Member States contribution called during the year 15 100 000 - - 100 000Profit for the year 2013 - - 510 510
Total other comprehensive income for the year - 9 757 - 9 757Changes in contributors’ resources 100 000 9 757 510 110 267
At 31 December 2013 1 661 309 78 191 145 212 1 884 712
Notes Contribution called
Fair Value Reserve
Retained earnings
Total
At 1 January 2012 1 281 309 41 750 125 722 1 448 781
Member States contribution called during the year 15 280 000 - - 280 000Profit for the year 2012 - - 18 980 18 980
Total other comprehensive income for the year - 26 684 - 26 684Changes in contributors’ resources 280 000 26 684 18 980 325 664
At 31 December 2012 1 561 309 68 434 144 702 1 774 445
The accompanying notes form an integral part of these financial statements.
8 Financial Statements on EIB activity in Africa, the Caribbean and Pacific, and the overseas territories 2013
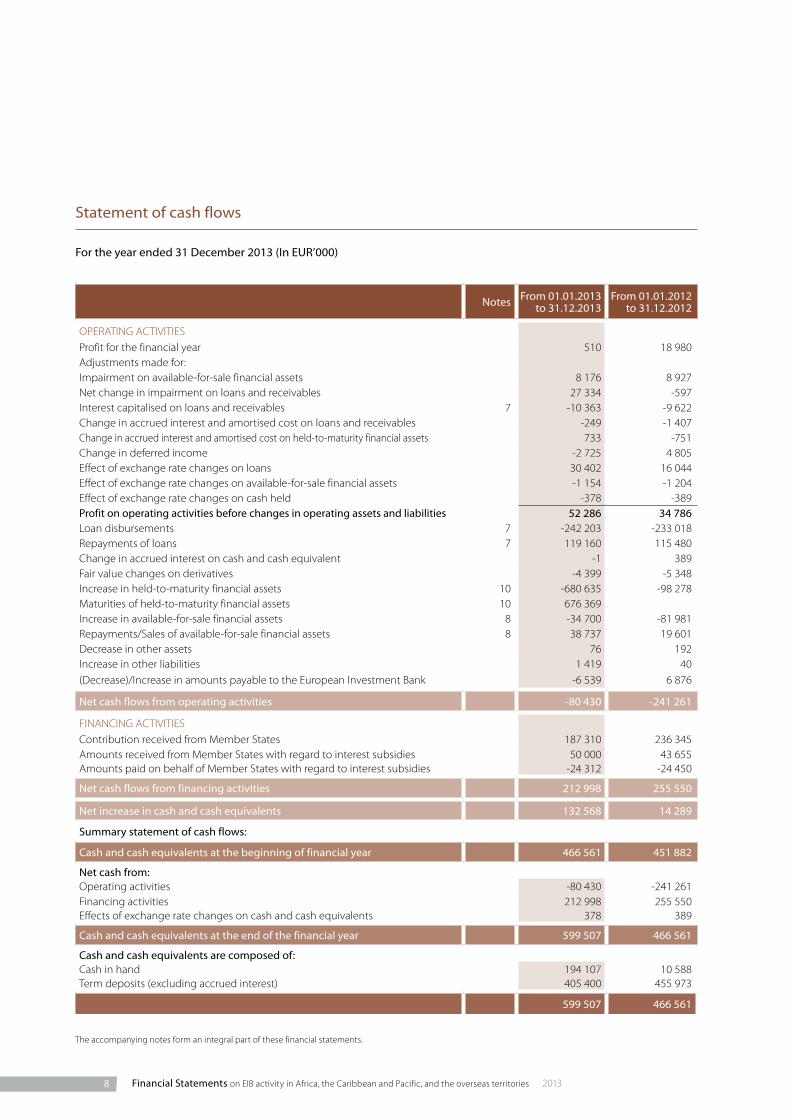
Statement of cash flows
For the year ended 31 December 2013 (In EUR’000)
Notes From 01.01.2013 to 31.12.2013
From 01.01.2012 to 31.12.2012
OPERATING ACTIVITIES Profit for the financial year 510 18 980Adjustments made for: Impairment on available-for-sale financial assets 8 176 8 927Net change in impairment on loans and receivables 27 334 -597Interest capitalised on loans and receivables 7 -10 363 -9 622Change in accrued interest and amortised cost on loans and receivables -249 -1 407Change in accrued interest and amortised cost on held-to-maturity financial assets 733 -751Change in deferred income -2 725 4 805Effect of exchange rate changes on loans 30 402 16 044Effect of exchange rate changes on available-for-sale financial assets -1 154 -1 204Effect of exchange rate changes on cash held -378 -389Profit on operating activities before changes in operating assets and liabilities 52 286 34 786Loan disbursements 7 -242 203 -233 018Repayments of loans 7 119 160 115 480Change in accrued interest on cash and cash equivalent -1 389Fair value changes on derivatives -4 399 -5 348Increase in held-to-maturity financial assets 10 -680 635 -98 278Maturities of held-to-maturity financial assets 10 676 369Increase in available-for-sale financial assets 8 -34 700 -81 981Repayments/Sales of available-for-sale financial assets 8 38 737 19 601Decrease in other assets 76 192Increase in other liabilities 1 419 40(Decrease)/Increase in amounts payable to the European Investment Bank -6 539 6 876
Net cash flows from operating activities -80 430 -241 261
FINANCING ACTIVITIES Contribution received from Member States 187 310 236 345Amounts received from Member States with regard to interest subsidies 50 000 43 655Amounts paid on behalf of Member States with regard to interest subsidies -24 312 -24 450
Net cash flows from financing activities 212 998 255 550
Net increase in cash and cash equivalents 132 568 14 289
Summary statement of cash flows:
Cash and cash equivalents at the beginning of financial year 466 561 451 882
Net cash from:Operating activities -80 430 -241 261Financing activities 212 998 255 550Effects of exchange rate changes on cash and cash equivalents 378 389
Cash and cash equivalents at the end of the financial year 599 507 466 561
Cash and cash equivalents are composed of:Cash in hand 194 107 10 588Term deposits (excluding accrued interest) 405 400 455 973
599 507 466 561
The accompanying notes form an integral part of these financial statements.

10 Financial Statements on EIB activity in Africa, the Caribbean and Pacific, and the overseas territories 2013
Notes to the financial statements as at 31 December 2013
1 General information
The Investment Facility (“the Facility” or “IF”) has been estab-lished within the framework of the Cotonou Agreement (the “Agreement”) on co-operation and development assistance negotiated between the African, Caribbean and Pacific Group of States (the “ACP States”) and the European Union and its Member States on 23 June 2000, revised on 25 June 2005 and 23 June 2010.
The Facility is not a separate legal entity and the European In-vestment Bank (“EIB” or “the Bank”) manages the contributions on behalf of the Member States (“Donors”) in accordance with the terms of the Agreement and acts as an administrator of the Facility.
Financing under the Agreement is provided from EU Member States’ budgets and is disbursed according to financial proto-cols defined for successive five- to six-year periods. Within the framework of the Agreement and following the entry into force of a second financial protocol on 1 July 2008 (covering the pe-riod 2008-2013), referred to as the 10th European Development Fund (“EDF”), the EIB is entrusted with the management of:
– the Facility, a EUR 3 185.5 million risk-bearing revolving fund geared to fostering private sector investment in ACP coun-tries of which EUR 48.5 million are allocated to Overseas Countries and territories (“OCT countries”);
– grants for the financing of interest rate subsidies worth EUR 400 million for ACP countries and EUR 1.5 million for OCT countries. Up to 15% (10% up the end of 2012) of these subsi-dies can be used to fund project-related technical assistance.
The present financial statements cover the period from 1 Janu-ary 2013 to 31 December 2013.
On a proposal from the Management Committee of EIB, the Board of Directors of EIB adopted the Financial Statements on 13 March 2014, and authorised their submission to the Board of Governors for approval by 29 April 2014.
2 Significant accounting policies
2.1 Basis of preparation – Statement of compliance
The Facility’s financial statements have been prepared in ac-cordance with International Financial Reporting Standards (IFRS) as adopted by the European Union.
2.2 Significant accounting judgments and estimates
The preparation of financial statements requires the use of ac-counting estimates. It also requires the European Investment Bank’s Management to exercise its judgment in the process of applying the Investment Facility’s accounting policies. The areas involving a higher degree of judgment or complexity, or areas where assumptions and estimates are significant to the financial statements are disclosed hereafter.
The most significant use of judgments and estimates are as fol-lows:
Measurement of fair values of financial instruments
Fair values of financial assets and financial liabilities that are traded in active markets are based on quoted market prices or broker price quotations. Where the fair values cannot be de-rived from active markets, they are determined using a variety of valuation techniques that include the use of mathematical models. The input to these models is taken from observable markets where possible, but where this is not feasible, a degree of judgement is required in establishing fair values. The valua-tions are categorised into different levels in the fair value hierar-chy based on the inputs used in the valuation techniques as described and disclosed in Notes 2.4.3 and 4.
These valuation techniques may include net present value and discounted cash flow models, comparison to similar instru-ments for which market observable prices exist, Black-Scholes and polynomial option pricing models and other valuation models. Assumptions and inputs used in valuation techniques include risk-free and benchmark interest rates, credit spreads used in estimating discount rates, bond and equity prices, for-eign currency exchange rates, equity and equity index prices and expected price volatilities and correlations.
The objective of valuation techniques is to arrive at a fair value measurement that reflects the price that would be received to sell the asset or paid to transfer the liability in an orderly trans-action between market participants at the measurement date.
The Facility uses widely recognised valuation models for deter-mining the fair value of common and more simple financial in-struments, like interest rate and currency swaps that use only observable market data and require limited management judgement and estimation. Observable prices and model in-puts are usually available in the market for listed debt and equi-ty securities, exchange traded derivatives and simple over the
112013 Financial Statements on EIB activity in Africa, the Caribbean and Pacific, and the overseas territories
Financial Statements
counter derivatives like interest rate swaps. Availability of ob-servable market prices and model inputs reduces the need for management judgement and estimation and also reduces the uncertainty associated with determination of fair values. Avai l-ability of observable market prices and inputs varies depending on the products and markets and is prone to changes based on specific events and general conditions in the financial markets.
For more complex instruments, the Facility uses own valuation models, which are developed from recognised valuation mod-els. Some or all of the significant inputs into these models may not be observable in the market, and are derived from market prices or rates or are estimated based on assumptions. Exam-ple of instruments involving significant unobservable inputs includes certain loans and guarantees for which there is no ac-tive market. Valuation models that employ significant unob-servable inputs require a higher degree of management judgement and estimation in the determination of fair value. Management judgement and estimation are usually required for selection of the appropriate valuation model to be used, determination of expected future cash flows on the financial instrument being valued, determination of probability or coun-terparty default and prepayments and selection of appropriate discount rates.
The Facility has an established control framework with respect to the measurement of fair values. This framework includes the EIB’s Investment Bank’s Risk Management and Market Data Management functions. These functions are independent of front office management and are responsible for verifying sig-nificant fair value measurements. Specific controls include:
– Verification of observable pricing;– A review and approval process for new valuation models
and changes to existing models;– Calibration and back testing of models against observed
market transactions;– Analysis and investigation of significant valuation movements;– Review of significant unobservable inputs and valuation ad-
justments.
Where third-party information such as broker quotes or pricing services are used to measure fair value, the Facility verifies that such valuations meet the requirements of IFRS. This includes the following:
– Determining where broker quote or pricing service pricing is appropriate;
– Assessing whether a particular broker quote or pricing ser-vice is reliable;
– Understanding how the fair value has been arrived at and the extent to which it represents actual market transactions;
– When prices for similar instruments are used to measure fair value, how these prices have been adjusted to reflect the characteristics of the instrument subject to measurement.
Impairment losses on loans and receivables
The Facility reviews its loans and receivables at each reporting date to assess whether an allowance for impairment should be recorded in the statement of profit or loss and other compre-hensive income. In particular, judgment by the European In-vestment Bank’s Management is required in the estimation of the amount and timing of future cash flows when determining the level of allowance required. Such estimates are based on assumptions about a number of factors and actual results may differ, resulting in future changes to the allowance. In addition to specific allowances against individually significant loans and receivables, the Facility may also book a collective impairment allowance against exposures which have not been individually identified as impaired and have a greater risk of default than when originally granted.
In principle, a loan is considered as impaired when payment of interest and principal are past due by 90 days or more and, at the same time, the European Investment Bank’s Management considers that there is an objective indication of impairment.
Valuation of unquoted available-for-sale equity investments
Valuation of unquoted available-for-sale equity investments is normally based on one of the following:
– recent arm’s length market transactions; – current fair value of another instrument that is substantially
the same; – the expected cash flows discounted at current rates applic-
able for items with similar terms and risk characteristics; – adjusted net assets method; or – other valuation models.
The determination of the cash flows and discount factors for unquoted available-for-sale equity investments requires sig-nificant estimation. The Facility calibrates the valuation tech-niques periodically and tests them for validity using either price from observable current market transactions in the same instrument or from other available observable market data.
Impairment of available-for-sale financial assets
The Facility treats available-for-sale equity investments as im-paired when there has been a significant or prolonged decline in the fair value below its cost or where other objective evi-dence of impairment exists. The determination of what is “sig-nificant” or “prolonged” requires judgment. The Facility treats “significant” generally as 30% or more and “prolonged” greater than 12 months. In addition, the Facility evaluates other factors, including normal volatility in share price for quoted equities and the future cash flows and the discount factors for unquot-ed equities.
12 Financial Statements on EIB activity in Africa, the Caribbean and Pacific, and the overseas territories 2013
2.3 Changes in accounting policies
Except for the changes below, the Facility has consistently ap-plied the accounting policies set out in Note 2.4 to all periods presented in these financial statements. The Facility has adopt-ed the following new standards and amendments to standards.
Standard adopted
The following standards, amendments to standards and inter-pretations were adopted in the preparation of these financial statements:
Amendments to IAS 1 Presentation of items of Other comprehen-sive income (OCI)
As a result of the amendments to IAS 1, the Facility has modi-fied the presentation of items of OCI in its statement of profit or loss and OCI, to present separately items that would be reclassi-fied to profit or loss from those that would never be. Compara-tive information has been re-presented accordingly.
IFRS 13 Fair value measurement
This standard establishes a single framework for measuring fair value and making disclosures about fair value measurements when such measurements are required or permitted by other IFRSs. It unifies the definition of fair value as the price that would be received to sell an asset or paid to transfer a liability in an orderly transaction between market participants at the measurement date. It replaces and expands the disclosure re-quirements about fair value measurements in other IFRSs, in-cluding IFRS 7. As a result, the Facility has included additional disclosures in this regard. In accordance with the transitional provisions of IFRS 13, the Facility has applied the new fair value measurement guidance prospectively and has not provided any comparative information for new disclosures.
IFRS 13 refers to a number of valuation adjustments which the Facility has considered in the valuations of its derivatives, namely:
– credit value adjustments (CVA), reflecting the counterparties credit risk embedded in the fair value of derivatives;
– debit value adjustments (DVA), reflecting the Facility’s own credit embedded in the fair value of derivatives.
CVA per counterparty is calculated on the potential future expo-sure (PFE) and expected positive exposure (EPE) measures, per net counterparty exposure. The probabilities of default per coun-terparty are then modelled using market-available CDS spreads. For counterparties without available CDS spreads, spreads of banks of similar size and rating in similar jurisdictions are used.
The adoption of this standard resulted in the recognition of a loss of EUR 184k in the current period statement of profit or loss and other comprehensive income, as described in Note 4.
Standards issued but not yet effective
The following standards, amendments to standards and inter-pretations are effective for annual periods beginning after 1 January 2013, and have not been applied in preparing these Financial Statements. Those of which may be relevant for the Facility are set out below. The Facility does not plan to adopt these standards early.
IFRS 9 Financial instruments
The first step in a three part project by the IASB to replace IAS 39 Financial instruments, this standard redefines the categories of financial assets and liabilities and their accounting treatment. The standard remains a ‘work in progress’ and it will eventually replace IAS 39 in its entirety. The current effective date of the standard is no earlier than 1 January 2017. IFRS 9 has not yet been endorsed by the European Union. The Facility does not plan to adopt this standard early and the extent of the impact has not yet been determined.
The following three standards were issued in 2012 and have been endorsed by the European Union being effective for an-nual periods beginning after 1 January 2014. The impact of the adoption of these standards on the Facility’s financial state-ments has not yet been determined.
IFRS 10 Consolidated financial statements
This standard establishes the principles for the presentation and preparation of consolidated financial statements when an entity controls one or more other entities.
IFRS 11 Joint arrangements
This standard sets up a framework for determining the type of joint arrangements that an entity has with another entity.
IFRS 12 Disclosure of interests in other entities
The objective of this standard is to require the disclosure of in-formation that enables users of financial statements to evaluate the nature of, and risks associated with, its interests in other en-tities and the effects of those interests on its financial position, financial performance and cash flows.
2.4 Summary of significant accounting policies
The statement of financial position represents assets and liabil-ities in decreasing order of liquidity and does not distinguish between current and non-current items.
2.4.1 Foreign currency translation
The Facility uses the Euro (EUR) for presenting its financial state-ments, which is also the functional currency. Except as other-wise indicated, financial information presented in EUR has been rounded to the nearest thousand.

132013 Financial Statements on EIB activity in Africa, the Caribbean and Pacific, and the overseas territories
Financial Statements
Foreign currency transactions are translated, at the exchange rate prevailing on the date of the transaction.
Monetary assets and liabilities denominated in currencies other than Euro are translated into Euro at the exchange rate prevail-ing at the balance sheet date. The gain or loss arising from such translation is recorded in the statement of profit or loss and other comprehensive income.
Non-monetary items that are measured in terms of historical cost in a foreign currency are translated using the exchange rates at the dates of the initial transactions. Non-monetary items measured at fair value in a foreign currency are translated using the exchange rates at the date when the fair value was determined.
Exchange differences arising on the settlement of transactions at rates different from those at the date of the transaction, and unrealised foreign exchange differences on unsettled foreign currency monetary assets and liabilities, are recognised in the statement of profit or loss and other comprehensive income.
The elements of the statement of profit or loss and other com-prehensive income are translated into Euro on the basis of the exchange rates prevailing at the end of each month.
2.4.2 Cash and cash equivalents
The Facility defines cash and cash equivalents as current ac-counts, short-term deposits or commercial papers with original maturities of three months or less.
2.4.3 Financial assets other than derivatives
Financial assets are accounted for using the settlement date basis.
Fair value of financial instruments
Fair value is the price that would be received to sell an asset or paid to transfer a liability in an orderly transaction between market participants at the measurement date in the principal, or in its absence, the most advantageous market to which the Facility has access at that date.
When applicable, the EIB on behalf of the Facility measures the fair value of an instrument using the quoted price in an active market for that instrument. A market is regarded as active if transactions for the asset or liability take place with sufficient frequency and volume to provide pricing information on an on-going basis.
Where the fair values of financial assets and financial liabilities recorded on the balance sheet cannot be derived from active markets, they are determined using a variety of valuation tech-niques that include the use of mathematical models. The in-put to these models is taken from observable markets where
possible, but where this is not feasible, a degree of judgement is required in establishing fair values. The chosen valuation technique incorporates all the factors that market participants would take into account in pricing a transaction.
The EIB measures fair values using the following fair value hier-archy that reflects the significance of the inputs used in making the measurements:
– Level 1: inputs that are unadjusted quoted market prices in active markets for identical instruments to which the Facility has access.
– Level 2: inputs other than quoted prices included within Lev-el 1 that are observable either directly (i.e. as prices) or indi-rectly (i.e. derived from prices). This category includes instruments valued using quoted market prices in active markets for similar instruments, quoted prices for identical or similar instruments in markets that are considered less than active or other valuation techniques where all significant in-puts are directly or indirectly observable from market data.
– Level 3: inputs that are not observable. This category in-cludes all instruments where the valuation technique in-cludes inputs not based on observable data and the unobservable inputs have a significant effect on the instru-ment’s valuation. This category includes instruments that are valued based on quoted prices for similar instruments where significant unobservable adjustments or assumptions are re-quired to reflect differences between the instruments.
The Facility recognises transfers between levels of the fair value hierarchy as of the end of the reporting period during which the change has occurred.
Held-to-maturity financial assets
Held-to-maturity financial assets comprise quoted bonds with the intention of holding them to maturity.
Those bonds are initially recorded at their fair value plus any di-rectly attributable transaction cost. The difference between entry price and redemption value is amortised in accordance with the effective interest method over the remaining life of the bond.
The Facility assesses at each balance sheet date whether there is any objective evidence that a financial asset or a group of fi-nancial assets is impaired. A financial asset or a group of finan-cial assets is deemed to be impaired if, and only if, there is objective evidence of impairment as a result of one or more events that has occurred after the initial recognition of the asset (an incurred “loss event”) and that loss event (or event) has an impact on the estimated future cash flows of the financial asset or the group of financial assets that can be reliably estimated. Impairment loss is recognised in profit and loss and the amount of the loss is measured as the difference between the carrying
14 Financial Statements on EIB activity in Africa, the Caribbean and Pacific, and the overseas territories 2013
value and the present value of estimated future cash flows dis-counted at the instrument’s original effective interest rate.
Loans
Loans originated by the Facility are recognised in the assets of the Facility when cash is advanced to borrowers. They are ini-tially recorded at cost (net disbursed amounts), which is the fair value of the cash given to originate the loan, including any transaction costs, and are subsequently measured at amortised cost, using the effective yield method, less any provision for im-pairment or uncollectability.
Available-for-sale financial assets
Available-for-sale financial assets are those which are designat-ed as such or do not qualify to be classified as designated at fair value through profit or loss, held-to-maturity or loans and re-ceivables. They include direct equity investments and invest-ments in venture capital funds.
After initial measurement, available-for-sale financial assets are subsequently carried at fair value. Note the following details for the fair value measurement of equity investments, which can-not be derived from active markets:
a. Venture capital funds
The fair value of each venture capital fund is based on the latest available Net Asset Value (NAV), reported by the fund, if calcu-lated based on international valuation guidelines recognised to be in line with IFRS (for example: the International Private Equity and Venture Capital Valuation guidelines, IPEV Guidelines, as published by the European Venture Capital Association). The Fa-cility may however decide to adjust the NAV reported by the fund if there are issues that may affect the valuation.
b. Direct equity investments
The fair value of the investment is based on the latest set of fi-nancial statements available, re-using, if applicable, the same model as the one used at the acquisition of the participation.
Unrealised gains or losses on venture capital funds and direct equity investments are reported in contributors’ resources until such investments are sold, collected or disposed of, or until such investments are determined to be impaired. If an avail-able-for-sale investment is determined to be impaired, the cu-mulative unrealised gain or loss previously recognised in equity is transferred to the statement of profit or loss and other com-prehensive income.
For unquoted investment, the fair value is determined by ap-plying recognised valuation techniques (for example adjusted net assets, discounted cash flows or multiple). These invest-ments are accounted for at cost when the fair value cannot be
reliably measured. To be noted that in the first 2 years of the in-vestments, they are recognised at cost.
The participations acquired by the Facility typically represent investments in private equity or venture capital funds. Accord-ing to industry practice, such investments are generally invest-ments jointly subscribed by a number of investors, none of whom is in a position to individually influence the daily opera-tions and the investment activity of such fund. As a conse-quence, any membership by an investor in a governing body of such fund does not in principle entitle such investor to influ-ence the day-to-day operations of the fund. In addition, indi-vidual investors in a private equity or a venture capital fund do not determine policies of a fund such as distribution policies on dividends or other distributions. Such decisions are typically taken by the management of a fund on the basis of the share-holders agreement governing the rights and obligations of the management and all shareholders of the fund. The sharehold-ers’ agreement also generally prevents individual investors from bilaterally executing material transactions with the fund, interchanging managerial personnel or obtaining privileged access to essential technical information. The Facility’s invest-ments are executed in line with the above stated industry practice, ensuring that the Facility neither controls nor exercis-es any form of significant influence within the meaning of IAS 27 and IAS 28 over any of these investments, including those investments in which the Facility holds over 20 % of the voting rights.
Guarantees
At initial recognition, the financial guarantees are recognised at fair value corresponding to the Net Present Value (NPV) of ex-pected premium inflows. This calculation is performed at the starting date of each transaction and is recognised on balance sheet as “Financial guarantees” under “other assets” and “other liabilities”.
Subsequent to initial recognition, the Facility’s liabilities under such guarantees are measured at the higher of:
– the best estimate of expenditure required to settle any fi-nancial obligation arising as a result of the guarantee, which is estimated based on all relevant factors and information existing at the date of the statement of financial position.
– the amount initially recognised less cumulative amortisation. The amortisation of the amount initially recognised is done using the actuarial method.
Any increase or decrease in the liability relating to financial guarantees is taken to the statement of profit or loss and other comprehensive income under “fee and commission income”.
The Facility’s assets under such guarantee are subsequently am-ortized using the actuarial method and tested for impairment.

152013 Financial Statements on EIB activity in Africa, the Caribbean and Pacific, and the overseas territories
Financial Statements
In addition, when a guarantee agreement is signed, it is pre-sented as a contingent liability for the Facility and when the guarantee is engaged, as a commitment for the Facility.
2.4.4 Impairment of financial assets
The Facility assesses at each balance sheet date whether there is any objective evidence that a financial asset is impaired. A fi-nancial asset or a group of financial assets is deemed to be im-paired if, and only if, there is objective evidence of impairment as a result of one or more events that has occurred after the ini-tial recognition of the asset (an incurred “loss event”) and that loss event has an impact on the estimated future cash flows of the financial asset or the group of financial assets that can be reliably estimated. Evidence of impairment may include indica-tions that the borrower or a group of borrowers is experiencing significant financial difficulty, default or delinquency in interest or principal payments, the probability that they will enter into bankruptcy or other financial reorganisation and where ob-servable data indicate that there is a measurable decrease in the estimated future cash flows, such as changes in arrears or economic conditions that correlate with defaults.
For the loans outstanding at the end of the financial year and carried at amortised cost, impairments are made when present-ing objective evidence of risks of non-recovery of all or part of their amounts according to the original contractual terms or the equivalent value. If there is objective evidence that an impair-ment loss has been incurred, the amount of the loss is measured as the difference between the assets carrying amount and the present value of estimated future cash flows. The carrying amount of the asset is reduced through the use of an allowance account and the amount of the loss is recognised in the state-ment of profit or loss and other comprehensive income. Interest income continues to be accrued on the reduced carrying amount based on the effective interest rate of the asset. Loans together with the associated allowance are written off when there is no realistic prospect of future recovery. If, in a subsequent year, the amount of the estimated impairment loss increases or decreases because of an event occurring after the impairment was recognised, the previously recognised impairment loss is in-creased or reduced by adjusting the allowance account.
The Facility conducts the credit risk assessments based on each individual operation and does not consider a collective impairment.
For the available-for-sale financial assets, the Facility assesses at each balance sheet date whether there is objective evidence that an investment is impaired. Objective evidence would in-clude a significant or prolonged decline in the fair value of the investment below its costs. Where there is evidence of impair-ment, the cumulative loss (measured as the difference be-tween the acquisition cost and the current fair value, less any
impairment loss on that investment previously recognised in the statement of profit or loss and other comprehensive in-come) is removed from contributors’ resources and recognised in the statement of profit or loss and other comprehensive in-come. Impairment losses on available-for-sale financial assets are not reversed through the statement of profit or loss and other comprehensive income; increases in their fair value after impairment are recognised directly in contributors’ resources.
The European Investment Bank’s Risk Management reviews fi-nancial assets for impairment at least once a year. Resulting ad-justments include the unwinding of the discount in the statement of profit or loss and other comprehensive income over the life of the asset, and any adjustments required in re-spect of a reassessment of the initial impairment.
2.4.5 Derivative financial instruments
Derivatives include cross currency swaps, cross currency inter-est rate swaps, short term currency swaps and interest rate swaps.
In the normal course of its activity, the Facility may enter into swap contracts with a view to hedge specific lending opera-tions or into currency forward contract with a view to hedge its currency positions, denominated in actively traded currencies other than the Euro, in order to offset any gain or loss caused by foreign exchange rate fluctuations.
The Facility does not use any of the hedge possibilities under IAS 39. All derivatives are measured at fair value through the profit or loss and are reported as derivative financial instru-ments. Fair values are derived primarily from discounted cash-flow models, option-pricing models and from third party quotes.
Derivatives are recorded at fair value and carried as assets when their fair value is positive and as liabilities when their fair value is negative. Changes in the fair value of derivative finan-cial instruments are shown in the income statement under “Fair value change of derivative financial instruments”.
Derivatives are initially recognised using the trade date basis.
2.4.6 Contributions
Contributions from Member States are recognised as receiv-ables in the statement of financial position on the date of the Council Decision fixing the financial contribution to be paid by the Member States to the Facility.
The Member States contributions meet the following condi-tions and are consequently classified as equity:
– as defined in the contribution agreement, they entitle the Member States to decide on the utilisation of the Facility’s net assets in the events of the Facility’s liquidation;
16 Financial Statements on EIB activity in Africa, the Caribbean and Pacific, and the overseas territories 2013
– they are in the class of instruments that is subordinate to all other classes of instruments;
– all financial instruments in the class of instruments that is subordinate to all other classes of instruments have identical features;
– the instrument does not include any features that would re-quire classification as a liability; and
– the total expected cash flows attributable to the instrument over its life are based substantially on the profit or loss, the change in the recognised net assets or the change in the fair value of the recognised and unrecognised net assets of the Facility over the life of the instrument.
2.4.7 Interest income on loans
Interest on loans originated by the Facility is recorded in the statement of profit or loss and other comprehensive income (‘In-terest and similar income’) and on the statement of financial po-sition (‘Loans and receivables’) on an accrual basis using the effective interest rate, which is the rate that exactly discounts es-timated future cash payments or receipts through the expected life of the loan to the net carrying amount of the loan. Once the recorded value of a loan has been reduced due to impairment, interest income continues to be recognised using the original effective interest rate applied to the new carrying amount.
2.4.8 Interest subsidies and technical assistance
As part of its activity, the Facility manages interest subsidies and technical assistance (“TA”) on behalf of the Member States.
The part of the Member States contributions allocated to the payment of interest subsidies and TA is not accounted for in the Facility’s contributors’ resources but is classified as amounts owed to third parties. The Facility operates the disbursement to the final beneficiaries and then decreases the amounts owed to third parties.
When amounts contributed with regard to interest subsidies and TA are not fully granted, they are reclassified as contribu-tion to the Facility.
2.4.9 Interest income on cash and cash equivalents
Interest income on cash and cash equivalents is recognised in the statement of profit or loss and other comprehensive in-come of the Facility on an accrual basis.
2.4.10 Fees, commissions and dividends
Fees received in respect of services provided over a period of time are recognised as income as the services are provided. Commitment fees are deferred and recognised in income us-ing the effective interest method over the period from dis-bursement to repayment of the related loan.
Dividends relating to available-for-sale financial assets are rec-ognised when received.
2.4.11 Taxation
The Protocol on the Privileges and Immunities of the European Communities, appended to the treaty on the European Union and the treaty of the functioning of the European Union, stipu-lates that the assets, revenues and other property of the Institu-tions of the Union are exempt from all direct taxes.
3 Risk management
This note presents information about the Facility’s exposure to and its management and control of credit and financial risks, in particular the primary risks associated with its use of financial instruments. These are:
– credit risk – the risk of loss resulting from client or counter-party default and arising on credit exposure in all forms, in-cluding settlement risk;
– liquidity risk – the risk that an entity will encounter difficulty in meeting obligations associated with financial liabilities that are settled by delivering cash or another financial asset;
– market risk – exposure to observable market variables such as interest rates, foreign exchange rates and equity market prices.
3.1 Risk management organisation
The European Investment Bank adapts its risk management on an ongoing basis.
The Risk Management of EIB independently identifies, assesses, monitors and reports the credit and equity price risks to which the Facility is exposed. Within a framework whereby the segre-gation of duties is preserved, the Risk Management is inde-pendent of the Front Offices. The Director General of Risk Management reports for risk matters, to the designated Vice-President of the European Investment Bank. The designated Vice-President meets regularly with the Audit Committee to discuss topics relating to risks. He is also responsible for over-seeing risk reporting to the European Investment Bank’s Man-agement Committee and the Board of Directors.
3.2 Credit risk
Credit risk is the potential loss that could result from client or counterparty default and arising on credit exposure in all forms, including settlement.

172013 Financial Statements on EIB activity in Africa, the Caribbean and Pacific, and the overseas territories
Financial Statements
3.2.1. Credit risk policy
In carrying out the credit analysis on loan counterparts, EIB as-sesses credit risk with a view to quantify and pricing it. The Fa-cility has developed an Internal Rating Methodology (IRM) for corporates or financial institutions to determine the Internal Ratings of its main borrower/guarantor beneficiary counter-parts. The methodology is based on a system of scoring sheets tailored for each major credit counterpart type (e.g. Corporates, Banks, Public Sector Entities, etc). Taking into consideration both, best banking practice and the principles set under the Basel International Capital Accord (Basel II), all counterparts that are material to the credit profile of a specific transaction are classified into internal rating categories using the IRM for the specific counterpart type. Each counterpart is initially assigned to an Internal Rating reflecting the counterpart’s long-term for-eign currency rating (or local currency equivalent when re-quired) following an in-depth analysis of the counterpart’s risk profile and its country risk operating context.
The credit assessment of project finance and other structured limited recourse operations is not subject to IRM and is using credit risk tools relevant for the sector, focused mainly on cash flow availability and debt service capacity. These tools include the analysis of projects’ contractual framework, counterpart’s analysis and cash flow simulations. Similarly to corporates and financial institutions, each project is assigned to an internal risk rating and an expected loss.
All non-sovereign (or non sovereign guaranteed/assimilated) operations are subject to specific transaction-level and
counterpart size limits. The maximum nominal amount of each transaction is capped by a limit which depends on the transaction expected loss. Counterpart limits are applied to consolidated exposures. Such limits typically reflect the size of counterparts own funds as well as their total external long-term funding.
In order to mitigate credit risk the Facility uses various credit enhancements which are:
– project related securities (e.g., pledge over the shares; pledge over the assets; assignment of rights; pledge over the accounts); or/and
– guarantees, generally provided by the sponsor of the fi-nanced project (e.g., completion guarantees, first demand guarantees).
In addition, the Facility uses seldom credit enhancements which are not immediately correlated to the project risk, like collaterals or bank guarantees.
The Facility does not use any credit derivatives to mitigate credit risk.
3.2.2. Maximum exposure to credit risk without taking into account any collateral and other credit enhancements
The following table shows the maximum exposure to credit risk for the components of the statement of financial position, including derivatives. The maximum exposure is shown gross, before the effect of mitigation through the use of collateral.
Maximum exposure (in EUR’000) 31.12.2013 31.12.2012
ASSETSCash and cash equivalents 599 515 466 568
Derivative financial instruments 1 024 115
Loans and receivables 1 222 199 1 146 280
Amounts receivable from contributors - 87 310
Held-to-maturity financial assets 102 562 99 029Other assets 148 224
Total Assets 1 925 448 1 799 526
OFF BALANCE SHEETContingent liabilities
- Guarantees undrawn 25 000 20 000
Commitments
- Undisbursed loans 889 866 749 044- Guarantees drawn 4 414 6 224
Total off balance sheet 919 280 775 268
Total credit exposure 2 844 728 2 574 794

18 Financial Statements on EIB activity in Africa, the Caribbean and Pacific, and the overseas territories 2013
3.2.3. Credit risk on loans and receivables
3.2.3.1 Credit risk measurement for loans and receivables
Each and every lending transaction undertaken by the Facility benefits from a comprehensive risk assessment and quantifica-tion of expected loss estimates that are reflected in a Loan Grad-ing (“LG”). LGs are established according to generally accepted criteria, based on the quality of the borrower, the maturity of the loan, the guarantee and, where appropriate, the guarantor.
The loan grading (LG) system comprises the methodologies, pro-cesses, databases and IT systems supporting the assessment of credit risk in lending operations and the quantification of expect-ed loss estimates. It summarises a large amount of information with the purpose of offering a relative ranking of loans’ credit risks. LGs reflect the present value of the estimated level of the “expected loss”, this being the product of the probability of de-fault of the main obligors, the exposure at risk and the loss sever-ity in the case of default. LGs are used for the following purposes:
– as an aid to a finer and more quantitative assessment of lend-ing risks;
– as help in distributing monitoring efforts;– as a description of the loan’s portfolio quality at any given
date;– as one input in risk-pricing decisions based on the expected
loss.
The following factors enter into the determination of an LG:
i) The borrower’s creditworthiness: RM independently reviews borrowers and assesses their creditworthiness based on inter-nal methodologies and external data. In line with the Basel II Advanced Approach chosen, the Bank has developed an in-ternal rating methodology (IRM) to determine the internal rat-ings of borrowers and guarantors. This is based on a set of scoring sheets specific to defined counterparty types.
ii) The default correlation: it quantifies the chances of simulta-neous financial difficulties arising for both the borrower and the guarantor. The higher the correlation between the borrower and the guarantor’s default probabilities, the lower the value of the guarantee and therefore the lower the LG.
iii) The value of guarantee instruments and of securities: this value is assessed on the basis of the combination of the issuer’s creditworthiness and the type of instrument used.
iv) The contractual framework: a sound contractual framework will add to the loan’s quality and enhance its internal grading.
v) The loan’s duration: all else being equal, the longer the loan, the higher the risk of incurring difficulties in the servicing of the loan.
A loan’s expected loss is computed by combining the five ele-
ments discussed above. Depending on the level of this loss, a loan is assigned to one of the following LG classes listed below:
A Prime quality loans: there are three sub-categories. A compris-es all EU sovereign risks, i.e. loans granted to or fully, explicitly and unconditionally guaranteed by Member States, where no repayment difficulties are expected and for which an unex-pected loss of 0% is allocated. A+ denotes loans granted to (or guaranteed by) entities other than Member States, with no ex-pectation of deterioration over their duration. A- includes those lending operations where there is some doubt about the maintenance of their current status (for instance because of a long maturity, or for the high volatility of the future price of an otherwise excellent collateral), but where any downside is expected to be quite limited.
B High quality loans: these represent an asset class with which the bank feels comfortable, although a minor deterioration is not ruled out in the future. B+ and B- are used to denote the relative likelihood of the possibility of such deterioration oc-curring.
C Good quality loans: an example could be unsecured loans to solid banks and corporates with a 7-year bullet, or equivalent amortising, maturity at disbursement.
D This rating class represents the borderline between “accept-able quality” loans and those that have experienced some diffi culties. This watershed in loan grading is more precisely determined by the sub-classifications D+ and D-. Loans rated D- require heightened monitoring.
E This LG category includes loans with a risk profile greater than generally accepted. It also includes loans which in the course of their lives have experienced severe problems and their slid-ing into a situation of loss cannot be excluded. For this reason, the loans are subject to close and high monitoring. The sub-classes E+ and E- differentiate the intensity of this special mon-itoring process, with those operations graded E- being in a position where there is a strong possibility that debt service cannot be maintained on a timely basis and therefore some form of debt restructuring is required, possibly leading to an impairment loss.
F F (fail) denotes loans representing unacceptable risks. F- grad-ed loans can only arise out of outstanding transactions that have experienced, after signature, unforeseen, exceptional and dramatic adverse circumstances. All operations where there is a loss of principal to the Facility are graded F and a specific provision is applied.
Generally, loans internally graded D- or below are placed on the Watch List. However, if a loan was originally approved with a risk profile of D- or weaker, it will only be placed on the Watch List as a result of a material credit event causing a further deterioration of its LG classification.
192013 Financial Statements on EIB activity in Africa, the Caribbean and Pacific, and the overseas territories
Financial Statements
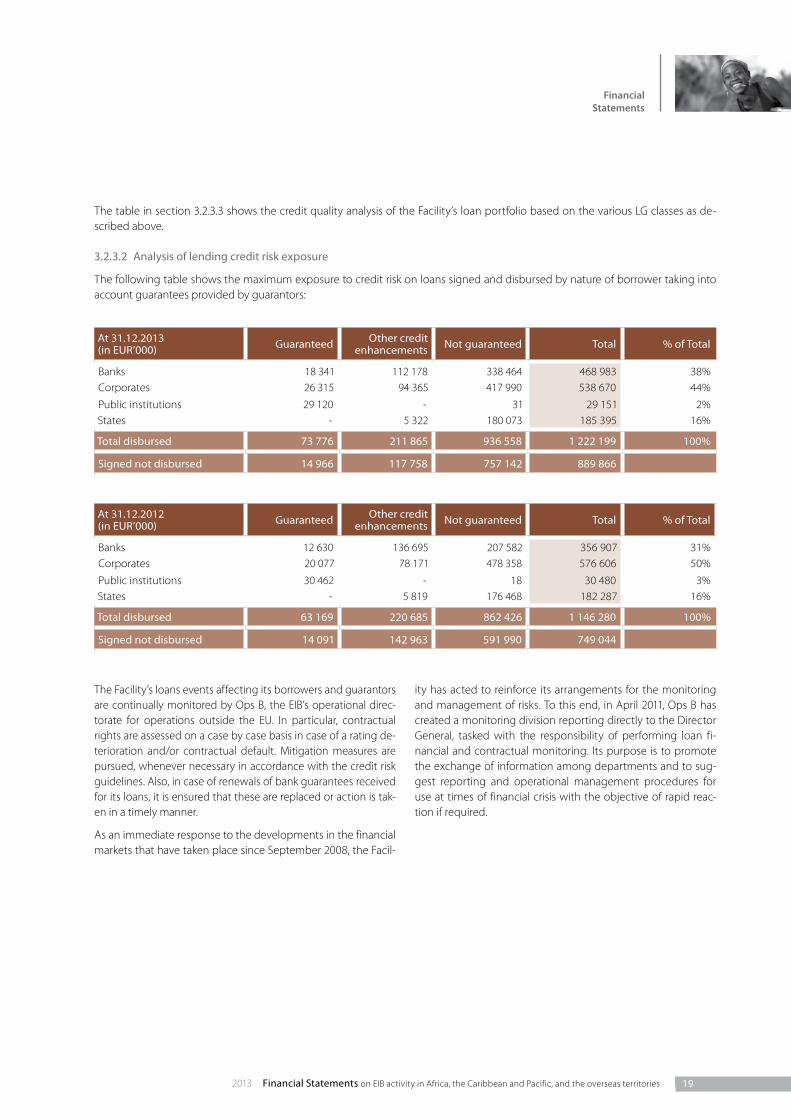
The Facility’s loans events affecting its borrowers and guarantors are continually monitored by Ops B, the EIB’s operational direc-torate for operations outside the EU. In particular, contractual rights are assessed on a case by case basis in case of a rating de-terioration and/or contractual default. Mitigation measures are pursued, whenever necessary in accordance with the credit risk guidelines. Also, in case of renewals of bank guarantees received for its loans, it is ensured that these are replaced or action is tak-en in a timely manner.
As an immediate response to the developments in the financial markets that have taken place since September 2008, the Facil-
At 31.12.2013 (in EUR’000) Guaranteed Other credit
enhancements Not guaranteed Total % of Total
Banks 18 341 112 178 338 464 468 983 38%Corporates 26 315 94 365 417 990 538 670 44%
Public institutions 29 120 - 31 29 151 2%States - 5 322 180 073 185 395 16%
Total disbursed 73 776 211 865 936 558 1 222 199 100%
Signed not disbursed 14 966 117 758 757 142 889 866
At 31.12.2012 (in EUR’000) Guaranteed Other credit
enhancements Not guaranteed Total % of Total
Banks 12 630 136 695 207 582 356 907 31%Corporates 20 077 78 171 478 358 576 606 50%
Public institutions 30 462 - 18 30 480 3%States - 5 819 176 468 182 287 16%
Total disbursed 63 169 220 685 862 426 1 146 280 100%
Signed not disbursed 14 091 142 963 591 990 749 044
The table in section 3.2.3.3 shows the credit quality analysis of the Facility’s loan portfolio based on the various LG classes as de-scribed above.
3.2.3.2 Analysis of lending credit risk exposure
The following table shows the maximum exposure to credit risk on loans signed and disbursed by nature of borrower taking into account guarantees provided by guarantors:
ity has acted to reinforce its arrangements for the monitoring and management of risks. To this end, in April 2011, Ops B has created a monitoring division reporting directly to the Director General, tasked with the responsibility of performing loan fi-nancial and contractual monitoring. Its purpose is to promote the exchange of information among departments and to sug-gest reporting and operational management procedures for use at times of financial crisis with the objective of rapid reac-tion if required.
20 Financial Statements on EIB activity in Africa, the Caribbean and Pacific, and the overseas territories 2013
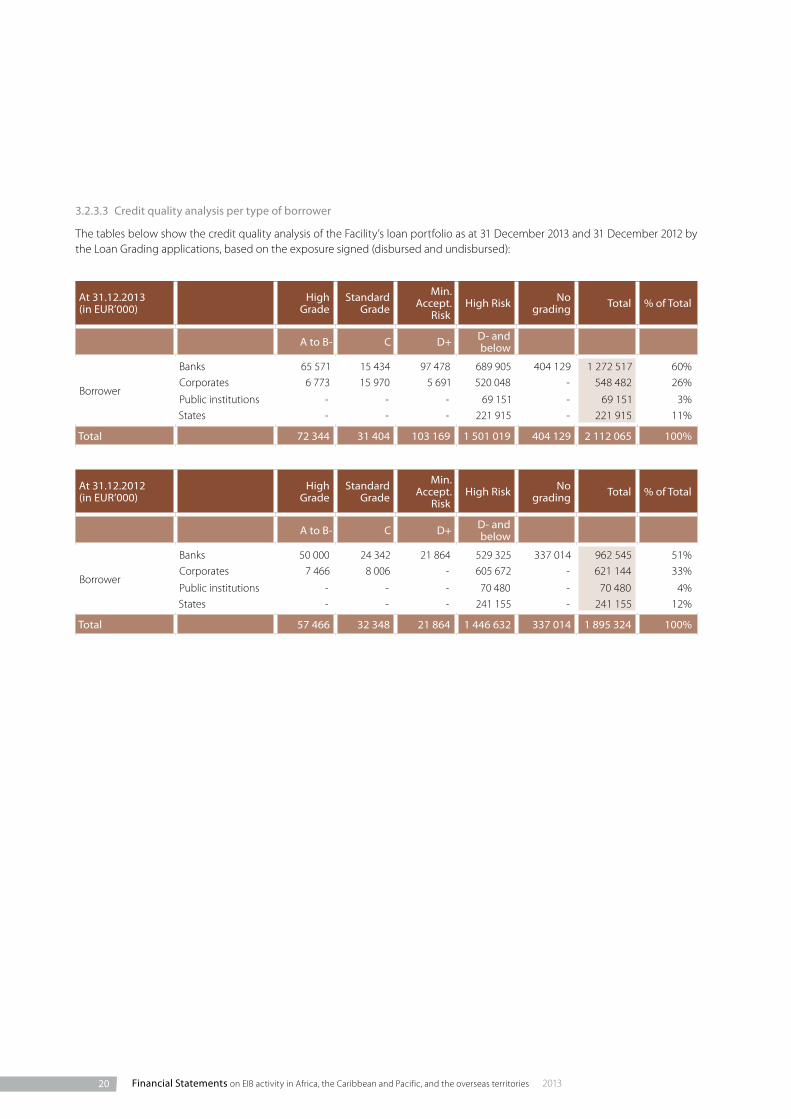
3.2.3.3 Credit quality analysis per type of borrower
The tables below show the credit quality analysis of the Facility’s loan portfolio as at 31 December 2013 and 31 December 2012 by the Loan Grading applications, based on the exposure signed (disbursed and undisbursed):
At 31.12.2013 (in EUR’000) High
Grade Standard
Grade
Min. Accept.
Risk High Risk No
grading Total % of Total
A to B- C D+ D- and below
Borrower
Banks 65 571 15 434 97 478 689 905 404 129 1 272 517 60%Corporates 6 773 15 970 5 691 520 048 - 548 482 26%
Public institutions - - - 69 151 - 69 151 3%States - - - 221 915 - 221 915 11%
Total 72 344 31 404 103 169 1 501 019 404 129 2 112 065 100%
At 31.12.2012 (in EUR’000) High
Grade Standard
Grade
Min. Accept.
Risk High Risk No
grading Total % of Total
A to B- C D+ D- and below
Borrower
Banks 50 000 24 342 21 864 529 325 337 014 962 545 51%Corporates 7 466 8 006 - 605 672 - 621 144 33%
Public institutions - - - 70 480 - 70 480 4%States - - - 241 155 - 241 155 12%
Total 57 466 32 348 21 864 1 446 632 337 014 1 895 324 100%

212013 Financial Statements on EIB activity in Africa, the Caribbean and Pacific, and the overseas territories
Financial Statements
3.2.3.4 Risk concentrations of loans and receivables
3.2.3.4.1 Geographical analysis
Based on the country of borrower, the Facility’s loan portfolio can be analysed by the following geographical regions (in EUR‘000):
Country of borrower 31.12.2013 31.12.2012
Uganda 144 816 140 833Kenya 131 384 131 566
Mauritius 108 511 119 228
Regional-ACP 101 863 95 636
Mauritania 93 455 73 602
Ethiopia 75 962 81 666
Nigeria 73 469 14 383
Cameroon 70 154 72 525
Jamaica 68 000 71 027
Dominican Republic 64 015 67 991
Togo 50 319 52 644
Congo (Democratic Republic) 39 047 28 415
Cape Verde 27 470 27 073
Mozambique 26 202 28 298
Tanzania 26 121 -
French Polynesia 13 994 2 631
Senegal 13 063 13 762
Burkina Faso 8 944 10 727
Samoa 8 872 8 759
Congo 8 649 10 431
Mali 7 717 7 931
Rwanda 6 439 9 641
Zambia 6 412 18 772
Angola 6 380 10 009
Ghana 6 365 5 642
Haiti 5 511 4 654
Vanuatu 5 028 6 263
Malawi 3 999 4 950
New Caledonia 3 708 4 198
Lesotho 3 417 3 827
Niger 3 020 4 146
Grenada 2 243 2 477
Palau 2 224 2 566
Saint Lucia 2 102 2 916
Tonga 1 416 2 199
Fiji 1 032 1 619
Gabon 512 1 011
Liberia 364 4
Belize - 13
Djibouti - 762
Trinidad and Tobago - 1 483
Total 1 222 199 1 146 280

22 Financial Statements on EIB activity in Africa, the Caribbean and Pacific, and the overseas territories 2013
3.2.3.4.2 Industry sector analysis
The table below analyses the Facility’s loan portfolio by industry sector of the borrower. Operations which are first disbursed to a financial intermediary before being disbursed to the final beneficiary are reported under global loans (in EUR’000):
Industry sector of borrower 31.12.2013 31.12.2012
Global loans and agency agreements 337 482 251 797Electricity, coal and others 234 106 255 031
Urban development, renovation and transport 216 244 215 642
Basic material and mining 176 909 185 200
Tertiary and other 148 875 116 414
Roads and motorways 38 880 40 565
Airports and air traffic management systems 29 116 30 462
Materials processing, construction 20 884 24 154
Telecommunications 11 746 18 428
Paper chain 4 540 4 747
Investment goods/consumer durables 3 417 3 827
Airlines and aircraft manufacture - 13
Total 1 222 199 1 146 280
3.2.3.5 Arrears on loans
Amounts in arrears are identified, monitored and reported ac-cording to the procedures defined into the bank wide “Finance Monitoring Guidelines and Procedures”. These procedures are in line with best banking practices and are adopted for all loans managed by the EIB.
Loans in arrears are monitored by the Operational Reporting and Arrears Unit of EIB’s Transaction Management and Restruc-turing Directorate. This ensures that (i) potential arrears are
properly detected and reported to the services in charge; (ii) critical cases are promptly escalated to the right operational and decision level; (iii) regular reporting is provided on the overall status of arrears and on the recovery measures already taken or to be taken.
Regular reports on loans in arrears are sent to the European Commission. Twice a year the EIB management committee and the Board of Directors receive a summary analysis of arrears for loans overdue.

232013 Financial Statements on EIB activity in Africa, the Caribbean and Pacific, and the overseas territories
Financial Statements
The arrears of payments on concerned loans can be analysed as follows (in EUR’000):
NotesLoans and
receivables31.12.2013
Loans and receivables 31.12.2012
Carrying amount 1 222 199 1 146 280Individually impaired Gross amount 227 007 105 154Allowance for impairment 7 -70 791 -45 145
Carrying amount individually impaired 156 216 60 009
Collectively impaired Gross amount - -Allowance for impairment - -
Carrying amount collectively impaired - -
Past due but not impaired Past due comprises30-60 days 1 561 1260-90 days - -90-180 days - -more 180 days - -
Carrying amount past due but not impaired 1 561 12
Carrying amount neither past due nor impaired 1 064 422 1 086 259
Total carrying amount loans and receivables 1 222 199 1 146 280
The following table shows the situation of bank cash accounts and deposits including accrued interest (in EUR’000):
Minimum short-term rating (Moody’s term)
Minimum long-term rating (Moody’s term) 31.12.2013 31.12.2012
P-1 Aa1 48 130 8% 43 400 9%P-1 Aa3 50 000 8% 130 901 28%P-1 A1 106 572 18% 83 500 18%P-1 A2 394 765 66% 208 729 45%P-1 Aa2 48 0% 38 0%
Total 599 515 100% 466 568 100%
3.2.4. Credit risk on cash and cash equivalents
Available funds are invested in accordance with the Facility’s schedule of contractual disbursement obligations. As of 31 De-cember 2013, investments were in the form of bank deposits.
The authorized banks have a rating similar to the short- and long-term ratings required for the EIB’s own treasury place-ments. The minimum short term rating required for authorised banks is P-1/A-1/F1 (Moody’s, S&P, Fitch). In case of different rat-
ings being granted by more than one credit rating agency, the lowest rating governs. The maximum authorized limit for each authorised bank is currently EUR 50 000 000 (fifty million euro).
All investments have been done with authorised entities with a maximum tenor of three months from trading date and up to the credit exposure limit. As at 31 December 2013 and 31 De-cember 2012 all treasury deposits held by the treasury portfolio of the Facility had a minimum rating of P-1 (Moody’s equiva-lent) at settlement day.

24 Financial Statements on EIB activity in Africa, the Caribbean and Pacific, and the overseas territories 2013
3.2.5. Credit risk on derivatives
3.2.5.1 Credit risk policy of derivatives
The credit risk with respect to derivatives is represented by the loss which a given party would incur where the other counter-party to the deal would be unable to honour its contractual obligations. The credit risk associated with derivatives varies ac-cording to a number of factors (such as interest and exchange rates) and generally corresponds to only a small portion of their notional value.
In the normal course of its activity, the Facility may enter into swap contracts with a view to hedge specific lending opera-tions or into currency forward contracts, with a view to hedge its currency positions denominated in actively traded curren-cies other than the Euro. All the swaps are executed by the Euro pean Investment Bank with an external counterpart. The swaps are disciplined by the same Master Swap Agreements
and Credit Support Annexes signed between the European In-vestment Bank and its external counterparts.
3.2.5.2 Credit risk measurement for derivatives
All the swaps executed by the European Investment Bank that are related to the Facility are treated within the same contrac-tual framework and methodologies applied for the derivatives negotiated by the European Investment Bank for its own pur-poses. In particular, eligibility of swap counterparts is deter-mined by the European Investment Bank based on the same eligibility conditions applied for its general swap purposes.
The European Investment Bank measures the credit risk expo-sure related to swaps and derivatives transactions using the Net Market Exposure (“NME”) and Potential Future Exposure (“PFE”) approach for reporting and limit monitoring. The NME and the PFE fully include the derivatives related to the Invest-ment Facility.
The Facility enters into foreign exchange short term currency
swaps (“FX swaps”) contracts in order to hedge currency risk on
loan disbursements in currencies different from EUR. FX swaps
have a maturity of maximum three months and are regularly
rolled-over. The notional amount of FX swaps stood at
EUR 700 million at 31 December 2013 against EUR 649 million at
31 December 2012. The fair value of FX swaps amounts to
EUR -1.5 million at 31 December 2013 against EUR -2.9 million at 31 December 2012.
The Facility enters into interest rate swap contracts in order to hedge the interest rate risk on loans disbursed. As at 31 Decem-ber 2013 there are two interest rate swaps outstanding with a notional amount of EUR 43.3 million (2012: EUR 19.6 million) and a fair value of EUR 0.92 million (2012: EUR 0.03 million).
The following table shows the maturities of cross currency swaps and cross currency interest rate swaps, sub-divided according to their notional amount and fair value:
Swap contracts at 31.12.2013 (in EUR’000)
less than 1 year
1 year to 5 years
5 years to 10 years
more than to 10 years Total 2013
Notional amount 2 453 2 584 13 491 - 18 528Fair Value (i.e. net discounted value) 19 - 62 -1 892 - -1 935
Swap contracts at 31.12.2012 (in EUR’000)
less than 1 year
1 year to 5 years
5 years to 10 years
more than to 10 years Total 2012
Notional amount 1 480 9 833 15 253 - 26 566Fair Value (i.e. net discounted value) 71 -528 -3 529 - -3 986
252013 Financial Statements on EIB activity in Africa, the Caribbean and Pacific, and the overseas territories
Financial Statements
3.3 Liquidity risk
Liquidity risk refers to an institution’s ability to fund increases in assets and meet obligations as they come due, without incur-ring unacceptable losses. It can be split into funding liquidity risk and market liquidity risk. Funding liquidity risk is the risk that an institution will not be able to meet efficiently both ex-pected and unexpected current and future cash flow needs without affecting its daily operations or its financial condition. Market liquidity risk is the risk that an institution cannot easily offset or eliminate a position at the market price because of in-adequate market depth or market disruption.
3.3.1 Liquidity risk management
The Facility is primarily funded by annual contributions from Member States (9th and 10th EDF resources) as well as by re-flows stemming from the Facility’s operations. The Facility manages its funding liquidity risk primarily by planning of its net liquidity needs and the required Member States annual contributions.
Each year, the EC, taking into account EIB’s forecasts concern-ing the management and operations of the Facility, shall estab-lish and communicate to the Council by 15 October a statement of the commitments, payments and the annual amount of the calls for contributions (interest subsidies includ-ed) to be made in the current and the following budget years.
In order to calculate Member States annual contributions, dis-bursement pattern of the existing and pipelined portfolio is analysed and followed up throughout the year. Special events, such as early reimbursements, sales of shares or default cases are taken into account to correct annual liquidity requirements.
To further minimize the liquidity risk, the Facility maintains a li-quidity reserve sufficient to cover at any point in time forecast-
ed cash disbursements, as communicated periodically by EIB’s Lending Department. Funds are invested on the money market and bond markets in the form of interbank deposits and other short term financial instruments by taking into consideration the Facility’s cash disbursement obligations. The Facility’s liquid assets are managed by the Bank’s Treasury Department with a view to maintain appropriate liquidity to enable the Facility to meet its obligations.
In accordance with the principle of segregation of duties be-tween the Front and Back Office, settlement operations related to the investment of these assets are under the responsibility of the EIB’s Planning and Settlement of Operations Department. Furthermore, the authorisation of counterparts and limits for treasury investments, as well as the monitoring of such limits, are the responsibility of the Bank’s Risk Management Directorate.
3.3.2 Liquidity risk measurement
The tables in this section analyse the financial liabilities of the Facility by maturity on the basis of the period remaining be-tween the balance sheet date and the contractual maturity date (based on undiscounted cash flows).
In terms of non-derivative financial liabilities, the Facility holds commitments in form of undisbursed portions of the credit un-der signed loan agreements, of undisbursed portions of signed capital subscription/investment agreements, of loan guaran-tees granted, or of committed interest rate subsidies and tech-nical assistance (“TA”).
The table representing the maturity profile of non-derivative fi-nancial liabilities as at 31 December 2012 has been restated due to the application of an updated methodology. In the 2012 fi-nancial statements, the breakdown of maturities has been pre-pared using forecasted rather than contractual maturity dates, primarily due to the uncertainty in the timing of cash flows. In
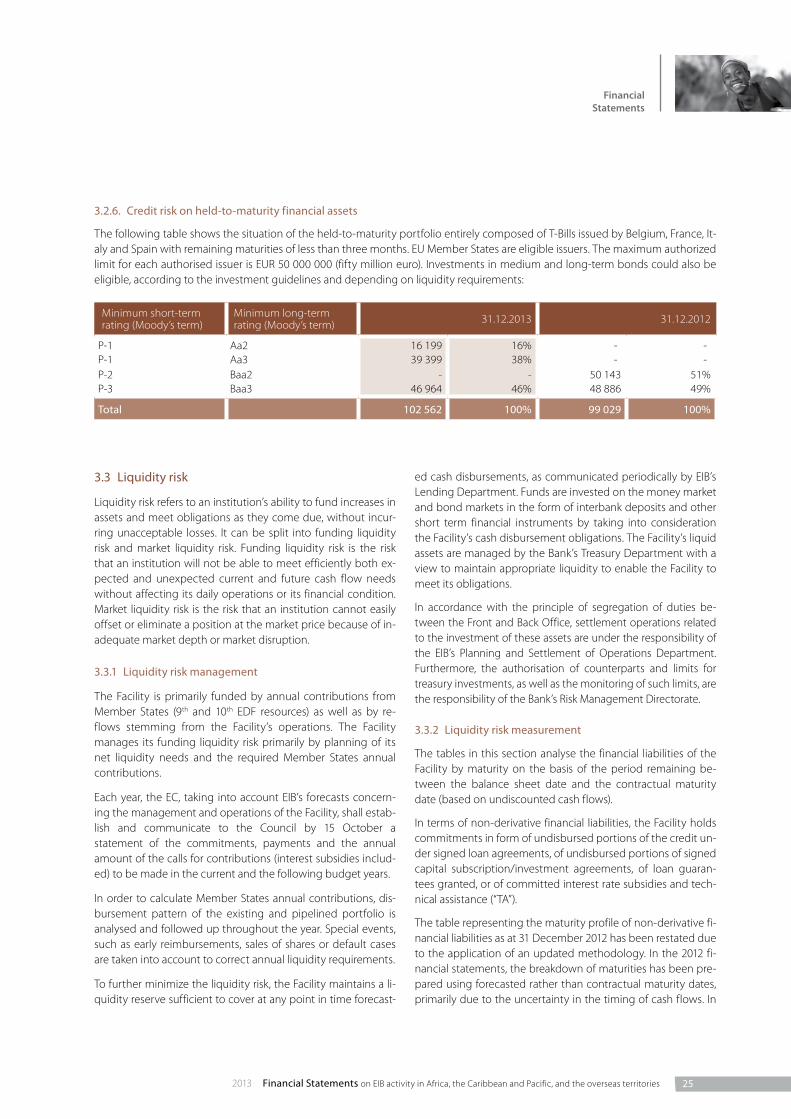
3.2.6. Credit risk on held-to-maturity financial assets
The following table shows the situation of the held-to-maturity portfolio entirely composed of T-Bills issued by Belgium, France, It-aly and Spain with remaining maturities of less than three months. EU Member States are eligible issuers. The maximum authorized limit for each authorised issuer is EUR 50 000 000 (fifty million euro). Investments in medium and long-term bonds could also be eligible, according to the investment guidelines and depending on liquidity requirements:
Minimum short-term rating (Moody’s term)
Minimum long-term rating (Moody’s term) 31.12.2013 31.12.2012
P-1 Aa2 16 199 16% - -P-1 Aa3 39 399 38% - -P-2 Baa2 - - 50 143 51%P-3 Baa3 46 964 46% 48 886 49%
Total 102 562 100% 99 029 100%

26 Financial Statements on EIB activity in Africa, the Caribbean and Pacific, and the overseas territories 2013
the updated methodology, the maturity profile of non-deriva-tive financial liabilities depicts the cash outflows based on their contractual maturity date.
Loans under the IF have a disbursement deadline. However, disbursements are made at times and in amounts reflecting the progress of underlying investment projects. Moreover, the IF’s loans are transactions performed in a relatively volatile op-erating environment, hence their disbursement schedule is subject to a significant degree of uncertainty.
Capital investments become due when and as soon as equity fund managers issue valid calls for capital, reflecting the pro-gress in their investment activities. The drawdown period is usually of 3 years, with frequent prolongation by one or two years. Some disbursement commitments usually survive the end of the drawdown period until full disposal of the fund’s un-derlying investments, as the fund’s liquidity may be insufficient from time to time to meet payment obligations arising in re-spect of fees or other expenses.
Loan guarantees are not subject to specific disbursement com-mitments unless a guarantee is called by its beneficiary. The amount of guarantee outstanding is reduced alongside the re-payment schedule of each guaranteed loan.
Committed interest subsidies’ cash outflows occur generally in the case of subsidized loans financed by the Bank’s own re-sources. Therefore, reported outflows represent only commit-ments related to these loans rather than the total amount of committed undisbursed interest subsidies which was reflected in the 2012 financial statements. As in the case of loans, their disbursement schedule is uncertain.
Committed TA “gross nominal outflow” in the “Maturity profile of non-derivative financial liabilities” table refers to the total undis-bursed portion of signed TA contracts. The disbursement time pattern is subject to a significant degree of uncertainty. Cash out-flows classified in the “3 months or less” bucket represent the amount of outstanding invoices received by the reporting date.
Commitments for non-derivative financial liabilities for which there is no defined contractual maturity date are classified un-der “Maturity Undefined”. Commitments, for which there is a recorded cash disbursement request at the reporting date, are classified under the relevant time bucket.
In terms of derivative financial liabilities, the maturity profile represents the contractual undiscounted gross cash flows of swap contracts including cross currency swaps (CCS), cross cur-rency interest rate swaps (CCIRS), short term currency swaps and interest rate swaps.
Maturity profile of non-derivative financial liabilities in EUR’000 as at 31.12.2013
3 months or less
More than 3 months to 1 year
More than 1 year to
5 years
More than 5 years
Maturity Undefined
Gross nominal outflow
Outflows for committed but un-disbursed loans 363 - - - 889 503 889 866Outflows for committed investment funds and share subscription 1 689 - - - 175 132 176 821
Others (issued guarantees, drawn guarantees) - - - - 29 414 29 414
Outflows for committed interest subsidies - - - - 191 760 191 760Outflows for committed TA 759 - - - 14 707 15 466
Total 2 811 - - - 1 300 516 1 303 327
Maturity profile of non-derivative financial liabilities in EUR’000 as at 31.12.2012
3 months or less
More than 3 months to 1 year
More than 1 year to
5 years
More than 5 years
Maturity Undefined
Gross nominal outflow
Outflows for committed but un-disbursed loans 3 882 - - - 745 162 749 044Outflows for committed investment funds and share subscription 430 - - - 216 640 217 070
Others (issued guarantees, drawn guarantees) - - - - 26 224 26 224
Outflows for committed interest subsidies - - - - 179 108 179 108Outflows for committed TA 1 867 - - - 21 753 23 620
Total 6 179 - - - 1 188 887 1 195 066
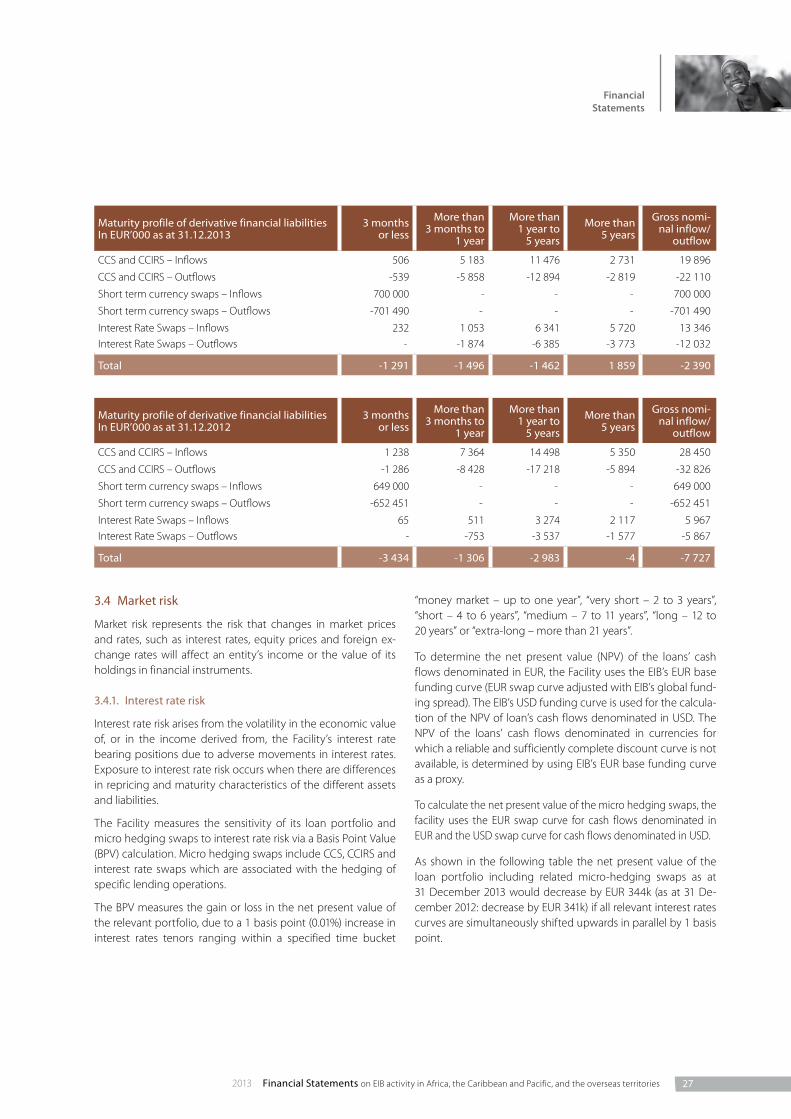
272013 Financial Statements on EIB activity in Africa, the Caribbean and Pacific, and the overseas territories
Financial Statements
Maturity profile of derivative financial liabilities In EUR’000 as at 31.12.2013
3 months or less
More than 3 months to
1 year
More than 1 year to
5 years
More than 5 years
Gross nomi-nal inflow/
outflow
CCS and CCIRS – Inflows 506 5 183 11 476 2 731 19 896
CCS and CCIRS – Outflows -539 -5 858 -12 894 -2 819 -22 110
Short term currency swaps – Inflows 700 000 - - - 700 000
Short term currency swaps – Outflows -701 490 - - - -701 490
Interest Rate Swaps – Inflows 232 1 053 6 341 5 720 13 346 Interest Rate Swaps – Outflows - -1 874 -6 385 -3 773 -12 032
Total -1 291 -1 496 -1 462 1 859 -2 390
Maturity profile of derivative financial liabilities In EUR’000 as at 31.12.2012
3 months or less
More than 3 months to
1 year
More than 1 year to
5 years
More than 5 years
Gross nomi-nal inflow/
outflow
CCS and CCIRS – Inflows 1 238 7 364 14 498 5 350 28 450
CCS and CCIRS – Outflows -1 286 -8 428 -17 218 -5 894 -32 826
Short term currency swaps – Inflows 649 000 - - - 649 000
Short term currency swaps – Outflows -652 451 - - - -652 451
Interest Rate Swaps – Inflows 65 511 3 274 2 117 5 967Interest Rate Swaps – Outflows - -753 -3 537 -1 577 -5 867
Total -3 434 -1 306 -2 983 -4 -7 727
3.4 Market risk
Market risk represents the risk that changes in market prices and rates, such as interest rates, equity prices and foreign ex-change rates will affect an entity’s income or the value of its holdings in financial instruments.
3.4.1. Interest rate risk
Interest rate risk arises from the volatility in the economic value of, or in the income derived from, the Facility’s interest rate bearing positions due to adverse movements in interest rates. Exposure to interest rate risk occurs when there are differences in repricing and maturity characteristics of the different assets and liabilities.
The Facility measures the sensitivity of its loan portfolio and micro hedging swaps to interest rate risk via a Basis Point Value (BPV) calculation. Micro hedging swaps include CCS, CCIRS and interest rate swaps which are associated with the hedging of specific lending operations.
The BPV measures the gain or loss in the net present value of the relevant portfolio, due to a 1 basis point (0.01%) increase in interest rates tenors ranging within a specified time bucket
“money market – up to one year”, “very short – 2 to 3 years”, “short – 4 to 6 years”, “medium – 7 to 11 years”, “long – 12 to 20 years” or “extra-long – more than 21 years”.
To determine the net present value (NPV) of the loans’ cash flows denominated in EUR, the Facility uses the EIB’s EUR base funding curve (EUR swap curve adjusted with EIB’s global fund-ing spread). The EIB’s USD funding curve is used for the calcula-tion of the NPV of loan’s cash flows denominated in USD. The NPV of the loans’ cash flows denominated in currencies for which a reliable and sufficiently complete discount curve is not available, is determined by using EIB’s EUR base funding curve as a proxy.
To calculate the net present value of the micro hedging swaps, the facility uses the EUR swap curve for cash flows denominated in EUR and the USD swap curve for cash flows denominated in USD.
As shown in the following table the net present value of the loan portfolio including related micro-hedging swaps as at 31 December 2013 would decrease by EUR 344k (as at 31 De-cember 2012: decrease by EUR 341k) if all relevant interest rates curves are simultaneously shifted upwards in parallel by 1 basis point.

28 Financial Statements on EIB activity in Africa, the Caribbean and Pacific, and the overseas territories 2013
3.4.2. Foreign exchange risk
Foreign exchange (“FX”) risk is the volatility in the economic value of, or in the income derived from, the Facility’s positions due to adverse movements of foreign exchange rates.
The Facility is exposed to foreign exchange risk whenever there is a currency mismatch between its assets and liabilities. For-eign exchange risk also comprises the effect of unexpected and unfavourable changes in the value of future cash flows due to fluctuations in exchange rates.
3.4.2.1 Foreign exchange risk and treasury assets
The IF’s treasury assets are denominated either in EUR or USD.
FX risk is hedged by means of FX spot or forward transactions, FX swaps or cross-currency swaps. The EIB’s Treasury Depart-ment can, where deemed necessary and appropriate, use any other instrument, in line with the Bank’s policy, that provide protection against market risks incurred in connection with the IF’s financial activities.
3.4.2.2 Foreign exchange risk and operations financed or guaranteed by the IF
Member States’ IF contributions are received in EUR. The opera-tions financed or guaranteed by the IF as well as Interest Rate Subsidies can be denominated in EUR, USD or any other au-thorized currency.
A foreign exchange risk exposure (against the EUR reference currency) arises whenever transactions denominated in curren-cies other than the EUR are left un-hedged. The IF’s foreign ex-change risk hedging guidelines are set out below.
3.4.2.2.1. Hedging of operations denominated in currencies other than EUR or USD
– IF loans disbursed in currencies other than EUR and USD shall be hedged through cross-currency swap contracts with the same financial profile as the underlying Loan, pro-vided that a swap market is operational.
– For disbursements under IF Operations made in a currency other than EUR and USD, and for which a long-term hedging
operation is not undertaken, the Treasury Department shall enter into a foreign exchange transaction two business days prior to the disbursement. The FX conversion rate applied to IF Operations shall correspond to the market exchange rate obtained by the Treasury Department. Similarly, for repay-ments received in a currency other than EUR and USD, the Treasury Department shall undertake an FX operation where necessary to convert the currencies received.
– Uncalled guarantees are not subject to any FX hedging. Guarantee calls in currencies other than EUR and USD will be hedged.
– Operations in currencies other than EUR and USD for which no FX hedging operation can be undertaken by the Treasury Department shall be left un-hedged. This also includes (syn-thetic) operations denominated in local currency but settled in EUR or USD. The IF shall remain exposed to the FX risk in-curred thereby.
3.4.2.2.2. Hedging of operations denominated in USD
– The total outstanding amount of all IF Operations (except uncalled Guarantees) denominated in USD shall be hedged by means of USD/EUR FX swaps, rolled over on a periodic basis. At the beginning of each period, the cash flows to be received or paid in USD during the next period shall be esti-mated on the basis of planned or expected reflows/dis-bursements. Subsequently, the maturing FX swaps shall be rolled over, their amount being adjusted to cover at least the USD liquidity needs projected over the next period.
– A periodic calculation of the overall USD exposure as per the accounting records will be undertaken to adjust, if necessary, the hedge on the next FX swap roll.
– If deemed operationally convenient by the Treasury Depart-ment, cross-currency swaps can also be used to hedge spe-cific USD Loans.
– Within a roll-over period, unexpected USD liquidity deficits shall be covered by means of ad hoc FX swap operations while liquidity surpluses shall either be invested in treasury assets or swapped into EUR.
Basis point value in EUR’000 as at 31.12.2013
MoneyMarket
1 year
Very Short 2 to 3 years
Short4 to 6 year
Medium7 to 11
years
Long12 to-20
years
Extra Long 21 years Total
Total sensitivity of loans and micro hedging swaps -25 -57 -90 -124 -48 - -344
Basis point value in EUR’000 as at 31.12.2012
MoneyMarket
1 year
Very Short 2 to 3 years
Short4 to 6 year
Medium7 to 11
years
Long12 to-20
years
Extra Long 21 years Total
Total sensitivity of loans and micro hedging swaps -25 -47 -90 -117 -62 - -341

292013 Financial Statements on EIB activity in Africa, the Caribbean and Pacific, and the overseas territories
Financial Statements
3.4.2.3 Foreign exchange position
The following tables show the Facility’s foreign exchange position (in EUR’000):
At 31 December 2013 EUR USD KES ACP/OCT Currencies Total
ASSETSCash and cash equivalents 542 373 57 142 - - 599 515Derivative financial instruments 3 168 -2 144 - - 1 024Loans and receivables 488 249 572 346 66 111 95 493 1 222 199Available-for-sale financial assets 70 299 252 668 - 8 732 331 699Held-to-maturity financial assets 102 562 - - - 102 562Other assets - - - 148 148
Total assets 1 206 651 880 012 66 111 104 373 2 257 147
LIABILITIES AND CONTRIBUTORS’ RESOURCES
LiabilitiesDerivative financial instruments -715 945 719 490 - - 3 545Deferred income 34 880 203 - - 35 083Amounts owed to third parties 331 235 - - - 331 235Other liabilities 2 428 2 - 142 2 572
Total liabilities -347 402 719 695 - 142 372 435
Contributors’ resourcesMember States Contribution called 1 661 309 - - - 1 661 309Fair value reserve 2 632 69 082 - 6 477 78 191Retained earnings 145 212 - - - 145 212
Total Contributors’ resources 1 809 153 69 082 - 6 477 1 884 712
Total liabilities and Contributors’ resources 1 461 751 788 777 - 6 619 2 257 147
Currency position as at 31 December 2013 -255 100 91 235 66 111 97 754 -
As at 31 December 2013:
COMMITMENTSUn-disbursed loans and available-for-sale financial assets 896 655 170 032 - - 1 066 687
Guarantees drawn - - - 4 414 4 414Interest subsidies and TA 222 588 - - - 222 588
CONTINGENT LIABILITIESGuarantees undrawn 25 000 - - - 25 000
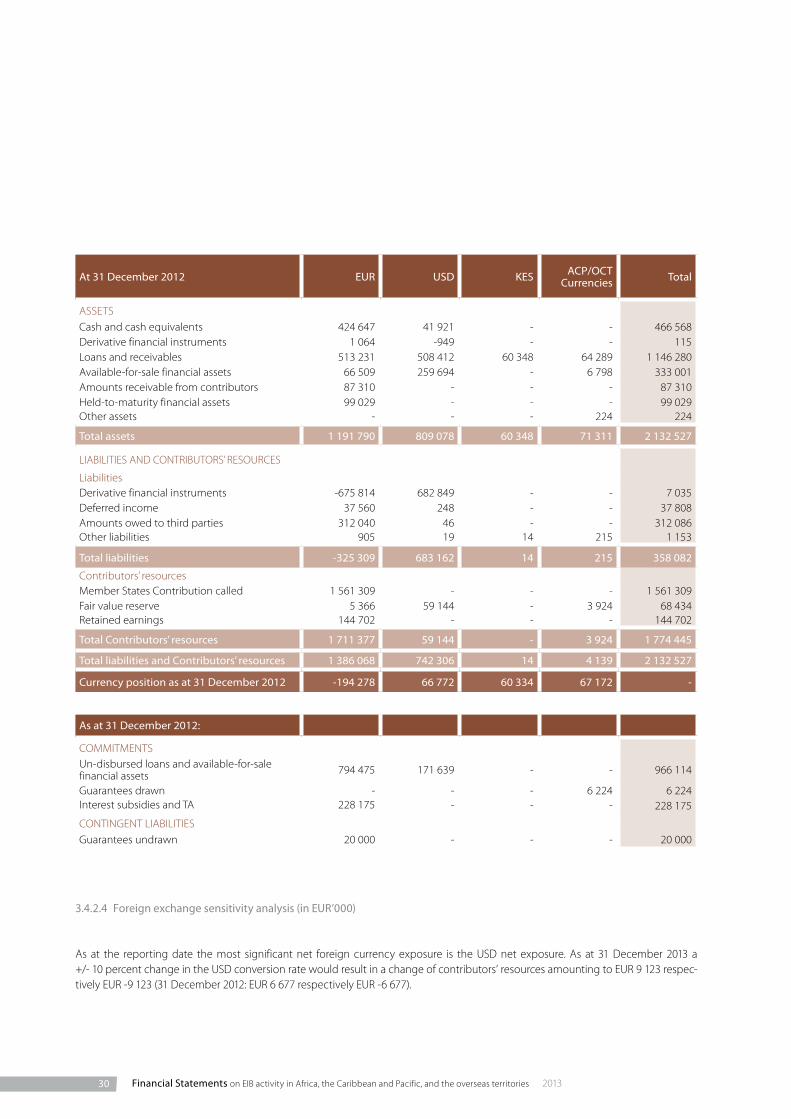
30 Financial Statements on EIB activity in Africa, the Caribbean and Pacific, and the overseas territories 2013
At 31 December 2012 EUR USD KES ACP/OCT Currencies Total
ASSETSCash and cash equivalents 424 647 41 921 - - 466 568Derivative financial instruments 1 064 -949 - - 115Loans and receivables 513 231 508 412 60 348 64 289 1 146 280Available-for-sale financial assets 66 509 259 694 - 6 798 333 001Amounts receivable from contributors 87 310 - - - 87 310Held-to-maturity financial assets 99 029 - - - 99 029Other assets - - - 224 224
Total assets 1 191 790 809 078 60 348 71 311 2 132 527
LIABILITIES AND CONTRIBUTORS’ RESOURCES
LiabilitiesDerivative financial instruments -675 814 682 849 - - 7 035Deferred income 37 560 248 - - 37 808Amounts owed to third parties 312 040 46 - - 312 086Other liabilities 905 19 14 215 1 153
Total liabilities -325 309 683 162 14 215 358 082
Contributors’ resourcesMember States Contribution called 1 561 309 - - - 1 561 309Fair value reserve 5 366 59 144 - 3 924 68 434Retained earnings 144 702 - - - 144 702
Total Contributors’ resources 1 711 377 59 144 - 3 924 1 774 445
Total liabilities and Contributors’ resources 1 386 068 742 306 14 4 139 2 132 527
Currency position as at 31 December 2012 -194 278 66 772 60 334 67 172 -
As at 31 December 2012:
COMMITMENTSUn-disbursed loans and available-for-sale financial assets 794 475 171 639 - - 966 114
Guarantees drawn - - - 6 224 6 224Interest subsidies and TA 228 175 - - - 228 175
CONTINGENT LIABILITIESGuarantees undrawn 20 000 - - - 20 000
3.4.2.4 Foreign exchange sensitivity analysis (in EUR’000)
As at the reporting date the most significant net foreign currency exposure is the USD net exposure. As at 31 December 2013 a +/- 10 percent change in the USD conversion rate would result in a change of contributors’ resources amounting to EUR 9 123 respec-tively EUR -9 123 (31 December 2012: EUR 6 677 respectively EUR -6 677).

312013 Financial Statements on EIB activity in Africa, the Caribbean and Pacific, and the overseas territories
Financial Statements
3.4.3. Equity price risk (in EUR’000)
Equity price risk refers to the risk that the fair values of equity investments decrease as the result of changes in the levels of equity prices and/or the value of equity investments.
The IF is exposed to equity price risk via its investments in di-rect equity and venture capital funds.
The value of non-listed equity positions is not readily avail-able for the purpose of monitoring and control on a continu-
ous basis. For such positions, the best indications available include prices derived from any relevant valuation tech-niques.
The effects on the Facility’s contributors’ resources (as a result of a change in the fair value of the available-for-sale equity portfolio) due to a 10% decrease in the value of individual di-rect equity and venture capital investments, with all other variables held constant is EUR -33 170 as at 31 December 2013 and EUR -33 300 as at 31 December 2012.
3.4.2.5 Conversion rates
The following conversion rates were used for establishing the balance sheet at 31 December 2013 and 31 December 2012:
31.12.2013 31.12.2012
Non-EU currencies Dominican Republic Pesos (DOP) 58.3329 53.1220
Fiji Dollars (FJD) 2.5655 2.3417
Haitian Gourde (HTG) 60.1459 55.7265
Kenya Shillings (KES) 118.73 113.68
Mauritania Ouguiyas (MRO) 398.7 393.99
Mauritius Rupees (MUR) 41.27 40.19
Rwanda Francs (RWF) 926.86 811.83
Tanzania Shillings (TZS) 2 179.05 n/a
Uganda Shillings (UGX) 3 476 3 549
United States Dollars (USD) 1.3791 1.3194
Franc CFA Francs (XAF/XOF) 655.957 655.957
South Africa Rand (ZAR) 14.566 11.1727
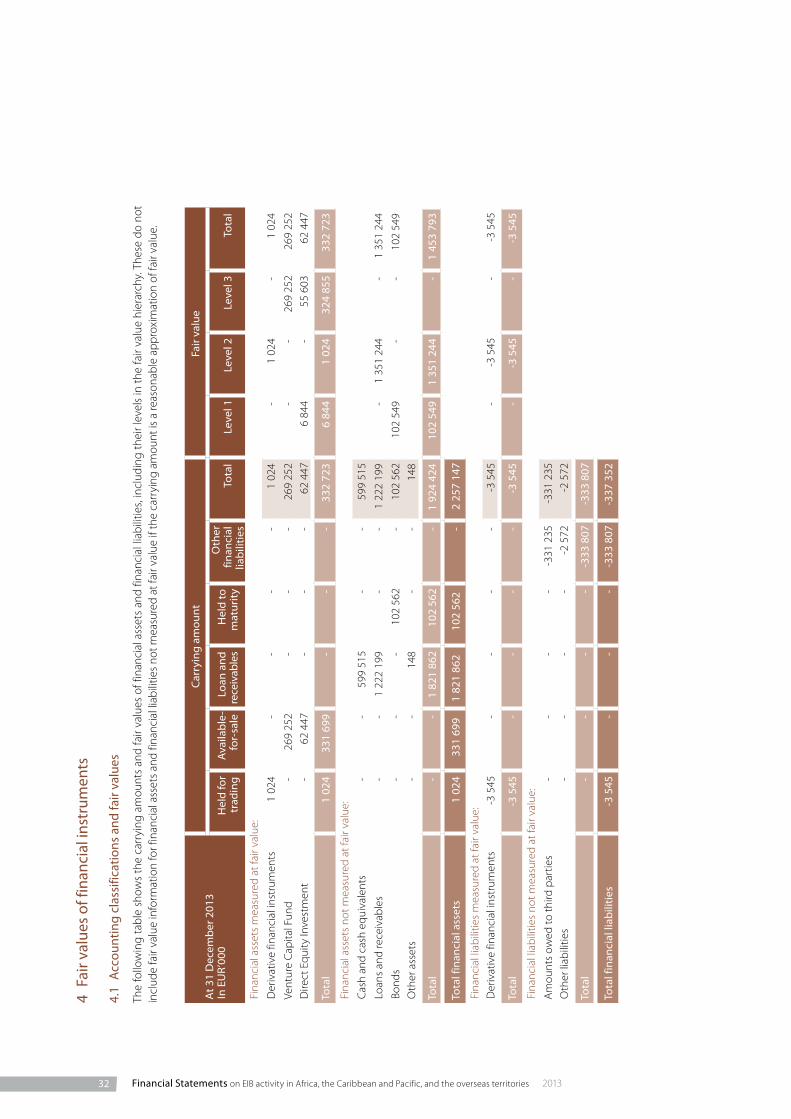
32 Financial Statements on EIB activity in Africa, the Caribbean and Pacific, and the overseas territories 2013
4 Fa
ir va
lues
of f
inan
cial
inst
rum
ents
4.1
Acco
untin
g cl
assi
ficat
ions
and
fair
valu
es
The
follo
win
g ta
ble
show
s th
e ca
rryi
ng a
mou
nts
and
fair
valu
es o
f fin
anci
al a
sset
s an
d fin
anci
al li
abili
ties,
incl
udin
g th
eir l
evel
s in
the
fair
valu
e hi
erar
chy.
The
se d
o no
t in
clud
e fa
ir va
lue
info
rmat
ion
for f
inan
cial
ass
ets
and
finan
cial
liab
ilitie
s no
t mea
sure
d at
fair
valu
e if
the
carr
ying
am
ount
is a
reas
onab
le a
ppro
xim
atio
n of
fair
valu
e.
At 3
1 D
ecem
ber 2
013
In E
UR’
000
Carr
ying
am
ount
Fair
valu
e
Hel
d fo
r tr
adin
gA
vaila
ble-
for-
sale
Loan
and
re
ceiv
able
sH
eld
to
mat
urity
Oth
er
finan
cial
lia
bilit
ies
Tota
lLe
vel 1
Leve
l 2Le
vel 3
Tota
l
Fina
ncia
l ass
ets
mea
sure
d at
fair
valu
e:
Der
ivat
ive
finan
cial
inst
rum
ents
1
024
--
--
1 02
4-
1 02
4-
1 02
4
Vent
ure
Cap
ital F
und
-26
9 25
2-
--
269
252
--
269
252
269
252
Dire
ct E
quity
Inve
stm
ent
-62
447
--
-62
447
6 84
4-
55 6
0362
447
Tota
l 1
024
331
699
--
-33
2 72
36
844
1 02
432
4 85
533
2 72
3
Fina
ncia
l ass
ets
not m
easu
red
at fa
ir va
lue:
Cas
h an
d ca
sh e
quiv
alen
ts-
-59
9 51
5-
-59
9 51
5
Loan
s an
d re
ceiv
able
s-
-1
222
199
--
1 22
2 19
9-
1 35
1 24
4-
1 35
1 24
4
Bond
s -
--
102
562
-10
2 56
210
2 54
9-
-10
2 54
9O
ther
ass
ets
--
148
--
148
Tota
l -
-1
821
862
102
562
-1
924
424
102
549
1 35
1 24
4-
1 45
3 79
3
Tota
l fin
anci
al a
sset
s1
024
331
699
1 82
1 86
210
2 56
2-
2 25
7 14
7
Fina
ncia
l lia
bili
ties
mea
sure
d at
fair
valu
e:D
eriv
ativ
e fin
anci
al in
stru
men
ts-3
545
--
--
-3 5
45-
-3 5
45-
-3 5
45
Tota
l -3
545
--
--
-3 5
45-
-3 5
45-
-3 5
45
Fina
ncia
l lia
bili
ties
not m
easu
red
at fa
ir va
lue:
Am
ount
s ow
ed to
third
par
ties
--
--
-331
235
-331
235
Oth
er li
abili
ties
--
--
-2 5
72-2
572
Tota
l -
--
--3
33 8
07-3
33 8
07
Tota
l fin
anci
al li
abili
ties
-3 5
45-
--
-333
807
-337
352

332013 Financial Statements on EIB activity in Africa, the Caribbean and Pacific, and the overseas territories
Financial Statements
At 3
1 D
ecem
ber 2
012
In E
UR’
000
Carr
ying
am
ount
Fair
valu
e
Hel
d fo
r tr
adin
gA
vaila
ble-
for-
sale
Loan
and
re
ceiv
able
sH
eld
to
mat
urity
Oth
er
finan
cial
lia
bilit
ies
Tota
lLe
vel 1
Leve
l 2Le
vel 3
Leve
l 4
Fina
ncia
l ass
ets
mea
sure
d at
fair
valu
e:
Der
ivat
ive
finan
cial
inst
rum
ents
11
5-
--
-11
5-
115
-11
5
Vent
ure
Cap
ital F
und
-26
5 30
1-
--
265
301
--
265
301
265
301
Dire
ct E
quity
Inve
stm
ent
-67
700
--
-67
700
11 0
01-
56 6
9967
700
Tota
l 11
533
3 00
1-
--
333
116
11 0
0111
532
2 00
033
3 11
6
Fina
ncia
l ass
ets
not m
easu
red
at fa
ir va
lue:
Cas
h an
d ca
sh e
quiv
alen
ts-
-46
6 56
8-
-46
6 56
8
Loan
s an
d re
ceiv
able
s-
-1
146
280
--
1 14
6 28
0-
1 22
6 40
9-
1 22
6 40
9
Amou
nts r
ecei
vabl
e fro
m c
ontr
ibut
ors
--
87 3
10-
-87
310
Bond
s-
--
99 0
29-
99 0
2998
805
--
98 8
05O
ther
ass
ets
--
224
--
224
Tota
l -
-1
700
382
99 0
29-
1 79
9 41
198
805
1 22
6 40
9-
1 32
5 21
4
Tota
l fin
anci
al a
sset
s11
533
3 00
11
700
382
99 0
29-
2 13
2 52
7
Fina
ncia
l lia
bili
ties
mea
sure
d at
fair
valu
e:D
eriv
ativ
e fin
anci
al in
stru
men
ts-7
035
--
--
-7 0
35-
-7 0
35-
-7 0
35
Tota
l -7
035
--
--
-7 0
35-
-7 0
35-
-7 0
35
Fina
ncia
l lia
bili
ties
not m
easu
red
at fa
ir va
lue:
Am
ount
s ow
ed to
third
par
ties
--
--
-312
086
-312
086
Oth
er li
abili
ties
--
--
-1 1
53-1
153
Tota
l -
--
--3
13 2
39-3
13 2
39
Tota
l fin
anci
al li
abili
ties
-7 0
35-
--
-313
239
-320
274
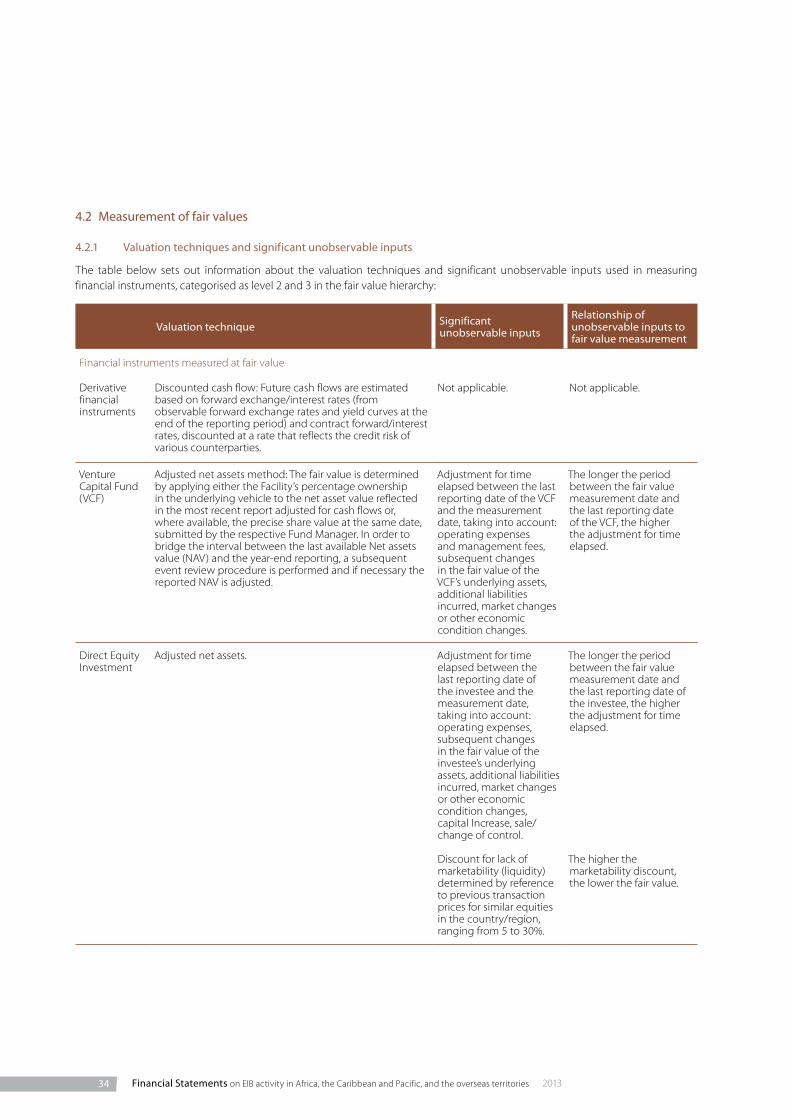
34 Financial Statements on EIB activity in Africa, the Caribbean and Pacific, and the overseas territories 2013
4.2 Measurement of fair values
4.2.1 Valuation techniques and significant unobservable inputs
The table below sets out information about the valuation techniques and significant unobservable inputs used in measuring financial instruments, categorised as level 2 and 3 in the fair value hierarchy:
Valuation technique Significant unobservable inputs
Relationship of unobservable inputs to fair value measurement
Financial instruments measured at fair value
Derivative financial instruments
Discounted cash flow: Future cash flows are estimated based on forward exchange/interest rates (from observable forward exchange rates and yield curves at the end of the reporting period) and contract forward/interest rates, discounted at a rate that reflects the credit risk of various counterparties.
Not applicable. Not applicable.
Venture Capital Fund (VCF)
Adjusted net assets method: The fair value is determined by applying either the Facility’s percentage ownership in the underlying vehicle to the net asset value reflected in the most recent report adjusted for cash flows or, where available, the precise share value at the same date, submitted by the respective Fund Manager. In order to bridge the interval between the last available Net assets value (NAV) and the year-end reporting, a subsequent event review procedure is performed and if necessary the reported NAV is adjusted.
Adjustment for time elapsed between the last reporting date of the VCF and the measurement date, taking into account: operating expenses and management fees, subsequent changes in the fair value of the VCF’s underlying assets, additional liabilities incurred, market changes or other economic condition changes.
The longer the period between the fair value measurement date and the last reporting date of the VCF, the higher the adjustment for time elapsed.
Direct Equity Investment
Adjusted net assets. Adjustment for time elapsed between the last reporting date of the investee and the measurement date, taking into account: operating expenses, subsequent changes in the fair value of the investee’s underlying assets, additional liabilities incurred, market changes or other economic condition changes, capital Increase, sale/ change of control.
The longer the period between the fair value measurement date and the last reporting date of the investee, the higher the adjustment for time elapsed.
Discount for lack of marketability (liquidity) determined by reference to previous transaction prices for similar equities in the country/region, ranging from 5 to 30%.
The higher the marketability discount, the lower the fair value.

352013 Financial Statements on EIB activity in Africa, the Caribbean and Pacific, and the overseas territories
Financial Statements
With the application of IFRS 13, valuation adjustments are in-cluded in the fair value of derivatives at 31 December 2013, namely:
– Credit valuation adjustments (CVA), reflecting counterparty credit risk on derivative transactions, amounting to a loss of EUR 184k.
– Debit valuation adjustments (DVA), reflecting own credit risk on derivative transactions, were estimated at nil.
The Facility’s policy is to recognise the transfers between Levels as of the date of the event or change in circumstances that caused the transfer.
4.2.2 Transfers between Level 1 and 2
In 2013 the Facility did not make transfers from Level 1 to 2 or Level 2 to 1 of the fair value hierarchy.
Valuation technique Significant unobservable inputs
Relationship of unobservable inputs to fair value measurement
Financial instruments not measured at fair value
Loans and receivables
Discounted cash flows: The valuation model uses contractual cash flows that are conditional upon the non-occurrence of default by the debtor and do not take into account any collateral values or early repayments’ scenarios. To obtain the Net Present Value (NPV) of the loans, the model retained discounts the contractual cash flows of each loan using an adjusted market discount curve. The individual loan NPV is then adjusted to take into consideration the relevant associated Expected Loss. The results are then summed to obtain the fair value of Loans and receivables.
Not applicable. Not applicable.
Amounts owed to third parties
Discounted cash flows. Not applicable. Not applicable.
Other liabilities
Discounted cash flows. Not applicable. Not applicable.
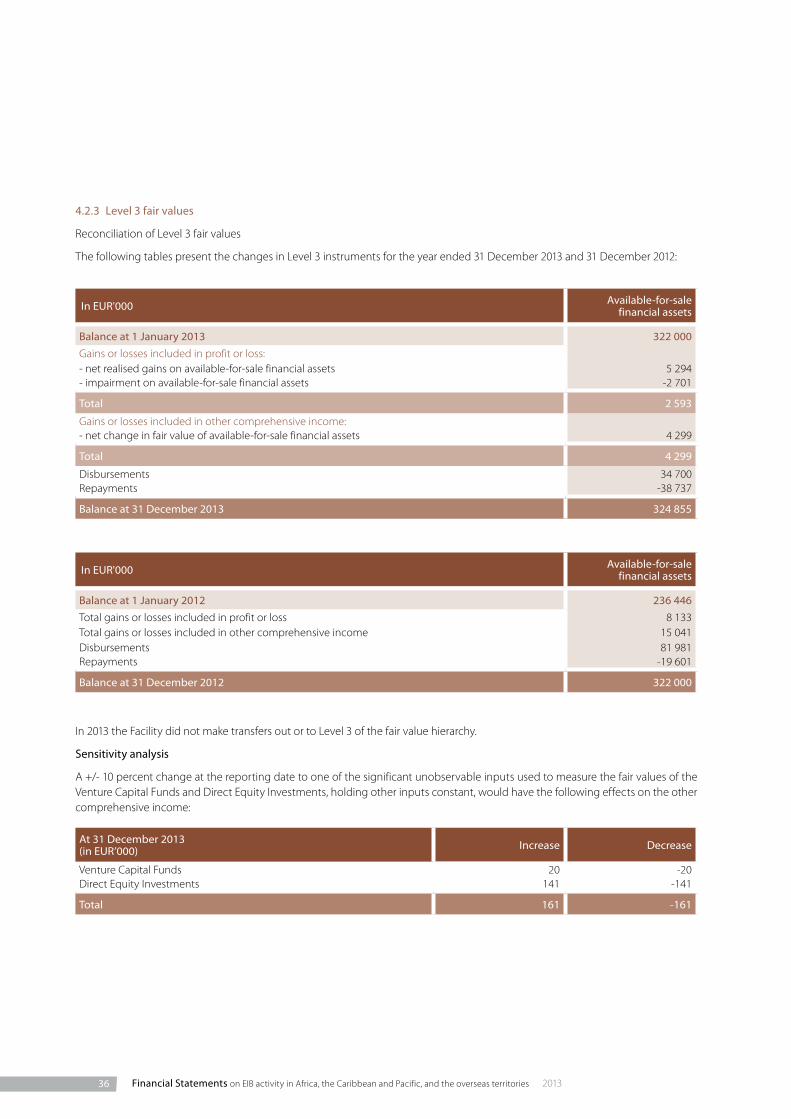
36 Financial Statements on EIB activity in Africa, the Caribbean and Pacific, and the overseas territories 2013
In EUR'000 Available-for-sale financial assets
Balance at 1 January 2013 322 000Gains or losses included in profit or loss:- net realised gains on available-for-sale financial assets 5 294- impairment on available-for-sale financial assets -2 701
Total 2 593
Gains or losses included in other comprehensive income:- net change in fair value of available-for-sale financial assets 4 299
Total 4 299
Disbursements 34 700Repayments -38 737
Balance at 31 December 2013 324 855
At 31 December 2013(in EUR’000) Increase Decrease
Venture Capital Funds 20 -20Direct Equity Investments 141 -141
Total 161 -161
In EUR'000 Available-for-sale financial assets
Balance at 1 January 2012 236 446Total gains or losses included in profit or loss 8 133Total gains or losses included in other comprehensive income 15 041Disbursements 81 981Repayments -19 601
Balance at 31 December 2012 322 000
4.2.3 Level 3 fair values
Reconciliation of Level 3 fair values
The following tables present the changes in Level 3 instruments for the year ended 31 December 2013 and 31 December 2012:
In 2013 the Facility did not make transfers out or to Level 3 of the fair value hierarchy.
Sensitivity analysis
A +/- 10 percent change at the reporting date to one of the significant unobservable inputs used to measure the fair values of the Venture Capital Funds and Direct Equity Investments, holding other inputs constant, would have the following effects on the other comprehensive income:
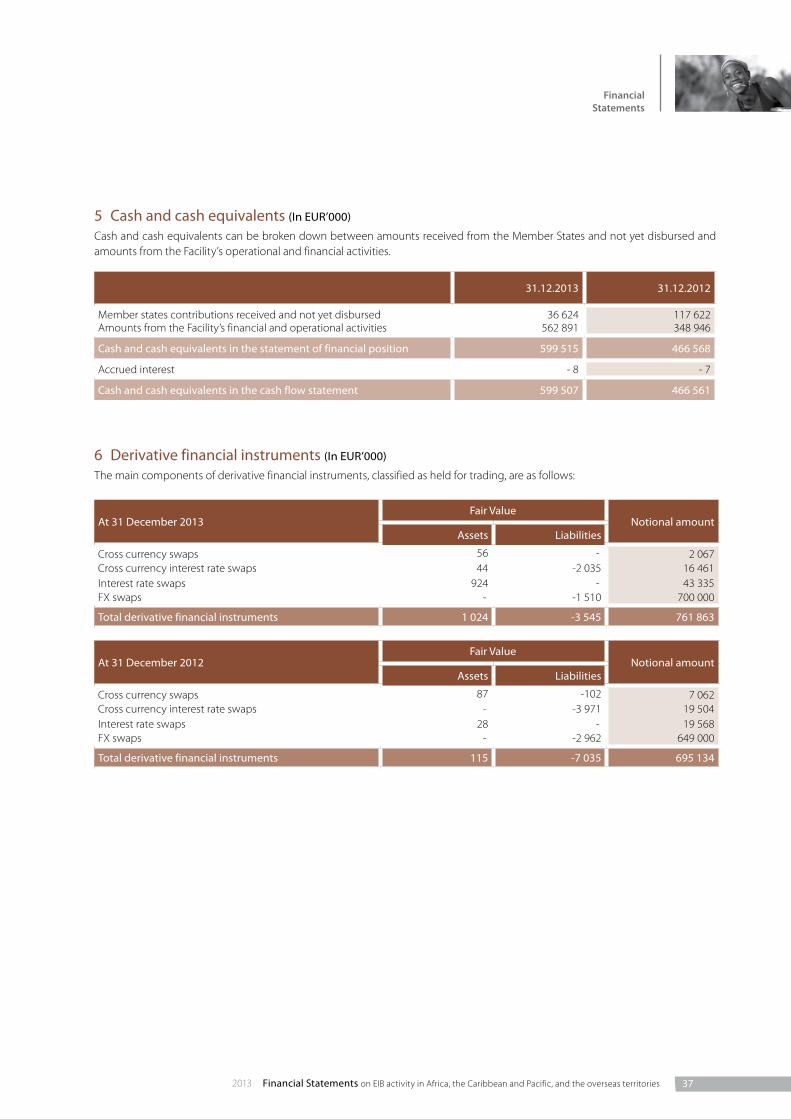
372013 Financial Statements on EIB activity in Africa, the Caribbean and Pacific, and the overseas territories
Financial Statements
6 Derivative financial instruments (In EUR’000)
The main components of derivative financial instruments, classified as held for trading, are as follows:
5 Cash and cash equivalents (In EUR’000)
Cash and cash equivalents can be broken down between amounts received from the Member States and not yet disbursed and amounts from the Facility’s operational and financial activities.
31.12.2013 31.12.2012
Member states contributions received and not yet disbursed 36 624 117 622Amounts from the Facility’s financial and operational activities 562 891 348 946
Cash and cash equivalents in the statement of financial position 599 515 466 568
Accrued interest - 8 - 7
Cash and cash equivalents in the cash flow statement 599 507 466 561
At 31 December 2013Fair Value
Notional amountAssets Liabilities
Cross currency swaps 56 - 2 067Cross currency interest rate swaps 44 -2 035 16 461Interest rate swaps 924 - 43 335FX swaps - -1 510 700 000
Total derivative financial instruments 1 024 -3 545 761 863
At 31 December 2012Fair Value
Notional amountAssets Liabilities
Cross currency swaps 87 -102 7 062Cross currency interest rate swaps - -3 971 19 504Interest rate swaps 28 - 19 568FX swaps - -2 962 649 000
Total derivative financial instruments 115 -7 035 695 134

38 Financial Statements on EIB activity in Africa, the Caribbean and Pacific, and the overseas territories 2013
7 Loans and receivables (In EUR’000)
The main components of loans and receivable are as follows:
Global loans (*) Senior loans Subordinated loans Total
Nominal as at 1 January 2013 254 686 789 970 133 780 1 178 436
Disbursements 150 513 91 690 - 242 203Write offs - - - -Repayments -51 595 -55 865 -11 700 -119 160 Interest capitalised - -342 10 705 10 363Foreign exchange rates differences -11 491 -19 446 -1 153 -32 090
Nominal as at 31 December 2013 342 113 806 007 131 632 1 279 752
Impairment as at 1 January 2013 -6 494 -14 296 -24 355 -45 145
Impairment recorded in statement of profit or loss and other comprehensive income -1 341 - -27 081 -28 422
Write offs - - - -Reversal of impairment - 1 088 - 1 088Foreign exchange rates differences 160 474 1 054 1 688
Impairment as at 31 December 2013 -7 675 -12 734 -50 382 -70 791
Amortised Cost -2 109 -3 883 -66 -6 058Interest 5 154 10 536 3 606 19 296
Loans and receivables as at 31 December 2013 337 482 799 926 84 790 1 222 199
Global loans (*) Senior loans Subordinated loans Total
Nominal as at 1 January 2012 225 365 716 350 128 679 1 070 394
Disbursements 79 015 154 003 - 233 018Write offs -947 -1 206 - -2 153Repayments -39 967 -71 368 -4 145 -115 480Interest capitalised - -117 9 739 9 622Foreign exchange rates differences -8 780 -7 692 -493 -16 965
Nominal as at 31 December 2012 254 686 789 970 133 780 1 178 436
Impairment as at 1 January 2012 -7 609 -16 372 -24 835 -48 816
Impairment recorded in statement of profit or loss and other comprehensive income -835 -292 - -1 127
Write offs 947 1 206 - 2 153Reversal of impairment 910 814 - 1 724Foreign exchange rates differences 93 348 480 921
Impairment as at 31 December 2012 -6 494 -14 296 -24 355 -45 145
Amortised Cost -1 641 -3 984 -82 -5 707Interest 5 246 9 244 4 206 18 696
Loans and receivables as at 31 December 2012 251 797 780 934 113 549 1 146 280
(*) including agency agreements

392013 Financial Statements on EIB activity in Africa, the Caribbean and Pacific, and the overseas territories
Financial Statements
8 Available-for-sale financial assets (In EUR’000)
The main components of available-for-sale financial assets are as follows:
Venture Capital Fund Direct Equity Investment Total
Cost as at 1 January 2013 220 710 61 830 282 540
Disbursements 33 600 1 100 34 700Repayments / sales -36 322 -2 415 -38 737Foreign exchange rates differences on repayments / sales 922 - 398 524
Cost as at 31 December 2013 218 910 60 117 279 027
Unrealised gains and losses as at 1 January 2013 59 321 9 113 68 434Net change in unrealised gains and losses 13 290 -3 533 9 757
Unrealised gains and losses as at 31 December 2013 72 611 5 580 78 191
Impairment as at 1 January 2013 -14 730 -3 243 -17 973
Impairment recorded in statement of profit or loss and other comprehensive income during the year -8 105 -71 -8 176
Foreign exchange rates differences on impairment 566 64 630
Impairment as at 31 December 2013 -22 269 -3 250 -25 519
Available-for-sale financial assets as at 31 December 2013 269 252 62 447 331 699
Venture Capital Fund Direct Equity Investment Total
Cost as at 1 January 2012 182 692 36 565 219 257
Disbursements 56 007 25 974 81 981Repayments / sales -19 570 -31 -19 601Foreign exchange rates differences on repayments / sales 1 581 -678 903
Cost as at 31 December 2012 220 710 61 830 282 540
Unrealised gains and losses as at 1 January 2012 29 781 11 969 41 750Net change in unrealised gains and losses 29 540 -2 856 26 684
Unrealised gains and losses as at 31 December 2012 59 321 9 113 68 434
Impairment as at 1 January 2012 -6 887 -2 460 -9 347
Impairment recorded in statement of profit or loss and other comprehensive income during the year -7 976 -951 -8 927
Foreign exchange rates differences on impairment 133 168 301
Impairment as at 31 December 2012 -14 730 -3 243 -17 973
Available-for-sale financial assets as at 31 December 2012 265 301 67 700 333 001

40 Financial Statements on EIB activity in Africa, the Caribbean and Pacific, and the overseas territories 2013
9 Amounts receivable from contributors (In EUR’000)
The main components of amounts receivable from contributors are as follows:
31.12.2013 31.12.2012
Member states contribution called but not paid - 87 310
Total amounts receivable from contributors - 87 310
11 Other assets (In EUR’000)
The main components of other assets are as follows:
31.12.2013 31.12.2012
Amount receivable from EIB 6 7Financial guarantees 142 217Amounts receivable with regard to TA disbursements 337 337
Impairment on amounts receivable with regard to TA disbursements (Note 20) -337 -337
Total other assets 148 224
12 Deferred income (In EUR’000)
The main components of deferred income are as follows:
31.12.2013 31.12.2012
Deferred interest subsidies 34 787 37 387Deferred commissions on loans and receivables 296 421
Total deferred income 35 083 37 808
10 Held-to-maturity financial assets (In EUR’000)
The held-to-maturity portfolio is composed of quoted bonds which have a remaining maturity of less than three months at report-ing date. The following table shows the movements of the held-to-maturity portfolio:
Balance as at 1 January 2013 99 029
Acquisitions 680 635Maturities -676 369Change in amortisation of premium/discount 228Change in accrued interest -961
Balance as at 31 December 2013 102 562
Balance as at 1 January 2012 -
Acquisitions 98 278Change in amortisation of premium/discount -210Change in accrued interest 961
Balance as at 31 December 2012 99 029

412013 Financial Statements on EIB activity in Africa, the Caribbean and Pacific, and the overseas territories
Financial Statements
13 Amounts owed to third parties (In EUR’000)
The main components of amounts owed to third parties are as follows:
31.12.2013 31.12.2012
Net general administrative expenses payable to EIB 37 851 36 202Other amounts payable to EIB 716 8 904
Interest subsidies not yet disbursed owed to Member States 292 668 266 980
Total amounts owed to third parties 331 235 312 086
14 Other liabilities (In EUR’000)
The main components of other liabilities are as follows:
15 Member States Contribution called (In EUR’000)
31.12.2013 31.12.2012
Loan repayments received in advance 1 827 215Deferred income from interest subsidies 603 723
Financial guarantees 142 215
Total other liabilities 2 572 1 153
Member States Contribution to the Facility
Contribution to interest subsidies Total contributed Called and not
paid (*)
Austria 44 025 11 493 55 518 -Belgium 65 123 17 001 82 124 -Denmark 35 552 9 281 44 833 -Finland 24 587 6 419 31 006 -France 403 698 105 387 509 085 -Germany 388 082 101 310 489 392 -Greece 20 766 5 421 26 187 -Ireland 10 300 2 689 12 989 -
Italy 208 328 54 385 262 713 -Luxembourg 4 818 1 258 6 076 -Netherlands 86 720 22 638 109 358 -Portugal 16 115 4 207 20 322 -Spain 97 020 25 327 122 347 -Sweden 45 355 11 840 57 195 -United Kingdom 210 820 55 035 265 855 -
Total as at 31 December 2013 1 661 309 433 691 2 095 000 -
Total as at 31 December 2012 1 561 309 383 691 1 945 000 87 310
(*) On 20 November 2012, the Council fixed the amount of financial contributions to be paid by each Member State by 21 January 2013.

42 Financial Statements on EIB activity in Africa, the Caribbean and Pacific, and the overseas territories 2013
16 Contingent liabilities and commitments (In EUR’000)
31.12.2013 31.12.2012
COMMITMENTS
Undisbursed loans 889 866 749 044Undisbursed commitment in respect of available-for-sale financial assets 176 821 217 070Guarantees drawn 4 414 6 224Subsidies and TA 222 588 228 175
CONTINGENT LIABILITIES
Guarantees undrawn 25 000 20 000
Total contingent liabilities and commitments 1 318 689 1 220 513
17 Interest and similar income and expenses (In EUR’000)
The main component of interest and similar expenses is as follows:
From 01.01.2013to 31.12.2013
From 01.01.2012to 31.12.2012
Cash and cash equivalents 273 1 678Held-to-maturity financial assets 461 36Loans and receivables 63 189 64 060Interest subsidies 4 347 1 729
Total interest and similar income 68 270 67 503
From 01.01.2013to 31.12.2013
From 01.01.2012to 31.12.2012
Derivative financial instruments -1 175 -1 114
Total interest and similar expenses -1 175 - 1 114
18 Fee and commission income and expenses (In EUR’000)
The main components of fee and commission income are as follows:
The main component of fee and commission expenses is as follows:
From 01.01.2013to 31.12.2013
From 01.01.2012to 31.12.2012
Fee and commission on loans and receivables 3 896 1 710Fee and commission on financial guarantees 145 191Other 10 33
Total fee and commission income 4 051 1 934
From 01.01.2013to 31.12.2013
From 01.01.2012to 31.12.2012
Commission paid to third parties with regard to available-for-sale financial assets -43 -292
Total fee and commission expenses -43 -292

432013 Financial Statements on EIB activity in Africa, the Caribbean and Pacific, and the overseas territories
Financial Statements
19 Net realised gains on available-for-sale financial assets (In EUR’000)
The main components of net realised gains on available-for-sale financial assets are as follows:
22 Subsequent eventsThere have been no material post balance sheet events which could require disclosure or adjustment to the 31 December 2013 fi-nancial statements.
20 Impairment on other assets (In EUR’000)
During 2012 the Facility made a technical assistance payment amounting to EUR 638 which due to fraudulent behaviour of the counterparty did not reach the final beneficiary. Following legal interventions, the Facility could recover EUR 301 and the remain-ing amount outstanding was recorded as a receivable. As at the reporting date the likelihood that the Facility will ever recover the outstanding amount is estimated to be low and the outstanding amount of EUR 337 was recorded as impairment in the Facility’s comprehensive income.
From 01.01.2013to 31.12.2013
From 01.01.2012to 31.12.2012
Net proceeds from available-for-sale financial assets 2 688 70Dividend income 2 606 975
Net realised gains on available-for-sale financial assets 5 294 1 045
Following the entry in force of the revised Cotonou Partnership Agreement on the 1st of July 2008, general administrative expens-es are not covered anymore by the Member States.
21 General administrative expenses (In EUR’000)
General administrative expenses represent the actual costs incurred by the EIB for managing the Facility less in-come generated from standard appraisal fees directly charged by the EIB to clients of the Facility.
From 01.01.2013to 31.12.2013
From 01.01.2012to 31.12.2012
Actual cost incurred by the EIB -40 966 -38 390Income from appraisal fees directly charged to clients of the Facility 3 115 2 188
General administrative expenses -37 851 -36 202

EIB addresses
European Investment Bank
98-100, boulevard Konrad Adenauer 3 +352 4379-1L-2950 Luxembourg 5 +352 437704
www.eib.org/acp – U [email protected]
Caribbean/Dominican Republic1063, Ave. Abraham Lincoln, 3 +1 8094734496Ensanche Serrallés 5 +1 8094734031Santo Domingo U [email protected]
Central and Eastern Africa/NairobiAfrica Re Centre, 5th Floor, 3 +254 202735260Hospital Road, PO Box 40193 5 +254 202713278KE-00100 Nairobi U [email protected]
Pacific/SydneyLevel 32 3 +61 28211053688 Phillip Street 5 +61 282110538Sydney NSW 2000 U [email protected]
Southern Africa and Indian Ocean/Tshwane (Pretoria)5, Greenpark Estate 3 +27 12425046027, George Storrar Drive 5 +27 124250470Groenkloof 0181, Tshwane Pretoria U [email protected] Africa
West Africa and Sahel/Dakar3, rue du Docteur Roux 3 +221 338894300BP 6935 Dakar-Plateau 5 +221 338429712Senegal U [email protected]
ACP and OCT External Regional Offices


© EIB – 06/2014 – QH-AW-14-001-EN-C – ISBN 978-92-861-2070-1 – ISSN 2363-1074 – doi:10.2867/62362 – EIB GraphicTeam
www.eib.org/acp
2 0 1 3 Fi n a n c i a l S t a t e m e n t s on EIB activity in Africa, the Caribbean and Pacific, and the overseas territories
2013
Fin
anci
al S
tate
men
ts o
n E
IB a
ctiv
ity
in A
fric
a, t
he
Car
ibb
ean
an
d P
acifi
c, a
nd
th
e o
vers
eas
terr
ito
ries
European Investment Bank98 -100, boulevard Konrad AdenauerL-2950 Luxembourg3 +352 4379 -15 +352 437704 www.eib.org/acp – U [email protected]