Embed Size (px)
Citation preview
FINANCIAL STATEMENTS 2016Jussi Pesonen
President and CEO
31 January 2017
| © UPM
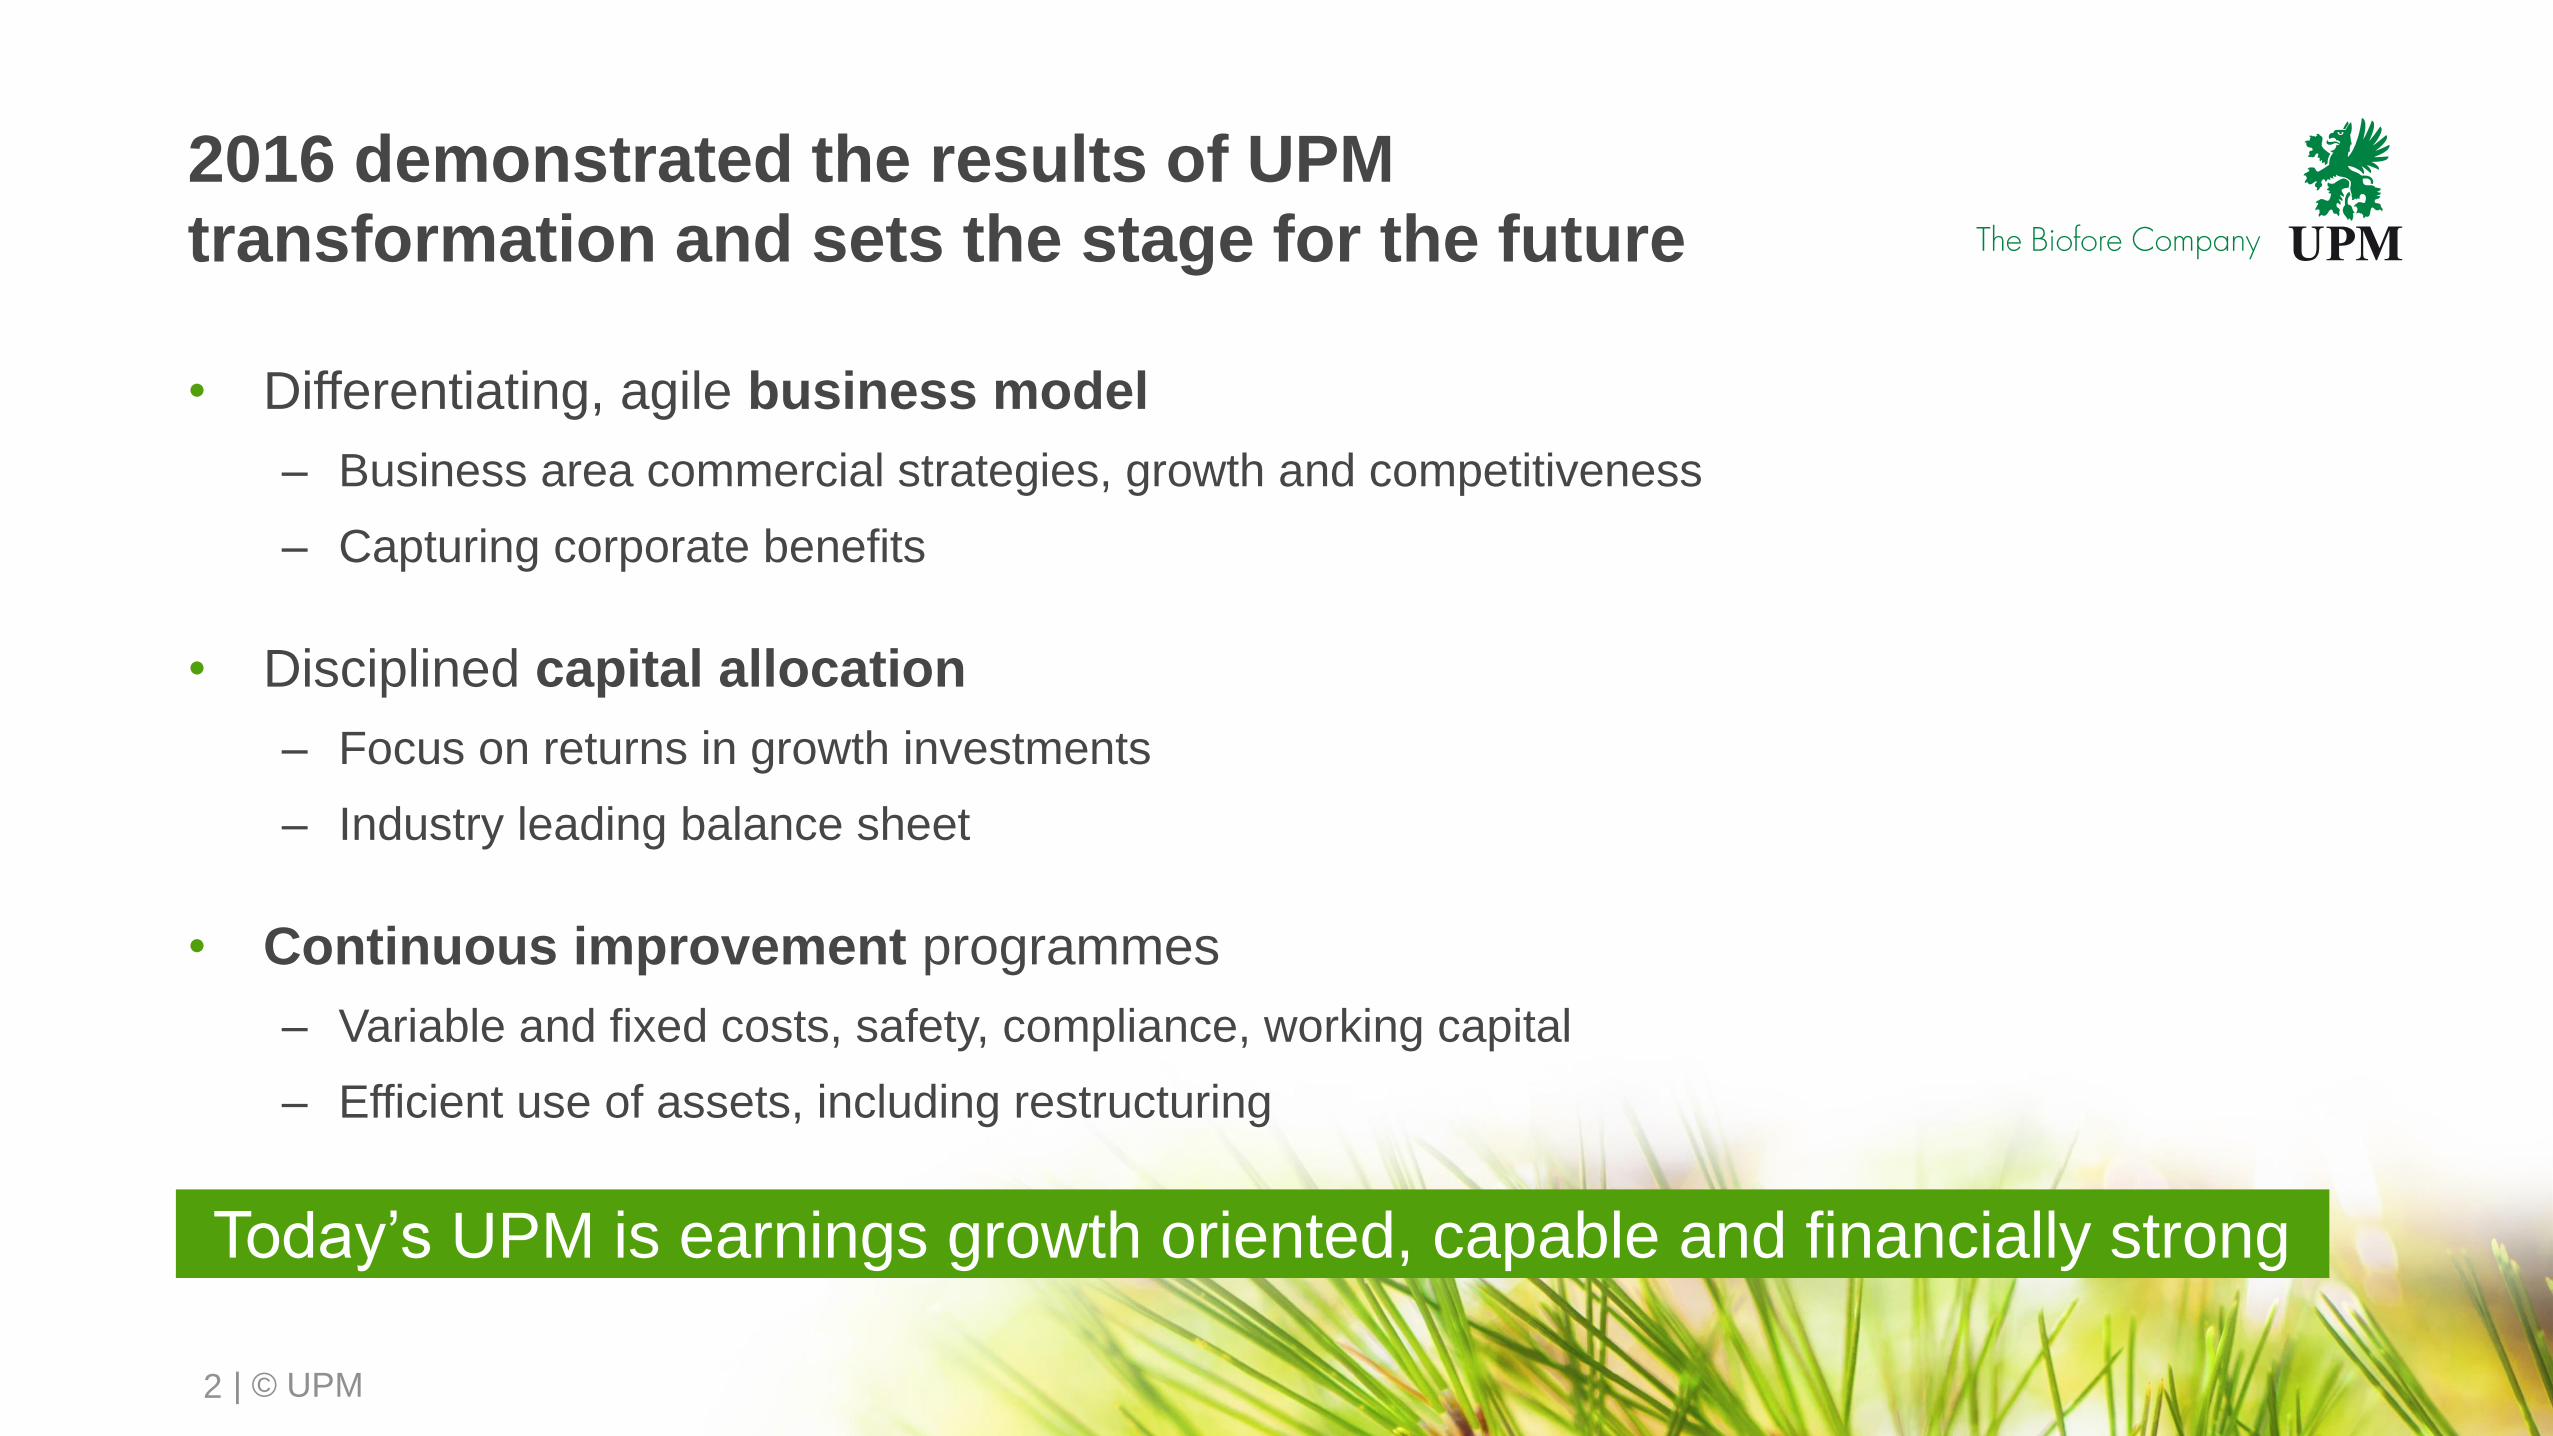
2016 demonstrated the results of UPM
transformation and sets the stage for the future
• Differentiating, agile business model
– Business area commercial strategies, growth and competitiveness
– Capturing corporate benefits
• Disciplined capital allocation
– Focus on returns in growth investments
– Industry leading balance sheet
• Continuous improvement programmes
– Variable and fixed costs, safety, compliance, working capital
– Efficient use of assets, including restructuring
Today’s UPM is earnings growth oriented, capable and financially strong
2
| © UPM
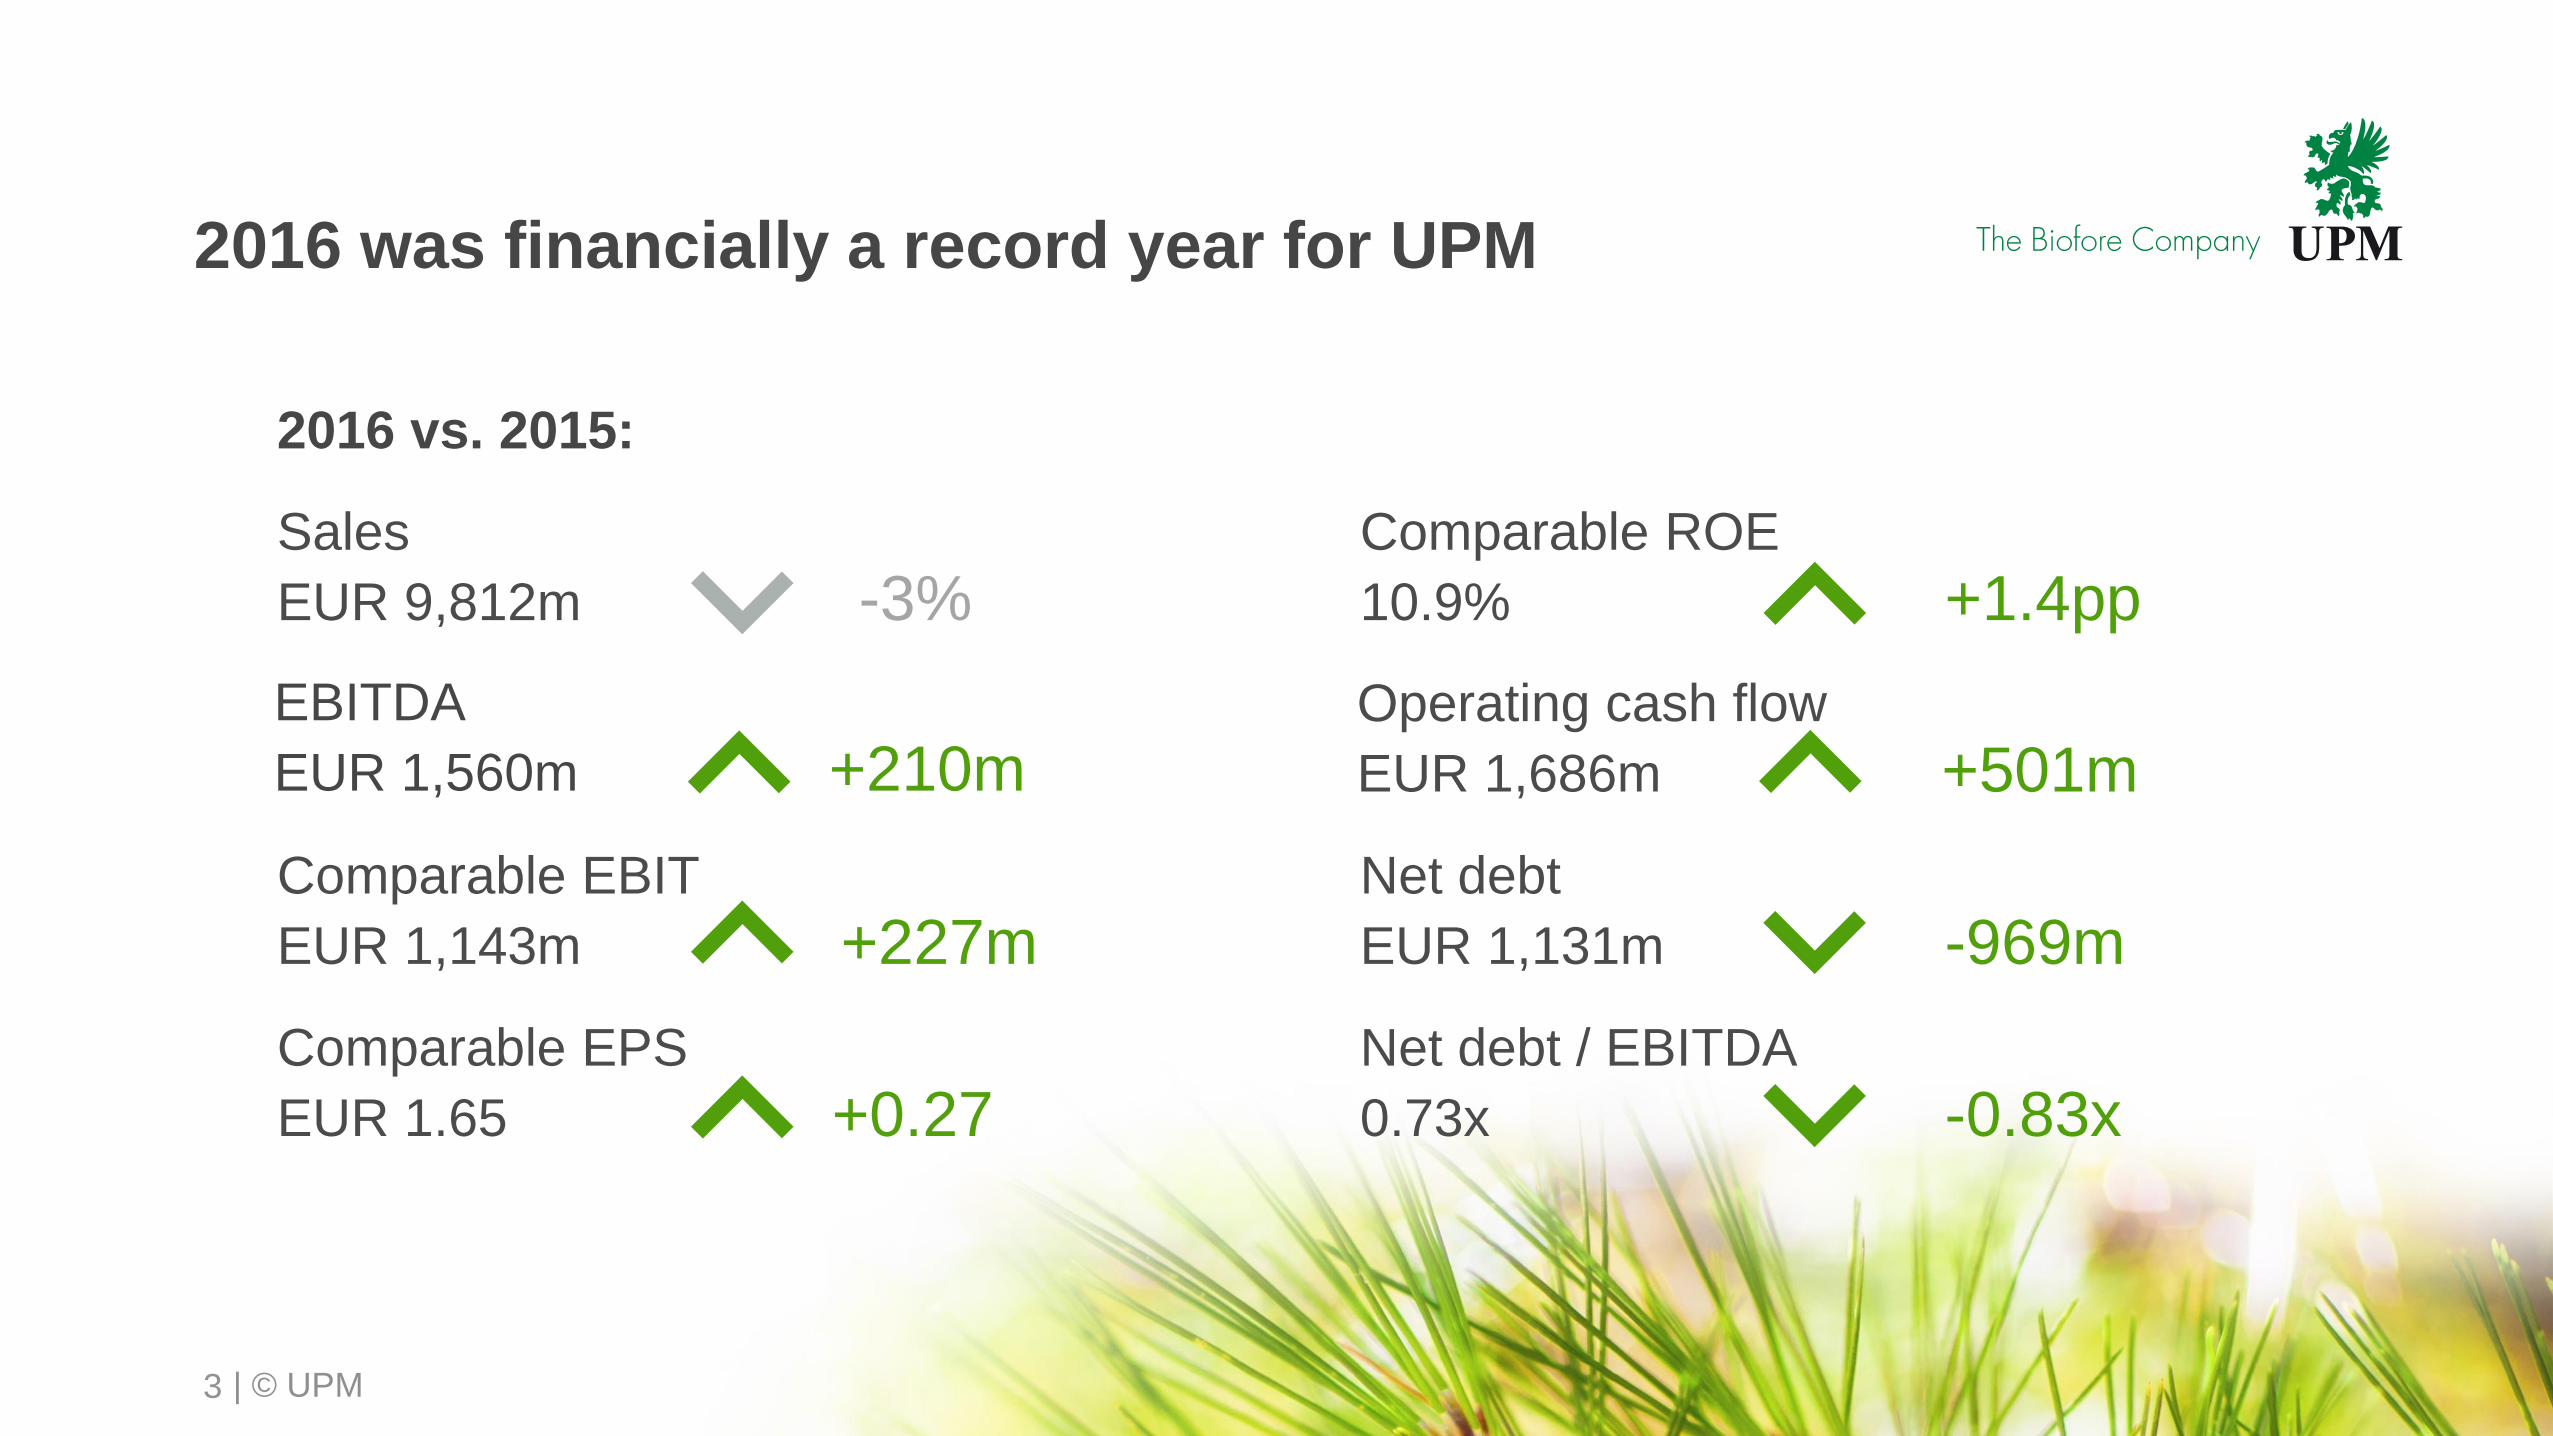
Sales
EUR 9,812m -3%
EBITDA
EUR 1,560m +210m
2016 was financially a record year for UPM
Comparable EBIT
EUR 1,143m +227m
2016 vs. 2015:
Comparable EPS
EUR 1.65 +0.27
Net debt
EUR 1,131m -969m
Operating cash flow
EUR 1,686m +501m
Net debt / EBITDA
0.73x -0.83x
Comparable ROE
10.9% +1.4pp
3
| © UPM
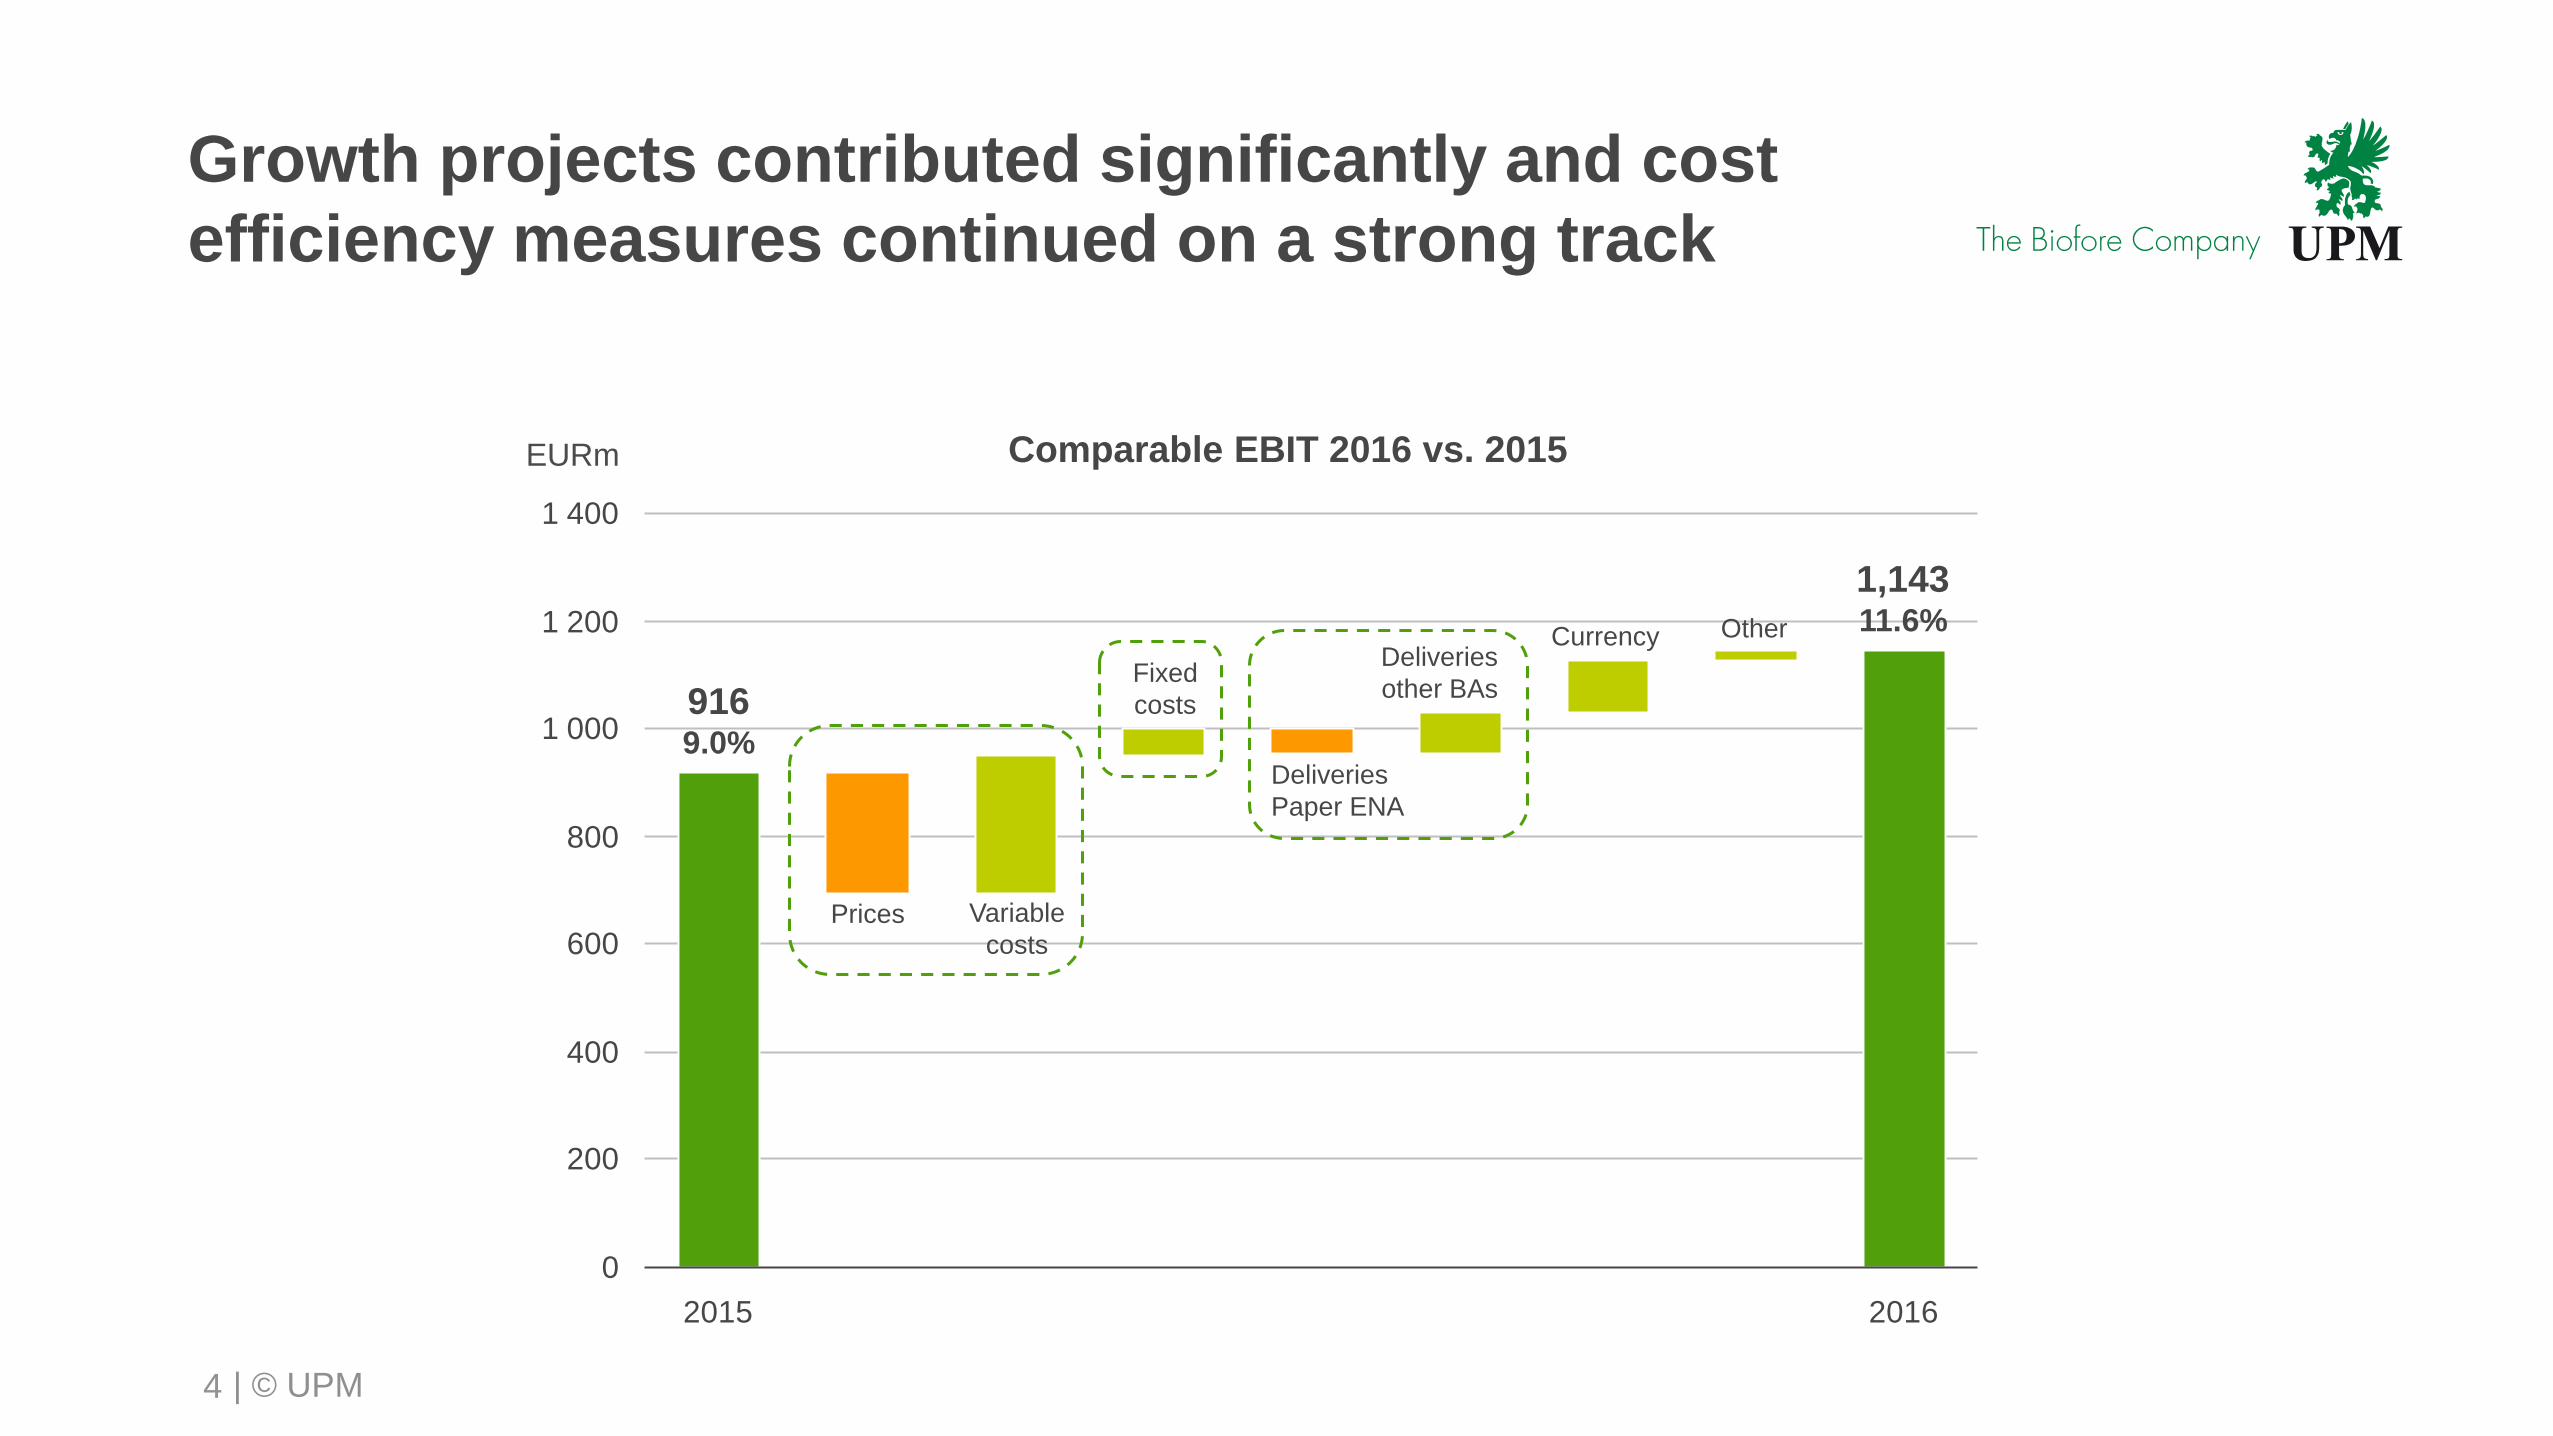
Growth projects contributed significantly and cost
efficiency measures continued on a strong track
4
0
200
400
600
800
1 000
1 200
1 400
2015 2016
Variable
costs
Fixed
costs
Deliveries
other BAs
Deliveries
Paper ENA
Currency
Comparable EBIT 2016 vs. 2015
Prices
Other
9169.0%
1,14311.6%
EURm
| © UPM
0,0
0,5
1,0
1,5
2,0
2,5
3,0
3,5
4,0
0
500
1 000
1 500
2 000
2 500
3 000
3 500
4 000
2011 2012 2013 2014 2015 2016
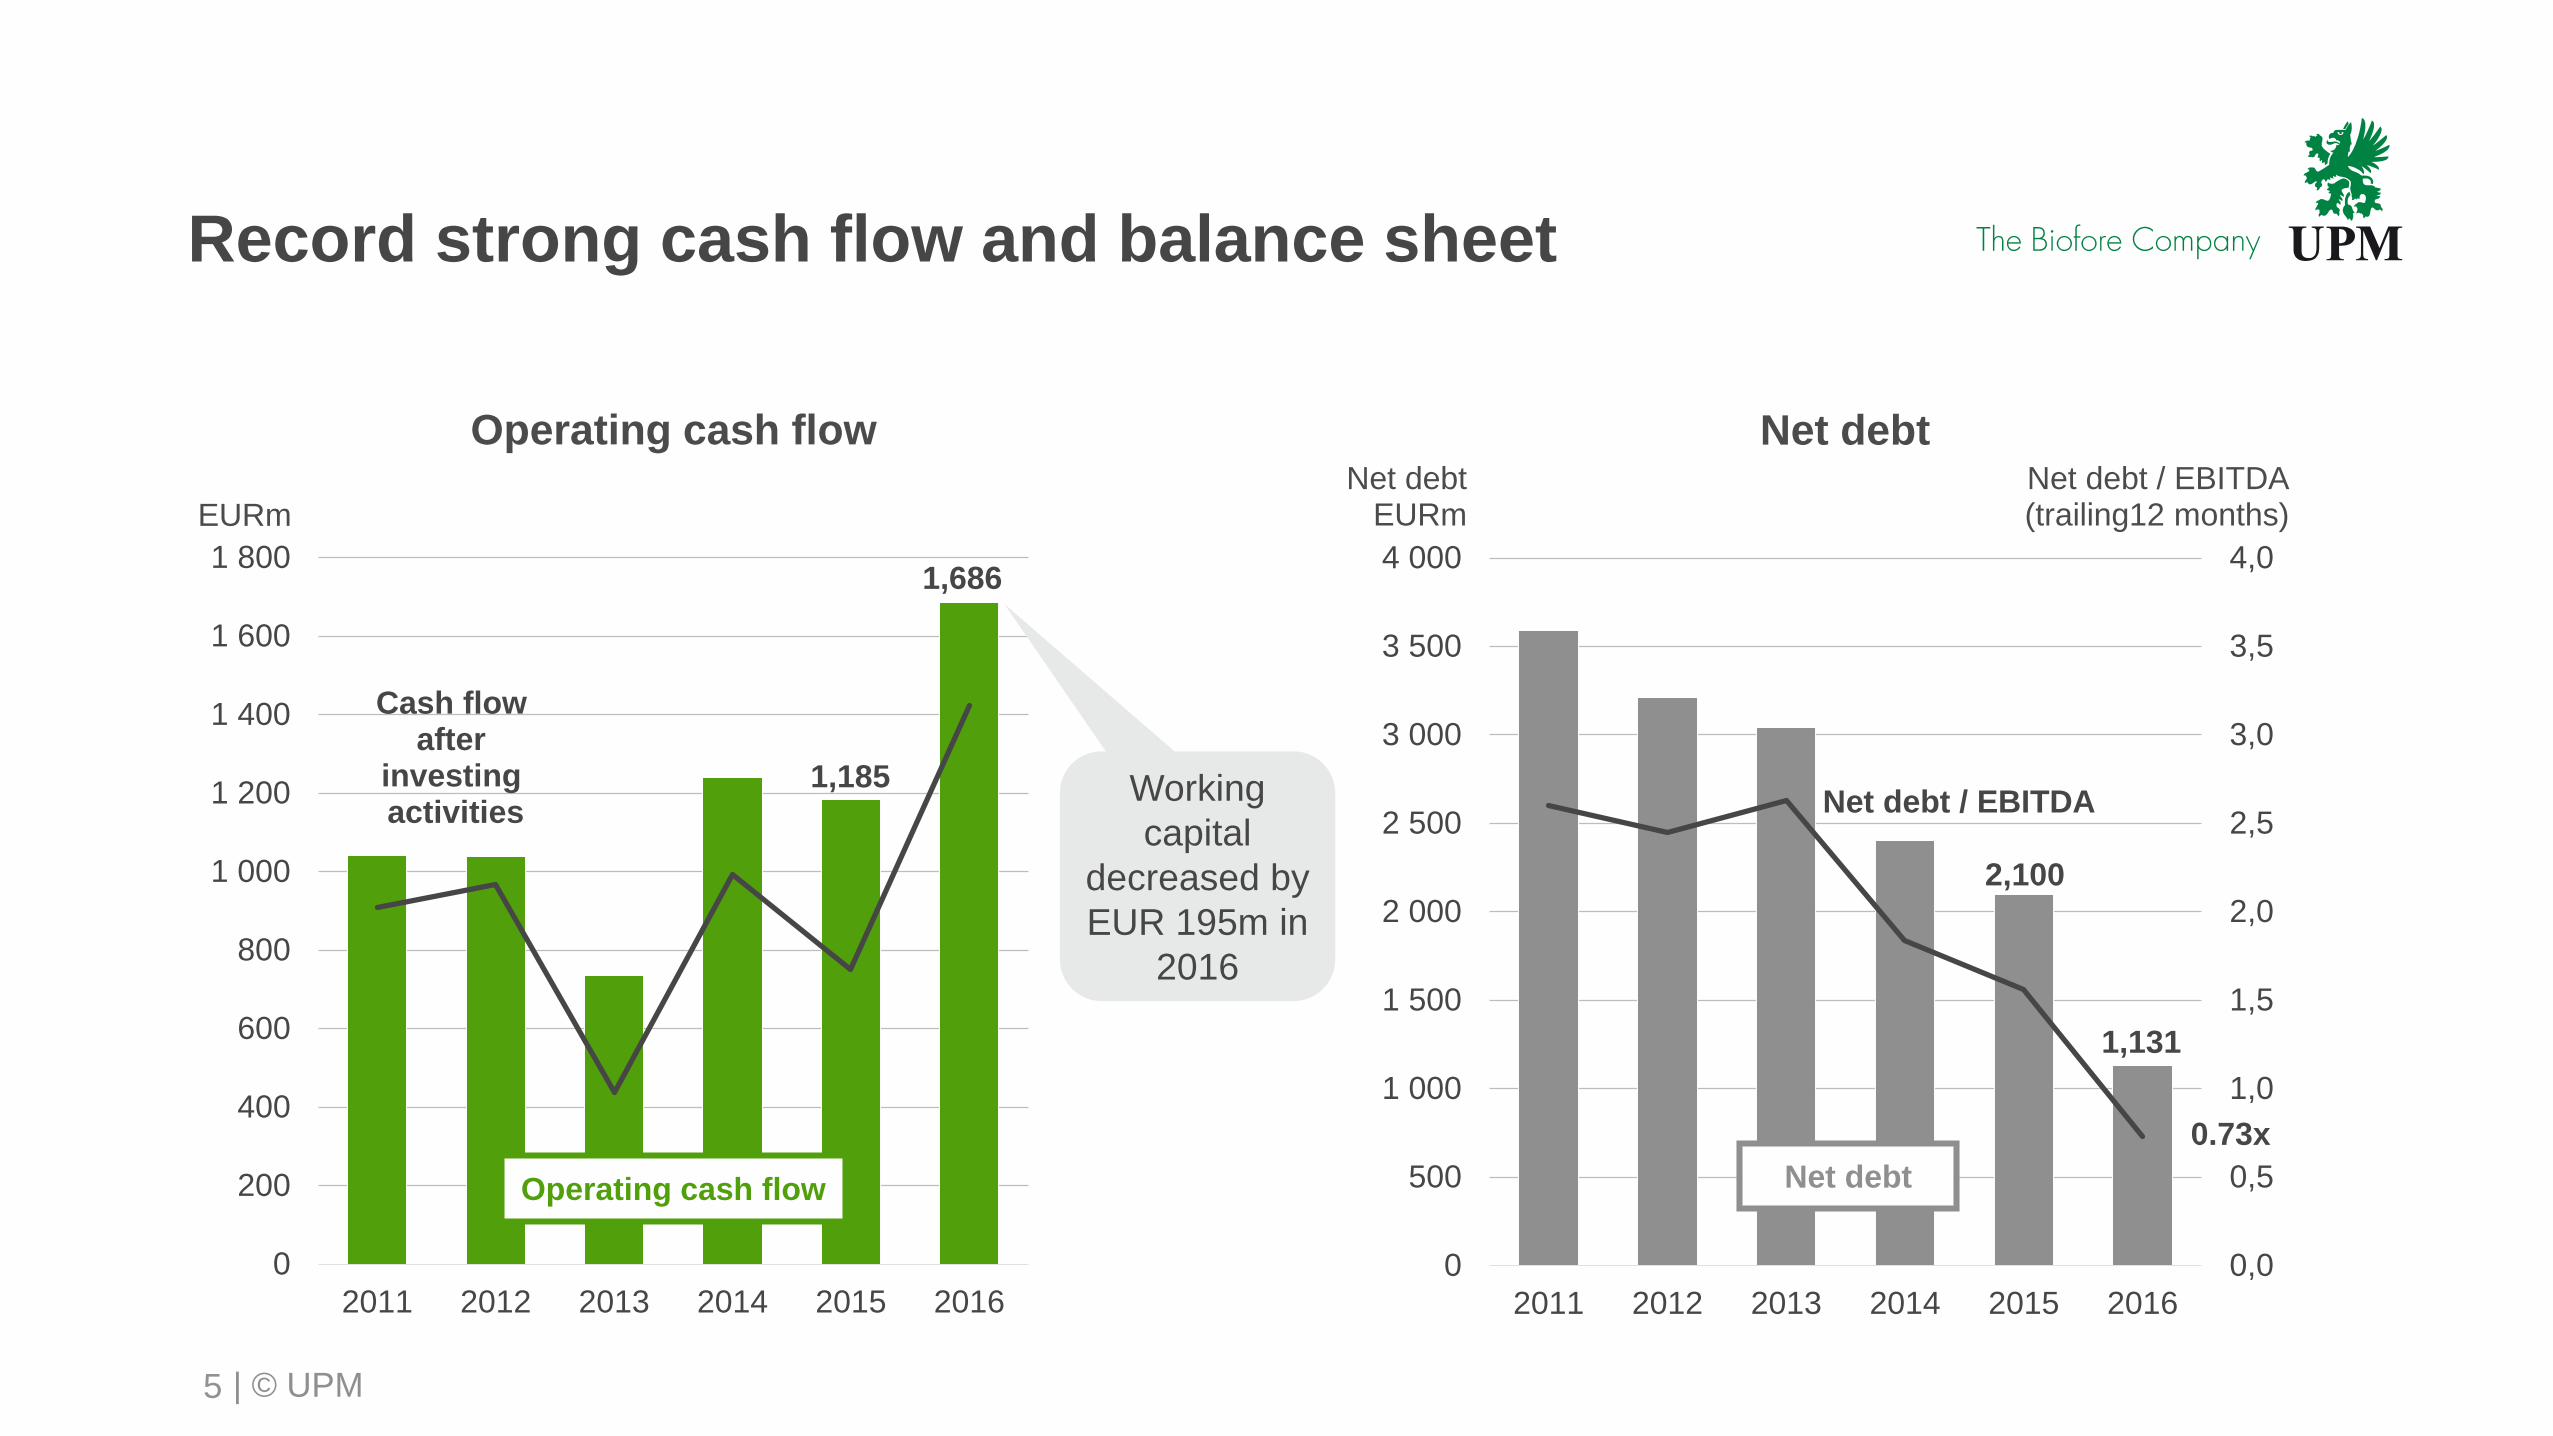
Record strong cash flow and balance sheet
5
Net debt / EBITDA(trailing12 months)
Net debt
Net debt / EBITDA
0.73x
0
200
400
600
800
1 000
1 200
1 400
1 600
1 800
2011 2012 2013 2014 2015 2016
Operating cash flow Net debt
1,131
2,100
1,686
1,185
Net debtEURm
Cash flow after
investing activities
Operating cash flow
EURm
Working
capital
decreased by
EUR 195m in
2016
| © UPM
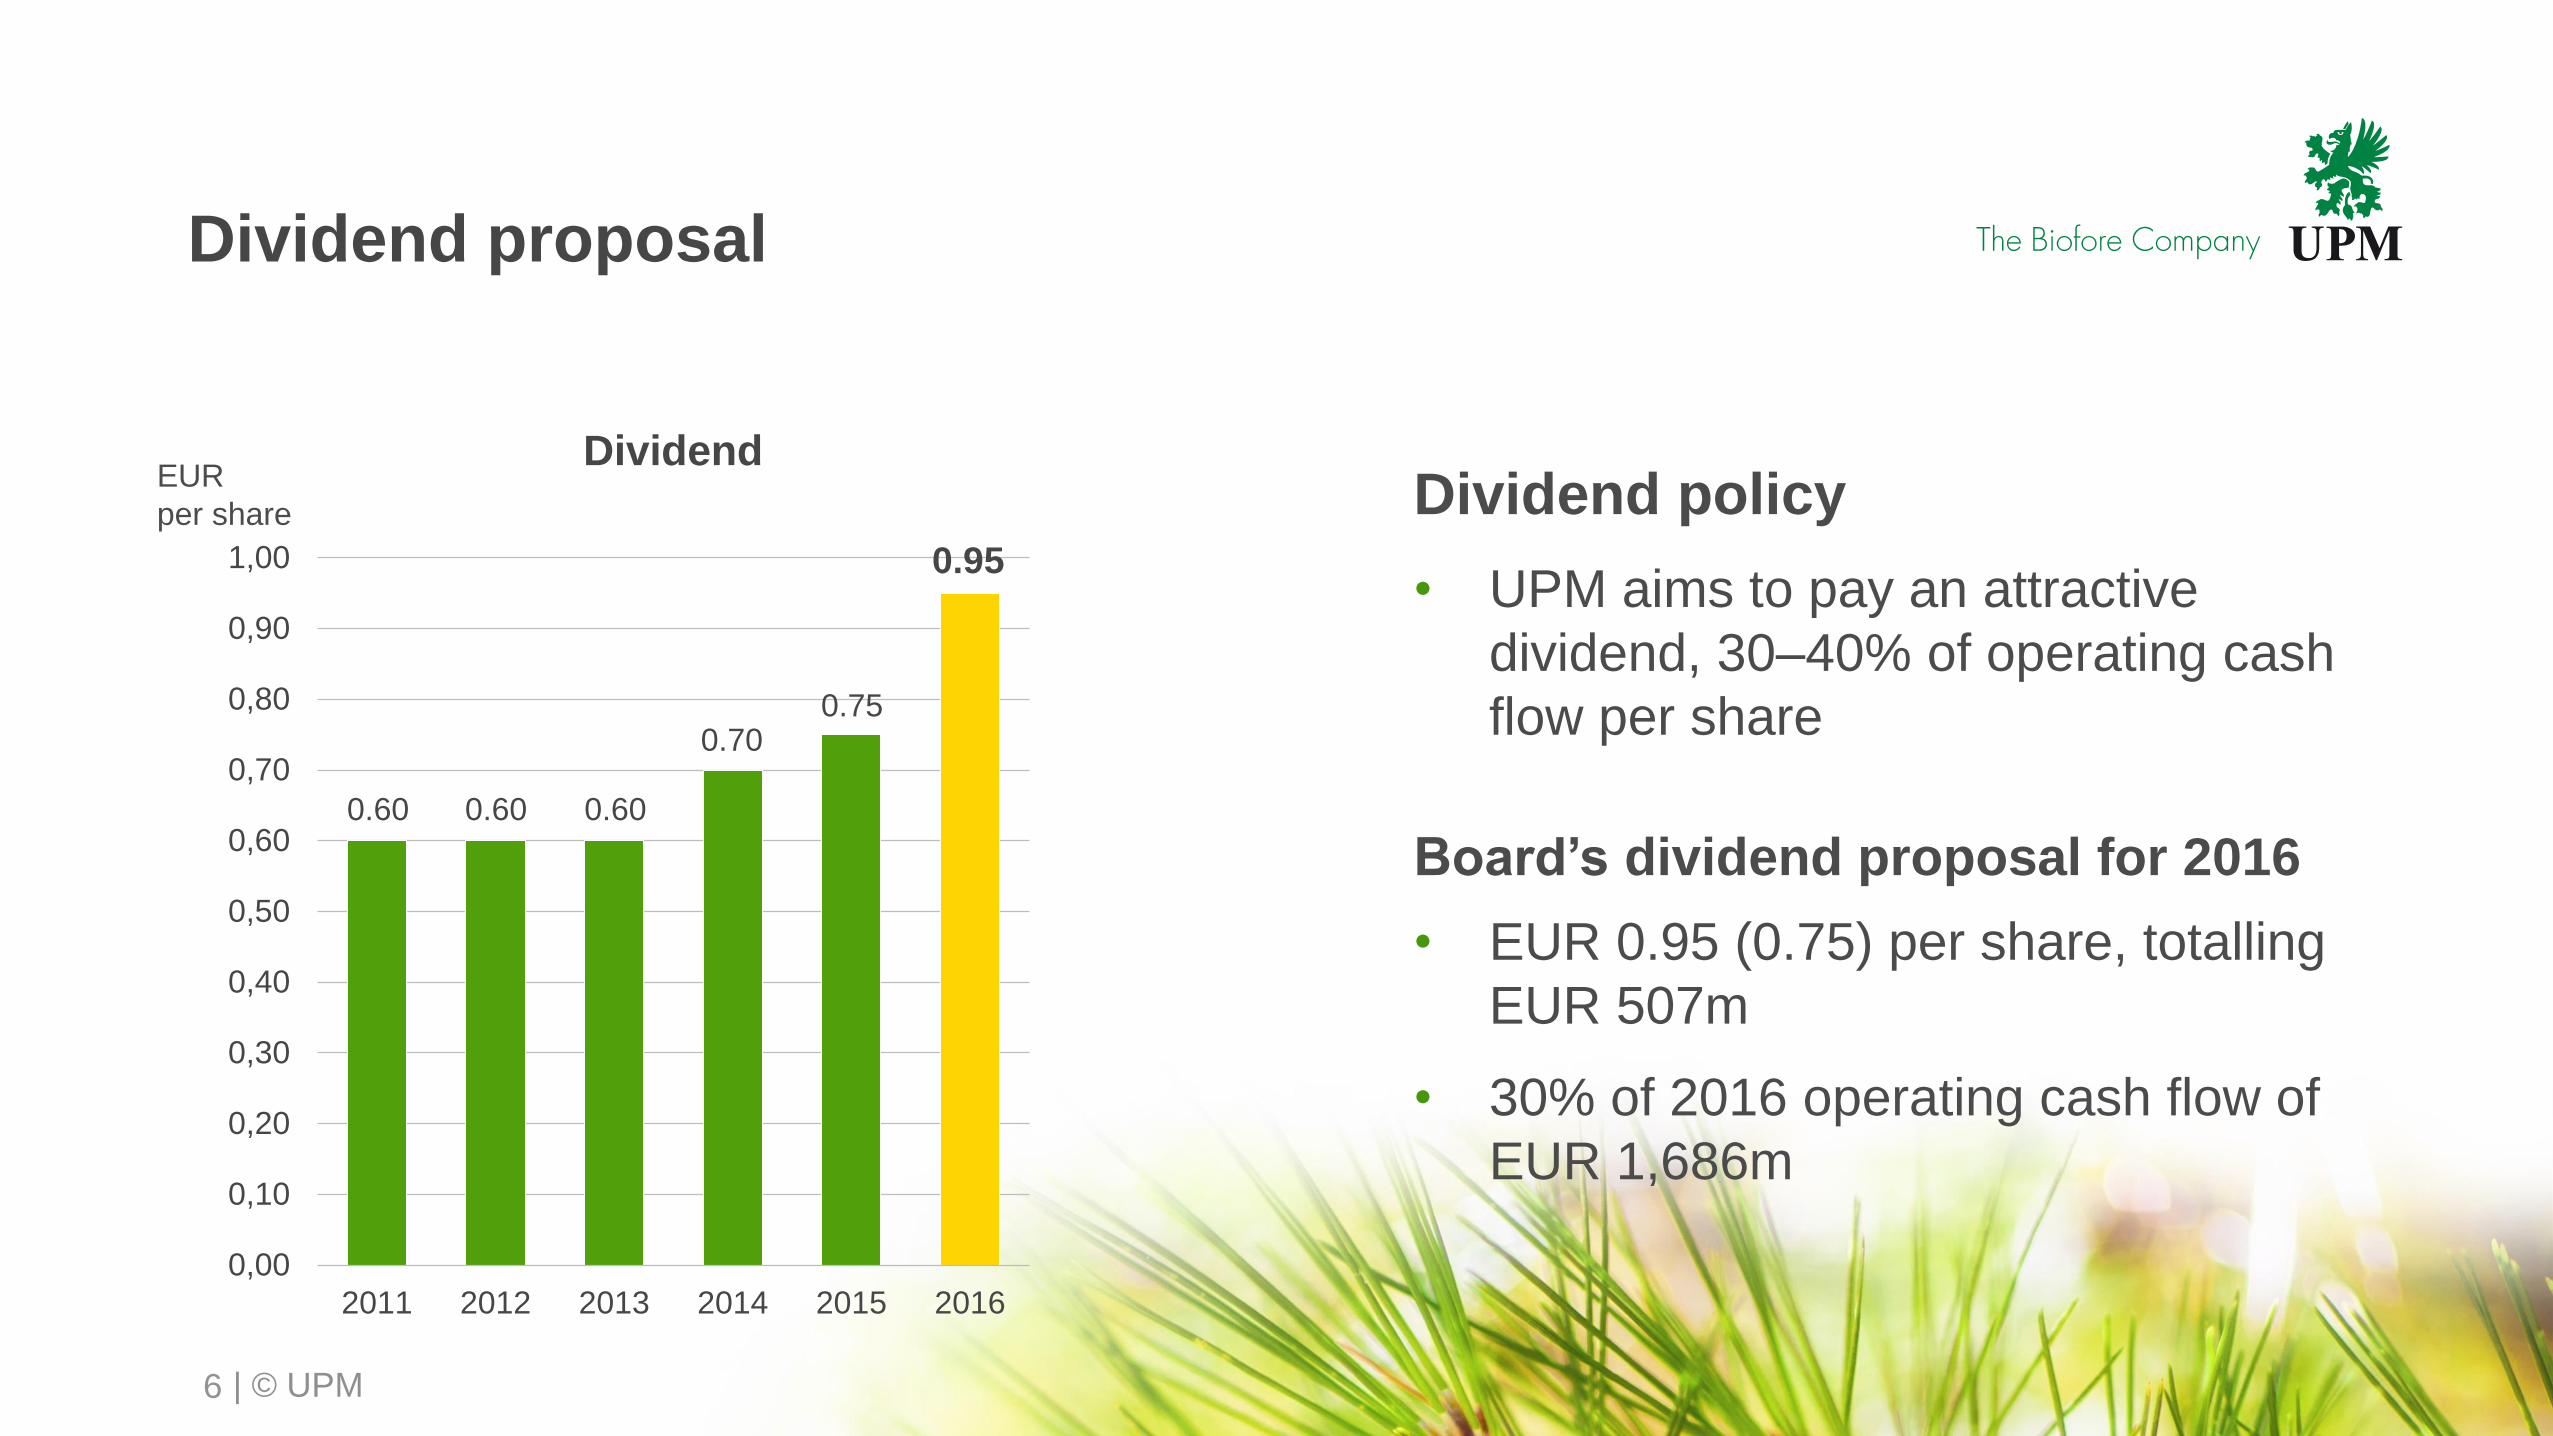
Dividend proposal
6
0,00
0,10
0,20
0,30
0,40
0,50
0,60
0,70
0,80
0,90
1,00
2011 2012 2013 2014 2015 2016
DividendEUR
per share Dividend policy
• UPM aims to pay an attractive
dividend, 30–40% of operating cash
flow per share
Board’s dividend proposal for 2016
• EUR 0.95 (0.75) per share, totalling
EUR 507m
• 30% of 2016 operating cash flow of
EUR 1,686m
0.60 0.60 0.60
0.70
0.95
0.75
| © UPM
0
50
100
150
200
250
300
350
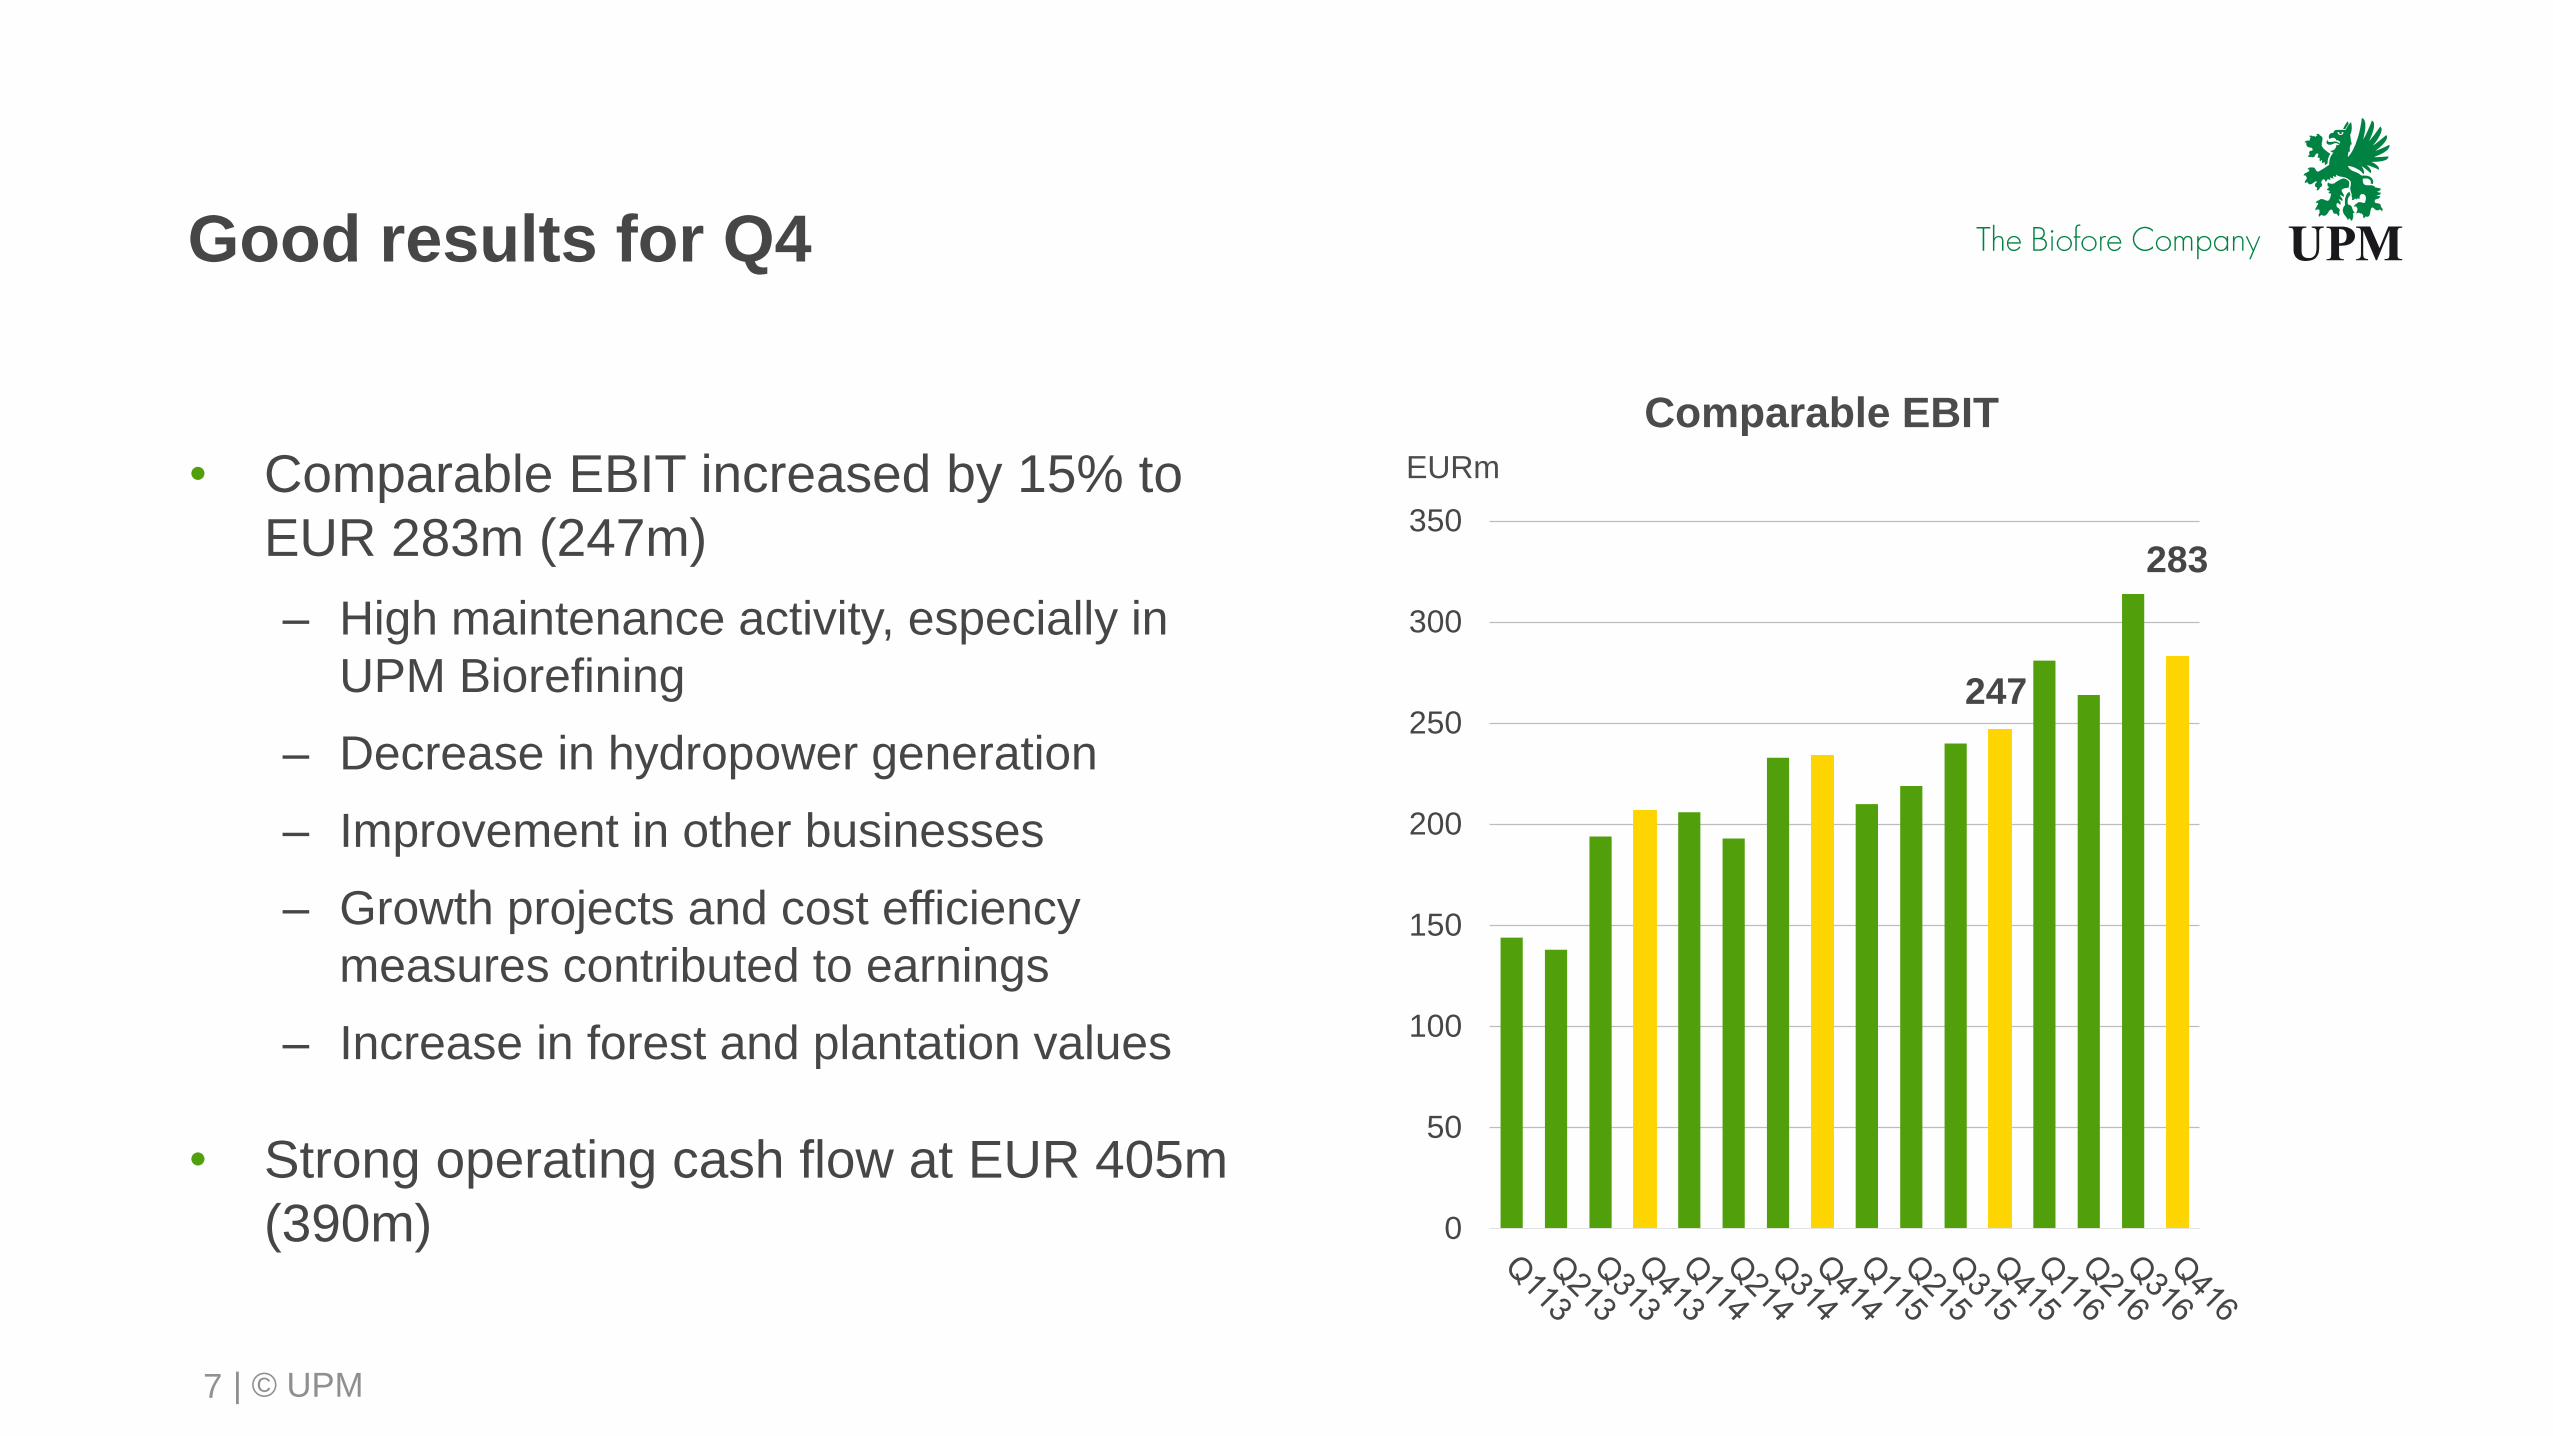
Good results for Q4
• Comparable EBIT increased by 15% to
EUR 283m (247m)
– High maintenance activity, especially in
UPM Biorefining
– Decrease in hydropower generation
– Improvement in other businesses
– Growth projects and cost efficiency
measures contributed to earnings
– Increase in forest and plantation values
• Strong operating cash flow at EUR 405m
(390m)
EURm
Comparable EBIT
283
247
7
| © UPM
0
50
100
150
200
250
300
350
Q4/15 Q4/16
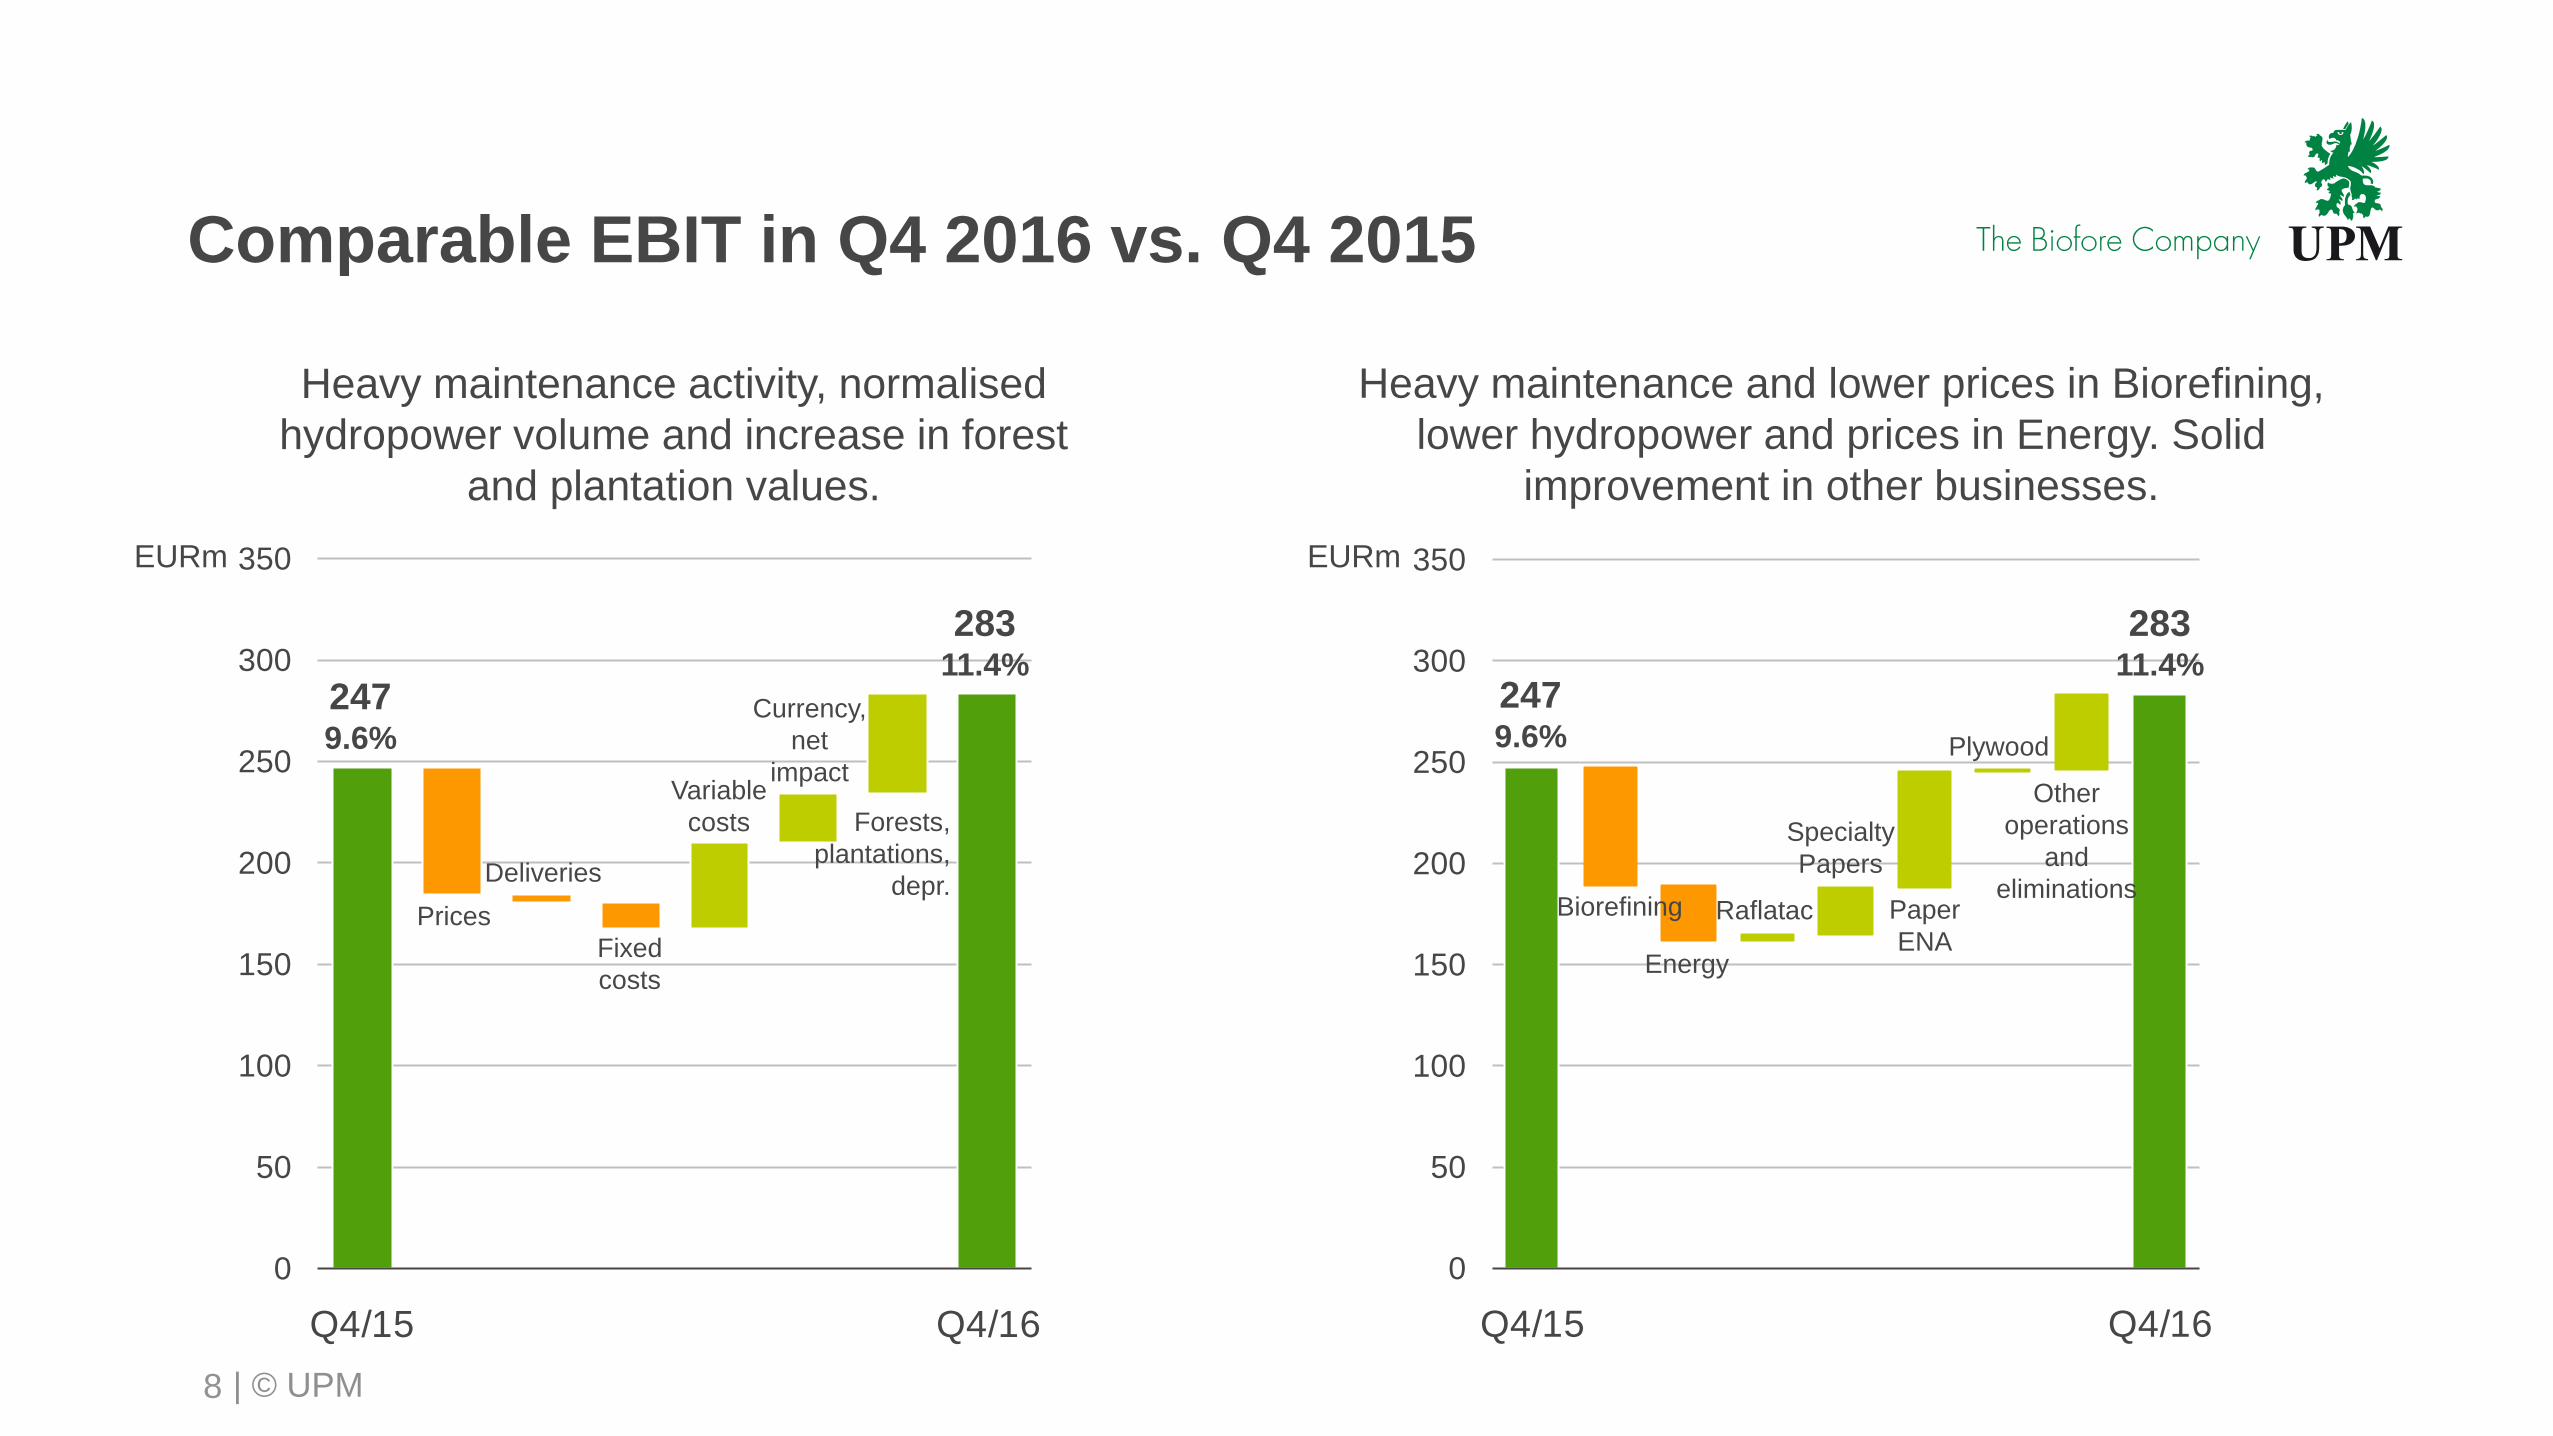
Comparable EBIT in Q4 2016 vs. Q4 2015
Raflatac
Specialty
Papers
Other
operations
and
eliminations
Energy
Biorefining Paper
ENA
Plywood
0
50
100
150
200
250
300
350
Q4/15 Q4/16
EURm
Prices
Variable
costs
Fixed
costs
Deliveries
Heavy maintenance activity, normalised
hydropower volume and increase in forest
and plantation values.
EURm
Heavy maintenance and lower prices in Biorefining,
lower hydropower and prices in Energy. Solid
improvement in other businesses.
2479.6%
28311.4%
Currency,
net
impact
2479.6%
28311.4%
8
Forests,
plantations,
depr.
| © UPM
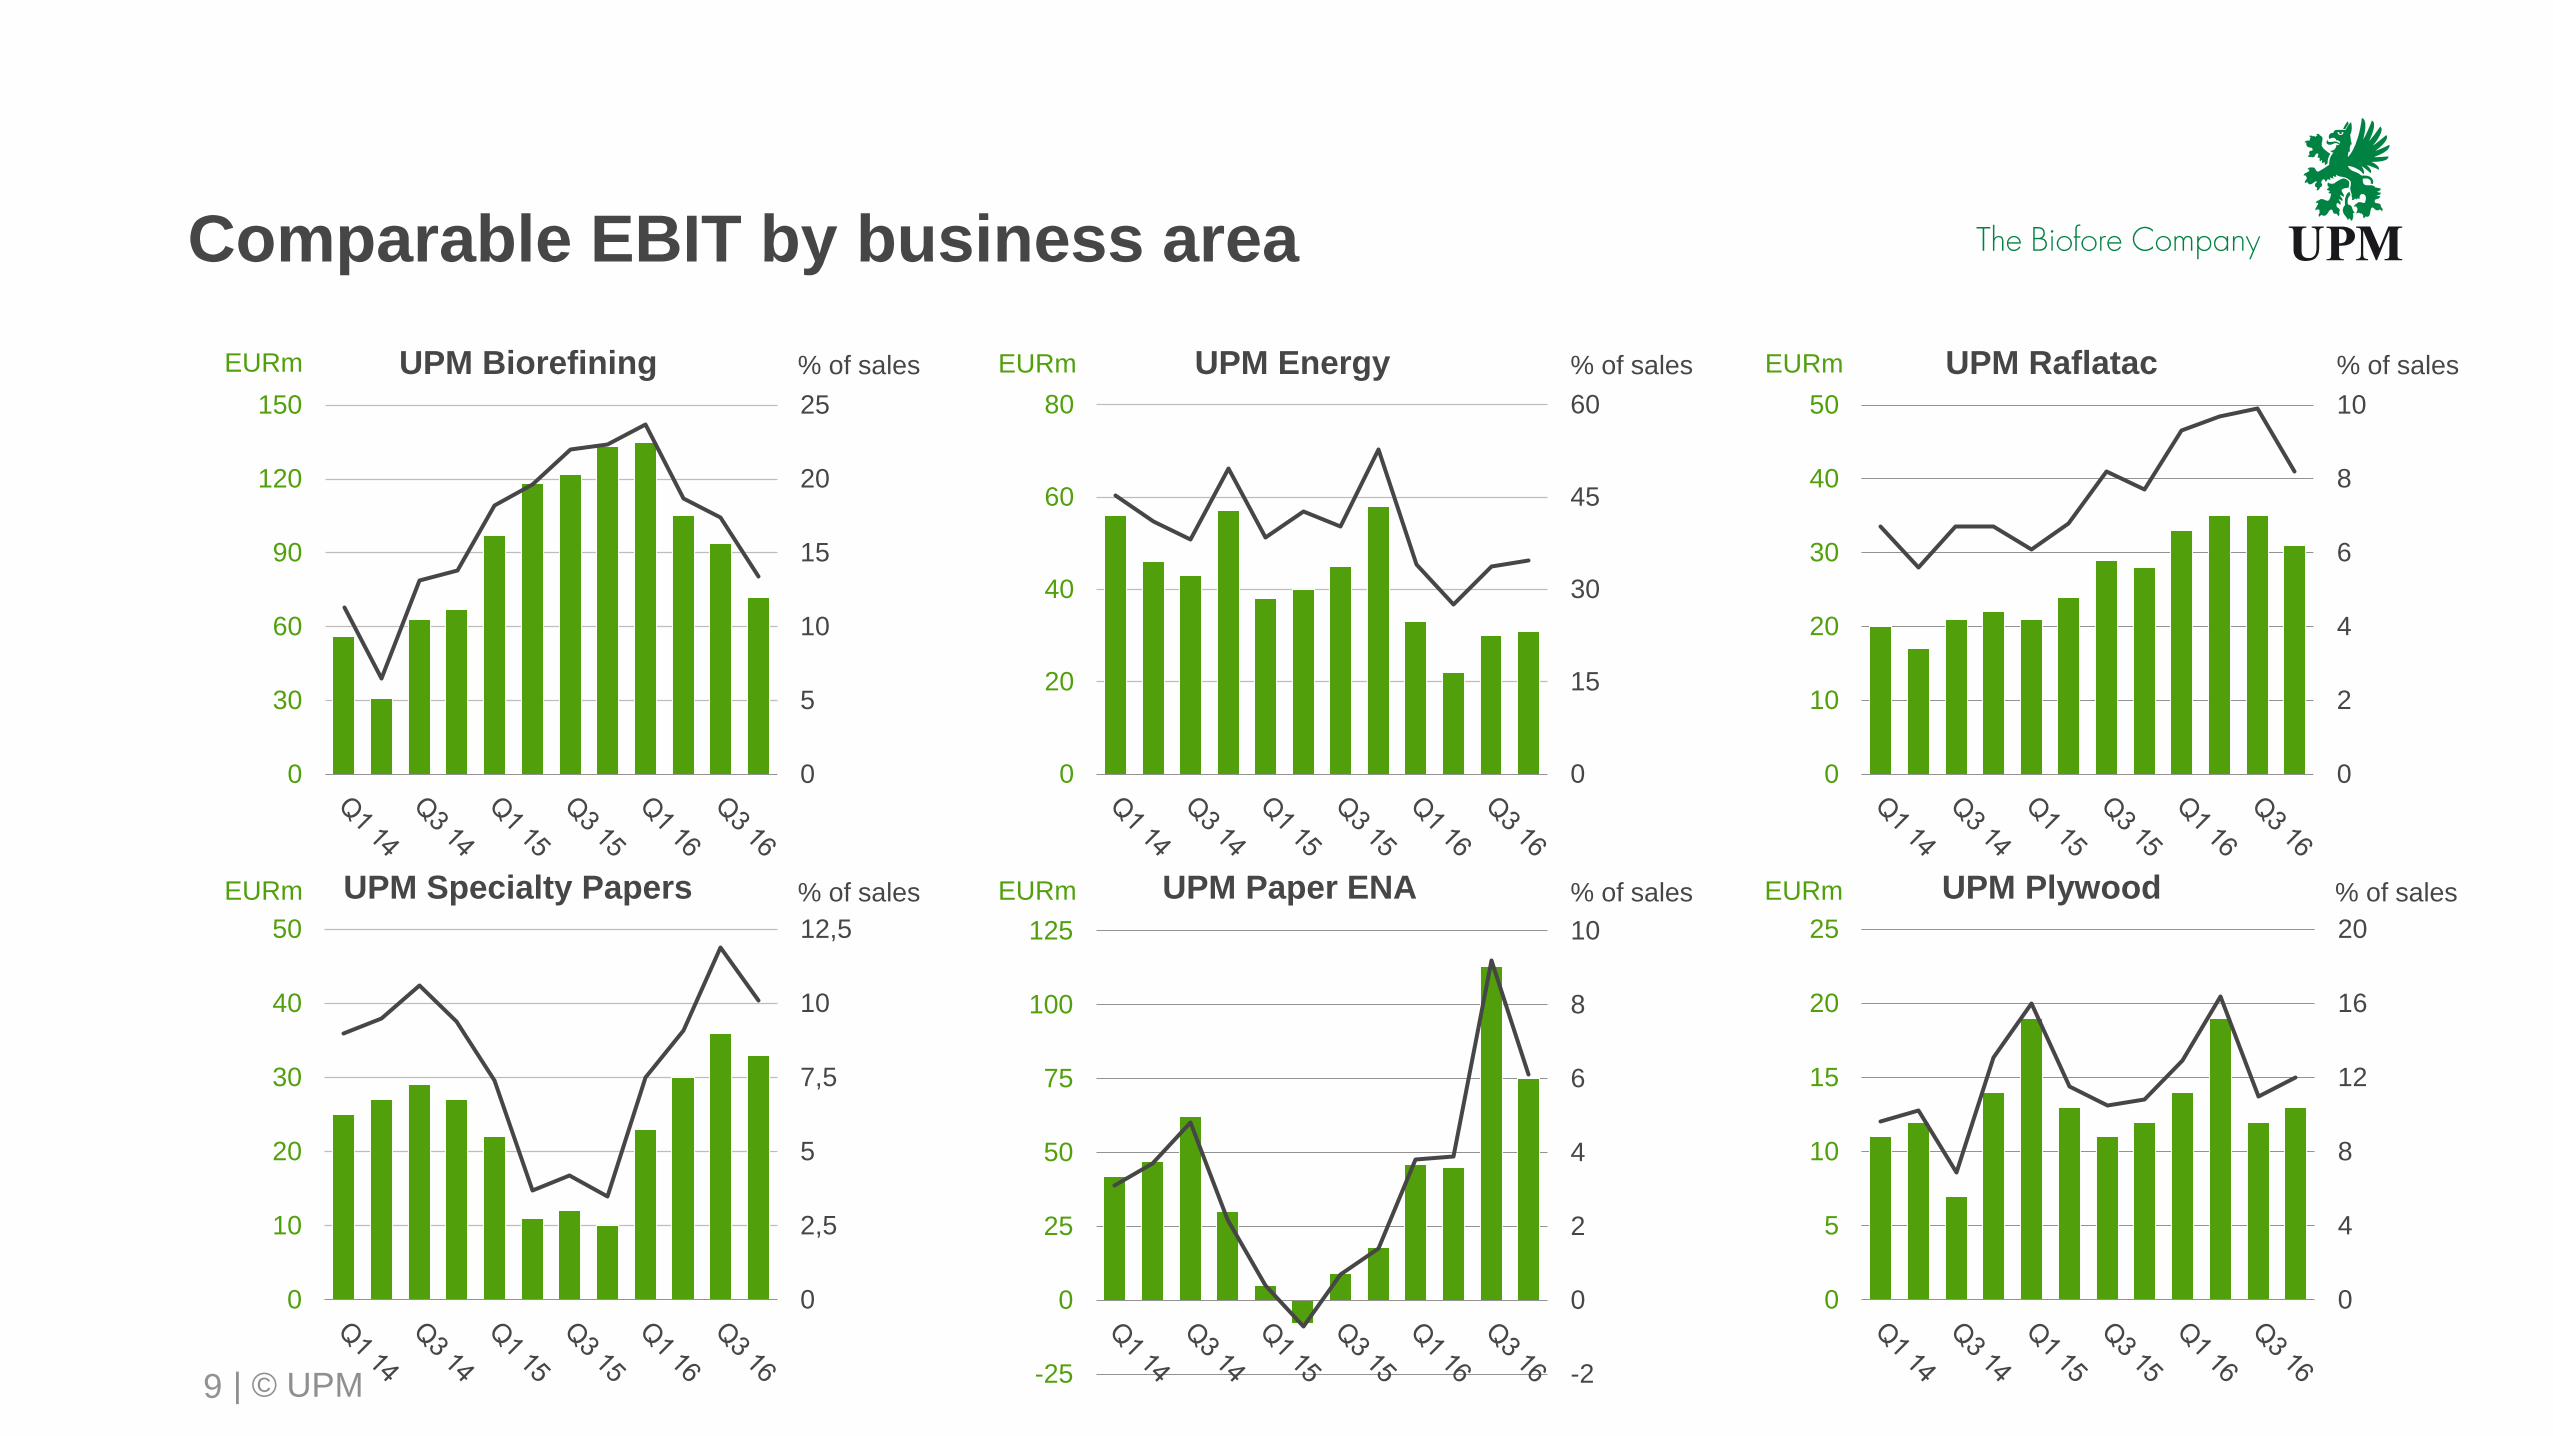
Comparable EBIT by business area
9
0
2,5
5
7,5
10
12,5
0
10
20
30
40
50
0
5
10
15
20
25
0
30
60
90
120
150
0
15
30
45
60
0
20
40
60
80
0
2
4
6
8
10
0
10
20
30
40
50
-2
0
2
4
6
8
10
-25
0
25
50
75
100
125
0
4
8
12
16
20
0
5
10
15
20
25
EURm % of salesUPM Specialty Papers EURm % of salesUPM Paper ENA EURm % of salesUPM Plywood
EURm % of salesUPM RaflatacEURm % of salesUPM EnergyEURm % of salesUPM Biorefining
| © UPM
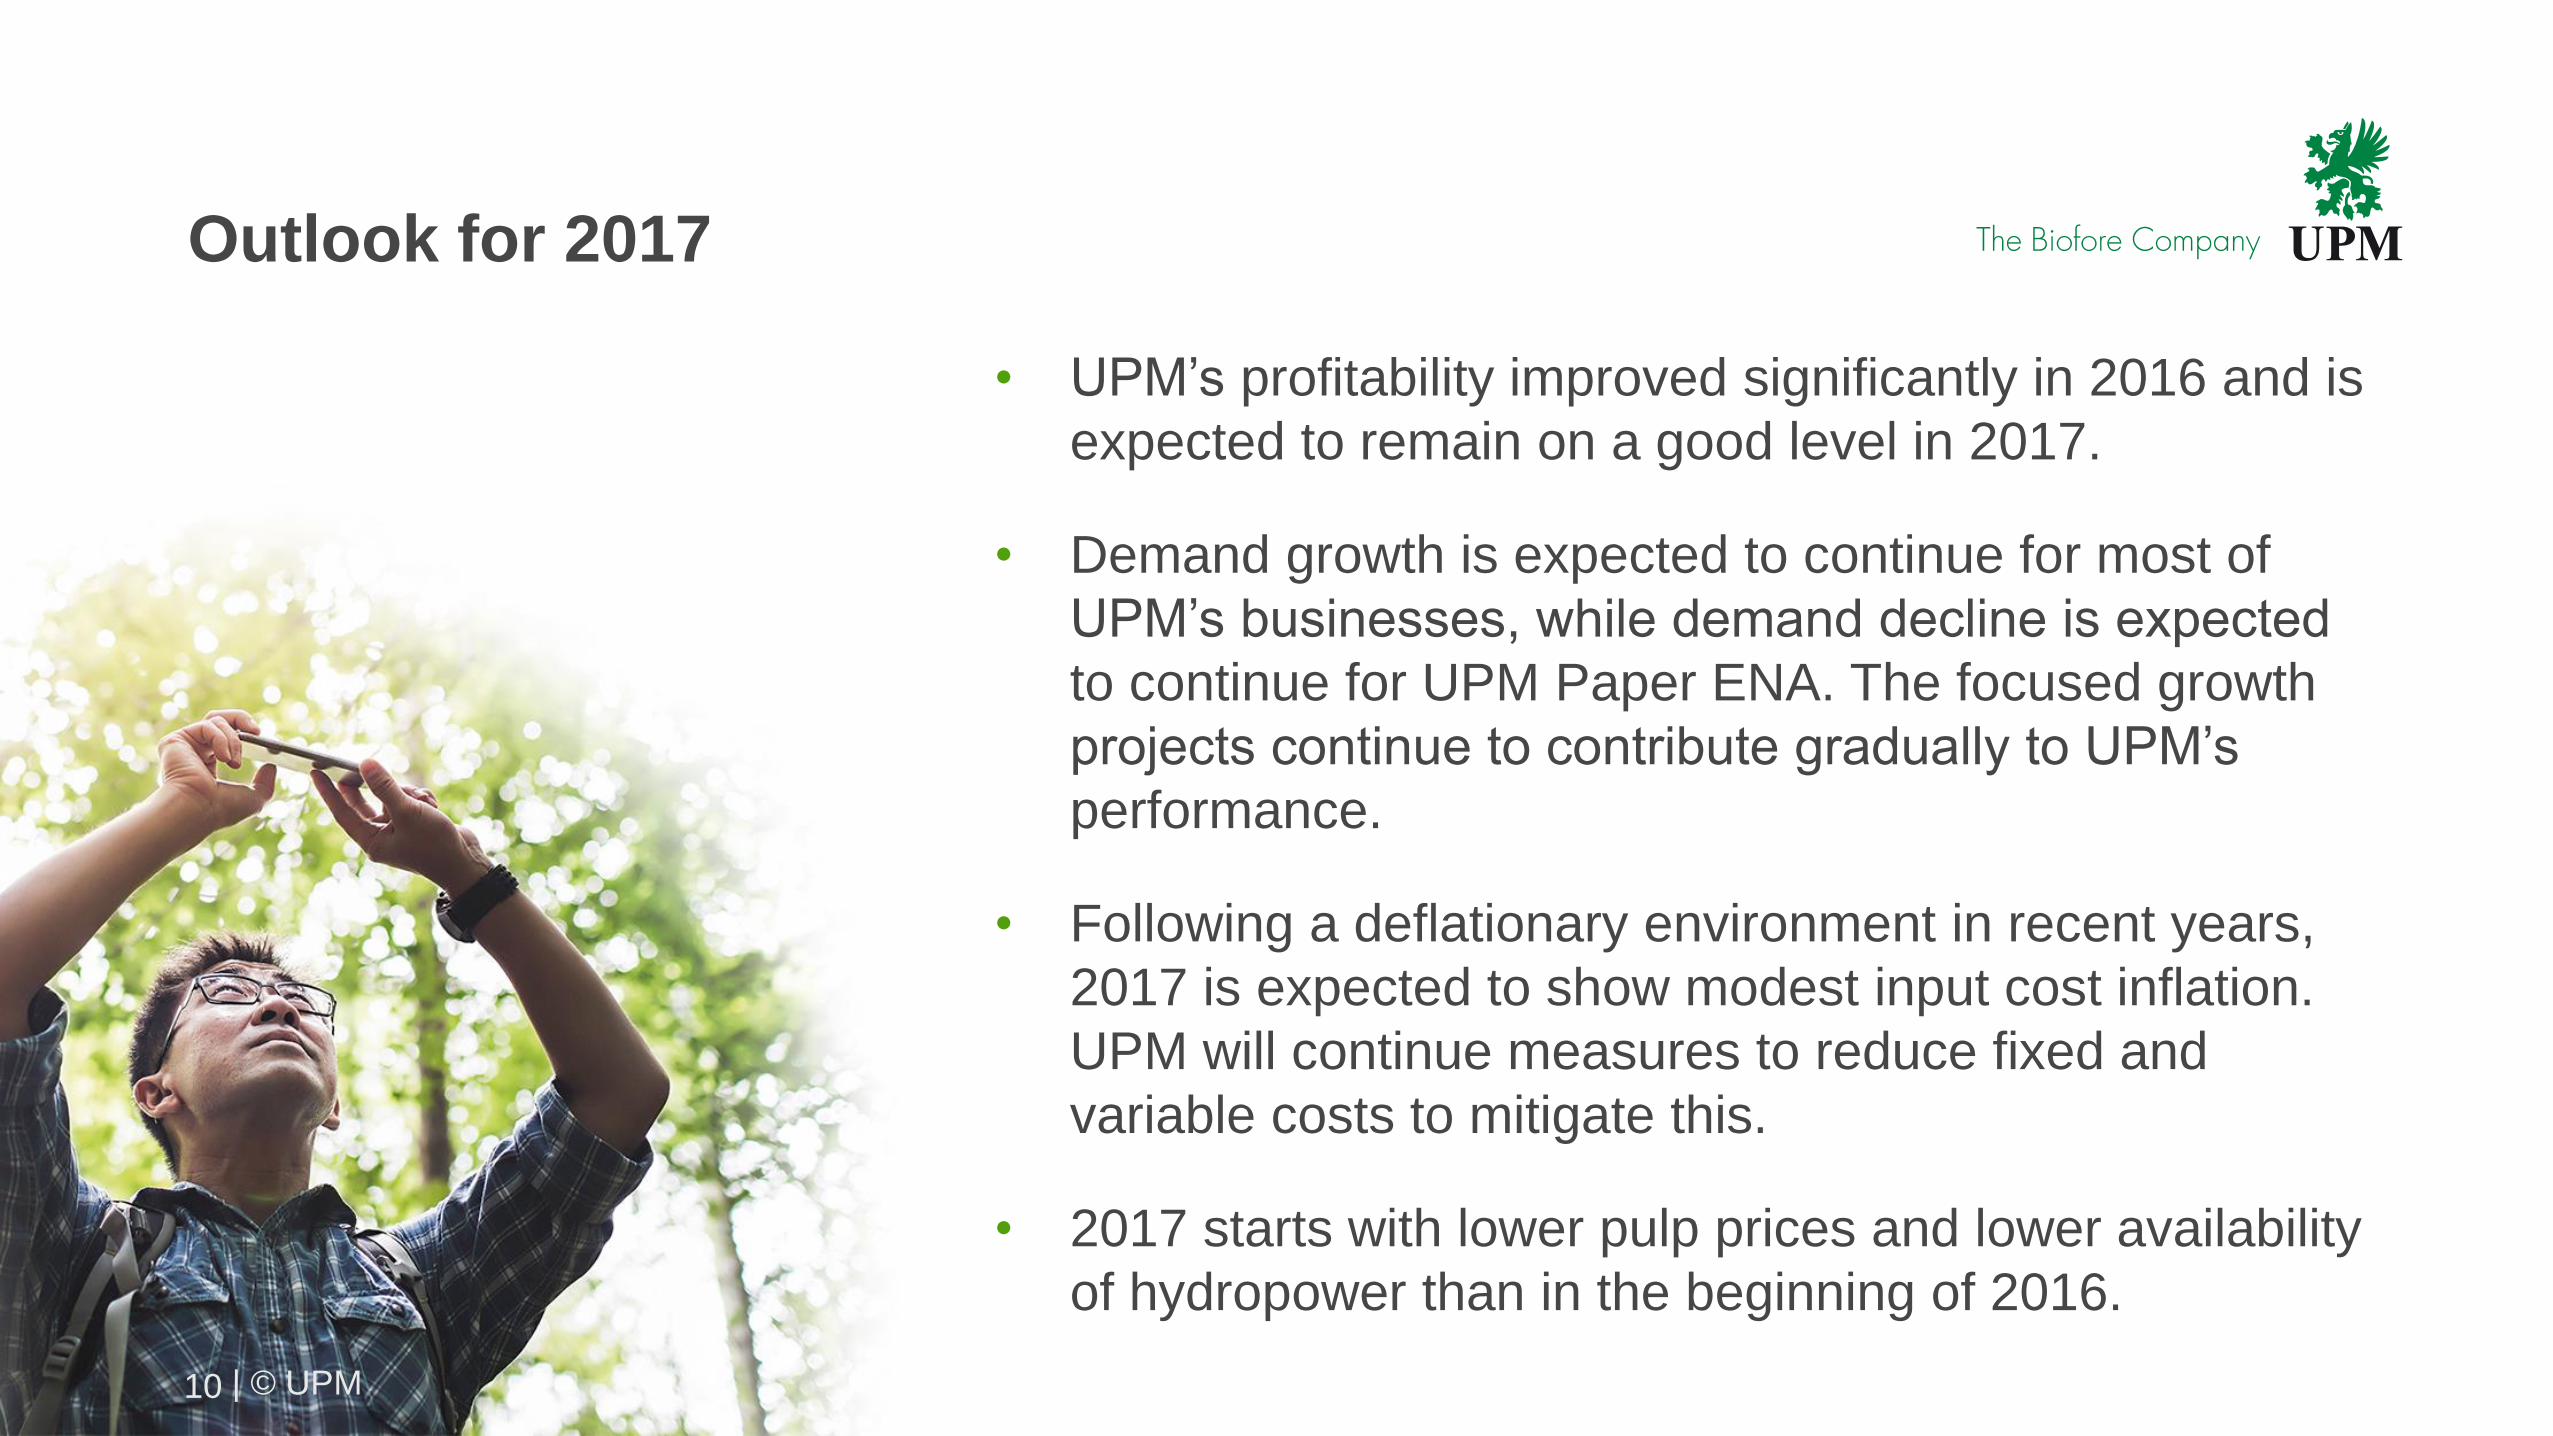
Outlook for 2017
• UPM’s profitability improved significantly in 2016 and is
expected to remain on a good level in 2017.
• Demand growth is expected to continue for most of
UPM’s businesses, while demand decline is expected
to continue for UPM Paper ENA. The focused growth
projects continue to contribute gradually to UPM’s
performance.
• Following a deflationary environment in recent years,
2017 is expected to show modest input cost inflation.
UPM will continue measures to reduce fixed and
variable costs to mitigate this.
• 2017 starts with lower pulp prices and lower availability
of hydropower than in the beginning of 2016.
10 | © UPM
| © UPM
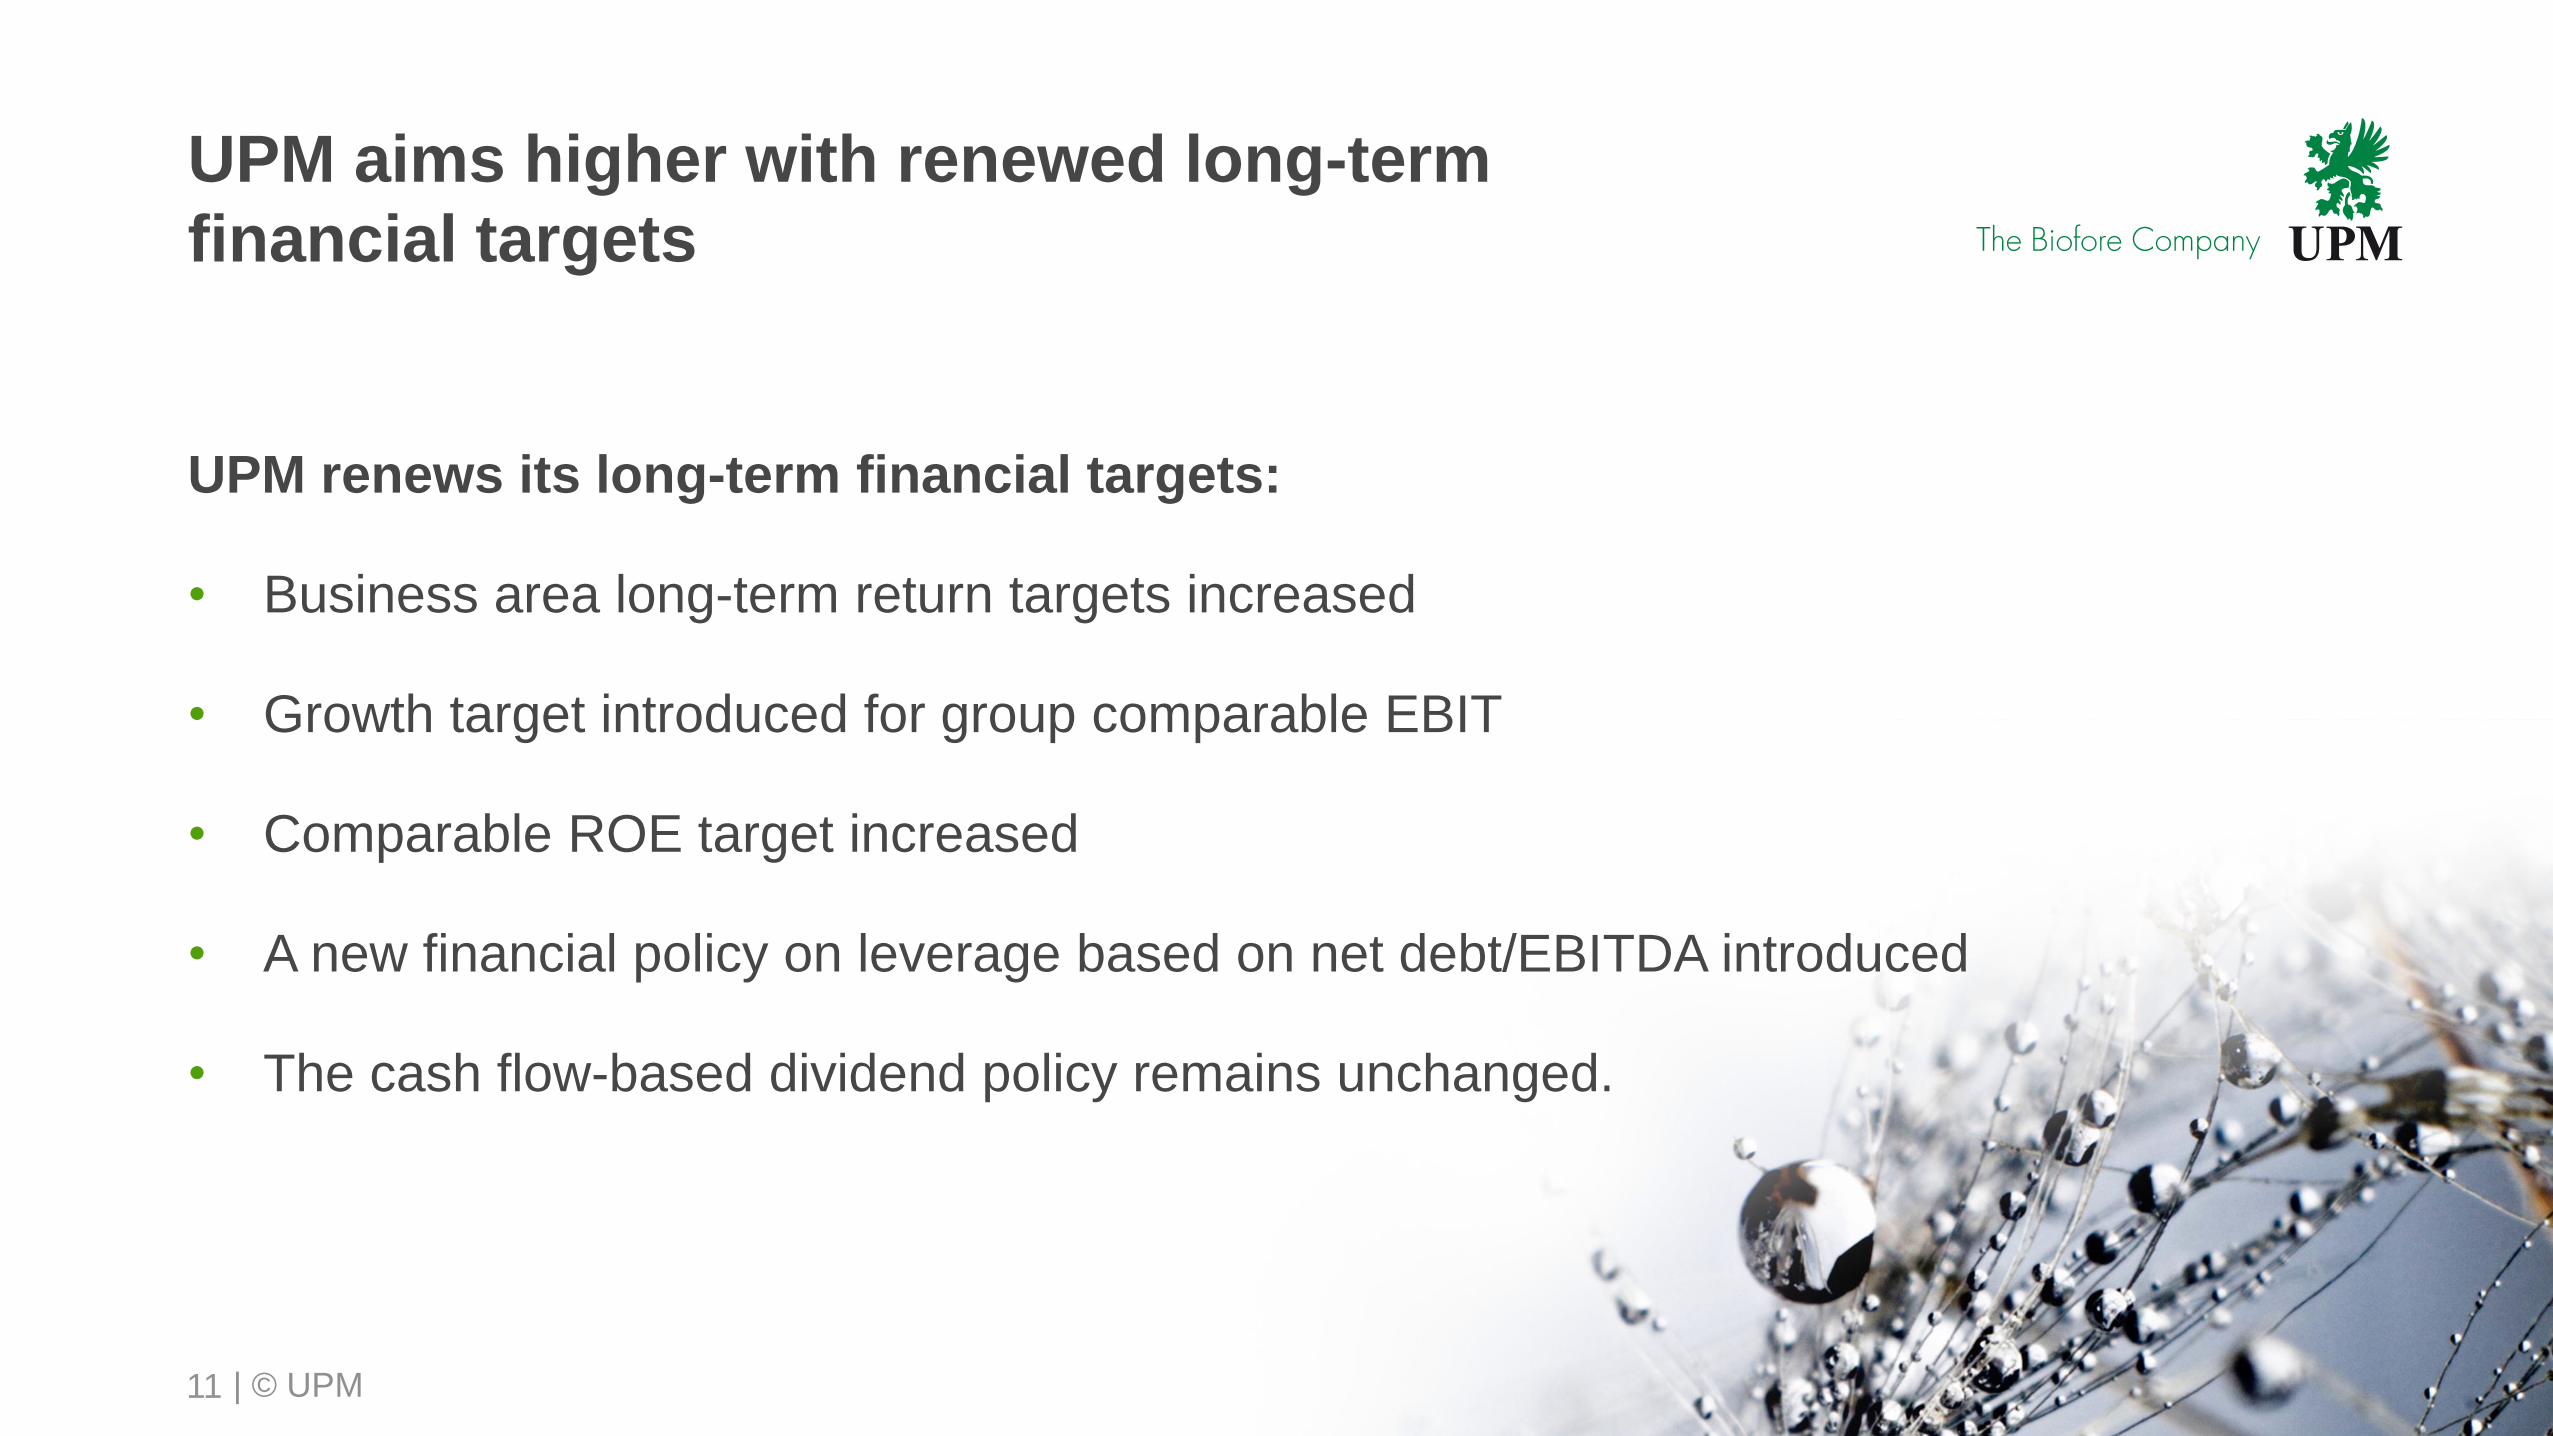
UPM aims higher with renewed long-term
financial targets
11
UPM renews its long-term financial targets:
• Business area long-term return targets increased
• Growth target introduced for group comparable EBIT
• Comparable ROE target increased
• A new financial policy on leverage based on net debt/EBITDA introduced
• The cash flow-based dividend policy remains unchanged.
| © UPM
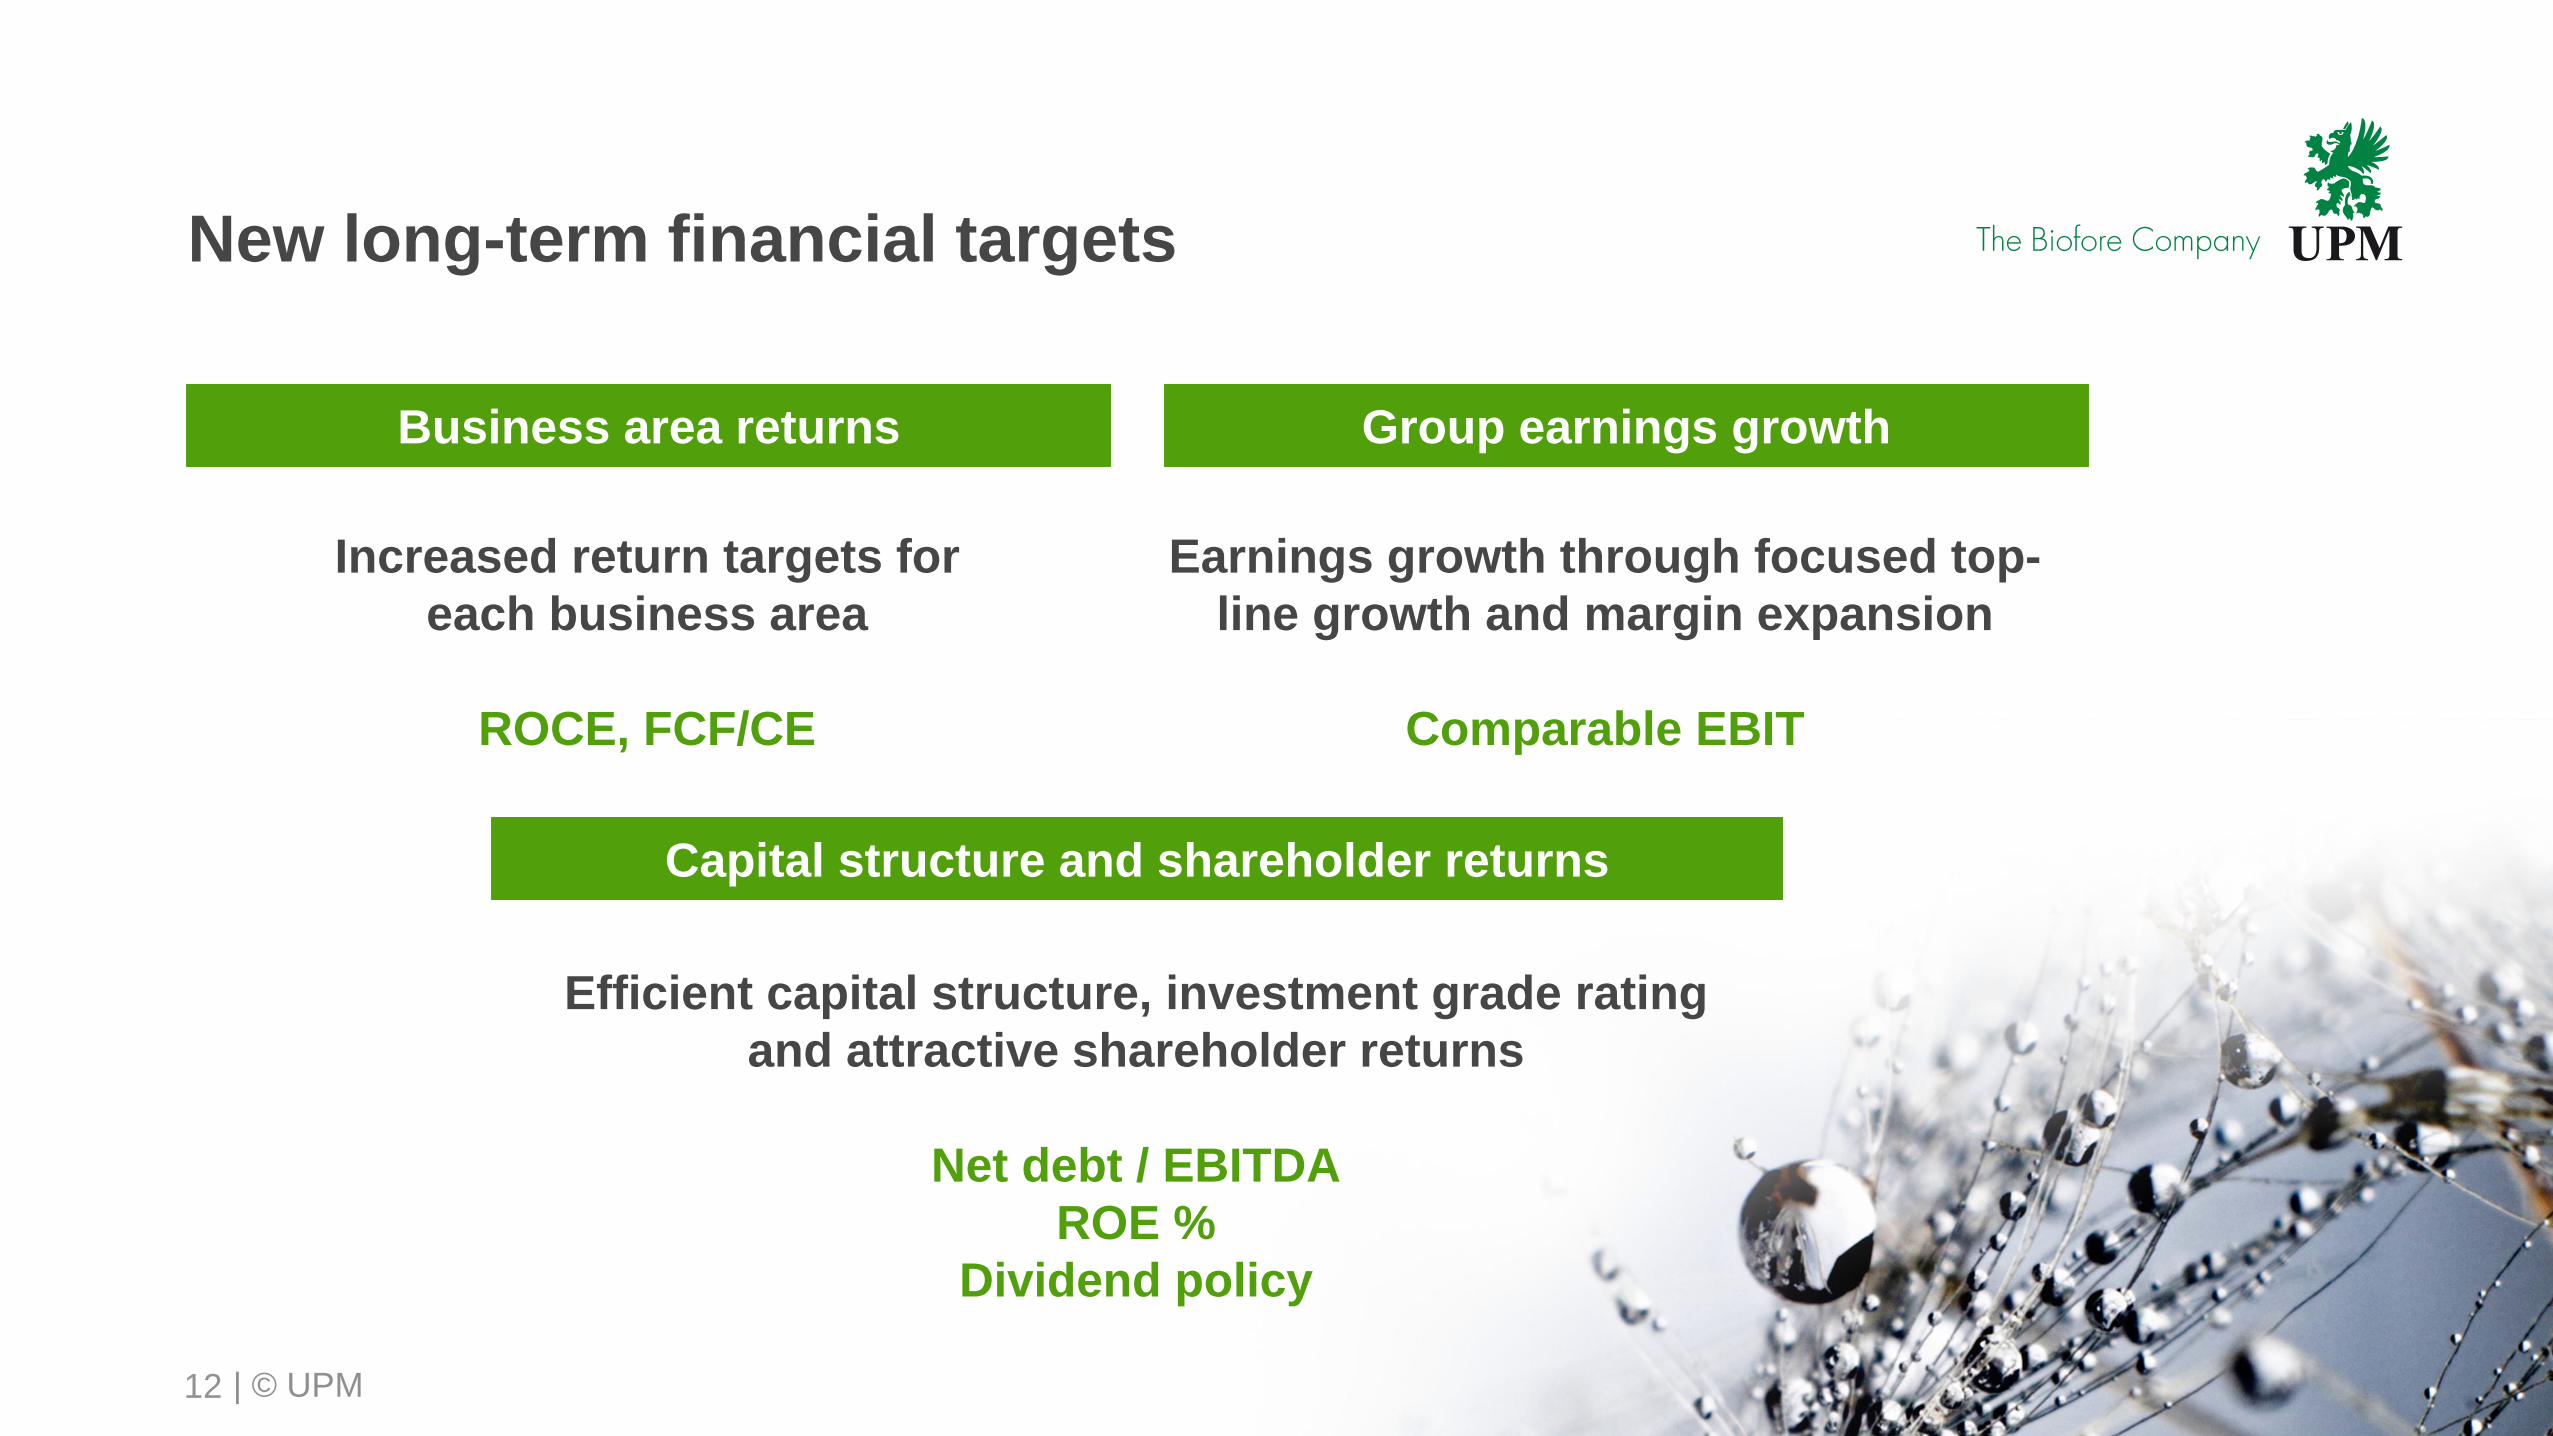
New long-term financial targets
12
Business area returns Group earnings growth
Earnings growth through focused top-
line growth and margin expansion
Comparable EBIT
Increased return targets for
each business area
ROCE, FCF/CE
Capital structure and shareholder returns
Efficient capital structure, investment grade rating
and attractive shareholder returns
Net debt / EBITDA
ROE %
Dividend policy
| © UPM
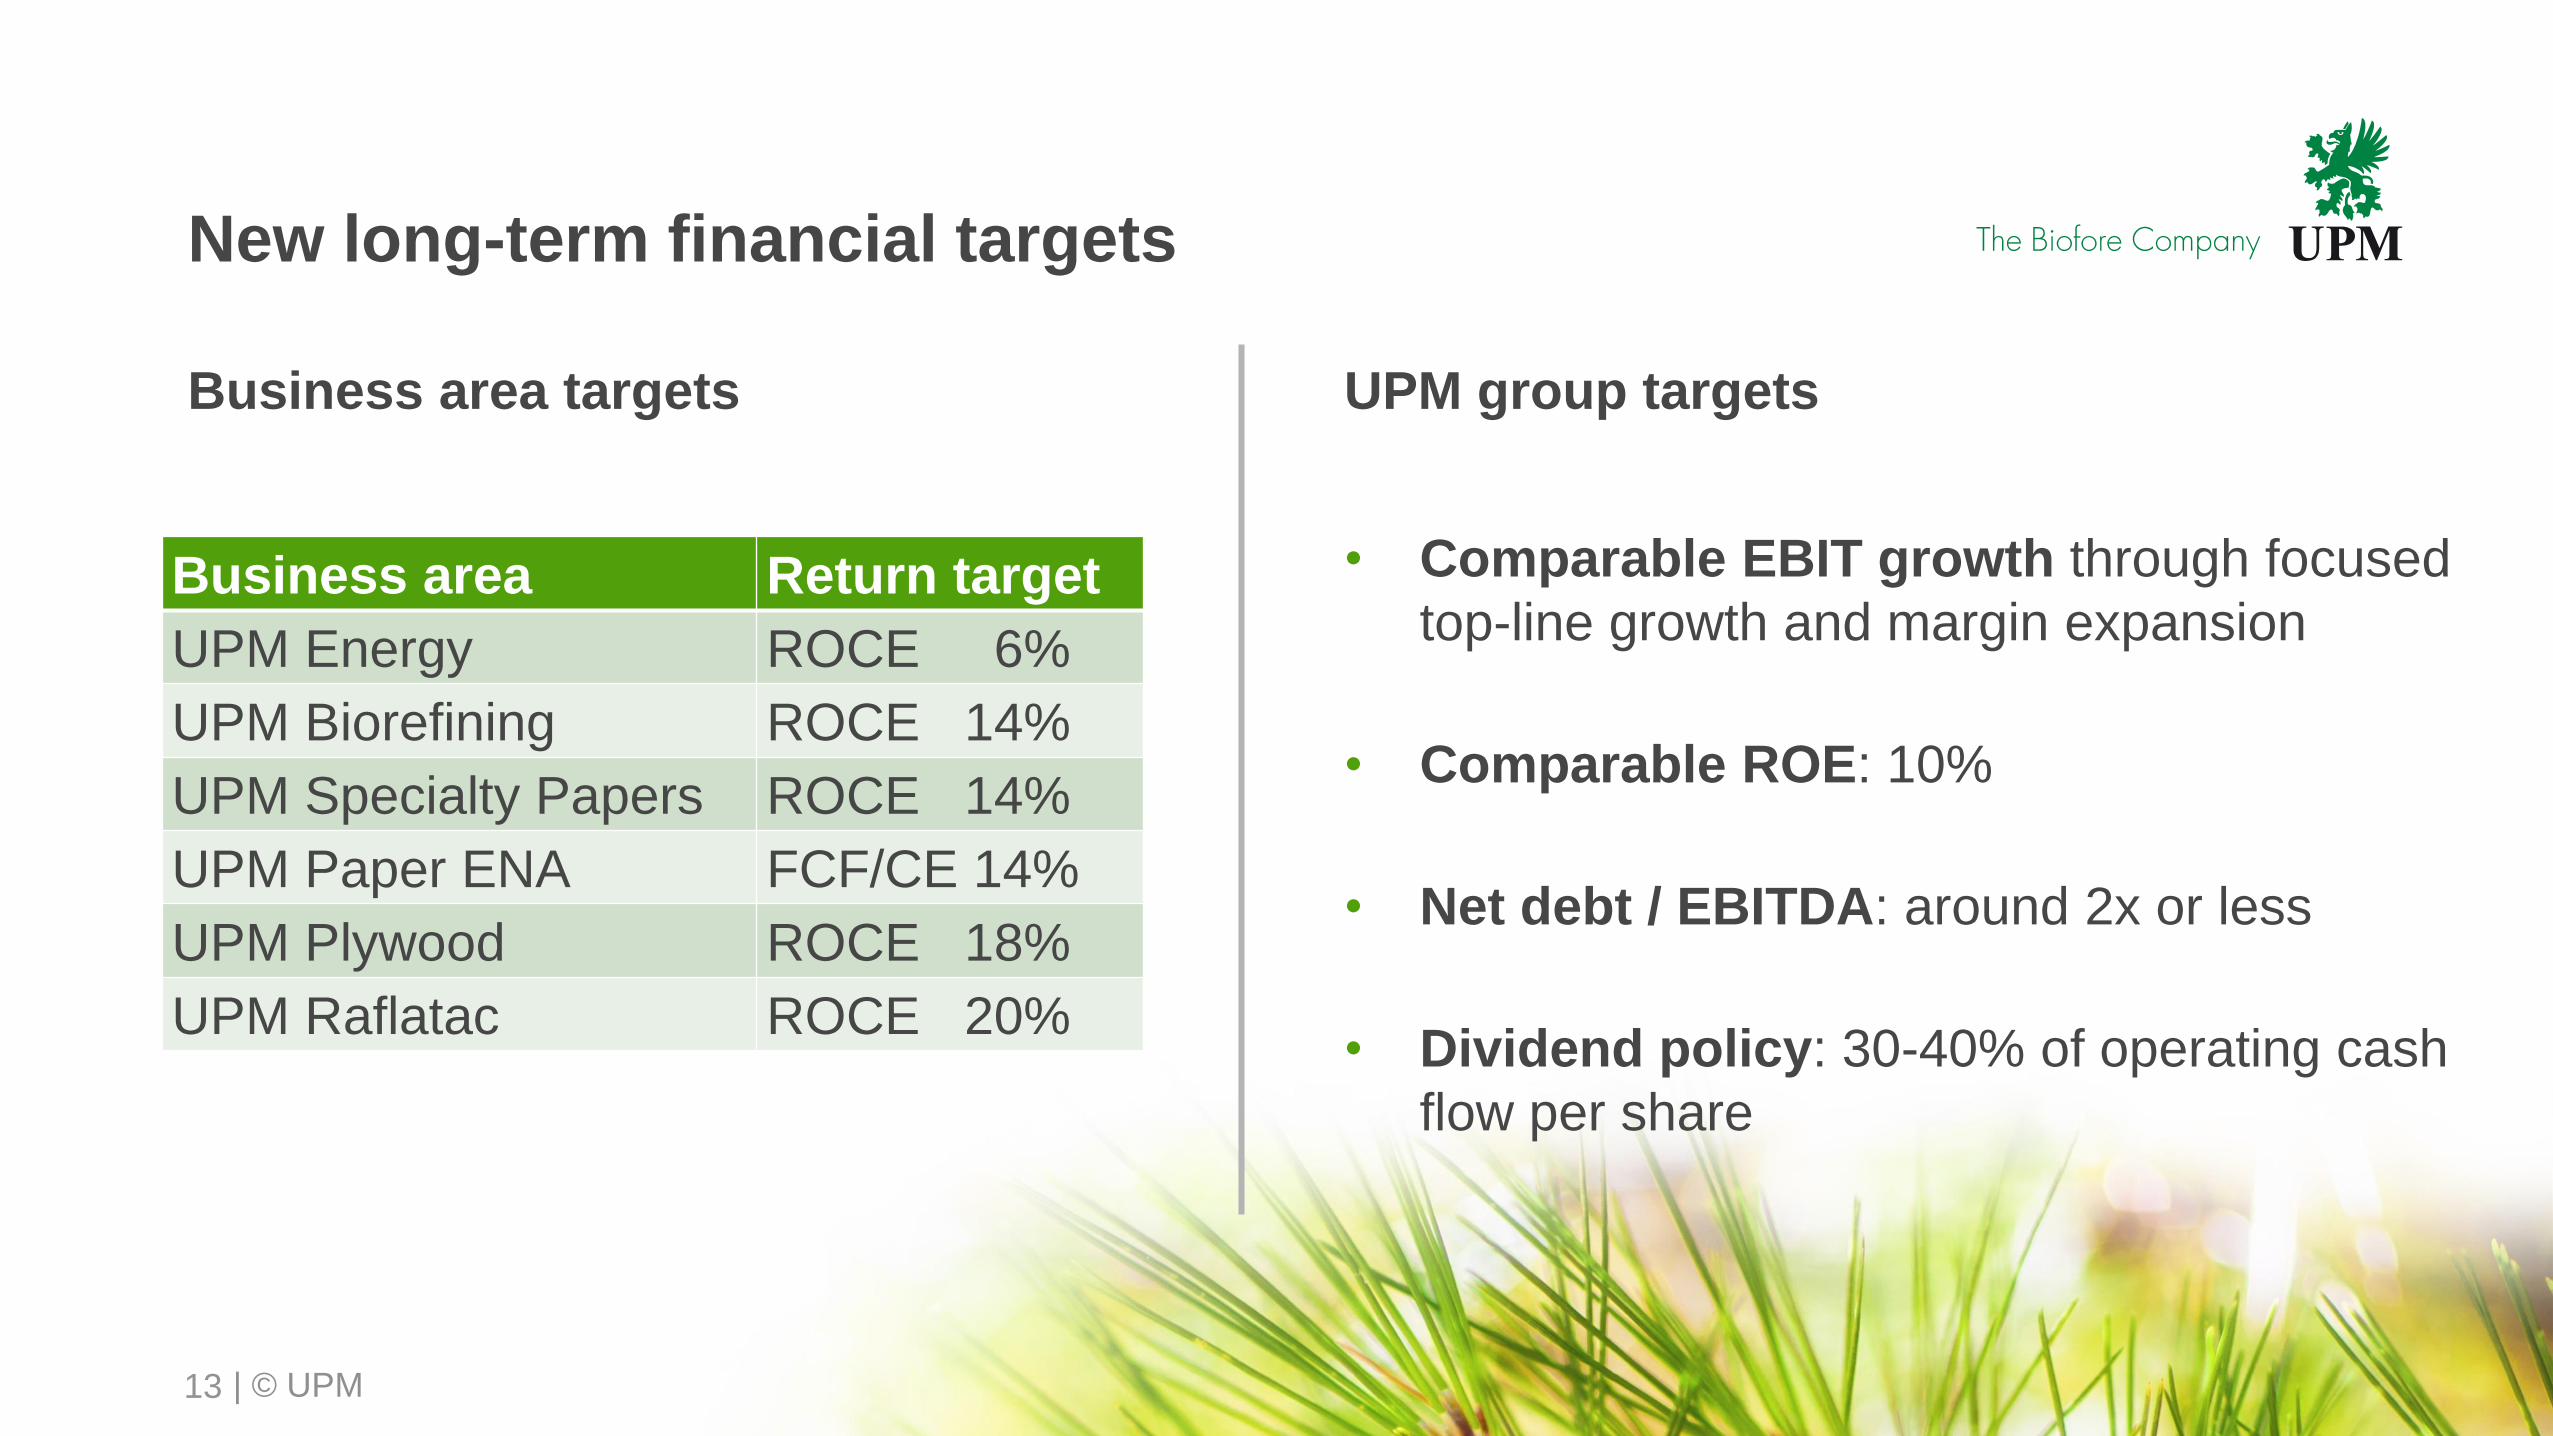
New long-term financial targets
Business area targets UPM group targets
• Comparable EBIT growth through focused
top-line growth and margin expansion
• Comparable ROE: 10%
• Net debt / EBITDA: around 2x or less
• Dividend policy: 30-40% of operating cash
flow per share
13
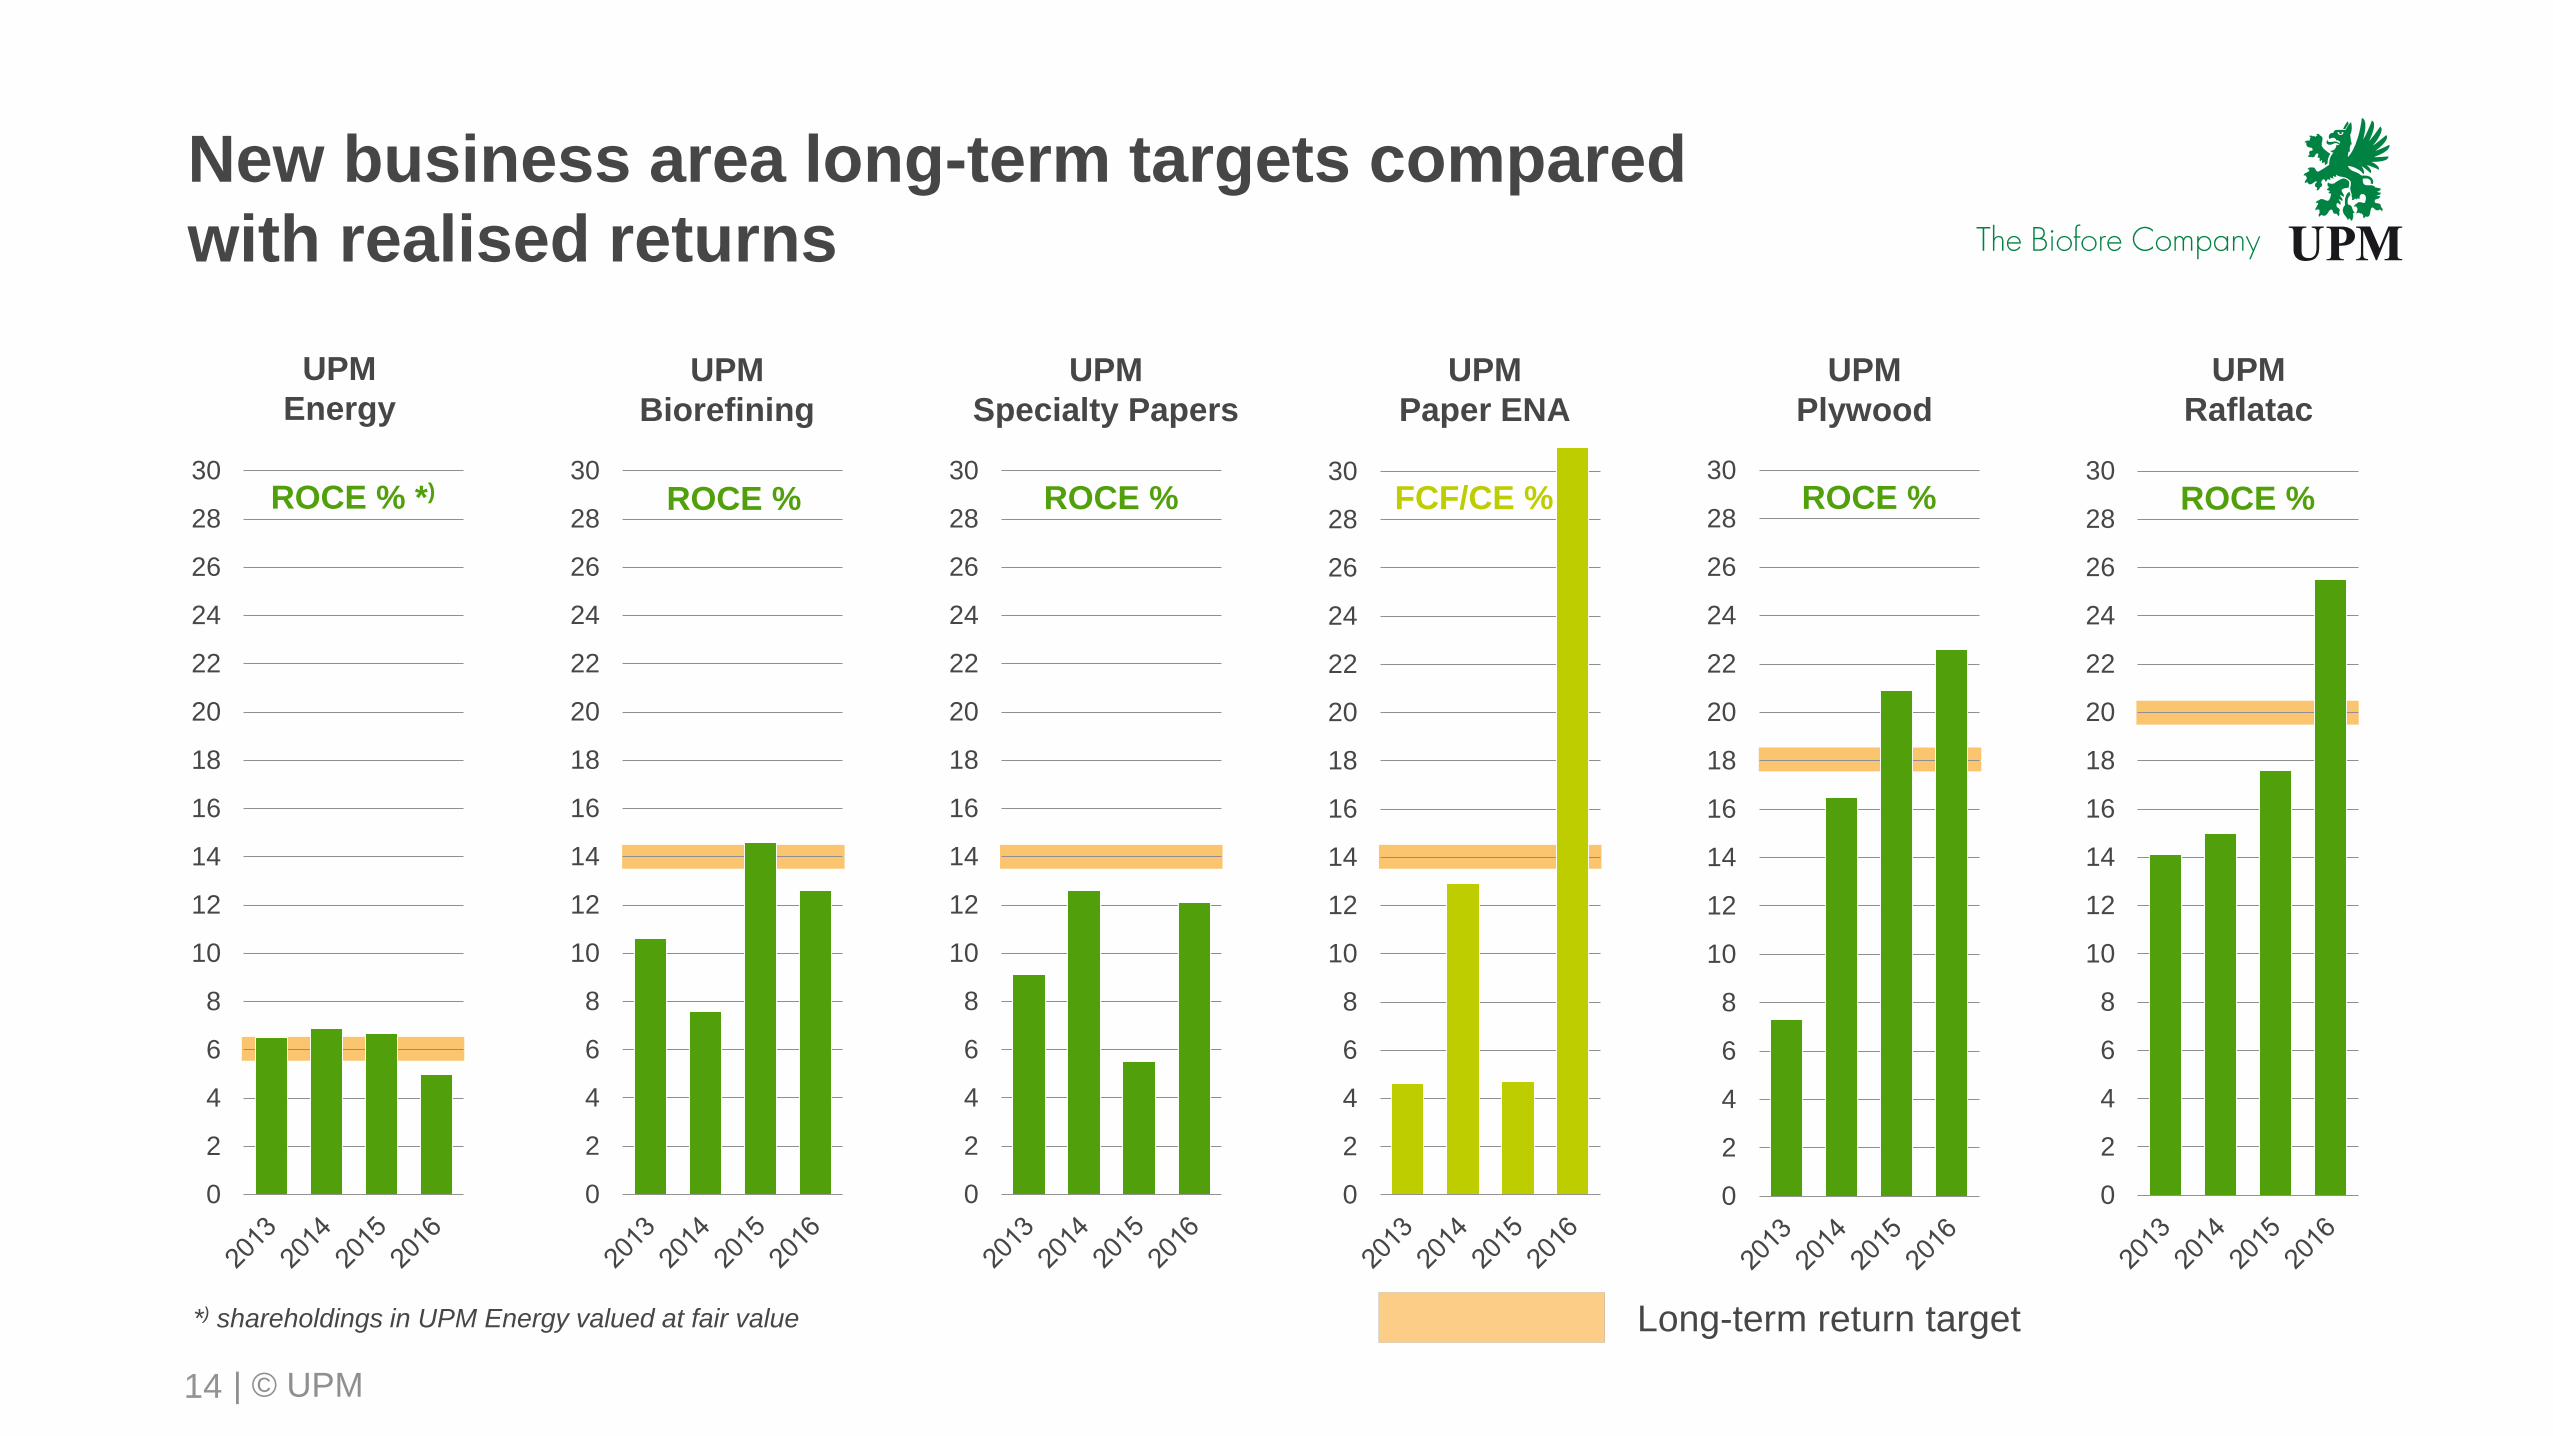
Business area Return target
UPM Energy ROCE 6%
UPM Biorefining ROCE 14%
UPM Specialty Papers ROCE 14%
UPM Paper ENA FCF/CE 14%
UPM Plywood ROCE 18%
UPM Raflatac ROCE 20%
| © UPM
New business area long-term targets compared
with realised returns
14
0
2
4
6
8
10
12
14
16
18
20
22
24
26
28
30ROCE %
UPM
Specialty Papers
0
2
4
6
8
10
12
14
16
18
20
22
24
26
28
30FCF/CE %
UPM
Paper ENA
0
2
4
6
8
10
12
14
16
18
20
22
24
26
28
30ROCE %
UPM
Plywood
0
2
4
6
8
10
12
14
16
18
20
22
24
26
28
30ROCE %
UPM
Raflatac
0
2
4
6
8
10
12
14
16
18
20
22
24
26
28
30ROCE % *)
UPM
Energy
0
2
4
6
8
10
12
14
16
18
20
22
24
26
28
30ROCE %
UPM
Biorefining
*) shareholdings in UPM Energy valued at fair value Long-term return target
| © UPM
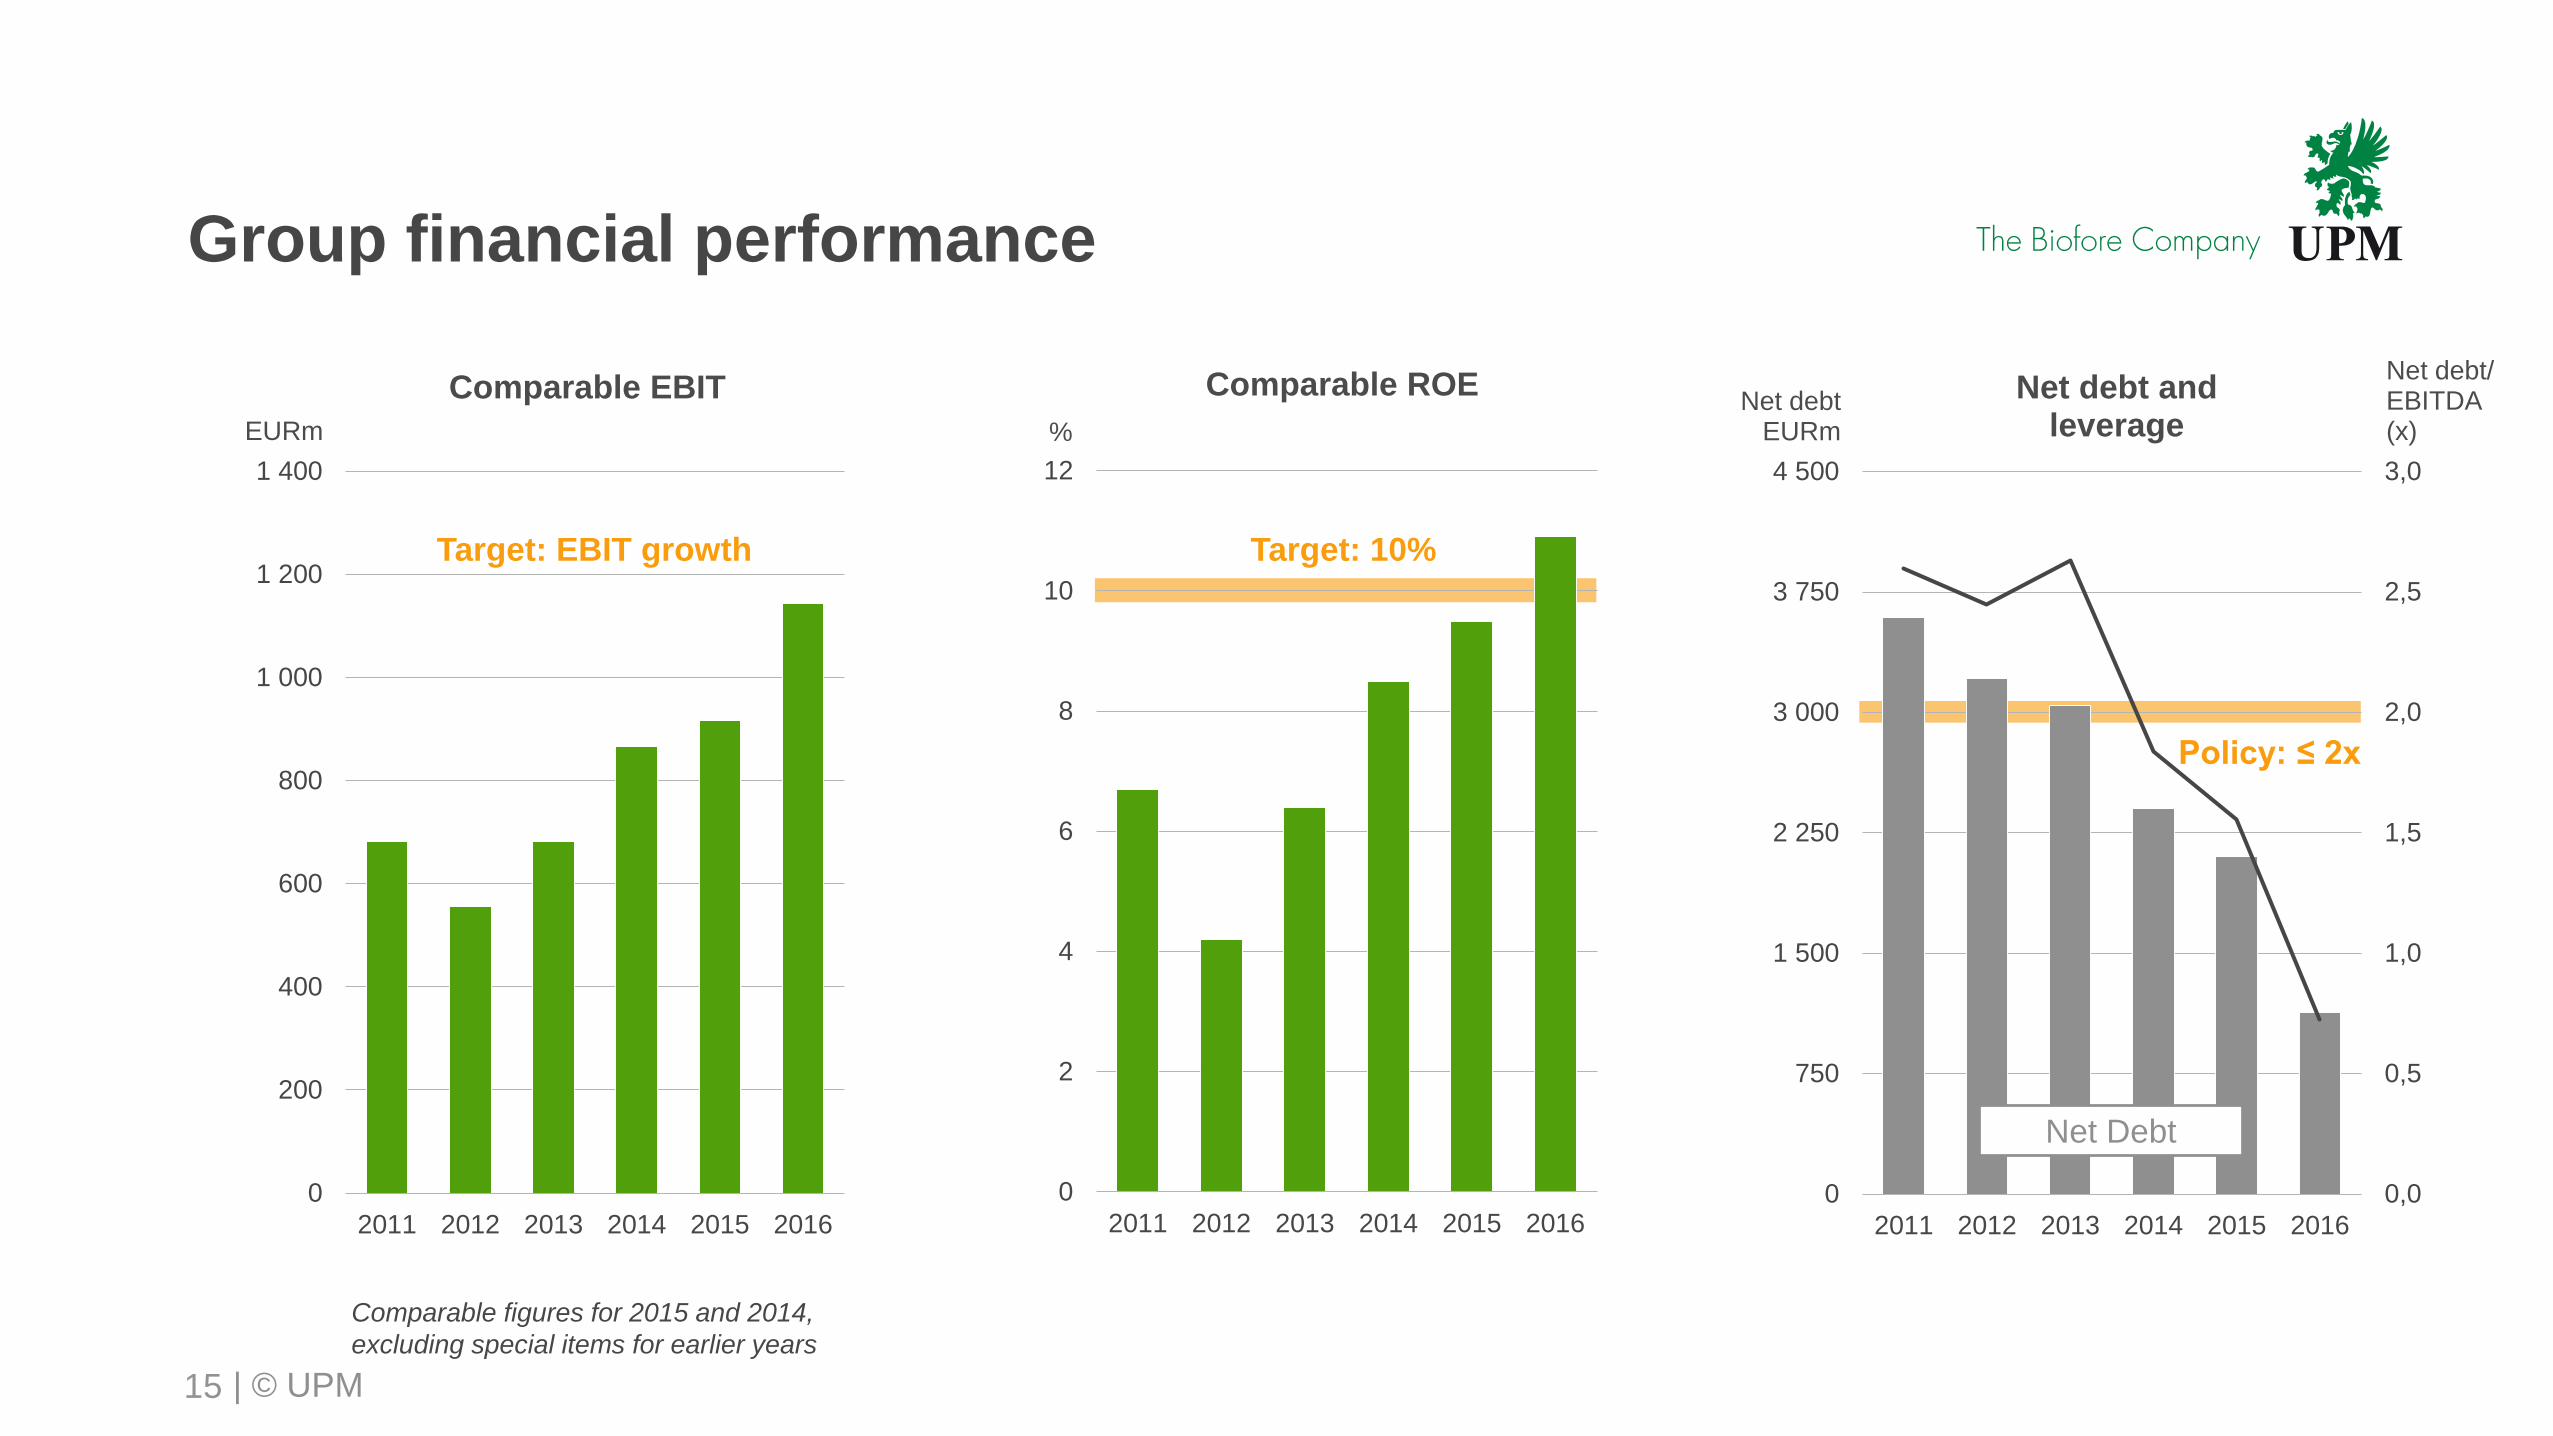
Group financial performance
15
0
200
400
600
800
1 000
1 200
1 400
2011 2012 2013 2014 2015 20160,0
0,5
1,0
1,5
2,0
2,5
3,0
0
750
1 500
2 250
3 000
3 750
4 500
2011 2012 2013 2014 2015 2016
Net Debt
Policy: ≤ 2x
Net debtEURm
Net debt/EBITDA(x)
Comparable EBIT
0
2
4
6
8
10
12
2011 2012 2013 2014 2015 2016
Target: 10%
%
Comparable ROE Net debt and leverage
Comparable figures for 2015 and 2014,
excluding special items for earlier years
EURm
Target: EBIT growth
| © UPM
Summary
16
• 2016 was financially a record year, demonstrating the results of
UPM transformation
• Board proposes a dividend of EUR 0.95 (0.75) per share
• UPM aims higher with renewed long-term financial targets

| © UPM
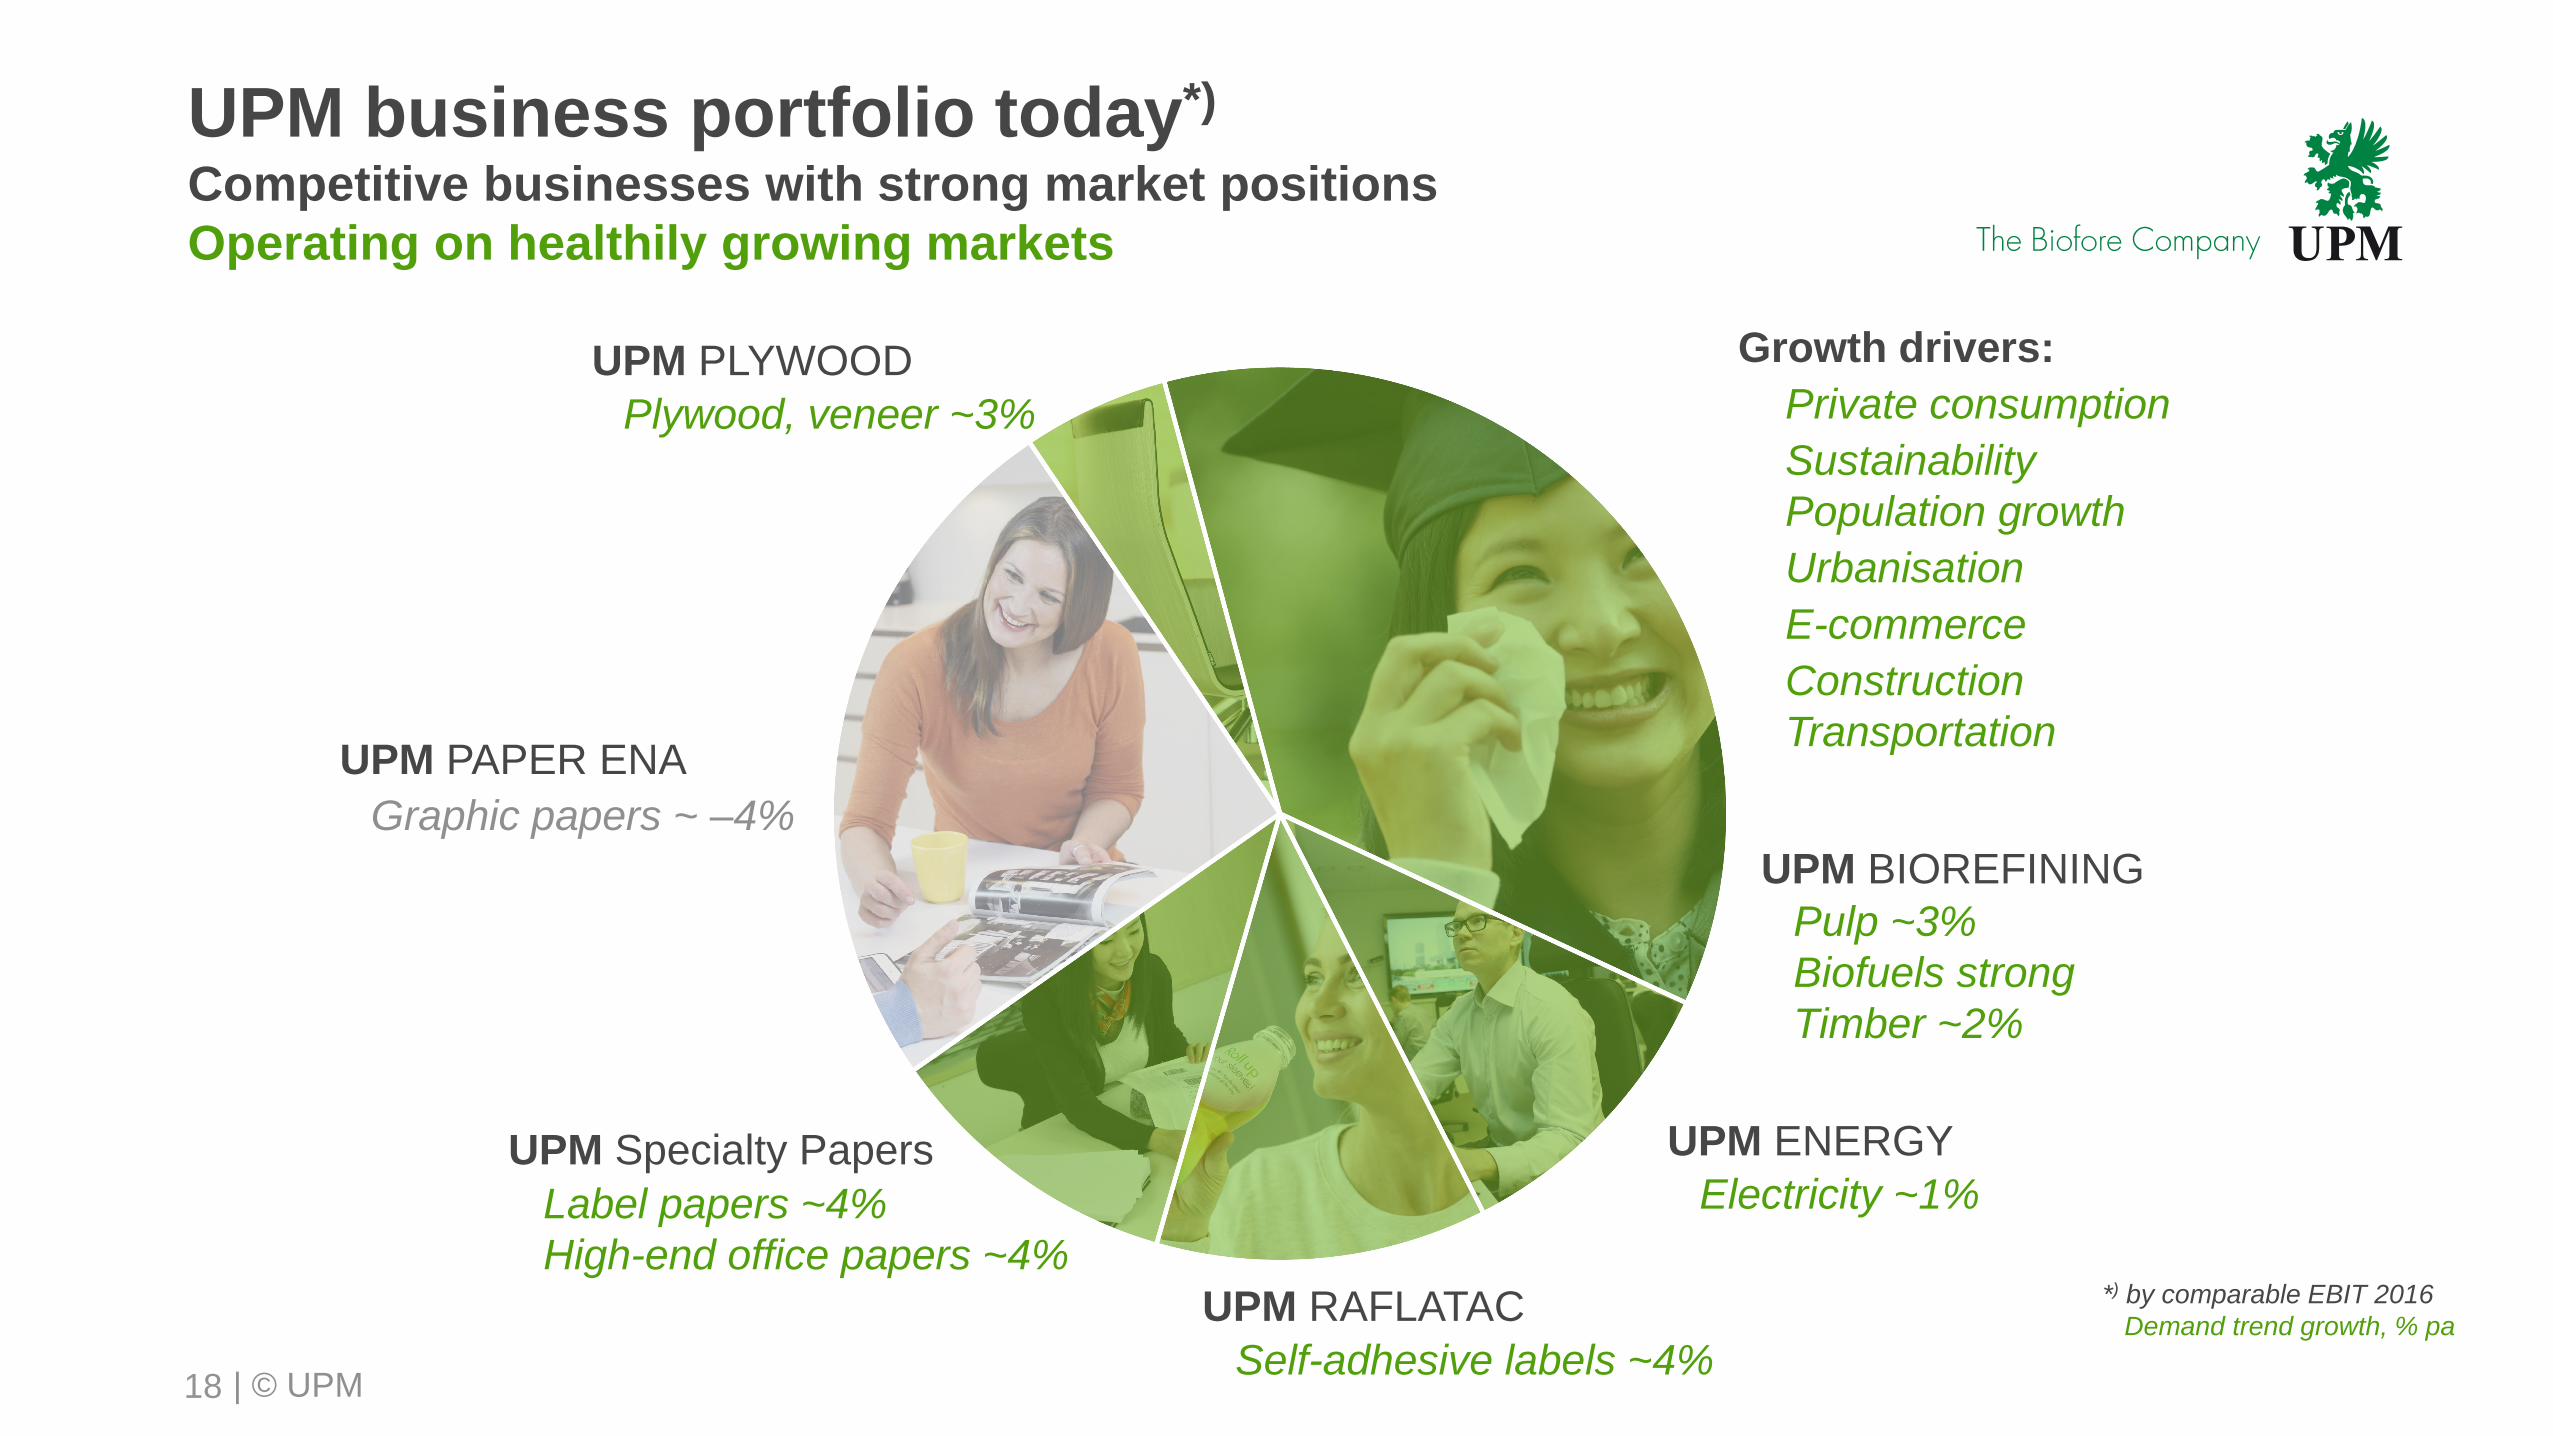
UPM business portfolio today*)
Competitive businesses with strong market positions
Operating on healthily growing markets
18
UPM ENERGY
UPM RAFLATAC
UPM PAPER ENA
UPM PLYWOOD
Electricity ~1%
Pulp ~3%
Biofuels strong
Timber ~2%
Graphic papers ~ –4%
Plywood, veneer ~3%
Self-adhesive labels ~4%
UPM Specialty Papers
UPM BIOREFINING
Growth drivers:
Private consumption
Sustainability
Population growth
Urbanisation
E-commerce
Construction
Transportation
*) by comparable EBIT 2016
Demand trend growth, % pa
Label papers ~4%
High-end office papers ~4%
| © UPM
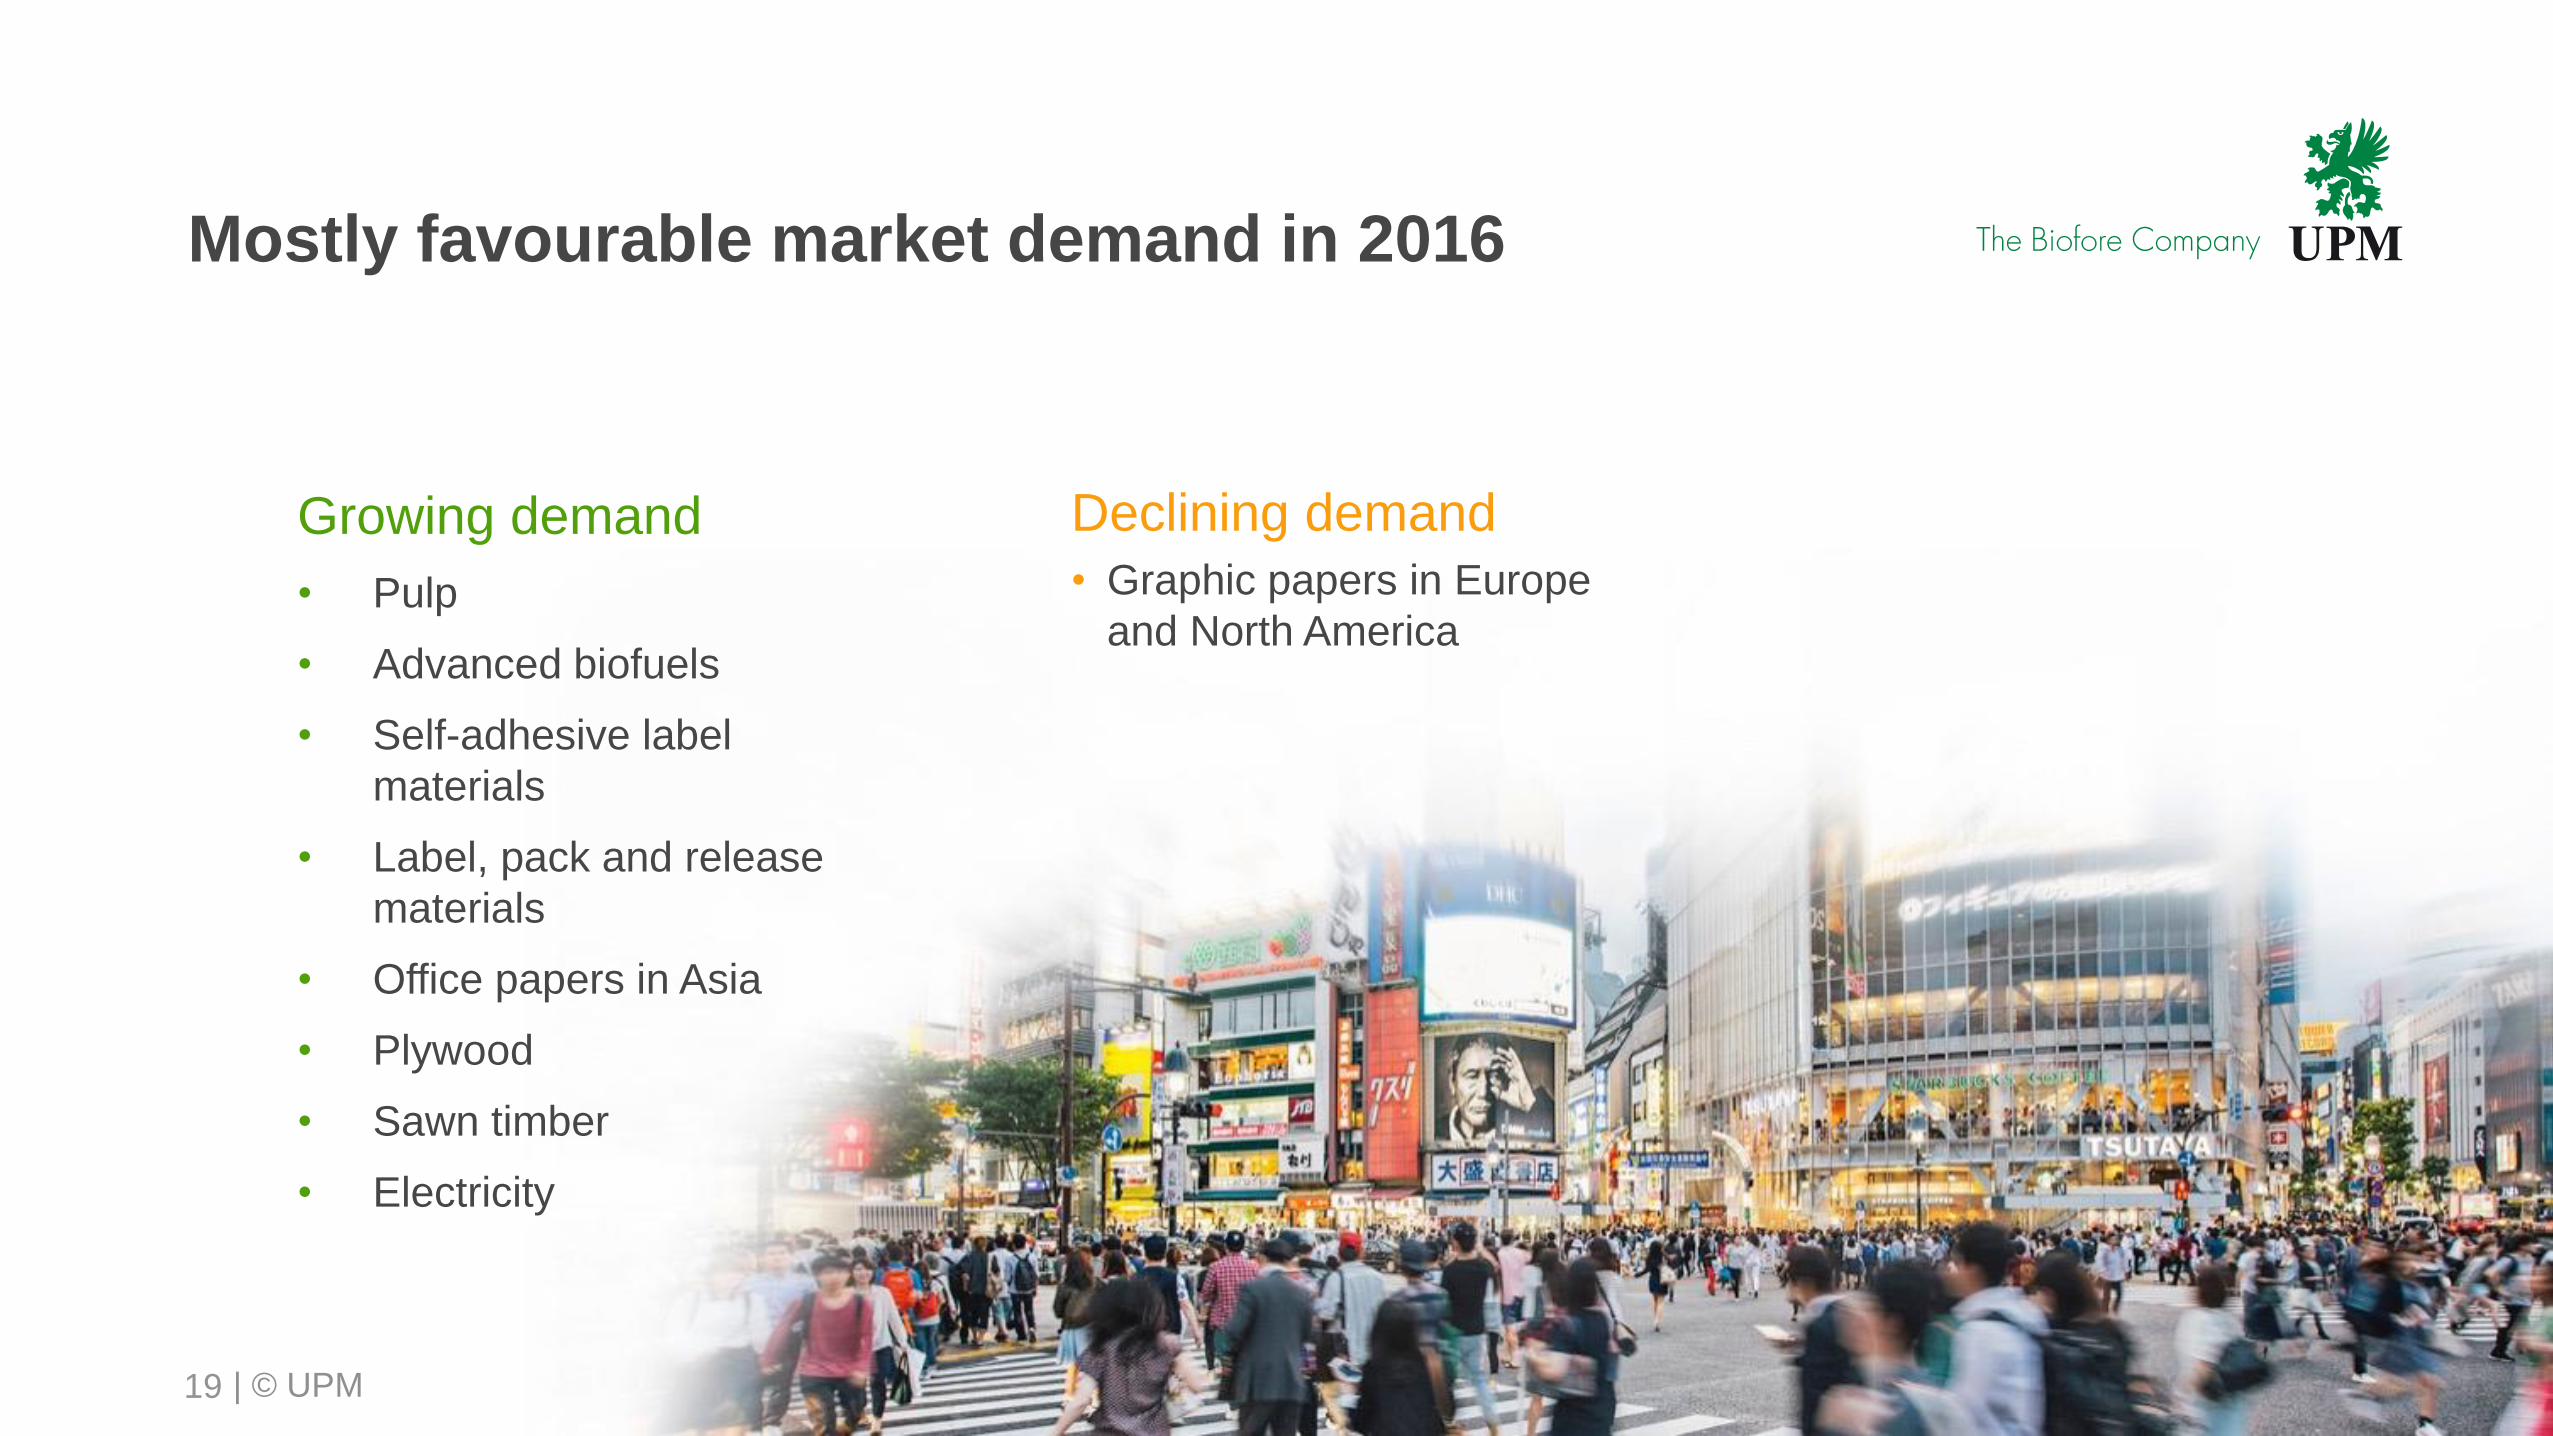
Mostly favourable market demand in 2016
19
Growing demand
• Pulp
• Advanced biofuels
• Self-adhesive label
materials
• Label, pack and release
materials
• Office papers in Asia
• Plywood
• Sawn timber
• Electricity
Declining demand
• Graphic papers in Europe
and North America
| © UPM
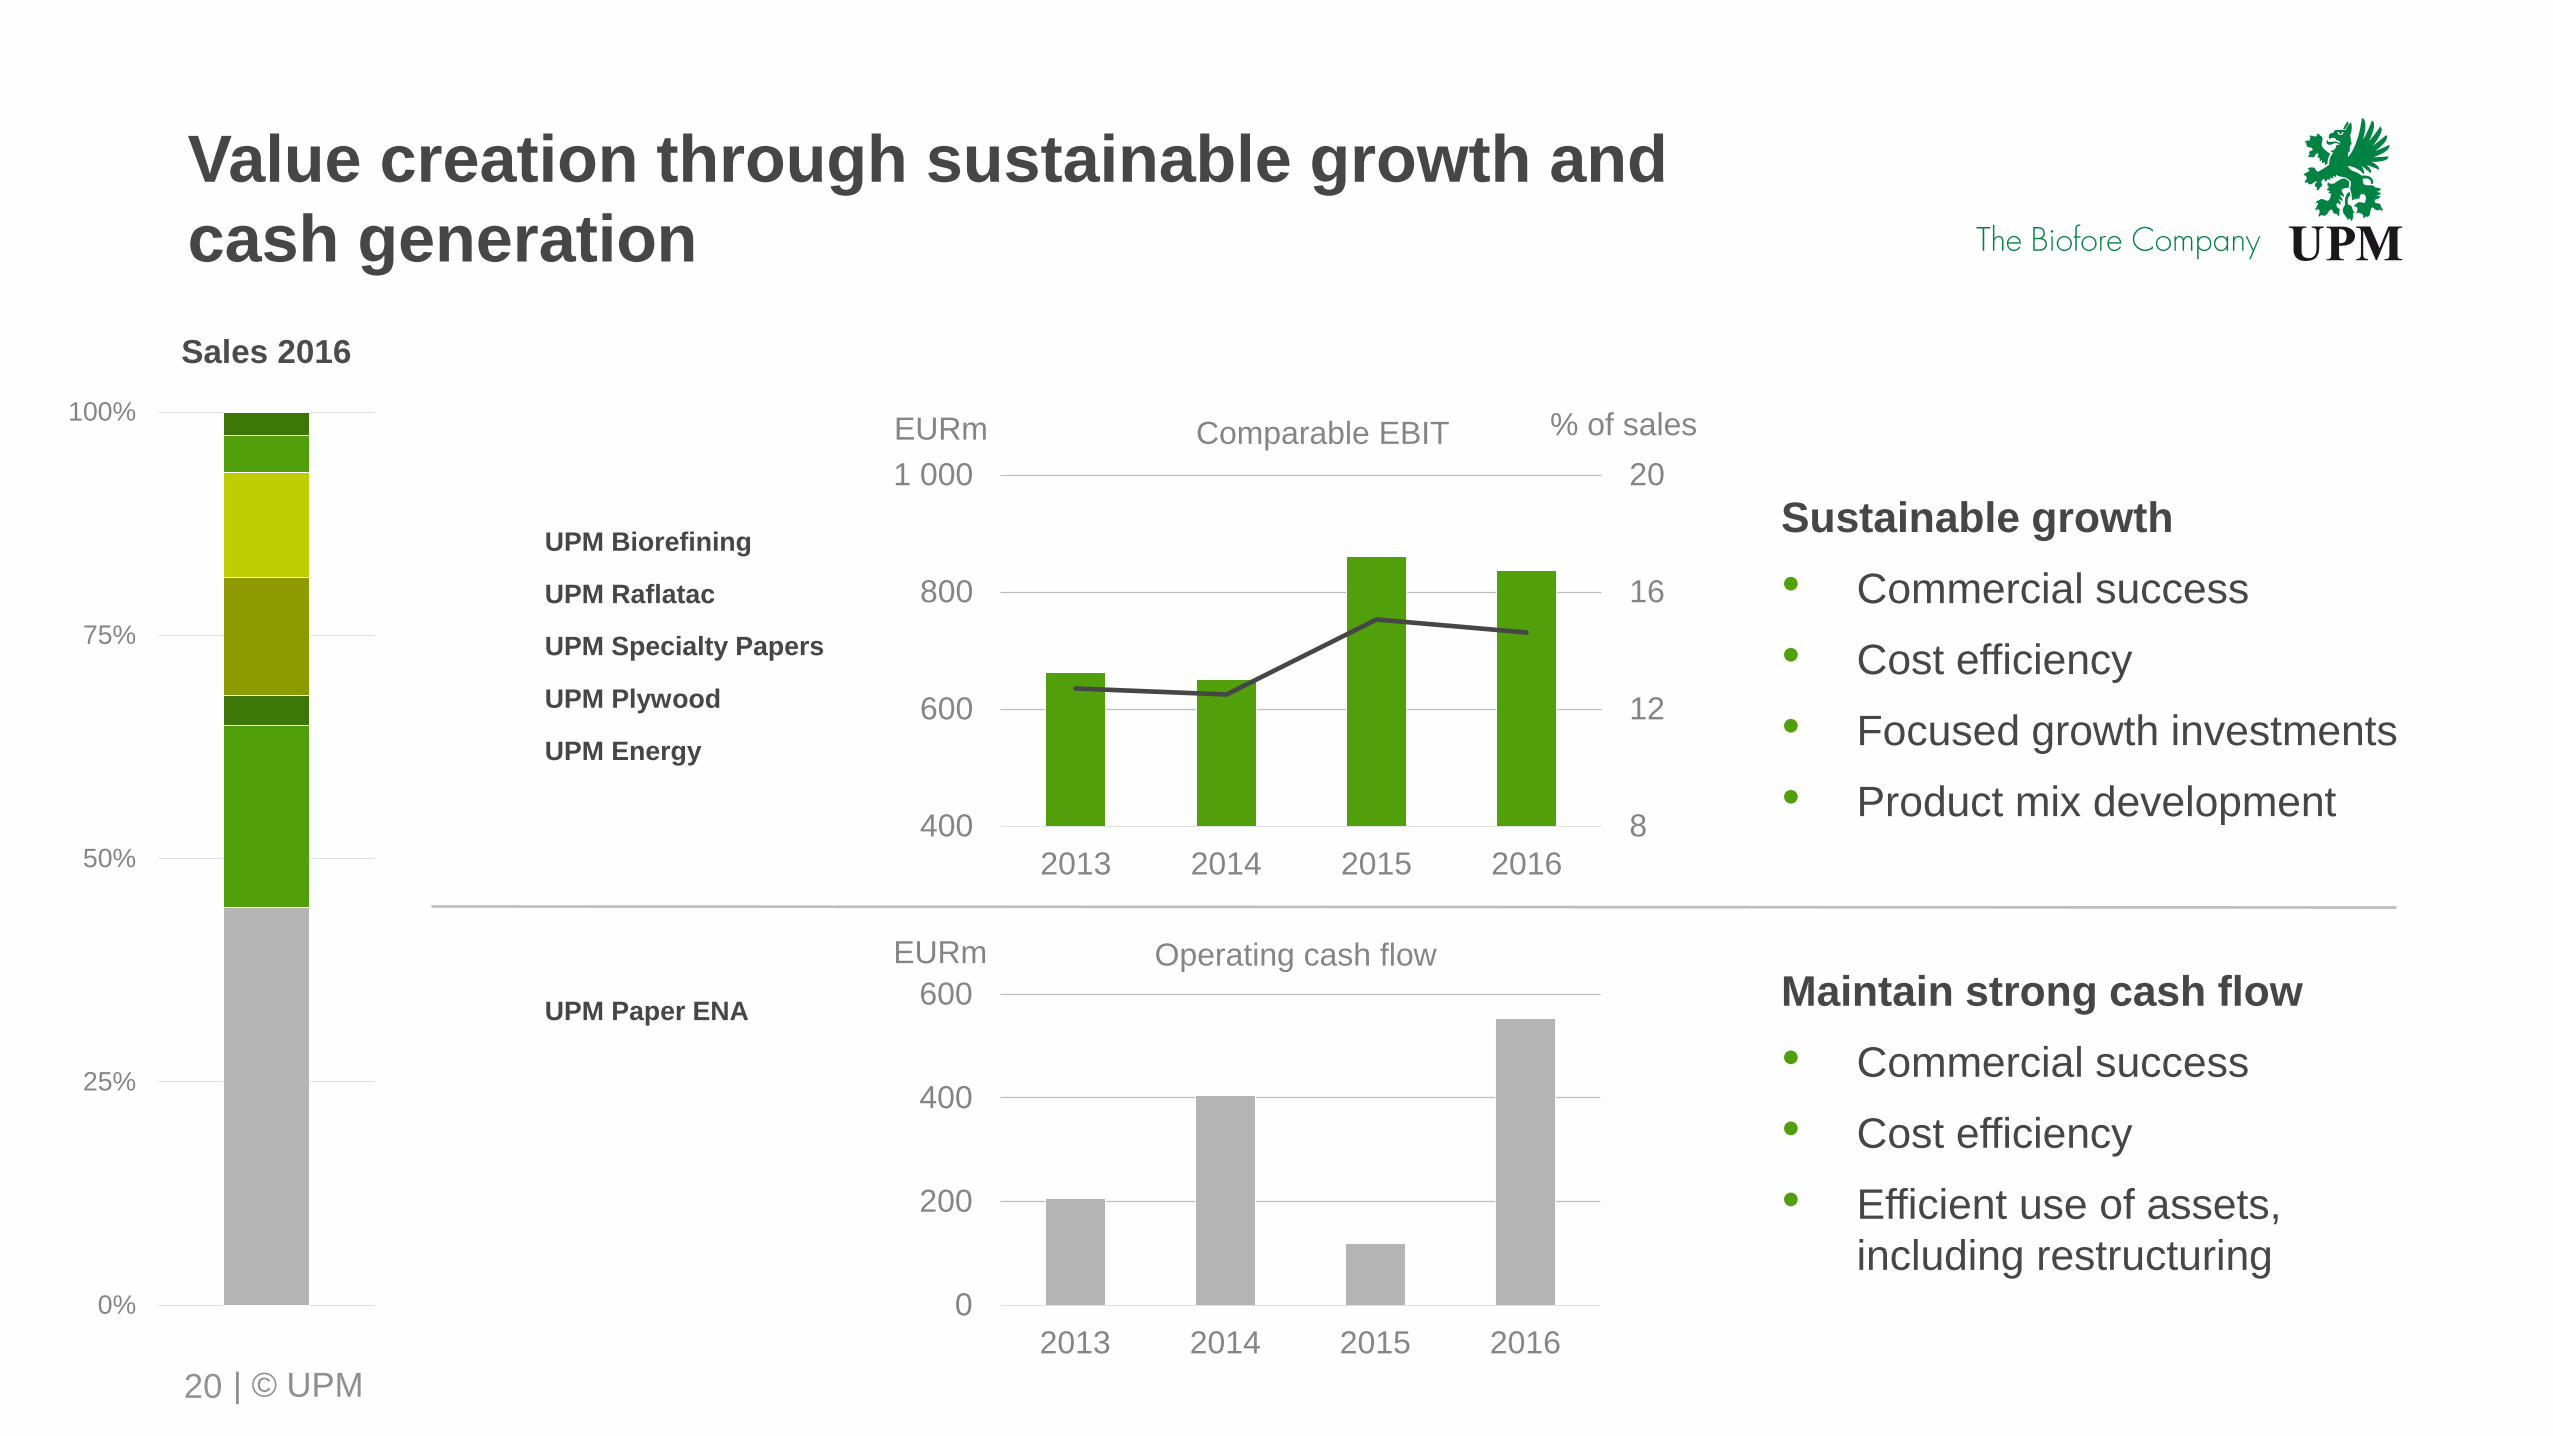
Value creation through sustainable growth and
cash generation
20
UPM Biorefining
UPM Raflatac
UPM Specialty Papers
UPM Plywood
Sales 2016
UPM Paper ENA
UPM Energy
8
12
16
20
400
600
800
1 000
2013 2014 2015 2016
% of salesEURm Comparable EBIT
Maintain strong cash flow
• Commercial success
• Cost efficiency
• Efficient use of assets,
including restructuring
Sustainable growth
• Commercial success
• Cost efficiency
• Focused growth investments
• Product mix development
0
200
400
600
2013 2014 2015 2016
EURm Operating cash flow
0%
25%
50%
75%
100%
| © UPM
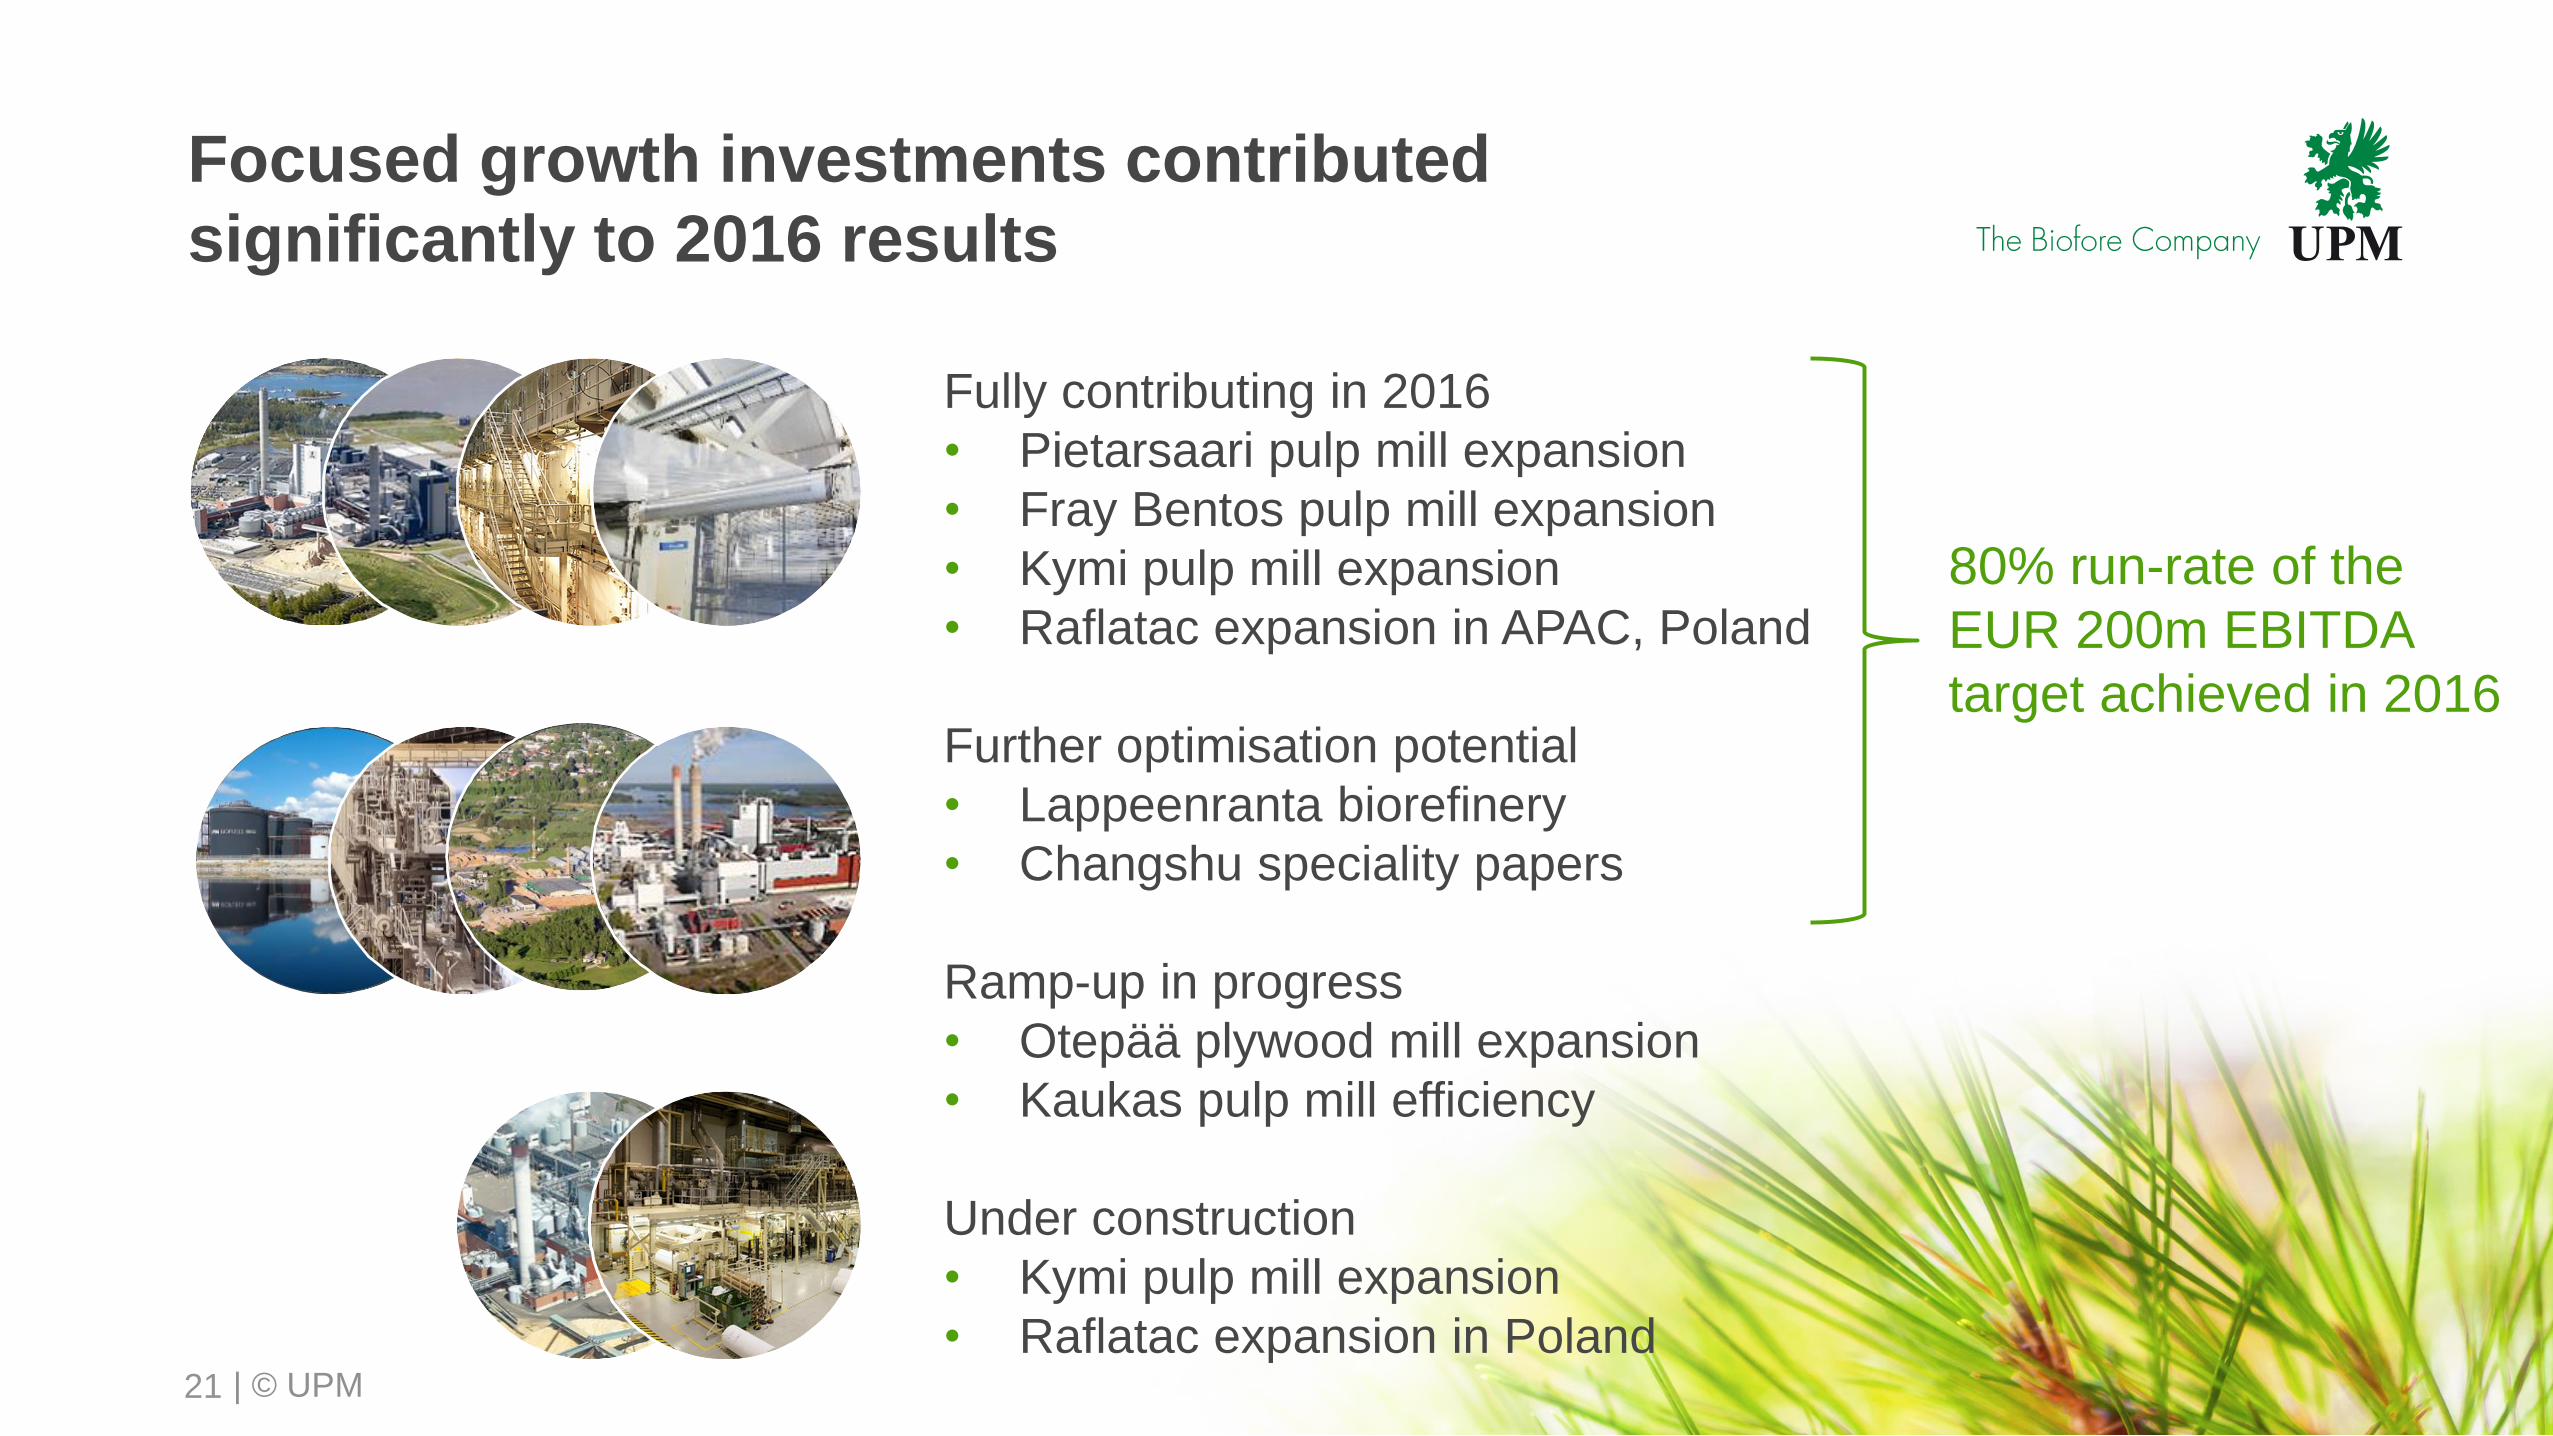
Focused growth investments contributed
significantly to 2016 results
21
Fully contributing in 2016
• Pietarsaari pulp mill expansion
• Fray Bentos pulp mill expansion
• Kymi pulp mill expansion
• Raflatac expansion in APAC, Poland
Further optimisation potential
• Lappeenranta biorefinery
• Changshu speciality papers
Ramp-up in progress
• Otepää plywood mill expansion
• Kaukas pulp mill efficiency
Under construction
• Kymi pulp mill expansion
• Raflatac expansion in Poland
80% run-rate of the
EUR 200m EBITDA
target achieved in 2016
| © UPM
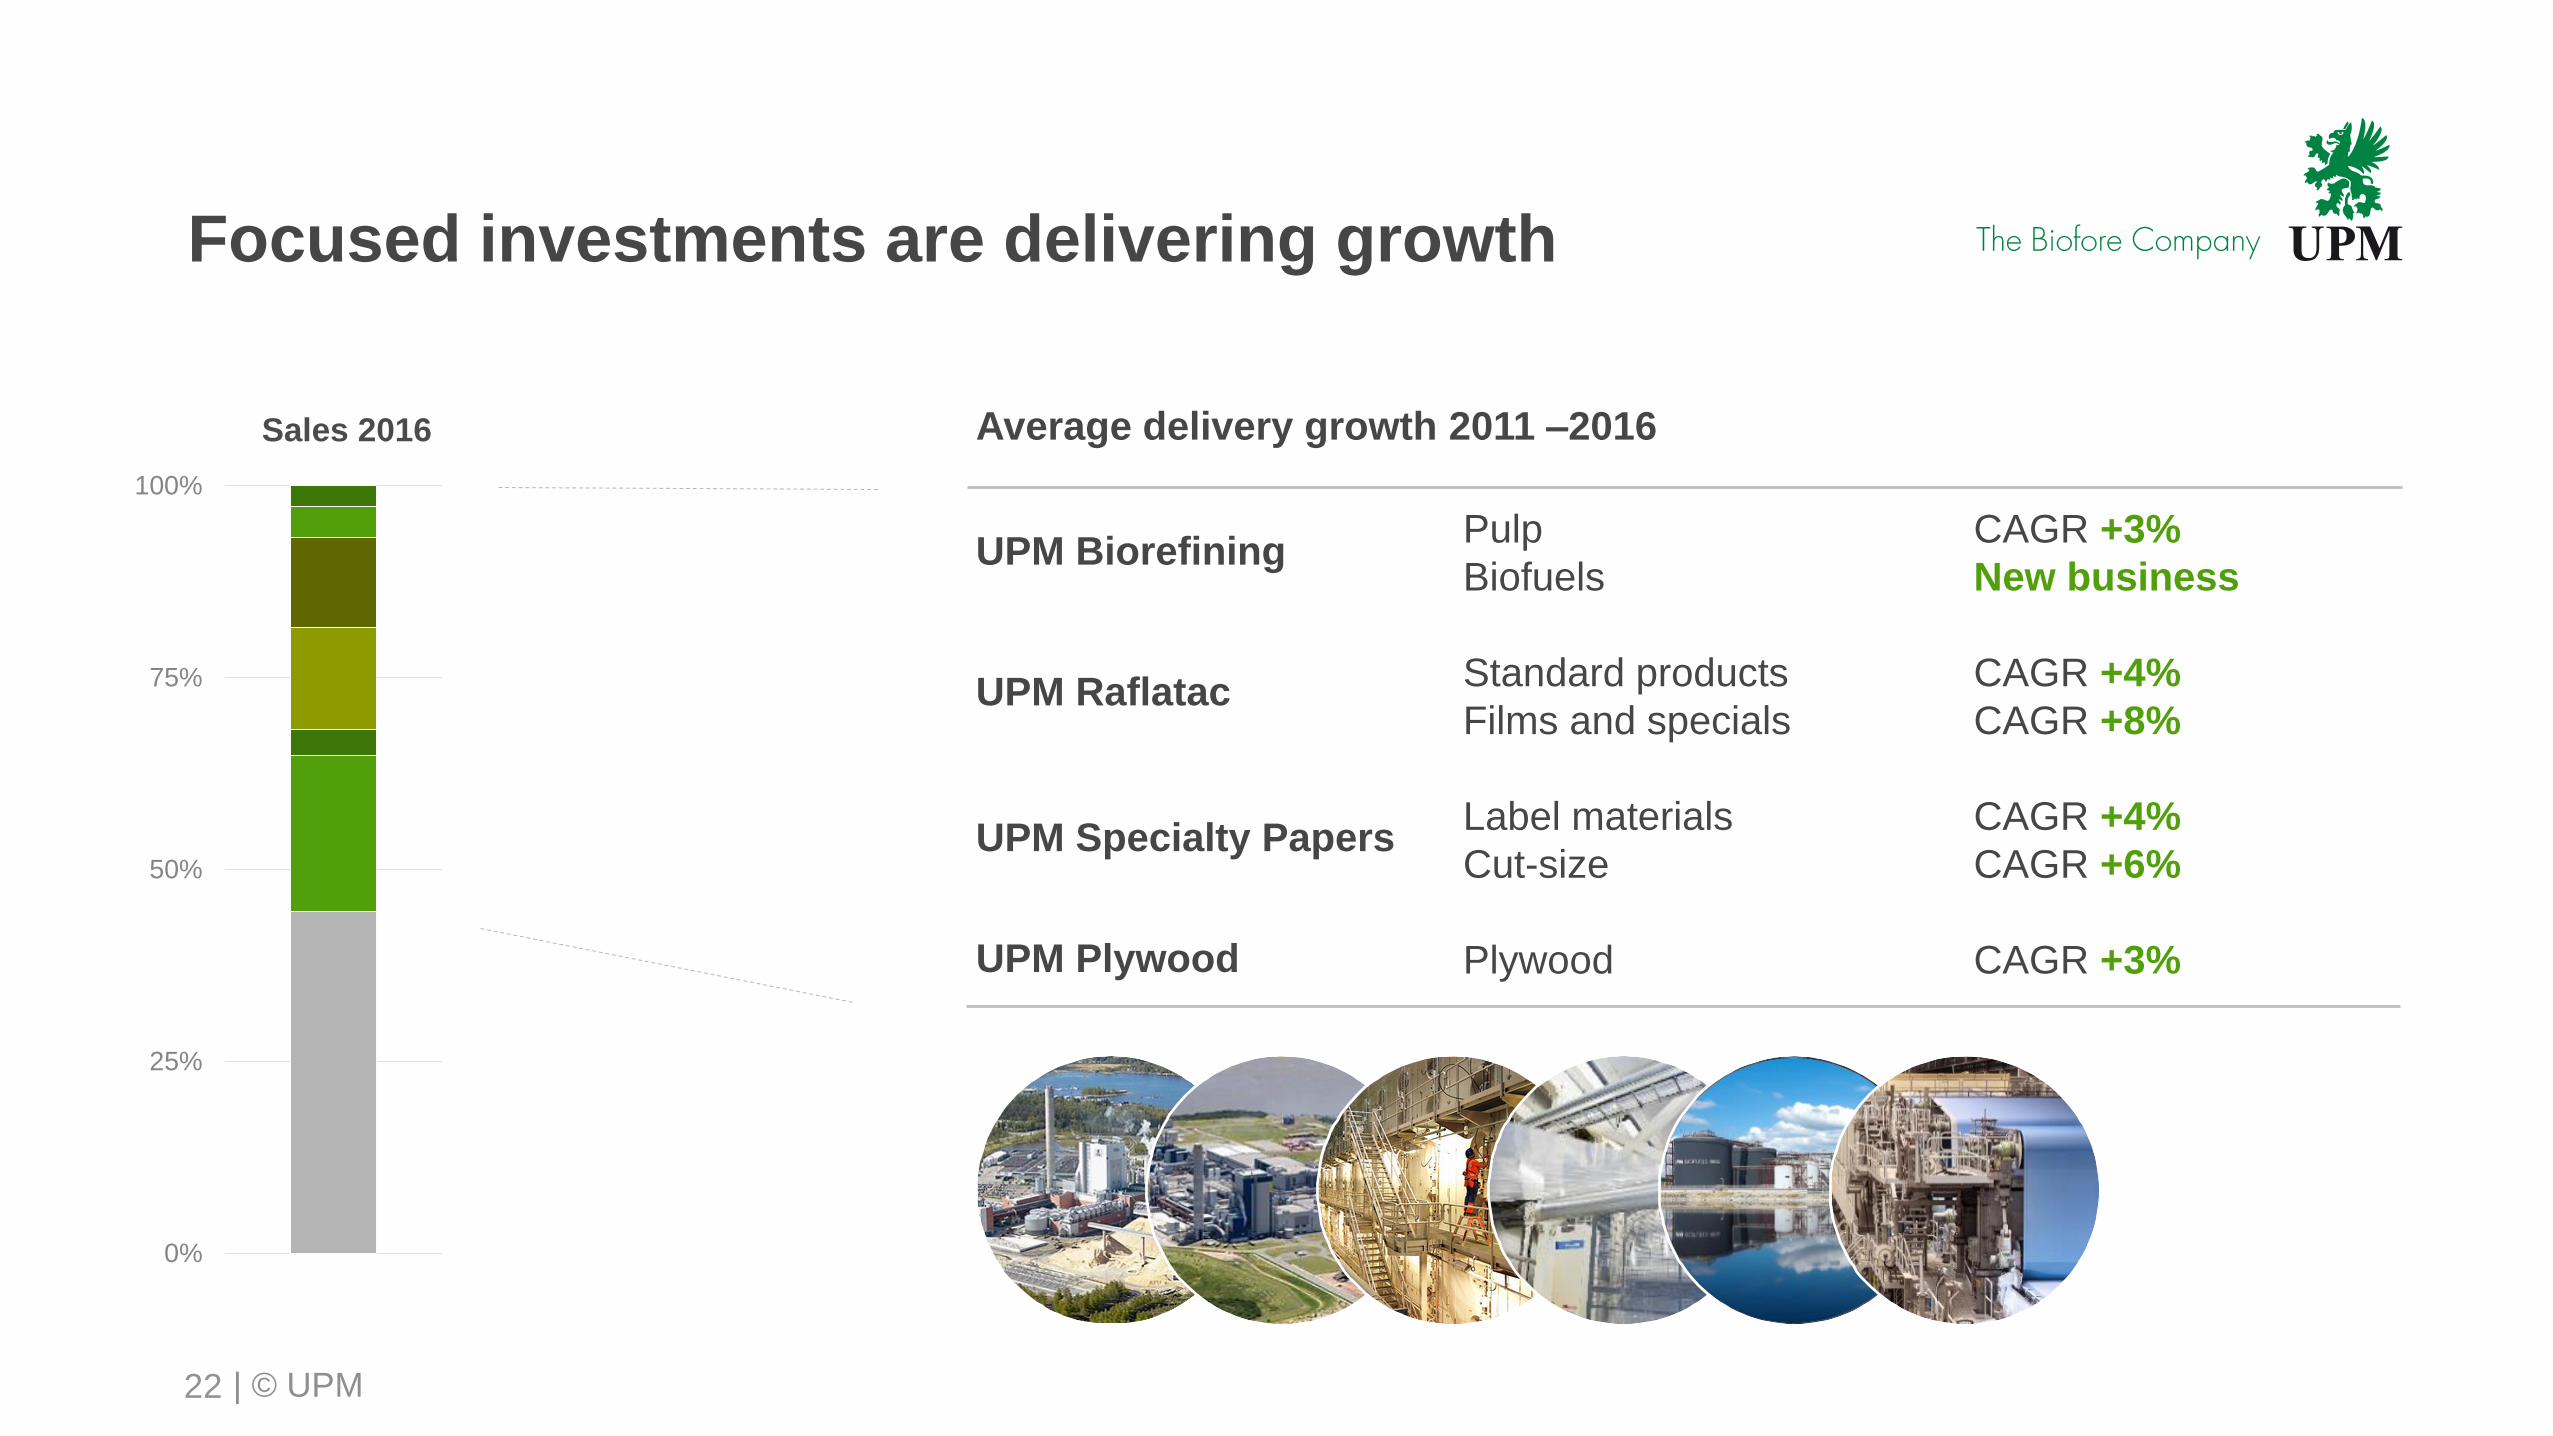
Focused investments are delivering growth
22
Pulp CAGR +3%
Biofuels New business
Standard products CAGR +4%
Films and specials CAGR +8%
Label materials CAGR +4%
Cut-size CAGR +6%
Plywood CAGR +3%
Average delivery growth 2011 –2016
UPM Biorefining
UPM Raflatac
UPM Specialty Papers
UPM Plywood
Sales 2016
0%
25%
50%
75%
100%
| © UPM
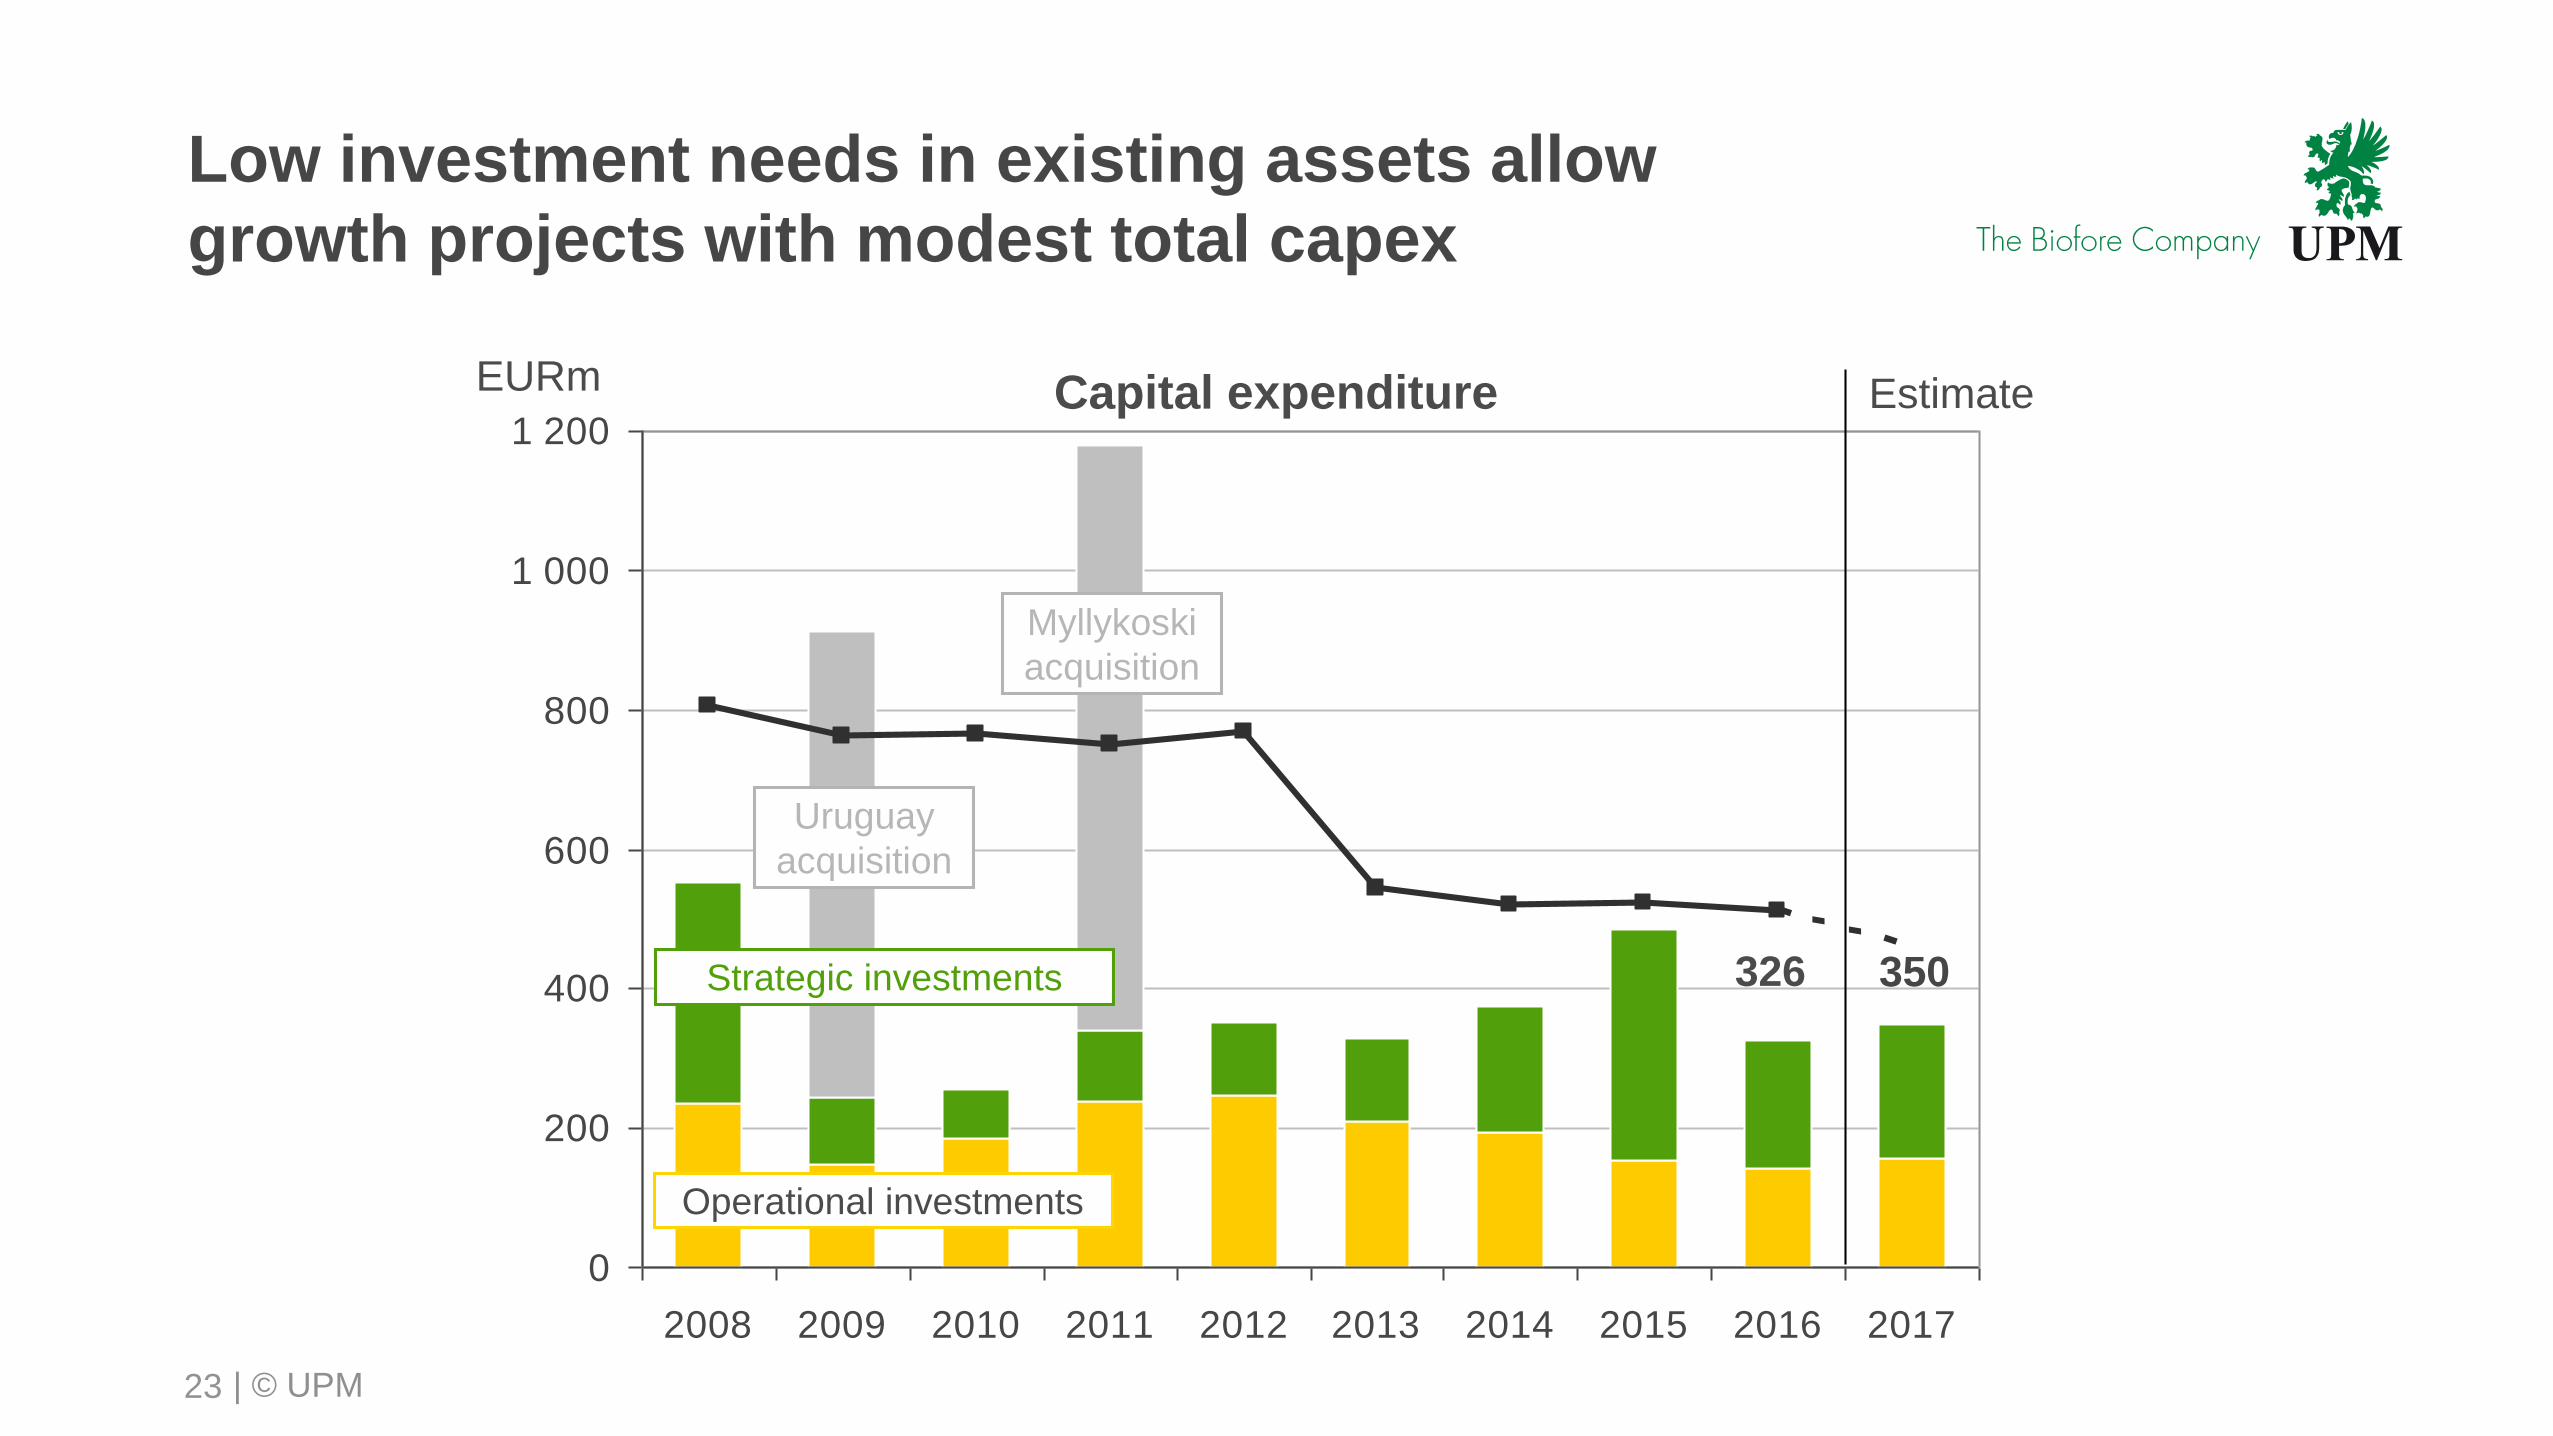
Low investment needs in existing assets allow
growth projects with modest total capex
23
0
200
400
600
800
1 000
1 200
2008 2009 2010 2011 2012 2013 2014 2015 2016 2017
EURm
Operational investments
Capital expenditure
Strategic investments
Uruguay
acquisition
486
Estimate
326 350
Myllykoski
acquisition
| © UPM
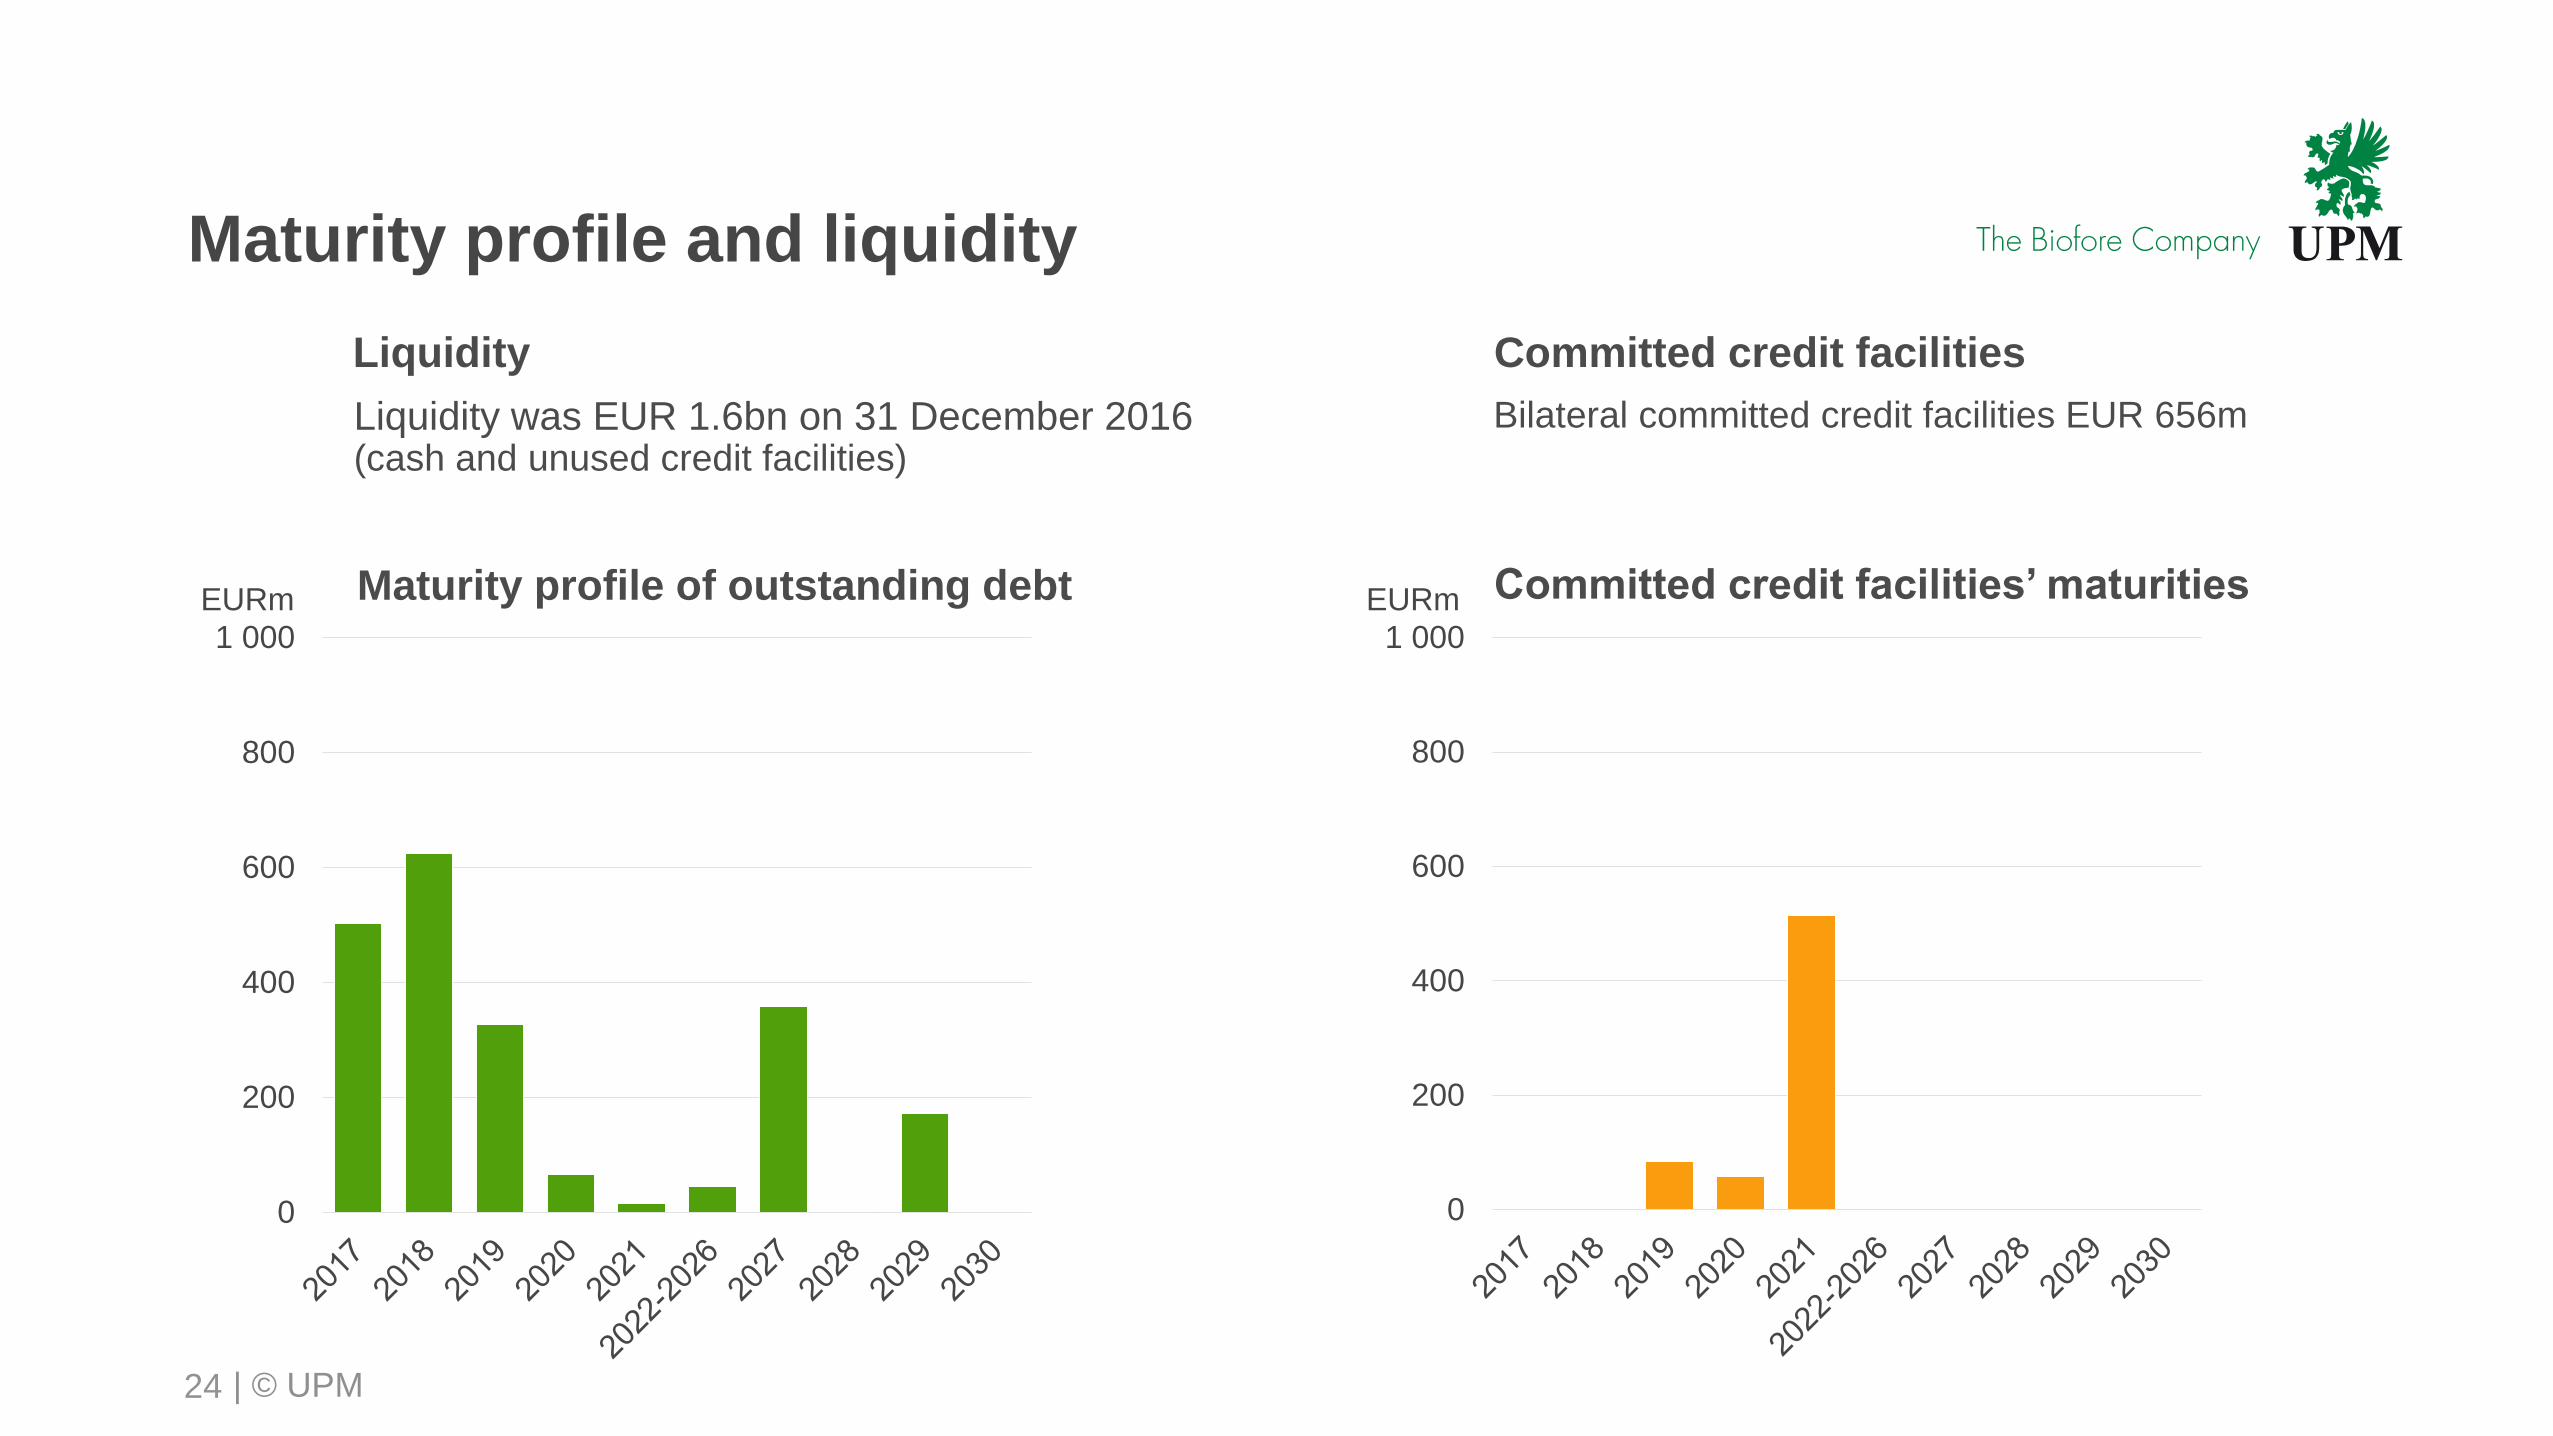
Maturity profile and liquidity
0
200
400
600
800
1 000
0
200
400
600
800
1 000
24
Maturity profile of outstanding debt Committed credit facilities’ maturities EURm EURm
Liquidity
Liquidity was EUR 1.6bn on 31 December 2016(cash and unused credit facilities)
Bilateral committed credit facilities EUR 656m
Committed credit facilities
| © UPM
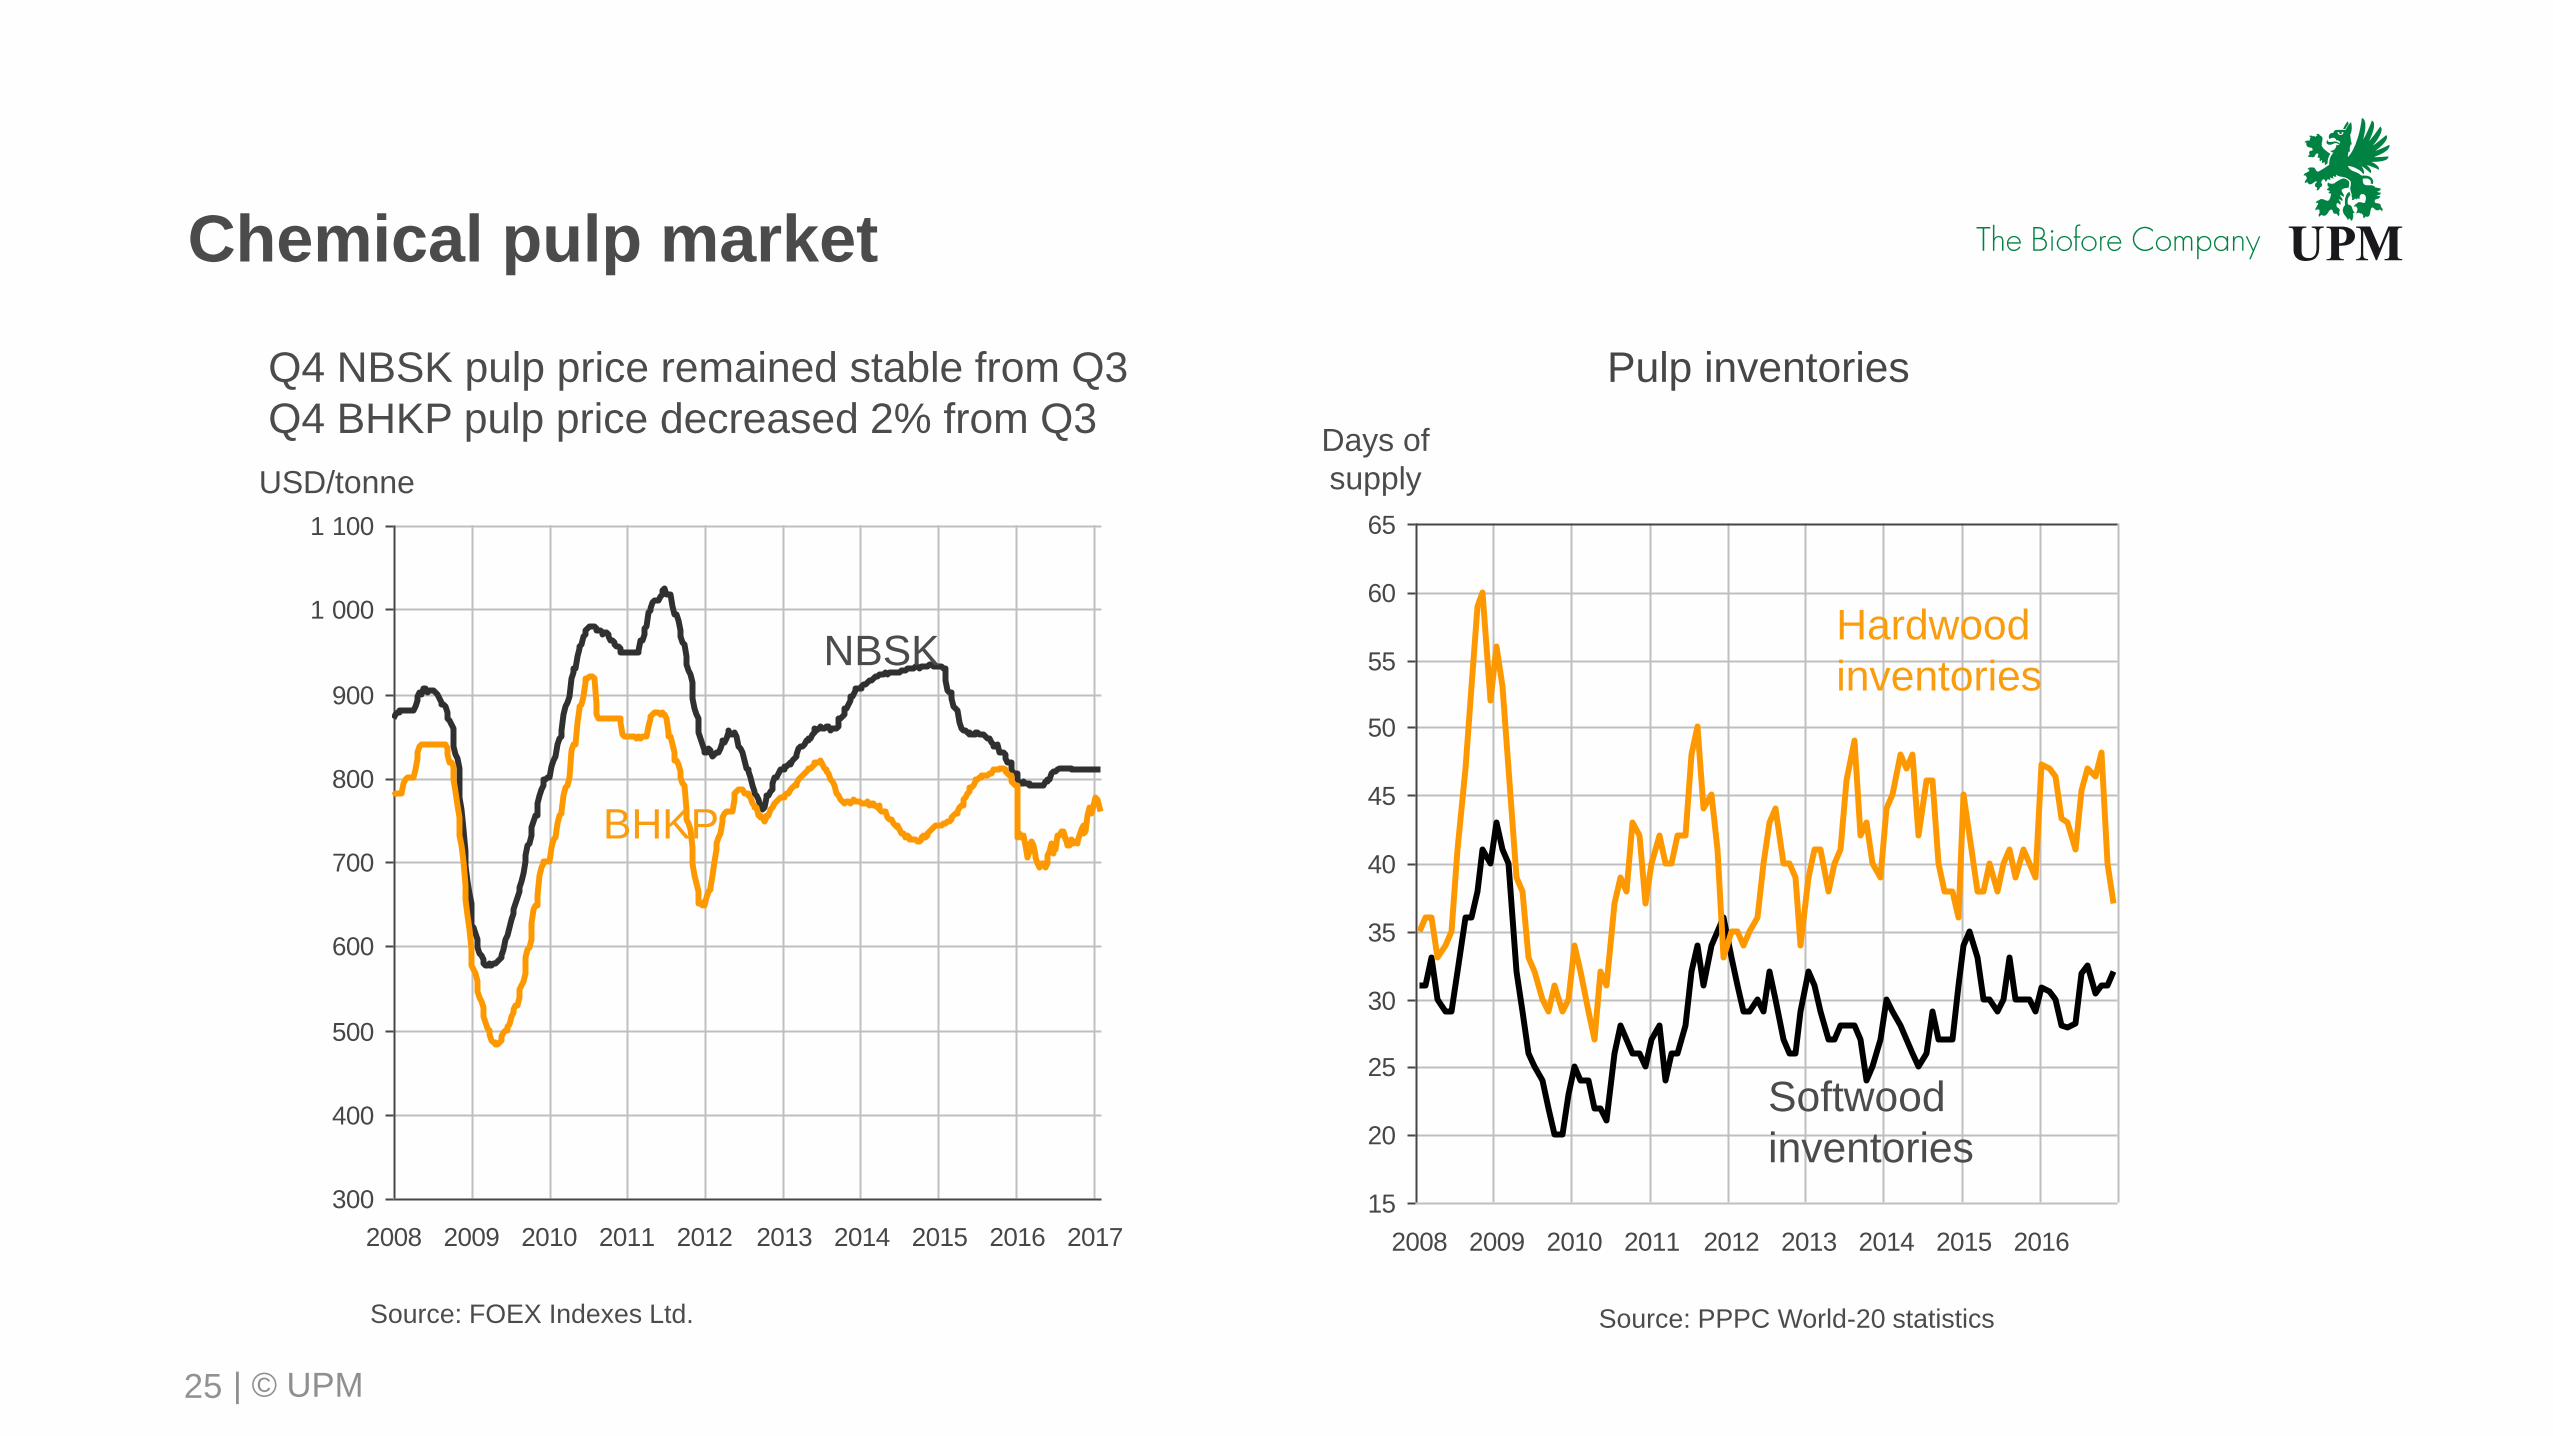
Chemical pulp market
25
Source: PPPC World-20 statistics
Pulp inventories
Days of
supply
300
400
500
600
700
800
900
1 000
1 100
2008 2009 2010 2011 2012 2013 2014 2015 2016 2017
USD/tonne
Q4 NBSK pulp price remained stable from Q3
Q4 BHKP pulp price decreased 2% from Q3
BHKP
NBSK
Source: FOEX Indexes Ltd.
15
20
25
30
35
40
45
50
55
60
65
2008 2009 2010 2011 2012 2013 2014 2015 2016
Hardwood
inventories
Softwood
inventories
| © UPM
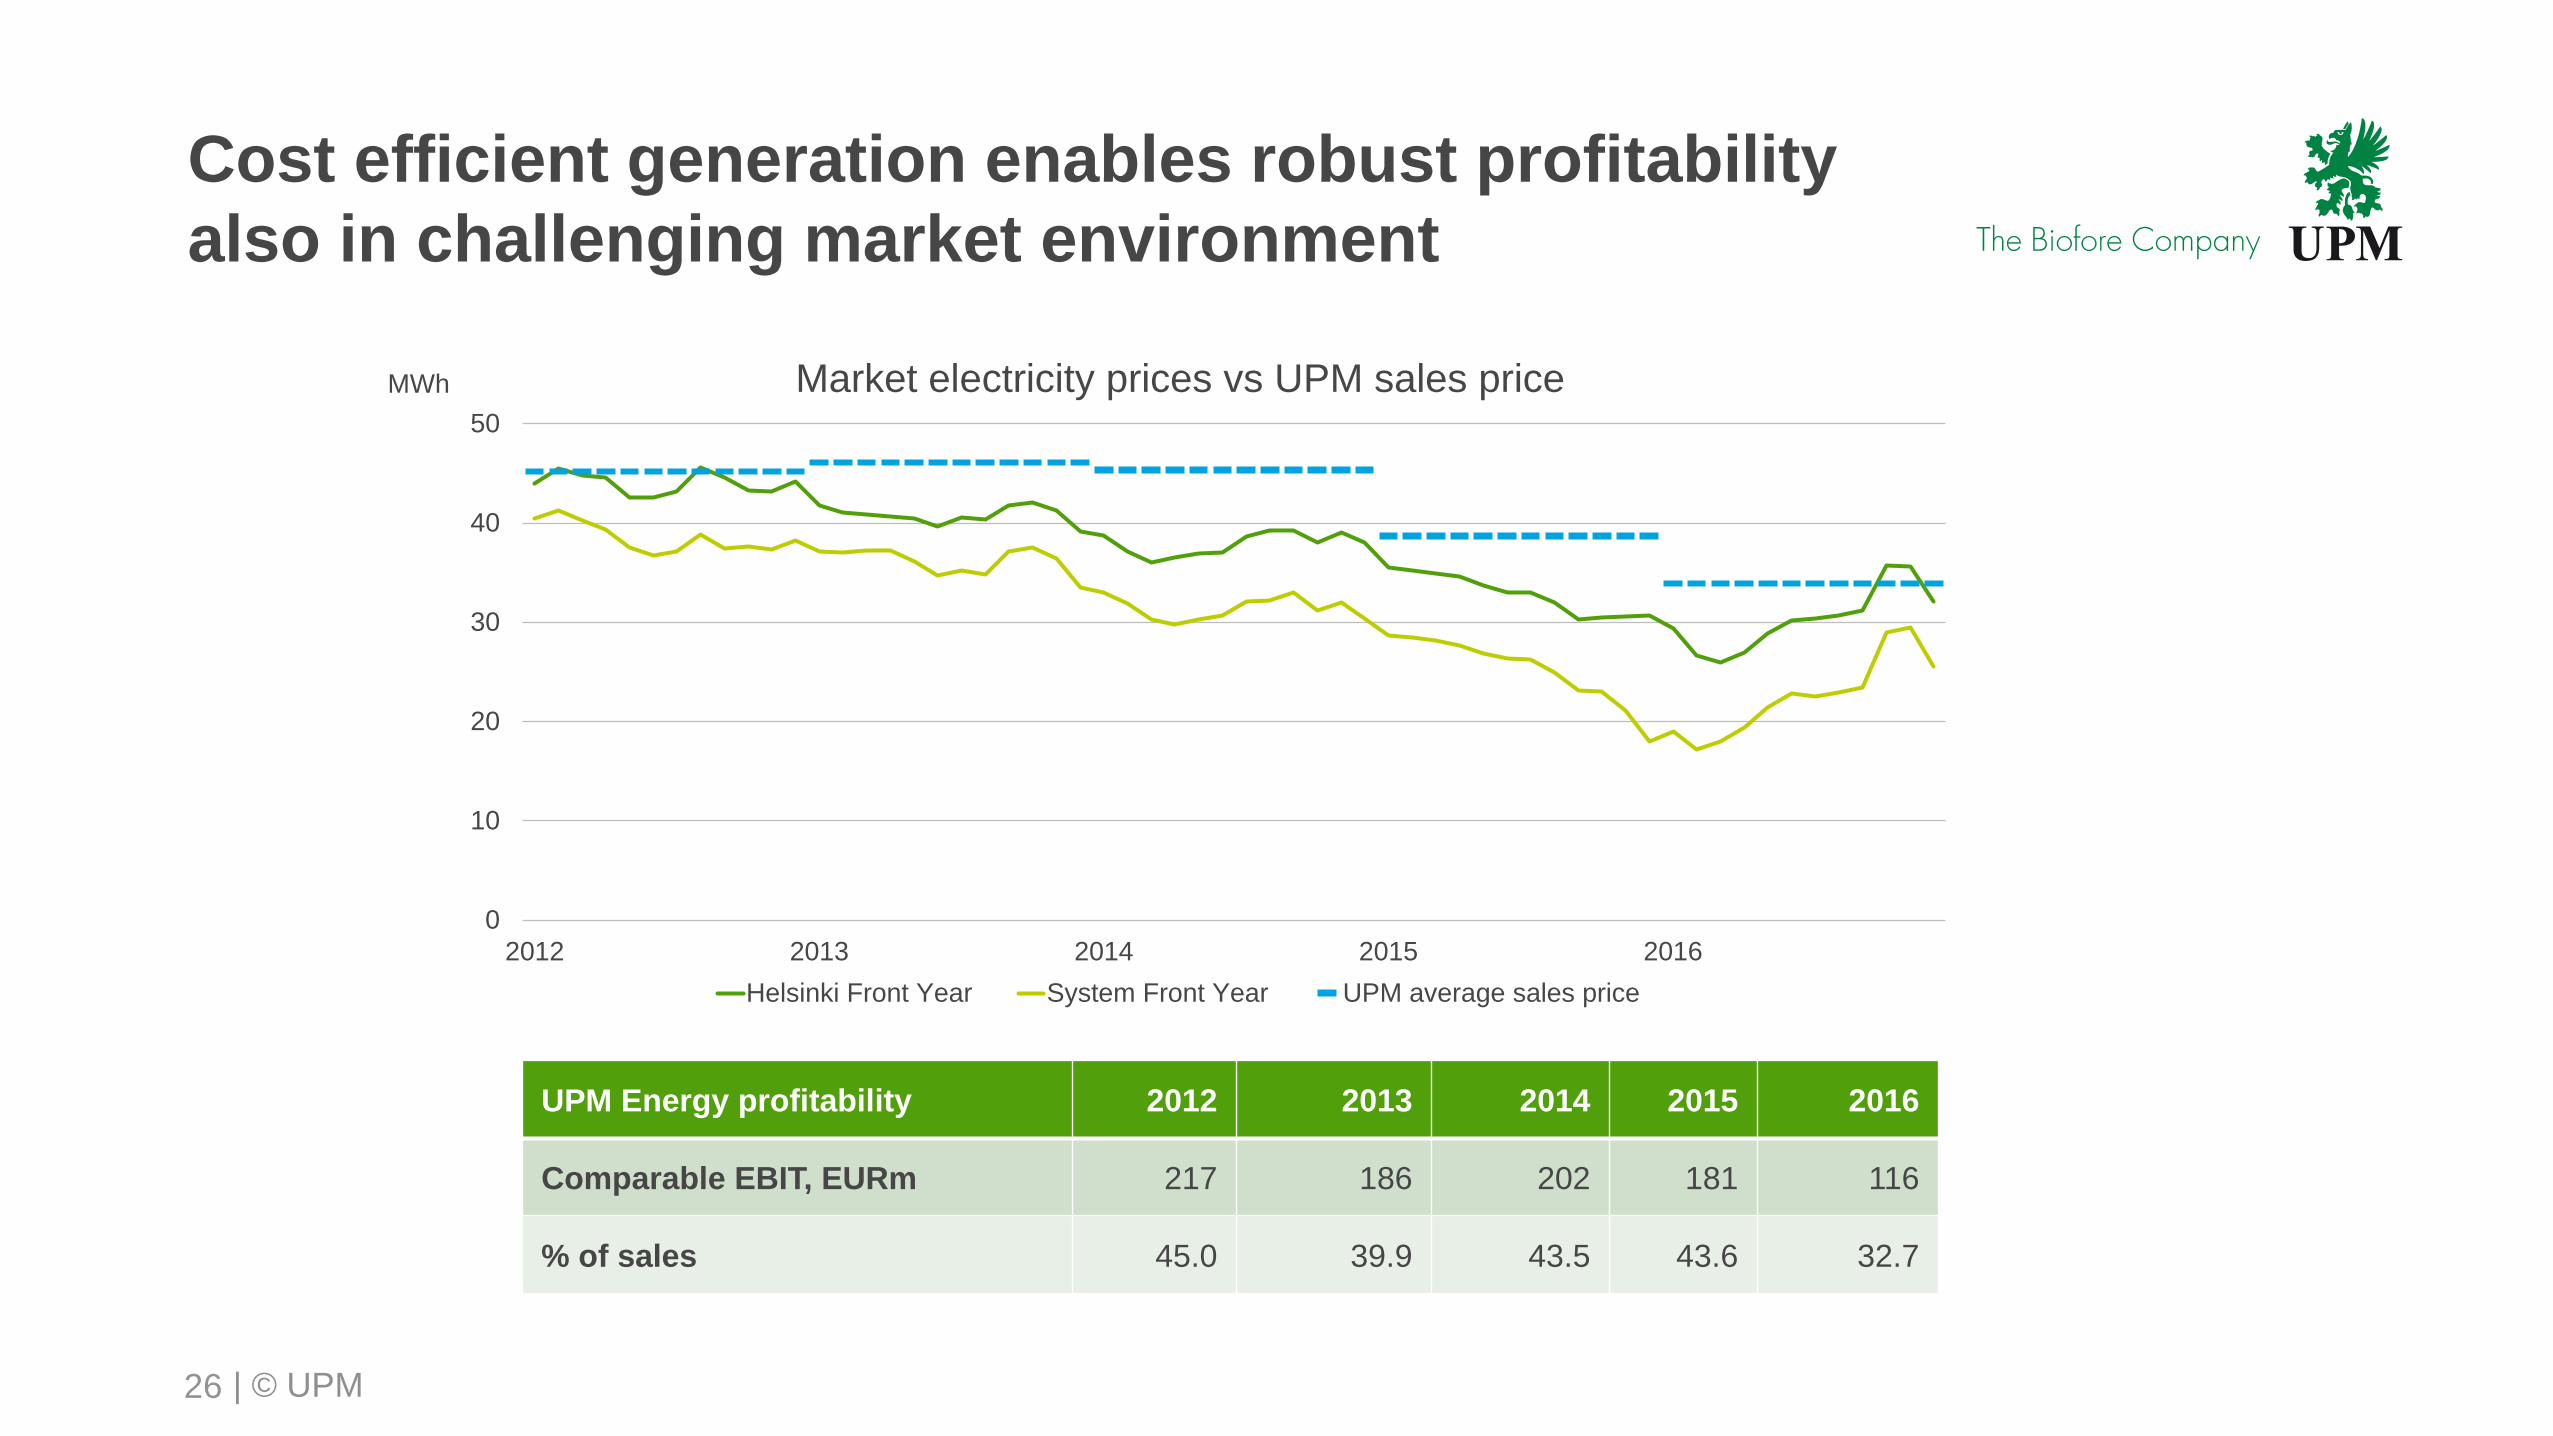
Cost efficient generation enables robust profitability
also in challenging market environment
26
0
10
20
30
40
50
2012 2013 2014 2015 2016
MWh Market electricity prices vs UPM sales price
Helsinki Front Year System Front Year UPM average sales price
UPM Energy profitability 2012 2013 2014 2015 2016
Comparable EBIT, EURm 217 186 202 181 116
% of sales 45.0 39.9 43.5 43.6 32.7
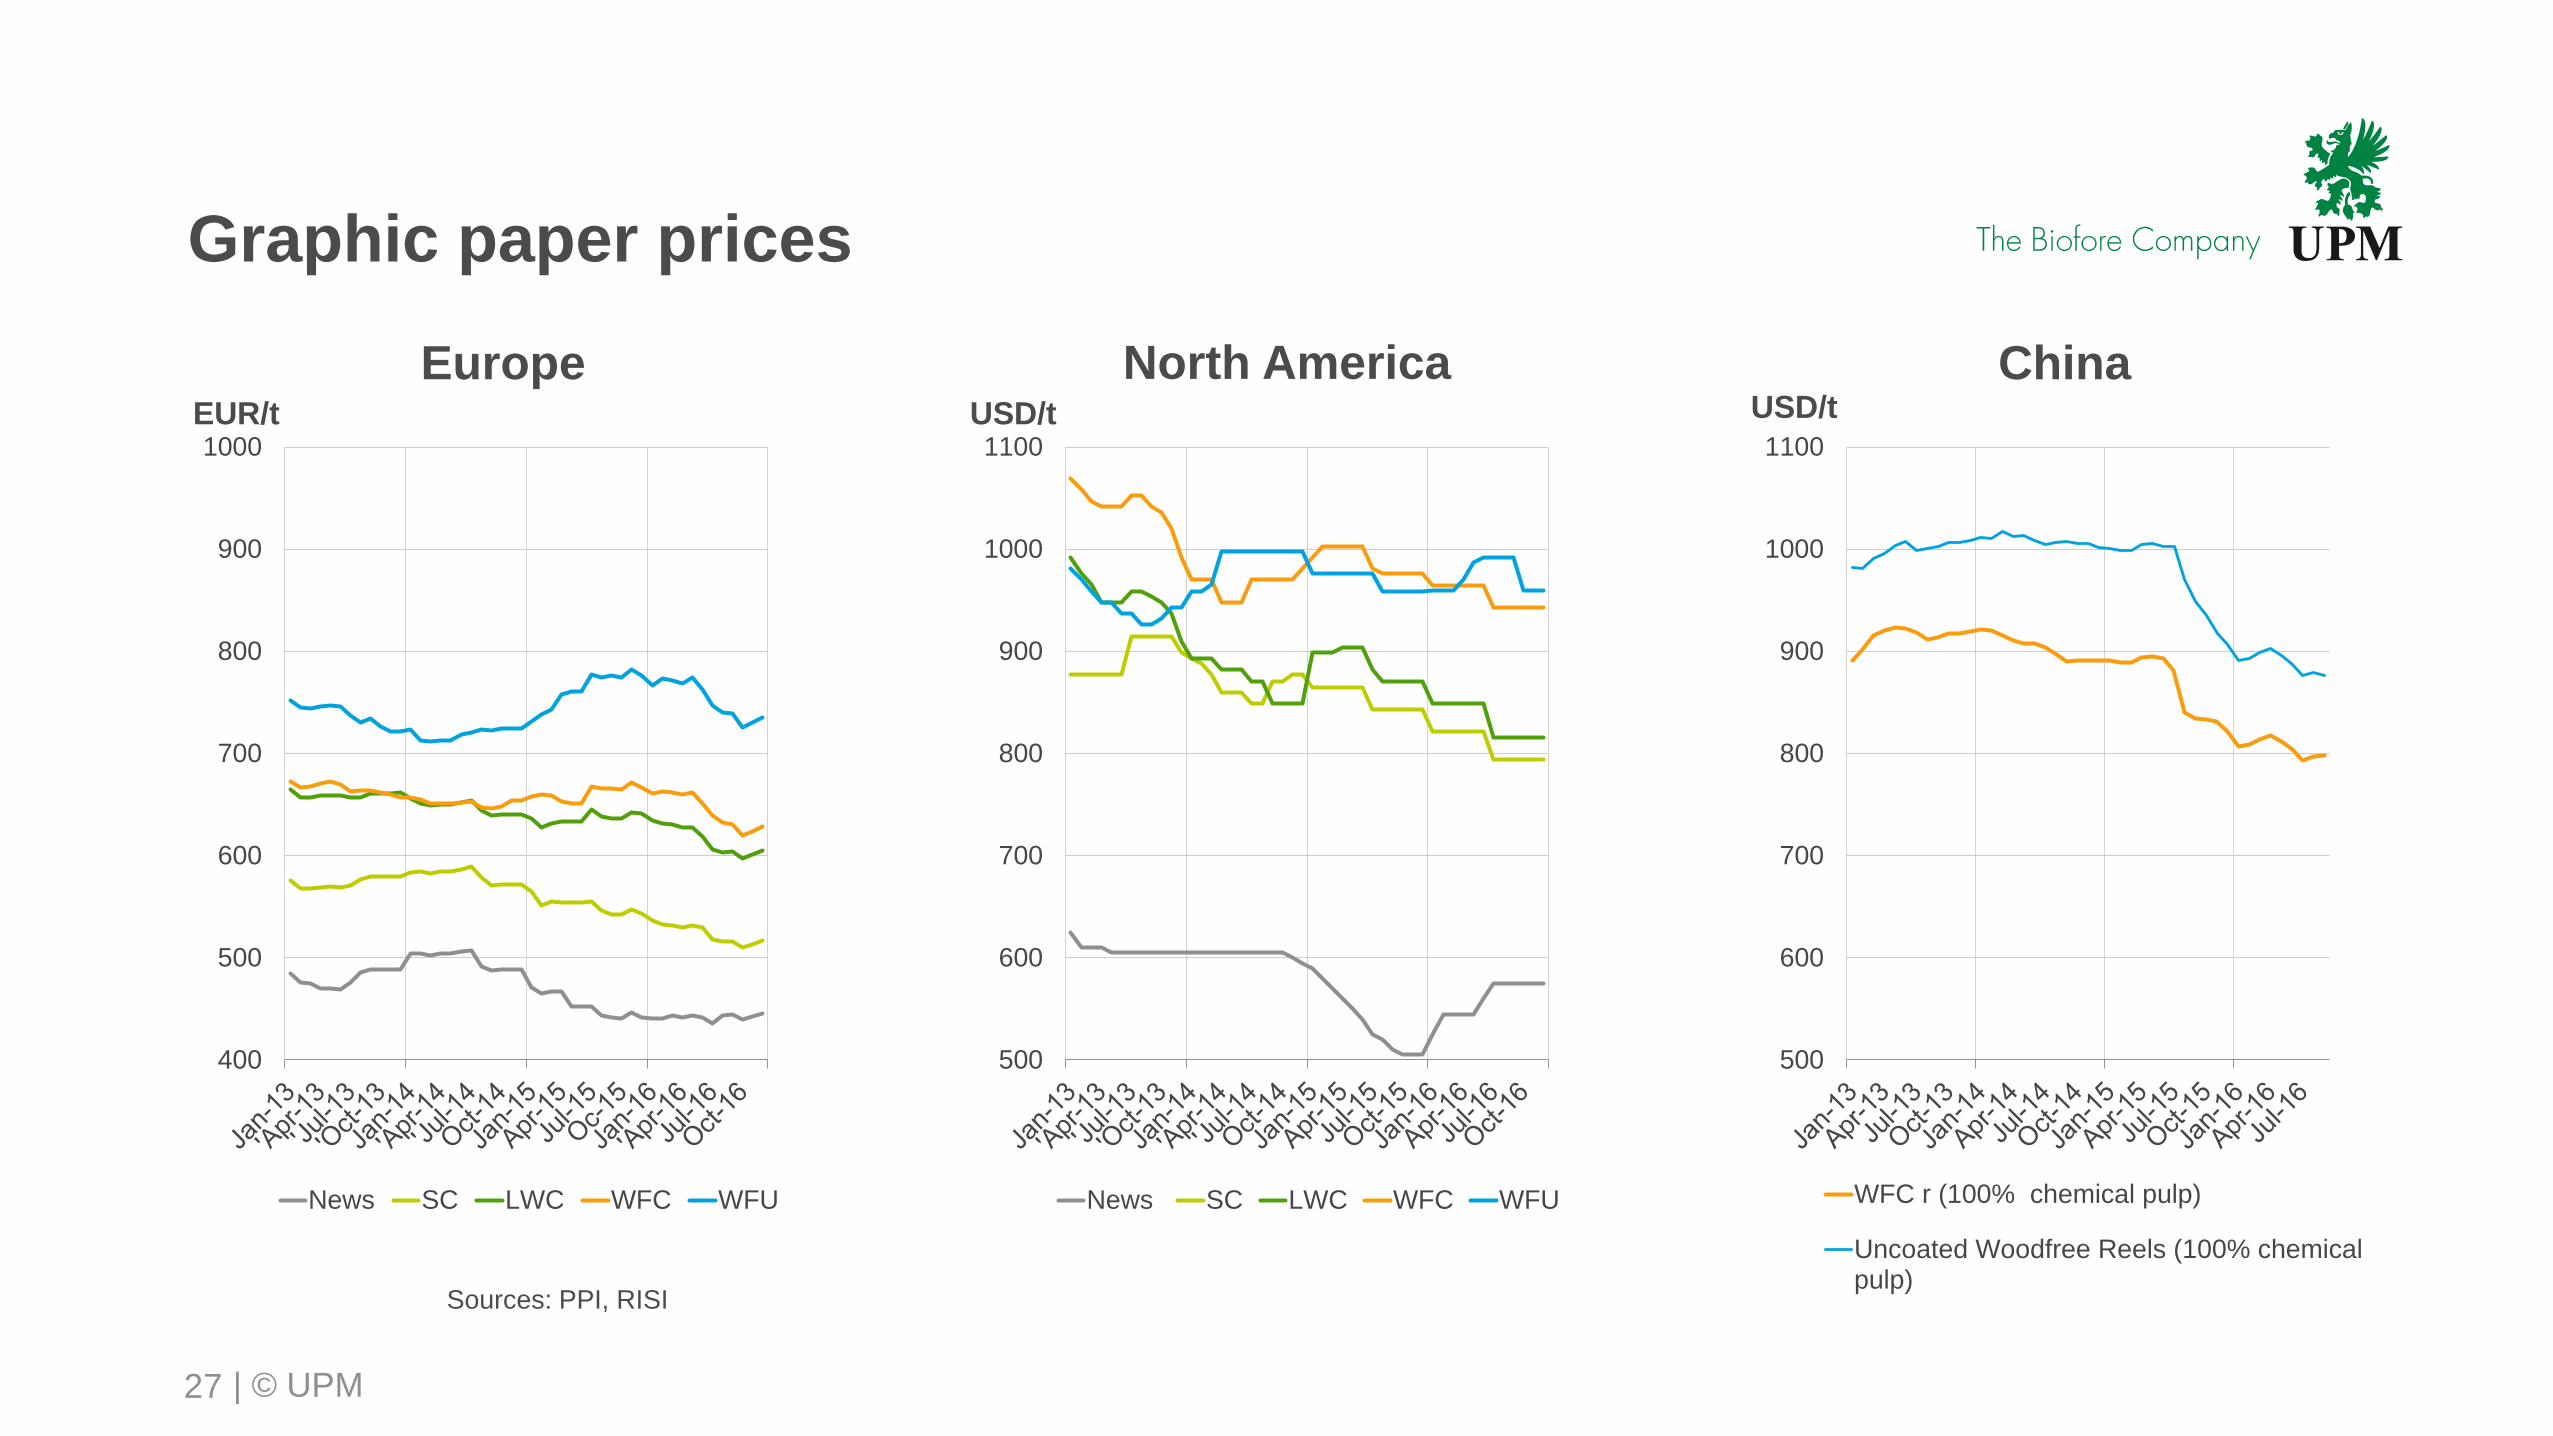
| © UPM27
EUR/t
EuropeUSD/t USD/t
ChinaNorth America
Sources: PPI, RISI
500
600
700
800
900
1000
1100
WFC r (100% chemical pulp)
Uncoated Woodfree Reels (100% chemicalpulp)
Graphic paper prices
400
500
600
700
800
900
1000
News SC LWC WFC WFU
500
600
700
800
900
1000
1100
News SC LWC WFC WFU
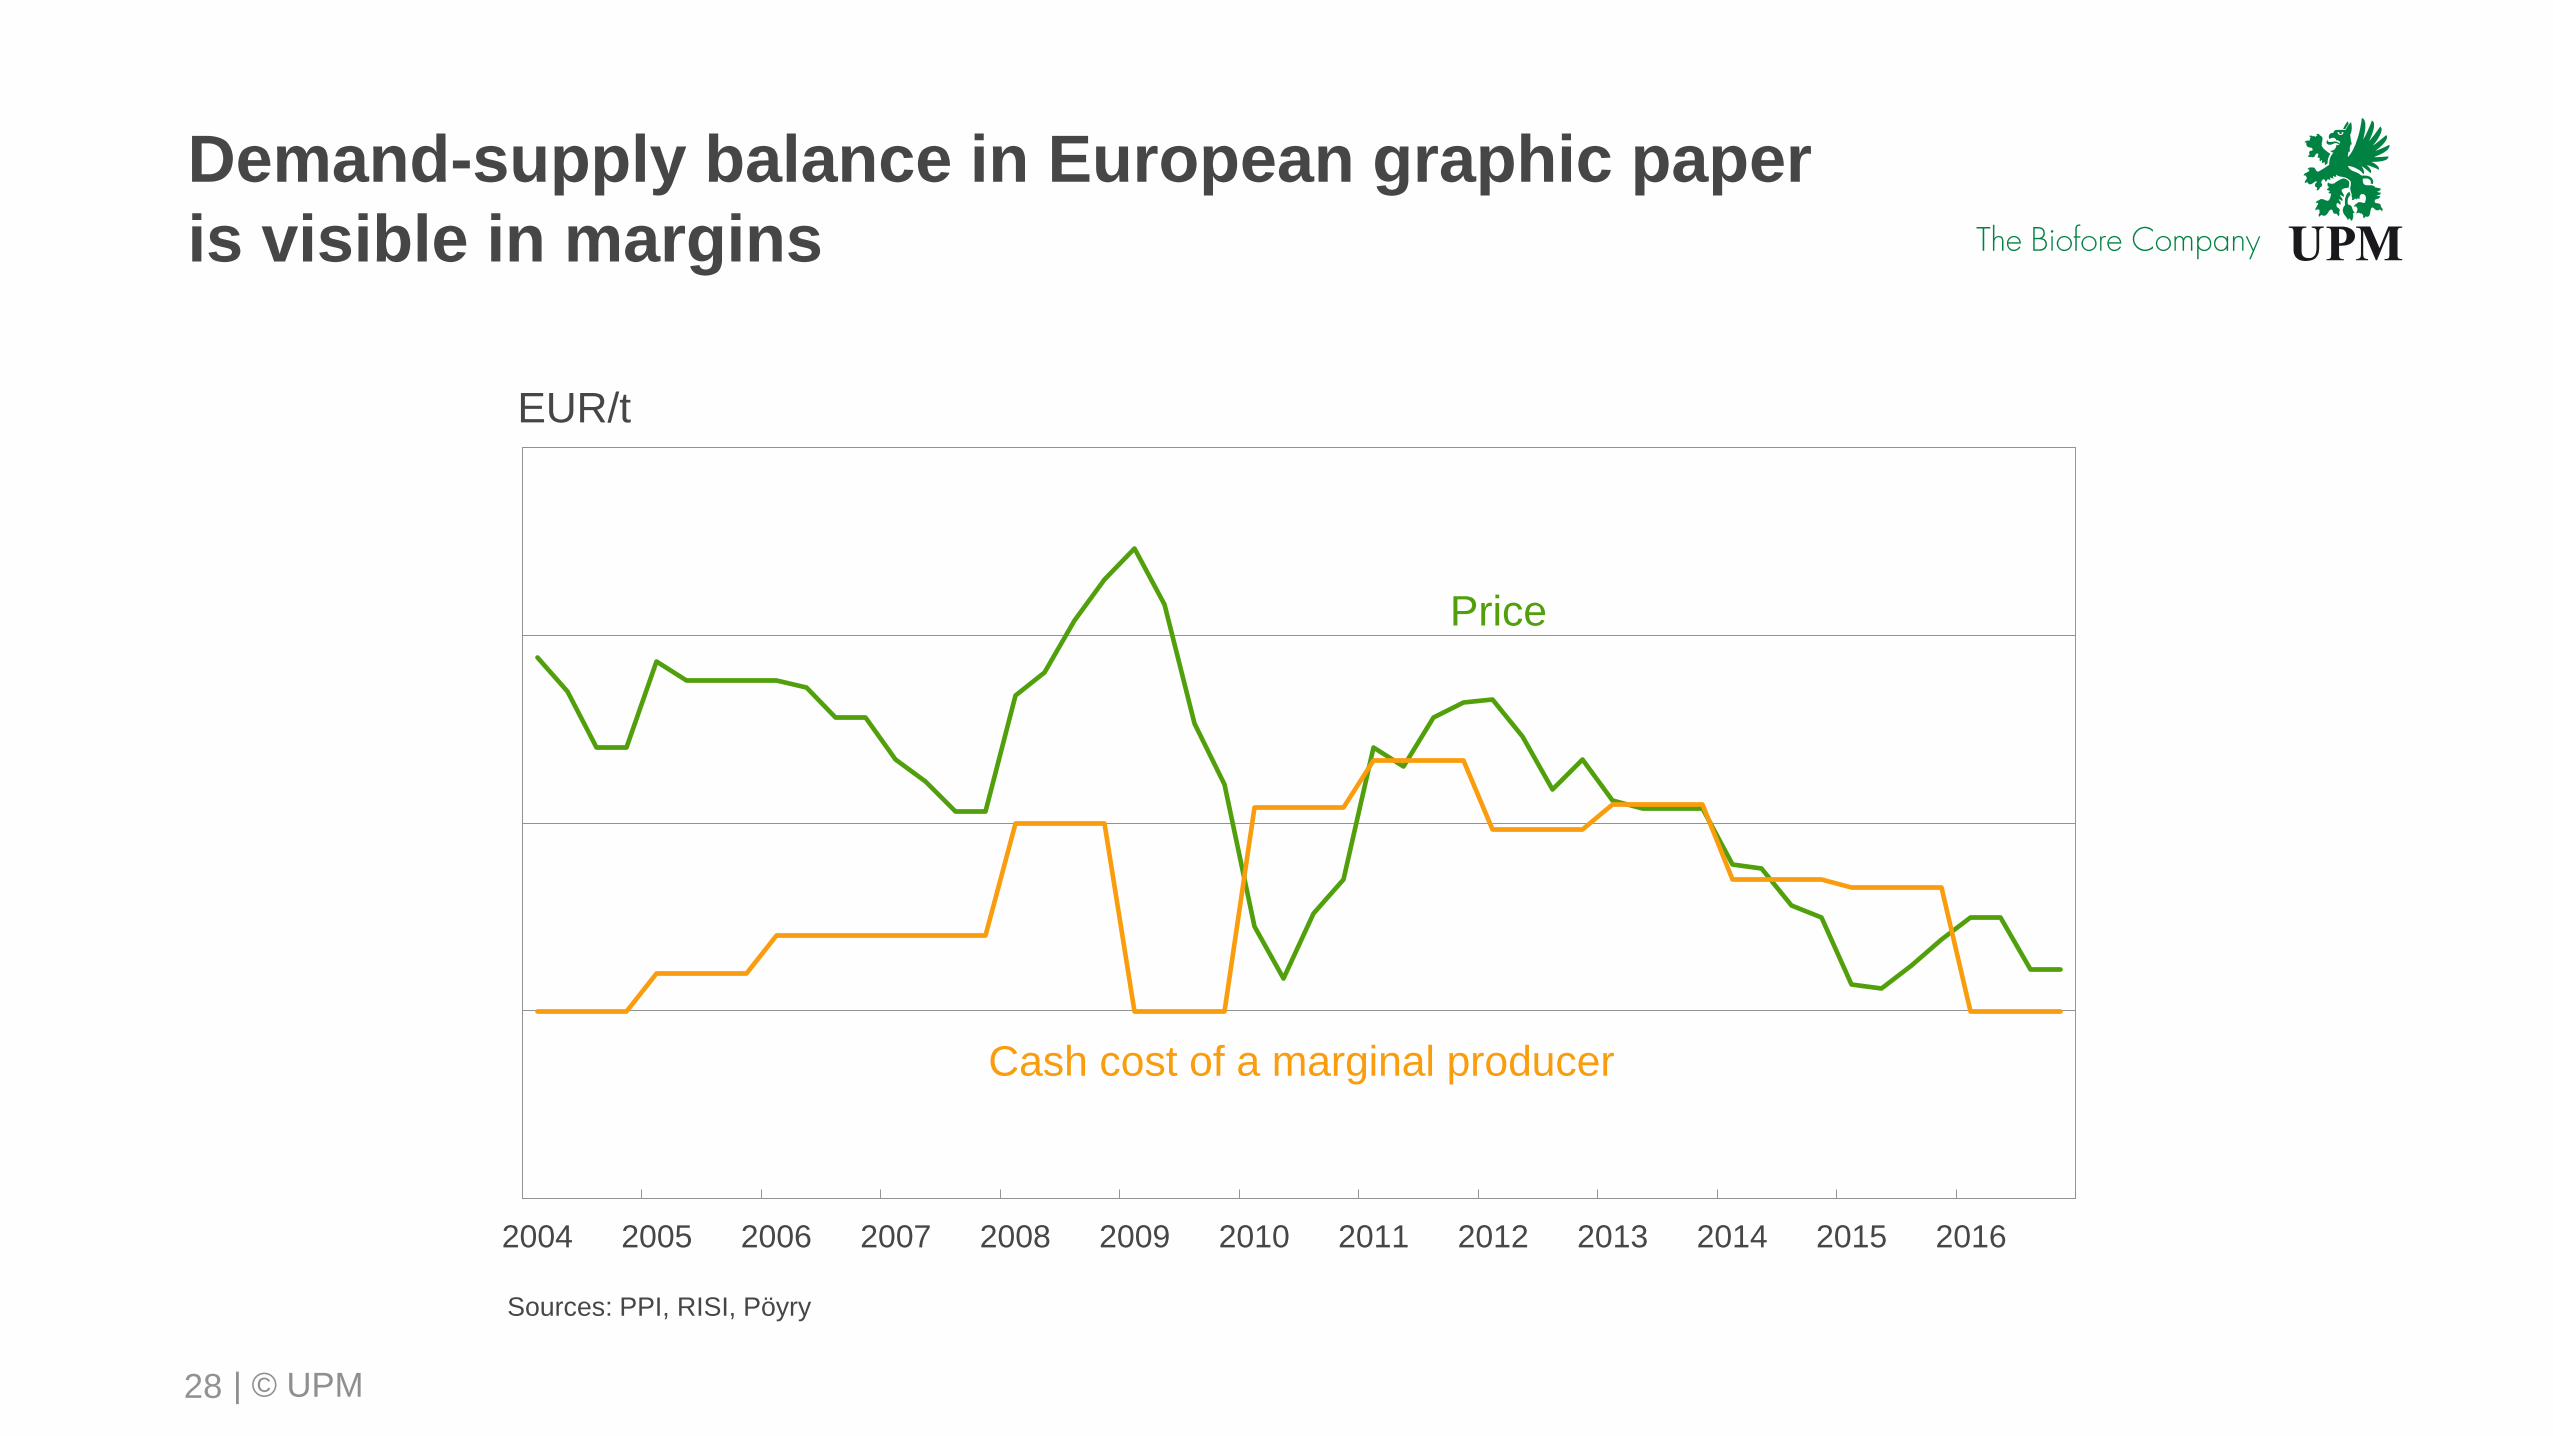
| © UPM
Demand-supply balance in European graphic paper
is visible in margins
28
2004 2005 2006 2007 2008 2009 2010 2011 2012 2013 2014 2015 2016
Cash cost of a marginal producer
Price
EUR/t
Sources: PPI, RISI, Pöyry