Embed Size (px)
Citation preview
Independent auditors’ report to the members of The British Land Company PLC 98Financial statements Consolidated income statement 104 Consolidated statement of comprehensive income 105 Consolidated balance sheet 106 Consolidated statement of cash flows 107 Consolidated statement of changes in equity 108Notes to the accounts 109Company balance sheet 148Company statement of changes in equity 149Supplementary disclosures 159
Financial statements and other information
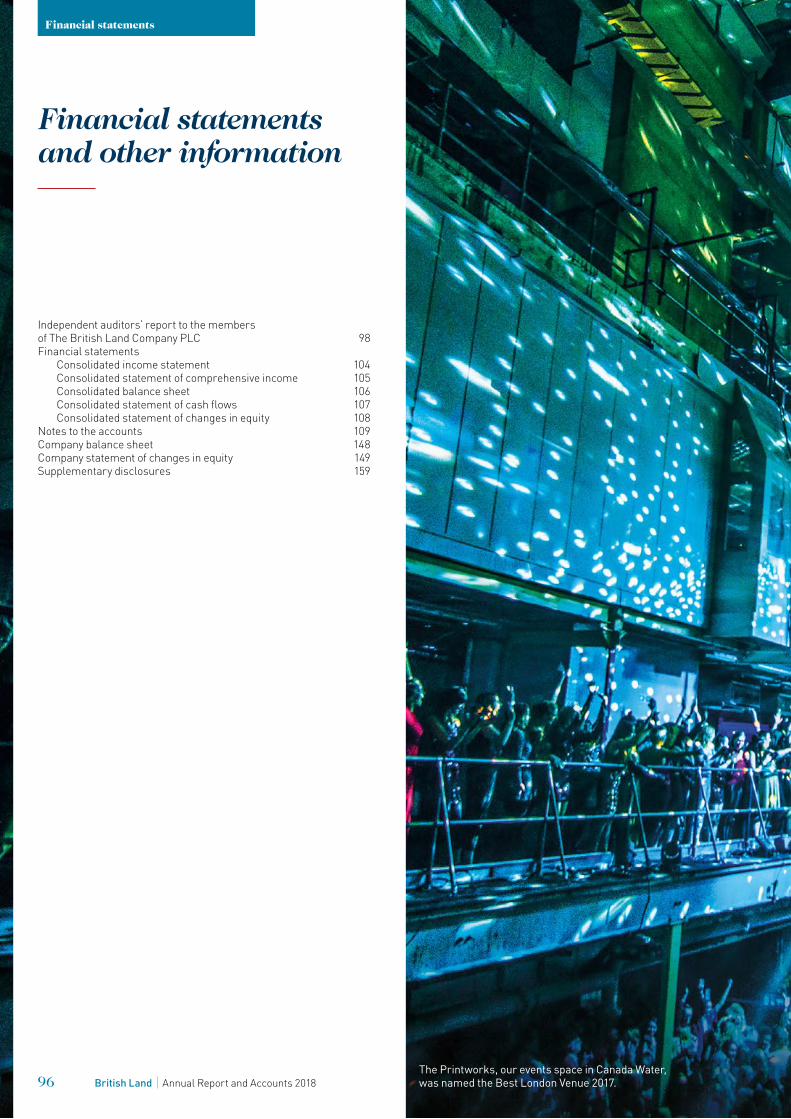
The Printworks, our events space in Canada Water, was named the Best London Venue 2017.
Financial statements
96 British Land Annual Report and Accounts 2018

97British Land Annual Report and Accounts 2018

Report on the audit of the financial statementsOpinionIn our opinion:
– The British Land Company PLC’s Group financial statements and Company financial statements (the “financial statements”) give a true and fair view of the state of the Group’s and of the Company’s affairs as at 31 March 2018 and of the Group’s profit and cash flows for the year then ended;
– the Group financial statements have been properly prepared in accordance with IFRSs as adopted by the European Union;
– the Company financial statements have been properly prepared in accordance with United Kingdom Generally Accepted Accounting Practice (United Kingdom Accounting Standards, comprising FRS 101 “Reduced Disclosure Framework”, and applicable law); and
– the financial statements have been prepared in accordance with the requirements of the Companies Act 2006 and, as regards the Group financial statements, Article 4 of the IAS Regulation.
We have audited the financial statements, included within the Annual Report and Accounts 2018 (the “Annual Report”), which comprise:
– the Consolidated Balance Sheet as at 31 March 2018; – the Consolidated Income Statement for the year ended
31 March 2018; – the Consolidated Statement of Comprehensive Income for the
year ended 31 March 2018; – the Consolidated Statement of Cash Flows for the year ended
31 March 2018; – the Consolidated Statement of Changes in Equity for the year
ended 31 March 2018; – the Company Balance Sheet as at 31 March 2018; – the Company Statement of Changes in Equity for the year ended
31 March 2018; and – the notes to the financial statements, which include a description
of the significant accounting policies.
Our opinion is consistent with our reporting to the Audit Committee.
Basis for opinionWe conducted our audit in accordance with International Standards on Auditing (UK) (“ISAs (UK)”) and applicable law. Our responsibilities under ISAs (UK) are further described in the Auditors’ responsibilities for the audit of the financial statements section of our report. We believe that the audit evidence we have obtained is sufficient and appropriate to provide a basis for our opinion.
IndependenceWe remained independent of the Group in accordance with the ethical requirements that are relevant to our audit of the financial statements in the UK, which includes the FRC’s Ethical Standard, as applicable to listed public interest entities, and we have fulfilled our other ethical responsibilities in accordance with these requirements.
To the best of our knowledge and belief, we declare that non-audit services prohibited by the FRC’s Ethical Standard were not provided to the Group or the Company.
Other than those disclosed in note 5 to the financial statements, we have provided no non-audit services to the Group or the Company in the period from 1 April 2017 to 31 March 2018.
Our audit approachOverview – Our 2018 audit was planned and executed having regard to the fact
that the Group’s operations were largely unchanged in nature from the previous year. Additionally, there have been no significant changes to the valuation methodology and accounting standards relevant to the Group. In light of this, our approach to the audit in terms of scoping and key audit matters was largely unchanged.
– We tailored the scope of our audit to ensure that we performed enough work to be able to give an opinion on the financial statements as a whole. The Group financial statements are prepared on a consolidated basis, and the audit team carries out an audit over the consolidated Group balances in support of the Group audit opinion. The following joint ventures are also audited to Group materiality: Broadgate and Meadowhall.
Materiality – Overall Group materiality: £131.8 million (2017: £135.0 million),
based on 1% of total assets. – Specific Group materiality, applied to underlying profit; £19.6 million
(2017: £19.4m) which represents 5% of underlying pre-tax profit – Overall company materiality: £287.0 million (2017: £283.0 million),
based on 1% of total assets.
Key audit matters – Valuation of investment and development properties. – Revenue recognition. – Accounting for transactions. – Taxation.
The scope of our auditAs part of designing our audit, we determined materiality and assessed the risks of material misstatement in the financial statements. In particular, we looked at where the directors made subjective judgements, for example in respect of significant accounting estimates that involved making assumptions and considering future events that are inherently uncertain.
We gained an understanding of the legal and regulatory framework applicable to the Group and the industry in which it operates, and considered the risk of acts by the Group which were contrary to applicable laws and regulations, including fraud. We designed audit procedures to respond to the risk, recognising that the risk of not detecting a material misstatement due to fraud is higher than the risk of not detecting one resulting from error, as fraud may involve deliberate concealment by, for example, forgery or intentional misrepresentations, or through collusion. We focused on laws and regulations that could give rise to a material misstatement in the financial statements, including, but not limited to, the Companies Act 2006 and the UK tax legislation as applicable to a REIT.
Our tests included, but were not limited to, review of the financial statement disclosures to underlying supporting documentation, and enquiries of management and review of minutes of those charged with governance.
There are inherent limitations in the audit procedures described above and the further removed non-compliance with laws and regulations is from the events and transactions reflected in the financial statements, the less likely we would become aware of it.
We did not identify any key audit matters relating to irregularities, including fraud. As in all of our audits we also addressed the risk of management override of internal controls, including testing journals and evaluating whether there was evidence of bias by the directors that represented a risk of material misstatement due to fraud.
Key audit mattersKey audit matters are those matters that, in the auditors’ professional judgement, were of most significance in the audit of the financial statements of the current period and include the most significant assessed risks of material misstatement (whether or not due to fraud) identified by the auditors, including those which had the greatest effect on: the overall audit strategy; the allocation of resources in the audit; and directing the efforts of the engagement team. These matters, and any comments we make on the results of our procedures thereon, were addressed in the context of our audit of the financial statements as a whole, and in forming our opinion thereon, and we do not provide a separate opinion on these matters. This is not a complete list of all risks identified by our audit.
Financial statements
98 British Land Annual Report and Accounts 2018
INDEPENDENT AUDITORS’ REPORT TO THE MEMBERS OF THE BRITISH LAND COMPANY PLC
Key audit matter How our audit addressed the key audit matter
Valuation of investment and development properties – GroupRefer to pages 69 to 73 (Report of the Audit Committee), pages 109 to 111 (Accounting policies) and pages 119 to 123 (Notes to the Accounts).
The Group’s investment property portfolio is split between office in Central London, retail across the UK, the assets at the Canada Water site in East London and other properties in Central London. The valuation in the Consolidated Balance Sheet is £9,997 million.
The valuation of the Group’s investment property portfolio is inherently subjective due to, among other factors, the individual nature of each property, its location and the expected future rentals for that particular property. For developments, factors include projected costs to complete and timing of practical completion.
The valuations were carried out by third party valuers, CB Richard Ellis, Jones Lang LaSalle, Cushman and Wakefield and Knight Frank (the “valuers”). The valuers were engaged by the Directors, and performed their work in accordance with the Royal Institute of Chartered Surveyors (“RICS”) Valuation – Professional Standards. The valuers used by the Group have considerable experience of the markets in which the Group operates.
In determining a property’s valuation the valuers take into account property-specific information such as the current tenancy agreements and rental income. They apply assumptions for yields and estimated market rent, which are influenced by prevailing market yields and comparable market transactions, to arrive at the final valuation. For developments, the residual appraisal method is used, by estimating the fair value of the completed project using a capitalisation method less estimated costs to completion and a risk premium.
The significance of the estimates and judgements involved, coupled with the fact that only a small percentage difference in individual property valuations, when aggregated, could result in a material misstatement, warrants specific audit focus in this area.
There were also certain specific factors affecting the valuations in the year: Properties under development, completed developments that are now valued as standing investment properties and standing investment properties that have been reclassified to development properties continue to be a key audit matter.
We read the valuation reports for all the properties and confirmed that the valuation approach for each was in accordance with RICS standards and suitable for use in determining the carrying value for the purpose of the financial statements.
We assessed the valuers’ qualifications and expertise and read their terms of engagement with the Group to determine whether there were any matters that might have affected their objectivity or may have imposed scope limitations upon their work. We also considered fee arrangements between the valuers and the Group and other engagements which might exist between the Group and the valuers. We found no evidence to suggest that the objectivity of the valuers in their performance of the valuations was compromised.
We obtained details of every property held by the Group and set an expected range for yield and capital value movement, determined by reference to published benchmarks and using our experience and knowledge of the market. We compared the investment yields used by the valuers with the range of expected yields and the year on year capital movement to our expected range. We also considered the reasonableness of other assumptions that are not so readily comparable with published benchmarks, such as Estimated Rental Value.
We attended meetings with management and the valuers, at which the valuations and the key assumptions therein were discussed. Our work covered the valuation of every property in the Group, but the discussions with management and the valuers focused on the largest properties in the portfolio, properties under development or where the valuation basis has changed in the year, the Canada Water site and those where the yields used and / or year on year capital value movement suggested a possible outlier versus externally published market data for the relevant sector.
Where assumptions were outside the expected range or otherwise appeared unusual, and/or valuations showed unexpected movements, we undertook further investigations and, when necessary, held further discussions with the valuers and obtained evidence to support explanations received. The valuation commentaries provided by the valuers and supporting evidence, enabled us to consider the property specific factors that may have had an impact on value, including recent comparable transactions where appropriate.
We saw evidence that alternative assumptions had been considered and evaluated by management and the valuers, before determining the final valuation. We concluded that the assumptions used in the valuations were supportable in light of available and comparable market evidence.
We performed testing on the standing data in the Group’s information systems concerning the valuation process. We carried out procedures, on a sample basis, to satisfy ourselves of the accuracy of the property information supplied to the valuers by management. For developments, capitalised expenditure was tested on a sample basis to invoices, and budgeted costs to complete compared with supporting evidence (for example construction contracts).
It was evident from our interaction with management and the valuers, and from our review of the valuation reports, that close attention had been paid to each property’s individual characteristics at a granular, tenant by tenant level, as well as considering the overall quality, geographic location and desirability of the asset as a whole. No issues were identified in our testing.
99British Land Annual Report and Accounts 2018
Key audit matter How our audit addressed the key audit matter
Revenue recognition – GroupRefer to pages 69 to 73 (Report of the Audit Committee), page 109 to 111 (Accounting policies) and page 113 (Notes to the Accounts).
Revenue for the Group consists primarily of rental income. Rental income is based on tenancy agreements where there is a standard process in place for recording revenue, which is system generated. There are certain transactions within revenue that warrant additional audit focus because of an increased inherent risk of error due to their non-standard nature.
These include spreading of tenant incentives and guaranteed rent increases – these balances require adjustments made to rental income to ensure revenue is recorded on a straight line basis over the course of the lease.
We carried out tests of controls over the cash and accounts receivable processes and the related IT systems to obtain evidence that postings to these accounts were reliable. For rental income balances, we then used data-enabled audit techniques to identify all standard revenue journals posted using these systems and processes.
The remaining journals related to non-standard transactions. These included reclassifications within revenue, accrued income, and bad debt provisions. For each category of non-standard revenue summarised above, we understood the nature and assessed the reasonableness of journals being generated, and performed substantive testing over a sample of these items. There were no exceptions arising from our testing over non-standard revenue transactions.
For balances not included within rental income, such as service charge income, we performed substantive testing on a sample basis. No issues were identified in our testing.
Accounting for transactions – Group and Company Refer to pages 69 to 73 (Report of the Audit Committee), pages 109 to 111 (Accounting policies) and pages 112 to 147 (Notes).
There have been a number of transactions during the year. These warranted additional audit focus due to the magnitude of the transactions and the potential for complex contractual terms that introduce judgement into how they were accounted for. Key transactions subject to additional audit focus for the Group were:
– Investment property acquisitions of £250 million, including the acquisition of The Woolwich Estate (“Woolwich”) for £103 million
– Investment property disposals of £185 million – Share buyback of £300 million – Issue of 2.375% £300m unsecured bond – Partial close out of interest rate derivative 103 (‘IRD 103’) for
£14.1 million cash settlement – An amount of £15m (the Group’s share) received from RBS in
relation to the surrender of their lease at 135 Bishopsgate, within the Broadgate joint venture
Key transactions subject to additional audit focus for the Company were:
– Share buyback of £300 million
For each transaction, we understood the nature of the transaction and assessed the accounting treatment in relation to the Group’s accounting policies and relevant IFRSs.
For acquisitions and disposals, we obtained and read the key supporting documentation such as Sale and Purchase Agreements and completion statements. Consideration received or paid was agreed to bank statements.
For the sites acquired at Woolwich which have been accounted for as an asset acquisition, we assessed the accounting treatment in relation to IFRS 3 Business combinations and IAS 40, acquisition of investment property. We read the sale and purchase agreements and agreed that the purchase met the criteria to be recognised as an asset acquisition. We audited the acquisition accounting and the subsequent re-measurement to fair value at the balance sheet date. We agreed the proceeds paid to bank statements and checked the transfer of legal title of the assets passed to British Land. No issues were found as a result of these procedures.
For the share buyback, we read the broker contracts and audited the accounting for the buyback in accordance with IAS 32. For shares repurchased by the Group, we tested the subsequent cancellation of the shares acquired and checked the associated costs of the transaction were correctly recognised within reserves (retained earnings). From our audit procedures performed, no exceptions were noted in the accounting for the share buyback programme.
A 2.375% Sterling Unsecured Bond, maturing September 2029, was issued in September 2017. The new bond is held at amortised cost, with a book value of £297.6 million. We examined the bond issue documents and the accounting treatment applied in line with IAS 39 and are satisfied that the treatment applied is appropriate.
The group partially closed a long standing cash flow hedge derivative during the year, breaking the hedge relationship. This resulted in the recycling of £115.3m from the hedging and translation reserve and £14.1m of closeout costs being recognised in the income statement. We tested the accounting treatment applied in line with IAS 39 and have no issues to report.
For the £15m received from RBS, we read the surrender agreements that detail the payment. We agreed receipt of the amount to bank statements. We concur with the treatment adopted.
Financial statements
100 British Land Annual Report and Accounts 2018
INDEPENDENT AUDITORS’ REPORT TO THE MEMBERS OF THE BRITISH LAND COMPANY PLC CONTINUED
How we tailored the audit scopeWe tailored the scope of our audit to ensure that we performed enough work to be able to give an opinion on the financial statements as a whole, taking into account the structure of the Group and the Company, the accounting processes and controls, and the industry in which they operate.
In establishing the overall approach to our audit, we assessed the risk of material misstatement, taking into account the nature, likelihood and potential magnitude of any misstatement. Following this assessment, we applied professional judgment to determine the extent of testing required over each balance in the financial statements.
The Group and Company financial statements are produced using a single consolidation system that has a direct interface with the general ledger. The Group audit team performed all audit procedures over the consolidation for the purposes of the Group audit, which included testing over the general ledger system and its interface with the consolidation system. The Group also has investments in two joint ventures (Broadgate and Meadowhall), which were subject to audits of their complete financial information by the Group audit team.
This work gave us sufficient appropriate audit evidence for our opinion on the Group financial statements as a whole.
MaterialityThe scope of our audit was influenced by our application of materiality. We set certain quantitative thresholds for materiality. These, together with qualitative considerations, helped us to determine the scope of our audit and the nature, timing and extent of our audit procedures on the individual financial statement line items and disclosures and in evaluating the effect of misstatements, both individually and in aggregate on the financial statements as a whole.
Based on our professional judgement, we determined materiality for the financial statements as a whole as follows:
Group financial statements Company financial statements
Overall materiality £131.8 million (2017: £135.0 million). £287.0 million (2017: £283.0 million).How we determined it 1% of total assets. 1% of total assetsRationale for benchmark applied
A key determinant of the Group’s value is direct property investments. Due to this, the key area of focus in the audit is the valuation of investment properties. On this basis, and consistent with the prior year, we set an overall Group materiality level based on total assets.
The parent company’s main activity is the holding of investments in subsidiaries. Given this, and consistent with the prior year, we set an overall parent company materiality level based on total assets. For purposes of the Group audit, we capped the overall materiality for the company to be 90% of the Group overall materiality.
In addition, for the Group we set a specific materiality level of £19.6m (2017: £19.4m) for items within underlying pre-tax profit. This equates to 5% of profit before tax adjusted for capital and other items. In arriving at this judgement we had regard to the fact that the underlying pre-tax profit is a secondary financial indicator of the Group (Refer to Note 2 of the financial statements page 112 where the term is defined in full).
For the Group and Company, we agreed with the Audit Committee that we would report to them misstatements identified during our audit of underlying pre-tax items above £1m (2017: £1m) as well as misstatements below that amount that, in our view, warranted reporting for qualitative reasons. We agreed with the Audit Committee that we would report to them, any other misstatements identified during our audit above £6.5m (2017: £6.7m) as well as misstatements below that amount that, in our view, warranted reporting for qualitative reasons.
Key audit matter How our audit addressed the key audit matter
Taxation Refer to pages 69 to 73 (Report of the Audit Committee), page 111 (Accounting policies) and pages 115 and 130 (Notes to the Accounts).
The Group’s status as a REIT underpins its business model and shareholder returns. For this reason, it warrants special audit focus. The obligations of the REIT regime include requirements to comply with balance of business, dividend and income cover tests. The Broadgate joint venture is also structured as a REIT and as such, REIT compliance is also of relevance for this joint venture in addition to the overall Group.
Tax provisions are in place to account for the risk of challenge of certain of the Group’s tax provisions. Given the subjective nature of these provisions, additional audit focus was placed on tax provisions.
We re-performed the Group’s annual REIT compliance tests, as well as those tests for the Broadgate REIT. Based on our work performed, we agreed with management’s assessment that all REIT compliance tests had been met to ensure that the Group and Broadgate maintain their REIT status.
We evaluated the tax provisions and movements made within the year. We obtained sufficient supporting evidence for provisions released during the year. We discussed provisions raised and increased during the year with management and obtained evidence to support the levels of provisions recorded. We read relevant correspondence between the Group and Her Majesty’s Revenue and Customs to obtain evidence over the completeness of provisions. Based on our work performed, we are satisfied that the assumptions and judgements used by the Group are reasonable.
101British Land Annual Report and Accounts 2018
Going concern In accordance with ISAs (UK) we report as follows:
Reporting obligation Outcome
We are required to report if we have anything material to add or draw attention to in respect of the directors’ statement in the financial statements about whether the directors considered it appropriate to adopt the going concern basis of accounting in preparing the financial statements and the directors’ identification of any material uncertainties to the Group’s and the Company’s ability to continue as a going concern over a period of at least twelve months from the date of approval of the financial statements.
We have nothing material to add or to draw attention to. As not all future events or conditions can be predicted, this statement is not a guarantee as to the Group’s and Company’s ability to continue as a going concern.
We are required to report if the directors’ statement relating to Going Concern in accordance with Listing Rule 9.8.6R(3) is materially inconsistent with our knowledge obtained in the audit.
We have nothing to report.
Corporate Governance StatementIn our opinion, based on the work undertaken in the course of the audit, the information given in the Corporate Governance Statement (on page 67 in the Governance Review section) about internal controls and risk management systems in relation to financial reporting processes and about share capital structures in compliance with rules 7.2.5 and 7.2.6 of the Disclosure Guidance and Transparency Rules sourcebook of the FCA (“DTR”) is consistent with the financial statements and has been prepared in accordance with applicable legal requirements. (CA06)
In light of the knowledge and understanding of the Group and Company and their environment obtained in the course of the audit, we did not identify any material misstatements in this information. (CA06)
In our opinion, based on the work undertaken in the course of the audit, the information given in the Corporate Governance Statement (on pages 63 and 64 in the Governance Review section) with respect to the company’s corporate governance code and practices and about its administrative, management and supervisory bodies and their committees complies with rules 7.2.2, 7.2.3 and 7.2.7 of the DTR. (CA06)
We have nothing to report arising from our responsibility to report if a corporate governance statement has not been prepared by the company. (CA06)
The directors’ assessment of the prospects of the Group and of the principal risks that would threaten the solvency or liquidity of the GroupWe have nothing material to add or draw attention to regarding:
– The directors’ confirmation on page 50 of the Annual Report that they have carried out a robust assessment of the principal risks facing the Group, including those that would threaten its business model, future performance, solvency or liquidity.
– The disclosures in the Annual Report that describe those risks and explain how they are being managed or mitigated.
– The directors’ explanation on page 51 of the Annual Report as to how they have assessed the prospects of the Group, over what period they have done so and why they consider that period to be appropriate, and their statement as to whether they have a reasonable expectation that the Group will be able to continue in operation and meet its liabilities as they fall due over the period of their assessment, including any related disclosures drawing attention to any necessary qualifications or assumptions.
Reporting on other information The other information comprises all of the information in the Annual Report other than the financial statements and our auditors’ report thereon. The directors are responsible for the other information. Our opinion on the financial statements does not cover the other information and, accordingly, we do not express an audit opinion or, except to the extent otherwise explicitly stated in this report, any form of assurance thereon.
In connection with our audit of the financial statements, our responsibility is to read the other information and, in doing so, consider whether the other information is materially inconsistent with the financial statements or our knowledge obtained in the audit, or otherwise appears to be materially misstated. If we identify an apparent material inconsistency or material misstatement, we are required to perform procedures to conclude whether there is a material misstatement of the financial statements or a material misstatement of the other information. If, based on the work we have performed, we conclude that there is a material misstatement of this other information, we are required to report that fact. We have nothing to report based on these responsibilities.
With respect to the Strategic Report, Directors’ Report and Additional Disclosures and Corporate Governance Statement, we also considered whether the disclosures required by the UK Companies Act 2006 have been included.
Based on the responsibilities described above and our work undertaken in the course of the audit, the Companies Act 2006 (CA06), ISAs (UK) and the Listing Rules of the Financial Conduct Authority (FCA) require us also to report certain opinions and matters as described below (required by ISAs (UK) unless otherwise stated).
Strategic Report and Directors’ Report and Additional DisclosuresIn our opinion, based on the work undertaken in the course of the audit, the information given in the Strategic Report and Directors’ Report and Additional Disclosures for the year ended 31 March 2018 is consistent with the financial statements and has been prepared in accordance with applicable legal requirements. (CA06)
In light of the knowledge and understanding of the Group and Company and their environment obtained in the course of the audit, we did not identify any material misstatements in the Strategic Report and Directors’ Report and Additional Disclosures. (CA06)
Financial statements
102 British Land Annual Report and Accounts 2018
INDEPENDENT AUDITORS’ REPORT TO THE MEMBERS OF THE BRITISH LAND COMPANY PLC CONTINUED
We have nothing to report having performed a review of the directors’ statement that they have carried out a robust assessment of the principal risks facing the Group and statement in relation to the longer-term viability of the Group. Our review was substantially less in scope than an audit and only consisted of making inquiries and considering the directors’ process supporting their statements; checking that the statements are in alignment with the relevant provisions of the UK Corporate Governance Code (the “Code”); and considering whether the statements are consistent with the knowledge and understanding of the Group and Company and their environment obtained in the course of the audit. (Listing Rules)
Other Code ProvisionsWe have nothing to report in respect of our responsibility to report when:
– The statement given by the directors, on page 67, that they consider the Annual Report taken as a whole to be fair, balanced and understandable, and provides the information necessary for the members to assess the Group’s and Company’s position and performance, business model and strategy is materially inconsistent with our knowledge of the Group and Company obtained in the course of performing our audit.
– The section of the Annual Report on page 69 describing the work of the Audit Committee does not appropriately address matters communicated by us to the Audit Committee.
– The directors’ statement relating to the company’s compliance with the Code does not properly disclose a departure from a relevant provision of the Code specified, under the Listing Rules, for review by the auditors.
Directors’ RemunerationIn our opinion, the part of the Directors’ Remuneration Report to be audited has been properly prepared in accordance with the Companies Act 2006. (CA06)
Responsibilities for the financial statements and the auditResponsibilities of the directors for the financial statementsAs explained more fully in the Directors’ Responsibilities Statement set out on page 95, the directors are responsible for the preparation of the financial statements in accordance with the applicable framework and for being satisfied that they give a true and fair view. The directors are also responsible for such internal control as they determine is necessary to enable the preparation of financial statements that are free from material misstatement, whether due to fraud or error.
In preparing the financial statements, the directors are responsible for assessing the Group’s and the Company’s ability to continue as a going concern, disclosing as applicable, matters related to going concern and using the going concern basis of accounting unless the directors either intend to liquidate the Group or the Company or to cease operations, or have no realistic alternative but to do so.
Auditors’ responsibilities for the audit of the financial statementsOur objectives are to obtain reasonable assurance about whether the financial statements as a whole are free from material misstatement, whether due to fraud or error, and to issue an auditors’ report that includes our opinion. Reasonable assurance is a high level of assurance, but is not a guarantee that an audit conducted in accordance with ISAs (UK) will always detect a material misstatement when it exists. Misstatements can arise from fraud or error and are considered material if, individually or in the aggregate, they could reasonably be expected to influence the economic decisions of users taken on the basis of these financial statements.
A further description of our responsibilities for the audit of the financial statements is located on the FRC’s website at: ww w.frc.org.uk/auditorsresponsibilities. This description forms part of our auditors’ report.
Use of this reportThis report, including the opinions, has been prepared for and only for the company’s members as a body in accordance with Chapter 3 of Part 16 of the Companies Act 2006 and for no other purpose. We do not, in giving these opinions, accept or assume responsibility for any other purpose or to any other person to whom this report is shown or into whose hands it may come save where expressly agreed by our prior consent in writing.
Other required reportingCompanies Act 2006 exception reportingUnder the Companies Act 2006 we are required to report to you if, in our opinion:
– we have not received all the information and explanations we require for our audit; or
– adequate accounting records have not been kept by the company, or returns adequate for our audit have not been received from branches not visited by us; or
– certain disclosures of directors’ remuneration specified by law are not made; or
– the company financial statements and the part of the Directors’ Remuneration Report to be audited are not in agreement with the accounting records and returns.
We have no exceptions to report arising from this responsibility.
AppointmentFollowing the recommendation of the audit committee, we were appointed by the members on 18 July 2014 to audit the financial statements for the year ended 31 March 2015 and subsequent financial periods. The period of total uninterrupted engagement is 4 years, covering the years ended 31 March 2015 to 31 March 2018.
John Waters (Senior Statutory Auditor)for and on behalf of PricewaterhouseCoopers LLPChartered Accountants and Statutory AuditorsLondon16 May 2018
103British Land Annual Report and Accounts 2018
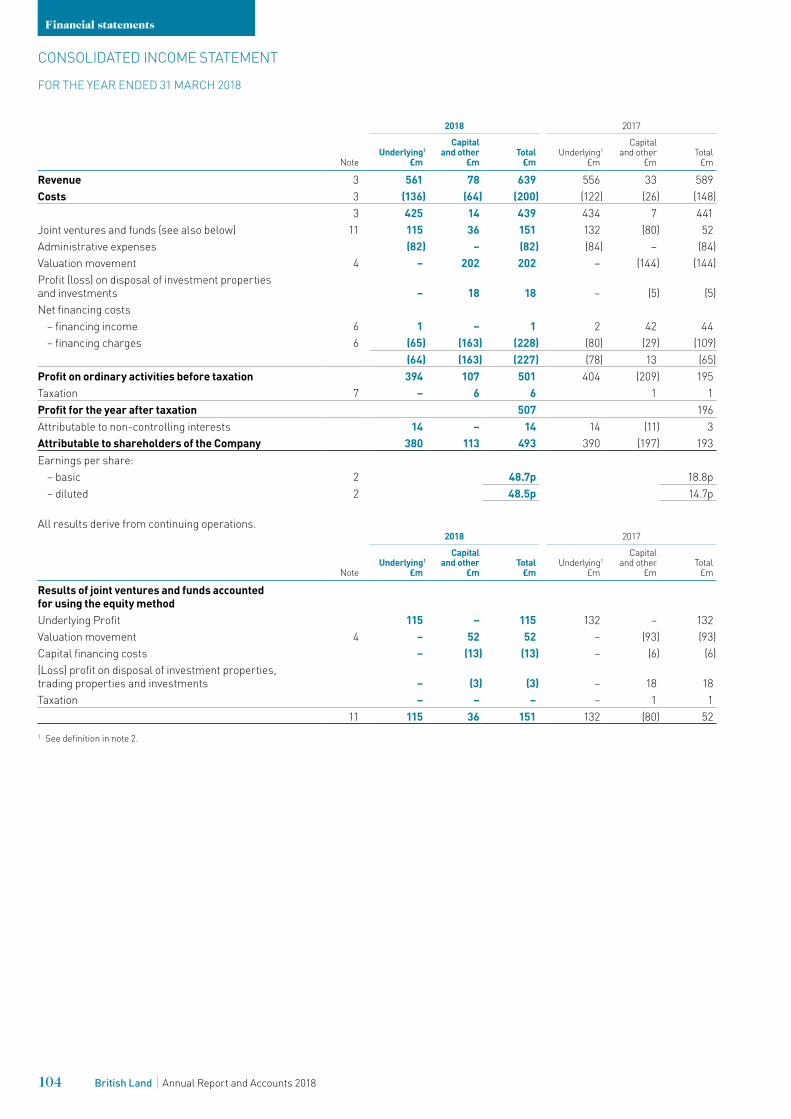
Note
2018 2017
Underlying1
£m
Capital and other
£mTotal
£mUnderlying1
£m
Capital and other
£mTotal
£m
Revenue 3 561 78 639 556 33 589Costs 3 (136) (64) (200) (122) (26) (148)
3 425 14 439 434 7 441Joint ventures and funds (see also below) 11 115 36 151 132 (80) 52Administrative expenses (82) – (82) (84) – (84)Valuation movement 4 – 202 202 – (144) (144)Profit (loss) on disposal of investment properties and investments – 18 18 – (5) (5)Net financing costs
– financing income 6 1 – 1 2 42 44– financing charges 6 (65) (163) (228) (80) (29) (109)
(64) (163) (227) (78) 13 (65)Profit on ordinary activities before taxation 394 107 501 404 (209) 195Taxation 7 – 6 6 1 1Profit for the year after taxation 507 196Attributable to non-controlling interests 14 – 14 14 (11) 3Attributable to shareholders of the Company 380 113 493 390 (197) 193Earnings per share:
– basic 2 48.7p 18.8p– diluted 2 48.5p 14.7p
All results derive from continuing operations.
Note
2018 2017
Underlying1
£m
Capital and other
£mTotal
£mUnderlying1
£m
Capital and other
£mTotal
£m
Results of joint ventures and funds accounted for using the equity methodUnderlying Profit 115 – 115 132 – 132Valuation movement 4 – 52 52 – (93) (93)Capital financing costs – (13) (13) – (6) (6)(Loss) profit on disposal of investment properties, trading properties and investments – (3) (3) – 18 18Taxation – – – – 1 1
11 115 36 151 132 (80) 521 See definition in note 2.
Financial statements
104 British Land Annual Report and Accounts 2018
CONSOLIDATED INCOME STATEMENT
FOR THE YEAR ENDED 31 MARCH 2018
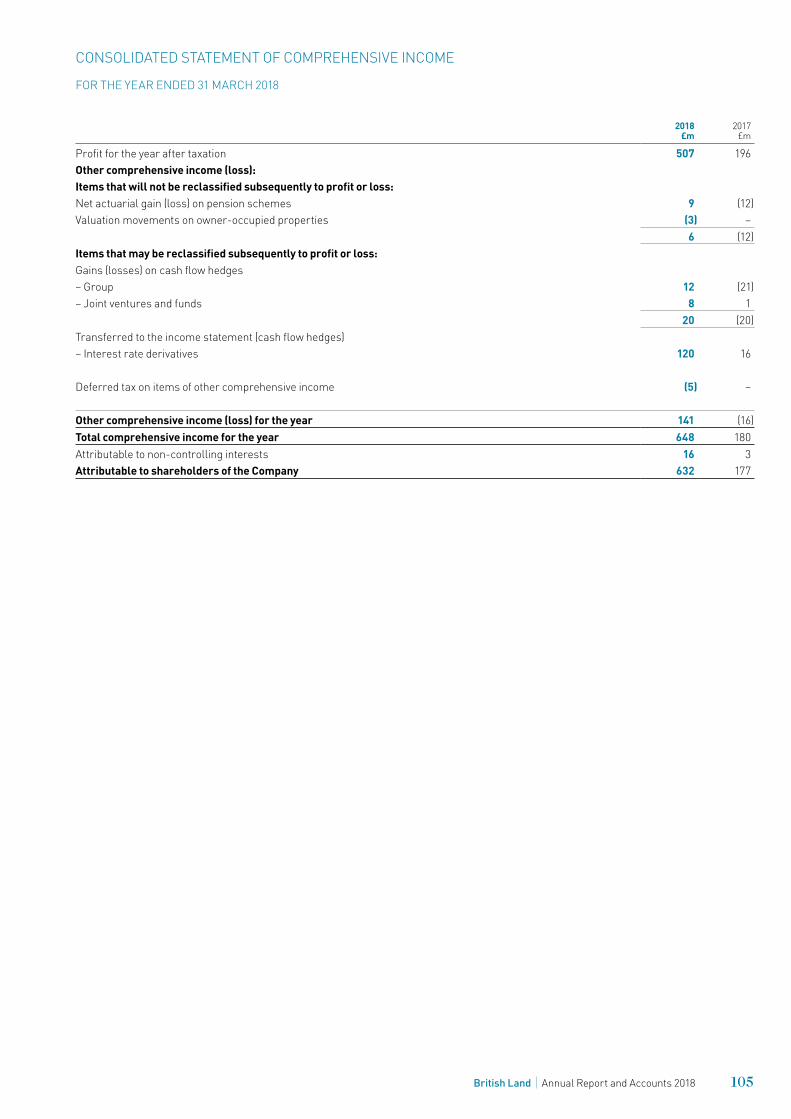
2018£m
2017 £m
Profit for the year after taxation 507 196Other comprehensive income (loss):Items that will not be reclassified subsequently to profit or loss:Net actuarial gain (loss) on pension schemes 9 (12)Valuation movements on owner-occupied properties (3) –
6 (12)Items that may be reclassified subsequently to profit or loss:Gains (losses) on cash flow hedges– Group 12 (21)– Joint ventures and funds 8 1
20 (20)Transferred to the income statement (cash flow hedges)– Interest rate derivatives 120 16
Deferred tax on items of other comprehensive income (5) –
Other comprehensive income (loss) for the year 141 (16)Total comprehensive income for the year 648 180Attributable to non-controlling interests 16 3Attributable to shareholders of the Company 632 177
105British Land Annual Report and Accounts 2018
CONSOLIDATED STATEMENT OF COMPREHENSIVE INCOME
FOR THE YEAR ENDED 31 MARCH 2018
Note2018
£m2017
£m
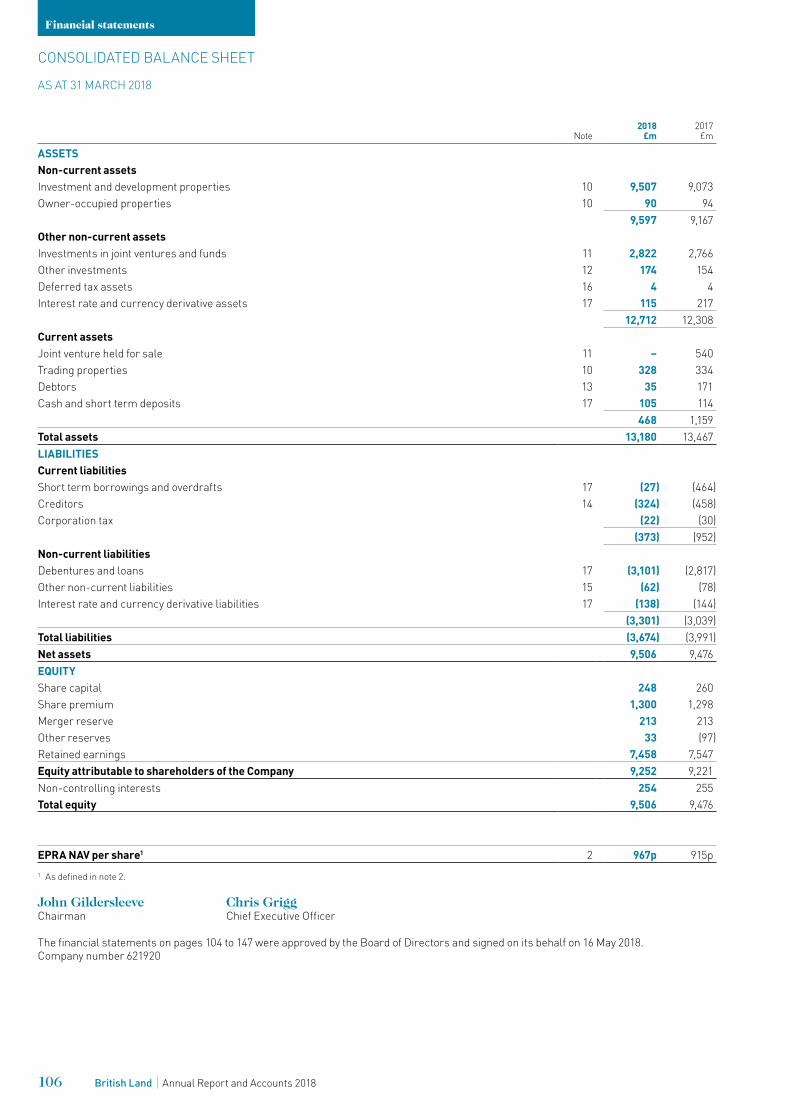
ASSETSNon-current assetsInvestment and development properties 10 9,507 9,073Owner-occupied properties 10 90 94
9,597 9,167Other non-current assetsInvestments in joint ventures and funds 11 2,822 2,766Other investments 12 174 154Deferred tax assets 16 4 4Interest rate and currency derivative assets 17 115 217
12,712 12,308Current assetsJoint venture held for sale 11 – 540Trading properties 10 328 334Debtors 13 35 171Cash and short term deposits 17 105 114
468 1,159Total assets 13,180 13,467LIABILITIESCurrent liabilitiesShort term borrowings and overdrafts 17 (27) (464)Creditors 14 (324) (458)Corporation tax (22) (30)
(373) (952)Non-current liabilitiesDebentures and loans 17 (3,101) (2,817)Other non-current liabilities 15 (62) (78)Interest rate and currency derivative liabilities 17 (138) (144)
(3,301) (3,039)Total liabilities (3,674) (3,991)Net assets 9,506 9,476EQUITYShare capital 248 260Share premium 1,300 1,298Merger reserve 213 213Other reserves 33 (97)Retained earnings 7,458 7,547Equity attributable to shareholders of the Company 9,252 9,221Non-controlling interests 254 255Total equity 9,506 9,476
EPRA NAV per share1 2 967p 915p1 As defined in note 2.
John Gildersleeve Chris GriggChairman Chief Executive Officer
The financial statements on pages 104 to 147 were approved by the Board of Directors and signed on its behalf on 16 May 2018. Company number 621920
Financial statements
106 British Land Annual Report and Accounts 2018
CONSOLIDATED BALANCE SHEET
AS AT 31 MARCH 2018
Note2018
£m2017
£m
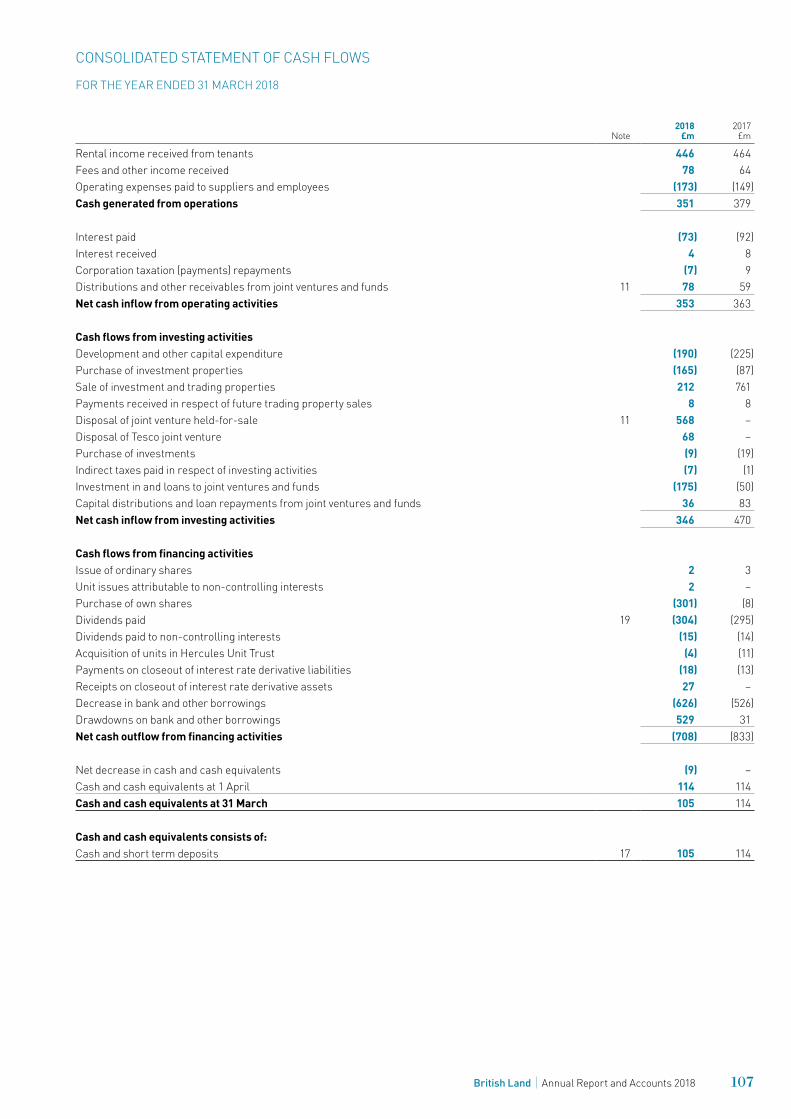
Rental income received from tenants 446 464Fees and other income received 78 64Operating expenses paid to suppliers and employees (173) (149)Cash generated from operations 351 379
Interest paid (73) (92)Interest received 4 8Corporation taxation (payments) repayments (7) 9Distributions and other receivables from joint ventures and funds 11 78 59Net cash inflow from operating activities 353 363
Cash flows from investing activitiesDevelopment and other capital expenditure (190) (225)Purchase of investment properties (165) (87)Sale of investment and trading properties 212 761Payments received in respect of future trading property sales 8 8Disposal of joint venture held-for-sale 11 568 –Disposal of Tesco joint venture 68 –Purchase of investments (9) (19)Indirect taxes paid in respect of investing activities (7) (1)Investment in and loans to joint ventures and funds (175) (50)Capital distributions and loan repayments from joint ventures and funds 36 83Net cash inflow from investing activities 346 470
Cash flows from financing activitiesIssue of ordinary shares 2 3Unit issues attributable to non-controlling interests 2 –Purchase of own shares (301) (8)Dividends paid 19 (304) (295)Dividends paid to non-controlling interests (15) (14)Acquisition of units in Hercules Unit Trust (4) (11)Payments on closeout of interest rate derivative liabilities (18) (13)Receipts on closeout of interest rate derivative assets 27 –Decrease in bank and other borrowings (626) (526)Drawdowns on bank and other borrowings 529 31Net cash outflow from financing activities (708) (833)
Net decrease in cash and cash equivalents (9) –Cash and cash equivalents at 1 April 114 114Cash and cash equivalents at 31 March 105 114
Cash and cash equivalents consists of:Cash and short term deposits 17 105 114
107British Land Annual Report and Accounts 2018
CONSOLIDATED STATEMENT OF CASH FLOWS
FOR THE YEAR ENDED 31 MARCH 2018
Sharecapital
£m
Sharepremium
£m
Hedgingand
translationreserve1
£m
Re-valuation
reserve£m
Mergerreserve
£m
Retainedearnings
£mTotal
£m
Non-controlling
interests£m
Total equity
£m
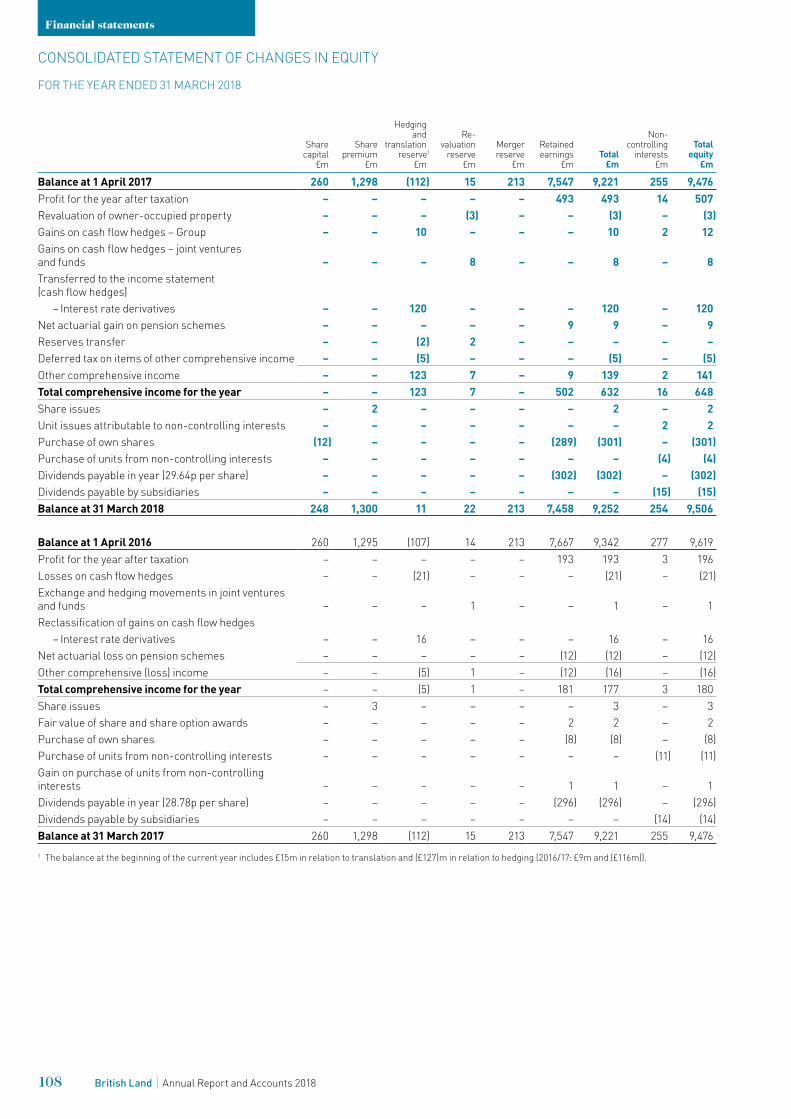
Balance at 1 April 2017 260 1,298 (112) 15 213 7,547 9,221 255 9,476Profit for the year after taxation – – – – – 493 493 14 507Revaluation of owner-occupied property – – – (3) – – (3) – (3)Gains on cash flow hedges – Group – – 10 – – – 10 2 12Gains on cash flow hedges – joint ventures and funds – – – 8 – – 8 – 8Transferred to the income statement (cash flow hedges)
– Interest rate derivatives – – 120 – – – 120 – 120Net actuarial gain on pension schemes – – – – – 9 9 – 9Reserves transfer – – (2) 2 – – – – –Deferred tax on items of other comprehensive income – – (5) – – – (5) – (5)Other comprehensive income – – 123 7 – 9 139 2 141Total comprehensive income for the year – – 123 7 – 502 632 16 648Share issues – 2 – – – – 2 – 2Unit issues attributable to non-controlling interests – – – – – – – 2 2Purchase of own shares (12) – – – – (289) (301) – (301)Purchase of units from non-controlling interests – – – – – – – (4) (4)Dividends payable in year (29.64p per share) – – – – – (302) (302) – (302)Dividends payable by subsidiaries – – – – – – – (15) (15)Balance at 31 March 2018 248 1,300 11 22 213 7,458 9,252 254 9,506
Balance at 1 April 2016 260 1,295 (107) 14 213 7,667 9,342 277 9,619 Profit for the year after taxation – – – – – 193 193 3 196 Losses on cash flow hedges – – (21) – – – (21) – (21)Exchange and hedging movements in joint ventures and funds – – – 1 – – 1 – 1Reclassification of gains on cash flow hedges
– Interest rate derivatives – – 16 – – – 16 – 16Net actuarial loss on pension schemes – – – – – (12) (12) – (12)Other comprehensive (loss) income – – (5) 1 – (12) (16) – (16)Total comprehensive income for the year – – (5) 1 – 181 177 3 180Share issues – 3 – – – – 3 – 3Fair value of share and share option awards – – – – – 2 2 – 2Purchase of own shares – – – – – (8) (8) – (8)Purchase of units from non-controlling interests – – – – – – – (11) (11)Gain on purchase of units from non-controlling interests – – – – – 1 1 – 1Dividends payable in year (28.78p per share) – – – – – (296) (296) – (296)Dividends payable by subsidiaries – – – – – – – (14) (14)Balance at 31 March 2017 260 1,298 (112) 15 213 7,547 9,221 255 9,476 1 The balance at the beginning of the current year includes £15m in relation to translation and (£127)m in relation to hedging (2016/17: £9m and (£116m)).
Financial statements
108 British Land Annual Report and Accounts 2018
CONSOLIDATED STATEMENT OF CHANGES IN EQUITY
FOR THE YEAR ENDED 31 MARCH 2018
disposals. The changes introduced by IFRS 15 will result in minimal qualitative changes to the revenue disclosure and will not have a quantitative impact on the consolidated financial statements of the Group.
IFRS 16 – Leases (effective year ending 31 March 2020) – For lessees, IFRS 16 will result in almost all operating leases
being brought on balance sheet, as the distinction between operating and finance leases will be removed. The accounting for lessors will however not significantly change. As a result, on adoption of the new standard, these changes will have an immaterial impact on the consolidated financial statements of the Group.
Going concernThe financial statements are prepared on a going concern basis as explained in the corporate governance section on page 51.
Subsidiaries, joint ventures and associates (including funds)The consolidated accounts include the accounts of The British Land Company PLC and all subsidiaries (entities controlled by British Land). Control is assumed where British Land is exposed, or has the rights, to variable returns from its involvement with investees and has the ability to affect those returns through its power over those investees.
The results of subsidiaries, joint ventures or associates acquired or disposed of during the year are included from the effective date of acquisition or up to the effective date of disposal. Accounting policies of subsidiaries, joint ventures or associates which differ from Group accounting policies are adjusted on consolidation.
Business combinations are accounted for under the acquisition method. Any excess of the purchase price of business combinations over the fair value of the assets, liabilities and contingent liabilities acquired and resulting deferred tax thereon is recognised as goodwill. Any discount received is credited to the income statement in the period of acquisition.
All intra-Group transactions, balances, income and expenses are eliminated on consolidation. Joint ventures and associates, including funds, are accounted for under the equity method, whereby the consolidated balance sheet incorporates the Group’s share (investor’s share) of the net assets of its joint ventures and associates. The consolidated income statement incorporates the Group’s share of joint venture and associate profits after tax. Their profits include revaluation movements on investment properties.
Distributions and other receivables from joint ventures and associates (including funds) are classed as cash flows from operating activities, except where they relate to a cash flow arising from a capital transaction, such as a property or investment disposal. In this case they are classed as cash flows from investing activities.
PropertiesProperties are externally valued on the basis of fair value at the balance sheet date. Investment and owner-occupied properties are recorded at valuation whereas trading properties are stated at the lower of cost and net realisable value.
Any surplus or deficit arising on revaluing investment properties is recognised in the capital and other column of the income statement.
Any surplus arising on revaluing owner-occupied properties above cost is recognised in other comprehensive income, and any deficit arising in revaluation below cost for owner-occupied and trading properties is recognised in the capital and other column of the income statement.
1 Basis of preparation, significant accounting policies and accounting judgementsThe financial statements for the year ended 31 March 2018 have been prepared on the historical cost basis, except for the revaluation of properties, investments held for trading and derivatives. The financial statements have also been prepared in accordance with International Financial Reporting Standards (IFRSs) as adopted by the European Union and interpretations issued by the IFRS Interpretations Committee (IFRS IC), and therefore comply with article 4 of the EU IAS regulation, and in accordance with the Companies Act 2006. In the current financial year the Group has adopted a number of minor amendments to standards effective in the year issued by the IASB and endorsed by the EU, none of which have had a material impact on the Group. The accounting policies used are otherwise consistent with those contained in the Group’s previous Annual Report and Accounts for the year ended 31 March 2017.
A number of new standards and amendments to standards and interpretations have been issued but are not yet effective for the current accounting period. None of these are expected to have a material impact on the consolidated financial statements of the Group.
Certain standards which could be expected to have an impact on the consolidated financial statements are discussed in further detail below. The Group conducted an impact assessment of the new standards which are effective next year based on the Group’s current activities and have quantified the impact. The results of the impact assessment confirm that the new standards will lead to limited changes to presentation and disclosure and will have an immaterial impact on the consolidated financial statements.
IFRS 9 – Financial instruments (effective year ending March 2019) – The new standard addresses the classification and measurement
of financial assets. – The alignment of the classification and measurement model
under IFRS 9 will result in changes in the classification of all financial assets excluding derivatives. These changes will not have a quantitative impact on the financial statements.
– IFRS 9 introduces an expected credit loss model, requiring an expected credit loss to be recognised on all financial assets held at amortised cost. The quantitative impact based on balances as at 31 March 2018 will result in the recognition of an expected credit loss of £5m, with a corresponding reduction in financial assets held at amortised cost of £5m. The Group has previously provided for a materially similar balance against trade and other receivables and therefore the resulting reclassification of existing provisions will not have a material impact on the net assets of the Group.
– IFRS 9 introduces changes to the qualifying criteria for hedge accounting and expands the financial and non-financial instruments which may be designated as hedged items and hedging instruments in order to align hedge accounting with business strategy. The changes to hedge accounting under IFRS 9 will result in qualitative enhancements to the interest rate and foreign currency risk management disclosures. The changes introduced by IFRS 9 will not have a quantitative impact on the consolidated financial statements of the Group.
IFRS 15 – Revenue from contracts with customers (effective year ending 31 March 2019) – The new standard combines a number of previous standards,
setting out a five step model for the recognition of revenue and establishing principles for reporting useful information to users of financial statements about the nature, timing and uncertainty of revenue and cash flows arising from an entity’s contracts with customers. The new standard does not apply to rental income, which is in the scope of IAS 17, but does apply to service charge income, management and performance fees and trading property
109British Land Annual Report and Accounts 2018
NOTES TO THE ACCOUNTS
As defined by IAS 39, cash flow and fair value hedges are initially recognised at fair value at the date the derivative contracts are entered into, and subsequently remeasured at fair value. Changes in the fair value of derivatives that are designated and qualify as effective cash flow hedges are recognised directly through other comprehensive income as a movement in the hedging and translation reserve. Changes in the fair value of derivatives that are designated and qualify as effective fair value hedges are recorded in the capital and other column of the income statement, along with any changes in the fair value of the hedged item that is attributable to the hedged risk. Any ineffective portion of all derivatives is recognised in the capital and other column of the income statement. Changes in the fair value of derivatives that are not in a designated hedging relationship under IAS 39 are recorded directly in the capital and other column of the income statement. These derivatives are carried at fair value on the balance sheet.
Cash equivalents are limited to instruments with a maturity of less than three months.
Held for sale assetsAssets are classified as held for sale if their carrying amount is expected to be recovered or settled principally through sale rather than through continuing use. The asset must be available for immediate sale and the sale must be highly probable within one year of the reporting date. Held for sale assets are measured at the lower of carrying value and fair value less costs to sell. Impairment losses on initial classification as held for sale and gains or losses on subsequent re-measurements are included in the capital and other column of the income statement.
RevenueRevenue comprises rental income and surrender premia, service charge income, management and performance fees and proceeds from the sale of trading properties.
Rental income, including fixed rental uplifts, from investment property leased out under an operating lease is recognised as revenue on a straight-line basis over the lease term. Lease incentives, such as rent-free periods and cash contributions to tenant fit-out, are recognised on the same straight-line basis being an integral part of the net consideration for the use of the investment property. Any rent adjustments based on open market estimated rental values are recognised, based on management estimates, from the rent review date in relation to unsettled rent reviews. Contingent rents, being those lease payments that are not fixed at the inception of the lease, including for example turnover rents, are recognised in the period in which they are earned.
Surrender premia for the early determination of a lease are recognised as revenue immediately upon receipt, net of dilapidations and non-recoverable outgoings relating to the lease concerned. Service charge income is recognised as revenue in the period to which it relates.
Management and performance fees receivable are recognised as revenue in the period to which they relate. Performance fees are recognised at the end of the performance period when the fee amount can be estimated reliably and it is virtually certain that the fee will be received.
Proceeds from the sale of trading properties are recognised when the risks and rewards of ownership have been transferred to the purchaser. This generally occurs on completion. Proceeds from the sale of trading properties are recognised as revenue in the capital and other column of the income statement. All other revenue described above is recognised in the underlying column of the income statement.
The cost of properties in the course of development includes attributable interest and other associated outgoings including attributable development personnel costs. Interest is calculated on the development expenditure by reference to specific borrowings, where relevant, and otherwise on the weighted average interest rate of British Land Company PLC borrowings. Interest is not capitalised where no development activity is taking place. A property ceases to be treated as a development property on practical completion.
Investment property disposals are recognised on completion. Profits and losses arising are recognised through the capital and other column of the income statement. The profit on disposal is determined as the difference between the net sales proceeds and the carrying amount of the asset at the commencement of the accounting period plus capital expenditure in the period.
Trading properties are initially recognised at cost less impairment, and trading property disposals are recognised in line with the revenue policies outlined below.
Where investment properties are appropriated to trading properties, they are transferred at market value. If properties held for trading are appropriated to investment properties, they are transferred at book value. In determining whether leases and related properties represent operating or finance leases, consideration is given to whether the tenant or landlord bears the risks and rewards of ownership.
Financial assets and liabilitiesTrade debtors and creditors are initially recognised at fair value and subsequently measured at amortised cost and discounted as appropriate.
Other investments include loans and receivables held at amortised cost and investments held for trading classified as fair value through profit or loss. Amortised cost of loans and receivables is measured using the effective interest method, less any impairment. Interest is recognised by applying the effective interest rate. Investments held for trading are initially recorded at fair value and are subsequently externally valued on the same basis at the balance sheet date. Any surplus or deficit arising on revaluing investments held for trading is recognised in the capital and other column of the income statement.
Where an investment property is held under a head lease, the head lease is initially recognised as an asset, being the sum of the premium paid on acquisition plus the present value of minimum ground rent payments. The corresponding rent liability to the head leaseholder is included in the balance sheet as a finance lease obligation.
Debt instruments are stated at their net proceeds on issue. Finance charges including premia payable on settlement or redemption and direct issue costs are spread over the period to redemption, using the effective interest method. Exceptional finance charges incurred due to early redemption (including premiums) are recognised in the income statement when they occur.
Convertible bonds are designated as fair value through profit or loss and so are initially recognised at fair value with all subsequent gains and losses, including the write-off of issue costs, recognised in the capital and other column of the income statement as a component of net financing costs. The interest charge in respect of the coupon rate on the bonds has been recognised within the underlying component of net financing costs on an accruals basis.
NOTES TO THE ACCOUNTS CONTINUED
Financial statements
110 British Land Annual Report and Accounts 2018
The key areas of accounting judgement are:
REIT status: British Land is a Real Estate Investment Trust (REIT) and does not pay tax on its property income or gains on property sales, provided that at least 90% of the Group’s property income is distributed as a dividend to shareholders, which becomes taxable in their hands. In addition, the Group has to meet certain conditions such as ensuring the property rental business represents more than 75% of total profits and assets. Any potential or proposed changes to the REIT legislation are monitored and discussed with HMRC. It is management’s intention that the Group will continue as a REIT for the foreseeable future.
Accounting for joint ventures and funds: In accordance with IFRS 10 ‘Consolidated financial statements’, IFRS 11 ‘Joint arrangements’, and IFRS 12 ‘Disclosures of interests in other entities’ an assessment is required to determine the degree of control or influence the Group exercises and the form of any control to ensure that the financial statement treatment is appropriate. The assessment undertaken by management includes a consideration of the structure, legal form, contractual terms and other facts and circumstances in relation to the entity in question, prior to reaching a conclusion. This assessment is updated annually and there have been no changes in the judgement reached in relation to the degree of control the Group exercises within the current or prior year. Group shares in joint ventures and funds resulting from this process are disclosed in note 11 to the financial statements.
Interest in the Group’s joint ventures is commonly driven by the terms of the partnership agreements which ensure that control is shared between the partners. All significant joint venture arrangements of the Group are held in structures in which the Group has 50% of the voting rights. Joint ventures are accounted for under the equity method, whereby the consolidated balance sheet incorporates the Group’s share of the net assets of its joint ventures and associates. The consolidated income statement incorporates the Group’s share of joint venture and associate profits after tax.
Accounting for transactions: Property transactions are complex in nature and can be material to the financial statements. Judgements made in relation to transactions include whether an acquisition is a business combination or an asset; whether held for sale criteria have been met for transactions not yet completed; and accounting for transaction costs and contingent consideration. Management consider each transaction separately in order to determine the most appropriate accounting treatment, and, when considered necessary, seek independent advice.
TaxationCurrent tax is based on taxable profit for the year and is calculated using tax rates that have been enacted or substantively enacted at the balance sheet date. Taxable profit differs from net profit as reported in the income statement because it excludes items of income or expense that are not taxable (or tax deductible).
Deferred tax is provided on items that may become taxable in the future, or which may be used to offset against taxable profits in the future, on the temporary differences between the carrying amounts of assets and liabilities for financial reporting purposes, and the amounts used for taxation purposes on an undiscounted basis. On business combinations, the deferred tax effect of fair value adjustments is incorporated in the consolidated balance sheet.
Employee costsThe fair value of equity-settled share-based payments to employees is determined at the date of grant and is expensed on a straight-line basis over the vesting period, based on the Group’s estimate of shares or options that will eventually vest. In the case of options granted, fair value is measured by a Black-Scholes pricing model.
Defined benefit pension scheme assets are measured using fair values. Pension scheme liabilities are measured using the projected unit credit method and discounted at the rate of return of a high quality corporate bond of equivalent term to the scheme liabilities. The net surplus (where recoverable by the Group) or deficit is recognised in full in the consolidated balance sheet. Any asset resulting from the calculation is limited to the present value of available refunds and reductions in future contributions to the plan.
The current service cost and gains and losses on settlement and curtailments are charged to operating profit. Actuarial gains and losses are recognised in full in the period in which they occur and are presented in the consolidated statement of comprehensive income.
Contributions to the Group’s defined contribution schemes are expensed on the basis of the contracted annual contribution.
Accounting judgements and estimatesIn applying the Group’s accounting policies, the Directors are required to make judgements and estimates that affect the financial statements.
Significant areas of estimation are:
Valuation of properties and investments held for trading: The Group uses external professional valuers to determine the relevant amounts. The primary source of evidence for property valuations should be recent, comparable market transactions on an arms-length basis. However, valuations of the Group’s property portfolio and investments held for trading are inherently subjective, as they are made on the basis of assumptions made by the valuers which may not prove to be accurate.
Other less significant areas of estimation include the valuation of fixed rate debt and interest rate derivatives, the determination of share-based payment expense, the actuarial assumptions used in calculating the Group’s retirement benefit obligations and taxation provisions.
111British Land Annual Report and Accounts 2018
2 Performance measures Earnings per shareThe Group measures financial performance with reference to underlying earnings per share, the European Public Real Estate Association (EPRA) earnings per share and IFRS earnings per share. The relevant earnings and weighted average number of shares (including dilution adjustments) for each performance measure are shown below, and a reconciliation between these is shown within the supplementary disclosures (Table B).
EPRA earnings per share is calculated using EPRA earnings, which is the IFRS profit after taxation attributable to shareholders of the Company excluding investment and development property revaluations, gains/losses on investing and trading property disposals, changes in the fair value of financial instruments and associated close-out costs and their related taxation. The 2012 convertible bond was repaid in the current year. In the prior year diluted EPRA earnings per share did not include the dilutive impact of the 2012 convertible bond, as the Group’s share price was below the exchange price of 693 pence. IFRS diluted earnings per share included the dilutive impact as IAS 33 ignores this hurdle to conversion. In the current and prior year, both EPRA and IFRS measures exclude the dilutive impact of the 2015 convertible bond as the Company’s share price had not exceeded the level required for the convertible conditions attached to the bond to trigger conversion into shares.
Underlying earnings per share is calculated using Underlying Profit adjusted for underlying taxation (see note 7). Underlying Profit is the pre-tax EPRA earnings measure, with additional Company adjustments. No Company adjustments were made in either the current or prior year.
Earnings per share
2018 2017
Relevant earnings
£m
Relevant number
of shares million
Earnings per share
pence
Relevant earnings
£m
Relevant number
of shares million
Earnings per share
pence
UnderlyingUnderlying basic 380 1,013 37.5 390 1,029 37.9Underlying diluted 380 1,016 37.4 390 1,033 37.8EPRAEPRA basic 380 1,013 37.5 390 1,029 37.9EPRA diluted 380 1,016 37.4 390 1,033 37.8IFRSBasic 493 1,013 48.7 193 1,029 18.8Diluted 493 1,016 48.5 160 1,091 14.7
Net asset valueThe Group measures financial position with reference to EPRA net asset value (NAV) per share and EPRA triple net asset value (NNNAV) per share. The net asset value and number of shares for each performance measure are shown below. A reconciliation between IFRS net assets and EPRA net assets, and the relevant number of shares for each performance measure, is shown within the supplementary disclosures (Table B). EPRA net assets is a proportionally consolidated measure that is based on IFRS net assets excluding the mark-to-market on derivatives and related debt adjustments, the mark-to-market on the convertible bonds as well as deferred taxation on property and derivative valuations. They include the valuation surplus on trading properties and are adjusted for the dilutive impact of share options.
The 2012 convertible bond was repaid in the current year. In the prior year EPRA NAV and EPRA NNNAV did not include the dilutive impact of the 2012 convertible bond, as the Group’s share price was below the exchange price of 693 pence. In the current and prior year, both EPRA and IFRS measures exclude the dilutive impact of the 2015 convertible bond as the Company’s share price had not exceeded the level required for the convertible conditions attached to the bond to trigger conversion into shares.
Net asset value per share
2018 2017
Relevant net assets
£m
Relevant number
of shares million
Net asset value per
share pence
Relevant net assets
£m
Relevant number
of shares million
Net asset value per
share pence
EPRAEPRA NAV 9,560 989 967 9,498 1,038 915EPRA NNNAV 9,044 989 914 8,938 1,038 861IFRSBasic 9,506 983 967 9,476 1,029 921Diluted 9,506 989 961 9,876 1,096 901
Total accounting returnThe Group also measures financial performance with reference to total accounting return. This is calculated as the increase in EPRA net asset value per share and dividend paid in the year as a percentage of the EPRA net asset value per share at the start of the year.
2018 2017
Increase in NAV per share
pence
Dividend per share paid
pence
Total accounting
return
Decrease in NAV per share
pence
Dividend per share paid
pence
Total accounting
return
Total accounting return 52 29.64 8.9% (4) 28.78 2.7%
NOTES TO THE ACCOUNTS CONTINUED
Financial statements
112 British Land Annual Report and Accounts 2018
3 Revenue and costs2018 2017
Underlying £m
Capital and other
£mTotal
£mUnderlying
£m
Capital and other
£mTotal
£m
Rent receivable 441 – 441 449 – 449Spreading of tenant incentives and guaranteed rent increases (6) – (6) (9) – (9)Surrender premia 6 – 6 2 – 2Gross rental income 441 – 441 442 – 442Trading property sales proceeds – 78 78 – 33 33Service charge income 66 – 66 62 – 62Management and performance fees (from joint ventures and funds) 6 – 6 9 – 9Other fees and commissions 48 – 48 43 – 43Revenue 561 78 639 556 33 589
Trading property cost of sales – (64) (64) – (26) (26)Service charge expenses (66) – (66) (62) – (62)Property operating expenses (29) – (29) (25) – (25)Other fees and commissions expenses (41) – (41) (35) – (35)Costs (136) (64) (200) (122) (26) (148)
425 14 439 434 7 441
The cash element of net rental income recognised during the year ended 31 March 2018 from properties which were not subject to a security interest was £301m (2016/17: £276m). Property operating expenses relating to investment properties that did not generate any rental income were £2m (2016/17: £2m). Contingent rents of £4m (2016/17: £2m) were recognised in the year.
4 Valuation movements on property2018
£m2017
£m
Consolidated income statementRevaluation of properties 202 (144)Revaluation of properties held by joint ventures and funds accounted for using the equity method 52 (93)
254 (237)Consolidated statement of comprehensive incomeRevaluation of owner-occupied properties (3) –
251 (237)
5 Auditors’ remuneration – PricewaterhouseCoopers LLP2018
£m2017
£m
Fees payable to the Company’s auditors for the audit of the Company’s annual accounts 0.3 0.2Fees payable to the Company’s auditors for the audit of the Company’s subsidiaries, pursuant to legislation 0.4 0.4Total audit fees 0.7 0.6Audit-related assurance services 0.1 0.1Total audit and audit-related assurance services 0.8 0.7Other feesOther services 0.2 0.1Total 1.0 0.8
In addition to the above, PricewaterhouseCoopers LLP were remunerated for non-audit fees in PREF, an equity accounted property fund (see note 11). The Group’s share of fees totalled £0.1m (2016/17: £0.1m). PricewaterhouseCoopers LLP are not the external auditors to PREF.
113British Land Annual Report and Accounts 2018
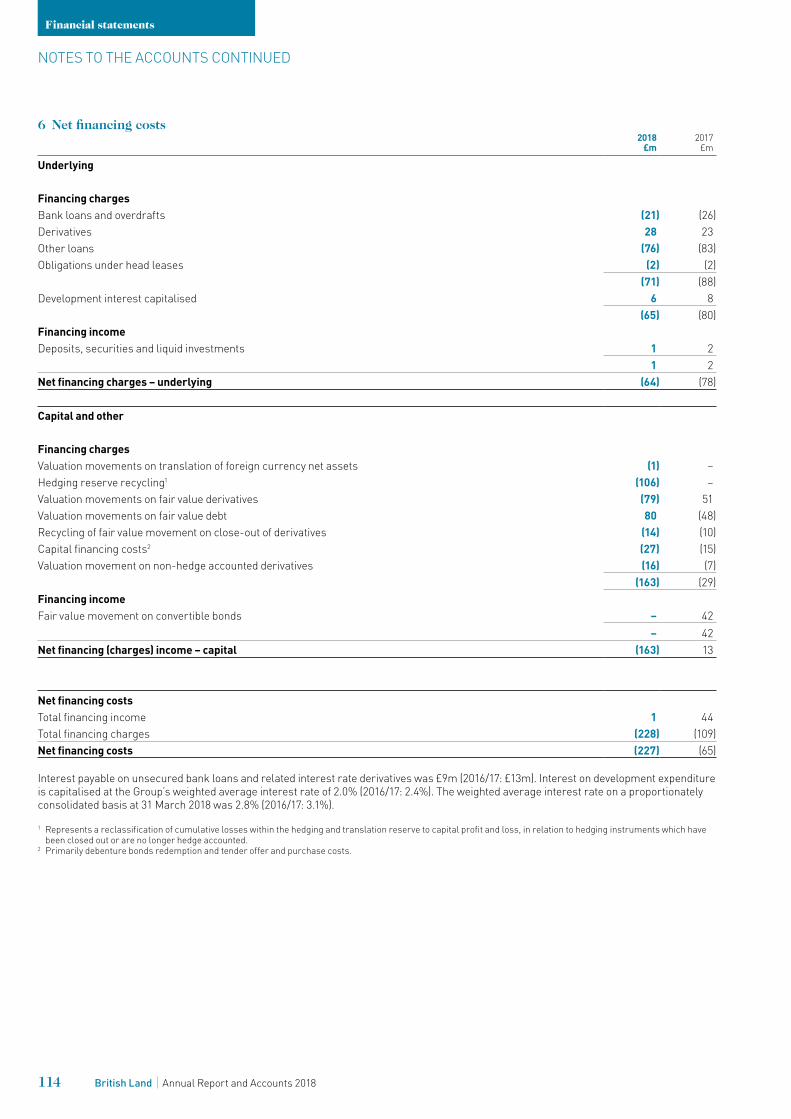
6 Net financing costs2018
£m2017
£m
Underlying
Financing chargesBank loans and overdrafts (21) (26)Derivatives 28 23Other loans (76) (83)Obligations under head leases (2) (2)
(71) (88)Development interest capitalised 6 8
(65) (80)Financing incomeDeposits, securities and liquid investments 1 2
1 2Net financing charges – underlying (64) (78)
Capital and other
Financing chargesValuation movements on translation of foreign currency net assets (1) –Hedging reserve recycling1 (106) –Valuation movements on fair value derivatives (79) 51Valuation movements on fair value debt 80 (48)Recycling of fair value movement on close-out of derivatives (14) (10)Capital financing costs2 (27) (15)Valuation movement on non-hedge accounted derivatives (16) (7)
(163) (29)Financing incomeFair value movement on convertible bonds – 42
– 42Net financing (charges) income – capital (163) 13
Net financing costsTotal financing income 1 44Total financing charges (228) (109)Net financing costs (227) (65)
Interest payable on unsecured bank loans and related interest rate derivatives was £9m (2016/17: £13m). Interest on development expenditure is capitalised at the Group’s weighted average interest rate of 2.0% (2016/17: 2.4%). The weighted average interest rate on a proportionately consolidated basis at 31 March 2018 was 2.8% (2016/17: 3.1%).
1 Represents a reclassification of cumulative losses within the hedging and translation reserve to capital profit and loss, in relation to hedging instruments which have been closed out or are no longer hedge accounted.
2 Primarily debenture bonds redemption and tender offer and purchase costs.
NOTES TO THE ACCOUNTS CONTINUED
Financial statements
114 British Land Annual Report and Accounts 2018
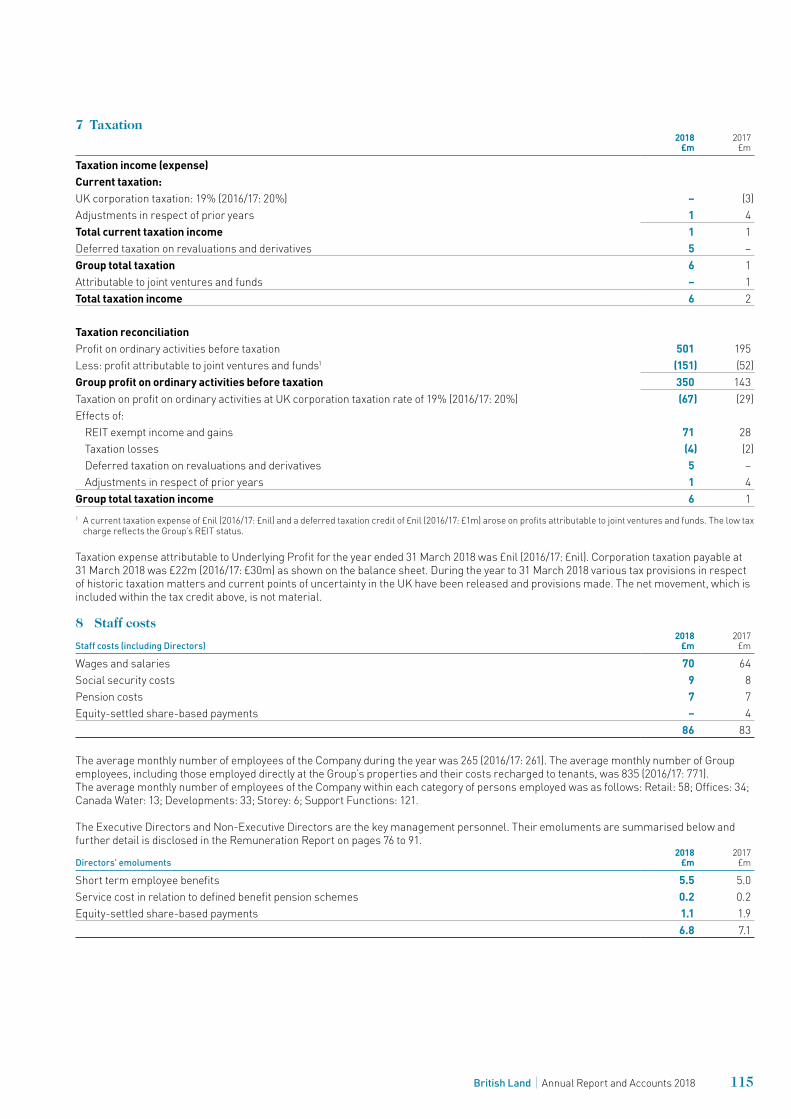
7 Taxation2018
£m2017
£m
Taxation income (expense) Current taxation:UK corporation taxation: 19% (2016/17: 20%) – (3)Adjustments in respect of prior years 1 4Total current taxation income 1 1Deferred taxation on revaluations and derivatives 5 –Group total taxation 6 1Attributable to joint ventures and funds – 1Total taxation income 6 2
Taxation reconciliationProfit on ordinary activities before taxation 501 195Less: profit attributable to joint ventures and funds1 (151) (52)Group profit on ordinary activities before taxation 350 143Taxation on profit on ordinary activities at UK corporation taxation rate of 19% (2016/17: 20%) (67) (29)Effects of:
REIT exempt income and gains 71 28Taxation losses (4) (2)Deferred taxation on revaluations and derivatives 5 –Adjustments in respect of prior years 1 4
Group total taxation income 6 11 A current taxation expense of £nil (2016/17: £nil) and a deferred taxation credit of £nil (2016/17: £1m) arose on profits attributable to joint ventures and funds. The low tax
charge reflects the Group’s REIT status.
Taxation expense attributable to Underlying Profit for the year ended 31 March 2018 was £nil (2016/17: £nil). Corporation taxation payable at 31 March 2018 was £22m (2016/17: £30m) as shown on the balance sheet. During the year to 31 March 2018 various tax provisions in respect of historic taxation matters and current points of uncertainty in the UK have been released and provisions made. The net movement, which is included within the tax credit above, is not material.
8 Staff costs
Staff costs (including Directors)2018
£m2017
£m
Wages and salaries 70 64Social security costs 9 8Pension costs 7 7Equity-settled share-based payments – 4
86 83
The average monthly number of employees of the Company during the year was 265 (2016/17: 261). The average monthly number of Group employees, including those employed directly at the Group’s properties and their costs recharged to tenants, was 835 (2016/17: 771). The average monthly number of employees of the Company within each category of persons employed was as follows: Retail: 58; Offices: 34; Canada Water: 13; Developments: 33; Storey: 6; Support Functions: 121.
The Executive Directors and Non-Executive Directors are the key management personnel. Their emoluments are summarised below and further detail is disclosed in the Remuneration Report on pages 76 to 91.
Directors’ emoluments2018
£m2017
£m
Short term employee benefits 5.5 5.0Service cost in relation to defined benefit pension schemes 0.2 0.2Equity-settled share-based payments 1.1 1.9
6.8 7.1
115British Land Annual Report and Accounts 2018
8 Staff costs continuedStaff costsThe Group’s equity-settled share-based payments comprise the Long-Term Incentive Plan (LTIP), the Matching Share Plan (MSP) and various savings related share option schemes.
The Company expenses an estimate of how many shares are likely to vest based on the market price at the date of grant, taking account of expected performance against the relevant performance targets and service periods, which are discussed in further detail in the Remuneration Report.
For all schemes except the Company’s Long-Term Incentive Plan share options, the fair value of awards are equal to the market value at grant date. The key inputs used to value share options using a Black-Scholes model granted under the Company’s Long-Term Incentive Plan are shown below.
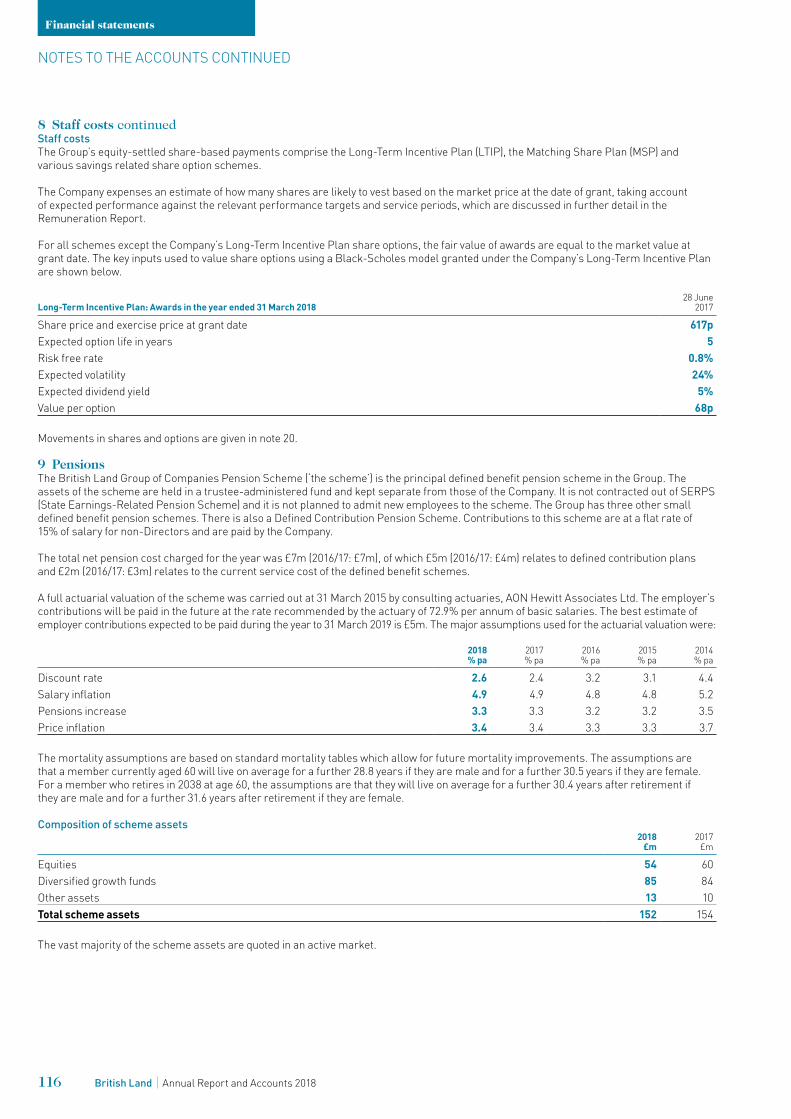
Long-Term Incentive Plan: Awards in the year ended 31 March 201828 June
2017
Share price and exercise price at grant date 617pExpected option life in years 5Risk free rate 0.8%Expected volatility 24%Expected dividend yield 5%Value per option 68p
Movements in shares and options are given in note 20.
9 PensionsThe British Land Group of Companies Pension Scheme (‘the scheme’) is the principal defined benefit pension scheme in the Group. The assets of the scheme are held in a trustee-administered fund and kept separate from those of the Company. It is not contracted out of SERPS (State Earnings-Related Pension Scheme) and it is not planned to admit new employees to the scheme. The Group has three other small defined benefit pension schemes. There is also a Defined Contribution Pension Scheme. Contributions to this scheme are at a flat rate of 15% of salary for non-Directors and are paid by the Company.
The total net pension cost charged for the year was £7m (2016/17: £7m), of which £5m (2016/17: £4m) relates to defined contribution plans and £2m (2016/17: £3m) relates to the current service cost of the defined benefit schemes.
A full actuarial valuation of the scheme was carried out at 31 March 2015 by consulting actuaries, AON Hewitt Associates Ltd. The employer’s contributions will be paid in the future at the rate recommended by the actuary of 72.9% per annum of basic salaries. The best estimate of employer contributions expected to be paid during the year to 31 March 2019 is £5m. The major assumptions used for the actuarial valuation were:
2018 % pa
2017 % pa
2016 % pa
2015 % pa
2014 % pa
Discount rate 2.6 2.4 3.2 3.1 4.4Salary inflation 4.9 4.9 4.8 4.8 5.2Pensions increase 3.3 3.3 3.2 3.2 3.5Price inflation 3.4 3.4 3.3 3.3 3.7
The mortality assumptions are based on standard mortality tables which allow for future mortality improvements. The assumptions are that a member currently aged 60 will live on average for a further 28.8 years if they are male and for a further 30.5 years if they are female. For a member who retires in 2038 at age 60, the assumptions are that they will live on average for a further 30.4 years after retirement if they are male and for a further 31.6 years after retirement if they are female.
Composition of scheme assets2018
£m2017
£m
Equities 54 60Diversified growth funds 85 84Other assets 13 10Total scheme assets 152 154
The vast majority of the scheme assets are quoted in an active market.
NOTES TO THE ACCOUNTS CONTINUED
Financial statements
116 British Land Annual Report and Accounts 2018
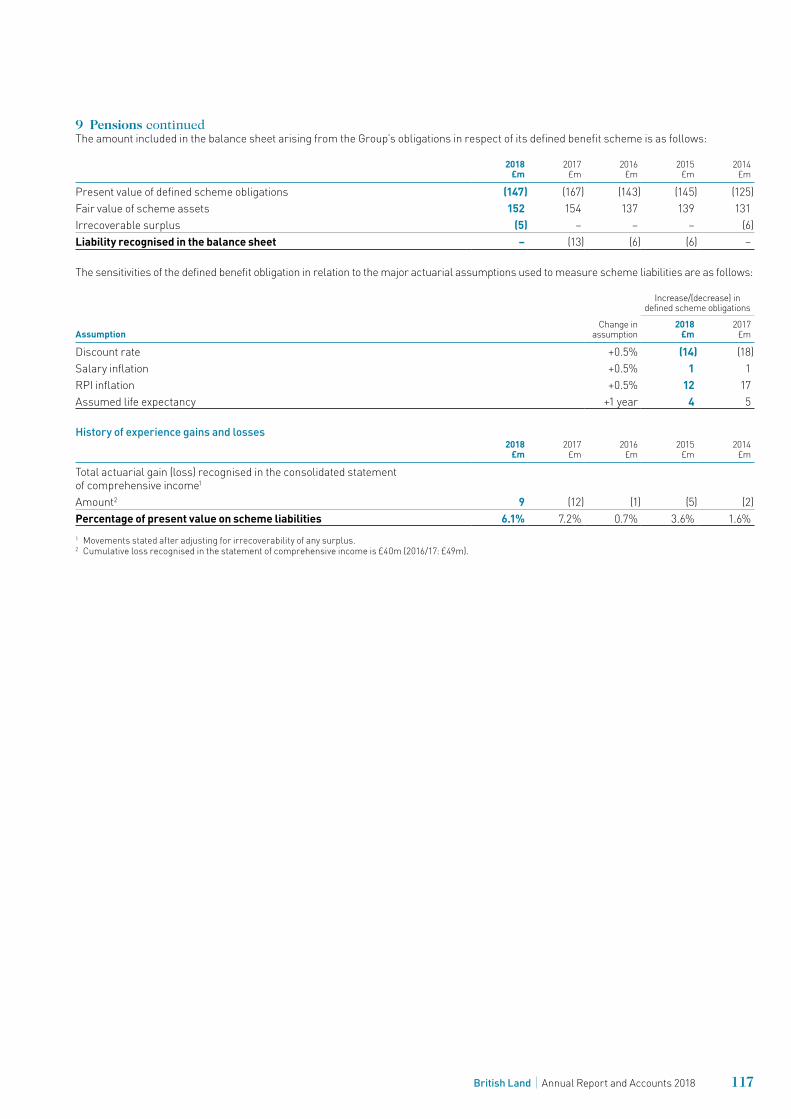
9 Pensions continuedThe amount included in the balance sheet arising from the Group’s obligations in respect of its defined benefit scheme is as follows:
2018 £m
2017 £m
2016 £m
2015 £m
2014 £m
Present value of defined scheme obligations (147) (167) (143) (145) (125)Fair value of scheme assets 152 154 137 139 131Irrecoverable surplus (5) – – – (6)Liability recognised in the balance sheet – (13) (6) (6) –
The sensitivities of the defined benefit obligation in relation to the major actuarial assumptions used to measure scheme liabilities are as follows:
AssumptionChange in
assumption
Increase/(decrease) in defined scheme obligations
2018 £m
2017 £m
Discount rate +0.5% (14) (18)Salary inflation +0.5% 1 1RPI inflation +0.5% 12 17Assumed life expectancy +1 year 4 5
History of experience gains and losses2018
£m2017
£m2016
£m2015
£m2014
£m
Total actuarial gain (loss) recognised in the consolidated statement of comprehensive income1
Amount2 9 (12) (1) (5) (2)Percentage of present value on scheme liabilities 6.1% 7.2% 0.7% 3.6% 1.6%1 Movements stated after adjusting for irrecoverability of any surplus.2 Cumulative loss recognised in the statement of comprehensive income is £40m (2016/17: £49m).
117British Land Annual Report and Accounts 2018
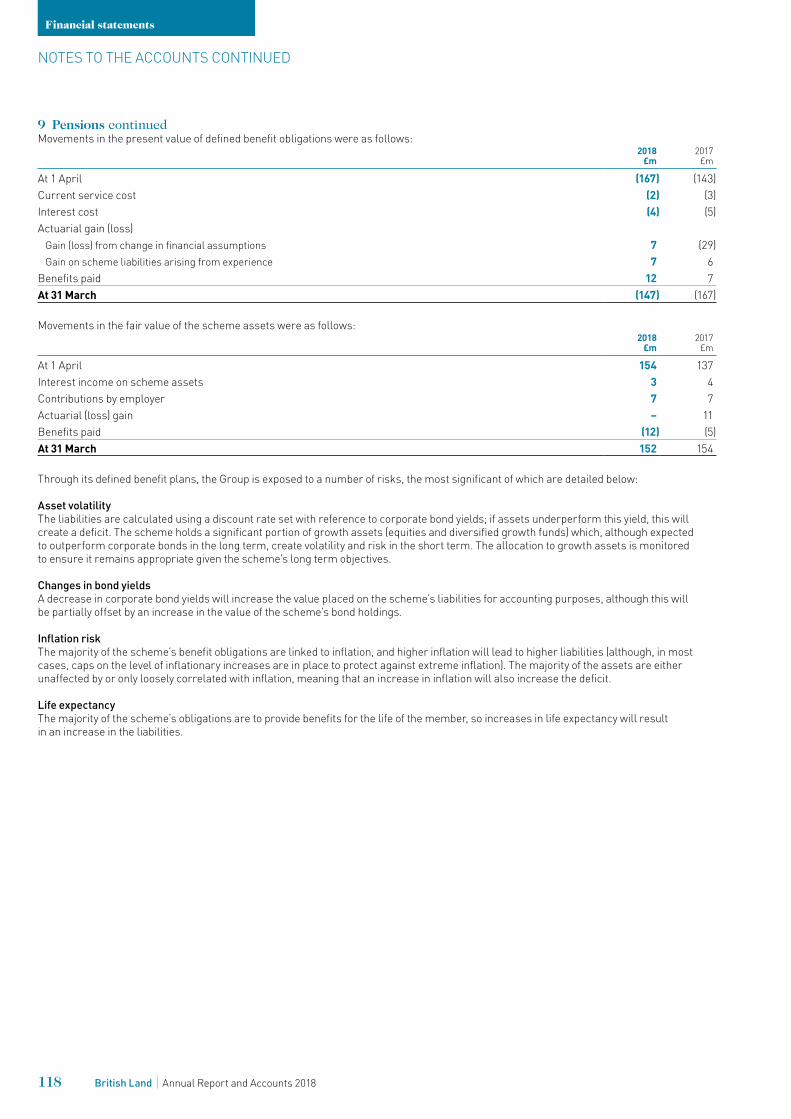
9 Pensions continuedMovements in the present value of defined benefit obligations were as follows:
2018 £m
2017 £m
At 1 April (167) (143)Current service cost (2) (3)Interest cost (4) (5)Actuarial gain (loss)
Gain (loss) from change in financial assumptions 7 (29)Gain on scheme liabilities arising from experience 7 6
Benefits paid 12 7At 31 March (147) (167)
Movements in the fair value of the scheme assets were as follows:2018
£m2017
£m
At 1 April 154 137Interest income on scheme assets 3 4Contributions by employer 7 7Actuarial (loss) gain – 11Benefits paid (12) (5)At 31 March 152 154
Through its defined benefit plans, the Group is exposed to a number of risks, the most significant of which are detailed below:
Asset volatilityThe liabilities are calculated using a discount rate set with reference to corporate bond yields; if assets underperform this yield, this will create a deficit. The scheme holds a significant portion of growth assets (equities and diversified growth funds) which, although expected to outperform corporate bonds in the long term, create volatility and risk in the short term. The allocation to growth assets is monitored to ensure it remains appropriate given the scheme’s long term objectives.
Changes in bond yieldsA decrease in corporate bond yields will increase the value placed on the scheme’s liabilities for accounting purposes, although this will be partially offset by an increase in the value of the scheme’s bond holdings.
Inflation riskThe majority of the scheme’s benefit obligations are linked to inflation, and higher inflation will lead to higher liabilities (although, in most cases, caps on the level of inflationary increases are in place to protect against extreme inflation). The majority of the assets are either unaffected by or only loosely correlated with inflation, meaning that an increase in inflation will also increase the deficit.
Life expectancyThe majority of the scheme’s obligations are to provide benefits for the life of the member, so increases in life expectancy will result in an increase in the liabilities.
NOTES TO THE ACCOUNTS CONTINUED
Financial statements
118 British Land Annual Report and Accounts 2018
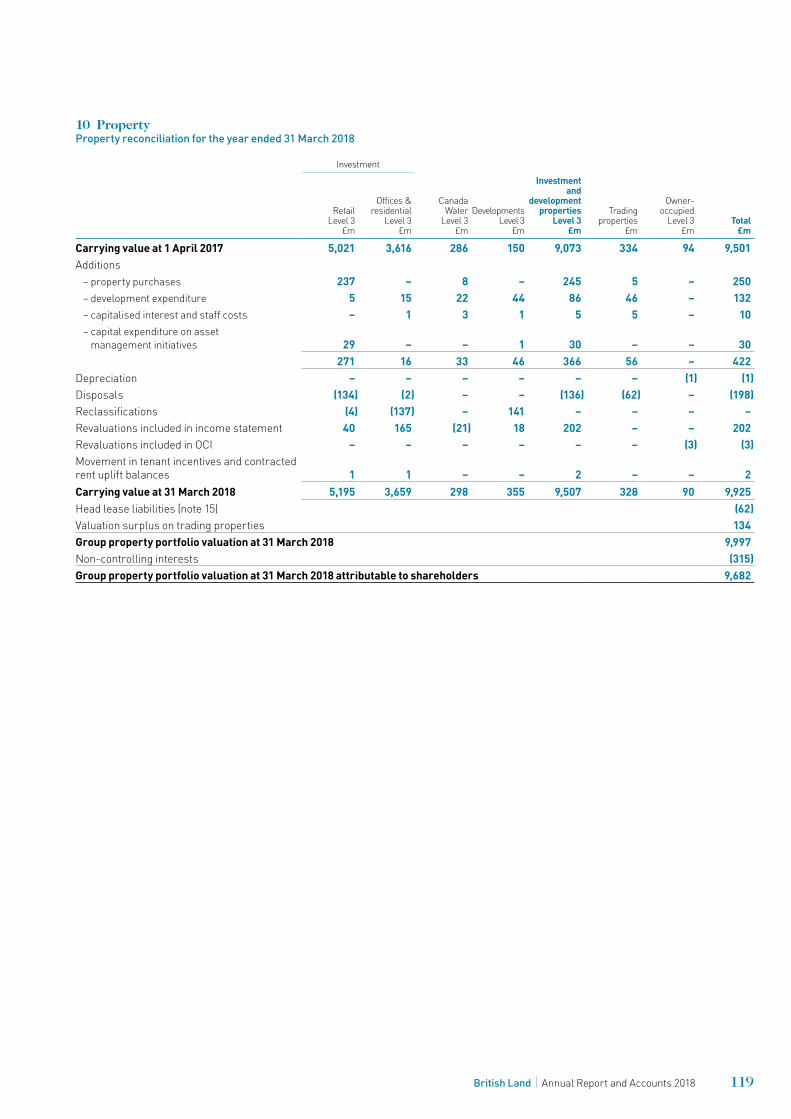
10 PropertyProperty reconciliation for the year ended 31 March 2018
Investment
RetailLevel 3
£m
Offices & residential
Level 3 £m
CanadaWater
Level 3£m
Developments Level 3
£m
Investment and
development properties
Level 3 £m
Trading properties
£m
Owner- occupied
Level 3 £m
Total £m
Carrying value at 1 April 2017 5,021 3,616 286 150 9,073 334 94 9,501Additions
– property purchases 237 – 8 – 245 5 – 250– development expenditure 5 15 22 44 86 46 – 132– capitalised interest and staff costs – 1 3 1 5 5 – 10– capital expenditure on asset
management initiatives 29 – – 1 30 – – 30271 16 33 46 366 56 – 422
Depreciation – – – – – – (1) (1)Disposals (134) (2) – – (136) (62) – (198)Reclassifications (4) (137) – 141 – – – –Revaluations included in income statement 40 165 (21) 18 202 – – 202Revaluations included in OCI – – – – – – (3) (3)Movement in tenant incentives and contracted rent uplift balances 1 1 – – 2 – – 2Carrying value at 31 March 2018 5,195 3,659 298 355 9,507 328 90 9,925Head lease liabilities (note 15) (62)Valuation surplus on trading properties 134Group property portfolio valuation at 31 March 2018 9,997Non-controlling interests (315)Group property portfolio valuation at 31 March 2018 attributable to shareholders 9,682
119British Land Annual Report and Accounts 2018
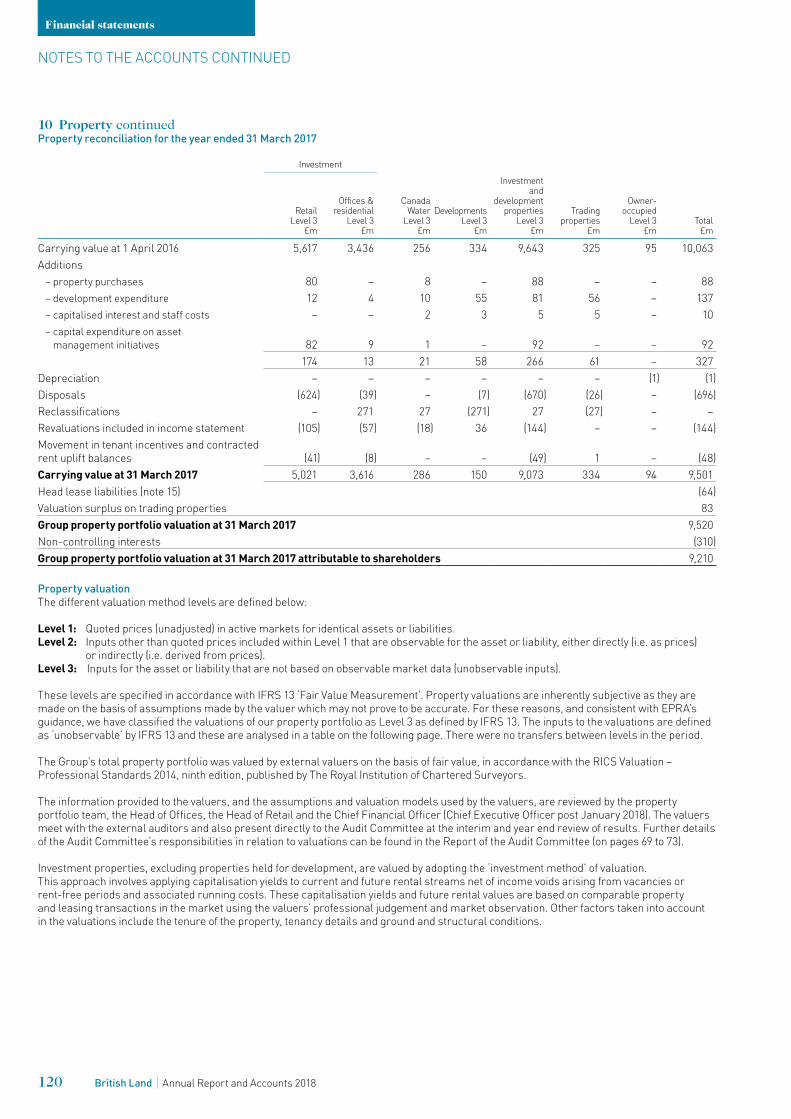
10 Property continuedProperty reconciliation for the year ended 31 March 2017
Investment
RetailLevel 3
£m
Offices & residential
Level 3 £m
CanadaWater
Level 3£m
Developments Level 3
£m
Investment and
development properties
Level 3 £m
Trading properties
£m
Owner- occupied
Level 3 £m
Total £m
Carrying value at 1 April 2016 5,617 3,436 256 334 9,643 325 95 10,063Additions
– property purchases 80 – 8 – 88 – – 88– development expenditure 12 4 10 55 81 56 – 137– capitalised interest and staff costs – – 2 3 5 5 – 10– capital expenditure on asset
management initiatives 82 9 1 – 92 – – 92174 13 21 58 266 61 – 327
Depreciation – – – – – – (1) (1)Disposals (624) (39) – (7) (670) (26) – (696)Reclassifications – 271 27 (271) 27 (27) – –Revaluations included in income statement (105) (57) (18) 36 (144) – – (144)Movement in tenant incentives and contracted rent uplift balances (41) (8) – – (49) 1 – (48)Carrying value at 31 March 2017 5,021 3,616 286 150 9,073 334 94 9,501Head lease liabilities (note 15) (64)Valuation surplus on trading properties 83Group property portfolio valuation at 31 March 2017 9,520Non-controlling interests (310)Group property portfolio valuation at 31 March 2017 attributable to shareholders 9,210
Property valuationThe different valuation method levels are defined below:
Level 1: Quoted prices (unadjusted) in active markets for identical assets or liabilities.Level 2: Inputs other than quoted prices included within Level 1 that are observable for the asset or liability, either directly (i.e. as prices)
or indirectly (i.e. derived from prices).Level 3: Inputs for the asset or liability that are not based on observable market data (unobservable inputs).
These levels are specified in accordance with IFRS 13 ‘Fair Value Measurement’. Property valuations are inherently subjective as they are made on the basis of assumptions made by the valuer which may not prove to be accurate. For these reasons, and consistent with EPRA’s guidance, we have classified the valuations of our property portfolio as Level 3 as defined by IFRS 13. The inputs to the valuations are defined as ‘unobservable’ by IFRS 13 and these are analysed in a table on the following page. There were no transfers between levels in the period.
The Group’s total property portfolio was valued by external valuers on the basis of fair value, in accordance with the RICS Valuation – Professional Standards 2014, ninth edition, published by The Royal Institution of Chartered Surveyors.
The information provided to the valuers, and the assumptions and valuation models used by the valuers, are reviewed by the property portfolio team, the Head of Offices, the Head of Retail and the Chief Financial Officer (Chief Executive Officer post January 2018). The valuers meet with the external auditors and also present directly to the Audit Committee at the interim and year end review of results. Further details of the Audit Committee’s responsibilities in relation to valuations can be found in the Report of the Audit Committee (on pages 69 to 73).
Investment properties, excluding properties held for development, are valued by adopting the ‘investment method’ of valuation. This approach involves applying capitalisation yields to current and future rental streams net of income voids arising from vacancies or rent-free periods and associated running costs. These capitalisation yields and future rental values are based on comparable property and leasing transactions in the market using the valuers’ professional judgement and market observation. Other factors taken into account in the valuations include the tenure of the property, tenancy details and ground and structural conditions.
NOTES TO THE ACCOUNTS CONTINUED
Financial statements
120 British Land Annual Report and Accounts 2018
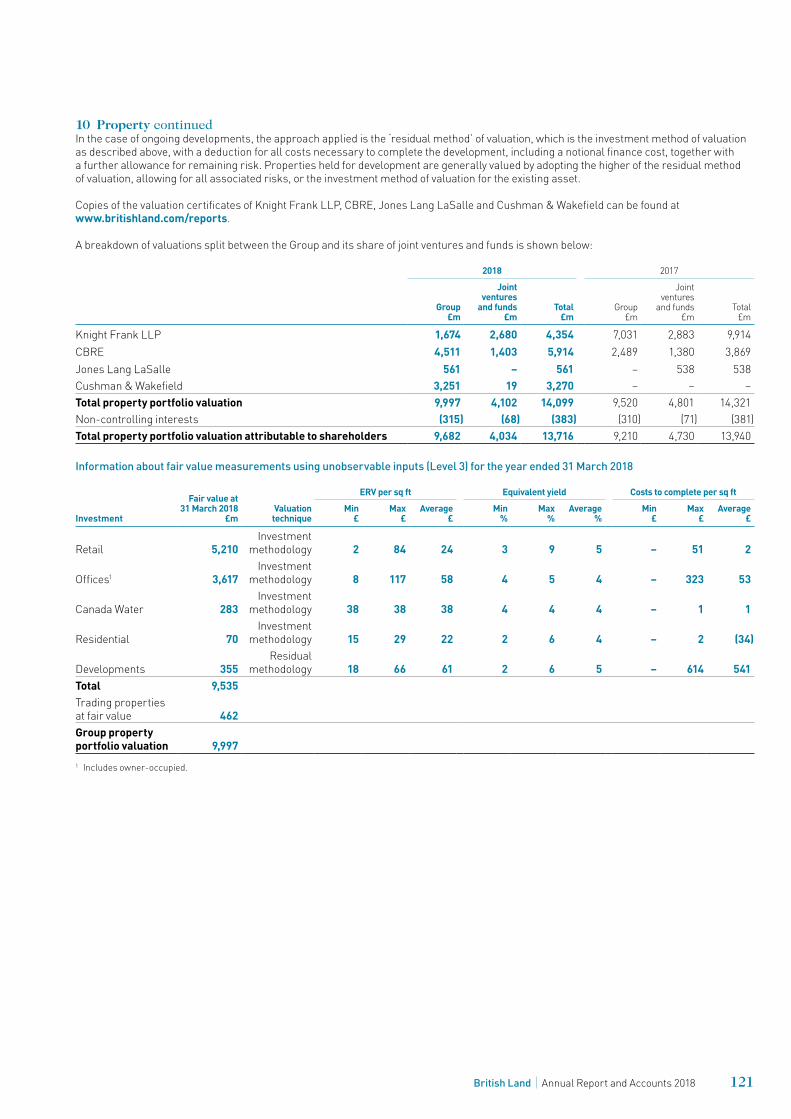
10 Property continuedIn the case of ongoing developments, the approach applied is the ‘residual method’ of valuation, which is the investment method of valuation as described above, with a deduction for all costs necessary to complete the development, including a notional finance cost, together with a further allowance for remaining risk. Properties held for development are generally valued by adopting the higher of the residual method of valuation, allowing for all associated risks, or the investment method of valuation for the existing asset.
Copies of the valuation certificates of Knight Frank LLP, CBRE, Jones Lang LaSalle and Cushman & Wakefield can be found at ww w.britishland.com/reports.
A breakdown of valuations split between the Group and its share of joint ventures and funds is shown below:
2018 2017
Group £m
Joint ventures
and funds £m
Total £m
Group £m
Joint ventures
and funds £m
Total £m
Knight Frank LLP 1,674 2,680 4,354 7,031 2,883 9,914CBRE 4,511 1,403 5,914 2,489 1,380 3,869Jones Lang LaSalle 561 – 561 – 538 538Cushman & Wakefield 3,251 19 3,270 – – –Total property portfolio valuation 9,997 4,102 14,099 9,520 4,801 14,321Non-controlling interests (315) (68) (383) (310) (71) (381)Total property portfolio valuation attributable to shareholders 9,682 4,034 13,716 9,210 4,730 13,940
Information about fair value measurements using unobservable inputs (Level 3) for the year ended 31 March 2018
Investment
Fair value at 31 March 2018
£mValuation technique
ERV per sq ft Equivalent yield Costs to complete per sq ftMin
£Max
£Average
£Min
%Max
%Average
%Min
£Max
£Average
£
Retail 5,210Investment
methodology 2 84 24 3 9 5 – 51 2
Offices1 3,617Investment
methodology 8 117 58 4 5 4 – 323 53
Canada Water 283Investment
methodology 38 38 38 4 4 4 – 1 1
Residential 70Investment
methodology 15 29 22 2 6 4 – 2 (34)
Developments 355Residual
methodology 18 66 61 2 6 5 – 614 541Total 9,535Trading properties at fair value 462Group property portfolio valuation 9,9971 Includes owner-occupied.
121British Land Annual Report and Accounts 2018
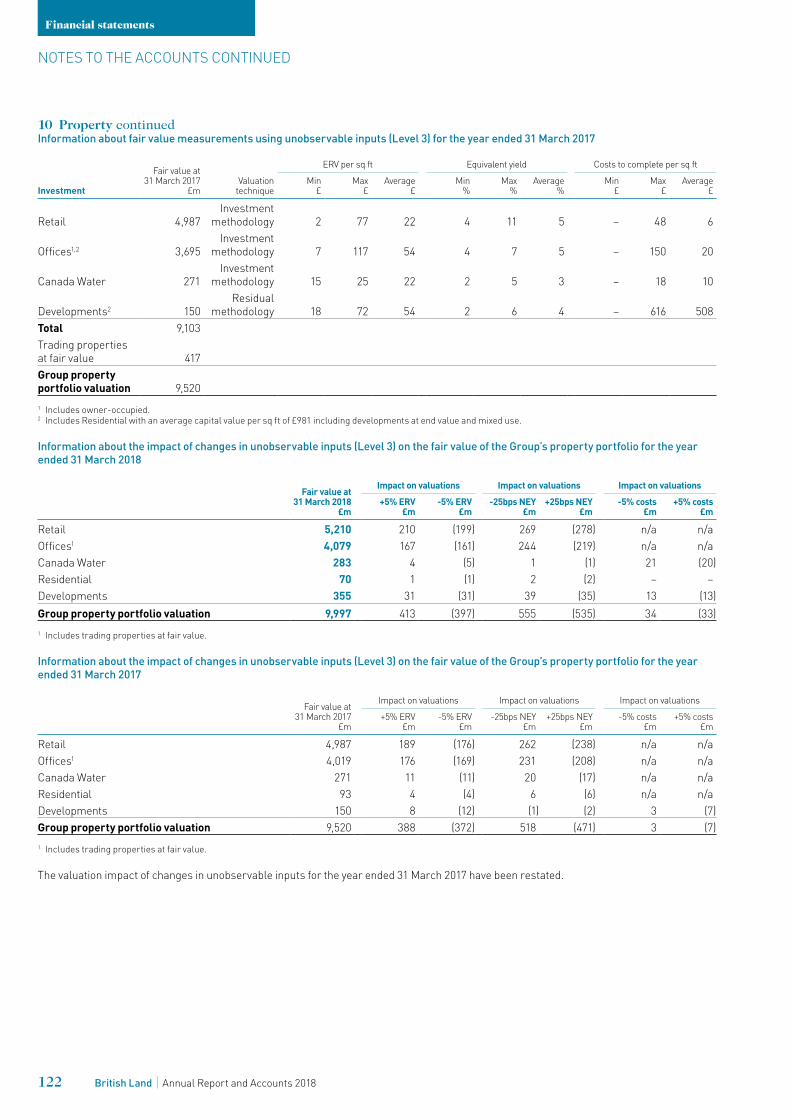
10 Property continuedInformation about fair value measurements using unobservable inputs (Level 3) for the year ended 31 March 2017
Investment
Fair value at 31 March 2017
£mValuation
technique
ERV per sq ft Equivalent yield Costs to complete per sq ft
Min £
Max £
Average£
Min %
Max %
Average%
Min £
Max £
Average £
Retail 4,987Investment
methodology 2 77 22 4 11 5 – 48 6
Offices1,2 3,695Investment
methodology 7 117 54 4 7 5 – 150 20
Canada Water 271Investment
methodology 15 25 22 2 5 3 – 18 10
Developments2 150Residual
methodology 18 72 54 2 6 4 – 616 508Total 9,103Trading properties at fair value 417Group property portfolio valuation 9,5201 Includes owner-occupied.2 Includes Residential with an average capital value per sq ft of £981 including developments at end value and mixed use.
Information about the impact of changes in unobservable inputs (Level 3) on the fair value of the Group’s property portfolio for the year ended 31 March 2018
Fair value at 31 March 2018
£m
Impact on valuations Impact on valuations Impact on valuations+5% ERV
£m-5% ERV
£m-25bps NEY
£m+25bps NEY
£m-5% costs
£m+5% costs
£m
Retail 5,210 210 (199) 269 (278) n/a n/aOffices1 4,079 167 (161) 244 (219) n/a n/aCanada Water 283 4 (5) 1 (1) 21 (20)Residential 70 1 (1) 2 (2) – –Developments 355 31 (31) 39 (35) 13 (13)Group property portfolio valuation 9,997 413 (397) 555 (535) 34 (33)1 Includes trading properties at fair value.
Information about the impact of changes in unobservable inputs (Level 3) on the fair value of the Group’s property portfolio for the year ended 31 March 2017
Fair value at 31 March 2017
£m
Impact on valuations Impact on valuations Impact on valuations
+5% ERV £m
-5% ERV £m
-25bps NEY £m
+25bps NEY £m
-5% costs £m
+5% costs £m
Retail 4,987 189 (176) 262 (238) n/a n/aOffices1 4,019 176 (169) 231 (208) n/a n/aCanada Water 271 11 (11) 20 (17) n/a n/aResidential 93 4 (4) 6 (6) n/a n/aDevelopments 150 8 (12) (1) (2) 3 (7)Group property portfolio valuation 9,520 388 (372) 518 (471) 3 (7)1 Includes trading properties at fair value.
The valuation impact of changes in unobservable inputs for the year ended 31 March 2017 have been restated.
NOTES TO THE ACCOUNTS CONTINUED
Financial statements
122 British Land Annual Report and Accounts 2018
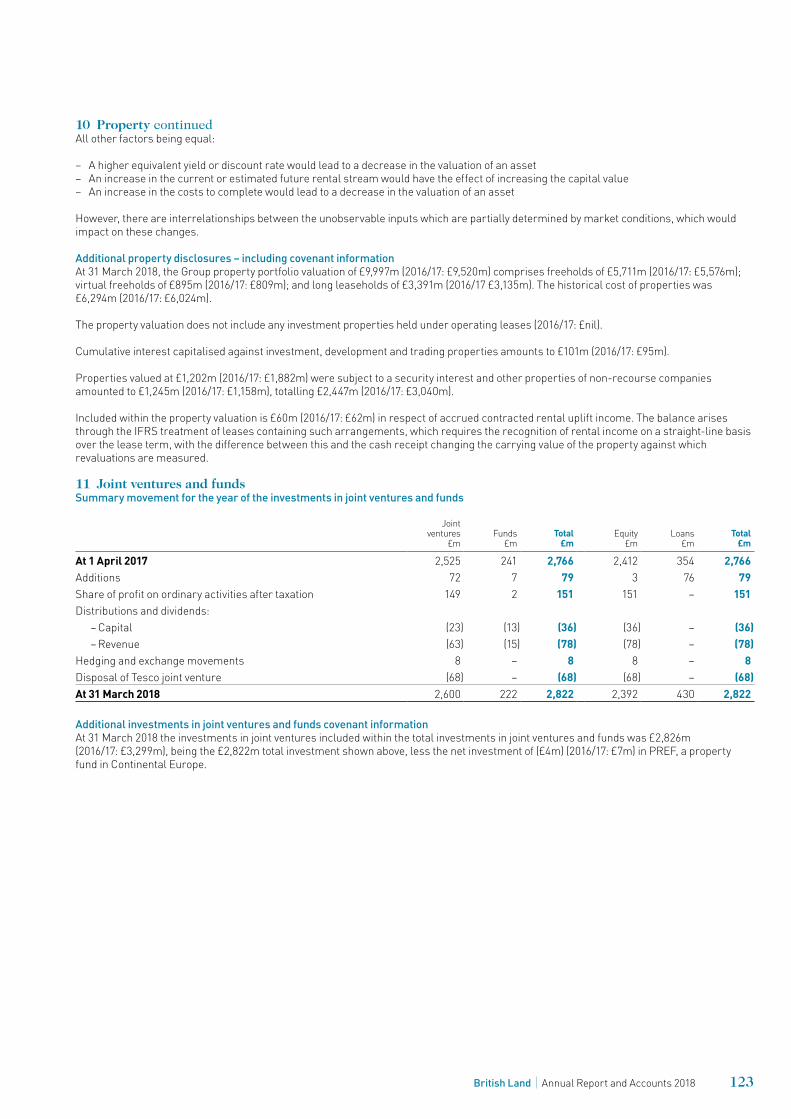
10 Property continuedAll other factors being equal:
– A higher equivalent yield or discount rate would lead to a decrease in the valuation of an asset – An increase in the current or estimated future rental stream would have the effect of increasing the capital value – An increase in the costs to complete would lead to a decrease in the valuation of an asset
However, there are interrelationships between the unobservable inputs which are partially determined by market conditions, which would impact on these changes.
Additional property disclosures – including covenant informationAt 31 March 2018, the Group property portfolio valuation of £9,997m (2016/17: £9,520m) comprises freeholds of £5,711m (2016/17: £5,576m); virtual freeholds of £895m (2016/17: £809m); and long leaseholds of £3,391m (2016/17 £3,135m). The historical cost of properties was £6,294m (2016/17: £6,024m).
The property valuation does not include any investment properties held under operating leases (2016/17: £nil).
Cumulative interest capitalised against investment, development and trading properties amounts to £101m (2016/17: £95m).
Properties valued at £1,202m (2016/17: £1,882m) were subject to a security interest and other properties of non-recourse companies amounted to £1,245m (2016/17: £1,158m), totalling £2,447m (2016/17: £3,040m).
Included within the property valuation is £60m (2016/17: £62m) in respect of accrued contracted rental uplift income. The balance arises through the IFRS treatment of leases containing such arrangements, which requires the recognition of rental income on a straight-line basis over the lease term, with the difference between this and the cash receipt changing the carrying value of the property against which revaluations are measured.
11 Joint ventures and fundsSummary movement for the year of the investments in joint ventures and funds
Joint ventures
£mFunds
£mTotal
£mEquity
£mLoans
£mTotal
£m
At 1 April 2017 2,525 241 2,766 2,412 354 2,766 Additions 72 7 79 3 76 79Share of profit on ordinary activities after taxation 149 2 151 151 – 151Distributions and dividends:
– Capital (23) (13) (36) (36) – (36) – Revenue (63) (15) (78) (78) – (78)
Hedging and exchange movements 8 – 8 8 – 8Disposal of Tesco joint venture (68) – (68) (68) – (68)At 31 March 2018 2,600 222 2,822 2,392 430 2,822
Additional investments in joint ventures and funds covenant informationAt 31 March 2018 the investments in joint ventures included within the total investments in joint ventures and funds was £2,826m (2016/17: £3,299m), being the £2,822m total investment shown above, less the net investment of (£4m) (2016/17: £7m) in PREF, a property fund in Continental Europe.
123British Land Annual Report and Accounts 2018
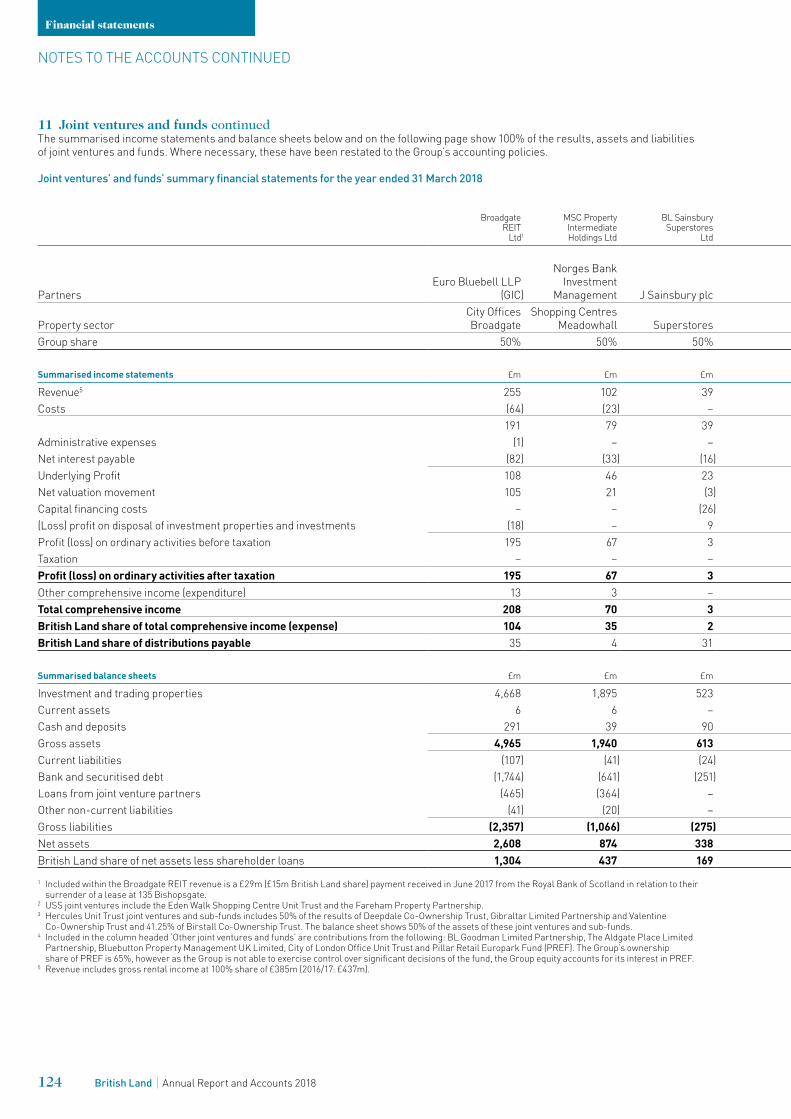
11 Joint ventures and funds continued The summarised income statements and balance sheets below and on the following page show 100% of the results, assets and liabilities of joint ventures and funds. Where necessary, these have been restated to the Group’s accounting policies.
Joint ventures’ and funds’ summary financial statements for the year ended 31 March 2018
Broadgate REIT
Ltd1
MSC PropertyIntermediateHoldings Ltd
BL SainsburySuperstores
LtdThe SouthGate Limited
Partnership
USSjoint
ventures2
Hercules Unit Trustjoint ventures
and sub-funds3
Otherjoint ventures
and funds4
Total2018
TotalGroup share
2018
PartnersEuro Bluebell LLP
(GIC)
Norges Bank Investment
Management J Sainsbury plcAviva
Investors
Universities Superannuation
Scheme Group PLC
Property sectorCity OfficesBroadgate
Shopping CentresMeadowhall Superstores
Shopping Centres
Shopping Centres
RetailParks
Group share 50% 50% 50% 50% 50% Various
Summarised income statements £m £m £m £m £m £m £m £m £m
Revenue5 255 102 39 18 13 36 6 469 235Costs (64) (23) – (4) (4) (5) (2) (102) (51)
191 79 39 14 9 31 4 367 184Administrative expenses (1) – – (1) – – – (2) (1)Net interest payable (82) (33) (16) (1) – (4) – (136) (68)Underlying Profit 108 46 23 12 9 27 4 229 115Net valuation movement 105 21 (3) 10 – (28) – 105 52Capital financing costs – – (26) – – – – (26) (13)(Loss) profit on disposal of investment properties and investments (18) – 9 1 – – 2 (6) (3)Profit (loss) on ordinary activities before taxation 195 67 3 23 9 (1) 6 302 151Taxation – – – – – – – – –Profit (loss) on ordinary activities after taxation 195 67 3 23 9 (1) 6 302 151Other comprehensive income (expenditure) 13 3 – – – – – 16 8Total comprehensive income 208 70 3 23 9 (1) 6 318 159British Land share of total comprehensive income (expense) 104 35 2 11 5 (1) 3 159British Land share of distributions payable 35 4 31 5 4 14 – 93
Summarised balance sheets £m £m £m £m £m £m £m £m £m
Investment and trading properties 4,668 1,895 523 275 250 590 – 8,201 4,100Current assets 6 6 – 1 1 4 42 60 31Cash and deposits 291 39 90 9 7 10 8 454 227Gross assets 4,965 1,940 613 285 258 604 50 8,715 4,358Current liabilities (107) (41) (24) (4) (5) (11) (15) (207) (105)Bank and securitised debt (1,744) (641) (251) – – (140) – (2,776) (1,388)Loans from joint venture partners (465) (364) – – (26) – (6) (861) (430)Other non-current liabilities (41) (20) – (28) – (4) 5 (88) (43)Gross liabilities (2,357) (1,066) (275) (32) (31) (155) (16) (3,932) (1,966)Net assets 2,608 874 338 253 227 449 34 4,783 2,392British Land share of net assets less shareholder loans 1,304 437 169 127 113 226 16 2,392 1 Included within the Broadgate REIT revenue is a £29m (£15m British Land share) payment received in June 2017 from the Royal Bank of Scotland in relation to their
surrender of a lease at 135 Bishopsgate. 2 USS joint ventures include the Eden Walk Shopping Centre Unit Trust and the Fareham Property Partnership.3 Hercules Unit Trust joint ventures and sub-funds includes 50% of the results of Deepdale Co-Ownership Trust, Gibraltar Limited Partnership and Valentine
Co-Ownership Trust and 41.25% of Birstall Co-Ownership Trust. The balance sheet shows 50% of the assets of these joint ventures and sub-funds.4 Included in the column headed ‘Other joint ventures and funds’ are contributions from the following: BL Goodman Limited Partnership, The Aldgate Place Limited
Partnership, Bluebutton Property Management UK Limited, City of London Office Unit Trust and Pillar Retail Europark Fund (PREF). The Group’s ownership share of PREF is 65%, however as the Group is not able to exercise control over significant decisions of the fund, the Group equity accounts for its interest in PREF.
5 Revenue includes gross rental income at 100% share of £385m (2016/17: £437m).
NOTES TO THE ACCOUNTS CONTINUED
Financial statements
124 British Land Annual Report and Accounts 2018
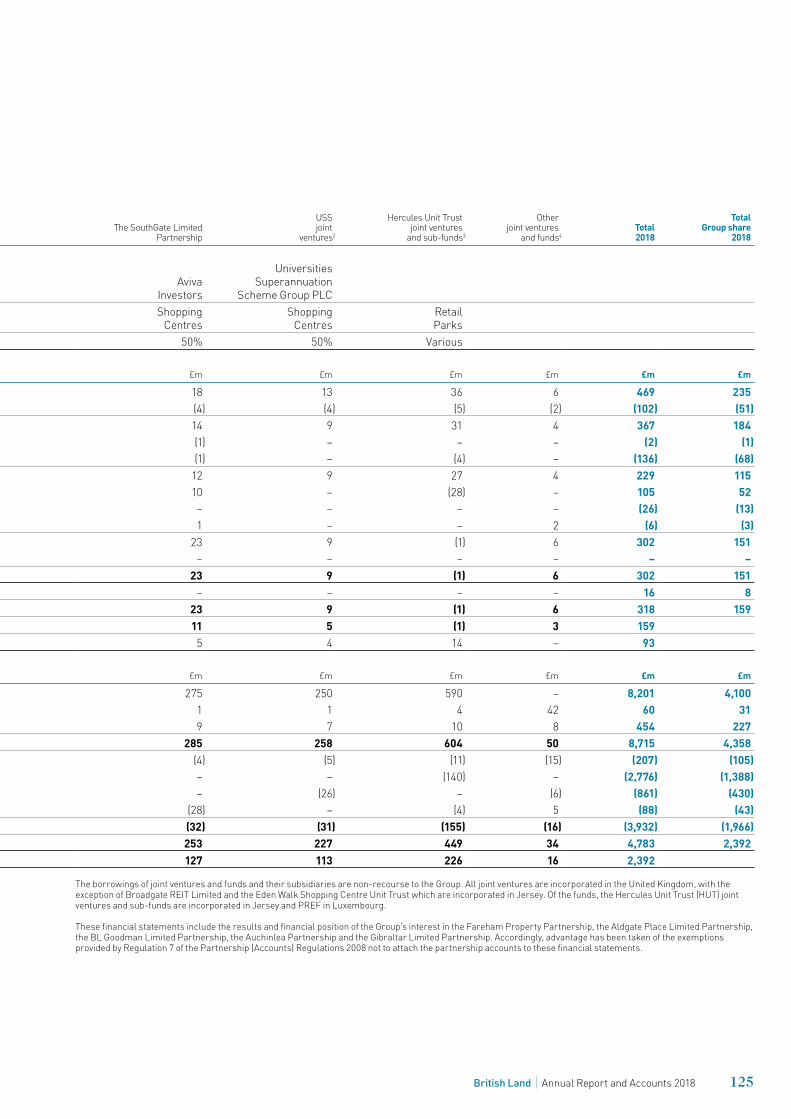
The borrowings of joint ventures and funds and their subsidiaries are non-recourse to the Group. All joint ventures are incorporated in the United Kingdom, with the exception of Broadgate REIT Limited and the Eden Walk Shopping Centre Unit Trust which are incorporated in Jersey. Of the funds, the Hercules Unit Trust (HUT) joint ventures and sub-funds are incorporated in Jersey and PREF in Luxembourg.
These financial statements include the results and financial position of the Group’s interest in the Fareham Property Partnership, the Aldgate Place Limited Partnership, the BL Goodman Limited Partnership, the Auchinlea Partnership and the Gibraltar Limited Partnership. Accordingly, advantage has been taken of the exemptions provided by Regulation 7 of the Partnership (Accounts) Regulations 2008 not to attach the partnership accounts to these financial statements.
Broadgate REIT
Ltd1
MSC PropertyIntermediateHoldings Ltd
BL SainsburySuperstores
LtdThe SouthGate Limited
Partnership
USSjoint
ventures2
Hercules Unit Trustjoint ventures
and sub-funds3
Otherjoint ventures
and funds4
Total2018
TotalGroup share
2018
PartnersEuro Bluebell LLP
(GIC)
Norges Bank Investment
Management J Sainsbury plcAviva
Investors
Universities Superannuation
Scheme Group PLC
Property sectorCity OfficesBroadgate
Shopping CentresMeadowhall Superstores
Shopping Centres
Shopping Centres
RetailParks
Group share 50% 50% 50% 50% 50% Various
Summarised income statements £m £m £m £m £m £m £m £m £m
Revenue5 255 102 39 18 13 36 6 469 235Costs (64) (23) – (4) (4) (5) (2) (102) (51)
191 79 39 14 9 31 4 367 184Administrative expenses (1) – – (1) – – – (2) (1)Net interest payable (82) (33) (16) (1) – (4) – (136) (68)Underlying Profit 108 46 23 12 9 27 4 229 115Net valuation movement 105 21 (3) 10 – (28) – 105 52Capital financing costs – – (26) – – – – (26) (13)(Loss) profit on disposal of investment properties and investments (18) – 9 1 – – 2 (6) (3)Profit (loss) on ordinary activities before taxation 195 67 3 23 9 (1) 6 302 151Taxation – – – – – – – – –Profit (loss) on ordinary activities after taxation 195 67 3 23 9 (1) 6 302 151Other comprehensive income (expenditure) 13 3 – – – – – 16 8Total comprehensive income 208 70 3 23 9 (1) 6 318 159British Land share of total comprehensive income (expense) 104 35 2 11 5 (1) 3 159British Land share of distributions payable 35 4 31 5 4 14 – 93
Summarised balance sheets £m £m £m £m £m £m £m £m £m
Investment and trading properties 4,668 1,895 523 275 250 590 – 8,201 4,100Current assets 6 6 – 1 1 4 42 60 31Cash and deposits 291 39 90 9 7 10 8 454 227Gross assets 4,965 1,940 613 285 258 604 50 8,715 4,358Current liabilities (107) (41) (24) (4) (5) (11) (15) (207) (105)Bank and securitised debt (1,744) (641) (251) – – (140) – (2,776) (1,388)Loans from joint venture partners (465) (364) – – (26) – (6) (861) (430)Other non-current liabilities (41) (20) – (28) – (4) 5 (88) (43)Gross liabilities (2,357) (1,066) (275) (32) (31) (155) (16) (3,932) (1,966)Net assets 2,608 874 338 253 227 449 34 4,783 2,392British Land share of net assets less shareholder loans 1,304 437 169 127 113 226 16 2,392
125British Land Annual Report and Accounts 2018
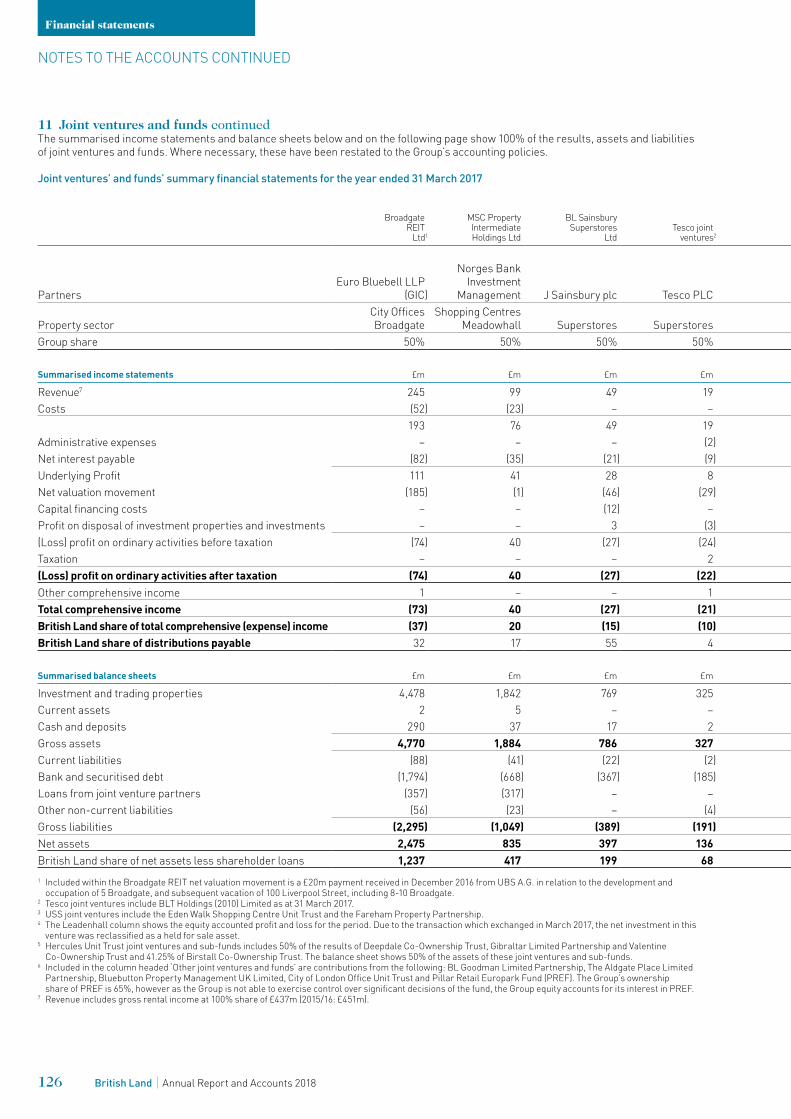
11 Joint ventures and funds continuedThe summarised income statements and balance sheets below and on the following page show 100% of the results, assets and liabilities of joint ventures and funds. Where necessary, these have been restated to the Group’s accounting policies.
Joint ventures’ and funds’ summary financial statements for the year ended 31 March 2017
Broadgate REIT
Ltd1
MSC PropertyIntermediateHoldings Ltd
BL SainsburySuperstores
Ltd Tesco joint
ventures2The SouthGate Limited
Partnership
USSjoint
ventures3
LeadenhallHolding Co(Jersey) Ltd4
Hercules Unit Trustjoint ventures
and sub-funds5
Otherjoint ventures
and funds6
Total2017
TotalGroup share
2017
PartnersEuro Bluebell LLP
(GIC)
Norges Bank Investment
Management J Sainsbury plc Tesco PLCAviva
Investors
Universities Superannuation Scheme Group
PLCOxford
Properties
Property sectorCity OfficesBroadgate
Shopping CentresMeadowhall Superstores Superstores
Shopping Centres
Shopping Centres
City OfficesLeadenhall
RetailParks
Group share 50% 50% 50% 50% 50% 50% 50% Various
Summarised income statements £m £m £m £m £m £m £m £m £m £m £m
Revenue7 245 99 49 19 17 14 43 35 1 522 260Costs (52) (23) – – (5) (5) (10) (4) (1) (100) (50)
193 76 49 19 12 9 33 31 – 422 210Administrative expenses – – – (2) (1) – – – (1) (4) (2)Net interest payable (82) (35) (21) (9) (1) – – (4) – (152) (76)Underlying Profit 111 41 28 8 10 9 33 27 (1) 266 132Net valuation movement (185) (1) (46) (29) (6) (7) 107 (16) – (183) (93)Capital financing costs – – (12) – – – – – – (12) (6)Profit on disposal of investment properties and investments – – 3 (3) – – – – 34 34 18(Loss) profit on ordinary activities before taxation (74) 40 (27) (24) 4 2 140 11 33 105 51Taxation – – – 2 – – – – – 2 1(Loss) profit on ordinary activities after taxation (74) 40 (27) (22) 4 2 140 11 33 107 52Other comprehensive income 1 – – 1 – – – – – 2 1Total comprehensive income (73) 40 (27) (21) 4 2 140 11 33 109 53British Land share of total comprehensive (expense) income (37) 20 (15) (10) 2 1 70 5 17 53British Land share of distributions payable 32 17 55 4 1 – 5 14 4 132
Summarised balance sheets £m £m £m £m £m £m £m £m £m £m £m
Investment and trading properties 4,478 1,842 769 325 264 247 – 603 1 8,529 4,265Current assets 2 5 – – 1 1 3 52 64 32Cash and deposits 290 37 17 2 8 7 – 10 28 399 200Gross assets 4,770 1,884 786 327 273 255 – 616 81 8,992 4,497Current liabilities (88) (41) (22) (2) (4) (6) – (10) (19) (192) (96)Bank and securitised debt (1,794) (668) (367) (185) – – – (139) – (3,153) (1,577)Loans from joint venture partners (357) (317) – – – (22) – – (12) (708) (354)Other non-current liabilities (56) (23) – (4) (28) – – (4) – (115) (58)Gross liabilities (2,295) (1,049) (389) (191) (32) (28) – (153) (31) (4,168) (2,085)Net assets 2,475 835 397 136 241 227 – 463 50 4,824 2,412British Land share of net assets less shareholder loans 1,237 417 199 68 121 114 – 231 25 2,4121 Included within the Broadgate REIT net valuation movement is a £20m payment received in December 2016 from UBS A.G. in relation to the development and
occupation of 5 Broadgate, and subsequent vacation of 100 Liverpool Street, including 8-10 Broadgate. 2 Tesco joint ventures include BLT Holdings (2010) Limited as at 31 March 2017.3 USS joint ventures include the Eden Walk Shopping Centre Unit Trust and the Fareham Property Partnership.4 The Leadenhall column shows the equity accounted profit and loss for the period. Due to the transaction which exchanged in March 2017, the net investment in this
venture was reclassified as a held for sale asset.5 Hercules Unit Trust joint ventures and sub-funds includes 50% of the results of Deepdale Co-Ownership Trust, Gibraltar Limited Partnership and Valentine
Co-Ownership Trust and 41.25% of Birstall Co-Ownership Trust. The balance sheet shows 50% of the assets of these joint ventures and sub-funds.6 Included in the column headed ‘Other joint ventures and funds’ are contributions from the following: BL Goodman Limited Partnership, The Aldgate Place Limited
Partnership, Bluebutton Property Management UK Limited, City of London Office Unit Trust and Pillar Retail Europark Fund (PREF). The Group’s ownership share of PREF is 65%, however as the Group is not able to exercise control over significant decisions of the fund, the Group equity accounts for its interest in PREF.
7 Revenue includes gross rental income at 100% share of £437m (2015/16: £451m).
NOTES TO THE ACCOUNTS CONTINUED
Financial statements
126 British Land Annual Report and Accounts 2018
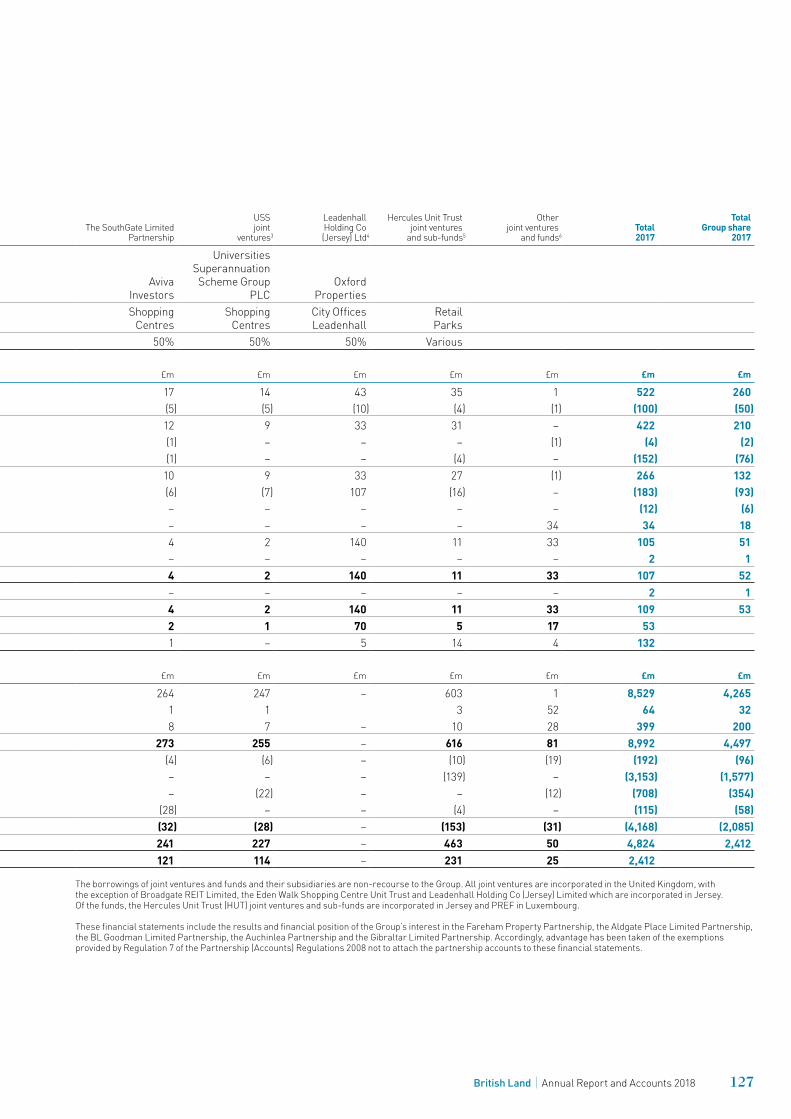
Broadgate REIT
Ltd1
MSC PropertyIntermediateHoldings Ltd
BL SainsburySuperstores
Ltd Tesco joint
ventures2The SouthGate Limited
Partnership
USSjoint
ventures3
LeadenhallHolding Co(Jersey) Ltd4
Hercules Unit Trustjoint ventures
and sub-funds5
Otherjoint ventures
and funds6
Total2017
TotalGroup share
2017
PartnersEuro Bluebell LLP
(GIC)
Norges Bank Investment
Management J Sainsbury plc Tesco PLCAviva
Investors
Universities Superannuation Scheme Group
PLCOxford
Properties
Property sectorCity OfficesBroadgate
Shopping CentresMeadowhall Superstores Superstores
Shopping Centres
Shopping Centres
City OfficesLeadenhall
RetailParks
Group share 50% 50% 50% 50% 50% 50% 50% Various
Summarised income statements £m £m £m £m £m £m £m £m £m £m £m
Revenue7 245 99 49 19 17 14 43 35 1 522 260Costs (52) (23) – – (5) (5) (10) (4) (1) (100) (50)
193 76 49 19 12 9 33 31 – 422 210Administrative expenses – – – (2) (1) – – – (1) (4) (2)Net interest payable (82) (35) (21) (9) (1) – – (4) – (152) (76)Underlying Profit 111 41 28 8 10 9 33 27 (1) 266 132Net valuation movement (185) (1) (46) (29) (6) (7) 107 (16) – (183) (93)Capital financing costs – – (12) – – – – – – (12) (6)Profit on disposal of investment properties and investments – – 3 (3) – – – – 34 34 18(Loss) profit on ordinary activities before taxation (74) 40 (27) (24) 4 2 140 11 33 105 51Taxation – – – 2 – – – – – 2 1(Loss) profit on ordinary activities after taxation (74) 40 (27) (22) 4 2 140 11 33 107 52Other comprehensive income 1 – – 1 – – – – – 2 1Total comprehensive income (73) 40 (27) (21) 4 2 140 11 33 109 53British Land share of total comprehensive (expense) income (37) 20 (15) (10) 2 1 70 5 17 53British Land share of distributions payable 32 17 55 4 1 – 5 14 4 132
Summarised balance sheets £m £m £m £m £m £m £m £m £m £m £m
Investment and trading properties 4,478 1,842 769 325 264 247 – 603 1 8,529 4,265Current assets 2 5 – – 1 1 3 52 64 32Cash and deposits 290 37 17 2 8 7 – 10 28 399 200Gross assets 4,770 1,884 786 327 273 255 – 616 81 8,992 4,497Current liabilities (88) (41) (22) (2) (4) (6) – (10) (19) (192) (96)Bank and securitised debt (1,794) (668) (367) (185) – – – (139) – (3,153) (1,577)Loans from joint venture partners (357) (317) – – – (22) – – (12) (708) (354)Other non-current liabilities (56) (23) – (4) (28) – – (4) – (115) (58)Gross liabilities (2,295) (1,049) (389) (191) (32) (28) – (153) (31) (4,168) (2,085)Net assets 2,475 835 397 136 241 227 – 463 50 4,824 2,412British Land share of net assets less shareholder loans 1,237 417 199 68 121 114 – 231 25 2,4121 Included within the Broadgate REIT net valuation movement is a £20m payment received in December 2016 from UBS A.G. in relation to the development and
occupation of 5 Broadgate, and subsequent vacation of 100 Liverpool Street, including 8-10 Broadgate. 2 Tesco joint ventures include BLT Holdings (2010) Limited as at 31 March 2017.3 USS joint ventures include the Eden Walk Shopping Centre Unit Trust and the Fareham Property Partnership.4 The Leadenhall column shows the equity accounted profit and loss for the period. Due to the transaction which exchanged in March 2017, the net investment in this
venture was reclassified as a held for sale asset.5 Hercules Unit Trust joint ventures and sub-funds includes 50% of the results of Deepdale Co-Ownership Trust, Gibraltar Limited Partnership and Valentine
Co-Ownership Trust and 41.25% of Birstall Co-Ownership Trust. The balance sheet shows 50% of the assets of these joint ventures and sub-funds.6 Included in the column headed ‘Other joint ventures and funds’ are contributions from the following: BL Goodman Limited Partnership, The Aldgate Place Limited
Partnership, Bluebutton Property Management UK Limited, City of London Office Unit Trust and Pillar Retail Europark Fund (PREF). The Group’s ownership share of PREF is 65%, however as the Group is not able to exercise control over significant decisions of the fund, the Group equity accounts for its interest in PREF.
7 Revenue includes gross rental income at 100% share of £437m (2015/16: £451m).
The borrowings of joint ventures and funds and their subsidiaries are non-recourse to the Group. All joint ventures are incorporated in the United Kingdom, with the exception of Broadgate REIT Limited, the Eden Walk Shopping Centre Unit Trust and Leadenhall Holding Co (Jersey) Limited which are incorporated in Jersey. Of the funds, the Hercules Unit Trust (HUT) joint ventures and sub-funds are incorporated in Jersey and PREF in Luxembourg.
These financial statements include the results and financial position of the Group’s interest in the Fareham Property Partnership, the Aldgate Place Limited Partnership, the BL Goodman Limited Partnership, the Auchinlea Partnership and the Gibraltar Limited Partnership. Accordingly, advantage has been taken of the exemptions provided by Regulation 7 of the Partnership (Accounts) Regulations 2008 not to attach the partnership accounts to these financial statements.
127British Land Annual Report and Accounts 2018
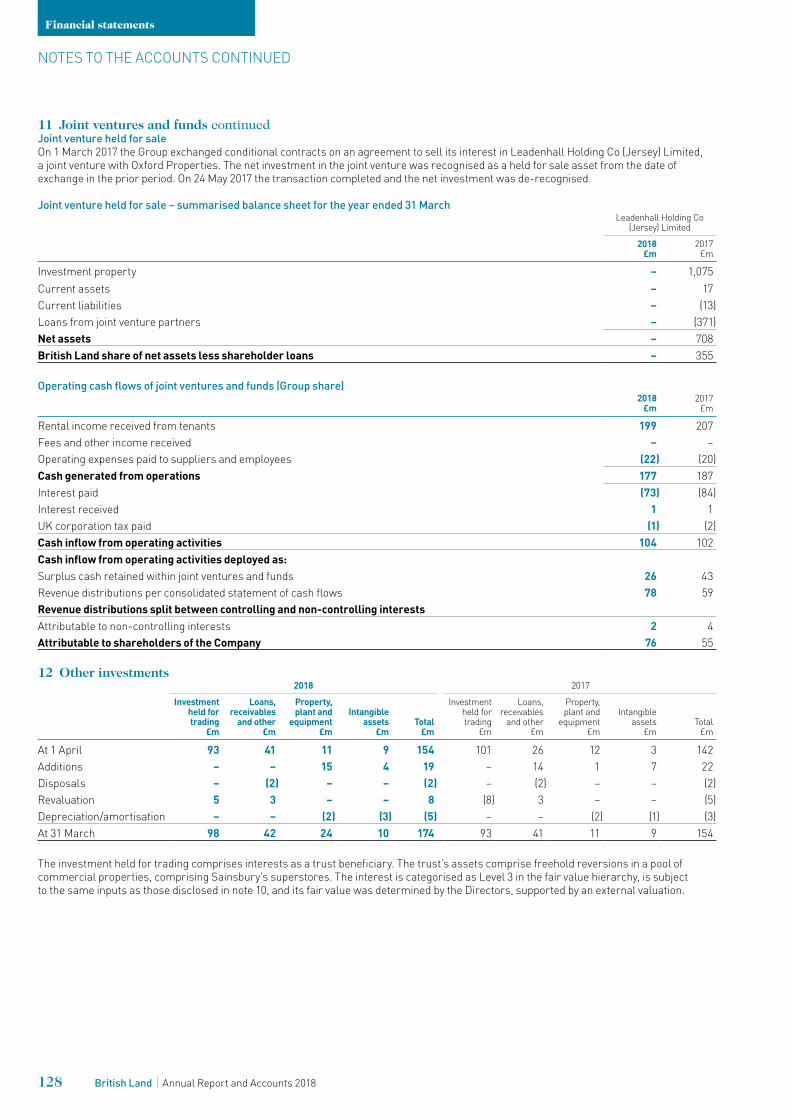
11 Joint ventures and funds continuedJoint venture held for saleOn 1 March 2017 the Group exchanged conditional contracts on an agreement to sell its interest in Leadenhall Holding Co (Jersey) Limited, a joint venture with Oxford Properties. The net investment in the joint venture was recognised as a held for sale asset from the date of exchange in the prior period. On 24 May 2017 the transaction completed and the net investment was de-recognised.
Joint venture held for sale – summarised balance sheet for the year ended 31 MarchLeadenhall Holding Co
(Jersey) Limited
2018£m
2017£m
Investment property – 1,075Current assets – 17Current liabilities – (13)Loans from joint venture partners – (371)Net assets – 708British Land share of net assets less shareholder loans – 355
Operating cash flows of joint ventures and funds (Group share)2018
£m2017
£m
Rental income received from tenants 199 207Fees and other income received – –Operating expenses paid to suppliers and employees (22) (20)Cash generated from operations 177 187Interest paid (73) (84)Interest received 1 1UK corporation tax paid (1) (2)Cash inflow from operating activities 104 102Cash inflow from operating activities deployed as:Surplus cash retained within joint ventures and funds 26 43Revenue distributions per consolidated statement of cash flows 78 59Revenue distributions split between controlling and non-controlling interestsAttributable to non-controlling interests 2 4Attributable to shareholders of the Company 76 55
12 Other investments2018 2017
Investment held for trading
£m
Loans, receivables
and other £m
Property, plant and
equipment £m
Intangible assets
£mTotal
£m
Investment held for trading
£m
Loans, receivables
and other £m
Property, plant and
equipment £m
Intangible assets
£mTotal
£m
At 1 April 93 41 11 9 154 101 26 12 3 142Additions – – 15 4 19 – 14 1 7 22Disposals – (2) – – (2) – (2) – – (2)Revaluation 5 3 – – 8 (8) 3 – – (5)Depreciation/amortisation – – (2) (3) (5) – – (2) (1) (3)At 31 March 98 42 24 10 174 93 41 11 9 154
The investment held for trading comprises interests as a trust beneficiary. The trust’s assets comprise freehold reversions in a pool of commercial properties, comprising Sainsbury’s superstores. The interest is categorised as Level 3 in the fair value hierarchy, is subject to the same inputs as those disclosed in note 10, and its fair value was determined by the Directors, supported by an external valuation.
NOTES TO THE ACCOUNTS CONTINUED
Financial statements
128 British Land Annual Report and Accounts 2018
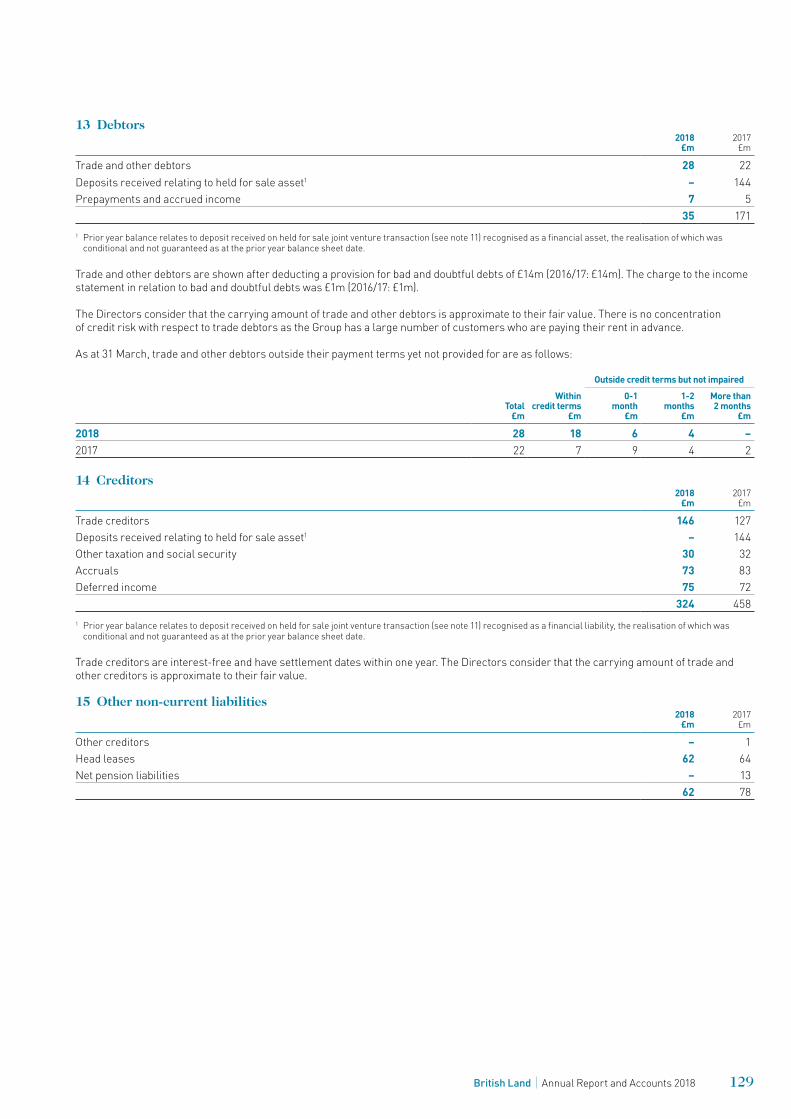
13 Debtors2018
£m2017
£m
Trade and other debtors 28 22Deposits received relating to held for sale asset1 – 144Prepayments and accrued income 7 5
35 1711 Prior year balance relates to deposit received on held for sale joint venture transaction (see note 11) recognised as a financial asset, the realisation of which was
conditional and not guaranteed as at the prior year balance sheet date.
Trade and other debtors are shown after deducting a provision for bad and doubtful debts of £14m (2016/17: £14m). The charge to the income statement in relation to bad and doubtful debts was £1m (2016/17: £1m).
The Directors consider that the carrying amount of trade and other debtors is approximate to their fair value. There is no concentration of credit risk with respect to trade debtors as the Group has a large number of customers who are paying their rent in advance.
As at 31 March, trade and other debtors outside their payment terms yet not provided for are as follows:
Total£m
Withincredit terms
£m
Outside credit terms but not impaired0-1
month £m
1-2months
£m
More than 2 months
£m
2018 28 18 6 4 –2017 22 7 9 4 2
14 Creditors2018
£m2017
£m
Trade creditors 146 127Deposits received relating to held for sale asset1 – 144Other taxation and social security 30 32Accruals 73 83Deferred income 75 72
324 4581 Prior year balance relates to deposit received on held for sale joint venture transaction (see note 11) recognised as a financial liability, the realisation of which was
conditional and not guaranteed as at the prior year balance sheet date.
Trade creditors are interest-free and have settlement dates within one year. The Directors consider that the carrying amount of trade and other creditors is approximate to their fair value.
15 Other non-current liabilities2018
£m2017
£m
Other creditors – 1Head leases 62 64Net pension liabilities – 13
62 78
129British Land Annual Report and Accounts 2018
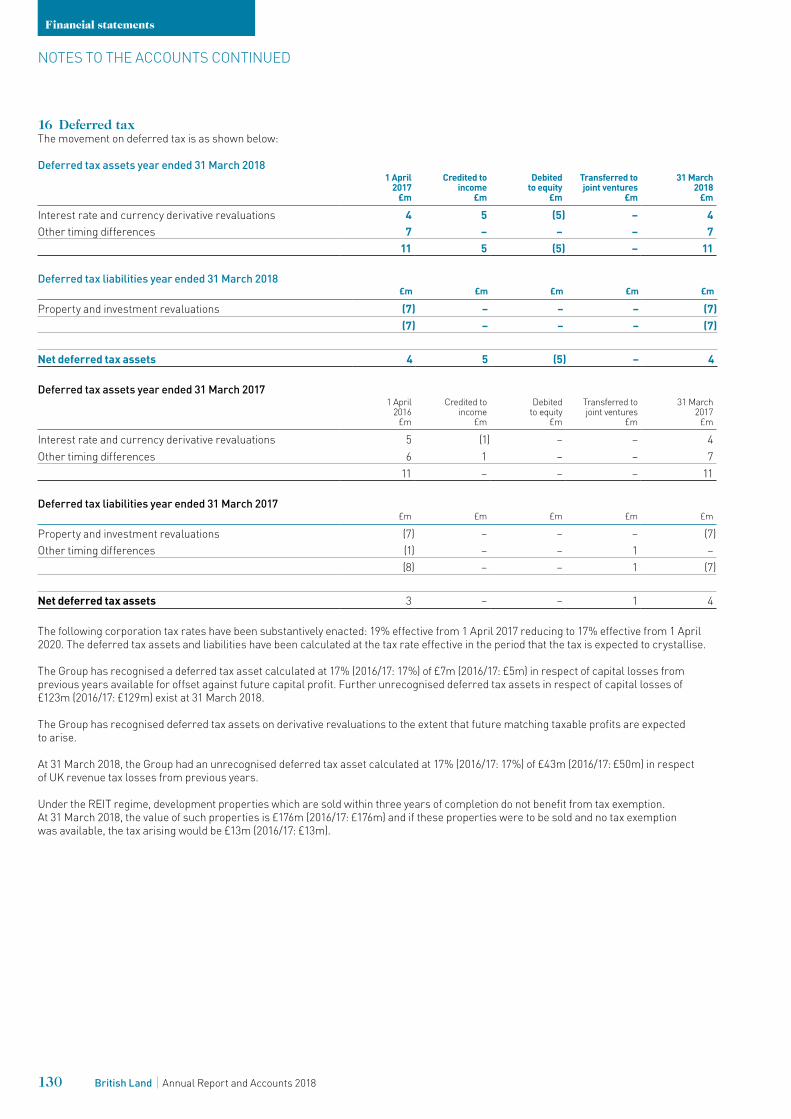
16 Deferred taxThe movement on deferred tax is as shown below:
Deferred tax assets year ended 31 March 20181 April
2017 £m
Credited to income
£m
Debited to equity
£m
Transferred to joint ventures
£m
31 March 2018
£m
Interest rate and currency derivative revaluations 4 5 (5) – 4Other timing differences 7 – – – 7
11 5 (5) – 11
Deferred tax liabilities year ended 31 March 2018£m £m £m £m £m
Property and investment revaluations (7) – – – (7)(7) – – – (7)
Net deferred tax assets 4 5 (5) – 4
Deferred tax assets year ended 31 March 20171 April
2016 £m
Credited to income
£m
Debited to equity
£m
Transferred to joint ventures
£m
31 March 2017
£m
Interest rate and currency derivative revaluations 5 (1) – – 4Other timing differences 6 1 – – 7
11 – – – 11
Deferred tax liabilities year ended 31 March 2017£m £m £m £m £m
Property and investment revaluations (7) – – – (7)Other timing differences (1) – – 1 –
(8) – – 1 (7)
Net deferred tax assets 3 – – 1 4
The following corporation tax rates have been substantively enacted: 19% effective from 1 April 2017 reducing to 17% effective from 1 April 2020. The deferred tax assets and liabilities have been calculated at the tax rate effective in the period that the tax is expected to crystallise.
The Group has recognised a deferred tax asset calculated at 17% (2016/17: 17%) of £7m (2016/17: £5m) in respect of capital losses from previous years available for offset against future capital profit. Further unrecognised deferred tax assets in respect of capital losses of £123m (2016/17: £129m) exist at 31 March 2018.
The Group has recognised deferred tax assets on derivative revaluations to the extent that future matching taxable profits are expected to arise.
At 31 March 2018, the Group had an unrecognised deferred tax asset calculated at 17% (2016/17: 17%) of £43m (2016/17: £50m) in respect of UK revenue tax losses from previous years.
Under the REIT regime, development properties which are sold within three years of completion do not benefit from tax exemption. At 31 March 2018, the value of such properties is £176m (2016/17: £176m) and if these properties were to be sold and no tax exemption was available, the tax arising would be £13m (2016/17: £13m).
NOTES TO THE ACCOUNTS CONTINUED
Financial statements
130 British Land Annual Report and Accounts 2018
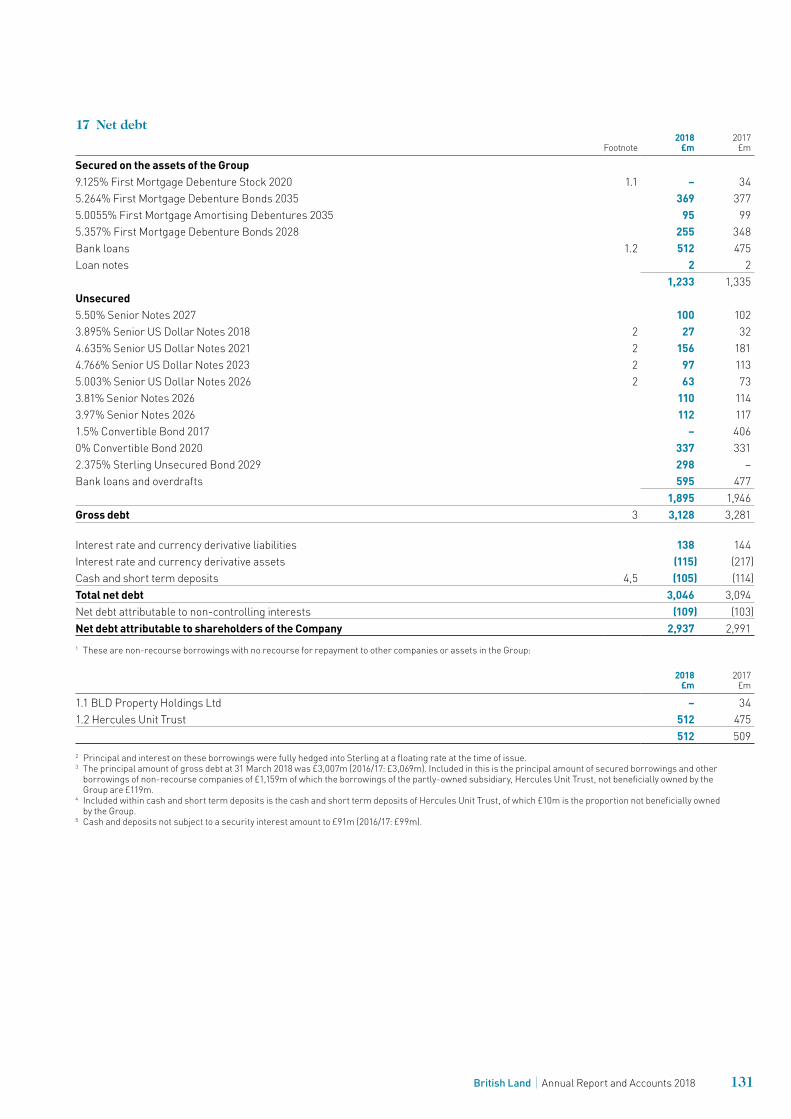
17 Net debt
Footnote2018
£m2017
£m
Secured on the assets of the Group9.125% First Mortgage Debenture Stock 2020 1.1 – 345.264% First Mortgage Debenture Bonds 2035 369 3775.0055% First Mortgage Amortising Debentures 2035 95 995.357% First Mortgage Debenture Bonds 2028 255 348Bank loans 1.2 512 475Loan notes 2 2
1,233 1,335Unsecured5.50% Senior Notes 2027 100 1023.895% Senior US Dollar Notes 2018 2 27 324.635% Senior US Dollar Notes 2021 2 156 1814.766% Senior US Dollar Notes 2023 2 97 1135.003% Senior US Dollar Notes 2026 2 63 733.81% Senior Notes 2026 110 1143.97% Senior Notes 2026 112 1171.5% Convertible Bond 2017 – 4060% Convertible Bond 2020 337 3312.375% Sterling Unsecured Bond 2029 298 –Bank loans and overdrafts 595 477
1,895 1,946Gross debt 3 3,128 3,281
Interest rate and currency derivative liabilities 138 144Interest rate and currency derivative assets (115) (217)Cash and short term deposits 4,5 (105) (114)Total net debt 3,046 3,094Net debt attributable to non-controlling interests (109) (103)Net debt attributable to shareholders of the Company 2,937 2,9911 These are non-recourse borrowings with no recourse for repayment to other companies or assets in the Group:
2018 £m
2017 £m
1.1 BLD Property Holdings Ltd – 341.2 Hercules Unit Trust 512 475
512 5092 Principal and interest on these borrowings were fully hedged into Sterling at a floating rate at the time of issue.3 The principal amount of gross debt at 31 March 2018 was £3,007m (2016/17: £3,069m). Included in this is the principal amount of secured borrowings and other
borrowings of non-recourse companies of £1,159m of which the borrowings of the partly-owned subsidiary, Hercules Unit Trust, not beneficially owned by the Group are £119m.
4 Included within cash and short term deposits is the cash and short term deposits of Hercules Unit Trust, of which £10m is the proportion not beneficially owned by the Group.
5 Cash and deposits not subject to a security interest amount to £91m (2016/17: £99m).
131British Land Annual Report and Accounts 2018
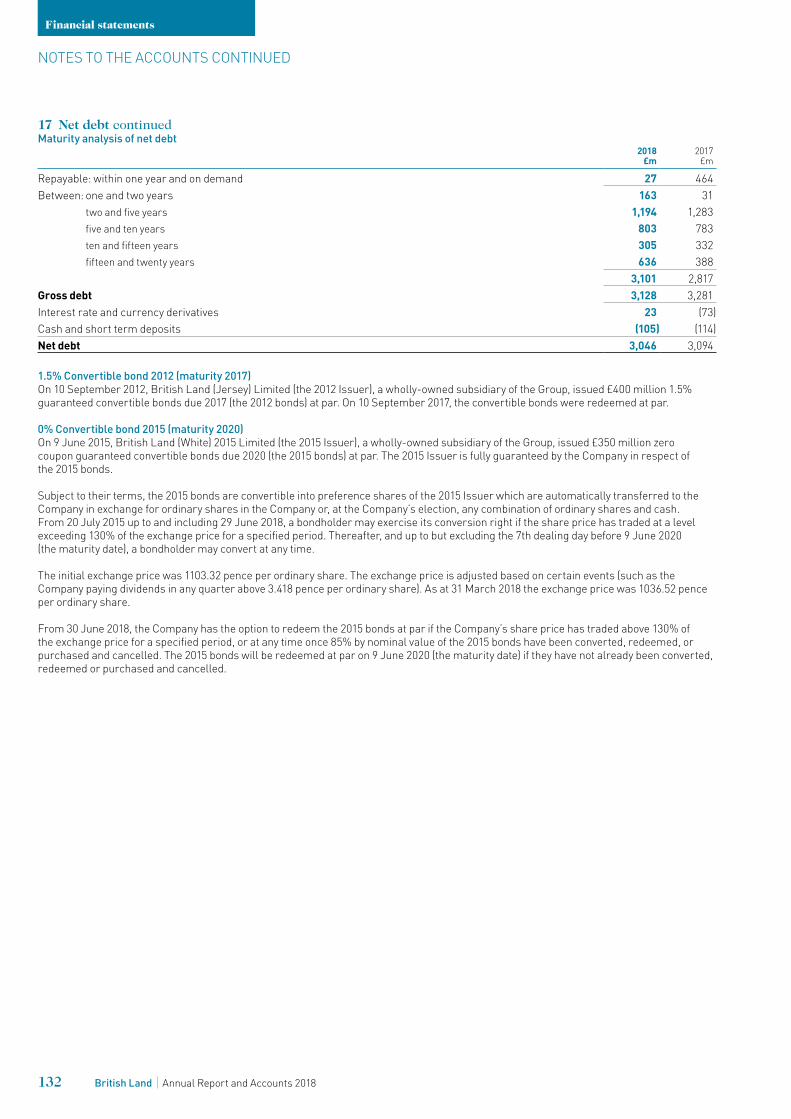
17 Net debt continuedMaturity analysis of net debt
2018 £m
2017 £m
Repayable: within one year and on demand 27 464Between: one and two years 163 31
two and five years 1,194 1,283 five and ten years 803 783 ten and fifteen years 305 332 fifteen and twenty years 636 388
3,101 2,817Gross debt 3,128 3,281Interest rate and currency derivatives 23 (73)Cash and short term deposits (105) (114)Net debt 3,046 3,094
1.5% Convertible bond 2012 (maturity 2017)On 10 September 2012, British Land (Jersey) Limited (the 2012 Issuer), a wholly-owned subsidiary of the Group, issued £400 million 1.5% guaranteed convertible bonds due 2017 (the 2012 bonds) at par. On 10 September 2017, the convertible bonds were redeemed at par.
0% Convertible bond 2015 (maturity 2020)On 9 June 2015, British Land (White) 2015 Limited (the 2015 Issuer), a wholly-owned subsidiary of the Group, issued £350 million zero coupon guaranteed convertible bonds due 2020 (the 2015 bonds) at par. The 2015 Issuer is fully guaranteed by the Company in respect of the 2015 bonds.
Subject to their terms, the 2015 bonds are convertible into preference shares of the 2015 Issuer which are automatically transferred to the Company in exchange for ordinary shares in the Company or, at the Company’s election, any combination of ordinary shares and cash. From 20 July 2015 up to and including 29 June 2018, a bondholder may exercise its conversion right if the share price has traded at a level exceeding 130% of the exchange price for a specified period. Thereafter, and up to but excluding the 7th dealing day before 9 June 2020 (the maturity date), a bondholder may convert at any time.
The initial exchange price was 1103.32 pence per ordinary share. The exchange price is adjusted based on certain events (such as the Company paying dividends in any quarter above 3.418 pence per ordinary share). As at 31 March 2018 the exchange price was 1036.52 pence per ordinary share.
From 30 June 2018, the Company has the option to redeem the 2015 bonds at par if the Company’s share price has traded above 130% of the exchange price for a specified period, or at any time once 85% by nominal value of the 2015 bonds have been converted, redeemed, or purchased and cancelled. The 2015 bonds will be redeemed at par on 9 June 2020 (the maturity date) if they have not already been converted, redeemed or purchased and cancelled.
NOTES TO THE ACCOUNTS CONTINUED
Financial statements
132 British Land Annual Report and Accounts 2018
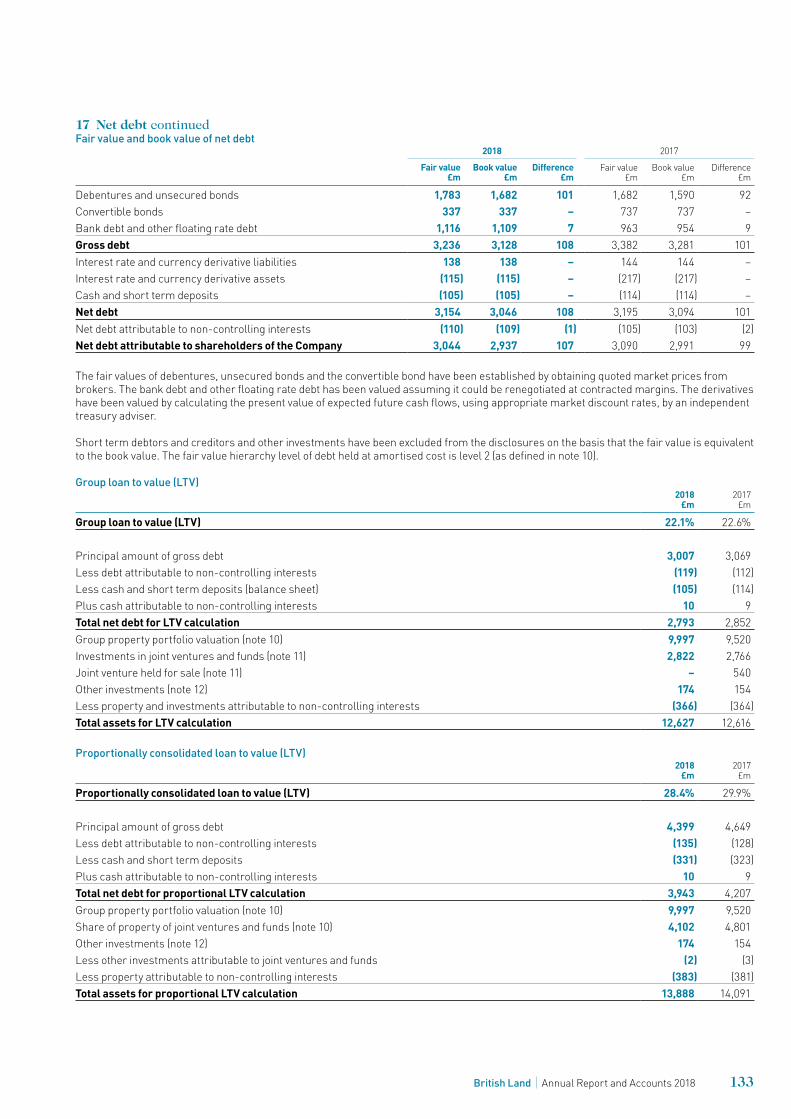
17 Net debt continuedFair value and book value of net debt
2018 2017
Fair value £m
Book value £m
Difference £m
Fair value £m
Book value £m
Difference £m
Debentures and unsecured bonds 1,783 1,682 101 1,682 1,590 92Convertible bonds 337 337 – 737 737 –Bank debt and other floating rate debt 1,116 1,109 7 963 954 9Gross debt 3,236 3,128 108 3,382 3,281 101Interest rate and currency derivative liabilities 138 138 – 144 144 –Interest rate and currency derivative assets (115) (115) – (217) (217) –Cash and short term deposits (105) (105) – (114) (114) –Net debt 3,154 3,046 108 3,195 3,094 101Net debt attributable to non-controlling interests (110) (109) (1) (105) (103) (2)Net debt attributable to shareholders of the Company 3,044 2,937 107 3,090 2,991 99
The fair values of debentures, unsecured bonds and the convertible bond have been established by obtaining quoted market prices from brokers. The bank debt and other floating rate debt has been valued assuming it could be renegotiated at contracted margins. The derivatives have been valued by calculating the present value of expected future cash flows, using appropriate market discount rates, by an independent treasury adviser.
Short term debtors and creditors and other investments have been excluded from the disclosures on the basis that the fair value is equivalent to the book value. The fair value hierarchy level of debt held at amortised cost is level 2 (as defined in note 10).
Group loan to value (LTV)2018
£m2017
£m
Group loan to value (LTV) 22.1% 22.6%
Principal amount of gross debt 3,007 3,069Less debt attributable to non-controlling interests (119) (112)Less cash and short term deposits (balance sheet) (105) (114)Plus cash attributable to non-controlling interests 10 9Total net debt for LTV calculation 2,793 2,852Group property portfolio valuation (note 10) 9,997 9,520 Investments in joint ventures and funds (note 11) 2,822 2,766 Joint venture held for sale (note 11) – 540Other investments (note 12) 174 154 Less property and investments attributable to non-controlling interests (366) (364)Total assets for LTV calculation 12,627 12,616
Proportionally consolidated loan to value (LTV)2018
£m2017
£m
Proportionally consolidated loan to value (LTV) 28.4% 29.9%
Principal amount of gross debt 4,399 4,649Less debt attributable to non-controlling interests (135) (128)Less cash and short term deposits (331) (323)Plus cash attributable to non-controlling interests 10 9Total net debt for proportional LTV calculation 3,943 4,207Group property portfolio valuation (note 10) 9,997 9,520Share of property of joint ventures and funds (note 10) 4,102 4,801Other investments (note 12) 174 154Less other investments attributable to joint ventures and funds (2) (3)Less property attributable to non-controlling interests (383) (381)Total assets for proportional LTV calculation 13,888 14,091
133British Land Annual Report and Accounts 2018
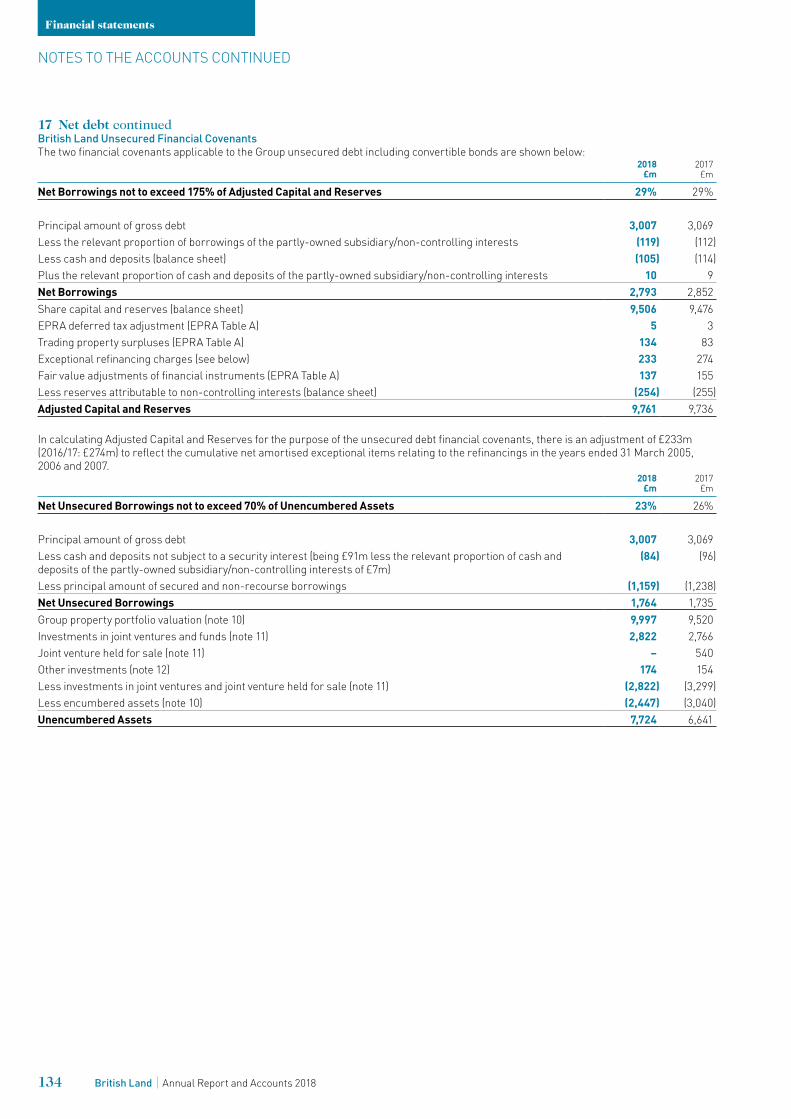
17 Net debt continuedBritish Land Unsecured Financial CovenantsThe two financial covenants applicable to the Group unsecured debt including convertible bonds are shown below:
2018 £m
2017 £m
Net Borrowings not to exceed 175% of Adjusted Capital and Reserves 29% 29%
Principal amount of gross debt 3,007 3,069 Less the relevant proportion of borrowings of the partly-owned subsidiary/non-controlling interests (119) (112)Less cash and deposits (balance sheet) (105) (114)Plus the relevant proportion of cash and deposits of the partly-owned subsidiary/non-controlling interests 10 9 Net Borrowings 2,793 2,852 Share capital and reserves (balance sheet) 9,506 9,476 EPRA deferred tax adjustment (EPRA Table A) 5 3Trading property surpluses (EPRA Table A) 134 83 Exceptional refinancing charges (see below) 233 274 Fair value adjustments of financial instruments (EPRA Table A) 137 155 Less reserves attributable to non-controlling interests (balance sheet) (254) (255)Adjusted Capital and Reserves 9,761 9,736
In calculating Adjusted Capital and Reserves for the purpose of the unsecured debt financial covenants, there is an adjustment of £233m (2016/17: £274m) to reflect the cumulative net amortised exceptional items relating to the refinancings in the years ended 31 March 2005, 2006 and 2007.
2018 £m
2017 £m
Net Unsecured Borrowings not to exceed 70% of Unencumbered Assets 23% 26%
Principal amount of gross debt 3,007 3,069 Less cash and deposits not subject to a security interest (being £91m less the relevant proportion of cash and deposits of the partly-owned subsidiary/non-controlling interests of £7m)
(84) (96)
Less principal amount of secured and non-recourse borrowings (1,159) (1,238)Net Unsecured Borrowings 1,764 1,735 Group property portfolio valuation (note 10) 9,997 9,520Investments in joint ventures and funds (note 11) 2,822 2,766Joint venture held for sale (note 11) – 540Other investments (note 12) 174 154Less investments in joint ventures and joint venture held for sale (note 11) (2,822) (3,299)Less encumbered assets (note 10) (2,447) (3,040)Unencumbered Assets 7,724 6,641
NOTES TO THE ACCOUNTS CONTINUED
Financial statements
134 British Land Annual Report and Accounts 2018
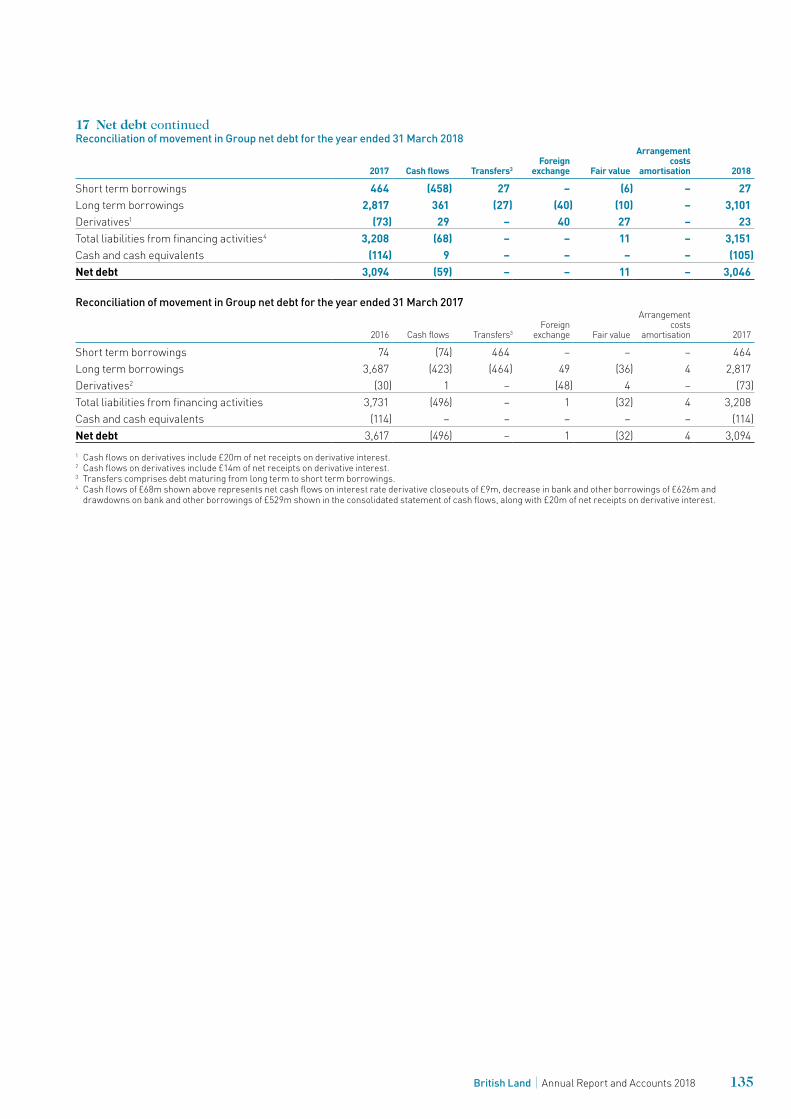
17 Net debt continuedReconciliation of movement in Group net debt for the year ended 31 March 2018
2017 Cash flows Transfers3Foreign
exchange Fair value
Arrangement costs
amortisation 2018
Short term borrowings 464 (458) 27 – (6) – 27Long term borrowings 2,817 361 (27) (40) (10) – 3,101Derivatives1 (73) 29 – 40 27 – 23Total liabilities from financing activities4 3,208 (68) – – 11 – 3,151Cash and cash equivalents (114) 9 – – – – (105)Net debt 3,094 (59) – – 11 – 3,046
Reconciliation of movement in Group net debt for the year ended 31 March 2017
2016 Cash flows Transfers3Foreign
exchange Fair value
Arrangement costs
amortisation 2017
Short term borrowings 74 (74) 464 – – – 464Long term borrowings 3,687 (423) (464) 49 (36) 4 2,817Derivatives2 (30) 1 – (48) 4 – (73)Total liabilities from financing activities 3,731 (496) – 1 (32) 4 3,208Cash and cash equivalents (114) – – – – – (114)Net debt 3,617 (496) – 1 (32) 4 3,0941 Cash flows on derivatives include £20m of net receipts on derivative interest.2 Cash flows on derivatives include £14m of net receipts on derivative interest.3 Transfers comprises debt maturing from long term to short term borrowings.4 Cash flows of £68m shown above represents net cash flows on interest rate derivative closeouts of £9m, decrease in bank and other borrowings of £626m and
drawdowns on bank and other borrowings of £529m shown in the consolidated statement of cash flows, along with £20m of net receipts on derivative interest.
135British Land Annual Report and Accounts 2018
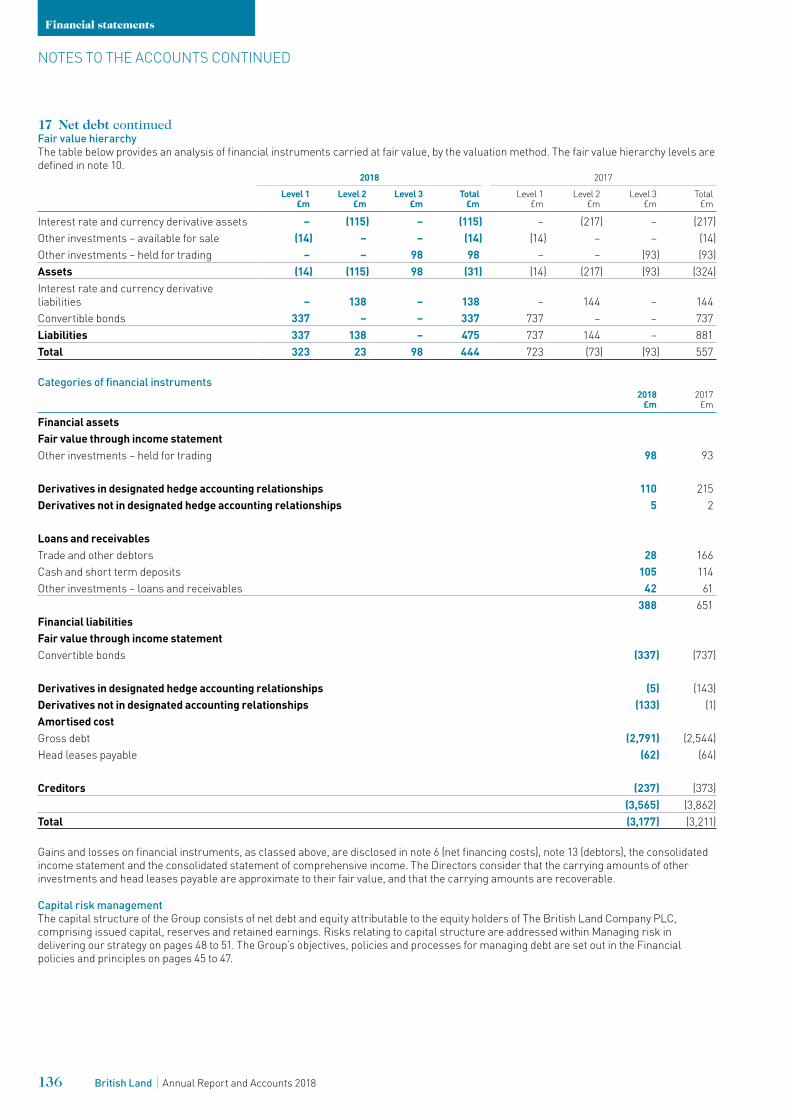
17 Net debt continuedFair value hierarchyThe table below provides an analysis of financial instruments carried at fair value, by the valuation method. The fair value hierarchy levels are defined in note 10.
2018 2017
Level 1 £m
Level 2 £m
Level 3 £m
Total £m
Level 1 £m
Level 2 £m
Level 3 £m
Total £m
Interest rate and currency derivative assets – (115) – (115) – (217) – (217)Other investments – available for sale (14) – – (14) (14) – – (14)Other investments – held for trading – – 98 98 – – (93) (93)Assets (14) (115) 98 (31) (14) (217) (93) (324)Interest rate and currency derivative liabilities – 138 – 138 – 144 – 144Convertible bonds 337 – – 337 737 – – 737Liabilities 337 138 – 475 737 144 – 881Total 323 23 98 444 723 (73) (93) 557
Categories of financial instruments2018
£m2017
£m
Financial assetsFair value through income statementOther investments – held for trading 98 93
Derivatives in designated hedge accounting relationships 110 215Derivatives not in designated hedge accounting relationships 5 2
Loans and receivablesTrade and other debtors 28 166Cash and short term deposits 105 114Other investments – loans and receivables 42 61
388 651Financial liabilitiesFair value through income statementConvertible bonds (337) (737)
Derivatives in designated hedge accounting relationships (5) (143)Derivatives not in designated accounting relationships (133) (1)Amortised costGross debt (2,791) (2,544)Head leases payable (62) (64)
Creditors (237) (373)(3,565) (3,862)
Total (3,177) (3,211)
Gains and losses on financial instruments, as classed above, are disclosed in note 6 (net financing costs), note 13 (debtors), the consolidated income statement and the consolidated statement of comprehensive income. The Directors consider that the carrying amounts of other investments and head leases payable are approximate to their fair value, and that the carrying amounts are recoverable.
Capital risk managementThe capital structure of the Group consists of net debt and equity attributable to the equity holders of The British Land Company PLC, comprising issued capital, reserves and retained earnings. Risks relating to capital structure are addressed within Managing risk in delivering our strategy on pages 48 to 51. The Group’s objectives, policies and processes for managing debt are set out in the Financial policies and principles on pages 45 to 47.
NOTES TO THE ACCOUNTS CONTINUED
Financial statements
136 British Land Annual Report and Accounts 2018
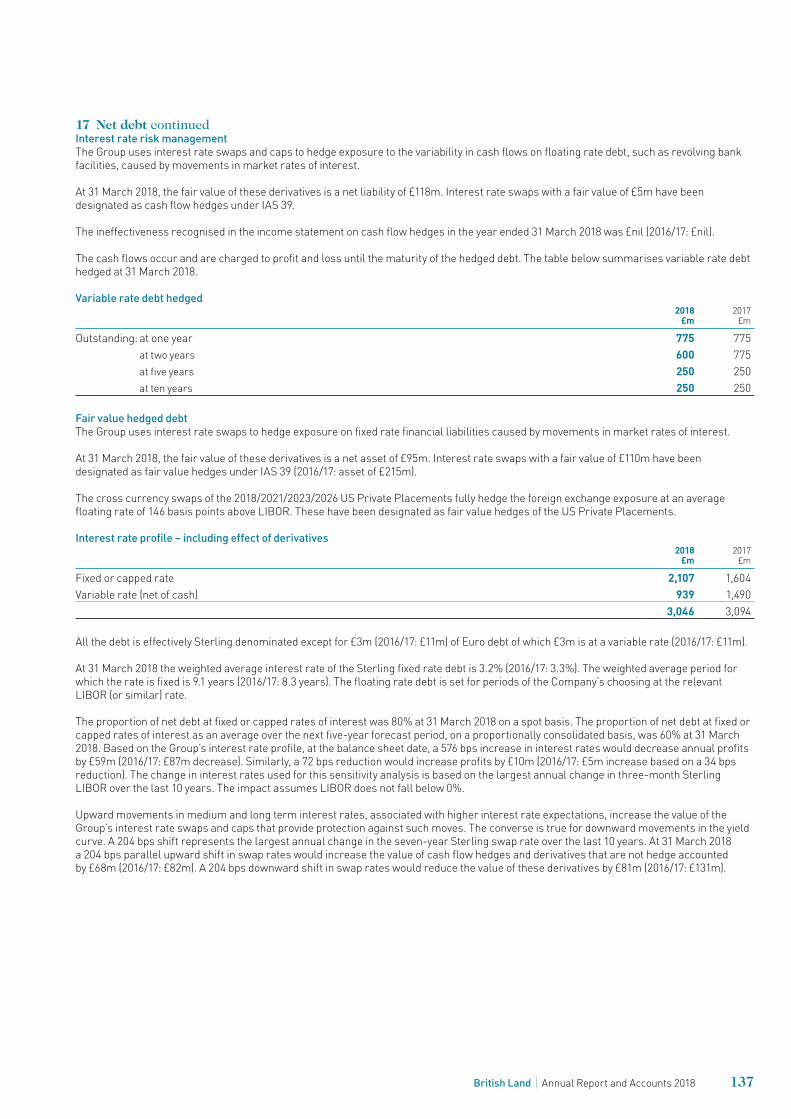
17 Net debt continuedInterest rate risk managementThe Group uses interest rate swaps and caps to hedge exposure to the variability in cash flows on floating rate debt, such as revolving bank facilities, caused by movements in market rates of interest.
At 31 March 2018, the fair value of these derivatives is a net liability of £118m. Interest rate swaps with a fair value of £5m have been designated as cash flow hedges under IAS 39.
The ineffectiveness recognised in the income statement on cash flow hedges in the year ended 31 March 2018 was £nil (2016/17: £nil).
The cash flows occur and are charged to profit and loss until the maturity of the hedged debt. The table below summarises variable rate debt hedged at 31 March 2018.
Variable rate debt hedged 2018
£m2017
£m
Outstanding: at one year 775 775 at two years 600 775 at five years 250 250 at ten years 250 250
Fair value hedged debtThe Group uses interest rate swaps to hedge exposure on fixed rate financial liabilities caused by movements in market rates of interest.
At 31 March 2018, the fair value of these derivatives is a net asset of £95m. Interest rate swaps with a fair value of £110m have been designated as fair value hedges under IAS 39 (2016/17: asset of £215m).
The cross currency swaps of the 2018/2021/2023/2026 US Private Placements fully hedge the foreign exchange exposure at an average floating rate of 146 basis points above LIBOR. These have been designated as fair value hedges of the US Private Placements.
Interest rate profile – including effect of derivatives2018
£m2017
£m
Fixed or capped rate 2,107 1,604Variable rate (net of cash) 939 1,490
3,046 3,094
All the debt is effectively Sterling denominated except for £3m (2016/17: £11m) of Euro debt of which £3m is at a variable rate (2016/17: £11m).
At 31 March 2018 the weighted average interest rate of the Sterling fixed rate debt is 3.2% (2016/17: 3.3%). The weighted average period for which the rate is fixed is 9.1 years (2016/17: 8.3 years). The floating rate debt is set for periods of the Company’s choosing at the relevant LIBOR (or similar) rate.
The proportion of net debt at fixed or capped rates of interest was 80% at 31 March 2018 on a spot basis. The proportion of net debt at fixed or capped rates of interest as an average over the next five-year forecast period, on a proportionally consolidated basis, was 60% at 31 March 2018. Based on the Group’s interest rate profile, at the balance sheet date, a 576 bps increase in interest rates would decrease annual profits by £59m (2016/17: £87m decrease). Similarly, a 72 bps reduction would increase profits by £10m (2016/17: £5m increase based on a 34 bps reduction). The change in interest rates used for this sensitivity analysis is based on the largest annual change in three-month Sterling LIBOR over the last 10 years. The impact assumes LIBOR does not fall below 0%.
Upward movements in medium and long term interest rates, associated with higher interest rate expectations, increase the value of the Group’s interest rate swaps and caps that provide protection against such moves. The converse is true for downward movements in the yield curve. A 204 bps shift represents the largest annual change in the seven-year Sterling swap rate over the last 10 years. At 31 March 2018 a 204 bps parallel upward shift in swap rates would increase the value of cash flow hedges and derivatives that are not hedge accounted by £68m (2016/17: £82m). A 204 bps downward shift in swap rates would reduce the value of these derivatives by £81m (2016/17: £131m).
137British Land Annual Report and Accounts 2018
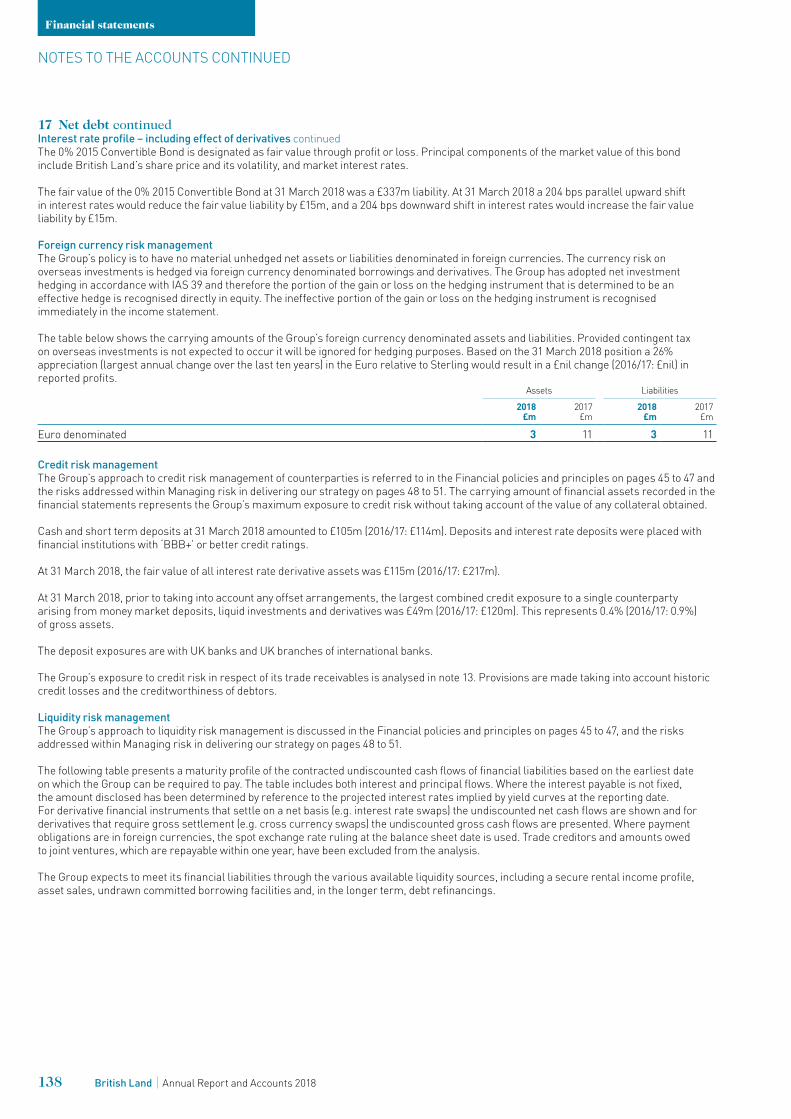
17 Net debt continuedInterest rate profile – including effect of derivatives continuedThe 0% 2015 Convertible Bond is designated as fair value through profit or loss. Principal components of the market value of this bond include British Land’s share price and its volatility, and market interest rates.
The fair value of the 0% 2015 Convertible Bond at 31 March 2018 was a £337m liability. At 31 March 2018 a 204 bps parallel upward shift in interest rates would reduce the fair value liability by £15m, and a 204 bps downward shift in interest rates would increase the fair value liability by £15m.
Foreign currency risk managementThe Group’s policy is to have no material unhedged net assets or liabilities denominated in foreign currencies. The currency risk on overseas investments is hedged via foreign currency denominated borrowings and derivatives. The Group has adopted net investment hedging in accordance with IAS 39 and therefore the portion of the gain or loss on the hedging instrument that is determined to be an effective hedge is recognised directly in equity. The ineffective portion of the gain or loss on the hedging instrument is recognised immediately in the income statement.
The table below shows the carrying amounts of the Group’s foreign currency denominated assets and liabilities. Provided contingent tax on overseas investments is not expected to occur it will be ignored for hedging purposes. Based on the 31 March 2018 position a 26% appreciation (largest annual change over the last ten years) in the Euro relative to Sterling would result in a £nil change (2016/17: £nil) in reported profits.
Assets Liabilities
2018 £m
2017 £m
2018 £m
2017 £m
Euro denominated 3 11 3 11
Credit risk managementThe Group’s approach to credit risk management of counterparties is referred to in the Financial policies and principles on pages 45 to 47 and the risks addressed within Managing risk in delivering our strategy on pages 48 to 51. The carrying amount of financial assets recorded in the financial statements represents the Group’s maximum exposure to credit risk without taking account of the value of any collateral obtained.
Cash and short term deposits at 31 March 2018 amounted to £105m (2016/17: £114m). Deposits and interest rate deposits were placed with financial institutions with ‘BBB+’ or better credit ratings.
At 31 March 2018, the fair value of all interest rate derivative assets was £115m (2016/17: £217m).
At 31 March 2018, prior to taking into account any offset arrangements, the largest combined credit exposure to a single counterparty arising from money market deposits, liquid investments and derivatives was £49m (2016/17: £120m). This represents 0.4% (2016/17: 0.9%) of gross assets.
The deposit exposures are with UK banks and UK branches of international banks.
The Group’s exposure to credit risk in respect of its trade receivables is analysed in note 13. Provisions are made taking into account historic credit losses and the creditworthiness of debtors.
Liquidity risk managementThe Group’s approach to liquidity risk management is discussed in the Financial policies and principles on pages 45 to 47, and the risks addressed within Managing risk in delivering our strategy on pages 48 to 51.
The following table presents a maturity profile of the contracted undiscounted cash flows of financial liabilities based on the earliest date on which the Group can be required to pay. The table includes both interest and principal flows. Where the interest payable is not fixed, the amount disclosed has been determined by reference to the projected interest rates implied by yield curves at the reporting date. For derivative financial instruments that settle on a net basis (e.g. interest rate swaps) the undiscounted net cash flows are shown and for derivatives that require gross settlement (e.g. cross currency swaps) the undiscounted gross cash flows are presented. Where payment obligations are in foreign currencies, the spot exchange rate ruling at the balance sheet date is used. Trade creditors and amounts owed to joint ventures, which are repayable within one year, have been excluded from the analysis.
The Group expects to meet its financial liabilities through the various available liquidity sources, including a secure rental income profile, asset sales, undrawn committed borrowing facilities and, in the longer term, debt refinancings.
NOTES TO THE ACCOUNTS CONTINUED
Financial statements
138 British Land Annual Report and Accounts 2018
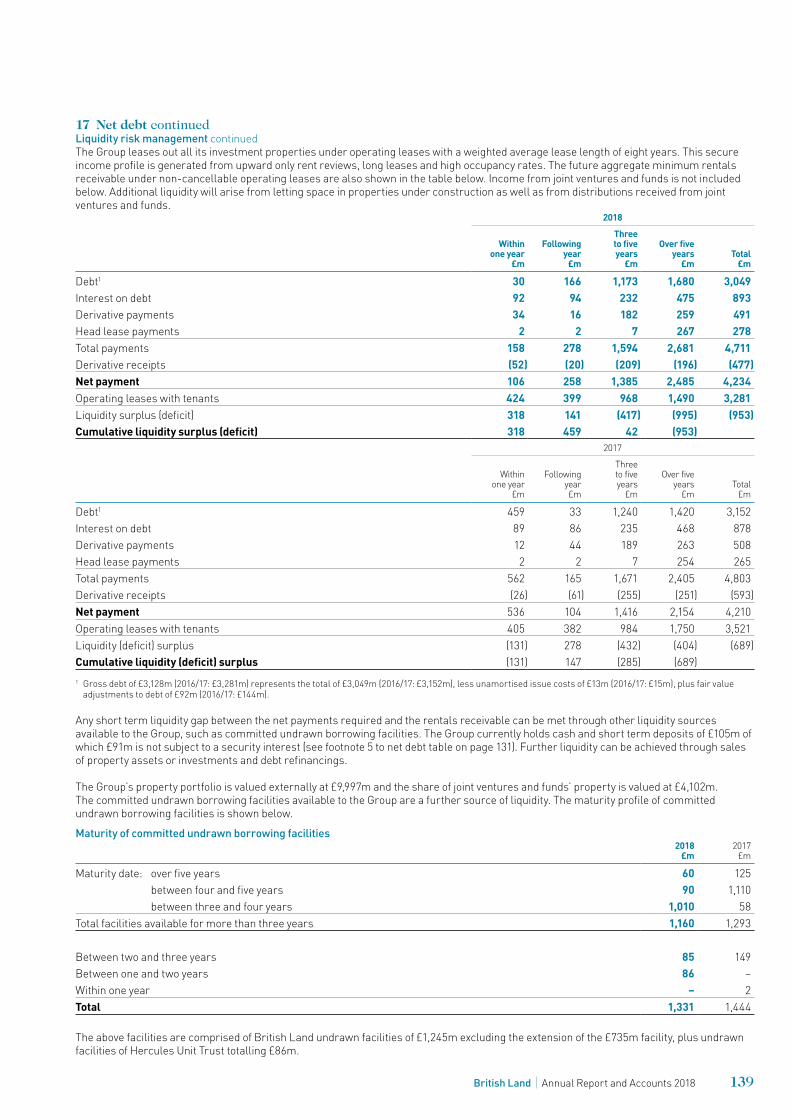
17 Net debt continuedLiquidity risk management continuedThe Group leases out all its investment properties under operating leases with a weighted average lease length of eight years. This secure income profile is generated from upward only rent reviews, long leases and high occupancy rates. The future aggregate minimum rentals receivable under non-cancellable operating leases are also shown in the table below. Income from joint ventures and funds is not included below. Additional liquidity will arise from letting space in properties under construction as well as from distributions received from joint ventures and funds.
2018
Within one year
£m
Following year
£m
Three to five years
£m
Over five years
£mTotal
£m
Debt1 30 166 1,173 1,680 3,049Interest on debt 92 94 232 475 893Derivative payments 34 16 182 259 491Head lease payments 2 2 7 267 278Total payments 158 278 1,594 2,681 4,711Derivative receipts (52) (20) (209) (196) (477)Net payment 106 258 1,385 2,485 4,234Operating leases with tenants 424 399 968 1,490 3,281Liquidity surplus (deficit) 318 141 (417) (995) (953)Cumulative liquidity surplus (deficit) 318 459 42 (953)
2017
Within one year
£m
Following year £m
Three to five years
£m
Over five years
£mTotal
£m
Debt1 459 33 1,240 1,420 3,152Interest on debt 89 86 235 468 878Derivative payments 12 44 189 263 508Head lease payments 2 2 7 254 265Total payments 562 165 1,671 2,405 4,803Derivative receipts (26) (61) (255) (251) (593)Net payment 536 104 1,416 2,154 4,210Operating leases with tenants 405 382 984 1,750 3,521Liquidity (deficit) surplus (131) 278 (432) (404) (689)Cumulative liquidity (deficit) surplus (131) 147 (285) (689)1 Gross debt of £3,128m (2016/17: £3,281m) represents the total of £3,049m (2016/17: £3,152m), less unamortised issue costs of £13m (2016/17: £15m), plus fair value
adjustments to debt of £92m (2016/17: £144m).
Any short term liquidity gap between the net payments required and the rentals receivable can be met through other liquidity sources available to the Group, such as committed undrawn borrowing facilities. The Group currently holds cash and short term deposits of £105m of which £91m is not subject to a security interest (see footnote 5 to net debt table on page 131). Further liquidity can be achieved through sales of property assets or investments and debt refinancings.
The Group’s property portfolio is valued externally at £9,997m and the share of joint ventures and funds’ property is valued at £4,102m. The committed undrawn borrowing facilities available to the Group are a further source of liquidity. The maturity profile of committed undrawn borrowing facilities is shown below.
Maturity of committed undrawn borrowing facilities2018
£m2017
£m
Maturity date: over five years 60 125 between four and five years 90 1,110 between three and four years 1,010 58Total facilities available for more than three years 1,160 1,293
Between two and three years 85 149Between one and two years 86 –Within one year – 2Total 1,331 1,444
The above facilities are comprised of British Land undrawn facilities of £1,245m excluding the extension of the £735m facility, plus undrawn facilities of Hercules Unit Trust totalling £86m.
139British Land Annual Report and Accounts 2018
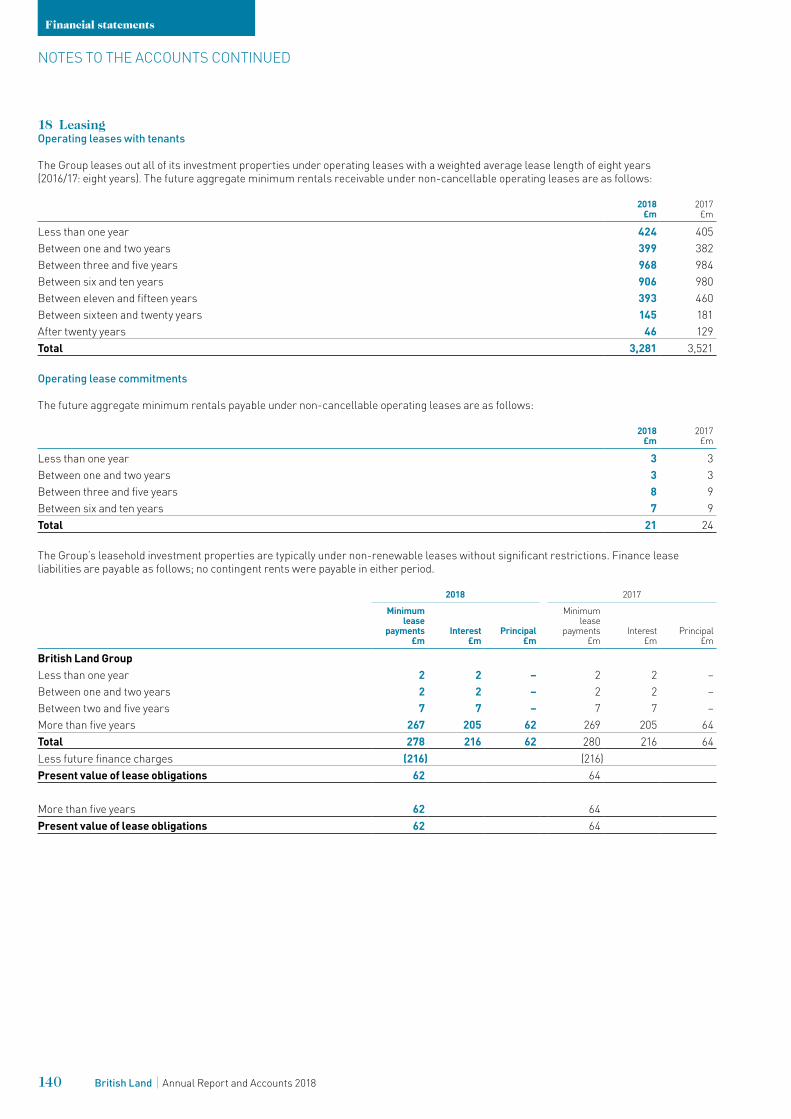
18 LeasingOperating leases with tenants
The Group leases out all of its investment properties under operating leases with a weighted average lease length of eight years (2016/17: eight years). The future aggregate minimum rentals receivable under non-cancellable operating leases are as follows:
2018 £m
2017 £m
Less than one year 424 405Between one and two years 399 382Between three and five years 968 984Between six and ten years 906 980Between eleven and fifteen years 393 460Between sixteen and twenty years 145 181After twenty years 46 129Total 3,281 3,521
Operating lease commitments
The future aggregate minimum rentals payable under non-cancellable operating leases are as follows:
2018 £m
2017 £m
Less than one year 3 3Between one and two years 3 3Between three and five years 8 9Between six and ten years 7 9Total 21 24
The Group’s leasehold investment properties are typically under non-renewable leases without significant restrictions. Finance lease liabilities are payable as follows; no contingent rents were payable in either period.
2018 2017
Minimum lease
payments £m
Interest £m
Principal £m
Minimum lease
payments £m
Interest £m
Principal £m
British Land GroupLess than one year 2 2 – 2 2 –Between one and two years 2 2 – 2 2 –Between two and five years 7 7 – 7 7 –More than five years 267 205 62 269 205 64Total 278 216 62 280 216 64Less future finance charges (216) (216)Present value of lease obligations 62 64
More than five years 62 64Present value of lease obligations 62 64
NOTES TO THE ACCOUNTS CONTINUED
Financial statements
140 British Land Annual Report and Accounts 2018
19 DividendThe fourth quarter interim dividend of 7.52 pence per share, totalling £74m (2016/17: 7.30 pence per share, totalling £75m), was approved by the Board on 16 May 2018 and is payable on 3 August 2018 to shareholders on the register at the close of business on 29 June 2018.
The Board will announce the availability of the Scrip Dividend Alternative, if available, via the Regulatory News Service and on its website (ww w.britishland.com/dividends), no later than four business days before the ex-dividend date of 28 June 2018. The Board expects to announce the split between Property Income Distributions (PID) and non-PID income at that time. Any Scrip Dividend Alternative will not be enhanced. PID dividends are paid, as required by REIT legislation, after deduction of withholding tax at the basic rate (currently 20%), where appropriate. Certain classes of shareholders may be able to elect to receive dividends gross. Please refer to our website ww w.britishland.com/dividends for details.
Payment date DividendPence per
share2018
£m2017
£m
Current year dividends03.08.2018 2018 4th interim 7.5204.05.2018 2018 3rd interim 7.5209.02.2018 2018 2nd interim 7.52 7510.11.2017 2018 1st interim 7.52 77
30.08Prior year dividends04.08.2017 2017 4th interim 7.30 7505.05.2017 2017 3rd interim 7.30 7510.02.2017 2017 2nd interim 7.30 7511.11.2016 2017 1st interim 7.30 75
29.20
05.08.2016 2016 4th interim 7.091 7306.05.2016 2016 3rd interim 7.09 73Dividends in consolidated statement of changes in equity 302 296Dividends settled in shares – –Dividends settled in cash 302 296Timing difference relating to payment of withholding tax 2 (1)Dividends in cash flow statement 304 2951 Dividend split half PID, half non-PID.
20 Share capital and reserves2018 2017
Number of ordinary shares in issue at 1 April 1,041,035,058 1,040,562,323Share issues 429,206 472,735Repurchased and cancelled (47,607,139) –At 31 March 993,857,125 1, 041,035,058
Of the issued 25p ordinary shares, 7,376 shares were held in the ESOP trust (2016/17: 7,783), 11,266,245 shares were held as treasury shares (2016/17: 11,266,245) and 982,583,504 shares were in free issue (2016/17: 1,029,761,030). No treasury shares were acquired by the ESOP trust during the year. All issued shares are fully paid. In the year ended 31 March 2018 the Company repurchased and cancelled 47,607,139 ordinary shares at a weighted average price of 630 pence.
Hedging and translation reserveThe hedging and translation reserve comprises the effective portion of the cumulative net change in the fair value of cash flow and foreign currency hedging instruments, as well as all foreign exchange differences arising from the translation of the financial statements of foreign operations. The foreign exchange differences also include the translation of the liabilities that hedge the Company’s net investment in a foreign subsidiary.
Revaluation reserveThe revaluation reserve relates to owner-occupied properties and investments in joint ventures and funds.
Merger reserveThis comprises the premium on the share placing in March 2013. No share premium is recorded in the Company’s financial statements, through the operation of the merger relief provisions of the Companies Act 2006.
141British Land Annual Report and Accounts 2018
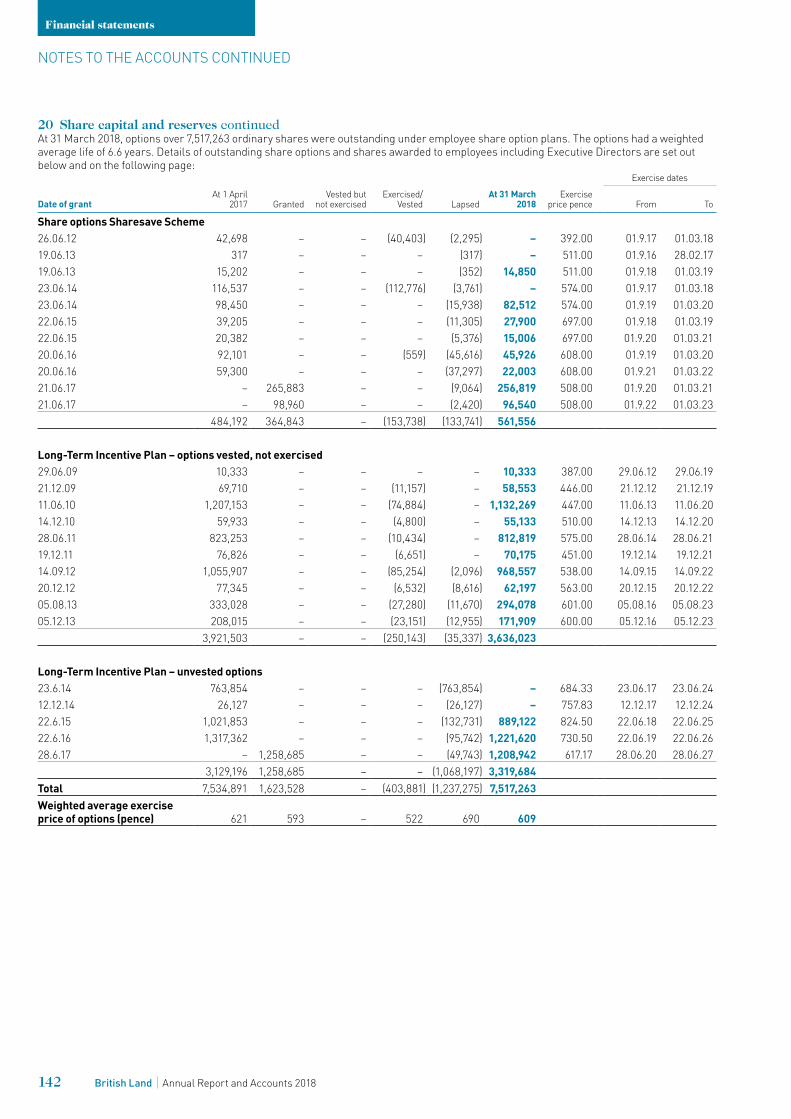
20 Share capital and reserves continuedAt 31 March 2018, options over 7,517,263 ordinary shares were outstanding under employee share option plans. The options had a weighted average life of 6.6 years. Details of outstanding share options and shares awarded to employees including Executive Directors are set out below and on the following page:
Exercise dates
Date of grantAt 1 April
2017 GrantedVested but
not exercisedExercised/
Vested LapsedAt 31 March
2018Exercise
price pence From To
Share options Sharesave Scheme26.06.12 42,698 – – (40,403) (2,295) – 392.00 01.9.17 01.03.1819.06.13 317 – – – (317) – 511.00 01.9.16 28.02.1719.06.13 15,202 – – – (352) 14,850 511.00 01.9.18 01.03.1923.06.14 116,537 – – (112,776) (3,761) – 574.00 01.9.17 01.03.1823.06.14 98,450 – – – (15,938) 82,512 574.00 01.9.19 01.03.2022.06.15 39,205 – – – (11,305) 27,900 697.00 01.9.18 01.03.1922.06.15 20,382 – – – (5,376) 15,006 697.00 01.9.20 01.03.2120.06.16 92,101 – – (559) (45,616) 45,926 608.00 01.9.19 01.03.2020.06.16 59,300 – – – (37,297) 22,003 608.00 01.9.21 01.03.2221.06.17 – 265,883 – – (9,064) 256,819 508.00 01.9.20 01.03.2121.06.17 – 98,960 – – (2,420) 96,540 508.00 01.9.22 01.03.23
484,192 364,843 – (153,738) (133,741) 561,556
Long-Term Incentive Plan – options vested, not exercised29.06.09 10,333 – – – – 10,333 387.00 29.06.12 29.06.1921.12.09 69,710 – – (11,157) – 58,553 446.00 21.12.12 21.12.1911.06.10 1,207,153 – – (74,884) – 1,132,269 447.00 11.06.13 11.06.2014.12.10 59,933 – – (4,800) – 55,133 510.00 14.12.13 14.12.2028.06.11 823,253 – – (10,434) – 812,819 575.00 28.06.14 28.06.2119.12.11 76,826 – – (6,651) – 70,175 451.00 19.12.14 19.12.2114.09.12 1,055,907 – – (85,254) (2,096) 968,557 538.00 14.09.15 14.09.2220.12.12 77,345 – – (6,532) (8,616) 62,197 563.00 20.12.15 20.12.2205.08.13 333,028 – – (27,280) (11,670) 294,078 601.00 05.08.16 05.08.2305.12.13 208,015 – – (23,151) (12,955) 171,909 600.00 05.12.16 05.12.23
3,921,503 – – (250,143) (35,337) 3,636,023
Long-Term Incentive Plan – unvested options23.6.14 763,854 – – – (763,854) – 684.33 23.06.17 23.06.2412.12.14 26,127 – – – (26,127) – 757.83 12.12.17 12.12.2422.6.15 1,021,853 – – – (132,731) 889,122 824.50 22.06.18 22.06.2522.6.16 1,317,362 – – – (95,742) 1,221,620 730.50 22.06.19 22.06.2628.6.17 – 1,258,685 – – (49,743) 1,208,942 617.17 28.06.20 28.06.27
3,129,196 1,258,685 – – (1,068,197) 3,319,684Total 7,534,891 1,623,528 – (403,881) (1,237,275) 7,517,263Weighted average exercise price of options (pence) 621 593 – 522 690 609
NOTES TO THE ACCOUNTS CONTINUED
Financial statements
142 British Land Annual Report and Accounts 2018
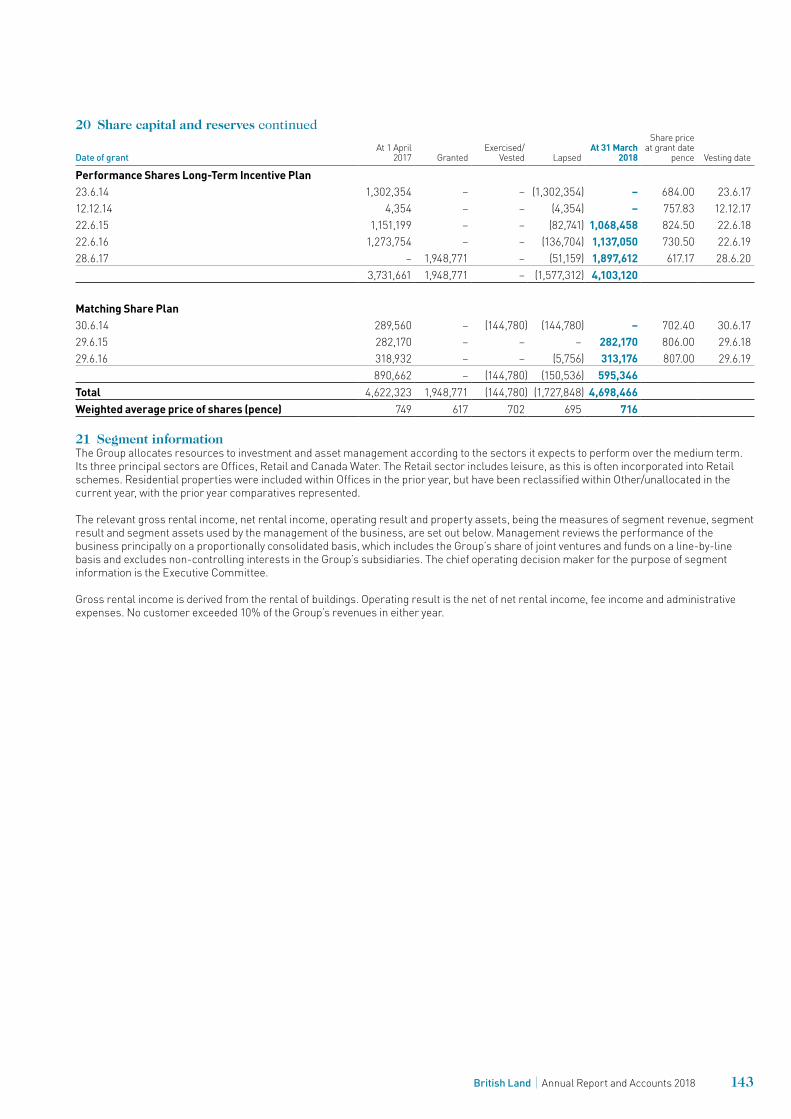
20 Share capital and reserves continued
Date of grantAt 1 April
2017 GrantedExercised/
Vested LapsedAt 31 March
2018
Share price at grant date
pence Vesting date
Performance Shares Long-Term Incentive Plan23.6.14 1,302,354 – – (1,302,354) – 684.00 23.6.1712.12.14 4,354 – – (4,354) – 757.83 12.12.1722.6.15 1,151,199 – – (82,741) 1,068,458 824.50 22.6.1822.6.16 1,273,754 – – (136,704) 1,137,050 730.50 22.6.1928.6.17 – 1,948,771 – (51,159) 1,897,612 617.17 28.6.20
3,731,661 1,948,771 – (1,577,312) 4,103,120
Matching Share Plan30.6.14 289,560 – (144,780) (144,780) – 702.40 30.6.1729.6.15 282,170 – – – 282,170 806.00 29.6.1829.6.16 318,932 – – (5,756) 313,176 807.00 29.6.19
890,662 – (144,780) (150,536) 595,346Total 4,622,323 1,948,771 (144,780) (1,727,848) 4,698,466Weighted average price of shares (pence) 749 617 702 695 716
21 Segment informationThe Group allocates resources to investment and asset management according to the sectors it expects to perform over the medium term. Its three principal sectors are Offices, Retail and Canada Water. The Retail sector includes leisure, as this is often incorporated into Retail schemes. Residential properties were included within Offices in the prior year, but have been reclassified within Other/unallocated in the current year, with the prior year comparatives represented.
The relevant gross rental income, net rental income, operating result and property assets, being the measures of segment revenue, segment result and segment assets used by the management of the business, are set out below. Management reviews the performance of the business principally on a proportionally consolidated basis, which includes the Group’s share of joint ventures and funds on a line-by-line basis and excludes non-controlling interests in the Group’s subsidiaries. The chief operating decision maker for the purpose of segment information is the Executive Committee.
Gross rental income is derived from the rental of buildings. Operating result is the net of net rental income, fee income and administrative expenses. No customer exceeded 10% of the Group’s revenues in either year.
143British Land Annual Report and Accounts 2018
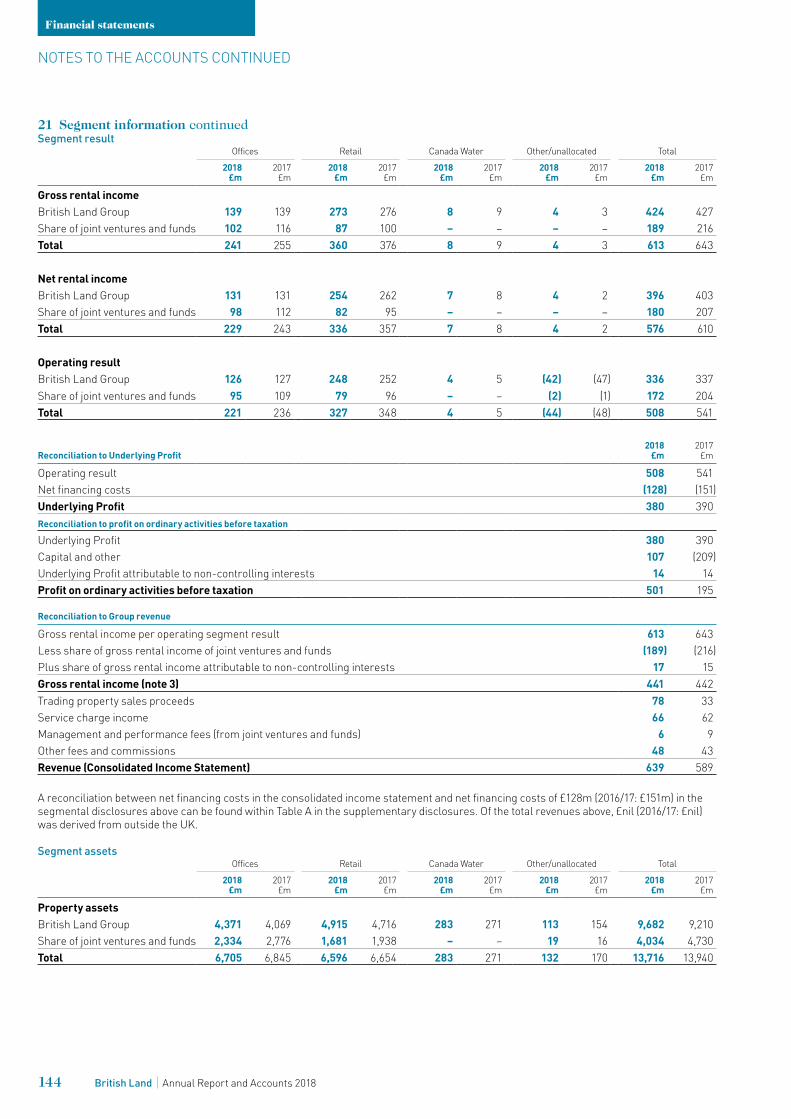
21 Segment information continuedSegment result
Offices Retail Canada Water Other/unallocated Total
2018£m
2017£m
2018£m
2017£m
2018£m
2017£m
2018£m
2017£m
2018£m
2017£m
Gross rental incomeBritish Land Group 139 139 273 276 8 9 4 3 424 427Share of joint ventures and funds 102 116 87 100 – – – – 189 216Total 241 255 360 376 8 9 4 3 613 643
Net rental incomeBritish Land Group 131 131 254 262 7 8 4 2 396 403Share of joint ventures and funds 98 112 82 95 – – – – 180 207Total 229 243 336 357 7 8 4 2 576 610
Operating resultBritish Land Group 126 127 248 252 4 5 (42) (47) 336 337Share of joint ventures and funds 95 109 79 96 – – (2) (1) 172 204Total 221 236 327 348 4 5 (44) (48) 508 541
Reconciliation to Underlying Profit2018
£m2017
£m
Operating result 508 541Net financing costs (128) (151)Underlying Profit 380 390Reconciliation to profit on ordinary activities before taxation
Underlying Profit 380 390Capital and other 107 (209)Underlying Profit attributable to non-controlling interests 14 14Profit on ordinary activities before taxation 501 195
Reconciliation to Group revenue
Gross rental income per operating segment result 613 643Less share of gross rental income of joint ventures and funds (189) (216)Plus share of gross rental income attributable to non-controlling interests 17 15Gross rental income (note 3) 441 442Trading property sales proceeds 78 33Service charge income 66 62Management and performance fees (from joint ventures and funds) 6 9Other fees and commissions 48 43Revenue (Consolidated Income Statement) 639 589
A reconciliation between net financing costs in the consolidated income statement and net financing costs of £128m (2016/17: £151m) in the segmental disclosures above can be found within Table A in the supplementary disclosures. Of the total revenues above, £nil (2016/17: £nil) was derived from outside the UK.
Segment assets Offices Retail Canada Water Other/unallocated Total
2018£m
2017£m
2018£m
2017£m
2018£m
2017£m
2018£m
2017£m
2018£m
2017£m
Property assetsBritish Land Group 4,371 4,069 4,915 4,716 283 271 113 154 9,682 9,210Share of joint ventures and funds 2,334 2,776 1,681 1,938 – – 19 16 4,034 4,730Total 6,705 6,845 6,596 6,654 283 271 132 170 13,716 13,940
NOTES TO THE ACCOUNTS CONTINUED
Financial statements
144 British Land Annual Report and Accounts 2018
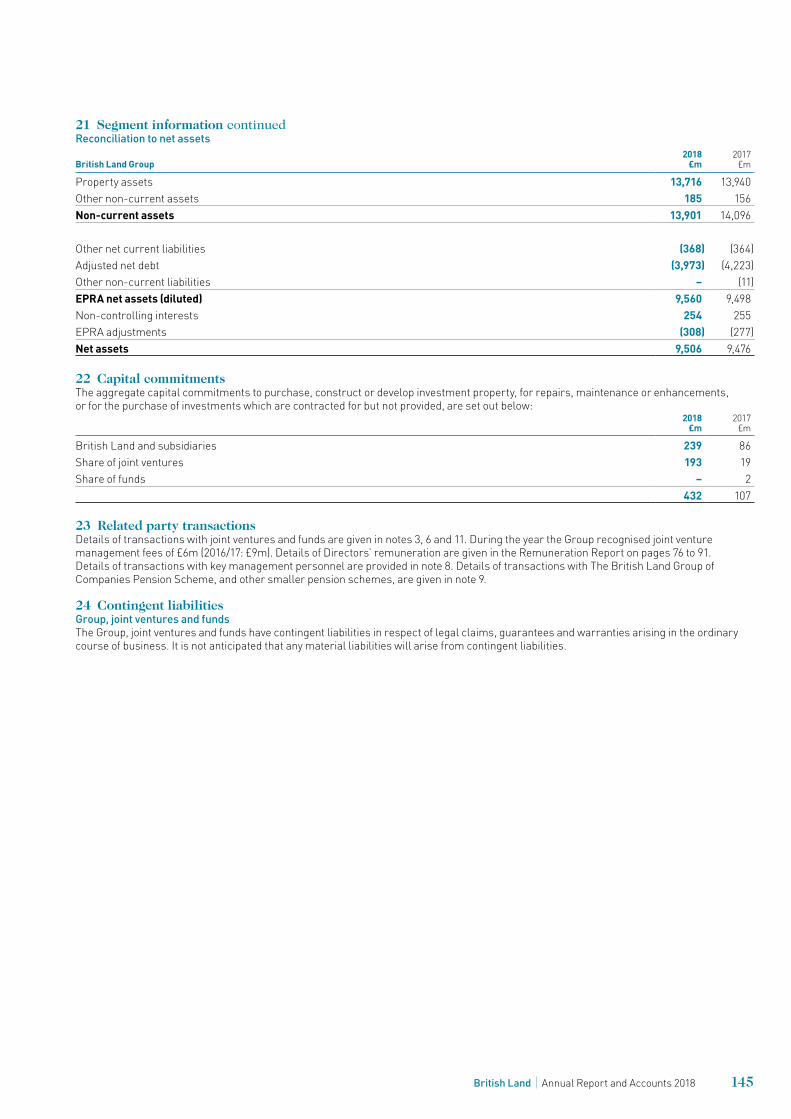
21 Segment information continuedReconciliation to net assets
British Land Group2018
£m2017
£m
Property assets 13,716 13,940Other non-current assets 185 156Non-current assets 13,901 14,096
Other net current liabilities (368) (364)Adjusted net debt (3,973) (4,223)Other non-current liabilities – (11)EPRA net assets (diluted) 9,560 9,498Non-controlling interests 254 255EPRA adjustments (308) (277)Net assets 9,506 9,476
22 Capital commitmentsThe aggregate capital commitments to purchase, construct or develop investment property, for repairs, maintenance or enhancements, or for the purchase of investments which are contracted for but not provided, are set out below:
2018£m
2017£m
British Land and subsidiaries 239 86Share of joint ventures 193 19Share of funds – 2
432 107
23 Related party transactionsDetails of transactions with joint ventures and funds are given in notes 3, 6 and 11. During the year the Group recognised joint venture management fees of £6m (2016/17: £9m). Details of Directors’ remuneration are given in the Remuneration Report on pages 76 to 91. Details of transactions with key management personnel are provided in note 8. Details of transactions with The British Land Group of Companies Pension Scheme, and other smaller pension schemes, are given in note 9.
24 Contingent liabilitiesGroup, joint ventures and fundsThe Group, joint ventures and funds have contingent liabilities in respect of legal claims, guarantees and warranties arising in the ordinary course of business. It is not anticipated that any material liabilities will arise from contingent liabilities.
145British Land Annual Report and Accounts 2018
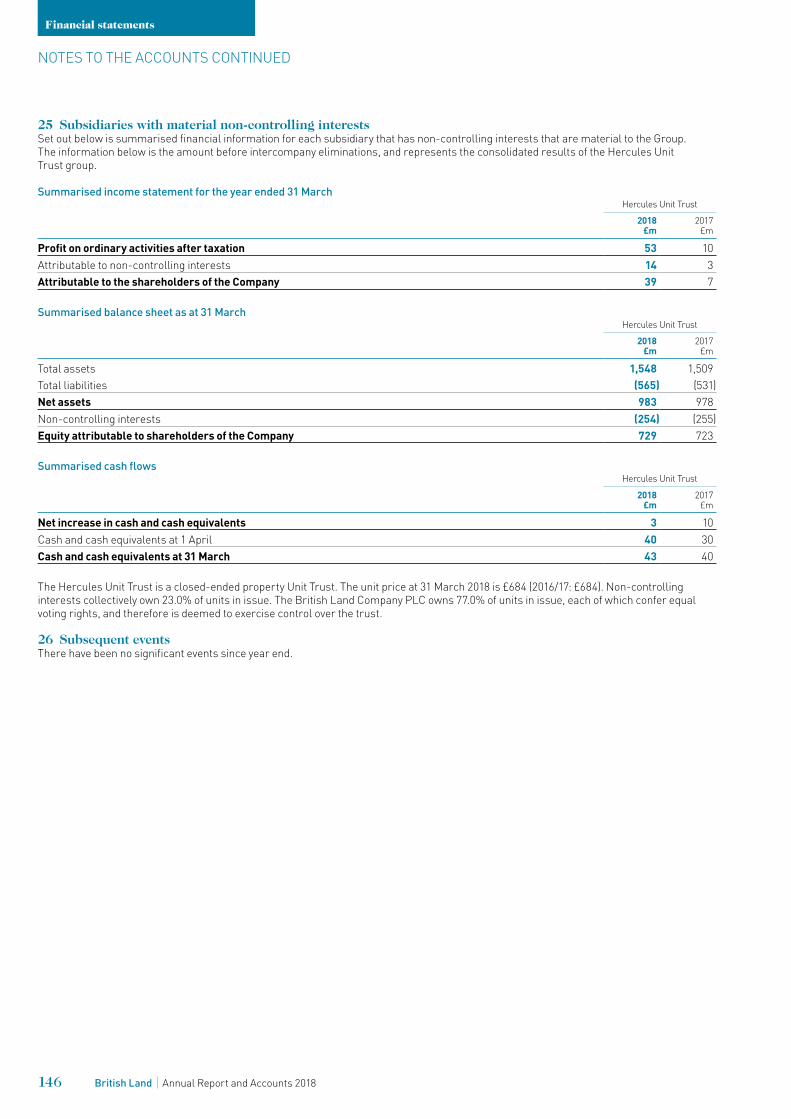
25 Subsidiaries with material non-controlling interestsSet out below is summarised financial information for each subsidiary that has non-controlling interests that are material to the Group. The information below is the amount before intercompany eliminations, and represents the consolidated results of the Hercules Unit Trust group.
Summarised income statement for the year ended 31 MarchHercules Unit Trust
2018£m
2017£m
Profit on ordinary activities after taxation 53 10Attributable to non-controlling interests 14 3Attributable to the shareholders of the Company 39 7
Summarised balance sheet as at 31 MarchHercules Unit Trust
2018£m
2017£m
Total assets 1,548 1,509Total liabilities (565) (531)Net assets 983 978Non-controlling interests (254) (255)Equity attributable to shareholders of the Company 729 723
Summarised cash flowsHercules Unit Trust
2018£m
2017£m
Net increase in cash and cash equivalents 3 10Cash and cash equivalents at 1 April 40 30Cash and cash equivalents at 31 March 43 40
The Hercules Unit Trust is a closed-ended property Unit Trust. The unit price at 31 March 2018 is £684 (2016/17: £684). Non-controlling interests collectively own 23.0% of units in issue. The British Land Company PLC owns 77.0% of units in issue, each of which confer equal voting rights, and therefore is deemed to exercise control over the trust.
26 Subsequent eventsThere have been no significant events since year end.
NOTES TO THE ACCOUNTS CONTINUED
Financial statements
146 British Land Annual Report and Accounts 2018
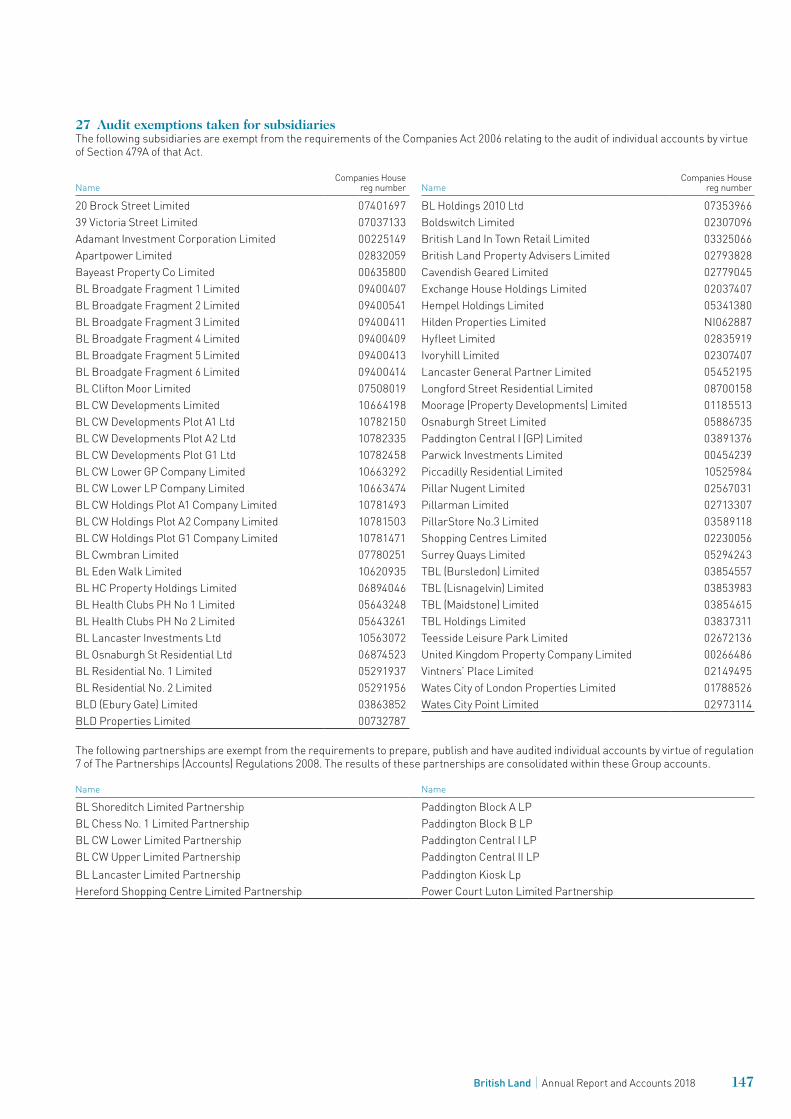
27 Audit exemptions taken for subsidiariesThe following subsidiaries are exempt from the requirements of the Companies Act 2006 relating to the audit of individual accounts by virtue of Section 479A of that Act.
The following partnerships are exempt from the requirements to prepare, publish and have audited individual accounts by virtue of regulation 7 of The Partnerships (Accounts) Regulations 2008. The results of these partnerships are consolidated within these Group accounts.
Name Name
BL Shoreditch Limited Partnership Paddington Block A LPBL Chess No. 1 Limited Partnership Paddington Block B LPBL CW Lower Limited Partnership Paddington Central I LPBL CW Upper Limited Partnership Paddington Central II LPBL Lancaster Limited Partnership Paddington Kiosk LpHereford Shopping Centre Limited Partnership Power Court Luton Limited Partnership
NameCompanies House
reg number
20 Brock Street Limited 0740169739 Victoria Street Limited 07037133Adamant Investment Corporation Limited 00225149Apartpower Limited 02832059Bayeast Property Co Limited 00635800BL Broadgate Fragment 1 Limited 09400407BL Broadgate Fragment 2 Limited 09400541BL Broadgate Fragment 3 Limited 09400411BL Broadgate Fragment 4 Limited 09400409BL Broadgate Fragment 5 Limited 09400413BL Broadgate Fragment 6 Limited 09400414BL Clifton Moor Limited 07508019BL CW Developments Limited 10664198BL CW Developments Plot A1 Ltd 10782150BL CW Developments Plot A2 Ltd 10782335BL CW Developments Plot G1 Ltd 10782458BL CW Lower GP Company Limited 10663292BL CW Lower LP Company Limited 10663474BL CW Holdings Plot A1 Company Limited 10781493BL CW Holdings Plot A2 Company Limited 10781503BL CW Holdings Plot G1 Company Limited 10781471BL Cwmbran Limited 07780251BL Eden Walk Limited 10620935BL HC Property Holdings Limited 06894046BL Health Clubs PH No 1 Limited 05643248BL Health Clubs PH No 2 Limited 05643261BL Lancaster Investments Ltd 10563072 BL Osnaburgh St Residential Ltd 06874523BL Residential No. 1 Limited 05291937BL Residential No. 2 Limited 05291956BLD (Ebury Gate) Limited 03863852BLD Properties Limited 00732787
NameCompanies House
reg number
BL Holdings 2010 Ltd 07353966Boldswitch Limited 02307096British Land In Town Retail Limited 03325066British Land Property Advisers Limited 02793828Cavendish Geared Limited 02779045Exchange House Holdings Limited 02037407Hempel Holdings Limited 05341380Hilden Properties Limited NI062887Hyfleet Limited 02835919Ivoryhill Limited 02307407Lancaster General Partner Limited 05452195Longford Street Residential Limited 08700158Moorage (Property Developments) Limited 01185513Osnaburgh Street Limited 05886735Paddington Central I (GP) Limited 03891376Parwick Investments Limited 00454239Piccadilly Residential Limited 10525984Pillar Nugent Limited 02567031Pillarman Limited 02713307PillarStore No.3 Limited 03589118Shopping Centres Limited 02230056Surrey Quays Limited 05294243TBL (Bursledon) Limited 03854557TBL (Lisnagelvin) Limited 03853983TBL (Maidstone) Limited 03854615TBL Holdings Limited 03837311Teesside Leisure Park Limited 02672136United Kingdom Property Company Limited 00266486Vintners’ Place Limited 02149495Wates City of London Properties Limited 01788526Wates City Point Limited 02973114
147British Land Annual Report and Accounts 2018
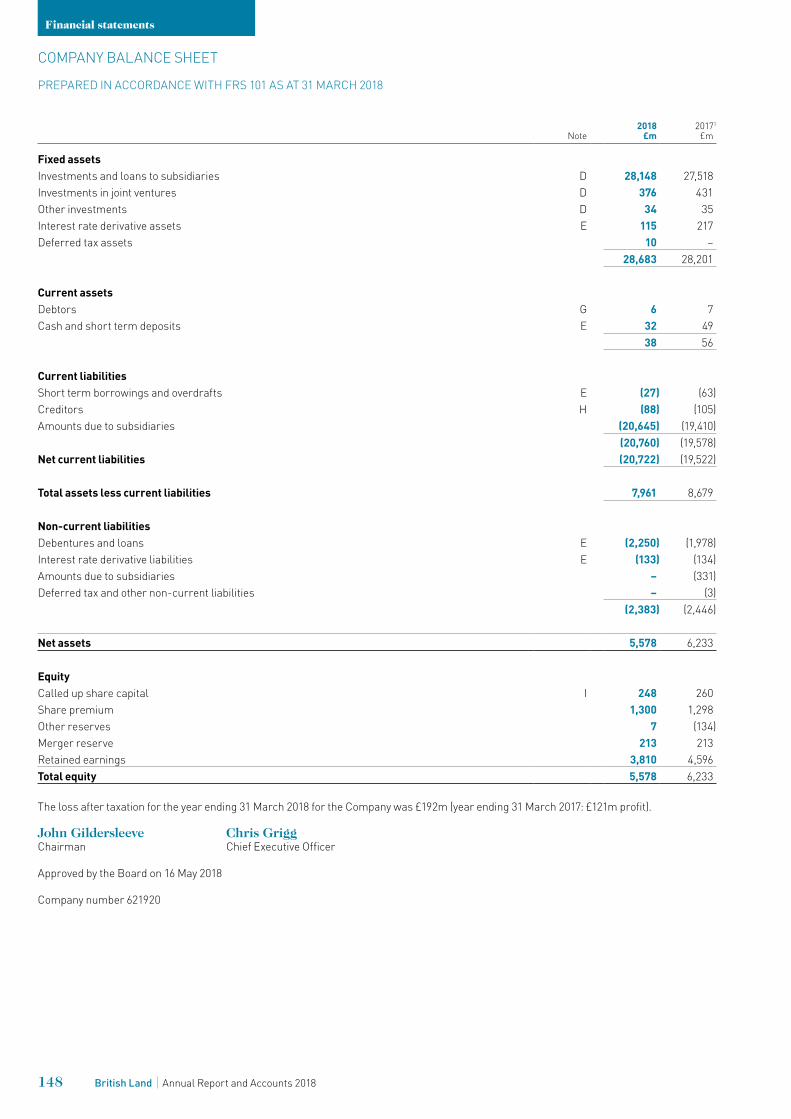
Note2018
£m20171
£m
Fixed assetsInvestments and loans to subsidiaries D 28,148 27,518Investments in joint ventures D 376 431 Other investments D 34 35Interest rate derivative assets E 115 217Deferred tax assets 10 –
28,683 28,201
Current assetsDebtors G 6 7Cash and short term deposits E 32 49
38 56
Current liabilitiesShort term borrowings and overdrafts E (27) (63)Creditors H (88) (105)Amounts due to subsidiaries (20,645) (19,410)
(20,760) (19,578)Net current liabilities (20,722) (19,522)
Total assets less current liabilities 7,961 8,679
Non-current liabilitiesDebentures and loans E (2,250) (1,978)Interest rate derivative liabilities E (133) (134)Amounts due to subsidiaries – (331)Deferred tax and other non-current liabilities – (3)
(2,383) (2,446)
Net assets 5,578 6,233
EquityCalled up share capital I 248 260Share premium 1,300 1,298Other reserves 7 (134)Merger reserve 213 213Retained earnings 3,810 4,596Total equity 5,578 6,233
The loss after taxation for the year ending 31 March 2018 for the Company was £192m (year ending 31 March 2017: £121m profit).
John Gildersleeve Chris GriggChairman Chief Executive Officer
Approved by the Board on 16 May 2018
Company number 621920
148 British Land Annual Report and Accounts 2018
Financial statements
COMPANY BALANCE SHEET
PREPARED IN ACCORDANCE WITH FRS 101 AS AT 31 MARCH 2018
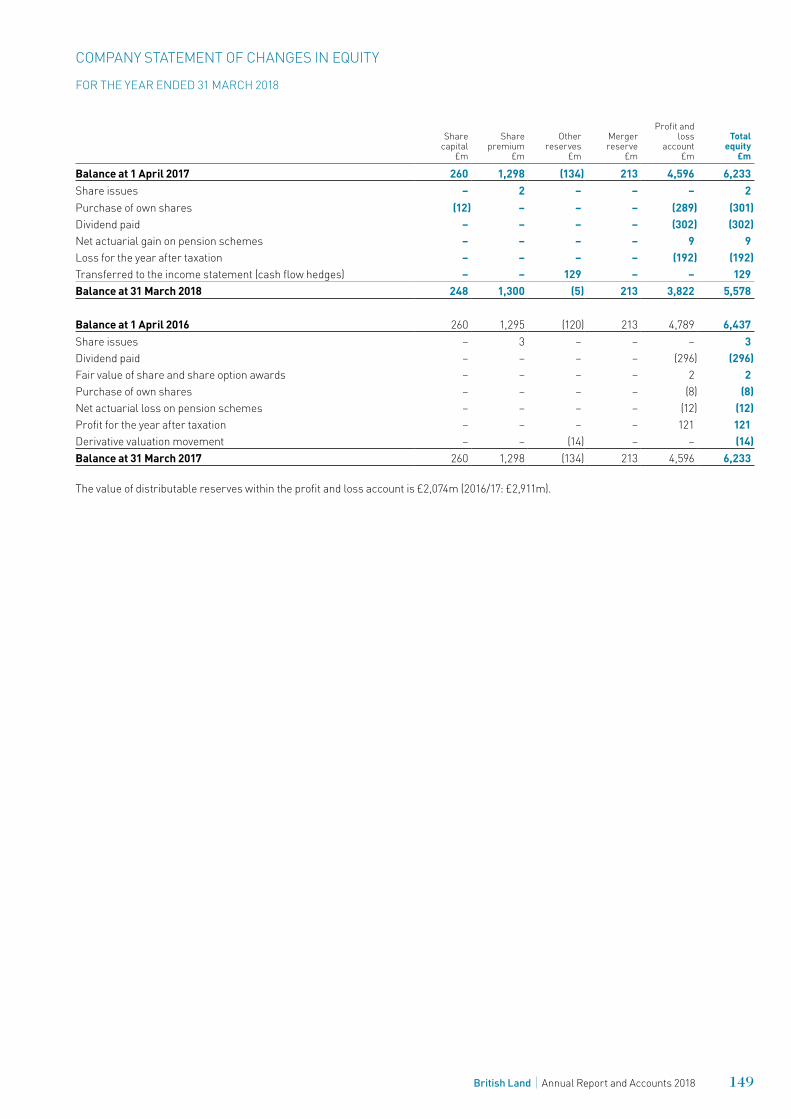
Sharecapital
£m
Share premium
£m
Other reserves
£m
Merger reserve
£m
Profit and loss
account£m
Totalequity
£m
Balance at 1 April 2017 260 1,298 (134) 213 4,596 6,233Share issues – 2 – – – 2Purchase of own shares (12) – – – (289) (301)Dividend paid – – – – (302) (302)Net actuarial gain on pension schemes – – – – 9 9Loss for the year after taxation – – – – (192) (192)Transferred to the income statement (cash flow hedges) – – 129 – – 129Balance at 31 March 2018 248 1,300 (5) 213 3,822 5,578
Balance at 1 April 2016 260 1,295 (120) 213 4,789 6,437Share issues – 3 – – – 3 Dividend paid – – – – (296) (296)Fair value of share and share option awards – – – – 2 2Purchase of own shares – – – – (8) (8)Net actuarial loss on pension schemes – – – – (12) (12)Profit for the year after taxation – – – – 121 121 Derivative valuation movement – – (14) – – (14)Balance at 31 March 2017 260 1,298 (134) 213 4,596 6,233
The value of distributable reserves within the profit and loss account is £2,074m (2016/17: £2,911m).
149British Land Annual Report and Accounts 2018
COMPANY STATEMENT OF CHANGES IN EQUITY
FOR THE YEAR ENDED 31 MARCH 2018
(A) Accounting policiesThe financial statements for the year ended 31 March 2018 have been prepared on the historical cost basis, except for the revaluation of derivatives. These financial statements have also been prepared in accordance with Financial Reporting Standard 101 Reduced Disclosure Framework (‘FRS 101’). The amendments to FRS 101 (2015/16 Cycle) issued in July 2016 and effective immediately have been applied.
In preparing these financial statements, the Company applies the recognition, measurement and disclosure requirements of International Financial Reporting Standards as adopted by the EU (‘Adopted IFRSs’), but makes amendments where necessary in order to comply with the Companies Act 2006 and has set out below where advantage of the FRS 101 disclosure exemptions has been taken.
The Company has taken advantage of the following disclosure exemptions under FRS 101:
(a) the requirements of IAS 1 to provide a balance sheet at the beginning of the period in the event of a prior period adjustment;
(b) the requirements of IAS 1 to provide a statement of cash flows for the period;
(c) the requirements of IAS 1 to provide a statement of compliance with IFRS;
(d) the requirements of IAS 1 to disclose information on the management of capital;
(e) the requirements of paragraphs 30 and 31 of IAS 8 Accounting Policies, Changes in Accounting Estimates and Errors to disclose new IFRSs that have been issued but are not yet effective;
(f) the requirements in IAS 24 Related Party Disclosures to disclose related party transactions entered into between two or more members of a group, provided that any subsidiary which is a party to the transaction is wholly-owned by such a member;
(g) the requirements of paragraph 17 of IAS 24 Related Party Disclosures to disclose key management personnel compensation;
(h) the requirements of IFRS 7 to disclose financial instruments; and(i) the requirements of paragraphs 91-99 of IFRS 13 Fair Value
Measurement to disclose information of fair value valuation techniques and inputs.
Going concernThe financial statements are prepared on the going concern basis as explained in the corporate governance section on page 51.
Investments and loansInvestments and loans in subsidiaries and joint ventures are stated at cost less provision for impairment.
Significant judgements and sources of estimation uncertaintyThe key source of estimation uncertainty relates to the Company’s investments in subsidiaries and joint ventures. In estimating the requirement for impairment of these investments, management make assumptions and judgements on the value of these investments using inherently subjective underlying asset valuations, supported by independent valuers.
(B) DividendsDetails of dividends paid and proposed are included in note 19 of the consolidated financial statements.
(C) Employee informationEmployee costs include wages and salaries of £39m (2016/17: £37m), social security costs of £5m (2016/17: £5m) and pension costs of £5m (2016/17: £5m). Details of the Executive Directors’ remuneration are disclosed in the Remuneration Report.
Audit fees in relation to the parent Company only were £0.3m (2016/17: £0.2m).
150 British Land Annual Report and Accounts 2018
Financial statements
NOTES TO THE FINANCIAL STATEMENTS
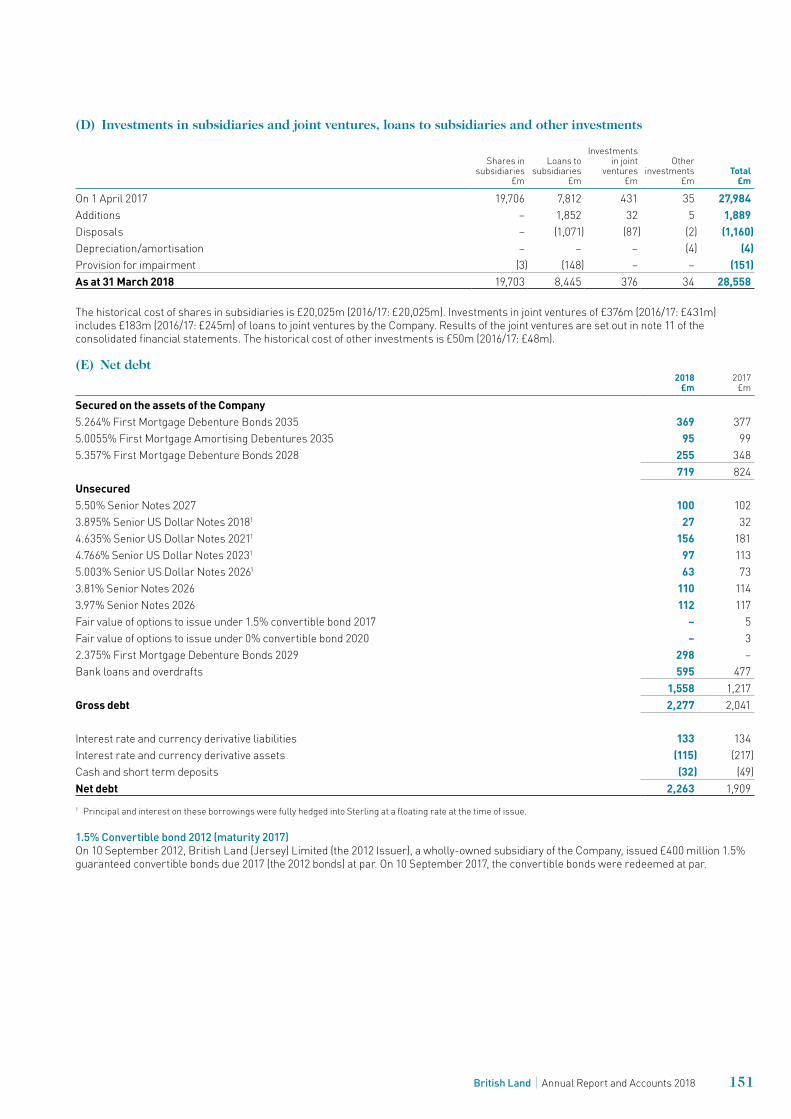
(D) Investments in subsidiaries and joint ventures, loans to subsidiaries and other investments
Shares in subsidiaries
£m
Loans to subsidiaries
£m
Investments in joint
ventures£m
Other investments
£mTotal
£m
On 1 April 2017 19,706 7,812 431 35 27,984Additions – 1,852 32 5 1,889Disposals – (1,071) (87) (2) (1,160)Depreciation/amortisation – – – (4) (4)Provision for impairment (3) (148) – – (151)As at 31 March 2018 19,703 8,445 376 34 28,558
The historical cost of shares in subsidiaries is £20,025m (2016/17: £20,025m). Investments in joint ventures of £376m (2016/17: £431m) includes £183m (2016/17: £245m) of loans to joint ventures by the Company. Results of the joint ventures are set out in note 11 of the consolidated financial statements. The historical cost of other investments is £50m (2016/17: £48m).
(E) Net debt2018
£m2017
£m
Secured on the assets of the Company5.264% First Mortgage Debenture Bonds 2035 369 377 5.0055% First Mortgage Amortising Debentures 2035 95 99 5.357% First Mortgage Debenture Bonds 2028 255 348
719 824Unsecured 5.50% Senior Notes 2027 100 1023.895% Senior US Dollar Notes 20181 27 32 4.635% Senior US Dollar Notes 20211 156 181 4.766% Senior US Dollar Notes 20231 97 1135.003% Senior US Dollar Notes 20261 63 733.81% Senior Notes 2026 110 1143.97% Senior Notes 2026 112 117Fair value of options to issue under 1.5% convertible bond 2017 – 5Fair value of options to issue under 0% convertible bond 2020 – 32.375% First Mortgage Debenture Bonds 2029 298 –Bank loans and overdrafts 595 477
1,558 1,217Gross debt 2,277 2,041
Interest rate and currency derivative liabilities 133 134Interest rate and currency derivative assets (115) (217)Cash and short term deposits (32) (49)Net debt 2,263 1,9091 Principal and interest on these borrowings were fully hedged into Sterling at a floating rate at the time of issue.
1.5% Convertible bond 2012 (maturity 2017)On 10 September 2012, British Land (Jersey) Limited (the 2012 Issuer), a wholly-owned subsidiary of the Company, issued £400 million 1.5% guaranteed convertible bonds due 2017 (the 2012 bonds) at par. On 10 September 2017, the convertible bonds were redeemed at par.
151British Land Annual Report and Accounts 2018
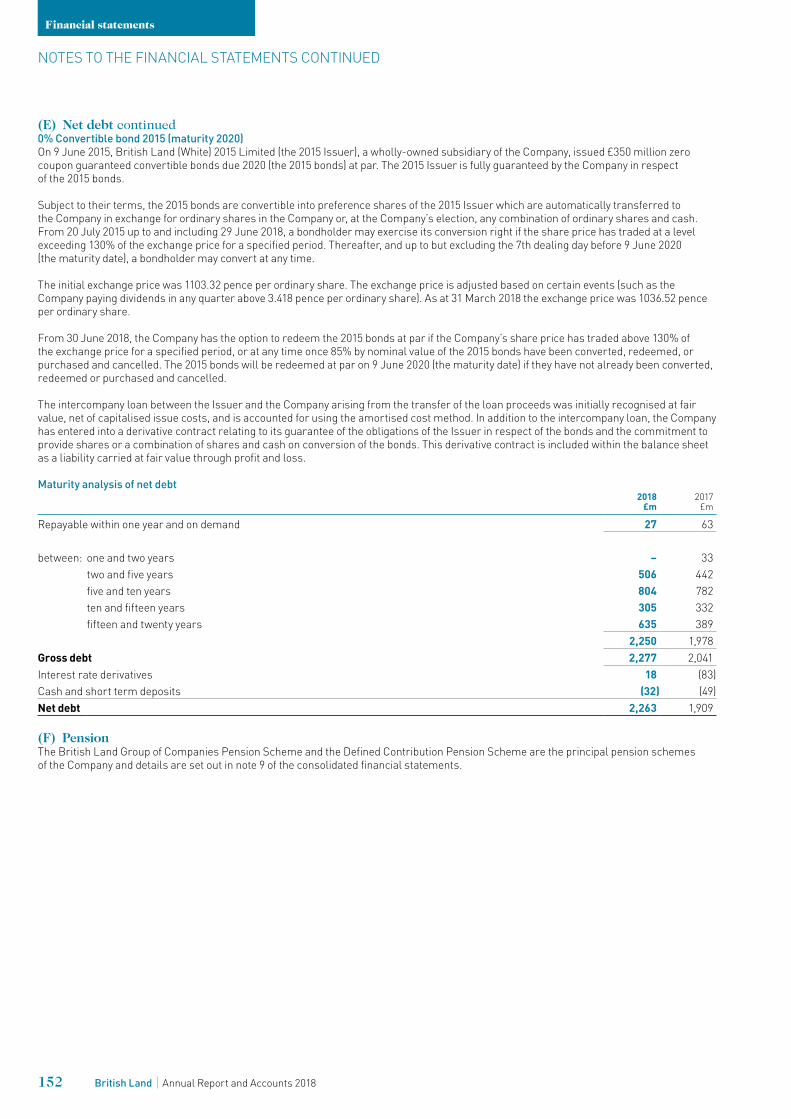
(E) Net debt continued0% Convertible bond 2015 (maturity 2020)On 9 June 2015, British Land (White) 2015 Limited (the 2015 Issuer), a wholly-owned subsidiary of the Company, issued £350 million zero coupon guaranteed convertible bonds due 2020 (the 2015 bonds) at par. The 2015 Issuer is fully guaranteed by the Company in respect of the 2015 bonds.
Subject to their terms, the 2015 bonds are convertible into preference shares of the 2015 Issuer which are automatically transferred to the Company in exchange for ordinary shares in the Company or, at the Company’s election, any combination of ordinary shares and cash. From 20 July 2015 up to and including 29 June 2018, a bondholder may exercise its conversion right if the share price has traded at a level exceeding 130% of the exchange price for a specified period. Thereafter, and up to but excluding the 7th dealing day before 9 June 2020 (the maturity date), a bondholder may convert at any time.
The initial exchange price was 1103.32 pence per ordinary share. The exchange price is adjusted based on certain events (such as the Company paying dividends in any quarter above 3.418 pence per ordinary share). As at 31 March 2018 the exchange price was 1036.52 pence per ordinary share.
From 30 June 2018, the Company has the option to redeem the 2015 bonds at par if the Company’s share price has traded above 130% of the exchange price for a specified period, or at any time once 85% by nominal value of the 2015 bonds have been converted, redeemed, or purchased and cancelled. The 2015 bonds will be redeemed at par on 9 June 2020 (the maturity date) if they have not already been converted, redeemed or purchased and cancelled.
The intercompany loan between the Issuer and the Company arising from the transfer of the loan proceeds was initially recognised at fair value, net of capitalised issue costs, and is accounted for using the amortised cost method. In addition to the intercompany loan, the Company has entered into a derivative contract relating to its guarantee of the obligations of the Issuer in respect of the bonds and the commitment to provide shares or a combination of shares and cash on conversion of the bonds. This derivative contract is included within the balance sheet as a liability carried at fair value through profit and loss.
Maturity analysis of net debt2018
£m2017
£m
Repayable within one year and on demand 27 63
between: one and two years – 33two and five years 506 442five and ten years 804 782ten and fifteen years 305 332fifteen and twenty years 635 389
2,250 1,978Gross debt 2,277 2,041Interest rate derivatives 18 (83)Cash and short term deposits (32) (49)Net debt 2,263 1,909
(F) PensionThe British Land Group of Companies Pension Scheme and the Defined Contribution Pension Scheme are the principal pension schemes of the Company and details are set out in note 9 of the consolidated financial statements.
152 British Land Annual Report and Accounts 2018
Financial statements
NOTES TO THE FINANCIAL STATEMENTS CONTINUED
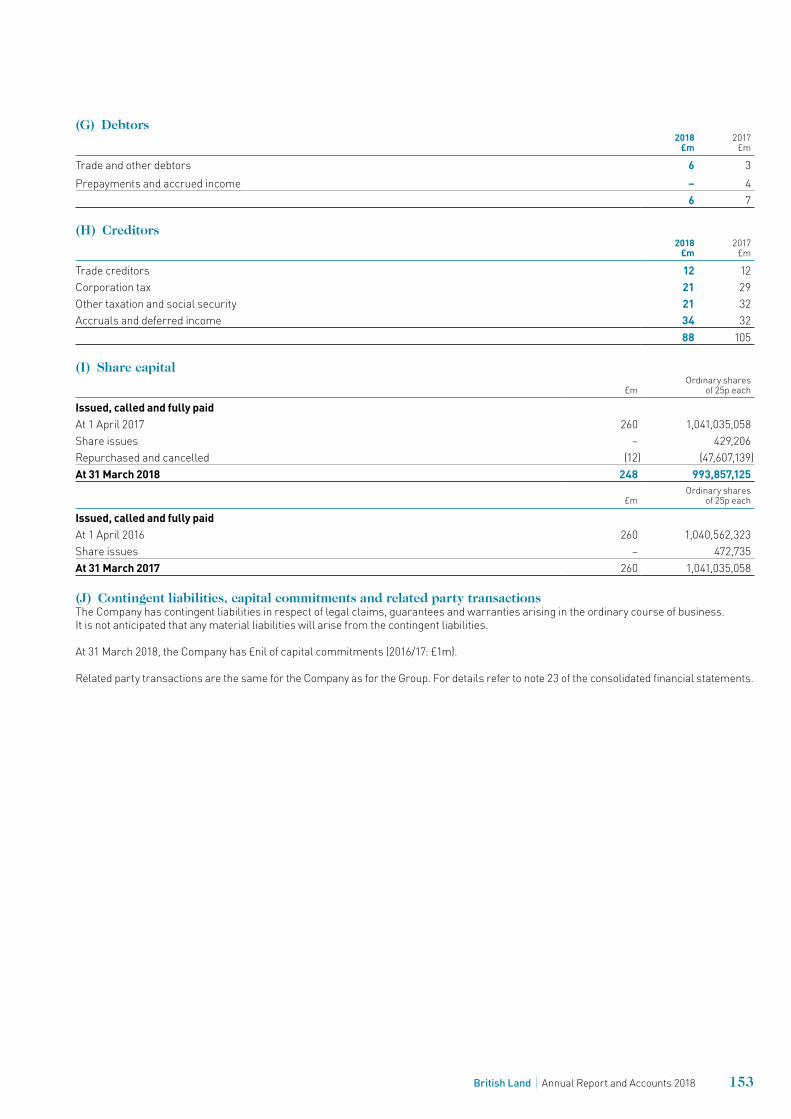
(G) Debtors2018
£m2017
£m
Trade and other debtors 6 3Prepayments and accrued income – 4
6 7
(H) Creditors2018
£m2017
£m
Trade creditors 12 12Corporation tax 21 29Other taxation and social security 21 32Accruals and deferred income 34 32
88 105
(I) Share capital
£mOrdinary shares
of 25p each
Issued, called and fully paidAt 1 April 2017 260 1,041,035,058Share issues – 429,206Repurchased and cancelled (12) (47,607,139)At 31 March 2018 248 993,857,125
£mOrdinary shares
of 25p each
Issued, called and fully paidAt 1 April 2016 260 1,040,562,323Share issues – 472,735At 31 March 2017 260 1,041,035,058
(J) Contingent liabilities, capital commitments and related party transactions The Company has contingent liabilities in respect of legal claims, guarantees and warranties arising in the ordinary course of business. It is not anticipated that any material liabilities will arise from the contingent liabilities.
At 31 March 2018, the Company has £nil of capital commitments (2016/17: £1m).
Related party transactions are the same for the Company as for the Group. For details refer to note 23 of the consolidated financial statements.
153British Land Annual Report and Accounts 2018
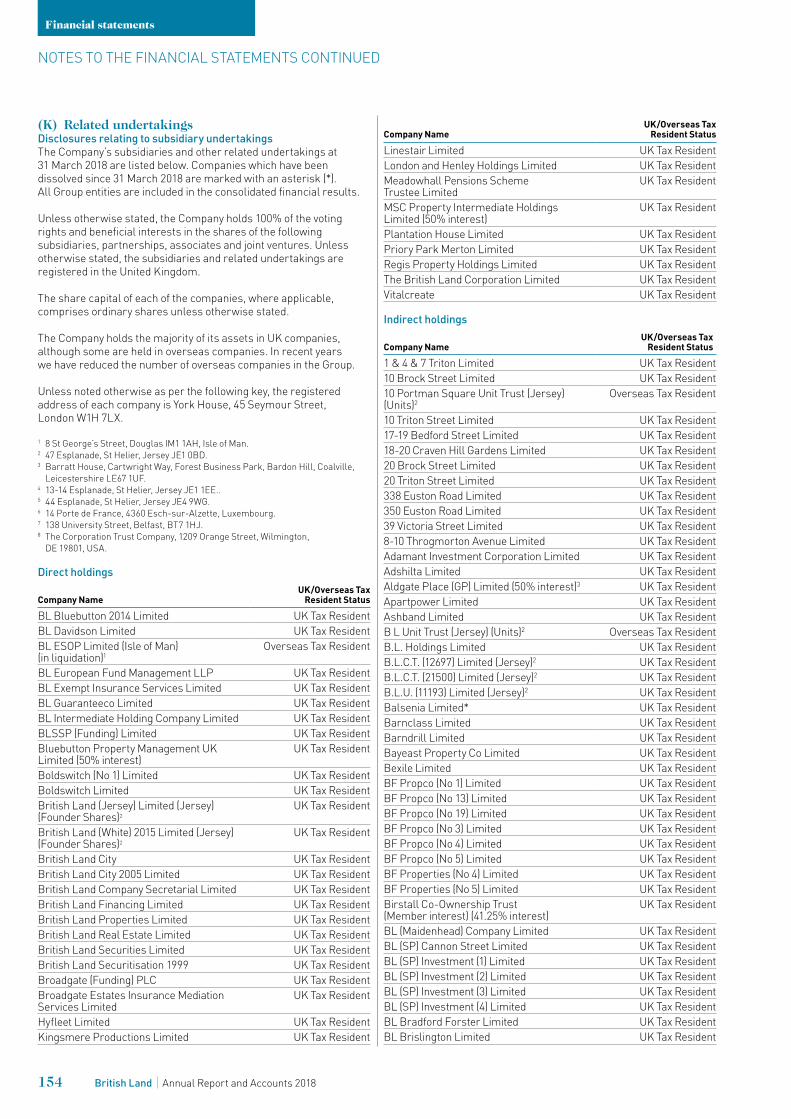
(K) Related undertakingsDisclosures relating to subsidiary undertakings The Company’s subsidiaries and other related undertakings at 31 March 2018 are listed below. Companies which have been dissolved since 31 March 2018 are marked with an asterisk (*). All Group entities are included in the consolidated financial results.
Unless otherwise stated, the Company holds 100% of the voting rights and beneficial interests in the shares of the following subsidiaries, partnerships, associates and joint ventures. Unless otherwise stated, the subsidiaries and related undertakings are registered in the United Kingdom.
The share capital of each of the companies, where applicable, comprises ordinary shares unless otherwise stated.
The Company holds the majority of its assets in UK companies, although some are held in overseas companies. In recent years we have reduced the number of overseas companies in the Group.
Unless noted otherwise as per the following key, the registered address of each company is York House, 45 Seymour Street, London W1H 7LX.
1 8 St George’s Street, Douglas IM1 1AH, Isle of Man.2 47 Esplanade, St Helier, Jersey JE1 0BD.3 Barratt House, Cartwright Way, Forest Business Park, Bardon Hill, Coalville,
Leicestershire LE67 1UF.4 13-14 Esplanade, St Helier, Jersey JE1 1EE..5 44 Esplanade, St Helier, Jersey JE4 9WG.6 14 Porte de France, 4360 Esch-sur-Alzette, Luxembourg.7 138 University Street, Belfast, BT7 1HJ.8 The Corporation Trust Company, 1209 Orange Street, Wilmington,
DE 19801, USA.
Direct holdings
Company NameUK/Overseas Tax
Resident Status
BL Bluebutton 2014 Limited UK Tax ResidentBL Davidson Limited UK Tax ResidentBL ESOP Limited (Isle of Man) (in liquidation)1
Overseas Tax Resident
BL European Fund Management LLP UK Tax ResidentBL Exempt Insurance Services Limited UK Tax ResidentBL Guaranteeco Limited UK Tax ResidentBL Intermediate Holding Company Limited UK Tax ResidentBLSSP (Funding) Limited UK Tax ResidentBluebutton Property Management UK Limited (50% interest)
UK Tax Resident
Boldswitch (No 1) Limited UK Tax ResidentBoldswitch Limited UK Tax ResidentBritish Land (Jersey) Limited (Jersey) (Founder Shares)2
UK Tax Resident
British Land (White) 2015 Limited (Jersey) (Founder Shares)2
UK Tax Resident
British Land City UK Tax ResidentBritish Land City 2005 Limited UK Tax ResidentBritish Land Company Secretarial Limited UK Tax ResidentBritish Land Financing Limited UK Tax ResidentBritish Land Properties Limited UK Tax ResidentBritish Land Real Estate Limited UK Tax ResidentBritish Land Securities Limited UK Tax ResidentBritish Land Securitisation 1999 UK Tax ResidentBroadgate (Funding) PLC UK Tax ResidentBroadgate Estates Insurance Mediation Services Limited
UK Tax Resident
Hyfleet Limited UK Tax ResidentKingsmere Productions Limited UK Tax Resident
Company NameUK/Overseas Tax
Resident Status
Linestair Limited UK Tax ResidentLondon and Henley Holdings Limited UK Tax ResidentMeadowhall Pensions Scheme Trustee Limited
UK Tax Resident
MSC Property Intermediate Holdings Limited (50% interest)
UK Tax Resident
Plantation House Limited UK Tax ResidentPriory Park Merton Limited UK Tax ResidentRegis Property Holdings Limited UK Tax ResidentThe British Land Corporation Limited UK Tax ResidentVitalcreate UK Tax Resident
Indirect holdings
Company NameUK/Overseas Tax
Resident Status
1 & 4 & 7 Triton Limited UK Tax Resident10 Brock Street Limited UK Tax Resident10 Portman Square Unit Trust (Jersey) (Units)2
Overseas Tax Resident
10 Triton Street Limited UK Tax Resident17-19 Bedford Street Limited UK Tax Resident18-20 Craven Hill Gardens Limited UK Tax Resident20 Brock Street Limited UK Tax Resident20 Triton Street Limited UK Tax Resident338 Euston Road Limited UK Tax Resident350 Euston Road Limited UK Tax Resident39 Victoria Street Limited UK Tax Resident8-10 Throgmorton Avenue Limited UK Tax ResidentAdamant Investment Corporation Limited UK Tax ResidentAdshilta Limited UK Tax ResidentAldgate Place (GP) Limited (50% interest)3 UK Tax ResidentApartpower Limited UK Tax ResidentAshband Limited UK Tax ResidentB L Unit Trust (Jersey) (Units)2 Overseas Tax ResidentB.L. Holdings Limited UK Tax ResidentB.L.C.T. (12697) Limited (Jersey)2 UK Tax ResidentB.L.C.T. (21500) Limited (Jersey)2 UK Tax ResidentB.L.U. (11193) Limited (Jersey)2 UK Tax ResidentBalsenia Limited* UK Tax ResidentBarnclass Limited UK Tax ResidentBarndrill Limited UK Tax ResidentBayeast Property Co Limited UK Tax ResidentBexile Limited UK Tax ResidentBF Propco (No 1) Limited UK Tax ResidentBF Propco (No 13) Limited UK Tax ResidentBF Propco (No 19) Limited UK Tax ResidentBF Propco (No 3) Limited UK Tax ResidentBF Propco (No 4) Limited UK Tax ResidentBF Propco (No 5) Limited UK Tax ResidentBF Properties (No 4) Limited UK Tax ResidentBF Properties (No 5) Limited UK Tax ResidentBirstall Co-Ownership Trust (Member interest) (41.25% interest)
UK Tax Resident
BL (Maidenhead) Company Limited UK Tax ResidentBL (SP) Cannon Street Limited UK Tax ResidentBL (SP) Investment (1) Limited UK Tax ResidentBL (SP) Investment (2) Limited UK Tax ResidentBL (SP) Investment (3) Limited UK Tax ResidentBL (SP) Investment (4) Limited UK Tax ResidentBL Bradford Forster Limited UK Tax ResidentBL Brislington Limited UK Tax Resident
154 British Land Annual Report and Accounts 2018
Financial statements
NOTES TO THE FINANCIAL STATEMENTS CONTINUED
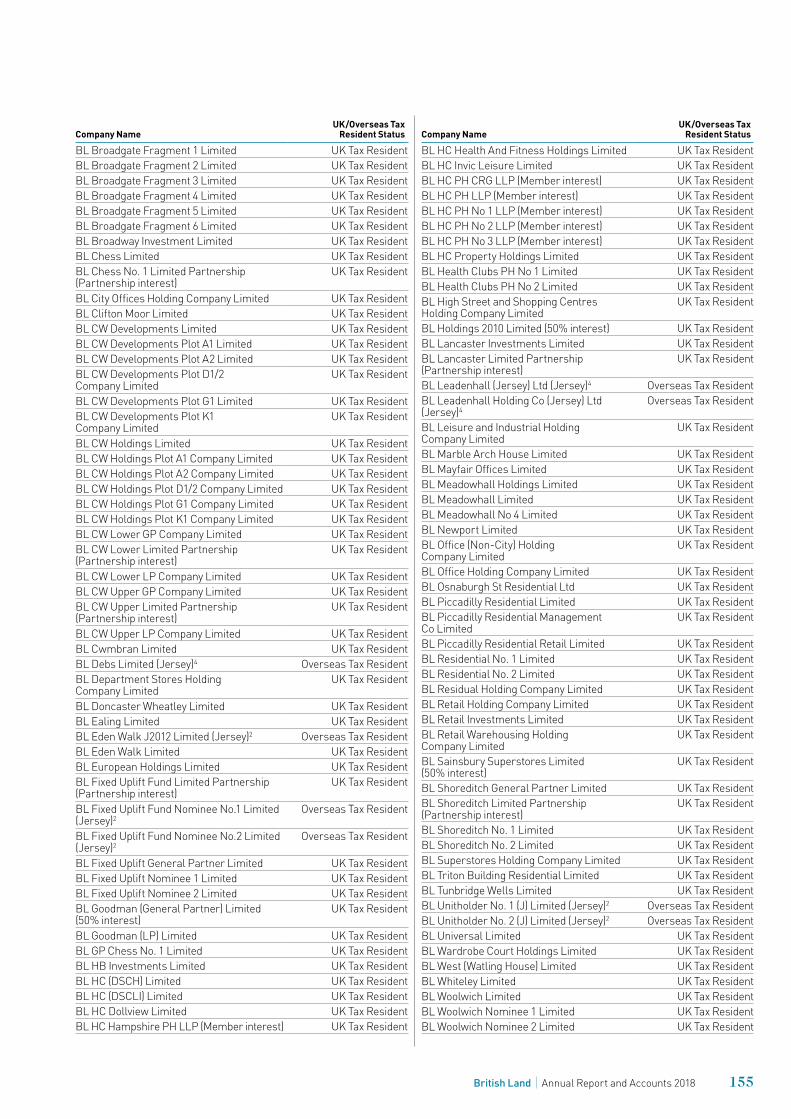
Company NameUK/Overseas Tax
Resident Status
BL Broadgate Fragment 1 Limited UK Tax ResidentBL Broadgate Fragment 2 Limited UK Tax ResidentBL Broadgate Fragment 3 Limited UK Tax ResidentBL Broadgate Fragment 4 Limited UK Tax ResidentBL Broadgate Fragment 5 Limited UK Tax ResidentBL Broadgate Fragment 6 Limited UK Tax ResidentBL Broadway Investment Limited UK Tax ResidentBL Chess Limited UK Tax ResidentBL Chess No. 1 Limited Partnership (Partnership interest)
UK Tax Resident
BL City Offices Holding Company Limited UK Tax ResidentBL Clifton Moor Limited UK Tax ResidentBL CW Developments Limited UK Tax ResidentBL CW Developments Plot A1 Limited UK Tax ResidentBL CW Developments Plot A2 Limited UK Tax ResidentBL CW Developments Plot D1/2 Company Limited
UK Tax Resident
BL CW Developments Plot G1 Limited UK Tax ResidentBL CW Developments Plot K1 Company Limited
UK Tax Resident
BL CW Holdings Limited UK Tax ResidentBL CW Holdings Plot A1 Company Limited UK Tax ResidentBL CW Holdings Plot A2 Company Limited UK Tax ResidentBL CW Holdings Plot D1/2 Company Limited UK Tax ResidentBL CW Holdings Plot G1 Company Limited UK Tax ResidentBL CW Holdings Plot K1 Company Limited UK Tax ResidentBL CW Lower GP Company Limited UK Tax ResidentBL CW Lower Limited Partnership (Partnership interest)
UK Tax Resident
BL CW Lower LP Company Limited UK Tax ResidentBL CW Upper GP Company Limited UK Tax ResidentBL CW Upper Limited Partnership (Partnership interest)
UK Tax Resident
BL CW Upper LP Company Limited UK Tax ResidentBL Cwmbran Limited UK Tax ResidentBL Debs Limited (Jersey)4 Overseas Tax ResidentBL Department Stores Holding Company Limited
UK Tax Resident
BL Doncaster Wheatley Limited UK Tax ResidentBL Ealing Limited UK Tax ResidentBL Eden Walk J2012 Limited (Jersey)2 Overseas Tax ResidentBL Eden Walk Limited UK Tax ResidentBL European Holdings Limited UK Tax ResidentBL Fixed Uplift Fund Limited Partnership (Partnership interest)
UK Tax Resident
BL Fixed Uplift Fund Nominee No.1 Limited (Jersey)2
Overseas Tax Resident
BL Fixed Uplift Fund Nominee No.2 Limited (Jersey)2
Overseas Tax Resident
BL Fixed Uplift General Partner Limited UK Tax ResidentBL Fixed Uplift Nominee 1 Limited UK Tax ResidentBL Fixed Uplift Nominee 2 Limited UK Tax ResidentBL Goodman (General Partner) Limited (50% interest)
UK Tax Resident
BL Goodman (LP) Limited UK Tax ResidentBL GP Chess No. 1 Limited UK Tax ResidentBL HB Investments Limited UK Tax ResidentBL HC (DSCH) Limited UK Tax ResidentBL HC (DSCLI) Limited UK Tax ResidentBL HC Dollview Limited UK Tax ResidentBL HC Hampshire PH LLP (Member interest) UK Tax Resident
Company NameUK/Overseas Tax
Resident Status
BL HC Health And Fitness Holdings Limited UK Tax ResidentBL HC Invic Leisure Limited UK Tax ResidentBL HC PH CRG LLP (Member interest) UK Tax ResidentBL HC PH LLP (Member interest) UK Tax ResidentBL HC PH No 1 LLP (Member interest) UK Tax ResidentBL HC PH No 2 LLP (Member interest) UK Tax ResidentBL HC PH No 3 LLP (Member interest) UK Tax ResidentBL HC Property Holdings Limited UK Tax ResidentBL Health Clubs PH No 1 Limited UK Tax ResidentBL Health Clubs PH No 2 Limited UK Tax ResidentBL High Street and Shopping Centres Holding Company Limited
UK Tax Resident
BL Holdings 2010 Limited (50% interest) UK Tax ResidentBL Lancaster Investments Limited UK Tax ResidentBL Lancaster Limited Partnership (Partnership interest)
UK Tax Resident
BL Leadenhall (Jersey) Ltd (Jersey)4 Overseas Tax ResidentBL Leadenhall Holding Co (Jersey) Ltd (Jersey)4
Overseas Tax Resident
BL Leisure and Industrial Holding Company Limited
UK Tax Resident
BL Marble Arch House Limited UK Tax ResidentBL Mayfair Offices Limited UK Tax ResidentBL Meadowhall Holdings Limited UK Tax ResidentBL Meadowhall Limited UK Tax ResidentBL Meadowhall No 4 Limited UK Tax ResidentBL Newport Limited UK Tax ResidentBL Office (Non-City) Holding Company Limited
UK Tax Resident
BL Office Holding Company Limited UK Tax ResidentBL Osnaburgh St Residential Ltd UK Tax ResidentBL Piccadilly Residential Limited UK Tax ResidentBL Piccadilly Residential Management Co Limited
UK Tax Resident
BL Piccadilly Residential Retail Limited UK Tax ResidentBL Residential No. 1 Limited UK Tax ResidentBL Residential No. 2 Limited UK Tax ResidentBL Residual Holding Company Limited UK Tax ResidentBL Retail Holding Company Limited UK Tax ResidentBL Retail Investments Limited UK Tax ResidentBL Retail Warehousing Holding Company Limited
UK Tax Resident
BL Sainsbury Superstores Limited (50% interest)
UK Tax Resident
BL Shoreditch General Partner Limited UK Tax ResidentBL Shoreditch Limited Partnership (Partnership interest)
UK Tax Resident
BL Shoreditch No. 1 Limited UK Tax ResidentBL Shoreditch No. 2 Limited UK Tax ResidentBL Superstores Holding Company Limited UK Tax ResidentBL Triton Building Residential Limited UK Tax ResidentBL Tunbridge Wells Limited UK Tax ResidentBL Unitholder No. 1 (J) Limited (Jersey)2 Overseas Tax ResidentBL Unitholder No. 2 (J) Limited (Jersey)2 Overseas Tax ResidentBL Universal Limited UK Tax ResidentBL Wardrobe Court Holdings Limited UK Tax ResidentBL West (Watling House) Limited UK Tax ResidentBL Whiteley Limited UK Tax ResidentBL Woolwich Limited UK Tax ResidentBL Woolwich Nominee 1 Limited UK Tax ResidentBL Woolwich Nominee 2 Limited UK Tax Resident
155British Land Annual Report and Accounts 2018
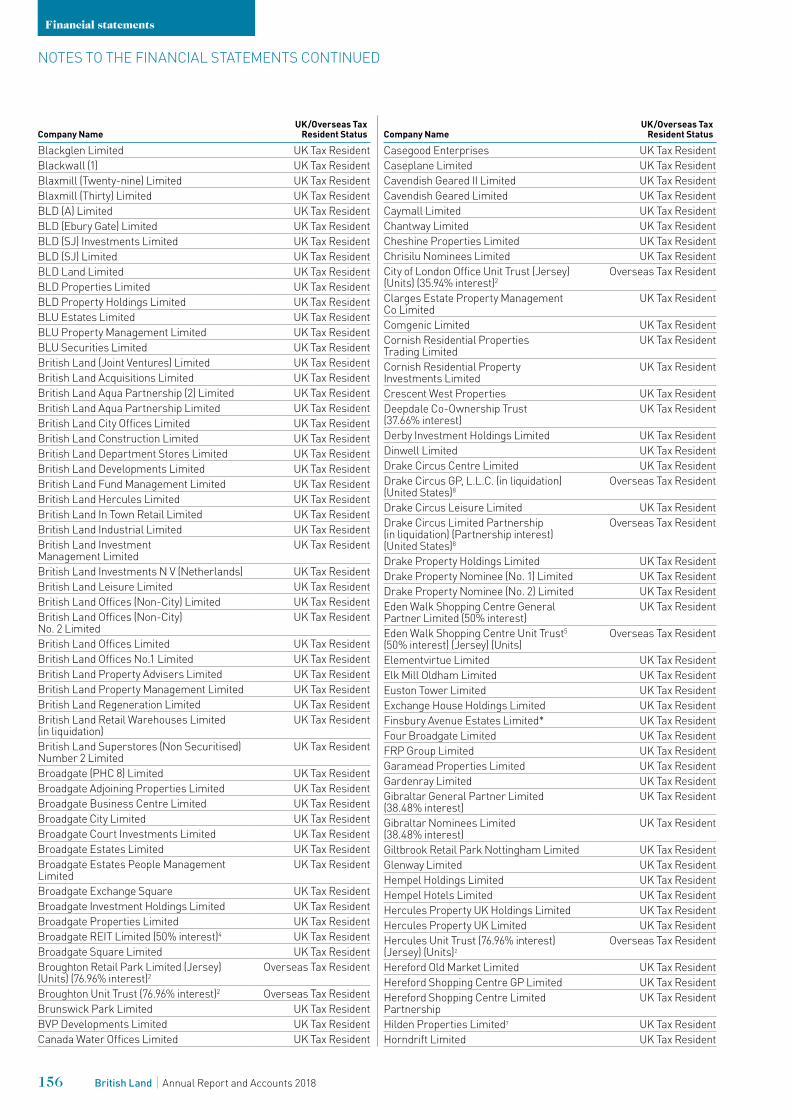
Company NameUK/Overseas Tax
Resident Status
Blackglen Limited UK Tax ResidentBlackwall (1) UK Tax ResidentBlaxmill (Twenty-nine) Limited UK Tax ResidentBlaxmill (Thirty) Limited UK Tax ResidentBLD (A) Limited UK Tax ResidentBLD (Ebury Gate) Limited UK Tax ResidentBLD (SJ) Investments Limited UK Tax ResidentBLD (SJ) Limited UK Tax ResidentBLD Land Limited UK Tax ResidentBLD Properties Limited UK Tax ResidentBLD Property Holdings Limited UK Tax ResidentBLU Estates Limited UK Tax ResidentBLU Property Management Limited UK Tax ResidentBLU Securities Limited UK Tax ResidentBritish Land (Joint Ventures) Limited UK Tax ResidentBritish Land Acquisitions Limited UK Tax ResidentBritish Land Aqua Partnership (2) Limited UK Tax ResidentBritish Land Aqua Partnership Limited UK Tax ResidentBritish Land City Offices Limited UK Tax ResidentBritish Land Construction Limited UK Tax ResidentBritish Land Department Stores Limited UK Tax ResidentBritish Land Developments Limited UK Tax ResidentBritish Land Fund Management Limited UK Tax ResidentBritish Land Hercules Limited UK Tax ResidentBritish Land In Town Retail Limited UK Tax ResidentBritish Land Industrial Limited UK Tax ResidentBritish Land Investment Management Limited
UK Tax Resident
British Land Investments N V (Netherlands) UK Tax ResidentBritish Land Leisure Limited UK Tax ResidentBritish Land Offices (Non-City) Limited UK Tax ResidentBritish Land Offices (Non-City) No. 2 Limited
UK Tax Resident
British Land Offices Limited UK Tax ResidentBritish Land Offices No.1 Limited UK Tax ResidentBritish Land Property Advisers Limited UK Tax ResidentBritish Land Property Management Limited UK Tax ResidentBritish Land Regeneration Limited UK Tax ResidentBritish Land Retail Warehouses Limited (in liquidation)
UK Tax Resident
British Land Superstores (Non Securitised) Number 2 Limited
UK Tax Resident
Broadgate (PHC 8) Limited UK Tax ResidentBroadgate Adjoining Properties Limited UK Tax ResidentBroadgate Business Centre Limited UK Tax ResidentBroadgate City Limited UK Tax ResidentBroadgate Court Investments Limited UK Tax ResidentBroadgate Estates Limited UK Tax ResidentBroadgate Estates People Management Limited
UK Tax Resident
Broadgate Exchange Square UK Tax ResidentBroadgate Investment Holdings Limited UK Tax ResidentBroadgate Properties Limited UK Tax ResidentBroadgate REIT Limited (50% interest)4 UK Tax ResidentBroadgate Square Limited UK Tax ResidentBroughton Retail Park Limited (Jersey) (Units) (76.96% interest)2
Overseas Tax Resident
Broughton Unit Trust (76.96% interest)2 Overseas Tax ResidentBrunswick Park Limited UK Tax ResidentBVP Developments Limited UK Tax ResidentCanada Water Offices Limited UK Tax Resident
Company NameUK/Overseas Tax
Resident Status
Casegood Enterprises UK Tax ResidentCaseplane Limited UK Tax ResidentCavendish Geared II Limited UK Tax ResidentCavendish Geared Limited UK Tax ResidentCaymall Limited UK Tax ResidentChantway Limited UK Tax ResidentCheshine Properties Limited UK Tax ResidentChrisilu Nominees Limited UK Tax ResidentCity of London Office Unit Trust (Jersey) (Units) (35.94% interest)2
Overseas Tax Resident
Clarges Estate Property Management Co Limited
UK Tax Resident
Comgenic Limited UK Tax ResidentCornish Residential Properties Trading Limited
UK Tax Resident
Cornish Residential Property Investments Limited
UK Tax Resident
Crescent West Properties UK Tax ResidentDeepdale Co-Ownership Trust (37.66% interest)
UK Tax Resident
Derby Investment Holdings Limited UK Tax ResidentDinwell Limited UK Tax ResidentDrake Circus Centre Limited UK Tax ResidentDrake Circus GP, L.L.C. (in liquidation) (United States)8
Overseas Tax Resident
Drake Circus Leisure Limited UK Tax ResidentDrake Circus Limited Partnership (in liquidation) (Partnership interest) (United States)8
Overseas Tax Resident
Drake Property Holdings Limited UK Tax ResidentDrake Property Nominee (No. 1) Limited UK Tax ResidentDrake Property Nominee (No. 2) Limited UK Tax ResidentEden Walk Shopping Centre General Partner Limited (50% interest)
UK Tax Resident
Eden Walk Shopping Centre Unit Trust5 (50% interest) (Jersey) (Units)
Overseas Tax Resident
Elementvirtue Limited UK Tax ResidentElk Mill Oldham Limited UK Tax ResidentEuston Tower Limited UK Tax ResidentExchange House Holdings Limited UK Tax ResidentFinsbury Avenue Estates Limited* UK Tax ResidentFour Broadgate Limited UK Tax ResidentFRP Group Limited UK Tax ResidentGaramead Properties Limited UK Tax ResidentGardenray Limited UK Tax ResidentGibraltar General Partner Limited (38.48% interest)
UK Tax Resident
Gibraltar Nominees Limited (38.48% interest)
UK Tax Resident
Giltbrook Retail Park Nottingham Limited UK Tax ResidentGlenway Limited UK Tax ResidentHempel Holdings Limited UK Tax ResidentHempel Hotels Limited UK Tax ResidentHercules Property UK Holdings Limited UK Tax ResidentHercules Property UK Limited UK Tax ResidentHercules Unit Trust (76.96% interest) (Jersey) (Units)2
Overseas Tax Resident
Hereford Old Market Limited UK Tax ResidentHereford Shopping Centre GP Limited UK Tax ResidentHereford Shopping Centre Limited Partnership
UK Tax Resident
Hilden Properties Limited7 UK Tax ResidentHorndrift Limited UK Tax Resident
156 British Land Annual Report and Accounts 2018
Financial statements
NOTES TO THE FINANCIAL STATEMENTS CONTINUED
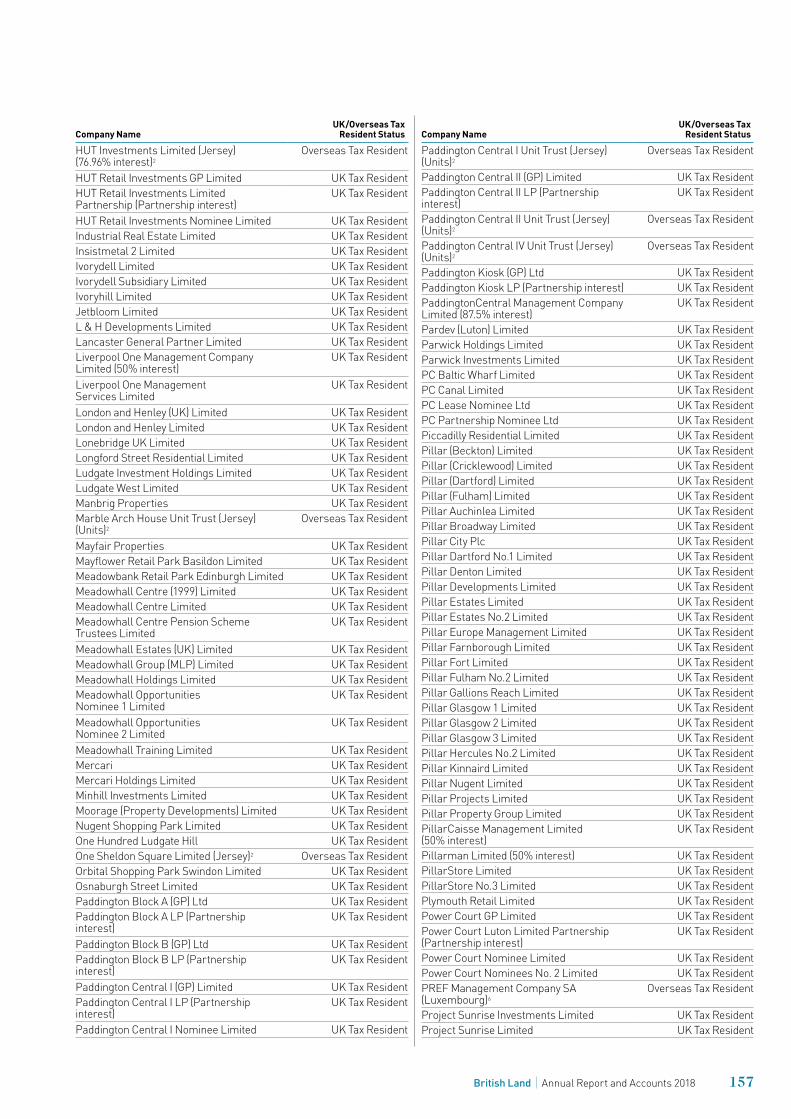
Company NameUK/Overseas Tax
Resident Status
HUT Investments Limited (Jersey) (76.96% interest)2
Overseas Tax Resident
HUT Retail Investments GP Limited UK Tax ResidentHUT Retail Investments Limited Partnership (Partnership interest)
UK Tax Resident
HUT Retail Investments Nominee Limited UK Tax ResidentIndustrial Real Estate Limited UK Tax ResidentInsistmetal 2 Limited UK Tax ResidentIvorydell Limited UK Tax ResidentIvorydell Subsidiary Limited UK Tax ResidentIvoryhill Limited UK Tax ResidentJetbloom Limited UK Tax ResidentL & H Developments Limited UK Tax ResidentLancaster General Partner Limited UK Tax ResidentLiverpool One Management Company Limited (50% interest)
UK Tax Resident
Liverpool One Management Services Limited
UK Tax Resident
London and Henley (UK) Limited UK Tax ResidentLondon and Henley Limited UK Tax ResidentLonebridge UK Limited UK Tax ResidentLongford Street Residential Limited UK Tax ResidentLudgate Investment Holdings Limited UK Tax ResidentLudgate West Limited UK Tax ResidentManbrig Properties UK Tax ResidentMarble Arch House Unit Trust (Jersey) (Units)2
Overseas Tax Resident
Mayfair Properties UK Tax ResidentMayflower Retail Park Basildon Limited UK Tax ResidentMeadowbank Retail Park Edinburgh Limited UK Tax ResidentMeadowhall Centre (1999) Limited UK Tax ResidentMeadowhall Centre Limited UK Tax ResidentMeadowhall Centre Pension Scheme Trustees Limited
UK Tax Resident
Meadowhall Estates (UK) Limited UK Tax ResidentMeadowhall Group (MLP) Limited UK Tax ResidentMeadowhall Holdings Limited UK Tax ResidentMeadowhall Opportunities Nominee 1 Limited
UK Tax Resident
Meadowhall Opportunities Nominee 2 Limited
UK Tax Resident
Meadowhall Training Limited UK Tax ResidentMercari UK Tax ResidentMercari Holdings Limited UK Tax ResidentMinhill Investments Limited UK Tax ResidentMoorage (Property Developments) Limited UK Tax ResidentNugent Shopping Park Limited UK Tax ResidentOne Hundred Ludgate Hill UK Tax ResidentOne Sheldon Square Limited (Jersey)2 Overseas Tax ResidentOrbital Shopping Park Swindon Limited UK Tax ResidentOsnaburgh Street Limited UK Tax ResidentPaddington Block A (GP) Ltd UK Tax ResidentPaddington Block A LP (Partnership interest)
UK Tax Resident
Paddington Block B (GP) Ltd UK Tax ResidentPaddington Block B LP (Partnership interest)
UK Tax Resident
Paddington Central I (GP) Limited UK Tax ResidentPaddington Central I LP (Partnership interest)
UK Tax Resident
Paddington Central I Nominee Limited UK Tax Resident
Company NameUK/Overseas Tax
Resident Status
Paddington Central I Unit Trust (Jersey) (Units)2
Overseas Tax Resident
Paddington Central II (GP) Limited UK Tax ResidentPaddington Central II LP (Partnership interest)
UK Tax Resident
Paddington Central II Unit Trust (Jersey) (Units)2
Overseas Tax Resident
Paddington Central IV Unit Trust (Jersey) (Units)2
Overseas Tax Resident
Paddington Kiosk (GP) Ltd UK Tax ResidentPaddington Kiosk LP (Partnership interest) UK Tax ResidentPaddingtonCentral Management Company Limited (87.5% interest)
UK Tax Resident
Pardev (Luton) Limited UK Tax ResidentParwick Holdings Limited UK Tax ResidentParwick Investments Limited UK Tax ResidentPC Baltic Wharf Limited UK Tax ResidentPC Canal Limited UK Tax ResidentPC Lease Nominee Ltd UK Tax ResidentPC Partnership Nominee Ltd UK Tax ResidentPiccadilly Residential Limited UK Tax ResidentPillar (Beckton) Limited UK Tax ResidentPillar (Cricklewood) Limited UK Tax ResidentPillar (Dartford) Limited UK Tax ResidentPillar (Fulham) Limited UK Tax ResidentPillar Auchinlea Limited UK Tax ResidentPillar Broadway Limited UK Tax ResidentPillar City Plc UK Tax ResidentPillar Dartford No.1 Limited UK Tax ResidentPillar Denton Limited UK Tax ResidentPillar Developments Limited UK Tax ResidentPillar Estates Limited UK Tax ResidentPillar Estates No.2 Limited UK Tax ResidentPillar Europe Management Limited UK Tax ResidentPillar Farnborough Limited UK Tax ResidentPillar Fort Limited UK Tax ResidentPillar Fulham No.2 Limited UK Tax ResidentPillar Gallions Reach Limited UK Tax ResidentPillar Glasgow 1 Limited UK Tax ResidentPillar Glasgow 2 Limited UK Tax ResidentPillar Glasgow 3 Limited UK Tax ResidentPillar Hercules No.2 Limited UK Tax ResidentPillar Kinnaird Limited UK Tax ResidentPillar Nugent Limited UK Tax ResidentPillar Projects Limited UK Tax ResidentPillar Property Group Limited UK Tax ResidentPillarCaisse Management Limited (50% interest)
UK Tax Resident
Pillarman Limited (50% interest) UK Tax ResidentPillarStore Limited UK Tax ResidentPillarStore No.3 Limited UK Tax ResidentPlymouth Retail Limited UK Tax ResidentPower Court GP Limited UK Tax ResidentPower Court Luton Limited Partnership (Partnership interest)
UK Tax Resident
Power Court Nominee Limited UK Tax ResidentPower Court Nominees No. 2 Limited UK Tax ResidentPREF Management Company SA (Luxembourg)6
Overseas Tax Resident
Project Sunrise Investments Limited UK Tax ResidentProject Sunrise Limited UK Tax Resident
157British Land Annual Report and Accounts 2018
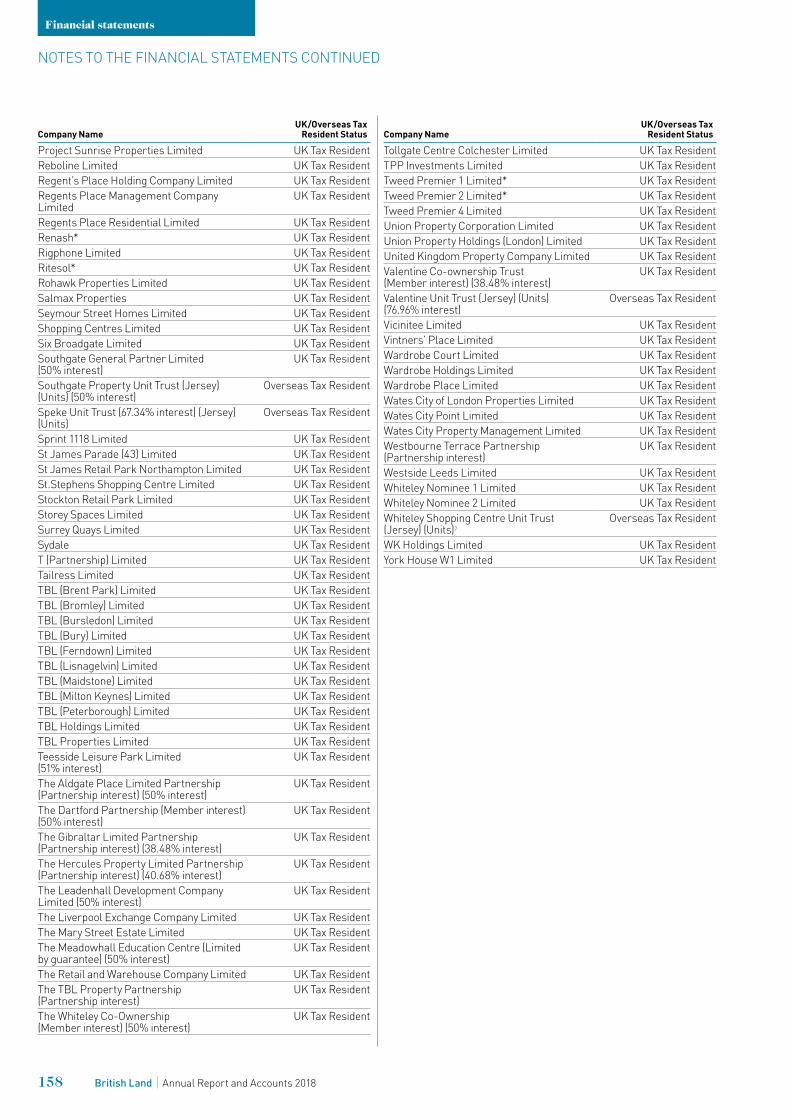
Company NameUK/Overseas Tax
Resident Status
Project Sunrise Properties Limited UK Tax ResidentReboline Limited UK Tax ResidentRegent’s Place Holding Company Limited UK Tax ResidentRegents Place Management Company Limited
UK Tax Resident
Regents Place Residential Limited UK Tax ResidentRenash* UK Tax ResidentRigphone Limited UK Tax ResidentRitesol* UK Tax ResidentRohawk Properties Limited UK Tax ResidentSalmax Properties UK Tax ResidentSeymour Street Homes Limited UK Tax ResidentShopping Centres Limited UK Tax ResidentSix Broadgate Limited UK Tax ResidentSouthgate General Partner Limited (50% interest)
UK Tax Resident
Southgate Property Unit Trust (Jersey) (Units) (50% interest)
Overseas Tax Resident
Speke Unit Trust (67.34% interest) (Jersey) (Units)
Overseas Tax Resident
Sprint 1118 Limited UK Tax ResidentSt James Parade (43) Limited UK Tax ResidentSt James Retail Park Northampton Limited UK Tax ResidentSt.Stephens Shopping Centre Limited UK Tax ResidentStockton Retail Park Limited UK Tax ResidentStorey Spaces Limited UK Tax ResidentSurrey Quays Limited UK Tax ResidentSydale UK Tax ResidentT (Partnership) Limited UK Tax ResidentTailress Limited UK Tax ResidentTBL (Brent Park) Limited UK Tax ResidentTBL (Bromley) Limited UK Tax ResidentTBL (Bursledon) Limited UK Tax ResidentTBL (Bury) Limited UK Tax ResidentTBL (Ferndown) Limited UK Tax ResidentTBL (Lisnagelvin) Limited UK Tax ResidentTBL (Maidstone) Limited UK Tax ResidentTBL (Milton Keynes) Limited UK Tax ResidentTBL (Peterborough) Limited UK Tax ResidentTBL Holdings Limited UK Tax ResidentTBL Properties Limited UK Tax ResidentTeesside Leisure Park Limited (51% interest)
UK Tax Resident
The Aldgate Place Limited Partnership (Partnership interest) (50% interest)
UK Tax Resident
The Dartford Partnership (Member interest)(50% interest)
UK Tax Resident
The Gibraltar Limited Partnership (Partnership interest) (38.48% interest)
UK Tax Resident
The Hercules Property Limited Partnership (Partnership interest) (40.68% interest)
UK Tax Resident
The Leadenhall Development Company Limited (50% interest)
UK Tax Resident
The Liverpool Exchange Company Limited UK Tax ResidentThe Mary Street Estate Limited UK Tax ResidentThe Meadowhall Education Centre (Limited by guarantee) (50% interest)
UK Tax Resident
The Retail and Warehouse Company Limited UK Tax ResidentThe TBL Property Partnership (Partnership interest)
UK Tax Resident
The Whiteley Co-Ownership (Member interest) (50% interest)
UK Tax Resident
Company NameUK/Overseas Tax
Resident Status
Tollgate Centre Colchester Limited UK Tax ResidentTPP Investments Limited UK Tax ResidentTweed Premier 1 Limited* UK Tax ResidentTweed Premier 2 Limited* UK Tax ResidentTweed Premier 4 Limited UK Tax ResidentUnion Property Corporation Limited UK Tax ResidentUnion Property Holdings (London) Limited UK Tax ResidentUnited Kingdom Property Company Limited UK Tax ResidentValentine Co-ownership Trust (Member interest) (38.48% interest)
UK Tax Resident
Valentine Unit Trust (Jersey) (Units) (76.96% interest)
Overseas Tax Resident
Vicinitee Limited UK Tax ResidentVintners’ Place Limited UK Tax ResidentWardrobe Court Limited UK Tax ResidentWardrobe Holdings Limited UK Tax ResidentWardrobe Place Limited UK Tax ResidentWates City of London Properties Limited UK Tax ResidentWates City Point Limited UK Tax ResidentWates City Property Management Limited UK Tax ResidentWestbourne Terrace Partnership (Partnership interest)
UK Tax Resident
Westside Leeds Limited UK Tax ResidentWhiteley Nominee 1 Limited UK Tax ResidentWhiteley Nominee 2 Limited UK Tax ResidentWhiteley Shopping Centre Unit Trust (Jersey) (Units)2
Overseas Tax Resident
WK Holdings Limited UK Tax ResidentYork House W1 Limited UK Tax Resident
158 British Land Annual Report and Accounts 2018
Financial statements
NOTES TO THE FINANCIAL STATEMENTS CONTINUED
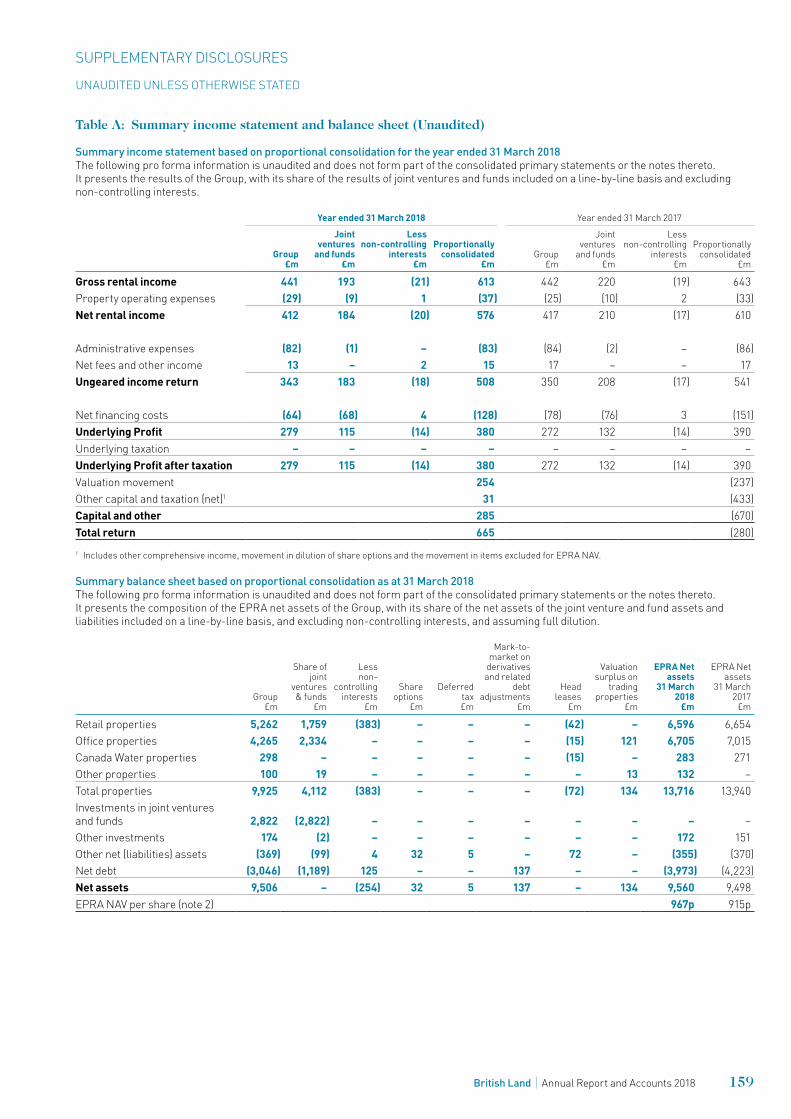
Table A: Summary income statement and balance sheet (Unaudited)
Summary income statement based on proportional consolidation for the year ended 31 March 2018The following pro forma information is unaudited and does not form part of the consolidated primary statements or the notes thereto. It presents the results of the Group, with its share of the results of joint ventures and funds included on a line-by-line basis and excluding non-controlling interests.
Year ended 31 March 2018 Year ended 31 March 2017
Group£m
Jointventures
and funds£m
Less non-controlling
interests£m
Proportionally consolidated
£mGroup
£m
Joint ventures
and funds£m
Less non-controlling
interests£m
Proportionally consolidated
£m
Gross rental income 441 193 (21) 613 442 220 (19) 643Property operating expenses (29) (9) 1 (37) (25) (10) 2 (33)Net rental income 412 184 (20) 576 417 210 (17) 610
Administrative expenses (82) (1) – (83) (84) (2) – (86)Net fees and other income 13 – 2 15 17 – – 17Ungeared income return 343 183 (18) 508 350 208 (17) 541
Net financing costs (64) (68) 4 (128) (78) (76) 3 (151)Underlying Profit 279 115 (14) 380 272 132 (14) 390Underlying taxation – – – – – – – –Underlying Profit after taxation 279 115 (14) 380 272 132 (14) 390Valuation movement 254 (237)Other capital and taxation (net)1 31 (433)Capital and other 285 (670)Total return 665 (280)1 Includes other comprehensive income, movement in dilution of share options and the movement in items excluded for EPRA NAV.
Summary balance sheet based on proportional consolidation as at 31 March 2018The following pro forma information is unaudited and does not form part of the consolidated primary statements or the notes thereto. It presents the composition of the EPRA net assets of the Group, with its share of the net assets of the joint venture and fund assets and liabilities included on a line-by-line basis, and excluding non-controlling interests, and assuming full dilution.
Group£m
Share of joint
ventures & funds
£m
Less non-
controlling interests
£m
Share options
£m
Deferred tax£m
Mark-to-market on
derivatives and related
debt adjustments
£m
Head leases
£m
Valuation surplus on
trading properties
£m
EPRA Net assets
31 March 2018
£m
EPRA Net assets
31 March2017
£m
Retail properties 5,262 1,759 (383) – – – (42) – 6,596 6,654Office properties 4,265 2,334 – – – – (15) 121 6,705 7,015Canada Water properties 298 – – – – – (15) – 283 271Other properties 100 19 – – – – – 13 132 –Total properties 9,925 4,112 (383) – – – (72) 134 13,716 13,940Investments in joint ventures and funds 2,822 (2,822) – – – – – – – –Other investments 174 (2) – – – – – – 172 151Other net (liabilities) assets (369) (99) 4 32 5 – 72 – (355) (370)Net debt (3,046) (1,189) 125 – – 137 – – (3,973) (4,223)Net assets 9,506 – (254) 32 5 137 – 134 9,560 9,498EPRA NAV per share (note 2) 967p 915p
159British Land Annual Report and Accounts 2018
SUPPLEMENTARY DISCLOSURES
UNAUDITED UNLESS OTHERWISE STATED
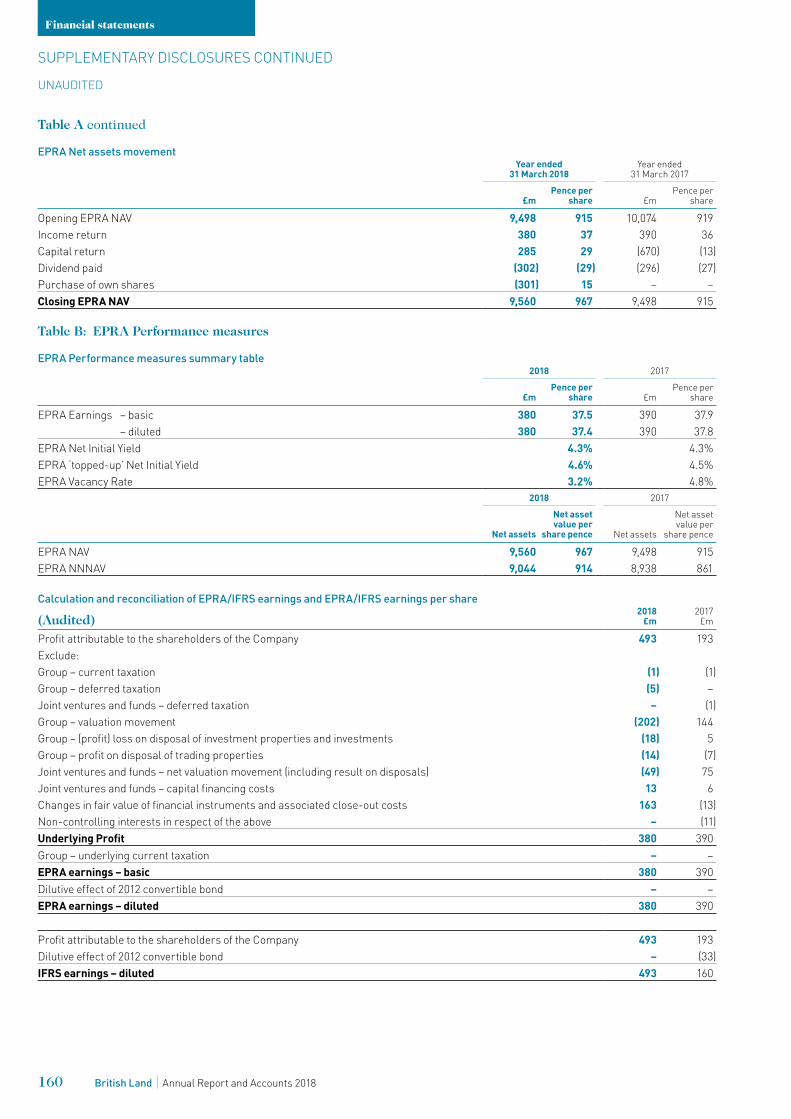
Table A continued
EPRA Net assets movementYear ended
31 March 2018Year ended
31 March 2017
£mPence per
share £mPence per
share
Opening EPRA NAV 9,498 915 10,074 919Income return 380 37 390 36Capital return 285 29 (670) (13)Dividend paid (302) (29) (296) (27)Purchase of own shares (301) 15 – –Closing EPRA NAV 9,560 967 9,498 915
Table B: EPRA Performance measures
EPRA Performance measures summary table2018 2017
£mPence per
share £mPence per
share
EPRA Earnings – basic 380 37.5 390 37.9– diluted 380 37.4 390 37.8
EPRA Net Initial Yield 4.3% 4.3%EPRA ‘topped-up’ Net Initial Yield 4.6% 4.5%EPRA Vacancy Rate 3.2% 4.8%
2018 2017
Net assets
Net asset value per
share pence Net assets
Net asset value per
share pence
EPRA NAV 9,560 967 9,498 915EPRA NNNAV 9,044 914 8,938 861
Calculation and reconciliation of EPRA/IFRS earnings and EPRA/IFRS earnings per share
(Audited)2018
£m2017
£m
Profit attributable to the shareholders of the Company 493 193Exclude:Group – current taxation (1) (1)Group – deferred taxation (5) –Joint ventures and funds – deferred taxation – (1) Group – valuation movement (202) 144Group – (profit) loss on disposal of investment properties and investments (18) 5Group – profit on disposal of trading properties (14) (7)Joint ventures and funds – net valuation movement (including result on disposals) (49) 75Joint ventures and funds – capital financing costs 13 6Changes in fair value of financial instruments and associated close-out costs 163 (13)Non-controlling interests in respect of the above – (11)Underlying Profit 380 390Group – underlying current taxation – –EPRA earnings – basic 380 390Dilutive effect of 2012 convertible bond – –EPRA earnings – diluted 380 390
Profit attributable to the shareholders of the Company 493 193Dilutive effect of 2012 convertible bond – (33)IFRS earnings – diluted 493 160
160 British Land Annual Report and Accounts 2018
Financial statements
SUPPLEMENTARY DISCLOSURES CONTINUED
UNAUDITED
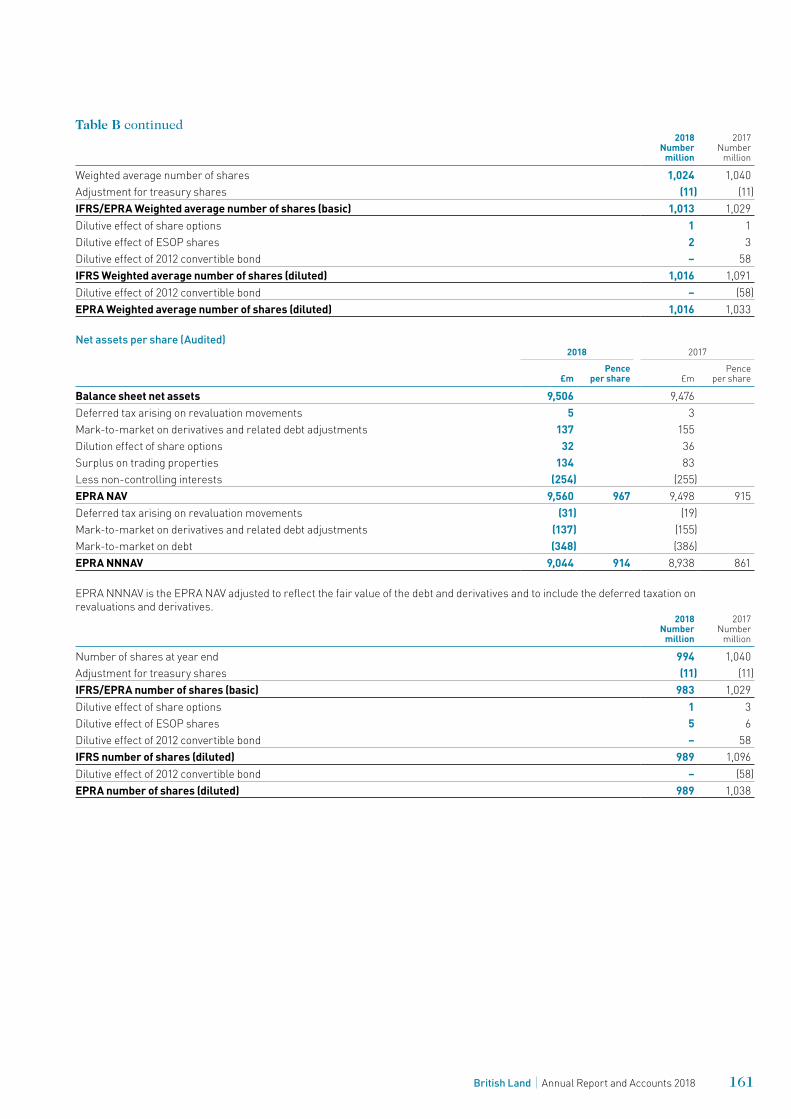
Table B continued2018
Numbermillion
2017Number
million
Weighted average number of shares 1,024 1,040Adjustment for treasury shares (11) (11)IFRS/EPRA Weighted average number of shares (basic) 1,013 1,029Dilutive effect of share options 1 1Dilutive effect of ESOP shares 2 3Dilutive effect of 2012 convertible bond – 58IFRS Weighted average number of shares (diluted) 1,016 1,091Dilutive effect of 2012 convertible bond – (58)EPRA Weighted average number of shares (diluted) 1,016 1,033
Net assets per share (Audited)2018 2017
£mPence
per share £mPence
per share
Balance sheet net assets 9,506 9,476Deferred tax arising on revaluation movements 5 3Mark-to-market on derivatives and related debt adjustments 137 155Dilution effect of share options 32 36Surplus on trading properties 134 83Less non-controlling interests (254) (255)EPRA NAV 9,560 967 9,498 915Deferred tax arising on revaluation movements (31) (19)Mark-to-market on derivatives and related debt adjustments (137) (155)Mark-to-market on debt (348) (386)EPRA NNNAV 9,044 914 8,938 861
EPRA NNNAV is the EPRA NAV adjusted to reflect the fair value of the debt and derivatives and to include the deferred taxation on revaluations and derivatives.
2018Number
million
2017Number
million
Number of shares at year end 994 1,040Adjustment for treasury shares (11) (11)IFRS/EPRA number of shares (basic) 983 1,029Dilutive effect of share options 1 3Dilutive effect of ESOP shares 5 6Dilutive effect of 2012 convertible bond – 58IFRS number of shares (diluted) 989 1,096Dilutive effect of 2012 convertible bond – (58)EPRA number of shares (diluted) 989 1,038
161British Land Annual Report and Accounts 2018
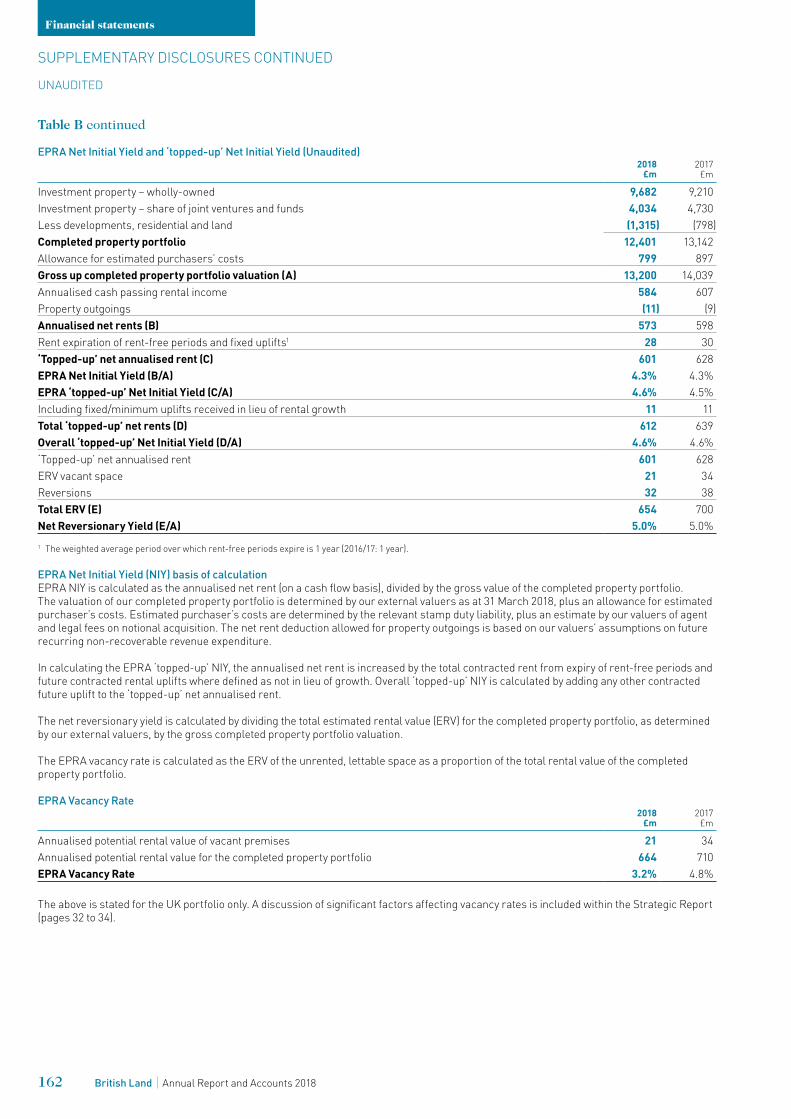
Table B continued
EPRA Net Initial Yield and ‘topped-up’ Net Initial Yield (Unaudited)2018
£m2017
£m
Investment property – wholly-owned 9,682 9,210 Investment property – share of joint ventures and funds 4,034 4,730 Less developments, residential and land (1,315) (798)Completed property portfolio 12,401 13,142 Allowance for estimated purchasers’ costs 799 897 Gross up completed property portfolio valuation (A) 13,200 14,039Annualised cash passing rental income 584 607 Property outgoings (11) (9)Annualised net rents (B) 573 598Rent expiration of rent-free periods and fixed uplifts1 28 30‘Topped-up’ net annualised rent (C) 601 628EPRA Net Initial Yield (B/A) 4.3% 4.3%EPRA ‘topped-up’ Net Initial Yield (C/A) 4.6% 4.5%Including fixed/minimum uplifts received in lieu of rental growth 11 11Total ‘topped-up’ net rents (D) 612 639Overall ‘topped-up’ Net Initial Yield (D/A) 4.6% 4.6%‘Topped-up’ net annualised rent 601 628ERV vacant space 21 34 Reversions 32 38Total ERV (E) 654 700 Net Reversionary Yield (E/A) 5.0% 5.0%1 The weighted average period over which rent-free periods expire is 1 year (2016/17: 1 year).
EPRA Net Initial Yield (NIY) basis of calculationEPRA NIY is calculated as the annualised net rent (on a cash flow basis), divided by the gross value of the completed property portfolio. The valuation of our completed property portfolio is determined by our external valuers as at 31 March 2018, plus an allowance for estimated purchaser’s costs. Estimated purchaser’s costs are determined by the relevant stamp duty liability, plus an estimate by our valuers of agent and legal fees on notional acquisition. The net rent deduction allowed for property outgoings is based on our valuers’ assumptions on future recurring non-recoverable revenue expenditure.
In calculating the EPRA ‘topped-up’ NIY, the annualised net rent is increased by the total contracted rent from expiry of rent-free periods and future contracted rental uplifts where defined as not in lieu of growth. Overall ‘topped-up’ NIY is calculated by adding any other contracted future uplift to the ‘topped-up’ net annualised rent.
The net reversionary yield is calculated by dividing the total estimated rental value (ERV) for the completed property portfolio, as determined by our external valuers, by the gross completed property portfolio valuation.
The EPRA vacancy rate is calculated as the ERV of the unrented, lettable space as a proportion of the total rental value of the completed property portfolio.
EPRA Vacancy Rate2018
£m2017
£m
Annualised potential rental value of vacant premises 21 34 Annualised potential rental value for the completed property portfolio 664 710EPRA Vacancy Rate 3.2% 4.8%
The above is stated for the UK portfolio only. A discussion of significant factors affecting vacancy rates is included within the Strategic Report (pages 32 to 34).
162 British Land Annual Report and Accounts 2018
Financial statements
SUPPLEMENTARY DISCLOSURES CONTINUED
UNAUDITED
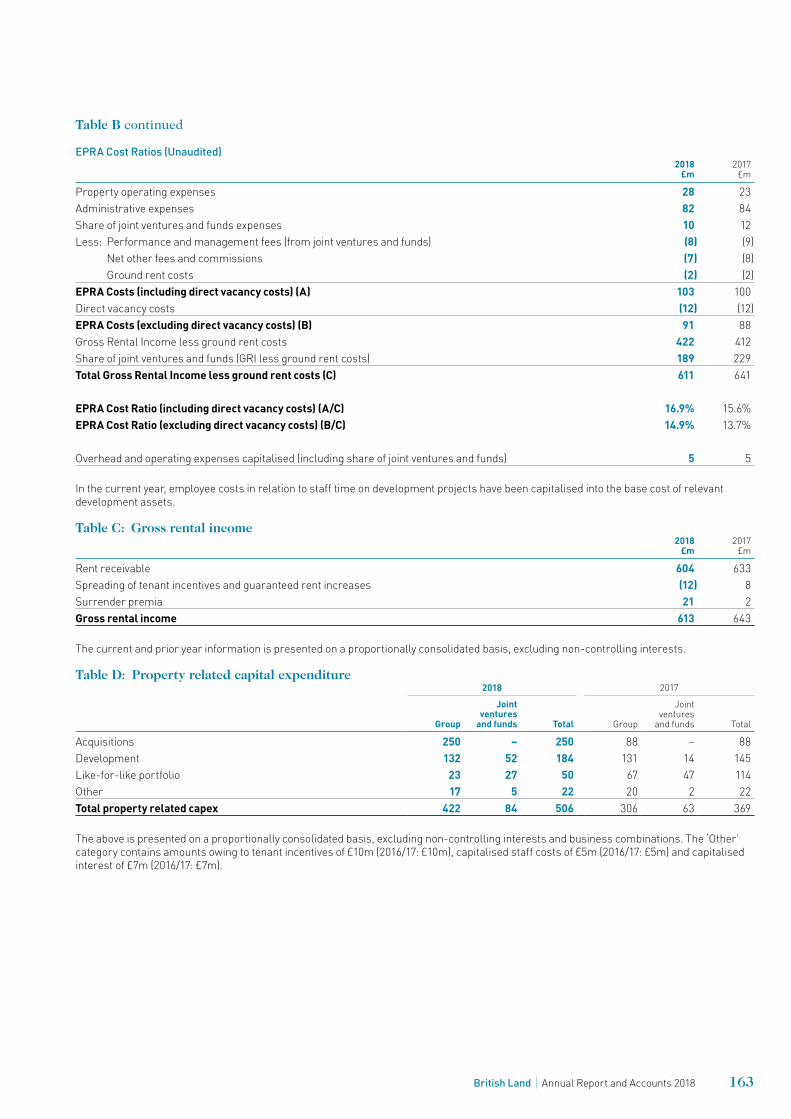
Table B continued
EPRA Cost Ratios (Unaudited)2018
£m2017
£m
Property operating expenses 28 23Administrative expenses 82 84Share of joint ventures and funds expenses 10 12Less: Performance and management fees (from joint ventures and funds) (8) (9)
Net other fees and commissions (7) (8)Ground rent costs (2) (2)
EPRA Costs (including direct vacancy costs) (A) 103 100Direct vacancy costs (12) (12)EPRA Costs (excluding direct vacancy costs) (B) 91 88Gross Rental Income less ground rent costs 422 412Share of joint ventures and funds (GRI less ground rent costs) 189 229Total Gross Rental Income less ground rent costs (C) 611 641
EPRA Cost Ratio (including direct vacancy costs) (A/C) 16.9% 15.6%EPRA Cost Ratio (excluding direct vacancy costs) (B/C) 14.9% 13.7%
Overhead and operating expenses capitalised (including share of joint ventures and funds) 5 5
In the current year, employee costs in relation to staff time on development projects have been capitalised into the base cost of relevant development assets.
Table C: Gross rental income2018
£m2017
£m
Rent receivable 604 633Spreading of tenant incentives and guaranteed rent increases (12) 8Surrender premia 21 2Gross rental income 613 643
The current and prior year information is presented on a proportionally consolidated basis, excluding non-controlling interests.
Table D: Property related capital expenditure2018 2017
Group
Joint ventures
and funds Total Group
Joint ventures
and funds Total
Acquisitions 250 – 250 88 – 88Development 132 52 184 131 14 145Like-for-like portfolio 23 27 50 67 47 114Other 17 5 22 20 2 22Total property related capex 422 84 506 306 63 369
The above is presented on a proportionally consolidated basis, excluding non-controlling interests and business combinations. The ‘Other’ category contains amounts owing to tenant incentives of £10m (2016/17: £10m), capitalised staff costs of £5m (2016/17: £5m) and capitalised interest of £7m (2016/17: £7m).
163British Land Annual Report and Accounts 2018

Other Information
Other information (unaudited) Acquisitions and Disposals 166 Portfolio valuation by sector 167 Gross rental income 167 Portfolio yield and ERV movements 168 Retail portfolio valuation – previous classification basis 168 Portfolio net yields 169 Total property return (as calculated by IPD) 169 Occupiers representing over 0.5% of total contracted rent 170 Major holdings 170 Lease length and occupancy 171 Portfolio weighting 171 Annualised rent and estimated rental value (ERV) 172 Rent subject to open market rent review 172 Rent subject to lease break or expiry 173 Recently completed and committed developments 174 Near term development pipeline 174 Medium term development pipeline 174Sustainability performance measures 175Ten year record 177Shareholder information 178
Other information
A Nordic forest was created at Broadgate this winter, with an artisan market, a tepee cinema and The Hideaway, a specialist dining experience.164 British Land Annual Report and Accounts 2018
Other information

165British Land Annual Report and Accounts 2018
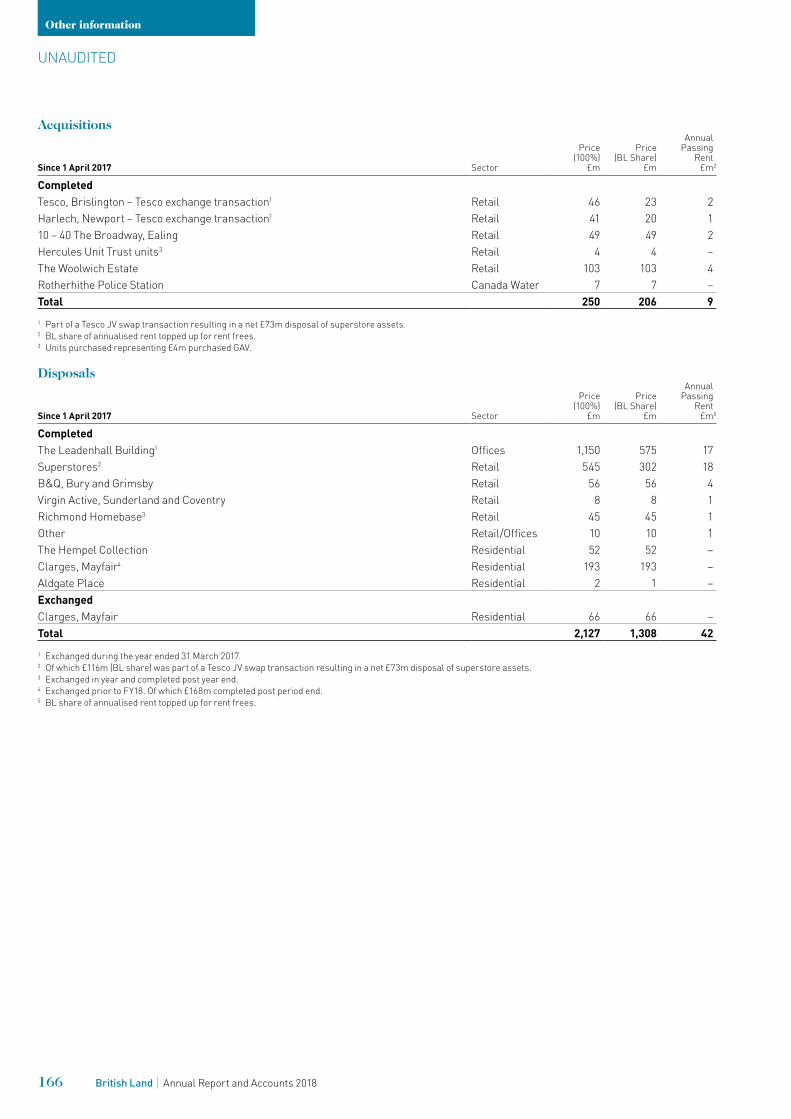
Acquisitions
Since 1 April 2017 Sector
Price (100%)
£m
Price (BL Share)
£m
Annual Passing
Rent £m2
Completed Tesco, Brislington – Tesco exchange transaction1 Retail 46 23 2Harlech, Newport – Tesco exchange transaction1 Retail 41 20 110 – 40 The Broadway, Ealing Retail 49 49 2Hercules Unit Trust units3 Retail 4 4 –The Woolwich Estate Retail 103 103 4Rotherhithe Police Station Canada Water 7 7 –Total 250 206 91 Part of a Tesco JV swap transaction resulting in a net £73m disposal of superstore assets.2 BL share of annualised rent topped up for rent frees.3 Units purchased representing £4m purchased GAV.
Disposals
Since 1 April 2017 Sector
Price (100%)
£m
Price (BL Share)
£m
Annual Passing
Rent £m5
Completed The Leadenhall Building1 Offices 1,150 575 17Superstores2 Retail 545 302 18B&Q, Bury and Grimsby Retail 56 56 4Virgin Active, Sunderland and Coventry Retail 8 8 1Richmond Homebase3 Retail 45 45 1Other Retail/Offices 10 10 1The Hempel Collection Residential 52 52 –Clarges, Mayfair4 Residential 193 193 –Aldgate Place Residential 2 1 –Exchanged Clarges, Mayfair Residential 66 66 –Total 2,127 1,308 421 Exchanged during the year ended 31 March 2017.2 Of which £116m (BL share) was part of a Tesco JV swap transaction resulting in a net £73m disposal of superstore assets.3 Exchanged in year and completed post year end.4 Exchanged prior to FY18. Of which £168m completed post period end.5 BL share of annualised rent topped up for rent frees.
166 British Land Annual Report and Accounts 2018
Other information
UNAUDITED
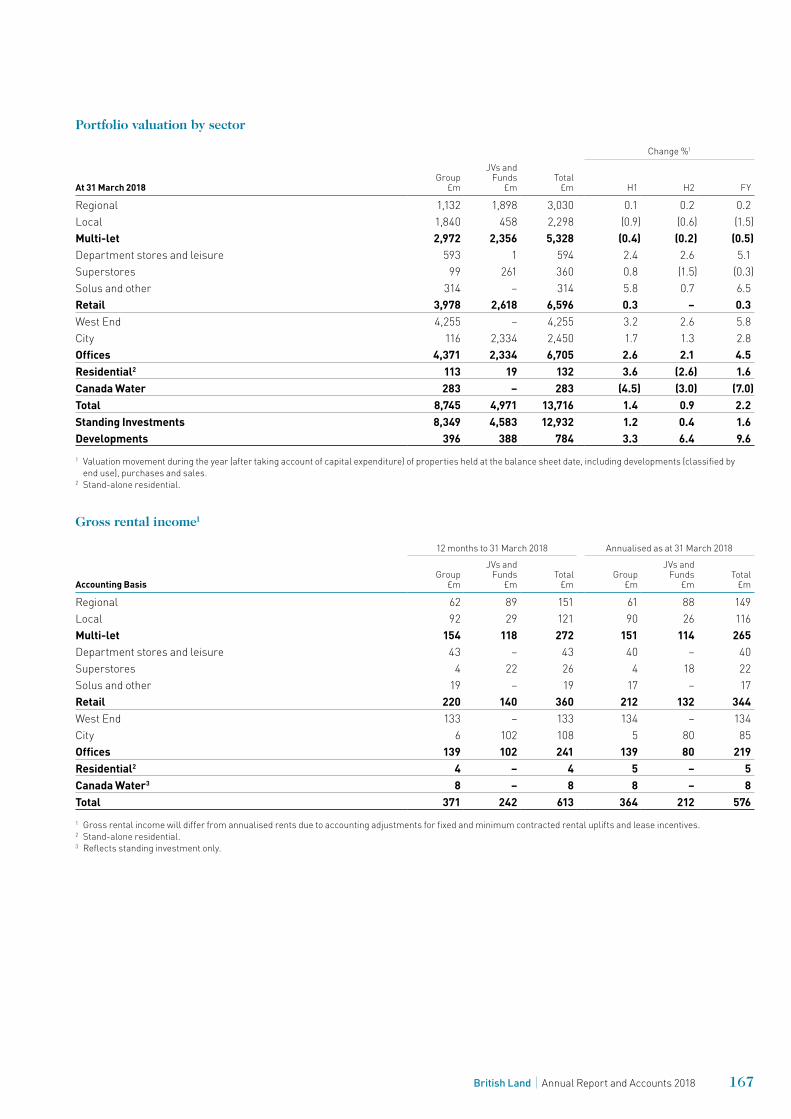
Portfolio valuation by sector
Change %1
At 31 March 2018Group
£m
JVs andFunds
£mTotal
£m H1 H2 FY
Regional 1,132 1,898 3,030 0.1 0.2 0.2Local 1,840 458 2,298 (0.9) (0.6) (1.5)Multi-let 2,972 2,356 5,328 (0.4) (0.2) (0.5)Department stores and leisure 593 1 594 2.4 2.6 5.1Superstores 99 261 360 0.8 (1.5) (0.3)Solus and other 314 – 314 5.8 0.7 6.5Retail 3,978 2,618 6,596 0.3 – 0.3West End 4,255 – 4,255 3.2 2.6 5.8City 116 2,334 2,450 1.7 1.3 2.8Offices 4,371 2,334 6,705 2.6 2.1 4.5Residential2 113 19 132 3.6 (2.6) 1.6Canada Water 283 – 283 (4.5) (3.0) (7.0)Total 8,745 4,971 13,716 1.4 0.9 2.2Standing Investments 8,349 4,583 12,932 1.2 0.4 1.6Developments 396 388 784 3.3 6.4 9.61 Valuation movement during the year (after taking account of capital expenditure) of properties held at the balance sheet date, including developments (classified by
end use), purchases and sales.2 Stand-alone residential.
Gross rental income1
Accounting Basis
12 months to 31 March 2018 Annualised as at 31 March 2018
Group£m
JVs andFunds
£mTotal
£mGroup
£m
JVs andFunds
£mTotal
£m
Regional 62 89 151 61 88 149Local 92 29 121 90 26 116Multi-let 154 118 272 151 114 265Department stores and leisure 43 – 43 40 – 40Superstores 4 22 26 4 18 22Solus and other 19 – 19 17 – 17Retail 220 140 360 212 132 344West End 133 – 133 134 – 134City 6 102 108 5 80 85Offices 139 102 241 139 80 219Residential2 4 – 4 5 – 5Canada Water3 8 – 8 8 – 8Total 371 242 613 364 212 5761 Gross rental income will differ from annualised rents due to accounting adjustments for fixed and minimum contracted rental uplifts and lease incentives.2 Stand-alone residential. 3 Reflects standing investment only.
167British Land Annual Report and Accounts 2018
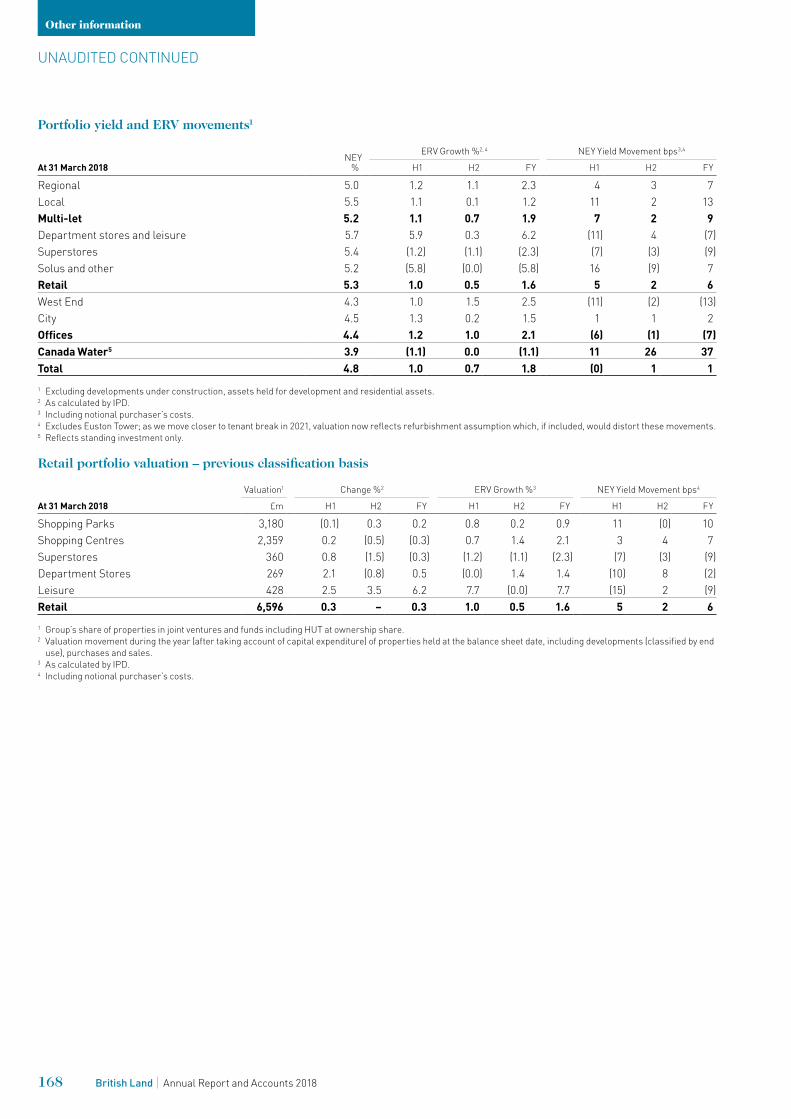
Portfolio yield and ERV movements1
At 31 March 2018NEY
%
ERV Growth %2, 4 NEY Yield Movement bps3,4
H1 H2 FY H1 H2 FY
Regional 5.0 1.2 1.1 2.3 4 3 7Local 5.5 1.1 0.1 1.2 11 2 13Multi-let 5.2 1.1 0.7 1.9 7 2 9Department stores and leisure 5.7 5.9 0.3 6.2 (11) 4 (7)Superstores 5.4 (1.2) (1.1) (2.3) (7) (3) (9)Solus and other 5.2 (5.8) (0.0) (5.8) 16 (9) 7Retail 5.3 1.0 0.5 1.6 5 2 6West End 4.3 1.0 1.5 2.5 (11) (2) (13)City 4.5 1.3 0.2 1.5 1 1 2Offices 4.4 1.2 1.0 2.1 (6) (1) (7)Canada Water5 3.9 (1.1) 0.0 (1.1) 11 26 37Total 4.8 1.0 0.7 1.8 (0) 1 11 Excluding developments under construction, assets held for development and residential assets. 2 As calculated by IPD. 3 Including notional purchaser’s costs. 4 Excludes Euston Tower; as we move closer to tenant break in 2021, valuation now reflects refurbishment assumption which, if included, would distort these movements.5 Reflects standing investment only.
Retail portfolio valuation – previous classification basis
Valuation1 Change %2 ERV Growth %3 NEY Yield Movement bps4
At 31 March 2018 £m H1 H2 FY H1 H2 FY H1 H2 FY
Shopping Parks 3,180 (0.1) 0.3 0.2 0.8 0.2 0.9 11 (0) 10Shopping Centres 2,359 0.2 (0.5) (0.3) 0.7 1.4 2.1 3 4 7Superstores 360 0.8 (1.5) (0.3) (1.2) (1.1) (2.3) (7) (3) (9)Department Stores 269 2.1 (0.8) 0.5 (0.0) 1.4 1.4 (10) 8 (2)Leisure 428 2.5 3.5 6.2 7.7 (0.0) 7.7 (15) 2 (9)Retail 6,596 0.3 – 0.3 1.0 0.5 1.6 5 2 61 Group’s share of properties in joint ventures and funds including HUT at ownership share.2 Valuation movement during the year (after taking account of capital expenditure) of properties held at the balance sheet date, including developments (classified by end
use), purchases and sales.3 As calculated by IPD.4 Including notional purchaser’s costs.
UNAUDITED CONTINUED
168 British Land Annual Report and Accounts 2018
Other information
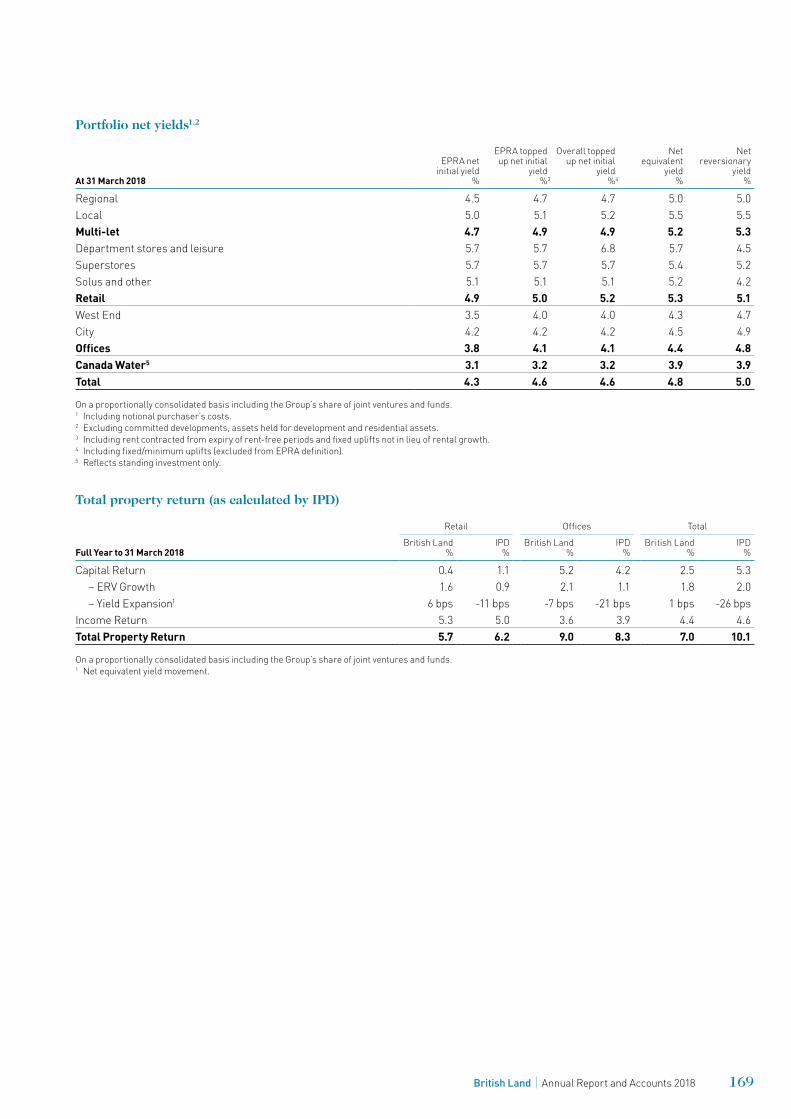
Portfolio net yields1,2
At 31 March 2018
EPRA netinitial yield
%
EPRA topped up net initial
yield %3
Overall toppedup net initial
yield%4
Netequivalent
yield %
Net reversionary
yield %
Regional 4.5 4.7 4.7 5.0 5.0Local 5.0 5.1 5.2 5.5 5.5Multi-let 4.7 4.9 4.9 5.2 5.3Department stores and leisure 5.7 5.7 6.8 5.7 4.5Superstores 5.7 5.7 5.7 5.4 5.2Solus and other 5.1 5.1 5.1 5.2 4.2Retail 4.9 5.0 5.2 5.3 5.1West End 3.5 4.0 4.0 4.3 4.7City 4.2 4.2 4.2 4.5 4.9Offices 3.8 4.1 4.1 4.4 4.8Canada Water5 3.1 3.2 3.2 3.9 3.9Total 4.3 4.6 4.6 4.8 5.0
On a proportionally consolidated basis including the Group’s share of joint ventures and funds.1 Including notional purchaser’s costs.2 Excluding committed developments, assets held for development and residential assets.3 Including rent contracted from expiry of rent-free periods and fixed uplifts not in lieu of rental growth.4 Including fixed/minimum uplifts (excluded from EPRA definition).5 Reflects standing investment only.
Total property return (as calculated by IPD)
Full Year to 31 March 2018
Retail Offices Total
British Land%
IPD%
British Land%
IPD%
British Land%
IPD%
Capital Return 0.4 1.1 5.2 4.2 2.5 5.3– ERV Growth 1.6 0.9 2.1 1.1 1.8 2.0– Yield Expansion1 6 bps -11 bps -7 bps -21 bps 1 bps -26 bps
Income Return 5.3 5.0 3.6 3.9 4.4 4.6Total Property Return 5.7 6.2 9.0 8.3 7.0 10.1
On a proportionally consolidated basis including the Group’s share of joint ventures and funds.1 Net equivalent yield movement.
169British Land Annual Report and Accounts 2018
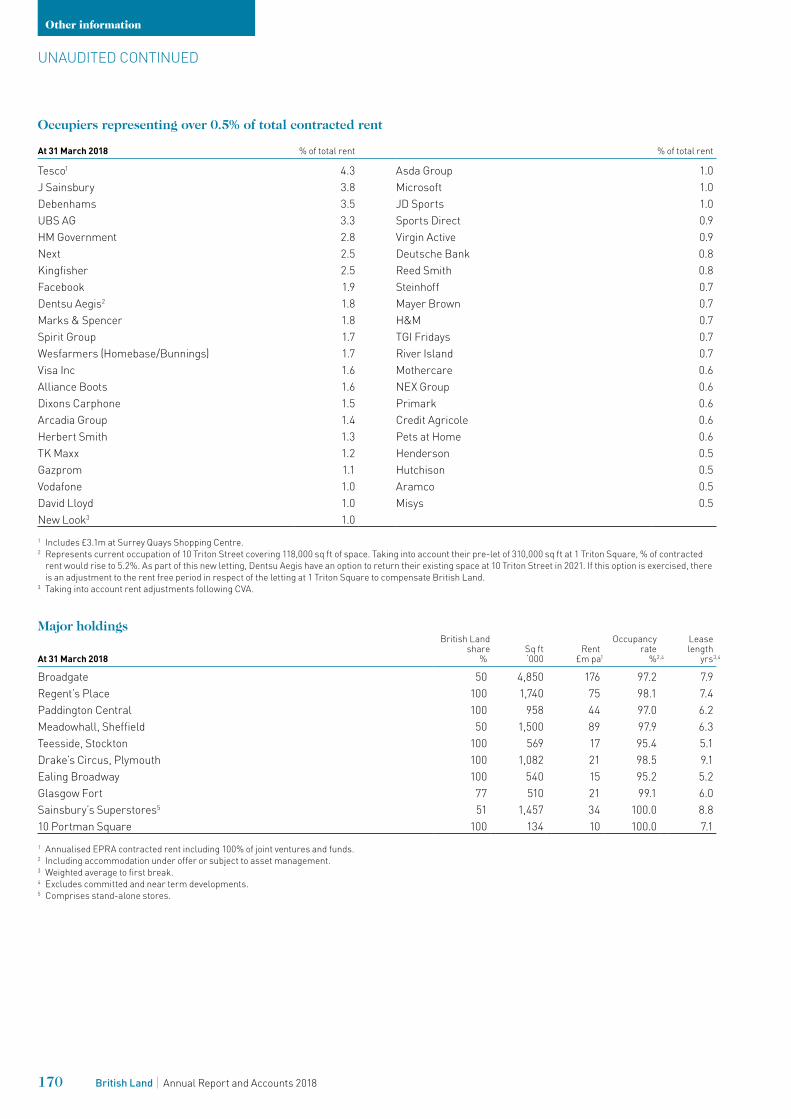
Occupiers representing over 0.5% of total contracted rent
At 31 March 2018 % of total rent % of total rent
Tesco1 4.3 Asda Group 1.0 J Sainsbury 3.8 Microsoft 1.0 Debenhams 3.5 JD Sports 1.0 UBS AG 3.3 Sports Direct 0.9 HM Government 2.8 Virgin Active 0.9 Next 2.5 Deutsche Bank 0.8 Kingfisher 2.5 Reed Smith 0.8 Facebook 1.9 Steinhoff 0.7 Dentsu Aegis2 1.8 Mayer Brown 0.7 Marks & Spencer 1.8 H&M 0.7 Spirit Group 1.7 TGI Fridays 0.7 Wesfarmers (Homebase/Bunnings) 1.7 River Island 0.7 Visa Inc 1.6 Mothercare 0.6 Alliance Boots 1.6 NEX Group 0.6 Dixons Carphone 1.5 Primark 0.6 Arcadia Group 1.4 Credit Agricole 0.6 Herbert Smith 1.3 Pets at Home 0.6 TK Maxx 1.2 Henderson 0.5 Gazprom 1.1 Hutchison 0.5 Vodafone 1.0 Aramco 0.5 David Lloyd 1.0 Misys 0.5 New Look3 1.0 1 Includes £3.1m at Surrey Quays Shopping Centre.2 Represents current occupation of 10 Triton Street covering 118,000 sq ft of space. Taking into account their pre-let of 310,000 sq ft at 1 Triton Square, % of contracted
rent would rise to 5.2%. As part of this new letting, Dentsu Aegis have an option to return their existing space at 10 Triton Street in 2021. If this option is exercised, there is an adjustment to the rent free period in respect of the letting at 1 Triton Square to compensate British Land.
3 Taking into account rent adjustments following CVA.
Major holdings
At 31 March 2018
British Land share
%Sq ft ‘000
Rent £m pa1
Occupancyrate
%2,4
Leaselength
yrs3,4
Broadgate 50 4,850 176 97.2 7.9Regent’s Place 100 1,740 75 98.1 7.4Paddington Central 100 958 44 97.0 6.2Meadowhall, Sheffield 50 1,500 89 97.9 6.3Teesside, Stockton 100 569 17 95.4 5.1Drake’s Circus, Plymouth 100 1,082 21 98.5 9.1Ealing Broadway 100 540 15 95.2 5.2Glasgow Fort 77 510 21 99.1 6.0Sainsbury’s Superstores5 51 1,457 34 100.0 8.810 Portman Square 100 134 10 100.0 7.11 Annualised EPRA contracted rent including 100% of joint ventures and funds.2 Including accommodation under offer or subject to asset management.3 Weighted average to first break.4 Excludes committed and near term developments.5 Comprises stand-alone stores.
UNAUDITED CONTINUED
170 British Land Annual Report and Accounts 2018
Other information
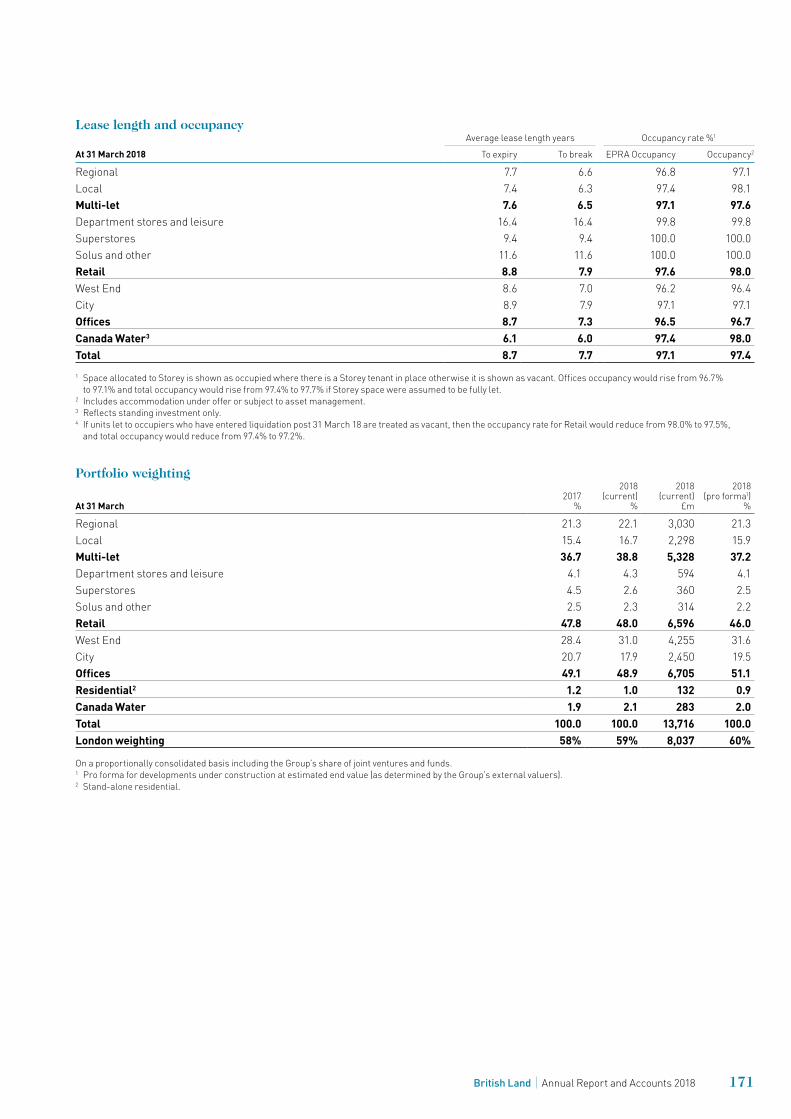
Lease length and occupancy
At 31 March 2018Average lease length years Occupancy rate %1
To expiry To break EPRA Occupancy Occupancy2
Regional 7.7 6.6 96.8 97.1 Local 7.4 6.3 97.4 98.1 Multi-let 7.6 6.5 97.1 97.6 Department stores and leisure 16.4 16.4 99.8 99.8 Superstores 9.4 9.4 100.0 100.0 Solus and other 11.6 11.6 100.0 100.0 Retail 8.8 7.9 97.6 98.0 West End 8.6 7.0 96.2 96.4 City 8.9 7.9 97.1 97.1 Offices 8.7 7.3 96.5 96.7 Canada Water3 6.1 6.0 97.4 98.0 Total 8.7 7.7 97.1 97.4 1 Space allocated to Storey is shown as occupied where there is a Storey tenant in place otherwise it is shown as vacant. Offices occupancy would rise from 96.7%
to 97.1% and total occupancy would rise from 97.4% to 97.7% if Storey space were assumed to be fully let. 2 Includes accommodation under offer or subject to asset management.3 Reflects standing investment only.4 If units let to occupiers who have entered liquidation post 31 March 18 are treated as vacant, then the occupancy rate for Retail would reduce from 98.0% to 97.5%,
and total occupancy would reduce from 97.4% to 97.2%.
Portfolio weighting
At 31 March2017
%
2018(current)
%
2018(current)
£m
2018(pro forma1)
%
Regional 21.3 22.1 3,030 21.3Local 15.4 16.7 2,298 15.9Multi-let 36.7 38.8 5,328 37.2Department stores and leisure 4.1 4.3 594 4.1Superstores 4.5 2.6 360 2.5Solus and other 2.5 2.3 314 2.2Retail 47.8 48.0 6,596 46.0West End 28.4 31.0 4,255 31.6City 20.7 17.9 2,450 19.5Offices 49.1 48.9 6,705 51.1Residential2 1.2 1.0 132 0.9Canada Water 1.9 2.1 283 2.0Total 100.0 100.0 13,716 100.0London weighting 58% 59% 8,037 60%
On a proportionally consolidated basis including the Group’s share of joint ventures and funds.1 Pro forma for developments under construction at estimated end value (as determined by the Group’s external valuers).2 Stand-alone residential.
171British Land Annual Report and Accounts 2018
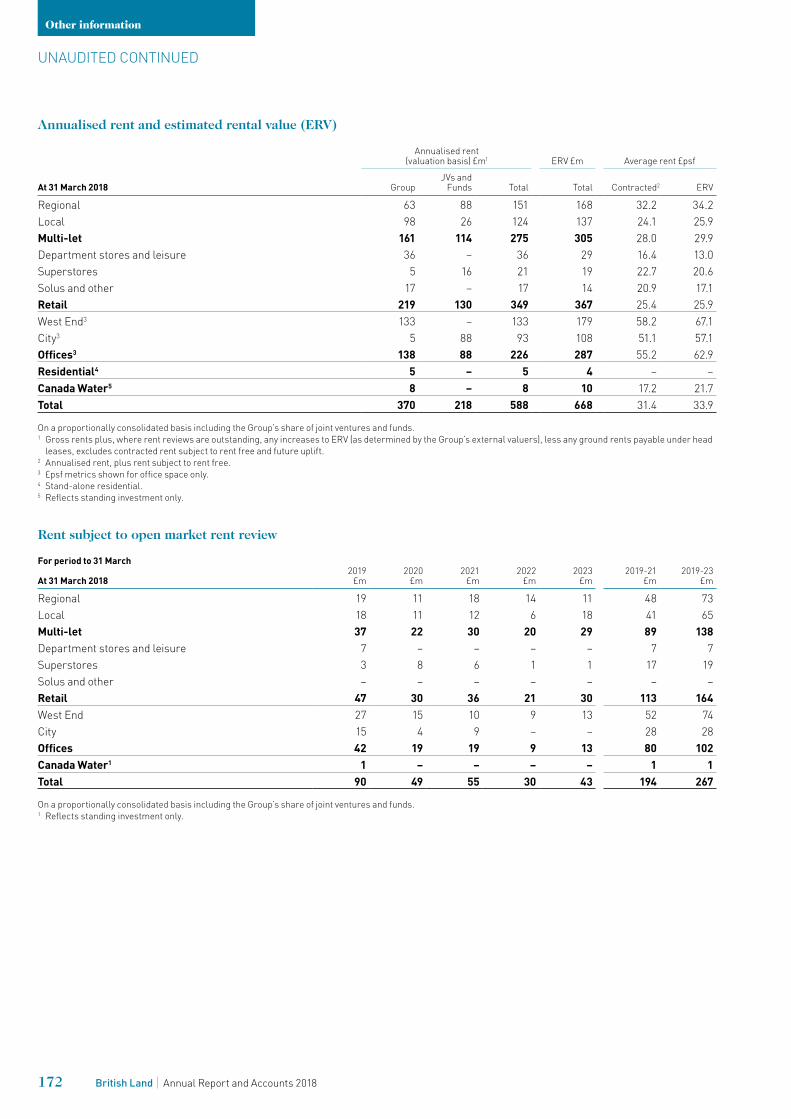
Annualised rent and estimated rental value (ERV)
At 31 March 2018
Annualised rent(valuation basis) £m1 ERV £m Average rent £psf
GroupJVs and
Funds Total Total Contracted2 ERV
Regional 63 88 151 168 32.2 34.2Local 98 26 124 137 24.1 25.9Multi-let 161 114 275 305 28.0 29.9Department stores and leisure 36 – 36 29 16.4 13.0Superstores 5 16 21 19 22.7 20.6Solus and other 17 – 17 14 20.9 17.1Retail 219 130 349 367 25.4 25.9West End3 133 – 133 179 58.2 67.1City3 5 88 93 108 51.1 57.1Offices3 138 88 226 287 55.2 62.9Residential4 5 – 5 4 – –Canada Water5 8 – 8 10 17.2 21.7Total 370 218 588 668 31.4 33.9
On a proportionally consolidated basis including the Group’s share of joint ventures and funds.1 Gross rents plus, where rent reviews are outstanding, any increases to ERV (as determined by the Group’s external valuers), less any ground rents payable under head
leases, excludes contracted rent subject to rent free and future uplift.2 Annualised rent, plus rent subject to rent free.3 £psf metrics shown for office space only.4 Stand-alone residential.5 Reflects standing investment only.
Rent subject to open market rent review
For period to 31 March
At 31 March 20182019
£m2020
£m2021
£m2022
£m2023
£m2019-21
£m2019-23
£m
Regional 19 11 18 14 11 48 73Local 18 11 12 6 18 41 65Multi-let 37 22 30 20 29 89 138Department stores and leisure 7 – – – – 7 7Superstores 3 8 6 1 1 17 19Solus and other – – – – – – –Retail 47 30 36 21 30 113 164West End 27 15 10 9 13 52 74City 15 4 9 – – 28 28Offices 42 19 19 9 13 80 102Canada Water1 1 – – – – 1 1Total 90 49 55 30 43 194 267
On a proportionally consolidated basis including the Group’s share of joint ventures and funds.1 Reflects standing investment only.
UNAUDITED CONTINUED
172 British Land Annual Report and Accounts 2018
Other information
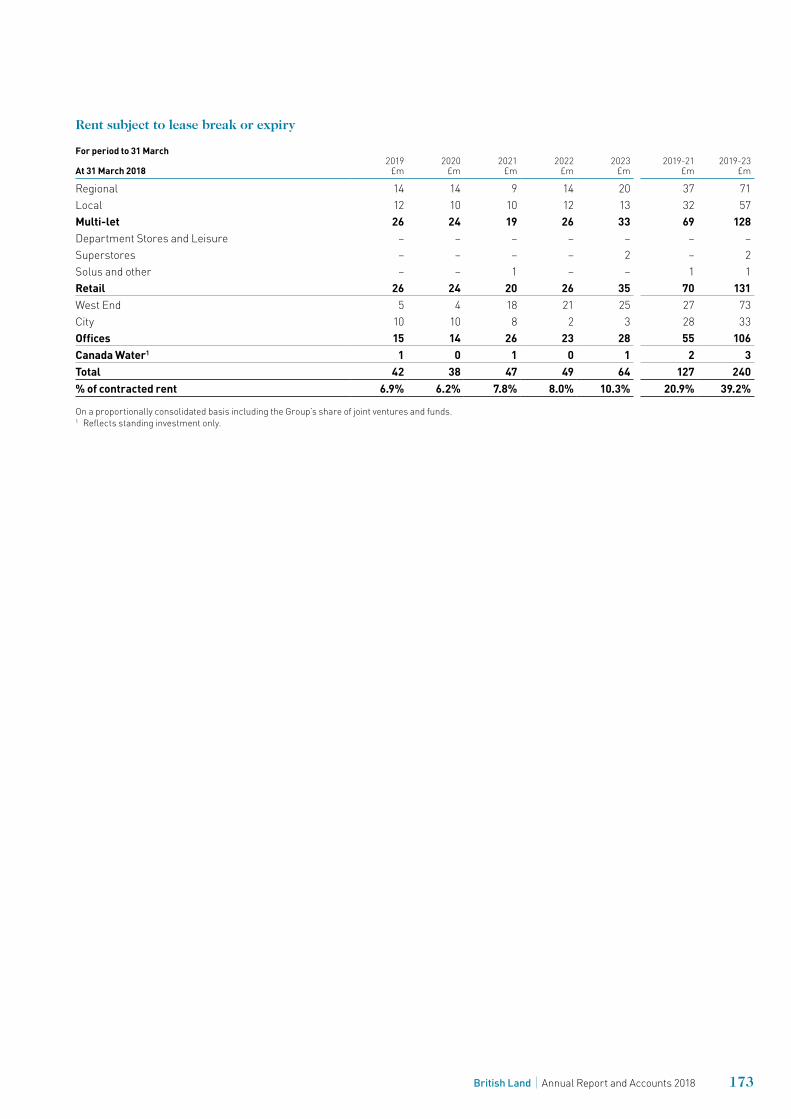
Rent subject to lease break or expiry
For period to 31 March
At 31 March 20182019
£m2020
£m2021
£m2022
£m2023
£m2019-21
£m2019-23
£m
Regional 14 14 9 14 20 37 71Local 12 10 10 12 13 32 57Multi-let 26 24 19 26 33 69 128Department Stores and Leisure – – – – – – –Superstores – – – – 2 – 2Solus and other – – 1 – – 1 1Retail 26 24 20 26 35 70 131West End 5 4 18 21 25 27 73City 10 10 8 2 3 28 33Offices 15 14 26 23 28 55 106Canada Water1 1 0 1 0 1 2 3Total 42 38 47 49 64 127 240% of contracted rent 6.9% 6.2% 7.8% 8.0% 10.3% 20.9% 39.2%
On a proportionally consolidated basis including the Group’s share of joint ventures and funds.1 Reflects standing investment only.
173British Land Annual Report and Accounts 2018
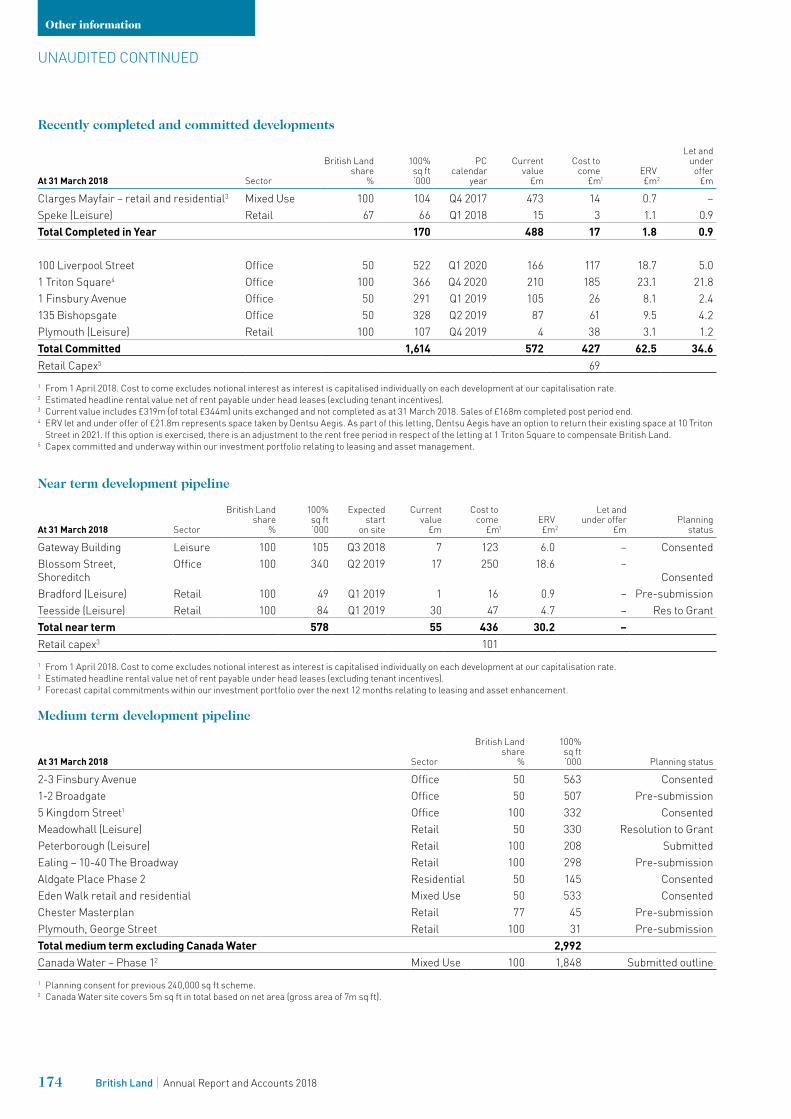
Recently completed and committed developments
At 31 March 2018 Sector
British Land share
%
100% sq ft‘000
PCcalendar
year
Currentvalue
£m
Cost tocome
£m1ERV£m2
Let andunderoffer
£m
Clarges Mayfair – retail and residential3 Mixed Use 100 104 Q4 2017 473 14 0.7 – Speke (Leisure) Retail 67 66 Q1 2018 15 3 1.1 0.9Total Completed in Year 170 488 17 1.8 0.9
100 Liverpool Street Office 50 522 Q1 2020 166 117 18.7 5.0 1 Triton Square4 Office 100 366 Q4 2020 210 185 23.1 21.81 Finsbury Avenue Office 50 291 Q1 2019 105 26 8.1 2.4135 Bishopsgate Office 50 328 Q2 2019 87 61 9.5 4.2Plymouth (Leisure) Retail 100 107 Q4 2019 4 38 3.1 1.2Total Committed 1,614 572 427 62.5 34.6Retail Capex5 69 1 From 1 April 2018. Cost to come excludes notional interest as interest is capitalised individually on each development at our capitalisation rate. 2 Estimated headline rental value net of rent payable under head leases (excluding tenant incentives). 3 Current value includes £319m (of total £344m) units exchanged and not completed as at 31 March 2018. Sales of £168m completed post period end.4 ERV let and under offer of £21.8m represents space taken by Dentsu Aegis. As part of this letting, Dentsu Aegis have an option to return their existing space at 10 Triton
Street in 2021. If this option is exercised, there is an adjustment to the rent free period in respect of the letting at 1 Triton Square to compensate British Land.5 Capex committed and underway within our investment portfolio relating to leasing and asset management.
Near term development pipeline
At 31 March 2018 Sector
British Land share
%
100% sq ft‘000
Expected start
on site
Currentvalue
£m
Cost tocome
£m1ERV£m2
Let and under offer
£m Planning
status
Gateway Building Leisure 100 105 Q3 2018 7 123 6.0 – ConsentedBlossom Street, Shoreditch
Office 100 340 Q2 2019 17 250 18.6 –Consented
Bradford (Leisure) Retail 100 49 Q1 2019 1 16 0.9 – Pre-submissionTeesside (Leisure) Retail 100 84 Q1 2019 30 47 4.7 – Res to GrantTotal near term 578 55 436 30.2 – Retail capex3 101 1 From 1 April 2018. Cost to come excludes notional interest as interest is capitalised individually on each development at our capitalisation rate.2 Estimated headline rental value net of rent payable under head leases (excluding tenant incentives). 3 Forecast capital commitments within our investment portfolio over the next 12 months relating to leasing and asset enhancement.
Medium term development pipeline
At 31 March 2018 Sector
British Land share
%
100% sq ft‘000 Planning status
2-3 Finsbury Avenue Office 50 563 Consented1-2 Broadgate Office 50 507 Pre-submission5 Kingdom Street1 Office 100 332 ConsentedMeadowhall (Leisure) Retail 50 330 Resolution to GrantPeterborough (Leisure) Retail 100 208 SubmittedEaling – 10-40 The Broadway Retail 100 298 Pre-submissionAldgate Place Phase 2 Residential 50 145 ConsentedEden Walk retail and residential Mixed Use 50 533 ConsentedChester Masterplan Retail 77 45 Pre-submissionPlymouth, George Street Retail 100 31 Pre-submissionTotal medium term excluding Canada Water 2,992Canada Water – Phase 12 Mixed Use 100 1,848 Submitted outline1 Planning consent for previous 240,000 sq ft scheme.2 Canada Water site covers 5m sq ft in total based on net area (gross area of 7m sq ft).
UNAUDITED CONTINUED
174 British Land Annual Report and Accounts 2018
Other information
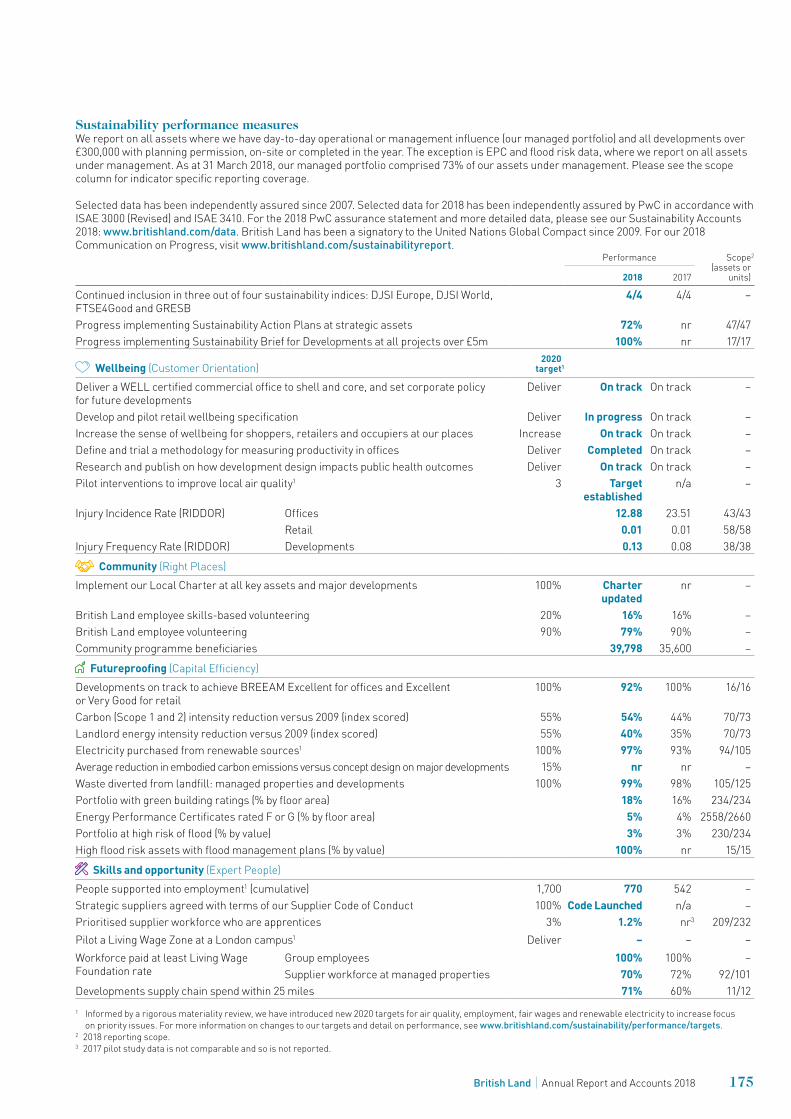
Sustainability performance measuresWe report on all assets where we have day-to-day operational or management influence (our managed portfolio) and all developments over £300,000 with planning permission, on-site or completed in the year. The exception is EPC and flood risk data, where we report on all assets under management. As at 31 March 2018, our managed portfolio comprised 73% of our assets under management. Please see the scope column for indicator specific reporting coverage.
Selected data has been independently assured since 2007. Selected data for 2018 has been independently assured by PwC in accordance with ISAE 3000 (Revised) and ISAE 3410. For the 2018 PwC assurance statement and more detailed data, please see our Sustainability Accounts 2018: ww w.britishland.com/data. British Land has been a signatory to the United Nations Global Compact since 2009. For our 2018 Communication on Progress, visit ww w.britishland.com/sustainabilityreport.
Performance Scope2 (assets or
units)2018 2017
Continued inclusion in three out of four sustainability indices: DJSI Europe, DJSI World, FTSE4Good and GRESB
4/4 4/4 –
Progress implementing Sustainability Action Plans at strategic assets 72% nr 47/47Progress implementing Sustainability Brief for Developments at all projects over £5m 100% nr 17/17
Wellbeing (Customer Orientation)2020
target1
Deliver a WELL certified commercial office to shell and core, and set corporate policy for future developments
Deliver On track On track –
Develop and pilot retail wellbeing specification Deliver In progress On track –Increase the sense of wellbeing for shoppers, retailers and occupiers at our places Increase On track On track –Define and trial a methodology for measuring productivity in offices Deliver Completed On track –Research and publish on how development design impacts public health outcomes Deliver On track On track –Pilot interventions to improve local air quality1 3 Target
establishedn/a –
Injury Incidence Rate (RIDDOR) Offices 12.88 23.51 43/43Retail 0.01 0.01 58/58
Injury Frequency Rate (RIDDOR) Developments 0.13 0.08 38/38
Community (Right Places)Implement our Local Charter at all key assets and major developments 100% Charter
updatednr –
British Land employee skills-based volunteering 20% 16% 16% –British Land employee volunteering 90% 79% 90% –Community programme beneficiaries 39,798 35,600 –
Futureproofing (Capital Efficiency)Developments on track to achieve BREEAM Excellent for offices and Excellent or Very Good for retail
100% 92% 100% 16/16
Carbon (Scope 1 and 2) intensity reduction versus 2009 (index scored) 55% 54% 44% 70/73Landlord energy intensity reduction versus 2009 (index scored) 55% 40% 35% 70/73Electricity purchased from renewable sources1 100% 97% 93% 94/105Average reduction in embodied carbon emissions versus concept design on major developments 15% nr nr –Waste diverted from landfill: managed properties and developments 100% 99% 98% 105/125Portfolio with green building ratings (% by floor area) 18% 16% 234/234Energy Performance Certificates rated F or G (% by floor area) 5% 4% 2558/2660Portfolio at high risk of flood (% by value) 3% 3% 230/234High flood risk assets with flood management plans (% by value) 100% nr 15/15
Skills and opportunity (Expert People)People supported into employment1 (cumulative) 1,700 770 542 –Strategic suppliers agreed with terms of our Supplier Code of Conduct 100% Code Launched n/a –Prioritised supplier workforce who are apprentices 3% 1.2% nr3 209/232Pilot a Living Wage Zone at a London campus1 Deliver – – –Workforce paid at least Living Wage Foundation rate
Group employees 100% 100% –Supplier workforce at managed properties 70% 72% 92/101
Developments supply chain spend within 25 miles 71% 60% 11/121 Informed by a rigorous materiality review, we have introduced new 2020 targets for air quality, employment, fair wages and renewable electricity to increase focus
on priority issues. For more information on changes to our targets and detail on performance, see ww w.britishland.com/sustainability/performance/targets.2 2018 reporting scope.3 2017 pilot study data is not comparable and so is not reported.
175British Land Annual Report and Accounts 2018
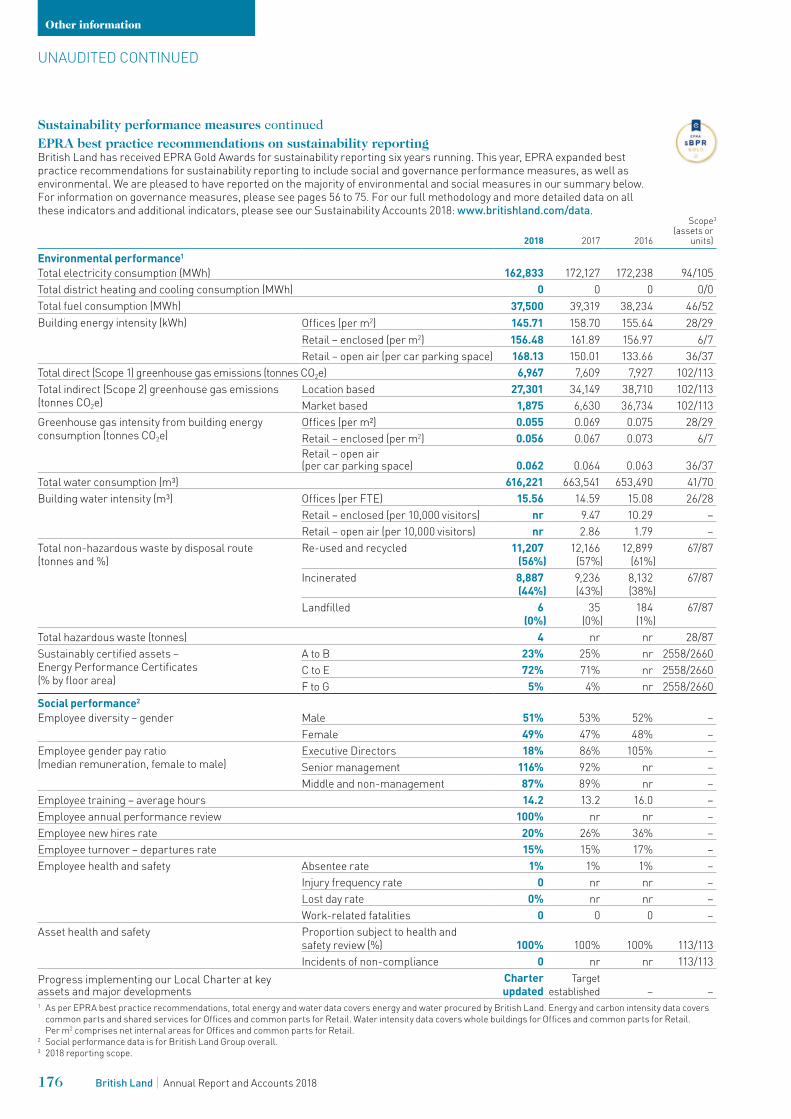
Sustainability performance measures continuedEPRA best practice recommendations on sustainability reportingBritish Land has received EPRA Gold Awards for sustainability reporting six years running. This year, EPRA expanded best practice recommendations for sustainability reporting to include social and governance performance measures, as well as environmental. We are pleased to have reported on the majority of environmental and social measures in our summary below. For information on governance measures, please see pages 56 to 75. For our full methodology and more detailed data on all these indicators and additional indicators, please see our Sustainability Accounts 2018: ww w.britishland.com/data.
2018 2017 2016
Scope3 (assets or
units)
Environmental performance1
Total electricity consumption (MWh) 162,833 172,127 172,238 94/105Total district heating and cooling consumption (MWh) 0 0 0 0/0Total fuel consumption (MWh) 37,500 39,319 38,234 46/52Building energy intensity (kWh) Offices (per m2) 145.71 158.70 155.64 28/29
Retail – enclosed (per m2) 156.48 161.89 156.97 6/7Retail – open air (per car parking space) 168.13 150.01 133.66 36/37
Total direct (Scope 1) greenhouse gas emissions (tonnes CO2e) 6,967 7,609 7,927 102/113Total indirect (Scope 2) greenhouse gas emissions (tonnes CO2e)
Location based 27,301 34,149 38,710 102/113Market based 1,875 6,630 36,734 102/113
Greenhouse gas intensity from building energy consumption (tonnes CO2e)
Offices (per m²) 0.055 0.069 0.075 28/29Retail – enclosed (per m2) 0.056 0.067 0.073 6/7Retail – open air (per car parking space) 0.062 0.064 0.063 36/37
Total water consumption (m³) 616,221 663,541 653,490 41/70Building water intensity (m³) Offices (per FTE) 15.56 14.59 15.08 26/28
Retail – enclosed (per 10,000 visitors) nr 9.47 10.29 –Retail – open air (per 10,000 visitors) nr 2.86 1.79 –
Total non-hazardous waste by disposal route (tonnes and %)
Re-used and recycled 11,207(56%)
12,166(57%)
12,899(61%)
67/87
Incinerated 8,887(44%)
9,236(43%)
8,132 (38%)
67/87
Landfilled 6(0%)
35(0%)
184 (1%)
67/87
Total hazardous waste (tonnes) 4 nr nr 28/87Sustainably certified assets – Energy Performance Certificates(% by floor area)
A to B 23% 25% nr 2558/2660C to E 72% 71% nr 2558/2660F to G 5% 4% nr 2558/2660
Social performance2
Employee diversity – gender Male 51% 53% 52% –Female 49% 47% 48% –
Employee gender pay ratio (median remuneration, female to male)
Executive Directors 18% 86% 105% –Senior management 116% 92% nr –Middle and non-management 87% 89% nr –
Employee training – average hours 14.2 13.2 16.0 –Employee annual performance review 100% nr nr –Employee new hires rate 20% 26% 36% –Employee turnover – departures rate 15% 15% 17% –Employee health and safety Absentee rate 1% 1% 1% –
Injury frequency rate 0 nr nr –Lost day rate 0% nr nr –Work-related fatalities 0 0 0 –
Asset health and safety Proportion subject to health and safety review (%) 100% 100% 100% 113/113Incidents of non-compliance 0 nr nr 113/113
Progress implementing our Local Charter at key assets and major developments
Charter updated
Targetestablished – –
1 As per EPRA best practice recommendations, total energy and water data covers energy and water procured by British Land. Energy and carbon intensity data covers common parts and shared services for Offices and common parts for Retail. Water intensity data covers whole buildings for Offices and common parts for Retail. Per m2 comprises net internal areas for Offices and common parts for Retail.
2 Social performance data is for British Land Group overall.3 2018 reporting scope.
UNAUDITED CONTINUED
176 British Land Annual Report and Accounts 2018
Other information
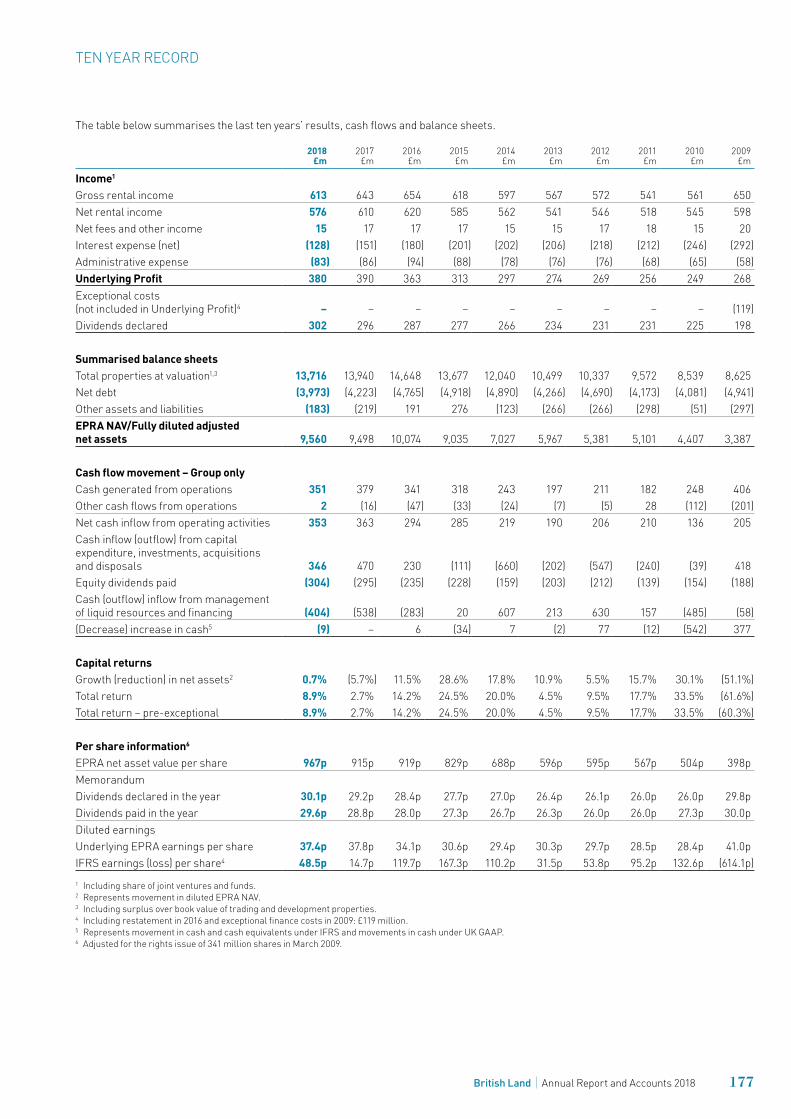
The table below summarises the last ten years’ results, cash flows and balance sheets.
2018 £m
2017 £m
2016 £m
2015 £m
2014 £m
2013 £m
2012 £m
2011 £m
2010 £m
2009 £m
Income1
Gross rental income 613 643 654 618 597 567 572 541 561 650 Net rental income 576 610 620 585 562 541 546 518 545 598 Net fees and other income 15 17 17 17 15 15 17 18 15 20 Interest expense (net) (128) (151) (180) (201) (202) (206) (218) (212) (246) (292)Administrative expense (83) (86) (94) (88) (78) (76) (76) (68) (65) (58)Underlying Profit 380 390 363 313 297 274 269 256 249 268 Exceptional costs (not included in Underlying Profit)4 – – – – – – – – – (119)Dividends declared 302 296 287 277 266 234 231 231 225 198
Summarised balance sheetsTotal properties at valuation1,3 13,716 13,940 14,648 13,677 12,040 10,499 10,337 9,572 8,539 8,625 Net debt (3,973) (4,223) (4,765) (4,918) (4,890) (4,266) (4,690) (4,173) (4,081) (4,941)Other assets and liabilities (183) (219) 191 276 (123) (266) (266) (298) (51) (297)EPRA NAV/Fully diluted adjusted net assets 9,560 9,498 10,074 9,035 7,027 5,967 5,381 5,101 4,407 3,387
Cash flow movement – Group only Cash generated from operations 351 379 341 318 243 197 211 182 248 406 Other cash flows from operations 2 (16) (47) (33) (24) (7) (5) 28 (112) (201)Net cash inflow from operating activities 353 363 294 285 219 190 206 210 136 205 Cash inflow (outflow) from capital expenditure, investments, acquisitions and disposals 346 470 230 (111) (660) (202) (547) (240) (39) 418 Equity dividends paid (304) (295) (235) (228) (159) (203) (212) (139) (154) (188)Cash (outflow) inflow from management of liquid resources and financing (404) (538) (283) 20 607 213 630 157 (485) (58)(Decrease) increase in cash5 (9) – 6 (34) 7 (2) 77 (12) (542) 377
Capital returnsGrowth (reduction) in net assets2 0.7% (5.7%) 11.5% 28.6% 17.8% 10.9% 5.5% 15.7% 30.1% (51.1%)Total return 8.9% 2.7% 14.2% 24.5% 20.0% 4.5% 9.5% 17.7% 33.5% (61.6%)Total return – pre-exceptional 8.9% 2.7% 14.2% 24.5% 20.0% 4.5% 9.5% 17.7% 33.5% (60.3%)
Per share information6
EPRA net asset value per share 967p 915p 919p 829p 688p 596p 595p 567p 504p 398pMemorandumDividends declared in the year 30.1p 29.2p 28.4p 27.7p 27.0p 26.4p 26.1p 26.0p 26.0p 29.8pDividends paid in the year 29.6p 28.8p 28.0p 27.3p 26.7p 26.3p 26.0p 26.0p 27.3p 30.0pDiluted earningsUnderlying EPRA earnings per share 37.4p 37.8p 34.1p 30.6p 29.4p 30.3p 29.7p 28.5p 28.4p 41.0pIFRS earnings (loss) per share4 48.5p 14.7p 119.7p 167.3p 110.2p 31.5p 53.8p 95.2p 132.6p (614.1p)1 Including share of joint ventures and funds.2 Represents movement in diluted EPRA NAV.3 Including surplus over book value of trading and development properties.4 Including restatement in 2016 and exceptional finance costs in 2009: £119 million.5 Represents movement in cash and cash equivalents under IFRS and movements in cash under UK GAAP.6 Adjusted for the rights issue of 341 million shares in March 2009.
177British Land Annual Report and Accounts 2018
TEN YEAR RECORD
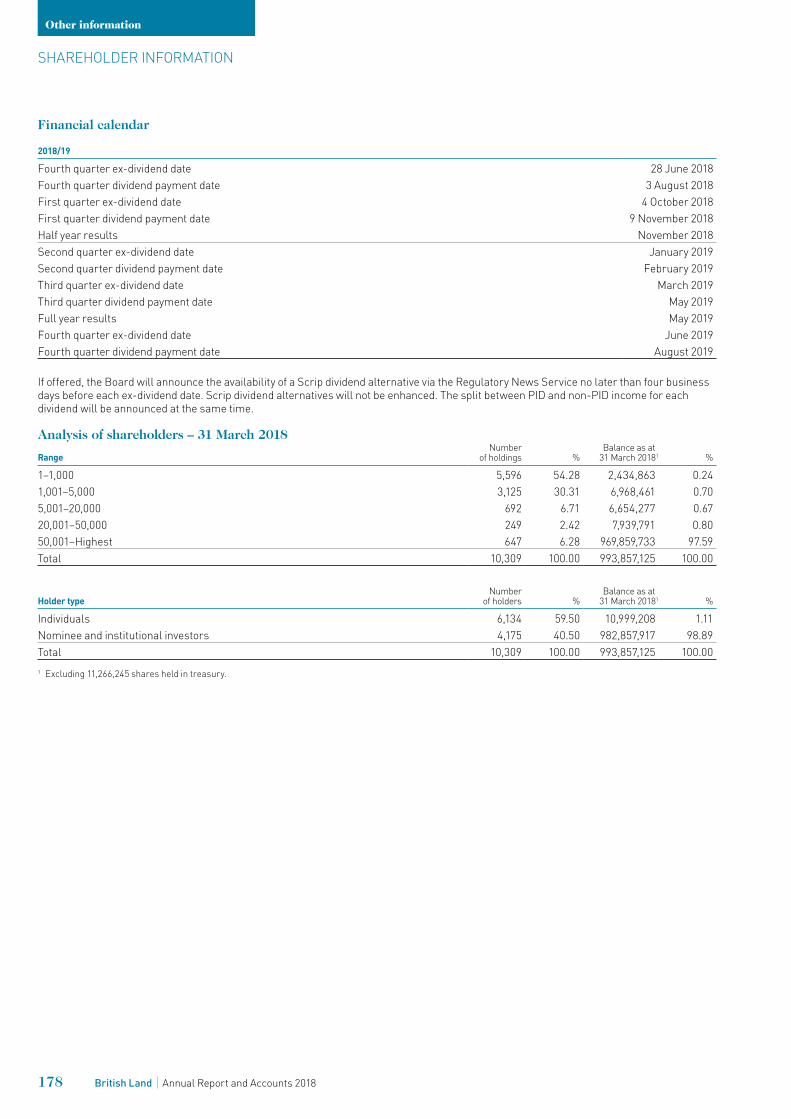
Financial calendar
2018/19
Fourth quarter ex-dividend date 28 June 2018 Fourth quarter dividend payment date 3 August 2018First quarter ex-dividend date 4 October 2018First quarter dividend payment date 9 November 2018Half year results November 2018Second quarter ex-dividend date January 2019Second quarter dividend payment date February 2019Third quarter ex-dividend date March 2019Third quarter dividend payment date May 2019Full year results May 2019Fourth quarter ex-dividend date June 2019Fourth quarter dividend payment date August 2019
If offered, the Board will announce the availability of a Scrip dividend alternative via the Regulatory News Service no later than four business days before each ex-dividend date. Scrip dividend alternatives will not be enhanced. The split between PID and non-PID income for each dividend will be announced at the same time.
Analysis of shareholders – 31 March 2018
RangeNumber
of holdings %Balance as at
31 March 20181 %
1–1,000 5,596 54.28 2,434,863 0.241,001–5,000 3,125 30.31 6,968,461 0.705,001–20,000 692 6.71 6,654,277 0.6720,001–50,000 249 2.42 7,939,791 0.8050,001–Highest 647 6.28 969,859,733 97.59Total 10,309 100.00 993,857,125 100.00
Holder type Number
of holders %Balance as at
31 March 20181 %
Individuals 6,134 59.50 10,999,208 1.11Nominee and institutional investors 4,175 40.50 982,857,917 98.89Total 10,309 100.00 993,857,125 100.001 Excluding 11,266,245 shares held in treasury.
178 British Land Annual Report and Accounts 2018
Other information
SHAREHOLDER INFORMATION
Registered officeThe British Land Company PLCYork House45 Seymour Street, London W1H 7LXTelephone: +44 (0)20 7486 4466Website: ww w.britishland.com
Dividends As a REIT, British Land pays Property Income Distribution (PID) and non-Property Income Distribution (non-PID) dividends. More information on REITs and PIDs can be found in the Investors section of our website at ww w.britishland.com/dividends.
British Land dividends can be paid directly into your bank or building society account instead of being despatched to you by cheque. More information about the benefits of having dividends paid directly into your bank or building society account, and the mandate form to set this up, can be found in the Investors section of our website at ww w.britishland.com/investors/dividends/ dividends-direct-to-your-bank.
Scrip Dividend SchemeBritish Land may offer shareholders the opportunity to participate in the Scrip Dividend Scheme by offering a Scrip Alternative to a particular dividend from time to time. The Scrip Dividend Scheme allows participating shareholders to receive additional shares instead of a cash dividend. For more information please visit the Investors section of our website at ww w.britishland.com/dividends/scrip-dividend-scheme.
Unsolicited mailBritish Land is required by law to make its share register available on request to other organisations. This may result in the receipt of unsolicited mail. To limit this, shareholders may register with the Mailing Preference Service. For more information, or to register, visit: ww w.mpsonline.org.uk.
Shareholders are also advised to be vigilant of share fraud which includes telephone calls offering free investment advice or offers to buy and sell shares at discounted or highly inflated prices. If it sounds too good to be true, it often is. Further information can be found on the Financial Conduct Authority’s website ww w.fca.org.uk/scams or by calling the FCA Consumer Helpline on 0800 111 6768.
TaxThe Group elected for REIT status on 1 January 2007, paying a £308m conversion charge to HMRC in the same year. As a consequence of the Group’s REIT status, tax is not levied within the corporate group on the qualifying property rental business but is instead deducted from distributions of such income as Property Income Distributions to shareholders. Any income which does not fall within the REIT regime is subject to tax within the Group in the usual way. This includes profits on property trading activity, property related fee income and interest income. We continue to comfortably pass all REIT tests ensuring that our REIT status is maintained.
We work proactively and openly to maintain a constructive relationship with HMRC. We discuss matters in real-time with HMRC and disclose all relevant facts and circumstances, particularly where there may be tax uncertainty or the law is unclear. HMRC assigns risk ratings to all large companies. We have a low appetite for tax risk and HMRC considers us to be ‘Low Risk’ (a status we have held since 2007 when the rating was first introduced by HMRC).
Further information can be found in our Tax Strategy at ww w.britishland.com/governance.
RegistrarsBritish Land has appointed Equiniti Limited (Equiniti) to administer its shareholder register. Equiniti can be contacted at:
Aspect HouseSpencer RoadLancing, West Sussex BN99 6DATel: 0371 384 2143 (UK callers)Tel: +44 (0)121 415 7047 (Overseas callers)Lines are open from 8.30am to 5.30pm Monday to Friday excluding public holidaysWebsite: ww w.shareview.co.uk
By registering with Shareview, shareholders can:
– View your British Land shareholding online – Update your details – Elect to receive shareholder mailings electronically
Equiniti is also the Registrar for the BLD Property Holdings Limited Stock.
Share dealing facilitiesBy registering with Shareview, Equiniti also provides existing and prospective UK shareholders with a share dealing facility for buying and selling British Land shares online or by phone.
For more information, contact Equiniti at ww w.shareview.co.uk/dealing or call 0845 603 7037 (Monday to Friday excluding public holidays from 8.30am to 4.30pm). Existing British Land shareholders will need the reference number given on your share certificate to register. Similar share dealing facilities are provided by other brokers, banks and financial services.
Website and shareholder communicationsThe British Land corporate website contains a wealth of material for shareholders, including the current share price, press releases and information dividends. The website can be accessed at ww w.britishland.com.
British Land encourages its shareholders to receive shareholder communications electronically. This enables shareholders to receive information quickly and securely as well as in a more environmentally friendly and cost-effective manner. Further information can be obtained from Shareview or the Shareholder Helpline.
ShareGiftShareholders with a small number of shares, the value of which makes it uneconomic to sell them, may wish to consider donating their shares to charity. ShareGift is a registered charity (No. 1052686) which collects and sells unwanted shares and uses the proceeds to support a wide range of UK charities. A ShareGift donation form can be obtained from Equiniti.
Further information about ShareGift can be obtained from their website at ww w.sharegift.org.
Honorary PresidentIn recognition of his work building British Land into the industry leading company it is today, Sir John Ritblat was appointed as Honorary President on his retirement from the Board in December 2006.
179British Land Annual Report and Accounts 2018
Forward-looking statementsThis Annual Report contains certain ‘forward-looking’ statements. Such statements reflect current views on, among other things, our markets, activities, projections, objectives and prospects. Such ‘forward-looking’ statements can sometimes, but not always, be identified by their reference to a date or point in the future or the use of ‘forward-looking’ terminology, including terms such as ‘believes’, ‘estimates’, ‘anticipates’, ‘expects’, ‘forecasts’, ‘intends’, ‘due’, ‘plans’, ‘projects’, ‘goal’, ‘outlook’, ‘schedule’, ‘target’, ‘aim’, ‘may’, ‘likely to’, ‘will’, ‘would’, ‘could’, ‘should’ or similar expressions or in each case their negative or other variations or comparable terminology. By their nature, forward-looking statements involve inherent risks, assumptions and uncertainties because they relate to future events and depend on circumstances which may or may not occur and may be beyond our ability to control or predict. Forward-looking statements should be regarded with caution as actual results may differ materially from those expressed in or implied by such statements.
Important factors that could cause actual results, performance or achievements of British Land to differ materially from any outcomes or results expressed or implied by such forward-looking statements include, among other things: (a) general business and political, social and economic conditions globally, (b) the consequences of the referendum on Britain leaving the EU, (c) industry and market trends (including demand in the property investment market and property price volatility), (d) competition, (e) the behaviour of other market participants, (f) changes in government policies or laws and regulation which affect British Land, including in relation to the environment, health and safety and taxation (in particular, in respect of British Land’s status as a Real Estate Investment Trust), (g) inflation and consumer confidence, (h) labour relations and work stoppages, (i) natural disasters and adverse weather conditions, (j) terrorism and acts of war, (k) British Land’s overall business strategy, risk appetite and investment choices in its portfolio management, (l) legal or other proceedings against or affecting British Land, (m) deterioration of reliability and security of its IT infrastructure, (n) changes in occupier demand and tenant default, (o) changes in financial and equity markets including interest and exchange rate fluctuations, (p) changes in accounting practices and the interpretation of accounting standards and (q) the availability and cost of finance. The Company’s principal risks are described in greater detail in the section of this Annual Report headed Managing risk in delivering our strategy and principal risks. Forward-looking statements in this Annual Report, or the British Land website or made subsequently, which are attributable to British Land or persons acting on its behalf should therefore be construed in light of all such factors.
Information contained in this Annual Report relating to British Land or its share price or the yield on its shares are not guarantees of, and should not be relied upon as an indicator of, future performance, and nothing in this Annual Report should be construed as a profit forecast or profit estimate. Any forward-looking statements made by or on behalf of British Land speak only as of the date they are made. Such forward-looking statements are expressly qualified in their entirety by the factors referred to above and no representation, assurance, guarantee or warranty is given in relation to them (whether by British Land or any of its associates, Directors, officers, employees or advisers), including as to their completeness, accuracy or the basis on which they were prepared.
Other than in accordance with our legal and regulatory obligations (including under the UK Financial Conduct Authority’s Listing Rules, Disclosure and Transparency Rules and the Market Abuse Regulations), British Land does not intend or undertake to update or revise forward-looking statements to reflect any changes in British Land’s expectations with regard thereto or any changes in information, events, conditions or circumstances on which any such statement is based. This document shall not, under any circumstances, create any implication that there has been no change in the business or affairs of British Land since the date of this document or that the information contained herein is correct as at any time subsequent to this date.
180 British Land Annual Report and Accounts 2018