Embed Size (px)
Citation preview
FINANCIAL STATEMENTS FOR THE YEARS ENDED JUNE, 2010 AND 2009 AND INDEPENDENT AUDITOR’S REPORT INCLUDING SCHEDULE OF EXPENDITURES OF FEDERAL AWARDS AND SINGLE AUDIT DOCUMENTS FOR THE YEAR ENDED JUNE 30, 2010


TABLE OF CONTENTS
Page
INDEPENDENT AUDITOR’S REPORT 1 - 2
MANAGEMENT’S DISCUSSION AND ANALYSIS 3 - 10
FINANCIAL STATEMENTS:
Statement of Net Assets 11 – 12
Statement of Revenues, Expenses and Changes in Net Assets 13 – 14
Statement of Cash Flows 15 – 16
Statements of Benefit Plan Net Assets 17
Statements of Changes in Benefit Plan Net Assets 18
Notes to Financial Statements 19 - 56
INDEPENDENT AUDITOR’S REPORT ON INTERNAL CONTROL OVER FINANCIAL REPORTING AND ON COMPLIANCE AND OTHER MATTERS BASED ON AN AUDIT OF FINANCIAL STATEMENTS PERFORMED IN ACCORDANCE WITH GOVERNMENT AUDITING STANDARDS 57 - 58 INDEPENDENT AUDITOR’S REPORT ON COMPLIANCE WITH REQUIREMENTS APPLICABLE TO EACH MAJOR PROGRAM AND ON INTERNAL CONTROL OVER COMPLIANCE IN ACCORDANCE WITH OMB CIRCULAR A-133 59 – 60 SCHEDULE OF FINDINGS AND QUESTIONED COSTS: 61 – 63
Part I – Summary of Auditor’s Results Section Part II – Financial Statement Findings Section Part III – Federal Award Findings and Questioned Costs Section
Summary Schedule of Prior Audit Findings 64 Schedule of Expenditures of Federal Awards 65 – 80 Notes to the Schedule of Expenditures of Federal Awards 81 – 84

1
INDEPENDENT AUDITOR’S REPORT Idaho State Board of Education University of Idaho Moscow, Idaho We have audited the accompanying financial statements of the University of Idaho (University) as of and for the years ended June 30, 2010 and 2009, as listed in the table of contents. These financial statements are the responsibility of the University’s management. Our responsibility is to express an opinion on these financial statements based on our audits. We did not audit the financial statements of the University’s discretely presented component unit as described in Note 18, or the University of Idaho Health Benefits Trust as described in Note 11. Those financial statements were audited by other auditors whose reports thereon have been furnished to us, and our opinion, insofar as it relates to the amounts included for the component unit and the University of Idaho Health Benefits Trust, are based solely on the reports of other auditors. We conducted our audits in accordance with auditing standards generally accepted in the United States of America and the standards applicable to financial audits contained in Government Auditing Standards, issued by the Comptroller General of the United States. Those standards require that we plan and perform the audits to obtain reasonable assurance about whether the financial statements are free of material misstatement. An audit includes consideration of internal control over financial reporting as a basis for designing audit procedures that are appropriate in the circumstances, but not for the purpose of expressing an opinion on the effectiveness of the internal control over financial reporting. Accordingly, we express no such opinion. An audit also includes examining, on a test basis, evidence supporting the amounts and disclosures in the financial statements, assessing the accounting principles used and significant estimates made by management, as well as evaluating the overall financial statement presentation. We believe that our audits and the reports of other auditors provide a reasonable basis for our opinions. In our opinion, based on our audits and the reports of other auditors, the financial statements referred to above present fairly, in all material respects, the financial position of the University of Idaho, its discretely presented component unit, as of June 30, 2010 and 2009, and the aggregate remaining fund information of the University of Idaho, as of December 31, 2009 and 2008, and the respective changes in its financial position and cash flows, where applicable, for the years then ended in conformity with accounting principles generally accepted in the United States of America.
In accordance with Government Auditing Standards, we have also issued our report dated September 30, 2010, on our consideration of the University’s internal control over financial reporting and our tests of its compliance with certain provisions of laws, regulations, contracts and grant agreements and other matters. The purpose of that report is to describe the scope of our testing of internal control over financial reporting and compliance and the results of that testing, and not to provide an opinion on the internal control over financial reporting or on compliance. That report is an integral part of an audit performed in accordance with Government Auditing Standards and should be considered in assessing the results of our audit.
2
The Management’s Discussion and Analysis on pages 3 through 10 and certain information in Note 13, Postemployment Benefits Other Than Pensions and Retiree Benefits Trust, that is labeled as “required supplementary information” is not a required part of the basic financial statements but is supplementary information required by accounting principles generally accepted in the United States of America. We have applied certain limited procedures, which consisted principally of inquiries of management regarding the methods of measurement and presentation of the required supplementary information. However we did not audit the information and express no opinion on it. Our audit was conducted for the purpose of forming an opinion on the University’s basic financial statements taken as a whole. The accompanying schedule of expenditures of federal awards is presented for purposes of additional analysis as required by U.S. Office of Management and Budget Circular A-133, Audits of States, Local Governments, and Non-Profit Organizations, and is not a required part of the basic financial statements. Such information has been subjected to the auditing procedures applied in the audit of the basic financial statements and in our opinion, is fairly stated, in all material respects, in relation to the basic financial statements taken as a whole.
Eugene, Oregon September 30, 2010

MANAGEMENT’S DISCUSSION AND ANALYSIS
AS OF AND FOR THE YEAR ENDED JUNE 30, 2010
3
The University of Idaho (the “University”) is a doctoral-research extensive land-grant institution, with the principal
responsibility for research and granting Ph.D. degrees in Idaho. The University serves state, national and
international communities by providing academic instruction and conducting research that advances fundamental
knowledge. In addition to its main campus in Moscow, the University has instructional centers in Coeur d’Alene,
Boise, Twin Falls and Idaho Falls as well as research and extension centers located across the state.
Overview
The Management’s Discussion and Analysis is designed to provide an easy to read analysis of the University’s
financial condition, results of operations and cash flows based on facts, decisions and conditions known at the date
of the auditor’s reports. The emphasis of this discussion of the financial performance of the University is for the
current year.
The discussion and analysis that follows provides an overview of the University’s financial activities for the fiscal
year ended June 30, 2010 and in comparison to 2009 and 2008. There are three financial statements presented: the
Statement of Net Assets; the Statement of Revenues, Expenses and Changes in Net Assets; and the Statement of
Cash Flows. They are prepared using the accrual basis of accounting, whereby revenues are recognized when
services are provided and expenses are recognized when goods or services are received, regardless of when cash is
exchanged.
In accordance with Governmental Accounting Standards Board (GASB) Statement No. 39, Determining Whether
Certain Organizations are Component Units, an Amendment of GASB Statement 14, these statements also present
information for the University of Idaho Foundation, Inc. (the “Foundation”) which qualifies as a component unit of
the University. Separate audited financial statements are prepared for the Foundation and may be obtained by
contacting University of Idaho Foundation, P.O. Box 443143, Moscow, ID 83844-3143.
In accordance with GASB Statement No. 43, Financial Reporting for Postemployment Benefit Plans Other Than
Pension Plans, the University has included financial statements for the Health Benefits (HBT) and Retirement
Benefits (RBT) Trusts. The HBT was established to meet the requirements of the State of Idaho Department of
Insurance in order to manage the University’s self insurance program. Separate audited financial statements are
prepared for the HBT and may be obtained by contacting University of Idaho, Attn. General Accounting, P.O. Box
443166, Moscow, ID 83844-3166. The RBT was established to meet the requirements of GASB Statement No. 45,
Accounting and Financial Reporting by Employers for Postemployment Benefits Other Than Pensions. These
statements and related supplementary information is presented after the University’s financial statements and
preceding the notes to the financial statements.
Statement of Net Assets
The statement of net assets outlines the University’s financial condition at fiscal year end. This is a point-in-time
financial statement and presents end-of-year data concerning assets, liabilities and net assets. From the data
presented, readers are able to determine the assets available to continue the operations of the University. They are
also able to determine how much the University owes vendors, investors and lending institutions. Finally, it
provides a picture of the net assets (assets minus liabilities) and their availability for expenditure by the University.
The statement of net assets is presented in a classified format, which differentiates between current and noncurrent
assets and liabilities, and also groups net assets into four categories which are:

MANAGEMENT’S DISCUSSION AND ANALYSIS
AS OF AND FOR THE YEAR ENDED JUNE 30, 2010
4
Invested in Capital Assets, Net of Related Debt - the University’s investment in property, plant and equipment net
of depreciation and outstanding debt obligations related to those capital assets.
Restricted Nonexpendable - the corpus of nonexpendable restricted resources is available only for investment
purposes. These assets are held in perpetuity.
Restricted Expendable - subject to external donor or grantor stipulations regarding their use. The University may
expend these assets for purposes as determined by donors and/or external entities.
Unrestricted - may be expended for any lawful purpose of the University.
2010 2009 2008
ASSETS
Current assets 69,459$ 47,658$ 37,157$
Capital assets - net 381,501 358,971 343,070
Other noncurrent assets 137,581 153,084 196,143
Total assests 588,541$ 559,713$ 576,370$
LIABILITIES
Current liabilities 48,507$ 44,441$ 44,525$
Noncurrent liabilities 159,748 142,472 146,009
Total Libilities 208,255$ 186,913$ 190,534$
NET ASSETS
Invested in capital assets-net of debt 211,194$ 205,938$ 185,755$
Restricted nonexpendable 67,830 62,392 77,042
Restricted expendable 74,964 68,225 84,838
Unrestricted 26,298 36,245 38,201
Total net assets 380,286$ 372,800$ 385,836$
Total liabilties and net assets 588,541$ 559,713$ 576,370$
Condensed Statement of Net Assets
Fiscal Years Ended June 30
(Dollars in Thousands)
Total assets for the University increased 5.2%, or $28.8M, in fiscal year 2010. Current assets increased $21.8M to
$69.4M over the year. The primary cause of the increase was a shift from long term investments to investments
with shorter durations. A similar decrease of $18.7M decrease in noncurrent investments reflects this change in
investment holdings. Noncurrent assets increased $7M primarily due a $22.5M increase in capital assets in fiscal
year 2010 and a $5.4M increase in University assets held in trust by the Foundation. These increases were offset by
the shift of restricted cash and investments to shorter term liquid investments. Restricted cash and equivalents
decreased by $2.4M and investments decreased by $18.7M.
Current liabilities increased $4.1M over the year primarily due to a $2.1M increase in accrued salaries and benefits
combined with a $1.9M increase in deferred revenues. Grant and contracts activity was $1.5M of this increase with
increases in summer session participation making up most of the rest of the balance. Revenues collected in the
current year for courses delivered after June 30 are deferred to the new fiscal year. Noncurrent liabilities increased
$17.3M due to the 2010 bond issues for capital improvements. Overall total liabilities increased $21.3M, an 11.1%
increase in fiscal year 2010 over 2009.

MANAGEMENT’S DISCUSSION AND ANALYSIS
AS OF AND FOR THE YEAR ENDED JUNE 30, 2010
5
Net assets increased $7.5M, 2%, for fiscal year 2010. Investment in capital assets increased $5.3M as projects were
completed over the year. Restricted nonexpendable assets increased $5.4M by the change in assets held in trust by
the Foundation and restricted expendable increased 9.9% to $74.9M over fiscal year 2009 primarily due to
increases in grant and contract activity and gifts distributed from the Foundation. Unrestricted assets decreased
$10M from the implementation of an early retirement incentive and as reductions in State funding shifted spending
over to other funding sources. It was the University’s decision to manage the reduction in funding by using
available reserves during fiscal year 2010.
Statement of Revenues, Expenses and Changes in Net Assets
The statement of revenues, expenses and changes in net assets presents the revenues earned and expenses incurred
during the year, classifying activities as either operating or non-operating. The GASB 34 reporting model classifies
state appropriations, gifts, federal appropriations, and investment income as non-operating revenue which results in
a net operating loss.
Operating revenues are derived from exchange transaction activities associated with providing goods and services
for instruction, research, public service or related support to entities separate from the university. Examples include
student tuition and fees, sales and services, grants and contracts. Operating expenses are those expenses paid to
acquire or produce the goods and services provided to carry out the functions of the University. Examples include
salaries, benefits, scholarships, and purchases of supplies. Non-operating revenues are primarily derived from
activities that are non-exchange transactions, e.g., gifts and contributions; and from sources defined as such by
GASB Statement No. 9, e.g., investment income; and from sources defined as such by GASB Statement Nos. 33
and 34, e.g., state and federal appropriations.
When comparing all of the University’s sources of revenue in 2010, as shown in the chart below, state
appropriations account for 31% of the total revenue received while grants and contracts and student tuition and fees
were 26% and 19% of the total respectively.
0%
20%
40%
60%
80%
100%
120%
2010 2009 2008
19% 18% 16%
26% 23% 22%
11%11% 11%
1%1% 2%
5%5% 5%
31% 37%35%
2% 2%1%
3% 1%2%
2% 1%4%
1% 1% 1%
Student tuition & fees Grants & Contracts including capital Sales and ServicesInterest Income Gifts including capital State General AppropriationEndowment Income Federal Appropriations Capital AppropriationsOther Sources
Total Revenues
MANAGEMENT’S DISCUSSION AND ANALYSIS
AS OF AND FOR THE YEAR ENDED JUNE 30, 2010
6
2010 2009 2008
Operating revenues 181,537$ 172,234$ 165,285$
Operating expenses 343,883 340,286 330,004
Operating loss (162,346) (168,052) (164,719)
Net nonoperating revenues 158,281 151,047 154,390
Loss before other revenues (4,065) (17,005) (10,329)
Other revenues 11,551 3,970 19,027
Increase in net asets 7,486 (13,035) 8,698
Net assets - Beginning of year 372,800 385,835 377,137
Net assets - End of year 380,286$ 372,800$ 385,835$
(Dollars inThousands)
Condensed Statement of Revenues, Expenses and Changes in Net Assets
Fiscal Years Ended June 30
The statement of revenues, expenses and changes in net assets details the $7.5M increase in net assets for fiscal
year 2010. Operating revenues increased $9.3M, a 5.4% increase over fiscal year 2009, caused by increases in
student fees, federal grants and contracts. Student fees increased $4.4M with a 6.5% in undergraduate fee rates and
an increased enrollment. Federal grants and contracts increased 11.2% with a $7M increase in grant activity
including $1.5M of capital grants recorded in other revenue. Other sources of revenue decreased 37%, or $1.4M,
but were offset by a $1.6M increase in sales and services of auxiliary enterprises. Operating expenses increased 1%
overall from 2009. The primary cause of the increase was a $4M increase in scholarship activity due to an increase
in Pell grant funding. This increase was offset by a 13% decrease, $3.5M, in spending for supplies in reaction to
decreasing resources. The supplies expense however was offset by a $3.2M increase in services fueled by the
increase in federal grant activity.
Nonoperating revenues and expenses increased 4.8% over the fiscal year. State appropriation revenues decreased
by $20M primarily caused by $18.5M in state holdbacks including $10M appropriated for a new dairy farm.
Federal appropriations increased $4.7M due to $5.3M in American Recovery and Reinvestment Act funding passed
through from the state. Federal grants and contracts increased $4.9M from increased Pell Grant funding. Net
investment income dropped $1.6M from fiscal year 2009 and net change in the fair value of investments decreased
$1.6M due to the investment decisions to hold more liquid investments. Interest expense for fiscal year 2010
decreased from the 2009 expense by $1.1M due to a higher level of capitalized interest that made up part of the
increase in capital assets reported on the Statement of Net Assets. Assets held by the Foundation for the University
as part of the overall consolidated investment trust increased $5.4M rebounding from large losses in fiscal years
2009 and 2008. Other revenues and expenditures increased $7.6M over the year primarily due to several large
projects, amounting to $6.4M, with Idaho Public Works completing during fiscal year 2010. Adding to this
increase is the $1.5M in capital grants mentioned above.
MANAGEMENT’S DISCUSSION AND ANALYSIS
AS OF AND FOR THE YEAR ENDED JUNE 30, 2010
7
0%
20%
40%
60%
80%
100%
120%
2010 2009 2008
36% 35% 35%
36% 34% 30%
3% 3%6%
2% 3% 4%
6% 6% 7%
16% 16% 16%
1% 2% 2%
Student tuition & fees Federal grants & contracts State grants & contractsPrivate grants & contracts Sales & services of educational activities Sales & services of auxiliary enterprisesOther sources
Operating Revenues
0%
10%
20%
30%
40%
50%
60%
70%
80%
90%
100%
2010 2009 2008
46% 46% 45%
16% 16% 15%
13% 12% 14%
7% 8% 8%4% 4% 4%8% 6% 6%
6% 6% 6%
1% 1% 2%
Salaries Benefits Services Supplies Insurance, utilities and rent Scholarships and fellowships Depreciation Other
Operating Expenses
Statement of Cash Flows
The statement of cash flows presents detailed information about the cash activities of the University during the year
ended June 30, 2010. The statement is divided into five parts. The first part details operating cash flows and the net

MANAGEMENT’S DISCUSSION AND ANALYSIS
AS OF AND FOR THE YEAR ENDED JUNE 30, 2010
8
cash used by the operating activities of the University. The second section reflects cash flows from noncapital
financing activities. This section reflects the cash received and spent for non-operating, non-investing and non-
capital financing purposes. The third section, cash flows from capital and related financing activities, shows the
cash used for the acquisition and construction of capital and related items. The fourth section reflects the cash flows
from investing activities and shows the purchases, proceeds and interest received. The fifth section reflects the net
change in cash position.
Cash provided (used) by: 2010 2009 2008
Operating activities (140,060)$ (147,991)$ (150,571)$
Noncapital financing activities 154,896 165,715 163,715
Capital and related financing activities (21,157) (42,921) 6,875
Investing activities 21,873 58,664 (21,686)
Net change in cash 15,552 33,467 (1,667)
Cash beginning of the year 41,839 8,372 10,039
Cash end of the year 57,391 41,839 8,372
Condensed Statement of Cash Flows
Fiscal Years Ended June 30
(Dollars in Thousands)
Operating activities used $140M in cash for the year, a decrease of $8M from FY 2009. Noncapital financing
activities provided $154.9M in cash for the year, a $10.8M decrease from FY 2009. This change was caused by the
decrease in state appropriations offset by increases in federal appropriation and grants and contract activity. Capital
and related financing activities used $21.2M of cash during the year, the large variance from the previous fiscal
year was primarily from a bond issuance in fiscal year 2010 while no bonds were issued in the previous year.
Investing activities provided $21.8M during fiscal year 2010.
Capital Assets and Debt Management
The University had $688.6M and $646.9M of capital assets at June 30, 2010 and 2009 respectively, with
accumulated depreciation of $307.0M and $287.9M respectively. The major categories and associated value of
capital assets as well as accumulated depreciation at June 30, 2010, 2009 and 2008 are illustrated in the chart below
(in thousands).
MANAGEMENT’S DISCUSSION AND ANALYSIS
AS OF AND FOR THE YEAR ENDED JUNE 30, 2010
9
2010 2009 2008
Capital Asset at Cost
Buildings and improvements 467,312$ 457,030$ 446,769$
Equipment 84,144 80,168 77,302
Construction in progress 48,509 24,431 8,343
Library materials 67,682 64,351 60,788
Capitalized collections 2,176 2,143 2,128
Land 18,768 18,768 18,768
Total Capital Assets 688,591$ 646,891$ 614,098$
Accumulated Depreciation
Building and improvements 188,184$ 176,853$ 165,685$
Equipment 66,260 60,993 57,802
Library materials 52,645 50,075 47,542
Total Accumulated Depreciation 307,089$ 287,921$ 271,029$
At June 30, 2010 and 2009 the University had debt (or similar long-term obligations) of $ 165.1M and $147.9M
respectively.
Economic Outlook
The deep financial downturn in the global economy that began in fiscal year 2008 has continued to be felt through
fiscal year 2010. In fiscal year 2009, the University was directed to return to the State of Idaho $6M of state
appropriated funds. In fiscal year 2010, the University was again directed to return appropriated funds as part of
another current year hold-back. This action was required in order for the state leadership to properly address
budget shortfalls. In addition, investing activities for the University resulted in reduced investment income and
reduced operating funds that typically come to the University from those revenue sources.
The University positioned itself strategically by: implementing an early exit program for employees; approving the
continuation of only mission critical travel; continuation of case by case hiring actions; increased grant and contract
proposal submissions; refinancing of Bonds, to include taking advantage of the Build America Bond program
associated with the federal stimulus plan, and instituted a fiscal year 2010 furlough. Those actions were critical as
they facilitated fiscal security for the enterprise and balancing of the FY2010 budget. With the uncertainty with
regard to State of Idaho fiscal matters, the University leadership chose to hire an Executive Director of Strategic
Planning and Budget. This action has resulted in more closely aligning critical University resources with the
University strategic plan. Our student leadership worked closely with the administration and together received
approval of a 9% student fee increase for academic year 2010 – 2011.
Additionally, in the fall of 2009, the University made permanent the strategic internal reallocation that was
implemented in 2008 with one time funds. As a result, the University’s major revenue producing engines
(advancement, enrollment, graduate studies, and research), collectively received a permanent influx of
approximately $5M of annually recurring dollars. This action continues to pay dividends as the number of research
proposals exceed last year (which was up over 40% of the year prior), graduate student enrollment is up, 2010
MANAGEMENT’S DISCUSSION AND ANALYSIS
AS OF AND FOR THE YEAR ENDED JUNE 30, 2010
10
summer school enrollment was up 10%, total student enrollment increased by 2% in 2009 the University is
anticipating another enrollment increase for fall 2010, student retention is up, and “gifting activity” is up as well.
Initial reports from the State of Idaho reflect that the challenging fiscal environment may have bottomed out and
even with the current challenges, the combination of actions listed above have facilitated execution of a balanced
fiscal year 2010 budget and initiation of a balanced fiscal year 2011 budget.

11
STATEMENT OF NET ASSETSAS OF JUNE 30, 2010 AND 2009
University of Idaho 2010
University of Idaho 2009
University of Idaho Foundation
(note 18)2010
University of Idaho Foundation
(note 18)2009
ASSETS
CURRENT ASSETSCash and cash equivalents 38,022,281$ 20,051,498$ 17,715,659$ 10,609,764$ Due from state agencies 213,537 333,983 - - Prepaid expenses 638,454 547,070 - - Investments 601,879 601,759 6,415,105 2,793,163 Interest receivable 484,478 485,808 625,122 693,017 Student loans receivable 1,569,223 1,551,336 - - Accounts receivable & unbilled charges - net 25,376,360 22,213,837 - - Inventories 2,187,052 1,872,635 - - Pledges receivable - net - - 1,997,969 966,123 Notes receivable 365,400 - 59,417 52,085
Total Current Assets 69,458,664 47,657,926 26,813,272 15,114,152
NONCURRENT ASSETSRestricted cash and cash equivalents 19,368,655 21,787,443 5,976,696 6,399,527 Student loans receivable - net 10,633,027 10,917,931 - - Investments 37,582,031 56,335,644 168,497,013 156,761,325 Assets held in trust by Foundation 67,829,850 62,391,971 - - Pledges receivable - net - - 4,718,131 1,766,253 Notes receivable - - 535,478 602,226 Deferred bond financing costs 2,167,504 1,651,574 - - Capital assets 381,501,275 358,970,963 3,481,497 3,607,701 Other noncurrent assets - - 309,980 193,356
Total Noncurrent Assets 519,082,342 512,055,526 183,518,795 169,330,388
TOTAL ASSETS 588,541,006$ 559,713,452$ 210,332,067 184,444,540$
See notes to financial statements Continued
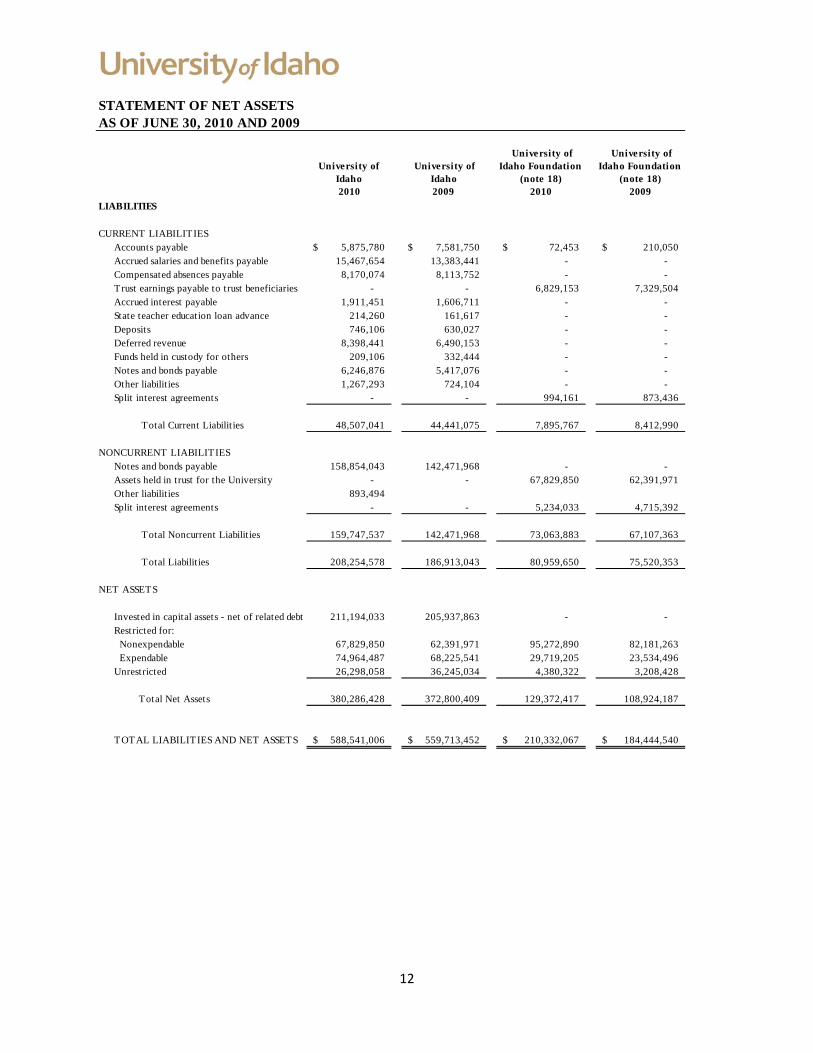
12
STATEMENT OF NET ASSETSAS OF JUNE 30, 2010 AND 2009
University of Idaho 2010
University of Idaho 2009
University of Idaho Foundation
(note 18)2010
University of Idaho Foundation
(note 18)2009
LIABILITIES
CURRENT LIABILITIESAccounts payable 5,875,780$ 7,581,750$ 72,453$ 210,050$ Accrued salaries and benefits payable 15,467,654 13,383,441 - - Compensated absences payable 8,170,074 8,113,752 - - T rust earnings payable to trust beneficiaries - - 6,829,153 7,329,504 Accrued interest payable 1,911,451 1,606,711 - - State teacher education loan advance 214,260 161,617 - - Deposits 746,106 630,027 - - Deferred revenue 8,398,441 6,490,153 - - Funds held in custody for others 209,106 332,444 - - Notes and bonds payable 6,246,876 5,417,076 - - Other liabilit ies 1,267,293 724,104 - - Split interest agreements - - 994,161 873,436
Total Current Liabilit ies 48,507,041 44,441,075 7,895,767 8,412,990
NONCURRENT LIABILITIESNotes and bonds payable 158,854,043 142,471,968 - - Assets held in trust for the University - - 67,829,850 62,391,971 Other liabilit ies 893,494 Split interest agreements - - 5,234,033 4,715,392
Total Noncurrent Liabilit ies 159,747,537 142,471,968 73,063,883 67,107,363
Total Liabilit ies 208,254,578 186,913,043 80,959,650 75,520,353
NET ASSETS
Invested in capital assets - net of related debt 211,194,033 205,937,863 - - Restricted for: Nonexpendable 67,829,850 62,391,971 95,272,890 82,181,263 Expendable 74,964,487 68,225,541 29,719,205 23,534,496 Unrestricted 26,298,058 36,245,034 4,380,322 3,208,428
Total Net Assets 380,286,428 372,800,409 129,372,417 108,924,187
TOTAL LIABILITIES AND NET ASSETS 588,541,006$ 559,713,452$ 210,332,067$ 184,444,540$

13
STATEMENT OF REVENUES, EXPENSES AND CHANGES IN NET ASSETSFOR THE YEARS ENDED JUNE 30, 2010 AND 2009
University of Idaho 2010
University of Idaho 2009
University of Idaho Foundation
(note 18)2010
University of Idaho Foundation
(note 18)2009
OPERATING REVENUESStudent tuition and fees including pledged revenues of $63,960,825 and $59,562,901 (net of scholarship allowance of $14,035,710 and $11,449,679 ) for FY 2010 and FY 2009 respectively 65,097,956$ 60,702,738$ -$ -$ Federal grants and contracts 64,618,026 59,096,376 - - State and local grants and contracts 5,051,659 5,502,914 - - Private grants and contracts 4,464,960 4,342,407 - - Sales and services of educational activities including pledged revenues of $10,130,640 and $10,643,423 for FY 2010 and FY 2009 respectively 10,130,640 10,643,423 - - Sales and services of auxiliary enterprises including pledged revenues of $29,563,701 and $27,964,720 for FY 2010 and FY 2009 respectively 29,563,701 27,964,720 - - Interest on loans receivable 251,144 234,577 - - Other sources 2,358,795 3,747,033 69,728 145,572 Gifts - - 18,156,092 16,674,827
Total operating revenue 181,536,881 172,234,188 18,225,820 16,820,399
OPERATING EXPENSESSalaries 158,351,318 158,066,029 - - Benefits 53,425,133 54,263,999 - - Services 42,664,491 39,422,442 - - Supplies 23,123,214 26,594,469 - - Insurance, utilit ies and rent 14,173,632 15,249,708 - - Scholarships and fellowships 26,114,721 22,068,009 - - Depreciation 21,993,020 20,555,241 5,893 5,893 Other 4,037,797 4,066,756 400,843 381,830 Administrative expense - - 1,860,247 2,527,796
Total operating expenses 343,883,326 340,286,653 2,266,983 2,915,519
OPERATING (LOSS) INCOME (162,346,445)$ (168,052,465)$ 15,958,837$ 13,904,880$
See notes to financial statements Continued

14
STATEMENT OF REVENUES, EXPENSES AND CHANGES IN NET ASSETSFOR THE YEARS ENDED JUNE 30, 2010 AND 2009
University of Idaho 2010
University of Idaho 2009
University of Idaho Foundation
(note 18)2010
University of Idaho Foundation
(note 18)2009
NONOPERATING REVENUES (EXPENSES)State appropriations 107,249,600$ 127,767,588$ -$ -$ Land grant endowment income 6,164,400 5,307,300 - - Federal appropriations 9,248,194 4,562,982 - - Federal grants and contracts 16,624,864 11,706,909 - - Gifts (including gifts from Foundation) 14,839,365 15,731,753 - - Private grants and contracts 35,286 114,616 - - Net investment income including pledged revenues to UI of $2,072,365 and $3,040,962 for FY 2010 and FY 2009 respectively
2,939,116 4,529,713 7,606,675 9,265,193
Net increase (decrease) in fair value of investments 180,583 1,745,586 19,069,365 (37,208,454) Change in value of assets held in trust for University 5,437,879 (14,650,447) (5,437,879) 14,650,448 Distribution of endowment income to University and trust beneficiaries
- - (6,829,153) (7,329,504)
Distribution to University and affiliates - - (8,715,015) (9,686,388) Distribution of trust income to life income beneficiaries - - (658,649) (548,866) Lease and rental income - - 25,864 65,770 Property management - - (30,291) (51,759) Change to split interest trusts - - (541,524) 1,976,562 Interest expense (net of capitalized interest of $1,744,741 and $734,106 for FY 2010 and FY 2009 respectively) (5,184,622) (6,292,913) - - Other sources 747,229 524,166 - -
Net nonoperating revenues (expenses) 158,281,894 151,047,253 4,489,393 (28,866,998)
LOSS BEFORE OTHER REVENUES (4,064,551) (17,005,212) 20,448,230 (14,962,118)
OTHER REVENUESCapital grants and contracts 2,008,091 435,823 - - Projects with Idaho Department of Public Works 8,274,055 1,897,555 - - Capital gifts from Foundation 1,268,424 1,636,408 - -
Total other revenues 11,550,570 3,969,786 - -
INCREASE (DECREASE) IN NET ASSETS 7,486,019 (13,035,426) 20,448,230 (14,962,118)
NET ASSETS - Beginning of year 372,800,409 385,835,835 108,924,187 123,886,305
NET ASSETS - End of year 380,286,428$ 372,800,409$ 129,372,417$ 108,924,187$
See notes to financial statements

15
STATEMENTS OF CASH FLOWSFOR THE YEARS ENDED JUNE 30, 2010 AND 2009
University ofIdaho2010
University of Idaho2009
CASH FLOWS FROM OPERATING ACTIVITIESCash Receipts and disbursements
Tuition and fees 68,282,261$ 60,456,013$ Grants and contracts 71,239,775 68,941,696 Sales of services - net 38,986,392 38,608,144 Payments to or for employees (209,187,018) (211,911,390) Payments to suppliers (86,461,209) (85,878,185) Scholarships disbursed (26,114,720) (22,068,009) Funds held for others (123,338) 78,836 Student loans collected 2,221,947 1,709,102 Student loans disbursed (1,795,882) (1,932,773) Other receipts 2,891,812 4,005,512
Net cash used by operating activities (140,059,980) (147,991,054)
CASH FLOWS FROM NONCAPITAL FINANCING ACTIVITIESAppropriated general education revenues: State general account 107,236,213 127,767,588 Land grant endowment income 6,164,400 5,307,300 Federal Appropriations 9,248,194 4,562,982 Federal Grants and Contracts 16,660,150 11,706,909 Gifts 14,839,365 15,846,369 Other receipts 747,229 524,164
Net cash provided by noncapital financing activities 154,895,551 165,715,312
CASH FLOWS FROM CAPITAL AND RELATED FINANCING ACTIVITIESState appropriations, capital 8,274,056 1,897,555 Capital grants and gifts 3,276,515 435,821 Capital asset purchases (44,523,333) (34,819,570) Proceeds from capital debt 42,173,495 - Principal paid on capital debt (25,477,550) (4,092,727) Interest paid on capital debt (4,879,886) (6,342,608)
Net cash used by capital & related financing activities (21,156,703) (42,921,529)
See notes to financial statements. Continued

16
STATEMENTS OF CASH FLOWSFOR THE YEARS ENDED JUNE 30, 2010 AND 2009
University ofIdaho2010
University of Idaho2009
CASH FLOWS FROM INVESTING ACTIVITIESProceeds from sales and maturities of investments 41,210,877 46,219,269 Investment income 2,939,116 6,982,020 Repurchase agreement - 33,649,058 Purchase of investments (22,276,866) (28,185,860)
Net cash provided by investing activities 21,873,127 58,664,487
NET INCREASE IN CASH 15,551,995 33,467,216 Cash - Beginning of year 41,838,941 8,371,725 Cash - End of year 57,390,936$ 41,838,941$
RECONCILIATION OF NET OPERATING REVENUES (EXPENSES)TO NET CASH USED BY OPERATING ACTIVITIES
Operating loss (162,346,445)$ (168,052,465)$ Adjustments to reconcile:
Depreciation expense 21,993,020 20,555,241 Noncash operating transactionsDecrease (increase) in assets:
Receivables, net (3,424,034) (374,881) Inventories and prepaids (405,801) (141,498) Deferred financing costs (515,930) 134,363
Increase (decrease) in liabilit ies:Accounts payable (1,705,970) (403,314) Accrued payroll, benefits and compensated absences 2,140,536 418,639 Current notes, bonds and accrued interest payable 1,134,540 (470,765) Deposits and deferred revenues 2,024,367 (64,476) Change in funds held for others (123,338) 78,837 Other liabilit ies 1,169,075 329,265
Net cash used by operating activities (140,059,980)$ (147,991,054)$
NONCASH TRANSACTIONSCapital asset write-offs 652,499$ 369,626$ Donated assets 1,268,424 1,636,408 Change in fair value of investments 180,583 1,048,850 Change in fair value of assets held in trust 5,437,879 (14,492,027) Proceeds from capital debt deposited to escrow 10,707,368 - Principal paid on capital debt through defeasance (10,415,000) -
See notes to financial statements
17
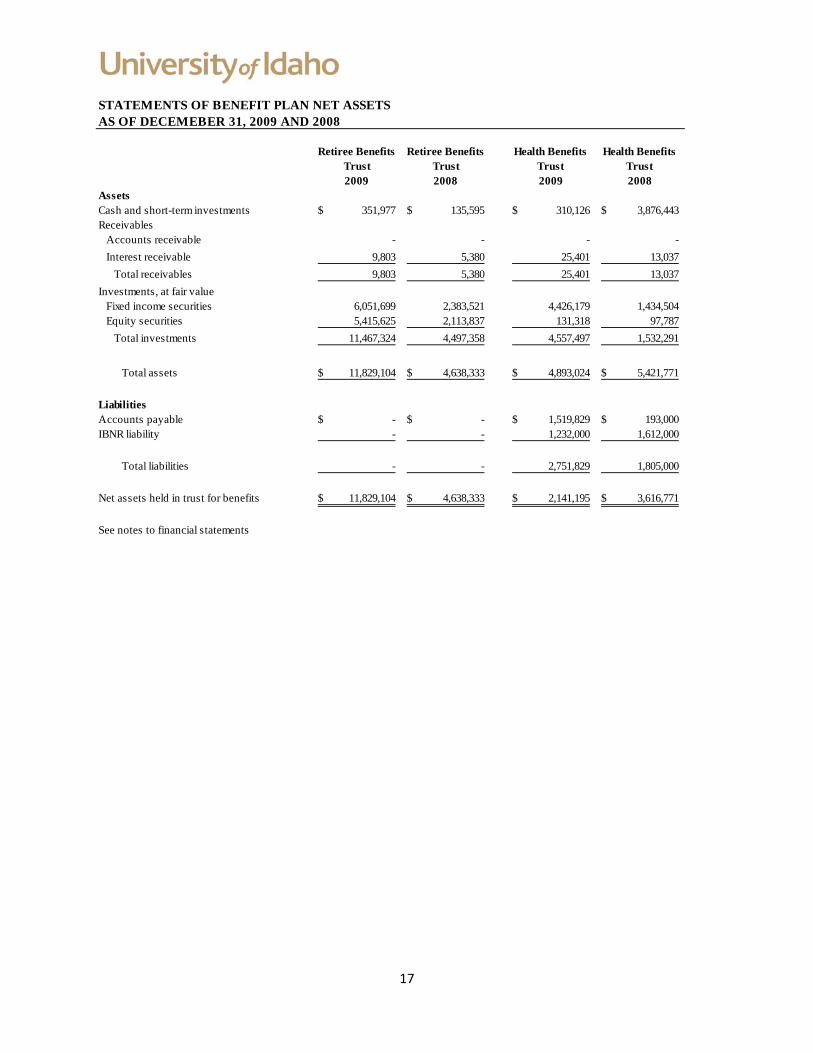
STATEMENTS OF BENEFIT PLAN NET ASSETSAS OF DECEMEBER 31, 2009 AND 2008
Retiree Benefits Trust
Retiree Benefits Trust
Health Benefits Trust
Health Benefits Trust
2009 2008 2009 2008AssetsCash and short-term investments 351,977$ 135,595$ 310,126$ 3,876,443$ Receivables Accounts receivable - - - - Interest receivable 9,803 5,380 25,401 13,037 Total receivables 9,803 5,380 25,401 13,037 Investments, at fair value Fixed income securities 6,051,699 2,383,521 4,426,179 1,434,504 Equity securities 5,415,625 2,113,837 131,318 97,787 Total investments 11,467,324 4,497,358 4,557,497 1,532,291
Total assets 11,829,104$ 4,638,333$ 4,893,024$ 5,421,771$
LiabilitiesAccounts payable -$ -$ 1,519,829$ 193,000$ IBNR liability - - 1,232,000 1,612,000
Total liabilities - - 2,751,829 1,805,000
Net assets held in trust for benefits 11,829,104$ 4,638,333$ 2,141,195$ 3,616,771$
See notes to financial statements
18
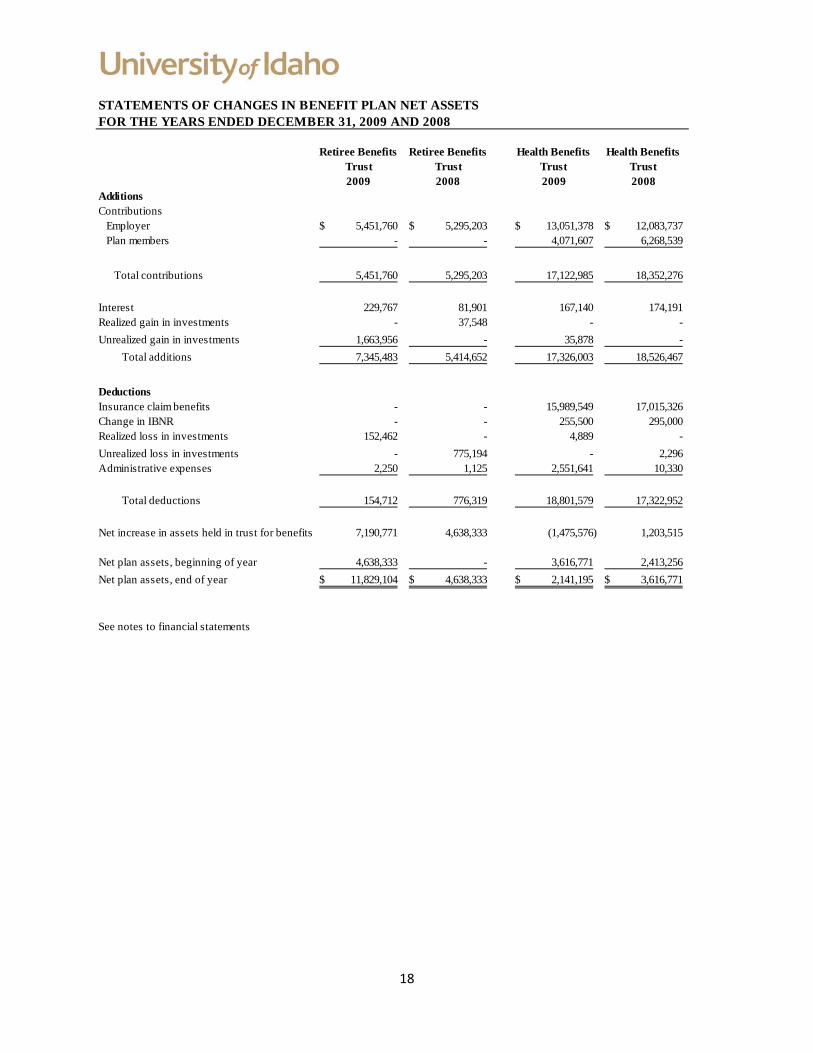
STATEMENTS OF CHANGES IN BENEFIT PLAN NET ASSETSFOR THE YEARS ENDED DECEMBER 31, 2009 AND 2008
Retiree Benefits Trust
Retiree Benefits Trust
Health Benefits Trust
Health Benefits Trust
2009 2008 2009 2008AdditionsContributions Employer 5,451,760$ 5,295,203$ 13,051,378$ 12,083,737$ Plan members - - 4,071,607 6,268,539
Total contributions 5,451,760 5,295,203 17,122,985 18,352,276
Interest 229,767 81,901 167,140 174,191 Realized gain in investments - 37,548 - - Unrealized gain in investments 1,663,956 - 35,878 - Total additions 7,345,483 5,414,652 17,326,003 18,526,467
DeductionsInsurance claim benefits - - 15,989,549 17,015,326 Change in IBNR - - 255,500 295,000 Realized loss in investments 152,462 - 4,889 - Unrealized loss in investments - 775,194 - 2,296 Administrative expenses 2,250 1,125 2,551,641 10,330
Total deductions 154,712 776,319 18,801,579 17,322,952
Net increase in assets held in trust for benefits 7,190,771 4,638,333 (1,475,576) 1,203,515
Net plan assets, beginning of year 4,638,333 - 3,616,771 2,413,256 Net plan assets, end of year 11,829,104$ 4,638,333$ 2,141,195$ 3,616,771$
See notes to financial statements
19
NOTES TO FINANCIAL STATEMENTS JUNE 30, 2010 AND 2009
1. SUMMARY OF SIGNIFICANT ACCOUNTING POLICIES
Reporting Entity—The University of Idaho (the “University”) is a publicly-supported comprehensive land grant institution created in 1889 by a statute of the 15th territorial legislature and is part of the public system of higher education in the State of Idaho. The system is considered part of the State of Idaho financial reporting entity. The State Board of Education, appointed by the Governor and confirmed by the State Senate, directs the University. The significant accounting policies followed by the University are described below to enhance the usefulness of the financial statements to the reader.
The University of Idaho Foundation, Inc. (the “Foundation”) is considered a component unit of the University as determined by GASB 39, Determining Whether Certain Organizations Are Component Units, an amendment of GASB Statement No.14, which requires reporting, as a component unit, an organization that raised and holds economic resources for the direct benefit of a governmental unit. The Foundation was established in 1970 to solicit financial support for the University of Idaho and to manage and invest the resulting charitable gifts. The Foundation is a separate 501(c)(3) corporation comprised of 25 members who serve as a self-perpetuating Board of Directors.
The Foundation receives all gifts to the University and transfers gifts to the donor specified area within the University on a regular schedule. In addition, it manages the endowment funds in a pooled investment fund, the Consolidated Investment Trust (“CIT”). Earnings from the endowment are transferred annually to the University. Some funds invested in the CIT are held in trust for the University and are shown as an asset and liability on the Foundation’s financial statements.
The Foundation also manages a number of split-interest agreements. These are contributions in the form of irrevocable charitable remainder trusts and charitable gift annuities. These gifts have been received from donors subject to obligations to pay stipulated amounts periodically to the donors or designated beneficiaries during their lifetimes or a period of years. These assets for which the Foundation serves as trustee are included in investments, and the present value of the estimated future payments to be made to the donors or other beneficiaries is included in the liabilities. The liabilities are adjusted during the term of the trusts for changes in the value of the assets, amortization of the discount, or the estimated life of the trust.
The University of Idaho Health Benefits Trust (“HBT”) was established in June, 2007 in accordance with the State of Idaho Department of Insurance (“DOI”) requirements. The HBT receives the employer, employee and retiree contributions for the University’s self-insured health plan, and pays the medical, dental, mental health and vision claims, and corresponding administrative processing fees, associated with the health plan. In addition, the HBT maintains a balance sufficient to cover the actuarially-determined incurred-but-not-paid (“IBNR”) claims of the health plan, as well as DOI-required supplemental funding of 30% of the actuarially determined IBNR claims. The HBT is overseen by a group of four independent Trustees who are employed by the University. The Trustees are responsible for overseeing the investment of the Trust monies, and ensuring that the University adequately funds the HBT on an ongoing basis through the aforementioned contributions to allow payment of the ongoing claims. The HBT proceeds are managed on behalf of the Trustees by U.S. Bank.
20
NOTES TO FINANCIAL STATEMENTS JUNE 30, 2010 AND 2009
The University of Idaho Retiree Benefits Trust (“RBT”) was established in April, 2008 to fund the University’s actuarially-determined projected liability for its self-insured retiree health plan. The RBT is overseen by University of Idaho Administration and the Trust proceeds are managed on behalf of the University by Wells Fargo Bank.
The HBT and RBT both have December 31 fiscal year ends. The difference in the fiscal year end from the University does not materially impact the net assets of the University.
Basis of Accounting—For financial statement purposes, the University is considered a special-purpose government engaged only in business-type activities. Accordingly, the University’s financial statements have been presented using the economic resources measurement focus and the accrual basis of accounting. Under the accrual basis, revenues are recognized when earned, and expenses are recorded when an obligation has been incurred. All significant intra-agency transactions have been eliminated. The University is presenting its financial statements in accordance with GASB Statement 34, Basic Financial Statements – and Management’s Discussion and Analysis – for State and Local Governments, and GASB Statement 35, Basic Financial Statements – and Management’s Discussion and Analysis – for Public Colleges and Universities, an amendment of GASB Statement No. 34.
The University has the option to apply all Financial Accounting Standards Board (“FASB”) pronouncements issued after November 30, 1989, unless those standards conflict or contradict with GASB pronouncements. The University has elected not to apply FASB pronouncements issued after the applicable date.
Cash and Cash Equivalents—The University considers all highly liquid investments with an original maturity of three months or less at the date of acquisition to be cash equivalents.
Student Loans Receivable—Loans receivable from students bear interest at rates ranging from 3% to 5% and are generally repayable in installments to the University over a 5- to 10-year period commencing 6 or 9 months from the date of separation from the University. Collections on these student loans are primarily handled through a third party servicer.
Accounts Receivable—Accounts receivable consists of tuition and fee charges to students and auxiliary enterprise services provided to students, faculty and staff. Accounts receivable also include amounts due from the federal government, state and local governments, or private sources, in connection with reimbursement of allowable expenditures made pursuant to the University’s grants and contracts. Accounts receivable are recorded net of estimated uncollectible amounts.
Inventories—All inventories are valued at the lower of first-in-first-out cost or market.
Investments—The University accounts for its investments at fair value in accordance with GASB Statement No. 31, Accounting and Financial Reporting for Certain Investments and for External Investment Pools. Changes in unrealized gain (loss) on the carrying value of investments are reported as a component of the net change in fair value of investments in the statement of revenues, expenses, and changes in net assets.
21
NOTES TO FINANCIAL STATEMENTS JUNE 30, 2010 AND 2009
Restricted Cash and Cash Equivalents—Cash and cash equivalents that are restricted to make debt service payments, maintain sinking or reserve funds, except for currently due payments, are classified as non-current assets in the statement of net assets.
Capital Assets—Capital Assets are stated at cost when purchased or constructed, or if acquired by gift, at the estimated fair value at the date of gift. For equipment, the University’s capitalization policy includes all tangible items with a unit cost of $5,000 or more and an estimated useful life of greater than one year. Renovations to buildings, and land improvements that significantly increase the value or extend the useful life of the structure, are capitalized. Routine repairs and maintenance are charged to operating expense in the period in which the expense was incurred. Depreciation is computed using the straight-line, composite method over the estimated useful lives of the assets, generally 40 years for buildings, 20 years for improvements other than buildings, 10 years for library materials and an average of 7 years for equipment. Depreciation is not computed on capitalized collections which include works of art, historical treasures, and various special collections comprising of anthropological, geological, entomological, musical, and wildlife subjects.
In fiscal year 2010, in accordance with the requirements and definitions of GASB No. 51, Accounting and Financial Reporting for Intangible Assets, the University adopted a policy of capitalizing any intangible assets $200,000 or greater in value that have an expected useful life of three years or longer. Depreciation on intangible assets is computed using the straight-line, composite method over the estimated useful lives of the assets, primarily consisting of computer software and licenses that generally have a useful life of 5 years. The University adopted this policy in compliance with the State of Idaho guidelines related to the requirements of implementation for GASB No. 51.
Compensated Absences—Employee vacation and compensatory time pay is accrued at year-end for financial statement purposes. Compensated absence costs are included in benefits expense in the statement of revenues, expenses, and changes in net assets.
Waivers—Tuition waivers, provided directly by the University for faculty and staff benefits, amounted to $629,496 and $646,240 for the fiscal years ended 2010 and 2009, respectively.
Deferred Revenue—Deferred revenue includes amounts received for tuition and fees and certain auxiliary activities prior to the end of the fiscal year but related to the subsequent accounting period. Deferred revenue also includes amounts received from grant and contract sponsors that have not yet been earned.
Noncurrent Liabilities—Noncurrent liabilities primarily include (1) principal amounts of revenue bonds payable, and notes payable with contractual maturities greater than one year; and (2) estimated amounts for other liabilities that will not be paid within the next fiscal year.
22
NOTES TO FINANCIAL STATEMENTS JUNE 30, 2010 AND 2009
Net Assets—The University’s net assets are classified as follows:
Invested In Capital Assets—Net of Related Debt—This represents the University’s investment in capital assets, net of depreciation and outstanding debt obligations related to those capital assets. To the extent debt has been incurred but not yet expended for capital assets, such amounts are not included as a component of invested in capital assets, net of related debt.
Restricted—Nonexpendable—Nonexpendable restricted net assets consist of endowment and similar type funds in which donors or other outside sources have stipulated, as a condition of the gift instrument, that the principal is to be maintained inviolate and in perpetuity, and invested for the purpose of producing present and future income, which may either be expended or added to principal.
Restricted—Expendable—Restricted expendable net assets include resources for which the University is legally or contractually obligated to spend resources in accordance with restrictions imposed by external third parties.
Unrestricted—Unrestricted net assets represent resources derived from student tuition and fees, state appropriations, investment income, and sales and services of educational departments and auxiliary enterprises. These resources are used for transactions relating to the educational and general operations of the University, and may be used at the discretion of the governing board for any lawful purpose. These resources also include auxiliary enterprises, which are substantially self-supporting activities that provide services for students, faculty and staff. When an expense is incurred that can be paid using either restricted or unrestricted resources, the University’s policy is to first apply the expense towards restricted resources, and then toward unrestricted resources.
Income Taxes—The University is excluded from federal income taxes under Section 115(1) of the Internal Revenue Code, per letter dated November 7, 1945. The University is also considered a Section 501(c)(3) corporation via letter from the Internal Revenue Service dated August 29, 1961. The University is subject to unrelated business income tax.
Classification of Revenues—The University has classified its revenues as either operating or nonoperating according to the following criteria:
Operating Revenues—Operating revenues include revenues from activities that have the characteristics of exchange transactions, such as (1) student tuition and fees, net of scholarship discounts and allowances, (2) sales and services of auxiliary enterprises, (3) most federal, state and local grants and contracts, and (4) interest on institutional student loans.
Nonoperating Revenues - Nonoperating revenues include revenues from activities that have the characteristics of nonexchange transactions, such as gifts and contributions, and other revenue sources that are defined as nonoperating revenues by GASB Statement No. 9, Reporting Cash Flows of Proprietary and Nonexpendable Trust Funds and Governmental Entities That Use Proprietary Fund Accounting, and GASB Statement No. 34, such as state appropriations and investment income.
23
NOTES TO FINANCIAL STATEMENTS JUNE 30, 2010 AND 2009
Scholarship Discounts and Allowances—Student tuition and fee revenues, and certain other revenues from students, are reported net of scholarship discounts and allowances in the Statement of Revenues, Expenses, and Changes in Net Assets. Scholarship discounts and allowances are the difference between the stated charge for goods and services provided by the University, and the amount that is paid by students and/or third parties making payments on the students’ behalf. Certain governmental grants, such as Pell grants, and other federal, state or nongovernmental programs, are recorded as either operating or nonoperating revenues in the University’s financial statements. To the extent that revenues from such programs are used to satisfy tuition and fees and other student charges, the University has recorded a scholarship discount and allowance. Scholarship allowances for FY2010 and FY2009 are $14,035,710 and $11,449,679 respectively.
Use of Estimates—The preparation of financial statements in conformity with accounting principles generally accepted in the United States of America requires management to make estimates and assumptions that affect the reported amounts of assets, liabilities, net assets and disclosures regarding contingent assets and liabilities. Actual results could differ from those estimates.
New Accounting Standards— In June 2007, the GASB issued Statement No. 51, Accounting and Financial Reporting for Intangible Assets. This Statement requires that all identifiable intangible assets, not specifically excluded by the Statement, be recorded as capital assets. These intangible assets will be included in the net assets of the University. The implementation of this Statement is effective for fiscal years beginning after June 15, 2009. During fiscal year 2010, the University conducted an evaluation of its identifiable intangible assets and identified two specific assets acquired in previous fiscal years that would require recording on its financial statements under the implementation of GASB Statement No. 51. As a result, the University recorded $1,165,600 of intangible assets and $1,045,480 of related accumulated depreciation in its financial records. These assets and related accumulated depreciation are included in the furniture and equipment category identified in the June 30, 2010 property, plant and equipment schedule in Footnote 6 of these financial statements. Although these assets were acquired in fiscal years previous to 2010, the University elected not to restate prior years’ financial statements due to the immaterial amount of these specific assets.

24
NOTES TO FINANCIAL STATEMENTS JUNE 30, 2010 AND 2009
2. CASH AND CASH EQUIVALENTS
Cash and cash equivalents are deposited with various financial institutions. Custodial credit risk on deposits is the risk that in the event of a bank failure, the University's deposits may not be returned to it. At June 30, 2010, $607,867 of the University's bank balance of $57,390,936 was exposed to custodial credit risk because it was uninsured and uncollateralized. At June 30, 2009, $925,048 of the University's bank balance of $41,838,941 was exposed to custodial credit risk because it was uninsured and uncollateralized.
3. INVESTMENTS
The general investment policy of the University as adopted by the State Board of Education is that investments in securities are to be made with the objectives of maximizing long-term total return, ensuring safety of principal, and providing satisfactory current income. Investment of cash shall be restricted to:
• FDIC passbook savings accounts. • Certificates of deposit. • U.S. securities. • Federal funds repurchase agreements. • Reverse repurchase agreements. • Federal agency securities. • Large money market funds. • Banker’s acceptances. • Corporate bonds of Aa grade or better. • Mortgage backed securities of Aa grade or better. • Commercial paper of prime or equivalent grade.
In accordance with established investment policy, the University may invest in various mortgage-backed securities, such as collateralized mortgage obligations. These securities are recorded at fair value in the statement of net assets. Investment income, including change in fair value of investments, is recognized as revenue in the statement of revenues, expenses and changes in net assets.
The following table represents the fair value of investments by type at June 30, 2010 and June 30, 2009 respectively:
2010 Fair Value
2009 Fair Value
Corporate debt securities and preferred stock 1,689,565$ 6,601,147$ U.S. government or government guaranteed securities 36,103,195 49,955,179 Mutual funds 391,150 381,077
38,183,910$ 56,937,403$
25
NOTES TO FINANCIAL STATEMENTS JUNE 30, 2010 AND 2009
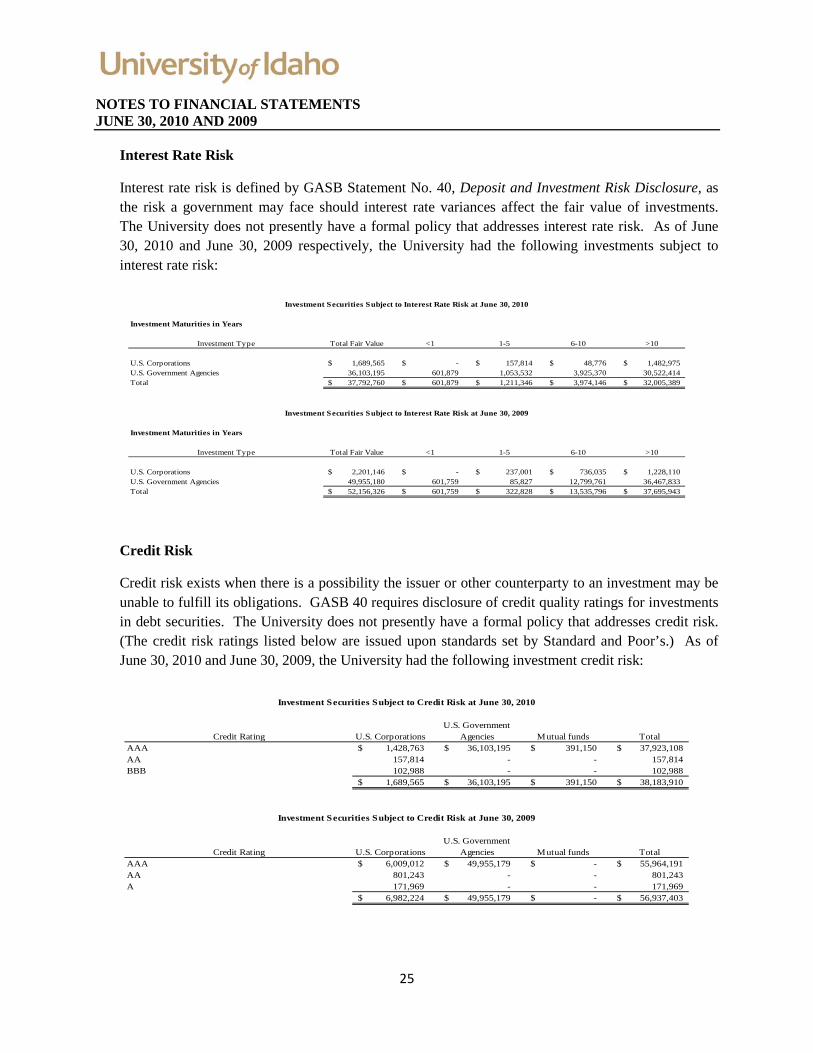
Interest Rate Risk
Interest rate risk is defined by GASB Statement No. 40, Deposit and Investment Risk Disclosure, as the risk a government may face should interest rate variances affect the fair value of investments. The University does not presently have a formal policy that addresses interest rate risk. As of June 30, 2010 and June 30, 2009 respectively, the University had the following investments subject to interest rate risk:
Investment Securities Subject to Interest Rate Risk at June 30, 2010
Investment Maturities in Years
Investment Type Total Fair Value <1 1-5 6-10 >10
U.S. Corporations 1,689,565$ -$ 157,814$ 48,776$ 1,482,975$ U.S. Government Agencies 36,103,195 601,879 1,053,532 3,925,370 30,522,414 Total 37,792,760$ 601,879$ 1,211,346$ 3,974,146$ 32,005,389$
Investment Securities Subject to Interest Rate Risk at June 30, 2009
Investment Maturities in Years
Investment Type Total Fair Value <1 1-5 6-10 >10
U.S. Corporations 2,201,146$ -$ 237,001$ 736,035$ 1,228,110$ U.S. Government Agencies 49,955,180 601,759 85,827 12,799,761 36,467,833 Total 52,156,326$ 601,759$ 322,828$ 13,535,796$ 37,695,943$
Credit Risk
Credit risk exists when there is a possibility the issuer or other counterparty to an investment may be unable to fulfill its obligations. GASB 40 requires disclosure of credit quality ratings for investments in debt securities. The University does not presently have a formal policy that addresses credit risk. (The credit risk ratings listed below are issued upon standards set by Standard and Poor’s.) As of June 30, 2010 and June 30, 2009, the University had the following investment credit risk:
Investment Securities Subject to Credit Risk at June 30, 2010
Credit Rating U.S. CorporationsU.S. Government
Agencies Mutual funds TotalAAA 1,428,763$ 36,103,195$ 391,150$ 37,923,108$ AA 157,814 - - 157,814 BBB 102,988 - - 102,988
1,689,565$ 36,103,195$ 391,150$ 38,183,910$
Investment Securities Subject to Credit Risk at June 30, 2009
Credit Rating U.S. CorporationsU.S. Government
Agencies Mutual funds TotalAAA 6,009,012$ 49,955,179$ -$ 55,964,191$ AA 801,243 - - 801,243 A 171,969 - - 171,969
6,982,224$ 49,955,179$ -$ 56,937,403$

26
NOTES TO FINANCIAL STATEMENTS JUNE 30, 2010 AND 2009
Concentration of Credit Risk
Per GASB Statement No. 40, Concentration of Credit Risk is defined as the risk of loss attributed to the magnitude of a government’s investment in a single issuer. The Governmental Accounting Standards Board has adopted a principle that governments should provide note disclosure when 5 percent of investments are concentrated in any one issuer. The University does not presently have a formal policy that addresses concentration of risk. The University did not have any investments at June 30, 2010 that represented a 5 percent or greater concentration in any one issuer. At June 30, 2009, the University had investments that represented a 5 percent or greater concentration in any one issuer as follows:
Investment Securities Subject to Concentration of Credit Risk at June 30, 2009
Issuer: Fair Value% of Total Investments
Pimco Corp (AAA) 3,800,000$ 6.67%Various securities (no single issuer) not exceeding 5% of total 53,137,403 93.33%Total 56,937,403$ 100.00%
Custodial Credit Risk
Custodial credit risk on investments is the risk that in the event of a failure of the counterparty, the University will not be able to recover the value of its investments that are in the possession of an outside party. The University does not have an investment policy for custodial credit risk. At June 30, 2010 all investments were held by the University or its counterparty in the University’s name.

27
NOTES TO FINANCIAL STATEMENTS JUNE 30, 2010 AND 2009
4. ACCOUNTS RECEIVABLE AND UNBILLED CHARGES
Receivables and unbilled charges consisted of the following at June 30, 2010 and June 30, 2009, respectively:
2010 2009
Student tuition and fees 3,173,907$ 2,995,758$ Auxiliary enterprises 2,139,546 1,833,097 Educational activities 1,462,382 1,060,882 Federal appropriations 16,839 3,452 Federal financial aid funds 119,544 132,348 Grants and contracts 12,534,803 9,639,932 Due from Foundation 6,332,939 7,044,168
25,779,960$ 22,709,637$ Less allowance for doubtful accounts (403,600) (495,800)
Net accounts receivable and unbilled charges 25,376,360$ 22,213,837$
5. STUDENT LOANS RECEIVABLE
Student loans made through the Federal Perkins Loan Program (the “Program”) comprise substantially all of the loans receivable at June 30, 2010 and June 30, 2009. Under this Program, the federal government provides approximately 67% of the funding for the Program with the University providing the balance. The Program provides for the cancellation of a loan at rates of 12.5% to 30% per year up to a maximum of 100% if the participant complies with certain provisions. The federal government reimburses the University for amounts cancelled under these provisions.
As the University determines that loans are uncollectible and not eligible for reimbursement by the federal government, the loans are written off and assigned to the U.S. Department of Education. The allowance for uncollectible loans was $1,499,868 for June 30, 2010 and $1,406,441 at June 30, 2009.
28
NOTES TO FINANCIAL STATEMENTS JUNE 30, 2010 AND 2009
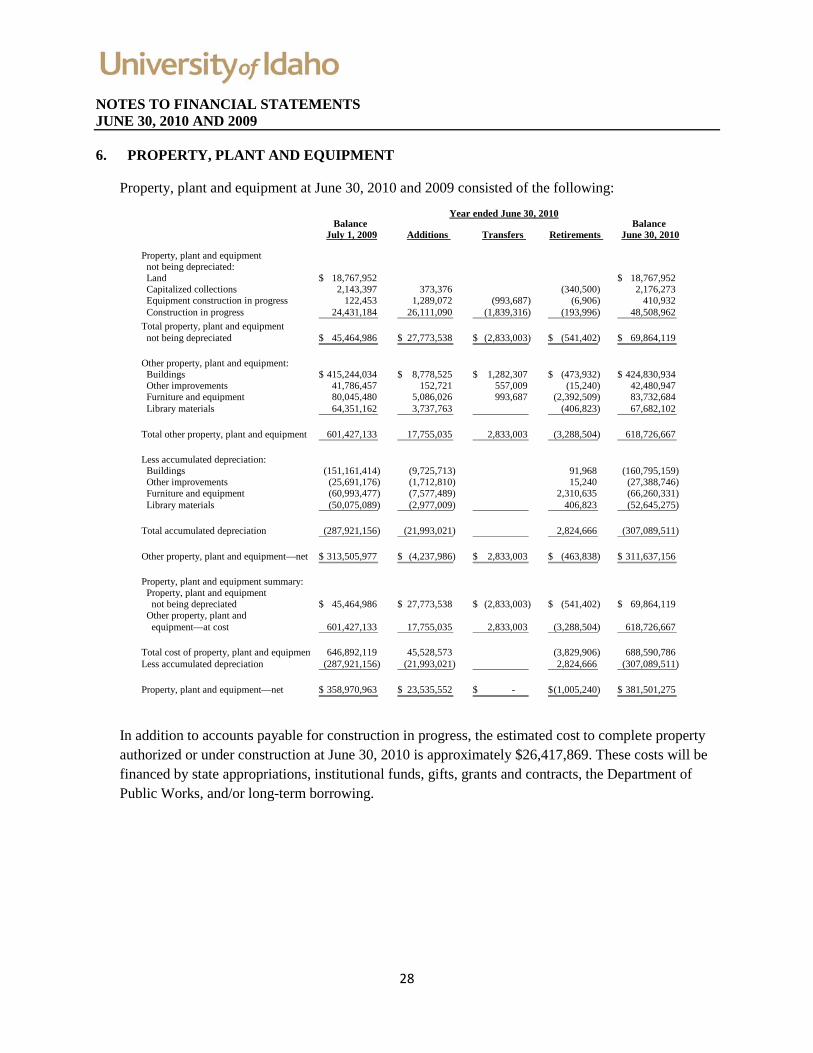
6. PROPERTY, PLANT AND EQUIPMENT
Property, plant and equipment at June 30, 2010 and 2009 consisted of the following:
Year ended June 30, 2010Balance Balance
July 1, 2009 Additions Transfers Retirements June 30, 2010
Property, plant and equipment not being depreciated: Land 18,767,952$ 18,767,952$ Capitalized collections 2,143,397 373,376 (340,500) 2,176,273 Equipment construction in progress 122,453 1,289,072 (993,687) (6,906) 410,932 Construction in progress 24,431,184 26,111,090 (1,839,316) (193,996) 48,508,962 Total property, plant and equipment not being depreciated 45,464,986$ 27,773,538$ (2,833,003)$ (541,402)$ 69,864,119$
Other property, plant and equipment: Buildings 415,244,034$ 8,778,525$ 1,282,307$ (473,932)$ 424,830,934$ Other improvements 41,786,457 152,721 557,009 (15,240) 42,480,947 Furniture and equipment 80,045,480 5,086,026 993,687 (2,392,509) 83,732,684 Library materials 64,351,162 3,737,763 (406,823) 67,682,102
Total other property, plant and equipment 601,427,133 17,755,035 2,833,003 (3,288,504) 618,726,667
Less accumulated depreciation: Buildings (151,161,414) (9,725,713) 91,968 (160,795,159) Other improvements (25,691,176) (1,712,810) 15,240 (27,388,746) Furniture and equipment (60,993,477) (7,577,489) 2,310,635 (66,260,331) Library materials (50,075,089) (2,977,009) 406,823 (52,645,275)
Total accumulated depreciation (287,921,156) (21,993,021) 2,824,666 (307,089,511)
Other property, plant and equipment—net 313,505,977$ (4,237,986)$ 2,833,003$ (463,838)$ 311,637,156$
Property, plant and equipment summary: Property, plant and equipment not being depreciated 45,464,986$ 27,773,538$ (2,833,003)$ (541,402)$ 69,864,119$ Other property, plant and equipment—at cost 601,427,133 17,755,035 2,833,003 (3,288,504) 618,726,667
Total cost of property, plant and equipment 646,892,119 45,528,573 (3,829,906) 688,590,786 Less accumulated depreciation (287,921,156) (21,993,021) 2,824,666 (307,089,511)
Property, plant and equipment—net 358,970,963$ 23,535,552$ - $ (1,005,240)$ 381,501,275$
In addition to accounts payable for construction in progress, the estimated cost to complete property authorized or under construction at June 30, 2010 is approximately $26,417,869. These costs will be financed by state appropriations, institutional funds, gifts, grants and contracts, the Department of Public Works, and/or long-term borrowing.
29
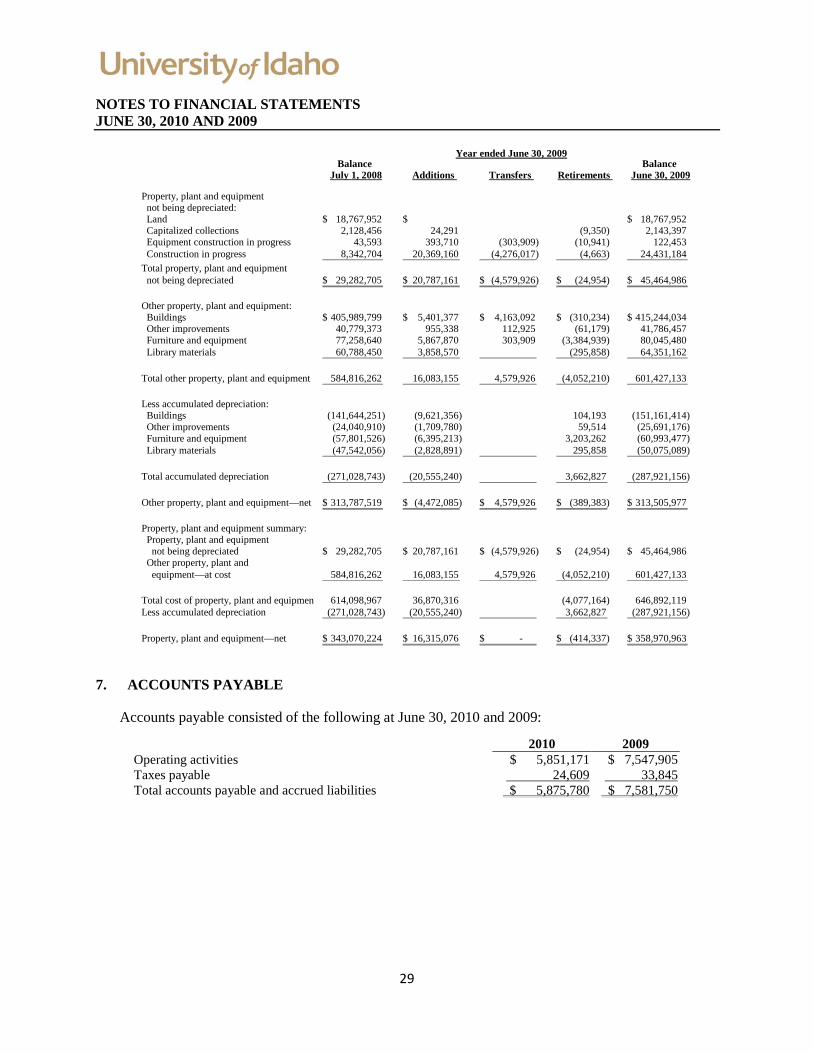
NOTES TO FINANCIAL STATEMENTS JUNE 30, 2010 AND 2009
Year ended June 30, 2009Balance Balance
July 1, 2008 Additions Transfers Retirements June 30, 2009
Property, plant and equipment not being depreciated: Land 18,767,952$ $ 18,767,952$ Capitalized collections 2,128,456 24,291 (9,350) 2,143,397 Equipment construction in progress 43,593 393,710 (303,909) (10,941) 122,453 Construction in progress 8,342,704 20,369,160 (4,276,017) (4,663) 24,431,184 Total property, plant and equipment not being depreciated 29,282,705$ 20,787,161$ (4,579,926)$ (24,954)$ 45,464,986$
Other property, plant and equipment: Buildings 405,989,799$ 5,401,377$ 4,163,092$ (310,234)$ 415,244,034$ Other improvements 40,779,373 955,338 112,925 (61,179) 41,786,457 Furniture and equipment 77,258,640 5,867,870 303,909 (3,384,939) 80,045,480 Library materials 60,788,450 3,858,570 (295,858) 64,351,162
Total other property, plant and equipment 584,816,262 16,083,155 4,579,926 (4,052,210) 601,427,133
Less accumulated depreciation: Buildings (141,644,251) (9,621,356) 104,193 (151,161,414) Other improvements (24,040,910) (1,709,780) 59,514 (25,691,176) Furniture and equipment (57,801,526) (6,395,213) 3,203,262 (60,993,477) Library materials (47,542,056) (2,828,891) 295,858 (50,075,089)
Total accumulated depreciation (271,028,743) (20,555,240) 3,662,827 (287,921,156)
Other property, plant and equipment—net 313,787,519$ (4,472,085)$ 4,579,926$ (389,383)$ 313,505,977$
Property, plant and equipment summary: Property, plant and equipment not being depreciated 29,282,705$ 20,787,161$ (4,579,926)$ (24,954)$ 45,464,986$ Other property, plant and equipment—at cost 584,816,262 16,083,155 4,579,926 (4,052,210) 601,427,133
Total cost of property, plant and equipment 614,098,967 36,870,316 (4,077,164) 646,892,119 Less accumulated depreciation (271,028,743) (20,555,240) 3,662,827 (287,921,156)
Property, plant and equipment—net 343,070,224$ 16,315,076$ - $ (414,337)$ 358,970,963$
7. ACCOUNTS PAYABLE
Accounts payable consisted of the following at June 30, 2010 and 2009:
2010 2009 Operating activities $ 5,851,171 $ 7,547,905 Taxes payable 24,609 33,845 Total accounts payable and accrued liabilities $ 5,875,780 $ 7,581,750
30
NOTES TO FINANCIAL STATEMENTS JUNE 30, 2010 AND 2009
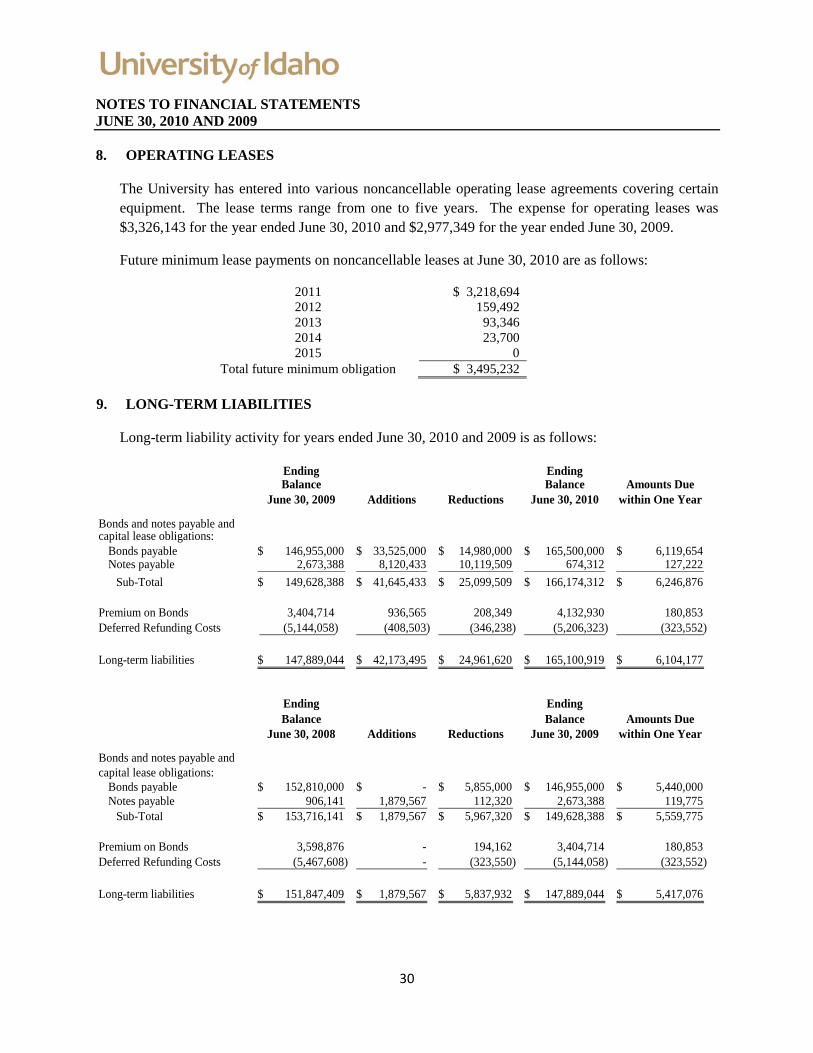
8. OPERATING LEASES
The University has entered into various noncancellable operating lease agreements covering certain equipment. The lease terms range from one to five years. The expense for operating leases was $3,326,143 for the year ended June 30, 2010 and $2,977,349 for the year ended June 30, 2009.
Future minimum lease payments on noncancellable leases at June 30, 2010 are as follows:
2011 $ 3,218,694 2012 159,492 2013 93,346 2014 23,700 2015 0
Total future minimum obligation $ 3,495,232 9. LONG-TERM LIABILITIES
Long-term liability activity for years ended June 30, 2010 and 2009 is as follows:
Ending EndingBalance Balance Amounts Due
June 30, 2009 Additions Reductions June 30, 2010 within One Year
Bonds and notes payable andcapital lease obligations:
Bonds payable 146,955,000$ 33,525,000$ 14,980,000$ 165,500,000$ 6,119,654$ Notes payable 2,673,388 8,120,433 10,119,509 674,312 127,222
Sub-Total 149,628,388$ 41,645,433$ 25,099,509$ 166,174,312$ 6,246,876$
Premium on Bonds 3,404,714 936,565 208,349 4,132,930 180,853 Deferred Refunding Costs (5,144,058) (408,503) (346,238) (5,206,323) (323,552)
Long-term liabilities 147,889,044$ 42,173,495$ 24,961,620$ 165,100,919$ 6,104,177$
Ending EndingBalance Balance Amounts Due
June 30, 2008 Additions Reductions June 30, 2009 within One Year
Bonds and notes payable andcapital lease obligations:
Bonds payable 152,810,000$ -$ 5,855,000$ 146,955,000$ 5,440,000$ Notes payable 906,141 1,879,567 112,320 2,673,388 119,775
Sub-Total 153,716,141$ 1,879,567$ 5,967,320$ 149,628,388$ 5,559,775$
Premium on Bonds 3,598,876 - 194,162 3,404,714 180,853 Deferred Refunding Costs (5,467,608) - (323,550) (5,144,058) (323,552)
Long-term liabilities 151,847,409$ 1,879,567$ 5,837,932$ 147,889,044$ 5,417,076$
31
NOTES TO FINANCIAL STATEMENTS JUNE 30, 2010 AND 2009
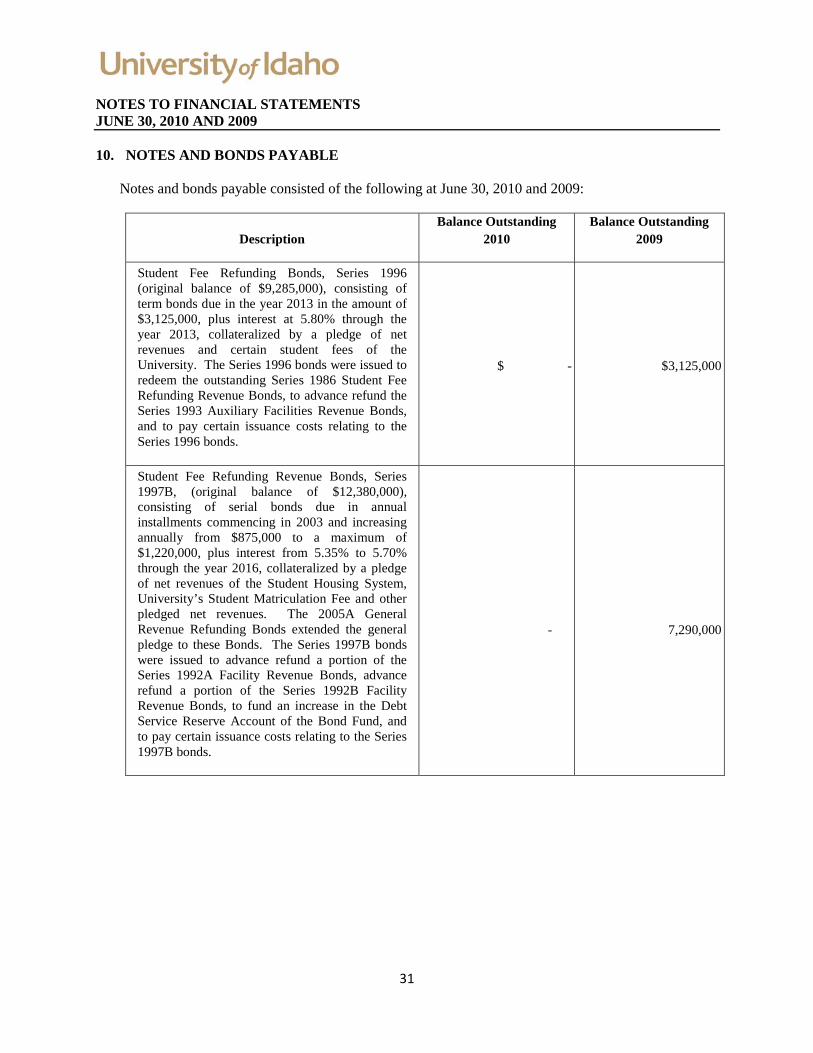
10. NOTES AND BONDS PAYABLE
Notes and bonds payable consisted of the following at June 30, 2010 and 2009:
Description Balance Outstanding
2010 Balance Outstanding
2009
Student Fee Refunding Bonds, Series 1996 (original balance of $9,285,000), consisting of term bonds due in the year 2013 in the amount of $3,125,000, plus interest at 5.80% through the year 2013, collateralized by a pledge of net revenues and certain student fees of the University. The Series 1996 bonds were issued to redeem the outstanding Series 1986 Student Fee Refunding Revenue Bonds, to advance refund the Series 1993 Auxiliary Facilities Revenue Bonds, and to pay certain issuance costs relating to the Series 1996 bonds.
$ -
$3,125,000
Student Fee Refunding Revenue Bonds, Series 1997B, (original balance of $12,380,000), consisting of serial bonds due in annual installments commencing in 2003 and increasing annually from $875,000 to a maximum of $1,220,000, plus interest from 5.35% to 5.70% through the year 2016, collateralized by a pledge of net revenues of the Student Housing System, University’s Student Matriculation Fee and other pledged net revenues. The 2005A General Revenue Refunding Bonds extended the general pledge to these Bonds. The Series 1997B bonds were issued to advance refund a portion of the Series 1992A Facility Revenue Bonds, advance refund a portion of the Series 1992B Facility Revenue Bonds, to fund an increase in the Debt Service Reserve Account of the Bond Fund, and to pay certain issuance costs relating to the Series 1997B bonds.
-
7,290,000

32
NOTES TO FINANCIAL STATEMENTS JUNE 30, 2010 AND 2009
Description Balance Outstanding
2010 Balance Outstanding
2009
Student Fee Revenue Bonds, Series 2001, (original balance of $40,930,000), consisting of serial bonds due in annual installments commencing in 2005 and increasing periodically from $435,000 to a maximum of $16,970,000, plus interest from 4.00% to 5.40% through the year 2041, collateralized initially by a pledge of net revenues of the University’s Student Matriculation Fee. 2005A General Revenue Refunding Bonds extended the general pledge to these Bonds. A portion of these bonds are considered extinguished through defeasance by the 2007A General Revenue Refunding Bonds. The defeased amount was $38,035,000 and the University’s remaining annual installments range from $435,000 to a maximum of $620,000, plus interest from 4.000% to 4.125%. The Series 2001 bonds were issued to provide funds to finance the cost of acquisition and construction of student housing improvements, to renovate the University’s athletic center, to acquire and construct a special math learning center (the “POLYA” project), to make the required deposit to the Debt Service Reserve Account of the Bond Fund, to pay bond issuance expenses, and to pay the capitalized interest on a portion of the Series 2001 bonds.
620,000
1,055,000
33
NOTES TO FINANCIAL STATEMENTS JUNE 30, 2010 AND 2009
Description Balance Outstanding
2010 Balance Outstanding
2009
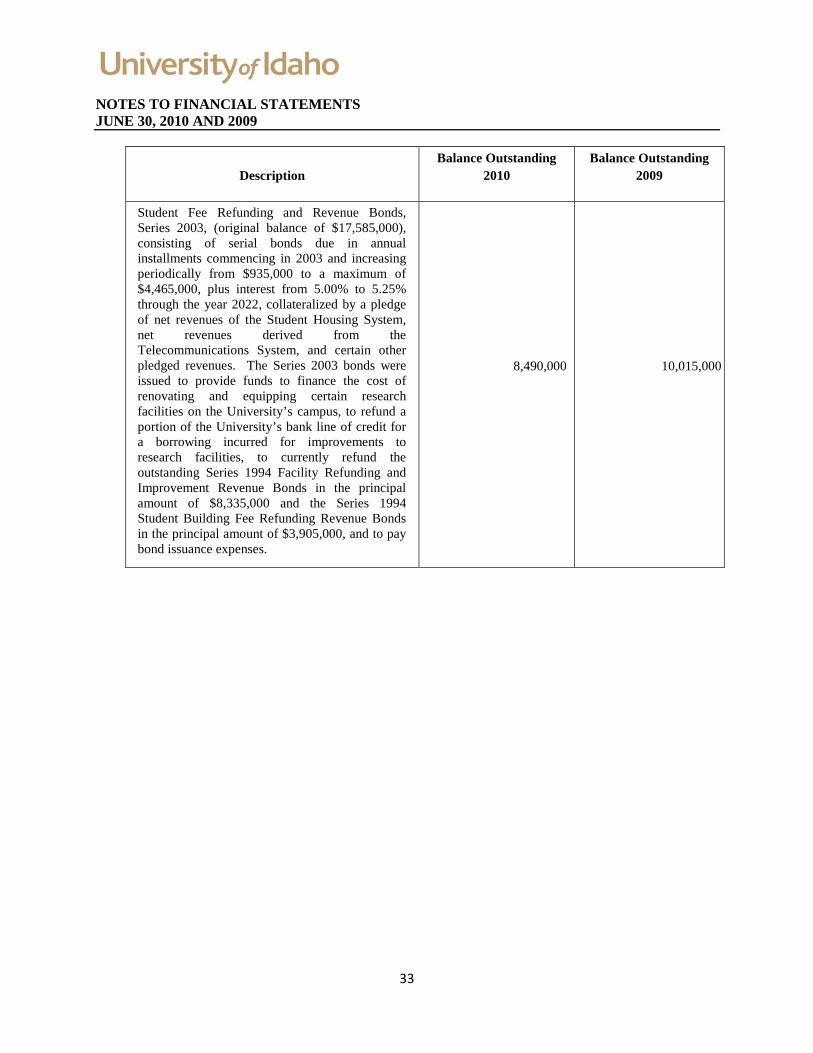
Student Fee Refunding and Revenue Bonds, Series 2003, (original balance of $17,585,000), consisting of serial bonds due in annual installments commencing in 2003 and increasing periodically from $935,000 to a maximum of $4,465,000, plus interest from 5.00% to 5.25% through the year 2022, collateralized by a pledge of net revenues of the Student Housing System, net revenues derived from the Telecommunications System, and certain other pledged revenues. The Series 2003 bonds were issued to provide funds to finance the cost of renovating and equipping certain research facilities on the University’s campus, to refund a portion of the University’s bank line of credit for a borrowing incurred for improvements to research facilities, to currently refund the outstanding Series 1994 Facility Refunding and Improvement Revenue Bonds in the principal amount of $8,335,000 and the Series 1994 Student Building Fee Refunding Revenue Bonds in the principal amount of $3,905,000, and to pay bond issuance expenses.
8,490,000
10,015,000
34
NOTES TO FINANCIAL STATEMENTS JUNE 30, 2010 AND 2009
Description Balance Outstanding
2010 Balance Outstanding
2009
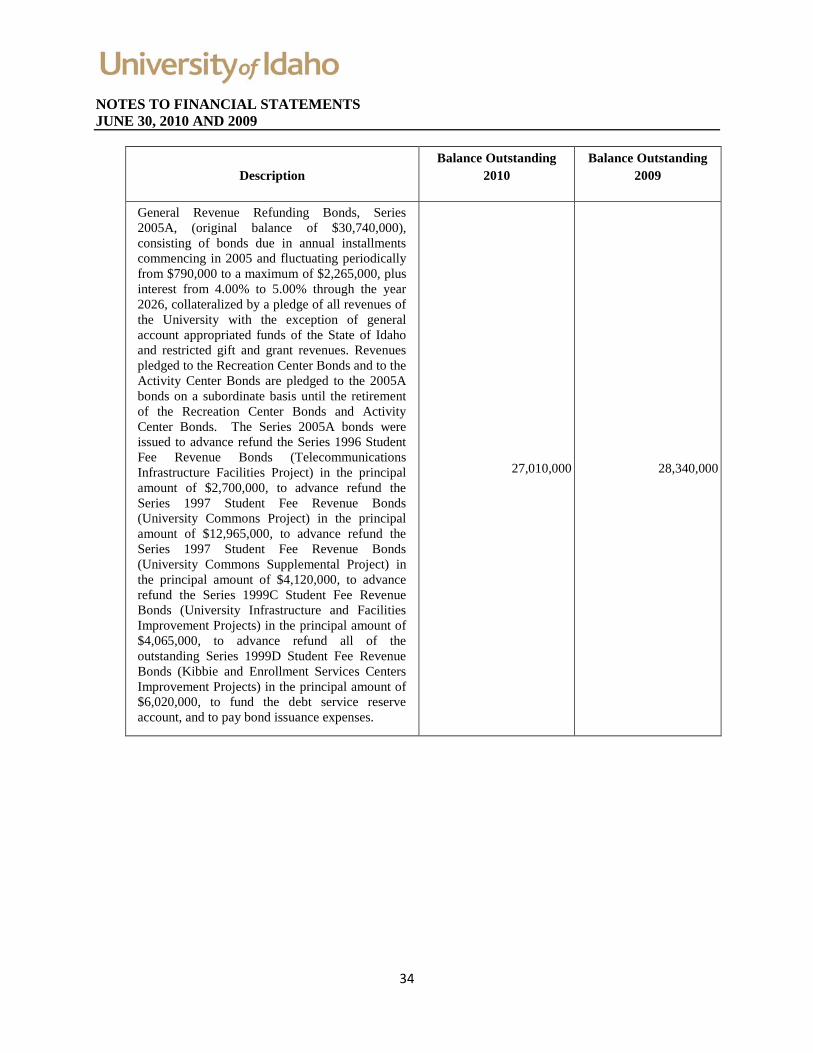
General Revenue Refunding Bonds, Series 2005A, (original balance of $30,740,000), consisting of bonds due in annual installments commencing in 2005 and fluctuating periodically from $790,000 to a maximum of $2,265,000, plus interest from 4.00% to 5.00% through the year 2026, collateralized by a pledge of all revenues of the University with the exception of general account appropriated funds of the State of Idaho and restricted gift and grant revenues. Revenues pledged to the Recreation Center Bonds and to the Activity Center Bonds are pledged to the 2005A bonds on a subordinate basis until the retirement of the Recreation Center Bonds and Activity Center Bonds. The Series 2005A bonds were issued to advance refund the Series 1996 Student Fee Revenue Bonds (Telecommunications Infrastructure Facilities Project) in the principal amount of $2,700,000, to advance refund the Series 1997 Student Fee Revenue Bonds (University Commons Project) in the principal amount of $12,965,000, to advance refund the Series 1997 Student Fee Revenue Bonds (University Commons Supplemental Project) in the principal amount of $4,120,000, to advance refund the Series 1999C Student Fee Revenue Bonds (University Infrastructure and Facilities Improvement Projects) in the principal amount of $4,065,000, to advance refund all of the outstanding Series 1999D Student Fee Revenue Bonds (Kibbie and Enrollment Services Centers Improvement Projects) in the principal amount of $6,020,000, to fund the debt service reserve account, and to pay bond issuance expenses.
27,010,000
28,340,000

35
NOTES TO FINANCIAL STATEMENTS JUNE 30, 2010 AND 2009
Description Balance Outstanding
2010 Balance Outstanding
2009
General Revenue Refunding Bonds, Series 2007A, (original balance of $62,445,000), consisting of bonds due in annual installments, commencing in 2009 and fluctuating periodically from $300,000 to a maximum of $59,500,000 plus interest from 3.250% to 4.375% through the year 2041, collateralized by a pledge of all revenues of the University with the exception of general account appropriated funds of the State of Idaho and restricted gift and grant revenues. Revenues pledged to the Activity Center Bonds are pledged to the 2007A Bonds on a subordinate basis until the retirement of the Recreation Center Bonds and the Activity Center Bonds. The Series 2007A bonds were issued to advance refund a portion of the Series 1999 Student Fee Revenue Bonds (Recreation Center Project) in the principal amount of $16,135,000, to advance refund the Series 1999A Student Fee Revenue Bonds in the principal amount of $1,175,000, to advance refund the Series 1999B Student Fee Revenue Bonds (Sweet Avenue and University Campus Improvement Project) in the principal amount of $4,970,000, and to advance refund the Series 2001 Student Fee Revenue Bonds (University Housing Improvement Projects) in the principal amount of $38,035,000.
60,820,000
62,095,000
General Revenue Bonds, Series 2007B, (original balance of $35,035,000), consisting of bonds due in annual installments, commencing in 2015 and fluctuating periodically from $200,000 to a maximum of $34,235,000 plus interest from 4.25% to 4.50% through the year 2041, collateralized by a pledge of all revenues of the University with the exception of general account appropriated funds of the State of Idaho and restricted gift and grant revenues. The Series 2007B bonds were issued to finance certain electrical upgrades and to fund capital maintenance and replacement of the University’s utility corridor, central steam plant and central chiller, and related improvements located on the University’s main campus.
35,035,000
35,035,000

36
NOTES TO FINANCIAL STATEMENTS JUNE 30, 2010 AND 2009
Description Balance Outstanding
2010 Balance Outstanding
2009
General Revenue Refunding Bonds, Series 2010A, (original balance of $10,230,000), consisting of serial bonds due in annual installments commencing in 2011 and fluctuating periodically from $585,000 to a maximum of $2,075,000, plus interest from 2.25% to 5.00% through the year 2016, collateralized by a pledge of all revenues of the University with the exception of general account appropriated funds of the State of Idaho and restricted gift and grant revenues. The Series 2010A bonds were issued to refund the Series 1996 Student Fee Refunding Revenue Bonds in the principal amount of $3,125,000 and to refund the Series 1997B Student Fee Refunding Revenue Bonds in the principal amount of $7,290,000.
10,230,000
-
General Revenue Refunding Bonds, Series 2010B, (original balance of $10,150,000), consisting of term bonds due beginning in 2024 and fluctuating periodically from $1,660,000 to a maximum of $2,430,000, plus interest from 4.01% to 4.65% through the year 2032, collateralized by a pledge of all revenues of the University with the exception of general account appropriated funds of the State of Idaho and restricted gift and grant revenues. The Series 2010B bonds were issued to pay off an interim loan from Wells Fargo Bank, N.A. which funded improvements to the University’s Kibbie Dome.
10,150,000
-
General Revenue Refunding Bonds, Series 2010C, (original balance of $13,145,000), consisting of term bonds due beginning in 2037 with two payments of $6,390,000 and $6,755,000, plus interest from 6.42% to 6.52% through the year 2041, collateralized by a pledge of all revenues of the University with the exception of general account appropriated funds of the State of Idaho and restricted gift and grant revenues. The Series 2010C bonds were issued to finance and reimburse costs incurred by the University for certain capital improvements to the University’s Kibbie Dome.
13,145,000
-

37
NOTES TO FINANCIAL STATEMENTS JUNE 30, 2010 AND 2009
Description Balance Outstanding
2010 Balance Outstanding
2009
Other indebtedness, consisting of notes payable with interest rates ranging from 4.75% to 5.00% due through the year 2019.
674,312
2,673,388
Sub-total 166,174,312 149,628,388
Premium on Bonds
Deferred amount on Refunding – 2005A , 2007A, 2010A
4,132,930
(5,206,323)
3,404,711
(5,144,055)
TOTAL $165,100,919 $147,889,044
Principal and interest maturities on bonds and notes payable, excluding amortization of bond premium and principal and interest on bonds subject to an in-substance debt defeasance are as follows for the years ending June 30:
Bonds Payable Notes Payable
Principal Interest Principal Interest2011 6,230,000$ 8,083,295$ 127,222$ 37,915$ 2012 3,845,000 7,342,241 135,133 30,003 2013 4,015,000 7,008,720 143,537 21,600 2014 4,130,000 6,663,931 152,467 12,672 2015 4,525,000 4,685,803 84,332 3,777 2016-2020 15,125,000 27,081,147 31,621 3,187 2021-2025 10,645,000 20,259,357 - - 2026-2030 7,675,000 15,364,674 - - 2031-2035 2,430,000 11,249,269 - - 2036-2040 6,390,000 5,837,691 - - 2041-2045 100,490,000 495,333 - -
165,500,000$ 114,071,461$ 674,312$ 109,154$
In December 2008, the University entered into a line of credit agreement with Wells Fargo Bank to finance safety renovations and improvements for the University’s Kibbie Dome athletic facility. The total available line of credit extended to the University under this agreement was $10,000,000. This note was refinanced with the Series 2010B bond issuance.
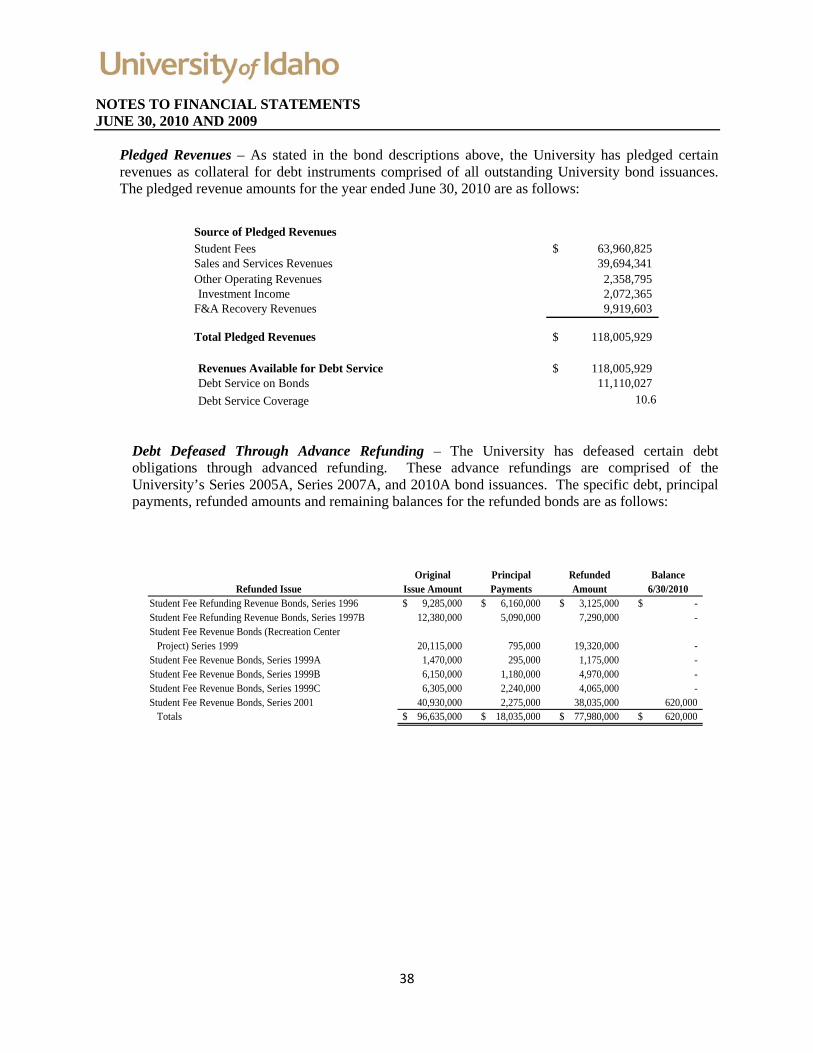
38
NOTES TO FINANCIAL STATEMENTS JUNE 30, 2010 AND 2009
Pledged Revenues – As stated in the bond descriptions above, the University has pledged certain revenues as collateral for debt instruments comprised of all outstanding University bond issuances. The pledged revenue amounts for the year ended June 30, 2010 are as follows:
Source of Pledged RevenuesStudent Fees 63,960,825$ Sales and Services Revenues 39,694,341 Other Operating Revenues 2,358,795 Investment Income 2,072,365
F&A Recovery Revenues 9,919,603
Total Pledged Revenues 118,005,929$
Revenues Available for Debt Service 118,005,929$ Debt Service on Bonds 11,110,027 Debt Service Coverage 10.6
Debt Defeased Through Advance Refunding – The University has defeased certain debt obligations through advanced refunding. These advance refundings are comprised of the University’s Series 2005A, Series 2007A, and 2010A bond issuances. The specific debt, principal payments, refunded amounts and remaining balances for the refunded bonds are as follows:
Original Principal Refunded BalanceRefunded Issue Issue Amount Payments Amount 6/30/2010
Student Fee Refunding Revenue Bonds, Series 1996 9,285,000$ 6,160,000$ 3,125,000$ -$ Student Fee Refunding Revenue Bonds, Series 1997B 12,380,000 5,090,000 7,290,000 - Student Fee Revenue Bonds (Recreation Center Project) Series 1999 20,115,000 795,000 19,320,000 - Student Fee Revenue Bonds, Series 1999A 1,470,000 295,000 1,175,000 - Student Fee Revenue Bonds, Series 1999B 6,150,000 1,180,000 4,970,000 - Student Fee Revenue Bonds, Series 1999C 6,305,000 2,240,000 4,065,000 - Student Fee Revenue Bonds, Series 2001 40,930,000 2,275,000 38,035,000 620,000 Totals 96,635,000$ 18,035,000$ 77,980,000$ 620,000$

39
NOTES TO FINANCIAL STATEMENTS JUNE 30, 2010 AND 2009
11. HEALTH INSURANCE PLAN AND HEALTH BENEFITS TRUST
The University of Idaho (“University”) is self-insured for the health insurance benefits it provides to employees and retirees. In June, 2007, the University established an affiliated but independent trust for the purpose of funding and paying its medical, mental health, dental and vision claims and their associated administrative costs under its health insurance plan for both active and retired employees. This trust, known as the University of Idaho Health Benefits Trust (“HBT”), was established as a tax-exempt entity under Section 115(1) of the Internal Revenue Code of 1986, as amended. The HBT is administered by a board of four trustees who are members of the University’s active staff and faculty. The HBT is maintained in an independent trust account established with U.S. Bank. This trust account is maintained under the sole control of the HBT board of trustees.
The HBT receives its funding for the payment of University health plan claims through a combination of employer, employee and retiree contributions. These contribution amounts are established in advance of the health plan year based upon independent actuarial valuation which takes into account health plan participant demographics, health plan design, expected health claim costs, and expected investment returns on HBT reserves.
Employer and employee contributions are made to the HBT on a bi-weekly basis corresponding to the University’s payroll schedule. Retiree contributions are billed and collected by the University quarterly and deposited to the HBT each calendar quarter. Additional employer funding may be provided by the University to the HBT as necessary to ensure the solvency of the HBT. Deposits into the HBT are irrevocable and may only be utilized for the payment of participating employee and retiree health plan claims, the associated administrative costs of such claims, and other necessary incidental costs attributable to the administration of the HBT.
Payments under the HBT are initiated via electronic request by University personnel on a weekly basis based upon processed claim information provided to the University by its contracted health plan claim administrators. All retiree-related costs incurred on an annual basis within the HBT apply toward the calculation of the University’s Annual Required Contribution (“ARC”) as determined under the requirements of Governmental Accounting Standard Board Statement 45, “Accounting and Financial Reporting by Employers for Postemployment Benefits Other Than Pensions.” The funding of the University’s liability under GASB 45 is recorded separately from the HBT under a second trust, the “University of Idaho Retiree Benefits Trust” as disclosed in Footnote 12 of these financial statements.
The financial statements of the HBT are audited annually on a calendar-year basis, and are publicly available via public records request by writing to: University of Idaho, Attn. General Accounting, P.O. Box 443166, Moscow, ID 83844-3166.
40
NOTES TO FINANCIAL STATEMENTS JUNE 30, 2010 AND 2009
12. RETIREMENT PLANS
Public Employee Retirement System of Idaho – The Public Employee Retirement System of Idaho (“PERSI”), a cost-sharing multiple-employer public retirement system, was created by the Idaho State Legislature. PERSI provides benefits based on members’ years of service, age, and compensation. In addition, benefits are provided for disability or death, and for survivors of eligible members or beneficiaries. It is a defined benefit plan requiring that both the member and the employer contribute. Designed as a mandatory system for eligible state employees, the legislation provided for political subdivisions to participate by contractual agreement with PERSI. The benefits and obligations to contribute to the plan were established and may be amended by the Idaho State Legislature. Financial reports for the plan are available from PERSI upon request sent to Public Employee Retirement System of Idaho, P.O. Box 83720, Boise, Idaho 83720-0078.
After five years of credited service, members become fully vested in retirement benefits earned to date. Members are eligible for retirement benefits upon attainment of the ages specified for their employment classification. For each year of credited service, the annual service retirement allowance is 2% of the average monthly salary for the highest consecutive 42 months.
For the three years ended June 30, 2010, 2009 and 2008, the required contribution rate as determined by PERSI was 10.39% and 6.23% of covered payroll for the University and employees, respectively. The University’s contributions required and paid were $5,607,259, $5,718,252, and $5,563,717, for the years ended June 30, 2010, 2009 and 2008, respectively.
Optional Retirement Plan – Effective July 1, 1990, the Idaho State Legislature authorized the Board of Regents to establish an Optional Retirement Plan (ORP), a defined contribution plan, for faculty and exempt employees. The employee contribution requirement for the ORP is based on a percentage of total payroll. Employer contributions are determined by the State of Idaho. The plan provisions were established by and may be amended by the State of Idaho.
New faculty and exempt employees hired July 1, 1990 or thereafter automatically enroll in the ORP and select their vendor option. Faculty and exempt employees hired before July 1, 1990 had a one-time opportunity to enroll in the ORP. Enrollees in the ORP no longer belong to PERSI. Vendor options include Teachers Insurance and Annuity Association – College Retirement Equities Fund and Variable Annuity Life Insurance Company.
Participants are immediately fully vested in the ORP. Retirement benefits are available either as a lump sum or any portion thereof upon attaining 55 years of age. The contribution requirements (and amounts paid) for the three years ended June 30, 2010, 2009 and 2008 were $13,569,621, $13,358,559, and $12,494,135, respectively, that consisted of $7,688,265 from the University and $5,881,335 from employees for 2010, $7,621,025 from the University and $5,737,534 from employees for 2009, and $7,127,049 from the University and $5,367,086 from employees for 2008.

41
NOTES TO FINANCIAL STATEMENTS JUNE 30, 2010 AND 2009
Although enrollees in the ORP no longer belong to PERSI, the University is required by the State of Idaho to contribute supplemental payments to PERSI for these enrollees in the amount of 1.49% of the annual covered payroll. The University will be required to make these annual supplemental payments through July 1, 2025. During the three years ended June 30, 2010, 2009 and 2008, these supplemental funding payments made to PERSI were $1,242,655, $1,226,593, and $1,147,997 respectively. These supplemental amounts are not included in the regular University PERSI contribution discussed previously.
13. POSTREMPLOYMENT BENEFITS OTHER THAN PENSIONS AND RETIREE BENEFITS TRUST
A. PLAN DESCRIPTION
The University of Idaho (the “University”) provides medical and dental benefits to eligible retirees, disabled employees, spouses, and survivors. The University also provides life insurance benefits to eligible retirees. Long-term disabled employees are treated as retirees and eligible for these same retiree benefits. These benefits represent a single-employer defined benefit plan administered by the University. The University has established a trust to fund the medical and dental portions of these post-employment benefits as described below in Section B.
Under certain conditions the University pays a portion of the coverage for retirees and disabled employees and the retiree or disabled employee pays the remainder. Spouses and survivors are always required to pay 100% of the cost for these benefits. In general, the employee must have completed at least 30 years of credited service or the sum of his/her age and years of credited service must total at least 80 to qualify for this benefit. Employees who were hired on or after January 1, 2002 are not eligible for this benefit. Employees hired after January 1, 2002 are eligible to participate in the University’s health insurance plan, but the University does not cover any portion of their premiums, deductibles, or coinsurance; those costs are the sole responsibility of the employee. All University post-employment benefits may be further established or amended by the University or the State Board of Education.
Funding for these benefits is comprised of both University and retiree contributions, combined with appropriated funding by the State of Idaho. The University determines the defined premium costs that will be borne by its retiree plan participants, and the State of Idaho Legislature determines the amount of annual state appropriations that will be granted to the University for employee and retiree benefits, provided to the University as a fixed annual amount per full-time equivalent employee. The University allocates this appropriated sum to its various employee and retiree benefits, including the retiree health insurance program. The University solely bears the risk for adverse financial performance within the retiree health insurance program, subject to a cap of $150,000 per retiree per year, after which the University is reinsured. Retiree premium rates through calendar year 2010 range from $0.00 to $1901.38 per month, depending upon the retiree’s status and number of dependents including spouse. Retiree health plan performance is reviewed annually and premium rates are then annually adjusted by the University as necessary.
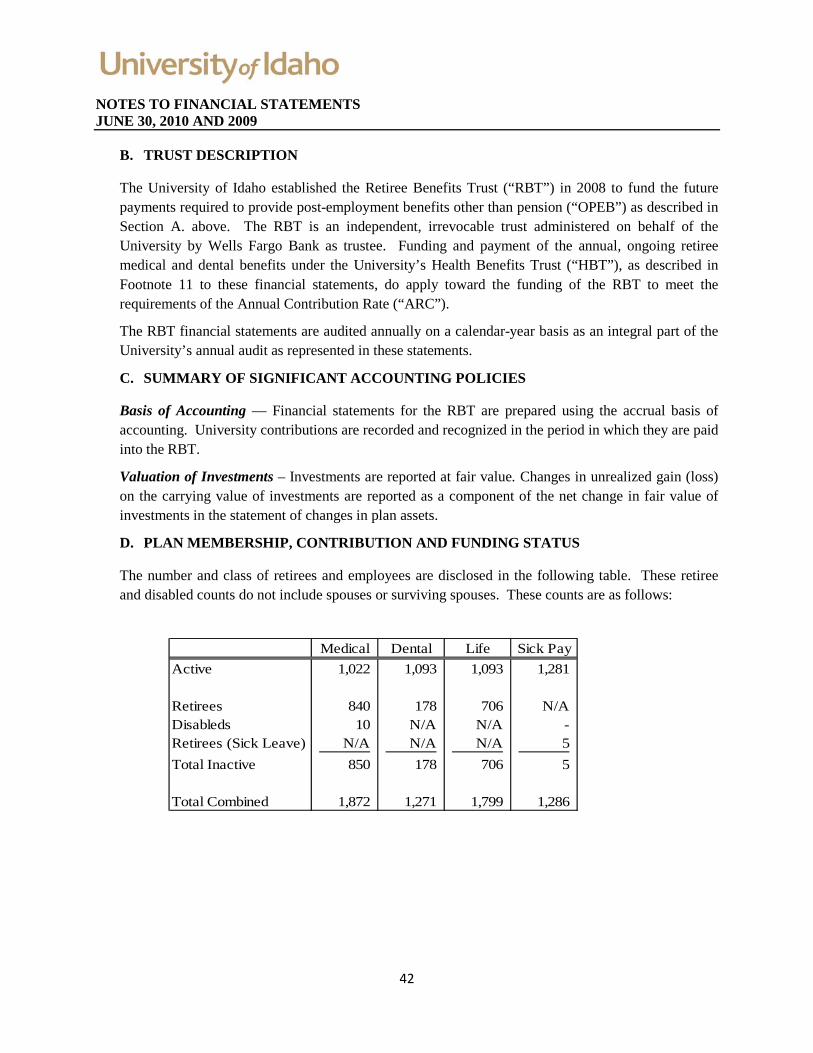
42
NOTES TO FINANCIAL STATEMENTS JUNE 30, 2010 AND 2009
B. TRUST DESCRIPTION
The University of Idaho established the Retiree Benefits Trust (“RBT”) in 2008 to fund the future payments required to provide post-employment benefits other than pension (“OPEB”) as described in Section A. above. The RBT is an independent, irrevocable trust administered on behalf of the University by Wells Fargo Bank as trustee. Funding and payment of the annual, ongoing retiree medical and dental benefits under the University’s Health Benefits Trust (“HBT”), as described in Footnote 11 to these financial statements, do apply toward the funding of the RBT to meet the requirements of the Annual Contribution Rate (“ARC”).
The RBT financial statements are audited annually on a calendar-year basis as an integral part of the University’s annual audit as represented in these statements.
C. SUMMARY OF SIGNIFICANT ACCOUNTING POLICIES
Basis of Accounting — Financial statements for the RBT are prepared using the accrual basis of accounting. University contributions are recorded and recognized in the period in which they are paid into the RBT.
Valuation of Investments – Investments are reported at fair value. Changes in unrealized gain (loss) on the carrying value of investments are reported as a component of the net change in fair value of investments in the statement of changes in plan assets.
D. PLAN MEMBERSHIP, CONTRIBUTION AND FUNDING STATUS
The number and class of retirees and employees are disclosed in the following table. These retiree and disabled counts do not include spouses or surviving spouses. These counts are as follows:
Medical Dental Life Sick Pay
Active 1,022 1,093 1,093 1,281
Retirees 840 178 706 N/ADisableds 10 N/A N/A - Retirees (Sick Leave) N/A N/A N/A 5 Total Inactive 850 178 706 5
Total Combined 1,872 1,271 1,799 1,286
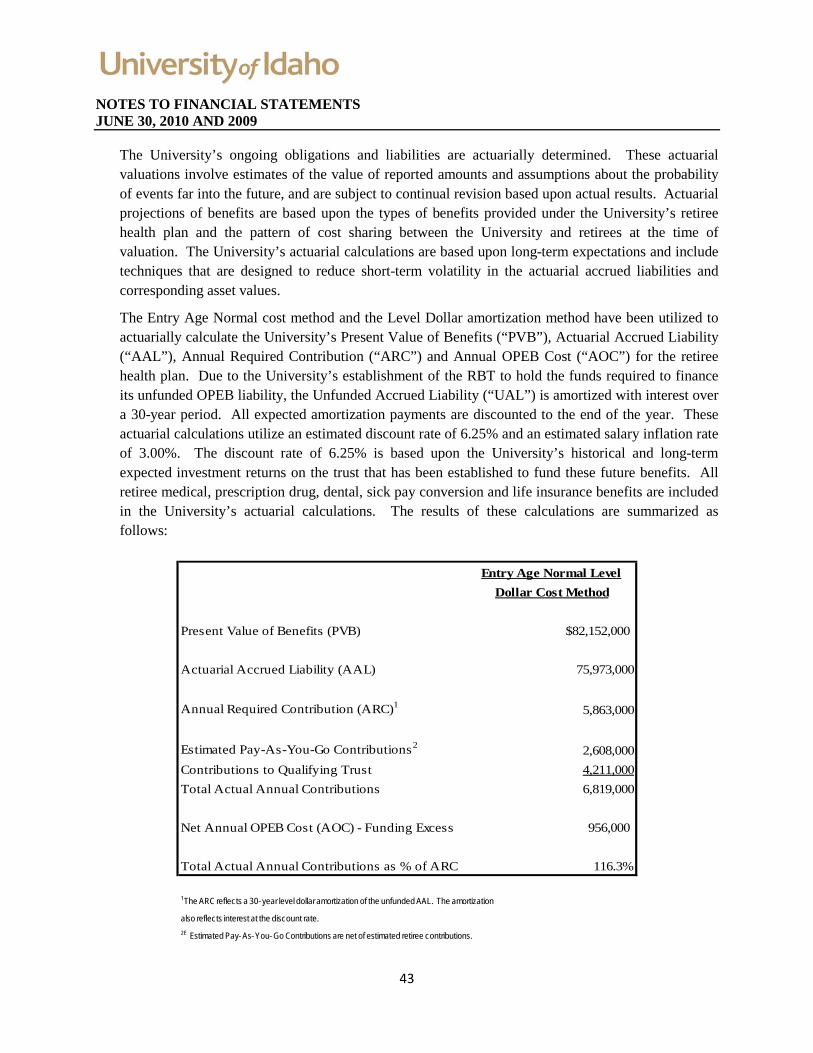
43
NOTES TO FINANCIAL STATEMENTS JUNE 30, 2010 AND 2009
The University’s ongoing obligations and liabilities are actuarially determined. These actuarial valuations involve estimates of the value of reported amounts and assumptions about the probability of events far into the future, and are subject to continual revision based upon actual results. Actuarial projections of benefits are based upon the types of benefits provided under the University’s retiree health plan and the pattern of cost sharing between the University and retirees at the time of valuation. The University’s actuarial calculations are based upon long-term expectations and include techniques that are designed to reduce short-term volatility in the actuarial accrued liabilities and corresponding asset values.
The Entry Age Normal cost method and the Level Dollar amortization method have been utilized to actuarially calculate the University’s Present Value of Benefits (“PVB”), Actuarial Accrued Liability (“AAL”), Annual Required Contribution (“ARC”) and Annual OPEB Cost (“AOC”) for the retiree health plan. Due to the University’s establishment of the RBT to hold the funds required to finance its unfunded OPEB liability, the Unfunded Accrued Liability (“UAL”) is amortized with interest over a 30-year period. All expected amortization payments are discounted to the end of the year. These actuarial calculations utilize an estimated discount rate of 6.25% and an estimated salary inflation rate of 3.00%. The discount rate of 6.25% is based upon the University’s historical and long-term expected investment returns on the trust that has been established to fund these future benefits. All retiree medical, prescription drug, dental, sick pay conversion and life insurance benefits are included in the University’s actuarial calculations. The results of these calculations are summarized as follows:
Entry Age Normal LevelDollar Cost Method
Present Value of Benefits (PVB) $82,152,000
Actuarial Accrued Liability (AAL) 75,973,000
Annual Required Contribution (ARC)1 5,863,000
Estimated Pay-As-You-Go Contributions2 2,608,000Contributions to Qualifying Trust 4,211,000Total Actual Annual Contributions 6,819,000
Net Annual OPEB Cost (AOC) - Funding Excess 956,000
Total Actual Annual Contributions as % of ARC 116.3%
1 The ARC reflects a 30-year level dollar amortization of the unfunded AAL. The amortization
also reflects interest at the discount rate. 2E Estimated Pay-As-You-Go Contributions are net of estimated retiree contributions.

44
NOTES TO FINANCIAL STATEMENTS JUNE 30, 2010 AND 2009
Funded Status, Utilizing Entry Age Normal Cost Method and Level Dollar Amortization Method of UAAL – As of June 30, 2010:
Medical Dental Life Sick Pay Total
Present Value of Benefits (PVB)
Retirees $41,554,000 $218,000 $3,961,000 $8,000 $45,741,000
Actives 33,046,000 212,000 486,000 2,667,000 36,411,000
Total $74,600,000 $430,000 $4,447,000 $2,675,000 $82,152,000
Actuarial Accrued Liability (AAL)
Retirees $41,554,000 $218,000 $3,961,000 $8,000 $45,741,000
Actives 28,829,000 194,000 473,000 736,000 30,232,000
Total $70,383,000 $412,000 $4,434,000 $744,000 $75,973,000
Assets $7,720,000 $45,000 $486,000 $82,000 $8,333,000
Unfunded AAL (UAAL) $62,663,000 $367,000 $3,948,000 $662,000 $67,640,000
Assets as % of AAL (Funded Ratio) 11.0% 10.9% 11.0% 11.0% 11.0%
UAAL as % of Annual Covered Payroll 98.9% 0.5% 5.9% 1.1% 54.3%
Annual Required Contribution (ARC)
Normal Cost 1$539,000 $3,000 $3,000 $272,000 $817,000
Amortization of Unfunded AAL 2$4,675,000 $27,000 $295,000 $49,000 $5,046,000
Total ARC $5,214,000 $30,000 $298,000 $321,000 $5,863,000
Estimated Benefit Payments (pay-as-you-go) 3$2,216,000 $70,000 $319,000 $3,000 $2,608,000
Covered Payroll $63,330,000 $66,875,000 $66,875,000 $57,709,000 $124,584,0001 Includes interest to year end.2 Level dollar basis for 30 years. Interest charged at the discount rate and paid at the end of the year. The accompanying schedule of University contributions presents trend information about the amounts contributed to the plan by the University in comparison to the ARC, an amount that is actuarially determined. The ARC represents a level of funding that, if paid on an ongoing basis, is projected to cover normal cost for each year and amortize any unfunded actuarial liabilities (or funding excess) over a period not to exceed thirty years. Projections of benefits for financial reporting purposes are based on the substantive plan (the plan as understood by the University and plan members) and include the types of benefits provided at the time of each valuation and the historical pattern of sharing of benefit costs between the University and plan members to that point. The actuarial methods and assumptions used include techniques that are designed to reduce the effects of short-term volatility in actuarial accrued liabilities and the actuarial value of assets, consistent with the long-term perspective of the calculations. Additional information as of the latest actuarial valuation is as follows:

45
NOTES TO FINANCIAL STATEMENTS JUNE 30, 2010 AND 2009
Retiree BenefitsTrust ("RBT")
Valuation Date 7/1/2009Actuarial Cost Method Entry Age NormalActuarial Amortization Method Level Dollar to decrement ageRemaining Amortization Period 30 Years, OpenAsset Valuation Method Fair Market Value
Actuarial Assumptions: Investment Rate of Return 6.25% Healthcare Cost Trend Rates: Medical and drug initial 11% Medical and drug ultimate 5% Dental initial 5% Dental ultimate 5% Inflation Rate - All Other N/A Administrative Costs - Medical & Dental Included in Claim Costs - Life Insurance 10%
Required Supplementary Information
Actuarial Accrued Unfunded UAAL as a PercentActuarial Actuarial Value Liability (AAL) - AAL (UAAL) Funded Covered of Covered
Valuation Date of Assets (a) Entry Age (b) (b-a) Ratio (a/b) Payroll (c ) Payroll (b-a)/(c )6/30/2008 4,325,000$ 83,011,000$ 78,686,000$ 5.21% 120,560,000$ 65.27%6/30/2009 8,333,000 77,141,000 68,808,000 10.80% 129,435,000 53.16%6/30/2010 13,768,000 75,973,000 62,205,000 18.12% 124,584,000 49.93%
Schedule of Funding Progress
Retiree Benefits TrustUniversity of Idaho
Required Supplementary Information
AnnualYear Ended Required Percentage
June 30 Contribution Contributed2008 7,157,000$ 101%2009 6,362,000 101%2010 5,863,000 116%
Schedule of Employer Contributions
Retiree Benefits TrustUniversity of Idaho
46
NOTES TO FINANCIAL STATEMENTS JUNE 30, 2010 AND 2009
14. VOLUNTARY TERMINATION BENEFITS
In November, 2009, the University initiated a voluntary Exit Incentive Program (EIP) to afford Board-appointed eligible faculty and staff members who desired to leave University employment an opportunity to do so with an economic incentive. In order to have been eligible to participate in this program, faculty and staff had to meet the following requirements on or before December 15, 2009:
1) Ten or more years of qualified service (as defined in the EIP) to the University;
2) Attainment of at least age 60 prior to June 30, 2010 and have accumulated at least 80 points through a combination of one point for each year of age and one point for each full year of qualified service;
3) Be an employee in good standing. They could not be under a suspension with or without pay, they could not have received a written notification of layoff, termination of employment, or nonrenewal (except for unit wide notices of nonrenewal), or have been notified of dismissal proceedings initiated by the University.
Eligible employees and faculty had to enroll in the EIP between December 15, 2009 and March 5, 2010. For those eligible persons who elected to enroll in the EIP, each participant signed a formal agreement releasing the University from certain types of legal liability and preventing the participant from being eligible to seek reemployment by the University for a period of at least 90 days. The University has obligated itself to make payments under this plan to the heirs or beneficiaries of the participant should the participant die before receiving payments under the EIP.
The exit incentive payment provided to eligible employees and faculty who enrolled is one-half of the employee’s or faculty member’s salary as defined in their salary agreement or salary letter and did not include any compensation amounts not included in the agreement or letter such as bonuses or summer salaries for faculty. Payment of the exit incentive amount will occur in two equal payments, the first in July, 2010 and the second in July, 2011, each payment comprised of ¼ of the employee or faculty member’s salary as described above. Total incentive payments for those staff and faculty members who enrolled in the program have been calculated to be $1,786,987. This amount has been recognized and recorded by the University in its FY10 Statement of Net Assets in “Other” liabilities, divided equally between current and noncurrent liabilities to reflect the timing of EIP payments. In accordance with the requirements of GASB Statement No. 47, Accounting for Termination Benefits, the University performed a present value analysis of the calculated payments for both years that resulted in an immaterial difference between the discounted and full value of these payments. The University therefore chose to record the EIP liability at its full amount. The recognition of this liability of $1,786,987 resulted in a corresponding increase in the University’s FY10 salaries expense in its Statement of Revenues, Expenses and Changes in Net Assets.
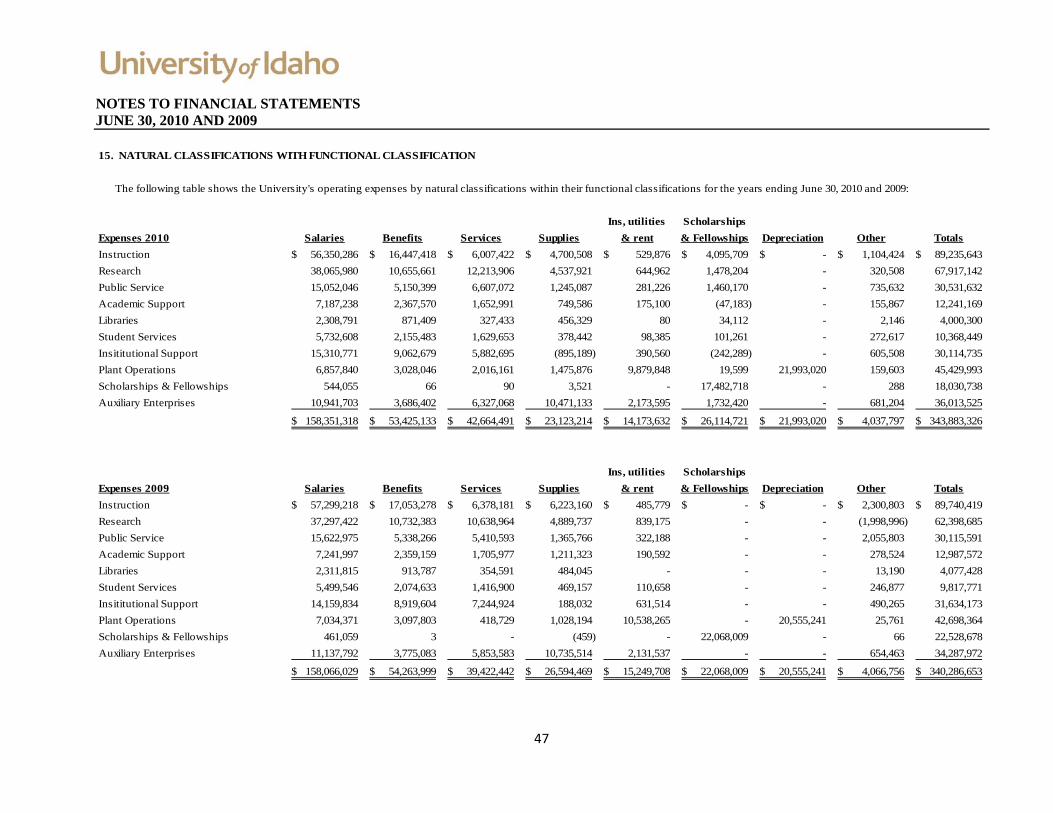
47
NOTES TO FINANCIAL STATEMENTS JUNE 30, 2010 AND 2009
15. NATURAL CLASSIFICATIONS WITH FUNCTIONAL CLASSIFICATION
The following table shows the University's operating expenses by natural classifications within their functional classifications for the years ending June 30, 2010 and 2009:
Ins, utilities ScholarshipsExpenses 2010 Salaries Benefits Services Supplies & rent & Fellowships Depreciation Other TotalsInstruction 56,350,286$ 16,447,418$ 6,007,422$ 4,700,508$ 529,876$ 4,095,709$ -$ 1,104,424$ 89,235,643$ Research 38,065,980 10,655,661 12,213,906 4,537,921 644,962 1,478,204 - 320,508 67,917,142 Public Service 15,052,046 5,150,399 6,607,072 1,245,087 281,226 1,460,170 - 735,632 30,531,632 Academic Support 7,187,238 2,367,570 1,652,991 749,586 175,100 (47,183) - 155,867 12,241,169 Libraries 2,308,791 871,409 327,433 456,329 80 34,112 - 2,146 4,000,300 Student Services 5,732,608 2,155,483 1,629,653 378,442 98,385 101,261 - 272,617 10,368,449 Insititutional Support 15,310,771 9,062,679 5,882,695 (895,189) 390,560 (242,289) - 605,508 30,114,735 Plant Operations 6,857,840 3,028,046 2,016,161 1,475,876 9,879,848 19,599 21,993,020 159,603 45,429,993 Scholarships & Fellowships 544,055 66 90 3,521 - 17,482,718 - 288 18,030,738 Auxiliary Enterprises 10,941,703 3,686,402 6,327,068 10,471,133 2,173,595 1,732,420 - 681,204 36,013,525
158,351,318$ 53,425,133$ 42,664,491$ 23,123,214$ 14,173,632$ 26,114,721$ 21,993,020$ 4,037,797$ 343,883,326$
Ins, utilities ScholarshipsExpenses 2009 Salaries Benefits Services Supplies & rent & Fellowships Depreciation Other TotalsInstruction 57,299,218$ 17,053,278$ 6,378,181$ 6,223,160$ 485,779$ -$ -$ 2,300,803$ 89,740,419$ Research 37,297,422 10,732,383 10,638,964 4,889,737 839,175 - - (1,998,996) 62,398,685 Public Service 15,622,975 5,338,266 5,410,593 1,365,766 322,188 - - 2,055,803 30,115,591 Academic Support 7,241,997 2,359,159 1,705,977 1,211,323 190,592 - - 278,524 12,987,572 Libraries 2,311,815 913,787 354,591 484,045 - - - 13,190 4,077,428 Student Services 5,499,546 2,074,633 1,416,900 469,157 110,658 - - 246,877 9,817,771 Insititutional Support 14,159,834 8,919,604 7,244,924 188,032 631,514 - - 490,265 31,634,173 Plant Operations 7,034,371 3,097,803 418,729 1,028,194 10,538,265 - 20,555,241 25,761 42,698,364 Scholarships & Fellowships 461,059 3 - (459) - 22,068,009 - 66 22,528,678 Auxiliary Enterprises 11,137,792 3,775,083 5,853,583 10,735,514 2,131,537 - - 654,463 34,287,972
158,066,029$ 54,263,999$ 39,422,442$ 26,594,469$ 15,249,708$ 22,068,009$ 20,555,241$ 4,066,756$ 340,286,653$
48
NOTES TO FINANCIAL STATEMENTS JUNE 30, 2010 AND 2009
16. CONTINGENCIES AND LEGAL MATTERS
Revenue from federal research and service grants includes amounts for the recovery of overhead and other costs allocated to these projects. The University may be required to make refunds of amounts received for overhead and other costs reimbursed as a result of audits by agencies of the federal government. The University considers any such potential refunds likely to be immaterial.
The University is a defendant in litigation arising from the normal course of operations. Based on present knowledge, the University’s administration believes any ultimate liability in these legal matters will not materially affect the financial position of the University.
17. RISK MANAGEMENT
The University participates in the State of Idaho’s risk and insurance program, which includes liability and property coverage. The State of Idaho’s Retained Risk Fund has a $500,000 cap for tort claims. The University’s premiums are based on the State’s actuarial calculations and are weighted for losses sustained by the University. Deductibles for the programs include $2,000 for property losses, $500 for auto physical damage, $5,000 for boiler and machinery losses, $500 for fine art losses and $50 for inland marine losses. There are no casualty deductibles. The State Fund of Idaho, a competitive state fund, writes the University’s Worker’s Compensation coverage. The University’s premiums and the State Fund loss experience modifications are based on the loss experience of all State agencies.
18. COMPONENT UNIT
The University of Idaho Foundation, Inc. (Foundation) is a legally separate, 501 (C) (3) component unit of the University of Idaho (University) which was established in 1970. The mission of the University of Idaho Foundation, Inc. Moscow, Idaho is to secure, manage, and distribute private support to enhance the growth and development of the University of Idaho. A Board of Directors comprised of up to 25 voting members governs and conducts the business of the Foundation, meeting at least four times in each fiscal year. The officers of the Foundation are Chairman, Vice-Chairman, Treasurer, Secretary, and Past Chairman. Committees include: the Executive Committee, Committee on Directors, Operations and Finance Committee, Investment Committee, Audit Committee, Gift Acceptance Committee, and other committees appointed by the Chairman as necessary to carry out the business of the Foundation. An Executive Director manages the operations of the Foundation. The Foundation professional staff also includes the Director of Finance; Director, Endowment and Gift Administration; Assistant Director, Finance; a Financial Specialist and support staff. The Foundation strategically partners with the leadership team at the University of Idaho including the President, Vice President of University Advancement and the Executive Director of Planning and Budget. Separate audited financial statements are prepared for the Foundation and may be obtained by contacting University of Idaho Foundation, PO Box 443143, Moscow, Idaho 83844-3143.
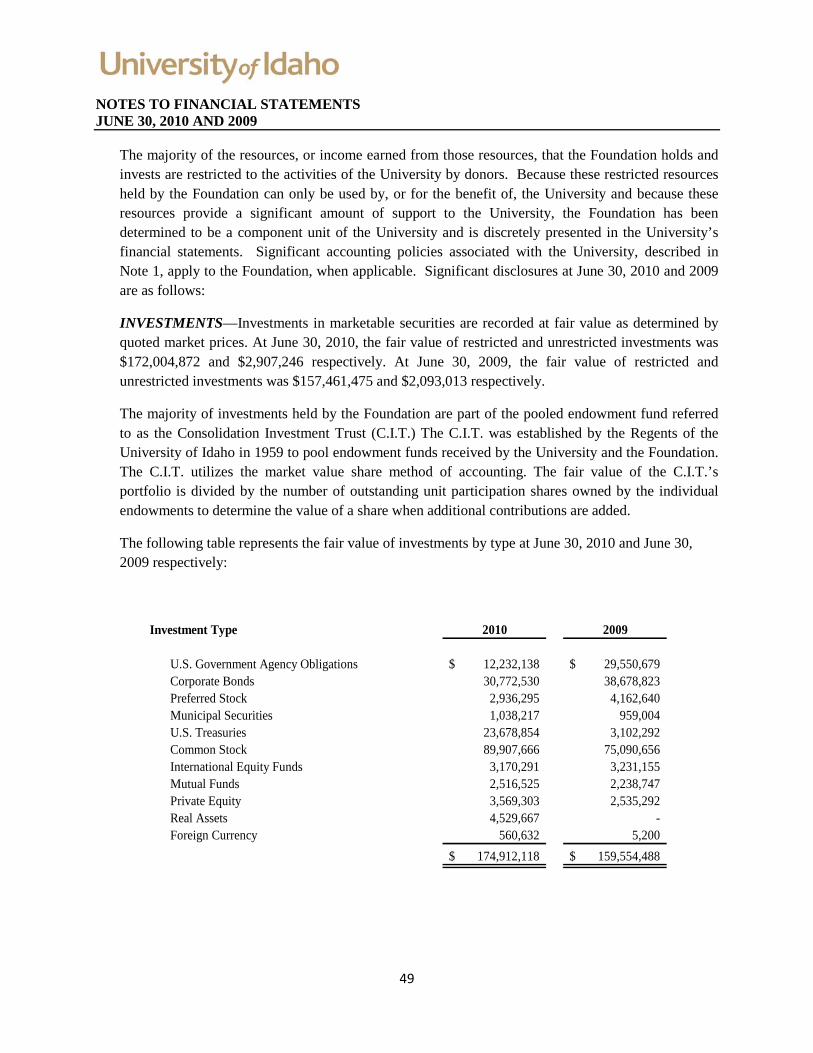
49
NOTES TO FINANCIAL STATEMENTS JUNE 30, 2010 AND 2009
The majority of the resources, or income earned from those resources, that the Foundation holds and invests are restricted to the activities of the University by donors. Because these restricted resources held by the Foundation can only be used by, or for the benefit of, the University and because these resources provide a significant amount of support to the University, the Foundation has been determined to be a component unit of the University and is discretely presented in the University’s financial statements. Significant accounting policies associated with the University, described in Note 1, apply to the Foundation, when applicable. Significant disclosures at June 30, 2010 and 2009 are as follows:
INVESTMENTS—Investments in marketable securities are recorded at fair value as determined by quoted market prices. At June 30, 2010, the fair value of restricted and unrestricted investments was $172,004,872 and $2,907,246 respectively. At June 30, 2009, the fair value of restricted and unrestricted investments was $157,461,475 and $2,093,013 respectively.
The majority of investments held by the Foundation are part of the pooled endowment fund referred to as the Consolidation Investment Trust (C.I.T.) The C.I.T. was established by the Regents of the University of Idaho in 1959 to pool endowment funds received by the University and the Foundation. The C.I.T. utilizes the market value share method of accounting. The fair value of the C.I.T.’s portfolio is divided by the number of outstanding unit participation shares owned by the individual endowments to determine the value of a share when additional contributions are added.
The following table represents the fair value of investments by type at June 30, 2010 and June 30, 2009 respectively:
Investment Type 2010 2009
U.S. Government Agency Obligations 12,232,138$ 29,550,679$ Corporate Bonds 30,772,530 38,678,823 Preferred Stock 2,936,295 4,162,640 Municipal Securities 1,038,217 959,004 U.S. Treasuries 23,678,854 3,102,292 Common Stock 89,907,666 75,090,656 International Equity Funds 3,170,291 3,231,155 Mutual Funds 2,516,525 2,238,747 Private Equity 3,569,303 2,535,292 Real Assets 4,529,667 - Foreign Currency 560,632 5,200
174,912,118$ 159,554,488$

50
NOTES TO FINANCIAL STATEMENTS JUNE 30, 2010 AND 2009
Interest Rate Risk
Interest rate risk is defined by GASB Statement No. 40 as the risk a government may face should interest rate variances affect the fair value of investments. The Foundation does not presently have a formal policy that addresses interest rate risk.
As of June 30, 2010, the Foundation had the following investments subject to interest rate risk:
Investment Type Fair Value Less than 1 1-5 6-10 More than 10
U.S. Corporations 30,772,530$ 661,644$ 7,414,585$ 11,243,095$ 11,453,206$ U.S. Government Agency Obligations 12,232,138 - 19,835 1,273,254 10,939,049 U.S. Treasuries 23,678,854 103,936 14,326,245 7,866,079 1,382,594 Municipal Securities 1,038,217 - 655,146 25,027 358,044
67,721,739$ 765,580$ 22,415,811$ 20,407,455$ 24,132,893$
As of June 30, 2009, the Foundation had the following investments subject to interest rate risk:
Investment Type Fair Value Less than 1 1-5 6-10 More than 10
U.S. Corporations 38,678,823$ 1,938,395$ 11,658,439$ 12,063,189$ 13,018,800$ U.S. Government Agency Obligations 29,550,679 - 19,715 5,029,061 24,501,903 U.S. Treasuries 3,102,292 99,995 2,134,791 701,213 166,293 Municipal Securities 959,004 - 376,459 420,576 161,969
72,290,798$ 2,038,390$ 14,189,404$ 18,214,039$ 37,848,965$
Investment Maturities (in years)
Investment Maturities (in years)
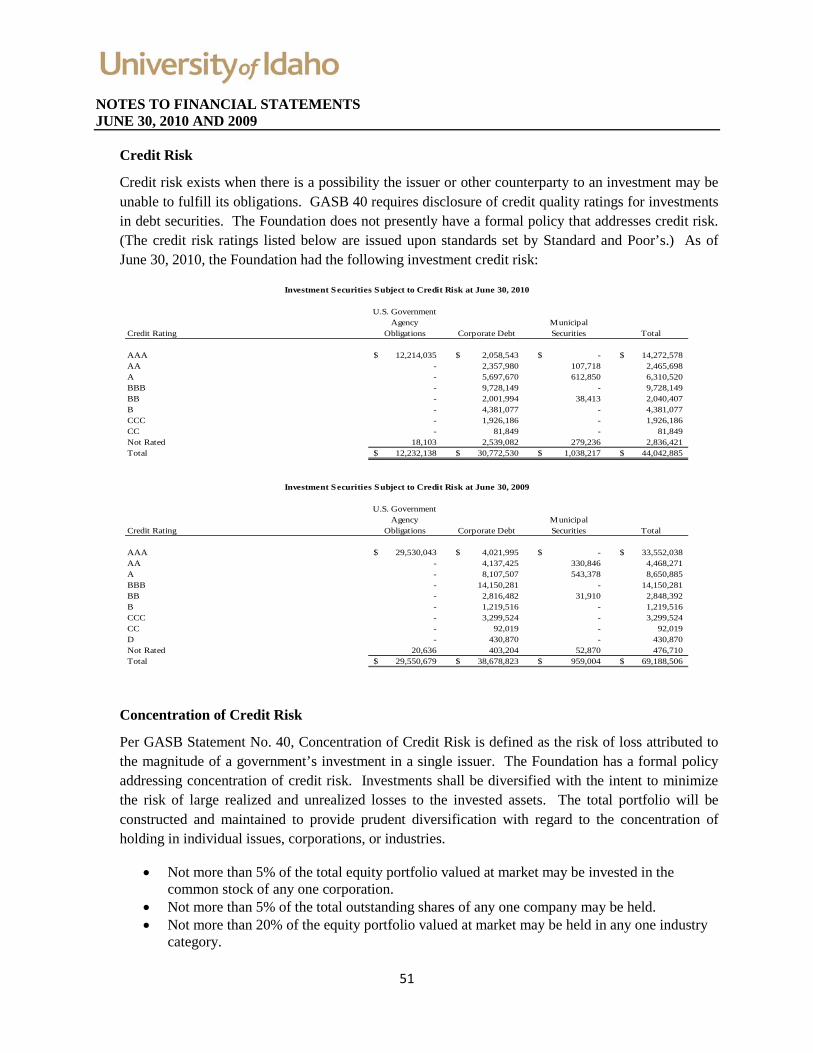
51
NOTES TO FINANCIAL STATEMENTS JUNE 30, 2010 AND 2009
Credit Risk
Credit risk exists when there is a possibility the issuer or other counterparty to an investment may be unable to fulfill its obligations. GASB 40 requires disclosure of credit quality ratings for investments in debt securities. The Foundation does not presently have a formal policy that addresses credit risk. (The credit risk ratings listed below are issued upon standards set by Standard and Poor’s.) As of June 30, 2010, the Foundation had the following investment credit risk:
Investment Securities Subject to Credit Risk at June 30, 2010
Credit Rating
U.S. Government Agency
Obligations Corporate DebtMunicipal Securities Total
AAA 12,214,035$ 2,058,543$ -$ 14,272,578$ AA - 2,357,980 107,718 2,465,698 A - 5,697,670 612,850 6,310,520 BBB - 9,728,149 - 9,728,149 BB - 2,001,994 38,413 2,040,407 B - 4,381,077 - 4,381,077 CCC - 1,926,186 - 1,926,186 CC - 81,849 - 81,849 Not Rated 18,103 2,539,082 279,236 2,836,421 Total 12,232,138$ 30,772,530$ 1,038,217$ 44,042,885$
Investment Securities Subject to Credit Risk at June 30, 2009
Credit Rating
U.S. Government Agency
Obligations Corporate DebtMunicipal Securities Total
AAA 29,530,043$ 4,021,995$ -$ 33,552,038$ AA - 4,137,425 330,846 4,468,271 A - 8,107,507 543,378 8,650,885 BBB - 14,150,281 - 14,150,281 BB - 2,816,482 31,910 2,848,392 B - 1,219,516 - 1,219,516 CCC - 3,299,524 - 3,299,524 CC - 92,019 - 92,019 D - 430,870 - 430,870 Not Rated 20,636 403,204 52,870 476,710 Total 29,550,679$ 38,678,823$ 959,004$ 69,188,506$
Concentration of Credit Risk
Per GASB Statement No. 40, Concentration of Credit Risk is defined as the risk of loss attributed to the magnitude of a government’s investment in a single issuer. The Foundation has a formal policy addressing concentration of credit risk. Investments shall be diversified with the intent to minimize the risk of large realized and unrealized losses to the invested assets. The total portfolio will be constructed and maintained to provide prudent diversification with regard to the concentration of holding in individual issues, corporations, or industries.
• Not more than 5% of the total equity portfolio valued at market may be invested in the common stock of any one corporation.
• Not more than 5% of the total outstanding shares of any one company may be held. • Not more than 20% of the equity portfolio valued at market may be held in any one industry
category.
52
NOTES TO FINANCIAL STATEMENTS JUNE 30, 2010 AND 2009
• Not more than 15% of the equity portfolio valued at market may be invested in securities issued as American Depository Receipts.
• Fixed income securities of any one issuer shall not exceed 5% of the market value of the total bond portfolio at the time of the purchase (except US Treasury or other federal agencies).
• Holdings of any individual fixed income issue must not exceed 5% of the value of the total issue (except US Treasury or other federal agency issues.)
As of June 30, 2010 and June 30, 2009 respectively, the Foundation had not invested more than 5 percent of their investments in any one issuer.
Custodial Credit Risk
The Foundation minimizes exposure to custodial credit risk by requiring that investments, to the extent possible, be clearly marked as to Foundation ownership and further to the extent possible, be held in the Foundation’s name. At June 30, 2010 and June 30, 2009 respectively, all Foundation funds were insured or registered investments, or investments held by the Foundation or their agent in the Foundation’s name.

53
NOTES TO FINANCIAL STATEMENTS JUNE 30, 2010 AND 2009
Foreign Currency Risk
Foreign currency risk is the risk that changes in exchange rates will adversely affect the fair value of an investment or a deposit. The Foundation does not presently have a policy that addresses foreign currency risk. The Foundation is exposed to foreign currency risk in foreign stocks that it holds as follows for June 30, 2010 and June 30, 2009 respectively:
Investment Securities Subject to Foreign Currency Risk
June 30, 2010 June 30, 2009Currency Type Fair Value Fair Value
AUD 2,477,884$ 1,846,423$ BMD 407 - BRL 306,812 - CAD 458,760 40,125 CHF 959,741 846,518 CLP 30,543 - CNY 259,446 - COP 15,569 - CZK 7,186 - DKK 516,651 9,878 EGP 10,618 - EUR 2,455,670 2,224,039 GBP 4,792,548 4,118,664 HKD 3,707,262 2,959,217 HUF 8,714 - IDR 47,909 - ILS 6,480 - INR 167,632 - JPY 4,518,890 4,349,797
KRW 269,904 - MAD 2,994 - MXN 88,302 - MYR 58,915 - NOK 22,401 6,585 NZD 222,066 294,605 PEN 8,921 - PHP 9,621 - PLN 24,988 - PTE - 3,231 RUB 125,497 - SEK 574,150 765,654 SGD 1,368,920 984,425 THB 30,771 - TRY 32,361 - TWD 214,522 - UAH 422 - ZAR 144,745 -
23,948,222$ 18,449,161$

54
NOTES TO FINANCIAL STATEMENTS JUNE 30, 2010 AND 2009
DISTRIBUTIONS TO UNIVERSITY OF IDAHO AND AFFILIATES
During fiscal years 2010 and 2009, earnings from endowments invested in the C.I.T., direct gifts and other revenues to the Foundation were distributed as follows:
C.I.T. Gifts and C.I.T. Gifts andEndowment Other Endowment Other
Income Revenues Income Revenues
Scholarships 3,985,636$ 3,316,883$ 4,318,636$ 3,339,809$ Student loans 159,618 - 178,452 - Building funds - 937,510 - 1,485,433 University of Idaho College and
Dept Operating AccountsAcademic Excellence 371,167 52,110 418,711 57,167 Agricultural and Life Sciences 245,025 633,069 266,660 534,480 Art and Architecture 11,972 56,756 13,040 55,453 Athletics 37,886 441,076 44,180 551,721 Business and Economics 262,263 427,452 293,950 411,498 Education 24,448 171,103 20,805 16,417 Engineering 81,549 568,724 82,352 615,133 Law 176,465 128,043 200,805 179,823 Letters, Art and Social Science 387,842 314,459 416,452 358,439 Library 117,856 28,741 131,799 745 Natural Resources 180,928 359,760 195,418 260,130 Science 97,108 186,337 95,259 347,928 Other departments 309,375 1,044,243 364,740 1,204,212
Life beneficiaries 349,666 - 261,356 - University of Idaho affiliates 30,349 48,749 26,889 268,000 TOTAL DISTRIBUTIONS 6,829,153$ 8,715,015$ 7,329,504$ 9,686,388$
2010 2009
DONOR RESTRICTED ENDOWMENTS The Foundation receives certain gift assets that are restricted for endowment purposes, and by definition the original gift amount will be held in perpetuity for the benefit of the University. Restriction requirement for principal preservation is addressed by Idaho statute, and is applicable lacking any further guidance from the individual gift agreement. During the fiscal years ended June 30, 2010 and June 30, 2009, $2,418,134 and $6,415,727 was contributed to current endowments, respectively. The Foundation has a two-tier spending policy dependent upon the endowment agreement that exists for each endowment. 1) Endowments with language requiring the reinvestment of all realized capital gains as principal can distribute only interest and dividends, and all realized gains are reinvested. 2) The Foundation Board of Directors establishes a spending rate annually for endowments without the
55
NOTES TO FINANCIAL STATEMENTS JUNE 30, 2010 AND 2009
restrictive reinvestment language. The approved fiscal year 2010 and 2009 spending rate was set at 4% of the three-year rolling average of the C.I.T.’s monthly fair market value. If total dividends, interest and short-term capital gains are less than the total amount required to make the distributions based on this spending rate, realized long-term gains will be used to make up the shortfall. During the fiscal year ended June 30, 2010 and 2009, the endowments held by the Foundation had net appreciation (depreciation) on donor restricted endowments of $16,749,694 and $(34,765,134). Per terms of the endowment agreements realized capital gains are either reinvested as principal or distributed per the donor agreement. Unrealized appreciation is included with the “Restricted – Non Expendable” Fund Balance.
19. RELATED ORGANIZATIONS
The Idaho Research Foundation, Inc. (the “Research Foundation”) is a separate legal entity that until 2008 provided technology transfer services to the University. In 2008 an agreement was reached between the University and Research Foundation to integrate some of the services into the University. The new role of the Research Foundation is to hold equity from licensing transactions on behalf of the University. On January 17, 2002, the University executed a revolving line-of-credit agreement with the Research Foundation not to exceed $200,000. As of June 30, 2007, the Research Foundation had drawn $126,000 on the line-of-credit. As part of the agreement to integrate into the University the $126,000 was forgiven and the note was removed from the University’s books in fiscal year 2008. The Research Foundation is a legally separate organization which provides a valuable service to the University. It does not provide financial resources to the University and is not reported as a component unit.
The Vandal Boosters, Inc. (the “Boosters”) is a fund raising organization that provides financial assistance and services to the University of Idaho intercollegiate athletic department. Contributions received by the University from this organization are recorded as gifts. Unaudited net assets of the Boosters at June 30, 2010 and 2009 were $126,884 and $119,137 respectively. Assets owned by the Boosters are not included in the accompanying financial statements.
The University of Idaho Alumni Association (the “Association”) was established to develop and maintain a positive relationship with alumni, parents, and friends of the University. The Association is a legally separate organization which provides a valuable service to the University. It does not provide significant financial resources to the University and is not reported as a component unit.
20. RISKS AND UNCERTAINTIES
Per Regents of University of Idaho policy, the University invests in various types of investment securities rated Aa or better. Investment securities are exposed to various risks, such as interest rate, market and credit risks. Due to the level of risk associated with certain investment securities, changes
56
NOTES TO FINANCIAL STATEMENTS JUNE 30, 2010 AND 2009
in the values of investments securities may occur in the near term and such changes could affect the amounts reported in the statement of financial position.
Since June 2008, there has been significant volatility in the domestic and international investment markets, primarily as a result of liquidity issues in credit markets. Consequently, the fair value of the University’s investments may be exposed to higher than typical price volatility which could result in a subsequent reduction in fair value of certain investments from the amounts reported as of June 30, 2009.
21. SUBSEQUENT EVENTS
Subsequent to June 30, 2010, the University entered into two loan agreements with Wells Fargo Bank, both of which mature in August, 2016. The first loan was acquired in the amount of $2,900,000 to finance improvements to the Kibbie Dome, and the second loan was acquired in the amount of $2,500,000 to finance improvements to the Dan O’Brien Track and Field Complex. Both of these facilities are owned by the University.
57
REPORT ON INTERNAL CONTROL OVER FINANCIAL REPORTING AND ON COMPLIANCE AND OTHER MATTERS BASED ON AN AUDIT OF FINANCIAL
STATEMENTS PERFORMED IN ACCORDANCE WITH GOVERNMENT AUDITING STANDARDS
Idaho State Board of Education University of Idaho Moscow, Idaho We have audited the financial statements of the University of Idaho (University), its discretely presented component unit, and the University of Idaho Health Benefits Trust as of and for the year ended June 30, 2010, which collectively comprise the University’s basic financial statements, and have issued our report thereon dated September 30, 2010. We conducted our audit in accordance with auditing standards generally accepted in the United States of America and the standards applicable to financial audits contained in Government Auditing Standards, issued by the Comptroller General of the United States. Other auditors audited the financial statements of the discretely presented component unit and the University of Idaho Health Benefits Trust, as described in our report on the University’s financial statements. This report does not include the results of the other auditors’ testing of internal control over financial reporting or compliance and other matters that are reported on separately by those auditors. The financial statements of the University of Idaho Health Benefits Trust were not audited in accordance with Government Auditing Standards. INTERNAL CONTROL OVER FINANCIAL REPORTING In planning and performing our audit, we considered the University's internal control over financial reporting as a basis for designing our auditing procedures for the purpose of expressing our opinion on the financial statements, but not for the purpose of expressing an opinion on the effectiveness of the University’s internal control over financial reporting. Accordingly, we do not express an opinion on the effectiveness of the University’s internal control over financial reporting. A deficiency in internal control exists when the design or operation of a control does not allow management or employees, in the normal course of performing their assigned functions, to prevent, or detect and correct misstatements on a timely basis. A material weakness is a deficiency, or combination of deficiencies, in internal control, such that there is a reasonable possibility that a material misstatement of the entity’s financial statements will not be prevented, or detected and corrected on a timely basis. Our consideration of the internal control over financial reporting was for the limited purpose described in the first paragraph of this section and was not designed to identify all deficiencies in internal control over financial reporting that might be deficiencies, significant deficiencies or material weaknesses. We did not identify any deficiencies in internal control over financial reporting that we consider to be material weaknesses, as defined above. COMPLIANCE AND OTHER MATTERS As part of obtaining reasonable assurance about whether the University’s financial statements are free of material misstatement, we performed tests of its compliance with certain provisions of
58
laws, regulations, contracts, and grant agreements, noncompliance with which could have a direct and material effect on the determination of financial statement amounts. However, providing an opinion on compliance with those provisions was not an objective of our audit, and accordingly, we do not express such an opinion. The results of our tests disclosed no instances of noncompliance or other matters that are required to be reported under Government Auditing Standards. This report is intended solely for the information and use of the Idaho State Board of Education, management, federal awarding agencies and pass-through entities, and is not intended to be and should not be used by anyone other than these specified parties.
Eugene, Oregon September 30, 2010
59
REPORT ON COMPLIANCE WITH REQUIREMENTS THAT COULD HAVE A DIRECT AND MATERIAL EFFECT ON EACH MAJOR PROGRAM AND ON INTERNAL CONTROLOVER COMPLIANCE IN ACCORDANCE WITH OMB
CIRCULAR A-133 Idaho State Board of Education University of Idaho Moscow, Idaho COMPLIANCE We have audited the University of Idaho’s (University) compliance with the types of compliance requirements described in the OMB Circular A-133 Compliance Supplement that could have a direct and material effect on each of the University’s major federal programs for the year ended June 30, 2010. The University’s major federal programs are identified in the summary of auditor’s results section of the accompanying schedule of findings and questioned costs. Compliance with the requirements of laws, regulations, contracts, and grants applicable to each of its major federal programs is the responsibility of the University’s management. Our responsibility is to express an opinion on the University’s compliance based on our audit. We conducted our audit of compliance in accordance with auditing standards generally accepted in the United States of America; the standards applicable to financial audits contained in Government Auditing Standards, issued by the Comptroller General of the United States; and OMB Circular A-133. Those standards and OMB Circular A-133 require that we plan and perform the audit to obtain reasonable assurance about whether noncompliance with the types of compliance requirements referred to above that could have a direct and material effect on a major federal program occurred. An audit includes examining, on a test basis, evidence about the University’s compliance with those requirements and performing such other procedures as we considered necessary in the circumstances. We believe that our audit provides a reasonable basis for our opinion. Our audit does not provide a legal determination of the University’s compliance with those requirements. In our opinion, the University complied, in all material respects, with the compliance requirements referred to above that could have a direct and material effect on each of its major federal programs for the year ended June 30, 2010. However, the results of our auditing procedures disclosed an instance of noncompliance with those requirements, which is required to be reported in accordance with OMB Circular A-133 and which is described in the accompanying schedule of findings and questioned costs as item 2010-01.
60
INTERNAL CONTROL OVER COMPLIANCE Management of the University is responsible for establishing and maintaining effective internal control over compliance with the requirements of laws, regulations, contracts, and grants applicable to federal programs. In planning and performing our audit, we considered the University’s internal control over compliance with the requirements that could have a direct and material effect on a major federal program in order to determine the auditing procedures for the purpose of expressing our opinion on compliance and to test and report on internal control over compliance in accordance with OMB Circular A-133, but not for the purpose of expressing an opinion on the effectiveness of internal control over compliance. Accordingly, we do not express an opinion on the effectiveness of the University’s internal control over compliance. A deficiency in internal control over compliance exists when the design or operation of a control over compliance does not allow management or employees, in the normal course of performing their assigned functions, to prevent, or detect and correct, noncompliance with a type of compliance requirement of a federal program on a timely basis. A material weakness in internal control over compliance is a deficiency, or combination of deficiencies, in internal control over compliance, such that there is a reasonable possibility that material noncompliance with a type of compliance requirement of a federal program will not be prevented, or detected and corrected, on a timely basis. Our consideration of internal control over compliance was for the limited purpose described in the first paragraph of this section and was not designed to identify all deficiencies in internal control over compliance that might be deficiencies, significant deficiencies, or material weaknesses. We did not identify any deficiencies in internal control over compliance that we consider to be material weaknesses, as defined above. The University’s response to the finding identified in our audit is described in the accompanying schedule of findings and questioned costs. We did not audit the University’s response and, accordingly, we express no opinion on it. This report is intended solely for the information and use of the Idaho State Board of Education, management, federal awarding agencies and pass-through entities and is not intended to be and should not be used by anyone other than these specified parties.
Eugene, Oregon September 30, 2010
61
UNIVERSITY OF IDAHO SCHEDULE OF FINDINGS AND QUESTIONED COSTS FOR THE YEAR ENDED JUNE 30, 2010
Section I - Summary of Auditor’s Results
Financial Statements
Type of auditor’s report issued: Unqualified Internal control over financial reporting:
Material weakness(es) identified? yes X no Significant deficiencies(s) identified
that are not considered to be material weaknesses? _ yes X none reported
Noncompliance material to financial statements noted? yes X no
Federal Awards
Internal control over major programs:
Material weakness(es) identified? yes X no Significant deficiencies (s) identified
that are not considered to be material weaknesses? yes X none reported
Type of auditor’s report issued on compliance for major programs: Unqualified
Any audit findings disclosed that are required to be reported in accordance with section 510(a) of Circular A-133? X yes no
Identification of major programs:
CFDA Number(s) Name of Federal Program or Cluster Multiple Research and Development Cluster
Child Care and Development Fund Cluster: 93.575 Child Care and Development Block Grant 93.713 ARRA – Child Care and Development Block Grant State Fiscal Stabilization Fund Cluster 84.394 State Fiscal Stabilization Fund – Education State Grants, Recovery Act Dollar threshold used to distinguish between type A and type B programs: $ 3,000,000
Auditee qualified as low-risk auditee? X yes no

62
UNIVERSITY OF IDAHO SCHEDULE OF FINDINGS AND QUESTIONED COSTS, (Continued) FOR THE YEAR ENDED JUNE 30, 2010
Section II - Financial Statement Findings
None.

63
UNIVERSITY OF IDAHO SCHEDULE OF FINDINGS AND QUESTIONED COSTS, (Continued) FOR THE YEAR ENDED JUNE 30, 2010
Section III - Federal Award Findings and Questioned Costs Federal Program: Research & Development Cluster Federal Agencies: National Science Foundation (CFDA #47.082), Department of Health and Human Services (CFDA #93.389) Criteria –OMB Circular A-110, Section 13, outlines requirements for recipients of federal financial assistance regarding compliance with the debarment and suspension common rule implementing Executive Orders (E. O. 12549 and 12689). This common rule restricts subawards and contracts with certain parties that are debarred, suspended or otherwise excluded from or ineligible for participation in Federal assistance programs or activities. For covered transactions occurring after November 26, 2003, the recipient must verify that the subrecipient or vendor entity is not suspended or debarred or otherwise excluded. This verification may be accomplished by checking the Excluded Parties List System (EPLS) maintained by the General Services Administration (GSA), collecting a certification from the entity, or adding a clause or condition to the covered transaction with that entity. Covered transactions include procurement contracts for goods and services awarded under a non-procurement transaction (e.g., grant or cooperative agreement) that are expected to equal or exceed $25,000 or meet certain other specified criteria. Condition: There were two covered transactions exceeding $25,000 for which verification of suspension and debarment status did not occur. Questioned Costs – None. During the audit, the Excluded Parties List System (EPLS) was checked for the specific entities with negative results. Context – The University’s process for checking suspension and debarment on purchases that do not go through a competitive bid process was lost with the departure of a trained employee and during transitional training of a new employee. Effect – The absence verifying suspension and debarment for all categories of covered transactions permits the possibility for suspended or debarred parties to inappropriately receive federal funds. Cause – The University had turnover in the purchasing department. During the loss of a trained employee and the transitional training of a new employee, suspension and debarment we not being verified on purchase orders and/or contracts that met certain criteria. Recommendation – Moss Adams recommends the purchasing office ensure suspension and debarment verifications are performed for all categories of covered transactions by training new employees. In addition, we further recommend management establish a monitoring or oversight mechanism to ensure compliance. Management Response--- All current staff members have been properly trained on suspension and debarment verification. A new Buyer has been hired. His duties will include maintenance of purchase order files to ensure compliance with suspension and debarment verification. The Senior Buyer will conduct a post-audit, bi-annual, representative sample of all “K” account purchase orders in excess of $25,000 to ensure compliance with this procedure.

64
SUMMARY SCHEDULE OF PRIOR YEAR AUDIT FINDINGS YEAR ENDED JUNE 30, 2010 FINDING 2009-1 Financial Statement Corrections Condition: The University did not have procedures in place to ensure that all records, books, and accounts were in agreement with the financial statement and schedule of expenditure of federal award dollar amounts and footnote disclosures. Recommendation: We recommend the University perform a final review of its financial statements and schedule of federal awards by agreeing all dollar amounts and footnote is closures to final adjusted records, books, and accounts. Status: During FY2010, the University developed review procedures and implemented them for the fiscal year 10 statement preparation. FINDING 2009-2 Allowable Costs Condition: The University has not established internal controls to provide reasonable assurance of compliance with the 5 percent retirement contribution limit. As a result, the University did not comply with the requirement. The University charged approximately $25,000 of retirement contributions to the Cooperative Extension program. This amount was 9% of the total salaries of approximately $220,000 charged to the program. Per the above criteria, the maximum allowed for retirement contributions for that salary amount is 5 percent, or approximately $11,000. The University charged approximately $14,000 (6 percent) in excess of the maximum allowed. Recommendation: We recommend the University develop policies and procedures to track compliance with the maximum retirement contribution, as stipulated by the United States Code and USDA Administrative Handbook for the Cooperative Extension program. Status: In FY2010, the University instituted policies and procedures to track compliance with the authoritative agencies. The University is now charging the correct percentages and tracking on a monthly basis to assure compliance.
65
FEDERAL GRANT/PRO GRAM TITLE
FEDERAL CFDA
NUMBER RESEARCH
EXPENDITURES
NO N-RESEARCH
EXPENDITURES TO TAL
EXPENDITURES
SCHEDULE OF EXPENDITURES OF FEDERAL AWARDSYEAR ENDED JUNE 30, 2010
DEPARTMENT OF AGRICULTURE DEPARTMENT OF AGRICULTURE
09JV11221632177 10. 9,462.23 9,462.23 09PA11046000048 10. 6,592.34 6,592.34 2009-10003-05142 10. 40,841.69 40,841.69 2009-10003-05142 10. 57,386.63 57,386.63 04DG11010000037 10. (0.03) (0.03)
SRS 05-DG-11330122-236 10. 13,830.80 13,830.80 08JV11221659038 10. 1,777.72 1,777.72 08CR11010500012 10. (569.15) (569.15) 08CS11010500034 10. 12,203.36 12,203.36 08JV11221633281 10. 27,870.99 27,870.99 08CS11011800027 10. 5,940.34 5,940.34 08JV11221632296 10. 2,806.77 2,806.77 09JV11221632011 10. 4,354.29 4,354.29
MOD#305PA11015600051 10. 21,998.74 21,998.74 09JV11221632067 10. 15,718.59 15,718.59
FSN09CR11060500022 10. 6,090.46 6,090.46 09CR11010500037 10. 14,853.68 14,853.68 09CS11221633209 10. 8,658.85 8,658.85
PNW03JV11261988074 10. (700.00) (700.00) 03PA11046000030 10. 11,932.57 11,932.57 04CR11132424144 10. (0.26) (0.26) 05JV11111124103 10. 6,306.12 6,306.12 06JV11111133065 10. 0.21 0.21
PNW06JV11261975281 10. 7,420.42 7,420.42 06JV11221648191 10. 32,732.90 32,732.90 06CA11120101028 10. 18,021.28 18,021.28 07JV11221659164 10. 18,538.72 18,538.72 07JV11111133088 10. 57,965.20 57,965.20
PNW07JV11261985166 10. 4,445.04 4,445.04 07JV11221659314 10. 36,442.40 36,442.40 07JV11221644280 10. 1,791.45 1,791.45
PNW07JV11261987168 10. 29,855.31 29,855.31 07CS11221662248 10. 705.81 705.81 08JV11221659036 10. 57,819.61 57,819.61 08JV11221665050 10. 32,952.88 32,952.88
08-JV-11221633-159 10. 11,500.89 11,500.89 PNW08JV11261900081 10. 11,110.43 11,110.43 PNW08JV11261900082 10. 80,631.10 80,631.10
08JV11060123103 10. 51,586.91 51,586.91 08JV11221632238 10. 21,791.77 21,791.77 08JV11221634236 10. 77,376.58 77,376.58 08JV11221633293 10. 26,928.98 26,928.98 08JV11221633201 10. 38,714.59 38,714.59 08JV11221611160 10. 31,633.83 31,633.83
08-JV-11221633-159 10. 12,337.54 12,337.54 09CS1221633210 10. 11,035.81 11,035.81
09JV11221637270 10. 51.98 51.98 09JV1221633325 10. 2,163.62 2,163.62
09JV11221634294 10. 578.49 578.49 09JV11052007214 10. 9,263.16 9,263.16 09CR11221633327 10. 6,127.16 6,127.16 09CA11010403031 10. 7,372.89 7,372.89 09CS11040204036 10. 19,399.99 19,399.99 10CR11221637077 10. 254,567.04 254,567.04 07DG11132762185 10. 6,262.28 6,262.28

66
FEDERAL GRANT/PRO GRAM TITLE
FEDERAL CFDA
NUMBER RESEARCH
EXPENDITURES
NO N-RESEARCH
EXPENDITURES TO TAL
EXPENDITURES
SCHEDULE OF EXPENDITURES OF FEDERAL AWARDSYEAR ENDED JUNE 30, 2010
DEPARTMENT OF AGRICULTURE (Continued)08JV11221611160 10. 342,893.40 342,893.40 09JV11221637312 10. 466,643.40 466,643.40
IFTNCIntrmnt For. Tree Nutrition Co 10 18,943.44 18,943.44
ARRA DEPARTMENT O F AGRICULTURE (RECO VERY)10JV112282B1015 10. 12,762.05 12,762.05
DEPARTMENT OF AGRICULTURE Federal Pass Through
IACAWARDLTR 10. 31,890.21 31,890.21 SRTGGAAWARDLTR 10. 17,388.41 17,388.41
IF&G Idaho Carnivore Project 10. 1,190.72 1,190.72 AGREEMENTFORSERVICES 10. 12,360.04 12,360.04
IF&G Amphibian Fungus 10. 682.81 682.81 IDAFIS - Wildlife Education 10. 16,392.35 16,392.35
20082009MOU 10. 4,363.46 4,363.46 G002539 10. 2,823.07 2,823.07
Nez Perce Tribe- Lapwai Sewer Proj 10. 3,025.16 3,025.16 IDOL ID Master Forest Owner Program 10. 14,991.25 14,991.25
IF&G Wolf DNA Analysis 10. 1,774.04 1,774.04 IETIC Director 10. 21,384.78 21,384.78
IETIC Data Manager 10. 722.58 722.58 T ree Nutrition Coop II 10. 1,552.82 1,552.82
IETIC Test 3 Systematic Insecticide 10. 758.83 758.83
AGRICULTURE RESEARCH SERVICE Agricultural Research-Basic and Applied Research 10.001 1,283,586.79 3,290.24 1,286,877.03 Federal Pass Through 10.001 185,204.69 185,204.69
- AGRICULTURAL MARKETING SERVICE - Federal-State Marketing Improvement Program 10.156 26,444.32 26,444.32 Specialty Crop Block Grant Program 10.169 - Federal Pass Through 10.169 7,103.27 7,103.27 Specialty Crop Block Grant Program - Farm Bill 10.170 - Federal Pass Through 10.170 39,398.26 39,398.26
- ANIMAL AND PLANT HEALTH INSPECTION SERVICE - Plant and Animal Disease, Pest Control, and Animal Care 10.025 68,065.16 68,065.16
- NATIONAL INSTITUTE OF FOOD AND AGRICULTURE - Grants for Agricultural Research, Special Research Grants 10.200 1,510,751.91 1,510,751.91 Federal Pass Through 10.200 737,163.36 13,505.23 750,668.59 Cooperative Forestry Research 10.202 353,702.41 353,702.41 Payments to Agricultural Experiment Stations Under the Hatch Act 10.203 1,540,369.68 1,540,369.68 Grants for Agricultural Research_Competitive Research Grants 10.206 812,326.79 812,326.79 Federal Pass Through 10.206 110,050.94 110,050.94 Animal Health and Disease Research 10.207 46,352.25 46,352.25 Food and Agricultural Sciences National Needs Graduate Fellowship Gra 10.210 - Federal Pass Through 10.210 834.48 834.48 Small Business Innovation Research 10.212 - Federal Pass Through 10.212 8,106.35 8,106.35 Sustainable Agriculture Research and Education 10.215 - Federal Pass Through 10.215 21,589.33 1,222.94 22,812.27 Higher Education Challenge Grants 10.217 21,418.42 21,418.42 Federal Pass Through 10.217 15,781.69 26,457.11 42,238.80
67
FEDERAL GRANT/PRO GRAM TITLE
FEDERAL CFDA
NUMBER RESEARCH
EXPENDITURES
NO N-RESEARCH
EXPENDITURES TO TAL
EXPENDITURES
SCHEDULE OF EXPENDITURES OF FEDERAL AWARDSYEAR ENDED JUNE 30, 2010
DEPARTMENT OF AGRICULTURE (Continued) Biotechnology Risk Assessment Research 10.219 61,944.59 61,944.59 Higher Education Multicultural Scholars Program 10.220 57,130.65 57,130.65 Secondary and Two-Year Postsecondary Agriculture Education Challen 10.226 21,878.62 21,878.62 1994 Institutions Research Program 10.227 - Federal Pass Through 10.227 19,504.18 19,504.18 Integrated Programs 10.303 1,139,776.07 1,139,776.07 Federal Pass Through 10.303 10,574.73 33,039.59 43,614.32 Homeland Security_Agriculture 10.304 - Federal Pass Through 10.304 72,534.61 72,534.61 Biodiesel 10.306 169,002.04 169,002.04 Organic Agriculture Research and Extension Initiative 10.307 - Federal Pass Through 10.307 3,676.01 3,676.01 Specialty Crop Research Initiative 10.309 - Federal Pass Through 10.309 7,540.15 7,540.15 Agriculture and Food Research Initiative (AFRI) 10.310 131,164.36 131,164.36 Federal Pass Through 10.310 4,110.75 4,110.75 Beginning Farmer and Rancher Development Program 10.311 - Federal Pass Through 10.311 1,815.00 1,815.00 Cooperative Extension Service 10.500 285,837.91 3,433,791.25 3,719,629.16 Federal Pass Through 10.500 35,610.18 202,829.40 238,439.58
- FOOD AND CONSUMER SERVICE - Child and Adult Care Food Programs 10.558 - Federal Pass Through 10.558 31,599.38 31,599.38 State Administrative Matching Grants for the Supplemental Nutrition A 10.561 - Federal Pass Through 10.561 705,903.27 705,903.27
- FOREST SERVICE - Cooperative Forestry Assistance 10.664 156,959.80 156,959.80 Federal Pass Through 10.664 48,122.42 11,735.50 59,857.92 Rural Development, Forestry, and Communities 10.672 (94.85) (94.85) Forest Health Protection 10.680 4,521.70 4,521.70 ARRA Recovery Act of 2009: Capital Improvement and Mainte 10.687 14,760.67 14,760.67
- NATURAL RESOURCES CONSERVATION SERVICE - Resource Conservation and Development 10.901 18,034.02 18,034.02 Soil & Water Conservation 10.902 194,676.57 194,676.57 Soil Survey 10.903 10,615.90 10,615.90 Environmental Quality Incentives Program 10.912 6,457.26 6,457.26 Federal Pass Through 10.912 1,340.38 1,340.38
FOREIGN AGRICULTURAL SERVICE Cochran Fellowship Program-International Training-Foreign Participa 10.962 12,673.51 12,673.51
Total - Department of Agriculture 10,043,216.26 5,917,600.80 15,960,817.06
DEPARTMENT OF COMMERCE DEPARTMENT OF COMMERCE
AB133F06SE4011 11. 6,524.90 6,524.90 AB133F06SE4951 11. 3,156.01 3,156.01 AB133F07CN0222 11. 3,979.91 3,979.91
ABK133F07CN0222 11. 40,752.94 40,752.94 AB133F07SE5377 11. 41,029.11 41,029.11 RA133R08SE2931 11. 4,278.96 4,278.96 AB133F06SE5682 11. 15,151.12 15,151.12 AB133F09SE3785 11. 21,984.44 21,984.44
68
FEDERAL GRANT/PRO GRAM TITLE
FEDERAL CFDA
NUMBER RESEARCH
EXPENDITURES
NO N-RESEARCH
EXPENDITURES TO TAL
EXPENDITURES
SCHEDULE OF EXPENDITURES OF FEDERAL AWARDSYEAR ENDED JUNE 30, 2010
DEPARTMENT OF COMMERCE (Continued) DEPARTMENT OF COMMERCE Federal Pass Through
MML170521 11. 64,207.81 64,207.81
ECONOMIC DEVELOPMENT ADMINISTRATION Economic Development_Technical Assistance 11.303 - Federal Pass Through 11.303 18,623.59 18,623.59
NATIONAL OCEANIC AND ATMOSPHERIC ADMINISTRATION Climate and Atmospheric Research 11.431 20,931.81 20,931.81 Federal Pass Through 11.431 10,764.05 10,764.05 Pacific Coast Salmon Recovery: Pacific Salmon Treaty Program 11.438 - Federal Pass Through 11.438 354,389.41 354,389.41 Hydrologic Research 11.462 - Federal Pass Through 11.462 23,902.42 23,902.42 Unallied Science Program 11.472 112,815.80 112,815.80 Federal Pass Through 11.472 47,228.76 47,228.76
NATIONAL INSTITUTE OF STANDARDS AND TECHNOLOGY Manufacturing Extension Partnership 11.611 - Federal Pass Through 11.611 143,957.55 143,957.55
Total - Department of Commerce 706,889.64 226,788.95 933,678.59
DEPARTMENT OF DEFENSE DEPARTMENT OF DEFENSE
W912EF08C0009 12. (337.68) (337.68) W9127N09200009 12. 10,674.78 10,674.78
TOW9127N0920009001 12. 3,827.38 3,827.38 W912HQ07C0014 12. 98,321.82 98,321.82 W91ZLK08P0739 12. 588.23 588.23 N0016708P0432 12. 16,798.23 16,798.23 N0016709P0457 12. 9,213.16 9,213.16
ARRA DEPARTMENT O F DEFENSE (RECO VERY)ARRA W912EF10P0008 12. 11,824.74 11,824.74
DEPARTMENT OF DEFENSE Federal Pass Through
ACOEW912EF08D0005TO003 12. 84,579.07 84,579.07 ACOEW912EF08D0005TO003 12. 140,197.37 140,197.37
0800026804 12. 171,251.06 171,251.06 W912EF08D0005TO6 12. 184,392.29 184,392.29
8007000110 12. 34,665.33 34,665.33 080026805 12. 22,006.53 22,006.53
0800026806 12. 43,325.09 43,325.09 PO 173038 LINE #2 12. 37.39 37.39
RSC07046 12. 232,811.47 232,811.47 PO1107PROJECT8894 12. 1,294.30 1,294.30 AGREEMENT07/26/08 12. 134,671.58 134,671.58
00717161BR001 12. 267,297.40 267,297.40 UI1 12. 37,875.86 37,875.86
114277G002680 12. 13,125.55 13,125.55
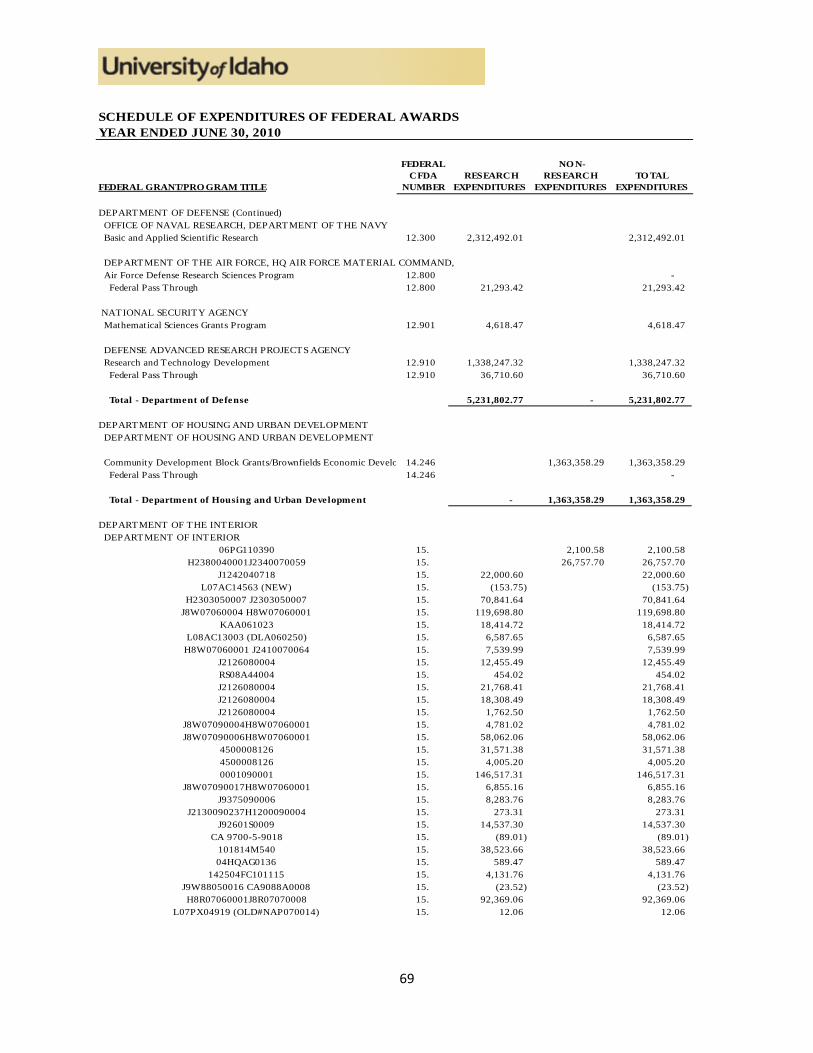
69
FEDERAL GRANT/PRO GRAM TITLE
FEDERAL CFDA
NUMBER RESEARCH
EXPENDITURES
NO N-RESEARCH
EXPENDITURES TO TAL
EXPENDITURES
SCHEDULE OF EXPENDITURES OF FEDERAL AWARDSYEAR ENDED JUNE 30, 2010
DEPARTMENT OF DEFENSE (Continued) OFFICE OF NAVAL RESEARCH, DEPARTMENT OF THE NAVY Basic and Applied Scientific Research 12.300 2,312,492.01 2,312,492.01
DEPARTMENT OF THE AIR FORCE, HQ AIR FORCE MATERIAL COMMAND, Air Force Defense Research Sciences Program 12.800 - Federal Pass Through 12.800 21,293.42 21,293.42
NATIONAL SECURITY AGENCY Mathematical Sciences Grants Program 12.901 4,618.47 4,618.47
DEFENSE ADVANCED RESEARCH PROJECTS AGENCY Research and Technology Development 12.910 1,338,247.32 1,338,247.32 Federal Pass Through 12.910 36,710.60 36,710.60
Total - Department of Defense 5,231,802.77 - 5,231,802.77
DEPARTMENT OF HOUSING AND URBAN DEVELOPMENT DEPARTMENT OF HOUSING AND URBAN DEVELOPMENT
Community Development Block Grants/Brownfields Economic Develo 14.246 1,363,358.29 1,363,358.29 Federal Pass Through 14.246 - Total - Department of Housing and Urban Development - 1,363,358.29 1,363,358.29
DEPARTMENT OF THE INTERIOR DEPARTMENT OF INTERIOR
06PG110390 15. 2,100.58 2,100.58 H2380040001J2340070059 15. 26,757.70 26,757.70
J1242040718 15. 22,000.60 22,000.60 L07AC14563 (NEW) 15. (153.75) (153.75)
H2303050007 J2303050007 15. 70,841.64 70,841.64 J8W07060004 H8W07060001 15. 119,698.80 119,698.80
KAA061023 15. 18,414.72 18,414.72 L08AC13003 (DLA060250) 15. 6,587.65 6,587.65
H8W07060001 J2410070064 15. 7,539.99 7,539.99 J2126080004 15. 12,455.49 12,455.49 RS08A44004 15. 454.02 454.02 J2126080004 15. 21,768.41 21,768.41 J2126080004 15. 18,308.49 18,308.49 J2126080004 15. 1,762.50 1,762.50
J8W07090004H8W07060001 15. 4,781.02 4,781.02 J8W07090006H8W07060001 15. 58,062.06 58,062.06
4500008126 15. 31,571.38 31,571.38 4500008126 15. 4,005.20 4,005.20 0001090001 15. 146,517.31 146,517.31
J8W07090017H8W07060001 15. 6,855.16 6,855.16 J9375090006 15. 8,283.76 8,283.76
J2130090237H1200090004 15. 273.31 273.31 J92601S0009 15. 14,537.30 14,537.30
CA 9700-5-9018 15. (89.01) (89.01) 101814M540 15. 38,523.66 38,523.66 04HQAG0136 15. 589.47 589.47
142504FC101115 15. 4,131.76 4,131.76 J9W88050016 CA9088A0008 15. (23.52) (23.52) H8R07060001J8R07070008 15. 92,369.06 92,369.06
L07PX04919 (OLD#NAP070014) 15. 12.06 12.06

70
FEDERAL GRANT/PRO GRAM TITLE
FEDERAL CFDA
NUMBER RESEARCH
EXPENDITURES
NO N-RESEARCH
EXPENDITURES TO TAL
EXPENDITURES
SCHEDULE OF EXPENDITURES OF FEDERAL AWARDSYEAR ENDED JUNE 30, 2010
DEPARTMENT OF THE INTERIOR (Continued)J2126077001H1200040001 15. 34,587.64 34,587.64
J8W07080001_H8W07060001 15. 5,945.58 5,945.58 J8R07080003_H8R07060001 15. 7,377.84 7,377.84 H2380040001 J2370080538 15. 31,665.29 31,665.29
101818M840 15. 23,948.31 23,948.31 H8W07060001TA#J8W07080021 15. 24,674.45 24,674.45
J8R07090001H8R07060001 15. 41,761.95 41,761.95 06HQGR0082 M004 15. 18,213.53 18,213.53
J2302090001 15. 211,245.77 211,245.77 06HQGR0082 M004 15. 11,591.12 11,591.12 06HQGR0082 M004 15. 13,020.50 13,020.50 06HQGR0082 M004 15. 9,177.09 9,177.09
H2370094000 J2302090002 15. 320,180.61 320,180.61 301819M597 15. 17,250.47 17,250.47 J2330106500 15. 278,108.83 278,108.83 L08AC13334 15. 340.78 340.78
AG9C5000788 15. 4,009.96 4,009.96 J95600090114H2370094000 15. 25,529.24 25,529.24 H2303050007 J2303060002 15. 83,105.05 83,105.05
H2303050007 TA J2303060003 15. 5.79 5.79 AG7C5000738 15. (7.49) (7.49) 08HQGR0104 15. 890.42 890.42 DTP070043 15. 1,051.29 1,051.29
IFTNCIntrmnt For. Tree Nutrition Co 15. 5,679.18 5,679.18
DEPARTMENT OF INTERIOR Federal Pass Through
SSIT&UOFIDAHOMOUNTAINGOAT 15. 3,693.02 3,693.02 NDG&F Paddlefish Aging II 15. 31,069.50 31,069.50
IF&G Black Bear Project 15. 18,684.30 18,684.30 IF&G Forest Carnivores in SW Idaho 15. 580.39 580.39
IF&G Pygmy Rabbit Distribution 15. 24,000.28 24,000.28 N/A 15. 4,523.01 4,523.01
NPT/UOFI: FECALDNA 15. 263.64 263.64 LETTER 9/27/07 MACK 15. 8,757.99 8,757.99
144208G004A 15. 12,947.83 12,947.83 IF&G: Pygmy Rabbit DNA 15. 8,536.30 8,536.30
AV08-ID03 15. 25,636.77 25,636.77 L0105A 15. 849.41 849.41
IDFG- Ungulate Ecology Atwood 15. 4,616.10 4,616.10 IF&G Wildlife Habitat Surveys 15. 1,195.15 1,195.15
IF&G Recovery Activities-Squirrels 15. 9,300.27 9,300.27 IF&G: T iger Beetle Taxonomy 15. 15,000.00 15,000.00
IETIC Director - BLM 15. 4,185.82 4,185.82 IETIC Director - BIA 15. 3,761.94 3,761.94
IETIC Data Manager - BLM 15. 141.44 141.44 IETIC Data Manager - BIA 15. 127.11 127.11
IETIC Russell H Hudson Gene Archive 15. 101.55 101.55 T ree Nutrition Coop II 15. 311.04 311.04
IETIC Test 3 Systematic Insecticide - BLM 15. 148.53 148.53 IETIC Test 3 Systematic Insecticide - BIA 15. 133.49 133.49
Department of Interior 15.DAC 26,381.21 26,381.21 Department of Interior 15.DAV 2,735.43 2,735.43 Department of Interior 15.SFB - Federal Pass Through 15.SFB 27,528.15 27,528.15
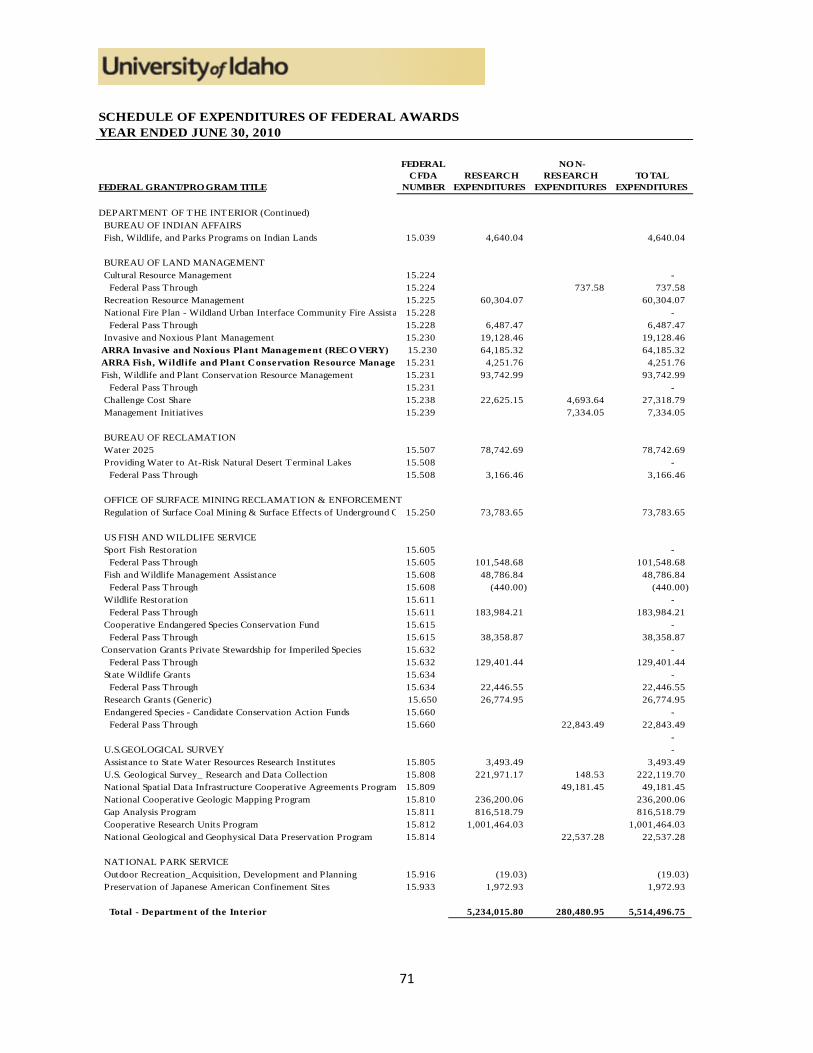
71
FEDERAL GRANT/PRO GRAM TITLE
FEDERAL CFDA
NUMBER RESEARCH
EXPENDITURES
NO N-RESEARCH
EXPENDITURES TO TAL
EXPENDITURES
SCHEDULE OF EXPENDITURES OF FEDERAL AWARDSYEAR ENDED JUNE 30, 2010
DEPARTMENT OF THE INTERIOR (Continued) BUREAU OF INDIAN AFFAIRS Fish, Wildlife, and Parks Programs on Indian Lands 15.039 4,640.04 4,640.04
BUREAU OF LAND MANAGEMENT Cultural Resource Management 15.224 - Federal Pass Through 15.224 737.58 737.58 Recreation Resource Management 15.225 60,304.07 60,304.07 National Fire Plan - Wildland Urban Interface Community Fire Assista 15.228 - Federal Pass Through 15.228 6,487.47 6,487.47 Invasive and Noxious Plant Management 15.230 19,128.46 19,128.46 ARRA Invasive and Noxious Plant Management (RECO VERY) 15.230 64,185.32 64,185.32 ARRA Fish, Wildlife and Plant Conservation Resource Manage 15.231 4,251.76 4,251.76 Fish, Wildlife and Plant Conservation Resource Management 15.231 93,742.99 93,742.99 Federal Pass Through 15.231 - Challenge Cost Share 15.238 22,625.15 4,693.64 27,318.79 Management Initiatives 15.239 7,334.05 7,334.05
BUREAU OF RECLAMATION Water 2025 15.507 78,742.69 78,742.69 Providing Water to At-Risk Natural Desert Terminal Lakes 15.508 - Federal Pass Through 15.508 3,166.46 3,166.46
OFFICE OF SURFACE MINING RECLAMATION & ENFORCEMENT Regulation of Surface Coal Mining & Surface Effects of Underground C 15.250 73,783.65 73,783.65
US FISH AND WILDLIFE SERVICE Sport Fish Restoration 15.605 - Federal Pass Through 15.605 101,548.68 101,548.68 Fish and Wildlife Management Assistance 15.608 48,786.84 48,786.84 Federal Pass Through 15.608 (440.00) (440.00) Wildlife Restoration 15.611 - Federal Pass Through 15.611 183,984.21 183,984.21 Cooperative Endangered Species Conservation Fund 15.615 - Federal Pass Through 15.615 38,358.87 38,358.87 Conservation Grants Private Stewardship for Imperiled Species 15.632 - Federal Pass Through 15.632 129,401.44 129,401.44 State Wildlife Grants 15.634 - Federal Pass Through 15.634 22,446.55 22,446.55 Research Grants (Generic) 15.650 26,774.95 26,774.95 Endangered Species - Candidate Conservation Action Funds 15.660 - Federal Pass Through 15.660 22,843.49 22,843.49
- U.S.GEOLOGICAL SURVEY - Assistance to State Water Resources Research Institutes 15.805 3,493.49 3,493.49 U.S. Geological Survey_ Research and Data Collection 15.808 221,971.17 148.53 222,119.70 National Spatial Data Infrastructure Cooperative Agreements Program 15.809 49,181.45 49,181.45 National Cooperative Geologic Mapping Program 15.810 236,200.06 236,200.06 Gap Analysis Program 15.811 816,518.79 816,518.79 Cooperative Research Units Program 15.812 1,001,464.03 1,001,464.03 National Geological and Geophysical Data Preservation Program 15.814 22,537.28 22,537.28
NATIONAL PARK SERVICE Outdoor Recreation_Acquisition, Development and Planning 15.916 (19.03) (19.03) Preservation of Japanese American Confinement Sites 15.933 1,972.93 1,972.93
Total - Department of the Interior 5,234,015.80 280,480.95 5,514,496.75
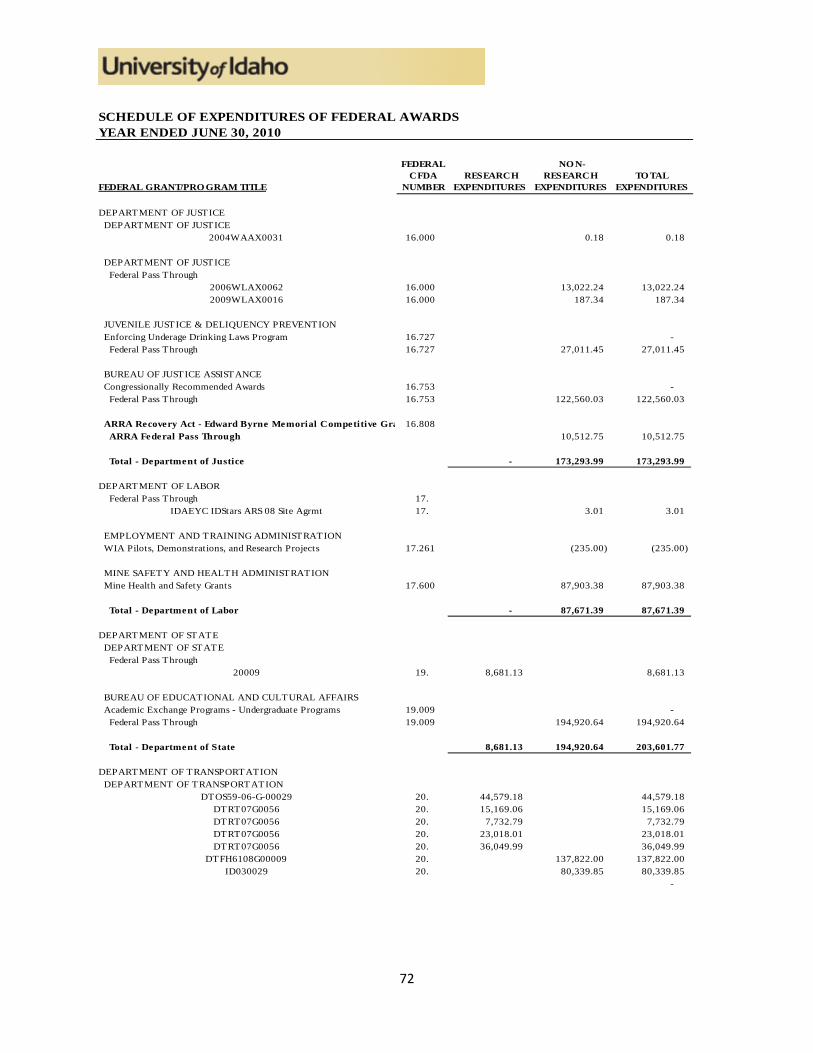
72
FEDERAL GRANT/PRO GRAM TITLE
FEDERAL CFDA
NUMBER RESEARCH
EXPENDITURES
NO N-RESEARCH
EXPENDITURES TO TAL
EXPENDITURES
SCHEDULE OF EXPENDITURES OF FEDERAL AWARDSYEAR ENDED JUNE 30, 2010
DEPARTMENT OF JUSTICE DEPARTMENT OF JUSTICE
2004WAAX0031 16.000 0.18 0.18
DEPARTMENT OF JUSTICE Federal Pass Through
2006WLAX0062 16.000 13,022.24 13,022.24 2009WLAX0016 16.000 187.34 187.34
JUVENILE JUSTICE & DELIQUENCY PREVENTION Enforcing Underage Drinking Laws Program 16.727 - Federal Pass Through 16.727 27,011.45 27,011.45
BUREAU OF JUSTICE ASSISTANCE Congressionally Recommended Awards 16.753 - Federal Pass Through 16.753 122,560.03 122,560.03
ARRA Recovery Act - Edward Byrne Memorial Competitive Gra 16.808 ARRA Federal Pass Through 10,512.75 10,512.75
Total - Department of Justice - 173,293.99 173,293.99
DEPARTMENT OF LABOR Federal Pass Through 17.
IDAEYC IDStars ARS 08 Site Agrmt 17. 3.01 3.01
EMPLOYMENT AND TRAINING ADMINISTRATION WIA Pilots, Demonstrations, and Research Projects 17.261 (235.00) (235.00)
MINE SAFETY AND HEALTH ADMINISTRATION Mine Health and Safety Grants 17.600 87,903.38 87,903.38
Total - Department of Labor - 87,671.39 87,671.39
DEPARTMENT OF STATE DEPARTMENT OF STATE Federal Pass Through
20009 19. 8,681.13 8,681.13
BUREAU OF EDUCATIONAL AND CULTURAL AFFAIRS Academic Exchange Programs - Undergraduate Programs 19.009 - Federal Pass Through 19.009 194,920.64 194,920.64
Total - Department of State 8,681.13 194,920.64 203,601.77
DEPARTMENT OF TRANSPORTATION DEPARTMENT OF TRANSPORTATION
DTOS59-06-G-00029 20. 44,579.18 44,579.18 DTRT07G0056 20. 15,169.06 15,169.06 DTRT07G0056 20. 7,732.79 7,732.79 DTRT07G0056 20. 23,018.01 23,018.01 DTRT07G0056 20. 36,049.99 36,049.99
DTFH6108G00009 20. 137,822.00 137,822.00 ID030029 20. 80,339.85 80,339.85
-

73
FEDERAL GRANT/PRO GRAM TITLE
FEDERAL CFDA
NUMBER RESEARCH
EXPENDITURES
NO N-RESEARCH
EXPENDITURES TO TAL
EXPENDITURES
SCHEDULE OF EXPENDITURES OF FEDERAL AWARDSYEAR ENDED JUNE 30, 2010
DEPARTMENT OF TRANSPORTATION (Continued) DEPARTMENT OF TRANSPORTATION Federal Pass Through
108664G002478 20. 7,487.00 7,487.00 108664G002478 20. 1,250.28 1,250.28
T0013GBTO1 20. 25.09 25.09 SPR2005(032) #9666 20. 39,966.51 39,966.51
T0013G-B 20. 19,478.48 19,478.48 T0013G-B 20. 18,637.31 18,637.31 T0013RA 20. 5,504.34 5,504.34
HR2007271 20. 50,389.69 50,389.69 ITD JEMS Program 20. 55,922.12 55,922.12
08576 20. 3,818.91 3,818.91 Moscow FY10 Safe Rtes to School 20. 8,383.98 8,383.98
HCR20 20. 3,184.15 3,184.15 SWCA Sandpoint Archaeological Project 20. 46,450.52 46,450.52
ITD Superpave Performance Test 20. 22,829.23 22,829.23 ITD Develop Stat Correlations 20. 626.98 626.98
DEPARTMENT OF TRANSPORTATION ARRA Federal Pass Through
ARRA 7297PRO JA011(960) 20. 20,629.36 20,629.36 -
FEDERAL HIGHWAY ADMINISTRATION - Highway Planning and Construction 20.205 - Federal Pass Through 20.205 192,884.63 192,884.63
FEDERAL TRANSIT ADMINISTRATION Capital Assistance Program for Elderly Persons and Persons with Disab 20.513 - Federal Pass Through 20.513 (99.99) (99.99)
RESEARCH AND SPECIAL PROGRAMS ADMINISTRATION University Transportation Centers Program 20.701 630,782.49 630,782.49
Total - Department of Transportation 1,218,783.70 254,078.26 1,472,861.96
DEPARTMENT OF TREASURY INTERNAL REVENUE SERVICE Low-Income Taxpayer Clinics 21.008 81,686.77 81,686.77
Total - Department of Treasury - 81,686.77 81,686.77
NATIONAL AERONAUTICS AND SPACE ADMINISTRATION NATIONAL AERONAUTICS AND SPACE ADMINISTRATION
NNG05GA92G 43. 77,595.77 77,595.77 NNG05GA92G 43. 40,800.00 40,800.00 NNG06GG29G 43. 60,894.03 60,894.03 NNX06AC12G 43. 120.46 120.46 NNG06GG29G 43. 35,719.40 35,719.40 NNX06AB15G 43. 96,353.38 96,353.38 NNX06AB15G 43. 25,000.00 25,000.00 NNX06AB17G 43. 174,766.57 174,766.57 NNX06AB17G 43. 35,000.00 35,000.00 NNX06AB17G 43. 97,759.27 97,759.27 NNX07AL05A 43. 153,956.53 153,956.53 NNX07AQ67G 43. 161,945.56 161,945.56 NNX07AT60A 43. 162,156.51 162,156.51

74
FEDERAL GRANT/PRO GRAM TITLE
FEDERAL CFDA
NUMBER RESEARCH
EXPENDITURES
NO N-RESEARCH
EXPENDITURES TO TAL
EXPENDITURES
SCHEDULE OF EXPENDITURES OF FEDERAL AWARDSYEAR ENDED JUNE 30, 2010
NATIONAL AERONAUTICS AND SPACE ADMINISTRATION (Continued)NNX08AL68G 43. 220,174.92 220,174.92 NNX08AK71G 43. 56,572.96 56,572.96 NNX08AT68A 43. 299,893.56 299,893.56 NNX08AQ94G 43. 80,723.88 80,723.88 NNX07AL05A 43. 3,717.68 3,717.68 NNX07AL05A 43. (424.39) (424.39) NNX08BA10G 43. 68,111.42 68,111.42 NNX07AL05A 43. 163.32 163.32 NNA08BC34P 43. 0.27 0.27 NNX09AD39G 43. 159,461.54 159,461.54 NNX09AM99G 43. 44,987.04 44,987.04 NNX07AL05A 43. 22,755.18 22,755.18 NNX09AV04A 43. 10,907.57 10,907.57
- NATIONAL AERONAUTICS AND SPACE ADMINISTRATION Federal Pass Through
1279002 43. 12,507.86 12,507.86 A797UNIVID 43. 51,135.23 51,135.23
Z650002 43. 16,113.96 16,113.96 PO#10285590 43. 44,775.87 44,775.87 3001056333 43. 149,293.60 149,293.60
1361190 43. 4,686.93 4,686.93 Y503506 43. 28,487.53 28,487.53
OR1241000101 43. 155.51 155.51 UND0014026 43. 30,267.01 30,267.01
1380195 43. 8,913.85 8,913.85 UND0015364 43. 28,354.41 28,354.41
1403702 43. 2,553.13 2,553.13 -
NATIONAL AERONAUTICS AND SPACE ADMINISTRATION - ARRA Federal Pass Through -
ARRA 10402 .43 27,659.52 27,659.52 -
Aerospace Education Services Program 43.001 150,413.92 802,640.88 953,054.80 Technology Transfer 43.002 - Federal Pass Through 43.002 15,385.05 15,385.05
Total - National Aeronautics and Space Administration 2,589,727.41 872,729.28 3,462,456.69
NATIONAL FOUNDATION ON THE ARTS AND THE HUMANITIES NATIONAL FOUNDATION ON THE ARTS AND THE HUMANITIES Federal Pass Through
FED08040 45. 3,230.00 3,230.00 00945AE10 45. 9,368.00 9,368.00
ARRA NATIO NAL FO UNDATIO N O N THE ARTS AND THE HUMANITIES ARRA Federal Pass Through 45.
ARRA-100010 45. 4,466.37 4,466.37
NATIONAL ENDOWMENT FOR THE ARTS Promotion of the Arts-Grants to Organizations & Individuals 45.024 20,472.46 20,472.46 Promotion of the Arts_Partnership Agreements 45.025 Federal Pass Through 45.025 6,535.95 6,535.95

75
FEDERAL GRANT/PRO GRAM TITLE
FEDERAL CFDA
NUMBER RESEARCH
EXPENDITURES
NO N-RESEARCH
EXPENDITURES TO TAL
EXPENDITURES
SCHEDULE OF EXPENDITURES OF FEDERAL AWARDSYEAR ENDED JUNE 30, 2010
NATIONAL FOUNDATION ON THE ARTS AND THE HUMANITIES (Continued) NATIONAL ENDOWMENT FOR THE HUMANITIES Promotion of the Humanities Federal-State Partnership 45.129 - Federal Pass Through 45.129 4,576.74 4,576.74 Promotion of the Humanities_We the People 45.168 - Federal Pass Through 45.168 738.00 738.00
INSTITUTE OF MUSEUM AND LIBRARY SERVICES Grants to States 45.310 - Federal Pass Through 45.310 693.52 693.52
Total - National Foundation on the Arts and Humanities - 50,081.04 50,081.04
NATIONAL SCIENCE FOUNDATION National Science Foundation Federal Pass Through
107980G002283 47. 8,846.31 8,846.31 AMP Minority Participation 47. 4,746.06 4,746.06
111462G002670 47. 4,590.65 4,590.65
Engineering Grants 47.041 366,160.74 366,160.74 Federal Pass Through 47.041 7,484.24 7,484.24 Mathematical and Physical Sciences 47.049 176,719.28 176,719.28 Federal Pass Through 47.049 39,630.45 39,630.45 Geosciences 47.050 365,129.65 365,129.65 Federal Pass Through 47.050 5,963.65 5,963.65 Biological Sciences 47.074 867,682.17 867,682.17 Federal Pass Through 47.074 156,672.33 156,672.33 Social Behavioral and Economic Sciences 47.075 113,454.09 113,454.09 Education and Human Resources 47.076 908,759.02 908,759.02 Federal Pass Through 47.076 7,225.33 7,225.33 Polar Sciences 47.078 83,930.42 83,930.42 International Science and Engineering (OISE) 47.079 48,459.16 48,459.16 Office of Cyberinfrastructure 47.080 2,924,610.32 2,924,610.32 Office of Experimental Program to Stimulate Competitive Research 47.081 57,423.05 57,423.05 ARRA Trans-NSF Recovery Act Reasearch Support (RECO VERY 47.082 639,455.83 639,455.83 ARRA Federal Pass Through 47.082 3,622.06 3,622.06
Total - National Science Foundation 6,790,564.81 - 6,790,564.81
ENVIRONMENTAL PROTECTION AGENCY ENVIRONMENTAL PROTECTION AGENCY Federal Pass Through
S332 66. 26,347.76 26,347.76 Nez Perce Tribe- Lapwai Sewer Proj 66. 3,025.16 3,025.16
OFFICE OF WATER Capitalization Grants for Drinking Water State Revolving Funds 66.468 - Federal Pass Through 66.468 10,626.99 10,626.99
OFFICE OF SOLID WASTE AND EMERGENCY RESPONSE Underground Storage Tank Prevention, Detection and Compliance Pro 66.804 - Federal Pass Through 66.804 8,782.67 8,782.67
- Total - Environmental Protection Agency 29,372.92 19,409.66 48,782.58

76
FEDERAL GRANT/PRO GRAM TITLE
FEDERAL CFDA
NUMBER RESEARCH
EXPENDITURES
NO N-RESEARCH
EXPENDITURES TO TAL
EXPENDITURES
SCHEDULE OF EXPENDITURES OF FEDERAL AWARDSYEAR ENDED JUNE 30, 2010
NUCLEAR REGULATORY COMMISSION NUCLEAR REGULATORY COMMISSION
NRC3808914 77. 54,894.43 54,894.43
Total - Nuclear Regulatory Commission - 54,894.43 54,894.43
DEPARTMENT OF ENERGY DEPARTMENT OF ENERGY
00037899 81. 303.60 303.60 0042600199102900 81. 51,588.10 51,588.10
00047127 81. 364.42 364.42 DEFG0203ER41270 81. 59,355.93 59,355.93
TO00043 81. 2.13 2.13 6838901 81. 152,524.38 152,524.38
42246TO41A2 81. 10,817.93 10,817.93 00042246TO00052 81. 38,157.08 38,157.08
TO00070 81. 34,400.55 34,400.55
DEPARTMENT OF ENERGY Federal Pass Through
42246 TO6 81. 432,521.28 432,521.28 00042246 TO00069 81. 1,339,481.60 1,339,481.60
TO27 81. 34,336.70 34,336.70 TO46 81. 66,137.72 66,137.72
TC000005870000 81. 24,994.51 24,994.51 C0822C0802240 81. 422,706.34 422,706.34
DEGG08WB39265 81. 271.77 271.77 DEGG6509WB42007 81. 36,591.27 36,591.27
42246TO62 81. 1,986.37 1,986.37 TC000006567000 81. 19,337.34 19,337.34
04-251B 81. 53,401.56 53,401.56 04-251B 81. 34,539.94 34,539.94
10553-20763 81. (962.54) (962.54) 604006402 81. 35,220.05 35,220.05
TO16 42246 81. 186,208.96 186,208.96 TO33 81. 29,746.97 29,746.97
04-251B 81. 58,208.29 58,208.29 TO39 81. 33,051.21 33,051.21 TO38 81. 88,042.64 88,042.64
604006505 81. 8,706.20 8,706.20 04-251B 81. 45,012.57 45,012.57
TO42 81. (44.61) (44.61) 200200100UNIVERSITYFY09 81. 29,621.80 29,621.80
TO47TA42246 81. 77,094.13 77,094.13 9F-30302 81. 73,737.15 73,737.15
12.09.08LETTERSCHRIEVER 81. 41,721.05 41,721.05 605003301 81. 17,458.78 17,458.78
0042243TO31SOW6897 81. 34,999.28 34,999.28 AMEND04TO00026 81. 32,807.04 32,807.04
42246TO51 81. 52,783.81 52,783.81 42246TO50 81. 28,497.41 28,497.41 42246TO53 81. 34,418.08 34,418.08
84281/TASK 1 81. 24,101.02 24,101.02 00042246TO00055 81. 31,981.96 31,981.96
TO5400042246 81. 30,469.75 30,469.75 42246TO56 81. 7,839.24 7,839.24 604006402 81. 4,167.87 4,167.87
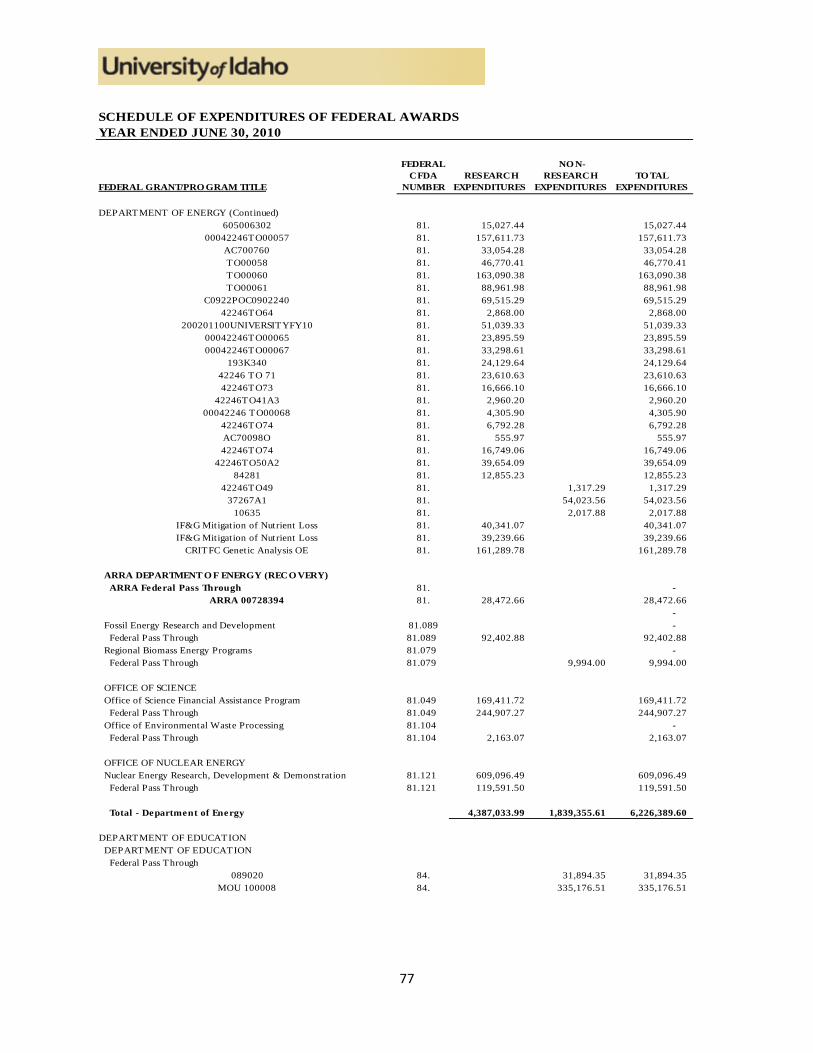
77
FEDERAL GRANT/PRO GRAM TITLE
FEDERAL CFDA
NUMBER RESEARCH
EXPENDITURES
NO N-RESEARCH
EXPENDITURES TO TAL
EXPENDITURES
SCHEDULE OF EXPENDITURES OF FEDERAL AWARDSYEAR ENDED JUNE 30, 2010
DEPARTMENT OF ENERGY (Continued)605006302 81. 15,027.44 15,027.44
00042246TO00057 81. 157,611.73 157,611.73 AC700760 81. 33,054.28 33,054.28 TO00058 81. 46,770.41 46,770.41 TO00060 81. 163,090.38 163,090.38 TO00061 81. 88,961.98 88,961.98
C0922POC0902240 81. 69,515.29 69,515.29 42246TO64 81. 2,868.00 2,868.00
200201100UNIVERSITYFY10 81. 51,039.33 51,039.33 00042246TO00065 81. 23,895.59 23,895.59 00042246TO00067 81. 33,298.61 33,298.61
193K340 81. 24,129.64 24,129.64 42246 TO 71 81. 23,610.63 23,610.63 42246TO73 81. 16,666.10 16,666.10
42246TO41A3 81. 2,960.20 2,960.20 00042246 TO00068 81. 4,305.90 4,305.90
42246TO74 81. 6,792.28 6,792.28 AC70098O 81. 555.97 555.97 42246TO74 81. 16,749.06 16,749.06
42246TO50A2 81. 39,654.09 39,654.09 84281 81. 12,855.23 12,855.23
42246TO49 81. 1,317.29 1,317.29 37267A1 81. 54,023.56 54,023.56
10635 81. 2,017.88 2,017.88 IF&G Mitigation of Nutrient Loss 81. 40,341.07 40,341.07 IF&G Mitigation of Nutrient Loss 81. 39,239.66 39,239.66
CRITFC Genetic Analysis OE 81. 161,289.78 161,289.78
ARRA DEPARTMENT O F ENERGY (RECO VERY) ARRA Federal Pass Through 81. -
ARRA 00728394 81. 28,472.66 28,472.66 -
Fossil Energy Research and Development 81.089 - Federal Pass Through 81.089 92,402.88 92,402.88 Regional Biomass Energy Programs 81.079 - Federal Pass Through 81.079 9,994.00 9,994.00
OFFICE OF SCIENCE Office of Science Financial Assistance Program 81.049 169,411.72 169,411.72 Federal Pass Through 81.049 244,907.27 244,907.27 Office of Environmental Waste Processing 81.104 - Federal Pass Through 81.104 2,163.07 2,163.07
OFFICE OF NUCLEAR ENERGY Nuclear Energy Research, Development & Demonstration 81.121 609,096.49 609,096.49 Federal Pass Through 81.121 119,591.50 119,591.50
Total - Department of Energy 4,387,033.99 1,839,355.61 6,226,389.60
DEPARTMENT OF EDUCATION DEPARTMENT OF EDUCATION Federal Pass Through
089020 84. 31,894.35 31,894.35 MOU 100008 84. 335,176.51 335,176.51

78
FEDERAL GRANT/PRO GRAM TITLE
FEDERAL CFDA
NUMBER RESEARCH
EXPENDITURES
NO N-RESEARCH
EXPENDITURES TO TAL
EXPENDITURES
SCHEDULE OF EXPENDITURES OF FEDERAL AWARDSYEAR ENDED JUNE 30, 2010
DEPARTMENT OF EDUCATION (Continued) DEPARTMENT OF EDUCATION Federal Pass Through 84.928A 27,784.18 27,784.18
ARRA DEPARTMENT O F EDUCATIO N (RECO VERY) 84.390A ARRA Federal Pass Through 84.390A 134,130.00 134,130.00
ARRA STATE FISCAL STABILIZATIO N FUNDS (RECO VERY) ARRA Education State Grants, Recovery Act 84.394A ARRA Federal Pass Through 84.394A 5,329,518.47 5,329,518.47
OFFICE OF STUDENT FINANCIAL ASSISTANCE - Federal Supplemental Educational Opportunity Grants 84.007 478,429.00 478,429.00 Federal Work-Study Program 84.033 607,086.64 607,086.64 Federal Perkins Loan Program-Federal Capital Contributions 84.038 461.65 461.65 Federal Pell Grant Program 84.063 14,404,790.00 14,404,790.00 Federal Direct Loan 84.268 63,754,978.00 63,754,978.00 Academic Competitiveness Grant 84.375 642,359.00 642,359.00 National Science and Mathematics Access to Retain Talent (SMART) Grants 84.376 640,333.00 640,333.00
OFFICE OF SPECIAL EDUCATION AND REHABILITATIVE SERVICES Special Education Grants to States 84.027 - Federal Pass Through 84.027 345,135.77 345,135.77 Federal Pass Through 84.027A 689,627.16 689,627.16 Assistive Technology 84.224 259,253.60 259,253.60 Assistive Technology 84.224A 158,640.31 158,640.31 Rehabilitation Services Demonstration and Training Program 84.235 129,804.03 129,804.03 Special Education_Technical Assistance and Dissemination to Improve 84.326 88,064.33 88,064.33 ARRA Special Education - Grants for Infants and Families, Rec 84.393 - ARRA Federal Pass Through 84.393 36,224.70 36,224.70
OFFICE OF ASSISTANT SECRETARY FOR POSTSECONDARY EDUCATION TRIO - Student Support Services 84.042A 346,376.04 346,376.04 TRIO - Talent Search 84.044 320,738.64 320,738.64 TRIO - Upward Bound 84.047 638,884.20 638,884.20 TRIO - Upward Bound 84.047A 296,064.73 296,064.73 TRIO - Upward Bound 84.047M 277,730.55 277,730.55 TRIO: Educational Opportunity Centers 84.066 193,101.94 193,101.94 Fund for the Improvement of Postsecondary Education 84.116 145,250.80 145,250.80 TRIO _ McNair Post-Baccalaureate Achievement 84.217 254,573.13 254,573.13 Byrd Scholarship 84.135 46,500.00 46,500.00 Leveraging Educational Assistance Partnership 84.069 142,894.00 142,894.00 International Education_Technological Innovation and Cooperation fo 84.337 - Federal Pass Through 84.337 232,391.72 232,391.72
OFFICE OF VOCATIONAL AND ADULT EDUCATION Career and Technical Education -- Basic Grants to States 84.048 - Federal Pass Through 84.048 95,672.52 95,672.52 Federal Pass Through 84.048A 101,380.23 101,380.23
OFFICE OF ELEMENTARY AND SECONDARY EDUCATION T itle I Grants to Local Educational Agencies 84.010 - Federal Pass Through 84.010 348,587.57 348,587.57 Migrant Education-College Assistance Migrant Program 84.149 3,507.29 3,507.29 Safe and Drug-Free Schools and Communities_National Programs 84.184 111,508.39 111,508.39 Even Start - State Educational Agencies 84.213 - Federal Pass Through 84.213 84,139.53 84,139.53
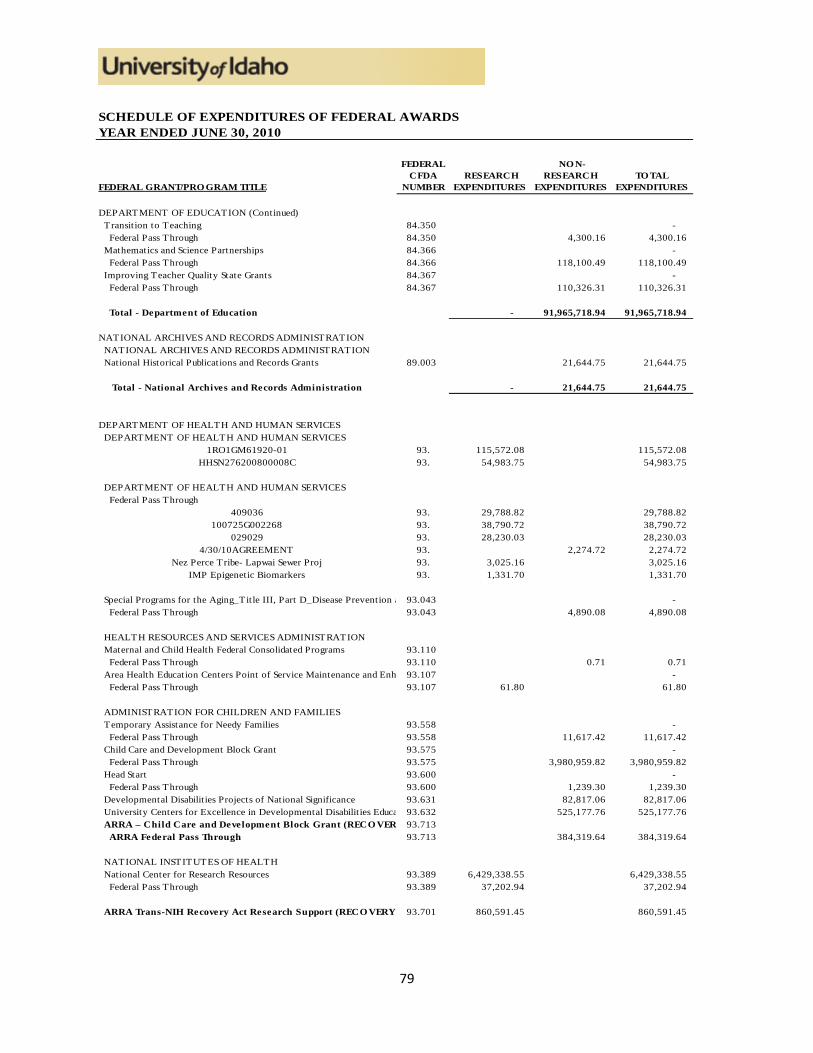
79
FEDERAL GRANT/PRO GRAM TITLE
FEDERAL CFDA
NUMBER RESEARCH
EXPENDITURES
NO N-RESEARCH
EXPENDITURES TO TAL
EXPENDITURES
SCHEDULE OF EXPENDITURES OF FEDERAL AWARDSYEAR ENDED JUNE 30, 2010
DEPARTMENT OF EDUCATION (Continued) Transition to Teaching 84.350 - Federal Pass Through 84.350 4,300.16 4,300.16 Mathematics and Science Partnerships 84.366 - Federal Pass Through 84.366 118,100.49 118,100.49 Improving Teacher Quality State Grants 84.367 - Federal Pass Through 84.367 110,326.31 110,326.31
Total - Department of Education - 91,965,718.94 91,965,718.94
NATIONAL ARCHIVES AND RECORDS ADMINISTRATION NATIONAL ARCHIVES AND RECORDS ADMINISTRATION National Historical Publications and Records Grants 89.003 21,644.75 21,644.75
Total - National Archives and Records Administration - 21,644.75 21,644.75
DEPARTMENT OF HEALTH AND HUMAN SERVICES DEPARTMENT OF HEALTH AND HUMAN SERVICES
1RO1GM61920-01 93. 115,572.08 115,572.08 HHSN276200800008C 93. 54,983.75 54,983.75
DEPARTMENT OF HEALTH AND HUMAN SERVICES Federal Pass Through
409036 93. 29,788.82 29,788.82 100725G002268 93. 38,790.72 38,790.72
029029 93. 28,230.03 28,230.03 4/30/10AGREEMENT 93. 2,274.72 2,274.72
Nez Perce Tribe- Lapwai Sewer Proj 93. 3,025.16 3,025.16 IMP Epigenetic Biomarkers 93. 1,331.70 1,331.70
Special Programs for the Aging_Title III, Part D_Disease Prevention a 93.043 - Federal Pass Through 93.043 4,890.08 4,890.08
HEALTH RESOURCES AND SERVICES ADMINISTRATION Maternal and Child Health Federal Consolidated Programs 93.110 Federal Pass Through 93.110 0.71 0.71 Area Health Education Centers Point of Service Maintenance and Enh 93.107 - Federal Pass Through 93.107 61.80 61.80
ADMINISTRATION FOR CHILDREN AND FAMILIES Temporary Assistance for Needy Families 93.558 - Federal Pass Through 93.558 11,617.42 11,617.42 Child Care and Development Block Grant 93.575 - Federal Pass Through 93.575 3,980,959.82 3,980,959.82 Head Start 93.600 - Federal Pass Through 93.600 1,239.30 1,239.30 Developmental Disabilit ies Projects of National Significance 93.631 82,817.06 82,817.06 University Centers for Excellence in Developmental Disabilit ies Educa 93.632 525,177.76 525,177.76 ARRA – Child Care and Development Block Grant (RECO VER 93.713 ARRA Federal Pass Through 93.713 384,319.64 384,319.64
NATIONAL INSTITUTES OF HEALTH National Center for Research Resources 93.389 6,429,338.55 6,429,338.55 Federal Pass Through 93.389 37,202.94 37,202.94
ARRA Trans-NIH Recovery Act Research Support (RECO VERY) 93.701 860,591.45 860,591.45
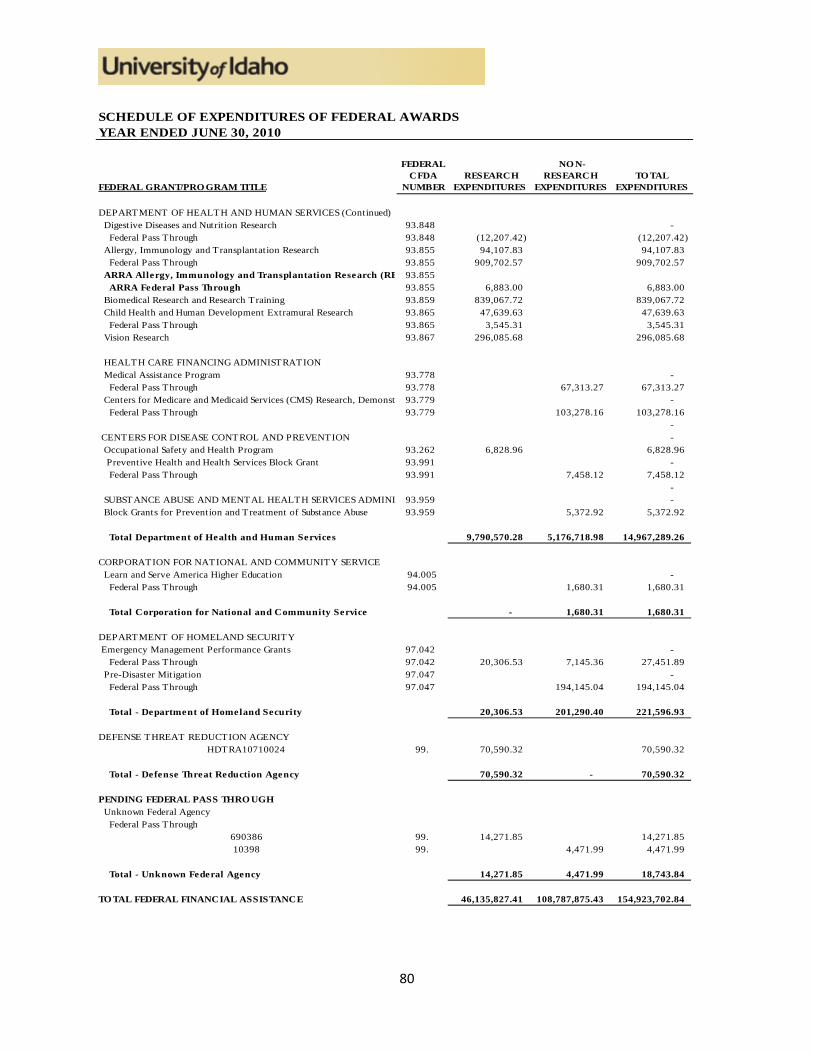
80
FEDERAL GRANT/PRO GRAM TITLE
FEDERAL CFDA
NUMBER RESEARCH
EXPENDITURES
NO N-RESEARCH
EXPENDITURES TO TAL
EXPENDITURES
SCHEDULE OF EXPENDITURES OF FEDERAL AWARDSYEAR ENDED JUNE 30, 2010
DEPARTMENT OF HEALTH AND HUMAN SERVICES (Continued) Digestive Diseases and Nutrition Research 93.848 - Federal Pass Through 93.848 (12,207.42) (12,207.42) Allergy, Immunology and Transplantation Research 93.855 94,107.83 94,107.83 Federal Pass Through 93.855 909,702.57 909,702.57 ARRA Allergy, Immunology and Transplantation Research (RE 93.855 ARRA Federal Pass Through 93.855 6,883.00 6,883.00 Biomedical Research and Research Training 93.859 839,067.72 839,067.72 Child Health and Human Development Extramural Research 93.865 47,639.63 47,639.63 Federal Pass Through 93.865 3,545.31 3,545.31 Vision Research 93.867 296,085.68 296,085.68
HEALTH CARE FINANCING ADMINISTRATION Medical Assistance Program 93.778 - Federal Pass Through 93.778 67,313.27 67,313.27 Centers for Medicare and Medicaid Services (CMS) Research, Demonst 93.779 - Federal Pass Through 93.779 103,278.16 103,278.16
- CENTERS FOR DISEASE CONTROL AND PREVENTION - Occupational Safety and Health Program 93.262 6,828.96 6,828.96 Preventive Health and Health Services Block Grant 93.991 - Federal Pass Through 93.991 7,458.12 7,458.12
- SUBSTANCE ABUSE AND MENTAL HEALTH SERVICES ADMINI 93.959 - Block Grants for Prevention and Treatment of Substance Abuse 93.959 5,372.92 5,372.92
Total Department of Health and Human Services 9,790,570.28 5,176,718.98 14,967,289.26
CORPORATION FOR NATIONAL AND COMMUNITY SERVICE Learn and Serve America Higher Education 94.005 - Federal Pass Through 94.005 1,680.31 1,680.31
Total Corporation for National and Community Service - 1,680.31 1,680.31
DEPARTMENT OF HOMELAND SECURITY Emergency Management Performance Grants 97.042 - Federal Pass Through 97.042 20,306.53 7,145.36 27,451.89 Pre-Disaster Mitigation 97.047 - Federal Pass Through 97.047 194,145.04 194,145.04
Total - Department of Homeland Security 20,306.53 201,290.40 221,596.93
DEFENSE THREAT REDUCTION AGENCYHDTRA10710024 99. 70,590.32 70,590.32
Total - Defense Threat Reduction Agency 70,590.32 - 70,590.32
PENDING FEDERAL PASS THRO UGH Unknown Federal Agency Federal Pass Through
690386 99. 14,271.85 14,271.85 10398 99. 4,471.99 4,471.99
Total - Unknown Federal Agency 14,271.85 4,471.99 18,743.84
TO TAL FEDERAL FINANCIAL ASSISTANCE 46,135,827.41 108,787,875.43 154,923,702.84
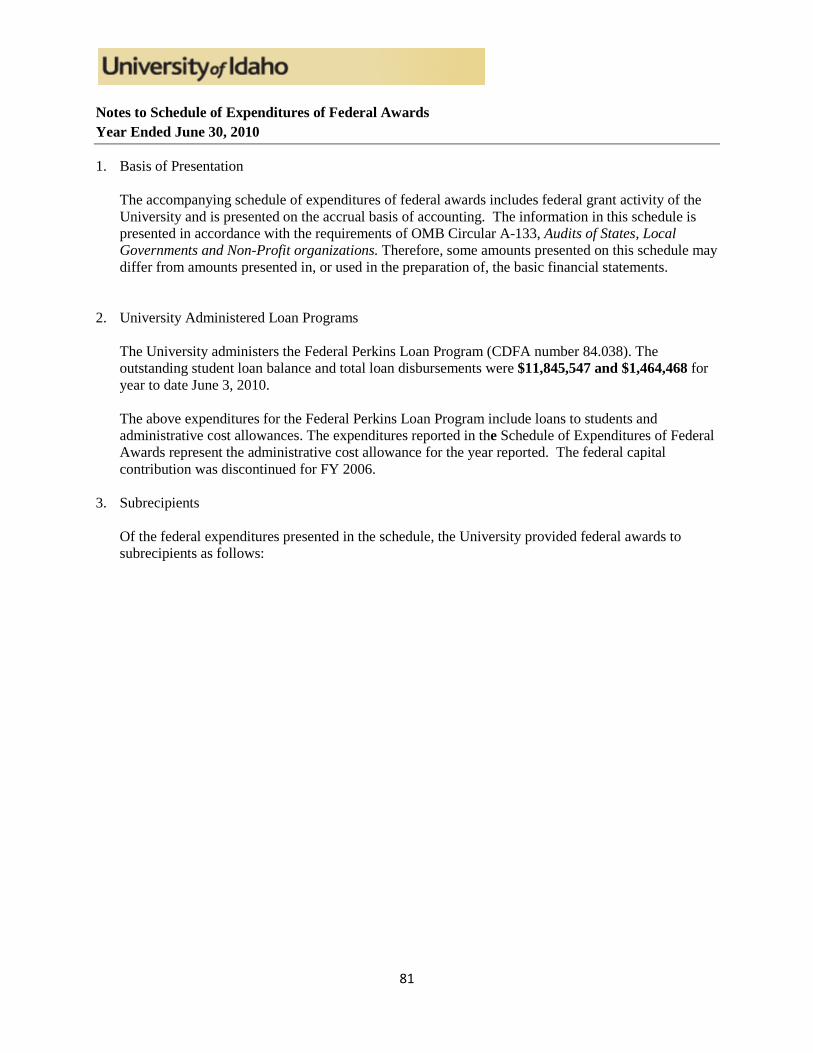
81
Notes to Schedule of Expenditures of Federal Awards Year Ended June 30, 2010
1. Basis of Presentation
The accompanying schedule of expenditures of federal awards includes federal grant activity of the University and is presented on the accrual basis of accounting. The information in this schedule is presented in accordance with the requirements of OMB Circular A-133, Audits of States, Local Governments and Non-Profit organizations. Therefore, some amounts presented on this schedule may differ from amounts presented in, or used in the preparation of, the basic financial statements.
2. University Administered Loan Programs The University administers the Federal Perkins Loan Program (CDFA number 84.038). The outstanding student loan balance and total loan disbursements were $11,845,547 and $1,464,468 for year to date June 3, 2010. The above expenditures for the Federal Perkins Loan Program include loans to students and administrative cost allowances. The expenditures reported in the Schedule of Expenditures of Federal Awards represent the administrative cost allowance for the year reported. The federal capital contribution was discontinued for FY 2006.
3. Subrecipients Of the federal expenditures presented in the schedule, the University provided federal awards to subrecipients as follows:

82
Notes to Schedule of Expenditures of Federal Awards Year Ended June 30, 2010
FEDERALCFDA PAYMENTS TO
FEDERAL GRANT/PRO GRAM TITLE NUMBER SUBRECIPIENTS
DEPARTMENT OF AGRICULTURE DEPARTMENT OF AGRICULTURE
PNW03JV11261988074 10. (700.00)
AGRICULTURE RESEARCH SERVICE Agricultural Research-Basic and Applied Research 10.001 26.32
AGRICULTURAL MARKETING SERVICE Federal-State Marketing Improvement Program 10.156 1,073.86
NATIONAL INSTITUTE OF FOOD AND AGRICULTURE Grants for Agricultural Research, Special Research Grants 10.200 542,239.25 Federal Pass Through 10.200 63,169.98 Grants for Agricultural Research, Competitive Research 10.206 161,604.51 Secondary and Two-Year Postsecondary Agriculture Education Challenge Grants 10.226 7,002.53 Integrated Programs 10.303 566,643.03 Agriculture and Food Research Initiative (AFRI) 10.310 3,672.40 Cooperative Extension Service 10.500 138,337.00 Federal Pass Through 10.500 1,200.00
FOREST SERVICE Cooperative Forestry Assistance 10.664 60,378.97
DEPARTMENT OF COMMERCE NATIONAL OCEANIC AND ATMOSPHERIC ADMINISTRATION Unallied Science Program 11.472 41,791.27
DEPARTMENT OF DEFENSE OFFICE OF NAVAL RESEARCH, DEPARTMENT OF THE NAVY Basic and Applied Scientific Research 12.300 183,546.89
DEFENSE ADVANCED RESEARCH PROJECTS AGENCY Research and Technology Development 12.910 249,054.98
DEPARTMENT OF THE INTERIOR DEPARTMENT OF INTERIOR
J8W07060004 H8W07060001 15. 45,908.06 H2380040001 J2370080538 15. 24,762.13
06HQGR0082 M004 15. 9,177.09
BUREAU OF LAND MANAGEMENT Invasive and Noxious Plant Management 15.230 7,000.00 ARRA Invasive and Noxious Plant Management 15.230 25,716.27
OFFICE OF SURFACE MINING RECLAMATION AND ENFORCEMENT Regulation of Surface Coal Mining and Surface Effects of 15.250 (10,616.05)
GEOLOGICAL SURVEY Geological Survey Research and Data Acquisition 15.808 1,293.45

83
Notes to Schedule of Expenditures of Federal Awards Year Ended June 30, 2010
FEDERALCFDA PAYMENTS TO
FEDERAL GRANT/PRO GRAM TITLE NUMBER SUBRECIPIENTS
National Spatial Data Infrastructure Cooperative Agreements Program 15.809 15,011.46
DEPARTMENT OF TRANSPORTATION DEPARTMENT OF TRANSPORTATION
DTFH6108G00009 20. 53,968.42
RESEARCH AND SPECIAL PROGRAMS ADMINISTRATION University Transportation Centers Program 20.701 6,869.46
NATIONAL AERONAUTICS AND SPACE ADMINISTRATION NATIONAL AERONAUTICS AND SPACE ADMINISTRATION
NNX07AL05A 43. 117,230.19 NNX07AT60A 43. 161,649.88 NNX09AV04A 43. 6,139.56
Aerospace Education Services Program 43.001 249,997.39 Technology Transfer Federal Pass Through 43.002 12,746.52
NATIONAL SCIENCE FOUNDATION Biological Sciences 47.074 5,907.28 Social Behavioral and Economic Sciences 47.075 21,941.63 Education and Human Resources 47.076 5,908.82 Office of Cyberinfrastructure 47.080 1,558,315.28
DEPARTMENT OF ENERGY DEPARTMENT OF ENERGY Federal Pass Through
TO16 42246 81. 10,000.00 00042246TO00057 81. 43,432.06
TO00061 81. 20,123.37
OFFICE OF NUCLEAR ENERGY, SCIENCE AND TECHNOLOGY Nuclear Energy Research, Development and Demonstration 81.121 135,582.25
DEPARTMENT OF EDUCATION OFFICE OF SPECIAL EDUCATION AND REHABILITATIVE SERVICES Assistive Technology 84.224 75,368.93 Assistive Technology 84.224A 8,376.35 Special Projects and Demonstrations for Providing 84.235 98,664.11
OFFICE OF ELEMENTARY AND SECONDARY EDUCATION Improving Teacher Quality State Grants Federal Pass Through 84.367 6,006.47
Rehabilitation Services-Vocational Rehabilitation Grants to States, Recovery Act 84.390A ARRA Federal Pass Through 84.390A 128,880.00
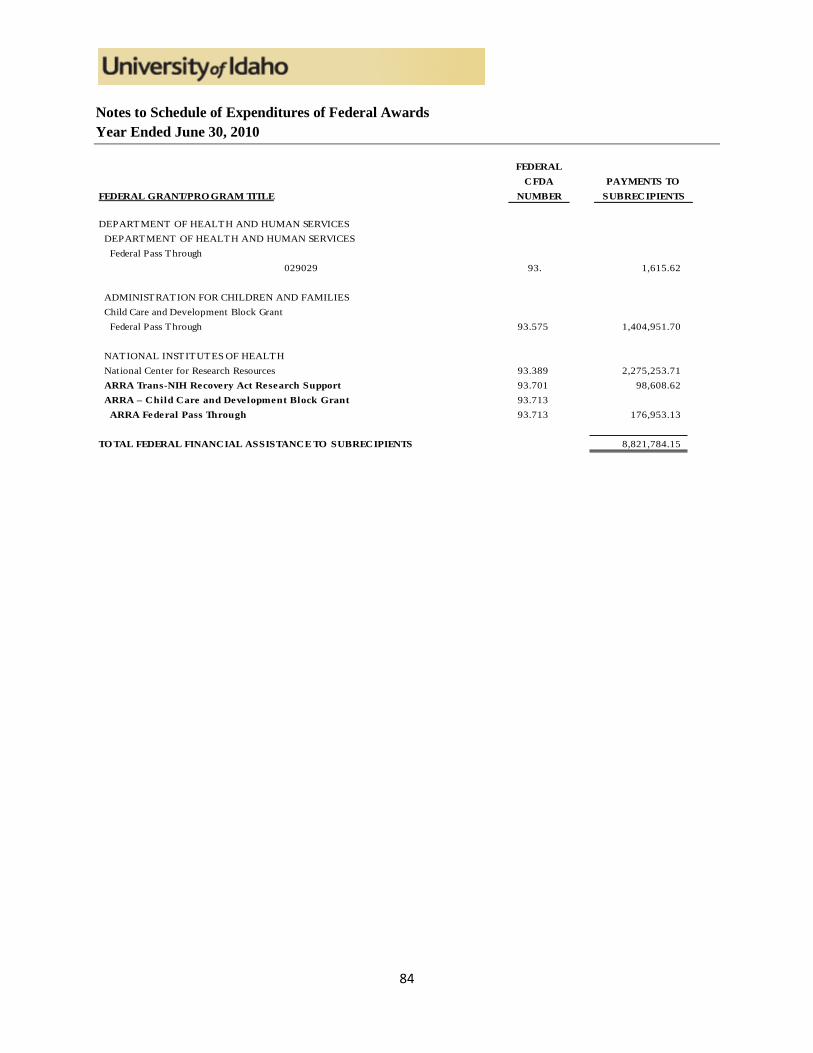
84
Notes to Schedule of Expenditures of Federal Awards Year Ended June 30, 2010
FEDERALCFDA PAYMENTS TO
FEDERAL GRANT/PRO GRAM TITLE NUMBER SUBRECIPIENTS
DEPARTMENT OF HEALTH AND HUMAN SERVICES DEPARTMENT OF HEALTH AND HUMAN SERVICES Federal Pass Through
029029 93. 1,615.62
ADMINISTRATION FOR CHILDREN AND FAMILIES Child Care and Development Block Grant Federal Pass Through 93.575 1,404,951.70
NATIONAL INSTITUTES OF HEALTH National Center for Research Resources 93.389 2,275,253.71 ARRA Trans-NIH Recovery Act Research Support 93.701 98,608.62 ARRA – Child Care and Development Block Grant 93.713 ARRA Federal Pass Through 93.713 176,953.13
TO TAL FEDERAL FINANCIAL ASSISTANCE TO SUBRECIPIENTS 8,821,784.15