Embed Size (px)
Citation preview

Financial Statements Introduction
Section 63 of the Financial Accountability Act 2009 requires all agencies to prepare annual reports for tabling in the Legislative Assembly.Annual reports are a key accountability document and the principal way agencies report on non-financial and financial performance.
The Financial and Performance Management Standard 2009 mandates the disclosure of information detailed in the document Annual report requirements for Queensland Government agencies prepared by the Department of the Premier and Cabinet (DPC).
The Auditor-General notes that ‘annual reports support transparency and can drive continuous improvement in performance. Where annual reports incorporate relevant and reliable performance information, they increase trust and confidence in government service delivery’ (Auditor-General’s Report to Parliament No. 4 for 2013–14 p.12).
The Gold Coast Health 2016–17 Annual Report is delivered in accordance with the above requirements and is compliant with the annual report requirements for Queensland Government agencies. Requirements can be found at www.forgov.qld.gov.au/manage-government-performance.
General informationGold Coast Hospital and Health Service (‘Gold Coast Health’) is a statutory body established under the Hospital and Health Boards Act 2011 and its registered trading name is Gold Coast Hospital and Health Service.
The head office and principal place of business of Gold Coast Health is Gold Coast University Hospital, 1 Hospital Boulevard, Southport QLD 4215.
A description of the nature of Gold Coast Health's operations and its principal activities is included in this Annual Report.
For information in relation to Gold Coast Health, please visit www.goldcoast.health.qld.gov.au.
60

Financial Statements 30 June 2017
Within this section:
Statement of comprehensive income ............................................................62
Statement of financial position ..................................................................... 63
Statement of changes in equity ....................................................................64
Statement of cash flows ................................................................................ 65
Notes to the financial statements .................................................................66
Management certificate .................................................................................98
Independent auditor’s report ........................................................................99
61

Gold Coast Hospital and Health Service Statement of comprehensive income for the year ended 30 June 2017
Note 2017 $’000
2016 $’000
Revenue
Health service funding 5 1,234,756 1,166,779
User charges and fees 6 92,938 85,703
Grants and other contributions 7 19,439 19,276
Other revenue 8 5,821 5,946
Net revaluation increment 16 5,562 10,294
Total revenue 1,358,516 1,287,998
Expenses
Employee expenses 9 (908,804) (831,413)
Supplies and services 10 (354,894) (358,204)
Grants and subsidies (804) (953)
Depreciation and amortisation 16/17 (79,165) (77,553)
Impairment loss 11 (1,680) (1,667)
Other expenses 12 (6,763) (7,661)
Total expenses (1,352,110) (1,277,451)
Surplus for the year 6,406 10,547
Other comprehensive income for the year Items that will not be reclassified subsequently to operating result:
– Increase in asset revaluation surplus
Total other comprehensive income
16 36,521
36,521
23,474
23,474
Total comprehensive income for the year 42,927 34,021
The above statement of comprehensive income should be read in conjunction with the accompanying notes.
62

Gold Coast Hospital and Health Service Statement of financial position as at 30 June 2017
The above statement of financial position should be read in conjunction with the accompanying notes.
Note 2017 $’000
2016 $’000
Assets
Current assets
Cash and cash equivalents
Receivables
Inventories
Prepayments
13
14
15
65,172
28,136
8,610
2,066
62,494
20,987
8,117
1,449
Total current assets 103,984 93,047
Non-current assets
Property, plant and equipment
Intangibles
16
17
1,736,399
1,850
1,761,609
2,298
Total non-current assets 1,738,249 1,763,907
Total assets 1,842,233 1,856,954
Liabilities
Current liabilities
Payables
Accrued employee benefits
Unearned revenue
18
19
20
36,942
35,743
4,948
37,475
30,818
1,132
Total current liabilities 77,633 69,425
Total liabilities 77,633 69,425
Net assets 1,764,600 1,787,529
Equity
Contributed equity
Accumulated surplus
Asset revaluation surplus 16
1,679,905
16,019
68,676
1,745,761
9,613
32,155
Total equity 1,764,600 1,787,529
63

Gold Coast Hospital and Health Service Statement of changes in equity for the year ended 30 June 2017
The above statement of changes in equity should be read in conjunction with the accompanying notes.
Note Contributed Equity $’000
Accumulated Surplus
$’000
Asset Revaluation
Surplus $’000
Total equity $’000
Balance at 1 July 2015
Surplus for the year
Other comprehensive income for the year
– Increase in asset revaluation surplus 16
1,801,445
-
-
(934)
10,547
-
8,681
-
23,474
1,809,192
10,547
23,474
Total comprehensive income for the year - 10,547 23,474 34,021
Transactions with owners in their capacity as owners:
Equity injections
Net non-current asset transfers
Equity withdrawals
16
20,582
1,289
(77,555)
-
-
-
-
-
-
20,582
1,289
(77,555)
Balance at 30 June 2016 1,745,761 9,613 32,155 1,787,529
Balance at 1 July 2016
Surplus for the year
Other comprehensive income for the year
– Increase in asset revaluation surplus 16
1,745,761
-
-
9,613
6,406
-
32,155
-
36,521
1,787,529
6,406
36,521
Total comprehensive income for the year - 6,406 36,521 42,927
Transactions with owners in their capacity as owners:
Equity injections
Net non-current asset transfers
Equity withdrawals
16
13,316
(7)
(79,165)
-
-
-
-
-
-
13,316
(7)
(79,165)
Balance at 30 June 2017 1,679,905 16,019 68,676 1,764,600
64
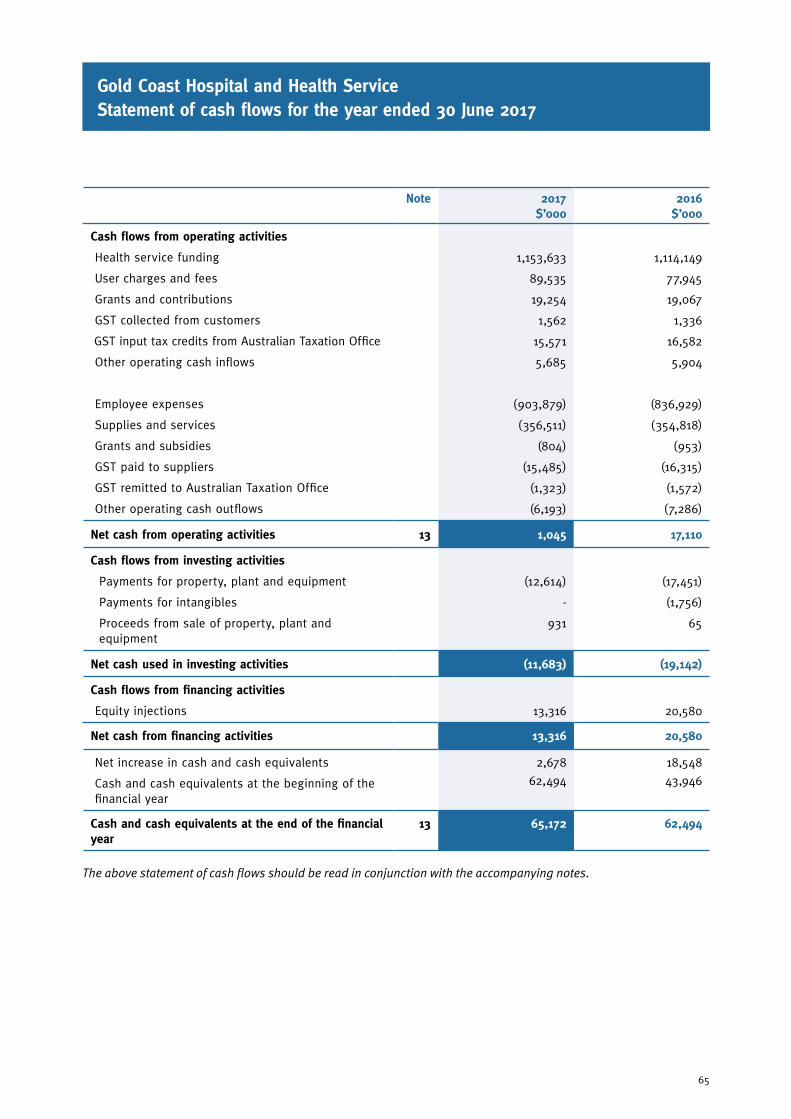
Gold Coast Hospital and Health Service Statement of cash flows for the year ended 30 June 2017
Note 2017 $’000
2016 $’000
Cash flows from operating activities
Health service funding
User charges and fees
Grants and contributions
GST collected from customers
GST input tax credits from Australian Taxation Office
Other operating cash inflows
Employee expenses
Supplies and services
Grants and subsidies
GST paid to suppliers
GST remitted to Australian Taxation Office
Other operating cash outflows
1,153,633
89,535
19,254
1,562
15,571
5,685
(903,879)
(356,511)
(804)
(15,485)
(1,323)
(6,193)
1,114,149
77,945
19,067
1,336
16,582
5,904
(836,929)
(354,818)
(953)
(16,315)
(1,572)
(7,286)
Net cash from operating activities 13 1,045 17,110
Cash flows from investing activities
Payments for property, plant and equipment
Payments for intangibles
Proceeds from sale of property, plant and equipment
(12,614)
-
931
(17,451)
(1,756)
65
Net cash used in investing activities (11,683) (19,142)
Cash flows from financing activities
Equity injections 13,316 20,580
Net cash from financing activities 13,316 20,580
Net increase in cash and cash equivalents
Cash and cash equivalents at the beginning of the financial year
2,678
62,494
18,548
43,946
Cash and cash equivalents at the end of the financial year
13 65,172 62,494
The above statement of cash flows should be read in conjunction with the accompanying notes.
65
Gold Coast Hospital and Health Service Notes to the financial statements 30 June 2017
Note 1. Significant accounting policiesThe principal accounting policies adopted in the preparation of the financial statements are set out below. These policies have been consistently applied to all the years presented, unless otherwise stated.
(a) The reporting entityGold Coast Health is established under the Hospital and Health Boards Act 2011. Gold Coast Health is an independent statutory body and a reporting entity, which is domiciled in Australia. Accountable to the Minister for Health and to the Queensland Parliament, it is primarily responsible for providing quality and safe public hospital and health services and for the direct management of the facilities within the Gold Coast region. The ultimate parent entity is the State of Queensland.
These financial statements include the value of all revenue, expenses, assets, liabilities and equity of Gold Coast Health. Gold Coast Health does not have any controlled entities.
(b) Statement of compliance Gold Coast Health has prepared these financial statements in compliance with section 62(1) of the Financial Accountability Act 2009 and section 43 of the Financial and Performance Management Standard 2009 (QLD). The financial statements are authorised for issue by the Board Chair and Chief Executive at the date of signing the management certificate.
These financial statements are general purpose financial statements and have been prepared on an accrual basis in accordance with Australian Accounting Standards and Interpretations. In addition, the financial statements comply with Queensland Treasury’s Minimum Reporting Requirements for the year ended 30 June 2017, and other authoritative pronouncements.
With respect to compliance with Australian Accounting Standards and Interpretations, Gold Coast Health has applied those requirements applicable to not-for-profit entities. Except where stated, the historical cost convention is used.
Amounts in this report are in Australian dollars and have been rounded off to the nearest thousand dollars, or in certain cases, the nearest dollar.
There were no material restatements of the comparative information required to ensure consistency with current period disclosures.
(c) Basis of preparationGold Coast Health has prepared these financial statements on a going concern basis, which assumes that Gold Coast Health will be able to meet the payment terms of its financial obligations as and when they fall due. Gold Coast Health is economically dependent on funding received from its Service Agreement with the Department of Health (‘the Department’).
A Service Agreement Framework is in place in order to provide Gold Coast Health with a level of guidance regarding funding commitments and purchase activity for 2016–2017 to 2018–2019. The Board and management believe that the terms and conditions of its funding arrangements under the Service Agreement Framework will provide Gold Coast Health with sufficient cash resources to meet its financial obligations for at least the next year.
In addition to Gold Coast Health’s funding arrangements under the Service Agreement Framework, Gold Coast Health has no intention to liquidate or to cease operations; and under section 18 of the Hospital and Health Boards Act 2011, Gold Coast Health represents the State of Queensland and has all the privileges and immunities of the State.
(d) Critical accounting estimatesThe preparation of the financial statements necessarily requires the determination and use of certain critical accounting estimates, assumptions, and management judgements that have the potential to cause a material adjustment to the carrying amount of assets and liabilities within the next financial year.
Such estimates, judgements and underlying assumptions are reviewed on an ongoing basis. Revisions to accounting estimates are recognised in the period in which the estimate is revised and in future periods as relevant.
Estimates and assumptions with the most significant effect on the financial statements are:
• Useful lives assessment – refer note 1(i)
• Land and building valuation assessment – refer note 1(j)
• Impairment of non-current assets – refer note 1(k)
66

(e) Health service fundingHealth service funding is received as part of the Service Agreement between Gold Coast Health and the Department. The funding from the Department (excluding depreciation funding) is received in cash fortnightly in advance. Refer below for key types of funding and Gold Coast Health’s revenue recognition policy.
Activity based funding (ABF)
ABF funding is provided according to the type and number of services purchased by the Department, based on a Queensland price for each type of service. ABF funding is received for acute inpatients, intensive care patients, sub-acute inpatients, emergency department presentations and outpatients. Revenue is recognised on the basis of purchased activity once delivered. Where actual activity exceeds purchased activity, additional funding is negotiated with the Department and accrued as an asset on the Statement of Financial Position where funding has been agreed to, but not yet received.
Non-activity based funding
Non-activity based funding is received for other services Gold Coast Health has agreed to provide per the Service Agreement with the Department. This funding has specific conditions attached that are not related to activity covered by ABF. This funding is recognised as revenue where the specific conditions have been met. Where conditions are not met, funding is renegotiated with the Department and may result in a deferral or return of revenue recognised as a liability on the Statement of Financial Position.
Depreciation and amortisation funding
The service agreement between the Department and Gold Coast Health specifies that the Department funds Gold Coast Health’s depreciation and amortisation charges via non-cash revenue. The Department retains the cash to fund future major capital replacements. This transaction is shown in the Statement of Changes in Equity as a non-appropriated equity withdrawal.
(f) User charges and feesUser charges and fees are recognised as revenues when the revenue has been earned and can be measured reliably with a sufficient degree of certainty. Refer below for key types of user charges and revenue recognition policy.
Hospital fees and related services/goods
Hospital fees (mainly from private patients and patients ineligible for Medicare) are recognised as revenue when the services/goods have been provided, and cash is received or the invoice is raised. Where inpatients have not been discharged and therefore not invoiced, revenue is accrued on the Statement of Financial Position to the extent of services/goods provided. Revenue is recognised net of discounts provided in accordance with approved policies.
Granted private practice revenue
This revenue relates in part to fees generated by bulk billing services performed by doctors with an assignment private practice arrangement with Gold Coast Health. These fees are recognised as revenue when cash has been received by Gold Coast Health. In addition, service fees charged to doctors with a retention private practice arrangement with Gold Coast Health are recognised monthly based on a percentage of revenue which has been received by the practice in cash. See note 26.
Pharmaceutical Benefits Scheme
Reimbursements from the federal government under the Pharmaceutical Benefits Scheme are recognised when the revenue is received or accrued where a reliable estimate of the value of eligible drugs that have been distributed and claimed can be made, but the cash has not yet been received.
(g) Grants and contributionsGrants and contributions received that are non-reciprocal in nature are recognised in the year in which Gold Coast Health obtains control over them.
Contributed services are recognised only when a fair value can be measured reliably and the services would have been purchased if they had not been donated. Gold Coast Health receives corporate services support from the Department for no cost. Corporate services received include payroll services and accounts payable services. As the fair value of these services is unable to be estimated reliably, no associated revenue and expense is recognised.
(h) Employee expenses Gold Coast Health is a prescribed employer (effective 1 July 2014) and as a result, all employees are deemed to be Gold Coast Health employees and related costs are recognised as employee expenses. Gold Coast Health also holds the liabilities for rostered days off, nurses’ professional development and purchased leave entitlements for these employees.
67

The Director-General, Department of Health, is responsible for setting terms and conditions for employment, including remuneration and classification structures, and for negotiating enterprise agreements.
Classification of employee expenses
Employer superannuation contributions, annual leave levies and long service leave levies are regarded as employee benefits. Payroll tax and workers’ compensation insurance are a consequence of employing employees, but are not counted in an employee’s total remuneration package. They are not employee benefits and are recognised separately as employee related expenses.
Recoveries of costs associated with salaries and wages are offset against employee expenses.
Wages, Salaries and Sick Leave
Wages and salaries due but unpaid at reporting date are recognised in the Statement of Financial Position at the current salary rates. Unpaid entitlements are expected to be paid within 12 months and the liabilities are recognised at their undiscounted values.
Prior history indicates that on average, sick leave taken each reporting period is less than the entitlement accrued. This is expected to continue in future periods. Accordingly, it is unlikely that existing accumulated entitlements will be used by employees and no liability for unused sick leave entitlements is recognised. As sick leave is non-vesting, an expense is recognised for this leave as it is taken.
Annual Leave, Long Service Leave and Other Leave
Gold Coast Health participates in the Queensland Government’s Annual Leave Central Scheme and Long Service Leave Scheme. Under the Annual Leave Central Scheme (established on 30 June 2008) and Long Service Leave Central Scheme (established on 1 July 1999), a levy is made on Gold Coast Health to cover the cost of employees’ annual leave (including leave loading and on-costs) and long service leave. The levies are expensed in the period in which they are payable. Amounts paid to employees for annual leave and long service leave are claimed from the Schemes quarterly in arrears.
No provision for annual leave or long service leave is recognised as the liability is held on a whole-of-Government basis and reported in those financial statements pursuant to AASB 1049 Whole of Government and General Government Sector Financial Reporting.
Other leave relates to Rostered Days Off, Nurses Professional Development and Purchased leave entitlements. These liabilities are expected to be settled wholly within 12 months after the end of the period in which the employees render the related service. They are measured at the amounts expected to be paid when the liabilities are settled, and recognised at undiscounted values.
Superannuation
Employer superannuation contributions are paid to the employee’s superannuation fund at rates prescribed by the government. Contributions are expensed in the period in which they are paid or payable. Gold Coast Health’s obligation is limited to its contributions.
The superannuation schemes have defined benefit and contribution categories. The liability for defined benefits is held on a whole-of-Government basis and reported in those financial statements pursuant to AASB 1049 Whole of Government and General Government Sector Financial Reporting.
(i) Depreciation of non-current assetsProperty, plant and equipment is depreciated on a straight-line basis. Annual depreciation is based on an assessment of the remaining useful life of individual assets. Land is not depreciated as it has an unlimited useful life. Assets under construction (work-in-progress) are not depreciated until they are ready for use as intended by management.
Any expenditure that increases the originally assessed capacity or service potential of an asset is capitalised and the new depreciable amount is depreciated over the remaining useful life of the asset. Where assets have separately identifiable components that are subject to regular replacement and these components have useful lives distinct from the asset to which they relate, they are separated into components and depreciated accordingly.
The estimated useful lives of assets are reviewed annually and where necessary, are adjusted to better reflect the pattern of consumption. The useful lives could change significantly as a result of events such as:
• the asset is technically obsolete; or
• non-strategic assets that have been abandoned or sold.
Note 1. Significant accounting policies (continued)
68

For each class of depreciable asset the following depreciation and amortisation rates are generally used:
Buildings 2.3%–6.3%
Leasehold improvements 6.7%–20.0%
Plant and equipment
Computer Hardware and Motor Vehicles
Engineering and Office Equipment
Furniture and Fittings
Medical equipment < $200,000
Medical equipment > $200,000
20%
10%
5%
6.7%–25%
12.5%
Intangible Assets 20%
(j) Revaluations of non-current assetsLand and buildings are measured at fair value in accordance with AASB 116 Property, Plant and Equipment, AASB 13 Fair Value Measurement as well as Queensland Treasury’s Non-Current Asset Policies for the Queensland Public Sector.
Gold Coast Health engage external valuers to determine fair value through either comprehensive revaluations and/or the indexation of the assets not subject to comprehensive revaluations. Comprehensive revaluations are undertaken at least once every five years. However, if a particular asset class experiences significant volatile changes in fair value, that class is subject to specific appraisal in the reporting period, where practicable, regardless of the timing of the last specific appraisal.
External valuers are selected based on market knowledge and reputation. Where there is a significant change in fair value of an asset or liability from one period to another, an analysis is undertaken, which includes a verification of the major inputs applied in the latest valuation and a comparison, where applicable, with external sources of data. Detailed disclosure of fair value methodology and inputs is included in Note 16.
Where indices are used, these are either publicly available, or are derived from market information available to the valuer. The valuer provides assurance of their robustness, validity and appropriateness for application to the relevant assets. Indices used are also tested for reasonableness by applying the indices to a sample of assets, comparing the results to similar assets that have been valued by the valuer, and analysing the trend of changes in values over time.
Any revaluation increment arising on the revaluation of an asset is credited to the asset revaluation surplus of the appropriate class, except to the extent it reverses a revaluation decrement for the class previously recognised as an expense. A decrease in the carrying amount on revaluation is charged as an expense, to the extent it exceeds the balance, if any, in the revaluation surplus relating to that asset class. On revaluation, for assets valued using a cost valuation approach, accumulated depreciation is restated proportionately with the change in the carrying amount of the asset and any change in the estimate of remaining useful life. On revaluation, for assets valued using a market approach, accumulated depreciation is eliminated against the gross amount of the asset prior to restating for valuation.
(k) Impairment of non-current assetsProperty, plant and equipment and intangible assets are assessed for indicators of impairment on an annual basis in accordance with AASB 136 Impairment of Assets. If an indicator of impairment exists, Gold Coast Health determines the asset’s recoverable amount (higher of value in use and fair value less costs to sell). Any amount by which the asset’s carrying amount exceeds the recoverable amount is considered an impairment loss.
An impairment loss is recognised immediately in the Statement of Comprehensive Income, unless the asset is carried at a revalued amount. When the asset is measured at a revalued amount, the impairment loss is offset against the asset revaluation surplus of the relevant class to the extent available.
Where an impairment loss subsequently reverses, the carrying amount of the asset is increased to the revised estimate of its recoverable amount, so that the increased carrying amount does not exceed the carrying amount that would have been determined had no impairment loss been recognised for the asset in prior years. A reversal of an impairment loss is recognised as income, unless the asset is carried at a revalued amount, in which case the reversal of the impairment loss is treated as a revaluation increase to the carrying amount.
(l) Cash and cash equivalentsFor the purposes of the Statement of Financial Position and the Statement of Cash Flows, cash assets include all cash and cheques receipted but not banked at 30 June.
69

(m) ReceivablesReceivables comprise trade receivables, GST net receivables and other accrued revenue. Trade receivables are recognised at the amounts due at the time of sale or service delivery. Settlement of these amounts is required within 30 days from the invoice date.
The collectability of receivables is assessed periodically with provisions made for impairment. Increases in the allowance for impairment are based on loss events as disclosed in Note 14. All known bad debts are written off when identified.
The provision for impairment of receivables assessment requires a degree of estimation and judgement.
(n) InventoriesInventories consist mainly of pharmaceutical supplies and clinical supplies held in wards for use throughout the hospitals. Inventories are measured at the lower of cost and net realisable value based on periodic assessments for obsolescence. Where damaged or expired items have been identified, provisions are made for impairment. Refer Note 15.
Consignment stock is held but is not recognised as inventory as it remains the property of the supplier until consumption. Upon consumption it is expensed as clinical supplies.
(o) Property, plant and equipmentItems of property, plant and equipment with a cost or other value equal to or more than the following thresholds are recognised for financial reporting purposes in the year of acquisition:
Buildings – $10,000
Land – $1
Plant and Equipment – $5,000
Property, plant and equipment are initially recorded at consideration plus any other costs directly incurred in ensuring the asset is ready for use.
Assets acquired at no cost or for nominal consideration, other than from an involuntary transfer from another Queensland Government entity, are recognised at their fair value at date of acquisition in accordance with AASB 116 Property, Plant and Equipment.
(p) Intangible assetsIntangible assets with a cost or other value equal to or greater than $100,000 are recognised in the financial statements. Items with a lesser value are expensed. Each intangible asset is amortised over its estimated useful life, currently 5 years. It has
been determined that there is not an active market for any of Gold Coast Health’s intangible assets. As such, the assets are recognised and carried at cost less accumulated amortisation and accumulated impairment losses. Work in progress is for software developed in-house but not yet in use and will be amortised in the same way as purchased software.
(q) PayablesTrade creditors are recognised on receipt of the goods or services ordered and are measured at the agreed purchase or contract price, net of applicable trade and other discounts. Amounts owing are unsecured and are generally settled on 30 to 60 day terms.
(r) ProvisionsProvisions are recorded when there is a present obligation, either legal or constructive as a result of a past event. They are recognised at the amount expected at reporting date for which the obligation will be settled in a future period. Where the settlement of the obligation is expected after 12 or more months, the obligation is discounted to the present value using an appropriate discount rate.
(s) Financial Instruments
RecognitionFinancial assets and financial liabilities are recognised in the Statement of Financial Position when Gold Coast Health becomes party to the contractual provisions of the financial instrument.
ClassificationFinancial instruments are classified and measured as follows:
• cash and cash equivalents – held at fair value
• receivables – held at amortised cost
• payables – held at amortised cost.
Gold Coast Health does not enter into derivative and other financial instrument transactions for speculative purposes nor for hedging. Apart from cash and cash equivalents, Gold Coast Health holds no financial assets classified at fair value through profit and loss.
All other disclosures relating to the measurement and financial risk management of financial instruments are included in Note 21.
(t) TaxationGold Coast Health is a State body as defined under the Income Tax Assessment Act 1936 and is exempt from Commonwealth taxation with the exception of Fringe Benefits Tax (FBT) and Goods and Services Tax (GST). All Queensland Hospital and Health
Note 1. Significant accounting policies (continued)
70

Services and the Department are grouped for the purposes of Section 149–25 A New Tax System (Goods and Services Tax) Act 1999.
Therefore all transactions made between the entities in the tax group do not attract GST, and all transactions external to the group are required to be accounted for GST where applicable. GST credits receivable from, and GST payable to the Australian Taxation Office are recognised.
(u) LeasesA distinction is made in the financial statements between finance leases that effectively transfer from the lessor to the lessee substantially all risks and benefits incidental to ownership, and operating leases, under which the lessor retains substantially all risks and benefits.
Operating lease payments are representative of the pattern of benefits derived from the leased assets and are expensed in the periods in which they are incurred.
(v) Trust transactions and balancesGold Coast Health manages patient trust accounts transactions (fiduciary funds) as trustee. As Gold Coast Health acts only in a custodial role in respect of these transactions and balances, they are not recognised in the financial statements. Trust activities are included in the annual audit performed by the Auditor-General of Queensland and disclosed in Note 25.
(w) Private practice arrangementsGold Coast Health administers the Private Practice arrangements. As Gold Coast Health acts only in an agency role in respect of these transactions and balances, they are not recognised in the financial statements. Fees collected under the scheme must be deposited initially into the private practice bank accounts and later distributed in accordance with the policy governing the private practice scheme. Private Practice funds are not controlled but the activities are included in the annual audit performed by the Auditor-General of Queensland and disclosed in Note 26.
(x) New, revised or amending Accounting Standards and Interpretations adoptedOne Australian Accounting Standard has been adopted for the 2016–17 year as required by Queensland Treasury.
AASB 124 Related Party Disclosures
AASB 124 Related Party Disclosures became effective for the first time in 2016–17 for not-for-profit public sector entities. The amendments are of a disclosure nature only and have no impact on the line items in the financial statements. This standard requires disclosure about the key management personnel (KMP) remuneration and other related party transactions. As Queensland Treasury already required disclosure of KMP remuneration expenses, AASB 124 itself had minimal impact on the KMP disclosure compared to 2015–16. However, the standard has resulted in the responsible Minister being identified as part of Gold Coast Health’s KMP from 2016–17. Remuneration details (including comparatives) have been disclosed in note 3 for KMP identified in 2016–2017. Material related party transaction information now required for 2016–17 is disclosed in Note 4. As this is the first year of application, comparative information is not required.
(y) New Accounting Standards and Interpretations not yet mandatory or early adoptedAustralian Accounting Standards and Interpretations that have recently been issued or amended but are not yet mandatory, have not been early adopted by Gold Coast Health. Gold Coast Health’s assessment of the impact of these new or amended Accounting Standards and Interpretations where applicable, are set out below.
AASB 1058 Income of Not-for-Profit Entities and AASB 15 Revenue from Contracts with Customers
These standards will first apply in Gold Coast Health’s financial statements from 2019–20. AASB 15 Revenue from Contracts requires much more detailed requirements for the accounting for certain types of revenue from customers. Depending on the specific contractual terms, the new requirements may potentially result in a change to the timing of revenue from sales of Gold Coast Health’s goods and services, such that some revenue may need to be deferred to a later reporting period to the extent that the service has not met its associated obligations. Further, under the new standards, grants presently recognised as revenue upfront may be eligible to be recognised as revenue progressively as the associated performance obligations are satisfied, but only if the associated performance obligations are enforceable and sufficiently specific.
Gold Coast Health is yet to complete its analysis of current arrangements for sale of its goods and services, but at this stage does not expect a significant impact on its present accounting practices.
71

AASB 9 Financial Instruments and AASB 2014–7 Amendments to Australian Accounting Standards arising from AASB 9 (December 2014)
AASB 9 Financial Instruments and AASB 2014–7 Amendments to Australian Accounting Standards arising from AASB 9 (December 2014) will become effective from reporting periods beginning on or after 1 January 2018. The main impacts of these standards on Gold Coast Health are that they will change the requirements for the classification, measurement, impairment and disclosures associated with financial assets. AASB 9 will introduce different criteria for whether financial assets can be measured at amortised cost or fair value.
The most likely ongoing disclosure impacts are expected to relate to the credit risk of financial assets subject to impairment. Gold Coast Health’s receivables do not include a significant financing component and therefore impairment losses will be determined according to the amount of lifetime expected credit losses. As Gold Coast Health’s receivables are short-term in nature, it is not expected that there will be a significant impact.
AASB 16 Leases
AASB 16 Leases will be effective for annual periods beginning on or after 1 January 2019. It supersedes:
(a) AASB 117 Leases;
(b) Interpretation 4 Determining whether an Arrangement contains a Lease;
(c) SIC-15 Operating Leases—Incentives; and
(d) SIC-27 Evaluating the Substance of Transactions Involving the Legal Form of a Lease.
This standard introduces a single lessee accounting model and requires a lessee to recognise assets and liabilities for all leases (both operating and finance) with a term of more than 12 months, unless the underlying asset is of low value. A lessee is required to recognise a right-of-use asset representing its right to use the underlying asset and a lease liability representing its obligations to make lease payments. Lessors continue to classify leases as operating or finance. Presently Gold Coast Health has minimal non-cancellable operating leases with a term exceeding 12 months and as such it is not anticipated that the impact of changes to the accounting standards for leases will have a material impact.
Note 1. Significant accounting policies (continued)
72

This note provides an explanation for major variances between the original budget and actual performance for 2016–2017. An explanation has also been provided for health service funding revenue due to its significance.
The original budget is the budget part of the Queensland Health Service Delivery Statement which was published prior to the completion of service agreement negotiations.
Statement of Comprehensive Income
Variance Notes
Original Budget 2017
$’000
Actual 2017 $’000
Variance $’000
Revenue
Health service funding
User charges and fees
Grants and other contributions
Other revenue
Net revaluation increment
A
B
C
B
F
1,183,696
86,345
12,656
740
-
1,234,756
92,938
19,439
5,821
5,562
51,060
6,593
6,783
5,081
5,562
Total revenue 1,283,437 1,358,516 75,079
Expenses
Employee expenses
Supplies and services
Grants and subsidies
Depreciation and amortisation
Impairment loss
Other expenses
D
E
(865,404)
(332,939)
(1,323)
(79,458)
(950)
(3,363)
(908,804)
(354,894)
(804)
(79,165)
(1,680)
(6,763)
(43,400)
(21,955)
519
293
(730)
(3,400)
Total expenses (1,283,437) (1,352,110) (68,673)
Surplus for the year - 6,406 6,406
Other comprehensive income for the year Items that will not be reclassified subsequently to operating result:
– Increase in asset revaluation surplus
Total other comprehensive income
F
-
-
36,521
36,521
36,521
36,521
Total comprehensive income for the year - 42,927 42,927
Note 2. Budget vs Actual Comparison
73

Statement of Financial Position
Variance Notes
Original Budget 2017
$’000
Actual 2017 $’000
Variance $’000
Assets
Current assets
Cash and cash equivalents
Receivables
Inventories
Prepayments
G
H
20,309
44,893
8,106
1,537
65,172
28,136
8,610
2,066
44,863
(16,757)
504
529
Total current assets 74,845 103,984 29,139
Non-current assets
Property, plant and equipment
Intangibles
I 1,761,957
727
1,736,399
1,850
(25,558)
1,123
Total non-current assets 1,762,684 1,738,249 (24,435)
Total assets 1,837,529 1,842,233 4,704
Liabilities
Current Liabilities
Payables
Accrued employee benefits
Unearned revenue
J
K
27,331
23,170
5,047
36,942
35,743
4,948
9,611
12,573
(99)
Total current liabilities 55,548 77,633 22,085
Net assets 1,781,981 1,764,600 (17,381)
Equity
Contributed equity
Accumulated surplus/(deficit)
Asset revaluation surplus
L
F
1,669,505
(933)
113,409
1,679,905
16,019
68,676
10,400
16,952
(44,733)
Total equity 1,781,981 1,764,600 (17,381)
Note 2. Budget vs Actual Comparison (continued)
74

Statement of cash flows
Variance Notes
Original Budget 2017
$’000
Actual 2017 $’000
Variance $’000
Cash flows from operating activities
Health service funding
User charges and fees
Grants and contributions
GST collected from customers
GST input tax credits from Australian Taxation Office
Other operating cash inflows
Employee expenses
Supplies and services
Grants and subsidies
GST paid to suppliers
GST remitted to Australian Taxation Office
Other operating cash outflows
A
B
C
N
N
B
D
E
N
N
1,104,239
85,043
12,656
-
8,050
740
(865,398)
(330,907)
(1,323)
(8,055)
-
(3,128)
1,153,633
89,535
19,254
1,562
15,571
5,685
(903,879)
(356,511)
(804)
(15,485)
(1,323)
(6,193)
49,394
4,492
6,598
1,562
7,521
4,945
(38,481)
(25,604)
519
(7,430)
(1,323)
(3,065)
Net cash from operating activities 1,917 1,045 (872)
Cash flows from investing activities
Payments for property, plant and equipment
Payments for intangibles
Proceeds from sale of property, plant and equipment
M (6,389)
-
(85)
(12,614)
-
931
(6,225)
-
1,016
Net cash used in investing activities (6,474) (11,683) (5,209)
Cash flows from financing activities
Equity injection L 6,389 13,316 6,927
Net cash from financing activities 6,389 13,316 6,927
Net increase in cash and cash equivalents
Cash and cash equivalents at the beginning of the financial year
1,832
18,477
2,678
62,494
846
44,017
Cash and cash equivalents at the end of the financial year
G 20,309 65,172 44,863
75

Explanations of major variances
A. Health service funding variance Health service funding revenue has increased by $51.1 million due to additional patient activity (estimated actual weighted activity units are 212,284 compared with budgeted activity of 198,182) and additional funding for new enterprise bargaining agreements which took effect during 2016–2017 ($22.0 million). This caused the corresponding increase in statement of cash flows of $49.4 million.
B. User charges and fees variance The combined user charges revenue and other revenue is higher than budget by $11.7 million. Additional patient activity led to additional revenue from chargeable services. This also caused the corresponding combined increase in the statement of cash flows of $9.4 million.
C. Grants and contributions variance Grants revenue of $19.4 million aligns to the funding agreements negotiated by Gold Coast Health with various State and Commonwealth government bodies for 2016–2017. The difference to budget relates to funding arrangements that were not confirmed before the finalisation of the budget. This also caused the corresponding increase in statement of cash flows of $6.6 million.
D. Employee expenses variance Employee expenses is $43.4 million higher than budget due to the additional staff required to service the growth in demand for healthcare services, along with new enterprise bargaining agreements which took effect during 2016–2017 ($22.0 million). The average number of full time equivalent staff for 2016–2017 is 7,360 compared to budget of 7,108. This also caused the corresponding increase in statement of cash flows of $38.4 million.
E. Supplies and services variance Supplies and services is $22.0 million higher than budget due to the costs of external contractors (mainly nursing staff ) not included in the supplies and services budget ($17.7 million), additional costs related to the growth in demand for healthcare services ($1.9 million) and costs associated with outsourcing services to ensure patients are treated within clinically recommended timeframes ($2.4 million). This also caused the corresponding increase in statement of cash flows of $25.6 million.
F. Net revaluation increment variance The net revaluation increment totalling $42.0 million ($5.5 million in revenue and $36.5m in other comprehensive income) is a result of land and building revaluation programs. The impact of
revaluations is different to the budgeted movement of $53.0 million due to the unforeseen nature of market forces affecting revaluation calculations. The budget assumed the full impact would increase the asset revaluation reserve, resulting in a variance in other comprehensive income and asset revaluation reserve.
G. Cash and cash equivalents variance The cash balance fluctuates due to the timing of receivables and payables. Refer to cash flow notes for more information.
H. Receivables variance The receivables balance is lower than budget by $16.7 million. The majority of this variance is caused by the unforeseeable nature of final amendments to funding in the Service Agreement with the Department.
I. Property, Plant and equipment variance The property, plant and equipment balance is lower than budget by $25.6 million. The majority of this variance is caused by lower than budget revaluation increment (see note F).
J. Payables variance The variance to budget of payables is $9.6 million and is due to a difference in the assumed impact of timing of payments to suppliers at the time of preparing the budget.
K. Accrued employee benefits variance The variance to budget of accrued employee benefits is $12.6 million and is due primarily to the impact of increased employee expenses (refer note D) and timing of payroll payment run.
L. Equity injection variance The variance to budget in contributed equity of $10.4 million was primarily due to equity injections. The equity injection of $13.3 million reflects the Department of Health capital funding connected with the establishment of the Gold Coast University Hospital and replacement of critical medical equipment. This increased by $6.9 million compared to budget due to the increased capital requirements arising from provision of new and/or expanded health care services.
M. Payments for property plant and equipment variance Payments for property, plant and equipment ($12.6 million) predominantly reflects the expenditure of the equity injection funding of $13.3 million (see note L).
N. GST variance Per Queensland Treasury Financial Reporting Requirements, GST inflows and outflows are reported separately in the financial statements. The net impact of the GST variance in the cash flow is only $0.3 million.
Note 2. Budget vs Actual Comparison (continued)
76
Note 3. Key Management Personnel
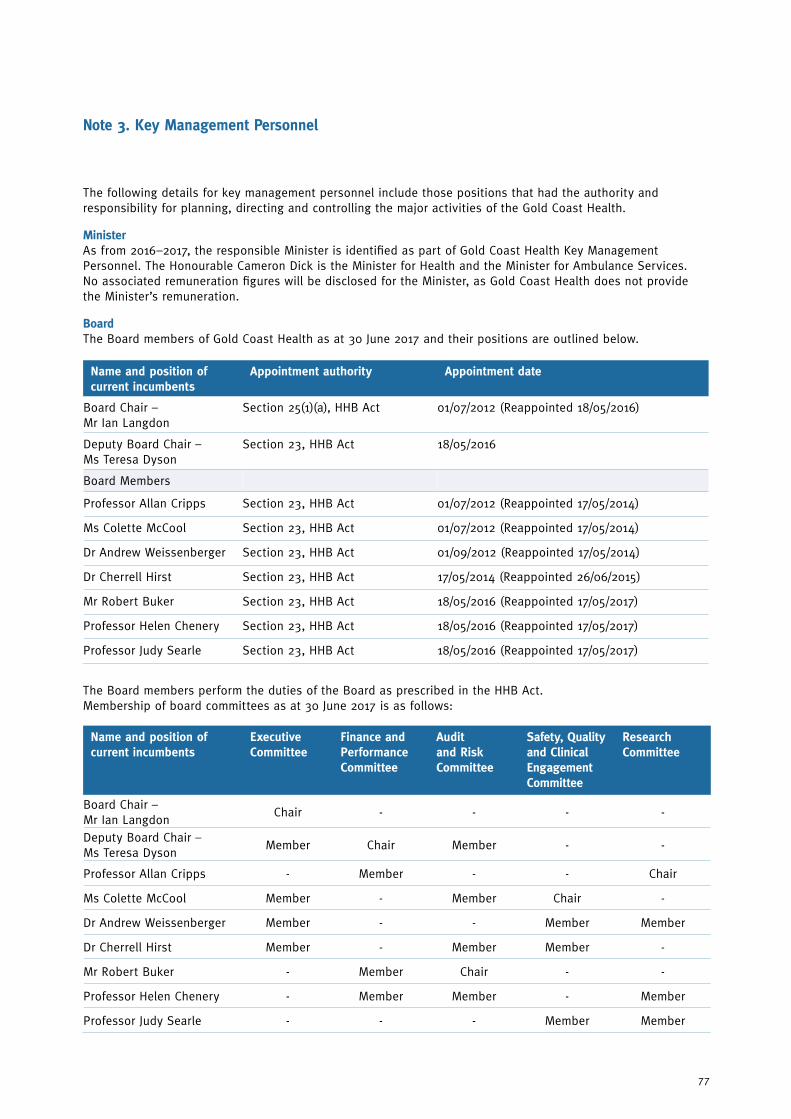
The following details for key management personnel include those positions that had the authority and responsibility for planning, directing and controlling the major activities of the Gold Coast Health.
MinisterAs from 2016–2017, the responsible Minister is identified as part of Gold Coast Health Key Management Personnel. The Honourable Cameron Dick is the Minister for Health and the Minister for Ambulance Services. No associated remuneration figures will be disclosed for the Minister, as Gold Coast Health does not provide the Minister’s remuneration.
BoardThe Board members of Gold Coast Health as at 30 June 2017 and their positions are outlined below.
Name and position of current incumbents
Executive Committee
Finance and Performance Committee
Audit and Risk Committee
Safety, Quality and Clinical Engagement Committee
Research Committee
Board Chair – Mr Ian Langdon
Chair - - - -
Deputy Board Chair – Ms Teresa Dyson
Member Chair Member - -
Professor Allan Cripps - Member - - Chair
Ms Colette McCool Member - Member Chair -
Dr Andrew Weissenberger Member - - Member Member
Dr Cherrell Hirst Member - Member Member -
Mr Robert Buker - Member Chair - -
Professor Helen Chenery - Member Member - Member
Professor Judy Searle - - - Member Member
The Board members perform the duties of the Board as prescribed in the HHB Act. Membership of board committees as at 30 June 2017 is as follows:
Name and position of current incumbents
Appointment authority Appointment date
Board Chair – Mr Ian Langdon
Section 25(1)(a), HHB Act 01/07/2012 (Reappointed 18/05/2016)
Deputy Board Chair – Ms Teresa Dyson
Section 23, HHB Act 18/05/2016
Board Members
Professor Allan Cripps Section 23, HHB Act 01/07/2012 (Reappointed 17/05/2014)
Ms Colette McCool Section 23, HHB Act 01/07/2012 (Reappointed 17/05/2014)
Dr Andrew Weissenberger Section 23, HHB Act 01/09/2012 (Reappointed 17/05/2014)
Dr Cherrell Hirst Section 23, HHB Act 17/05/2014 (Reappointed 26/06/2015)
Mr Robert Buker Section 23, HHB Act 18/05/2016 (Reappointed 17/05/2017)
Professor Helen Chenery Section 23, HHB Act 18/05/2016 (Reappointed 17/05/2017)
Professor Judy Searle Section 23, HHB Act 18/05/2016 (Reappointed 17/05/2017)
77

ExecutivesThe Key Management Personnel – Executive level includes those positions that have responsibility for planning, directing and controlling the agency as a whole. Each member holds responsibility for their divisional, financial, operational and clinical performance.
Name and position of current incumbents Appointment authority Appointment date
Chief Executive – Mr Ron Calvert SESL Contract – Section 33, HHB Act. 01/10/2012*
Chief Operations Officer – Ms Kimberley Pierce (previously named Executive Director, Operations)
HES3 Contract – Section 67, HHB Act. 15/08/2016
Executive Director, Finance and Business Services – Mr Ian Moody
HES3 Contract – Section 67, HHB Act. 04/12/2013
Executive Director, Clinical Governance, Education and Research – Professor Marianne Vonau
Medical Officer (Queensland Health) Certified Agreement (No. 4) 2015
01/09/2014
Executive Director, Digital Transformation Services – Mr Damian Green (previously named Executive Director, People, Systems and Performance up to 18/09/2016)
HES3 Contract – Section 67, HHB Act. 07/01/2013
Executive Director, People and Engagement – Ms Hannah Bloch (new position from 19/09/2016)
HES2 Contract – Section 67, HHB Act. 19/09/2016
Executive Director, Strategy and Planning – Ms Toni Peggrem
HES3 Contract – Section 67, HHB Act. 29/09/2014
Executive Director, Governance, Risk and Commercial Services – Ms Rebecca Freath
HES2 Contract – Section 67, HHB Act. 01/08/2014
* reappointed 20 June 2016
a) Remuneration Remuneration policy for the Gold Coast Health Board are approved by the Governor in Council and the Chair, Deputy Chair and members are paid an annual fee consistent with the government procedures titled ‘Remuneration procedures for part-time chairs and members of Queensland Government bodies’. Remuneration policy for Gold Coast Health Executive is set by the Director-General of the Department as provided for under the HHB Act. The remuneration and other terms of employment for are specified in individual employment contracts. Remuneration packages for key management personnel comprise the following components:
• Short term employee benefits which include: base salary, allowances and annual leave entitlements expensed for the entire year or for that part of the year during which the employee occupied the specified position. Non-monetary benefits consist of provision of vehicle together with fringe benefits tax applicable to the benefit.
• Long term employee benefits include amounts expensed in respect of long service leave.
• Post-employment benefits include amounts expensed in respect of employer superannuation obligations.
• Redundancy payments are not provided for within individual contracts of employment. Contracts of employment provide only for notice periods or payment in lieu of notice on termination, regardless of the reason for termination.
• Performance bonuses are not paid under the contracts in place.
Total fixed remuneration is calculated on a ‘total cost’ basis and includes the base and non-monetary benefits, long term employee benefits and post-employment benefits.
Due to a change in assessment of which positions constitutes Key Management Personal per Queensland Treasury Financial Reporting Requirements, there are additional positions published for the prior year that have not met the definition in the current year.
Note 3. Key Management Personnel (continued)
78

2017
Short-term employee expenses
Post- employment
expenses $’000
Long-term employee expenses
$’000
Termination benefits
$’000
Total Expenses
$’000
Monetary $’000
Non-monetary
$’000
Board
Board Chair – Mr Ian Langdon
98 - 9 - - 107
Board Chair – Ms Teresa Dyson
61 - 6 - - 67
Board Members
Professor Allan Cripps 51 - 5 - - 56
Ms Colette McCool 55 - 5 - - 60
Dr Andrew Weissenberger 53 - 5 - - 58
Dr Cherrell Hirst 56 - 6 - - 62
Mr Robert Buker 53 - 5 - - 58
Professor Helen Chenery 54 - 5 - - 59
Professor Judy Searle 50 - 5 - - 55
Executive Management
Chief Executive – Mr Ron Calvert
469 11 39 9 - 528
Chief Operations Officer (previously Executive Director, Operations) – Kimberley Pierce (from 15/08/16)
201 - 20 4 - 225
Executive Director, Finance and Business Services – Mr Ian Moody
237 - 24 5 - 266
Executive Director, Clinical Governance, Education and Research – Professor Marianne Vonau
424 - 32 8 - 464
Executive Director, Digital Transformation Service (previously Executive Director, People, Systems and Performance) – Mr Damian Green
234 - 18 4 - 256
Executive Director, People and Engagement – Ms Hannah Bloch (from 19/09/16)
158 - 16 3 - 177
Executive Director, Strategy and Planning – Ms Toni Peggrem
210 - 20 4 - 234
Executive Director, Governance, Risk and Commercial Services – Ms Rebecca Freath
188 - 19 4 - 211
79

2016
Short-term employee expenses
Post- employment
expenses $’000
Long-term employee expenses
$’000
Termination benefits
$’000
Total Expenses
$’000
Monetary $’000
Non-monetary
$’000
Board
Board Chair – Mr Ian Langdon
96 - 8 - - 104
Deputy Board Chair – Mr Kenneth Brown (To 17/05/2016)
49 - 5 - - 54
Deputy Board Chair – Ms Teresa Dyson (From 18/05/2016)
6 - - - - 6
Board Members
Professor Allan Cripps 51 - 5 - - 56
Ms Colette McCool 52 - 6 - - 58
Ms Pauline Ross (To 17/05/2016)
43 - 5 - - 48
Dr Andrew Weissenberger 48 - 4 - - 52
Dr Cherrell Hirst 53 - 5 - - 58
Mr Robert Buker (From 18/05/2016)
5 - 1 - - 6
Professor Helen Chenery (From 18/05/2016)
4 - - - - 4
Professor Judy Searle (From 18/05/2016)
3 - - - - 3
Note 3. Key Management Personnel (continued)
80

2016
Short-term employee expenses
Post- employment
expenses $’000
Long-term employee expenses
$’000
Termination benefits
$’000
Total Expenses
$’000
Monetary $’000
Non-monetary
$’000
Executive Management Team
Chief Executive – Mr Ron Calvert
362 10 30 7 - 409
Executive Director, Operations – Ms Jane Hancock
208 - 21 4 - 233
Executive Director, Finance and Business Services – Mr Ian Moody
229 - 23 4 - 256
Executive Director, Clinical Governance, Education and Research – Professor Marianne Vonau
434 - 31 8 - 473
Executive Director, People, Systems and Performance – Mr Damian Green
223 - 22 4 - 249
Executive Director, Strategy & Planning – Ms Toni Peggrem
204 - 15 4 - 223
Executive Director, Governance, Risk and Commercial Services – Ms Rebecca Freath
191 - 19 4 - 214
General Manager, Specialty and Procedural Services – Mr Brendan Docherty (To 21/02/2016)
118 - 11 2 - 131
A/General Manager, Specialty and Procedural Services – Mr Colin Dawson (From 22/02/2016)
50 - 6 1 - 57
Clinical Director, Specialty and Procedural Services – Dr Deborah Bailey
439 - 30 9 - 478
General Manager, Diagnostic, Emergency and Medical Services – Ms Kimberley Pierce
196 - 19 4 - 219
Clinical Director, Diagnostic, Emergency and Medical Services – Dr Mark Forbes
449 1 30 9 - 489
81

2016
Short-term employee expenses
Post- employment
expenses $’000
Long-term employee expenses
$’000
Termination benefits
$’000
Total Expenses
$’000
Monetary $’000
Non-monetary
$’000
General Manager, Mental Health and Specialist Services – Ms Karlyn Chettleburgh
210 1 21 4 - 236
Clinical Director, Mental Health and Specialist Services – Dr Kathryn Turner
397 2 25 8 - 432
General Manager, Cancer, Access and Support Services – Ms Alison Ewens
200 - 20 4 - 224
Clinical Director, Cancer, Access and Support Services – Dr Jeremy Wellwood
443 - 31 9 - 483
Senior Director, Clinical Governance and Community Partnerships – Ms Morven Gemmill (To 28/08/2015)
35 - 2 - 83 120
Senior Director, Clinical Governance and Community Partnerships – Ms Erin Finn (From 11/01/2016)
136 - 15 3 - 154
Professor Nursing and Midwifery – Professor Anita Bamford-Wade
186 - 18 4 - 208
Professor Allied Health – Professor Sharon Mickan
179 - 18 3 - 200
Director of Nursing, Diagnostic, Emergency and Medical Services – Ms Paula Duffy
159 - 18 3 - 180
Director of Nursing, Cancer, Access and Support Services – Mr Matthew Lunn
154 - 17 3 - 174
Director of Nursing, Mental Health and Specialist Services – Ms Diana Grice
162 - 18 3 - 183
Director of Nursing, Specialty and Procedural Services – Mr Paul Nieuwenhoven
118 - 13 2 - 133
Note 3. Key Management Personnel (continued)
82
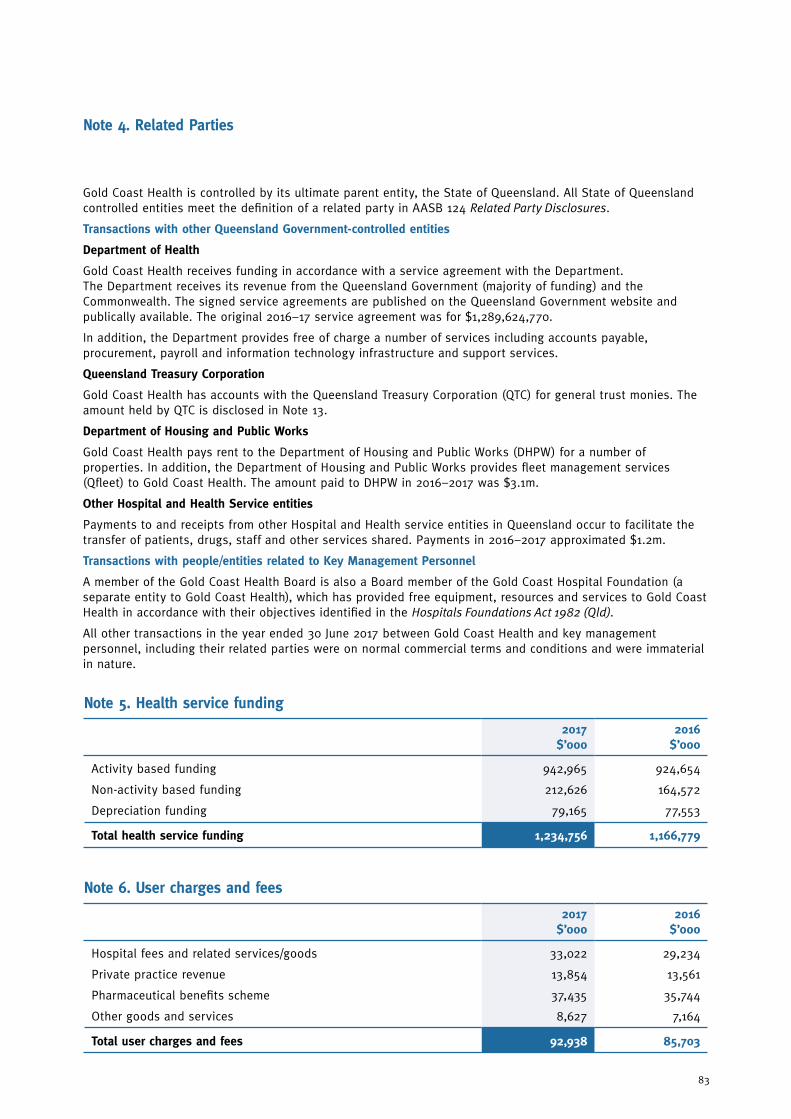
Note 4. Related Parties
Gold Coast Health is controlled by its ultimate parent entity, the State of Queensland. All State of Queensland controlled entities meet the definition of a related party in AASB 124 Related Party Disclosures.
Transactions with other Queensland Government-controlled entities
Department of Health
Gold Coast Health receives funding in accordance with a service agreement with the Department. The Department receives its revenue from the Queensland Government (majority of funding) and the Commonwealth. The signed service agreements are published on the Queensland Government website and publically available. The original 2016–17 service agreement was for $1,289,624,770.
In addition, the Department provides free of charge a number of services including accounts payable, procurement, payroll and information technology infrastructure and support services.
Queensland Treasury Corporation
Gold Coast Health has accounts with the Queensland Treasury Corporation (QTC) for general trust monies. The amount held by QTC is disclosed in Note 13.
Department of Housing and Public Works
Gold Coast Health pays rent to the Department of Housing and Public Works (DHPW) for a number of properties. In addition, the Department of Housing and Public Works provides fleet management services (Qfleet) to Gold Coast Health. The amount paid to DHPW in 2016–2017 was $3.1m.
Other Hospital and Health Service entities
Payments to and receipts from other Hospital and Health service entities in Queensland occur to facilitate the transfer of patients, drugs, staff and other services shared. Payments in 2016–2017 approximated $1.2m.
Transactions with people/entities related to Key Management Personnel
A member of the Gold Coast Health Board is also a Board member of the Gold Coast Hospital Foundation (a separate entity to Gold Coast Health), which has provided free equipment, resources and services to Gold Coast Health in accordance with their objectives identified in the Hospitals Foundations Act 1982 (Qld).
All other transactions in the year ended 30 June 2017 between Gold Coast Health and key management personnel, including their related parties were on normal commercial terms and conditions and were immaterial in nature.
Note 5. Health service funding
2017 $’000
2016 $’000
Activity based funding
Non-activity based funding
Depreciation funding
942,965
212,626
79,165
924,654
164,572
77,553
Total health service funding 1,234,756 1,166,779
Note 6. User charges and fees
2017 $’000
2016 $’000
Hospital fees and related services/goods
Private practice revenue
Pharmaceutical benefits scheme
Other goods and services
33,022
13,854
37,435
8,627
29,234
13,561
35,744
7,164
Total user charges and fees 92,938 85,703
83

Note 7. Grants and other contributions
2017 $’000
2016 $’000
Commonwealth grants and contributions
Other grants and contributions
Donations other
Donations non-current physical assets
13,355
4,484
1,415
185
13,723
4,206
1,137
210
Total grants and contributions 19,439 19,276
Note 8. Other revenue
2017 $’000
2016 $’000
Interest
Minor capital recoveries
Rental income
Gain on sale of property plant and equipment
Other
198
983
2,196
135
2,309
224
2,000
2,073
42
1,607
Total other revenue 5,821 5,946
Note 9. Employee expenses
2017 $’000
2016 $’000
Employee expenses
Employee benefits
Wages and salaries
Annual Leave
Superannuation
Long Service Leave
Termination payments
Employee related expenses
Other employee related expenses
Workers compensation premium
Payroll tax
717,904
86,362
75,450
15,256
612
7,019
6,198
3
657,294
77,113
69,040
14,008
380
7,401
6,174
3
Total employee expenses 908,804 831,413
The number of employees of Gold Coast Health at 30 June 2017 measured on a full-time equivalent basis (reflecting Minimum Obligatory Human Resource Information) is 7,436 (30 June 2016: 7,279).
84

Note 10. Supplies and services
2017 $’000
2016 $’000
Building services
Catering and domestic supplies
Clinical supplies and services
Communications
Computer services
Consultants
Contractors and external labour
Drugs
Expenses relating to capital works
Insurance premiums (Queensland Government Insurance Fund) *
Interstate patient expenses
Motor vehicles
Operating lease rentals
Outsourced service delivery
Repairs and maintenance
Travel – patients
Travel – staff
Utilities
Other
418
10,160
99,816
13,304
13,198
1,051
17,653
54,020
1,915
12,766
49,240
1,271
4,041
24,333
24,885
4,697
1,145
14,363
6,618
482
12,992
98,665
12,650
7,399
1,690
21,765
51,423
4,149
11,469
49,014
1,177
3,887
27,273
32,051
4,799
1,252
10,583
5,484
Total supplies and services 354,894 358,204
* Gold Coast Health is covered by the Department’s insurance policy with the Queensland Government Insurance Fund (QGIF). Gold Coast Health pays a fee to the Department as part of a fee-for-service arrangement.
Note 11. Impairment loss
2017 $’000
2016 $’000
Impairment on receivables
Impairment on intangibles
(1,680)
-
(1,400)
(267)
Total impairment loss (1,680) (1,667)
85

Note 13. Current assets – Cash and cash equivalents
2017 $’000
2016 $’000
Cash on hand
Cash at bank
QTC Cash Fund
23
57,842
7,307
33
55,316
7,145
Total cash 65,172 62,494
Note 12. Other expenses
2017 $’000
2016 $’000
Advertising
Ex-gratia payments*
External audit fees**
Insurance – other
Internal audit fees
Interpreter fees
Inventory written off
Legal Fees
Losses from the disposal of non-current assets
Other expenses
369
140
237
125
340
908
167
581
569
3,327
560
19
229
200
251
952
170
798
373
4,109
Total other expenses 6,763 7,661
*Ex-gratia payments are special payments that Gold Coast Health is not contractually or legally obligated to make to other parties and include payments to patients and staff for damaged or lost property. In compliance with the Financial and Performance Management Standard 2009, Gold Coast Health maintains a register setting out details of all special payments greater than $5,000. Three payments for patient and employee related matters exceeded the $5,000 threshold in 2016–2017.
**Total audit fees paid or accrued to the Queensland Audit Office for the financial statement audit were $237,000 (2016: $240,000). There are no non-audit services included in this amount.
86

a) Restricted Cash Gold Coast Health receives cash contributions from private practice arrangements (refer to Note 26) for education, study and research in clinical areas, and from external parties in the form of gifts, donations and bequests for stipulated purposes. This money is retained separately and payments are only made from the General Trust Fund for the specific purposes upon which contributions were received.
b) Effective Interest Rate Cash deposited with the Queensland Treasury Corporation earns interest at a rate of 2.43% per annum (2016: 2.78%). No interest is earned on other bank accounts.
c) Reconciliation of surplus to net cash from operating activities
2017 $’000
2016 $’000
Surplus for the year
Adjustments for:
Depreciation and amortisation
Net loss on disposal of property, plant and equipment
Net revaluation (increment)
Impairment loss on intangibles
Depreciation and amortisation funding
Other
Change in operating assets and liabilities:
(Increase)/Decrease in receivables
(Increase) in inventories
(Increase) in prepayments
(Decrease)/Increase in payables
Increase/(Decrease) in other employee benefits
Increase/(Decrease) in unearned revenue
6,406
79,165
569
(5,562)
-
(79,165)
(317)
(7,149)
(493)
(617)
(533)
4,925
3,816
10,547
77,553
373
(10,294)
267
(77,553)
(249)
22,912
(189)
(447)
3,622
(5,516)
(3,916)
Net cash from operating activities 1,045 17,110
87
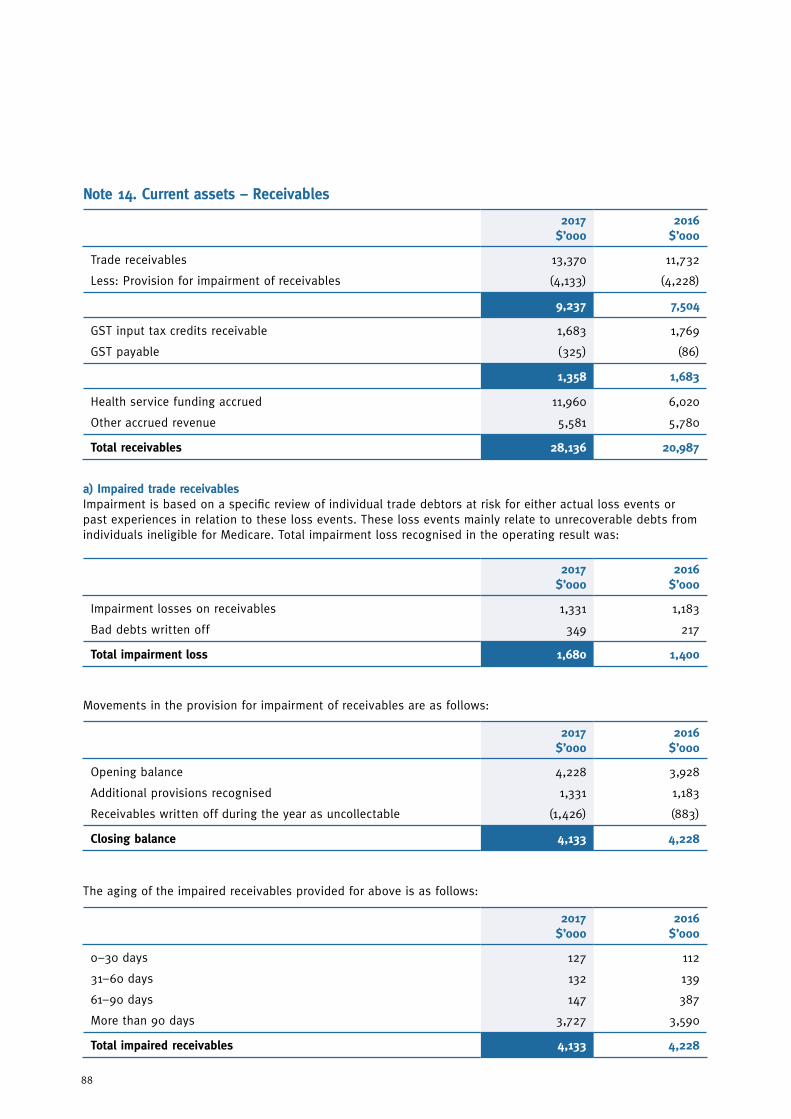
a) Impaired trade receivablesImpairment is based on a specific review of individual trade debtors at risk for either actual loss events or past experiences in relation to these loss events. These loss events mainly relate to unrecoverable debts from individuals ineligible for Medicare. Total impairment loss recognised in the operating result was:
Movements in the provision for impairment of receivables are as follows:
The aging of the impaired receivables provided for above is as follows:
2017 $’000
2016 $’000
Impairment losses on receivables
Bad debts written off
1,331
349
1,183
217
Total impairment loss 1,680 1,400
2017 $’000
2016 $’000
Opening balance
Additional provisions recognised
Receivables written off during the year as uncollectable
4,228
1,331
(1,426)
3,928
1,183
(883)
Closing balance 4,133 4,228
2017 $’000
2016 $’000
0–30 days
31–60 days
61–90 days
More than 90 days
127
132
147
3,727
112
139
387
3,590
Total impaired receivables 4,133 4,228
Note 14. Current assets – Receivables
2017 $’000
2016 $’000
Trade receivables
Less: Provision for impairment of receivables
13,370
(4,133)
11,732
(4,228)
9,237 7,504
GST input tax credits receivable
GST payable
1,683
(325)
1,769
(86)
1,358 1,683
Health service funding accrued
Other accrued revenue
11,960
5,581
6,020
5,780
Total receivables 28,136 20,987
88

b) Past due but not impairedThe aging of the past due but not impaired receivables is as follows:
2017 $’000
2016 $’000
0–30 days
31–60 days
61–90 days
More than 90 days
-
2,231
798
439
-
2,337
750
135
Total past due but not impaired 3,468 3,222
Based on credit history and other information, it is expected that these amounts will be received.
Note 15. Current assets – Inventories
2017 $’000
2016 $’000
Pharmaceutical and clinical supplies
Less: Provision for impairment
Catering and domestic supplies
Other Supplies
8,302
(109)
347
70
8,000
(109)
188
38
Total inventories 8,610 8,117
Note 16. Non-current assets – Property, plant and equipment
2017 $’000
2016 $’000
Land – at independent valuation
Buildings – at independent valuation
Less: Accumulated depreciation
86,008
1,848,621
(291,005)
81,200
1,793,136
(214,306)
1,557,616 1,578,830
Plant and equipment – at cost
Less: Accumulated depreciation
180,839
(89,016)
175,027
(74,464)
91,823 100,563
Capital works in progress – at cost 952 1,016
Total property, plant and equipment 1,736,399 1,761,609
89

a) Movement reconciliationReconciliations of the written down values at the beginning and end of the current and previous financial year are set out below:
Land $’000
Buildings
$’000
Plant and Equipment
$’000
Work-in-Progress
$’000
Total $’000
Balance at 30 June 2015 70,906 1,609,979 104,819 527 1,786,231
Additions
Disposals
Revaluation increments
Donations received
Net transfers from the Department
Transfers in/(out)
Depreciation expense
-
-
10,294
-
-
-
-
461
-
23,474
-
1,289
2,312
(58,685)
9,052
(373)
-
184
-
5,137
(18,256)
7,938
-
-
-
-
(7,449)
-
17,451
(373)
33,768
184
1,289
-
(76,941)
Balance at 30 June 2016 81,200 1,578,830 100,563 1,016 1,761,609
Additions
Disposals
Revaluation increments
Donations received/made
Net transfers from the Department
Transfers in/(out)
Depreciation expense
-
(754)
5,562
-
-
-
-
-
(35)
36,521
-
-
2,071
(59,771)
7,642
(579)
-
185
(7)
2,965
(18,946)
4,972
-
-
-
-
(5,036)
-
12,614
(1,368)
42,083
185
(7)
- (78,717)
Balance at 30 June 2017 86,008 1,557,616 91,823 952 1,763,399
Note 16. Non-current assets – Property, plant and equipment (continued)
90

b) Valuations of land and buildingsFair value is the price that would be received by using assets in their highest and best use or by selling it to another market participant that would use the assets in their highest and best use, regardless of whether that price is directly derived from observable inputs or estimated using another valuation technique. All Gold Coast Health assets are currently used in line with their highest and best use.
Observable inputs are publicly available data that are relevant to the characteristics of the asset being valued. Examples for Gold Coast Health include, but are not limited to, published sales data for land and general buildings. Unobservable inputs are data, assumptions and judgements that are not publicly available, but are relevant to the characteristics of the asset being valued. Examples for Gold Coast Health include, but are not limited to, internal records of construction costs, assessment of physical condition and remaining useful life. Unobservable inputs are used to the extent that sufficient relevant and reliable observable inputs are not available for similar assets.
LandThe State Valuation Service performed a comprehensive valuation of all land holdings, with an effective valuation date of 30 June 2017. The valuation is based on a market approach. Key inputs into the valuation include publicly available data on sales of similar land in nearby localities in the 12 months prior to the date of revaluation. Adjustments were made to the sales data to take into account the location, size, street/road frontage and access, and any significant restrictions for each individual parcel of land.
Previously, the State Valuation Service had performed a comprehensive valuation of all land holdings in 2013–14 with an index applied in 2014–2015 and 2015–2016. The indices provided by the State Valuation Service were derived from data on land sales in respective areas.
Buildings AECOM Australia Pty Ltd performed a comprehensive valuation of all buildings measured on a current replacement cost basis (effective valuation date of 30 June 2017), except one building held at market value which was not revalued due to immateriality in 2016–2017. Key inputs into the valuation on replacement cost basis included internal records of the original cost of the specialised fit out and more contemporary design/construction costs published for various standard components of buildings. Significant judgement was also used to assess the remaining service potential of the buildings given local environmental conditions and the records of the current condition of the building.
Previously, Davis Langdon (now part of AECOM Australia Pty Ltd) had performed comprehensive valuations for 84 percent of the gross value of the building portfolio in 2013–2014. This included valuations of Gold Coast University Hospital and the Southport Health Precinct. In 2015-2016 (and 2014-2015 except for one property which was comprehensively revalued) an indexation rate determined by Davis Langdon was applied to the building portfolio.
The revaluation increment/decrement is shown below:
2017 $’000
2016 $’000
Recognised in operating result:
Land revaluation increment
Net building revaluation increment
5,562
-
10,294
-
Net revaluation increment 5,562 10,294
Recognised in other comprehensive income:
Land revaluation increment
Net building revaluation increment
-
36,521
-
23,474
Net revaluation increment 36,521 23,474
The asset revaluation surplus in the statement of financial position as at 30 June 2017 ($68.7 million) relates solely to the building revaluation increments.
91

The movements associated with Level 3 assets are shown below:
c) Fair value hierarchy classificationThe fair value hierarchy classification is based on the lowest level of input that is significant to the entire fair value measurement, being:
• Level 1: Quoted prices (unadjusted) in active markets for identical assets or liabilities at the measurement date
• Level 2: Inputs other than quoted prices included within Level 1 that are observable, either directly or indirectly
• Level 3: Unobservable inputs for the asset or liability
Land valued with reference to an active market is classified as Level 2. Buildings valued with reference to an active market are classified as Level 2. Purpose–built hospital buildings valued without reference to an active market are valued using the depreciated replacement cost methodology and classified as Level 3.
Level 1 $’000
Level 2 $’000
Level 3 $’000
Total $’000
2017
Assets
Land
Buildings
-
-
86,008
1,914
-
1,555,702
86,008
1,557,616
Total assets - 87,922 1,555,702 1,643,624
2016
Assets
Land
Buildings
-
-
81,200
1,615
-
1,577,215
81,200
1,578,830
Total assets - 82,815 1,577,215 1,660,030
Note 16. Non-current assets – Property, plant and equipment (continued)
2017 $’000
2016 $’000
Balance at 30 June 2016 1,577,215 1,608,312
Transfers into Level 3 from Level 2
Additions
Disposals
Revaluation increments
Net transfers from the Department
Transfers in/(out)
Depreciation
426
-
(18)
36,388
-
1,334
(59,643)
-
461
-
23,472
1,289
2,312
(58,631)
Balance at 30 June 2017 1,555,702 1,577,215
92

Note 17. Non-current assets – Intangibles
2017 $’000
2016 $’000
Software purchased – at cost
Less: Accumulated amortisation
939
(627)
3,794
(3,373)
312 421
Software developed
Less: Accumulated amortisation
2,091
(553)
428
(214)
1,538 214
Software work in progress – at cost - 1,663
Total intangibles 1,850 2,298
a) Movement reconciliationReconciliations of the written down values at the beginning and end of the current and previous financial year are set out below:
Work-in-Progress
$’000
Purchased
$’000
Developed
$’000
Total $’000
Balance at 30 June 2015 267 833 321 1,421
Additions
Transfers In/(out)
Amortisation expense
Impairment
1,663
-
-
(267)
93
-
(505)
-
-
-
(107)
-
1,756
-
(612)
(267)
Balance at 30 June 2016 1,663 421 214 2,298
Additions
Disposals
Transfers In/(out)
Amortisation expense
Impairment
-
-
(1,663)
-
-
-
-
-
(109)
-
-
-
1,663
(339)
-
-
-
-
(448)
-
Balance at 30 June 2017 - 312 1,538 1,850
93

Note 18. Current liabilities – Payables
2017 $’000
2016 $’000
Trade and other payables
Payables to the Department
Accrued expenses
8,680
2,057
26,205
9,914
2,921
24,640
Total payable 36,942 37,475
Note 19. Current liabilities – Accrued employee benefits
2017 $’000
2016 $’000
Wages and salaries payables
Superannuation payable
32,109
3,634
27,977
2,841
Total accrued employee benefits 35,743 30,818
Note 20. Current liabilities – Unearned revenue
2017 $’000
2016 $’000
Health service funding unearned revenue
Other unearned revenue
4,926
22
1,073
59
Total unearned revenue 4,948 1,132
94

2017 cases
2016 cases
Supreme Court
District Court
Magistrates Court
Tribunals, commissions and boards
3
4
1
2
3
6
1
0
Total cases 10 10
Note 21. Financial instrumentsGold Coast Health’s activities expose it to a variety of financial risks – interest risk, credit risk and liquidity risk. Financial risk management is implemented pursuant to Gold Coast Health’s Financial Management Practice Manual. Overall financial risk is managed in accordance with written principles of Gold Coast Health for overall risk management, as well as policies covering specific areas.
The carrying amounts of cash, trade and other receivables and trade and other payables are assumed to approximate their fair values as disclosed on the Statement of Financial Position due to their short-term nature.
Interest Risk Gold Coast Health is exposed to interest rate risk through its cash deposited in interest bearing accounts. Changes in interest rates have had a minimal impact on the operating result.
Credit risk Credit risk exposure refers to the situation where Gold Coast Health may incur financial loss as a result of another party to a financial instrument failing to discharge their obligation. The maximum exposure to credit risk at balance date is equal to the gross carrying amount of the financial asset, inclusive of any provisions for impairment. As such, the gross carrying amount of cash and cash equivalents as well as receivables represents the maximum exposure to credit risk. See Note 14 for further information on impairment of receivables.
Liquidity risk Liquidity risk refers to the situation where Gold Coast Health may encounter difficulty in meeting obligations associated with financial liabilities that are settled by delivering cash or another financial asset.
Gold Coast Health is exposed to liquidity risk in respect of its payables. Exposure to liquidity risk is reduced by ensuring that sufficient funds are available to meet employee and supplier obligations as they fall due. This is achieved by ensuring that minimum levels of cash are held within the various bank accounts so as to match the expected incidence and duration of the various employee and supplier liabilities. Gold Coast Health has an approved overdraft facility of $7.5 million under whole-of-Government banking arrangements to manage any unexpected short term cash shortfalls. This facility has not been drawn down as at 30 June 2017.
Gold Coast Health’s trade and other payables are expected to be settled within 30–60 days.
Note 22. Contingent liabilitiesThe following cases were filed in the courts naming the State of Queensland acting through Gold Coast Health as the defendant:
It is not possible to make a reliable estimate of the final amount payable, if any, in respect of litigations before the courts at this time. Any amount payable would be covered by the Queensland Government Insurance Fund (QGIF). Gold Coast Health’s maximum exposure under the QGIF policy is $20,000 excess for each insurable event. Tribunals, commissions and boards include matters that may never be litigated or result in payments to claims.
95

Note 23. Commitments
Non-cancellable operating leasesCommitments at the reporting date under non-cancellable operating leases are inclusive of GST and payable as follows:
Note 24. Service Concession ArrangementsSurePark Pty Ltd was appointed in July 2010 to build, own, operate and transfer the Gold Coast University Hospital western car park (land owned by Gold Coast Health). The arrangement is for a period of 31 years. There was no revenue received from SurePark Pty Ltd and no upfront payments were made. Gold Coast Health does not control the facility and therefore it is not recognised as an asset of Gold Coast Health.
Healthscope Ltd was appointed in February 2012 to build, own, operate and transfer a private hospital facility in the southeast corner of the Gold Coast University Hospital campus (land owned by Gold Coast Health). The arrangement is from 12 March 2016 for a period of 50 years with possible extensions. No upfront payments were made. Gold Coast Health has a right to rental payments based on a percentage of revenue from March 2020. A reliable estimate of the rental amount cannot yet be determined. Gold Coast Health does not control the facility and therefore it is not recognised as an asset of Gold Coast Health.
Operating leases are entered into as a means of acquiring access to office accommodation and fleet vehicles and contain no restrictions on cancellation. Lease payments are generally fixed, but with standard inflation escalation clauses.
Consistent with prior year, there are no capital expenditure (property, plant and equipment and intangible), other expenditure or grants and subsidies commitments.
Lessor CommitmentsMinimum lease commitments receivable but not recognised in the financial statements:
Gold Coast Health is the beneficiary of rental income arising from the sub-lease of clinical, retail and office accommodation to third parties. Lease receipts are generally fixed, but with inflation escalation clauses.
2017 $’000
2016 $’000
Within one year
One to five years
2,523
2,509
2,712
4,319
5,032 7,031
2017 $’000
2016 $’000
Within one year
One to five years
1,547
657
1,477
2,083
2,204 3,560
96

Note 27. Events after the reporting periodNo events have occurred after the reporting period that have an impact on the financial statements.
Note 26. Granted private practice arrangementsGold Coast Health performs a custodial role in respect of private practice transactions and balances, and as such these are not recognised in the financial statements but are disclosed in these notes for information purposes.
The cash balance above represents timing differences between cash receipts and payments in relation to the private practice arrangements.
* Private Practice Trust funds are generated by doctors reaching the ceiling allowable under the retention option arrangements. These funds are included in the General Trust Fund and the allocation of these funds is managed by an advisory committee.
Note 25. Trust transactions and balances
Patient trust receipts and payments 2017 $’000
2016 $’000
Receipts
Amounts receipted on behalf of patients
Payments
Amounts paid to or on behalf of patients
Assets
Cash held and bank deposits on behalf of patients
265
259
24
240
235
18
Trust receipts and payments 2017 $’000
2016 $’000
Receipts
Private practice revenue
Private practice interest revenue
21,062
33
19,487
32
Total receipts 21,095 19,519
Payments
Payments to private practice doctors under retention arrangements
Payments to Gold Coast Health for service fees
Payments to Gold Coast Health for assignment arrangements
Payments to Gold Coast Health Private Practice Trust Fund*
6,623
6,347
6,209
1,352
4,524
6,908
7,354
940
Total payments 20,531 19,726
Assets
Cash held and bank deposits for private practice 2,376 1,812
97

Certificate of Gold Coast Hospital and Health ServiceThese general purpose financial statements have been prepared pursuant to s.62(1) of the Financial Accountability Act 2009 (the Act), section 43 of the Financial and Performance Management Standard 2009 and other prescribed requirements. In accordance with s.62(1)(b) of the Act we certify that in our opinion:
(a) the prescribed requirements for establishing and keeping the accounts have been complied with in all material respects; and
(b) the financial statements have been drawn up to present a true and fair view, in accordance with prescribed accounting standards, of the transactions of the Gold Coast Hospital and Health Service for the financial year ended 30 June 2017 and of the financial position of the Gold Coast Hospital and Health Service at the end of that year; and
(c) these assertions are based on an appropriate system of internal controls and risk management processes being effective, in all material respects, with respect to financial reporting throughout the reporting period.
Management certificate
Ian Langdon Board Chair
15 August 2017
30 June 2017
Ron Calvert Chief Executive
15 August 2017
98

Independent auditor’s report
99
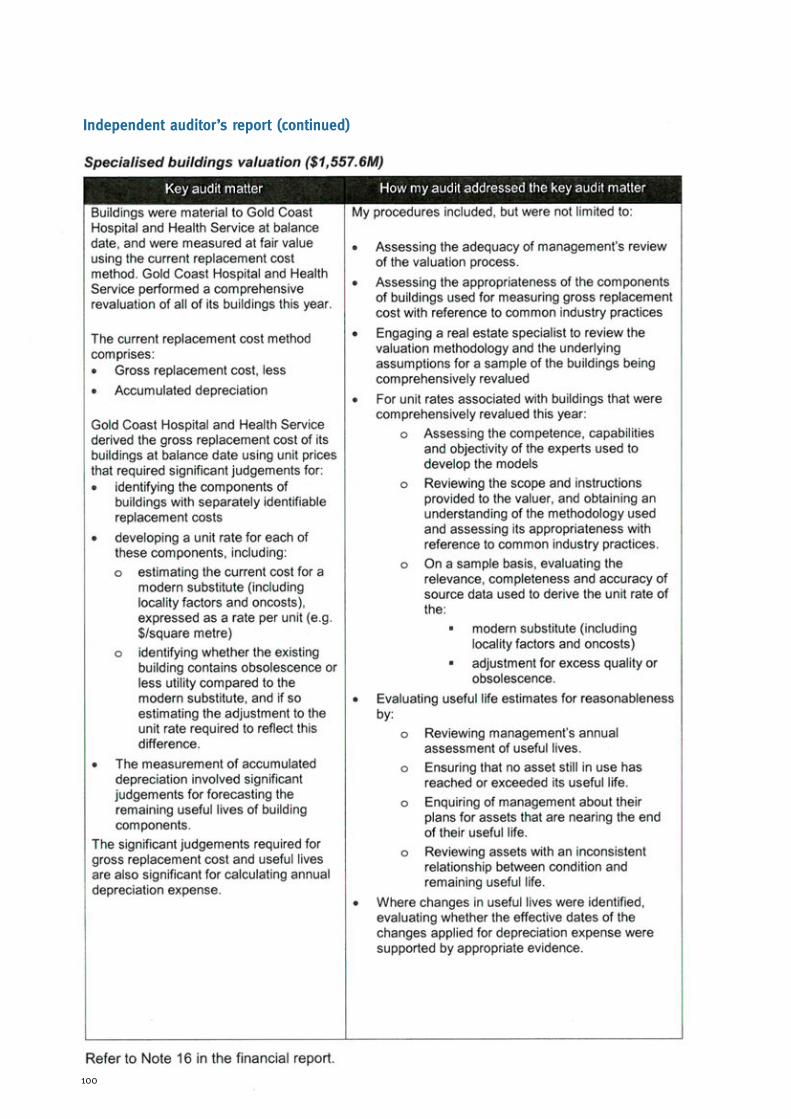
Independent auditor’s report (continued)
100

101

Independent auditor’s report (continued)
102

Index of charts and tablesAppendix 1
ChartsChart 1a: Revenue by funding source (over three years) ............................. 18
Chart 1b: Revenue, expenses and QWAUs (over three years) ...................... 18
Chart 2: Revenue by funding source ............................................................. 18
Chart 3: WAUs by purchasing category ........................................................ 19
Chart 4: WAU delivery performance by month, Q19 QWAUs vs targets ...... 19
Chart 5: Expenditure by major category .......................................................20
TablesTable 1: Service performance statement ....................................................... 21
Table 2: Births at GCUH ................................................................................ 25
Table 3: Current workforce statistics at 30 June 2017 and 2022 targets ..... 31
Table 4: New staff across Gold Coast Health ............................................... 31
Table 5: MOHRI Occupied Headcount by sex................................................34
Table 6: Professional stream MOHRI occupied FTE ......................................34
Table 7: Sex and age profile as at 30 June 2017 ......................................... 35
Table 8: Women in professional streams as at 30 June 2017 ...................... 35
Table 9: Summary of engagement activities 2016–17 by division ...............40
Table 10: Board member attendance ............................................................ 47
103
Glossary of acronyms
AASB Australian Accounting Standards Board
ABF Activity-based Funding
ACHS The Australian Council on Healthcare Standards
AODS Alcohol and Other Drugs Service
ATOD Alcohol, Tobacco and Other Drugs
BYOD Bring Your Own Device
CAG Consumer Advisory Group
CALD Culturally and Linguistically Diverse
CCC Crime and Corruption Commission
CCF Core Capability Framework
CDU Clinical Decision Unit
DHPW Department of Housing and Public Works
DPC Department Premier and Cabinet
DSO District Senior Officer
DTS Digital Transformation Services
EBP Evidence Based Practice
ECGO Executive Control Group: Operations
ED Emergency Department
EEO Equal Employment Opportunity
EMR Electronic Medical Record
EMT Executive Management Team
ENT Ear, nose, throat
EQuIP Evaluation and Quality Improvement Program
FBT Fringe Benefits Tax
FPMS Finance and Performance Management Standard 2009
FRR Financial Reporting Requirements
FTE Full-time Equivalent
GC2018 2018 Commonwealth Games
GCHKP Gold Coast Health and Knowledge Precinct
GCIC Gold Coast Integrated Care
GCUH Gold Coast University Hospital
GOLDOC Gold Coast 2018 Commonwealth Games Corporation
GP General Practitioner
GST Goods and Services Tax
HES Health Executive Service
HHB Hospital and Health Board
HHOT Homeless Health Outreach Team
HHS Hospital and Health Service
HR Human Resources
HSC Haemapoietic Stem Cell
ICT Information Communication Technology
ICU Intensive Care Unit
IHPA Independent Hospital Pricing Authority
IMT Information Management and Technology
KMP Key Managenent Personnel
KPI Key Performance Indicators
MGP Midwifery Group Practice
MHSS Mental Health and Specialist Services
MIS Management Information System
MOHRI Minimum Obligatory Human Resource Information
NAIDOC National Aborigines and Islanders Day Observance Committee
NATA National Association of Testing Authorities
Appendix 2
104

NEAT National Emergency Access Target
NED Neurodevelopment Exposure Disorder
NEST National Elective Surgery Target
NHHNA National Health and Hospitals Network Agreement
NHMRC National Health and Medical Research Council
NHS National Health Service
NICU Neonatal Intensive Care Unit
NPA National Partnership Agreement
NSQHS National Safety and Quality Health Service
PID Public Interest Disclosure
PLS Patient Liaison Service
PPH Potentially Preventable Hospitalisations
PPM Professional Practice Model
QAO Queensland Audit Office
QAS Queensland Ambulance Service
QGIF Queensland Government Insurance Fund
QPS Queensland Police Service
QTC Queensland Treasury Corporation
QWAU Queensland Weighted Activity Units
RACS Royal Australasian College of Surgeons
SCC Statutory Compliance and Conduct
SDS Service Delivery Statement
SNAP Sub- and Non-acute Patients
SRAC Strategic Research Advisory Committee
VMO Visiting Medical Officer
WAU Weighted Activity Units
105

Glossary of terms Appendix 3
Accessible Accessible healthcare is characterised by the ability of people to obtain appropriate healthcare at the right place and right time, irrespective of income, cultural background or geography.
Activity-based funding A management tool with the potential to enhance public accountability and drive technical efficiency in the delivery of health services by:
• capturing consistent and detailed information on hospital sector activity and accurately measuring the costs of delivery
• creating an explicit relationship between funds allocated and services provided
• strengthening management’s focus on outputs, outcomes and quality
• encouraging clinicians and managers to identify variations in costs and practices so they can be managed at a local level
• in the context of improving efficiency and effectiveness
• providing mechanisms to reward good practice and support quality initiatives.
Acute Having a short and relatively severe course.
Acute care Care in which the clinical intent or treatment goal is to:
• manage labour (obstetric)
• cure illness or provide definitive treatment of injury
• perform surgery
• relieve symptoms of illness or injury (excluding palliative care)
• reduce severity of an illness or injury
• protect against exacerbation and/or complication of an illness and/or injury that could threaten life or normal function
• perform diagnostic or therapeutic procedures.
Admission The process whereby a hospital accepts responsibility for a patient’s care and/or treatment. It follows a clinical decision, based on specified criteria, that a patient requires same-day or overnight care or treatment, which can occur in hospital and/or in the patient’s home (for hospital-in-the-home patients).
Allied health Professional staff who meet mandatory qualifications and regulatory requirements in the following areas: audiology; clinical measurement sciences; dietetics and nutrition; exercise physiology; leisure therapy; medical imaging; music therapy; nuclear medicine technology; occupational therapy; orthoptics; pharmacy; physiotherapy; podiatry; prosthetics and orthotics; psychology; radiation therapy; sonography; speech pathology and social work.
Best practice Cooperative way in which organisations and their employees undertake business activities in all key processes, and use benchmarking that can be expected to lead sustainable world-class positive outcomes.
106

Clinical governance A framework by which health organisations are accountable for continuously improving the quality of their services and safeguarding high standards of care by creating an environment in which excellence in clinical care will flourish.
Clinical practice Professional activity undertaken by health professionals to investigate patient symptoms and prevent and/or manage illness, together with associated professional activities for patient care.
Full-time equivalent (FTE) Refers to full-time equivalent staff currently working in a position.
Department of Health Refers to Queensland Health.
Health reform Response to the National Health and Hospitals Reform Commission Report (2009) that outlined recommendations for transforming the Australian health system, the National Health and Hospitals Network Agreement (NHHNA) signed by the Commonwealth and states and territories, other than Western Australia, in April 2010 and the National Health Reform Heads of Agreement (HoA) signed in February 2010 by the Commonwealth and all states and territories amending the NHHNA.
Hospital Healthcare facility established under Commonwealth, state or territory legislation as a hospital or a free-standing day-procedure unit and authorised to provide treatment and/or care to patients.
Hospital and Health Boards The Hospital and Health Boards are made up of a mix of members with expert skills and knowledge relevant to managing a complex health care organisation.
Hospital and Health Service Hospital and Health Service (HHS) is a separate legal entity established by Queensland Government to deliver public hospital services.
Immunisation Process of inducing immunity to an infectious agency by administering a vaccine.
Incidence Number of new cases of a condition occurring within a given population, over a certain period of time.
Indigenous health worker An Aboriginal and/or Torres Strait Islander person who holds the specified qualification and works within a primary healthcare framework to improve health outcomes for Indigenous Australians.
Long wait A ‘long wait’ elective surgery patient is one who has waited longer than the clinically recommended time for their surgery, according to the clinical urgency category assigned. That is, more than 30 days for a category 1 patient, more than 90 days for a category 2 patient and more than 365 days for a category 3 patient.
107

Nurse Navigator Highly experienced nurses who have an in-depth understanding of the health system and who will assist patients with complex healthcare needs to navigate to and from their referring general practitioner and/or other primary care providers, through hospital, the community and back home again.
Nurse practitioner A registered nurse educated and authorised to function autonomously and collaboratively in an advanced and extended clinical role. The nurse practitioner role includes assessing and managing clients using nursing knowledge and skills and may include, but is not limited to, direct referral of clients to other healthcare professionals, prescribing medications, and ordering diagnostic investigations.
Outpatient Non-admitted health service provided or accessed by an individual at a hospital or health service facility.
Outpatient service Examination, consultation, treatment or other service provided to non-admitted non-emergency patients in a speciality unit or under an organisational arrangement administered by a hospital.
Patient flow Optimal patient flow means the patient’s journey through the hospital system, be it planned or unplanned, happens in the safest, most streamlined and timely way to deliver good patient care.
Performance indicator A measure that provides an ‘indication’ of progress towards achieving the organisation’s objectives and usually has targets that define the level of performance expected against the performance indicator.
Private hospital A private hospital or free-standing day hospital, and either a hospital owned by a for-profit company or a non-profit organisation and privately funded through payment for medical services by patients or insurers. Patients admitted to private hospitals are treated by a doctor of their choice.
Public patient A public patient is one who elects to be treated as a public patient, so cannot choose the doctor who treats them, or is receiving treatment in a private hospital under a contract arrangement with a public hospital or health authority.
Glossary of terms (continued)
108

Public hospital Public hospitals offer free diagnostic services, treatment, care and accommodation to eligible patients.
Registered nurse An individual registered under national law to practice in the nursing profession as a nurse, other than as a student.
Statutory bodies A non-departmental government body, established under an Act of Parliament. Statutory bodies can include corporations, regulatory authorities and advisory committees/councils.
Sustainable A health system that provides infrastructure, such as workforce, facilities and equipment, and is innovative and responsive to emerging needs, for example, research and monitoring within available resources.
Weighted Activity Unit A standard unit used to measure all patient care activity consistently. The more resource intensive an activity is, the higher the weighted activity unit. This is multiplied by the standard unit cost to create the ‘price’ for the episode of care.
109

Compliance checklistAppendix 4
Annual report requirements for Queensland Government agencies Page 47 of 48
ATTACHMENT B – Compliance Checklist (template)
Summary of requirement Basis for requirementAnnual report
reference
Letter of compliance
• A letter of compliance from the accountable officer or statutory body to the relevant Minister/s
ARRs – section 7
Accessibility • Table of contents
• Glossary
ARRs – section 9.1
• Public availability ARRs – section 9.2
• Interpreter service statement Queensland Government Language Services Policy
ARRs – section 9.3
• Copyright notice Copyright Act 1968
ARRs – section 9.4
• Information Licensing QGEA – Information Licensing
ARRs – section 9.5
General information
• Introductory Information ARRs – section 10.1
• Agency role and main functions ARRs – section 10.2
• Operating environment ARRs – section 10.3
Non-financial performance
• Government’s objectives for the community ARRs – section 11.1
• Other whole-of-government plans / specific initiatives
ARRs – section 11.2
• Agency objectives and performance indicators ARRs – section 11.3
• Agency service areas and service standards ARRs – section 11.4
Financial performance
• Summary of financial performance ARRs – section 12.1
Governance –management and structure
• Organisational structure ARRs – section 13.1
• Executive management ARRs – section 13.2
• Government bodies (statutory bodies and other entities)
ARRs – section 13.3
• Public Sector Ethics Act 1994 Public Sector Ethics Act 1994
ARRs – section 13.4
• Queensland public service values ARRs – section 13.5
Governance –risk management and accountability
• Risk management ARRs – section 14.1
• Audit committee ARRs – section 14.2
• Internal audit ARRs – section 14.3
3
4
3 104–109
2
2
2
4
7
10
46
11
48–49
10
56
57
21
50–54
10
18–20
N/A
59
2
110

Compliance checklist (continued)
Annual report requirements for Queensland Government agencies Page 48 of 48
Summary of requirement Basis for requirementAnnual report
reference
• External scrutiny ARRs – section 14.4
• Information systems and recordkeeping ARRs – section 14.5
Governance –human resources
• Workforce planning and performance ARRs – section 15.1
• Early retirement, redundancy and retrenchment Directive No.11/12 Early Retirement, Redundancy and Retrenchment
Directive No.16/16 Early Retirement, Redundancy and Retrenchment (from 20 May 2016)
ARRs – section 15.2
Open Data • Statement advising publication of information ARRs – section 16
• Consultancies ARRs – section 33.1
• Overseas travel ARRs – section 33.2
• Queensland Language Services Policy ARRs – section 33.3
Financial statements
• Certification of financial statements FAA – section 62
FPMS – sections 42, 43 and 50
ARRs – section 17.1
• Independent Auditor’s Report FAA – section 62
FPMS – section 50
ARRs – section 17.2
FAA Financial Accountability Act 2009
FPMS Financial and Performance Management Standard 2009
ARRs Annual report requirements for Queensland Government agencies
56
59
59
58
30–37
34
98
99–102
59
59
111

Notes to Service Performance Statement
Appendix 5
1. The 2016–17 Estimated Actual figures are based on actual performance from 1 July 2016 to 30 April 2017. A Target/Estimate for percentage of emergency department patients seen within recommended timeframes is not included in the ‘All Categories’ as there is no national benchmark. Queensland public hospital emergency departments face ongoing increases in demand, with an average 1.3 per cent annual increase in emergency department attendances, which has an effect on emergency department performance.
2. This is a measure of access and timeliness of emergency department services. The 2016–17 Estimated Actual figures are based on actual performance from 1 July 2016 to 30 April 2017.
3. This is a measure of effectiveness that shows how hospitals perform in providing elective surgery services within the recommended timeframe for each urgency category. The 2016–17 Estimated Actual figures are based on actual performance from 1 July 2016 to 30 April 2017.
4. This is a National Performance Agreement indicator and a measure of effectiveness of infection control programs and services in hospitals. Staphylococcus aureus are bacteria commonly found on around 30 per cent of people’s skin and noses and often cause no adverse effects. Infections with this organism can be serious, particularly so when they infect the bloodstream. The data reported for this service standard are for bloodstream infections with Staphylococcus aureus (including methicillin resistant Staphylococcus aureus) and are reported as a rate of infection per 10,000 patient days. The Target/Estimate for this measure aligns with the national benchmark of 2 cases per 10,000 acute public hospital patient days for each jurisdiction. The 2016–17 Estimated Actual figures are based on actual performance from 1 July 2016 to 31 March 2017.
5. This is a measure of access to, and timeliness of the community support system that is in place for persons who have experienced an acute psychiatric episode requiring hospitalisation. The 2016–17 Estimated Actual is for the period 1 July 2016 to 31 January 2017. Queensland has made significant progress in improving the rate of community follow up over the past five years. Increased pressure on community and inpatient mental health services has seen increases in readmission rates and is impacting the rate of follow up.
6. This is a measure of effectiveness that shows the percentage of patients who are waiting to have their first appointment (from the time of referral) with the health professional in an outpatient clinic, within the clinically recommended time. The 2016–17 Estimated Actual figure is based on patients waiting as at 30 April 2017.
7. This is a measure of effectiveness that indicates the percentage of patients seen within clinically recommended times during the reporting period. The 2016–17 Estimated Actual figures are based on actual performance from 1 July 2016 to 30 April 2017.
8. This measure indicates the amount of time for which half of all people waited in the emergency department (for all categories), from the time of presentation to being seen by a nurse or doctor (whichever was first). The 2016–17 Estimated Actual figure is based on actual performance from 1 July 2016 to 30 April 2017.
9. This is a measure of effectiveness that reports on the number of days for which half of all patients wait before undergoing elective surgery. The 2016–17 Estimated Actual figure is based on actual performance from 1 July 2016 to 30 April 2017.
10. A WAU is a measure of activity and provides a common unit of comparison so that all activity can be measured consistently. Service agreements between the Department of Health and HHSs and other organisations specify the activity to be provided in WAUs by service type. Refer to Box 1, page 12.
11. The 2016–17 Estimated Actual figure reflects 1 July to 31 December 2016 activity based costs and actual activity based funded activity. The 2017-18 Target/Estimate reflects the activity based funding less Clinical Education and Training and Specified Grants and activity within the finance and activity schedules of the 2017-18 Final Round Service Agreements Contract Offers. 2017-18 Target/Estimate for cost per Queensland
112

WAU includes HHS activity forecast over delivery in 2016–17, funded by the Commonwealth at a marginal rate of 45 per cent. As a result, funding per Queensland WAU in 2017-18 is generally lower than the 2016–17 Target/Est cost per Queensland WAU. The impact of this is partially offset in some HHSs due to changes in Own Source Revenue classification between 2016–17 and 2017-18, and non-Queensland WAU investments. 2016–17 Est Actual cost per Queensland WAU is a point in time measure which includes the first 6 months of HHS expenditure and activity. It includes the impact of one-off investments in 2016–17.
12. This is a measure of activity. The 2016–17 Estimated Actual figures are based on 10 months of actual performance from 1 July 2016 to 30 April 2017.
13. This measure tracks the growth in occasions of service for Telehealth enabled outpatient services. These services support timely access to contemporary specialist services for patients from regional, rural and remote communities, supporting the reduction in wait times and costs associated with patient travel. The 2016–17 Estimated Actual figure is based on actual performance from 1 July 2016 to 30 April 2017 forecast out over 12 months.
14. The 2016–17 Estimated Actual figures are based on 2016–17 Queensland WAU forecasts as provided by HHSs. 2017-18 Target/Estimate figures are based on the 2017-18 Final Round Service Agreements Contract Offers. All activity is reported in the same phase - Activity Based Funding (ABF) model Q19. ‘Total WAUs – Interventions and procedures’ has been reallocated to ‘Total WAUs – Acute Inpatient Care’ and ‘Total WAUs – Outpatient Care’ service standards. ‘Total WAUs – Prevention and Primary Care’ is comprised of BreastScreen and Dental WAUs. Total WAUS - Prevention and Primary Care’ is a new measure for the Service Delivery Statement, however, it has been included in the HHS Service Agreements since 2016–17. Purchased Queensland WAUs in 2017-18 for Prevention and Primary Care are lower due to one off investments in Oral Health in 2016–17 and National Partnership Agreement (NPA) funding not yet allocated.
15. This measure counts the number of in-scope service contact hours attributable to each HHS, based on the national definition and calculation of service contacts and duration. The Estimated Actuals for 2016–17 are for the period 1 July 2016 to 31 March 2017. It is important to note that not all activity of ambulatory clinicians is in-scope for this measure, with most review and some service coordination activities excluded. In addition, improvements in data quality have contributed to the result, with the data more accurately reflecting way in which services are delivered. The Target/Estimate for this measure is determined using a standard formula based upon available clinical staffing, HHS rurality, and historical performance. The targets for these measures have been set to be consistently calculated and are considered a stretch for many services.
113

Gold Coast Hospital and Health Service2016 –2017 Annual Reportwww.goldcoast.health.qld.gov.au