Embed Size (px)
Citation preview

Financial StatementS
At December 31, 2015

02
independent auditor’S report ..................................................................................................................... 03 Financial StatementS ...........................................................................................................................................06
Summary
In compliance with Brazilian accounting practices (BR GAAP), Samarco Mineração S.A. is issuing its Financial Statement for the period ending 31 December 2015, duly audited by PricewaterhouseCoopers (PwC). As for data about our socioenvironmental and business performance and information about the actions which are underway in response to the impacts caused by the collapse of the Fundão dam, these will be published in the Annual Sustainability Report (RAS) in the second half of 2016.
Access www.samarco.com to learn more about the company.
introduction

Independent Auditor’s Report

04
Independent auditors’ report
05
Independent auditors’ report

06
Independent auditors’ report

Financial StatementsDecember 31, 2015

08
Financial Statements 2015
Balance SHeetat december 31(in thousands of reais - r$)
parent company consolidated
assets note 2015 2014 2015 2014
current
Cash and cash equivalents 4 1,799,138 2,090,026 1,822,801 2,117,649
Restricted short-term investments 5 82,785 - 82,811 20
Accounts receivable 6 362,384 644,192 190,657 637,264
Inventory 7 522,835 459,071 594,716 459,071
Recoverable taxes 8 249,602 232,424 249,664 232,473
Prepaid expenses 11,600 9,129 12,282 9,995
Other assets 9 132,904 61,727 133,071 59,262
total current assets 3,161,248 3,496,569 3,086,002 3,515,734
noncurrent
Court deposits 19 1,402,178 706,287 1,402,178 706,287
Recoverable taxes 8 49,217 53,479 49,222 53,477
Deferred income tax 28 1,373,024 - 1,373,155 -
Other assets 9 35,380 36,786 35,475 36,952
2,859,799 796,552 2,860,030 796,716
Capital expenditure 10 69,557 46,306 - -
Property, plant and equipment 12 21,355,934 15,161,586 21,356,302 15,161,940
Intangible assets 13 121,126 82,717 121,126 82,717
total noncurrent assets 24,406,416 16,087,161 24,337,458 16,041,373
total assets 27,567,664 19,583,730 27,423,460 19,557,107

09
Financial Statements 2015
Balance SHeetat december 31(in thousands of reais - r$)
parent company consolidated
liabilities note 2015 2014 2015 2014
current
Trade payables 14 118,706 348,779 116,197 347,763
Loans and financing 15 328,243 1,281,371 328,243 1,281,371
Financial charges payable 15 108,388 75,301 108,388 75,301
Payroll, provisions and social contributions 17 37,101 110,953 37,336 113,547
Taxes payable 18 66,747 62,293 66,866 62,380
Provision for income tax 28 6,571 - 6,657 68
Dividends 22 - 1,619,936 - 1,619,936
Other provisions 20 1,975,145 112,712 1,975,145 112,712
Other liabilities 21 64,701 188,581 21,343 160,254
total current liabilities 2,705,602 3,799,926 2,660,175 3,773,332
noncurrent
Loans and financing 15 14,741,919 10,291,321 14,741,919 10,291,321
Financial charges payable 15 740 177 740 177
Dividends 22 2,805,548 - 2,805,548 -
Provisions for contingencies 19 139,565 126,678 139,565 126,678
Deferred income tax 28 - 512,771 - 512,742
Other provisions 20 8,551,899 367,043 8,551,899 367,043
Other liabilities 21 275,655 172,483 176,878 172,483
total noncurrent liabilities 26,515,326 11,470,473 26,416,549 11,470,444
equity 22
Capital 297,025 297,025 297,025 297,025
Capital reserves 2,476 2,476 2,476 2,476
Revenue reserves - 294,549 - 294,549
Carrying value adjustments 3,589,203 1,615,120 3,589,203 1,615,120
Additional dividends proposed - 2,104,161 - 2,104,161
Accumulated losses (5,541,968) - (5,541,968) -
total shareholders’ equity (1,653,264) 4,313,331 (1,653,264) 4,313,331
total liabilities and shareholders’ equity 27,567,664 19,583,730 27,423,460 19,557,107
The accompanying notes are an integral part of these financial statements.

10
Financial Statements 2015
Statement of operations Financial years ended december 31 (in thousands of reais - r$)
parent company consolidated
note 2015 2014 2015 2014
Revenue 23 6,481,508 7,536,864 6,481,508 7,536,864
Cost of goods sold and services rendered 24 (3,603,182) (3,168,056) (3,603,182) (3,168,056)
Gross profit 2,878,326 4,368,808 2,878,326 4,368,808
operating expenses
Selling 25 (183,512) (183,007) (173,767) (172,927)
General and administrative 25 (58,374) (64,394) (58,374) (64,394)
Other operating expenses, net 26 (10,861,262) (696,488) (10,858,172) (689,719)
Equity in results of investees 10 10,670 15,767 - -
operating income (loss) before finance result (8,214,152) 3,440,686 (8,211,987) 3,441,768
Finance result
Finance income 27 87,413 185,972 87,547 186,082
Finance expenses 27 (738,236) (441,728) (738,258) (441,774)
Net foreing exchange variance 27 1,130,962 161,663 1,130,692 161,389
income (loss) before taxation (7,734,013) 3,346,593 (7,732,006) 3,347,465
Income tax 28 1,897,496 (541,045) 1,895,489 (541,917)
net income (loss) for the year (5,836,517) 2,805,548 (5,836,517) 2,805,548
The accompanying notes are an integral part of these financial statements.

11
Financial Statements 2015
Statement of comprehensive income (loSS)Financial years ended december 31 (in thousands of reais - r$)
parent company and consolidated
2015 2014
net income (loss) for the year (5,836,517) 2,805,548
Other comprehensive income
items that will not be reclassified to profit or loss - -
Translation adjustments in the year 1,975,684 500,980
Measurement of retirement benefit obligations (1,601) (1,312)
other comprehensive income for the year 1,974,083 499,668
total comprehensive income (loss) (3,862,434) 3,305,216
The accompanying notes are an integral part of these financial statements.

12
Financial Statements 2015
Statement of changes in Shareholders’ equityFinancial years ended december 31 (in thousands of reais - r$)
capital reserves revenue reservescarrying
value adjust-ments
profit (loss)losses
dividendsadditional proposed
total
not
e
capi
tal
Spec
ial m
onet
ary
rest
atem
ent o
f ppe
Good
will
on
shar
e su
bscr
iptio
n
tax i
ncen
tive
rese
rves
depl
etio
n re
serv
ein
cent
iviz
ed
lega
l res
erve
profi
t ret
entio
n
Balance at January 1, 2014
297,025 785 1,681 10 1,517 59,404 233,628 1,115,452 - 2,048,547 3,758,049
Net income for the year - - - - - - - - 2,805,548 - 2,805,548
other comprehensive income
Translation adjustment for the year, net of tax 22 - - - - - - - 500,980 - - 500,980
Measurement of retirement benefit obligations 22 - - - - - - - (1,312) - - (1,312)
total other comprehensive income - - - - - - - 499,668 - - 499,668
Transfer from reservers 22 - - - - - - (233,628) - 233,628 - -
Transfer to reserve 22 - - - - - - 233,628 - (233,628) - -
net income allocation:
Dividends (R$390.70 per common share)
22 - - - - - - - - - (2,048,547) (2,048,547)
Transfer to additional proposed dividends - - - - - - - - (701,387) - (701,387)
Minimum mandatory dividends 22 - - - - - - - - (2,104,161) 2,104,161 -
Balance as of december 31, 2014 297,025 785 1,681 10 1,517 59,404 233,628 1,615,120 - 2,104,161 4,313,331
Loss for the year - - - - - - - - (5,836,517) - (5,836,517)
other comprehensive income
Translation adjustment for the year, net of tax 22 - - - - - - - 1,975,684 - - 1,975,684
Measurement of retirement benefit obligations 22 - - - - - - - (1,601) - - (1,601)
total other comprehensive income - - - - - - - 1,974,083 - - 1,974,083
Allocation of additional dividends to the minimum proposed in 2014
22 - - - - - - - - - (2,104,161) (2,104,161)
Offset of losses with reserves - - - - (1,517) (59,404) (233,628) - 294,549 - -
Balance as of december 31, 2015 297,025 785 1,681 10 - - - 3,589,203 (5,541,968) - (1,653,264)
The accompanying notes are an integral part of these financial statements.

13
Financial Statements 2015
Statement of cash Flows Financial years ended december 31 (in thousands of reais - r$)
parent company consolidated
note 2015 2014 2015 2014
cash flows from operating activities
Net income (loss) before taxation (7,734,013) 3,346,593 (7,732,006) 3,347,465
adjustments to reconcile net income (loss) before tax to the cash provided by operations:
Depreciation and amortization 12 e 13 437,416 352,409 437,554 352,615
Allowance for doubtful accounts 6 27,896 4,699 27,881 4,631
Constitution (reversal) of the provision for price revision 6 (244,072) 368,738 (244,072) 368,738
Provision for inventory obsolescence 7 (1,821) 2,288 (1,821) 2,288
Provision for realization of recoverable taxes 8 252,548 247,149 252,548 247,149
Provision for realization of other assets (2,505) 2,509 (2,505) 2,509
Constitution (reversal) of the provision for contingencies 19 13,973 (19,992) 13,973 (19,992)
Provision for other liabilities 3 9,979,364 79,775 9,976,928 79,775
Provision for impariment of property, plant and equipment (Fundão dam) 12 216,817 - 216,817 -
Losses on property, plant and equipment 12 1,235 13,773 1,235 13,773
Equity in the results of subsidiaries 10 (10,670) (15,767) - -
Interest on loans 508,199 319,850 508,199 319,850
Exchange variance - gains and losses 689,593 175,635 702,023 175,591
4,133,960 4,877,659 4,156,754 4,894,392
(increase) decrease in operating assets:
Restricted short-term investments (82,785) 117,808 (82,791) 117,922
Trade accounts receivable 497,984 (160,507) 662,798 (153,653)
Inventory 16,918 (105,634) (54,963) (105,634)
Recoverable taxes (247,191) (446,989) (248,592) (447,022)
Court deposits (696,977) (296,724) (696,977) (296,724)
Prepaid expenses (2,474) (4,715) (2,287) (5,058)
Other assets (67,266) (29,930) (69,827) (30,962)
increase (decrease) in operating liabilities:
Trade payables (230,073) 58,338 (231,566) 57,249
Taxes payable 4,454 (154,361) 4,486 (154,436)The accompanying notes are an integral part of these financial statements.

14
Financial Statements 2015
Statement of cash Flows Financial years ended december 31 (in thousands of reais - r$)
parent company consolidated
note 2015 2014 2015 2014
increase (decrease) in operating liabilities:
Payroll, provisions and social contributions (5,928) 1,639 (5,851) 2,166
Income tax paid 28 - (216,448) (710) (217,252)
Interest payment (488,751) (295,173) (488,751) (295,173)
Other liabilities (22,305) 358,741 (136,116) 347,141
net cash provided by operations 2,809,566 3,703,704 2,805,607 3,712,956
cash flows from investing activities
Acquisition of PPE and intangible assets 12 and 13 (424,057) (1,474,847) (424,057) (1,474,847)
Receipt on sale of property, plant and equipment and intangible assets 123 409 123 409
net cash used in investing activities (423,934) (1,474,438) (423,934) (1,474,438)
cash flows from financing activities
Financing obtained from third parties 1,563 2,164,385 1,563 2,164,385
Financing repayments (1,760,511) (911,489) (1,760,511) (911,489)
Dividend payments 22 (918,549) (1,812,848) (918,549) (1,812,848)
net cash used in financing activities (2,677,497) (559,952) (2,677,497) (559,952)
Exchange variance on cash and cash equivalents 977 2,225 976 2,225
net increase (decrease) in balance of cash and cash equivalents (290,888) 1,671,539 (294,848) 1,680,791
Cash and cash equivalents at the beginning of year 2,090,026 418,487 2,117,649 436,858
Cash and cash equivalents at the end of the year 1,799,138 2,090,026 1,822,801 2,117,649
(290,888) 1,671,539 (294,848) 1,680,791The accompanying notes are an integral part of these financial statements.

15
Financial Statements 2015
Statement of Value added Financial years ended december 31 (in thousands of reais - r$) parent company consolidated
2015 2014 2015 2014
revenue
Sales of goods, products and services 6,638,101 7,601,335 6,638,101 7,601,335
Other revenue 7,334 5,680 7,334 5,680
Revenue relating to construction of company assets 477,103 1,639,803 477,113 1,639,803
Allowance for doubtful accounts (27,896) (4,699) (27,881) (4,631)
7,094,642 9,242,119 7,094,667 9,242,187
consumables acquired from third parties
Cost of goods sold and services rendered (3,745,026) (4,684,900) (3,737,396) (4,679,155)
Material, electricity, outsourced services and other (10,624,920) (229,469) (10,612,158) (209,483)
Loss of asset values (132,149) (1,674) (132,149) (1,674)
(14,502,095) (4,916,043) (14,481,703) (4,890,312)
Gross (7,407,453) 4,326,076 (7,387,036) 4,351,875
Depreciation and amortization (437,416) (352,409) (437,554) (352,615)
net value added produced by the company (7,844,869) 3,973,667 (7,824,590) 3,999,260
transferred value added
Equity in results of investees 10,670 15,767 - -
Finance income 2,490,131 678,114 2,490,205 678,498
2,500,801 693,881 2,490,205 678,498
total value added to be distributed (5,344,068) 4,667,548 (5,334,385) 4,677,758
distribution of value added (5,344,068) 4,667,548 (5,334,385) 4,677,758
personnel
Direct compensation 253,629 354,827 258,767 361,852
Benefits 93,217 87,627 95,371 89,305
Government Severance Indemnity Fund for Employees (FGTS) 19,760 18,363 19,760 18,363
taxes
Federal (1,886,951) 650,941 (1,884,663) 652,054
State (81,105) (104,340) (81,233) (104,541)
Municipal 83,751 50,232 83,751 50,232
interest expenses
Interest on loans, financing and other debt items 2,010,148 804,350 2,010,379 804,945
interest on shareholders' equity
Loss for the period (5,836,517) - (5,836,517) -
Minimum mandatory dividends - 701,387 - 701,387
Additional dividends proposed - 2,104,161 - 2,104,161
The accompanying notes are an integral part of these financial statements.

16
Financial Statements 2015
1. REPORTING ENTITYSamarco Mineração S.A. (“Samarco”, “Company” or “Parent Company”), a privately held corporation, is a joint venture between Vale S.A. (“Vale”) and BHP Billiton Brasil Ltda. (“BHP Billiton” or “BHP”) having its registered office in Belo Horizonte – Minas Gerais (MG). Samarco operates an integrated enterprise consisting of mining, beneficiation and concentration of low-grade iron ore in the municipality of Mariana, in the State of Minas Gerais, as well as the transportation of such concentrated ore through ore pipelines connecting the Company’s two operating plants located in Minas Gerais and Espírito Santo (ES). The pelletizing - transformation of iron ore concentrate into pellets, our core product, takes place at the Ponta Ubu plant in Anchieta, ES, in addition to the outbound shipments of the product through the Company’s own marine terminal (Anchieta, Espírito Santo). Production is chiefly sold on the international market.
Samarco’s reserves are located in the municipalities of Mariana and Ouro Preto, MG and comprising geological resources of around 7.336 billion metric tons (not audited) of iron ore. The technical and economic context of the mineral resource and its specifics suggested recoverable or minerable reserves of around 2.867 billion metric tons (not audited) up to October, 2015.
Following the collapse of the Fundão tailings dam in November 2015 and the temporary suspension of operations in Germano/Alegria areas, the Company is reviewing the reserves. Under these circumstances, Samarco is currently not in a position to report or confirm previous reserves as of December 31, 2015. However, developments in the future may provide additional information for which a different conclusion might be reached.
The production of concentrated iron ore in 2015 was 25.366 million dry metric tons (2014 – 26.292 million dry metric tonnes).
a) Collapse of Fundão dam As detailed in Note 3, in November 2015 operations in Germano/Alegria (“Mariana
complex”) were temporarily suspended by order of government agencies - SEMAD (State Sustainable Development and Environment Office) and DNPM (National Mineral Production Department). The Company has been working to meet legal and social requirements laid down by the respective authorities relating to the social and environmental impacts caused by the collapse of the dam.
Management expect to resume operations at the Mariana and Ouro Preto complexes when authorized by the respective authorities. Although the Company’s plants in both Germano (MG) and Ponta Ubu (ES) have not been prevented from operating, their integration with the Company’s suspended operations have constrained the ability to do so.
Based on information currently available, the Company has assessed for the coming periods its capacity to honor its obligations towards its employees and suppliers and financial and tax obligations, including the expenditure necessary to repair and remediate the impacts caused by the dam collapse, pursuant to the Settlement Agreement (“Settlement Agreement” or “TTAC”) reached on March 2, 2016 in public civil action 0069758-61.2015.4.01.3400 filed by the government et al before the 12th Federal Court of Belo Horizonte/MG.
Company management is evaluating its debt facilities in a proactive manner with the objective to avoid any material adverse effect with respect to the covenants in the first half of 2016, as a result of the operational stoppage, as detailed in Note 15. As mentioned in Note 3 (h), the uncertainty existing as a result of the dam’s collapse means the Company is party to several judicial and administrative, civil, environmental and labor proceedings, for which we cannot reliably estimate the final outcomes and consequences. A reasonable outcome from this uncertainty, especially success of any negotiations with creditors, in addition to the resumption of operations, are essential for the Company to continue its business.
noteS to tHeFinancial StatementS at decemBer 31, 2015
all amounts in thousands of reais - r$, unless otherwise state

17
Financial Statements 2015
According to the TTAC, Samarco, Vale and BHP should establish a Foundation that will develop and implement environmental and socioeconomic programs for the purpose of remediation and /or compensation for the damage caused by the collapse of Fundão dam. Samarco will be responsible for providing resources to the Foundation, subject to the timing and other conditions set forth in such instrument. If Samarco does not fulfill its financial obligations to the Foundation, Vale and BHP will be responsible under the Agreement for providing such resources in proportion to their shareholdings, representing 50 % (fifty percent ) each.
b) Company equity interests
· Samarco Iron Ore Europe B.V. (“Samarco Europe”) - direct interest of 100% - headquartered in the Netherlands, this company was incorporated on October 13, 2000 with the core activity of providing services consisting of marketing and selling the iron ore produced by Samarco. It also provides support to clients through technical seminars and market studies.
· Samarco Asia Ltd. (“Samarco Asia”) - direct interest of 100% - headquartered in Hong Kong, this company was acquired on July 10, 2001 by Samarco Europe to provide marketing and selling services through commercial representation in the Asia-Pacific region.
· Samarco Finance Ltd. (“Samarco Finance”) - direct interest of 100% - headquartered in the Cayman Islands, this company was incorporated on February 21, 2000 with the core activity of optimizing Samarco’s foreign-trade business, in order to support exports (resale) of iron ore acquired from the Company to designated clients and to borrow funds on the international market and subsequently pass them through to the Company.
The Executive Board approved the issuance of these financial statements on April 8, 2016.
2. PRESENTATION OF THE FINANCIAL STATEMENTS AND SIGNIFICANT ACCOUNTING POLICIESThe main accounting policies used to prepare these financial statements are as described below. These policies were consistently applied in the previous year, unless stipulated otherwise.
2.1 Basis of preparation
(a) Parent Company and consolidated financial statements
The parent Company and consolidated financial statements have been prepared based on historic cost, except for financial instruments which have been measured at fair value through profit and loss.
The preparation of financial statements in accordance with accounting practices adopted in Brazil requires that management uses its judgment in determining and recording accounting estimates. The Company reviews the estimates and assumptions at least once a year. The areas involving a higher degree of judgment or complexity, or areas where assumptions and estimates are significant to the financial statements are disclosed in Note 2.2.
The parent Company and consolidated financial statements have been prepared in accordance with the accounting practices adopted in Brazil, including the pronouncements issued by the Accounting Pronouncements Committee (“CPC”) and ratified by the regulatory agencies, and reflect all (and only) material information related to the financial statements, which corresponds to that used by management.
The statement of value added was prepared in accordance with accounting pronouncement CPC 09 – Statement of Value added, and as it is only required for listed companies is being presented as supplementary information to the financial statements, without prejudice to the financial statements as a whole.
(b) Changes in accounting policies and disclosures
There were no amendments or new pronouncements in force for the financial year commencing January 1, 2015 that had material impacts on the Group.
2.2 Critical accounting estimates and judgmentsThe preparation of financial statements requires the use of critical accounting estimates. It also requires management to exercise its judgment in the process of applying the Company’s accounting policies.
Estimates and judgments are continually evaluated and are based on historical experience and other factors, including expectations of future events that are believed to be reasonable under the circumstances.

18
Financial Statements 2015
Based on assumptions, the Company makes estimates concerning the future. The resulting accounting estimates will, by definition, seldom equal the related actual results. These estimates are based on the best knowledge existing in each financial year. Changes in facts and circumstances could lead to a revision of estimates, meaning the actual future results could diverge from the estimates.
The estimates and assumptions that have a significant risk of causing a material adjustment to the carrying amounts of assets and liabilities within the next financial year are addressed below.
(i) provision for social, environmental and socioeconomic recovery
The provision for social, environmental and socioeconomic recovery is made for an area impacted or requiring the rectification of civil damages incurred, that generates an obligation for the Company. This process involves complex estimates for determining the future disbursement expected by management and its independent consultants, as reported in Note 3.
(ii) tax Current and deferred tax is calculated in
accordance with the interpretations deriving from the existing legislation. This process normally involves complex estimates to determine the taxable income and the deductible or taxable and temporary differences. The measurement of the recoverability of deferred tax on temporary differences takes into account the estimated future taxable income and is based on future cash flows.
(iii) impairment Impairment losses are recorded for
tangible and intangible assets when the book value of an asset or its cash generating unit exceeds its recoverable value. The Company annually evaluates its assets with a defined useful life for indications of impairment. If such indicators do exist, the recoverability of its tangible and intangible assets segregated by cash generating unit is tested. The discounted cash flow criteria is usually used, which depends on several estimates, influenced by the market conditions at the time the impairment test is conducted.
(iv) mineral reserves and useful life of mines The estimated proven and probable reserves
are periodically evaluated and updated. These reserves are determined by using generally accepted geological estimate techniques. The estimated volume of the mineral reserves is the basis for determining the portion depletion of the respective mines and the estimated useful life is a prime factor for quantifying the provision for environmental recovery of the mines. Any change in the estimated volume of reserves of the mine and the useful life of the underlying assets could have a significant impact on the depreciation, depletion and amortization charges recognized in the financial statements. Changes in the estimated useful life of the mine could impact the estimated provision for environmental expenses, the recovery thereof and impairment analyses.
Following the collapse of the Fundão tailings dam in November 2015 and the temporary suspension of operations in Germano/Alegria areas, the Company is reviewing the operation’s resources and reserves.
asset retirement obligations The Company recognizes an obligation for
demobilization of assets in the period in which they occur. This provision is determined based on the present value of the cash flows necessary to demobilize the assets. The Company considers the accounting estimates related to the recovery of degraded areas and the cost of closing a mine as a critical accounting practice as it involves large provisions and estimates involving a range of assumptions, such as interest rates, inflation, useful life of the asset under analysis and the current stage of depletion as well as the projected depletion dates of each mine. These estimates are revised annually.
(v) provision for contingencies Contingencies are analyzed by management
in conjunction with its legal advisers. The Company’s analyses include factors like hierarchy of laws, case law available, recent decisions delivered by courts and their relevance in the legal order. These evaluations involve management judgements.
Provisions are recorded when the value of the loss can be reasonably estimated.

19
Financial Statements 2015
(vi) provision for price reduction The provision for price reduction is presented
as a reduction to accounts receivable and reflects the volatility of the global iron ore sector. Based on the trend of falling iron ore prices, management conducted an individual assessment of each client’s contract and made a provision in an amount sufficient to cover any losses.
2.3 ConsolidationThe Company’s consolidated financial statements, which include the financial statements of its subsidiaries, have been prepared in accordance with applicable consolidation practices and legal provisions. Balances of unrealized revenues, expenses and profits between companies are eliminated from the consolidated financial statements. Unrealized gains deriving from transactions with investees recorded by the equity method are eliminated against the investment in proportion to the Group’s interest in the investee.
(a) Subsidiaries
Subsidiaries are all entities the Group exercises control over. The Group controls an entity when it is exposed or entitled to variable returns deriving from its involvement in the entity and can influence in its returns due to the power it exercises over the entity. Subsidiaries are fully consolidated from the date on which control is transferred to the Group. They are deconsolidated from the date that control ceases.
(b) Joint ventures
A jointly controlled operation is an arrangement that involves the use of joint assets and other resources with each entrepreneur using its own resources in the joint operation. Joint operations are recorded in the financial statements to represent the Group’s contractual rights and obligations. The assets, liabilities, revenue and expenses related to interests in joint operations are therefore recorded individually in the financial statements. The Company has an interest of 49% in the Guilman-Amorim hydroelectric power plant, where the remaining 51% of the joint-venture belongs to the partner Arcelor Mittal Brasil S.A.
2.4 Foreign currency translation
(a) Functional currency
The items included in each of the Group’s entities’ financial statements were measured by using the currency of the main economy in which the company operates and generate and consumes cash (“functional currency”), which is the US dollar (USD).
(b) Presentation currency
In accordance with Brazilian legislation, these financial statements are being presented in reais, where the financial statements prepared in the Company’s functional currency are translated to reais by using the following criteria:
• Assetsandliabilitiesareconvertedattheclosingrate at the respective reporting date.
• Accountsinthestatementsofoperations,comprehensive income (loss), cash flows and value added are converted at the rates on the transaction dates.
• Shareholders’equityathistoricalformationvalue.
The exchange variance resulting from the translation is recognized in a specific account of the shareholders’ equity titled “Carrying value adjustments”.
(c) Transactions and balances
Transactions in currencies other than the Company’s functional currency are translated into the functional currency at the exchange rates prevailing on the transaction dates or valuation dates, if the items are remeasured. Exchange gains and losses resulting from the settlement of these transactions and the translation at the exchange rates at the end of the financial year for monetary assets and liabilities denominated in foreign currency are recognized in the statement of operations.
Exchange gains and losses relating to operations in currencies other than the functional currency are presented in profit or loss under finance income. The parent Company and consolidated financial statements in the functional currency (USD) are as follows:

20
Financial Statements 2015
Statement of Financial position - uSd
parent company consolidated
2015 2014 2015 2014
current assets
Cash and cash equivalents 460,803 787,008 466,865 797,410
Restricted short-term investments 21,205 - 21,211 7
Accounts receivable 92,812 242,573 48,829 239,965
Inventory 133,916 172,863 152,322 172,863
Recoverable taxes 63,932 87,522 63,948 87,537
Prepaid expenses 2,972 3,438 3,146 3,764
Other assets 34,035 23,238 34,075 22,305
total current assets 809,675 1,316,642 790,396 1,323,851
noncurrent assets
Court deposits 359,114 265,961 359,114 265,961
Recoverable taxes 12,606 20,138 12,607 20,139
Deferred income tax 351,679 - 351,712 -
Other assets 9,060 13,852 9,089 13,917
732,459 299,951 732,522 300,017
Capital expenditure 17,816 17,437 - -
Property, plant and equipment 5,469,990 5,709,288 5,470,084 5,709,421
Intangible assets 31,025 31,149 31,025 31,149
total noncurrent assets 6,251,290 6,057,825 6,233,631 6,040,587
total assets 7,060,965 7,374,467 7,024,027 7,364,438

21
Financial Statements 2015
Statement of Financial position - uSd
parent company consolidated
2015 2014 2015 2014
current liabilities
Trade payables 30,411 131,332 29,771 130,951
Loans and financing 84,074 482,516 84,074 482,516
Financial charges payable 27,762 28,356 27,762 28,356
Payroll, provisions and social contributions 9,517 41,795 9,577 42,772
Taxes payable 17,097 23,458 17,128 23,492
Provision for income tax 1,683 - 1,705 26
Dividends - 610,007 - 610,007
Other provisions 505,903 42,443 505,903 42,443
Other liabilities 16,580 70,987 5,469 60,313
total current liabilities 693,027 1,430,894 681,389 1,420,876
noncurrent liabilities
Loans and financing 3,775,913 3,875,328 3,775,913 3,875,328
Financial charges payable 189 66 189 66
Dividends 718,597 - 718,597 -
Provision for contingencies 35,753 47,705 35,753 47,705
Deferred income tax - 193,091 - 193,080
Other provisions 2,190,435 138,215 2,190,435 138,215
Other liabilities 70,607 64,953 45,307 64,953
total noncurrent liabilities 6,791,494 4,319,358 6,766,194 4,319,347
equity
Capital 409,774 409,774 409,774 409,774
Capital reserves 1,619 1,619 1,619 1,619
Revenue reserves - 164,485 - 164,485
Carrying value adjustments (920) (494) (920) (494)
Additional dividends proposed - 1,048,831 - 1,048,831
Accumulated losses (834,029) - (834,029) -
total shareholders’ equity (423,556) 1,624,215 (423,556) 1,624,215
total liabilities and shareholders’ equity 7,060,965 7,374,467 7,024,027 7,364,438

22
Financial Statements 2015
Statement of comprehensive income (loss) - uSd
Statement of operations - uSd
parent company consolidated
2015 2014 2015 2014
Revenue 2,017,480 3,215,180 2,017,480 3,215,180
Cost of goods sold and services rendered (1,086,192) (1,342,334) (1,086,192) (1,342,334)
Gross profit 931,288 1,872,846 931,288 1,872,846
operating expenses
Selling (58,967) (79,379) (55,919) (74,988)
General and administrative (17,654) (27,405) (17,655) (27,405)
Other operating expenses, net (2,621,442) (222,873) (2,623,387) (223,916)
Equity in income of associates 379 2,909 - -
operating income (loss) before finance result (1,766,396) 1,546,098 (1,765,673) 1,546,537
Finance result
Finance income 26,166 77,163 26,205 77,209
Finance expenses (204,023) (181,758) (204,029) (181,777)
Net foreign exchange variance 370,277 76,946 370,193 76,837
income (loss) before taxation (1,573,976) 1,518,449 (1,573,304) 1,518,806
Income tax 575,462 (205,501) 574,790 (205,858)
net income (loss) for the year (998,514) 1,312,948 (998,514) 1,312,948
parent company and consolidated
2015 2014
net income (loss) for the year (998,514) 1,312,948
other comprehensive income
items that will not be reclassified to profit or loss - -
Measurement of retirement benefit obligations (426) (494)
other comprehensive income for the year (426) (494)
total comprehensive income (loss) (998,940) 1,312,454

23
Financial Statements 2015
capital reserves revenue reserves
carrying value
adjust-ments
accu-mulated
losses
ad-ditional
dividends proposed
total
capi
tal
Spec
ial m
onet
ary
rest
atem
ent o
f ppe
Good
will
on
shar
e su
bscr
iptio
n
tax i
ncen
tive
rese
rves
depl
etio
n re
serv
ein
cent
iviz
ed
lega
l res
erve
profi
t ret
entio
n
Balance at January 1, 2014 409,774 - 1,616 3 935 38,538 57,552 - - 1,096,165 1,604,583
Net income for the year - - - - - - - - 1,312,948 - 1,312,948
other comprehensive income
Measurement of retirement benefit obligations - - - - - - - (494) - - (494)
total other comprehensive income - - - - - - - (494) - - (494)
Transfer from reserves - - - - - - (57,552) - 57,552 - -
Transfer to reserve - - - - - - 125,012 - (125,012) - -
net income allocation:
Dividends (USD 196.19 per common share) - - - - - - - - - (1,028,705) (1,028,705)
Transfer to additional proposed dividends - - - - - - - - (981,371) 981,371 -
Minimum mandatory dividends - - - - - - - - (264,117) - (264,117)
Balance as of december 31, 2014 409,774 - 1,616 3 935 38,538 125,012 (494) - 1,048,831 1,624,215
Loss for the year - - - - - - - - (998,514) - (998,514)
other comprehensive income
Measurement of retirement benefit obligations - - - - - - - (426) - - (426)
total other comprehensive income - - - - - - - (426) - - (426)
Allocation of additional dividends to the minimum proposed in 2014
- - - - - - - - - (1,048,831) (1,048,831)
Transfer to offset loss - - - - (935) (38,538) (125,012) - 164,485 - -
Balance as of december 31, 2015 409,774 - 1,616 3 - - - (920) (834,029) - (423,556)
Statements of changes in shareholders’ equity – uSd

24
Financial Statements 2015
Statement of cash flows - uSd
parent company consolidated
2015 2014 2015 2014
cash flows from operating activities
Net income (loss) before taxation (1,573,976) 1,518,449 (1,573,304) 1,518,806
adjustments to reconcile net income (loss) before tax to the cash provided by operations:
Depreciation and amortization 221,670 184,564 221,730 184,658
Allowance for doubtful accounts 6,517 1,743 6,509 1,713
Constitution (reversal) of the provision for price revision (106,922) 138,853 (106,922) 138,853
Provision for inventory obsolescence (1,579) 511 (1,579) 511
Provision for realization of recoverable taxes (86,130) 42,383 (86,130) 42,383
Provision for realization of other assets (1,098) 789 (1,098) 789
Reversal of the provision for contingencies (11,672) (14,954) (11,672) (14,954)
Provision for other liabilities 2,490,103 16,689 2,490,103 16,689
Provision for impairment of property, plant and equipament 95,677 - 95,677 -
Losses on property, plant and equipment and intangible assets 763 7,790 761 7,620
Equity in results of subsidiaries (379) (2,909) - -
Interest on loans 140,486 132,663 140,486 132,663
Exchange variance gains and losses (361,924) (72,174) (361,946) (72,170)
811,536 1,954,397 812,615 1,957,561
(increase) decrease in operating assets:
Restricted short-term investments (21,204) 50,302 (21,203) 50,352
Trade accounts receivable 249,962 (17,213) 291,345 (14,654)
Inventory 40,526 (29,259) 22,120 (29,259)
Recoverable taxes (124,587) (219,272) (124,574) (219,285)
Court deposits (93,153) (91,087) (93,153) (91,087)
Prepaid expenses 304 (1,532) 455 (1,635)
Other assets (108,479) (50,112) (109,413) (49,012)
continue »

25
Financial Statements 2015
continuation »
parent company consolidated
2015 2014 2015 2014
increase (decrease) in operating liabilities:
Trade payables (99,928) 7,759 (100,186) 7,342
Taxes payable 35,620 (48,870) 35,618 (48,904)
Payroll, provisions and social contributions (1,645) 1,190 (2,561) 1,284
Income tax paid - (89,928) (691) (90,259)
Interest payment (139,871) (125,658) (139,871) (125,658)
Other liabilities (21,901) 138,366 (47,641) 134,861
net cash provided by operations 527,180 1,479,083 522,860 1,481,647
cash flows from investing activities
Acquisition of PPE and intangible assets (78,719) (599,471) (78,740) (599,477)
Receipt on sale of property, plant and equipment and intangible assets 32 169 32 169
net cash used in investing activities (78,687) (599,302) (78,708) (599,308)
cash flows from financing activities
Financing obtained from third parties 531 911,050 531 911,050
Financing repayments (477,919) (378,374) (477,919) (378,374)
Dividend payments (297,785) (805,854) (297,785) (805,854)
net cash used in financing activities (775,173) (273,178) (775,173) (273,178)
Exchange variance on cash and cash equivalents 475 1,727 476 1,727
net increase (decrease) in balance of cash and cash equivalents (326,205) 608,330 (330,545) 610,888
Cash and cash equivalents at the beginning of year 787,008 178,678 797,410 186,522
Cash and cash equivalents at the end of the year 460,803 787,008 466,865 797,410
(326,205) 608,330 (330,545) 610,888
Statement of cash flows - uSd

26
Financial Statements 2015
Statement of value added - uSd
parent company consolidated
2015 2014 2015 2014
revenue
Sales of goods, products and services 2,062,758 3,242,707 2,062,758 3,242,707
Other revenue 2,288 2,455 2,288 2,455
Revenue relating to construction of company assets 95,413 666,659 95,415 666,659
Allowance for doubtful accounts (6,517) (1,743) (6,509) (1,713)
2,153,942 3,910,078 2,153,952 3,910,108
consumables acquired from third parties
Cost of goods sold and services rendered (1,080,735) (1,922,717) (1,078,477) (1,920,266)
Material, electricity, outsourced services and other (2,603,127) (68,782) (2,602,139) (64,207)
Loss/recovery of asset values (66,978) 627 (66,978) 627
(3,750,840) (1,990,872) (3,747,594) (1,983,846)
Gross (1,596,898) 1,919,206 (1,593,642) 1,926,262Depreciation and amortization (221,670) (184,564) (221,730) (184,658)
net value added produced by the company (1,818,568) 1,734,642 (1,815,372) 1,741,604transferred value added
Equity in results of associates 379 2,909 - -
Finance income 781,565 288,244 781,589 288,241
781,944 291,153 781,589 288,241total value added to be distributed (1,036,624) 2,025,795 (1,033,783) 2,029,845distribution of value added (1,036,624) 2,025,795 (1,033,783) 2,029,845
personnel
Direct compensation 73,487 147,325 74,881 150,188
Benefits 28,231 37,545 28,880 38,268
Government Severance Indemnity Fund for Employees (FGTS) 5,908 7,766 5,908 7,766
taxes
Federal (572,604) 254,196 (571,847) 254,656
State (186,142) (89,437) (186,176) (89,513)
Municipal 23,819 21,608 23,819 21,609
interest expenses
Interest on loans, financing and other debt items 589,191 333,844 589,266 333,923
interest on shareholders' equity
Loss for the year (998,514) - (998,514) -
Minimum mandatory dividends - 264,117 - 264,117
Additional dividends proposed - 1,048,831 - 1,048,831

27
Financial Statements 2015
2.5 Cash and cash equivalentsThese include the balances of cash, bank deposits and investments in marketable securities with immediate liquidity whose maturities as of the effective date of the investment are equal to or less than 90 days and involve insignificant risks of change in fair value. This category does not include cash frozen by court order.
2.6 Financial instruments Financial instruments include cash and cash equivalents, restricted short-term investments, trade accounts receivable, other assets, trade payables, loans and financings and other liabilities.
(a) Recognition and measurement
Investments are initially recognized at fair value plus transaction costs for all financial assets not carried at fair value through profit or loss. Financial assets carried at fair value through profit or loss are initially recognized at fair value, and transaction costs are expensed in the statement of operations. Financial assets are derecognized when the rights to receive cash flows have expired or have been transferred and the Group has substantially transferred all risks and rewards of ownership. Financial assets at fair value through profit or loss are subsequently carried at fair value. Loans and receivables are carried at amortized cost using the effective interest method.
As of December 31, 2015 and 2014 the Company did not have any financial instruments classified as available-for-sale and held-to-maturity.
(b) Offsetting of financial instruments
Financial assets and liabilities are offset and the net amount reported in the balance sheet when there is a legal right to offset the recognized amounts and there is an intention to settle on a net basis, or realize the asset and settle the liability simultaneously.
(c) Provision for financial asset impairment
The Company assesses at each reporting date whether there is objective evidence that a financial asset or group of financial assets is impaired. A financial asset or group of financial assets has impairment losses only if there is objective evidence of impairment as a result of one or more events that occurred after the initial recognition of the asset (“loss event”), and that
event(s) had an impact on the estimated future cash flows of that financial asset that can be estimated reliably.
An impairment loss is measured as the difference between the carrying amount of assets and the present value of the estimated future cash flows discounted at the financial asset’s original effective interest rate. The carrying amount of the asset is reduced and the amount of the loss is recognized in the statement of operations.
2.7 Accounts receivableTrade receivables consist of amounts owed by customers for goods or services acquired, and are recognized initially at present value and subsequently measured at amortized cost using the effective interest method, less an allowance for doubtful accounts.
Allowance for doubtful accounts: when applicable, this provision is made in an amount considered sufficient by management to cover any losses on amounts receivable, based on individual appraisals of the credits and the financial situation of each customer, including the past history of their relationship with the Company.
The provision for sales price reduction reflects the volatility of the global iron ore sector. Based on the trend of falling iron ore prices, management conducts an individual evaluation of each client’s contract and makes a provision in an amount sufficient to cover any losses.
2.8 InventoriesInventories are valued at average acquisition or production cost not in excess of the market or realization value.
Samarco uses the absorption costing system. Direct costs are appropriated objectively and indirect costs are appropriated based on normal production capacity and include expenses incurred on the acquisition of inventory, production and transformation costs and other costs incurred to bring the inventories to their current condition and location.
2.9 Investments In the parent Company financial statements subsidiaries are recorded by the equity method based on the investees’ financial statements. The financial statements for overseas investments
28
Financial Statements 2015
were prepared in accordance with accounting practices compatible with those adopted by the Company. The subsidiaries have the same functional currency as the parent company, i.e. the US Dollar.
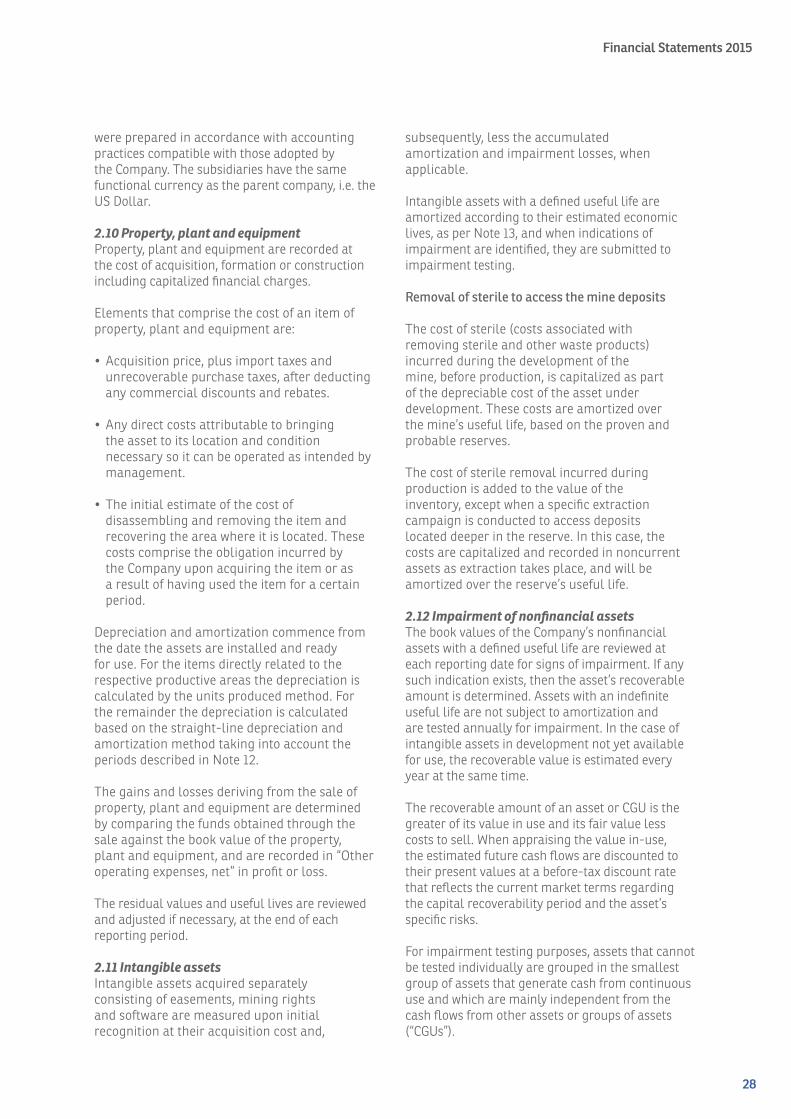
2.10 Property, plant and equipmentProperty, plant and equipment are recorded at the cost of acquisition, formation or construction including capitalized financial charges.
Elements that comprise the cost of an item of property, plant and equipment are:
•Acquisition price, plus import taxes and unrecoverable purchase taxes, after deducting any commercial discounts and rebates.
•Anydirectcostsattributabletobringingthe asset to its location and condition necessary so it can be operated as intended by management.
•Theinitialestimateofthecostofdisassembling and removing the item and recovering the area where it is located. These costs comprise the obligation incurred by the Company upon acquiring the item or as a result of having used the item for a certain period.
Depreciation and amortization commence from the date the assets are installed and ready for use. For the items directly related to the respective productive areas the depreciation is calculated by the units produced method. For the remainder the depreciation is calculated based on the straight-line depreciation and amortization method taking into account the periods described in Note 12.
The gains and losses deriving from the sale of property, plant and equipment are determined by comparing the funds obtained through the sale against the book value of the property, plant and equipment, and are recorded in “Other operating expenses, net” in profit or loss.
The residual values and useful lives are reviewed and adjusted if necessary, at the end of each reporting period.
2.11 Intangible assetsIntangible assets acquired separately consisting of easements, mining rights and software are measured upon initial recognition at their acquisition cost and,
subsequently, less the accumulated amortization and impairment losses, when applicable.
Intangible assets with a defined useful life are amortized according to their estimated economic lives, as per Note 13, and when indications of impairment are identified, they are submitted to impairment testing.
Removal of sterile to access the mine deposits
The cost of sterile (costs associated with removing sterile and other waste products) incurred during the development of the mine, before production, is capitalized as part of the depreciable cost of the asset under development. These costs are amortized over the mine’s useful life, based on the proven and probable reserves.
The cost of sterile removal incurred during production is added to the value of the inventory, except when a specific extraction campaign is conducted to access deposits located deeper in the reserve. In this case, the costs are capitalized and recorded in noncurrent assets as extraction takes place, and will be amortized over the reserve’s useful life.
2.12 Impairment of nonfinancial assetsThe book values of the Company’s nonfinancial assets with a defined useful life are reviewed at each reporting date for signs of impairment. If any such indication exists, then the asset’s recoverable amount is determined. Assets with an indefinite useful life are not subject to amortization and are tested annually for impairment. In the case of intangible assets in development not yet available for use, the recoverable value is estimated every year at the same time.
The recoverable amount of an asset or CGU is the greater of its value in use and its fair value less costs to sell. When appraising the value in-use, the estimated future cash flows are discounted to their present values at a before-tax discount rate that reflects the current market terms regarding the capital recoverability period and the asset’s specific risks.
For impairment testing purposes, assets that cannot be tested individually are grouped in the smallest group of assets that generate cash from continuous use and which are mainly independent from the cash flows from other assets or groups of assets (“CGUs”).

29
Financial Statements 2015
Impairment losses are recognized when the book value of an asset or its cash generating unit exceeds its estimated recoverable value. Impairment losses are recognized in profit or loss. Given the suspension of activities at the Germano mining complex in November and the increase in the expected costs to be incurred on social and environmental recuperation, for the financial year ended December 31, 2015 management conducted an impairment test on nonfinancial assets, as reported in Note 12. In 2014 the Company did not identify any evidence of impairment of its nonfinancial assets.
2.13 Trade payablesTrade payables are obligations payable to suppliers for goods and services acquired in the normal course of business, and are classified as current liabilities if the payment is due within a year. If not, they are presented as noncurrent liabilities.
Trade payables are recognized initially at fair value and subsequently measured at amortized cost using the effective interest method.
2.14 Loans and financingBorrowings are recognized initially at fair value, net of transaction costs incurred. Borrowings are subsequently carried at amortized cost. Any difference between the proceeds (net of transaction costs) and the total settlement value is recognized in the statement of operations over the period of the borrowings using the effective interest method.
Loans and financing are classified as current liabilities unless the Company has an unconditional right to defer settlement of the liability for at least 12 months after the reporting period.
The costs of loans and financing attributed directly to the acquisition, construction or production a qualifying asset that requires a substancial period of time to be concluded for the purpose of use or sale are capitalized as part of the corresponding asset’s cost when it is probable that future economic benefits will be generated in favor of the Company and the cost or value can be reliably measured. Other loans and financing costs are recorded as an expense in the period they are incurred.
2.15 Provision for contingencies A provision is made for legal obligations when losses and resulting outflows are assessed as
probable and the amounts can be measured reliably.
A provision is recognized if, as a result of a past event, the Company has a present legal or constructive obligation that can be estimated reliably, and it is probable that an outflow of economic benefits will be required to settle the obligation.
Provisions are determined by discounting the expected future cash flows at a pre-tax rate that reflects current market assessments of the time value of money and the risks specific to the liability.
2.16 Provision for asset retirement and environmental and socioeconomic remediation
(a) Asset retirement obligations
An asset retirement obligation is recognized when there is an approved detailed asset retirement plan. The expenses incurred on closing mines after mining operations have terminated are recorded as asset retirement obligations. The obligations primarily consist of shutting-down costs. The asset retirement cost related to the obligation is capitalized as part of the property, plant and equipment, and is depreciated over the asset’s useful life.
(b) Environmental and socioeconomic remediation
The provision for environmental and socioeconomic remediation is made in accordance with the determinations of the respective authorities and under the settlement reached on March 2, 2016 (Notes 1 and 3). The provision for environmental remediation is recorded when an area of degradation is identified thus generating an obligation for the Company. A liability for compensating social damages is recognized when the obligation of future payments has been identified deriving from past events related to civil damages.
2.17 Adjustment of assets and liabilities to present valueMonetary assets and liabilities are adjusted to their present value when the transaction is originally recorded, taking into account the contractual cash flows, the explicit and in certain cases implicit interest rate of the respective assets and liabilities and the rates prevalent in the market for similar transactions. This interest

30
Financial Statements 2015
is subsequently reallocated to financial expenses and revenue in the statement of operations by the effective interest rate method for contractual cash flows.
2.18 TaxationThe Company calculates taxes based on the existing legislation, considering the legally established additions and exclusions. Deferred tax credits are recognized on temporary differences between the tax bases of assets and liabilities and their carrying amounts in the financial statements to the extent that it is probable that future taxable profits will be available against which they can be utilized. This is measured at the rates expected to apply to the temporary differences when they are reversed, based on the laws that have been enacted or substantially decreed by the reporting date. Deferred tax assets and liabilities are offset and presented net in the balance sheet if there is a legally enforceable right to offset current tax liabilities and assets, and they relate to taxes levied by the same tax authority on the same taxable entity.
The Company has a tax benefit for exports that entails a reduction of income tax based on its operating income from plentiful mineral resources.
The Company has a final and unappealable decision in its favor which ruled that the social contribution on net income (“CSLL”) is unconstitutional. It is not therefore paying this contribution, as stated in Note 19.
2.19 Employee benefits
(a) Retirement obligation
The Company’s defined-contribution plan is a retirement benefits plan under it pays fixed contributions to a separate entity (ValiaPrev) and incurs no legal or constructive obligations to pay additional amounts. Contributions are recognized as an employee benefit expense when due.
For the defined-benefit portion of the plan (ValiaPrev), which denotes the constructive obligation, the Company obtains the actuarial calculation. When the benefits of a plan are increased, the portion of the increase in the benefit related to past service of employees is recognized immediately in profit or loss.
The defined-benefit obligation is the present value of the gross defined-benefit obligation less the fair value of the plan’s assets at the reporting date. It is calculated annually by independent actuaries using the projected unit of credit method. The present value of the defined benefit obligation is determined by discounting future estimated cash disbursements using interest rates in line with market yields, which are denominated in the currency in which benefits are paid and have maturity terms close to those of the respective pension plan obligation. However, no asset is recognized as there is no such provision in the bylaws for reimbursing the Company or reducing future contributions.
The actuarial gains or losses arising from the adjustment for experience and changes in actuarial assumptions are recorded directly in shareholders’ equity as other comprehensive income, when incurred.
(b) Share-based payments
Samarco operates a theoretical share-based payment plan, settled in cash. The fair value payable to employees relating to the long-term incentive plan is recognized as an expense with a corresponding increase in the liabilities. The amount is remeasured at least once a year, at the end of each year and on the settlement date. Any changes in the liability’s fair value are recognized as personnel expenses in the statement of operations.
(c) Medical assistance
The Company provides life insurance and healthcare insurance benefits for its employees and their dependents, which are recorded on the accrual basis and are discontinued in the event the employee leaves the Company.
(d) Profit sharing
Based on its variable compensation policy, the Company grants Profit Shares (“PLR”) to its employees, subject to the performance of targets, the evaluation of results and the achievement of specific goals, which are established and agreed at the beginning of each year. A provision is recognized when the Company has a contractual obligation or a past event that has created an constructive obligation.

31
Financial Statements 2015
2.20 CapitalEach common share entitles the holder thereof to one vote on General Meeting resolutions.
2.21 Payment of dividendsMinimum mandatory dividends paid to the Company’s shareholders are recognized as a liability in the Company’s financial statements at the end of the year, pursuant to its bylaws. The amounts referring to the portion exceedingly the minimum obligation required by law or the bylaws is held in a specific account in the shareholders’ equity, and is only transferred to liabilities when the permanent resolution is taken by the shareholders’ General Meeting.
2.22 Result of operationsIncome and expenses are recognized on the accrual basis, and include costs, expenses and revenue, in addition to the earnings, charges and monetary or exchange variance at official indexes or rates applied to current and noncurrent assets and liabilities. The attributable income-tax amounts are charged/credited to the statement of operations.
(a) Recognition of revenue from product sales
Ore sales revenue is recognized when the risks and rewards of ownership are transferred to the buyer. As most of the sales are made on a FOB (Free-on-Board) basis, the revenue is recognized when the product is delivered to the transporter.
Revenue is recognized at the dispatch date based on an estimated fair value of the payment receivable. When the realization of an amount already recorded under revenue is uncertain, a provision for the uncollectible amount or amount unlikely to be realized is recognized as a price adjustment or loss directly classified as an expense.
(b) Recognition of revenue from services
The Company sells logistics services at its own port. Service revenue is recognized when the economic rewards associated with the transaction will probably materialize. When the realization of an amount already recorded under revenue is uncertain, the uncollectible amount or amount unlikely to be realized is recognized as an expense.
(c) Finance income and costs
Finance income comprises interest income on funds invested and changes in the fair value of
financial assets measured at fair value through profit and loss.
Finance costs on comprise interest expenses on loans and financing, and changes in the fair value of financial assets measured through profit and loss.
Interest income and expenses are recognized as they accrue in profit or loss, using the effective interest method. Foreign currency gains and losses are reported on a net basis.
2.23 LeasingThe Company has leases, in which a significant portion of the risks and rewards of ownership are retained by the lessor. Payments made for operating leases (net of any incentives received from the lessor) are recognized in profit or loss on the straight-line method during the lease period.
2.24 New standards that are not yet effectiveThe following new standards have been issued by the International Accounting Standards Board (IASB) but are not in force for FY 2015. Whilst encouraged by the IASB, the early adoption of standards in Brazil is not permitted by the Accounting Pronouncements Committee (CPC).
. IFRS 15 - “Revenue from Contracts with Customers” specifies how and when an IFRS reporter will recognize and measure revenue. It comes into effective on January 1, 2018 and replaced IAS 11 - Construction Contracts and IAS 18 Revenue. Management in evaluating the impacts of its adoption.
. IFRS 9 - “Financial Instruments” - addresses the classification, measurement and recognition of financial assets and liabilities. The full version of IFRS 9 was published in July 2014 and is effective from January 1, 2018. It has replaced the guidelines of IAS 39, which outlines the requirements for the recognition and measurement of financial instruments. IFRS 9 retains but simplifies the combined measurement model and establishes three categories of main measurements for financial assets: amortized cost, fair value through other comprehensive income and fair value through profit or loss. It also includes a new single, forward-looking ‘expected loss’ impairment model, replacing the current incurred losses model. IFRS 9 reduces the hedge effectiveness requirements and requires an economic relationship between the hedged item and the hedging instrument, and

32
Financial Statements 2015
that the hedge ratio used for accounting should be the same as that used for risk management purposes. Management in evaluating the total impact of its adoption.
IFRS 16 – “Leases” – under this new standard, lessees must now recognize the liabilities for future payements and the right to use the leased asset for practically all lease agreements, including operating leases. Certain short-term or minor contracts can be excluded from the scope of this new standard. The criteria for the recognition and measurement of leases in lessor financial statements remain substantially unchanged. IFRS 16 is effective for financial years commencing January 1, 2019 and replaces IAS 17 “Leases” and corresponding interpretations. Management in evaluating the total impact of its adoption.
The Revision of Technical Pronouncements 8 issued by the Accounting Pronouncements Committee (CPC) was approved on August 7, 2015 and disclosed on November 5, 2015. The revision establishes amendments to several technical pronouncements, amongst others, to (i) the accounting for acquisitions of interests in joint operations; (ii) clarifications about depreciation and amortization methods; (iii) accounting for the sale or contribution of assets amongst investors and associated companies or joint ventures; (iv) the application of exceptions when consolidating investment entities and (v) the practical application of the concept of materiality.
In general, these amendments made improvements to the texts with a view to a better application of the pronouncements in line with international accounting practices. These amendments are effective for annual reporting periods beginning on or after January 1, 2016. Management in evaluating the impact of these amendments.
There are no other International Financial Reporting Standards (IFRS) or International Financial Reporting Interpretations Committee (IFRIC) pronouncements that have not yet become effective and that could have a significant impact on the Company.
3. SIGNIFICANT EVENT – COLLAPSE OF THE FUNDÃO DAMDue to the collapse of the Fundão dam on November 5, 2015, Samarco has incurred material accounting impacts especially
related to expenses on measures to prevent, remediate, contain and offset material, environmental, social and socioeconomic damages caused by the collapse, in addition to writing off Company assets.
Samarco has incurred expenses and made provisions for future disbursements that have been recorded and reported in accordance with CPC 25 - Provisions, contingent liabilities and contingent assets.
The material accounting impacts deriving from the significant event on the Company’s Statement of Financial Position, Statement of Operations and Statement of Cash Flows in the financial year ended December 31, 2015 are described below:
Statement of Financial Position
Assets 2015
Current
Restricted short-term investments (a) 82,785
Other assets (Advance to suppliers) (b) 7,848
Total current assets 90,633
Noncurrent
Judicial Deposits (c) 302,858
Deferred income tax (d) 2,555,405
Property, plant and equipment (e) (216,817)
Total noncurrent assets 2,641,446
Liabilities
Current
Trade payables (f) (51,392)
Other provisions (g) (1,949,964)
Total current liabilities (2,001,356)
Noncurrent
Provisions for contingencies -
Other provisions (g) (8,054,838)
Total noncurrent liabilities (8,054,838)
Net (7,324,115)

33
Financial Statements 2015
Statement of operations
Statement of cash Flows
2015
Cost of goods sold and services rendered (i) (197,515)
Gross profit (197,515)
operating expenses
Provision for social, environmental and socioeconomic recuperation (j) (9,833,189)
Expenses on social, environmental and socioeconomic recuperation (j) (144,350)
Provision for loss in PPE (j) (216,817)
operating loss before finance result (10,391,871)
Finance income -
loss before taxation (10,391,871)
Income tax (d) 2,555,405
loss for the year (7,836,466)
2015
cash flows from operating activities
Loss before tax (10,391,871)
adjustments to reconcile the loss to the cash provided by operations:
Provision for other liabilities (g) 10,004,802
Provision for asset impairment (e) 216,817
(increase) decrease in operating assets:
Restricted short-term investments (a) (82,785)
Court deposits (c) (302,858)
Other assets (b) (7,848)
increase (decrease) in operating liabilities:
Trade payables (f) 51,392
net cash used in operating activities (512,351)
net cash used in investing activities -
net cash used in financing activities -
total net decrease in cash and cash equivalents (512.351)
Preliminary Commitment (TCP) - Creation of Emergency GuaranteeOn November 16, 2015 Samarco signed a Preliminary Commitment (“TCP”) with the Prosecutor’s Department of Minas Gerais state and the Federal Public Prosecutors’ Office whereby
Samarco created a “social and environmental guarantee fund” amounting to R$1,000,000, to be used exclusively to pay for measures to prevent, remediate, contain and offset material social and environmental or socioeconomic damages caused by the Fundão dam collapse.

34
Financial Statements 2015
Pursuant to this TCP, Samarco created a fund in a specific remunerated account in the amount of R$500,000 and submitted guarantees amounting to R$500,000.
The fund’s money shall remain under Samarco management, be overseen by the Prosecutor’s Office and audited by an external auditor. However, the amount of R$500,000 allocated to this fund and deposited in a specific account was transferred to a court deposit account related to a tax contingency, which addresses the CFEM calculation base and bears no relation to the collapse of the Fundão dam. This transfer resulted from a court decision delivered on December 11, 2015 in the case records of the tax enforcement in progress before the 26th federal court of MG. Samarco management is working with its legal advisers to release these funds so they can be used in the social and environmental remediation pursuant to the signed TCP.
The tax proceeding related to CFEM is detailed in Note 19(b).
(a) Restricted short-term investments
On December 4, 2015 Samarco signed a Settlement Agreement (“Termo de Ajustamento de Conduta - TAC”) with the Ministry of Labor Prosecutor’s Department to prevent the collective dismissal of its employees until March 1, 2016 constituting a financial investment of R$77,816, an amount sufficient to guarantee payment of the salaries, benefits and auxiliary obligations owed to its employees in this period. In the circumstances, to date, the Company is evaluating workforce alternatives especially given the current suspension of its activities and the expected resumption of operations.
The amount of R$77,816 was also frozen by a court decision regarding the tax enforcement of the CFEM contingency mentioned in the above topic regarding the Preliminary Commitment. As this amount is not immediately available for use as at December 31, 2015, it has been classified as “restricted short-term investments “ in the financial statements.
The other amounts registered as “restricted short-term investments” represent other funds blocked by court order in proceedings directly related to the collapse of the Fundão dam.
(b) Other assets
Rever to advance to supplier of R$7,848 regarding the contract for maintaining and
streghthening of Germano and Santarém dams, which were partially affected by the collapse of the Fundão dam.
(c) Court deposits
By court order Samarco’s blocked accounts in the amount of R$302,858 where subsequently transferred to a judicial deposit account related to the proceeding brought by the Prosecutor’s Department of Minas Gerais state in connection with the collapse of Fundão dam.
(d) Deferred income tax
The accounting impacts deriving from the dam’s collapse were considered temporary differences for tax purposes. The Company therefore recorded a deferred income tax asset deriving from these amounts, as shown below:
calculation basis
income tax
Provision for write-off of PPE 216,817 54,204
Other provisions 10,004,802 2,501,201
2,555,405
cost depre-ciation
net Value
Industrial facilities (buildings, machinery and equipment) - Fundão dam
166,260 (28,678) 137,582
Assets under construction - Expenses on preparation of the Project and preparation for elevating the Fundão dam
79,235 - 79,235
245,495 (28,678) 216,817
(e) Property, plant and equipment
Write-off of property, plant and equipmentSamarco recorded a provision for loss in the amount of R$216,817 referring to the residual value of the property, plant and equipment related to Fundão dam, as follows:

35
Financial Statements 2015
ImpairmentThe Company has identified assets that may have been recorded at amounts above their recoverable value and conducted an impairment test, as described in Note 12.
(f) Trade payables
This refers to amounts payable of R$51,392 related to expenses incurred due to the collapse of the Fundão dam.
(g) Other provisions
On March 2, 2016, Samarco, together with its shareholders BHP Billiton Brasil Ltda. and Vale S.A., signed a Terms of Transaction and Adjustment of Conduct, in the public civil action brought by the Union and others, No. 0069758-61.2015.4.01.3400, in progress before the 12th Federal Court in Belo Horizonte, State of Minas Gerais, to determine measures and actions to remedy and compensate environmental and socioeconomic damages deriving from the collapse of the Fundão dam.
In addition to Samarco and shareholders, the following are parties to the Settlement Agreement: (i) the Brazilian Environmental and Renewable Natural Resources Institute (“IBAMA”), Instituto Chico Mendes de Conservação da Biodiversidade (“ICMBio”), the National Mineral Production Department (“DNPM”), Fundação Nacional do Índio (“FUNAI”); (ii) in Minas Gerais, the State of Minas Gerais, the State Institute for Forestry (“IEF”), the Minas Gerais State Institute for Water Management (“IGAM”), the State Foundation for the Environment (“FEAM”); and (iii) in Espírito Santo, the State of Espírito Santo, the State Institute for the Environment and Water Resources (“IEMA”), the Espirito Santo State Institute for Agricultural and Forestry Protection (“IDAF”) and the Espirito Santo State Water Resource Agency (“AGERH”).
The comprehensive scope of the Settlement Agreement (TTAC) comprises a total of 41 (forty-one) programs, of which: (i) 23 (twenty-three) are socioeconomic; and (ii) 18 (eighteen) are environmental. These programs include both remedial and compensatory measures required to be implemented.
The Settlement Agreement has been structured such that government authorities will assess, decide on the design of, and coordinate,
all programs through an Inter-federative Committee. Experts and advisory panels have also been appointed to settle technical disputes in a scientific, substantiated and expedited manner.
The TTAC established the creation of a private foundation to implement the measures the management, of which will be independently audited.
The period of the agreement is 15 years renewable every year until all the obligations of TTAC are complied with.
Samarco will provide funds for the Foundation as follows (calendar year):
- R$2,000,000 in 2016, less the amounts already spent or applied to the actions of remediation and compensation;
- R$1,200,000 in 2017; - R$1,200,000 in 2018.
From 2019 until 2021, annual contributions to the Foundation should be enough to comply with remediation and compensation programs and annual reference amounts should be between R$800,000 to R$1,600,000. From the signature of TTAC, the Foundation will allocate every year an amount of R$240,000 for a period of 15 years to compensation programs. These annual amounts are already included in the figures for the next six years (2016 – 2021). Additionally, a R$500,000 contribution will be allocated to sewage treatment and disposal of solid waste in certain areas. From 2022 onwards, the amounts to be contributed will be based on the project schedule approved by the Foundation at the time. The Settlement Agreement does not specify a minimum or maximum limit on contributions for the period from 2022 onwards.
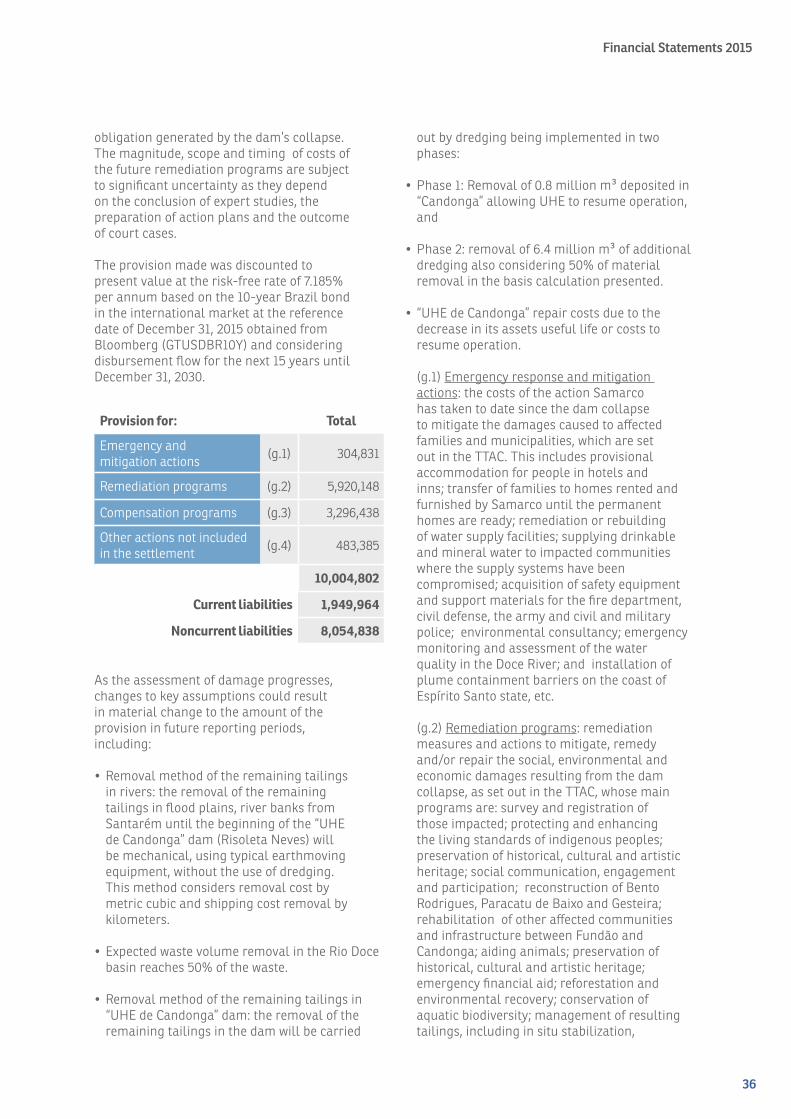
Based on the information above, management, with the advice of external consultants and experts has been preparing action plans and studies for the future remediation of the environmental and socioeconomic damage caused by the dam collapse, in addition to the implementation of compensation programs established in the Settlement Agreement. At December 31, 2015 Samarco has recognized provisions based on currently available information, including the technology available and current prices, for future disbursements related to the present
36
Financial Statements 2015
obligation generated by the dam’s collapse. The magnitude, scope and timing of costs of the future remediation programs are subject to significant uncertainty as they depend on the conclusion of expert studies, the preparation of action plans and the outcome of court cases.
The provision made was discounted to present value at the risk-free rate of 7.185% per annum based on the 10-year Brazil bond in the international market at the reference date of December 31, 2015 obtained from Bloomberg (GTUSDBR10Y) and considering disbursement flow for the next 15 years until December 31, 2030.
out by dredging being implemented in two phases:
•Phase1:Removalof0.8millionm³depositedin“Candonga” allowing UHE to resume operation, and
•Phase2:removalof6.4millionm³ofadditionaldredging also considering 50% of material removal in the basis calculation presented.
• “UHEdeCandonga”repaircostsduetothedecrease in its assets useful life or costs to resume operation.
(g.1) Emergency response and mitigation actions: the costs of the action Samarco has taken to date since the dam collapse to mitigate the damages caused to affected families and municipalities, which are set out in the TTAC. This includes provisional accommodation for people in hotels and inns; transfer of families to homes rented and furnished by Samarco until the permanent homes are ready; remediation or rebuilding of water supply facilities; supplying drinkable and mineral water to impacted communities where the supply systems have been compromised; acquisition of safety equipment and support materials for the fire department, civil defense, the army and civil and military police; environmental consultancy; emergency monitoring and assessment of the water quality in the Doce River; and installation of plume containment barriers on the coast of Espírito Santo state, etc.
(g.2) Remediation programs: remediation measures and actions to mitigate, remedy and/or repair the social, environmental and economic damages resulting from the dam collapse, as set out in the TTAC, whose main programs are: survey and registration of those impacted; protecting and enhancing the living standards of indigenous peoples; preservation of historical, cultural and artistic heritage; social communication, engagement and participation; reconstruction of Bento Rodrigues, Paracatu de Baixo and Gesteira; rehabilitation of other affected communities and infrastructure between Fundão and Candonga; aiding animals; preservation of historical, cultural and artistic heritage; emergency financial aid; reforestation and environmental recovery; conservation of aquatic biodiversity; management of resulting tailings, including in situ stabilization,
provision for: total
Emergency and mitigation actions (g.1) 304,831
Remediation programs (g.2) 5,920,148
Compensation programs (g.3) 3,296,438
Other actions not included in the settlement (g.4) 483,385
10,004,802
current liabilities 1,949,964
noncurrent liabilities 8,054,838
As the assessment of damage progresses, changes to key assumptions could result in material change to the amount of the provision in future reporting periods, including:
•Removalmethodoftheremainingtailingsin rivers: the removal of the remaining tailings in flood plains, river banks from Santarém until the beginning of the “UHE de Candonga” dam (Risoleta Neves) will be mechanical, using typical earthmoving equipment, without the use of dredging. This method considers removal cost by metric cubic and shipping cost removal by kilometers.
• ExpectedwastevolumeremovalintheRioDocebasin reaches 50% of the waste.
•Removalmethodoftheremainingtailingsin“UHE de Candonga” dam: the removal of the remaining tailings in the dam will be carried

37
Financial Statements 2015
excavation, dredging, haulage, treatment and disposal; improvement of water supply systems.
(g.3) Compensation programs: measures and initiatives to compensate damages not mitigated or remediated from the dam collapse by improving environmental and economic conditions in affected areas, in accordance with the program set out in the TTAC, whose main aspects are: supporting the research for the development and use of social and economic technologies applied to impact remediation; regional economic recuperation and diversification with incentives for industry; encouraging local contracting; rehabilitation of permanent protected areas (APP); recovery of springs; strengthening of screening structures and reintroduction of wildlife; collection and treatment of sewage and solid waste; environmental education and preparation for environmental emergencies. The total to be dispersed under the programs and initiatives of this nature is R$4,100,000, consisting of R$240,000 per annum, in real terms, for a period of 15 (fifteen) years from 2016. A R$500,000 will be provided to the program for the collection and treatment of sewage and solid waste.
(g.4) Other actions not covered by the agreement: other expenditure required for initiatives arising from the Fundão dam collapse but not covered by the TTAC programs.
(h) Contingencies
The Company is party to legal and administrative proceedings involving civil, labor and environmental matters arising from the Fundão dam collapse. These proceedings filed by individuals, private companies, NGOs and public and government entities are seeking remediation and compensation for environmental and socioeconomic impacts and material damage and loss of lives in addition to a range of compensation for affected municipalities.
As defined in the TTAC, the claims of several proceedings filed against Samarco are encompassed in this agreement. Any claims involving any matter established in the TTAC should seek to be dismissed by resolution of substance or grouping together filed claims. As mentioned in item (g) above, the estimated losses in the claims covered by the TTAC have been included as part of the various provisions for the remediation and compensation of impact caused by the dam collapse.
The Company was assessed by the environmental agencies IBAMA (Brazilian Environmental and Renewable Natural Resources Institute) due to the environmental damage caused by the discharge of solid and liquid waste (mining tailings) into the waters of the Doce river and SEMAD (state sustainable development and environment office) and SUCFIS (Integrated Environmental Inspection and Control Department) for causing pollution and environmental degradation resulting in damage to water resources. Samarco has submitted its defense against these charges and is waiting for a reply from the agency. The assessment notices amounts to R$432,356. Losses and resulting outflows are rated as possible.
In relation to the Public Civil Action Nº. 0043356-50.2015.8.13.0400 filed by the Public Prosecutor of Minas Gerais, despite not having been covered in the TTAC, its object will be fully accomplished within the fulfillment of the obligations assumed in the agreement.
Management has also considered other claims classified as possible and/or probable which are at the initial stage and which pose significant uncertainties due to the fact the claims overlap with the TTAC, the definition of amounts involved, compensation time-lapse, new claims, and other judicial and extrajudicial settlements.
There are other claims and proceedings to which the Company is not yet party which could result in future disbursements.
Until further facts are developed and uncertainties already mentioned resolved, it is not possible to provide a range of outcomes or a reliable estimate of Samarco’s obligations arising from such matters. As such, a provision has not been recognized or contingent liability quantified for these claims. Only in the fullness of time and natural development of disputes and maturity of the proceedings, with new settlements reached and/or legal decisions, will it be possible to understand the actual magnitude of the impacts and the Company’s exposure. These items could lead to significant impacts on the provisions and result in new adjustments to existing provisions and/or initial recognition of new provisions for disbursements that cannot currently be projected and/or measured.

38
Financial Statements 2015
(i) Cost of goods sold and services rendered
The Company incurred costs to maintain and repair facilities affected by the collapse of the tailings dam. R$25,902 had been spent by December 31, 2015 on outsourced services, construction materials and fuel, amongst other items. The total amount was registered as idle capacity in the months of November and December 2015.
Samarco has also made a provision of R$171,613 to repair the Company’s facilities that were affected following the collapse of the Fundão dam.
to be agreed, an insurance receivable has not been recognised for any recoveries under these policies at December 31, 2015.
(m) Commitments
Following the collapse of the Fundão dam on November 5, 2015, the Company has invoked a force majeure clause in long-term contracts with suppliers and service providers to suspend contractual obligations, except for the electricity contract.
2015
incurred provisioned for
Emergency and mitigation actions 90,184 304,831
Remedial programs 34,483 5,920,148
Compensation programs - 3,296,438
Actions not included in the settlement 19,683 311,772
144,350 9,833,189
The descriptions of the nature of each of the expenses included in the table above are detailed in Note 3(g).
(k) Investigations
In conjunction with its shareholders the Company has engaged an external investigation to identify the causes of the dam collapse; the federal and civil police departments have also started enquiries. All these investigations are still being conducted. Although the matters being disputed are partly covered by the above provisions and estimates, the value of the losses or even an estimated range of probable and possible losses cannot be estimated at this time.
(l) Insurance
Following the collapse of the Fundão dam the Company is negotiating with its insurance companies to receive compensation under its operational risk, general civil liability and engineering risk policies. Any payment of compensation will depend on the definition of the coverage for the dam collapse and evaluation of the loss amount. Given that the adjustment process for all policies is at an early stage and coverage is yet
(j) Other operating expenses
Loss on property, plant and equipment
On December 31, 2015 Samarco recognized a provision for loss on property, plant and equipment related to the Fundão dam in the net amount of R$216,817.
Expenses for social and environmental reparation
The breakdown of expenses related to the measures to prevent, remediate, contain and offset material, environmental and social damage caused by the dam collapse, incurred and provisioned for in 2015, are shown below:

39
Financial Statements 2015
4. CASH AND CASH EQUIVALENTSThe balance of cash and cash equivalents is comprised as follows:
5. RESTRICTED SHORT-TERM INVESTMENTSThe Company’s restricted short-term investments are as follows:
parent company consolidated
2015 2014 2015 2014
cash and bank deposits
Domestic 734 - 734 -
Foreign (a) - 1,417,868 1,410 1,425,829
call deposits
Overseas (Time Deposit / MMDA / MMF / SWEEP) (b) 1,798,321 664,776 1,820,574 684,438
Domestic (c) 83 7,382 83 7,382
1,799,138 2,090,026 1,822,801 2,117,649
parent company consolidated
call deposits 2015 2014 2015 2014
Restricted cash 82,785 - 82,811 20
82,785 - 82,811 20
(a) Current accounts denominated in USD at financial institutions overseas.
(b) Time Deposit,MMDA (Money Market Deposit Account), MMF (Money Market Fund), Sweep Account and Overnight are short-term investments denominated in US dollars at overseas financial institutions, yielding the US Treasuries bond rate and “overnight” rate (“Fed Fund rate”).
(c) Short-term investments with immediate liquidity at domestic financial institutions. Amount linked to current account yielding between 10% and 100% of the Selic base interest rate according to the investment period. These short-term investments are recorded at market value, in accordance with periodical reporting by the financial institutions.
The balance has been frozen by court order, due to the collapse of the Fundão dam (Note 3(a)).

40
Financial Statements 2015
parent company consolidated
2015 2014 2015 2014
Domestic receivables 6,519 3,332 6,519 3,332
Foreign receivables (a) 513,641 1,014,812 341,934 1,007,919
Allowance for doubtful accounts (b) (33,110) (5,214) (33,130) (5,249)
Provision for price reduction (c) (124,666) (368,738) (124,666) (368,738)
362,384 644,192 190,657 637,264
6. ACCOUNTS RECEIVABLEThe accounts receivables are comprised as follows:
(a) R$78,025 of the consolidated foreign trade receivables of R$341,934 in 2015 (R$1,007,919 in 2014) is secured by letters of credit or surety (R$414,817 in 2014). The remaining balance was released by analyzing each client’s credit, in order to mitigate the risk of default.
(b) The estimated allowance for doubtful accounts of R$33,110 in 2015 for the parent Company and R$33,130 consolidated statements respectively (R$5,214 and R$5,249 in 2014 respectively) is made based on an individual analysis of each customer for invoices more than 60 days overdue.
(c) As described in Note 2.23 (a), revenue is recognized at the dispatch date (FOB sales) based on an estimated fair value of the payment receivable. A provision for iron ore price reductions was necessary due to falling international prices.
The Company’s accounts receivable classified by aging are as follows:
As of December 31, 2015 accounts receivable of R$36,811 in the parent Company and consolidated statements (R$18,024 and R$10,776 in 2014) was overdue but not impaired. These accounts relate to a number of independent clients with no recent history of default.
parent company consolidated
2015 2014 2015 2014
Not yet due 450,239 994,906 278,512 995,226
Up to 30 days overdue 36,057 15,528 36,057 8,306
31 to 60 days overdue 754 2,343 754 2,470
61 to 90 days overdue 24,721 22 24,742 22
Past due more than 90 days 8,389 5,345 8,388 5,227
520,160 1,018,144 348,453 1,011,251

41
Financial Statements 2015
parent company consolidated
(a) Break down 2015 2014 2015 2014
Finished goods 13,689 25,427 85,570 25,427
Work in process 25,541 69,182 25,541 69,182
Consumables 136,936 92,889 136,936 92,889
Consumption and maintenance materials 354,085 268,403 354,085 268,403
Provision for loss on materials (7,416) (9,237) (7,416) (9,237)
Advances to suppliers - 12,407 - 12,407
522,835 459,071 594,716 459,071
parent company consolidated
(b) changes 2015 2014 2015 2014
change in finished goods
Balance on december 31 25,427 25,136 25,427 25,136
Additions 2,757,261 2,899,939 3,511,741 3,156,078
Write-offs due to sale (2,758,608) (2,903,987) (3,459,734) (3,160,126)
Addition (write-off) of inventory adjustment (8,913) 4,160 (8,913) 4,160
Advance to supplier - - 7,068 -
Translation adjustment (1,478) 179 9,981 179
Balance on december 31 13,689 25,427 85,570 25,427
7. INVENTORYThe inventory and changes in the balance thereof are as follows:
The Company appraised its inventory as of December 31, 2015 and concluded it was not exceeding its realization value.
In 2015 management reviewed the inventory obsolescence criteria and identified the consumption of certain warehouse items considered obsolete. The provision for material losses accordingly diminished by R$1,821.

42
Financial Statements 2015
parent company consolidated
2015 2014 2015 2014
ICMS – Minas Gerais (MG) (a) 76,202 85,358 76,202 85,358
ICMS – Espírito Santo (ES) (b) 1,504,880 1,252,332 1,504,880 1,252,332
Provision for ICMS losses - ES (b) (1,504,880) (1,252,332) (1,504,880) (1,252,332)
PIS and COFINS (c) 114,484 129,018 114,484 129,018
Income tax recoverable (d) 97,464 68,957 97,464 68,957
IRRF on short-term investment yields 8,912 102 8,912 102
Other 1,757 2,468 1,824 2,515
total 298,819 285,903 298,886 285,950
Current assets 249,602 232,424 249,664 232,473
Noncurrent assets 49,217 53,479 49,222 53,477
(a) Derives primarily from credits on the acquisition of property, plant and equipment.
(b) This relates to credits on the acquisition of property, plant and equipment, consumables, materials and other. In view of the history of nonrealization of ICMS tax credits held against Espírito Santo state, the Company set up a provision to cover 100% of the credits.
(c) The PIS and COFINS credits chiefly relate to the acquisition of material, consumables, energy, and property, plant and equipment, appropriation of which is taking place over 48 months at the rate of 1/12 per month. These credits are realized monthly through offsetting against other federal taxes, especially Corporate Income Tax (IRPJ) payable.
(d) Recoverable income tax on overpaid monthly estimates.
8. RECOVERABLE TAXES The balance of recoverable taxes is comprised as follows:

43
Financial Statements 2015
parent company consolidated
2015 2014 2015 2014
Recoverable insurance 44 5,510 44 5,510
Amount receivable for electricity (a) 70,377 45,958 70,377 42,737
Consórcio UHE Guilman Amorim 2,947 2,704 2,947 2,704
Advances to employees 6,972 7,422 7,065 7,446
Advances to suppliers (b) 51,933 - 51,933 -
Other 631 133 705 865
current 132,904 61,727 133,071 59,262
COHESA (c) 16,856 16,601 16,856 16,601
(-) Adjustment to present value COHESA (c) (1,288) (572) (1,288) (572)
Insurance amounts recoverable 13,725 13,726 13,725 13,726
Advances to employees 4,719 5,662 4,814 5,828
Other 1,368 1,369 1,368 1,369
noncurrent 35,380 36,786 35,475 36,952
9. OTHER ASSETS
(a) Refer to the sale of surplus electricity acquired for production, but not used.
(b) Advances to suppliers:
(b.1) Prepayment to supplier of R$7,848 related to the geotechnical/structural reinforcement services, to meet the minimum level required by law for stability of the Germano and Santarém dams, not leading to an increase in capacity or useful life.
(b.2) Prepayment of R$44,085 to Vale for partial leasing of mining rights of “Conta História Norte” and “Alegria” (mineral exploration areas). Vale is responsible for maintaining all of the rights until the lease has been registered by the respective authority.
(c) The Company passes through funds to COHESA (the Samarco Employees Housing Cooperative) on the basis of an arrangement to implement a housing plan signed March 1, 1994, aimed at financing property for employees, with terms varying from 8 to 25 years. The passed through amounts will be received in full upon termination of the Samarco Housing Plan - PHS, i.e. upon full repayment of the financing by the employees. The COHESA balance receivable is adjusted to present value. The interest charged by COHESA is restated according to the collective pay rise awarded by the Company.

44
Financial Statements 2015
10. INVESTMENTSThe Company recorded equity income of its subsidiaries of R$10,670 in 2015 (R$15,797 in 2014). The Company did not receive dividends deriving from investments in subsidiaries. None of the investees have shares traded on stock exchanges.
2015 inte
rest
num
ber o
f sha
res
or u
nits
curr
ent a
sset
s
non
curr
ent
asse
ts
tota
l ass
ets
curr
ent l
iabi
litie
s
equi
ty
tota
l lia
bilit
ies
reve
nue
cost
s and
ex
pens
es
net
inco
me
for
the
year
Samarco Finance Ltd. 100% 50,000 208,292 - 208,292 187,328 20,964 208,292 1,090,793 (1,087,679) 3,114
Samarco Iron Ore Europe B.V 100% 180 48,253 4,302 52,555 3,962 48,593 52,555 27,448 (19,892) 7,556
total 256,545 4,302 260,847 191,290 69,557 260,847 1,118,241 (1,107,571) 10,670
2014 inte
rest
num
ber o
f sha
res
or u
nits
curr
ent a
sset
s
non
curr
ent
asse
ts
tota
l ass
ets
curr
ent l
iabi
litie
s
equi
ty
tota
l lia
bilit
ies
reve
nue
cost
s and
ex
pens
es
net
inco
me
for
the
year
Samarco Finance Ltd, 100% 50,000 190,472 - 190,472 170,536 19,936 190,472 2,287,956 (2,278,188) 9,768
Samarco Iron Ore Europe B,V 100% 180 31,151 2,761 33,912 7,542 26,370 33,912 28,568 (22,569) 5,999
total 221,623 2,761 224,384 178,078 46,306 224,384 2,316,524 (2,300,757) 15,767

45
Financial Statements 2015
11. RELATED PARTIESThe main balances of related-party transactions are detailed below:
Shareholders Subsidiary parent company consolidated
BHp Billiton Vale Samarco
FinanceSamarco
europe 2015 2014 2015 2014
current assets
Accounts receivable (a) - 91 187,125 - 187,216 170,704 91 153
Inventory (b) - 41 - - 41 65,938 41 65,938
Other assets (Note 9 (b.2)) - 44,085 - 615 44,700 2,365 44,085 -
current liabilities
Trade payables (Note 14) - - - 2,560 2,560 34,798 - 34,798
Other liabilities (commission payable) - - - 44,099 44,099 28,993 - -
Dividends (Note 22) - - - - - 1,619,936 - 1,619,936
Mining rights (Note 20) - - - - - 70,208 - 70,208
noncurrent liabilities
Dividends (Note 22) 1,402,774 1,402,774 - - 2,805,548 - 2,805,548 -
Mining rights (Note 20) (c) - 112,222 - - 112,222 - 112,222 -
Statement of operations
Revenue (a) - - 1,090,793 - 1,090,793 2,287,956 - -
Cost of goods sold and services rendered (b) - (209,478) - - (209,478) (370,267) (209,478) (370,267)
General and administrative expenses - (78,756) - - (78,756) (115,408) (78,756) (115,408)
Selling expenses - - - (27,462) (27,462) (28,566) - -
Finance expenses - - - - - (22,096) - (11,286)
(a) The balance of accounts receivable and revenue of the subsidiary Samarco Finance entails the sale of iron ore acquired from the Parent Company and sold on the international market to other companies.
(b) R$212,748 (R$375,346 in 2014) related to the acquisition of iron ore fines direct from the shareholder Vale, for use in production. The amount of R$3,270 (R$5,079 in 2014) in favor of Samarco refers to the amount Samarco charged Vale for the disposal of tailings in the Fundão dam. The amount stated under “Inventory” denotes the iron ore purchased but not yet consumed in the production process.
(c) In November 1989 the Company and Vale signed a mining rights transfer agreement for iron ore deposits, whereby Vale assigned and transferred to Samarco prospecting rights for its ore reserves.
The value of the contract considered the payment of the following amounts for mining rights: (i) Lump sum of R$19,972, and (ii) Variable payments equal to 4% of the dividends paid by Samarco to its shareholders through depletion of the reserves.
The price agreed to in the agreement is not fixed, and was established as a percentage of the gross dividends paid out. For the year ended December 31, 2015 the payments totaled R$36,742 (R$72,513 in 2014).

46
Financial Statements 2015
Samarco sponsors Fundação Vale do Rio Doce de Seguridade Social - ValiaPrev, which provides participants and their dependents supplementary benefit or benefits similar to those offered by the official basic pension scheme. Details of this plan can be seen in Note 16.
The compensation of key management personnel is as follows:
2015 2014
Compensation (i) 26,671 23,515
Medical assistance plan 112 105
Private pension 1,459 1,333
Life insurance 153 146
28,395 25,099
(i) Includes wages, salaries, profit shares, bonuses and indemnities.
Key management personnel are considered to be directors and general managers.
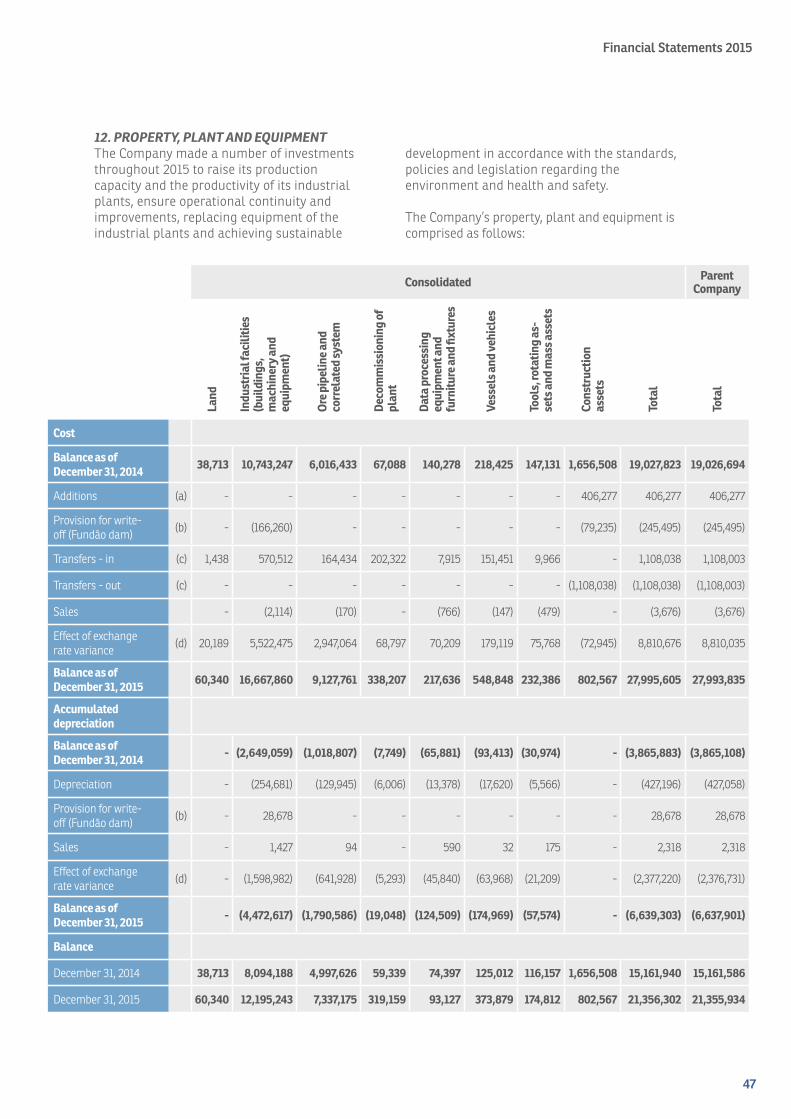
47
Financial Statements 2015
consolidated parent company
land
indu
stria
l fac
ilitie
s (b
uild
ings
, m
achi
nery
and
eq
uipm
ent)
ore
pip
elin
e and
co
rrel
ated
syst
em
dec
omm
issi
onin
g of
pl
ant
data
pro
cess
ing
equi
pmen
t and
fu
rnitu
re a
nd fi
xtur
es
Vess
els a
nd v
ehic
les
tool
s, ro
tatin
g as
-se
ts a
nd m
ass a
sset
s
cons
truc
tion
as
sets
tota
l
tota
l
cost
Balance as of december 31, 2014 38,713 10,743,247 6,016,433 67,088 140,278 218,425 147,131 1,656,508 19,027,823 19,026,694
Additions (a) - - - - - - - 406,277 406,277 406,277
Provision for write-off (Fundão dam) (b) - (166,260) - - - - - (79,235) (245,495) (245,495)
Transfers - in (c) 1,438 570,512 164,434 202,322 7,915 151,451 9,966 - 1,108,038 1,108,003
Transfers - out (c) - - - - - - - (1,108,038) (1,108,038) (1,108,003)
Sales - (2,114) (170) - (766) (147) (479) - (3,676) (3,676)
Effect of exchange rate variance (d) 20,189 5,522,475 2,947,064 68,797 70,209 179,119 75,768 (72,945) 8,810,676 8,810,035
Balance as of december 31, 2015 60,340 16,667,860 9,127,761 338,207 217,636 548,848 232,386 802,567 27,995,605 27,993,835
accumulated depreciation
Balance as of december 31, 2014 - (2,649,059) (1,018,807) (7,749) (65,881) (93,413) (30,974) - (3,865,883) (3,865,108)
Depreciation - (254,681) (129,945) (6,006) (13,378) (17,620) (5,566) - (427,196) (427,058)
Provision for write-off (Fundão dam) (b) - 28,678 - - - - - - 28,678 28,678
Sales - 1,427 94 - 590 32 175 - 2,318 2,318
Effect of exchange rate variance (d) - (1,598,982) (641,928) (5,293) (45,840) (63,968) (21,209) - (2,377,220) (2,376,731)
Balance as of december 31, 2015 - (4,472,617) (1,790,586) (19,048) (124,509) (174,969) (57,574) - (6,639,303) (6,637,901)
Balance
December 31, 2014 38,713 8,094,188 4,997,626 59,339 74,397 125,012 116,157 1,656,508 15,161,940 15,161,586
December 31, 2015 60,340 12,195,243 7,337,175 319,159 93,127 373,879 174,812 802,567 21,356,302 21,355,934
12. PROPERTY, PLANT AND EQUIPMENTThe Company made a number of investments throughout 2015 to raise its production capacity and the productivity of its industrial plants, ensure operational continuity and improvements, replacing equipment of the industrial plants and achieving sustainable
development in accordance with the standards, policies and legislation regarding the environment and health and safety.
The Company’s property, plant and equipment is comprised as follows:

48
Financial Statements 2015
(a) In terms of additions, we highlight below the main projects:
Start date
end date 2015 2014
Elevation of the Germano and Fundão dams to El. 940m - stage 2 2015 2016 51,263 -
New area for unloading processing consumables 2014 2016 36,600 1,610
Fourth Pelletizing Plant Project 2011 2016 31,437 664,003
Expansion of the Filtering 1 capacity 2015 2015 20,896 -
Replacement of fleet 2014 2016 10,932 149,364
Spare parts of Germano/Ubu 2014 2016 11,476 49,249
Refurbishment and expansion of the Germano restaurant 2013 2016 11,930 4,448
Industrial effluent and water at Ubu 2793 2014 2016 12,281 868
Automating the storage and shipment operations 2014 2016 12,192 4,052
Germano basic grid 2010 2015 9,114 22,347
Land 2014 2016 5,865 22,305
Mobile equipment repair shop of mine 2011 2015 108 18,037
Metal frames for aligning the rotary-control 2014 2015 183 11,701
Waterproofing of slurry pond 2013 2015 75 10,246
Raising of embankment 2013 2014 - 6,899
Wind Fence in the pellets yards 2011 2014 - 655
IT 2013 management systems - acquisition of software and licenses 2013 2015 740 3,220
Other 191,185 408,042
total 406,277 1,377,046
(b) Provisions for loss on property, plant and equipment due to the Fundão dam collapse, as described in Note 3 (e).
(c) The investments in property, plant and equipment and intangible assets are initially recorded in construction in progress. Once these investments are concluded and have come into operation, the assets are transferred to the respective accounts of property, plant and equipment and intangible assets, depending on the accounting nature of each item.
(d) The effect of the exchange rate variance resulted from translating the financial statements from the functional currency (US dollars) to the reporting currency (Real).

49
Financial Statements 2015
12.1 Impairment analysis Following the suspension of the Company’s operations in Mariana, as a result of the collapse of the Fundão dam, Samarco found evidence of impairment of certain items of property, plant and equipment and conducted an impairment test in the year.
The assets’ recoverable values were assessed based on projected cash flows, considering the Company to be the only cash generating unit (CGU). Cash flow projections were made based on: (i) estimated useful life of Samarco’s mines; (ii) assumptions and budgets approved by Company management for the period corresponding to the estimated useful life; (iii) discount rate deriving from the methodology used to calculate the weighted average cost of capital – WACC; (iv) market projections for exchange rates (Real/US Dollar);(v) market projections for price quotes of iron ore pellets (BF and DR).
The main assumptions used in the cash flow projections to determine the value in use of the CGU were: WACC of 11.3%; average inflation rate of 6.5% in 2016, amounting to 4.2% in the long term; average exchange rate for 2016 of R$4.08, rising to R$5.04 in the long term; average price of BF and DR pellets, as per the Platts index projected by market analysts and international marine freight references.
When testing its noncurrent nonfinancial assets for impairment based on projected cash flows as of December 31, 2015, the Company did not identify the need to make a provision for asset impairment.
12.2 Residual value It is Company policy to extend the useful life of its assets as much as possible by carrying out preventive and corrective maintenance. This policy enables the Company to maintain its assets in an appropriate state of repair and operation for lengthy periods of time until they become obsolete or are scrapped. It is not expected to recover a significant part of the value of property, plant and equipment, when sold i.e. the residual value thereof is close to zero.
12.3 Pledged assetsAt December 31, 2015 the Company had assets pledged as collateral in judicial proceedings. These assets are recorded under Property, Plant and Equipment as machinery and equipment, vessels and related systems, amounting to R$438,178 (R$64,954 in 2014). The guarantee related to the BNDES loan was increased in 2015.
Samarco has also submitted a guarantee to the Prosecutor’s Department of Minas Gerais state consisting of assets worth R$500,000, under the TPC entered into on November 16, 2015 (Note 3).
12.4 Useful lifeIn accordance with technical pronouncement CPC 27 - Property, Plant and Equipment, in 2015 the Company concluded its review of the useful lives of its property, plant and equipment. There were no changes to the expected use of the asset, which is assessed based on physical production or capacity expected of it. There were therefore no changes to the standard uses of Samarco’s property, plant and equipment in 2015, i.e. the useful lives are compatible with the expected benefit of the industrial complex.

50
Financial Statements 2015
Below is a summary descriptions of the property, plant and equipment accounts and the useful life by accounting item used to calculate depreciation, based on the units produced method for the items directly related to the respective productive areas and based on the straight-line depreciation method for the rest.
2015 2014
item account description
average weighted
useful life in years
years of deprecia-
tion
average weighted
useful life in years
years of deprecia-
tion
Buildings Buildings, warehouses, security cabins, road surfacing and civil works improvements. 34 10 to 50 34 10 to 50
Machinery and equipment
Furnace, pelletizing disks, ship loader, loaders, precipitators, ball mills, grate cars and other such items.
20 10 to 50 20 10 to 50
Ore pipeline and correlated system
Pipelines to transport iron ore and industrial fixtures, such as conveyor belts, cabling and others
18 20 to 43 18 20 to 43
Plant decommissioningEnvironmental obligations to discontinue the slurry pipeline and industrial facilities of Germano and Ubu.
43 43 43 43
Data processing equipment
Personal computers, printers, monitors, notebooks, servers, optical interfaces, collectors, switches, hubs, patch panels, racks, etc.
4 5 4 5
Furniture and fixtures Chairs, tables, cupboards and other such furniture 8 10 8 10
Vessels Boats, ferries, speed boats and dredgers. 16 9 to 24 16 9 to 24
Vehicles Automobiles, trucks, stackers, cranes, tractors, loaders. 10 4 to 25 10 4 to 25
Tools Impact keys, multimeter, torque wrenches, microscopes, and other small devices. 12 10 to 25 12 10 to 25
Rotating assets Parts of machinery and equipment and industrial facilities. 20 10 to 27 20 10 to 27
Mass assets Circuit breakers, capacitors, hydraulic pumps and other small items. 20 5 to 24 20 5 to 24

51
Financial Statements 2015
13.INTANGIBLE ASSETS The intangible assets are comprised as follows:
(a) The investments and expenditure to be recorded in intangible assets are initially recorded in construction in progress in property, plant and equipment. Once these investments are concluded and have come into operation, the assets are transferred to the respective accounts of intangible assets, depending on the accounting nature of each item.
(b) The effect of the exchange rate variance resulted from translating the financial statements from the functional currency (US dollars) to the reporting currency (Real).
(c) Amortization of the intangible assets is calculated according to the expected useful life of the iron ore mines owned by the Company, for the easements and mining rights. The straight-line method is applied for the others.
parent company and consolidated
right of way
mining rights
other rights
tailings removal
applications and software
construction assets total
cost
Balance as of december 31, 2014 16,261 33,593 1,531 16,094 104,874 14,690 187,043
Additions (a) - - - - - 17,780 17,780
Transfers - in 4,738 - - 1,079 8,523 - 14,340
Transfers - out - - - - - (14,340) (14,340)
Effect of exchange rate variance (b) 11,988 15,794 718 8,273 54,426 (1,846) 89,353
Balance as of december 31, 2015 32,987 49,387 2,249 25,446 167,823 16,284 294,176
accumulated amortization
Balance as of december 31, 2014 (3,722) (22,339) (1,531) (521) (76,213) - (104,326)
Amortization in the period (c) (232) (164) - (2,426) (7,536) - (10,358)
Effect of exchange rate variance (b) (2,025) (10,770) (718) (1,846) (43,007) - (58,366)
Balance as of december 31, 2015 (5,979) (33,273) (2,249) (4,793) (126,756) - (173,050)
Balance as of December 31, 2014 12,539 11,254 - 15,573 28,661 14,690 82,717
Balance as of December 31, 2015 27,008 16,114 - 20,653 41,067 16,284 121,126

52
Financial Statements 2015
13.1 Useful life Below is a summary descriptions of the intangible asset accounts and the useful life by accounting item.
2015 2014
item account description
average weighted
useful life in years
years of deprecia-
tion
average weighted
useful life in years
years of deprecia-
tion
EasementsRights acquired to use the easement on the ground to lay the slurry pipeline.
43 43 43 43
Mining rights Mining rights for exploration of iron ore deposits. 43 43 43 43
Other rights Oil pipeline usage right. 14 15 14 15
Tailings removal Cost of removing tailings, incurred in surface mine during production. 14 14 14 14
Applications and software Software and licenses. 5 5 5 5
13.2 Research and development The Company incurred research and development expenses of R$107,156 (R$104,570 in 2014), which were recognized as net operating expenses.
14. TRADE PAYABLES
parent company consolidated
2015 2014 2015 2014
Domestic customers 110,609 302,704 110,623 302,719
Overseas customers 5,537 11,277 5,574 10,246
Related-party transactions (Note 11) 2,560 34,798 - 34,798
118,706 348,779 116,197 347,763

53
Financial Statements 2015
15. LOANS AND FINANCINGLoans and financing are instruments used by the Company to finance its long-term projects and ventures. Loans and financing
parent company consolidated
current noncurrenttotal total total total
2015 2014 2015 2014
Overseas loans and financing 304,528 14,602,851 14,907,379 11,402,579 14,907,379 11,402,579
Local loans and financing 23,715 139,068 162,783 170,113 162,783 170,113
total 328,243 14,741,919 15,070,162 11,572,692 15,070,162 11,572,692
Current 328,243 - 328,243 1,281,371 328,243 1,281,371
Noncurrent - 14,741,919 14,741,919 10,291,321 14,741,919 10,291,321
2015 2014
principal value
provision for interest
principal value
provision for interest
0% to 2 % 4,138,452 20,023 4,549,043 13,883
2% to 3% 2,244,915 2,882 1,062,240 1,859
3% to 4% - - - -
Over 4% 8,524,012 83,485 5,791,296 56,785
14,907,379 106,390 11,402,579 72,527
2015 2014
principal value
provision for interest
principal value
provision for interest
3% to 4% 150,933 199 159,226 1,010
Over 4% 11,850 2,539 10,887 1,941
162,783 2,738 170,113 2,951
No major new loans were secured in FY 2015.
The financing contract entered into with the BNDES in October 2014 amounting to R$201,000 has not yet been disbursed (grace period of up to 2 years). The contract is subject to fixed interest paid quarterly during the grace period and monthly thereafter. It is
important to highlight that Company is evaluating the continuity of this contract.
As of December 31, 2015 the provision for interest on foreign currency loans and financing, which accounted for 98.9% of interest on total loans (98.5% in 2014) was as follows:
As of December 31, 2015 the provision for interest on local currency loans and financing, which accounted for 1.1% (1.5% in 2014) of interest on total loans and financing was as follows:
generally have a term in excess of 1 (one) years and are mainly denominated in US dollars:

54
Financial Statements 2015
The average cost of the total debt, including foreign currency loans and financing is 3.5% p.a (3.2% p.a. in 2014).
As of December 31, 2015 the loans and financing payments were subject to the following maturities:
parent company and consolidated
total 2016 2017 2018 2019 2020 2021 2022 2023 2024
Loans and financing 15,070,162 328,243 324,315 4,259,519 511,487 511,487 187,439 4,091,639 2,912,086 1,943,947
The fair value of financial liabilities related to the loans and financing, whose balances are measured at amortized cost, is calculated as follows:
(i) the fair value of the bonds is obtained from the security’s price in the secondary market (the value used is the closing value informed by Bloomberg).
(ii) the 2022 Bonds quotes in the secondary market and the 6-month Libor rate,
in force as of December 31, 2015, are used as a reference for EPP - Export Pre-Payment, Finame loans and loans which are not published in the secondary debt market or for which the secondary market does not have enough liquidity.
Below are the estimated fair values of the loans and financing:
2015 2014
carrying amount
estimated fair value
carrying amount
estimated fair value
Bonds 8,607,497 2,884,835 5,848,081 5,402,821
EPPs (export pre payments) 6,406,272 4,041,601 5,627,025 4,181,817
Other 165,521 89,024 173,064 146,607
15,179,290 7,015,460 11,648,170 9,731,245
Guarantees and obligations - loans and financingThe Company’s noncurrent loans and financing is guaranteed by promissory notes and is primarily linked to previously defined export receivables.
Certain loans and financing are subject to a number of financial covenants. Some of financial covenants concern the debt ratios Net Debt/ EBITDA limited to 4:1. The Company uses an adjusted EBITDA to calculate compliance with the covenants, in accordance with the various contracts with creditors. According to this criteria we exclude extraordinary noncash losses and gains, such as provisions, in order to reflect
in the EBITDA the expected cash generation, thereby evaluating the Company’s solidity and liquidity and its capacity to pay the entire debt in a certain period of time. The determination of the adjustments made in the financial indexes reflects management’s better interpretation of contractual clauses. Failure to comply with financial covenants in the period (or quarterly bases for certain loans and financing), could trigger early maturity of creditor obligations. Management believes that it will not meet the covenants’ financial indexes in the first quarter of 2016 and is evaluating its debts facilities proactively with the objective to avoid any material adverse effect with respect to the debit facilities.

55
Financial Statements 2015
As of December 31, 2015 this ratio was 3.0, as shown below:
net debt / eBitda
2015 2014
Operating income (loss) before financial income/loss (1,765,673) 1,546,537
Other operating expenses, net 72,112 8,199
Allowance for doubtful accounts 6,509 1,713
Other noncash operating expenses (revenue) 2,576,250 32,772
Depreciation and amortization 221,730 184,658
(a) EBITDA 1,110,928 1,773,879
(b) Net Indebtedness 3,393,122 3,560,434
Net Debt / EBITDA (b / a) 3.05 2.01
According to the facts and circumstances management is aware of, including: (i) the specialized foreign advisory report and (ii) the current stage of the investigation into the collapse of the Fundão dam, on November 05, 2015, it believes, all the covenants established by loans and financing agreements and other agreements are being duly complied with on December 31, 2015, there being no other facts or events which could be classified as default.
16. EMPLOYEE BENEFITS
16.1 Retirement benefitsSamarco sponsors Fundação Vale do Rio Doce de Seguridade Social (ValiaPrev), a multi-sponsor, multi-plan entity managing benefit plans with segregated assets and providing participants and their dependents with benefits supplementary, or similar, to Official Basic Social Security benefits. The plan is a defined-contribution plan and offers the following benefits:
» Normal retirement income» Early retirement income» Supplementary disability retirement.» Supplementary pension for death» Pension income for death» Deferred benefit income for severance» Supplementary annual bonus.» Annual income bonus.» Redemption.
(a) Defined-contribution plan
The plan is supported by regular contributions precisely matching participant contributions and limited to 9% of the amount by which contribution salaries exceed 10 reference plan units, as well as by contributions to support risk benefits (disablement and death at work and annual bonus) and plan administration expenses.
In FY 2015 the Company made contributions to the defined contribution plan of R$12,497 (R$10,715 in 2014).
(b) Defined-benefit plan portion.
The Company records the cost and obligations related to the pension benefits offered to its employees when they retire, based on a specific actuarial appraisal report.
The actuarial appraisal report calculated the retirement benefits considering the definitions contained in the regulations that concern eligibilities, benefit formulas and means of readjustment.
The actuarial report appraised the defined-benefit portion in the plan, which denotes the constructive obligation referring to supplementary retirements, pension for death and annual bonus, denominated Risk Plan and retirement income.
eBitda (in thousands of uSd)

56
Financial Statements 2015
1 – Change in present value of the obligations
2015 2014
Present value of the actuarial liability at the beginning of the year
24,729 19,611
Current service cost 1,369 1,467
Interest on actuarial obligation 2,723 2,309
Actuarial (gains)/losses - experience 4,138 3,357
Actuarial (gains)/losses - demographic assumptions (2,557) (3,622)
Actuarial (gains)/losses - financial hypothesis (3,954) 2,803
Benefits paid by the plan (1,694) (1,196)
present value of the actuarial liability at the end of the year 24,754 24,729
2015 2014
Fair value of assets at start of year 47,870 34,558
Real return on investments 6,376 11,896
Contributions paid by the Company 2,809 2,612
Benefits paid by the plan (1,694) (1,196)
Fair value of assets at end of year 55,361 47,870
2015 2014
Unrecoverable surplus at end of previous year 23,141 14,947
Interest on unrecoverable surplus 2,607 1,800
Change in unrecoverable surplus during period 4,859 6,394
unrecoverable surplus at end of current year 30,607 23,141
4.1 - in results for the year 2015 2014
Current service cost of the company 1,369 1,467
Net interest of net liabilities/(assets) (162) (167)
cost of defined benefit in results 1,207 1,300
4.2 - other comprehensive income (ora) 2015 2014
Actuarial gains(losses) of change in liabilities 4,138 3,357
Actuarial gains(losses) of changes in hypothesis (6,511) (820)
actuarial gains(losses) arising in the period (2,373) 2,537
Yields on plan assets (greater)/smaller than discount rate (885) (7,619)
Change in unrecoverable surplus 4,859 6,394
re-measurement of effects on other comprehensive income 1,601 1,312
4.3 – cost of defined benefit 2015 2014
Current service cost 1,369 1,467
Net interest on net value of liabilities/(asset) (162) (167)
Remuneration of effects recognized in ORA 1,602 1,312
cost of defined benefit 2,809 2,612
2 – Change in fair value of the assets
3 – Change in unrecoverable surplus
4 – Costs of defined benefit

57
Financial Statements 2015
5.1 – net liability/assets 2015 2014
Present value of obligation (VPO) (24,754) (24,729)
Fair value of the assets 55,361 47,870
net total (liability)/assets to be recognized 30,607 23,141
5.2 – reconciliation in net total (liability)/assets 2015 2014
Net total (liability)/asset at beginning of year
Service Cost (1,369) (1,467)
Net interest on net value of liabilities/(asset) 162 167
Remuneration of effects recognized in ORA (1,602) (1,312)
Contributions paid by the Company 2,809 2,612
net total (liability)/asset at end of year - -
2015 2014
economic
Discount rate 6.94% per year 5.77% per year
Salary growth rate 7.10% per year 7.30% per year
Inflation 5.00% per year 5.20% per year
Benefits growth 5.00% per year 5.20% per year
Return on noncurrent assets 12.29% per year 11.27% per year
demographic
Mortality table AT-2000 (H) AT-1983 (H)
Mortality table of disabled people AT-2000 (H) AT-1983 (H)
Disability rate table RGPS 1992-2002 0,55 Zimmerman 0.45
Turnover rate 3% up to 55 years Nil
Retirement age First age entitled to one of the benefits
First age entitled to one of the benefits
% of active participants married at retirement 95% 95%
Age difference between participant and spouse
Wives are 4 years younger than husbands
Wives are 4 years younger than husbands
Current service cost 558
Net interest of net liabilities (assets) (185)
Cost to be recognized in profit or loss 373
Company Contributions 3,012
Benefits paid by the plan 1,828
5 – Change in net liability/assets 6 – Estimated cost of defined benefit for 2016
7 – Expected cash flows for 2016
8 – Actuarial assumptions

58
Financial Statements 2015
9 - Summary of participants’ data
assets by category 2015 2014
Fixed income 384,351 306,812
Variable income 69,798 61,611
Loans 50,306 54,952
504,455 423,375
2015 2014
active and self-sponsored employees
Number 3,001 2,959
Average age 37.55 37.22
Average length of service (years) 9.29 9.04
Annual average payroll 67,361 65,219
participants with assisted benefits
Number 78 67
Annual average payroll 25,732 16,364
16.2 Other employee benefitsThe Company additionally offers employee benefits such as a health care plan (self-managed and contributed to by employees for coparticipation in expenses incurred) entitled Assistência Médica Supletiva (AMS), which is also extended to dependents. The plan covers
parent company consolidated
2015 2014 2015 2014
Compensation and charges (347,472) (337,529) (355,391) (344,462)
Social security charges (67,397) (67,062) (67,397) (67,062)
Retirement plan benefits (13,522) (12,568) (13,739) (12,779)
Meal vouchers (25,017) (23,041) (25,017) (23,041)
Health insurance (20,700) (17,244) (20,750) (17,299)
Other (15,893) (22,305) (17,840) (23,689)
(490,001) (479,749) (500,134) (488,332)
outpatient, inpatient and dental care as well as medication for beneficiaries and is ensured by a Collective Labor Agreement. Plan management fees are fully borne by the Company. Expenses on other benefits were recognized in the statement of operations as follows:
10 – The plan’s assets are administered as follows:
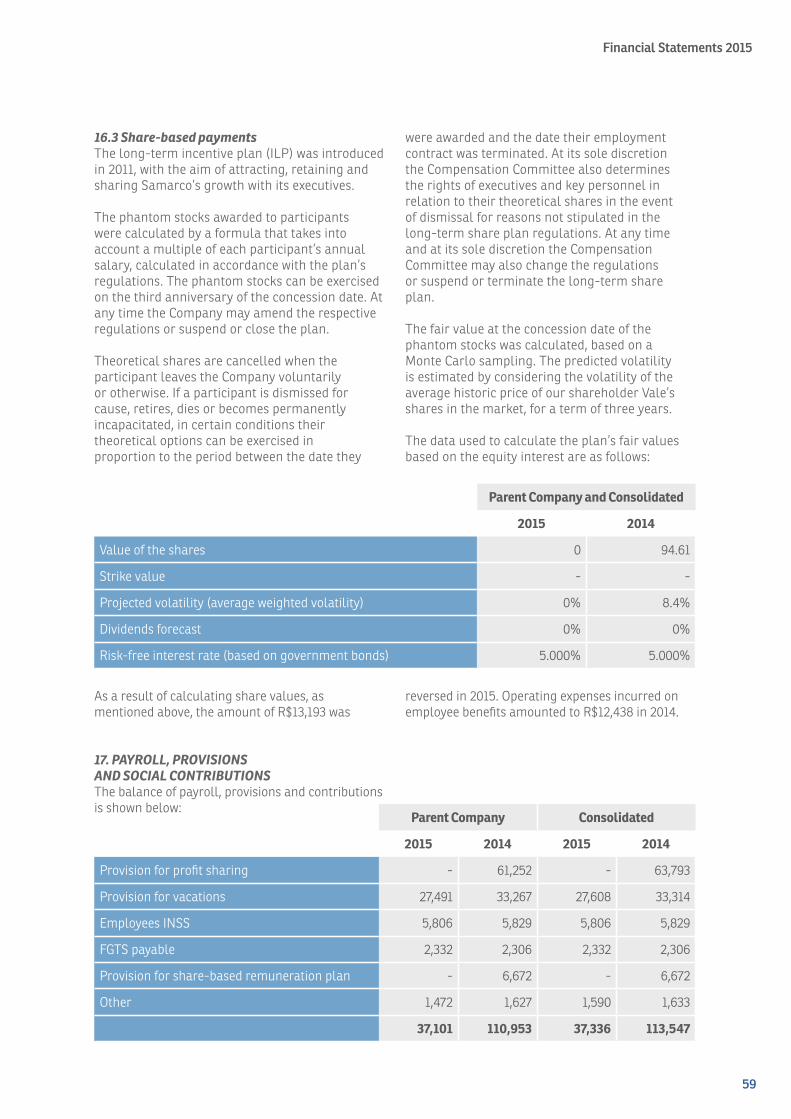
59
Financial Statements 2015
16.3 Share-based paymentsThe long-term incentive plan (ILP) was introduced in 2011, with the aim of attracting, retaining and sharing Samarco’s growth with its executives.
The phantom stocks awarded to participants were calculated by a formula that takes into account a multiple of each participant’s annual salary, calculated in accordance with the plan’s regulations. The phantom stocks can be exercised on the third anniversary of the concession date. At any time the Company may amend the respective regulations or suspend or close the plan.
Theoretical shares are cancelled when the participant leaves the Company voluntarily or otherwise. If a participant is dismissed for cause, retires, dies or becomes permanently incapacitated, in certain conditions their theoretical options can be exercised in proportion to the period between the date they
parent company and consolidated
2015 2014
Value of the shares 0 94.61
Strike value - -
Projected volatility (average weighted volatility) 0% 8.4%
Dividends forecast 0% 0%
Risk-free interest rate (based on government bonds) 5.000% 5.000%
As a result of calculating share values, as mentioned above, the amount of R$13,193 was
were awarded and the date their employment contract was terminated. At its sole discretion the Compensation Committee also determines the rights of executives and key personnel in relation to their theoretical shares in the event of dismissal for reasons not stipulated in the long-term share plan regulations. At any time and at its sole discretion the Compensation Committee may also change the regulations or suspend or terminate the long-term share plan.
The fair value at the concession date of the phantom stocks was calculated, based on a Monte Carlo sampling. The predicted volatility is estimated by considering the volatility of the average historic price of our shareholder Vale’s shares in the market, for a term of three years.
The data used to calculate the plan’s fair values based on the equity interest are as follows:
parent company consolidated
2015 2014 2015 2014
Provision for profit sharing - 61,252 - 63,793
Provision for vacations 27,491 33,267 27,608 33,314
Employees INSS 5,806 5,829 5,806 5,829
FGTS payable 2,332 2,306 2,332 2,306
Provision for share-based remuneration plan - 6,672 - 6,672
Other 1,472 1,627 1,590 1,633
37,101 110,953 37,336 113,547
reversed in 2015. Operating expenses incurred on employee benefits amounted to R$12,438 in 2014.
17. PAYROLL, PROVISIONS AND SOCIAL CONTRIBUTIONSThe balance of payroll, provisions and contributions is shown below:

60
Financial Statements 2015
18. TAXES PAYABLEThe balance of taxes payable is shown below:
parent company consolidated
2015 2014 2015 2014
ICMS payable 7,498 20,927 7,498 20,927
REFIS – Tax recovery – financed taxes 14,798 13,311 14,798 13,311
IRRF on interest 13,260 - 13,260 -
ISS withheld 4,003 4,713 4,003 4,713
INSS retained from third parties payable 3,264 4,585 3,264 4,585
IRRF payable 4,957 6,120 5,081 6,207
INSS DIFAL payable 954 2,432 954 2,432
CFEM payable 14,152 5,412 14,152 5,412
COFINS withheld 2,377 1,493 2,377 1,493
TFRM payable - 2,166 - 2,166
Other 1,484 1,134 1,479 1,134
66,747 62,293 66,866 62,380
19. PROVISION FOR CONTINGENCIES The Company is party to judicial and administrative proceedings in various courts and government agencies, arising from the normal course of operations, basically involving tax, civil, labor and environmental issues. Based on the information and opinions of its internal and external legal advisors, management has made a provision for contingencies in an amount considered sufficient to cover cases assessed as involving probable losses. The additional
parent company and consolidated
2015 2014
Judicial tax deposits (a.1) 1,087,117 692,001
Civil judicial deposits (a.1) 312,111 9,583
Judicial Deposits - Labor Claims 2,928 4,682
Judicial environmental deposits 22 21
1,402,178 706,287
provisions and deposits relating to the collapse of Fundão dam have been described in Note 3. In 2015 the provisions for present obligations are presented net of the corresponding judicial deposits amounting to R$69,878 (R$65,382 in 2014). The balance of unprovisioned judicial deposits is recorded in assets at R$1,402,178 (R$706,287 in 2014) and its breakdown is detailed below:
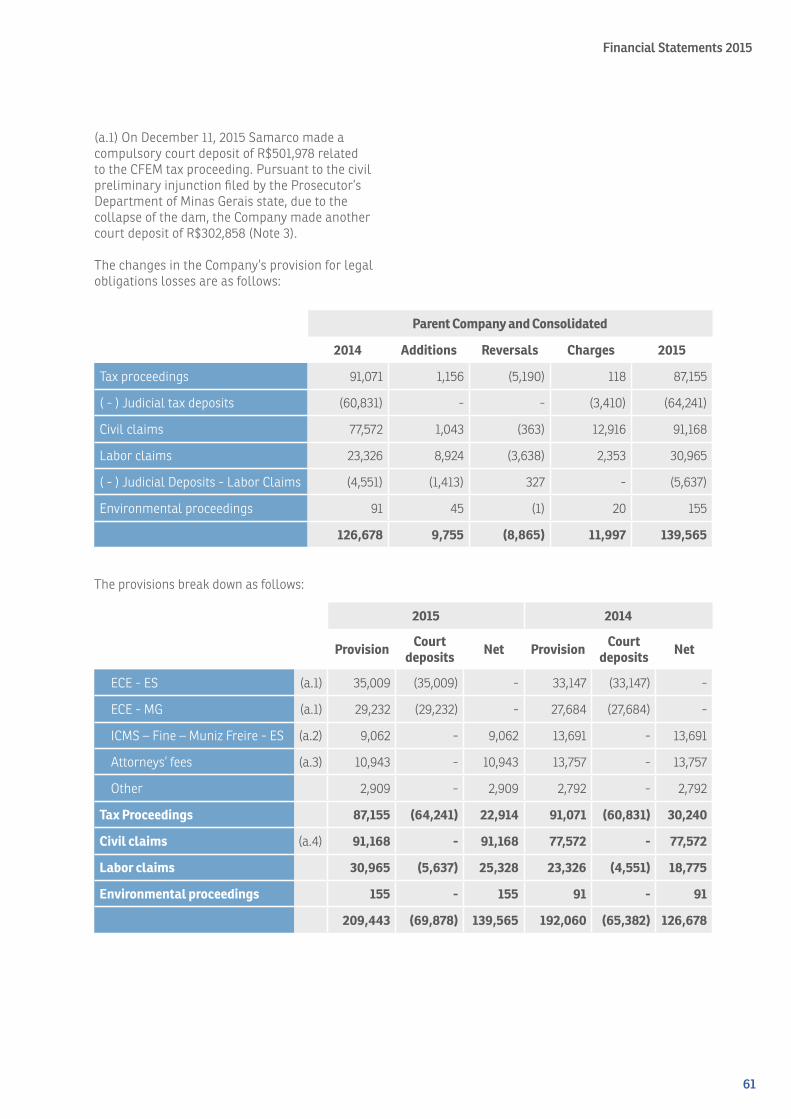
61
Financial Statements 2015
(a.1) On December 11, 2015 Samarco made a compulsory court deposit of R$501,978 related to the CFEM tax proceeding. Pursuant to the civil preliminary injunction filed by the Prosecutor’s Department of Minas Gerais state, due to the collapse of the dam, the Company made another court deposit of R$302,858 (Note 3).
The changes in the Company’s provision for legal obligations losses are as follows:
parent company and consolidated
2014 additions reversals charges 2015
Tax proceedings 91,071 1,156 (5,190) 118 87,155
( - ) Judicial tax deposits (60,831) - - (3,410) (64,241)
Civil claims 77,572 1,043 (363) 12,916 91,168
Labor claims 23,326 8,924 (3,638) 2,353 30,965
( - ) Judicial Deposits - Labor Claims (4,551) (1,413) 327 - (5,637)
Environmental proceedings 91 45 (1) 20 155
126,678 9,755 (8,865) 11,997 139,565
2015 2014
provision court deposits net provision court
deposits net
ECE - ES (a.1) 35,009 (35,009) - 33,147 (33,147) -
ECE - MG (a.1) 29,232 (29,232) - 27,684 (27,684) -
ICMS – Fine – Muniz Freire - ES (a.2) 9,062 - 9,062 13,691 - 13,691
Attorneys’ fees (a.3) 10,943 - 10,943 13,757 - 13,757
Other 2,909 - 2,909 2,792 - 2,792
tax proceedings 87,155 (64,241) 22,914 91,071 (60,831) 30,240
civil claims (a.4) 91,168 - 91,168 77,572 - 77,572
labor claims 30,965 (5,637) 25,328 23,326 (4,551) 18,775
environmental proceedings 155 - 155 91 - 91
209,443 (69,878) 139,565 192,060 (65,382) 126,678
The provisions break down as follows:

62
Financial Statements 2015
(a) Legal obligations by the Company:
note description Status 2015 2014
(a.1)
Court proceeding filed to have declared the unconstitutionality and illegality of the requirement to pay charges and acquisition of emergency energy, due to technical defects when these requirements were introduced.
The case for Espírito Santo is pending a decision of the appeal Court (2nd judicial instance) and the case relating to Minas Gerais is pending decision of another appeals court (3rd judicial instance).
64,241 60,831
(a.2)
Assessments for ICMS due on the transfer of electricity from the Muniz Freire power plant, which Samarco owns, for consumption at its industrial establishment in Ponta Ubu, Anchieta, ES, as well as a fine for failing to issue invoices on these transfers.
Case ruled in favor of Samarco. Admissibility of the Finance Department's appeal is pending.
9,062 13,691
(a.3)Provision is made for lawyers’ fees referring to proceedings classified as having a remote chance of defeat.
- 10,943 13,757
Other
Proceedings related to the former Guilman-Amorim hydroelectric power plant, closed down as a result of a spin-off and subsequent merger, for the offsetting of tax losses, PIS and COFINS.
Proceedings pending decisions under administrative appeals and 1st and 2nd instance judicial decisions.
2,909 2,792
(a.4)
Provision made to cover potential losses on civil proceedings related to third-party compensation and proceedings entailing the intermediation of transferred ICMS credits.
Proceedings at the judicial courts at several stages.
91,168 77,572
LaborLabor claims primarily related to the application of fines by the authorities, in addition to labor claims filed by employees and service providers.
Proceedings at the judicial and administrative courts at several stages.
30,965 23,326
EnvironmentalAssessment Notice 1284/10 issued by DNPM, for the alleged breach of article 54 (V) of the mining code's regulations.
Pending analysis of the administrative defense submitted.
155 91
209,443 192,060

63
Financial Statements 2015
(b) Possible contingencies:
The Company is party to other cases for which management, based on the information and opinions of its internal and external legal advisors,
description Status 2015 2014
Assessment Notices for the alleged non-payment of CSLL in 2008, 2009 and 2010.
A favorable decision of the administrative appeals court has been obtained for the proceeding for the period 2008. Appeal proposed by the Ministry of Finance. Case relating to the period 2009 and 2010 administrative appeal proposed by Samarco analyzed but decision is pending formalization.
2,472,611 2,250,376
Assessment notices for 2000 to 2003 and 2007, 2008, 2009 and 2010, for allegedly incorrectly calculating the IRPJ as a result of using the rate of 18% over profit deriving from mineral exports instead of the general rate of 15% plus the 10% surcharge.
A favorable decision from the administrative appeals court has been obtained for the proceeding for the period of 2007 and 2008. Appeal proposed by the Ministry of Finance analyzed but decision is pending formalization. Case relating to the period 2000 to 2003, terminated at the administrative level and pending notification of the decision. Appeal proposed by Samarco for years 2009 and 2010 analyzed but decision is pending formalization.
1,859,773 1,844,826
Assessment Notice issued by the National Mining Production Department (DNPM) for alleged underpayment of the Financial Compensation for Exploration of Mineral Resources (CFEM). The city government of Mariana filed suit against the Company, based on the same legal grounds as those invoked by the DNPM in its assessments.
1 case closed with a favorable sentence for Samarco, 3 cases pending appeal at the lower court and 1 case pending decision of an administrative appeal.
945,809 886,766
Tax enforcements regarding the timeliness and respective amounts of PIS paid on a semi-annual basis in the periods September 1989 to August 1994.
1 proceeding awaiting the decision of the 1st judicial court and 1 proceeding awaiting the decision of the 2nd judicial court.
21,182 20,548
Assessment Notice demanding social security contributions on payments made to insured employees as profit shares and "Field of Ideas" Premium, amongst other matters such as (i) social contributions allegedly due to the National Development Fund (FND) on said payments; (ii) fine for failure to pay social contributions; and (iii) fine for submitting incomplete information in declaration forms known as GFIPs.
Pending decision of the administrative appeal. The proceedings up to 2008 not covered by the statute of limitations have been included in the REFIS program.
23,418 12,923
has not set up a provision for contingencies, since the chance of loss has been rated as possible. The main such cases are described below:
continue »

64
Financial Statements 2015
description Status 2015 2014
Disallowance of the offset of IRPJ and CSLL losses of the former Guilman-Amorim hydroelectric power plant (subject to the legally established 30% limit).
Pending administrative decision. Process included in REFIS 7,681 7,124
Disallowance of offset PIS and COFINS credits in the period April 2006 to December 2007 and 2008 to 2010 against monthly estimated IRPJ debits calculated in the same period, submitting the individual PER/DCOMPs by quarter and origin of credits (PIS and COFINS credits).
Proceedings pending decision of the administrative appeal. 145,930 133,394
This is addressing the constitutionality and legality of the fee introduced by the Minas Gerais government to inspect the survey, mining, exploration and use of mineral resource activities (TFRM). This proceeding involves the entering into the Special Arrangement REGIME ESPECIAL/E-PTA Nº:45.000005700-79, which among other obligations stipulated the payment of the TFRM, with the consequent withdrawal of the proceeding and release of part of the judicial deposit to the government income.
Case closed. Part of the judicial deposit was released and the remaining balance returned to Samarco in 2014.
- -
Assessments for ICMS due on the transfer of electricity from the Muniz Freire power plant, which Samarco owns, for consumption at its industrial establishment in Ponta Ubu, Anchieta, ES, as well as a fine for failing to issue invoices on these transfers.
3 legal proceedings with appeals by Samarco upheld. Admissibility of the Finance Department's appeals is pending. 1 legal proceeding closed with a favorable outcome for Samarco.
50,082 64,356
Assessment Notice issued by Minas Gerais state for ICMS on acquisitions of consumables, on the grounds that the permission awarded by the federal tax authorities for the drawback customs basis only applies to SAMARCO's establishment in the same state (Espírito Santo), so that imports made by the establishment in Minas Gerais state are not embraced by the ICMS suspension.
These proceedings were paid with the reductions established in the legislation of Minas Gerais state. Pending submission of case records for filing.
- -
Tax enforcement and assessment notice issued by the municipal government of Anchieta in respect of the area where Samarco's industrial plant is located in Ubu, which is subject to the tax, also demanding tax for the area for which the ITR is paid.
1 case is pending decision of the court of appeal and 1 is pending an administrative decision.
77,790 66,371
Judicially dispute regarding the legality of the levying of ICMS on the right to use electric power transmission lines.
Case closed. The balance of the court deposit has been returned to Samarco.
- 170,302
continuation »
continue »

65
Financial Statements 2015
description Status 2015 2014
Civil proceedings primarily related to third-party compensation. According to the opinion of the Company’s legal advisers, the probability of losing these cases is possible.
Proceedings at the judicial courts at several stages. 64,064 56,638
Labor claims primarily related to the application of fines by the authorities, in addition to labor claims filed by employees and service providers.
Proceedings at the judicial courts at several stages. 56,344 40,335
Proceedings involving environmental risks in the states of Minas Gerais and Espírito Santo, consisting of assessments from the inspection authorities.
Proceedings at the judicial courts at several stages. 62,893 55,453
Other - 100,106 92,807
5,887,683 5,702,219
The contingencies relating to the collapse of Fundão dam are described in Note 3(h).
20. OTHER PROVISIONS
parent company and consolidated
2015 2014
Provision for electricity (a) 25,181 42,091
Provision for mining rights (b) - 70,208
Provision for purchase of iron ore - 413
Provision for social, environmental and socioeconomic recuperation (c) 1,949,964 -
total current 1,975,145 112,712
parent company and consolidated
2015 2014
Provision for asset retirement obligation (d) 384,839 350,718
Provision for mining rights (b) 112,222 -
Provision for social, environmental and socioeconomic recuperation (c) 8,054,838 -
Provision for share-based remuneration plan - 12,063
Other 4,262
total noncurrent 8,551,899 367,043
(a) Acquisition of energy for use in production, not invoiced by the concession operators in the period.
(b) The Company pays its shareholder Vale for the assignment of mining rights to iron ore geological resources. These amounts are calculated at the rate of 4% of dividends paid (Note 11).
(c) Provision for the collapse of the Fundão dam, as described in Note 3.
continuation »

66
Financial Statements 2015
(d) The changes in the provision for asset retirement obligations were as follows:
parent company and consolidated
2015 2014
Provision at beginning of year 350,718 135,669
Provision increase 36,651 202,322
Estimated revisions in cash flows (2,530) 12,727
Provision at end of year 384,839 350,718
In 2014 the Company revised its conceptual plan to close down operating units in order to diagnose the environmental situation of the mining exploration areas, acquire data to support the assessment of the environmental impacts and risks at closing, establish measures to mitigate any risks posed by potential sources of contamination in order to stabilize any potential environmental liabilities and estimate the closing costs according to the phase of the plan. The Company’s policy is to revise this plan every three years; however, due to the Fundão dam
collapse, management revised its plan for closing operating plants in December 2015, in accordance with advice from external consultants.
The provision for asset retirement was based on current information, including the technology available and current prices. The provision made was discounted to present value at the discount rate of 11.4% per annum, based on the parameters adopted by the Company for economic and financial valuations.
21. OTHER LIABILITIESOther liabilities are comprised as follows:
parent company consolidated
2015 2014 2015 2014
current
Advance of overseas receivables - 97,344 - 97,344
Commission payable overseas to related parties (a) 44,099 28,993 - -
Demurrage payable (b) 9,813 17,144 10,012 17,144
Amounts payable (material/services) (c) 1,108 31,849 1,108 31,849
Consórcio UHE Guilman Amorim (Note 2) 2,947 2,704 2,947 2,704
Other 6,734 10,547 7,276 11,213
total current 64,701 188,581 21,343 160,254
noncurrent
REFIS – Tax recovery – financed taxes (d) 176,345 171,932 176,345 171,932
Unrealized profit on inventory (e) 98,777 - - -
Other 533 551 533 551
total noncurrent 275,655 172,483 176,878 172,483
(a) Agency commission paid to the subsidiary Samarco Europe for intermediating in iron ore sales.
(b) Amount owed by Samarco for the extra time used on unloading or loading the product at the port.

67
Financial Statements 2015
(c) Amounts referring to materials and goods acquired which were not recorded, as the respective note had not been issued by the supplier. The goods and services have been recorded under inventory and cost.
(d) On December 20, 2013 Samarco entered the REFIS IV Financing Program introduced by Law 12865/13. The first instalment was paid at the time of enrolment. The total amount financed was R$180,789, to be paid over 180 installments. The amount of R$176,345 refers to 143 long-term installments, restated by Selic. The current portions are presented in taxes payable, as shown in Note 18.
(e) The amount refers to unrealized profits on the inventory of Samarco Finance relating to iron ore pellets acquired from Samarco.
22. SHAREHOLDERS’ EQUITY
22.1 CapitalThe fully subscribed and paid-in share capital amounts to R$297,025, consisting of shares as follows:
number of shares
% of total
capital
BHP Billiton Brasil Ltda. 2,621,653 50
Vale S.A. 2,621,653 50
5,243,306 100
22.2 DividendsDividends are as follows:
parent company and consolidated
2015 2014
net income (loss) for the year (available for distribution) (5,836,517) 2,805,548
Minimum mandatory dividends - 25% - 701,387
Additional dividends proposed - 2,104,161
Total dividends proposed - 2,805,548
percentage over calculation base - 100%
parent company and consolidated
2015 2014
dividends payable at start of year 1,619,936 682,850
Additional dividends proposed 2,104,161 2,048,547
Minimum mandatory dividends - 25% - 701,387
Dividends paid (918,549) (1,812,848)
dividends payable at end of year 2,805,548 1,619,936
The Annual General Meeting held April 28, 2015 approved the distribution of additional dividends for FY 2014 of R$2,104,161 and mandatory dividends of R$701,387.
As a result of the collapse of the Fundão dam (Note 3), on December 18, 2015 a court decision was delivered, which amongst other determinations prevented the Company from paying out pending dividends from November 5,
2015. The Extraordinary General Meeting held December 31, 2015 accordingly resolved that the dividends declared at the above Meeting, but not yet paid, be reclassified to noncurrent.
The Company’s Bylaws state the mandatory dividends are equal to 25% of net income in due accordance with Law 6404/76.
The changes in dividends were as follows:

68
Financial Statements 2015
22.3 ReservesPursuant to article 189 of Law 6404/76, revenue reserves were transferred to accumulated losses in order to offset part of the loss generated in FY 2015.
22.4 Carrying value adjustments
parent company and consolidated
2015 2014
Inventory 146,613 67,752
Property, plant and equipment 10,307,803 3,874,492
Intangible assets 48,383 17,403
Cost 631,142 225,087
Idle capacity - 633
Exchange variance (7,703,814) (2,562,641)
Other 161,989 (6,294)
accumulated translation adjustments (a) 3,592,116 1,616,432
Remeasurement of retirement benefit (2,913) (1,312)
remeasurement of retirement benefit (b) (2,913) (1,312)
3,589,203 1,615,120
(a) These adjustments are made for exchange variance resulting from translating the balance sheet and statement of operations for the year from the functional currency (USD) to the reporting currency, the Real.
(b) Refers to the actuarial gains and losses, increase in liabilities, change in assumptions, earnings on the plan’s asset and change in the irrecoverable surplus (Note 16).
23. REVENUEThe Company operates in the mining sector, deriving its revenue from the sale of two types of iron ore pellets: PDR – Pellets for direct reduction and PBF – Pellets for the blast furnace. The surplus production of iron ore concentrate is sold as fines (pellet feed).
In 2015 the Company made overseas sales only, selling its products and subproducts in countries
parent company and consolidated
2015 2014
Pellets - Brazil - -
Pellets - Overseas 6,294,881 6,960,308
Fines - Overseas 134,398 199,970
Electricity 168,781 405,205
Other goods and services 40,041 35,852
total gross revenue 6,638,101 7,601,335
Sales taxes (20,687) (42,062)
Freight on sales (135,906) (22,409)
net revenue 6,481,508 7,536,864
of the Americas, Asia, Africa and Europe. In addition to product and byproduct revenue, in 2015 the Company obtained revenue from electricity surpluses and logistics services at the Port owned by it, such as renting boats, tug boats and land, in addition to selling unagglomerated iron ore, which were recorded under “other products and services”.

69
Financial Statements 2015
24. COST OF GOODS SOLDThe costs of goods sold is comprised as follows:
parent company and consolidated
2015 2014
Consumables (986,975) (1,137,790)
Electricity (345,712) (309,891)
Materials (266,281) (285,473)
Outsourced services (331,455) (422,648)
Personnel expenses (287,315) (327,008)
Depreciation and amortization (387,303) (331,125)
Currency translation (406,055) (118,765)
Electricity sales (71,003) (58,745)
CFEM (75,597) (47,557)
TFRM (23,332) (22,483)
Idle capacity (a) (169,104) -
Provision for reinforcing dam facilities (b) (171,613) -
Other (81,437) (106,571)
cost of goods sold (3,603,182) (3,168,056)
(a) Operations in the Mariana were suspended following the Fundão dam collapse, as described in Note 1. Operations of the Ubu plant in ES were also affected as a result. The fixed costs of both Samarco sites incurred until December 31, 2015 were therefore directly allocated to Cost of Idle Capacity.
Part of the balance recorded under Idle Capacity of R$25,902 refer to outsourced services to maintain and repair the Samarco facilities affected by the dam’s collapse.
(b) Provisions for the Fundão dam collapse, as described in Note 3 (i).

70
Financial Statements 2015
25. SELLING, GENERAL AND ADMINISTRATIVE EXPENSES
parent company consolidated
2015 2014 2015 2014
Selling expenses
Outsourced services (36,930) (44,463) (36,930) (44,463)
Personnel expenses (27,093) (24,832) (27,093) (24,832)
Depreciation and amortization (23,301) (20,198) (23,439) (20,404)
Auxiliary supplies (11,875) (12,635) (11,875) (12,635)
Sales commission (27,462) (28,566) - -
Shipment expenses (12,314) (35,143) (12,314) (35,143)
Allowance for doubtful accounts (27,896) (4,699) (27,881) (4,631)
Sales expenses of subsidiaries - - (17,594) (18,348)
General expenses (16,641) (12,471) (16,641) (12,471)
total (183,512) (183,007) (173,767) (172,927)
General and administrative expenses
Outsourced services (13,590) (13,629) (13,590) (13,629)
Personnel expenses (39,776) (43,439) (39,776) (43,439)
Depreciation and amortization (1,134) (1,086) (1,134) (1,086)
Auxiliary supplies (72) (140) (72) (140)
General expenses (3,802) (6,100) (3,802) (6,100)
total (58,374) (64,394) (58,374) (64,394)

71
Financial Statements 2015
26. OTHER NET OPERATING EXPENSESDetails of other net operating expenses are shown below:
parent company consolidated
2015 2014 2015 2014
Tax (22,347) (23,793) (22,347) (23,793)
Provision for ICMS losses - ES (252,548) (247,148) (252,548) (247,148)
Provisions for contingencies (Note 19) (11,935) 33,201 (11,935) 33,201
Investments and social projects (29,837) (22,894) (29,837) (22,894)
Employee profit sharing (a) (22,969) (95,846) (22,595) (98,667)
Provision for share-based payments (Note 16) 13,193 (12,438) 13,193 (12,438)
Research expenses (Note 13) (107,156) (104,570) (107,156) (104,570)
Mining rights (Note 11) (78,756) (115,408) (78,756) (115,408)
Lawyers and expert fees (4,209) (6,629) (4,209) (6,629)
Inventory adjustment (warehouse) (6,126) (6,814) (6,126) (6,814)
Sale of property, plant and equipment (1,358) (14,182) (1,358) (14,182)
Provision PPE write-off (b) (216,817) - (216,817) -
Provision for social, environmental and socioeconomic recuperation (b) (9,833,189) - (9,833,189) -
Expenses on social, environmental and socioeconomic recuperation (b) (144,350) - (144,350) -
Other, net (142,858) (79,967) (140,142) (70,377)
total (10,861,262) (696,488) (10,858,172) (689,719)
(a) Based on the variable remuneration policy approved by its Board of Directors, the Company grants Profit Sharing to its employees, subject to the performance of goals, the evaluation of results and the achievement of specific targets, which are established and agreed at the beginning of each year.
(b) Loss on property, plant and equipment, provisions and expenses related to the collapse of Fundão dam, as described in Note 3.

72
Financial Statements 2015
27. FINANCE RESULTThe Company’s financial result (consolidated and parent company) is comprised as follows:
Financial revenue 2015 2014
Yields on judicial deposits (a) 71,030 148,043
Yields on government securities received - 24,430
Earnings on investments 12,218 3,635
Discounts obtained 13 105
Other financial revenue 4,286 9,869
consolidated financial information 87,547 186,082
Revenue of subsidiaries (134) (110)
Finance income - parent company 87,413 185,972
Finance expenses 2015 2014
Arrears and tax fines (b) (35,831) (62,575)
Charges on loans and financing (589,949) (289,076)
Interest on contingencies (a) (7,053) (45,288)
Financial expenses on exchange contract - -
Commission and bank interest (26,297) (27,763)
PIS and COFINS on financial revenue (c) (36,454) -
Other financial expenses (42,674) (17,072)
Financial expenses - consolidated (738,258) (441,774)
Expenses of subsidiaries 22 46
Financial expenses - parent company (738,236) (441,728)
(a) Refers to the restatement of judicial deposits and provisions for contingencies in respect of tax, civil, labor and envi-ronmental proceedings.
(b) Refers to arrears and tax interest on ICMS - Minas Gerais, REFIS, TFRM and other.
(c) Refers to PIS and COFINS taxes on financial revenue as per normative amendments introduced by Decree 8451.

73
Financial Statements 2015
The balance of exchange variance is comprised as follows:
exchange variance 2015 2014
Cash (964) 8,029
Trade receivables (5,434) 69
Recoverable taxes (907,395) (239,709)
Court deposits (338,877) (99,142)
Trade payables 44,350 8,627
Payroll, provisions and social contributions 17,157 7,664
Taxes payable 9,522 (843)
Dividends 2,040,739 388,851
Contingency 13,651 4,144
Deferred income tax 135,947 30,511
Others 121,996 53,188
net exchange variance - consolidated 1,130,692 161,389
Net exchange variance of subsidiaries 270 274
net exchange variance - parent company 1,130,962 161,663
28. INCOME TAX The Company is subject to income tax at the rate of 18% on income derived from subsidized exportations and 25% on the unsubsidized portion.
28.1 Income tax payableThe changes in income tax payable are as follows:
parent company consolidated
2015 2014 2015 2014
Balance at beginning of year - - 68 -
Provisions in the period - 439,537 (728) 440,409
Payments - (216,448) (710) (217,252)
Offsetting with PIS and COFINS credits - (193,908) - (193,908)
Offsetting of recoverable tax (prepayment) - 27,880 - 27,880
Offsetting of the negative balance from prior years - (45,373) - (45,373)
Income tax payable from prior years 6,571 - 6,571 -
Prior year IRPJ adjustment - (11,688) - (11,688)
Balance at end of year 6,571 - 6,657 68

74
Financial Statements 2015
28.2 Deferred income taxThe Company has deferred income tax recorded under noncurrent assets on temporarily non-deductible provisions, at the rates of 18% and 25%, according to the nature of each provision as adjustment of the net income from subsidized exports or adjustment of taxable income, respectively.
note 2015 2014
Amounts recorded at the rate of: 25% 18% total 25% 18% total
Provision for ICMS losses - ES and MG 8 376,220 - 376,220 313,083 - 313,083
Provision for price rectifications 6 31,166 - 31,166 92,185 - 92,185
Provision for depreciation, write-off and other - Property, plant and equipment
12 54,204 - 54,204 277 - 277
Provision for profit sharing 17 - - - 15,313 - 15,313
Provision for civil claims 19 22,534 - 22,534 19,393 - 19,393
Tax proceedings 19 18,518 956 19,474 21,468 936 22,404
Provision for mining rights 20 28,055 - 28,055 17,552 - 17,552
Provision for social, environmental and socioeconomic recuperation
20 2,501,201 - 2,501,201 - - -
Provision for asset retirement obligation 20 27,984 - 27,984 19,454 - 19,454
Provision for unrealized profits 21 24,694 - 24,694 - - -
Tax loss 572,511 - 572,511 - - -
Others 31,244 31 31,275 25,796 30 25,826
total consolidated assets 3,688,331 987 3,689,318 524,521 966 525,487
Conversion from the functional currency - (1,891,139) (1,891,139) - (714,276) (714,276)
Depreciation for tax purposes - (385,441) (385,441) - (287,765) (287,765)
Financial revenue on judicial deposits (39,291) - (39,291) (35,947) - (35,947)
Remeasurement of retirement benefit obligation - (292) (292) - (241) (241)
total consolidated liabilities (39,291) (2,276,872) (2,316,163) (35,947) (1,002,282) (1,038,229)
consolidated net total 3,649,040 (2,275,885) 1,373,155 488,574 (1,001,316) (512,742)
Provisions of subsidiaries (131) - (131) (29) - (29)
parent company net total 3,648,909 (2,275,885) 1,373,024 488,545 (1,001,316) (512,771)
28.3 Deferred income tax on nonmonetary itemsThe financial statements have been translated from the functional currency (USD) to the presentation currency (R$). The base for calculating income tax and assets and liabilities is denominated in Brazilian reais (R$). The change in the exchange rate could therefore have a significant effect on the income tax expenses, especially on nonmonetary assets.
Net deferred income tax:
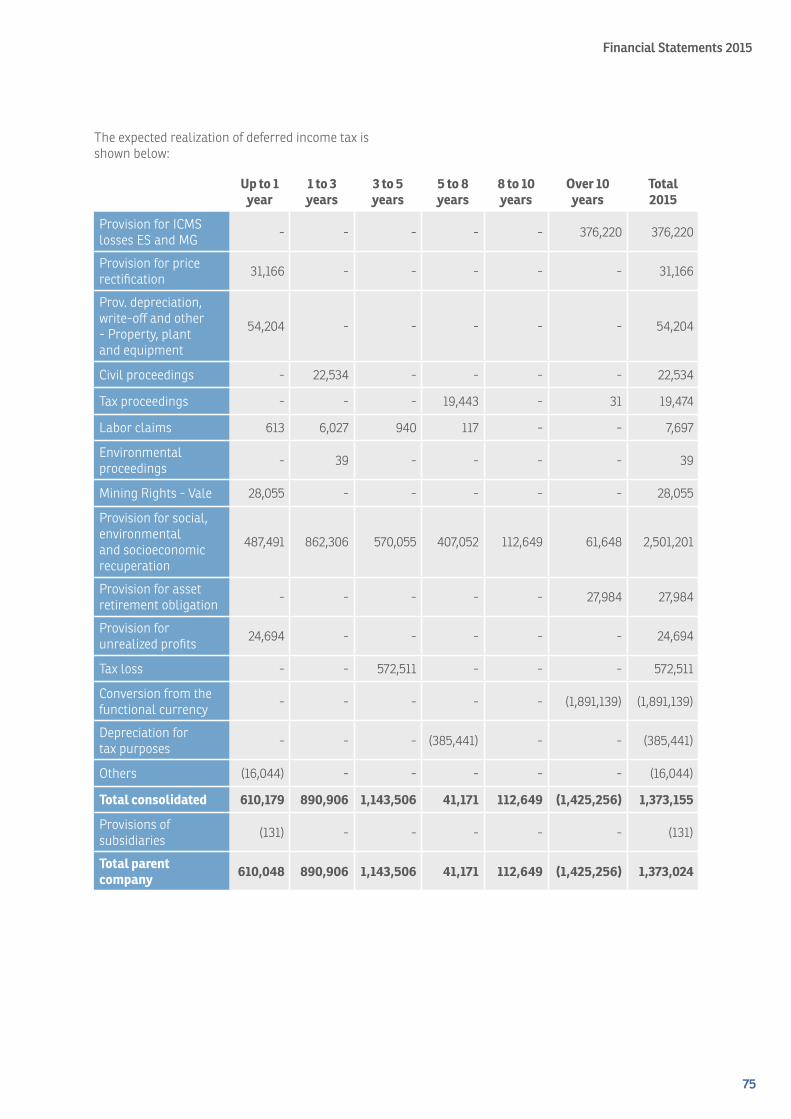
75
Financial Statements 2015
The expected realization of deferred income tax is shown below:
up to 1 year
1 to 3 years
3 to 5 years
5 to 8 years
8 to 10 years
over 10 years
total 2015
Provision for ICMS losses ES and MG - - - - - 376,220 376,220
Provision for price rectification 31,166 - - - - - 31,166
Prov. depreciation, write-off and other - Property, plant and equipment
54,204 - - - - - 54,204
Civil proceedings - 22,534 - - - - 22,534
Tax proceedings - - - 19,443 - 31 19,474
Labor claims 613 6,027 940 117 - - 7,697
Environmental proceedings - 39 - - - - 39
Mining Rights - Vale 28,055 - - - - - 28,055
Provision for social, environmental and socioeconomic recuperation
487,491 862,306 570,055 407,052 112,649 61,648 2,501,201
Provision for asset retirement obligation - - - - - 27,984 27,984
Provision for unrealized profits 24,694 - - - - - 24,694
Tax loss - - 572,511 - - - 572,511
Conversion from the functional currency - - - - - (1,891,139) (1,891,139)
Depreciation for tax purposes - - - (385,441) - - (385,441)
Others (16,044) - - - - - (16,044)
total consolidated 610,179 890,906 1,143,506 41,171 112,649 (1,425,256) 1,373,155
Provisions of subsidiaries (131) - - - - - (131)
total parent company 610,048 890,906 1,143,506 41,171 112,649 (1,425,256) 1,373,024

76
Financial Statements 2015
28.4 Income tax in the income statement
parent company consolidated
2015 2014 2015 2014
net income (loss) before taxation (7,734,013) 3,346,593 (7,732,006) 3,347,465
Permanent differences:
Equity in the results of subsidiaries (10,670) (15,767) - -
Overseas profits 12,362 8,611 12,362 8,611
Nondeductible tax fines 605 8,973 605 8,973
Nondeductible donations 13,816 10,729 13,816 10,729
Rate differences 18% to 25% 373,994 - 373,994 -
Other additions (exclusions) 68,900 33,293 56,224 17,526
Functional currency effects - art. 62 of Law 12973/2014 (4,600,531) (1,167,176) (4,600,531) (1,167,176)
Remeasurement of retirement benefit obligation - (1,312) - (1,312)
Profit deriving from subsidized exports - (2,116,300) - (2,116,300)
calculation basis (11,875,537) 107,644 (11,875,536) 108,516
Statutory rate 25% 25% 25% 25%
income tax calculated (2,968,884) 26,911 (2,968,884) 27,129
Income tax on subsidized exports 18% - 380,934 - 380,934
Tax incentive (PAT) - (9,557) - (9,557)
Deferred income tax on tax depreciation (93,534) (114,170) (93,534) (114,170)
Tax paid by companies overseas - - 2,007 872
Other adjustments (11,701) 11,687 (11,701) 11,469
Deferred income tax adjustment (240) - (240) -
Deferred income tax on translation 1,176,863 245,240 1,176,863 245,240
income tax in the statement of operations (1,897,496) 541,045 (1,895,489) 541,917
parent company consolidated
2015 2014 2015 2014
Current income tax 11,701 (439,537) 10,973 (440,409)
Tax loss 572,511 - 572,511 -
Deferred income tax on temporary differences 2,490,147 143,732 2,488,868 143,732
Deferred income tax on nonmonetary items (1,176,863) (245,240) (1,176,863) (245,240)
current and deferred income tax expenses 1,897,496 (541,045) 1,895,489 (541,917)
See below the breakdown of the income tax revenue (expense) segregated between current and deferred:

77
Financial Statements 2015
28.5 Law 12973/14The Company adopted early the effects of Law 12973/14 for 2014. Subaccounts were opened in 2015 to record the positive and negative differences between the assets measured according to corporate legislation and the amounts measured according to the accounting criteria in force as of December 31, 2007 (RTT), so that the tax effect of these adjustments arises as these assets are realized.
29. COMMITMENTSThe Company is party to long-term contracts for the supply of raw materials and services and the acquisition of real estate, as shown below:
up to 1 year
1 to 2 years
2 to3 years
3 to5 years
over5 years
total2015
Capital expenditure for expansion and overhaul of property, plant and equipment
148,779 - - - - 148,779
Services and other 466,523 260,995 117,684 26,158 936 872,296
Iron ore acquisition 131,456 271,446 271,282 575,274 609,650 1,859,108
Supply of power and raw materials 600,006 628,973 399,759 332,521 804,146 2,765,405
Freight and logistics costs 21,525 - - - - 21,525
1,368,289 1,161,414 788,725 933,953 1,414,732 5,667,113
The above shows the commitments undertaken by Samarco consisting of long-term contractual obligations to suppliers to renew and expand fixed assets, in addition to the provision of various services to maintain the manufacturing and administrative facilities, to acquire iron ore from third parties, to supply energy, consumables and costs on cargo chartering.
Due to the collapse of Fundão dam, the Company implemented a number of initiatives in relation to its commitments, as described in note 3.
30. FINANCIAL INSTRUMENTS
30.1 Financial risk managementThe Company has financial instruments inherent in its operations, represented by cash and cash equivalents, restricted marketable securities, trade accounts receivable, trade payables, and loans and financing.
The management of these instruments is performed through operating strategies and internal controls, aimed at liquidity, profitability and security.
In the case of financial instruments used for hedging purposes these are contracted through a periodic analysis of the risk exposure that management intends to mitigate (exchange, interest rate etc.) and in accordance with the policies and strategies determined by Company management, approved by the strategy and finances committee.
The Company and its subsidiaries do not invest in derivatives or any other risky assets on a speculative basis.

78
Financial Statements 2015
30.2 Financial instruments by categoryThe financial instruments have been classified as follows:
classification
assets
Cash and cash equivalents Financial assets at fair value through profit or loss
Restricted short-term investments Loans and receivables
Accounts receivable Loans and receivables
liabilities
Trade payables Liabilities measured at amortized cost
Loans and financing Liabilities measured at amortized cost
Financial assets consist of:
(a) Cash, cash equivalents, restricted short-term investments
parent company consolidated
2015 2014 2015 2014
Cash and cash equivalents 1,799,138 2,090,026 1,822,801 2,117,649
Restricted short-term investments 82,785 - 82,811 20
1,881,923 2,090,026 1,905,612 2,117,669
parent company consolidated
2015 2014 2015 2014
Accounts receivable 362,384 644,192 190,657 637,264
• Cashandcashequivalents Banks - Funds available in current accounts
maintained in Brazil and abroad.
Floating Fixed Fund – Petty funds (no yield) intended for US$advances required on international trips made by employees.
Marketable Securities – Funds invested in conservative, highly liquid bank products. Investment Funds.
•Restrictedcashkeptforuseasaresultof court proceedings associated with the Fundão dam collapse, as described in Note 3(a).
(b) Accounts receivable
Funds to be received by the Company, the balance of which represents market value.

79
Financial Statements 2015
Financial liabilities consist of loans and financing. These funding operations are intended to support the Company’s routine activities and investments.
The geographical distribution by region of the Company’s loans and financings is shown in the table below:
parent company and consolidated
2015 2014
Brazil 1.08% 1.47%
USA 85.32% 84.69%
Japan 13.60% 13.84%
parent company and consolidated
2015 2014
Middle East / Africa 21% 23%
China 31% 17%
Asia (except China) 15% 22%
Europe 19% 21%
Americas 14% 17%
30.3 Financial risk factorsThe Company’s activities expose it to a variety of financial risks: credit risk, market risk (including price risk, interest rate risk, exchange rate risk) and liquidity risk, as follows:
(a) credit risk
The Company’s sales policy is governed by the credit policies determined by management, which are aimed at minimizing any losses resulting from default by clients. The Company conducts credit analyses on its clients every year, in order to mitigate risks of nonpayment for outstanding receivables and future sales. Client payment capacity is also evaluated during the credit analysis. The Company presently offers its clients the following means of payment: letter of credit, cash payment or credit sale in current account.
Gross sales revenue amounted to R$6,638,101 in 2015 (R$7,601,335 in 2014), while the consolidated allowance for doubtful accounts made in 2015 was R$33,130 (R$5,249 in 2014). 13.71% of the outstanding accounts receivable is secured by a letter of credit.
With respect to financial institutions, the Company and its subsidiaries only carry out operations with first-class institutions ranked as low risk by rating agencies.
The receivables’ exposure to the credit risk by geographical distribution is minimal because they are dispersed across the regions, as shown in the table below:
(b) market risk
(i) Price risk
The price of the Company’s principal product, iron ore pellets, is set through periodic negotiations (primarily quarterly and monthly) with customers. The level of prices negotiated is directly impacted by global supply and demand for iron ore.
(ii) Interest rate risk
This arises from the possibility of the Company and its subsidiaries sustaining unforeseen impacts arising from fluctuations in interest rates on their financial assets and liabilities, and inflation. Most of the Company’s loans and financings as of December 31, 2015 is denominated in United States Dollars, with approximately R$8,524,012 bearing interest at fixed rates and R$6,383,367 (R$5,791,296 e R$5,611,283 in 2014, respectively) at floating rates corresponding to the variance in the LIBOR plus a contractual spread. The Company has no hedge against LIBOR variance, in accordance with its internal and its shareholders’ guidelines. Interest-rate risk also derives from the small amount of debt referenced to the IGP-DI price index and short-term investments referenced to the Selic base interest rate.

80
Financial Statements 2015
(iii) Exchange rate risk
This risk results from the possibility of fluctuations in the exchange rates for the foreign currencies (other than the functional currency) used by the Company to acquire domestic consumables and/or services, pay taxes, dividends, etc. The Company has the following assets and liabilities, in Reais, which can affect its results due to exchange rate variations:
(a) asset exposure consolidated (b) liability exposure consolidated
current assets 2015 2014 current liabilities 2015 2014
Cash and cash equivalents 817 7,382 Trade payables (110,623) (337,517)
Restricted short-term investments 82,811 20 Loans and financing
and charges (25,713) (14,768)
Domestic accounts receivable 6,519 3,332 Salaries and payroll
contributions (37,336) (113,547)
Recoverable taxes 249,664 232,473 Taxes payable (66,866) (62,380)
Prepaid expenses 12,282 9,995 Provision for income tax (6,657) (68)
Other assets 133,071 59,262 Dividends - (1,619,936)
Other provisions (1,975,145) (112,712)
Other liabilities (11,331) (143,110)
noncurrent assets noncurrent liabilities
Court deposits 1,402,178 706,287 Loans and financing and charges (139,808) (158,296)
Recoverable taxes 49,222 53,477 Provisions for contingencies (139,565) (126,678)
Deferred income tax 1,373,155 - Deferred income tax - (512,742)
Other assets 35,475 36,952 Dividends (2,805,548) -
Other provisions (8,551,899) (367,043)
Other liabilities (176,878) (172,483)
3,345,194 1,109,180 (14,047,369) (3,741,280)

81
Financial Statements 2015
(c) exposure not recorded in the balance sheet:
2015 2014 2015 2014
tax proceedings civil claims
Chance of defeat remote (2,178,659) (2,024,065) Chance of defeat remote (3,287) (13,601)
Chance of defeat possible (5,704,382) (5,549,793) Chance of defeat possible (64,064) (56,638)
labor claims environmental proceedings
Chance of defeat remote (7,564) (8,614) Chance of defeat remote (54) (45)
Chance of defeat possible (56,344) (40,335) Chance of defeat possible (62,893) (55,453)
Summary of the exchange rate exposure 2015 2014
Exposure recorded in the balance sheet (a + b ) (10,702,175) (2,632,100)
Exposure not recorded in the balance sheet (c) (8,077,247) (7,748,544)
total net exposure (18,779,422) (10,380,644)
consolidated
2015
amount up to 12 months
1 – 10 years
Trade payables 116,197 116,197
Loans and financing 15,070,162 328,243 14,741,919
Financial charges payable
109,128 108,388 740
The Company does not hedge its assets and liabilities in Reais, in accordance with its internal guidelines. Foreign currency assets and liabilities are translated to the functional currency at the exchange rate as of the balance sheet date, with US$1.00 being equal to R$3.9042 as of December 31, 2015 and US$1.00 equal to R$2.6556 as of December 31, 2014.
(c) liquidity risk
The liquidity risk arises if the Company does not have sufficient funds to honor its obligations on time.
Company Management believes it could face challenges in its liquidity risk management due to the suspension of production operations after the collapse of the Fundão dam (Note 3).
To mitigate liquidity risks the Company is looking into alternatives to obtain short and medium-term credit facilities to provide additional liquidity in order to enable it to honor its daily financial obligations in the event. However, according to the TTAC, Vale and BHP are obliged at the proportion of 50% each to cover the contributions Samarco is obliged to make under the settlement, if the Company does not have sufficient funds to honor its obligations.
The carrying amounts of the cash flows from financial liabilities are:

82
Financial Statements 2015
The value of the undiscounted cash flows are as follows:
Financial liabilities
carrying value
contractual cash flow
2015 2016 2017 2018 2019- 2024
0 - 6 months
6- 12 months
Trade payables 116,197 116,197 115,021 1,176 - - - -
Loans and financing 15,070,162 15,070,162 162,215 166,028 324,315 4,259,519 511,488 9,646,597
Financial charges 109,128 109,128 108,388 - - 740 - -
total 15,295,487 15,295,487 385,624 165,977 324,718 4,261,083 511,488 9,646,597
30.4 Bank suretiesThe Company has bank sureties issued for an indefinite term to guarantee the suspension of amounts demanded under tax enforcements amounting to a restated total as of December 31, 2015 of R$1,852,771. The total amount originally contracted is R$1,146,433.
Bank amount secured restated amount index term
Bradesco 607,850 860,299 Selic Indefinite
Bradesco 53,978 74,056 VRTE Indefinite
Votorantim 100,947 328,056 Selic Indefinite
Itaú 279,743 473,197 Selic Indefinite
Itaú 63,971 72,176 IPCA-E Indefinite
Itaú 13,319 - - Determined:
Citibank 371 - - Determined:
Safra 26,254 44,987 INPC Indefinite
total 1,146,433 1,852,771 - -
The Company also has fixed-term sureties used to guarantee the payment of electricity purchases and full performance of obligations required in the transmission system usage agreements amounting to a restated total as of December 31, 2015 of R$13,690; which is not indexed.
Company management does not expect any loss on these guarantees.
30.5 Capital management The Company administers its capital with a view to safeguarding liquidity, managing the capital cost
so as to minimize it, while yielding sustainable returns for shareholders and benefits for other stakeholders.
In order to maintain or adjust the Company’s capital structure, management constantly monitors its debt levels, aligned with its dividends policy, which in turn follows shareholder guidelines. The Company and its subsidiaries permanently monitor and manage their level of financial leverage in accordance with market standards, their strategy and financial covenants established in loans and financing contracts.

83
Financial Statements 2015
The Net Debt / EBITDA index denotes net debt in comparison with the Company’s cash generation, as measured by EBITDA. Net debt, in turn, corresponds to total loans and financing (including short- and long-term loans, as shown in the consolidated balance sheet), minus cash and cash equivalents.
In 2015, the Company’s strategy was to change its Net Debt/ EBITDA limit at financial institutions from 3:1 to 4:1 in all financial contracts. As of December 31, 2015 this ratio was 3,05:1 (Note 15).
We also show below the calculation of the financial leverage index considering net debt as a percentage of total capital. Total capital is calculated by adding the shareholders’ equity, as demonstrated in the consolidated balance sheet, to net debt:
2015 2014
Total loans and financing 15,179,290 11,648,170
(-) Cash, cash equivalents, restricted short-term investments (1,905,612) (2,117,669)
Net debt 13,273,678 9,530,501
Total shareholders’ equity (1,653,264) 4,313,331
Total capital 11,620,414 13,843,832
Financial leverage index 114% 69%
An analysis of these indicators is used to determine the working capital management so as to maintain the natural leverage of the Company and its subsidiaries at levels equal to or less than the leverage index considered adequate by management.
30.6 Fair value hierarchyThe Company considers fair value as the price that would be obtained on the sale of an asset or paid to transfer a liability in an arm’s length transaction on the measurement date (sale price). The Company uses market data or assumptions that market participants would use to price the asset and liability, including assumptions about the risks in general and risks inherent to the inputs used in the valuation method. The Company mainly applies the market approach to measure fair value and makes every effort to use the best information available. The Company consequently uses evaluation techniques to maximize the use of observable inputs and minimize the use of unobservable inputs. The Company can classify the fair value balances based on observable inputs. The fair value
hierarchy is used to prioritize the inputs used to measure fair value. The three levels of fair value hierarchy are as follows:
• Level1.Activemarket:quotedprice-Afinancialinstrument is deemed to be quoted in an active market if the quoted prices are readily and regularly disclosed by a stock exchange or organized over-the-counter market by operators, brokers or market association, by entities with disclosed prices by regulatory agencies, providing that these prices represent market transactions which take place frequently between independent parties, on an arm’s length basis.
•Level2.Noactivemarket:valuationmethod-Avaluation/pricing method should be used to determine the fair value of an instrument which is not traded in an active market. Other criteria like data of the current fair value of another similar instrument, discounted cash flow analyses and options pricing models can be used. The valuation method aims to establish what the transaction price at the measurement date would be in an arm’s length transaction.

84
Financial Statements 2015
•Level3.Noactivemarket:equityinstruments-Fair value of equity interests/equity instruments not quoted in an active market and underlying derivatives which should be settled by delivering unquoted equity instruments.
Balance in 2015
Fair value hierarchy
level 1 level 2 level 3
Short-term investments in cash and cash equivalents 1,820,657 - 1,820,657 -
30.7 Sensitivity analysisThe Company’s financial instruments consist of cash and cash equivalents restricted short-term investments, accounts receivable, accounts payable and loans and financing.
The main risks facing the Company’s operations are posed by changes in the Libor rate for long-term financing, IGP-DI for domestic operations and Selic for short-term investments.
In order to identify the sensitivity of the index in the short-term investments to which
risk probable scenario i Scenario ii Scenario iii
Short-term investments available in Brazil Selic 11.65% a.a. 8.74% a.a. 5.83% a.a.
Yields as of December 31, 2015 - 71 69 66
Financial investments abroad Fed Funds 0.50% a.a. 0.38%a.a. 0.25%a.a.
Yields as of December 31, 2015 - 32 31 31
risk probable scenario i Scenario ii Scenario iii
Overseas loans and financing Libor 0.8462% a.a. 1.0577% a.a. 1.2692% a.a.
Interest as of December 31, 2015 54,913 68,641 82,370
Domestic loans and financing IGP-DI 10.61% a.a. 13.27% a.a. 15.92% a.a.
Interest as of December 31, 2015 1,258 1,572 1,886
the Company was exposed as of December 31, 2015, three different scenarios were determined. Based on market projections and the official interest rate (Selic) in force at said date, the Company thought it was reasonable to use the rate of 11.65% p.a. of Selic for the sensitivity analysis, a rate defined as the probable scenario. Based on the rate established for the probable scenario, two more scenarios were prepared (II and III), with a negative variance of 25% and 50% respectively.
The sensitivity analysis was simulated over the previous 12 months (amounts corresponding to the yields obtained in the period, based on the rates used in the evaluated scenarios as of December 31, 2015).
In order to identify the sensitivity of the index in the long-term investments to which the Company was exposed as of December
31, 2015, three different scenarios were determined, the twelve-month to cover the following 12 months. Based on the accumulated IGP-DI price index and Libor rate in force for 12 months, in force at December 31, 2015, the Company determined a probable scenario and two other additional scenarios based on the first (II and III), with increases of 25% and 50% respectively.

85
Financial Statements 2015
Amounts corresponding to the indexes over the total long-term debt in USD, indexed to floating interest rates, as of December 31, 2015, with repayment at the end of the period only (effect of simulation).
In order to identify the sensitivity of the changes in foreign currency to which the Company was exposed as of December 31, 2015, three different scenarios were determined, where scenarios II and III entail an exchange-rate decrease of 25% and 50% respectively, based on the first, called probable scenario I.
Financial liabilities exposure (r$)
Scenario probable i
(uSd)
Scenario ii (uSd)
Scenario iii(uSd)
Exchange rate - (Risk - R$ / USD) - 3.9042 2.9282 1.9521
Total Assets 3,345,194 856,819 1,142,406 1,713,639
Total liabilities (14,047,369) (3,598,015) (4,797,271) (7,196,029)
net exposure in reais recorded in the balance sheet (10,702,175) (2,741,195) (3,654,865) (5,482,391)
31. CREDIT QUALITY OF FINANCIAL ASSETSThe credit quality of the financial assets is evaluated by referring to the independent credit ratings (if applicable), or historical information about the levels of counterparty default by counterparties.
31.1 Cash and cash equivalents
parent company consolidated
2015 2014 2015 2014
current account and short-term bank deposits
Investment Grade 1,799,138 2,090,026 1,822,801 2,117,649
Noninvestment Grade - - - -
1,799,138 2,090,026 1,822,801 2,117,649
This category includes current accounts and short-term investments at banks.

86
Financial Statements 2015
31.2 Trade accounts receivable
parent company consolidated
2015 2014 2015 2014
counterparties with independent credit rating (S&p)
Investment Grade 124,264 283,813 124,290 283,812
Noninvestment Grade 126,697 302,450 126,696 294,901
counterparties without independent credit rating (S&p)
Group 1 - clients with relationship of up to 5 years 21,188 122,577 19,931 122,071
Group 2 - clients with more than 5 years without history of default 37,238 226,291 40,000 227,412
Group 3 - clients with more than 5 years with little history of default 31,017 79,681 31,017 79,723
Group 4 - domestic clients not purchasing iron ore 6,519 3,332 6,519 3,332
Transfer of inventory between companies of the same business group. 173,237 - - -
520,160 1,018,144 348,453 1,011,251
32. INSURANCE COVERAGE In order to mitigate risks and given the nature of its operations, the Company takes out several different types of insurance policies. The policies are in line with the risk management policy and are similar to the policies taken out by other companies in the same line of business as Samarco. The coverage of these policies includes: operational risk of material damages and lost earnings, national transportation, international transportation, life and personal accident insurance, vehicle fleet, civil liability insurance, engineering risks, export credit, surety bonds and others.
The Civil Liability policy was in force until November 12, 2015 .It was renewed until February 10, 2017 with the elimination of the coverage for (i) sudden pollution as per the regulations of SUSEP, a Private Insurance Regulator, and (ii) dams, due to the recent incident occurred, where the structures are in the process of being recovered.
The operational risk insurance is contracted in foreign currency (USD) and is in force until March 31, 2016. The covered assets amounted to USD 6,599,646 (R$25,766,336) as of December 31, 2015 (R$17,160,642 in 2014) and the maximum value at risk declared for business interruption was USD 1,172,387 (R$4,577,235) in the year (R$1,859,340 in 2014).Samarco is still in negotiations with the
market with respect to the renewal of the Property Insurance. 33. SUBSEQUENT EVENT
a) terms of transaction and adjustment of conductBetween the end of the year - December 31, 2015 - and the date the conclusion of the statement was approved, Samarco together with its with its shareholders BHP Billiton Brasil Ltda. and VALE S.A., signed a Terms of Transaction and Adjustment of Conduct (“TTAC”) on March 02, 2016, as disclosed in Note 3.
b) administrative proceedings - cSllOn April 05th 2016, the 3rd tier of the Administrative Court (CARF) ruled that Samarco is subject to the payment of CSLL tax for calendar years 2007 and 2008. The Federal Supreme Court (STF) has also recognized the general repercussion effect over all the ongoing CSLL judicial disputes and a decision in this leading case could impact the final outcome of Samarco’s ongoing litigation due to its binding effects. The decision from 3rd tier of CARF is still pending formally publication. At December 31, 2015 this matter is classified as a possible contingency, as disclosed in Note 19.

87
Financial Statements 2015
SERVING MEMBERSBryan QuinnFlávio BulcãoSilmar SilvaStephen Potter
ALTERNATESJuan MerliniLeonardo Eyer HarrisSérgio Consoli FernandesPieter Le Roux
EXECUTIVE BOARDRoberto Lúcio Nunes de Carvalho CEO (acting)Commercial Officer
Eduardo Bahia Martins Costa CFO and Supplies Officer
Leonardo Sarlo WilkenStrategy and Planning Officer
Maury de Souza Júnior Project and Eco-efficiency Operations and Infrastructure Officer (acting)
ACCOUNTANT RESPONSIBLELucas Brandão Filho Accountant - CRC-MG 046442/O – T ES
Samarco mineraÇÃo S.a.Board oF directorS


![RBC Energy Conference 6-07.ppt [Read-Only]...RBC Capital Markets Energy Conference June 5-6, 2007 Page 2 Forward-Looking Statements Statements made by representatives of Legacy Reserves](https://img.pdfslide.net/doc/110x75/5ec61b438a96b85c730a9fb0/rbc-energy-conference-6-07ppt-read-only-rbc-capital-markets-energy-conference.jpg)