Embed Size (px)
Citation preview

1
Preliminary Version
Comments Welcome
FINANCIAL STRUCTURE AND ECONOMIC ACTIVITY IN MEXICO
Martina Copelman
Center of Analysis and Economic Research, ITAM
January 2000
Abstract
The effectiveness with which a country’s financial system functions to channelsavings into productive activities has an important effect on economic growth. The waysavings get directed into productive activities depends crucially on a country’s financialinstitutions and their effectiveness. The last two decades have been ones of tremendouschange in Mexico’s financial structure with a deep impact on economic activity andgrowth. The aim of this paper is twofold: first, to describe the developments that havetranspired in Mexico’s financial structure over the last two decades. And second, toanalyze how the increase in credit to the private sector brought about by thesemacroeconomic and financial developments affected output and investment in differentsectors and therefore, growth in the Mexican economy. We use the Vector ErrorCorrection methodology to show that an increase in the availability of credit has arelatively larger effect on the output of those sectors that are a priori considered to bemore liquidity constrained, such as manufactures, durables, construction, andinvestment in the construction sector.
2
I. Introduction
The effectiveness with which a country’s financial system functions to channel
savings into productive activities has an important effect on economic growth. The way
savings get directed into productive activities depends crucially on a country’s financial
institutions and their effectiveness. The last two decades have been ones of tremendous
change in Mexico’s financial structure with a deep impact on the level of investment
and growth. Mexico has become a country with modern financial institutions that
increasingly play a more important role in contributing to the country’s growth. In
1960, credit by all types of financial institutions to the private sector was only 20% of
GDP, but by 1994 this same ratio was 36%, indicating that the financial system has
become more important in financing the private sector’s projects. Moreover, not only
has the importance of the financial system grown, but also its structure has changed
dramatically over the last two decades. During this time, the stock market and other
non-bank financial institutions have gained ground over commercial banks. For
example, the ratio of bank assets to stock market capitalization went from 9 in the early
1980s to about 0.4 in 1997. In addition, the role of the Central Bank has diminished
greatly, commercial banks’ assets relative to the assets of the Central Bank grew from
around 50% in the early 1980s to 108% in 1997.
These changes in Mexico’s financial structure, although partially interrupted and
reversed due to the severity of the tequila crisis of 1994, have essentially changed
Mexico from a relatively more bank-based system to a market-based system since the
late 1980s. The aim of this paper is twofold: first, to describe the developments that
have transpired in Mexico’s financial structure over the last two decades. And second,
to analyze how the increase in credit to the private sector brought about by these
developments affected output and investment in different sectors and therefore, growth
in the Mexican economy.
The paper is arranged as follows. Section II discusses the macroeconomic
environment and the financial system from 1982-1999, concentrating on the financial
liberalization that took place during the period and how it contributed to the drastic
changes in financial structure. Beginning in 1988, Mexico underwent a series of
economic and financial regulatory changes that considerably altered the way financial
markets functioned and their role in economic growth, changing from a highly repressed
financial system to one where market forces play a dominant role. Section III describes

3
the changes in Mexico’s financial structure and its evolution over the period, paying
close attention to the changing role of banks versus other financial intermediaries and
the stock market as sources of financing for economic agents. In particular, we focus on
measures of relative size, activity and efficiency of each of these sectors following the
criteria proposed by Demirguc-Kunt and Levine (1999).
The changes in financial structure brought about in part by the financial
liberalization that took place during the last two decades have led to a sharp increase in
the access to credit by all types of firms in the Mexican economy. For small and
medium sized firms, who depend almost exclusively on domestic credit (bank or
otherwise), the previous lack of credit available either in price or quantity had serious
effects on their capacity to produce and expand output and or investment when other
conditions warranted it. Since a large portion of the firms in Mexico fall under this
category, it is reasonable to assume that higher capital accumulation and production
levels following these financial reforms would eventually lead to higher growth.
Section IV provides a brief survey of the literature on the relationship between
growth and investment and changes in financial structure or financial liberalization in
Mexico, particularly that which concentrates on using micro data at the firm level.
In Section V, the empirical results of the paper are presented. We use a Vector
Auto Correction (VEC) methodology to examine whether changes in the volume of
credit have real effects on the economy. Since financial repression and its subsequent
liberalization does not have a uniform effect on all firms in the economy, we separate
the sectors which a priori have a higher likelihood of being dependent on bank finance
and for whom financial liberalization should have a larger impact. The results show
that regulatory and macro developments in the financial system did have a significant
effect on economic activity, through their effect on the availability of credit; both in
terms of price and quantity. This is particularly clear when looking at the reaction of
those sectors that are previously relatively more credit constrained such as construction,
manufactures and durables. Section VI concludes.
II. A History of Mexico and its Financial System.
In this section, we briefly describe the history of Mexico’s macroeconomic
environment and the evolution of its financial system. We divide the section in two

4
parts; section II.1 examines the macroeconomic history from 1982 to 1999 and section
II.2 looks at the evolution of the financial system during the same period taking
particular care to point out the changes in regulation and laws that had a significant
effect on both how the financial system intermediated resources and changes in its
structure.
II.1 The Macroeconomic Environment 1982-1999
The 1980s have been called “the lost decade” for many countries in Latin
America. For Mexico, the rapid increase in government expenditures during the late
70s led to unsustainable fiscal and current account deficits and large amounts of foreign
debt. The era of easy growth came to a sudden halt with the rise in world interest rates
and a sharp fall in oil prices. The run on the peso and consequently the run down of
foreign exchange reserves led Mexico to default on its foreign debt and to devalue the
peso by 68% in 1982.
The debt crisis of 1982 had a severe effect on the economy and on economic
policy for many years to come. As a result of the crisis, GDP fell by 5.3% and real
wages declined by 32% between 1982 and 1984.1 After a mild recovery in 1984-85,
were GDP grew by 3.7% and 2.8% respectively, another external shock sent Mexico’s
economy into a crisis once more. In 1986, oil prices plummeted leading to a
deterioration in Mexico’s terms of trade of 28.6% and the economy fell into a recession
once again. In response to this shock, the government devalued the peso by 32% in real
terms and put in place an exchange rate target mechanism to conduct monetary policy,
which fueled inflation. The following year, this mechanism was changed to a crawling
peg regime. By 1987, the acute external sector crisis was amplified by the severe
problem of inflation, which reached 159% that year.
Following this crisis, Mexico began a process of adjustment with the aims of
reducing inflation, lowering the budget deficit, liberalizing trade, and reducing the
government’s role in economic activity through privatizations. On December 15, 1987,
the De La Madrid administration set in motion a comprehensive stabilization package
called the “Economic Solidarity Pact” (Pacto). The Pacto was an agreement between
the three most important sectors in the economy; the government, labor leaders and the
1 See G.Gelos (1997)

5
business sector. Its aim was to restrain wage growth, conduct austere monetary and
fiscal policies, control certain key prices of basic private and public services, and most
importantly, fixing the exchange rate against the U.S. dollar and using it as a nominal
anchor for prices. Other measures were introduced at the same time as the Pacto; these
included accelerated trade liberalization, the privatization of many public enterprises,
and financial liberalization.
The Pacto managed to reduce inflation from 159% in 1987 to 51.6% in 1988
without a recession. GDP grew at an annual average of 4% between 1989 and 1994, but
this growth was not achieved without costs. The combination of trade liberalization,
rapid growth, and falling inflation added to a slowed rate of crawl of the exchange rate
led to a sharp real appreciation of the exchange rate and, what turned out to be
unmanageable levels of current account deficits. These deficits in the current account
were being financed by large capital inflows. Between 1990 and 1993, net capital
inflows summed to US$91 billion, equivalent to more than half of the flows to all of
Latin America.2
Once again, Mexico faced an election year hanging on by a very thin thread.
1994 turned out to be a crisis year of a magnitude similar to the one in 1982. Concerns
over the sustainability of the current account deficit, which had reached 8% of GDP, the
ability of the Mexican government to refinance its dollar denominated debt, and a series
of political and criminal events finally culminated on a run on the peso and a massive
withdrawal of capital. By the time it was over, Mexico’s international reserves had
fallen from US$24.5 billion in 1993 to only US$6 billion at the end of 1994.
On December 20, 1994 the government devalued the peso and a few days later
let it float in response to continued pressure from the markets. The crisis that ensued
was devastating, resulting in a fall of real GDP of 6%. The effects of the crisis on all
sectors of the economy were widespread and were multiplied by the banking crisis that
exploded in early 1995. A large support package was implemented to rescue the
financial system which, as of the latest estimates, will end up costing at least 15% of
GDP.
The decisiveness of the government to attack the problems of the crisis head on,
as well as a large package of financial assistance from the U.S., the IMF, the BIS,
commercial banks, and the Bank of Canada totaling US$52 billion, were crucial in
6
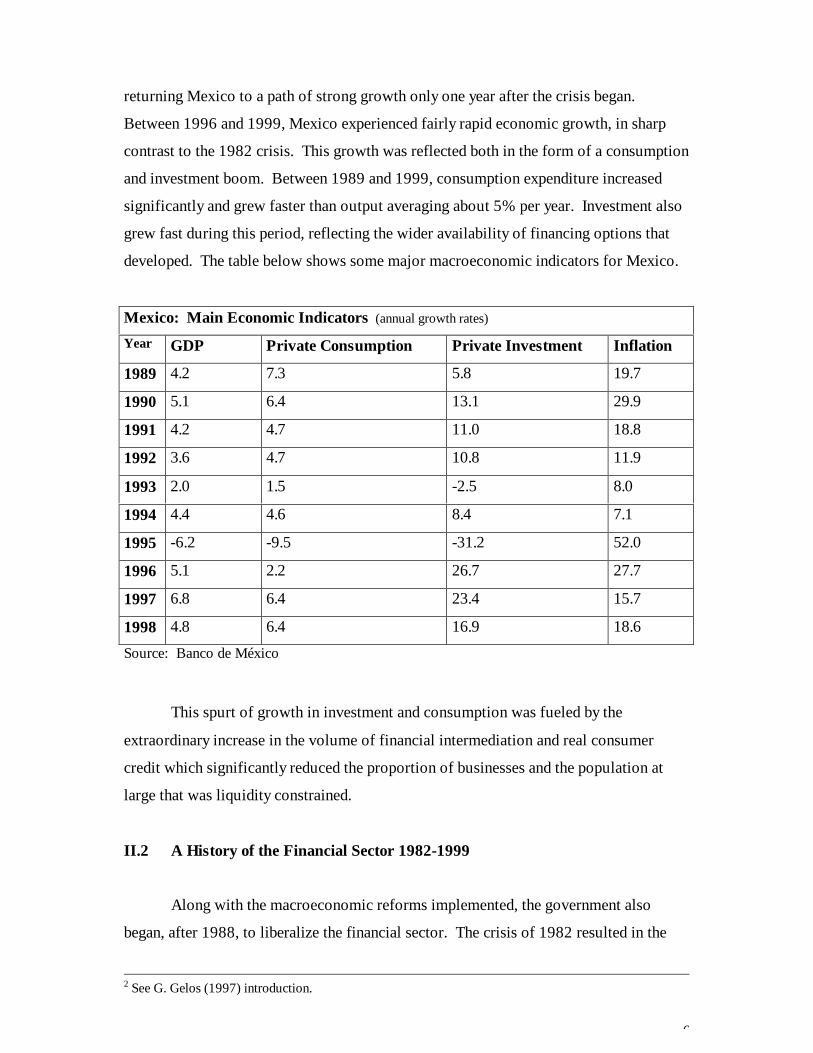
returning Mexico to a path of strong growth only one year after the crisis began.
Between 1996 and 1999, Mexico experienced fairly rapid economic growth, in sharp
contrast to the 1982 crisis. This growth was reflected both in the form of a consumption
and investment boom. Between 1989 and 1999, consumption expenditure increased
significantly and grew faster than output averaging about 5% per year. Investment also
grew fast during this period, reflecting the wider availability of financing options that
developed. The table below shows some major macroeconomic indicators for Mexico.
Mexico: Main Economic Indicators (annual growth rates)
Year GDP Private Consumption Private Investment Inflation
1989 4.2 7.3 5.8 19.7
1990 5.1 6.4 13.1 29.9
1991 4.2 4.7 11.0 18.8
1992 3.6 4.7 10.8 11.9
1993 2.0 1.5 -2.5 8.0
1994 4.4 4.6 8.4 7.1
1995 -6.2 -9.5 -31.2 52.0
1996 5.1 2.2 26.7 27.7
1997 6.8 6.4 23.4 15.7
1998 4.8 6.4 16.9 18.6
Source: Banco de México
This spurt of growth in investment and consumption was fueled by the
extraordinary increase in the volume of financial intermediation and real consumer
credit which significantly reduced the proportion of businesses and the population at
large that was liquidity constrained.
II.2 A History of the Financial Sector 1982-1999
Along with the macroeconomic reforms implemented, the government also
began, after 1988, to liberalize the financial sector. The crisis of 1982 resulted in the
2 See G. Gelos (1997) introduction.

7
nationalization of the banking system. Of the 60 private banks in existence in Mexico,
58 were nationalized.3 The government implemented policies to recapitalize the banks
and promote further consolidation of the banking system. By 1990, only 18 of the 58
originally nationalized banks remained. 4
Prior to 1988, the financial sector in Mexico was severely underdeveloped and
repressed. Given that the government’s access to international financial markets was
limited during the early 80s, it used the banking system and its resources to finance
public deficits. Quantitative restrictions to credit were widespread, and interest rates
were highly regulated. Between the 1950’s and the 1980’s, control over credit was
exercised through the quantitative controls on the intermediaries. The tools used were:
the imposition of very high reserve requirements, selective credit quotas (including
directed credits to certain sectors including the government), and borrowing interest
rates set by Banco de Mexico – in many cases upon instructions from the Ministry of
Finance— and not by current market conditions.5 In addition, the government forced
banks to hold a large proportion of their assets in the form of government liabilities. The
resources used by the government crowded out private sector financing in the banking
sector. For example, in 1986, 72 % of commercial bank credit flowed to the
government.6
Although the nationalization of the banking system did cause a sharp drop in the
role of the banking system in financial intermediation, the nonbank financial sector
grew fairly rapidly during 1982-1988. Principally, this was due to the policies
implemented by the de la Madrid administration, which reprivatized the nonbank assets
of multiple banks. It was in the money market where growth was most spectacular,
nonbank financial institution’s assets rose from 9.1% of total financial system assets to
32.1% between 1982 and 1988. 7
Even with the partial reprivatization of some of the nonbank subsidiaries of the
previously nationalized banks, credit markets were still very underdeveloped. Directed
and subsidized credit to specific sectors was the norm prior to 1988, and it was
primarily extended trough the national development bank, Nacional Financiera (NF),
3 The only two banks that were allowed to remain in private hands were Citibank and Banco Obrero, bothsmall banks.4 See Banco de México (1992)5 See Aspe (1993)6 See G. Gelos (1997)7 See J.Welch and W.Gruben (1996)

8
and through special “trust funds”. Unfortunately, most of these credits went to large
firms; for example, in 1987 94% of the credit extended by NF was to large government
enterprises, only 6% was allocated to small and medium-sized firms8, a legacy that
continues to this day to some extent. In short, prior to 1988 financing options were
limited in Mexico, but they were extremely limited for small and medium-sized firms.
Following the implementation of the Pacto in late 1988, thorough financial
reforms were implemented along with the other reforms adopted in the Pacto. One
important fact allowed this financial liberalization to take place, the substantial decline
in the government’s fiscal deficit year after year. From 1982 to 1989, the public sector
borrowing requirement fell from around 17% of GDP to 2.6% of GDP respectively, and
became a surplus of 1.5% of GDP in 1992. Furthermore, two other factors contributed
to the easing of financial restrictions. First, international capital markets began opening
up to Mexico once again in the late 80’s providing the government with an alternative
source of funds to finance their now much smaller borrowing needs. Second, inflation
began to fall rapidly, which significantly facilitated the liberalization of the financial
system.
Starting in the fall of 1988, interest rates were allowed to vary more due to
market conditions and were no longer controlled, and “credit quotas” to high priority
sectors were eliminated. By 1989, the selective credit mechanism was no longer in
place, compulsory reserve requirements were removed, and new financial instruments
were created. Interest payments on checking accounts were allowed and the
government removed interest rate ceilings on all deposits and securities, and dropped
the liquidity coefficient on bank liabilities to 30%. All these reforms were further
strengthened by the full privatization of the banking system, which began in May 1990
and was completed in 1992. At first, only Mexican nationals could buy the eighteen
banks sold by the government, although this changed after 1994. Moreover, a new law
was passed which allowed banks to unify their financial services into a universal
banking structure.
The financial and macroeconomic reforms implemented had an impressive effect
on the amount of credit available to the private sector, both from banks and non-bank
institutions. The increase in the volume of financial intermediation was spectacular.
Financial depth, measured by M4/GDP rose from 32.3% in 1988 to 51.3% in 1994. In 8 See Aspe (1993)

9
particular, credit to individuals by commercial banks, especially for consumption,
durable goods and housing grew significantly. Credit to private individuals more than
doubled in 1991 and 1992. In fact, the outstanding stock of private-sector loans
increased at an inflation-adjusted annual rate of 30% between 1987 and 1994, and the
share of these loans in GDP rose from 8.1% in 1988 to 35% by the end of 1994.9
Unfortunately, the lack of experience in lending to the private sector with little
regulation and supervision led to a situation in the banking system that could only be
described as a disaster waiting to happen. The causes of the 1994 exchange rate and
banking crisis have been thoroughly discussed; suffice it to say that large capital inflows
during the early 90’s were mainly used to accumulate reserves to defend the ever-more-
appreciated peso and accentuated the current account deficits which finally reached 8%
of GDP in 1994. In the end, investors refused to roll over the nearly $17 billion in
dollar-indexed Mexican Tesobonos that would be due in early 1995 and a devaluation
now known the world over became the trigger for another large crisis in Mexican
financial history.
Since then, the banking system has been mostly “re-nationalized” to a large
extent. Through FOBAPROA, the country’s now defunct deposit guarantee institution,
the government salvaged the banks by purchasing bad loans in exchange for
government certificates. Of the eighteen originally privatized banks in 1991/92, over
half have now been either completely taken over by the government, closed, or partially
intervened. FOBAPROA has now been dissolved and has been replaced by the IPAB
(the Instituto para la Protección al Ahorro Bancario in Spanish or the deposit insurance
agency) which has still a long way to go before it can sell the assets acquired by
FOBAPROA. In the meantime, the cost of the bank-bailout is running at around 20%
of GDP and will be around for many years to come.
More importantly, since the crisis of 95, credit to the private sector has fallen by
35% on average (Dec’94-Dec’98). Although much is still attributable to the poor
conditions of the financial sector at large, one of the most important obstacles to the
continued growth of the financial sector is the poor quality of the legal system and the
lack of efficient and effective institutions for the banking system to rely on. On the
other hand, the opening of the financial system has been nothing short of impressive
since 1995. Of the 37 banks operating today in Mexico, 19 are foreign or have a 9 See G.Gelos (1997)

10
significant foreign participation in them. It remains to be seen whether this will imply a
more active role of the banking system in intermediating the savings of Mexicans in the
near future.
III. Financial Structure
The description of the macroeconomic environment and the drastic changes in
policies related to the financial sector over the last two decades leaves little doubt that
the financial structure of Mexico has changed significantly over the period. Following
the criteria suggested by Demirguc-Kunt and Levine (1999), this section examines the
financial structure (defined as the relative importance of bank versus market-based
institutions) of Mexico and how it evolved during the period from 1982-1997 (due to
data availability restraints). Using their criteria, we evaluate the relative size, activity
and efficiency of banking and capital markets and their evolution over time. The
measures show that Mexico falls under a market-based system that is also
underdeveloped, despite the advances that have occurred in the last couple of decades.
Figure 1 shows the evolution of he overall financial system in Mexico from 1960
to 1997. Beginning in the late 1970s, the financial system as a percent of GDP begins
to grow, mostly the share of bank assets. Prior to 1980 Mexico’s financial system was
completely bank-based. The relative importance of the different players in the financial
system begin to matter after 1988, where the relative size as a percent of GDP, of the
banking sector, the stock market, and the bond market grow at significantly different
speeds, with the stock market taking off very rapidly. It is clear that the financial
liberalization policies followed after 1988 had a significant effect not only on the size of
the financial system, but on its structure and composition. One of the features that we
see in each of these ratios that we look at is how pronounced the negative effects of the
tequila crisis were on the financial system. All three sectors, banks, stock market and
bond market suffered severe declines in their size and activity and a sharp decrease in
efficiency following 1995.

11
Figure 1.
Next, we examine these different sectors independently and use some criteria to
determine their relative size, activity and efficiency and how these evolved over the last
twenty years.
A. Banking Sector
1. Size
One of the important things to keep in mind when looking at the Mexican
banking system is that it is dominated by three big banks, Banamex, Bancomer, and
Serfin, who together hold more than 50% of all bank assets and liabilities of the
financial system. Moreover, as universal banking groups, their influence on all other
sectors of the financial system, especially the bond market and currency trading, is
staggering. This means that one should be careful in interpreting some of these ratios
too strictly.
To get an idea of the size of the banking sector we use the ratio of deposit money
banks’ assets to GDP. As Figure 2 shows, this ratio remained fairly low until the mid
1970s, and then increased rapidly. Bank assets remained constant at around 15% until
Financial System Size (% GDP)
0%10%20%30%40%50%60%70%80%90%
100%
1960 1963 1966 1969 1972 1975 1978 1981 1984 1987 1990 1993 1996
Bank Assets Stock Market Bond Market

12
1988 and then began growing at an amazing speed between 1989 and 1994 due to the
implementation of the policies mentioned in Section II. The privatization of the
banking system and liberalization of financial policies led to an unprecedented boom in
bank financial assets during this period. Unfortunately, a lack of regulation and
supervision meant that some of these assets where not of high quality, and after the
crisis of ’95, the assets of the banking sector fell from a high of 35% of GDP to about
12% of GDP. By international standards, Mexico’s banking system is still small, even
at its zenith, the share of banking sector assets in GDP was still smaller than the world
average (52.6%), and slightly larger than the Latin American average of 27.4%.
Figure 2.
2. Activity
We measure the level of bank activity in the private sector by looking at the ratio
of private credit issued by commercial banks to GDP. As we see in Figure 3, bank
activity mimics bank size. As described in the financial policy section, the
government’s extensive role as a credit taker prevented the banking system from
fulfilling its role as provider of credit to the private sector up until the late 1980s. There
is a surge in banking sector activity in the mid 80s followed by a slight decline after the
debt crisis and then a strong resurgence following the reprivatization of the banking
system in the early 90s and the “credit boom” that followed, and a sharp reversal after
Bank Size(% GDP)
0%
5%
10%
15%
20%
25%
30%
35%
1960 1963 1966 1969 1972 1975 1978 1981 1984 1987 1990 1993 1996

13
1994. 10 Banks were more active in the late 70s and early 80s until the debt crisis of ’82
brought about a serious decline following the nationalization of the banking system,
with credit to the private sector falling from about 14% to 6% of GDP. After the
liberalization and reform program that began in late 1988, credit to the private sector
grew at unprecedented rates of almost 5% per year to reach over 36% of GDP in 1994,
but fell to about 13% of GDP in 1997 following the tequila crisis.
Following the criteria established by Demirguc-Kunt and Levine (1999),
Mexico’s banking sector can be considered highly underdeveloped during the 1960s to
the late 1980s. Aferwards and up until the early 1990s, the system becomes much more
developed (although based on the criteria it is still considered underdeveloped).11
Figure 3.
3. Efficiency
To measure the evolution of bank efficiency we use three indicators. The first
two are only available from 1990-1997 and are suggested by Demirguc-Kunt and
Levine (1999). Overhead costs are the ratio of bank overhead costs to the total assets of
the banks, and net interest margin is the difference between interest income and interest
expense over total assets. Efficiency improves when these indicators exhibit a decline.
As Figure 4 shows, overhead costs fell steadily throughout the early 90s until 1996.
After the crisis, the renationalization of some banks and the high costs of recovering (or
attempting to recover) some of the past due loans as well as increasing competition
10 See Copelman (1997)11 Demirguc-Kunt and Levine (1999) consider a country’s system to be underdeveloped if its bankingactivity is below the world average which is around 20% for the 60s, 23% for the 70s, 32% for the 80sand 39% for the 90s.
Bank Activity(% GDP)
0%
5%
10%
15%
20%
25%
30%
35%
1960 1963 1966 1969 1972 1975 1978 1981 1984 1987 1990 1993 1996

14
from foreign banks elevated this measure significantly. Net interest margins fluctuated
around 5.5% for most of the early 90s and fell significantly after 1995. This is not
necessarily due to improved efficiency, but to the tremendous jump in interest rates
following the crisis. In part, the drop in net interest margins does reflect an increase in
efficiency as domestic banks were forced to compete with more efficient and healthier
foreign banks that entered the Mexican financial market after 1995.
Figure 4.
The third measure of efficiency we use is the spread on short term banking
operations (lending minus borrowing). The spread increased during the 80s, indicating
a decrease in efficiency due to the nationalization of the banking system. Following the
financial liberalization that began in 1988, the spread fell consistently until the crisis of
1995 that brought a sharp but temporary increase, by 1996 the spread had fallen to
previous levels.
In summary then, Mexico has a relatively small and inactive banking system
when compared to the world average. We can categorize Mexico’s banking system as
relatively underdeveloped.
B a n k E f f i c i e n c y( % G D P )
3 . 5 %
4 . 0 %
4 . 5 %
5 . 0 %
5 . 5 %
6 . 0 %
6 . 5 %
7 . 0 %
1 9 9 0 1 9 9 1 1 9 9 2 1 9 9 3 1 9 9 4 1 9 9 5 1 9 9 6 1 9 9 7
O v e r h e a d c o s t s N e t I n t e r e s t M a r g i n

15
Figure 5.
B. The Stock Market
1. Size
To measure the size of the Mexican stock market we use the typical index of
stock market capitalization to GDP ratio.12 As Figure 6 shows, the stock market was
not very important in the late 70s and the 80s. It was only after financial liberalization
policies went into effect in 1988 that the stock market increased steadily in size to reach
45% of GDP in 1993. Following the crisis of 1995 the stock market’s size fell to
around 33% of GDP, still an impressive number given its humble role in the previous
decade. Compared to the world average (18.5% in the 70s, 28.4% in the 80s, and
38.2% in the 90s), Mexico’s stock market was relatively large in the early 90s and has
since declined somewhat.
12 This ratio is defined as the value of domestic equities (traded on the Mexican stock exchange) to GDP.
B a n k E f f i c i e n c y( % G D P )
0%
2%
4%
6%
8%
10%
12%
14%
16%
1980 1982 1984 1986 1988 1990 1992 1994 1996 1998
S p r e a d

16
Figure 6.
2. Activity
We measure the activity of the stock market using total value traded as a share of
GDP, which gives the value of stock transactions relative to the size of the economy.
This measure is also used to gauge market liquidity because it measures trading relative
to economic activity (Levine and Zervos 1998). Figure 7 shows that in Mexico, the
total value traded to GDP ratio has increased steadily since the mid 70s with a few
setbacks with each economic crisis (in 1981, 1987, and 1994) and reached a peak in
1994 at 23% of GDP. Using the criteria described in the banking section above,
Mexico's stock market can be considered underdeveloped until the late 1980s and early
1990s (the world average is about 5% in the 70s, 13% in the 80s, and 31% in the 90s).
Figure 7.
3. Efficiency
Stock Market Activity (% GDP)
0%
5%
10%
15%
20%
25%
1975 1978 1981 1984 1987 1990 1993 1996
Stock Market Size (% GDP)
0%10%20%30%40%50%
1978 1980 1982 1984 1986 1988 1990 1992 1994 1996

17
To measure the efficiency of the stock market we use the turnover ratio, which is
defined as the ratio of the value of total shares traded and market capitalization. It
measures the activity or liquidity of the stock market relative to its size. Figure 8 shows
that since the late 70s, the turnover ratio increased steadily until 1987. This was a
period with a lot of activity in the stock market in Mexico as more companies became
listed and the stock market grew in size. Following the crisis of 1987, the turnover ratio
has remained relatively steady indicating that at least domestic activity has not been
very large. In part, this reflects the fact that for the large companies that could, most of
the activity of share issues and trades take place in the United States stock market rather
than in the Mexican stock market, especially in the period up to 1994.
Figure 8.
In general, Mexico’s banking system and stock markets are small and relatively
inactive, although neither is significantly inefficient when compared to world means.
C. Other Capital Markets
Demirguc-Kunt and Levine (1999) show that as countries get richer, other
financial intermediaries such as insurance companies, pension funds, bond markets and
mutual funds become larger as a share of GDP, and that their role within the financial
structure rises relative to the role of development banks and other non-banks. In this
section we describe the characteristics of the development banks, insurance companies,
the bond market, and other bank-like institutions and their evolution.
Stock Market Efficiency(%GDP)
Turnover Ratio
0
0.5
1
1.5
2
2.5
1978 1980 1982 1984 1986 1988 1990 1992 1994 1996

18
Figure 9.
1. Development Banks, Insurance companies and Other Bank-like
Institutions
Figure 9 shows that in Mexico, development banks have been the predominant
players within these other types of financial intermediaries in terms of size. Their assets
as a share of GDP rose from about 17% of GDP in 1980 to 32% in 1986. Between 1987
and 1991 total assets of development banks as a share of GDP fell steadily before
recuperating to slightly above their previous high. This is not due to a more important
role of these banks in the financial structure during this period, it occurred because
government funds for political campaigns and to stimulate growth were being funneled
through the development banks so as to avoid higher public deficit figures. Following
the crisis of 1994, their assets’ share in GDP fell to about 16% in 1997.
The assets of insurance companies and other bank-like institutions took off after
1990. The assets of insurance companies had remained constant at just over 1% of
GDP between 1980 and 1990 and then reached a peak of 2.5% in 1995. The assets of
other bank-like institutions reached a peak of 4% of GDP in 1994 and fell to 1.6% of
GDP in 1997. It is clear that their role in the financial system is still limited. A sector
that will become increasingly important in the next few decades will be the recently
privatized pension funds. It is estimated that their assets as a percent of GDP could
reach as much as 30% over the next two to three decades.
Other Financial Intermediaries : Size(% GDP)
0%
5%
10%
15%
20%
25%
30%
35%
40%
1980 1982 1984 1986 1988 1990 1992 1994 1996
T o t a l A s s e t s o f D e v e l o p m e n t B a n k s / G D PT o t a l A s s e t s o f I n s u r a n c e C o m p a n i e s / G D PT o t a l A s s e t s o f O t h e r B a n k l i k e I n s t i t u t i o n s / G D P

19
The evolution of the activity of these other financial intermediaries mirrors their
size. Figure 10 shows that from 1980 to 1990, the activity, measured as the ratio of
credit to the private sector to GDP, of the development banks and insurance companies
remained fairly stable with development banks having the largest share at about 3.5% of
GDP. After 1990, all three sectors experienced a sharp increase in their share of private
credit to GDP until 1994, when their shares reached approximately 10%, 4.5%, and 3%
of GDP respectively for the development banks, the insurance companies, and other
bank-like institutions. Once again, this behavior reflects the macroeconomic crisis of
1994 and the subsequent decline in the overall size and activity of the financial system
in Mexico.
Figure 10.
1. The Bond Market
As in most other Latin American countries, the bond market in Mexico is mostly
the public bond market reflecting the importance of government bond issues over all
private bond issues. Figure 11 shows that the capitalization of the total bond market has
declined since 1990. This has been driven by the decline in the share of public bond
issues to GDP by about a half, from about 20% in 1990 to 10% in 1997, since private
bond market capitalization has remained fairly constant. As explained in the financial
policies section, this has been due to the progressively more restricted role of the
government as a taker of private savings to finance public deficits.
Other Financial Intermediaries: Act ivi ty (% GDP)
0%1%2%3%4%5%6%7%8%9%
10%
1980 1982 1984 1986 1988 1990 1992 1994 1996
P r i v a t e C r e d i t b y D e v e l o p m e n t B a n k s / G D PP r i v a t e C r e d i t b y I n s u r a n c e C o m p a n i e s t o G D PPr iva te Cred i t by Othe r Bank l ike Ins t i tu t ions /GDP

20
Figure 11.
D. Financial Structure: Bank-Based or Market-Based?
The last few sections have looked at the measures of financial structure set out in
Demirguc-Kunt and Levine (1999) and their evolution in Mexico over the past two
decades. As they point out, in general there is a trend for richer countries to be
relatively more market based. In this section, we use the same type of criteria to
evaluate whether Mexico can be considered to have a financial system that is bank-
based or market-based. In order to determine how the financial system has changed in
the Mexican economy, we look at measures of relative size, activity and efficiency to
determine whether banks or the stock market are more important.
1. Relative Size
To examine the relative size of the banking system vs. the stock market, we look
at three measures: the first is the ratio of stock market capitalization to the liquid
liabilities of all other financial intermediaries (banks and non-banks). This gives us a
sense of how much more important is the stock market relative to all other types of
financial institutions. The second is the ratio of stock market capitalization to bank
assets, and the third is the ratio of stock market capitalization to the assets of other
financial institutions. An increase in these indices implies that the stock market has
gained importance relative to the other institutions. As Figure 12 shows, since 1984, the
stock market has gained relative to all other types of institutions.
B o n d M a r k e t C a p i t a l i z a t i o n( % G D P )
0%
5%
10%
15%
20%
25%
1990 1991 1992 1993 1994 1995 1996
P u b l i c b o n d m a r k e t c a p i t a l i z a t i o n / G D PP r i v a t e b o n d m a r k e t c a p i t a l i z a t i o n / G D P

21
Figure 12.
2. Relative Activity
Next, we measure the relative activity of the stock market versus other types of
financial intermediaries such as banks, life insurance companies, the bond market, etc....
The activity of the stock market relative to other intermediaries is measured by two
indices, the ratio of the total value traded to private credit issued by deposit money
banks, and the ratio of the total value traded to private credit issued by deposit money
banks and other institutions. Figure 13 shows that there has been a steady, yet slow,
increase in these ratios since 1983. The peak we see between 1986 and 1987 is due to
the increase in activity of the stock market prior to the devaluation of late 1987. It is
interesting to note that since the crisis of 1995, these ratios have accelerated rapidly.
This indicates that increasingly, Mexico’s financial system is becoming more market-
based, although this is partly due to the effect that its banking system is relatively
underdeveloped and not because the stock market is very large or active.
F i n a n c i a l S t r u c t u r e : S i z e
0
1
2
3
4
5
6
1 9 7 8 1 9 8 0 1 9 8 2 1 9 8 4 1 9 8 6 1 9 8 8 1 9 9 0 1 9 9 2 1 9 9 4 1 9 9 6
S t . M k t . K / L i q u i d L i a b o f F i n a n c i a l I n t e r m .S t . M k t K / B a n k A s s e t sS t . M k t K / O t h e r F i n a n c i a l M k t . A s s e t s

22
Figure 13.
3. Relative Efficiency
To measure the relative efficiency of the stock market to the banks and other
financial institutions we use the product of the stock market’s turnover and the spread of
bank borrowing and lending rates. An increase in this indicator represents a more
efficient stock market relative to the banking sector. As Figure 14 shows, we see that
from 1980 to 1988 there was an increase in this index indicating that the stock market
was more efficient than the banks. Yet, from 1989 onwards, this index declines and
then stays fairly constant except for a peak in 1995. This should not be interpreted as a
decline in the relative efficiency of the stock market since the rapid increase in interest
rates following the devaluations distorts this index.
Figure 14.
Financial Structure: Activity
00.2
0.4
0.60.8
1
1.21.4
1.6
1.82
1978 1980 1982 1984 1986 1988 1990 1992 1994 1996
St . Mkt . Total Value Traded/ Private Credi t by Money Banks
St Mkt Total Value Traded/ Private Credi t Dep Money Baks andothers
Financial Structure: Efficiency
02468
10121416
1980 1982 1984 1986 1988 1990 1992 1994 1996
Turnover*Spread

23
Demirguc-Kunt and Levine (1999) classify Mexico’s financial system as
underdeveloped and market-based. However, we see that this classification is due to the
rapid development of the stock market relative to the banks since the late 1980s, but
also because the financial and banking crisis of 1995 has drastically reduced the size
and activity of the banking system.
IV.Empirical Results
A. A Survey of the Literature
The effects of financial structure on growth have been analyzed in different
ways in the literature. Most of this literature has not focused specifically on financial
structure as we define it in this paper, but has been mostly directed at explaining how
financial liberalization or changes in a country’s financial policies and regulation affect
components of growth, namely investment and capital accumulation. As we mentioned
in the introduction and described in Sections II and III, the changes that have occurred
in Mexico in terms of macroeconomic and financial reform have deeply affected
Mexico’s financial structure. Over the last fifteen to twenty years, the stock market and
other financial institutions have increased their relative importance as intermediaries of
private savings into investment in Mexico. In this section, we provide a brief survey of
the literature that examines the links between these changes in financial structure that
come about due to financial liberalization and investment and growth. In particular, we
concentrate on those studies that have used micro data (at the firm level) to complement
what we do in this paper which uses macro data.
Beginning in the late sixties, some authors have focused on the relationship
between the degree of financial development of an economy and its level and efficiency
of investment and growth. In this vein, the papers by Goldsmith (1969),
McKinnon(1973) and Shaw (1973) highlight the importance of financial factors in
growth mostly through interest rate effects.
At the firm level, which allows for more degrees of freedom and looking at
cross-sectional data, we find several interesting studies. Babatz and Conesa (1997) use
microeconomic data to analyze the importance of financial factors for capital formation.
They examine whether the privatization of banks in 1991 had a significant effect on
how different types of firms finance investment. To this they use data for 71 stock-
listed companies over the period 1988-94. By selecting a priori those firms which were

24
more likely to be financially constrained to use internal sources of financing, they find
that larger, exporting, and conglomerate-related firms experienced a significant
relaxation in their financial constraints. The main problem with this study is that the
period used does not allow for the years where the most pronounced financial repression
took place (prior to 1988), so that one cannot directly say that financial liberalization
was responsible for the changes in how firms received financing for investment.
Gelos and Werner (1999) made an important improvement in the literature.
Using plant-level data from the Mexican manufacturing sector, they find that that cash
flow is significantly correlated with investment before and after financial liberalization,
particularly for smaller firms. Additionally, their results show that financial
liberalization contributed to easing financing constraints for small firms and therefore to
higher investment levels by increasing the availability of credit to these types of firms.
They also find that collateral, in the form of real estate, played an important role in
determining investment especially after 1989.
The point that financial liberalization, by increasing credit availability to
financially constrained firms, can affect growth beyond the effects through interest rates
has been formally made by Bernanke and Blinder (1988). They extend the traditional
IS-LM framework to include a market for credit through which monetary policy
changes, or changes in financial regulation, can affect economic activity.13
These studies show that the changes that took place in Mexico since the mid
1980s with regard to financial regulation and policies that affect the structure of the
financial system had a deep impact on investment and growth. In the next section, we
show that the financial developments that took place at the macro level had an impact
on real activity, especially by having a more significant effect on the output of those
sectors of the economy that previously had more restricted access to credit.
B. Empirical Results
In this section, we use aggregate data to show that shocks to the volume of credit
and the cost of funds significantly affect the composition of output. In the next section,
we use sectoral data to show that the composition of output and investment changes
following shocks to the volume of credit and the cost of funds. We test the hypothesis
13 Several papers have tested this hypothesis using VAR techniques, these include Copelman and Werner(1997) and Greenham Llorente (1997) among others.

25
that heterogeneous borrowers will react differently to changes in the supply of bank
credit induced by policy shocks. The credit view, unlike the conventional money view,
relies on the supposition that informational asymmetries will lead some firms to have
more restricted access to bank credit. If the bank lending channel exists in Mexico, we
should see that the output of sectors that a priori are considered to have more restricted
access to credit will react more than the output of sectors that are not credit constrained
when there is a period of financial liberalization.
In Section IV B.1, we use the vector error correction methodology to show that
shocks to the volume of credit and the cost of funds explain a large proportion of the
variation in output and investment. Moreover, we show that the dynamic response of
output and investment to shocks in credit and the cost of funds are those we predict; that
is a positive shock to credit and to the cost of funds increases (decreases) output and
investment.
In Section IV B.2, we test the hypothesis that heterogeneous borrowers will react
differently to changes in the supply of bank credit and to changes in the cost of funds.
If credit affects investment and production, then we should see that the output and
investment of sectors that a priori are considered to have more restricted access to credit
will react more that the output and investment of sectors that are not credit constrained
when there is a financial liberalization. Our results show that the production of small
firms and non-tradable goods (all sectors that are highly dependent on bank credit),
reacts more than the other sectors’ production when financial liberalization occurs and
increases the volume of credit or reduces the cost of credit to firms. Additionally, we
find that investment reacts much more for non-tradable goods when there is a positive
shock to credit. This is particularly good news, given that we hypothesize that
investment by firms is highly dependent on bank credit.
IV B.1 Reduced Form Evidence and Data
First, a description of the data we used is in order. All the data are from 1980:01
to 1999:08, which has the appealing characteristic that it includes a significant period of
time prior to financial liberalization so that we can safely assume that the changes that
took place following 1989-1990 are captured in the data.

26
We use as our measure of credit, total loans to the non-financial private sector
given by commercial banks.14 To measure the cost of funds for firms, we use the spread
between the borrowing and lending rate for banks. For output we use an index of real
industrial production and an index of real gross fixed investment. 15 All variables are
seasonally adjusted and with the exception of the interest rate and the spread are in logs.
The following is a list of all the variables used.
1) CRED is the real quantity of credit by the banking sector
2) SPREAD is the spread between the borrowing and lending rate
3) CPP is the real interest rate16
4) RER is the real exchange rate
5) IP is an index of real industrial production
6) INVis an index of real gross fixed investment
All the variables are I(1).17 We found that all the variables that entered into the
estimated systems were cointegrated. Thus, we could use the number of cointegrating
equations to run a Vector Error Correction model (VEC).
We estimate the VECs and use the percentage of the variance of the forecasted
variable attributable to alternative right hand side variables at different horizons as a
good way to measure predictive power. Each VEC contains one of the measures of
economic activity (IP or INV), both the volume of credit (CRED) and its cost
(SPREAD), the real exchange rate (RER) and the real interest rate (CPP). Each
equation was estimated using a constant and 12 lags of each variable.18
The variance decomposition results for each VEC are presented in Table 2.
Each entry in the table is the percentage of the variance of the row variable attributable
to each of the column variables at a 12 and 24 month horizon. The results presented are
for the ordering listed in the table, however, the results did not change much when the
14 This data comes from the IFS.15 All the data are from the Banco de México.16 CPP is the average cost of funds.17 We performed Augmented Dickey Fuller tests to determine the order of integration of each series, andthe Johansen methogd of cointegration to test for cointegration among the series and determine thenumber of cointegrating equations for each set of VARs run.18 This lag length was chosen y running F-tests for omitted lags with 6,7,8,12 and 18 lags.

27
order is changed somewhat.19 We believe this model is the correct structural one for the
innovations. This is because in a small open economy with perfect capital mobility, like
Mexico is, the domestic real interest rate differs from the foreign interest rate by the
expected real appreciation of the currency (see Dornbusch (1983)). With a fixed
exchange rate (which was the regime in place during our sample) and a sticky price
level, any transitory shock to the real exchange rate (RER) will generate an immediate
change in the real interest rate. Therefore, in our model the real exchange rate should be
before the real interest rate in the ordering. Finally, we handicap the predictive power
of credit (CRED) by placing it last in the ordering and after the (SPREAD), since it too
is an interest rate measure and will be affected by changes in the real exchange rate.20
Table 2: Variance Decompositions of Investment
a INV RER CPP SPREAD CRED
INV-12 12.9 78.8 1.9 5.7 0.6
INV-24 4.5 88.6 1.8 4.9 0.3
INV-36 3.2 89.7 2.7 4.2 0.3a: The numbers following the dash refer to the horizon. Entries show the percentage of the forecastvariance of INV at different horizons attributable to innovations in column variables. Order is as shown.
The results shown in Table 2. are favorable to our hypothesis. Separately,
shocks to the spread explain up to 6 % of the variation in investment, while shocks to
credit explain almost 1% of the variation in investment. Together, they can account for
as much as 7% of the variations in investment. It seems that the most important
variable in explaining the variations in investment is the real exchange rate. This is not
so surprising, given the large variation in the real exchange rate during the sample
period and that a lot of investment is done with imported capital goods as a source of
intermediate goods. The results for industrial production are more encouraging in terms
of our hypothesis that financial liberalization has a positive effect on output through its
effect on the availability of credit. We show the results for industrial production in
Table 3.
19 The only real difference, which is good news, is that with credit last in the ordering, the percentage ofthe variance explained by CRED is usually higher.20 These two VECs were found to have 2 cointegrating equations.
28
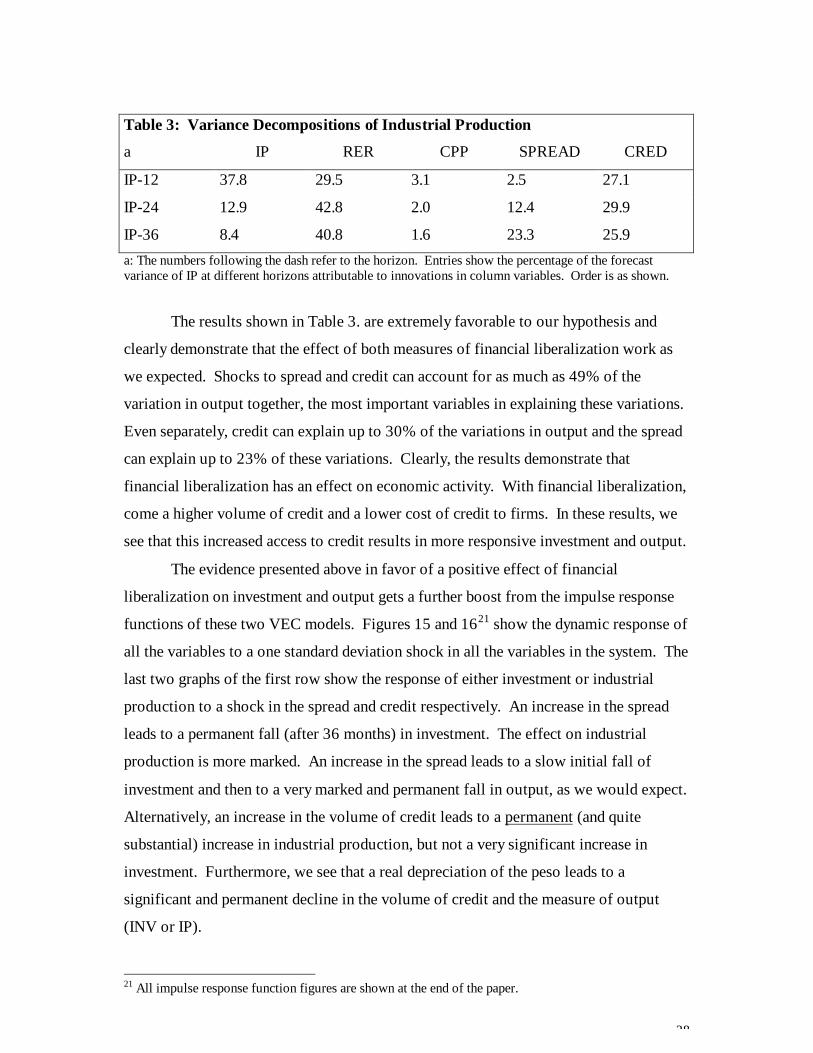
Table 3: Variance Decompositions of Industrial Production
a IP RER CPP SPREAD CRED
IP-12 37.8 29.5 3.1 2.5 27.1
IP-24 12.9 42.8 2.0 12.4 29.9
IP-36 8.4 40.8 1.6 23.3 25.9a: The numbers following the dash refer to the horizon. Entries show the percentage of the forecastvariance of IP at different horizons attributable to innovations in column variables. Order is as shown.
The results shown in Table 3. are extremely favorable to our hypothesis and
clearly demonstrate that the effect of both measures of financial liberalization work as
we expected. Shocks to spread and credit can account for as much as 49% of the
variation in output together, the most important variables in explaining these variations.
Even separately, credit can explain up to 30% of the variations in output and the spread
can explain up to 23% of these variations. Clearly, the results demonstrate that
financial liberalization has an effect on economic activity. With financial liberalization,
come a higher volume of credit and a lower cost of credit to firms. In these results, we
see that this increased access to credit results in more responsive investment and output.
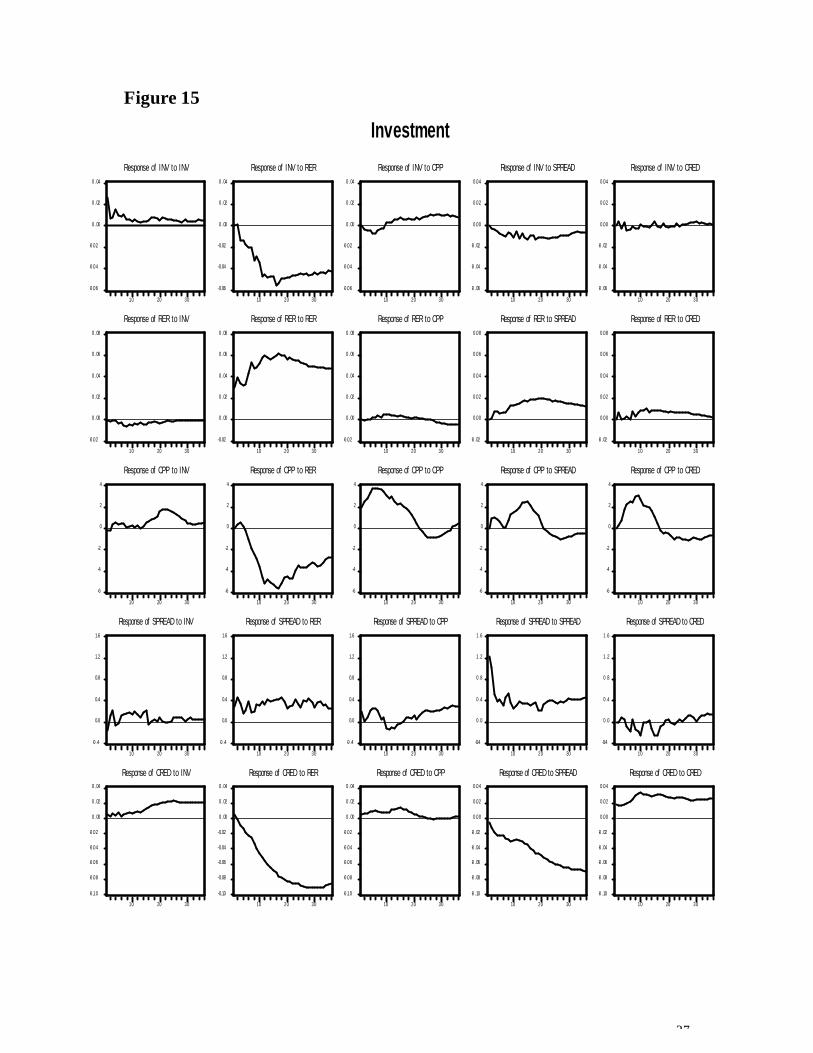
The evidence presented above in favor of a positive effect of financial
liberalization on investment and output gets a further boost from the impulse response
functions of these two VEC models. Figures 15 and 1621 show the dynamic response of
all the variables to a one standard deviation shock in all the variables in the system. The
last two graphs of the first row show the response of either investment or industrial
production to a shock in the spread and credit respectively. An increase in the spread
leads to a permanent fall (after 36 months) in investment. The effect on industrial
production is more marked. An increase in the spread leads to a slow initial fall of
investment and then to a very marked and permanent fall in output, as we would expect.
Alternatively, an increase in the volume of credit leads to a permanent (and quite
substantial) increase in industrial production, but not a very significant increase in
investment. Furthermore, we see that a real depreciation of the peso leads to a
significant and permanent decline in the volume of credit and the measure of output
(INV or IP).
21 All impulse response function figures are shown at the end of the paper.

29
The results from the VEC models show that financial liberalization in Mexico
did have a profound impact on investment and output and therefore growth, through its
effect on the availability of credit. These results are for aggregated data, and they do
not exclude other alternative explanations, such as that expectations of future changes in
output affect the volume of credit in the present. To clearly demonstrate that financial
liberalization affects output and investment through its effect on the availability of
credit, we take a more dissaggregated approach.
IV B.2 Sectoral Evidence
The previous section established that shocks to the volume of credit and the cost
of credit have a significant and permanent effect on investment and output. Since we
postulate that financial liberalization has the effect of increasing access to credit (both
by an increase in the volume of credit and a reduction in its cost) to firms, we show that
financial liberalization ultimately has an effect on growth due to capital accumulation.
However, aggregate data is hard to interpret. We believe that if financial liberalization
truly affects investment and output, this should be very evident in sectors that are more
credit dependent relative to those that aren’t.
In this section, we test the hypothesis that heterogeneous borrowers will react
differently to changes in the supply of bank credit (either via cost or volume). To test
this hypothesis, we use the same methodology as in the previous section, but we use
sectoral production data and investment data in addition to aggregate data on industrial
production and investment. We choose a set of sectors that a priori we consider being
more dependent on bank credit and therefore, its production (or investment) will react
more to shocks in either the volume of credit or the cost of credit. The sectors which
are considered to be more credit dependent are: construction ( a non-tradable good),
small firms, and total manufacturing. We compare the results of the VEC estimations
with those of the following sectors respectively (which we consider to be less bank-
credit dependent): mining, large firms, and maquiladora export production. A list of the
new variables used in this section follows.22
1) MAQ is the level of output of the maquiladora industry
2) MAN is the level of output of the manufacturing sector
22 Once again, all variables are real, seasonally adjusted and in logs. The range of the data is as before,monthly between 1980:01 to 1994:12. The rest of the variables remain as they were.

30
3) CONST is the level of output of the construction sector
4) INVCO is the level of gross fixed investment in the construction sector
5) MIN is the level of output of the mining sector
6) DUR is the level of output of the durable sector
7) NODUR is the level of output of the non-durable sector
8) ICONST is the level of gross fixed investment in the construction sector
We estimated a set of VECs that include aggregate industrial production (IP), the
output of a particular sector (MAQ; MAN; CONST; MIN; DUR; or NODUR), the real
exchange rate (RER), the real interest rate (CPP), the spread (SPREAD), and the level
of the volume of credit (CRED). As before, each equation was estimated using a
constant and 12 lags of each variable. By comparing the responses of different sectors’
output to a shock in the financial liberalization variables (i.e. CRED and SPREAD), we
can determine if the direction of causality is from credit or spread to output and not the
other way around. We expect to see that the reaction of the output of the bank-
dependent credit sectors will be stronger than the reaction of the sectors that have other
financing alternatives to shocks in either credit or the spread.
The variance decomposition results for each VEC are presented in Tables 4
through 7. Lines 1-3 of each table show the results for the credit dependent sector,
while lines 4-6 show the result for the comparison sector, which we consider relatively
not dependent on bank credit. The results are shown for the output of the relevant
sector only.23
23 The results for aggregate IP are available on request.

31
Table 4: Variance Decompositions for Manufacturing & Maquiladora
a IP MAN or
MAQ
RER CPP SPREAD CRED
1. MAN-12 46.7 2.4 13.8 4.4 10.3 22.2
2. MAN-24 25.9 7.9 8.9 10.1 26.4 20.63
3. MAN-36 15.2 6.2 5.1 8.9 47.3 17.2
4. MAQ-12 29.6 4.2 41.6 3.4 5.8 15.4
5. MAQ-24 8.9 8.0 56.7 1.6 4.7 20.0
6. MAQ-36 7.1 5.7 52.1 1.4 6.4 27.4a: The numbers following the dash refer to the horizon. Entries show the percentage of the forecastvariance of MAN or MAQ at different horizons attributable to innovations in column variables. Order isas shown.
The results for the manufacturing versus the maquiladora industry are extremely
favorable to our hypothesis that the production of those sectors which are relatively
more dependent on bank credit will react more to shocks in either the volume of credit
or the spread. This implies that financial liberalization has an effect on output and
growth particularly through its effect on these types of sectors in the economy. Shocks
to our financial liberalization measures together can explain up to 64% of the variation
in the output of the manufacturing sector, more than any other variable; while for the
maquiladora industry’s output they can only explain up to 33%.
Table 5 below, shows the evidence is also very favorable for another set of
sectors, durables vs. non-durables. Shocks to the financial liberalization measures
(credit and spread) can account for up to 60% of the variation in durables production,
more than any other variables either combined or alone. On the other hand, shocks to
these variables can only account for up to 27% of the variation in non-durables
production, still important, but not nearly in the same magnitude.

32
Table 5: Variance Decompositions for Durables & Non-Durables
a IP DUR or
NODUR
RER CPP SPREAD CRED
1. DUR-12 25.3 11.2 34.9 1.4 7.1 20.1
2. DUR-24 8.3 7.2 32.5 2.4 25.8 23.7
3. DUR-36 5.6 6.8 24.9 2.6 38.4 21.8
4. NODUR-12 31.5 42.4 3.5 1.9 11.5 9.1
5. NODUR-24 27.8 31.7 2.9 12.9 15.6 9.2
6. NODUR-36 31.5 26.5 3.4 11.5 16.6 10.5a: The numbers following the dash refer to the horizon. Entries show the percentage of the forecastvariance of DUR or NODUR at different horizons attributable to innovations in column variables. Orderis as shown.
The results for the variance decompositions for the construction and mining
sector, shown below in Table 6, are also supportive of our view. Shocks to the spread
and volume of credit together can account for as much as 14.5% of the variation in the
production of the construction sector, but only 11% of the production of the mining
sector.
Table 6: Variance Decompositions for Construction & Mining
a IP CONST
or MIN
RER CPP SPREAD CRED
1. CONST-12 15.5 39.9 37.5 1.7 4.3 1.6
2. CONST-24 12.3 29.6 47.5 1.4 6.6 2.6
3. CONST-36 11.2 26.6 43.1 4.5 11.0 3.5
4. MIN-12 22.8 57.8 8.3 2.8 6.3 2.0
5. MIN-24 22.1 47.2 12.5 6.8 5.6 5.7
6. MIN-36 21.9 40.0 15.9 10.4 4.7 6.9a: The numbers following the dash refer to the horizon. Entries show the percentage of the forecastvariance of CONST or MIN at different horizons attributable to innovations in column variables. Order isas shown.
However, it is clear that in comparing these two sectors, the results are not as
striking as in the other sectors. Since our hypotheses rely on the assumption that
financial liberalization affects mostly the level of investment in those sectors that are

33
more dependent on bank credit, we show the results for the variance decomposition of
total gross fixed investment versus gross fixed investment in the construction sector.
We should expect to see that shocks to either the spread or credit have a more profound
effect on investment in the construction sector than on investment in general. The
results shown below on Table 7 demonstrate that this is indeed the case in Mexico.
Shocks to the spread and credit can account for up to 38% of the variation in investment
in the construction sector, while they can only explain up to 6% of the variation of total
investment. This clearly demonstrates that financial liberalization works to increase
investment (and through time growth) by increasing the accessibility and availability of
credit to firms that are more dependent on domestic credit.
Table 7: Variance Decompositions Total Investment & Inv. in the Construction Sector
a INV or
ICONST
RER CPP SPREAD CRED
1. ICONST-12 36.5 37.6 14.9 5.6 5.4
2. ICONST-24 33.9 39.0 11.7 6.1 9.2
3. ICONST-36 30.9 22.8 8.1 22.6 15.6
4. INV-12 12.9 78.8 1.9 5.7 0.6
5. INV-24 4.5 88.6 1.8 4.9 0.3
6. INV-36 3.2 89.7 2.7 4.2 0.3a: The numbers following the dash refer to the horizon. Entries show the percentage of the forecastvariance of INV or ICONST at different horizons attributable to innovations in column variables. Orderis as shown.
The evidence presented above is confirmed by the impulse response functions.
Figures 17 through 24 show the dynamic response of all the variables in the VECs to a
shock in all the variables in the system.24 The second row of each figure shows the
response the output of the relevant sector to a shock in each of the variables in the
system. The last two graphs of that row show the response of each sector’s output to a
shock in the SPREAD and in CRED respectively (our financial liberalization measures).
Figure 17 shows that a shock to the spread has a negative and permanent effect
on both aggregate industrial production (the first row, second to last graph) and to
manufacturing output, which we believe to be the credit dependent sector. On the other
24 Each figure is associated with one of the tables presented before.

34
hand, Figure 18 shows that a shock to the spread has only a slight negative effect to
aggregate industrial production and almost no effect at all to the maquiladora sector’s
output, which we believe is relatively not dependent on bank credit. A shock to CRED
has a positive and permanent effect on aggregate industrial production in both VECs;
however, it has the expected positive effect on the output of the manufacturing industry
but not of the maquiladora industry, furthering our views. Furthermore, we see that a
shock to the real exchange rate has almost no effect on the manufacturing sector’s
output but it does have an effect on the maquiladora sector’s output.25 In addition, we
see that a shock to the real exchange rate has a negative effect on credit and almost no
effect on the spread.
Figures 19 and 20 show the same set of results for the durables and non-durables
sector. Once again the results are supportive of our hypothesis. A shock the spread has
a negative and permanent effect on the durables sector output and aggregate output, but
almost no effect on the non-durables sector’s output. In addition, a shock to credit has a
positive and permanent effect on the output of the durables sector and aggregate output,
but not the non-durables sector output.
Finally, the results for the construction and mining sector are shown in Figures
21 and 22. The graphs show that the effect of a shock to credit has almost no significant
effect on either sector’s output. But, a shock to the spread has a negative and
permanent effect, after almost two years, on the construction sector’s output, which is
reasonable, given the long term nature of the construction industry’s output.
Just as with the variance decompositions, however, the results for the impulse
response functions with investment in the construction sector versus aggregate
investment are much more favorable to our hypothesis. Figures 23 and 24 show that a
shock to credit has a strong positive and permanent effect on investment in the
construction sector but no effect on aggregate investment. Furthermore, this result also
holds for a shock in the spread, which has a strong negative effect on the sector’s
investment but not on aggregate investment.
The analysis presented above leads to some important conclusions. First, we
find that the sectoral evidence for Mexico confirms our hypothesis. The results are
consistent with the supposition that financial liberalization affects a country’s output
25 The results for the variance decompositions of the real exchange rate equation are available uponrequest.

35
and investment because it has a profound effect on the availability and accessibility of
credit to firms, particularly small and relatively credit constrained firms. This is
because we demonstrate that shocks to credit and the spread, which we consider our
measures of financial liberalization, have a profound effect on the output of sectors that
are considered a priori to be more credit dependent. Moreover, we showed that the
impact on each sector’s output of shocks to these two variables are is larger than that of
any other variable in the VEC’s (particularly the exchange rate). And second, we find
that the magnitude of the dynamic responses and the composition of output changes
cannot be reconciled with a story in which financial liberalization does not matter for
investment and therefore growth. This is the case since we find that the output of those
sectors that are considered to be relatively more dependent on bank credit reacts more to
shocks in the either the spread or credit than the output of sectors that are not dependent
on bank credit.
Section IV. Conclusions
Mexico’s financial landscape has changed drastically over the last two decades.
These changes have had a deep impact on Mexico’s financial structure, with the stock
market and non-bank financial institutions gaining ground relative to banks as
intermediaries for the private sector’s savings and investment. When analyzing these
changes, we find that the relative size, activity and efficiency of these institutions has
increased. Mexico today can be considered, according to the above criteria, to be a
market-based system. However, this is due not only to the significant increase in the
size and activity of the stock market over the last 12 years, but to the important decline
in its banking system’s size and activity.
Given that the changes in financial structure took place at an accelerated pace
after the financial liberalization that began in 1988/89, we consider that these changes in
the macroeconomic and financial rules of the game had a deep impact on economic
activity and growth. In particular, we stipulate that financial liberalization and the
consequent changes in financial structure had an effect on economic growth by
increasing the availability of credit to all types of firms and sectors in the economy.
The results of the Vector Error Correction estimations show that an increase in
the availability of credit, either due to quantity or price effects, has a significant positive

36
effect on output and investment. Furthermore, we show that this effect is larger for
those sectors that can be considered relatively more liquidity constrained prior to the
financial liberalization period. In particular, we find that the output of manufactures,
construction, durables, and investment in the construction sector reacts more to shocks
in either the quantity or price of credit than their not so credit constrained counterparts.
37
Figure 15
-0 .0 6
-0 .0 4
-0 .0 2
0 .00
0 .02
0 .04
1 0 2 0 3 0
R e s p o n s e o f I N V t o I N V
- 0 . 0 6
- 0 . 0 4
- 0 . 0 2
0 .00
0 .02
0 .04
1 0 2 0 3 0
R e s p o n s e o f I N V t o R E R
-0 .0 6
-0 .0 4
-0 .0 2
0 .00
0 .02
0 .04
1 0 2 0 3 0
R e s p o n s e o f I N V t o C P P
-0 .06
-0 .04
-0 .02
0 .0 0
0 .0 2
0 .0 4
1 0 2 0 3 0
Response o f INV t o SPREAD
-0 .06
-0 .04
-0 .02
0 .0 0
0 .0 2
0 .0 4
1 0 2 0 3 0
Re s p o n s e o f I NV t o CRED
-0 .0 2
0 .00
0 .02
0 .04
0 .06
0 .08
1 0 2 0 3 0
R e s p o n s e o f R E R t o I N V
- 0 . 0 2
0 .00
0 .02
0 .04
0 .06
0 .08
1 0 2 0 3 0
R e s p o n s e o f R E R t o R E R
-0 .0 2
0 .00
0 .02
0 .04
0 .06
0 .08
1 0 2 0 3 0
R e s p o n s e o f R E R t o C P P
-0 .02
0 .0 0
0 .0 2
0 .0 4
0 .0 6
0 .0 8
1 0 2 0 3 0
Response o f RER to SPREAD
-0 .02
0 .0 0
0 .0 2
0 .0 4
0 .0 6
0 .0 8
1 0 2 0 3 0
Response o f RER t o CRED
-6
-4
-2
0
2
4
1 0 2 0 3 0
R e s p o n s e o f C P P t o I N V
-6
-4
-2
0
2
4
1 0 2 0 3 0
Res p o n s e o f CPP t o RER
-6
-4
-2
0
2
4
1 0 2 0 3 0
R e s p o n s e o f C P P t o C P P
-6
-4
-2
0
2
4
1 0 2 0 3 0
Response o f CPP to SPREAD
-6
-4
-2
0
2
4
1 0 2 0 3 0
Response o f CPP t o CRED
-0 .4
0 .0
0 .4
0 .8
1 .2
1 .6
1 0 2 0 3 0
Resp o n s e o f SPREAD t o INV
-0 .4
0 .0
0 .4
0 .8
1 .2
1 .6
1 0 2 0 3 0
Response o f SPREAD to RER
-0 .4
0 .0
0 .4
0 .8
1 .2
1 .6
1 0 2 0 3 0
Response o f SPREAD to CPP
-0.4
0 .0
0 .4
0 .8
1 .2
1 .6
1 0 2 0 3 0
Response of SPREAD to SPREAD
-0.4
0 .0
0 .4
0 .8
1 .2
1 .6
1 0 2 0 3 0
Response o f SPREAD to CRED
-0 .1 0
-0 .0 8
-0 .0 6
-0 .0 4
-0 .0 2
0 .00
0 .02
0 .04
1 0 2 0 3 0
Re s p o n s e o f CRED t o I NV
- 0 . 1 0
- 0 . 0 8
- 0 . 0 6
- 0 . 0 4
- 0 . 0 2
0 .00
0 .02
0 .04
1 0 2 0 3 0
Response o f CRED t o RER
-0 .1 0
-0 .0 8
-0 .0 6
-0 .0 4
-0 .0 2
0 .00
0 .02
0 .04
1 0 2 0 3 0
Response o f CRED t o CPP
-0 .10
-0 .08
-0 .06
-0 .04
-0 .02
0 .0 0
0 .0 2
0 .0 4
1 0 2 0 3 0
Response o f CRED t o SPREAD
-0 .10
-0 .08
-0 .06
-0 .04
-0 .02
0 .0 0
0 .0 2
0 .0 4
1 0 2 0 3 0
Response o f CRED t o CRED
Investment

38
Figure 16.
-0 . 0 1 5
-0 . 0 1 0
-0 . 0 0 5
0 . 0 0 0
0 . 0 0 5
0 . 0 1 0
0 . 0 1 5
1 0 2 0 3 0
R e s p o n s e o f I P t o I P
- 0 . 0 1 5
- 0 . 0 1 0
- 0 . 0 0 5
0 . 0 0 0
0 . 0 0 5
0 . 0 1 0
0 . 0 1 5
1 0 2 0 3 0
R e s p o n s e o f I P t o R E R
-0 . 0 1 5
-0 . 0 1 0
-0 . 0 0 5
0 . 0 0 0
0 . 0 0 5
0 . 0 1 0
0 . 0 1 5
1 0 2 0 3 0
R e s p o n s e o f I P t o C P P
- 0 . 0 1 5
- 0 . 0 1 0
- 0 . 0 0 5
0 . 0 0 0
0 . 0 0 5
0 . 0 1 0
0 . 0 1 5
1 0 2 0 3 0
Respo n s e o f I P t o SPREAD
-0 . 0 1 5
-0 . 0 1 0
-0 . 0 0 5
0 . 0 0 0
0 . 0 0 5
0 . 0 1 0
0 . 0 1 5
1 0 2 0 3 0
R e s p o n s e o f I P t o C R E D
-0 . 0 2
-0 . 0 1
0 . 0 0
0 . 0 1
0 . 0 2
0 . 0 3
0 . 0 4
0 . 0 5
1 0 2 0 3 0
R e s p o n s e o f R E R t o I P
-0 . 0 2
-0 . 0 1
0 . 0 0
0 . 0 1
0 . 0 2
0 . 0 3
0 . 0 4
0 . 0 5
1 0 2 0 3 0
Response o f RER t o RER
-0 . 0 2
-0 . 0 1
0 . 0 0
0 . 0 1
0 . 0 2
0 . 0 3
0 . 0 4
0 . 0 5
1 0 2 0 3 0
Res p o n s e o f RER t o CPP
- 0 . 0 2
- 0 . 0 1
0 . 0 0
0 . 0 1
0 . 0 2
0 . 0 3
0 . 0 4
0 . 0 5
1 0 2 0 3 0
Response o f RER t o SPREAD
-0 . 0 2
-0 . 0 1
0 . 0 0
0 . 0 1
0 . 0 2
0 . 0 3
0 . 0 4
0 . 0 5
1 0 2 0 3 0
Resp o n s e o f RER t o CRED
-6
-4
-2
0
2
4
6
1 0 2 0 3 0
R e s p o n s e o f C P P t o I P
-6
-4
-2
0
2
4
6
1 0 2 0 3 0
Response o f CPP t o RER
-6
-4
-2
0
2
4
6
1 0 2 0 3 0
R e s p o n s e o f C P P t o C P P
-6
-4
-2
0
2
4
6
1 0 2 0 3 0
Response o f CPP t o SPREAD
-6
-4
-2
0
2
4
6
1 0 2 0 3 0
Resp o n s e o f CPP t o CRED
-0.4
0 . 0
0 . 4
0 . 8
1 . 2
1 . 6
1 0 2 0 3 0
R e s p o n s e o f S P R E A D t o I P
-0.4
0 .0
0 .4
0 .8
1 .2
1 .6
1 0 2 0 3 0
Response o f SPREAD t o RER
-0.4
0 . 0
0 . 4
0 . 8
1 . 2
1 . 6
1 0 2 0 3 0
Response o f SPREAD t o CPP
-0 .4
0 . 0
0 . 4
0 . 8
1 . 2
1 . 6
1 0 2 0 3 0
Response of SPREAD to SPREAD
-0.4
0 . 0
0 . 4
0 . 8
1 . 2
1 . 6
1 0 2 0 3 0
Response o f SPREAD t o CRED
-0 . 1 0
-0 . 0 8
-0 . 0 6
-0 . 0 4
-0 . 0 2
0 . 0 0
0 . 0 2
0 . 0 4
1 0 2 0 3 0
R e s p o n s e o f C R E D t o I P
-0 . 1 0
-0 . 0 8
-0 . 0 6
-0 . 0 4
-0 . 0 2
0 . 0 0
0 . 0 2
0 . 0 4
1 0 2 0 3 0
Response o f CRED t o RER
-0 . 1 0
-0 . 0 8
-0 . 0 6
-0 . 0 4
-0 . 0 2
0 . 0 0
0 . 0 2
0 . 0 4
1 0 2 0 3 0
Response o f CRED t o CPP
- 0 . 1 0
- 0 . 0 8
- 0 . 0 6
- 0 . 0 4
- 0 . 0 2
0 . 0 0
0 . 0 2
0 . 0 4
1 0 2 0 3 0
Response o f CRED to SPREAD
-0 . 1 0
-0 . 0 8
-0 . 0 6
-0 . 0 4
-0 . 0 2
0 . 0 0
0 . 0 2
0 . 0 4
1 0 2 0 3 0
Res p o n s e o f CRED t o CRED
Industrial Production

39
Figure 17.
- 0 . 0 1 5
- 0 . 0 1 0
- 0 . 0 0 5
0 . 0 0 0
0 . 0 0 5
0 . 0 1 0
0 . 0 1 5
1 0 2 0 3 0
R e s p o n s e o f I P t o I P
-0 . 0 1 5
-0 . 0 1 0
-0 . 0 0 5
0 . 0 0 0
0 . 0 0 5
0 . 0 1 0
0 . 0 1 5
1 0 2 0 3 0
R e s p o n s e o f I P t o M A N
- 0 . 0 1 5
- 0 . 0 1 0
- 0 . 0 0 5
0 . 0 0 0
0 . 0 0 5
0 . 0 1 0
0 . 0 1 5
1 0 2 0 3 0
R e s p o n s e o f I P t o R E R
-0 . 0 1 5
-0 . 0 1 0
-0 . 0 0 5
0 . 0 0 0
0 . 0 0 5
0 . 0 1 0
0 . 0 1 5
1 0 2 0 3 0
R e s p o n s e o f I P t o C P P
- 0 . 0 1 5
- 0 . 0 1 0
- 0 . 0 0 5
0 . 0 0 0
0 . 0 0 5
0 . 0 1 0
0 . 0 1 5
1 0 2 0 3 0
Response o f L IPSA t o SPREAD
-0 . 0 1 5
-0 . 0 1 0
-0 . 0 0 5
0 . 0 0 0
0 . 0 0 5
0 . 0 1 0
0 . 0 1 5
1 0 2 0 3 0
R e s p o n s e o f I P t o C R E D
- 0 . 0 1 5
- 0 . 0 1 0
- 0 . 0 0 5
0 . 0 0 0
0 . 0 0 5
0 . 0 1 0
0 . 0 1 5
1 0 2 0 3 0
R e s p o n s e o f M A N t o I P
-0 . 0 1 5
-0 . 0 1 0
-0 . 0 0 5
0 . 0 0 0
0 . 0 0 5
0 . 0 1 0
0 . 0 1 5
1 0 2 0 3 0
R e s p o n s e o f M A N t o M A N
- 0 . 0 1 5
- 0 . 0 1 0
- 0 . 0 0 5
0 . 0 0 0
0 . 0 0 5
0 . 0 1 0
0 . 0 1 5
1 0 2 0 3 0
R e s p o n s e o f M A N t o R E R
-0 . 0 1 5
-0 . 0 1 0
-0 . 0 0 5
0 . 0 0 0
0 . 0 0 5
0 . 0 1 0
0 . 0 1 5
1 0 2 0 3 0
R e s p o n s e o f M A N t o C P P
- 0 . 0 1 5
- 0 . 0 1 0
- 0 . 0 0 5
0 . 0 0 0
0 . 0 0 5
0 . 0 1 0
0 . 0 1 5
1 0 2 0 3 0
Res p o n s e o f MAN t o SPREAD
-0 . 0 1 5
-0 . 0 1 0
-0 . 0 0 5
0 . 0 0 0
0 . 0 0 5
0 . 0 1 0
0 . 0 1 5
1 0 2 0 3 0
R e s p o n s e o f M A N t o C R E D
-0 . 0 2
-0 . 0 1
0 . 0 0
0 . 0 1
0 . 0 2
0 . 0 3
0 . 0 4
0 . 0 5
1 0 2 0 3 0
R e s p o n s e o f R E R t o I P
- 0 . 0 2
- 0 . 0 1
0 . 0 0
0 . 0 1
0 . 0 2
0 . 0 3
0 . 0 4
0 . 0 5
1 0 2 0 3 0
R e s p o n s e o f R E R t o M A N
-0 . 0 2
-0 . 0 1
0 . 0 0
0 . 0 1
0 . 0 2
0 . 0 3
0 . 0 4
0 . 0 5
1 0 2 0 3 0
Res p o n s e o f RER t o RER
- 0 . 0 2
- 0 . 0 1
0 . 0 0
0 . 0 1
0 . 0 2
0 . 0 3
0 . 0 4
0 . 0 5
1 0 2 0 3 0
Response o f RER t o CPP
-0 . 0 2
-0 . 0 1
0 .0 0
0 .0 1
0 .0 2
0 .0 3
0 .0 4
0 .0 5
1 0 2 0 3 0
Response o f RE r t o SPREAD
- 0 . 0 2
- 0 . 0 1
0 . 0 0
0 . 0 1
0 . 0 2
0 . 0 3
0 . 0 4
0 . 0 5
1 0 2 0 3 0
Response o f RER t o CRED
-6
-4
-2
0
2
4
6
1 0 2 0 3 0
R e s p o n s e o f C P P t o I P
-6
-4
-2
0
2
4
6
1 0 2 0 3 0
R e s p o n s e o f C P P t o M A N
-6
-4
-2
0
2
4
6
1 0 2 0 3 0
Res p o n s e o f CPP t o RER
-6
-4
-2
0
2
4
6
1 0 2 0 3 0
Response o f CPP t o CPP
-6
-4
-2
0
2
4
6
1 0 2 0 3 0
Response o f CPP to SPREAD
-6
-4
-2
0
2
4
6
1 0 2 0 3 0
Response o f CPP t o CRED
-0 .4
0 . 0
0 . 4
0 . 8
1 . 2
1 0 2 0 3 0
Resp o n s e o f SPREAD t o I P
-0 .4
0 .0
0 .4
0 .8
1 .2
1 0 2 0 3 0
Res p o n s e o f SPREAD t o MAN
-0 .4
0 . 0
0 . 4
0 . 8
1 . 2
1 0 2 0 3 0
Response o f SPREAD to RER
-0 .4
0 .0
0 .4
0 .8
1 .2
1 0 2 0 3 0
Response o f SPREAD to CPP
-0 .4
0 . 0
0 . 4
0 . 8
1 . 2
1 0 2 0 3 0
Response of SPREAD to SPREAD
-0 .4
0 .0
0 .4
0 .8
1 .2
1 0 2 0 3 0
Response o f SPREAD to CRED
-0 . 1 2
-0 . 0 8
-0 . 0 4
0 . 0 0
0 . 0 4
1 0 2 0 3 0
R e s p o n s e o f C R E D t o I P
- 0 . 1 2
- 0 . 0 8
- 0 . 0 4
0 . 0 0
0 . 0 4
1 0 2 0 3 0
R e s p o n s e o f C R E D t o M A N
-0 . 1 2
-0 . 0 8
-0 . 0 4
0 . 0 0
0 . 0 4
1 0 2 0 3 0
Response o f CRED to RER
- 0 . 1 2
- 0 . 0 8
- 0 . 0 4
0 . 0 0
0 . 0 4
1 0 2 0 3 0
Response o f CRED t o CPP
-0 . 1 2
-0 . 0 8
-0 . 0 4
0 .0 0
0 .0 4
1 0 2 0 3 0
Response o f CRED to SPREAD
- 0 . 1 2
- 0 . 0 8
- 0 . 0 4
0 . 0 0
0 . 0 4
1 0 2 0 3 0
Response o f CRED t o CRED
Manufactures

40
Figure 18
- 0 . 0 1 5
- 0 . 0 1 0
- 0 . 0 0 5
0 . 0 0 0
0 . 0 0 5
0 . 0 1 0
0 . 0 1 5
1 0 2 0 3 0
R e s p o n s e o f I P t o I P
- 0 . 0 1 5
- 0 . 0 1 0
- 0 . 0 0 5
0 . 0 0 0
0 . 0 0 5
0 . 0 1 0
0 . 0 1 5
1 0 2 0 3 0
R e s p o n s e o f I P t o M A Q
- 0 . 0 1 5
- 0 . 0 1 0
- 0 . 0 0 5
0 . 0 0 0
0 . 0 0 5
0 . 0 1 0
0 . 0 1 5
1 0 2 0 3 0
R e s p o n s e o f I P t o R E R
- 0 . 0 1 5
- 0 . 0 1 0
- 0 . 0 0 5
0 . 0 0 0
0 . 0 0 5
0 . 0 1 0
0 . 0 1 5
1 0 2 0 3 0
R e s p o n s e o f I P t o C P P
- 0 . 0 1 5
- 0 . 0 1 0
- 0 . 0 0 5
0 . 0 0 0
0 . 0 0 5
0 . 0 1 0
0 . 0 1 5
1 0 2 0 3 0
Res p o n s e o f I P t o SPREAD
- 0 . 0 1 5
- 0 . 0 1 0
- 0 . 0 0 5
0 . 0 0 0
0 . 0 0 5
0 . 0 1 0
0 . 0 1 5
1 0 2 0 3 0
R e s p o n s e o f I P t o C R E D
-0 . 0 4
-0 . 0 2
0 . 0 0
0 . 0 2
0 . 0 4
1 0 2 0 3 0
R e s p o n s e o f M A Q t o I P
- 0 . 0 4
- 0 . 0 2
0 . 0 0
0 . 0 2
0 . 0 4
1 0 2 0 3 0
R e s p o n s e o f M A Q t o M A Q
-0 . 0 4
-0 . 0 2
0 . 0 0
0 . 0 2
0 . 0 4
1 0 2 0 3 0
R e s p o n s e o f M A Q t o R E R
-0 . 0 4
-0 . 0 2
0 . 0 0
0 . 0 2
0 . 0 4
1 0 2 0 3 0
R e s p o n s e o f M A Q t o C P P
- 0 . 0 4
- 0 . 0 2
0 . 0 0
0 . 0 2
0 . 0 4
1 0 2 0 3 0
R e s p o n s e o f M A Q t o S P R E A D
-0 . 0 4
-0 . 0 2
0 . 0 0
0 . 0 2
0 . 0 4
1 0 2 0 3 0
R e s p o n s e o f M A Q t o C R E D
-0 . 0 4
-0 . 0 2
0 . 0 0
0 . 0 2
0 . 0 4
0 . 0 6
1 0 2 0 3 0
R e s p o n s e o f R E R t o I P
- 0 . 0 4
- 0 . 0 2
0 . 0 0
0 . 0 2
0 . 0 4
0 . 0 6
1 0 2 0 3 0
R e s p o n s e o f R E R t o M A Q
-0 . 0 4
-0 . 0 2
0 . 0 0
0 . 0 2
0 . 0 4
0 . 0 6
1 0 2 0 3 0
Respo n s e o f RER t o RER
-0 . 0 4
-0 . 0 2
0 . 0 0
0 . 0 2
0 . 0 4
0 . 0 6
1 0 2 0 3 0
R e s p o n s e o f R E R t o C P P
- 0 . 0 4
- 0 . 0 2
0 . 0 0
0 . 0 2
0 . 0 4
0 . 0 6
1 0 2 0 3 0
Response o f RER to SPREAD
-0 . 0 4
-0 . 0 2
0 . 0 0
0 . 0 2
0 . 0 4
0 . 0 6
1 0 2 0 3 0
Response o f RER t o CRED
-8
-6
-4
-2
0
2
4
1 0 2 0 3 0
R e s p o n s e o f C P P t o I P
-8
-6
-4
-2
0
2
4
1 0 2 0 3 0
R e s p o n s e o f C P P t o M A Q
-8
-6
-4
-2
0
2
4
1 0 2 0 3 0
Respo n s e o f CPP t o RER
-8
-6
-4
-2
0
2
4
1 0 2 0 3 0
Respo n s e o f CPP t o CPP
-8
-6
-4
-2
0
2
4
1 0 2 0 3 0
Response o f CPP to SPREAD
-8
-6
-4
-2
0
2
4
1 0 2 0 3 0
Response o f CPP t o CRED
- 0 . 8
- 0 . 4
0 . 0
0 . 4
0 . 8
1 . 2
1 0 2 0 3 0
Res p o n s e o f SPREAD t o I P
- 0 . 8
- 0 . 4
0 . 0
0 . 4
0 . 8
1 . 2
1 0 2 0 3 0
Re s p o n s e o f SPREAD t o MAQ
- 0 . 8
- 0 . 4
0 . 0
0 . 4
0 . 8
1 . 2
1 0 2 0 3 0
Response o f SPREAD to RER
- 0 . 8
- 0 . 4
0 . 0
0 . 4
0 . 8
1 . 2
1 0 2 0 3 0
Response o f SPREAD to CPP
- 0 . 8
- 0 . 4
0 . 0
0 . 4
0 . 8
1 . 2
1 0 2 0 3 0
Response o f SPREAD to SPREAD
-0 .8
-0 .4
0 . 0
0 . 4
0 . 8
1 . 2
1 0 2 0 3 0
Response o f SPREAD to CRED
-0 . 1 0
-0 . 0 5
0 . 0 0
0 . 0 5
0 . 1 0
1 0 2 0 3 0
R e s p o n s e o f C R E D t o I P
- 0 . 1 0
- 0 . 0 5
0 . 0 0
0 . 0 5
0 . 1 0
1 0 2 0 3 0
R e s p o n s e o f C R E D t o M A Q
-0 . 1 0
-0 . 0 5
0 . 0 0
0 . 0 5
0 . 1 0
1 0 2 0 3 0
Respo n s e o f CRED t o RER
-0 . 1 0
-0 . 0 5
0 . 0 0
0 . 0 5
0 . 1 0
1 0 2 0 3 0
Respo n s e o f CRED t o CPP
- 0 . 1 0
- 0 . 0 5
0 . 0 0
0 . 0 5
0 . 1 0
1 0 2 0 3 0
Response o f CRED to SPREAD
-0 . 1 0
-0 . 0 5
0 . 0 0
0 . 0 5
0 . 1 0
1 0 2 0 3 0
Response o f CRED to CRED
Maquiladora Manufacturing
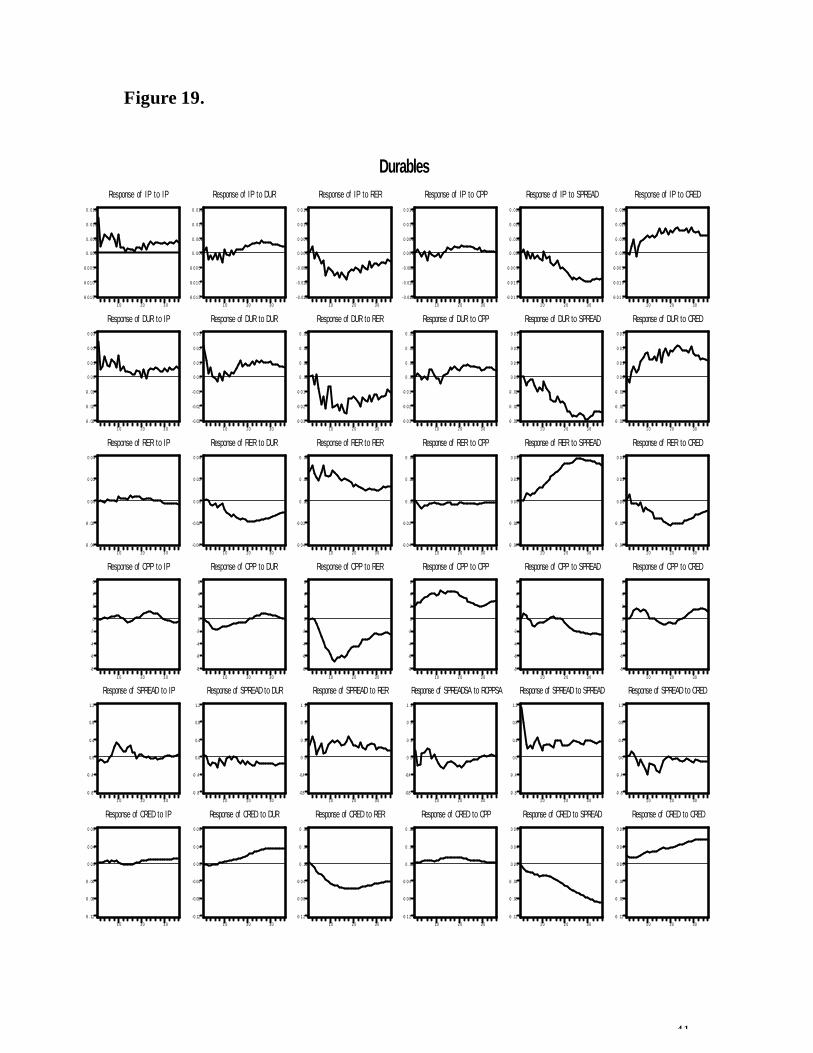
41
Figure 19.
-0 .0 1 5
-0 .0 1 0
-0 .0 0 5
0 . 0 0 0
0 . 0 0 5
0 . 0 1 0
0 . 0 1 5
1 0 2 0 3 0
R e s p o n s e o f I P t o I P
-0 .0 1 5
-0 .0 1 0
-0 .0 0 5
0 . 0 0 0
0 . 0 0 5
0 . 0 1 0
0 . 0 1 5
1 0 2 0 3 0
R e s p o n s e o f I P t o D U R
- 0 . 0 1 5
- 0 . 0 1 0
- 0 . 0 0 5
0 .0 0 0
0 .0 0 5
0 .0 1 0
0 .0 1 5
1 0 2 0 3 0
R e s p o n s e o f I P t o R E R
- 0 . 0 1 5
- 0 . 0 1 0
- 0 . 0 0 5
0 .0 0 0
0 .0 0 5
0 .0 1 0
0 .0 1 5
1 0 2 0 3 0
Re s p o n s e o f I P t o CPP
-0 .0 1 5
-0 .0 1 0
-0 .0 0 5
0 . 0 0 0
0 . 0 0 5
0 . 0 1 0
0 . 0 1 5
1 0 2 0 3 0
Response o f IP t o SPREAD
-0 .0 1 5
-0 .0 1 0
-0 .0 0 5
0 . 0 0 0
0 . 0 0 5
0 . 0 1 0
0 . 0 1 5
1 0 2 0 3 0
R e s p o n s e o f I P t o C R E D
-0 . 0 3
-0 . 0 2
-0 . 0 1
0 .0 0
0 .0 1
0 .0 2
0 .0 3
1 0 2 0 3 0
R e s p o n s e o f D U R t o I P
- 0 . 0 3
- 0 . 0 2
- 0 . 0 1
0 .0 0
0 .0 1
0 .0 2
0 .0 3
1 0 2 0 3 0
Re s p o n s e o f DUR t o DUR
-0 .0 3
-0 .0 2
-0 .0 1
0 . 0 0
0 . 0 1
0 . 0 2
0 . 0 3
1 0 2 0 3 0
R e s p o n s e o f D U R t o R E R
-0 .0 3
-0 .0 2
-0 .0 1
0 . 0 0
0 . 0 1
0 . 0 2
0 . 0 3
1 0 2 0 3 0
Response o f DUR t o CPP
-0 . 0 3
-0 . 0 2
-0 . 0 1
0 .0 0
0 .0 1
0 .0 2
0 .0 3
1 0 2 0 3 0
Response o f DUR to SPREAD
-0 . 0 3
-0 . 0 2
-0 . 0 1
0 .0 0
0 .0 1
0 .0 2
0 .0 3
1 0 2 0 3 0
Response o f DUR t o CRED
-0 . 0 4
-0 . 0 2
0 .0 0
0 .0 2
0 .0 4
1 0 2 0 3 0
R e s p o n s e o f R E R t o I P
- 0 . 0 4
- 0 . 0 2
0 .0 0
0 .0 2
0 .0 4
1 0 2 0 3 0
Re s p o n s e o f RER t o DUR
-0 .0 4
-0 .0 2
0 . 0 0
0 . 0 2
0 . 0 4
1 0 2 0 3 0
R e s p o n s e o f R E R t o R E R
-0 .0 4
-0 .0 2
0 . 0 0
0 . 0 2
0 . 0 4
1 0 2 0 3 0
Response o f RER t o CPP
-0 . 0 4
-0 . 0 2
0 .0 0
0 .0 2
0 .0 4
1 0 2 0 3 0
Response o f RER to SPREAD
-0 . 0 4
-0 . 0 2
0 .0 0
0 .0 2
0 .0 4
1 0 2 0 3 0
Response o f RER t o CRED
-8
-6
-4
-2
0
2
4
6
1 0 2 0 3 0
R e s p o n s e o f C P P t o I P
-8
-6
-4
-2
0
2
4
6
1 0 2 0 3 0
Re s p o n s e o f CPP t o DUR
-8
-6
-4
-2
0
2
4
6
1 0 2 0 3 0
R e s p o n s e o f C P P t o R E R
-8
-6
-4
-2
0
2
4
6
1 0 2 0 3 0
Response o f CPP t o CPP
-8
-6
-4
-2
0
2
4
6
1 0 2 0 3 0
Response o f CPP to SPREAD
-8
-6
-4
-2
0
2
4
6
1 0 2 0 3 0
Response o f CPP t o CRED
-0 .8
-0 .4
0 . 0
0 . 4
0 . 8
1 . 2
1 0 2 0 3 0
Response o f SPREAD t o IP
-0 .8
-0 .4
0 . 0
0 . 4
0 . 8
1 . 2
1 0 2 0 3 0
Response o f SPREAD t o DUR
-0.8
-0.4
0 .0
0 .4
0 .8
1 .2
1 0 2 0 3 0
Response o f SPREAD to RER
-0.8
-0.4
0 .0
0 .4
0 .8
1 .2
1 0 2 0 3 0
Response of SPREADSA to RCPPSA
-0 .8
-0 .4
0 . 0
0 . 4
0 . 8
1 . 2
1 0 2 0 3 0
Response of SPREAD to SPREAD
-0 .8
-0 .4
0 . 0
0 . 4
0 . 8
1 . 2
1 0 2 0 3 0
Response o f SPREAD to CRED
-0 . 1 2
-0 . 0 8
-0 . 0 4
0 .0 0
0 .0 4
0 .0 8
1 0 2 0 3 0
R e s p o n s e o f C R E D t o I P
- 0 . 1 2
- 0 . 0 8
- 0 . 0 4
0 .0 0
0 .0 4
0 .0 8
1 0 2 0 3 0
Response o f CRED to DUR
-0 .1 2
-0 .0 8
-0 .0 4
0 . 0 0
0 . 0 4
0 . 0 8
1 0 2 0 3 0
Response o f CRED t o RER
-0 .1 2
-0 .0 8
-0 .0 4
0 . 0 0
0 . 0 4
0 . 0 8
1 0 2 0 3 0
Response o f CRED t o CPP
-0 . 1 2
-0 . 0 8
-0 . 0 4
0 .0 0
0 .0 4
0 .0 8
1 0 2 0 3 0
Response o f CRED to SPREAD
-0 . 1 2
-0 . 0 8
-0 . 0 4
0 .0 0
0 .0 4
0 .0 8
1 0 2 0 3 0
Response o f CRED t o CRED
Durables

42
Figure 20
- 0 . 0 1 0
- 0 . 0 0 5
0 . 0 0 0
0 . 0 0 5
0 . 0 1 0
0 . 0 1 5
1 0 2 0 3 0
R e s p o n s e o f I P t o I P
- 0 . 0 1 0
- 0 . 0 0 5
0 . 0 0 0
0 . 0 0 5
0 . 0 1 0
0 . 0 1 5
1 0 2 0 3 0
R e s p o n s e o f I P t o N O D U R
- 0 . 0 1 0
- 0 . 0 0 5
0 . 0 0 0
0 . 0 0 5
0 . 0 1 0
0 . 0 1 5
1 0 2 0 3 0
Res p o n s e o f I P t o RER
-0 . 0 1 0
-0 . 0 0 5
0 . 0 0 0
0 . 0 0 5
0 . 0 1 0
0 . 0 1 5
1 0 2 0 3 0
R e s p o n s e o f I P t o C P P
- 0 . 0 1 0
- 0 . 0 0 5
0 . 0 0 0
0 . 0 0 5
0 . 0 1 0
0 . 0 1 5
1 0 2 0 3 0
R e s p o n s e o f I P t o S P R E A D
-0 . 0 1 0
-0 . 0 0 5
0 . 0 0 0
0 . 0 0 5
0 . 0 1 0
0 . 0 1 5
1 0 2 0 3 0
R e s p o n s e o f I P t o C R E D
- 0 . 0 1 0
- 0 . 0 0 5
0 . 0 0 0
0 . 0 0 5
0 . 0 1 0
0 . 0 1 5
0 . 0 2 0
1 0 2 0 3 0
R e s p o n s e o f N O D U R t o I P
- 0 . 0 1 0
- 0 . 0 0 5
0 . 0 0 0
0 . 0 0 5
0 . 0 1 0
0 . 0 1 5
0 . 0 2 0
1 0 2 0 3 0
R e s p o n s e o f N O D U R t o N O D U R
- 0 . 0 1 0
- 0 . 0 0 5
0 . 0 0 0
0 . 0 0 5
0 . 0 1 0
0 . 0 1 5
0 . 0 2 0
1 0 2 0 3 0
R e s p o n s e o f N O D U R t o R E R
-0 . 0 1 0
-0 . 0 0 5
0 . 0 0 0
0 . 0 0 5
0 . 0 1 0
0 . 0 1 5
0 . 0 2 0
1 0 2 0 3 0
Res p o n s e o f NODUR t o CPP
- 0 . 0 1 0
- 0 . 0 0 5
0 . 0 0 0
0 . 0 0 5
0 . 0 1 0
0 . 0 1 5
0 . 0 2 0
1 0 2 0 3 0
Resp o n s e o f NODUR t o SPREAD
-0 . 0 1 0
-0 . 0 0 5
0 . 0 0 0
0 . 0 0 5
0 . 0 1 0
0 . 0 1 5
0 . 0 2 0
1 0 2 0 3 0
Respon s e o f NODUR t o CRED
- 0 . 0 3
- 0 . 0 2
- 0 . 0 1
0 . 0 0
0 . 0 1
0 . 0 2
0 . 0 3
0 . 0 4
1 0 2 0 3 0
R e s p o n s e o f R E R t o I P
-0 . 0 3
-0 . 0 2
-0 . 0 1
0 . 0 0
0 . 0 1
0 . 0 2
0 . 0 3
0 . 0 4
1 0 2 0 3 0
R e s p o n s e o f R E R t o N O D U R
-0 . 0 3
-0 . 0 2
-0 . 0 1
0 . 0 0
0 . 0 1
0 . 0 2
0 . 0 3
0 . 0 4
1 0 2 0 3 0
R e s p o n s e o f R E R t o R E R
- 0 . 0 3
- 0 . 0 2
- 0 . 0 1
0 . 0 0
0 . 0 1
0 . 0 2
0 . 0 3
0 . 0 4
1 0 2 0 3 0
R e s p o n s e o f R E R t o C P P
-0 . 0 3
-0 . 0 2
-0 . 0 1
0 . 0 0
0 . 0 1
0 . 0 2
0 . 0 3
0 . 0 4
1 0 2 0 3 0
Response o f RER t o SPREAD
- 0 . 0 3
- 0 . 0 2
- 0 . 0 1
0 . 0 0
0 . 0 1
0 . 0 2
0 . 0 3
0 . 0 4
1 0 2 0 3 0
Response o f RER t o CRED
-4
-2
0
2
4
6
1 0 2 0 3 0
R e s p o n s e o f C P P t o I P
-4
-2
0
2
4
6
1 0 2 0 3 0
R e s p o n s e o f C P P t o N O D U R
-4
-2
0
2
4
6
1 0 2 0 3 0
R e s p o n s e o f C P P t o R E R
-4
-2
0
2
4
6
1 0 2 0 3 0
R e s p o n s e o f C P P t o C P P
-4
-2
0
2
4
6
1 0 2 0 3 0
Response o f CPP t o SPREAD
-4
-2
0
2
4
6
1 0 2 0 3 0
Response o f CPP t o CRED
- 0 . 8
-0 .4
0 .0
0 .4
0 .8
1 .2
1 0 2 0 3 0
Response o f SPREAD t o IP
- 0 . 8
-0 .4
0 . 0
0 . 4
0 . 8
1 . 2
1 0 2 0 3 0
Response o f SPREAD t o NODUR
-0 .8
-0 .4
0 . 0
0 . 4
0 . 8
1 . 2
1 0 2 0 3 0
Response o f SPREAD to RER
- 0 . 8
-0 .4
0 . 0
0 . 4
0 . 8
1 . 2
1 0 2 0 3 0
Response o f SPREAD to CPP
-0 .8
-0 .4
0 . 0
0 . 4
0 . 8
1 . 2
1 0 2 0 3 0
Response o f SPREAD to SPREAD
- 0 . 8
-0 .4
0 .0
0 .4
0 .8
1 .2
1 0 2 0 3 0
Response o f SPREAD to CRED
- 0 . 1 0
- 0 . 0 8
- 0 . 0 6
- 0 . 0 4
- 0 . 0 2
0 . 0 0
0 . 0 2
0 . 0 4
0 . 0 6
1 0 2 0 3 0
R e s p o n s e o f C R E D t o I P
-0 . 1 0
-0 . 0 8
-0 . 0 6
-0 . 0 4
-0 . 0 2
0 . 0 0
0 . 0 2
0 . 0 4
0 . 0 6
1 0 2 0 3 0
R e s p o n s e o f C R E D t o N O D U R
-0 . 1 0
-0 . 0 8
-0 . 0 6
-0 . 0 4
-0 . 0 2
0 . 0 0
0 . 0 2
0 . 0 4
0 . 0 6
1 0 2 0 3 0
Response o f CRED t o RER
- 0 . 1 0
- 0 . 0 8
- 0 . 0 6
- 0 . 0 4
- 0 . 0 2
0 . 0 0
0 . 0 2
0 . 0 4
0 . 0 6
1 0 2 0 3 0
Resp o n s e o f CRED t o CPP
-0 . 1 0
-0 . 0 8
-0 . 0 6
-0 . 0 4
-0 . 0 2
0 . 0 0
0 . 0 2
0 . 0 4
0 . 0 6
1 0 2 0 3 0
Response o f CRED to SPREAD
- 0 . 1 0
- 0 . 0 8
- 0 . 0 6
- 0 . 0 4
- 0 . 0 2
0 . 0 0
0 . 0 2
0 . 0 4
0 . 0 6
1 0 2 0 3 0
Response o f CRED to CRED
Non-Durables

43
Figure 21
-0 .0 1 0
-0 .0 0 5
0 .0 0 0
0 .0 0 5
0 .0 1 0
0 .0 1 5
0 .0 2 0
1 0 2 0 3 0
R e s p o n s e o f I P t o I P
- 0 . 0 1 0
- 0 . 0 0 5
0 .0 0 0
0 .0 0 5
0 .0 1 0
0 .0 1 5
0 .0 2 0
1 0 2 0 3 0
R e s p o n s e o f I P t o C O N S T
-0 .0 1 0
-0 .0 0 5
0 .0 0 0
0 .0 0 5
0 .0 1 0
0 .0 1 5
0 .0 2 0
1 0 2 0 3 0
R e s p o n s e o f I P t o R E R
-0 .0 1 0
-0 .0 0 5
0 . 0 0 0
0 . 0 0 5
0 . 0 1 0
0 . 0 1 5
0 . 0 2 0
1 0 2 0 3 0
R e s p o n s e o f I P t o C P P
-0 .0 1 0
-0 .0 0 5
0 . 0 0 0
0 . 0 0 5
0 . 0 1 0
0 . 0 1 5
0 . 0 2 0
1 0 2 0 3 0
Res p o n s e o f I P t o SPREAD
-0 .0 1 0
-0 .0 0 5
0 .0 0 0
0 .0 0 5
0 .0 1 0
0 .0 1 5
0 .0 2 0
1 0 2 0 3 0
R e s p o n s e o f I P t o C R E D
-0 .0 2
-0 .0 1
0 . 0 0
0 . 0 1
0 . 0 2
1 0 2 0 3 0
R e s p o n s e o f C O N S T t o I P
-0 .0 2
-0 .0 1
0 . 0 0
0 . 0 1
0 . 0 2
1 0 2 0 3 0
R e s p o n s e o f C O N S T t o C O N S T
-0 .0 2
-0 .0 1
0 .0 0
0 .0 1
0 .0 2
1 0 2 0 3 0
R e s p o n s e o f C O N S T t o R E R
-0 . 0 2
-0 . 0 1
0 .0 0
0 .0 1
0 .0 2
1 0 2 0 3 0
Res p o n s e o f CONST t o CPP
-0 . 0 2
-0 . 0 1
0 .0 0
0 .0 1
0 .0 2
1 0 2 0 3 0
Resp o n s e o f CONST t o SPREAD
-0 .0 2
-0 .0 1
0 .0 0
0 .0 1
0 .0 2
1 0 2 0 3 0
Re s p o n s e o f CONST t o CRED
-0 .0 2
-0 .0 1
0 . 0 0
0 . 0 1
0 . 0 2
0 . 0 3
0 . 0 4
1 0 2 0 3 0
R e s p o n s e o f R E R t o I P
-0 .0 2
-0 .0 1
0 . 0 0
0 . 0 1
0 . 0 2
0 . 0 3
0 . 0 4
1 0 2 0 3 0
Res p o n s e o f RER t o CONST
-0 .0 2
-0 .0 1
0 .0 0
0 .0 1
0 .0 2
0 .0 3
0 .0 4
1 0 2 0 3 0
Respo n s e o f RER t o RER
-0 . 0 2
-0 . 0 1
0 .0 0
0 .0 1
0 .0 2
0 .0 3
0 .0 4
1 0 2 0 3 0
Respo n s e o f RER t o CPP
-0 . 0 2
-0 . 0 1
0 .0 0
0 .0 1
0 .0 2
0 .0 3
0 .0 4
1 0 2 0 3 0
Response o f RER t o SPREAD
-0 .0 2
-0 .0 1
0 .0 0
0 .0 1
0 .0 2
0 .0 3
0 .0 4
1 0 2 0 3 0
Resp o n s e o f RER t o CRED
-3
-2
-1
0
1
2
3
4
1 0 2 0 3 0
R e s p o n s e o f C P P t o I P
-3
-2
-1
0
1
2
3
4
1 0 2 0 3 0
Res p o n s e o f CPP t o CONST
-3
-2
-1
0
1
2
3
4
1 0 2 0 3 0
Respo n s e o f CPP t o RER
-3
-2
-1
0
1
2
3
4
1 0 2 0 3 0
Respo n s e o f CPP t o CPP
-3
-2
-1
0
1
2
3
4
1 0 2 0 3 0
Response o f CPP t o SPREAD
-3
-2
-1
0
1
2
3
4
1 0 2 0 3 0
Resp o n s e o f CPP t o CRED
-1 .0
-0 .5
0 .0
0 .5
1 .0
1 .5
2 .0
1 0 2 0 3 0
Respon s e o f SPREAD t o IP
-1.0
-0.5
0 .0
0 .5
1 .0
1 .5
2 .0
1 0 2 0 3 0
Response o f SPREAD t o CONST
-1 .0
-0 .5
0 .0
0 .5
1 .0
1 .5
2 .0
1 0 2 0 3 0
Response o f SPREAD t o RER
-1 .0
-0 .5
0 . 0
0 . 5
1 . 0
1 . 5
2 . 0
1 0 2 0 3 0
Response o f SPREAD to CPP
-1 .0
-0 .5
0 .0
0 .5
1 .0
1 .5
2 .0
1 0 2 0 3 0
Response o f SPREAD to SPREAD
-1 .0
-0 .5
0 .0
0 .5
1 .0
1 .5
2 .0
1 0 2 0 3 0
Response o f SPREAD to CRED
-0 .0 6
-0 .0 4
-0 .0 2
0 . 0 0
0 . 0 2
0 . 0 4
0 . 0 6
0 . 0 8
1 0 2 0 3 0
R e s p o n s e o f C R E D t o I P
-0 .0 6
-0 .0 4
-0 .0 2
0 . 0 0
0 . 0 2
0 . 0 4
0 . 0 6
0 . 0 8
1 0 2 0 3 0
Response o f CRED t o CONST
-0 .0 6
-0 .0 4
-0 .0 2
0 .0 0
0 .0 2
0 .0 4
0 .0 6
0 .0 8
1 0 2 0 3 0
Response o f CRED t o RER
-0 . 0 6
-0 . 0 4
-0 . 0 2
0 .0 0
0 .0 2
0 .0 4
0 .0 6
0 .0 8
1 0 2 0 3 0
Response o f CRED t o CPP
-0 . 0 6
-0 . 0 4
-0 . 0 2
0 .0 0
0 .0 2
0 .0 4
0 .0 6
0 .0 8
1 0 2 0 3 0
Response o f CRED to SPREAD
-0 .0 6
-0 .0 4
-0 .0 2
0 .0 0
0 .0 2
0 .0 4
0 .0 6
0 .0 8
1 0 2 0 3 0
Response o f CRED to CRED
Construction

44
Figure 22
-0 .0 1 5
-0 .0 1 0
-0 .0 0 5
0 . 0 0 0
0 . 0 0 5
0 . 0 1 0
0 . 0 1 5
0 . 0 2 0
1 0 2 0 3 0
R e s p o n s e o f I P t o I P
-0 .0 1 5
-0 .0 1 0
-0 .0 0 5
0 . 0 0 0
0 . 0 0 5
0 . 0 1 0
0 . 0 1 5
0 . 0 2 0
1 0 2 0 3 0
R e s p o n s e o f I P t o M I N
- 0 . 0 1 5
- 0 . 0 1 0
- 0 . 0 0 5
0 .0 0 0
0 .0 0 5
0 .0 1 0
0 .0 1 5
0 .0 2 0
1 0 2 0 3 0
R e s p o n s e o f I P t o R E R
-0 .0 1 5
-0 .0 1 0
-0 .0 0 5
0 . 0 0 0
0 . 0 0 5
0 . 0 1 0
0 . 0 1 5
0 . 0 2 0
1 0 2 0 3 0
R e s p o n s e o f I P t o C P P
-0 .0 1 5
-0 .0 1 0
-0 .0 0 5
0 . 0 0 0
0 . 0 0 5
0 . 0 1 0
0 . 0 1 5
0 . 0 2 0
1 0 2 0 3 0
Res p o n s e o f I P t o SPREAD
- 0 . 0 1 5
- 0 . 0 1 0
- 0 . 0 0 5
0 .0 0 0
0 .0 0 5
0 .0 1 0
0 .0 1 5
0 .0 2 0
1 0 2 0 3 0
R e s p o n s e o f I P t o C R E D
-0 .0 1 0
-0 .0 0 5
0 . 0 0 0
0 . 0 0 5
0 . 0 1 0
0 . 0 1 5
0 . 0 2 0
1 0 2 0 3 0
R e s p o n s e o f M I N t o I P
-0 .0 1 0
-0 .0 0 5
0 . 0 0 0
0 . 0 0 5
0 . 0 1 0
0 . 0 1 5
0 . 0 2 0
1 0 2 0 3 0
R e s p o n s e o f M I N t o M I N
- 0 . 0 1 0
- 0 . 0 0 5
0 .0 0 0
0 .0 0 5
0 .0 1 0
0 .0 1 5
0 .0 2 0
1 0 2 0 3 0
R e s p o n s e o f M I N t o R E R
-0 .0 1 0
-0 .0 0 5
0 . 0 0 0
0 . 0 0 5
0 . 0 1 0
0 . 0 1 5
0 . 0 2 0
1 0 2 0 3 0
R e s p o n s e o f M I N t o C P P
-0 .0 1 0
-0 .0 0 5
0 . 0 0 0
0 . 0 0 5
0 . 0 1 0
0 . 0 1 5
0 . 0 2 0
1 0 2 0 3 0
R e s p o n s e o f M I N t o S P R E A D
- 0 . 0 1 0
- 0 . 0 0 5
0 .0 0 0
0 .0 0 5
0 .0 1 0
0 .0 1 5
0 .0 2 0
1 0 2 0 3 0
R e s p o n s e o f M I N t o C R E D
- 0 . 0 2
- 0 . 0 1
0 . 0 0
0 . 0 1
0 . 0 2
0 . 0 3
0 . 0 4
0 . 0 5
1 0 2 0 3 0
R e s p o n s e o f R E R t o I P
-0 . 0 2
-0 . 0 1
0 .0 0
0 .0 1
0 .0 2
0 .0 3
0 .0 4
0 .0 5
1 0 2 0 3 0
R e s p o n s e o f R E R t o M I N
-0 .0 2
-0 .0 1
0 . 0 0
0 . 0 1
0 . 0 2
0 . 0 3
0 . 0 4
0 . 0 5
1 0 2 0 3 0
Re s p o n s e o f RER t o RER
- 0 . 0 2
- 0 . 0 1
0 . 0 0
0 . 0 1
0 . 0 2
0 . 0 3
0 . 0 4
0 . 0 5
1 0 2 0 3 0
Response o f RER t o CPP
-0 . 0 2
-0 . 0 1
0 .0 0
0 .0 1
0 .0 2
0 .0 3
0 .0 4
0 .0 5
1 0 2 0 3 0
Response o f RER t o SPREAD
-0 .0 2
-0 .0 1
0 . 0 0
0 . 0 1
0 . 0 2
0 . 0 3
0 . 0 4
0 . 0 5
1 0 2 0 3 0
Respo n s e o f RER t o CRED
-4
-2
0
2
4
6
1 0 2 0 3 0
R e s p o n s e o f C P P t o I P
-4
-2
0
2
4
6
1 0 2 0 3 0
R e s p o n s e o f C P P t o M I N
-4
-2
0
2
4
6
1 0 2 0 3 0
Re s p o n s e o f CPP t o RER
-4
-2
0
2
4
6
1 0 2 0 3 0
Response o f CPP t o CPP
-4
-2
0
2
4
6
1 0 2 0 3 0
Response o f CPP t o SPREAD
-4
-2
0
2
4
6
1 0 2 0 3 0
Respo n s e o f CPP t o CRED
-1 .0
-0 .5
0 .0
0 .5
1 .0
1 .5
1 0 2 0 3 0
Response o f SPREAD t o IP
-1 .0
-0 .5
0 . 0
0 . 5
1 . 0
1 . 5
1 0 2 0 3 0
R e s p o n s e o f S P R E A D t o M I N
-1.0
-0.5
0 .0
0 .5
1 .0
1 .5
1 0 2 0 3 0
Respon s e o f SPREAD t o RER
-1 .0
-0 .5
0 .0
0 .5
1 .0
1 .5
1 0 2 0 3 0
Response o f SPREAD t o CPP
-1 .0
-0 .5
0 . 0
0 . 5
1 . 0
1 . 5
1 0 2 0 3 0
Response o f SPREAD to SPREAD
-1.0
-0.5
0 .0
0 .5
1 .0
1 .5
1 0 2 0 3 0
Response o f SPREAD t o CRED
- 0 . 0 8
- 0 . 0 6
- 0 . 0 4
- 0 . 0 2
0 . 0 0
0 . 0 2
0 . 0 4
0 . 0 6
1 0 2 0 3 0
R e s p o n s e o f C R E D t o I P
-0 . 0 8
-0 . 0 6
-0 . 0 4
-0 . 0 2
0 .0 0
0 .0 2
0 .0 4
0 .0 6
1 0 2 0 3 0
R e s p o n s e o f C R E D t o M I N
-0 .0 8
-0 .0 6
-0 .0 4
-0 .0 2
0 . 0 0
0 . 0 2
0 . 0 4
0 . 0 6
1 0 2 0 3 0
R e s p o n s e o f C R E D t o R E R
- 0 . 0 8
- 0 . 0 6
- 0 . 0 4
- 0 . 0 2
0 . 0 0
0 . 0 2
0 . 0 4
0 . 0 6
1 0 2 0 3 0
Response o f CRED t o CPP
-0 . 0 8
-0 . 0 6
-0 . 0 4
-0 . 0 2
0 .0 0
0 .0 2
0 .0 4
0 .0 6
1 0 2 0 3 0
Response o f CRED to SPREAD
-0 .0 8
-0 .0 6
-0 .0 4
-0 .0 2
0 . 0 0
0 . 0 2
0 . 0 4
0 . 0 6
1 0 2 0 3 0
Response o f CRED t o CRED
Mining

45
Figure 23
-0 . 0 6
-0 . 0 4
-0 . 0 2
0 . 0 0
0 . 0 2
0 . 0 4
1 0 2 0 3 0
R e s p o n s e o f I N V t o I N V
-0 . 0 6
-0 . 0 4
-0 . 0 2
0 . 0 0
0 . 0 2
0 . 0 4
1 0 2 0 3 0
R e s p o n s e o f I N V t o R E R
-0 . 0 6
-0 . 0 4
-0 . 0 2
0 . 0 0
0 . 0 2
0 . 0 4
1 0 2 0 3 0
R e s p o n s e o f I N V t o C P P
- 0 . 0 6
- 0 . 0 4
- 0 . 0 2
0 . 0 0
0 . 0 2
0 . 0 4
1 0 2 0 3 0
Response o f INV t o SPREAD
-0 . 0 6
-0 . 0 4
-0 . 0 2
0 . 0 0
0 . 0 2
0 . 0 4
1 0 2 0 3 0
R e s p o n s e o f I N V t o C R E D
-0 . 0 2
0 . 0 0
0 . 0 2
0 . 0 4
0 . 0 6
0 . 0 8
1 0 2 0 3 0
R e s p o n s e o f R E R t o I N V
-0 . 0 2
0 . 0 0
0 . 0 2
0 . 0 4
0 . 0 6
0 . 0 8
1 0 2 0 3 0
Response o f RER t o RER
-0 . 0 2
0 . 0 0
0 . 0 2
0 . 0 4
0 . 0 6
0 . 0 8
1 0 2 0 3 0
Response o f RER t o CPP
- 0 . 0 2
0 . 0 0
0 . 0 2
0 . 0 4
0 . 0 6
0 . 0 8
1 0 2 0 3 0
Response o f RER to SPREAD
-0 . 0 2
0 . 0 0
0 . 0 2
0 . 0 4
0 . 0 6
0 . 0 8
1 0 2 0 3 0
Resp o n s e o f RER t o CRED
-6
-4
-2
0
2
4
1 0 2 0 3 0
R e s p o n s e o f C P P t o I N V
-6
-4
-2
0
2
4
1 0 2 0 3 0
Res p o n s e o f CPP t o RER
-6
-4
-2
0
2
4
1 0 2 0 3 0
Response o f CPP t o CPP
-6
-4
-2
0
2
4
1 0 2 0 3 0
Response o f CPP to SPREAD
-6
-4
-2
0
2
4
1 0 2 0 3 0
Resp o n s e o f CPP t o CRED
-0.4
0 . 0
0 . 4
0 . 8
1 . 2
1 . 6
1 0 2 0 3 0
Res p o n s e o f SPREAD t o I NV
-0.4
0 .0
0 .4
0 .8
1 .2
1 .6
1 0 2 0 3 0
Response o f SPREAD t o RER
-0.4
0 .0
0 .4
0 .8
1 .2
1 .6
1 0 2 0 3 0
Response o f SPREAD to CPP
-0 .4
0 . 0
0 . 4
0 . 8
1 . 2
1 . 6
1 0 2 0 3 0
Response o f SPREAD to SPREAD
-0.4
0 . 0
0 . 4
0 . 8
1 . 2
1 . 6
1 0 2 0 3 0
Response o f SPREAD t o CRED
-0 . 1 0
-0 . 0 8
-0 . 0 6
-0 . 0 4
-0 . 0 2
0 . 0 0
0 . 0 2
0 . 0 4
1 0 2 0 3 0
R e s p o n s e o f C R E D t o I N V
-0 . 1 0
-0 . 0 8
-0 . 0 6
-0 . 0 4
-0 . 0 2
0 . 0 0
0 . 0 2
0 . 0 4
1 0 2 0 3 0
Response o f CRED t o RER
-0 . 1 0
-0 . 0 8
-0 . 0 6
-0 . 0 4
-0 . 0 2
0 . 0 0
0 . 0 2
0 . 0 4
1 0 2 0 3 0
Response o f CRED t o CPP
- 0 . 1 0
- 0 . 0 8
- 0 . 0 6
- 0 . 0 4
- 0 . 0 2
0 . 0 0
0 . 0 2
0 . 0 4
1 0 2 0 3 0
Response o f CRED to SPREAD
-0 . 1 0
-0 . 0 8
-0 . 0 6
-0 . 0 4
-0 . 0 2
0 . 0 0
0 . 0 2
0 . 0 4
1 0 2 0 3 0
Response o f CRED to CRED
Investment

46
Figure 24
-0 . 02
-0 . 01
0 . 0 0
0 . 0 1
0 . 0 2
0 . 0 3
1 0 2 0 3 0
Res p o n s e o f I NVCONST t o I NVCONST
- 0 . 0 2
- 0 . 0 1
0 .00
0 .01
0 .02
0 .03
1 0 2 0 3 0
Res p o n s e o f I NVCONST t o RER
-0 .0 2
-0 .0 1
0 . 0 0
0 . 0 1
0 . 0 2
0 . 0 3
1 0 2 0 3 0
Res p o n s e o f I NVCONST t o CPP
-0 . 02
-0 . 01
0 .00
0 .01
0 .02
0 .03
1 0 2 0 3 0
Respo n s e o f INVCONST t o SPREAD
-0 .0 2
-0 .0 1
0 .00
0 .01
0 .02
0 .03
1 0 2 0 3 0
Respo n s e o f INVCONST t o CRED
-0 . 02
-0 . 01
0 . 0 0
0 . 0 1
0 . 0 2
0 . 0 3
0 . 0 4
1 0 2 0 3 0
Resp o n s e o f RER t o I NVCONST
- 0 . 0 2
- 0 . 0 1
0 .00
0 .01
0 .02
0 .03
0 .04
1 0 2 0 3 0
R e s p o n s e o f R E R t o R E R
-0 .0 2
-0 .0 1
0 . 0 0
0 . 0 1
0 . 0 2
0 . 0 3
0 . 0 4
1 0 2 0 3 0
Response o f RER t o CPP
-0 . 02
-0 . 01
0 .00
0 .01
0 .02
0 .03
0 .04
1 0 2 0 3 0
Response o f RER to SPREAD
-0 .0 2
-0 .0 1
0 .00
0 .01
0 .02
0 .03
0 .04
1 0 2 0 3 0
Response o f RER t o CRED
-6
-4
-2
0
2
4
6
1 0 2 0 3 0
Response o f CPP t o INVCONST
-6
-4
-2
0
2
4
6
1 0 2 0 3 0
Res p o n s e o f CPP t o RER
-6
-4
-2
0
2
4
6
1 0 2 0 3 0
Res p o n s e o f CPP t o CPP
-6
-4
-2
0
2
4
6
1 0 2 0 3 0
Response o f CPP to SPREAD
-6
-4
-2
0
2
4
6
1 0 2 0 3 0
Response o f CPP t o CRED
-0.5
0 .0
0 .5
1 .0
1 .5
1 0 2 0 3 0
Response o f SPREAD to INVCONST
-0 .5
0 . 0
0 . 5
1 . 0
1 . 5
1 0 2 0 3 0
Response o f SPREAD to RER
-0 .5
0 .0
0 .5
1 .0
1 .5
1 0 2 0 3 0
Response o f SPREAD to CPP
-0.5
0 . 0
0 . 5
1 . 0
1 . 5
1 0 2 0 3 0
Response of SPREAD to SPREAD
-0 .5
0 . 0
0 . 5
1 . 0
1 . 5
1 0 2 0 3 0
Response o f SPREAD to CRED
-0 . 08
-0 . 06
-0 . 04
-0 . 02
0 . 0 0
0 . 0 2
0 . 0 4
0 . 0 6
0 . 0 8
1 0 2 0 3 0
Res p o n s e o f CRED t o I NVCONST
- 0 . 0 8
- 0 . 0 6
- 0 . 0 4
- 0 . 0 2
0 .00
0 .02
0 .04
0 .06
0 .08
1 0 2 0 3 0
Response o f CRED t o RER
-0 .0 8
-0 .0 6
-0 .0 4
-0 .0 2
0 . 0 0
0 . 0 2
0 . 0 4
0 . 0 6
0 . 0 8
1 0 2 0 3 0
Response o f CRED t o CPP
-0 . 08
-0 . 06
-0 . 04
-0 . 02
0 .00
0 .02
0 .04
0 .06
0 .08
1 0 2 0 3 0
Response o f CRED to SPREAD
-0 .0 8
-0 .0 6
-0 .0 4
-0 .0 2
0 .00
0 .02
0 .04
0 .06
0 .08
1 0 2 0 3 0
Response o f CRED t o CRED
Investment in Construction

REFERENCES
Aspe, A.P (1993), Economic Transformation: The Mexican Way , M.I.T. Press.
Babatz, G. and A. Conesa (1997), “The Effect of Financial Liberalization on the CapitalStructure and Investment Decisions of the Form: Evidence from Mexican Panel Data”,mimeo.
______, ______ (1997), “Exchange Rate Risk and the Debt Portafolio Composition ofthe Mexican Firms”, mimeo.
______, _______ (1997), “The Stock Market as a Source of Capital in EmergingMarkets: An Emperical Analysis of the Mexican Stock Exchange”, mimeo.
Banco de México (1996), The Mexican Economy 1996 (Mexico City: Banco de México)
______ (1997), The Mexican Economy 1997 (Mexico City: Banco de México)
______ (1998), The Mexican Economy 1998 (Mexico City: Banco de México)
Bayoumi, T. and P. Koujuanou (1998), “The Effects of Financial Deregulation onConsumption” IMF Working Paper 89/88, October.
Bernanke, B.S. (1986), “Alternative Explanations of the Money-Income Correlation” inK. Brunner and A. Meltzer eds. Real Business Cycles, Real Exchange Rates and ActualPolicies, Carnegie-Rochester Conferences Series on Public Policy 25 pp. 49-100.
______, and A.S. Blinder (1988), “Credit, Money and Aggregate Demand,” AmericanEconomic Review, Paper and Proceedings, LXXXVIII, pp. 435-439.
_______, and M. Gertler (1995) “Inside the Black Box: The Credit Channel ofMonetary Policy Transmission” Journal of Economic Perspectives Vol. 9 Num. 4 Fall1995.
Beck, T., A. Dermiguc-Kunt, and R. Levine (1999), “A New Database on FinancialDevelopment and Structure,” Policy Research Working Paper 1829. The World Bank
Chan-Lau, J.A. and Z. Chen (1998), “Financial Crises and credit Cunch as a Result ofIneddicient Financial Intermediation-with Reference to the Asian Financial Crises,”IMF Working Paper 98/127.
Copelman, M. (1996), “The Role of Credit in Post-stabilization Consumption Booms”International Finance Discussion Papers No. 569, Board of Governors of the FederalReserve System, October 1996.
_____, and A. Werner (1997), “Exchange Rate Policy and the Bank Lending Channel:Sectorial Evidence from Mexico” mimeo.

Dailami, M. and M. Guigale (1991), “Reflections on Credit Policy in developingCountries- Its Effect on Private Investment,” World Bank Policy, Research and ExternalAffairs Working Paper WPS 654 (Washington: The World Bank).
Demirguc-Kunt, A. and R. Levine (1999), “Bank-Based and Market-Based FinancialSystems: Cross-Country Comparisons”, Manuscript. The World Bank.
______, and V. Maksimovic (1994), “Stock Market Development and Firm FinancingChoices”, Policy Research Working Paper 1461. The World Bank.
Dornbusch, R. and A. Werner (1994), “Mexico: Stabilization, Reform and No Growth,”Brookings Papers on Economic Activity, Vol. 1, 1994.
Gallego, F. and N. Loayza (1999), “Financial Structure in Chile: MacroeconomicDevelopments and Microeconomic Effects,” mimeo
Garber, P. (1996), “Managing Risks to Financial Markets from Volatile Capital Flows:The Role of Prudential Regulation” (Paper, Brown University).
Gavito, J. and I. Trigueros (1993), “Los Efectos del TLC sobre las EntidadesFederativas,” (Paper, Insituto Tecnológico Autónomo de México, May).
Gelos, G. (1997), “How Did Financial Liberalization in Mexico Affect Investment?Evidence from Manufacturing Sector,” mimeo, Yale University.
_____ (1998), “Fixed Investment in the Mexican Manufacturing Sector: AdjustmentCosts, Credit Constraints, and the Efects of the Financial Liberalization,” Ph.D. Thesis,Yale University.
_____ and A. Werner (1998), “La Inversión Fija en el Sector Manufacturero Mexicano1985-94: El Rol de los Factores Financieros y el Impacto de la LiberalizaciónFinanciera,” Serie Documentos de Investigación, Banco de México, No. 9805.
_____ and A. Werner (1999), “Financial Liberalization, Credit Constraints, andCollateral: Investment in the Mexican Manufacturing Sector” IMF Working Paper
Glaessner, T.C. and D. Oks (1998), “NAFTA, Capital Mobility, and Mexico’s FinancialSystem,” Policy Research Working paper 1984, (Washington, The World Bank)
Goldsmith, R. (1969), “Financial Structure and Development,” Yale University Press,New Haven
Grether, J.M. (1994), “Trade Liberalization, Market Structure, and Performance inMexican Manufacturing 1985-90,” mimeo
Gruben, W.C. and R.P. McComb (1996), “Privatization, Competition andSupracompetition in the Mexican Commercial Banking System” (Paper, FederalReserve Bank of Dallas, Dallas).

______, and J. Welch (1996), “Distortions and Resolutions in Mexico’s FinancialSystem,” in Changing Structure of Mexico: Political Social and Economic Perspectives,ed. Laura Randall ( Armonk, N.Y.: M.E. Sharpe), pp. 63-76.
______, ______ (1996), “A Brief Modern History of the Mexican Financial System”(Paper, Federal Reserve Bank of Dallas, Dallas).
______, and R.P. McComb (1997), “Liberalization, Privatization and Crash: Mexico’sBanking System in the 1990’s,” Economic Review, Federal Reserve Bank of Dallas.
Levine, R. (1997), “Financial Development and Economic Growth: Views and Agenda”Journal of Economic Literature 35(2).
McComb, R., W. Gruben and J. Welch (1994), “Privatization and Performance in theMexican Financial Services Industry,” Quarterly Review of Economics and Finance 34(Special Issue) pp. 217-36.
Stiglitz, J. and A. Weiss (1981), “Credit Rationing in Markets with ImperfectInformation,” American Economic Review, pp. 393-410.
Sundararajan, V. And T. Baliño (1991), Issues in Recent Banking Crises,” in: V.Sundararajan, and T. Baliño (eds.), “Banking Crises: Cases and Issues,” InternationalMonetary Fund, Washington, D.C.
Tybout, J.R. (1983), “Credit Rationing and the Investment Behavior in a DevelopingCountry,” Review of Economics and Statistics 24, pp. 598-607