Embed Size (px)
Citation preview
Financial Structures and Economic Outcomes: An Empirical Analysis
Tom Gole and Tao Sun
WP/13/121
© 2013 International Monetary Fund WP/13/121
IMF Working Paper
Monetary and Capital Markets
Financial Structures and Economic Outcomes: An Empirical Analysis
Prepared by Tom Gole and Tao Sun1
Authorized for distribution by Laura Kodres
May 2013
Abstract
This paper investigates the potential relationships between financial structures and economic outcomes. The empirical results that withstand a battery of methods suggest that some financial intermediation structures are likely to be more closely related to positive economic outcomes than others. For instance, protective financial buffers within institutions have been associated with better economic performance, and a domestic financial system that is dominated by some types of nontraditional bank intermediation or that has a high proportion of foreign banks has in some cases been associated with adverse economic outcomes, especially during the financial crisis. The results also suggest that there may be trade-offs between beneficial effects on growth and stability of some financial structures. For example, the positive association of financial buffers with growth can diminish above a certain, relatively high, threshold—a too-safe system may limit the available funds for credit and hence growth.
JEL Classification Numbers: C33; F65; G18
Keywords: financial structures, economic outcomes, fixed-effects panel estimation
Author’s E-Mail Address: [email protected]; [email protected]
1 Thanks are due to Laura Kodres, Nicolas Arregui, Ken Chikada, John Kiff, and Erik Oppers. Research support was provided by Yoon Sook Kim.
This Working Paper should not be reported as representing the views of the IMF. The views expressed in this Working Paper are those of the author(s) and do not necessarily represent those of the IMF or IMF policy. Working Papers describe research in progress by the author(s) and are published to elicit comments and to further debate.
2
CONTENTS PAGE
I. Introduction ............................................................................................................................3 II. Literature Review: The Relationship between Financial Structures and Economic Outcomes .......................................................................................................4
A. Financial Development and Growth .........................................................................4 B. Financial Development and Growth Volatility .........................................................5 C. Financial Structure and Growth ................................................................................5 D. Financial Structure and Stability ...............................................................................6 E. Financial Development and Income Inequality .........................................................7
III. Data and Methodology .........................................................................................................8 A. Data ...........................................................................................................................8 B. Econometric Methodology ......................................................................................10
IV. Empirical Results ...............................................................................................................12 A. Fixed-Effects Panel Regressions with Interaction Terms .......................................14 B. Fixed-Effects Panel Estimation with Quadratic Term ............................................18
V. Conclusions .........................................................................................................................21 References ................................................................................................................................23 Tables 1. List of Variables Used in Regression Analysis ......................................................................8 2. Indices, Subindices, and Data Sources ..................................................................................9 3. Summary of Fixed-effects Panel Estimation Results on Economic Outcomes ...................13 4. Fixed-effects Panel Estimation with Interaction Term (1998–2010) ..................................17 5. Fixed-effects Panel Estimation with Quadratic Term (1998–2010) ....................................20
3
I. INTRODUCTION
The global financial crisis has required policymakers to reconsider the role that the structure of their financial systems plays in achieving good economic outcomes. Going forward, a number of forces—including the crisis itself, ongoing adjustments by market participants, crisis management responses by authorities, and an evolving regulatory reform agenda—can be expected to change the structure of the financial intermediation in fundamental ways.
The aim of this paper is to assess how these expected changes in the financial structures across countries will interact with economic outcomes. We will use measurements of financial structure and relate them to four indicators of economic outcomes: (1) the growth of real GDP per capita (real growth); (2) the volatility of real growth (which implies periodic economic booms and busts); (3) financial stability (financial crises lead to economic and social dislocations); and (4) income inequality, as measured by the Gini coefficient.
Since the relationship between the structure of the financial sector and economic performance has not been as intensively studied as the degree of financial development, the overall empirical results of this paper should be viewed as suggestive. First, data available on structural characteristics are only available from the late 1990s, making long-term relationships difficult to verify. Second, the period over which the empirical work can be conducted contains a very severe financial crisis, suggesting that even with good estimation techniques the results should be interpreted cautiously. Third, the proxies for financial structure are just that—proxies of concepts—and the interpretation of the results needs to consider their representativeness. Despite these provisos, this paper fills an important gap given (1) the prominence of innovative structural features in the near collapse of the financial system following Lehman’s failure and (2) the prospect of further structural changes (whether intended or not) as regulatory and other policies seek to prevent a replay of that crisis and to improve economic performance by making the financial system safer (see Chapter 3 of the October 2012 Global Financial Stability Report).
A related question we seek to investigate is whether the structural changes occurring in the financial system are making it safer in a way that will promote better economic outcomes. Rather than on the role of financial depth and development, we focus on structural features—such as the extent of unregulated intermediation (banks vs. nonbanks), competition and concentration, and domestic and cross border interconnectedness. Which of those features matter? How should these features be shaped to produce higher real growth, lower volatility of real growth, and a more stable financial system? These are new questions that the literature has not taken up thoroughly before.
While the results are to be interpreted cautiously, the preliminary evidence from 1998 to 2010 across 58 countries suggests that, indeed, some structures of financial systems are likely to be more closely related to positive economic and financial stability outcomes than others. On the positive side, protective financial buffers within institutions have been associated with better economic performance. On the negative side, a domestic financial system that is dominated by some types of nontraditional bank intermediation or that has a high proportion
4
of foreign banks has in some cases been associated with adverse economic outcomes, especially during the financial crisis.
The results also suggest that there may be levels beyond which the beneficial effects on growth and stability of some financial structures diminish. For example, the positive association of financial buffers with growth can diminish above a certain, relatively high, threshold—a too-safe system may limit the available funds for credit and hence growth. Similarly, cross border connections through foreign banks are beneficial most of the time, but during a crisis may be associated with instability or limit their active participation in the local economy. Hence, we cannot say that specific characteristics of a financial structure will always be associated with better outcomes, since there are cases where these characteristics may in fact have detrimental effects.
The paper concludes with a few tentative recommendations for regulatory reform and other financial policies to deliver preferred outcomes. These include: (i) encouraging sufficient financial buffers (although not so high so as to inhibit their intermediation role); (ii) ensuring foreign banks can support healthy financial globalization through a robust cross border resolution framework and other arrangements to ensure that financial flows are less volatile; and (iii) ensuring a more concrete discussion of how concentration of banking system assets in just a few large banks might hold the economy hostage through large, expensive implicit government guarantees.
The paper proceeds as follows. Section II briefly reviews the literature on the relationship between financial structures and economic outcomes. Section III discusses data and methodology for the econometric work. Section IV summarizes the empirical results. Section V concludes with key lessons learned and policy implications.
II. LITERATURE REVIEW: THE RELATIONSHIP BETWEEN FINANCIAL STRUCTURES AND
ECONOMIC OUTCOMES
A rich theoretical and empirical literature exists on the relationship between financial and economic outcomes. It has focused mostly on the relationship between financial development and growth, using proxies for the size of financial systems, and less on the effect of financial structures. Specifically:
A. Financial Development and Growth
There have long been two schools of thought with sharply differing perspectives on the potential importance of finance. On the one hand, economists such as Schumpeter (1911), Goldsmith (1969), McKinnon and Shaw (1973) saw financial intermediaries and markets as playing a key role in economic activity and growth. A battery of models articulates the mechanisms through which the financial system may affect long-run growth, stressing that financial markets enable small savers to pool funds, that these markets allocate investment to the highest return use, and that financial intermediaries partially overcome problems of adverse selection in credit markets. Empirically, researchers have shown that a range of financial indicators for size, depth, and functioning are robustly positively correlated with economic growth. For instance, Levine (2005) showed the deep and well-functioning
5
financial systems are associated with higher long-run growth. On the other hand, Robinson (1952) believed that the causality was reversed. Economies with good growth prospects develop institutions to provide the funds necessary to support those good prospects. In other words, in this view the economy leads, and finance follows. Lucas (1988) also dismissed the finance-economic growth relationship, stating that economists “badly over-stress” the role financial factors play in economic growth.
B. Financial Development and Growth Volatility
A large body of theoretical and empirical evidence suggests that larger and deeper financial systems help diversify risk and reduce the vulnerability of the economy to external shocks, thus smoothing output volatility. Easterly, Islam, and Stiglitz (2000) suggest that financial depth (as measured by private credit to GDP) reduces volatility up to a point, but too much private credit can increase volatility. Rancière, Tornell, and Westermann (2008) argue that countries with large financial sectors feature both higher growth and higher volatility. Moreover, Dabla-Norris and Narapong (2012) summarize the theoretical literature that outlines various mechanisms through which financial development can affect macroeconomic volatility. Aghion and others (1999) develop a theoretical model which combines financial market imperfections and unequal access to investment opportunities. They show that economies with poorly developed financial systems tend to be more volatile, as the demand for and supply of credit tends to be more cyclical. Empirically, Aghion and others (2010) find that deep financial systems can alleviate liquidity constraints on firms and facilitate long-term investment, reducing the volatility of investment and growth. In the same vein, Raddatz (2006) finds that sectors with larger liquidity needs in financially underdeveloped countries are more volatile and their economies experience deeper crises. Similarly, access to bank finance dampens output volatility at the industrial level due to countercyclical borrowing by financially constrained sectors (Larrain, 2006). Evidence at the household level suggests that access to financial services allows for greater risk smoothing (i.e., deviations of realized income from mean income). Dabla-Norris and Narapong (2012) also investigate the relationship between volatility and financial development in both advanced and developing economies.
C. Financial Structure and Growth
In considering the importance of financial structure for economic growth, economists have tended to focus on whether bank-based or market-based financial systems are more conducive to growth, with inconclusive results. Those who argue for the superiority of bank-based systems emphasize the advantages that banks and other intermediaries have in information acquisition and relationship formation (Grossman and Hart, 1980; Stiglitz, 1985; Bhide, 1993; Allen and Gale, 2000). However, proponents of market-based systems argue that bank-based systems tend to include intermediaries with monopoly power, and that bank-based systems tend to be more conservative and less flexible in nature (see Rajan 1992). There are also those who argue that neither type is more effective than the other at promoting growth; what matters is the financial system’s overall level of development (see for example, Rajan and Zingales, 1998).
6
Empirically, there has been little resounding evidence in favor of either bank-based or market-based systems. Beck and Levine (2004), Demirgüç-Kunt and Maksimovic (2002), and Levine (2003) all suggest that financial structure does not play a decisive role in growth. Others, however, find that after controlling for the effect of overall financial development on growth, the structure of the financial system can still matter. When countries have inflexible judicial systems so that they are less able to adapt laws to changing economic conditions, the degree of bank-orientation is positively correlated with long-run economic growth (Ergungor, 2008).
Some in the literature have considered in some depth whether a competitive or monopolistic banking structure is better for promoting growth. Some authors find support for high levels of competition (Jayaratne and Strahan, 1996; Cetorelli and Strahan, 2006; World Bank 2007), whereas others find that a more oligopolistic system better promotes growth (Jackson and Thomas, 1995; Petersen and Rajan, 1995). As for financial stability, Allen and Gale (2004) argue that excessive risk taking is contained when banks enjoy monopoly power, while Boyd and De Nicolò (2005) argue that monopoly power lowers borrowing firms’ profitability and incentivizes firms to take excessive risk, transferring subsequent losses to the banking system. Borrowing firm profitability may depend on industrial development stage. In early stages, firm profitability can be higher with larger investments of other firms (e.g., 19th century railroads, and more recently, the dot-com boom). In such cases, financial intermediaries compete, if allowed, to facilitate investments, resulting in higher growth and more stability (Ueda, 2012).
D. Financial Structure and Stability
There are two main dimensions of stability that matter: the volatility of economic growth and financial stability. Most research has been concerned with the volatility of economic growth; that is, the effect of financial structure on the occurrence of booms and recessions. Two papers analyze the role of the relative importance of equity and debt financing in macroeconomic volatility, with Denizer, Iyigun, and Owen (2000) finding that a higher share of equity financing leads to greater macroeconomic volatility, and Huizinga and Zhu (2006) reaching the opposite conclusion. There has been some research related to financial structure and financial stability. For instance, Rajan (2005) suggests that the increasing complexity of the modern financial system may create more financial-sector-induced procyclicality than in the past, and creates a greater probability of a catastrophic meltdown.
Some authors investigate the relationship between financial structure and financial stability. Barrell and others (2010a,b) and Kato and others (2010) expand existing work on early warning systems for banking crises to include buffer measures like capital and liquidity. They find that higher buffers have a marked negative effect on the probability of a banking crisis. Lund-Jensen (2012) finds that high levels of financial interconnectedness, proxied by non-core to core bank liabilities, hve a positive significant impact on the probability of a systemic banking crisis. Additionally, the BCBS 2010 report on long-term economic impact of stronger capital and liquidity requirements studies how higher buffers may reduce the amplitude of normal business cycles. In another study, Rosengren (2012) finds that certain financial structures (taking the degree to which money market mutual funds and broker-
7
dealers are present in the financial system as measures of structure) can make the financial system vulnerable to stresses.
The aim of this paper differs from seemingly similar work done in IMF (2006), which focused on comparing the economic cycle dynamics associated with "arms-length" versus "relationship-based" financial systems. Still, IMF (2006) was influential regarding the choice of variables used in this paper. Also, IMF (2006) abstracts from the detailed financial and regulatory factors considered here.
In all, however, conclusions about the relationships between differing financial structures and economic outcomes have been tentative and largely inconclusive. This is an important gap, since the structure of financial intermediation across the globe is changing, especially during the last two decades. It is important to assess how these changes in financial structures may be associated with economic outcomes. If these changes in financial structures are associated with lower longer-term growth or increases in economic volatility, there may be a role for government policies to try and “tweak” the changes in financial structures to promote better economic outcomes.
The implications of certain structural features are assessed with our three measures of performance—the pace of real per capita growth, the volatility of real per capita growth, and financial stress.2 As noted in Chapter 3 of the October 2012 GFSR, the desirable features of a financial system are thought to include one that is less complex and more transparent, better capitalized and features a more sustainable level of maturity mismatch. A safe system would be competitive but without encouraging excessive risk-taking or dependence on implicit government guarantees without paying for them. Finally, a system that allowed a healthy degree of risk diversification with well-managed institutions, both domestically and across borders would allow economies to benefit from financial globalization.
E. Financial Development and Income Inequality
Theory does not give clear guidance on whether financial development should increase or decrease income inequality. An argument that it may lower inequality is based on the idea that financial market imperfections, such as information asymmetries and transaction costs, may be more binding upon the poor. As a result, any financial development that relaxed those constraints would disproportionately benefit the poor (see Galor and Zeira (1993); Aghion and Bolton (1997); Galor and Moav (2004)). On the other hand, there is a literature arguing that because the poor typically rely on informal or family connections for capital, improvements in the formal financial sector disproportionately benefit the rich (see, for example, Greenwood and Jovanovic (1990)).
2 For the formal definitions of these variables, see Annex 3.1 in Chapter 3 of the October 2012 Global Financial Stability Report. The financial stress index is a monthly indicator of national financial system strain. See Cardarelli, Elekdag, and Lall (2011) for advanced economies and Balakrishnan and other (2009) for emerging economies. The indicator is used here at an annual frequency.
8
The empirical evidence is less mixed, strongly suggesting that financial development leads to lower inequality. Examples of papers that support this result include Clarke et al (2006) and Beck, Demirgüç-Kunt and Levine (2007), which also provides a thorough summary of the literature. Townsend and Ueda (2006) and Nikoloski (2012) find an inverted U-curve relationship between financial sector development and inequality. One paper that argues in the other direction is Claessens and Perotti (2007), which focuses on institutional factors and argues that financial development can be accompanied by the erection of barriers to entry by insiders, and so can lead to unequal access to finance and contribute to inequality. In contrast to the literature on financial development, there is very little written on the relationship of specific aspects of financial structure and inequality, beyond direct measures of financial access. This working paper aims to contribute to the study of that relationship.
III. DATA AND METHODOLOGY
A. Data
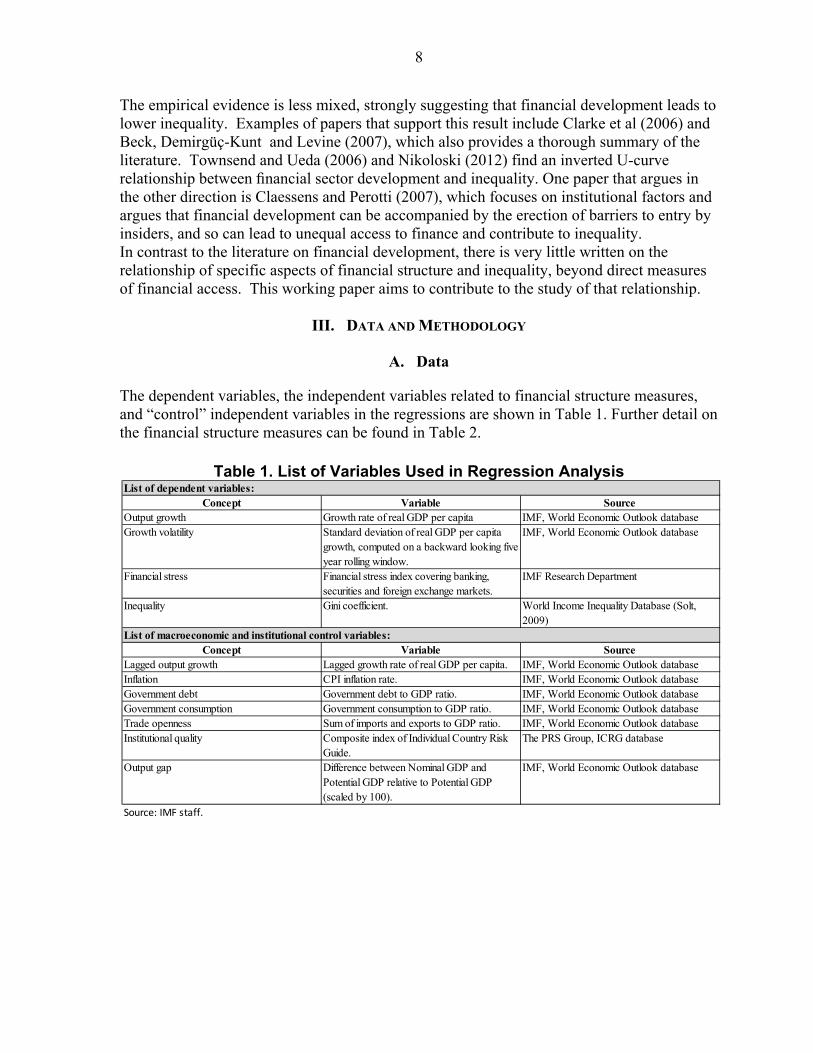
The dependent variables, the independent variables related to financial structure measures, and “control” independent variables in the regressions are shown in Table 1. Further detail on the financial structure measures can be found in Table 2.
Table 1. List of Variables Used in Regression Analysis
Concept Variable SourceOutput growth Growth rate of real GDP per capita IMF, World Economic Outlook databaseGrowth volatility Standard deviation of real GDP per capita
growth, computed on a backward looking five year rolling window.
IMF, World Economic Outlook database
Financial stress Financial stress index covering banking, securities and foreign exchange markets.
IMF Research Department
Inequality Gini coefficient. World Income Inequality Database (Solt, 2009)
Concept Variable SourceLagged output growth Lagged growth rate of real GDP per capita. IMF, World Economic Outlook databaseInflation CPI inflation rate. IMF, World Economic Outlook databaseGovernment debt Government debt to GDP ratio. IMF, World Economic Outlook databaseGovernment consumption Government consumption to GDP ratio. IMF, World Economic Outlook databaseTrade openness Sum of imports and exports to GDP ratio. IMF, World Economic Outlook databaseInstitutional quality Composite index of Individual Country Risk
Guide.The PRS Group, ICRG database
Output gap Difference between Nominal GDP and Potential GDP relative to Potential GDP (scaled by 100).
IMF, World Economic Outlook database
Source: IMF staff.
List of dependent variables:
List of macroeconomic and institutional control variables:
9
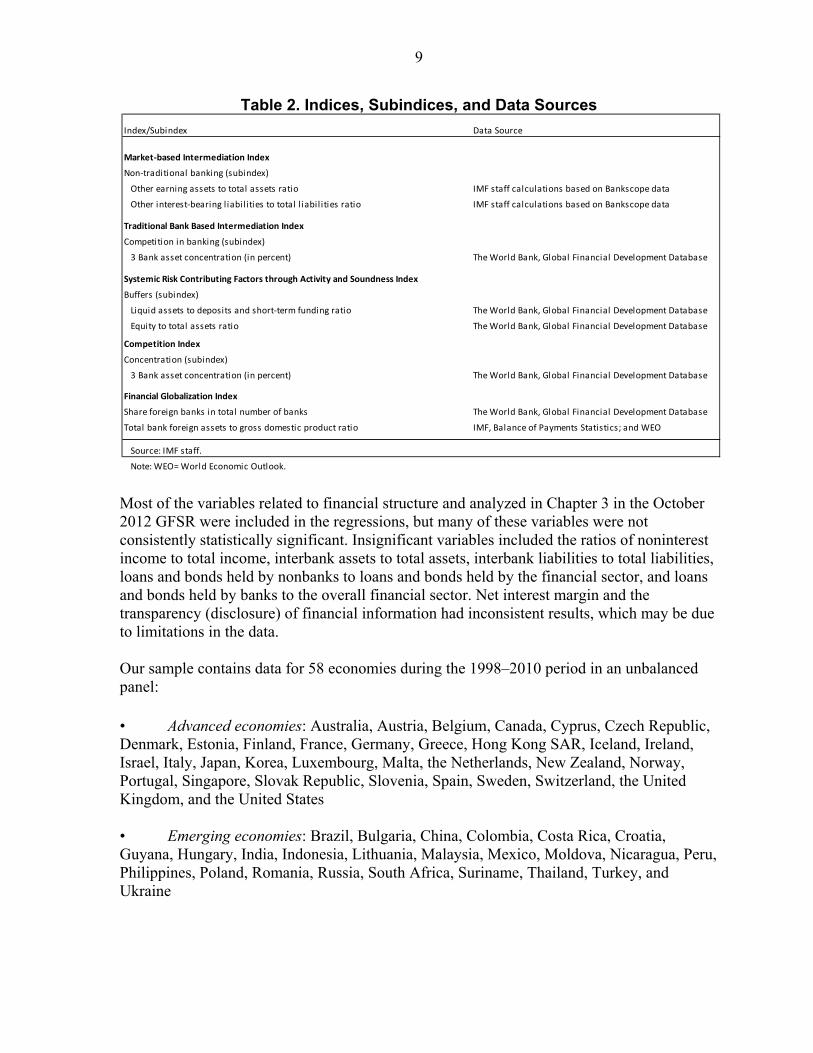
Table 2. Indices, Subindices, and Data Sources
Most of the variables related to financial structure and analyzed in Chapter 3 in the October 2012 GFSR were included in the regressions, but many of these variables were not consistently statistically significant. Insignificant variables included the ratios of noninterest income to total income, interbank assets to total assets, interbank liabilities to total liabilities, loans and bonds held by nonbanks to loans and bonds held by the financial sector, and loans and bonds held by banks to the overall financial sector. Net interest margin and the transparency (disclosure) of financial information had inconsistent results, which may be due to limitations in the data. Our sample contains data for 58 economies during the 1998–2010 period in an unbalanced panel: • Advanced economies: Australia, Austria, Belgium, Canada, Cyprus, Czech Republic, Denmark, Estonia, Finland, France, Germany, Greece, Hong Kong SAR, Iceland, Ireland, Israel, Italy, Japan, Korea, Luxembourg, Malta, the Netherlands, New Zealand, Norway, Portugal, Singapore, Slovak Republic, Slovenia, Spain, Sweden, Switzerland, the United Kingdom, and the United States • Emerging economies: Brazil, Bulgaria, China, Colombia, Costa Rica, Croatia, Guyana, Hungary, India, Indonesia, Lithuania, Malaysia, Mexico, Moldova, Nicaragua, Peru, Philippines, Poland, Romania, Russia, South Africa, Suriname, Thailand, Turkey, and Ukraine
Index/Subindex Data Source
Market-based Intermediation Index
Non-traditional banking (subindex)
Other earning assets to total assets ratio IMF staff calculations based on Bankscope data
Other interest-bearing liabil ities to total l iabil ities ratio IMF staff calculations based on Bankscope data
Traditional Bank Based Intermediation Index
Competition in banking (subindex)
3 Bank asset concentration (in percent) The World Bank, Global Financial Development Database
Systemic Risk Contributing Factors through Activity and Soundness Index
Buffers (subindex)
Liquid assets to deposits and short-term funding ratio The World Bank, Global Financial Development Database
Equity to total assets ratio The World Bank, Global Financial Development Database
Competition Index
Concentration (subindex)
3 Bank asset concentration (in percent) The World Bank, Global Financial Development Database
Financial Globalization Index
Share foreign banks in total number of banks The World Bank, Global Financial Development Database
Total bank foreign assets to gross domestic product ratio IMF, Balance of Payments Statistics; and WEO
Source: IMF staff.
Note: WEO= World Economic Outlook.
10
B. Econometric Methodology
Our interest is in the relationship between measures of financial structure and our set of dependent variables. Due to our relatively short sample period, we aim to use variation both across countries and over the length of our sample. Our short sample motivates the used of a country fixed effects specification as our primary specification (see below). 3 A “baseline” regression relates our dependent variables outcomes to financial structures and a set of controls. In addition, we include an interaction term between the financial structure variable being examined and a crisis dummy indicating whether a given country is undergoing a banking crisis. The purpose is to explore the possible differences in their relationships between good times and crisis periods. The baseline regression is then augmented to investigate the presence of nonlinearities in the relationship between financial structures and economic outcomes. We allow for these nonlinear effects by including a second-degree polynomial specification for the financial structure variables. To determine whether the relationship between financial structures and economic outcomes differs depending on different levels of economic development, the analysis is also conducted separately for each group of economies. Also, to control for the level of development the GDP per capita level was introduced, but it did not gain significance, as the fixed effect likely captured this concept in the cross-section of countries. The relative lack of data constrains our ability to estimate and interpret the results. The key difficulties include: The short sample period. Data on the financial structures are only consistently
available across a large enough sample of countries to perform meaningful empirical work since 1998. Hence, they are accompanied by a short, and relatively limited, set of macroeconomic circumstances. In particular, the period under study included a very severe financial crisis.
Incomplete measures of financial structure. The analysis relies on proxies for the concepts of financial structure. For example, to measure the level of financial globalization, the paper uses a measure of foreign bank presence (share of foreign banks in total number of banks) and a measure of domestic bank presence overseas (the ratio of total bank foreign assets to GDP). These variables capture important elements of financial globalization, but only imperfectly as they are only measuring certain aspects of globalization from the perspective of the banking sector.
Outliers. Some variables in certain countries exhibit large swings. As a robustness check, the regressions were re-run using a range of methods excluding these outliers.
3 Our short sample rules out using 5-year non-overlapping periods, a standard approach in the literature to controlling for the business cycle.
11
Difficulties in assessing statistical significance. The initial analysis included a range of structural variables that show no statistically significant relationship (see Section IV). However, this should not necessarily be interpreted as the evidence of there being no relationship between these other measures and economic outcomes; instead, this statistically insignificant relationship may be the result of insufficient variation in the data to detect a statistical relationship. In the same vein, the results reported in the paper are the relationships for which the analysis has shown sufficient evidence.
The analysis, as in other similar econometric work on economic growth, also faces two main econometric challenges: Possibility of a catch-up effect. The difference in economic development level may
affect econometric results. For instance, countries that start at a lower level of economic activity tend to grow faster than those which start at a higher level. There are also other country-specific factors that drive economic outcomes. Therefore, both GDP per capita and a country level fixed-effects panel specifications were employed separately.4 In addition, estimation is also done for advanced and emerging economies separately to broadly reflect the different level of economic development.
Possibility of reverse causation and endogeneity: As indicated in the literature, it might be economic outcomes that drive financial structure, rather than the other way around. One approach that can mitigate this problem is the Generalized Method of Moments (GMM) approach proposed by Arellano-Bond (1991), Arellano-Bover (1995) and Blundell-Bond (1998).5 This method is employed in addition to the fixed effects model with a lagged dependent variable, and provides conclusions that are broadly similar. While the analysis attempts to correct for any reverse causality, the econometric results are presented conservatively as providing information about associations between financial structures and economic outcomes, rather than relying on a clear identification of causal relationships.
In attempting to deal with this range of issues, the discussion in the text only presents variables where the estimated coefficients remain statistically significant (or remain insignificant of the same sign) across various specifications that were used, as well as across time, and across countries (or within subsets of countries), and with or without outliers. The battery of techniques provides some reasonable confidence that the results are “robust” and reflect the variables’ association with economic outcomes. In this paper, we report results from the fixed effects regressions, GMM results are available from the authors upon request.
4 One complication with this approach, combined with the use of a lagged dependent variable, is the possibility of so-called “Nickell bias”. See Nickell (1981). We use robust standard errors in all fixed effect regressions.
5 In the GMM estimation, Windmeijer finite-sample corrected standard errors are used. See Windmeijer (2005).
12
IV. EMPIRICAL RESULTS
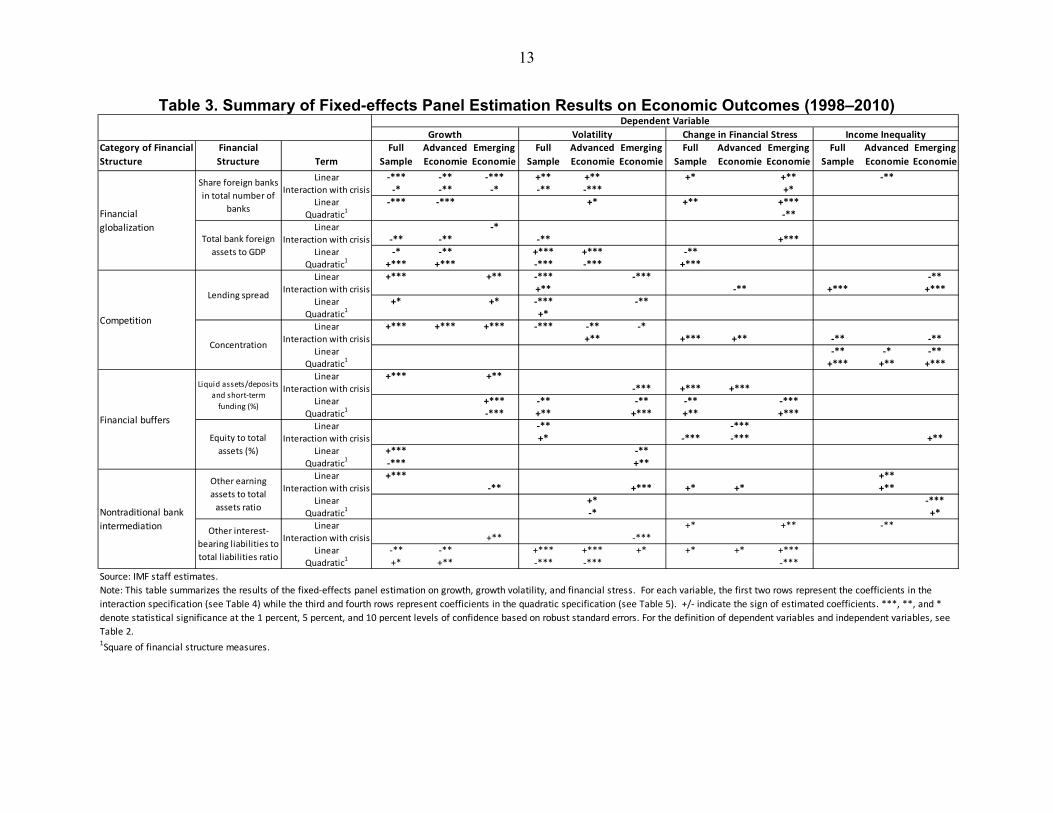
The results can be summarized as follows: in regressions that relate real GDP per capita growth, growth volatility, and changes in financial stress to measures of financial structure, the variables proxying for competition, financial buffers, financial globalization, and nontraditional bank intermediation have some statistical significance over the full period 1998–2010. However, for the proxies for financial globalization, the results seem to be driven mainly by the developments since the crisis as re-estimating the regressions using data through 2007 results in some of the relationships losing statistical significance. Table 3 reports relationships that are robust across several panel data specifications, meaning the coefficients were statistically significant using one of the techniques and did not change sign in the other techniques, and as well, did not change substantively if outliers were removed or other controls were introduced. It is worth noting that our results with respect to income inequality are generally less robust than our results for the other dependent variables, owing to a relative lack of data.
13
Table 3. Summary of Fixed-effects Panel Estimation Results on Economic Outcomes (1998–2010)
Category of Financial
Structure
Financial
Structure Term
Full
Sample
Advanced
Economie
Emerging
Economie
Full
Sample
Advanced
Economie
Emerging
Economie
Full
Sample
Advanced
Economie
Emerging
Economie
Full
Sample
Advanced
Economie
Emerging
Economie
Linear -*** -** -*** +** +** +* +** -**Interaction with crisis -* -** -* -** -*** +*
Linear -*** -*** +* +** +***Quadratic
1 -**Linear -*
Interaction with crisis -** -** -** +***Linear -* -** +*** +*** -**
Quadratic1 +*** +*** -*** -*** +***
Linear +*** +** -*** -*** -**Interaction with crisis +** -** +*** +***
Linear +* +* -*** -**Quadratic
1 +*Linear +*** +*** +*** -*** -** -*
Interaction with crisis +** +*** +** -** -**Linear -** -* -**
Quadratic1 +*** +** +***
Linear +*** +**Interaction with crisis -*** +*** +***
Linear +*** -** -** -** -***Quadratic
1 -*** +** +*** +** +***Linear -** -***
Interaction with crisis +* -*** -*** +**Linear +*** -**
Quadratic1 -*** +**
Linear +*** +**Interaction with crisis -** +*** +* +* +**
Linear +* -***Quadratic
1 -* +*Linear +* +** -**
Interaction with crisis +** -***Linear -** -** +*** +*** +* +* +* +***
Quadratic1 +* +** -*** -*** -***
Dependent Variable
1Square of financial structure measures.
Competition
Lending spread
Concentration
Financial buffers
Liquid assets/deposits
and short-term
funding (%)
Equity to total
assets (%)
Nontraditional bank
intermediation
Other earning
assets to total
assets ratio
Other interest-
bearing liabilities to
total liabilities ratio
Growth Volatility
Source: IMF staff estimates.
Change in Financial Stress
Financial
globalization
Share foreign banks
in total number of
banks
Total bank foreign
assets to GDP
Income Inequality
Note: This table summarizes the results of the fixed-effects panel estimation on growth, growth volatility, and financial stress. For each variable, the first two rows represent the coefficients in the
interaction specification (see Table 4) while the third and fourth rows represent coefficients in the quadratic specification (see Table 5). +/- indicate the sign of estimated coefficients. ***, **, and *
denote statistical significance at the 1 percent, 5 percent, and 10 percent levels of confidence based on robust standard errors. For the definition of dependent variables and independent variables, see
Table 2.

14
A. Fixed-Effects Panel Regressions with Interaction Terms
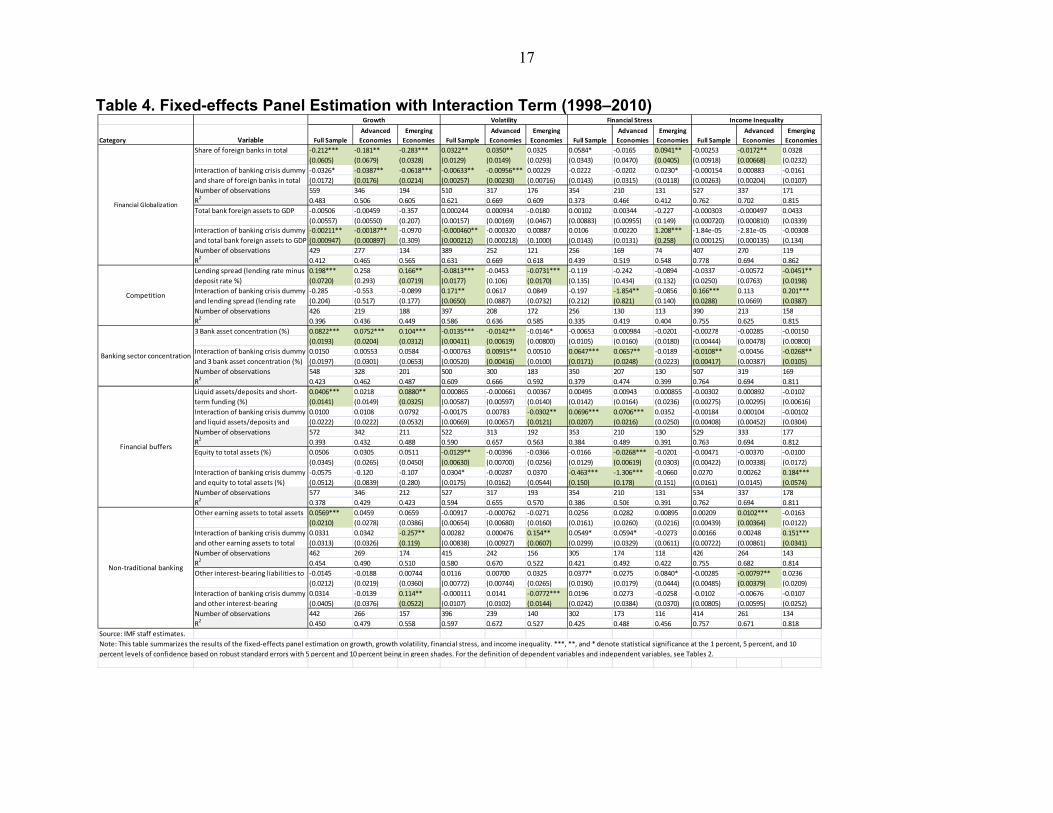
To investigate the possible differences between financial structures and economic outcomes during both good times and crisis periods, we run fixed-effects panel regressions with interaction terms (Table 4). Results for Growth A larger share of foreign banks in the domestic banking sector is associated with
lower economic growth. This result is robust in the full sample as well as separately for advanced and emerging economies. However, these relationships weaken when regressions are run using a sample that includes only data prior to 2007. Similarly, the interaction terms with crises are also significant in advanced economies, suggesting that having a banking sector with a high share of foreign banks is associated with poor outcomes during crisis periods. This difference between pre-crisis and crisis periods indicates a potentially destabilizing role played by foreign banks during the crisis as they could—and were sometimes forced to—deleverage and retrench relatively quickly.
The ratio of liquid assets to deposits and short-term funding is positively associated with economic growth in the full sample and in emerging economies, suggesting a positive role for liquidity buffers, possibly driven by the relatively larger emphasis on emerging economies.
Higher concentration and lending spreads are statistically significantly associated with higher growth and less growth volatility.6 One explanation is that higher spreads and lower competition enable banks to earn higher profits, and as a result they are less motivated to take excessive risk and thus less likely to cause or contribute to economic fluctuations. This result could, however, reflect a reverse causality: during periods of high growth, already dominant banks may become more prominent and be able to charge higher lending spreads.
Results for Volatility The share of foreign banks in the domestic banking sector is positively associated
with volatility, in the full sample and in advanced economies.
The interaction term with crises is negative in the full sample and advanced economies, suggesting that this positive relationship turns negative if a country is in a banking crisis.
6 While higher lending spreads traditionally signal lower competition, more recent economic models of competition show that this is not necessarily the case. A summary of this literature can be found in Degryse and Ongena (2008).
15
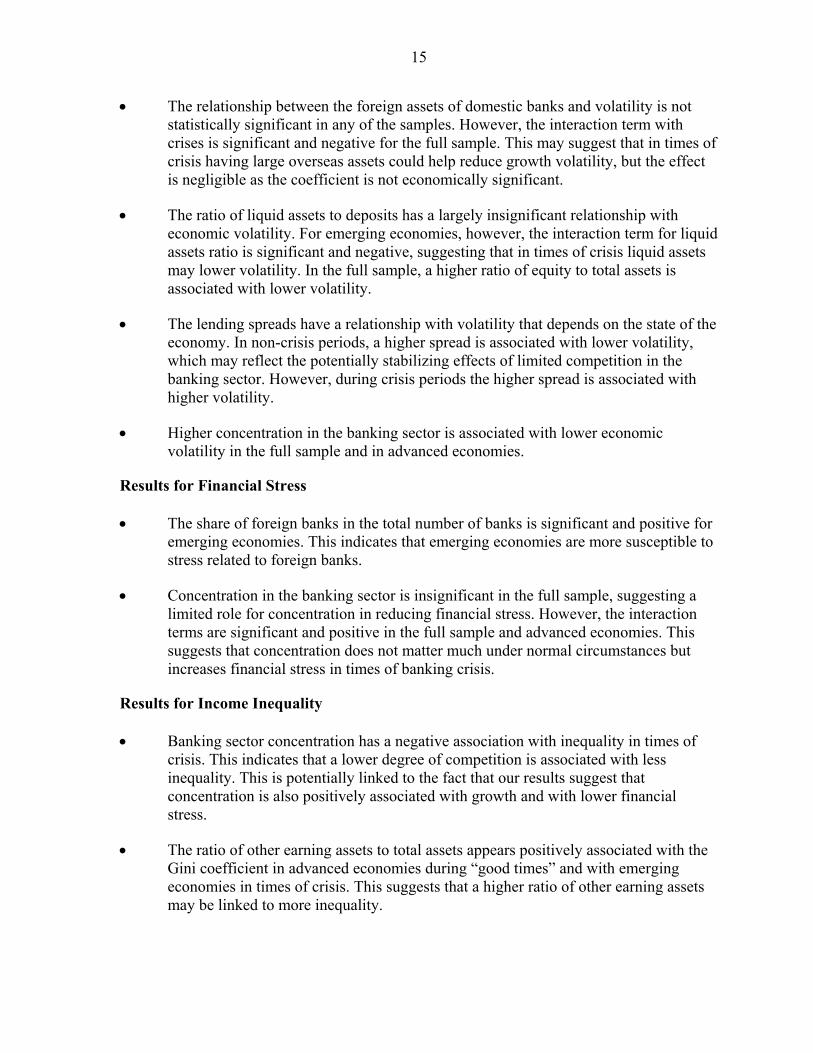
The relationship between the foreign assets of domestic banks and volatility is not statistically significant in any of the samples. However, the interaction term with crises is significant and negative for the full sample. This may suggest that in times of crisis having large overseas assets could help reduce growth volatility, but the effect is negligible as the coefficient is not economically significant.
The ratio of liquid assets to deposits has a largely insignificant relationship with economic volatility. For emerging economies, however, the interaction term for liquid assets ratio is significant and negative, suggesting that in times of crisis liquid assets may lower volatility. In the full sample, a higher ratio of equity to total assets is associated with lower volatility.
The lending spreads have a relationship with volatility that depends on the state of the economy. In non-crisis periods, a higher spread is associated with lower volatility, which may reflect the potentially stabilizing effects of limited competition in the banking sector. However, during crisis periods the higher spread is associated with higher volatility.
Higher concentration in the banking sector is associated with lower economic volatility in the full sample and in advanced economies.
Results for Financial Stress The share of foreign banks in the total number of banks is significant and positive for
emerging economies. This indicates that emerging economies are more susceptible to stress related to foreign banks.
Concentration in the banking sector is insignificant in the full sample, suggesting a limited role for concentration in reducing financial stress. However, the interaction terms are significant and positive in the full sample and advanced economies. This suggests that concentration does not matter much under normal circumstances but increases financial stress in times of banking crisis.
Results for Income Inequality Banking sector concentration has a negative association with inequality in times of
crisis. This indicates that a lower degree of competition is associated with less inequality. This is potentially linked to the fact that our results suggest that concentration is also positively associated with growth and with lower financial stress.
The ratio of other earning assets to total assets appears positively associated with the Gini coefficient in advanced economies during “good times” and with emerging economies in times of crisis. This suggests that a higher ratio of other earning assets may be linked to more inequality.
16
The share of foreign banks in the number of total banks appears negatively associated with the Gini coefficient in advanced economies, indicating that higher levels of financial globalization may be associated with less inequality.
The lending spread appears to be positively associated with the Gini coefficient in
times of crisis. This result corroborates the result regarding banking concentration: higher levels of banking competition appear to be associated with lower levels of inequality in times of crisis. However, in the emerging economies lower levels of banking competition (higher lending spreads) appear to be associated with lower levels of inequality in normal periods.
17
Table 4. Fixed-effects Panel Estimation with Interaction Term (1998–2010)
Category Variable Full Sample
Advanced
Economies
Emerging
Economies Full Sample
Advanced
Economies
Emerging
Economies Full Sample
Advanced
Economies
Emerging
Economies Full Sample
Advanced
Economies
Emerging
Economies
Share of foreign banks in total -0.212*** -0.181** -0.283*** 0.0322** 0.0350** 0.0325 0.0584* -0.0165 0.0941** -0.00253 -0.0172** 0.0328
(0.0605) (0.0679) (0.0328) (0.0129) (0.0149) (0.0293) (0.0343) (0.0470) (0.0405) (0.00918) (0.00668) (0.0232)
-0.0326* -0.0387** -0.0618*** -0.00633** -0.00956*** 0.00229 -0.0222 -0.0202 0.0230* -0.000154 0.000883 -0.0161
(0.0172) (0.0176) (0.0214) (0.00257) (0.00230) (0.00716) (0.0143) (0.0315) (0.0118) (0.00263) (0.00204) (0.0107)
Number of observations 559 346 194 510 317 176 354 210 131 527 337 171
R2
0.483 0.506 0.605 0.621 0.669 0.609 0.373 0.466 0.412 0.762 0.702 0.815
Total bank foreign assets to GDP -0.00506 -0.00459 -0.357 0.000244 0.000934 -0.0180 0.00102 0.00344 -0.227 -0.000303 -0.000497 0.0433
(0.00557) (0.00550) (0.207) (0.00157) (0.00169) (0.0467) (0.00883) (0.00955) (0.149) (0.000720) (0.000810) (0.0339)
-0.00211** -0.00187** -0.0970 -0.000460** -0.000320 0.00887 0.0106 0.00220 1.208*** -1.84e-05 -2.81e-05 -0.00308
(0.000947) (0.000897) (0.309) (0.000212) (0.000218) (0.1000) (0.0143) (0.0131) (0.258) (0.000125) (0.000135) (0.134)
Number of observations 429 277 134 389 252 121 256 169 74 407 270 119
R2
0.412 0.465 0.565 0.631 0.669 0.618 0.439 0.519 0.548 0.778 0.694 0.862
0.198*** 0.258 0.166** -0.0813*** -0.0453 -0.0731*** -0.119 -0.242 -0.0894 -0.0337 -0.00572 -0.0451**
(0.0720) (0.293) (0.0719) (0.0177) (0.106) (0.0170) (0.135) (0.434) (0.132) (0.0250) (0.0763) (0.0198)
-0.285 -0.553 -0.0899 0.171** 0.0617 0.0849 -0.197 -1.854** -0.0856 0.166*** 0.113 0.201***
(0.204) (0.517) (0.177) (0.0650) (0.0887) (0.0732) (0.212) (0.821) (0.140) (0.0288) (0.0669) (0.0387)
Number of observations 426 219 188 397 208 172 256 130 113 390 213 158
R2
0.396 0.436 0.449 0.586 0.636 0.585 0.335 0.419 0.404 0.755 0.625 0.815
3 Bank asset concentration (%) 0.0822*** 0.0752*** 0.104*** -0.0135*** -0.0142** -0.0146* -0.00653 0.000984 -0.0201 -0.00278 -0.00285 -0.00150
(0.0193) (0.0204) (0.0312) (0.00411) (0.00619) (0.00800) (0.0105) (0.0160) (0.0180) (0.00444) (0.00478) (0.00800)
0.0150 0.00553 0.0584 -0.000763 0.00915** 0.00510 0.0647*** 0.0657** -0.0189 -0.0108** -0.00456 -0.0268**
(0.0197) (0.0301) (0.0653) (0.00520) (0.00416) (0.0100) (0.0171) (0.0248) (0.0223) (0.00417) (0.00387) (0.0105)
Number of observations 548 328 201 500 300 183 350 207 130 507 319 169
R2
0.423 0.462 0.487 0.609 0.666 0.592 0.379 0.474 0.399 0.764 0.694 0.811
0.0406*** 0.0218 0.0880** 0.000865 -0.000661 0.00367 0.00495 0.00943 0.000855 -0.00302 0.000892 -0.0102
(0.0141) (0.0149) (0.0325) (0.00587) (0.00597) (0.0140) (0.0142) (0.0164) (0.0236) (0.00275) (0.00295) (0.00616)
0.0100 0.0108 0.0792 -0.00175 0.00783 -0.0302** 0.0696*** 0.0706*** 0.0352 -0.00184 0.000104 -0.00102
(0.0222) (0.0222) (0.0532) (0.00669) (0.00657) (0.0121) (0.0207) (0.0216) (0.0250) (0.00408) (0.00452) (0.0304)
Number of observations 572 342 211 522 313 192 353 210 130 529 333 177
R2
0.393 0.432 0.488 0.590 0.657 0.563 0.384 0.489 0.391 0.763 0.694 0.812
Equity to total assets (%) 0.0506 0.0305 0.0511 -0.0129** -0.00396 -0.0366 -0.0166 -0.0268*** -0.0201 -0.00471 -0.00370 -0.0100
(0.0345) (0.0265) (0.0450) (0.00630) (0.00700) (0.0256) (0.0129) (0.00619) (0.0303) (0.00422) (0.00338) (0.0172)
-0.0575 -0.120 -0.107 0.0304* -0.00287 0.0370 -0.463*** -1.306*** -0.0660 0.0270 0.00262 0.184***
(0.0512) (0.0839) (0.280) (0.0175) (0.0162) (0.0544) (0.150) (0.178) (0.151) (0.0161) (0.0145) (0.0574)
Number of observations 577 346 212 527 317 193 354 210 131 534 337 178
R2
0.378 0.429 0.423 0.594 0.655 0.570 0.386 0.506 0.391 0.762 0.694 0.811
Other earning assets to total assets 0.0569*** 0.0459 0.0659 -0.00917 -0.000762 -0.0271 0.0256 0.0282 0.00895 0.00209 0.0102*** -0.0163
(0.0210) (0.0278) (0.0386) (0.00654) (0.00680) (0.0160) (0.0161) (0.0260) (0.0216) (0.00439) (0.00364) (0.0122)
0.0331 0.0342 -0.257** 0.00282 0.000476 0.154** 0.0549* 0.0594* -0.0273 0.00166 0.00248 0.151***
(0.0313) (0.0326) (0.119) (0.00838) (0.00927) (0.0607) (0.0299) (0.0329) (0.0611) (0.00722) (0.00861) (0.0341)
Number of observations 462 269 174 415 242 156 305 174 118 426 264 143
R2
0.454 0.490 0.510 0.580 0.670 0.522 0.421 0.492 0.422 0.755 0.682 0.814
Other interest-bearing liabilities to -0.0145 -0.0188 0.00744 0.0116 0.00700 0.0325 0.0377* 0.0275 0.0840* -0.00285 -0.00797** 0.0236
(0.0212) (0.0219) (0.0360) (0.00772) (0.00744) (0.0265) (0.0190) (0.0179) (0.0444) (0.00485) (0.00379) (0.0209)
0.0314 -0.0139 0.114** -0.000111 0.0141 -0.0772*** 0.0196 0.0273 -0.0258 -0.0102 -0.00676 -0.0107
(0.0405) (0.0376) (0.0522) (0.0107) (0.0102) (0.0144) (0.0242) (0.0384) (0.0370) (0.00805) (0.00595) (0.0252)
Number of observations 442 266 157 396 239 140 302 173 116 414 261 134
R2
0.450 0.479 0.558 0.597 0.672 0.527 0.425 0.488 0.456 0.757 0.671 0.818
Source: IMF staff estimates.
Interaction of banking crisis dummy
and 3 bank asset concentration (%)
Liquid assets/deposits and short-
term funding (%)
Interaction of banking crisis dummy
and liquid assets/deposits and
Interaction of banking crisis dummy
and equity to total assets (%)
Interaction of banking crisis dummy
and other earning assets to total
Interaction of banking crisis dummy
and other interest-bearing
Note: This table summarizes the results of the fixed-effects panel estimation on growth, growth volatility, financial stress, and income inequality. ***, **, and * denote statistical significance at the 1 percent, 5 percent, and 10
percent levels of confidence based on robust standard errors with 5 percent and 10 percent being in green shades. For the definition of dependent variables and independent variables, see Tables 2.
Volatility Financial Stress Income Inequality
Financial Globalization
Non-traditional banking
Financial buffers
Banking sector concentration
Competition
Growth
Interaction of banking crisis dummy
and share of foreign banks in total
Interaction of banking crisis dummy
and total bank foreign assets to GDP
Lending spread (lending rate minus
deposit rate %)
Interaction of banking crisis dummy
and lending spread (lending rate

18
B. Fixed-Effects Panel Estimation with Quadratic Term
To investigate the possibility of a nonlinear relationship among some variables, we use a second degree polynomial (quadratic) approximation for the relations, using fixed-effects panel regressions (Table 5).
Results for Growth The ratio of liquid assets to deposits and short term funding is associated with higher
growth in emerging economies, and the ratio of equity to total assets is associated with higher growth in the full sample. However, the quadratic term is of the opposite sign, suggesting that the link between the level of financial buffers and positive economic outcomes weakens as buffers accumulate.
The thresholds are quite high, approximately 74 percent for liquidity buffers and 45 percent for capital buffers, suggesting any dampening economic effect occurs only after these buffers are more than high enough to act as prudential buffers and begin to constrict a bank’s normal intermediation activities.
The ratio of other interest-bearing liabilities to total liabilities is negatively associated with economic growth in the full sample and in advanced economies. This may suggest that a funding structure that depends on other interest-bearing liabilities is unfavorable to economic growth.
The share of foreign banks in the domestic banking system is negatively related to growth in the full sample and in advanced economies. This is in line with the results in the panel regressions with interaction terms.
Results for Growth Volatility In the full sample and advanced economies, greater foreign asset holdings by
domestic banks is associated with higher economic volatility, but is associated with lower volatility beyond a certain point.
A higher level of liquid assets is associated with lower economic volatility in the full sample and in emerging economies. However, beyond a certain point, higher liquidity buffers could increase the volatility, reflecting the possible adverse impact of excess requirements on holdings of liquid assets. A similar pattern exists for the ratio of equity to total assets in emerging economies.
Results for Financial Stress The share of foreign banks is positively associated with changes in financial stress in
the full sample and in emerging economies. The ratio of total bank foreign assets to GDP is negatively associated with changes in the financial stress in the full sample, suggesting a role for bank foreign assets in smoothing financial stress.

19
A higher ratio of liquid assets to deposits and short-term funding is associated with lower financial stress in the full sample and in emerging economies. But this relationship may reverse beyond a certain point in line with its relationship with volatility.
The ratio of other interest-bearing liabilities to total liabilities is positively associated with financial stress in emerging economies.
Results for Income Inequality Banking sector concentration has a negative linear term, but a positive quadratic term,
suggesting that concentration is initially associated with falling inequality, but sufficiently high levels of concentration tend to be associated with rising inequality. This suggests that too much concentration in the banking sector can hinder the reduction of inequality.
The ratio of other earning assets to total assets also has a negative linear term and a positive quadratic term in emerging economies, although it is only marginally significant. This weakly suggests that non-traditional bank activities are initially associated with falling inequality, but sufficiently high levels may be associated with rising inequality.
The thresholds in this exercise should not be viewed as a prudential maximum since what may be an appropriate set of buffers for a specific country will depend on the ability of its financial institutions to manage risk properly and the incidence and size of shocks to which it is subject to. In any event, the thresholds for the capital buffers are above 45 percent for each of the dependent variables and most of the countries that exceed the thresholds were low-income or emerging economies.

20
Table 5. Fixed-effects Panel Estimation with Quadratic Term (1998–2010)
Category Variable Full Sample
Advanced
Economies
Emerging
Economies Full Sample
Advanced
Economies
Emerging
Economies Full Sample
Advanced
Economies
Emerging
Economies Full Sample
Advanced
Economies
Emerging
Economies
-0.291*** -0.281*** -0.119 0.0301 0.0348* -0.0219 0.109** -0.0395 0.180*** 0.000987 -0.00530 -0.0210
(0.0766) (0.0886) (0.0810) (0.0233) (0.0181) (0.0420) (0.0513) (0.0891) (0.0390) (0.0166) (0.00992) (0.0532)
0.000832 0.00100 -0.00144 1.67e-05 3.41e-06 0.000486 -0.000898 -5.48e-05 -0.00107** -3.73e-05 -0.000122 0.000597
(0.00121) (0.00119) (0.00103) (0.000202) (0.000238) (0.000303) (0.000674) (0.00159) (0.000503) (0.000147) (0.000109) (0.000499)
Number of observations 559 346 213 510 317 193 354 210 144 527 337 190
R2
0.457 0.481 0.552 0.620 0.667 0.599 0.307 0.412 0.403 0.762 0.703 0.813
Total bank foreign assets to GDP -0.0147* -0.0154** -0.897 0.00312*** 0.00427*** 0.152 -0.0291** -0.0205 -0.185 0.000633 0.000523 0.0616
(0.00791) (0.00647) (0.546) (0.000934) (0.000920) (0.107) (0.0132) (0.0179) (0.592) (0.00101) (0.00120) (0.107)
Square of total bank foreign assets 4.43e-06*** 4.53e-06*** 0.0281 -8.57e-07*** -1.00e-06*** -0.00808 0.000129*** 8.46e-05 -0.000187 -3.22e-07 -3.34e-07 -0.000355
(1.56e-06) (1.25e-06) (0.0220) (1.85e-07) (1.75e-07) (0.00575) (4.33e-05) (5.72e-05) (0.0385) (2.00e-07) (2.26e-07) (0.00487)
Number of observations 429 277 152 389 252 137 256 169 87 407 270 137
R2
0.396 0.454 0.554 0.633 0.674 0.612 0.353 0.450 0.476 0.779 0.696 0.850
0.456* 0.293 0.461* -0.139*** -0.205 -0.126** -0.106 -0.284 -0.0841 -0.0161 0.121 -0.0376
(0.236) (0.494) (0.256) (0.0476) (0.181) (0.0475) (0.209) (0.815) (0.193) (0.0513) (0.121) (0.0642)
-0.00808 -0.00215 -0.00841 0.00190* 0.0236 0.00155 0.000364 -0.00770 0.000657 -0.000272 -0.0189 9.41e-05
(0.00505) (0.0681) (0.00534) (0.00102) (0.0218) (0.000941) (0.00215) (0.167) (0.00206) (0.00113) (0.0179) (0.00128)
Number of observations 426 219 207 397 208 189 256 130 126 390 213 177
R2
0.384 0.426 0.438 0.585 0.636 0.579 0.277 0.350 0.365 0.752 0.626 0.806
3 Bank asset concentration (%) 0.0767 0.0792 0.0874 -0.0264 0.0156 -0.0685 0.0408 0.0992 0.0310 -0.0576** -0.0340* -0.0768**
(0.0806) (0.131) (0.119) (0.0287) (0.0365) (0.0409) (0.0700) (0.107) (0.0937) (0.0218) (0.0196) (0.0326)
4.23e-05 -1.83e-05 4.69e-05 9.46e-05 -0.000202 0.000429 -0.000314 -0.000645 -0.000316 0.000400*** 0.000215 0.000576**
(0.000578) (0.000872) (0.000904) (0.000203) (0.000253) (0.000275) (0.000500) (0.000756) (0.000668) (0.000146) (0.000133) (0.000222)
Number of observations 548 328 220 500 300 200 350 207 143 507 319 188
R2
0.397 0.436 0.454 0.609 0.665 0.586 0.296 0.408 0.377 0.768 0.696 0.812
0.106 0.0573 0.291*** -0.0353** -0.00295 -0.0828** -0.0777** -0.00953 -0.149*** -0.00638 -0.000308 -0.0223
(0.0697) (0.0720) (0.0605) (0.0153) (0.0141) (0.0297) (0.0381) (0.0716) (0.0325) (0.00960) (0.00895) (0.0233)
-0.000667 -0.000355 -0.00196*** 0.000356** 2.96e-05 0.000781*** 0.000828** 0.000283 0.00131*** 3.31e-05 1.26e-05 0.000111
(0.000589) (0.000643) (0.000466) (0.000146) (0.000153) (0.000232) (0.000319) (0.000680) (0.000241) (8.09e-05) (8.64e-05) (0.000181)
Number of observations 572 342 230 522 313 209 353 210 143 529 333 196
R2
0.373 0.407 0.516 0.597 0.656 0.586 0.318 0.417 0.447 0.763 0.694 0.808
Equity to total assets (%) 0.121*** 0.0657 0.0538 -0.0160 0.00645 -0.149** -0.0338 -0.0927 -0.132 -0.00864 -0.00910 -0.0616
(0.0423) (0.0444) (0.201) (0.0185) (0.0225) (0.0551) (0.0464) (0.0603) (0.112) (0.00727) (0.00640) (0.0550)
Square of equity to total assets (%) -0.00136*** -0.000683 -0.000351 8.20e-05 -0.000150 0.00249** 0.000172 0.000728 0.00251 9.62e-05 9.81e-05 0.00120
(0.000429) (0.000405) (0.00345) (0.000206) (0.000234) (0.000988) (0.000511) (0.000666) (0.00201) (7.54e-05) (6.61e-05) (0.000952)
Number of observations 577 346 231 527 317 210 354 210 144 534 337 197
R2
0.360 0.404 0.405 0.593 0.655 0.570 0.302 0.418 0.379 0.762 0.695 0.805
Other earning assets to total assets 0.111 0.0391 0.180 0.0241 0.0732* -0.0193 0.0124 0.0235 0.0357 -0.0274 0.00452 -0.0704***
(0.101) (0.150) (0.148) (0.0238) (0.0406) (0.0259) (0.0777) (0.140) (0.0827) (0.0206) (0.0235) (0.0246)
Square of other earning assets to -0.000583 0.000102 -0.00150 -0.000367 -0.000775* -2.85e-05 0.000198 6.66e-05 -0.000542 0.000328 6.08e-05 0.000690*
(0.00100) (0.00145) (0.00163) (0.000243) (0.000404) (0.000339) (0.000927) (0.00158) (0.000821) (0.000212) (0.000236) (0.000354)
Number of observations 462 269 193 415 242 173 305 174 131 426 264 162
R2
0.427 0.463 0.483 0.582 0.683 0.503 0.331 0.415 0.384 0.759 0.682 0.810
Other interest-bearing liabilities to -0.0873** -0.117** 0.000233 0.0442*** 0.0456*** 0.0994* 0.0673* 0.0736* 0.264*** 0.00772 0.000744 -0.00377
(0.0332) (0.0447) (0.121) (0.0113) (0.0105) (0.0539) (0.0362) (0.0359) (0.0809) (0.00953) (0.00640) (0.0365)
Square of other interest-bearing 0.00112* 0.00132** -0.000236 -0.000513*** -0.000548*** -0.00244 -0.000361 -0.000586 -0.00572*** -0.000177* -0.000132 0.000944
(0.000587) (0.000556) (0.00352) (0.000116) (0.000114) (0.00160) (0.000446) (0.000406) (0.00188) (9.69e-05) (7.91e-05) (0.00117)
Number of observations 442 266 176 396 239 157 302 173 129 414 261 153
R2
0.430 0.476 0.513 0.608 0.687 0.520 0.345 0.429 0.448 0.758 0.673 0.814
Source: IMF staff estimates.
Income Inequality
Financial Globalization
Banking sector concentration
Financial buffers
Non-traditional banking
Competition
Growth Volatility Financial Stress
Share of foreign banks in total
number of banks
Square of share of foreign banks in
total number of banks
Lending spread (lending rate minus
deposit rate %)
Square of lending spread (lending
rate minus deposit rate %)
Square of 3 bank asset
concentration (%)
Liquid assets/deposits and short-
term funding (%)
Square of liquid assets/deposits
and short-term funding (%)
Note: This table summarizes the results of the fixed-effects panel estimation on growth, growth volatility, financial stress, and income inequality. ***, **, and * denote statistical significance at the 1 percent, 5 percent, and 10 percent levels of
confidence based on robust standard errors with 5 percent and 10 percent being in green shades. For the definition of dependent variables and independent variables, see Tables 2.
21
V. CONCLUSIONS
It is worth repeating again the caveat expressed in Section III: these results should be viewed as suggestive, given the data and econometric issues. However, based on these results we can draw some robust results and offer several tentative policy suggestions.
Some features can enhance the effectiveness and resilience of a financial system and thus contribute to better economic outcomes. The main features that have these beneficial effects are capital and liquidity buffers. The analysis showed this most clearly for emerging economies; the effect was not significant for advanced economies. This is not as surprising as it may seem: it became clear in the financial crisis that the measured capital and liquidity buffers that we thought were in place in advanced economies were not large enough nor of sufficiently high quality, did not offer the liquidity and solvency protection they were supposed to provide, and had to be raised in the subsequent period of economic downturn.7 Buffers in emerging economies were larger and were consistently of higher quality and protected these financial systems more effectively from instability.
Some features that improve the resilience of a financial system can adversely interact with economic outcomes once they exceed a certain threshold. Capital and liquidity buffers are a case in point. While these financial buffers generally tend to help economic outcomes, the analysis found that beyond certain (fairly high) levels in low-income and emerging economies, they may be associated with lower economic growth, higher volatility of economic growth, and higher financial stress. This result is generally in line with findings of the Basel Committee on Banking Supervision (BCBS, 2010) on the diminishing benefits of buffers. A similar result has also been found in other studies for the influence of credit-to-GDP ratio on economic volatility.
Some features of a financial system appear to make it more susceptible to financial instability and to poor economic outcomes. These features include a higher level of nontraditional bank intermediation and a high share of foreign banks in the financial sector. This is where a careful interpretation of the results is important: they do not imply that nontraditional bank intermediation and financial globalization are not beneficial. Instead, they suggest that there are some costs to foreign bank presence—particularly in a period leading up to and including severe financial distress. Some previous empirical work suggests that foreign banks’ positive role is most likely when those banks are well managed, know their local customer base, and have a commitment to the economy or region.
7 Alternatively, the insignificant relationship could reflect the notion that crisis intervention measures substitute for the use of the buffers in past advanced economy crises, serving to cushion economic growth and its volatility.

22
Our hope is that this working paper, tentative as it is, has provided some insight into the role of financial structure in determining macroeconomic outcomes. Much work remains to be done in this area, particularly as more and better data become available.
23
REFERENCES Aghion, Philippe, George-Marios Angeletos, Abhijit Banerjee, and Kalina Manova, 2010,
“Volatility and Growth: Credit Constraints and the Composition of Investment,” Journal of Monetary Economics, Vol. 57, pp. 246–65.
Aghion, Philippe, Abhijit Banerjee, and Thomas Piketty, 1999, “Dualism and
Macroeconomic Volatility,” Quarterly Journal of Economics, Vol. 114, No. 4, pp. 1359–97.
Aghion, Philippe, and Patrick Bolton, 1997, "A theory of trickle-down growth and
development." The Review of Economic Studies Vol. 64, No. 2, pp. 151–72. Allen, Franklin, and Douglas Gale, 2000, Comparing Financial Systems (Cambridge,
Massachusetts: MIT Press). ———, 2004, “Competition and Financial Stability,” Journal of Money, Credit, and
Banking, Vol. 36, pp. 453–80. Arellano, Manuel, and Stephen Bond, 1991, “Some Tests of Specification for Panel Data:
Monte Carlo Evidence and an Application to Employment Equations,” Review of Economic Studies, Vol. 58, pp. 277–97.
Arellano, Manuel, and Olympia Bover, 1995, “Another Look at the Instrumental Variables
Estimation of Error-Components Models,” Journal of Econometrics, Vol. 68, pp. 29–51.
Balakrishnan, Ravi, Stephan Danninger, Irina Tytell, and Selim Ali Elekdag, 2009, “The
Transmission of Financial Stress from Advanced to Emerging Economies,” IMF Working Paper No. 09/133 (Washington: International Monetary Fund).
Bank of Japan, 2012, Financial System Report (Tokyo, April).
www.boj.or.jp/en/research/brp/fsr/fsr120419a.htm/ Barrell, Ray, Philip E. Davis, Karim Dilruba, and Iana Liadze, 2010a, “Bank Regulation,
Property Prices and Early Warning Systems for Banking Crises in OECD Countries,” Journal of Banking & Finance, Vol. 34, No. 9, pp. 2255–64.
_____, 2010b, “Does the Current Account Balance Help to Predict Banking Crises in OECD
Countries?” NIESR Discussion Papers No. 351 (London: National Institute of Economic and Social Research).
Basel Committee on Banking Supervision (BCBS), 2010, “An Assessment of the Long-Term
Economic Impact of Stronger Capital and Liquidity Requirements” (Basel: Bank for International Settlements).
24
Beck, Thorsten, and Ross Levine, 2004, “Stock Markets, Banks, and Growth: Panel Evidence,” Journal of Banking and Finance, Vol. 28, pp. 423–42.
Beck, Thorsten, Asli Demirgüç-Kunt, and Ross Levine. 2007, "Finance, inequality and the
poor." Journal of Economic Growth Vol 12, No. 1, pp. 27–49. Bhide, Amar, 1993, “The Hidden Costs of Stock Market Liquidity,” Journal of Financial
Economics, Vol. 34, pp. 31–51. Boyd, John H., and Gianni De Nicolò, 2005, “The Theory of Bank Risk Taking and
Competition Revisited,” Journal of Finance, Vol. 60, pp. 1329–43. Blundell, Richard, and Stephen Bond, 1998, “Initial Conditions and Moment Restrictions in
Dynamic Panel Data Models,” Journal of Econometrics, Vol. 87, No. 2, pp. 115–43. Cardarelli, Roberto, Selim Elekdag, and Subir Lall, 2011, “Financial Stress and Economic
Contractions,” Journal of Financial Stability, Vol. 7, pp. 78–97. Cetorelli, Nicola, and Philip E. Strahan, 2006, “Finance as a Barrier to Entry: Bank
Competition and Industry Structure in Local U.S. Markets,” Journal of Finance, Vol. 61, pp. 437–61.
Claessens, Stijn, and Enrico Perotti.2007, "Finance and inequality: Channels and evidence."
Journal of Comparative Economics, Vol. 35, No. 4 pp. 748–73. Clarke, George RG, Lixin Colin Xu, and Heng-fu Zou. 2006, "Finance and income
inequality: what do the data tell us?." Southern Economic Journal, Vol. 72, No. 3 pp. 578–96.
Dabla-Norris, Era, and Srivisal Narapong, forthcoming, “Financial Depth and
Macroeconomic Volatility,” IMF Working Paper (Washington: International Monetary Fund).
Degryse, H. A., and S. Ongena, 2008, "Competition and Regulation in the Banking Sector: A
Review of the Empirical Evidence on the Sources of Bank Rents." Handbook of Financial Intermediation and Banking.
Demirgüç-Kunt, Asili, and V. Maksimovic, 2002, “Funding Growth in Bank-Based and
Market- Based Financial Systems: Evidence from Firm Level Data,” Journal of Financial Economics, Vol. 65, pp. 337–63.
Denizer, Cevdet, Murat F. Iyigun, and Ann L. Owen, 2000, “Finance and Macroeconomic
Volatility,” Board of Governors of the Federal Reserve System, International Finance Discussion Paper No. 670 (Washington; June).
25
Easterly, William, Roumeen Islam, and Joseph E. Stiglitz, 2000, “Shaken and Stirred, Explaining Growth Volatility,” Annual Bank Conference on Development Economics (Washington: World Bank).
Ergungor, Emre O., 2008, “Financial System Structure and Economic Growth; Structure
Matters,” International Review of Economics & Finance, Vol. 17, pp. 292–305. Galor, Oded, and Omer Moav, 2004, "From Physical to Human Capital Accumulation:
Inequality and the Process of Development." The Review of Economic Studies Vol. 71, No. 4, pp. 1001–26.
Galor, Oded, and Joseph Zeira. 1993. "Income Distribution and Macroeconomics." The
Review of Economic Studies Vol. 60, No. 1 pp. 35–52. Goldsmith, Raymond., 1969, Financial Structure and Development (New Haven,
Connecticut: Yale University Press). Greenwood and Jovanovic, 1990, “Financial development, growth, and the distribution of
income” Journal of Political Economy, Vol 98, pp. 1076–1107 Grossman, Sanford J., and Oliver D. Hart, 1980, “Takeover Bids, the Free-Rider Problem,
and the Theory of the Corporation,” Bell Journal of Economics, Vol. 11, pp. 42–64. Heckman, James J., and Thomas E. MaCurdy, 1980, “A Life Cycle Model of Female Labour
Supply,” Review of Economic Studies, Vol. 47, No. 1 (Econometrics Issue), pp. 47–74.
Huizinga, Harry, and Dantao Zhu, 2006, “Financial Structure and Macroeconomic Volatility:
Theory and Evidence,” CEPR Discussion Paper No. 5697 (London: Centre for Economic Policy Research).
International Monetary Fund, 2006, “How Do Financial Systems Affect Economic Cycles?”
World Economic Outlook, World Economic and Financial Surveys (Washington; September).
_____, 2010a, “Understanding Financial Interconnectedness” (Washington).
http://www.imf.org/external/np/pp/eng/2010/100410.pdf. _____, 2010b, “Understanding Financial Interconnectedness Supplementary Information”
(Washington). http://www.imf.org/external/np/pp/eng/2010/100510a.pdf. _____, 2010c, United States—Financial System Stability Assessment, Country Report
No. 10/247 (Washington).
26
_____, 2011, “Toward Operationalizing Macroprudential Policies: When to Act?” Global Financial Stability Report, World Economic and Financial Surveys (Washington; September).
_____, 2012a, Global Financial Stability Report, World Economic and Financial Surveys
(Washington; April). _____, 2012b, Japan—Financial System Stability Assessment Update, Country Report No.
12/210 (Washington). _____, 2012c, Japan: Staff Report for the 2012 Article IV Consultation, Country Report No.
12/208 (Washington). Jackson, John E., and Ann R.. Thomas, 1995, “Bank Structure and New Business Creation:
Lessons from an Earlier Time,” Regional Science and Urban Economics, Vol. 25, pp. 323–53.
Jayaratne, Jith, and Philip E. Strahan, 1996, “The Finance-Growth Nexus: Evidence from
Bank Branch Deregulation,” Quarterly Journal of Economics, Vol. 111, pp. 639–70. Kato, Ryo, Shun Kobayashi, and Yumi Saita, 2010, “Calibrating the Level of Capital: The
Way We See It,” Bank of Japan Working Paper Series No. 10-E-6 (Tokyo: Bank of Japan).
Laeven, Luc, and Fabian Valencia, 2010, “Resolution of Banking Crises: The Good, the Bad,
and the Ugly,” IMF Working Paper 10/146 (Washington: International Monetary Fund).
Larrain, Borja, 2006, “Do Banks Affect the Level and Composition of Industrial Volatility?”
Journal of Finance, Vol. 61, pp. 1897–1925. Levine, Ross, 2003, “Bank-Based or Market-Based Financial Systems: Which Is Better?”
Journal of Financial Intermediation, Vol. 11, pp. 398–428. ———, 2005, “Finance and Growth: Theory and Evidence” in Handbook of Economic
Growth, Vol. 1, ed. Aghion, P. and Durlauf, S. (North Holland: Elsevier), pp. 865–84. Lucas, Robert E. Jr., 1988, “On the Mechanics of Economic Development,” Journal of
Monetary Economics, Vol. 22, pp. 3–42. Lund-Jensen, Kasper, 2012, “Monitoring Systemic Risk Based on Dynamic Thresholds,”
IMF Working Paper No. 12/159 (Washington: International Monetary Fund). McKinnon, Ronald, and Edward Shaw, 1973, Financial Deepening in Economic
Development (New York: Oxford University Press).
27
Nickell, Stephen, 1981, “Biases in Dynamic Models with Fixed Effects,” Econometrica, Vol. 49, No. 6, pp. 1417–26.
Nikoloski, Z., (2012). Financial sector development and inequality: Is there any Financial
Kuznets curve? Journal of International Development. DOI: 10.1002/jid.2843. Petersen, Mitchell A., and Raghuram G. Rajan, 1995, “The Effect of Credit Market
Competition on Lending Relationship,” Quarterly Journal of Economics, Vol. 110, pp. 407–43.
Raddatz, Claudio, 2006, “Liquidity Needs and Vulnerability to Financial
Underdevelopment,” Journal of Financial Economics, Vol. 80, pp. 677–722. Rajan, Raghuram G., 1992, “Insiders and Outsiders: The Choice Between Informed and
Arms Length Debt,” Journal of Finance, Vol. 47, pp. 1367–1400. ———, 2005, “Has Financial Development Made the World Riskier?” Proceedings, Federal
Reserve Bank of Kansas City, pp. 313–69 (August). Rajan, Raghuram G., and Zingales, Luigi, 1998, “Financial Dependence and Growth,”
American Economic Review, Vol. 88, pp. 559–86. Rancière, Romain, Aaron Tornell, and Frank Westermann, 2008, “Systemic Crises and
Growth,” Quarterly Journal of Economics, Vol. 123, pp. 359–406. Robinson, Joan, 1952, “The Generalization of the General Theory,” in The Rate of Interest
and Other Essays (London: Macmillan), pp. 69–142. Rosengren, Eric S., 2012, “Our Financial Structures: Are They Prepared for Financial
Stability?” Keynote Remarks, Conference on Post-Crisis Banking, June 28–29, Amsterdam.
Schumpeter, Joseph A., 1911, A Theory of Economic Development (Cambridge,
Massachusetts: Harvard University Press). Shirakawa, Masaaki, 2012, “Deleveraging and Growth: Is the Developed World Following
Japan’s Long and Winding Road?” Lecture at the London School of Economic and Political Science (Tokyo: Bank of Japan).
Solt, Frederick. 2009. “Standardizing the World Income Inequality Database.” Social Science
Quarterly 90(2): 231–242. SWIID Version 3.1, December 2011 Stiglitz, Joseph E., 1985, “Credit Markets and the Control of Capital,” Journal of Money,
Credit and Banking, Vol. 17, pp. 133–52.
28
Townsend, Robert M., and Kenichi Ueda, 2006, "Financial Deepening, Inequality, and Growth: A Model-Based Quantitative Evaluation”, Review of Economic Studies, Vol. 73, pp. 251–92.
Ueda, Kenichi 2012. “Banks as coordinators of economic growth and stability:
Microfoundation for macroeconomy with externality.” Journal of Economic Theory. Windmeijer, Frank, 2005, "A Finite Sample Correction for the Variance of Linear Efficient
Two-Step GMM Estimators." Journal of Econometrics Vol. 126, No. 1, pp. 25–51. World Bank, 2007, Finance for All? Policies and Pitfalls in Expanding Access (Washington).