Embed Size (px)
Citation preview

FINANCIAL SUMMARY
FY2017 (April 1, 2016 through March 31, 2017)
English translation from the original Japanese-language document
TOYOTA MOTOR CORPORATION

(Consolidated financial information has been prepared in accordance with U.S. generally accepted accounting principles)
English translation from the original Japanese-language document
May 10, 2017
(Amounts are rounded to the nearest million yen for consolidated results)
1. Consolidated Results for FY2017 (April 1, 2016 through March 31, 2017)
(2) Consolidated financial position
(3) Consolidated cash flows
2. Cash Dividends
3. Forecast of Consolidated Results for FY2018 (April 1, 2017 through March 31, 2018)
FY2017 Consolidated Financial Results
Company name : Toyota Motor CorporationStock exchanges on which the shares are listed : Tokyo, Nagoya, Sapporo and Fukuoka Stock Exchanges in Japan Code number : 7203URL Representative
: http://www.toyota.co.jp : Akio Toyoda, President
Contact person : Kenta Kon, General Manager, Accounting Division Tel. (0565)28-2121
Date of the ordinary general shareholders' meeting : June 14, 2017 Payment date of cash dividends : May 25, 2017Filing date of financial statements : June 23, 2017 Supplemental materials prepared for financial results : yes Earnings announcement for financial results : yes
(1) Consolidated financial results (% of change from previous year)
Net revenues Operating income Income before income taxes
and equity in earnings of affiliated companies
Net income attributable to Toyota Motor Corporation
Million yen % Million yen % Million yen % Million yen %FY2017 27,597,193 -2.8 1,994,372 -30.1 2,193,825 -26.5 1,831,109 -20.8FY2016 28,403,118 4.3 2,853,971 3.8 2,983,381 3.1 2,312,694 6.4
Note: Comprehensive income FY2017 1,966,650 million yen ( 29.6 %), FY2016 1,517,486 million yen ( -53.9 %)
Net income attributable to Toyota Motor Corporation per common share
- Basic
Net income attributable to Toyota Motor Corporation per common share
- Diluted
Ratio of net income attributable to Toyota Motor Corporation to
Toyota Motor Corporationshareholders' equity
Ratio of income before income taxes and
equity in earnings of affiliated companies
to total assets
Ratio of operating incometo net revenues
Yen Yen % % %FY2017 605.47 599.22 10.6 4.6 7.2FY2016 741.36 735.36 13.8 6.3 10.0
Reference: Equity in earnings of affiliated companies FY2017 362,060 million yen, FY2016 329,099 million yen
Total assets Mezzanine equity and Shareholders' equity
Toyota Motor Corporation
shareholders' equity
Ratio of Toyota Motor Corporation
shareholders' equity
Toyota Motor Corporation
shareholders' equity per share
Million yen Million yen Million yen % YenFY2017 48,750,186 18,668,953 17,514,812 35.9 5,887.88FY2016 47,427,597 18,088,186 16,746,935 35.3 5,513.08
From operating activities From investing activities From financing activities Cash and cash equivalents
at end of year Million yen Million yen Million yen Million yen
FY2017 3,414,237 -2,969,939 -375,165 2,995,075FY2016 4,460,857 -3,182,544 -423,571 2,939,428
Annual cash dividends per common share Total amount of cash dividends
(annual)
Dividends payout ratio
(consolidated)
Ratio of total amount of dividends to Toyota
Motor Corporation shareholders' equity
(consolidated)
End of
first quarter
End of second quarter
End of third
quarter Year-end Total
Yen Yen Yen Yen Yen Million yen % % FY2016 — 100.00 — 110.00 210.00 645,520 28.3 3.9FY2017 — 100.00 — 110.00 210.00 627,551 34.6 3.7FY2018
(forecast) — — — — — —
Note: Please refer to "Reference: Cash Dividends on Class Shares" for information regarding cash dividends on class shares, which are unlisted and have different rights from common stock.
(% of change from FY2017)
Net revenues Operating income
Income before income taxes and equity in
earnings of affiliated companies
Net income attributable to Toyota
Motor Corporation
Net income attributable to Toyota Motor Corporation per
common share – Basic Million yen % Million yen % Million yen % Million yen % Yen
Full-year 27,500,000 -0.4 1,600,000 -19.8 1,800,000 -18.0 1,500,000 -18.1 500.05

Notes (1) Changes in significant subsidiaries during FY2017
(Changes in specified subsidiaries that caused a change in the scope of consolidation): none (2) Changes in accounting principles, procedures, and disclosures during FY2017
(i) Changes by a newly issued accounting pronouncement: yes (ii) Changes other than (2)-(i) above: yes Note: For more details, please see page 14 "(6) Summary of Significant Accounting Policies."
(3) Number of shares issued and outstanding (common stock)
(i) Number of shares issued and outstanding at the end of each fiscal year (including treasury stock) : FY2017 3,262,997,492 shares, FY2016 3,337,997,492 shares
(ii) Number of treasury stock at the end of each fiscal year: FY2017 288,274,636 shares, FY2016 300,321,622 shares
(iii) Average number of shares issued and outstanding in each fiscal year: FY2017 3,008,088,275 shares, FY2016 3,111,306,060 shares
Reference: Overview of the Unconsolidated Financial Results
(Unconsolidated financial information has been prepared in accordance with Japanese generally accepted accounting principles)
English translation from the original Japanese-language document
(Amounts less than one million yen are omitted for unconsolidated results)
1. Unconsolidated Results for FY2017 (April 1, 2016 through March 31, 2017)
(2) Unconsolidated financial position
2. Forecast of Unconsolidated Results for FY2018 (April 1, 2017 through March 31, 2018)
This report is not audited. Cautionary Statement with Respect to Forward-Looking Statements, and Other Information
This report contains forward-looking statements that reflect Toyota's plans and expectations. These forward-looking statements are not guarantees of future performance and involve known and unknown risks, uncertainties and other factors that may cause Toyota's actual results, performance, achievements or financial position to be materially different from any future results, performance, achievements or financial position expressed or implied by these forward-looking statements. These factors include, but are not limited to: (i) changes in economic conditions, market demand, and the competitive environment affecting, the automotive markets in Japan, North America, Europe, Asia and other markets in which Toyota operates; (ii) fluctuations in currency exchange rates, particularly with respect to the value of the Japanese yen, the U.S. dollar, the euro, the Australian dollar, the Russian ruble, the Canadian dollar and the British pound, and interest rates fluctuations; (iii) changes in funding environment in financial markets and increased competition in the financial services industry; (iv) Toyota's ability to market and distribute effectively; (v) Toyota's ability to realize production efficiencies and to implement capital expenditures at the levels and times planned by management; (vi) changes in the laws, regulations and government policies in the markets in which Toyota operates that affect Toyota's automotive operations, particularly laws, regulations and government policies relating to vehicle safety including remedial measures such as recalls, trade, environmental protection, vehicle emissions and vehicle fuel economy, as well as changes in laws, regulations and government policies that affect Toyota's other operations, including the outcome of current and future litigation and other legal proceedings, government proceedings and investigations; (vii) political and economic instability in the markets in which Toyota operates; (viii) Toyota's ability to timely develop and achieve market acceptance of new products that meet customer demand; (ix) any damage to Toyota's brand image; (x) Toyota's reliance on various suppliers for the provision of supplies; (xi) increases in prices of raw materials; (xii) Toyota's reliance on various digital and information technologies; (xiii) fuel shortages or interruptions in electricity, transportation systems, labor strikes, work stoppages or other interruptions to, or difficulties in, the employment of labor in the major markets where Toyota purchases materials, components and supplies for the production of its products or where its products are produced, distributed or sold; and (xiv) the impact of natural calamities including the negative effect on Toyota's vehicle production and sales.
A discussion of these and other factors which may affect Toyota's actual results, performance, achievements or financial position is contained in Toyota's annual report on Form 20-F, which is on file with the United States Securities and Exchange Commission.
Consolidated financial information in this report is prepared in accordance with U.S. generally accepted accounting principles.
FY2017 Unconsolidated Financial Results
(1) Unconsolidated financial results (% of change from previous year)
Net revenues Operating income Ordinary income Net income Million yen % Million yen % Million yen % Million yen %
FY2017 11,476,343 -0.9 837,204 -40.3 1,801,736 -21.1 1,529,911 -15.5FY2016 11,585,822 3.4 1,402,126 10.3 2,284,091 7.5 1,810,370 7.1
Net income per common share
- Basic
Net income per common share
- Diluted Yen Yen
FY2017 506.96 500.65FY2016 581.08 575.64
Total assets Net assets Equity ratio Net assets per common share Million yen Million yen % Yen
FY2017 16,592,167 11,365,784 68.5 3,659.40 FY2016 16,100,209 10,859,443 67.4 3,417.07
Reference: Equity at the end of FY2017: 11,364,877 million yen, Equity at the end of FY2016: 10,857,883 million yen
(% of change from FY2017)
Net revenues Operating income Ordinary income Net income Net income per common share
- Basic Million yen % Million yen % Million yen % Million yen % Yen
Full-year 11,300,000 -1.5 650,000 -22.4 1,570,000 -12.9 1,350,000 -11.8 451.32

Reference: Cash Dividends on Class Shares Cash dividends on class shares, which have different rights from common stock, are as follows:
Annual cash dividends per First Series Model AA Class Share
End of first
quarterEnd of second
quarter End of third
quarterYear-end Total
Yen Yen Yen Yen YenFY2016 — 26.00 — 26.00 52.00 FY2017 — 52.50 — 52.50 105.00FY2018 (forecast) — — — — —
Note: The First Series Model AA Class Shares were issued in July 2015.

TABLE OF CONTENTS
TOYOTA MOTOR CORPORATION FY2017 Financial Summary(Consolidated financial information has been prepared in accordance with U.S. generally accepted accounting principles)
1. Financial Results and Position .............................................................................................................................. 2
(1) Consolidated Financial Results for FY2017 ....................................................................................................... 2
(2) Consolidated Financial Position for FY2017 ...................................................................................................... 4
(3) Forecast of Consolidated Financial Results for FY2018 ................................................................................... 5
2. Basic Concept Regarding the Selection of Accounting Standards ............................................................. 6
3. Consolidated Financial Statements ..................................................................................................................... 7
(1) Consolidated Balance Sheets ........................................................................................................................... 7
(2) Consolidated Statements of Income and Consolidated Statements of Comprehensive Income ......................... 9
(3) Consolidated Statements of Shareholders' Equity ............................................................................................ 11
(4) Consolidated Statements of Cash Flows ............................................................................................................ 12
(5) Going Concern Assumption ............................................................................................................................... 13
(6) Summary of Significant Accounting Policies ....................................................................................................... 13
(7) Segment Information .......................................................................................................................................... 14
(8) Per Share Amounts ............................................................................................................................................ 21
1

Note: Translational impacts concerning operating income of overseas subsidiaries and concerning
provisions in foreign currencies at the end of the fiscal year are included in "Effects of changes in exchange rates" from the consolidated fiscal year ended March 31, 2017.
TOYOTA MOTOR CORPORATION FY2017 Financial Summary(Consolidated financial information has been prepared in accordance with U.S. generally accepted accounting principles)
1. Financial Results and Position
(1) Consolidated Financial Results for FY2017
Financial Results
Reviewing the general economic environment for FY2017 (April 1, 2016 through March 31,2017), with respect to the world economy, the U.S. economy has seen ongoing recovery due toincreasing personal consumption owing to improvements in employment and income conditions, andthe European economy has continued its moderate recovery. Meanwhile, weaknesses have beenseen in some emerging countries. The Japanese economy has been on a moderate recovery due toimprovements in employment and income conditions.
For the automobile industry, although markets have progressed in a steady manner in thedeveloped countries and expanded in China due to effects of a sales tax cut on small cars, markets inresource-rich countries have slowed down. Meanwhile, efforts toward improvement acrossbusinesses in areas including automated driving technology, connected vehicles, environmentaltechnologies used in fuel cell vehicles and electric vehicles, as well as car-sharing and ride-sharing have become active.
Under these conditions, consolidated vehicle unit sales in Japan and overseas increased by290 thousand units, or 3.3%, to 8,971 thousand units in FY2017 compared with FY2016 (April 1, 2015through March 31, 2016). Vehicle unit sales in Japan increased by 215 thousand units, or 10.4%, to2,274 thousand units in FY2017 compared with FY2016, primarily as a result of the active introductionof new products and the efforts of dealers nationwide. Toyota and Lexus brands' market shareexcluding mini-vehicles was 47.8% , while market share (including Daihatsu and Hino brands)including mini-vehicles was 45.0%, representing a record high. Each remained at as high a level as inFY2016. Meanwhile, overseas vehicle unit sales increased by 75 thousand units, or 1.1%, to 6,697thousand units in FY2017 compared with FY2016, because of sales expansion in Asia and Europedespite decline in sales in the Middle East.
Result of Operation for FY2017
Net revenues 27,597.1 billion yen(a decrease of 805.9 billion yen or 2.8% compared with FY2016)
Operating income 1,994.3 billion yen(a decrease of 859.5 billion yen or 30.1% compared with FY2016)
Income before income taxes and equity in earnings of affiliated companies
2,193.8 billion yen(a decrease of 789.5 billion yen or 26.5% compared with FY2016)
Net income attributable to Toyota Motor Corporation
1,831.1 billion yen(a decrease of 481.5 billion yen or 20.8% compared with FY2016)
Changes in operating income and loss for FY2017
Marketing efforts an increase of 210.0 billion yen compared with FY2016
Effects of changes in exchange rates
a decrease of 940.0 billion yen compared with FY2016
Cost reduction efforts an increase of 440.0 billion yen compared with FY2016
Increase in expenses and others a decrease of 530.0 billion yen compared with FY2016
Other a decrease of 39.5 billion yen compared with FY2016
2

TOYOTA MOTOR CORPORATION FY2017 Financial Summary(Consolidated financial information has been prepared in accordance with U.S. generally accepted accounting principles)
Segment Operating Results
(i) Automotive: Net revenues for the automotive operations decreased by 895.5 billion yen, or 3.4%, to
25,081.8 billion yen in FY2017 compared with FY2016, and operating income decreased by 756.0billion yen, or 30.9%, to 1,692.9 billion yen in FY2017 compared with FY2016. The decrease inoperating income was mainly due to the effects of changes in exchange rates and the increase inexpenses and others.
(ii) Financial services: Net revenues for the financial services operations decreased by 72.6 billion yen, or 3.8%, to
1,823.6 billion yen in FY2017 compared with FY2016, and operating income decreased by 116.7billion yen, or 34.4%, to 222.4 billion yen in FY2017 compared with FY2016. The decrease inoperating income was mainly due to the increase in expenses related to credit losses and residualvalue losses in sales finance subsidiaries.
(iii) All other: Net revenues for all other businesses increased by 143.6 billion yen, or 12.2%, to 1,321.0
billion yen in FY2017 compared with FY2016, and operating income increased by 14.8 billion yen,or 22.3%, to 81.3 billion yen in FY2017 compared with FY2016.
Geographic Information
(i) Japan:
Net revenues in Japan increased by 71.3 billion yen, or 0.5%, to 14,830.8 billion yen inFY2017 compared with FY2016. However, operating income decreased by 475.2 billion yen, or28.3%, to 1,202.2 billion yen in FY2017 compared with FY2016. The decrease in operating incomewas mainly due to the effects of changes in exchange rates and the increase in expenses andothers.
(ii) North America:
Net revenues in North America decreased by 812.8 billion yen, or 7.4%, to 10,239.0 billionyen in FY2017 compared with FY2016, and operating income decreased by 217.6 billion yen, or41.2%, to 311.1 billion yen in FY2017 compared with FY2016. The decrease in operating incomewas mainly due to the increase in expenses and others as well as the increase in expenses relatedto credit losses and residual value losses, and the recording of valuation losses on interest rateswaps stated at fair value, both in sales finance subsidiaries.
(iii) Europe:
Net revenues in Europe increased by 19.7 billion yen, or 0.7%, to 2,681.0 billion yen inFY2017 compared with FY2016. However, operating income decreased by 84.6 billion yen to anoperating loss of 12.2 billion yen in FY2017 compared with FY2016. The decrease in operatingincome was mainly due to the increase in expenses and others.
(iv) Asia:
Net revenues in Asia decreased by 184.0 billion yen, or 3.7%, to 4,819.8 billion yen inFY2017 compared with FY2016, and operating income decreased by 14.0 billion yen, or 3.1%, to435.1 billion yen in FY2017 compared with FY2016. The decrease in operating income was mainlydue to the effects of changes in exchange rates.
(v) Other (Central and South America, Oceania, Africa and the Middle East):
Net revenues in other regions decreased by 49.1 billion yen, or 2.2%, to 2,161.0 billion yenin FY2017 compared with FY2016, and operating income decreased by 50.2 billion yen, or 46.1%,to 58.6 billion yen in FY2017 compared with FY2016. The decrease in operating income wasmainly due to the increase in expenses and others.
3

TOYOTA MOTOR CORPORATION FY2017 Financial Summary(Consolidated financial information has been prepared in accordance with U.S. generally accepted accounting principles)
(2) Consolidated Financial Position for FY2017
Cash and cash equivalents increased by 55.6 billion yen, or 1.9%, to 2,995.0 billion yen at theend of FY2017 compared with the end of FY2016.
The increases or decreases for each cash flow activity compared with the previous fiscal yearare as follows:
Cash flows from operating activities
Net cash flows from operating activities resulted in an increase in cash by 3,414.2 billion yenin FY2017. Net cash provided by operating activities decreased by 1,046.6 billion yen from 4,460.8billion yen in FY2016.
Cash flows from investing activities
Net cash flows from investing activities resulted in a decrease in cash by 2,969.9 billion yen inFY2017. Net cash used in investing activities decreased by 212.6 billion yen from 3,182.5 billion yenin FY2016.
Cash flows from financing activities
Net cash flows from financing activities resulted in a decrease in cash by 375.1 billion yen inFY2017. Net cash used in financing activities decreased by 48.4 billion yen from 423.5 billion yen inFY2016.
The consolidated cash flows by segment for FY2017 are as follows:
Non-financial services Net cash provided by operating activities was 2,564.3 billion yen, net cash used in investing
activities was 1,288.4 billion yen and net cash used in financing activities was 1,325.6 billion yen.
Financial services Net cash provided by operating activities was 1,028.1 billion yen, net cash used in investing
activities was 1,910.4 billion yen and net cash provided by financing activities was 1,001.2 billion yen.
4

TOYOTA MOTOR CORPORATION FY2017 Financial Summary(Consolidated financial information has been prepared in accordance with U.S. generally accepted accounting principles)
(3) Forecast of Consolidated Financial Results for FY2018
As for our future business environment, developed countries are expected to continue growingsteadily, while the growth rate of emerging countries are expected to increase gradually on the backof the steady growth in developed countries and the effects of policy measures taken by emergingcountries. The Japanese economy is expected to improve mainly in the area of private demandsupported by continuing extension of the positive cycle of the economy with improvements inemployment and income conditions, although attention needs to be paid to uncertainty related topolicy trends mainly in the U.S. and U.K. The automotive market is expected to progress steadily indeveloped countries and to pick up gradually in emerging countries. Meanwhile, complicatedinteractions and changes such as changing market and regulations, developments in technology, andentry from other businesses are changing the automotive business itself.
Under these circumstances, the current forecast of consolidated financial results for the nextfiscal year ending March 31, 2018 is set forth below. This forecast assumes average exchange ratesthrough the fiscal year of 105 yen per US$1 and 115 yen per 1 euro.
Forecast of consolidated results for FY2018
Net revenues 27,500.0 billion yen (a decrease of 0.4% compared with FY2017) Operating income 1,600.0 billion yen (a decrease of 19.8% compared with FY2017) Income before income taxes and equity in earnings of affiliated companies
1,800.0 billion yen (a decrease of 18.0% compared with FY2017)
Net income attributable to Toyota Motor Corporation
1,500.0 billion yen (a decrease of 18.1% compared with FY2017)
These forward-looking statements are not guarantees of future performance and involveknown and unknown risks, uncertainties and other factors that may cause Toyota's actual results,performance, achievements or financial position to be materially different from any future results,performance, achievements or financial position expressed or implied by these forward-looking statements. These factors include, but are not limited to: (i) changes in economic conditions, marketdemand, and the competitive environment affecting the automotive markets in Japan, North America,Europe, Asia and other markets in which Toyota operates; (ii) fluctuations in currency exchange rates,particularly with respect to the value of the Japanese yen, the U.S. dollar, the euro, the Australiandollar, the Russian ruble, the Canadian dollar and the British pound, and interest rates fluctuations;(iii) changes in funding environment in financial markets and increased competition in the financialservices industry; (iv) Toyota's ability to market and distribute effectively; (v) Toyota's ability to realizeproduction efficiencies and to implement capital expenditures at the levels and times planned bymanagement; (vi) changes in the laws, regulations and government policies in the markets in whichToyota operates that affect Toyota's automotive operations, particularly laws, regulations andgovernment policies relating to vehicle safety including remedial measures such as recalls, trade,environmental protection, vehicle emissions and vehicle fuel economy, as well as changes in laws,regulations and government policies that affect Toyota's other operations, including the outcome ofcurrent and future litigation and other legal proceedings, government proceedings and investigations;(vii) political and economic instability in the markets in which Toyota operates; (viii) Toyota's ability totimely develop and achieve market acceptance of new products that meet customer demand; (ix) anydamage to Toyota's brand image; (x) Toyota's reliance on various suppliers for the provision ofsupplies; (xi) increases in prices of raw materials; (xii) Toyota's reliance on various digital andinformation technologies; (xiii) fuel shortages or interruptions in electricity, transportation systems,labor strikes, work stoppages or other interruptions to, or difficulties in, the employment of labor in themajor markets where Toyota purchases materials, components and supplies for the production of itsproducts or where its products are produced, distributed or sold; and (xiv) the impact of naturalcalamities including the negative effect on Toyota's vehicle production and sales.
A discussion of these and other factors which may affect Toyota's actual results, performance,achievements or financial position is contained in Toyota's annual report on Form 20-F, which is on file with the United States Securities and Exchange Commission.
5

TOYOTA MOTOR CORPORATION FY2017 Financial Summary(Consolidated financial information has been prepared in accordance with U.S. generally accepted accounting principles)
2. Basic Concept Regarding the Selection of Accounting Standards
Toyota prepares its consolidated financial statements in accordance with U.S. generallyaccepted accounting principles due to the listing of Toyota's common stock on the New York StockExchange. Toyota is examining adoption of International Financial Reporting Standards in light of theenvironment surrounding Toyota, as well as domestic and international trends.
6

TOYOTA MOTOR CORPORATION FY2017 Financial Summary(Consolidated financial information has been prepared in accordance with U.S. generally accepted accounting principles)
3. Consolidated Financial Statements
(1) Consolidated Balance Sheets (Yen in millions)
FY2016 (March 31, 2016)
FY2017 (March 31, 2017)
Increase (Decrease)
Assets
Current assets:
Cash and cash equivalents 2,939,428 2,995,075 55,647
Time deposits 1,032,034 1,082,654 50,620
Marketable securities 1,511,389 1,821,598 310,209 Trade accounts and notes receivable, less allowance for doubtful accounts of ¥83,969 million at March 31, 2016 and ¥50,110 million at March 31, 2017
2,000,149
2,115,938
115,789
Finance receivables, net 5,912,684 6,196,649 283,965
Other receivables 451,406 436,867 (14,539)
Inventories 2,061,511 2,388,617 327,106
Deferred income taxes 967,607 ― (967,607)
Prepaid expenses and other current assets 1,333,345 796,297 (537,048)
Total current assets 18,209,553 17,833,695 (375,858)
Noncurrent finance receivables, net 8,642,947 9,012,222 369,275
Investments and other assets: Marketable securities and other securities investments 7,439,799 7,679,928 240,129
Affiliated companies 2,631,612 2,845,639 214,027
Employees receivables 32,998 25,187 (7,811)
Other 730,271 1,156,406 426,135
Total investments and other assets 10,834,680 11,707,160 872,480
Property, plant and equipment:
Land 1,352,904 1,379,991 27,087
Buildings 4,311,895 4,470,996 159,101
Machinery and equipment 10,945,267 11,357,340 412,073
Vehicles and equipment on operating leases 5,652,622 5,966,579 313,957
Construction in progress 513,953 474,188 (39,765)
Total property, plant and equipment, at cost 22,776,641 23,649,094 872,453
Less – Accumulated depreciation (13,036,224) (13,451,985) (415,761)
Total property, plant and equipment, net 9,740,417 10,197,109 456,692
Total assets 47,427,597 48,750,186 1,322,589
7

TOYOTA MOTOR CORPORATION FY2017 Financial Summary(Consolidated financial information has been prepared in accordance with U.S. generally accepted accounting principles)
(Yen in millions)
FY2016 (March 31, 2016)
FY2017 (March 31, 2017)
Increase (Decrease)
Liabilities Current liabilities:
Short-term borrowings 4,698,134 4,953,682 255,548
Current portion of long-term debt 3,822,954 4,290,449 467,495
Accounts payable 2,389,515 2,566,382 176,867
Other payables 1,040,277 936,938 (103,339)
Accrued expenses 2,726,120 3,137,827 411,707
Income taxes payable 343,325 223,574 (119,751)
Other current liabilities 1,104,131 1,210,113 105,982
Total current liabilities 16,124,456 17,318,965 1,194,509
Long-term liabilities: Long-term debt 9,772,065 9,911,596 139,531
Accrued pension and severance costs 904,911 905,070 159
Deferred income taxes 2,046,089 1,423,726 (622,363)
Other long-term liabilities 491,890 521,876 29,986
Total long-term liabilities 13,214,955 12,762,268 (452,687)
Total liabilities 29,339,411 30,081,233 741,822
Mezzanine equity Model AA Class Shares, no par value, 479,779 485,877 6,098
authorized: 150,000,000 shares at March 31, 2016 and March 31, 2017
issued: 47,100,000 shares at March 31, 2016and March 31, 2017
Shareholders' equity Toyota Motor Corporation shareholders' equity:
Common stock, no par value, 397,050 397,050 ―
authorized: 10,000,000,000 shares at March 31, 2016 and March 31, 2017 issued: 3,337,997,492 shares at March 31, 2016 and 3,262,997,492 shares at March 31, 2017
Additional paid-in capital 548,161 484,013 (64,148)
Retained earnings 16,794,240 17,601,070 806,830
Accumulated other comprehensive income (loss) 610,768 640,922 30,154
Treasury stock, at cost, (1,603,284) (1,608,243) (4,959)
300,321,622 shares at March 31, 2016 and 288,274,636 shares at March 31, 2017
Total Toyota Motor Corporation shareholders' equity 16,746,935 17,514,812 767,877
Noncontrolling interests 861,472 668,264 (193,208)
Total shareholders' equity 17,608,407 18,183,076 574,669
Commitments and contingencies Total liabilities, mezzanine equity and shareholders'
equity 47,427,597 48,750,186 1,322,589
Note: The total number of authorized shares for common stock and Model AA Class Shares is 10,000,000,000 shares.
8
TOYOTA MOTOR CORPORATION FY2017 Financial Summary(Consolidated financial information has been prepared in accordance with U.S. generally accepted accounting principles)
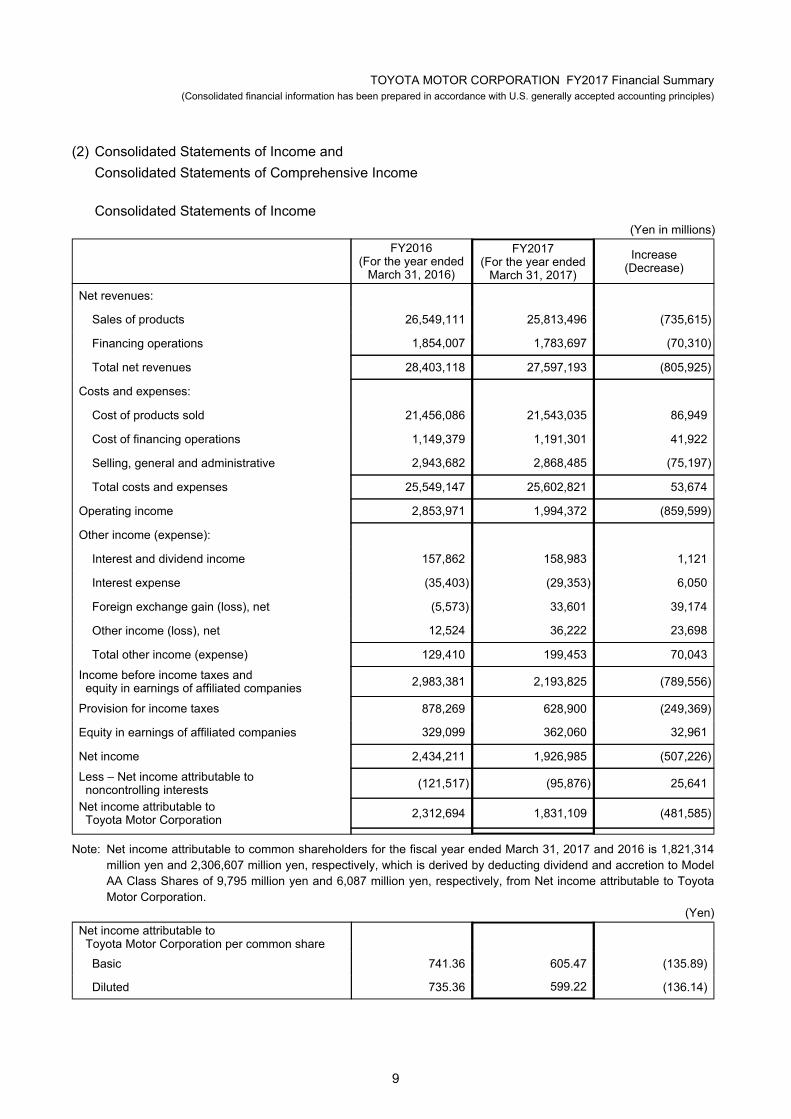
(2) Consolidated Statements of Income and
Consolidated Statements of Comprehensive Income
Consolidated Statements of Income (Yen in millions)
FY2016
(For the year ended March 31, 2016)
FY2017(For the year ended
March 31, 2017)
Increase(Decrease)
Net revenues:
Sales of products 26,549,111 25,813,496 (735,615)
Financing operations 1,854,007 1,783,697 (70,310)
Total net revenues 28,403,118 27,597,193 (805,925)
Costs and expenses:
Cost of products sold 21,456,086 21,543,035 86,949
Cost of financing operations 1,149,379 1,191,301 41,922
Selling, general and administrative 2,943,682 2,868,485 (75,197)
Total costs and expenses 25,549,147 25,602,821 53,674
Operating income 2,853,971 1,994,372 (859,599)
Other income (expense):
Interest and dividend income 157,862 158,983 1,121
Interest expense (35,403) (29,353) 6,050
Foreign exchange gain (loss), net (5,573) 33,601 39,174
Other income (loss), net 12,524 36,222 23,698
Total other income (expense) 129,410 199,453 70,043
Income before income taxes and equity in earnings of affiliated companies 2,983,381 2,193,825 (789,556)
Provision for income taxes 878,269 628,900 (249,369)
Equity in earnings of affiliated companies 329,099 362,060 32,961
Net income 2,434,211 1,926,985 (507,226)
Less – Net income attributable to noncontrolling interests (121,517) (95,876) 25,641
Net income attributable to Toyota Motor Corporation 2,312,694 1,831,109 (481,585)
Note: Net income attributable to common shareholders for the fiscal year ended March 31, 2017 and 2016 is 1,821,314 million yen and 2,306,607 million yen, respectively, which is derived by deducting dividend and accretion to Model AA Class Shares of 9,795 million yen and 6,087 million yen, respectively, from Net income attributable to Toyota Motor Corporation.
(Yen)
Net income attributable to Toyota Motor Corporation per common share
Basic 741.36 605.47 (135.89)
Diluted 735.36 599.22 (136.14)
9
TOYOTA MOTOR CORPORATION FY2017 Financial Summary(Consolidated financial information has been prepared in accordance with U.S. generally accepted accounting principles)
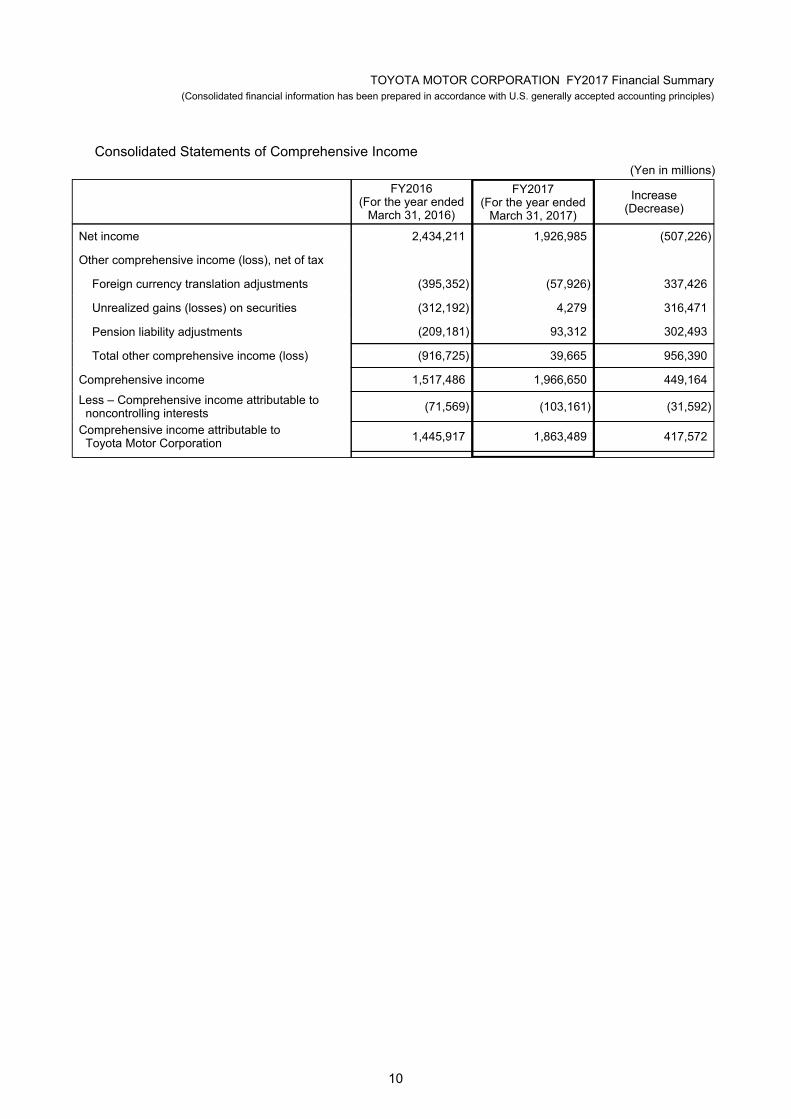
Consolidated Statements of Comprehensive Income (Yen in millions)
FY2016
(For the year ended March 31, 2016)
FY2017 (For the year ended
March 31, 2017)
Increase (Decrease)
Net income 2,434,211 1,926,985 (507,226)
Other comprehensive income (loss), net of tax
Foreign currency translation adjustments (395,352) (57,926) 337,426
Unrealized gains (losses) on securities (312,192) 4,279 316,471
Pension liability adjustments (209,181) 93,312 302,493
Total other comprehensive income (loss) (916,725) 39,665 956,390
Comprehensive income 1,517,486 1,966,650 449,164
Less – Comprehensive income attributable to noncontrolling interests
(71,569) (103,161) (31,592)
Comprehensive income attributable to Toyota Motor Corporation
1,445,917 1,863,489 417,572
10

TOYOTA MOTOR CORPORATION FY2017 Financial Summary(Consolidated financial information has been prepared in accordance with U.S. generally accepted accounting principles)
(3) Consolidated Statements of Shareholders' Equity
(Yen in millions)
FY2016 (For the year ended March 31, 2016)
Common
stock
Additional paid-in capital
Retained earnings
Accumulated other
comprehensive income (loss)
Treasury stock, at cost
Total Toyota Motor
Corporation shareholders'
equity
Noncontrolling interests
Total shareholders'
equity
Balances at March 31, 2015 397,050 547,054 15,591,947 1,477,545 (1,225,465) 16,788,131 859,198 17,647,329
Equity transaction with noncontrolling interests and other 1,972 (97) 1,875 3,834 5,709
Comprehensive income: Net income 2,312,694 2,312,694 121,517 2,434,211
Other comprehensive income (loss)
Foreign currency translation adjustments
(362,965) (362,965) (32,387) (395,352)
Unrealized gains (losses) on securities
(302,620) (302,620) (9,572) (312,192)
Pension liability adjustments (201,192) (201,192) (7,989) (209,181)
Total comprehensive income 1,445,917 71,569 1,517,486
Accretion to Mezzanine equity (3,638) (3,638) (3,638)
Dividends to Toyota Motor Corporation class shareholders
(2,449) (2,449) (2,449)
Dividends paid to Toyota Motor Corporation common shareholders
(704,728) (704,728) (704,728)
Dividends paid to noncontrolling interests
(73,129) (73,129)
Repurchase of treasury stock (782,871) (782,871) (782,871)
Reissuance of treasury stock 183 4,515 4,698 4,698
Retirement of treasury stock (1,048) (399,489) 400,537 ― ―
Balances at March 31, 2016 397,050 548,161 16,794,240 610,768 (1,603,284) 16,746,935 861,472 17,608,407
(Yen in millions)
FY2017 (For the year ended March 31, 2017)
Common
stock
Additional paid-in capital
Retained earnings
Accumulated other
comprehensiveincome (loss)
Treasury stock, at cost
Total Toyota Motor
Corporation shareholders'
equity
Noncontrolling interests
Total shareholders'
equity
Balances at March 31, 2016 397,050 548,161 16,794,240 610,768 (1,603,284) 16,746,935 861,472 17,608,407
Equity transaction with noncontrolling interests and other (35,555) (2,226) 283,561 245,780 (232,433) 13,347
Comprehensive income: Net income 1,831,109 1,831,109 95,876 1,926,985
Other comprehensive income (loss)
Foreign currency translation adjustments
(52,427) (52,427) (5,499) (57,926)
Unrealized gains (losses) on securities
(8,002) (8,002) 12,281 4,279
Pension liability adjustments 92,809 92,809 503 93,312
Total comprehensive income 1,863,489 103,161 1,966,650
Accretion to Mezzanine equity (4,849) (4,849) (4,849)
Dividends to Toyota Motor Corporation class shareholders
(4,946) (4,946) (4,946)
Dividends paid to Toyota Motor Corporation common shareholders
(634,475) (634,475) (634,475)
Dividends paid to noncontrolling interests
(63,936) (63,936)
Repurchase of treasury stock (700,228) (700,228) (700,228)
Reissuance of treasury stock (1,219) 4,325 3,106 3,106
Retirement of treasury stock (27,374) (380,009) 407,383 ― ―
Balances at March 31, 2017 397,050 484,013 17,601,070 640,922 (1,608,243) 17,514,812 668,264 18,183,076
11

TOYOTA MOTOR CORPORATION FY2017 Financial Summary(Consolidated financial information has been prepared in accordance with U.S. generally accepted accounting principles)
(4) Consolidated Statements of Cash Flows
(Yen in millions)
FY2016
(For the year ended March 31, 2016)
FY2017 (For the year ended
March 31, 2017)
Cash flows from operating activities:
Net income 2,434,211 1,926,985 Adjustments to reconcile net income to net cash provided by operating activities
Depreciation 1,625,837 1,610,950
Provision for doubtful accounts and credit losses 159,265 98,666
Pension and severance costs, less payments 8,833 23,253
Losses on disposal of fixed assets 33,329 30,673
Unrealized losses on available-for-sale securities, net 9,272 7,073
Deferred income taxes 32,889 (53,299)
Equity in earnings of affiliated companies (329,099) (362,060)
Changes in operating assets and liabilities, and other 486,320 131,996
Net cash provided by operating activities 4,460,857 3,414,237
Cash flows from investing activities:
Additions to finance receivables (13,549,278) (13,636,694)
Collection of and proceeds from sales of finance receivables 13,115,854 12,927,981
Additions to fixed assets excluding equipment leased to others (1,282,545) (1,223,878)
Additions to equipment leased to others (2,776,671) (2,317,559) Proceeds from sales of fixed assets excluding equipment leased to others 42,147 41,238
Proceeds from sales of equipment leased to others 1,111,727 1,238,278
Purchases of marketable securities and security investments (2,197,477) (2,517,008) Proceeds from sales of and maturity of marketable securities and security investments 3,415,815 1,901,541
Payment for additional investments in affiliated companies, net of cash acquired 628 44,274
Changes in investments and other assets, and other (1,062,744) 571,888
Net cash used in investing activities (3,182,544) (2,969,939)
Cash flows from financing activities:
Proceeds from issuance of long-term debt 4,845,872 4,603,446
Payments of long-term debt (4,176,202) (3,845,554)
Increase (decrease) in short-term borrowings (10,903) 273,037
Proceeds from issuance of class shares 474,917 ―
Dividends paid to Toyota Motor Corporation class shareholders (1,225) (3,697)
Dividends paid to Toyota Motor Corporation common shareholders (704,728) (634,475)
Dividends paid to noncontrolling interests (73,129) (63,936)
Reissuance (repurchase) of treasury stock, and other (778,173) (703,986)
Net cash used in financing activities (423,571) (375,165)
Effect of exchange rate changes on cash and cash equivalents (199,871) (13,486)
Net increase in cash and cash equivalents 654,871 55,647
Cash and cash equivalents at beginning of year 2,284,557 2,939,428
Cash and cash equivalents at end of year 2,939,428 2,995,075
Note:
In the Consolidated Statements of Cash Flows, cash and cash equivalents include cash on hand, bank deposits that can be withdrawn at any time and short-term investments that can be converted into cash at any time and carry minimal risk of change in value.
12

TOYOTA MOTOR CORPORATION FY2017 Financial Summary(Consolidated financial information has been prepared in accordance with U.S. generally accepted accounting principles)
(5) Going Concern Assumption
None
(6) Summary of Significant Accounting Policies
"Summary of Significant Accounting Policies" has been omitted, as there were no significantchanges from the most recent Securities Report (filed on June 24, 2016). Changes in accountingprinciples, procedures, and disclosures for consolidated financial statements by newly issuedaccounting pronouncements are set forth below.
In February 2015, the Financial Accounting Standards Board ("FASB") issued updated
guidance that amends the analysis a reporting entity must perform to determine whether it shouldconsolidate certain legal entities. The parent company and its consolidated subsidiaries ("Toyota")adopted this guidance on April 1, 2016. The adoption of this guidance did not have a material impacton Toyota's consolidated financial statements.
In April 2015, the FASB issued updated guidance that requires debt issuance costs related to
a recognized debt liability be presented in the balance sheet as a direct deduction from the carryingamount of the related debt liability instead of being presented as an asset. In August 2015, the FASBissued an additional update which clarifies that debt issuance costs for line of credit agreements maycontinue to be deferred and amortized. Toyota adopted this guidance on April 1, 2016. The adoptionof this guidance did not have a material impact on Toyota's consolidated financial statements. For theprevious consolidated fiscal year, debt issuance costs are recorded at "Other" in "Investments andother assets" on the consolidated balance sheet in the amount of 23,695 million yen.
In April 2015, the FASB issued updated guidance to help entities evaluate the accounting for
fees paid by a customer in a cloud computing arrangement. Toyota adopted this guidance on April 1,2016. The adoption of this guidance did not have a material impact on Toyota's consolidated financialstatements.
In November 2015, the FASB issued updated guidance to simplify the balance sheet
classification of deferred taxes. This guidance will require that deferred tax assets and liabilities beclassified as noncurrent on the balance sheet. Toyota early adopted this guidance on April 1, 2016.Toyota adopted this guidance on a prospective basis from April 1, 2016 and prior periods were notretrospectively adjusted.
In March 2016, the FASB issued updated guidance to simplify the requirement in applying the
equity method of accounting. This update eliminates the requirement that when an investmentqualifies for use of the equity method as a result of an increase in the level of ownership interest ordegree of influence, an investor must adjust the investment, results of operations, and retainedearnings retroactively as if the equity method had been in effect during all previous periods that theinvestment had been held. Toyota early adopted this guidance on April 1, 2016. The adoption of thisguidance did not have a material impact on Toyota's consolidated financial statements.
13

TOYOTA MOTOR CORPORATION FY2017 Financial Summary(Consolidated financial information has been prepared in accordance with U.S. generally accepted accounting principles)
(7) Segment Information
(i) Segment Operating Results and Assets
FY2016 (As of and for the year ended March 31, 2016) (Yen in millions)
Automotive Financial Services
All Other
Inter-segment Elimination and/or
Unallocated Amount
Consolidated
Net revenues:
Sales to external customers 25,923,813 1,854,007 625,298 — 28,403,118
Inter-segment sales and transfers 53,603 42,217 552,089 (647,909) —
Total 25,977,416 1,896,224 1,177,387 (647,909) 28,403,118
Operating expenses 23,528,418 1,556,998 1,110,880 (647,149) 25,549,147
Operating income 2,448,998 339,226 66,507 (760) 2,853,971
Assets 15,621,757 21,709,010 1,917,148 8,179,682 47,427,597
Investment in equity method investees 2,532,644 9,168 10,801 78,776 2,631,389
Depreciation expenses 900,434 697,991 27,412 — 1,625,837
Capital expenditure 1,389,289 2,638,111 41,826 (10,010) 4,059,216
FY2017 (As of and for the year ended March 31, 2017) (Yen in millions)
Automotive Financial Services
All Other
Inter-segment Elimination and/or
Unallocated Amount
Consolidated
Net revenues:
Sales to external customers 25,032,229 1,783,697 781,267 — 27,597,193
Inter-segment sales and transfers 49,618 39,903 539,785 (629,306) —
Total 25,081,847 1,823,600 1,321,052 (629,306) 27,597,193
Operating expenses 23,388,874 1,601,172 1,239,725 (626,950) 25,602,821
Operating income 1,692,973 222,428 81,327 (2,356) 1,994,372
Assets 16,156,496 22,507,613 2,170,498 7,915,579 48,750,186
Investment in equity method investees 2,745,437 9,792 — 90,193 2,845,422
Depreciation expenses 912,797 671,155 26,998 — 1,610,950
Capital expenditure 1,293,564 2,182,149 53,710 12,014 3,541,437
Note: Unallocated corporate assets included under "Inter-segment Elimination and/or Unallocated Amount" for FY2016 and FY2017 are 9,369,868 million yen and 9,177,953 million yen, respectively, and consist primarily of funds such as cash and cash equivalents, marketable securities and portion of security investments held by TMC.
14

TOYOTA MOTOR CORPORATION FY2017 Financial Summary(Consolidated financial information has been prepared in accordance with U.S. generally accepted accounting principles)
(ii) Consolidated Financial Statements as Classified into Non-Financial Services Business and Financial Services Business
Consolidated Balance Sheets as Classified into Non-Financial Services Business andFinancial Services Business
(Yen in millions)
FY2016 (March 31, 2016)
FY2017 (March 31, 2017)
Increase (Decrease)
Assets
(Non-financial services)
Current assets:
Cash and cash equivalents 2,318,152 2,257,064 (61,088)
Marketable securities 1,210,427 1,439,944 229,517
Trade accounts and notes receivable, less allowance for doubtful accounts
2,089,216 2,191,594 102,378
Inventories 2,061,113 2,388,394 327,281
Prepaid expenses and other current assets 3,341,150 1,988,016 (1,353,134)
Total current assets 11,020,058 10,265,012 (755,046)
Investments and other assets 10,204,760 11,276,128 1,071,368
Property, plant and equipment 5,426,247 5,700,818 274,571
Total assets 26,651,065 27,241,958 590,893
(Financial services)
Current assets:
Cash and cash equivalents 621,276 738,011 116,735
Marketable securities 300,962 381,654 80,692
Finance receivables, net 5,912,684 6,196,649 283,965
Prepaid expenses and other current assets 895,257 831,924 (63,333)
Total current assets 7,730,179 8,148,238 418,059
Noncurrent finance receivables, net 8,642,947 9,012,222 369,275
Investments and other assets 1,021,714 850,862 (170,852)
Property, plant and equipment 4,314,170 4,496,291 182,121
Total assets 21,709,010 22,507,613 798,603
(Elimination) Elimination of assets (932,478) (999,385) (66,907)
(Consolidated) Total assets 47,427,597 48,750,186 1,322,589
Note: Assets in the non-financial services include unallocated corporate assets.
15

TOYOTA MOTOR CORPORATION FY2017 Financial Summary(Consolidated financial information has been prepared in accordance with U.S. generally accepted accounting principles)
(Yen in millions)
FY2016
(March 31, 2016) FY2017
(March 31, 2017) Increase
(Decrease)
Liabilities
(Non-financial services)
Current liabilities:
Short-term borrowings 586,685 669,947 83,262
Current portion of long-term debt 117,484 196,227 78,743
Accounts payable 2,356,355 2,540,078 183,723
Accrued expenses 2,640,128 3,038,218 398,090
Income taxes payable 334,490 203,101 (131,389)
Other current liabilities 1,527,024 1,512,662 (14,362)
Total current liabilities 7,562,166 8,160,233 598,067
Long-term liabilities:
Long-term debt 584,793 590,366 5,573
Accrued pension and severance costs 891,405 890,684 (721)
Other long-term liabilities 1,690,460 1,206,427 (484,033)
Total long-term liabilities 3,166,658 2,687,477 (479,181)
Total liabilities 10,728,824 10,847,710 118,886
(Financial services)
Current liabilities:
Short-term borrowings 4,418,483 4,605,389 186,906
Current portion of long-term debt 3,715,195 4,129,005 413,810
Accounts payable 40,094 33,283 (6,811)
Accrued expenses 109,246 117,773 8,527
Income taxes payable 8,835 20,473 11,638
Other current liabilities 814,298 833,813 19,515
Total current liabilities 9,106,151 9,739,736 633,585
Long-term liabilities:
Long-term debt 9,343,632 9,491,504 147,872
Accrued pension and severance costs 13,506 14,386 880
Other long-term liabilities 1,081,789 987,289 (94,500)
Total long-term liabilities 10,438,927 10,493,179 54,252
Total liabilities 19,545,078 20,232,915 687,837
(Elimination) Elimination of liabilities (934,491) (999,392) (64,901)
(Consolidated) Total liabilities 29,339,411 30,081,233 741,822
(Consolidated) Mezzanine equity 479,779 485,877 6,098
Shareholders' equity (Consolidated) Total Toyota Motor Corporation shareholders' equity 16,746,935 17,514,812 767,877
(Consolidated) Noncontrolling interests 861,472 668,264 (193,208)
(Consolidated) Total shareholders' equity 17,608,407 18,183,076 574,669 (Consolidated) Total liabilities, mezzanine equity
and shareholders' equity 47,427,597 48,750,186 1,322,589
16

TOYOTA MOTOR CORPORATION FY2017 Financial Summary(Consolidated financial information has been prepared in accordance with U.S. generally accepted accounting principles)
Consolidated Statements of Income as Classified into Non-Financial Services Business andFinancial Services Business
(Yen in millions)
FY2016
(For the year ended March 31, 2016)
FY2017(For the year ended
March 31, 2017)
Increase (Decrease)
(Non-financial services)
Net revenues 26,581,102 25,845,453 (735,649)
Costs and expenses: 24,063,468 24,068,841 5,373
Cost of revenues 21,474,386 21,557,194 82,808
Selling, general and administrative 2,589,082 2,511,647 (77,435)
Operating income 2,517,634 1,776,612 (741,022)
Other income (expense), net 117,930 200,370 82,440 Income before income taxes and equity in earnings of affiliated companies
2,635,564 1,976,982 (658,582)
Provision for income taxes 752,248 562,452 (189,796)
Equity in earnings of affiliated companies 327,167 360,130 32,963
Net income 2,210,483 1,774,660 (435,823)Less – Net income attributable to noncontrolling interests (117,544) (89,337) 28,207
Net income attributable to Toyota Motor Corporation 2,092,939 1,685,323 (407,616)
(Financial services) Net revenues 1,896,224 1,823,600 (72,624)
Costs and expenses: 1,556,998 1,601,172 44,174
Cost of revenues 1,181,437 1,221,268 39,831
Selling, general and administrative 375,561 379,904 4,343
Operating income 339,226 222,428 (116,798)
Other income (expense), net 8,579 (5,618) (14,197)Income before income taxes and equity in earnings of affiliated companies 347,805 216,810 (130,995)
Provision for income taxes 126,319 66,583 (59,736)
Equity in earnings of affiliated companies 1,932 1,930 (2)
Net income 223,418 152,157 (71,261)Less – Net income attributable to noncontrolling interests
(3,963) (6,518) (2,555)
Net income attributable to Toyota Motor Corporation 219,455 145,639 (73,816)
(Elimination) Elimination of net income attributable to Toyota Motor Corporation 300 147 (153)
(Consolidated) Net income attributable to Toyota Motor Corporation 2,312,694 1,831,109 (481,585)
17

TOYOTA MOTOR CORPORATION FY2017 Financial Summary(Consolidated financial information has been prepared in accordance with U.S. generally accepted accounting principles)
Consolidated Statements of Cash Flows as Classified into Non-Financial Services Businessand Financial Services Business
(Yen in millions)
FY2016
(For the year ended March 31, 2016)
FY2017(For the year ended
March 31, 2017)
(Non-financial services)
Cash flows from operating activities:
Net income 2,210,483 1,774,660 Adjustments to reconcile net income to net cash provided by operating activities
Depreciation
927,846
939,795Provision for doubtful accounts 69,029 6,519
Pension and severance costs, less payments 8,300 21,796
Losses on disposal of fixed assets 33,293 30,461
Unrealized losses on available-for-sale securities, net 3,217 4,422
Deferred income taxes (43,237) (59,668)
Equity in earnings of affiliated companies (327,167) (360,130)
Changes in operating assets and liabilities, and other 386,529 206,455
Net cash provided by operating activities 3,268,293 2,564,310
Cash flows from investing activities:
Additions to fixed assets excluding equipment leased to others (1,265,174) (1,206,738)
Additions to equipment leased to others (155,931) (152,550)Proceeds from sales of fixed assets excluding equipment leased to others
41,154 40,189
Proceeds from sales of equipment leased to others 60,989 72,659
Purchases of marketable securities and security investments (1,302,965) (2,104,202)Proceeds from sales of and maturity of marketable securities and security investments
2,471,876 1,435,267
Payment for additional investments in affiliated companies,net of cash acquired 628 44,274
Changes in investments and other assets, and other (1,371,996) 582,649
Net cash used in investing activities (1,521,419) (1,288,452)
Cash flows from financing activities:
Proceeds from issuance of long-term debt 110,691 111,727
Payments of long-term debt (71,758) (82,840)
Increase in short-term borrowings 75,990 51,523
Proceeds from issuance of class shares 474,917 ―
Dividends paid to Toyota Motor Corporation class shareholders (1,225) (3,697)
Dividends paid to Toyota Motor Corporation common shareholders (704,728) (634,475)
Dividends paid to noncontrolling interests (73,129) (63,936)
Reissuance (repurchase) of treasury stock, and other (778,173) (703,986)
Net cash used in financing activities (967,415) (1,325,684)
Effect of exchange rate changes on cash and cash equivalents (142,301) (11,262)
Net increase (decrease) in cash and cash equivalents 637,158 (61,088)
Cash and cash equivalents at beginning of year 1,680,994 2,318,152
Cash and cash equivalents at end of year 2,318,152 2,257,064
18

TOYOTA MOTOR CORPORATION FY2017 Financial Summary(Consolidated financial information has been prepared in accordance with U.S. generally accepted accounting principles)
(Yen in millions)
FY2016
(For the year ended March 31, 2016)
FY2017 (For the year ended
March 31, 2017)
(Financial services)
Cash flows from operating activities:
Net income 223,418 152,157 Adjustments to reconcile net income to net cash provided by operating activities
Depreciation 697,991 671,155
Provision for doubtful accounts and credit losses 90,236 92,147
Pension and severance costs, less payments 533 1,457
Losses on disposal of fixed assets 36 212
Unrealized losses on available-for-sale securities, net 6,055 2,651
Deferred income taxes 76,423 6,504
Equity in earnings of affiliated companies (1,932) (1,930)
Changes in operating assets and liabilities, and other 148,376 103,840
Net cash provided by operating activities 1,241,136 1,028,193
Cash flows from investing activities:
Additions to finance receivables (23,399,113) (22,894,114)
Collection of and proceeds from sales of finance receivables 22,918,132 22,006,010
Additions to fixed assets excluding equipment leased to others (17,371) (17,140)
Additions to equipment leased to others (2,620,740) (2,165,009)Proceeds from sales of fixed assets excluding equipment leased to others
993 1,049
Proceeds from sales of equipment leased to others 1,050,738 1,165,619
Purchases of marketable securities and security investments (894,512) (412,806)Proceeds from sales of and maturity of marketable securities and security investments
943,939 466,274
Changes in investments and other assets, and other 296,788 (60,345)
Net cash used in investing activities (1,721,146) (1,910,462)
Cash flows from financing activities:
Proceeds from issuance of long-term debt 4,815,323 4,541,541
Payments of long-term debt (4,127,178) (3,773,644)
Increase (decrease) in short-term borrowings (132,852) 233,331
Net cash provided by financing activities 555,293 1,001,228
Effect of exchange rate changes on cash and cash equivalents (57,570) (2,224)
Net increase in cash and cash equivalents 17,713 116,735
Cash and cash equivalents at beginning of year 603,563 621,276
Cash and cash equivalents at end of year 621,276 738,011
(Consolidated)
Effect of exchange rate changes on cash and cash equivalents (199,871) (13,486)
Net increase in cash and cash equivalents 654,871 55,647
Cash and cash equivalents at beginning of year 2,284,557 2,939,428
Cash and cash equivalents at end of year 2,939,428 2,995,075
Note:
In the Consolidated Statements of Cash Flows, cash and cash equivalents include cash on hand, bank depositsthat can be withdrawn at any time and short-term investments that can be converted into cash at any time andcarry minimal risk of change in value.
19

TOYOTA MOTOR CORPORATION FY2017 Financial Summary(Consolidated financial information has been prepared in accordance with U.S. generally accepted accounting principles)
(iii) Geographic Information
FY2016 (As of and for the year ended March 31, 2016) (Yen in millions)
Japan North
America Europe Asia Other
Inter-segment Elimination
and/or Unallocated
Amount
Consolidated
Net revenues:
Sales to external customers 8,588,437 10,822,772 2,507,292 4,475,623 2,008,994 — 28,403,118
Inter-segment sales and transfers 6,171,051 229,198 154,039 528,236 201,220 (7,283,744) —
Total 14,759,488 11,051,970 2,661,331 5,003,859 2,210,214 (7,283,744) 28,403,118
Operating expenses 13,081,966 10,523,151 2,588,915 4,554,670 2,101,305 (7,300,860) 25,549,147
Operating income 1,677,522 528,819 72,416 449,189 108,909 17,116 2,853,971
Assets 14,291,434 16,622,979 2,612,210 4,415,700 2,579,113 6,906,161 47,427,597
FY2017 (As of and for the year ended March 31, 2017) (Yen in millions)
Japan North
America Europe Asia Other
Inter-segment Elimination
and/or Unallocated
Amount
Consolidated
Net revenues:
Sales to external customers 8,798,903 10,033,419 2,517,601 4,279,617 1,967,653 — 27,597,193
Inter-segment sales and transfers 6,031,965 205,672 163,438 540,204 193,421 (7,134,700) —
Total 14,830,868 10,239,091 2,681,039 4,819,821 2,161,074 (7,134,700) 27,597,193
Operating expenses 13,628,623 9,927,897 2,693,283 4,384,642 2,102,380 (7,134,004) 25,602,821
Operating income (loss) 1,202,245 311,194 (12,244) 435,179 58,694 (696) 1,994,372
Assets 14,791,969 17,365,237 2,846,469 4,486,021 2,819,935 6,440,555 48,750,186
Note:
1.Unallocated corporate assets included under "Inter-segment Elimination and/or Unallocated Amount" for FY2016 and FY2017 are9,369,868 million yen and 9,177,953 million yen, respectively, and consist primarily of funds such as cash and cash equivalents,marketable securities and portion of security investments held by TMC.
2."Other" consists of Central and South America, Oceania, Africa and the Middle East.
20

Basic and diluted net income attributable to Toyota Motor Corporation per common share for theyears ended March 31, 2016 and 2017 are as follows:
The following table shows Toyota Motor Corporation shareholders' equity per share as of March
31, 2016 and 2017.
TOYOTA MOTOR CORPORATION FY2017 Financial Summary(Consolidated financial information has been prepared in accordance with U.S. generally accepted accounting principles)
(8) Per Share Amounts
Yen in millions
Thousands of shares
Yen
Net income attributable to Toyota
Motor Corporation
Weighted-average common shares
Net income attributable
to Toyota Motor Corporation
per common share
For the year ended March 31, 2016
Net income attributable to Toyota Motor Corporation
2,312,694
Accretion to Mezzanine equity (3,638)
Dividends to Toyota Motor Corporation Model AA Class Shareholders
(2,449)
Basic net income attributable to Toyota Motor Corporation per common share
2,306,607 3,111,306 741.36
Effect of dilutive securities
Model AA Class Shares 6,087 32,429
Assumed exercise of dilutive stock options (21) 1,212
Diluted net income attributable to Toyota Motor Corporation per common share
2,312,673 3,144,947 735.36
For the year ended March 31, 2017
Net income attributable to Toyota Motor Corporation
1,831,109
Accretion to Mezzanine equity (4,849)
Dividends to Toyota Motor Corporation Model AA Class Shareholders
(4,946)
Basic net income attributable to Toyota Motor Corporation per common share
1,821,314 3,008,088 605.47
Effect of dilutive securities
Model AA Class Shares 9,795 47,100
Assumed exercise of dilutive stock options (6) 638
Diluted net income attributable to Toyota Motor Corporation per common share
1,831,103 3,055,826 599.22
Yen in millions
Thousands of shares
Yen
Toyota Motor Corporation
shareholders' equity
Common shares issued and outstanding
at the end of the year (excluding treasury
stock)
Toyota Motor Corporation
shareholders' equity per share
As of March 31, 2016 16,746,935 3,037,676 5,513.08
As of March 31, 2017 17,514,812 2,974,723 5,887.88
21


![FY2017 Financial Results · 2018-05-21 · ©2018 Topcon Corporation 5 FY2017 Financial Results by Business [Consolidated] FY2016 FY2017](https://img.pdfslide.net/doc/110x75/5f7157b8a702f55df61cd566/fy2017-financial-results-2018-05-21-2018-topcon-corporation-5-fy2017-financial.jpg)