Embed Size (px)
Citation preview
Copyright © 2018 Mitsui Chemicals, Inc.
Mitsui Chemicals, Inc.
Financial Summary
February 2, 2018
<Remarks>FY2017 indicates the period from April 1, 2017 to March 31, 2018.
Results for 3rd Quarter of FY2017 & Outlook for FY2017
Copyright © 2018 Mitsui Chemicals, Inc.
Contents
Please note that this document has been translated from the original Japanese into English for the convenience of our stakeholders. The information was originally provided in Japanese. If there is any discrepancy, the Japanese language version is the official document and is available on our Japanese language website.
1. Results for 3rd Quarter of FY2017 (April 1, 2017 – December 31, 2017)
1) Review on 3rd Quarter of FY2017 (Business Overview and Topics) ・・・ 1, 2
2) Consolidated Financial Highlights ・・・ 3, 4 3) Net sales and Operating Income/Loss by Business Segment (compared with corresponding period of FY2016 results)
・・・ 5
4) Non-Operating Income and Expenses, and Extraordinary Gains and Losses ・・・ 6
5) Consolidated Balance Sheet ・・・ 7
6) Consolidated Statement of Cash Flow ・・・ 8
2. Outlook for FY2017 (April 1, 2017 – March 31, 2018)
1) Topics for 4th Quarter of FY2017 ・・・ 9
2) Consolidated Financial Highlights of Outlook ・・・10 3) Net sales and Operating Income/Loss by Business Segment (compared with FY2016 results)
・・・11
4) Operating Income/Loss by Business Segment (compared with previous outlook)
・・・12
5) Non-Operating Income and Expenses, and Extraordinary Gains and Losses ・・・13, 14
6) Consolidated Statement of Cash Flow ・・・15
3. Appendix ・・・16〜24
Copyright © 2018 Mitsui Chemicals, Inc.
1. Results for 3rd Quarter of FY2017(April 1, 2017 – December 31, 2017)
Copyright © 2018 Mitsui Chemicals, Inc.1
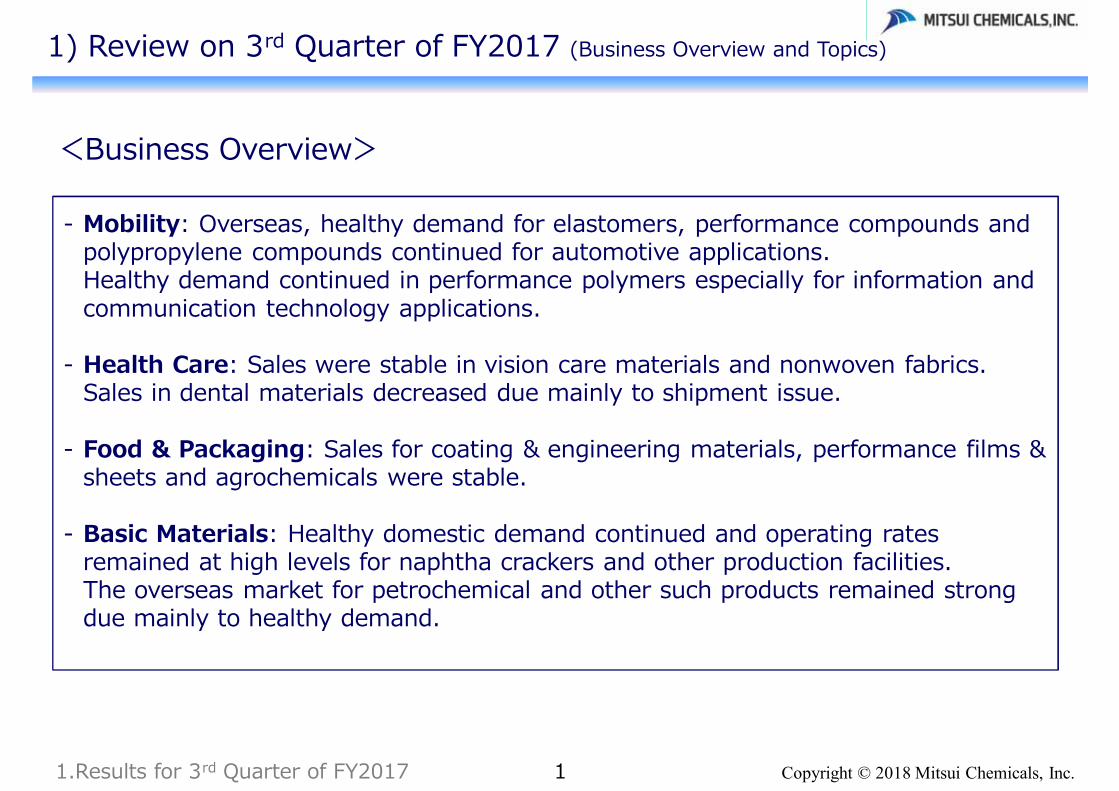
<Business Overview>
- Mobility: Overseas, healthy demand for elastomers, performance compounds and polypropylene compounds continued for automotive applications.Healthy demand continued in performance polymers especially for information and communication technology applications.
- Health Care: Sales were stable in vision care materials and nonwoven fabrics. Sales in dental materials decreased due mainly to shipment issue.
- Food & Packaging: Sales for coating & engineering materials, performance films & sheets and agrochemicals were stable.
- Basic Materials: Healthy domestic demand continued and operating rates remained at high levels for naphtha crackers and other production facilities. The overseas market for petrochemical and other such products remained strong due mainly to healthy demand.
1) Review on 3rd Quarter of FY2017 (Business Overview and Topics)
1.Results for 3rd Quarter of FY2017
Copyright © 2018 Mitsui Chemicals, Inc.2
1) Review on 3rd Quarter of FY2017 (Business Overview and Topics)
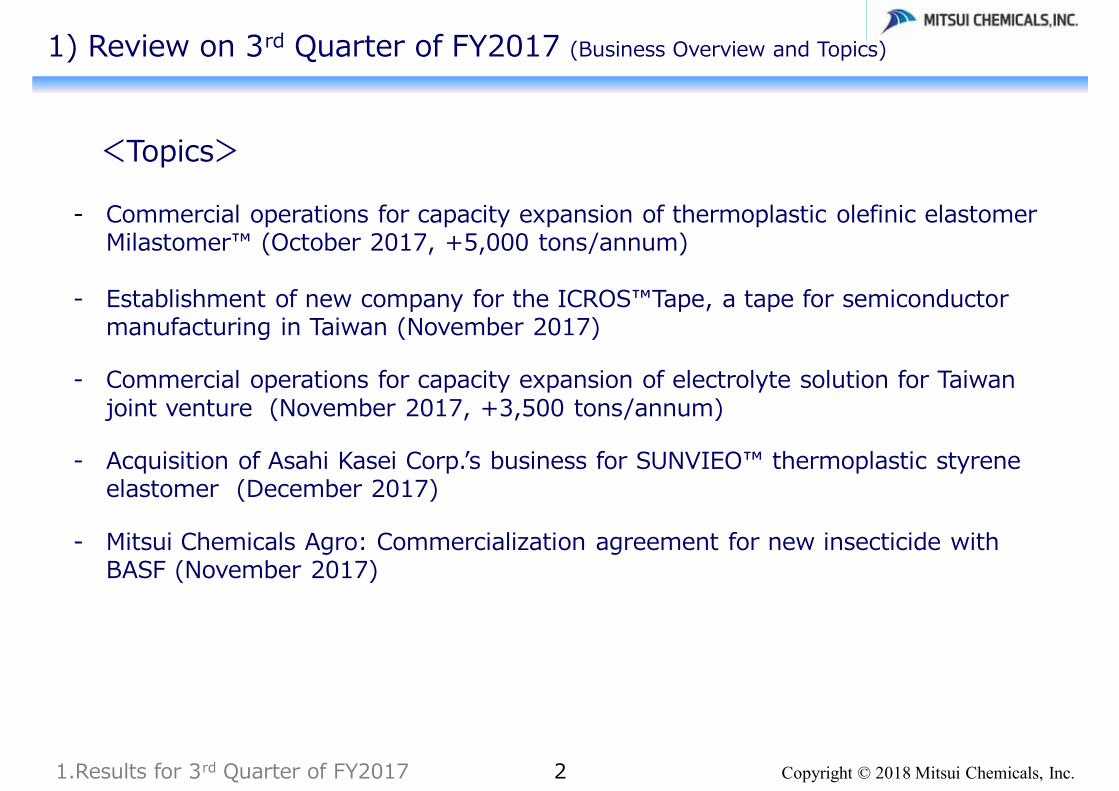
<Topics>
- Commercial operations for capacity expansion of thermoplastic olefinic elastomer Milastomer™ (October 2017, +5,000 tons/annum)
- Establishment of new company for the ICROS™Tape, a tape for semiconductor manufacturing in Taiwan (November 2017)
- Commercial operations for capacity expansion of electrolyte solution for Taiwan joint venture (November 2017, +3,500 tons/annum)
- Acquisition of Asahi Kasei Corp.’s business for SUNVIEO™ thermoplastic styrene elastomer (December 2017)
- Mitsui Chemicals Agro: Commercialization agreement for new insecticide with BASF (November 2017)
1.Results for 3rd Quarter of FY2017
Copyright © 2018 Mitsui Chemicals, Inc.3
2) Consolidated Financial Highlights
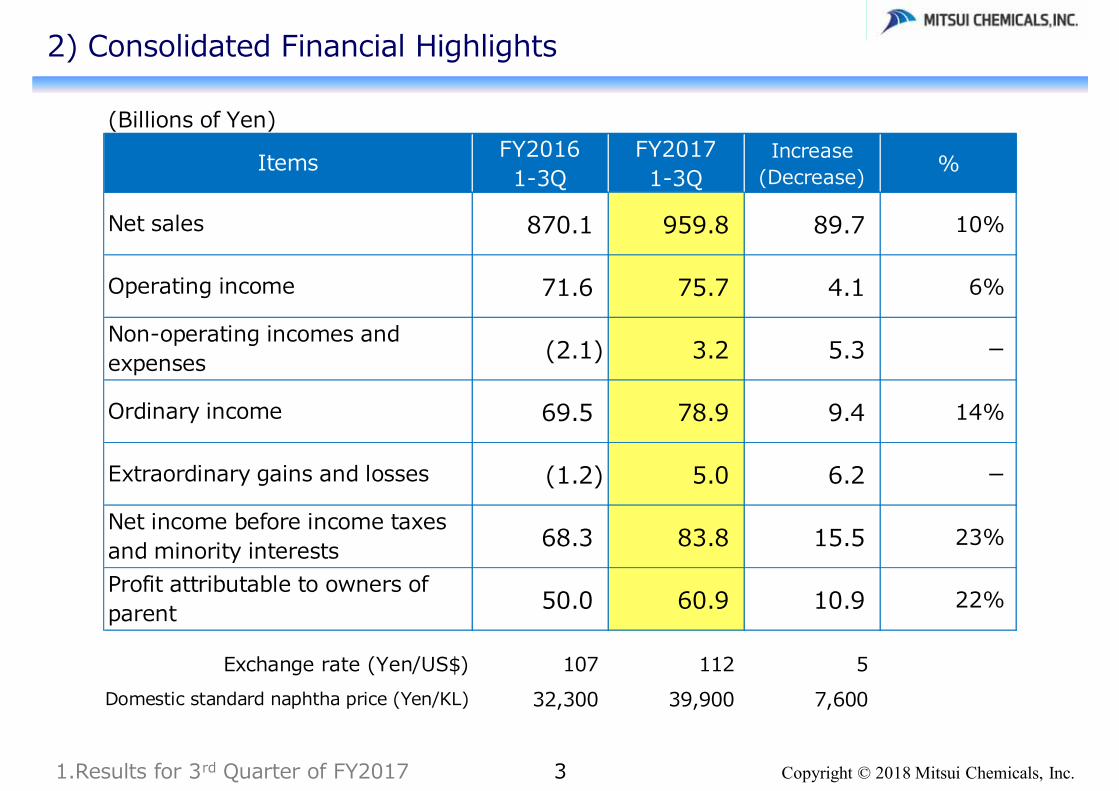
(Billions of Yen)FY20161-3Q
FY20171-3Q
Increase(Decrease) %
870.1 959.8 89.7 10%
71.6 75.7 4.1 6%
(2.1) 3.2 5.3 ー
69.5 78.9 9.4 14%
(1.2) 5.0 6.2 ー
68.3 83.8 15.5 23%
50.0 60.9 10.9 22%
Exchange rate (Yen/US$) 107 112 5Domestic standard naphtha price (Yen/KL) 32,300 39,900 7,600
Items
Net sales
Operating income
Non-operating incomes andexpenses
Ordinary income
Extraordinary gains and losses
Net income before income taxesand minority interestsProfit attributable to owners ofparent
1.Results for 3rd Quarter of FY2017
Copyright © 2018 Mitsui Chemicals, Inc.4
2) Consolidated Financial Highlights
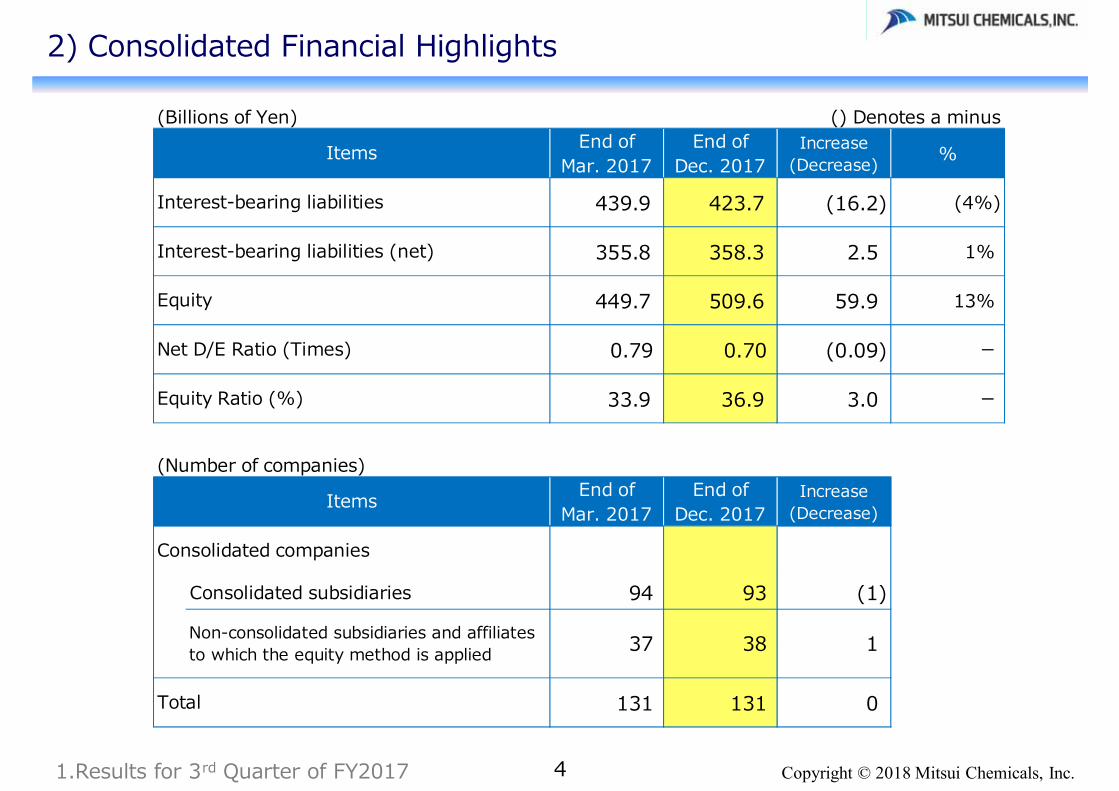
(Billions of Yen) () Denotes a minusEnd of
Mar. 2017End of
Dec. 2017Increase
(Decrease) %
439.9 423.7 (16.2) (4%)
355.8 358.3 2.5 1%
449.7 509.6 59.9 13%
0.79 0.70 (0.09) ー
33.9 36.9 3.0 ー
(Number of companies)End of
Mar. 2017End of
Dec. 2017Increase
(Decrease)
Consolidated subsidiaries 94 93 (1)
131 131 0
37 38 1
Items
Consolidated companies
Total
Non-consolidated subsidiaries and affiliatesto which the equity method is applied
Equity
Net D/E Ratio (Times)
Equity Ratio (%)
Items
Interest-bearing liabilities
Interest-bearing liabilities (net)
1.Results for 3rd Quarter of FY2017
Copyright © 2018 Mitsui Chemicals, Inc.5
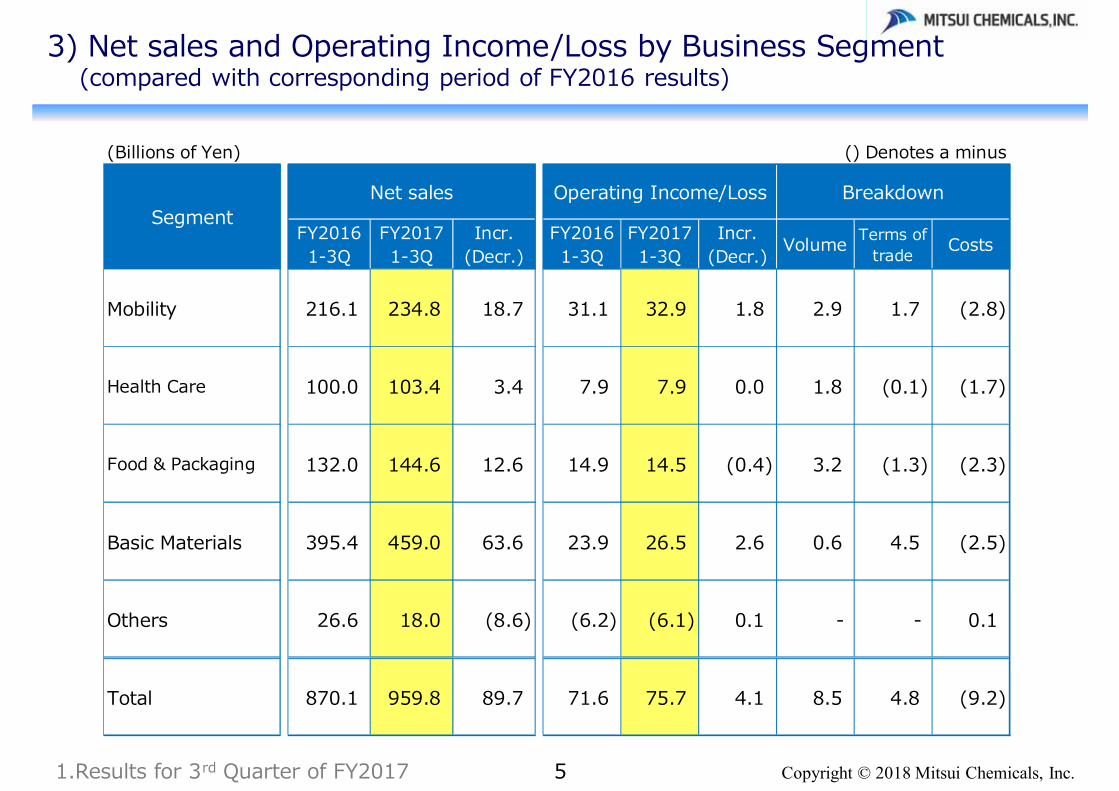
3) Net sales and Operating Income/Loss by Business Segment(compared with corresponding period of FY2016 results)
(Billions of Yen) () Denotes a minus
FY20161-3Q
FY20171-3Q
Incr.(Decr.)
FY20161-3Q
FY20171-3Q
Incr.(Decr.) Volume Terms of
trade Costs
Mobility 216.1 234.8 18.7 31.1 32.9 1.8 2.9 1.7 (2.8)
Health Care 100.0 103.4 3.4 7.9 7.9 0.0 1.8 (0.1) (1.7)
Food & Packaging 132.0 144.6 12.6 14.9 14.5 (0.4) 3.2 (1.3) (2.3)
Basic Materials 395.4 459.0 63.6 23.9 26.5 2.6 0.6 4.5 (2.5)
Others 26.6 18.0 (8.6) (6.2) (6.1) 0.1 - - 0.1
Total 870.1 959.8 89.7 71.6 75.7 4.1 8.5 4.8 (9.2)
BreakdownSegment
Net sales Operating Income/Loss
1.Results for 3rd Quarter of FY2017
Copyright © 2018 Mitsui Chemicals, Inc.
(Billions of Yen) () Denotes a minusFY20161-3Q
FY20171-3Q
Incr.(Decr.)
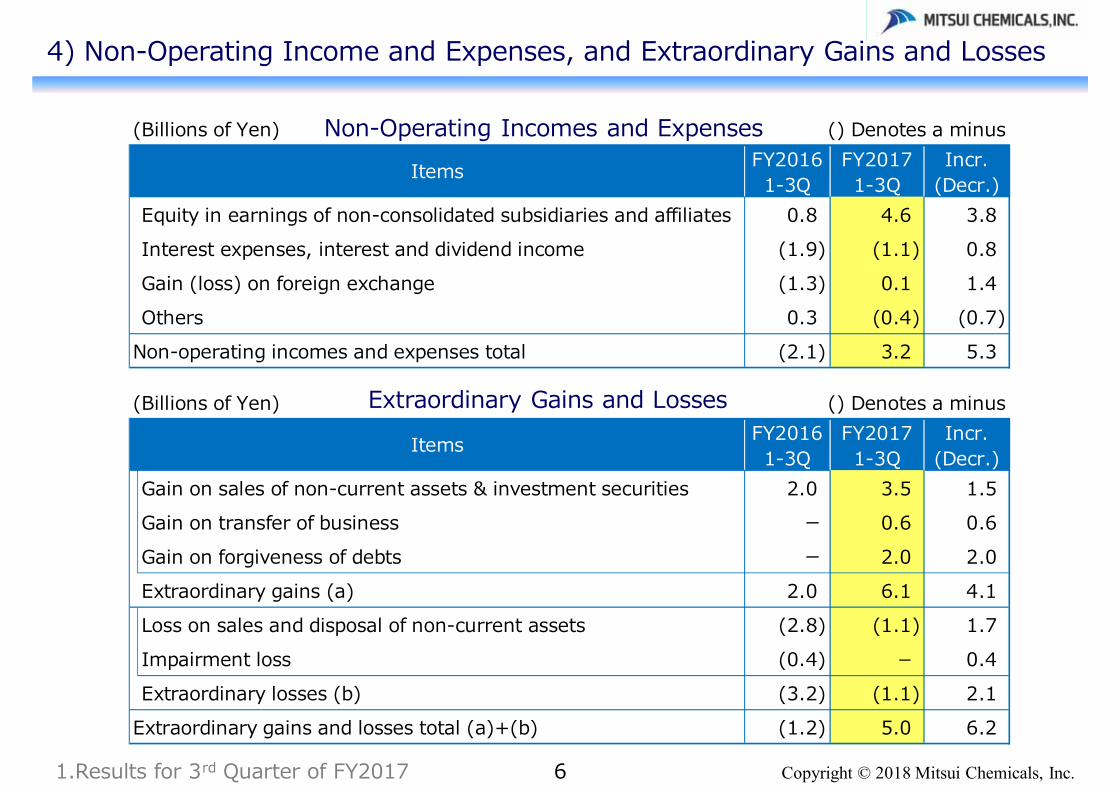
Equity in earnings of non-consolidated subsidiaries and affiliates 0.8 4.6 3.8Interest expenses, interest and dividend income (1.9) (1.1) 0.8Gain (loss) on foreign exchange (1.3) 0.1 1.4Others 0.3 (0.4) (0.7)
Non-operating incomes and expenses total (2.1) 3.2 5.3
(Billions of Yen) () Denotes a minusFY20161-3Q
FY20171-3Q
Incr.(Decr.)
Gain on sales of non-current assets & investment securities 2.0 3.5 1.5Gain on transfer of business ー 0.6 0.6Gain on forgiveness of debts ー 2.0 2.0Extraordinary gains (a) 2.0 6.1 4.1Loss on sales and disposal of non-current assets (2.8) (1.1) 1.7Impairment loss (0.4) - 0.4Extraordinary losses (b) (3.2) (1.1) 2.1
Extraordinary gains and losses total (a)+(b) (1.2) 5.0 6.2
Items
Items
6
4) Non-Operating Income and Expenses, and Extraordinary Gains and Losses
Non-Operating Incomes and Expenses
Extraordinary Gains and Losses
1.Results for 3rd Quarter of FY2017
Copyright © 2018 Mitsui Chemicals, Inc.7
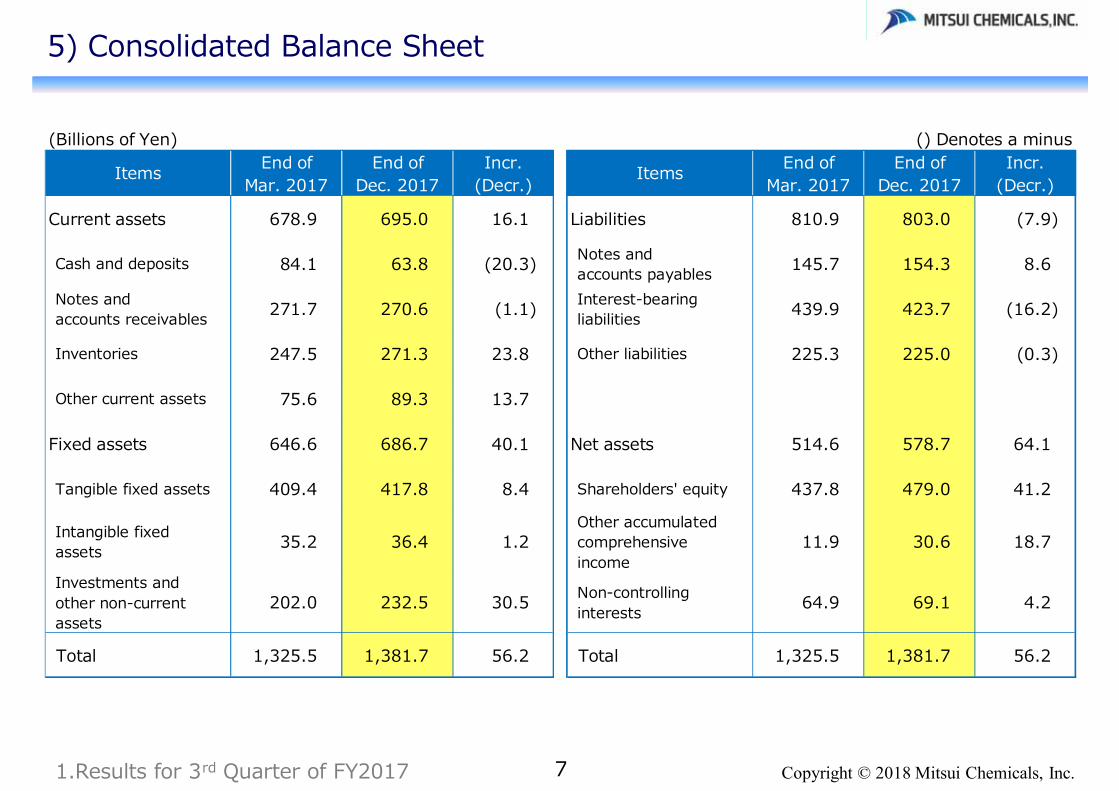
5) Consolidated Balance Sheet
(Billions of Yen) () Denotes a minus
Current assets 678.9 695.0 16.1 Liabilities 810.9 803.0 (7.9)
Cash and deposits 84.1 63.8 (20.3) Notes andaccounts payables 145.7 154.3 8.6
Notes andaccounts receivables 271.7 270.6 (1.1) Interest-bearing
liabilities 439.9 423.7 (16.2)
Inventories 247.5 271.3 23.8 Other liabilities 225.3 225.0 (0.3)
Other current assets 75.6 89.3 13.7
Fixed assets 646.6 686.7 40.1 Net assets 514.6 578.7 64.1
Tangible fixed assets 409.4 417.8 8.4 Shareholders' equity 437.8 479.0 41.2
Intangible fixedassets 35.2 36.4 1.2
Other accumulatedcomprehensiveincome
11.9 30.6 18.7
Investments andother non-currentassets
202.0 232.5 30.5 Non-controllinginterests 64.9 69.1 4.2
Total 1,325.5 1,381.7 56.2 Total 1,325.5 1,381.7 56.2
Incr.(Decr.)Items End of
Mar. 2017End of
Dec. 2017Incr.
(Decr.) Items End ofMar. 2017
End ofDec. 2017
1.Results for 3rd Quarter of FY2017
Copyright © 2018 Mitsui Chemicals, Inc.8
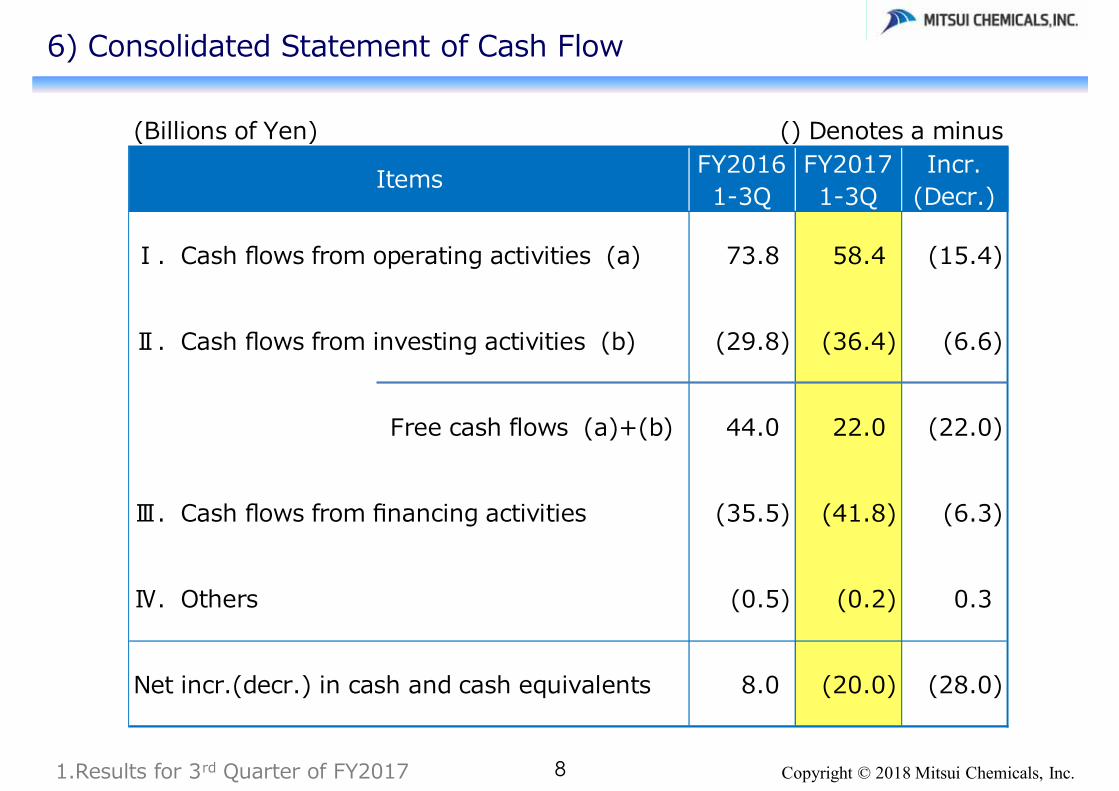
6) Consolidated Statement of Cash Flow
(Billions of Yen) () Denotes a minusFY20161-3Q
FY20171-3Q
Incr.(Decr.)
Ⅰ.Cash flows from operating activities (a) 73.8 58.4 (15.4)
Ⅱ.Cash flows from investing activities (b) (29.8) (36.4) (6.6)
Free cash flows (a)+(b) 44.0 22.0 (22.0)
Ⅲ.Cash flows from financing activities (35.5) (41.8) (6.3)
Ⅳ.Others (0.5) (0.2) 0.3
Net incr.(decr.) in cash and cash equivalents 8.0 (20.0) (28.0)
Items
1.Results for 3rd Quarter of FY2017
Copyright © 2018 Mitsui Chemicals, Inc.
2. Outlook for FY2017(April 1, 2017 – March 31, 2018)
This summary contains forward-looking statements about the future plans, strategies, belief and performance of the Mitsui Chemicals Group as a whole and its individual consolidated companies. These forward-looking statements are not historical facts. They are expectations, estimates, forecasts and projections based on information currently available to the Mitsui Chemicals Group and are subject to a number of risks, uncertainties and assumptions, which, without limitation, include economic trends, fluctuations in foreign currency exchange rates, fluctuations in the price of raw materials, competition in markets where the Company is active, personal consumption, market demand, the tax system and other legislation. As such, actual results may differ materially from those projected and the Mitsui Chemicals Group cannot guarantee that these forward-looking statements are accurate or will be achieved.
Copyright © 2018 Mitsui Chemicals, Inc.9
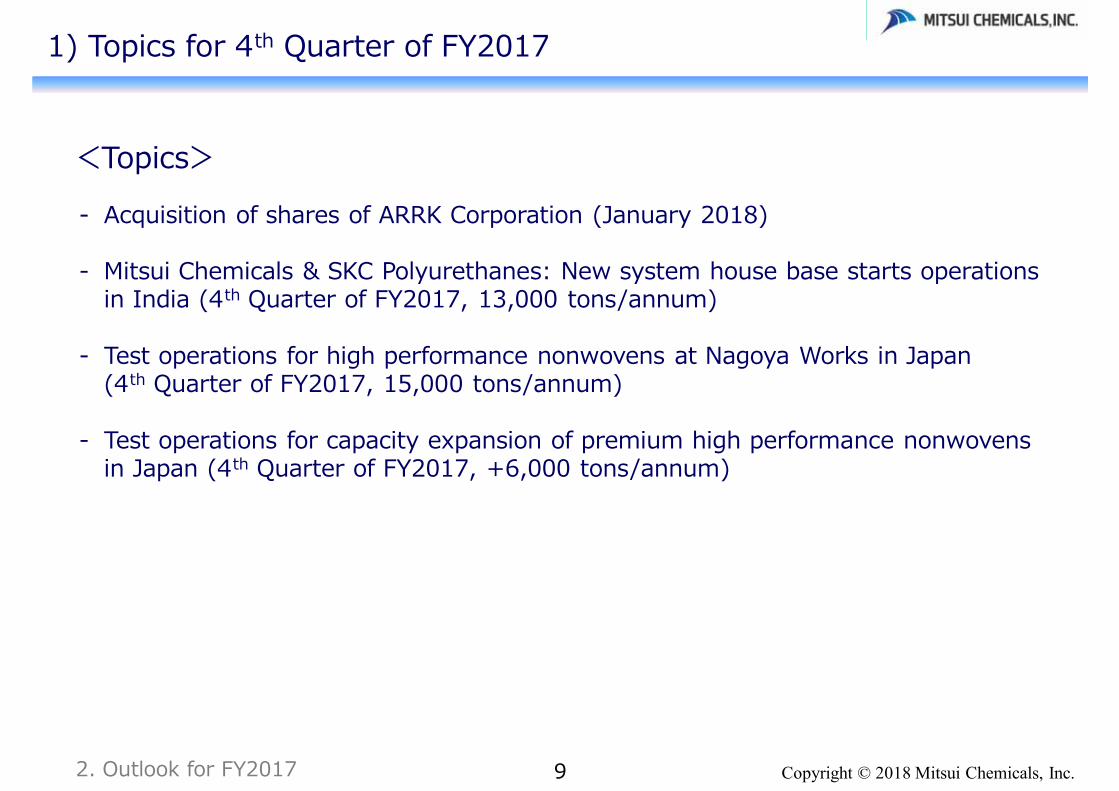
<Topics>- Acquisition of shares of ARRK Corporation (January 2018)
- Mitsui Chemicals & SKC Polyurethanes: New system house base starts operations in India (4th Quarter of FY2017, 13,000 tons/annum)
- Test operations for high performance nonwovens at Nagoya Works in Japan (4th Quarter of FY2017, 15,000 tons/annum)
- Test operations for capacity expansion of premium high performance nonwovens in Japan (4th Quarter of FY2017, +6,000 tons/annum)
1) Topics for 4th Quarter of FY2017
2. Outlook for FY2017
Copyright © 2018 Mitsui Chemicals, Inc.
(Billions of Yen) () Denotes a minusFY2017 Previous
Outlook(on Nov 1, 2017)
1-3Q Full Year 1-3Q Full Year Full Year % Full Year
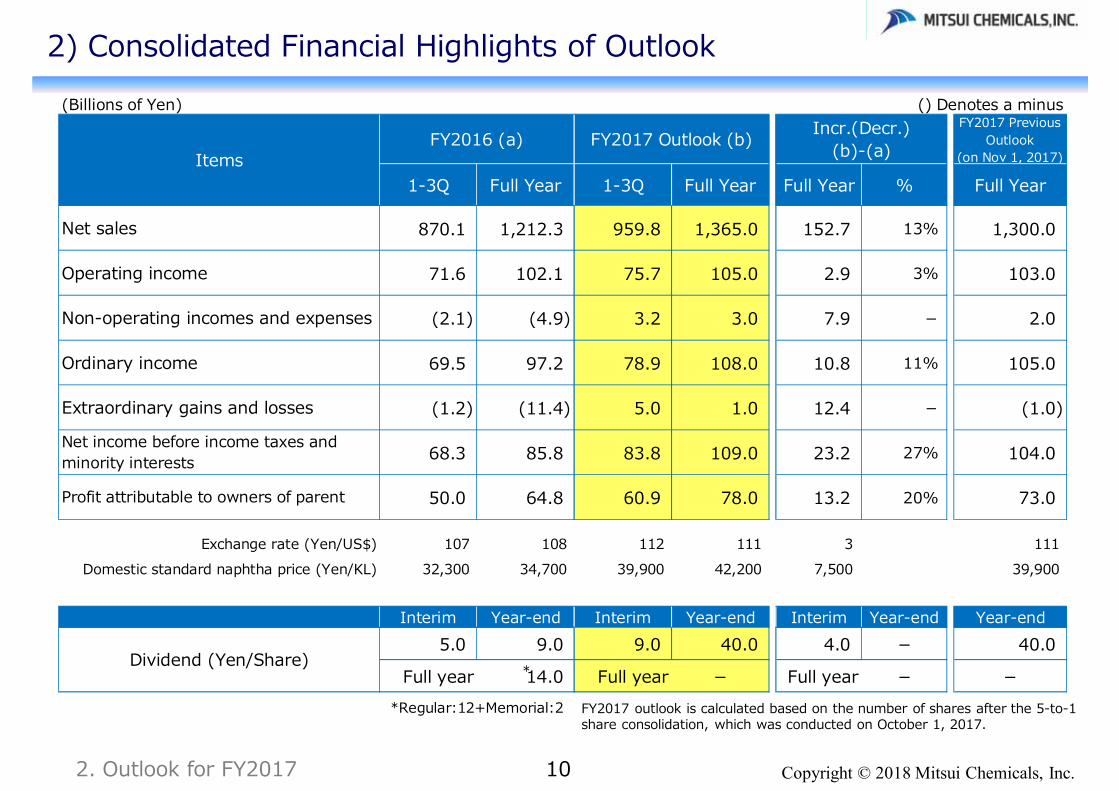
870.1 1,212.3 959.8 1,365.0 152.7 13% 1,300.0
71.6 102.1 75.7 105.0 2.9 3% 103.0
(2.1) (4.9) 3.2 3.0 7.9 - 2.0
69.5 97.2 78.9 108.0 10.8 11% 105.0
(1.2) (11.4) 5.0 1.0 12.4 - (1.0)
68.3 85.8 83.8 109.0 23.2 27% 104.0
50.0 64.8 60.9 78.0 13.2 20% 73.0
Exchange rate (Yen/US$) 107 108 112 111 3 111Domestic standard naphtha price (Yen/KL) 32,300 34,700 39,900 42,200 7,500 39,900
Interim Year-end Interim Year-end Interim Year-end Year-end5.0 9.0 9.0 40.0 4.0 - 40.0
Full year 14.0 Full year - Full year - -*Regular:12+Memorial:2
Incr.(Decr.)(b)-(a)Items
FY2016 (a) FY2017 Outlook (b)
Net sales
Operating income
Profit attributable to owners of parent
Non-operating incomes and expenses
Ordinary income
Extraordinary gains and losses
Dividend (Yen/Share)
Net income before income taxes andminority interests
*
2) Consolidated Financial Highlights of Outlook
102. Outlook for FY2017
FY2017 outlook is calculated based on the number of shares after the 5-to-1 share consolidation, which was conducted on October 1, 2017.
Copyright © 2018 Mitsui Chemicals, Inc.
3) Net sales and Operating Income/Loss by Business Segment(compared with FY2016 results)
112. Outlook for FY2017
(Billions of Yen) () Denotes a minus
1-3Q Full Year (a) 1-3Q Full Year (b) 1-3Q Full Year (c) 1-3Q Full Year (d)
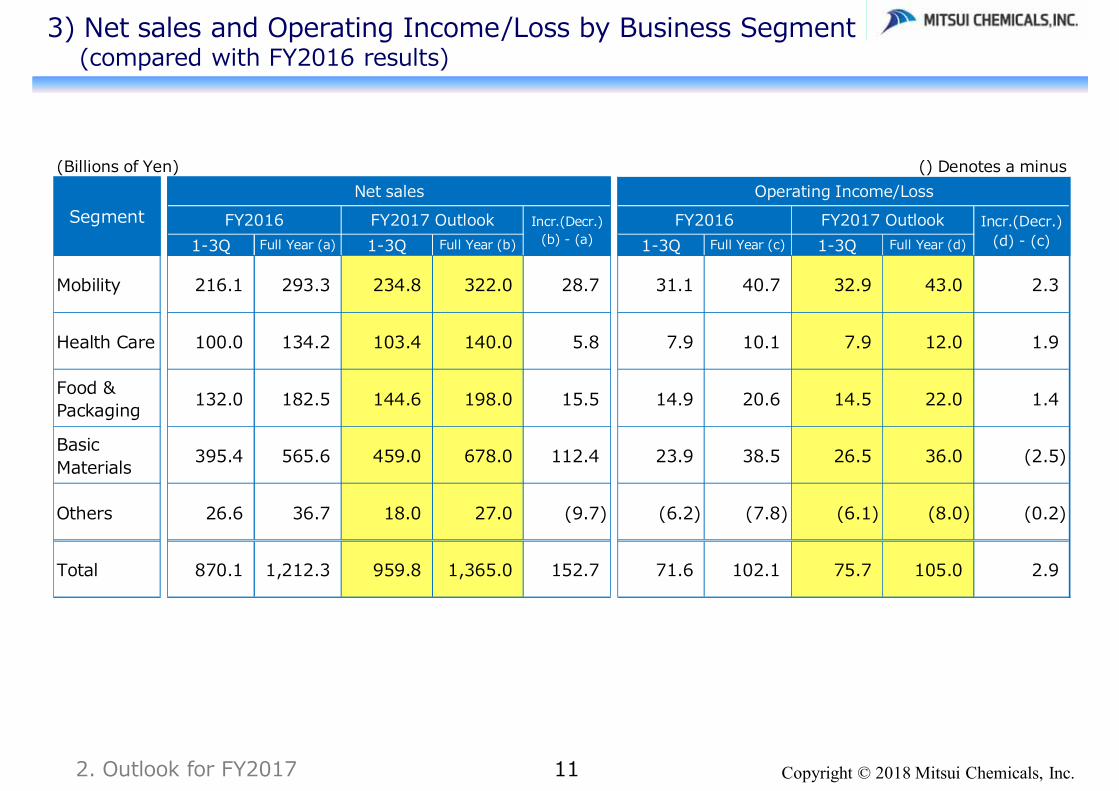
Mobility 216.1 293.3 234.8 322.0 28.7 31.1 40.7 32.9 43.0 2.3
Health Care 100.0 134.2 103.4 140.0 5.8 7.9 10.1 7.9 12.0 1.9
Food &Packaging 132.0 182.5 144.6 198.0 15.5 14.9 20.6 14.5 22.0 1.4
BasicMaterials 395.4 565.6 459.0 678.0 112.4 23.9 38.5 26.5 36.0 (2.5)
Others 26.6 36.7 18.0 27.0 (9.7) (6.2) (7.8) (6.1) (8.0) (0.2)
Total 870.1 1,212.3 959.8 1,365.0 152.7 71.6 102.1 75.7 105.0 2.9
Operating Income/LossIncr.(Decr.)
(b) - (a)FY2016 FY2017 Outlook Incr.(Decr.)
(d) - (c)Segment
Net salesFY2016 FY2017 Outlook
Copyright © 2018 Mitsui Chemicals, Inc.122. Outlook for FY2017
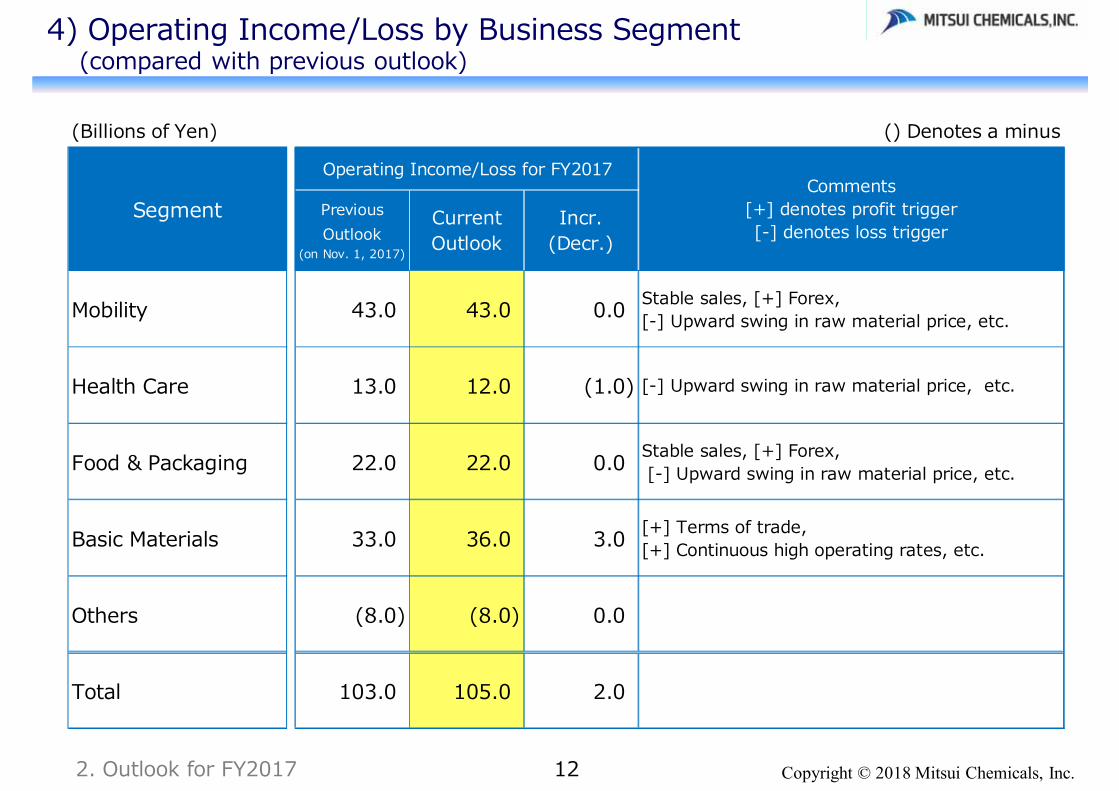
4) Operating Income/Loss by Business Segment(compared with previous outlook)
(Billions of Yen) () Denotes a minus
PreviousOutlook
(on Nov. 1, 2017)
CurrentOutlook
Incr.(Decr.)
Mobility 43.0 43.0 0.0 Stable sales, [+] Forex,[-] Upward swing in raw material price, etc.
Health Care 13.0 12.0 (1.0) [-] Upward swing in raw material price, etc.
Food & Packaging 22.0 22.0 0.0 Stable sales, [+] Forex, [-] Upward swing in raw material price, etc.
Basic Materials 33.0 36.0 3.0 [+] Terms of trade,[+] Continuous high operating rates, etc.
Others (8.0) (8.0) 0.0
Total 103.0 105.0 2.0
Operating Income/Loss for FY2017Comments
[+] denotes profit trigger[-] denotes loss trigger
Segment
Copyright © 2018 Mitsui Chemicals, Inc.
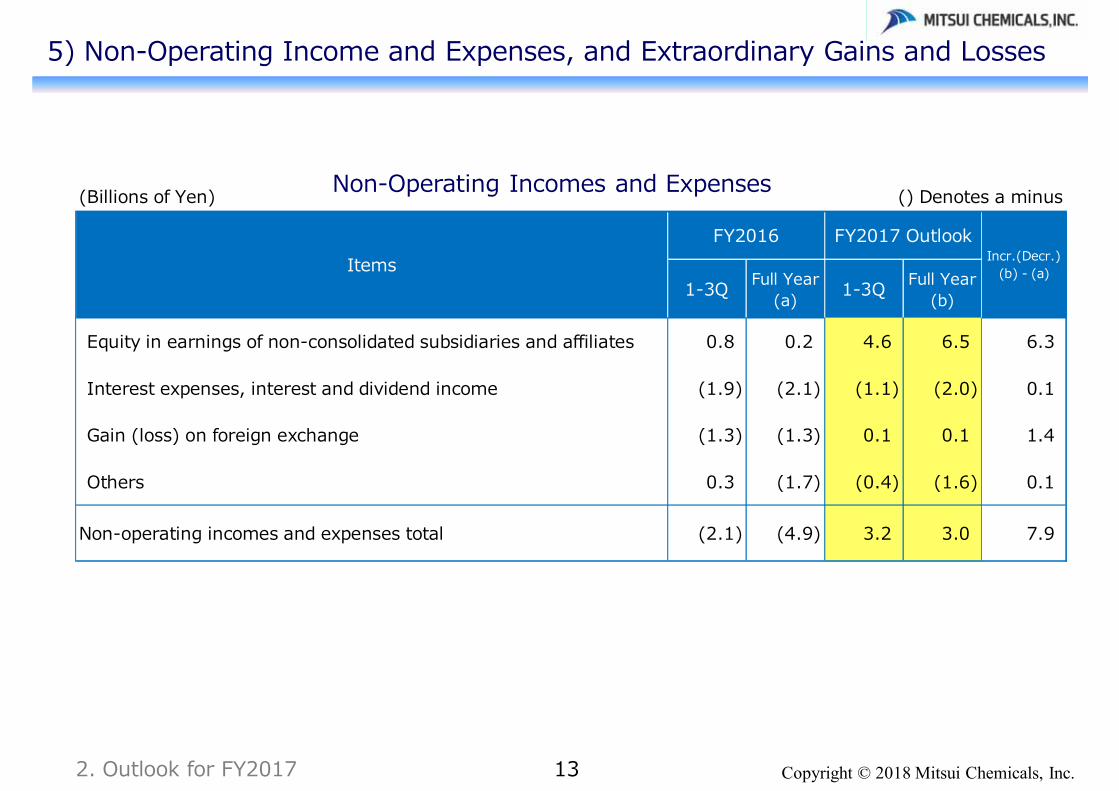
Non-Operating Incomes and Expenses
132. Outlook for FY2017
5) Non-Operating Income and Expenses, and Extraordinary Gains and Losses
(Billions of Yen) () Denotes a minus
1-3Q Full Year(a) 1-3Q Full Year
(b)
Equity in earnings of non-consolidated subsidiaries and affiliates 0.8 0.2 4.6 6.5 6.3
Interest expenses, interest and dividend income (1.9) (2.1) (1.1) (2.0) 0.1
Gain (loss) on foreign exchange (1.3) (1.3) 0.1 0.1 1.4
Others 0.3 (1.7) (0.4) (1.6) 0.1
Non-operating incomes and expenses total (2.1) (4.9) 3.2 3.0 7.9
ItemsFY2016 FY2017 Outlook
Incr.(Decr.)(b) - (a)
Copyright © 2018 Mitsui Chemicals, Inc.
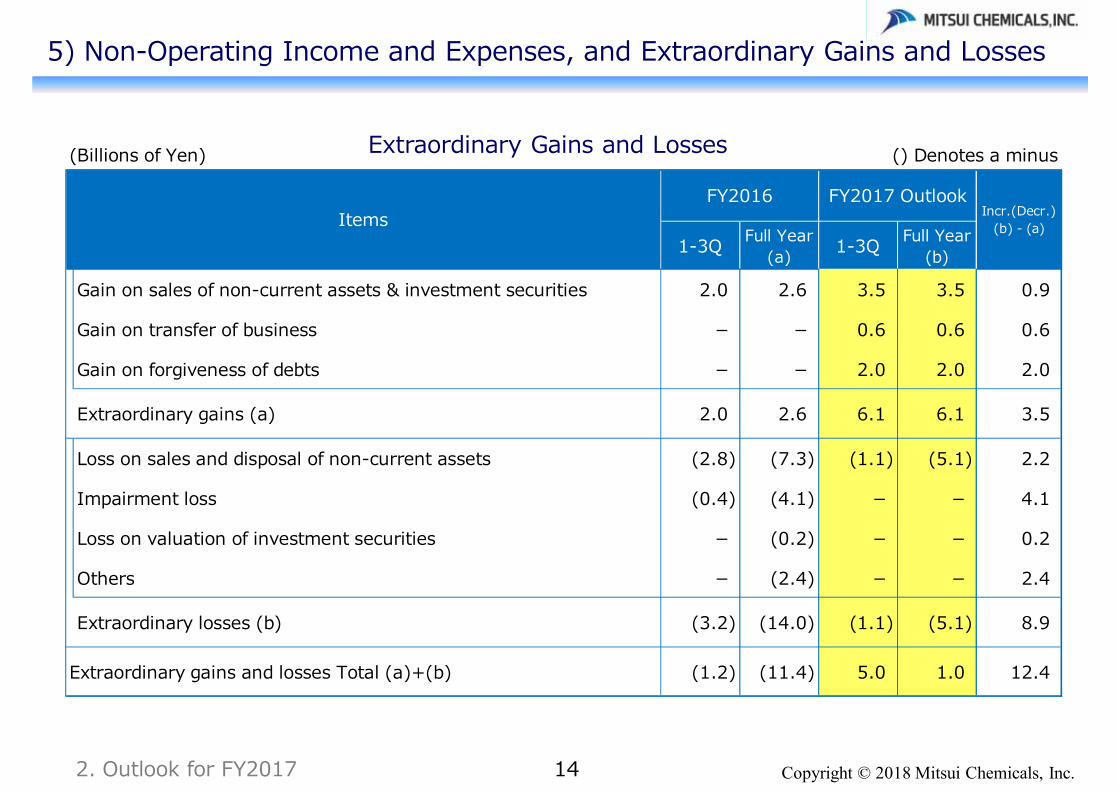
Extraordinary Gains and Losses
142. Outlook for FY2017
5) Non-Operating Income and Expenses, and Extraordinary Gains and Losses
(Billions of Yen) () Denotes a minus
1-3Q Full Year(a) 1-3Q Full Year
(b)
Gain on sales of non-current assets & investment securities 2.0 2.6 3.5 3.5 0.9
Gain on transfer of business - - 0.6 0.6 0.6
Gain on forgiveness of debts - - 2.0 2.0 2.0
Extraordinary gains (a) 2.0 2.6 6.1 6.1 3.5
Loss on sales and disposal of non-current assets (2.8) (7.3) (1.1) (5.1) 2.2
Impairment loss (0.4) (4.1) - - 4.1
Loss on valuation of investment securities - (0.2) - - 0.2
Others - (2.4) - - 2.4
Extraordinary losses (b) (3.2) (14.0) (1.1) (5.1) 8.9
Extraordinary gains and losses Total (a)+(b) (1.2) (11.4) 5.0 1.0 12.4
FY2017 OutlookIncr.(Decr.)
(b) - (a)ItemsFY2016
Copyright © 2018 Mitsui Chemicals, Inc.
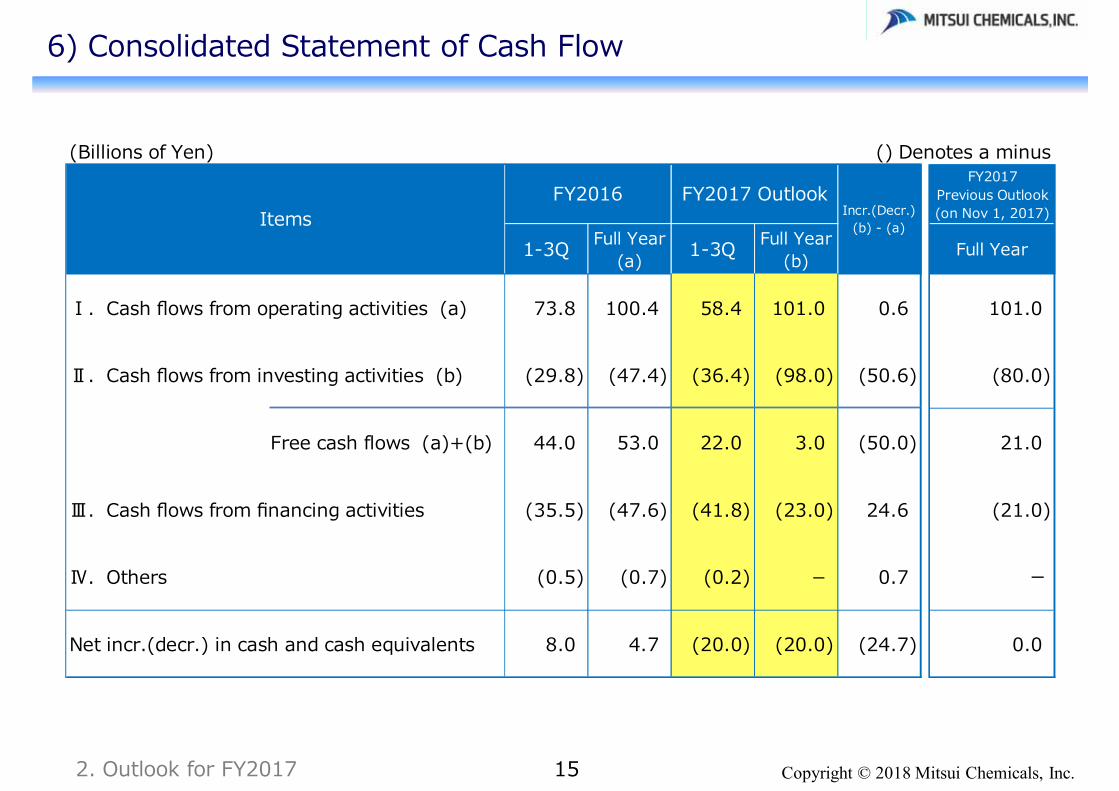
6) Consolidated Statement of Cash Flow
152. Outlook for FY2017
(Billions of Yen) () Denotes a minusFY2017
Previous Outlook(on Nov 1, 2017)
1-3Q Full Year(a) 1-3Q Full Year
(b) Full Year
Ⅰ.Cash flows from operating activities (a) 73.8 100.4 58.4 101.0 0.6 101.0
Ⅱ.Cash flows from investing activities (b) (29.8) (47.4) (36.4) (98.0) (50.6) (80.0)
Free cash flows (a)+(b) 44.0 53.0 22.0 3.0 (50.0) 21.0
Ⅲ.Cash flows from financing activities (35.5) (47.6) (41.8) (23.0) 24.6 (21.0)
Ⅳ.Others (0.5) (0.7) (0.2) - 0.7 ー
Net incr.(decr.) in cash and cash equivalents 8.0 4.7 (20.0) (20.0) (24.7) 0.0
FY2017 OutlookIncr.(Decr.)
(b) - (a)ItemsFY2016
Copyright © 2018 Mitsui Chemicals, Inc.
3. Appendix
This summary contains forward-looking statements about the future plans, strategies, belief and performance of the Mitsui Chemicals Group as a whole and its individual consolidated companies. These forward-looking statements are not historical facts. They are expectations, estimates, forecasts and projections based on information currently available to the Mitsui Chemicals Group and are subject to a number of risks, uncertainties and assumptions, which, without limitation, include economic trends, fluctuations in foreign currency exchange rates, fluctuations in the price of raw materials, competition in markets where the Company is active, personal consumption, market demand, the tax system and other legislation. As such, actual results may differ materially from those projected and the Mitsui Chemicals Group cannot guarantee that these forward-looking statements are accurate or will be achieved.
1) Trends in Product Prices2) Increase/Decrease in Business Segment (Net sales and Operating Income, year on year)3) Net sales and Operating Income/Loss by Business Segment (by Quarter)4) Financial Summary5) Net sales by Region
Copyright © 2018 Mitsui Chemicals, Inc.
1) Trends in Product Prices
3. Appendix 16
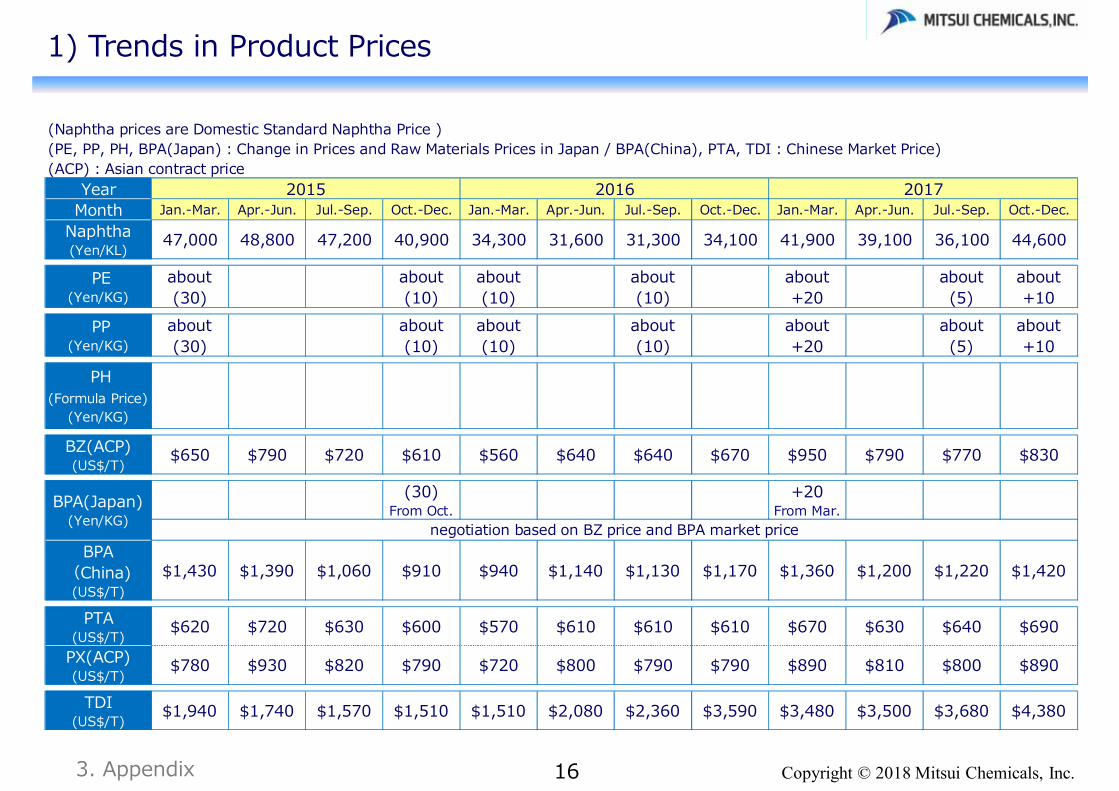
(Naphtha prices are Domestic Standard Naphtha Price )(PE, PP, PH, BPA(Japan) : Change in Prices and Raw Materials Prices in Japan / BPA(China), PTA, TDI : Chinese Market Price)(ACP) : Asian contract price
Year 2015 2016 2017Month Jan.-Mar. Apr.-Jun. Jul.-Sep. Oct.-Dec. Jan.-Mar. Apr.-Jun. Jul.-Sep. Oct.-Dec. Jan.-Mar. Apr.-Jun. Jul.-Sep. Oct.-Dec.
Naphtha(Yen/KL) 47,000 48,800 47,200 40,900 34,300 31,600 31,300 34,100 41,900 39,100 36,100 44,600
PE(Yen/KG)
about(30)
about(10)
about(10)
about(10)
about+20
about(5)
about+10
PP(Yen/KG)
about(30)
about(10)
about(10)
about(10)
about+20
about(5)
about+10
PH(Formula Price)
(Yen/KG)
BZ(ACP)(US$/T) $650 $790 $720 $610 $560 $640 $640 $670 $950 $790 $770 $830
(30)From Oct.
+20From Mar.
BPA(China)(US$/T)
$1,430 $1,390 $1,060 $910 $940 $1,140 $1,130 $1,170 $1,360 $1,200 $1,220 $1,420
PTA(US$/T) $620 $720 $630 $600 $570 $610 $610 $610 $670 $630 $640 $690
PX(ACP)(US$/T)
$780 $930 $820 $790 $720 $800 $790 $790 $890 $810 $800 $890
TDI(US$/T) $1,940 $1,740 $1,570 $1,510 $1,510 $2,080 $2,360 $3,590 $3,480 $3,500 $3,680 $4,380
BPA(Japan)(Yen/KG) negotiation based on BZ price and BPA market price
Copyright © 2018 Mitsui Chemicals, Inc.17
2-1) Increase/Decrease in Mobility(Net sales and Operating Income, year on year)
+18.7
+1.8
3. Appendix
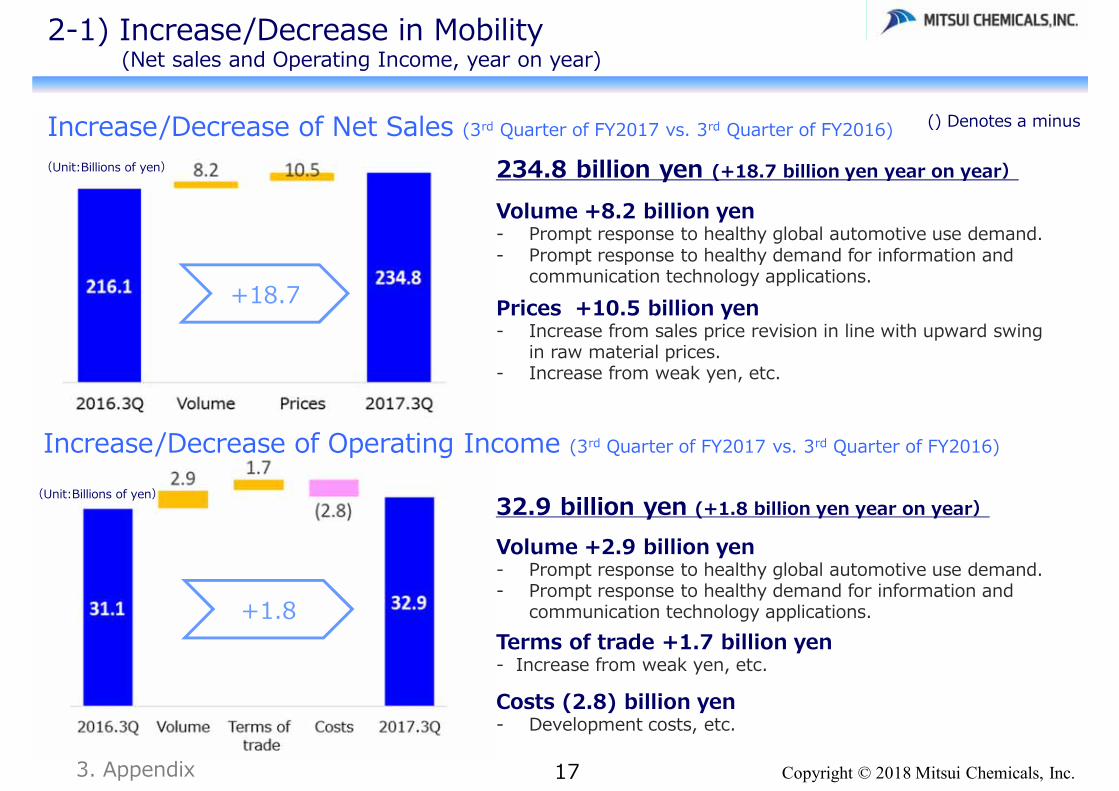
234.8 billion yen (+18.7 billion yen year on year)
Volume +8.2 billion yen - Prompt response to healthy global automotive use demand.- Prompt response to healthy demand for information and
communication technology applications.Prices +10.5 billion yen- Increase from sales price revision in line with upward swing
in raw material prices.- Increase from weak yen, etc.
32.9 billion yen (+1.8 billion yen year on year)
Volume +2.9 billion yen- Prompt response to healthy global automotive use demand.- Prompt response to healthy demand for information and
communication technology applications.Terms of trade +1.7 billion yen- Increase from weak yen, etc.
Costs (2.8) billion yen- Development costs, etc.
() Denotes a minusIncrease/Decrease of Net Sales (3rd Quarter of FY2017 vs. 3rd Quarter of FY2016)
Increase/Decrease of Operating Income (3rd Quarter of FY2017 vs. 3rd Quarter of FY2016)
(Unit:Billions of yen)
(Unit:Billions of yen)
Copyright © 2018 Mitsui Chemicals, Inc.18
2-2) Increase/Decrease in Health Care(Net sales and Operating Income, year on year)
+3.4
(Unit:Billions of yen)
+0.0
(Unit:Billions of yen)
3. Appendix
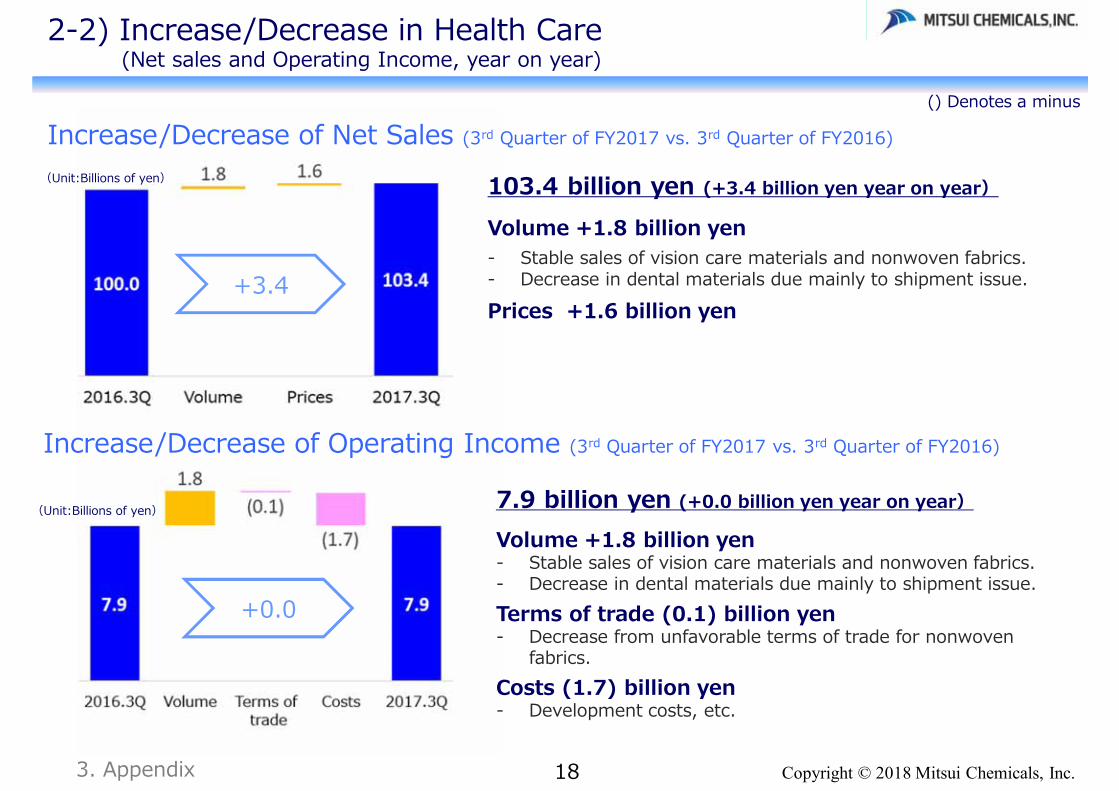
103.4 billion yen (+3.4 billion yen year on year)
Volume +1.8 billion yen- Stable sales of vision care materials and nonwoven fabrics.- Decrease in dental materials due mainly to shipment issue.Prices +1.6 billion yen
7.9 billion yen (+0.0 billion yen year on year)
Volume +1.8 billion yen- Stable sales of vision care materials and nonwoven fabrics.- Decrease in dental materials due mainly to shipment issue.Terms of trade (0.1) billion yen- Decrease from unfavorable terms of trade for nonwoven
fabrics.Costs (1.7) billion yen- Development costs, etc.
() Denotes a minus
Increase/Decrease of Net Sales (3rd Quarter of FY2017 vs. 3rd Quarter of FY2016)
Increase/Decrease of Operating Income (3rd Quarter of FY2017 vs. 3rd Quarter of FY2016)
Copyright © 2018 Mitsui Chemicals, Inc.19
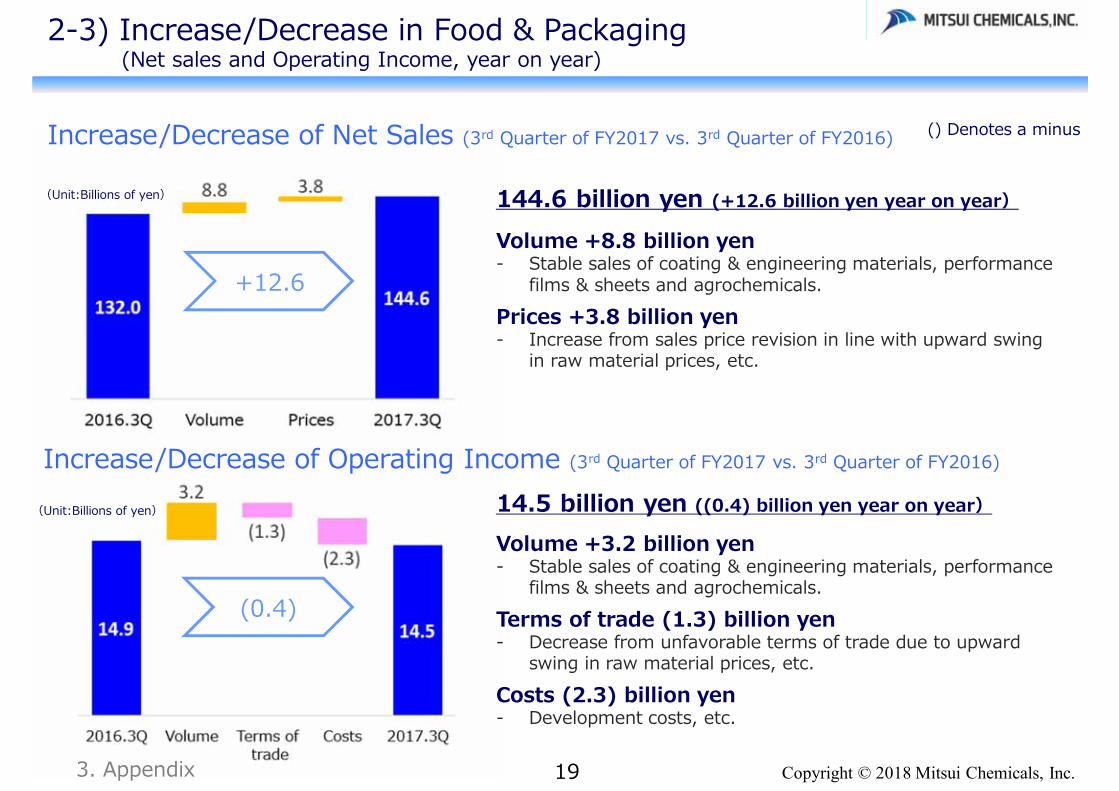
2-3) Increase/Decrease in Food & Packaging(Net sales and Operating Income, year on year)
+12.6
(0.4)
3. Appendix
144.6 billion yen (+12.6 billion yen year on year)
Volume +8.8 billion yen - Stable sales of coating & engineering materials, performance
films & sheets and agrochemicals.Prices +3.8 billion yen- Increase from sales price revision in line with upward swing
in raw material prices, etc.
14.5 billion yen ((0.4) billion yen year on year)
Volume +3.2 billion yen- Stable sales of coating & engineering materials, performance
films & sheets and agrochemicals.Terms of trade (1.3) billion yen- Decrease from unfavorable terms of trade due to upward
swing in raw material prices, etc.Costs (2.3) billion yen- Development costs, etc.
(Unit:Billions of yen)
(Unit:Billions of yen)
() Denotes a minusIncrease/Decrease of Net Sales (3rd Quarter of FY2017 vs. 3rd Quarter of FY2016)
Increase/Decrease of Operating Income (3rd Quarter of FY2017 vs. 3rd Quarter of FY2016)
Copyright © 2018 Mitsui Chemicals, Inc.20
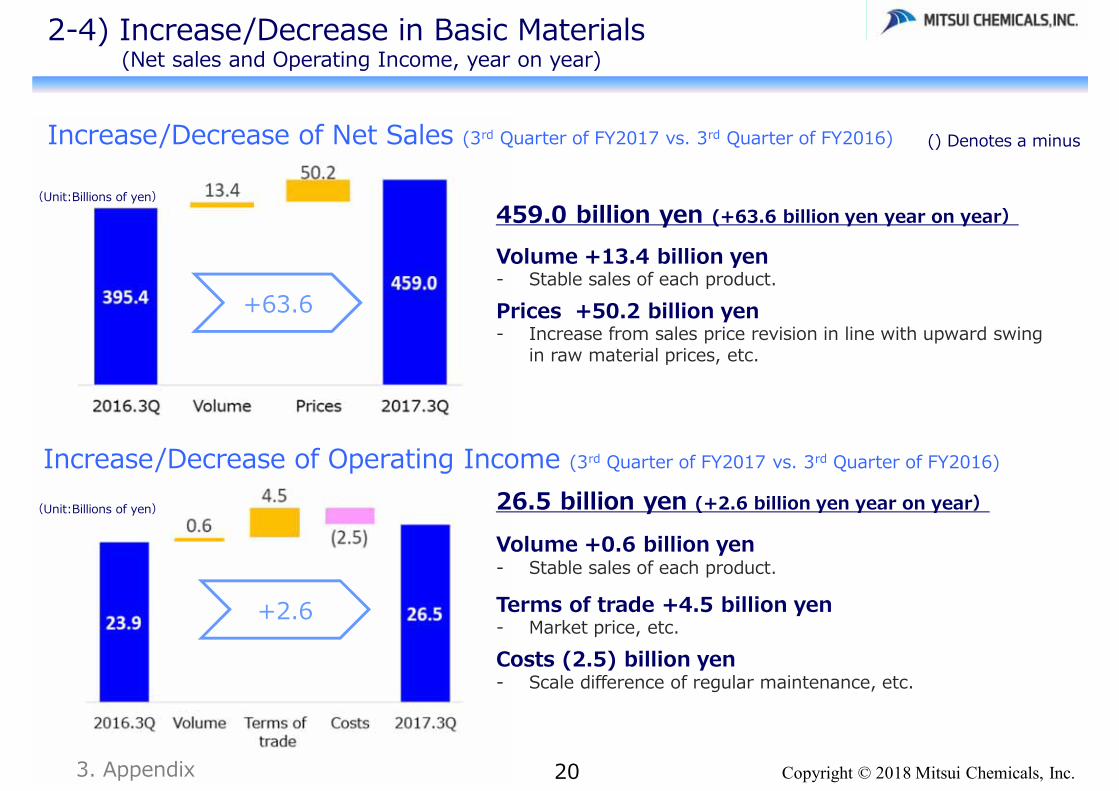
2-4) Increase/Decrease in Basic Materials(Net sales and Operating Income, year on year)
+63.6
+2.6
3. Appendix
459.0 billion yen (+63.6 billion yen year on year)
Volume +13.4 billion yen - Stable sales of each product.Prices +50.2 billion yen- Increase from sales price revision in line with upward swing
in raw material prices, etc.
26.5 billion yen (+2.6 billion yen year on year)
Volume +0.6 billion yen- Stable sales of each product.
Terms of trade +4.5 billion yen- Market price, etc.Costs (2.5) billion yen- Scale difference of regular maintenance, etc.
(Unit:Billions of yen)
(Unit:Billions of yen)
() Denotes a minusIncrease/Decrease of Net Sales (3rd Quarter of FY2017 vs. 3rd Quarter of FY2016)
Increase/Decrease of Operating Income (3rd Quarter of FY2017 vs. 3rd Quarter of FY2016)
Copyright © 2018 Mitsui Chemicals, Inc.213. Appendix
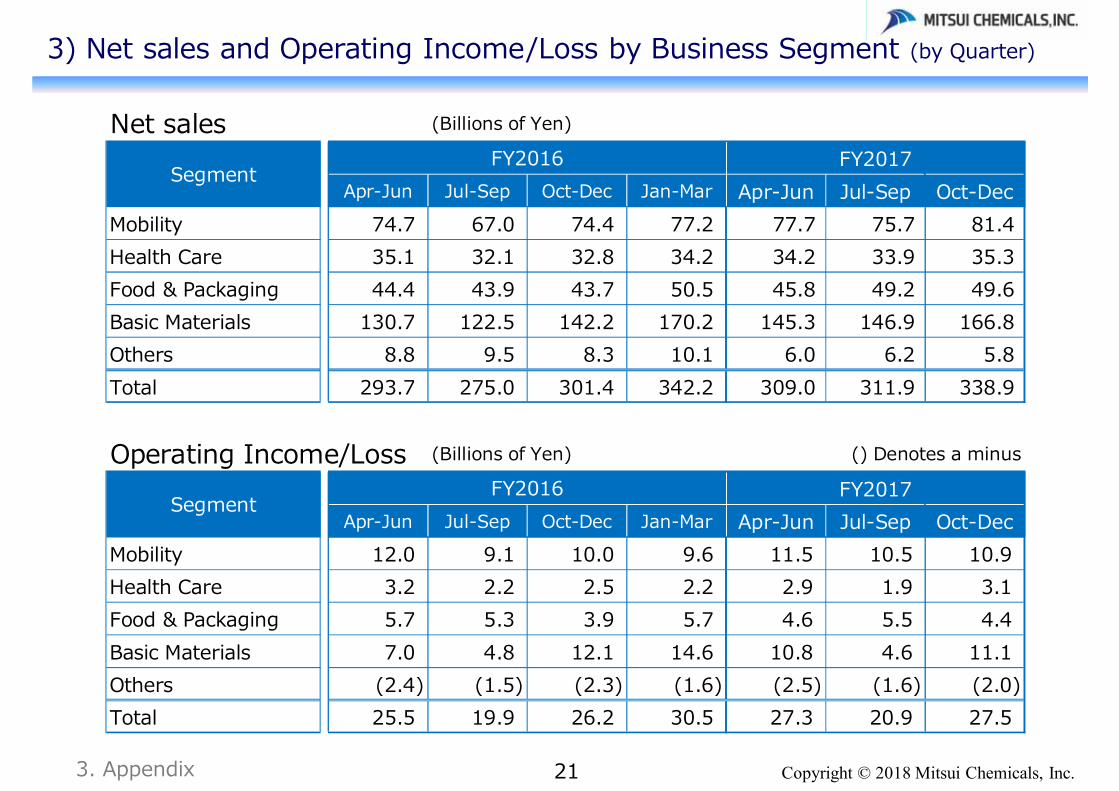
3) Net sales and Operating Income/Loss by Business Segment (by Quarter)
Net sales (Billions of Yen)
FY2017Apr-Jun Jul-Sep Oct-Dec Jan-Mar Apr-Jun Jul-Sep Oct-Dec
Mobility 74.7 67.0 74.4 77.2 77.7 75.7 81.4Health Care 35.1 32.1 32.8 34.2 34.2 33.9 35.3Food & Packaging 44.4 43.9 43.7 50.5 45.8 49.2 49.6Basic Materials 130.7 122.5 142.2 170.2 145.3 146.9 166.8Others 8.8 9.5 8.3 10.1 6.0 6.2 5.8Total 293.7 275.0 301.4 342.2 309.0 311.9 338.9
Operating Income/Loss (Billions of Yen) () Denotes a minus
FY2017Apr-Jun Jul-Sep Oct-Dec Jan-Mar Apr-Jun Jul-Sep Oct-Dec
Mobility 12.0 9.1 10.0 9.6 11.5 10.5 10.9Health Care 3.2 2.2 2.5 2.2 2.9 1.9 3.1Food & Packaging 5.7 5.3 3.9 5.7 4.6 5.5 4.4Basic Materials 7.0 4.8 12.1 14.6 10.8 4.6 11.1Others (2.4) (1.5) (2.3) (1.6) (2.5) (1.6) (2.0)Total 25.5 19.9 26.2 30.5 27.3 20.9 27.5
FY2016
SegmentFY2016
Segment
Copyright © 2018 Mitsui Chemicals, Inc.3.Appendix 22
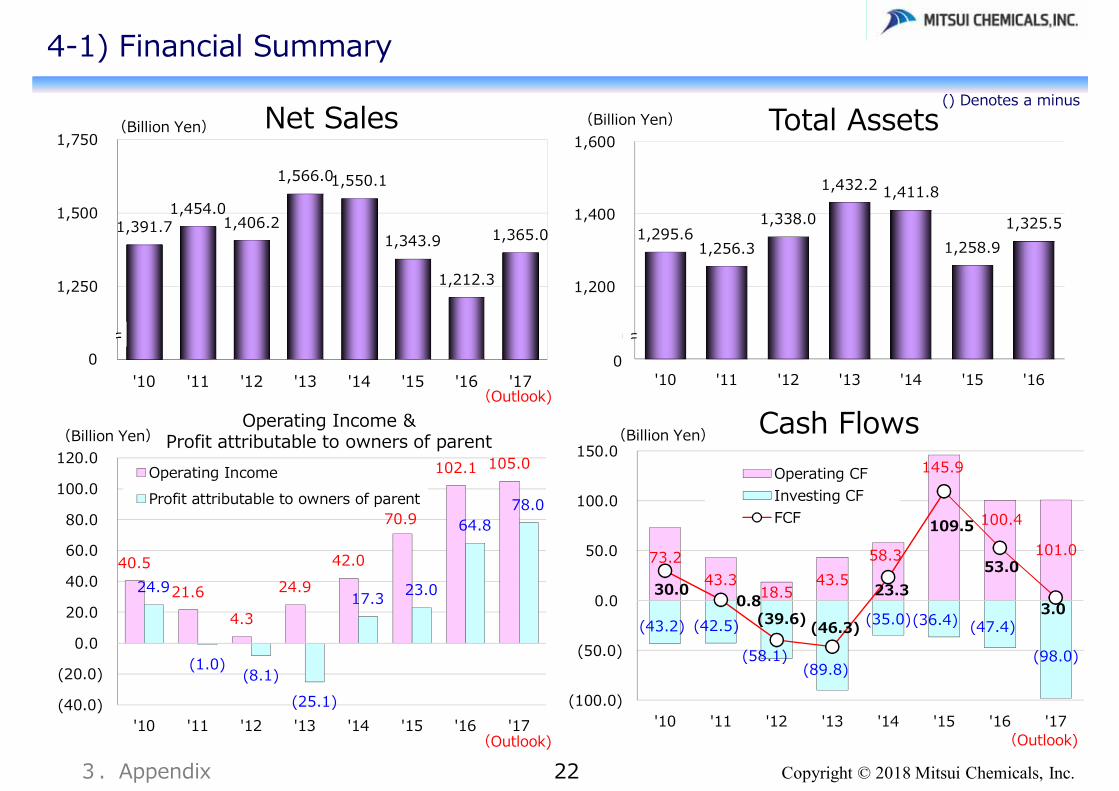
4-1) Financial Summary
1,295.61,256.3
1,338.0
1,432.2 1,411.8
1,258.91,325.5
1,000
1,200
1,400
1,600
'10 '11 '12 '13 '14 '15 '16
(Billion Yen)
1,391.7 1,454.0
1,406.2
1,566.0 1,550.1
1,343.9
1,212.3
1,365.0
1,000
1,250
1,500
1,750
'10 '11 '12 '13 '14 '15 '16 '17
(Billion Yen) Net Sales
Operating Income & Profit attributable to owners of parent
(Outlook)
Total Assets
Cash Flows
(Outlook) (Outlook)
0 0
() Denotes a minus
40.5
21.6 4.3
24.9 42.0
70.9
102.1 105.0
24.9
(1.0)(8.1)
(25.1)
17.3 23.0
64.8 78.0
(40.0)
(20.0)
0.0
20.0
40.0
60.0
80.0
100.0
120.0
'10 '11 '12 '13 '14 '15 '16 '17
Operating IncomeProfit attributable to owners of parent
73.2 43.3
18.5 43.5
58.3
145.9
100.4
101.0
(43.2) (42.5)
(58.1)(89.8)
(35.0)(36.4) (47.4)
(98.0)
30.0 0.8
(39.6) (46.3)
23.3
109.5
53.0
3.0
(100.0)
(50.0)
0.0
50.0
100.0
150.0
'10 '11 '12 '13 '14 '15 '16 '17
Operating CFInvesting CFFCF
(Billion Yen)(Billion Yen)
Copyright © 2018 Mitsui Chemicals, Inc.3.Appendix 23
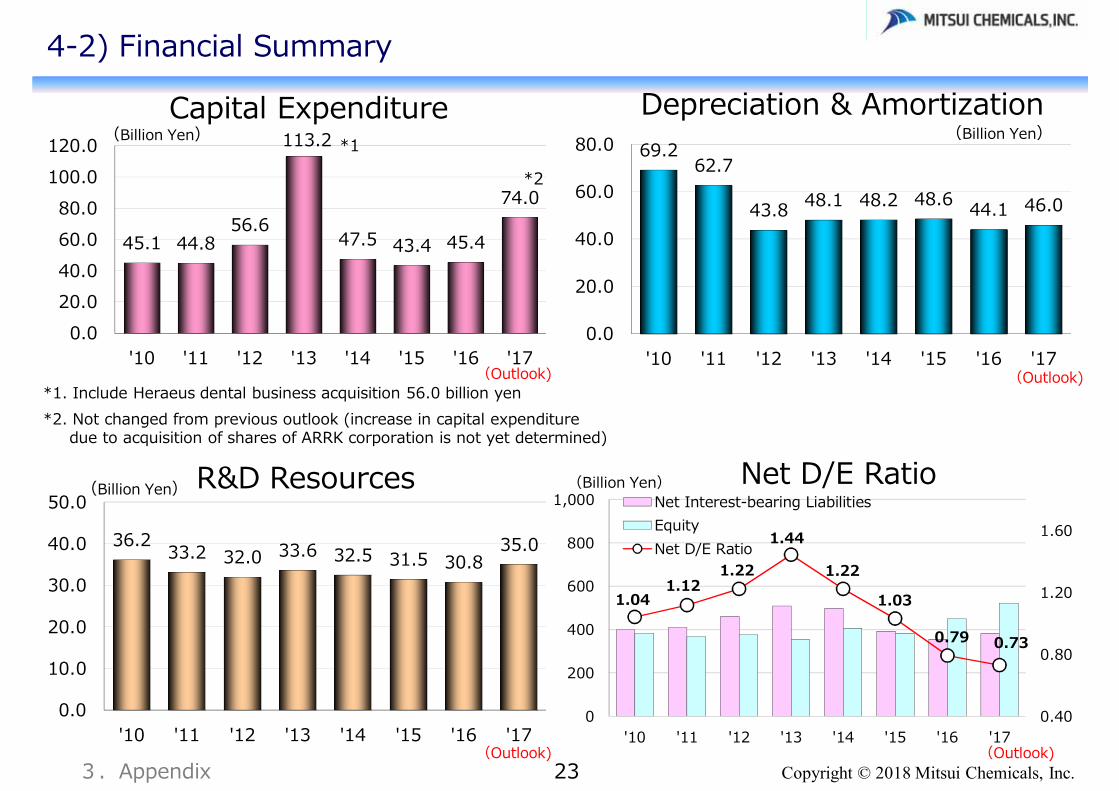
4-2) Financial Summary
Depreciation & AmortizationCapital Expenditure
45.1 44.8 56.6
113.2
47.5 43.4 45.4
74.0
0.020.040.060.080.0
100.0120.0
'10 '11 '12 '13 '14 '15 '16 '17
(Billion Yen)69.2
62.7
43.8 48.1 48.2 48.6 44.1 46.0
0.0
20.0
40.0
60.0
80.0
'10 '11 '12 '13 '14 '15 '16 '17
(Billion Yen)
*1. Include Heraeus dental business acquisition 56.0 billion yen
*1
R&D Resources Net D/E Ratio
36.2 33.2 32.0 33.6 32.5 31.5 30.835.0
0.0
10.0
20.0
30.0
40.0
50.0
'10 '11 '12 '13 '14 '15 '16 '17
(Billion Yen)
(Outlook) (Outlook)
(Outlook) (Outlook)
1.04 1.12
1.22
1.44
1.22
1.03
0.79 0.73
0.40
0.80
1.20
1.60
0
200
400
600
800
1,000
'10 '11 '12 '13 '14 '15 '16 '17
Net Interest-bearing LiabilitiesEquityNet D/E Ratio
(Billion Yen)
*2
*2. Not changed from previous outlook (increase in capital expenditure due to acquisition of shares of ARRK corporation is not yet determined)
Copyright © 2018 Mitsui Chemicals, Inc.3.Appendix 24
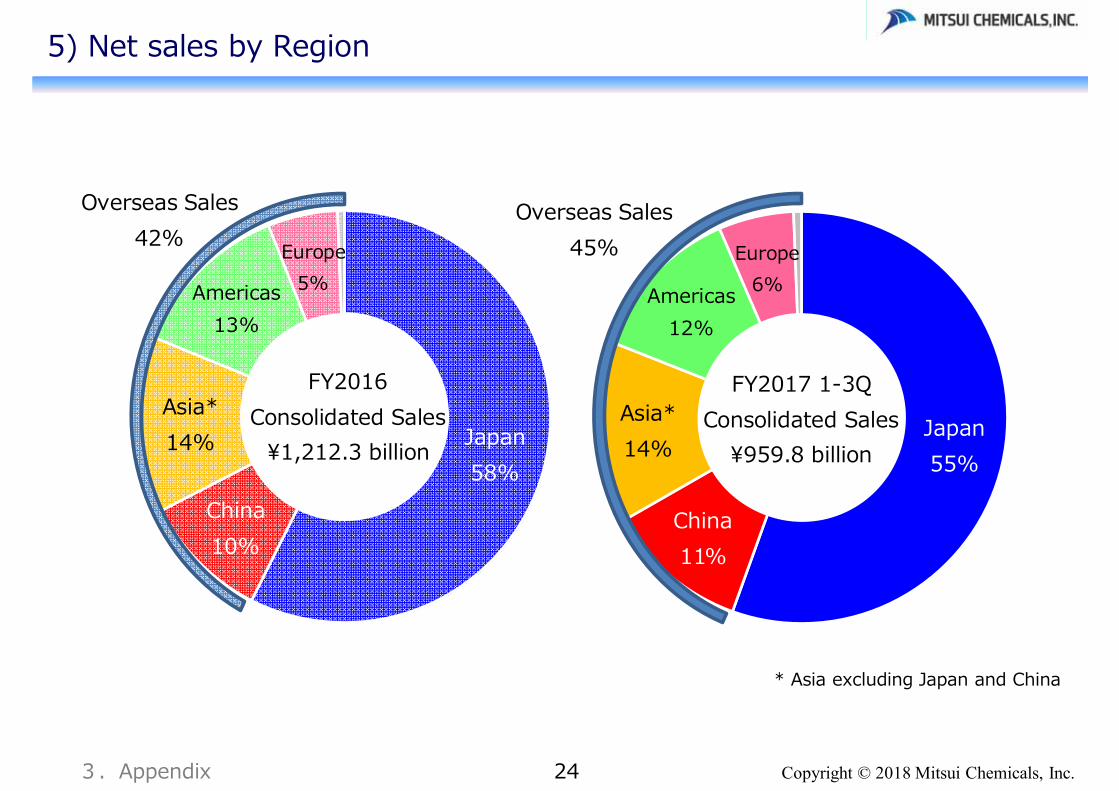
5) Net sales by Region
* Asia excluding Japan and China
Japan55%
China11%
Asia*14%
Americas12%
Europe6%
Japan58%
China10%
Asia*14%
Americas13%
Europe5%
FY2016Consolidated Sales
¥1,212.3 billion
Overseas Sales42%
FY2017 1-3QConsolidated Sales
¥959.8 billion
Overseas Sales45%
Copyright © 2018 Mitsui Chemicals, Inc.
Creating New Customer Value and Solving Social Challenges through Business Activities