Embed Size (px)
Citation preview
Financial System Review
—June 2013 Financial System Review
June 2013
Revue du système fi nancier —
Juin 2013

The Financial System Review is available on the Bank of Canada’s website at bankofcanada.ca.
For further information, contact:
Public InformationCommunications DepartmentBank of Canada234 Wellington StreetOttawa, Ontario K1A 0G9
Telephone: 613 782-8111; 1 800 303-1282 (toll free in North America)Email: [email protected]; Website: bankofcanada.ca
ISSN 1705-1290 (Print)ISSN 1705-1304 (Online)© Bank of Canada 2013
Financial System ReviewJune 2013
The Risk Assessment section is a product of the Governing Council of the Bank of Canada: Stephen S. Poloz, Tiff Macklem, John Murray, Timothy Lane, Agathe Côté and Lawrence Schembri.
This report includes data received up to 6 June 2013.

ContentsPreface . . . . . . . . . . . . . . . . . . . . . . . . . . . . . . . . . . . . . . . . . . . . . . . . . . . . . . . . . . . . . . . . . . . . . .iii
Overview . . . . . . . . . . . . . . . . . . . . . . . . . . . . . . . . . . . . . . . . . . . . . . . . . . . . . . . . . . . . . . . . . . . . 1
Risk AssessmentMacrofinancial Conditions . . . . . . . . . . . . . . . . . . . . . . . . . . . . . . . . . . . . . . . . . . . . . . . . 5
Key Risks . . . . . . . . . . . . . . . . . . . . . . . . . . . . . . . . . . . . . . . . . . . . . . . . . . . . . . . . . . . . . . . . . . . . 9
Euro-Area Crisis . . . . . . . . . . . . . . . . . . . . . . . . . . . . . . . . . . . . . . . . . . . . . . . . . . . . . . . . . 9
Deficient Global Demand . . . . . . . . . . . . . . . . . . . . . . . . . . . . . . . . . . . . . . . . . . . . . . . 16
Canadian Household Finances and the Housing Market . . . . . . . . . . . . . . . . 19
Low Interest Rate Environment in Major Advanced Economies . . . . . . . . .25
Safeguarding Financial Stability . . . . . . . . . . . . . . . . . . . . . . . . . . . . . . . . . . . . . . . . . . 31
ReportsIntroduction . . . . . . . . . . . . . . . . . . . . . . . . . . . . . . . . . . . . . . . . . . . . . . . . . . . . . . . . . . . . . . . .35
The Basel III Liquidity Standards: An UpdateTamara Gomes and Carolyn Wilkins . . . . . . . . . . . . . . . . . . . . . . . . . . . . . . . . . . . . . . . . . . . .37
The Market for Collateral: The Potential Impact of Financial RegulationJorge Cruz Lopez, Royce Mendes and Harri Vikstedt . . . . . . . . . . . . . . . . . . . . . . . . . . . . . .45
Monitoring and Assessing Risks in Canada’s Shadow Banking SectorToni Gravelle, Timothy Grieder and Stéphane Lavoie . . . . . . . . . . . . . . . . . . . . . . . . . . . . . .55

PrefaceThe financial system makes an important contribution to the welfare of all Canadians, since the ability of households and firms to hold and transfer financial assets with confidence is one of the fundamental building blocks of our economy. A stable financial system contributes to broader eco-nomic growth and rising living standards. In this context, financial stability is defined as the resilience of the financial system to unanticipated adverse shocks, which enables the continued smooth functioning of the financial intermediation process.
As part of its commitment to promoting the economic and financial welfare of Canada, the Bank of Canada actively fosters a stable and efficient finan-cial system. The Bank promotes this objective by providing central banking services, including various liquidity and lender-of-last-resort facilities; over-seeing key domestic clearing and settlement systems; conducting and pub-lishing analyses and research; and collaborating with various domestic and international policy-making bodies to develop policy. The Bank’s contribu-tion complements the efforts of other federal and provincial agencies, each of which brings unique expertise to this challenging area in the context of its own mandate.
The Financial System Review (FSR) is one avenue through which the Bank of Canada seeks to contribute to the longer-term resilience of the Canadian financial system. It brings together the Bank’s ongoing work in monitoring developments in the system with a view to identifying potential risks to its overall soundness, as well as highlighting the efforts of the Bank, and other domestic and international regulatory authorities, to mitigate those risks. The focus of this FSR, therefore, is on providing an assessment of the downside risks rather than on the most likely future path for the financial system. The FSR also summarizes recent work by Bank of Canada staff on specific financial sector policies and on aspects of the financial sys-tem’s structure and functioning. More generally, the FSR aims to promote informed public discussion on all aspects of the financial system.
PReFaCe iii BANK OF CANADA • FINANCIAL SyStEM REvIEw • JuNE 2013

OverviewThis section of the Financial System Review (FSR) summarizes the judgment of the Bank of Canada’s Governing Council on the main risks to the stability of the Canadian financial system and on the policy actions required to mitigate them.
Global financial conditions have improved over the past six months despite the subdued pace of the global economic recovery. Sovereign bond yields remain low for a number of advanced economies, and have decreased noticeably for peripheral euro-area countries. Yields on corporate bonds are also at low levels in most advanced economies, and some equity markets have reached historical highs. These developments reflect a number of factors, including additional accommodative central bank policies and some reduction in global policy uncertainty.
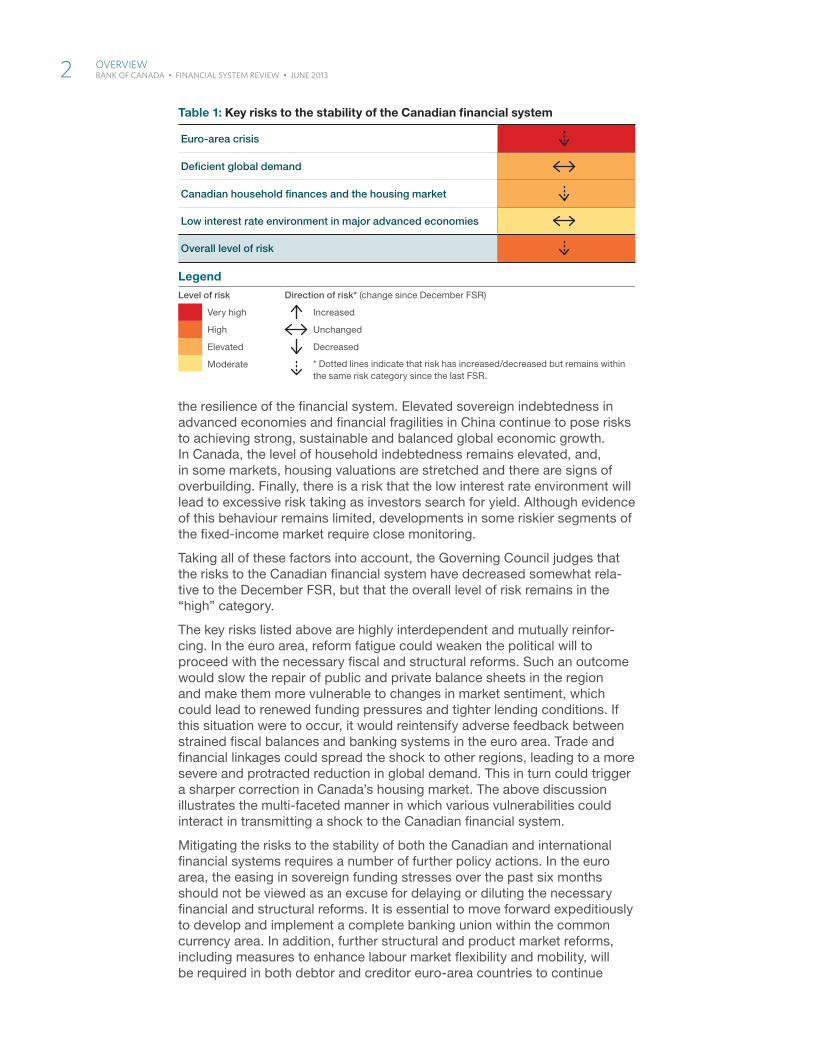
In Canada, the financial system remains robust. The balance sheets of Canadian banks are healthy, and banks have ready access to low-cost funding across the term structure. Corporate leverage remains near all-time lows, and firms have good access to credit from both banks and capital markets. Nevertheless, the Canadian financial system continues to be vulnerable to a number of key risks. These risks are similar to those highlighted in the December FSR and emanate primarily from the external environment (Table 1):
� sovereign and banking stresses in the euro area;
� deficient global demand;
� elevated household indebtedness and imbalances in some segments of the Canadian housing market; and
� increased risk taking arising from a prolonged period of low interest rates.
There have been positive developments related to these risks over the past six months. Sovereign funding pressures have eased in the euro area, mainly because of the European Central Bank’s (ECB) ongoing liquidity sup-port and commitment to take whatever further action is needed to underpin the integrity of the euro area. In the United States, the fiscal cliff has been largely averted, thus reducing the near-term tail risks to global economic growth. In Canada, there has been a constructive evolution of imbalances in the household sector. In particular, the growth rate of household credit has continued to slow and is now broadly in line with that of disposable income, and overall activity in the housing market has moderated.
Despite these developments, risks to the stability of Canada’s financial system remain. In the euro area, the weak macroeconomic situation is making it increasingly challenging to implement fiscal consolidation and structural reform, while financial fragmentation continues to undermine
OveRview 1 BANK OF CANADA • FINANCIAL SyStEM REvIEw • JuNE 2013
the resilience of the financial system. Elevated sovereign indebtedness in advanced economies and financial fragilities in China continue to pose risks to achieving strong, sustainable and balanced global economic growth. In Canada, the level of household indebtedness remains elevated, and, in some markets, housing valuations are stretched and there are signs of overbuilding. Finally, there is a risk that the low interest rate environment will lead to excessive risk taking as investors search for yield. Although evidence of this behaviour remains limited, developments in some riskier segments of the fixed-income market require close monitoring.
Taking all of these factors into account, the Governing Council judges that the risks to the Canadian financial system have decreased somewhat rela-tive to the December FSR, but that the overall level of risk remains in the “high” category.
The key risks listed above are highly interdependent and mutually reinfor-cing. In the euro area, reform fatigue could weaken the political will to proceed with the necessary fiscal and structural reforms. Such an outcome would slow the repair of public and private balance sheets in the region and make them more vulnerable to changes in market sentiment, which could lead to renewed funding pressures and tighter lending conditions. If this situation were to occur, it would reintensify adverse feedback between strained fiscal balances and banking systems in the euro area. Trade and financial linkages could spread the shock to other regions, leading to a more severe and protracted reduction in global demand. This in turn could trigger a sharper correction in Canada’s housing market. The above discussion illustrates the multi-faceted manner in which various vulnerabilities could interact in transmitting a shock to the Canadian financial system.
Mitigating the risks to the stability of both the Canadian and international financial systems requires a number of further policy actions. In the euro area, the easing in sovereign funding stresses over the past six months should not be viewed as an excuse for delaying or diluting the necessary financial and structural reforms. It is essential to move forward expeditiously to develop and implement a complete banking union within the common currency area. In addition, further structural and product market reforms, including measures to enhance labour market flexibility and mobility, will be required in both debtor and creditor euro-area countries to continue
Table 1: Key risks to the stability of the Canadian fi nancial system
Euro-area crisis
Defi cient global demand
Canadian household fi nances and the housing market
Low interest rate environment in major advanced economies
Overall level of risk
LegendLevel of risk Direction of risk* (change since December FSR)
Very high Increased
High Unchanged
Elevated Decreased
Moderate * Dotted lines indicate that risk has increased/decreased but remains within the same risk category since the last FSR.
2 OveRview BANK OF CANADA • FINANCIAL SyStEM REvIEw • JuNE 2013
narrowing differences in their competitiveness. Further work also needs to be done on institutional changes to establish a closer fiscal union. In China, continued structural and financial sector reforms, as well as greater flexibility in nominal exchange rates, are required to help to foster sustainable and balanced medium-term global economic growth. In the United States and Japan, credible plans are needed to address medium-term fiscal challenges.
For monetary authorities in advanced economies, managing the timing and manner of the eventual unwinding of the extraordinary monetary stimulus and liquidity in the financial system will be an important challenge. Effective communication of their eventual exit strategies will be necessary to manage expectations with a view to minimizing any unintended consequences for the global financial system.
In Canada, imbalances in the household sector, which built up over a number of years, will take some time to correct. Since borrowing rates will eventually normalize, households need to ensure that they will be able to service new and existing debt over the duration of their loans. All financial institutions should have rigorous lending practices in place and actively monitor their risks, consistent with guidelines provided by the Office of the Superintendent of Financial Institutions (OSFI). For their part, authorities in Canada will continue to monitor carefully the financial situation of the house-hold sector and developments in the housing market.
The risks highlighted in this issue of the FSR underscore the need to strengthen the resilience of the financial system. Significant progress has been made on this front since December, both in Canada and internationally. Canada implemented the Basel III capital rules at the start of 2013, which is the beginning of the internationally agreed-upon phase-in period for these rules that extends to 2019. At the international level, the Basel Committee on Banking Supervision (BCBS) published revisions to the Liquidity Coverage Ratio that strengthen the minimum standards for the funding liquidity of banks, as outlined in a report in this issue of the FSR on page 37.
In March, six domestic systemically important banks were identified in Canada, and in its 2013 budget, the federal government announced plans to implement a comprehensive risk-management framework for these institu-tions. This framework will include higher capital requirements, enhanced supervision and recovery and resolution plans, additional disclosure require-ments, and a “bail-in” regime under which (in the event a bank fails) losses would be borne by creditors before any public support is provided. Later this year, the Financial Stability Board (FSB) will publish an integrated set of recommendations for strengthening oversight and regulation of shadow banking.
The Government of Canada has also begun to reduce its reliance on external credit ratings, as agreed on by the G-20 leaders in 2010. In par-ticular, the Bank of Canada has set up a new credit-assessment group to evaluate the credit risk of the assets that the Bank manages on behalf of the Government of Canada (see Box 2 on page 32).
Financial market infrastructure continues to be strengthened, both in Canada and globally. The Bank of Canada is continuing to implement new international risk-management standards for its oversight of systemically important financial market infrastructure. Meanwhile, the central counter-party (CCP) service for the Canadian repo market (established in 2012) has expanded its functions to include blind repos and cash trades. Progress also continues on the central clearing of over-the-counter derivatives:
OveRview 3 BANK OF CANADA • FINANCIAL SyStEM REvIEw • JuNE 2013
in April, LCH.Clearnet’s SwapClear service (the largest global CCP for the interest rate derivatives market) was designated as systemically important for the Canadian financial system and is now subject to Bank of Canada oversight. The Bank carries out this function through arrangements for over-sight co-operation.1 Finally, the BCBS and the International Organization of Securities Commissions (IOSCO) have published a near-final policy framework for margin requirements for non-centrally-cleared over-the-counter derivatives transactions, designed, in part, to strengthen incentives for central clearing.
Despite this progress, much remains to be done. Most importantly, the implementation of financial sector reforms has been somewhat uneven across countries. Policy-makers will need to ensure full, timely and con-sistent implementation of the agreed global standards.
1 The Bank participates in a multilateral arrangement for oversight co-operation led by SwapClear’s lead regulator, the Bank of England.
4 OveRview BANK OF CANADA • FINANCIAL SyStEM REvIEw • JuNE 2013
Risk assessmentThis section of the Financial System Review (FSR) outlines the Governing Council’s evaluation of the key risks to the Canadian financial system. After a brief survey of macrofinancial conditions, the principal risks are examined. The objective of the FSR is not to predict the most likely outcomes for the financial system but to raise early awareness of key risks and promote mitigating actions.
Macrofinancial ConditionsThe global economic recovery continues at a modest pace. The expan-sion in the United States is being supported by a strengthening in private demand that is more than offsetting the drag from fiscal consolidation. The euro area remains in recession, with economic activity constrained by fiscal austerity, low confidence and tight credit conditions, especially in the affected peripheral countries. Economic growth in China has eased from the very strong rates seen earlier, which is weighing somewhat on global com-modity prices, while Japan’s economy is beginning to respond to significant policy stimulus. In Canada, economic growth in the second half of 2012 was weak, but picked up in the first quarter of 2013.
Global financial conditions have improvedDespite the subdued pace of the global economic recovery, financial conditions have continued to improve. Supported by additional accom-modative central bank policies, yields on corporate bonds remain low in most advanced countries. Equity markets in advanced economies have also performed well, with some indexes reaching historical highs.
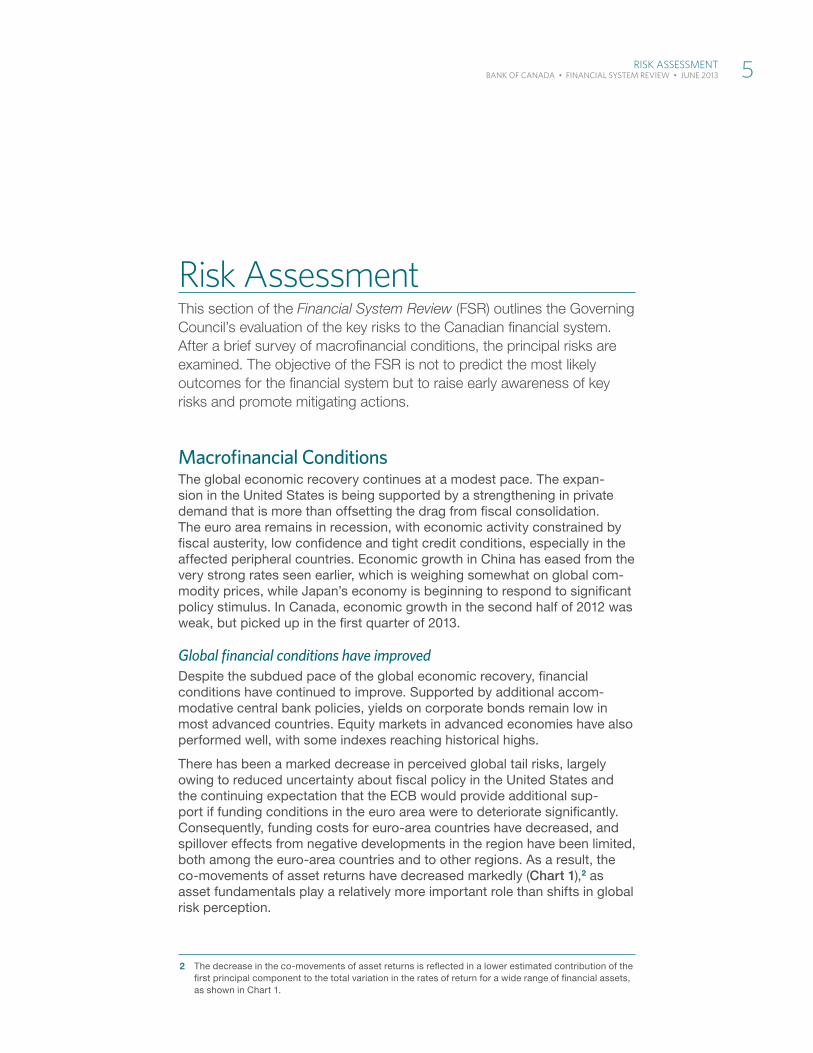
There has been a marked decrease in perceived global tail risks, largely owing to reduced uncertainty about fiscal policy in the United States and the continuing expectation that the ECB would provide additional sup-port if funding conditions in the euro area were to deteriorate significantly. Consequently, funding costs for euro-area countries have decreased, and spillover effects from negative developments in the region have been limited, both among the euro-area countries and to other regions. As a result, the co-movements of asset returns have decreased markedly (Chart 1),2 as asset fundamentals play a relatively more important role than shifts in global risk perception.
2 The decrease in the co-movements of asset returns is reflected in a lower estimated contribution of the first principal component to the total variation in the rates of return for a wide range of financial assets, as shown in Chart 1.
RiSk aSSeSSment 5 BANK OF CANADA • FINANCIAL SyStEM REvIEw • JuNE 2013
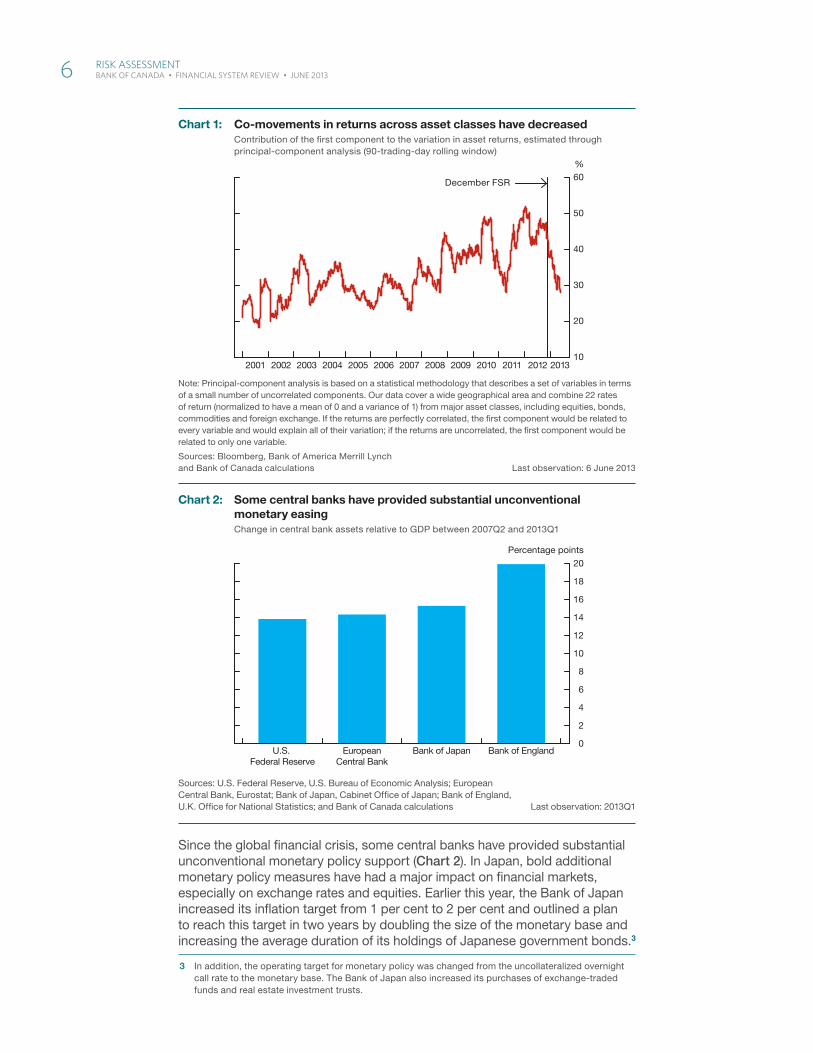
Since the global financial crisis, some central banks have provided substantial unconventional monetary policy support (Chart 2). In Japan, bold additional monetary policy measures have had a major impact on financial markets, especially on exchange rates and equities. Earlier this year, the Bank of Japan increased its inflation target from 1 per cent to 2 per cent and outlined a plan to reach this target in two years by doubling the size of the monetary base and increasing the average duration of its holdings of Japanese government bonds.3
3 In addition, the operating target for monetary policy was changed from the uncollateralized overnight call rate to the monetary base. The Bank of Japan also increased its purchases of exchange-traded funds and real estate investment trusts.
Note: Principal-component analysis is based on a statistical methodology that describes a set of variables in terms of a small number of uncorrelated components. Our data cover a wide geographical area and combine 22 rates of return (normalized to have a mean of 0 and a variance of 1) from major asset classes, including equities, bonds, commodities and foreign exchange. If the returns are perfectly correlated, the fi rst compo nent would be related to every variable and would explain all of their variation; if the returns are uncorrelated, the fi rst component would be related to only one variable.
Sources: Bloomberg, Bank of America Merrill Lynch and Bank of Canada calculations Last observation: 6 June 2013
2001 2002 2003 2004 2005 2006 2007 2008 2009 2010 2011 2012 201310
20
30
40
50
60%
December FSR
Chart 1: Co-movements in returns across asset classes have decreasedContribution of the fi rst component to the variation in asset returns, estimated through principal-component analysis (90-trading-day rolling window)
Sources: U.S. Federal Reserve, U.S. Bureau of Economic Analysis; European Central Bank, Eurostat; Bank of Japan, Cabinet Offi ce of Japan; Bank of England, U.K. Offi ce for National Statistics; and Bank of Canada calculations Last observation: 2013Q1
0
2
4
6
8
10
12
14
16
18
20
Percentage points
U.S. Federal Reserve
EuropeanCentral Bank
Bank of EnglandBank of Japan
Chart 2: Some central banks have provided substantial unconventional monetary easingChange in central bank assets relative to GDP between 2007Q2 and 2013Q1
6 RiSk aSSeSSment BANK OF CANADA • FINANCIAL SyStEM REvIEw • JuNE 2013
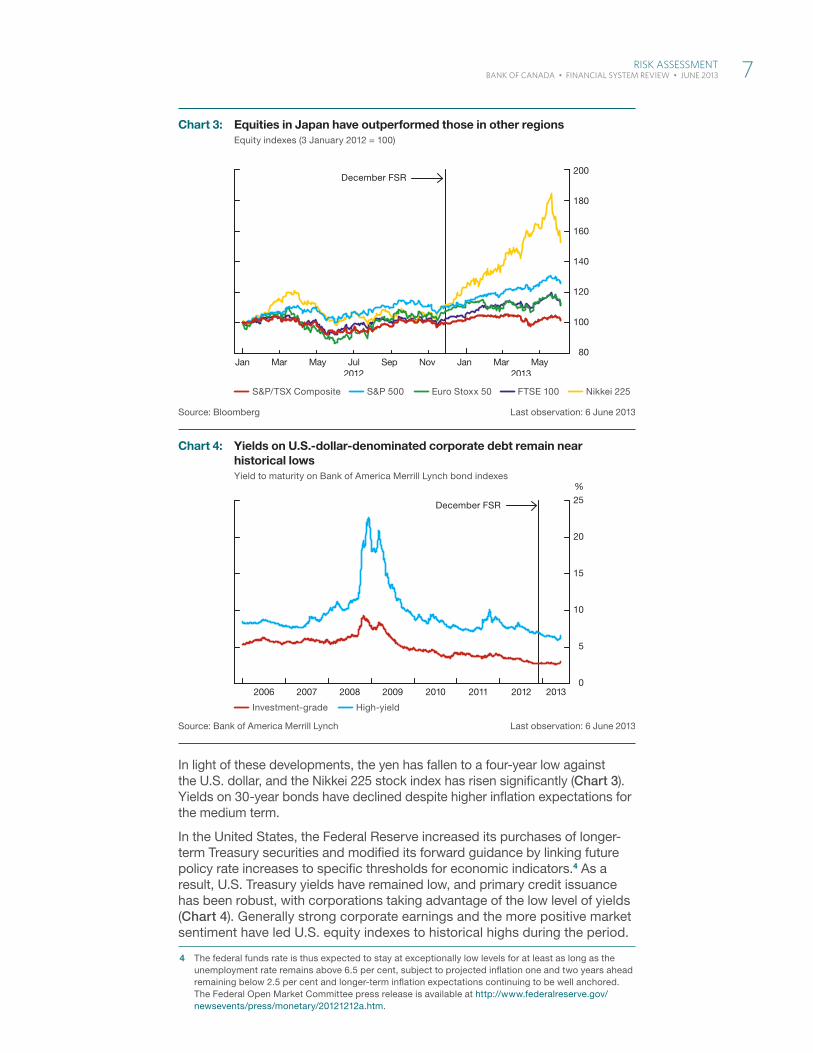
In light of these developments, the yen has fallen to a four-year low against the U.S. dollar, and the Nikkei 225 stock index has risen significantly (Chart 3). Yields on 30-year bonds have declined despite higher inflation expectations for the medium term.
In the United States, the Federal Reserve increased its purchases of longer-term Treasury securities and modified its forward guidance by linking future policy rate increases to specific thresholds for economic indicators.4 As a result, U.S. Treasury yields have remained low, and primary credit issuance has been robust, with corporations taking advantage of the low level of yields (Chart 4). Generally strong corporate earnings and the more positive market sentiment have led U.S. equity indexes to historical highs during the period.
4 The federal funds rate is thus expected to stay at exceptionally low levels for at least as long as the unemployment rate remains above 6.5 per cent, subject to projected inflation one and two years ahead remaining below 2.5 per cent and longer-term inflation expectations continuing to be well anchored. The Federal Open Market Committee press release is available at http://www.federalreserve.gov/newsevents/press/monetary/20121212a.htm.
Source: Bloomberg Last observation: 6 June 2013
S&P/TSX Composite S&P 500 Euro Stoxx 50 FTSE 100 Nikkei 225
80
100
120
140
160
180
200
2012 2013Jan Mar May Jul Sep Nov Jan Mar May
December FSR
Chart 3: Equities in Japan have outperformed those in other regionsEquity indexes (3 January 2012 = 100)
Source: Bank of America Merrill Lynch Last observation: 6 June 2013
Investment-grade High-yield
2006 2007 2008 2009 2010 2011 2012 20130
5
10
15
20
25
%
December FSR
Chart 4: Yields on U.S.-dollar-denominated corporate debt remain near historical lowsYield to maturity on Bank of America Merrill Lynch bond indexes
RiSk aSSeSSment 7 BANK OF CANADA • FINANCIAL SyStEM REvIEw • JuNE 2013
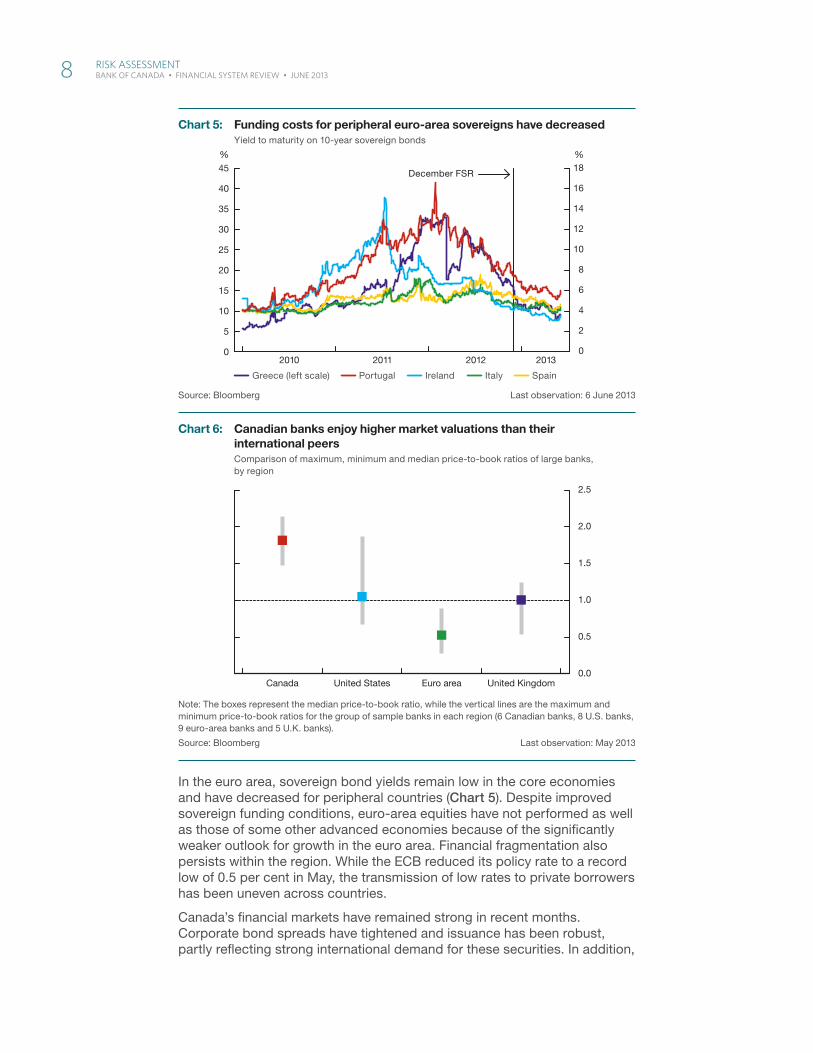
In the euro area, sovereign bond yields remain low in the core economies and have decreased for peripheral countries (Chart 5). Despite improved sovereign funding conditions, euro-area equities have not performed as well as those of some other advanced economies because of the significantly weaker outlook for growth in the euro area. Financial fragmentation also persists within the region. While the ECB reduced its policy rate to a record low of 0.5 per cent in May, the transmission of low rates to private borrowers has been uneven across countries.
Canada’s financial markets have remained strong in recent months. Corporate bond spreads have tightened and issuance has been robust, partly reflecting strong international demand for these securities. In addition,
Source: Bloomberg Last observation: 6 June 2013
Greece (left scale) Portugal Ireland Italy Spain
0
2
4
6
8
10
12
14
16
18
0
5
10
15
20
25
30
35
40
45
2010 2011 2012 2013
%%
December FSR
Chart 5: Funding costs for peripheral euro-area sovereigns have decreasedYield to maturity on 10-year sovereign bonds
Note: The boxes represent the median price-to-book ratio, while the vertical lines are the maximum and minimum price-to-book ratios for the group of sample banks in each region (6 Canadian banks, 8 U.S. banks, 9 euro-area banks and 5 U.K. banks).
Source: Bloomberg Last observation: May 2013
0.0
0.5
1.0
1.5
2.0
2.5
Canada United States Euro area United Kingdom
Chart 6: Canadian banks enjoy higher market valuations than their international peersComparison of maximum, minimum and median price-to-book ratios of large banks, by region
8 RiSk aSSeSSment BANK OF CANADA • FINANCIAL SyStEM REvIEw • JuNE 2013
responses to the Bank of Canada’s Senior Loan Officer Survey5 for the first quarter of 2013 point to further easing in business-lending conditions, pri-marily for corporate and commercial borrowers.
Canadian banks continue to have ready access to funding markets at attractive rates. Thus far in 2013, banks have reported strong earnings and modest loan losses. Based on the new Basel III rules, the median common equity Tier 1 capital ratio for the big six Canadian banks was 9 per cent in 2013Q2, well above OSFI’s 7 per cent requirement.6 Canadian bank stocks are trading at prices that, on average, are about 90 per cent above their book value, markedly higher than in many other countries (Chart 6).
Key RisksThis section examines the risks that the Governing Council judges to be the most important for assessing the stability of the Canadian financial system. The key sources of risk are broadly the same as those noted in the December FSR and emanate primarily from the external environment. Although the risks are interrelated and mutually reinforcing, the following discussion focuses on the underlying vulnerabilities that are distinct for each risk.
Euro-Area CrisisThe most important risk to financial stability in Canada continues to stem from the euro area. Several interconnected factors are contributing to stresses in the region: potentially unsustainable fiscal trajectories in some peripheral economies; adverse feedback between weak economic activity and fragilities in the banking sector; and differences in competitiveness within the common currency area.
Over recent years, there have been recurrent market concerns that the crisis in the euro area could rapidly reintensify, with severe consequences for the global financial system. These concerns have eased in the past several months, mainly because of the ECB’s provision of liquidity to the financial system and its commitment to take whatever further action is needed to support the integrity of the euro area. As a result, sovereign funding costs for the peripheral euro-area countries have fallen. In addition, competitive-ness in the peripheral countries has improved somewhat, and current account deficits have narrowed.
Despite these positive developments, macrofinancial strains and structural problems persist. Financial fragmentation across the euro area remains high, and there has been limited further progress on the reforms needed to address underlying structural imbalances and to increase potential output growth. At the same time, the weakening economic outlook in the region has increased the likelihood that the repair of the financial system will take longer to complete. A prolonged period of economic and financial strain could make it more challenging to implement the necessary fiscal and structural reforms.
On balance, the Governing Council judges that, while the risks arising from stresses in the euro area have decreased somewhat, they remain within the “very high” category.
5 The latest Senior Loan Officer Survey is available on the Bank’s website under Publications and Research > Periodicals > SLOS 2013Q1.
6 The Basel III capital rules were implemented in Canada at the start of 2013, which is the beginning of the internationally agreed-upon phase-in period for these rules that extends to 2019.
RiSk aSSeSSment 9 BANK OF CANADA • FINANCIAL SyStEM REvIEw • JuNE 2013
Sovereign funding conditions and the resilience of the euro-area financial system have improved somewhatBond yields for the stressed peripheral countries have continued to decline since December (Chart 5), and Portugal and Ireland have taken advantage of these lower borrowing costs by returning to bond markets. Meanwhile, Spain has issued long-dated bonds with strong demand at auctions. This continued easing in sovereign funding pressures reflects a combination of factors, including the ECB’s actions and statements, some progress in addressing the problems in the banking systems of the peripheral countries, and extensions to the maturities of program loans for Portugal and Ireland granted by the “Troika” (the International Monetary Fund, the European Commission and the ECB).7
Financial conditions in the euro area appear somewhat more resilient. The lim-ited market reaction to the political uncertainty in Italy following parliamentary elections and to the policy and communications missteps in connection with the banking crisis in Cyprus partly reflects this increased resilience.
Linkages between weak economic activity, strained fiscal balances and fragile banking systems continue to present challengesDespite the reduction in short-term tail risks, the protracted recession in the euro area poses a longer-term threat to financial stability. Since December, softness in manufacturing has spread from the periphery to the core euro-area countries, including Germany and France. Lending conditions have continued to tighten as euro-area banks raise credit standards and reduce lending to strengthen their capital positions.8 The combination of weak economic activity and tight credit conditions is reflected in survey expecta-tions of further decreases in loan demand from both euro-area businesses and households over the first half of 2013. A gradual recovery in economic activity is expected later this year, but there are important downside risks.
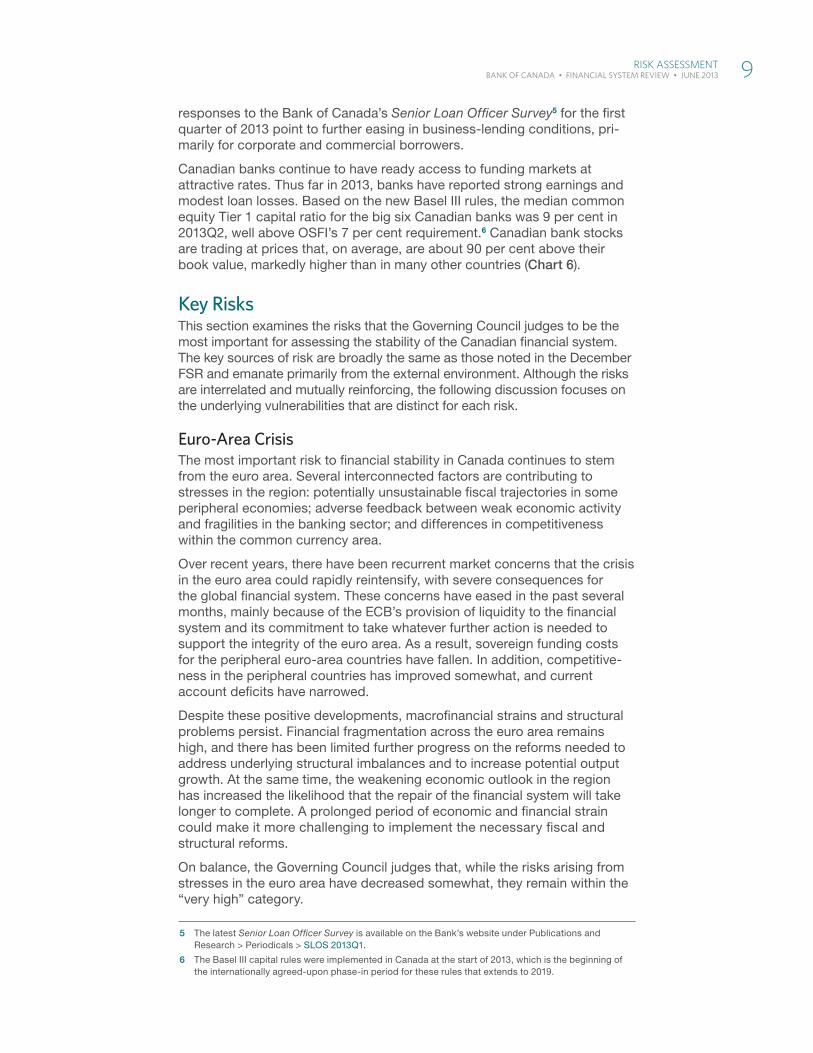
The euro-area financial system also remains more fragmented along national lines than before the crisis. Banks in peripheral countries remain highly exposed to debt issued by their own governments, which continues to be a source of vulnerability in the event that concerns about sovereign risk reintensify. Banks in peripheral countries also have less access to market funding. As a result, their interest margins remain compressed, even though lending rates for small and medium-sized firms are around 230 basis points higher in Italy and Spain than those in Germany (Chart 7). The ECB’s April 2013 Survey on the Access to Finance of Small and Medium-Sized Enterprises in the Euro Area also suggests that access to credit by small and medium-sized businesses in the peripheral economies is limited.9
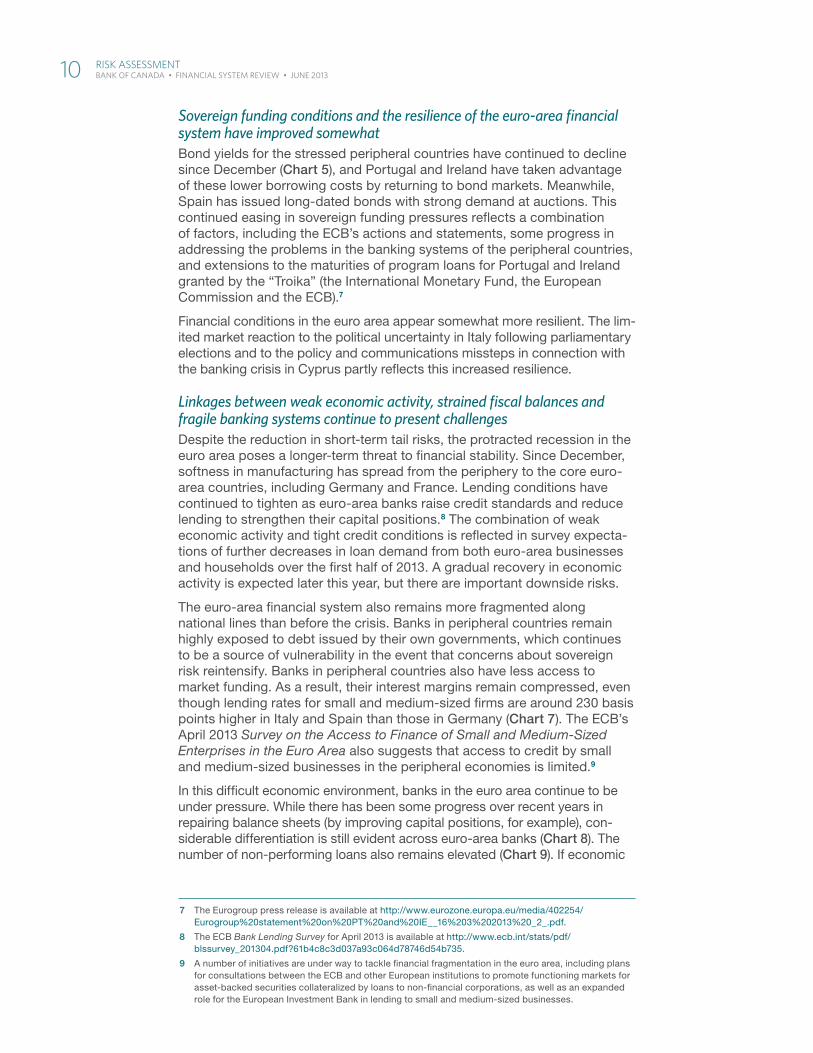
In this difficult economic environment, banks in the euro area continue to be under pressure. While there has been some progress over recent years in repairing balance sheets (by improving capital positions, for example), con-siderable differentiation is still evident across euro-area banks (Chart 8). The number of non-performing loans also remains elevated (Chart 9). If economic
7 The Eurogroup press release is available at http://www.eurozone.europa.eu/media/402254/Eurogroup%20statement%20on%20PT%20and%20IE__16%203%202013%20_2_.pdf.
8 The ECB Bank Lending Survey for April 2013 is available at http://www.ecb.int/stats/pdf/blssurvey_201304.pdf?61b4c8c3d037a93c064d78746d54b735.
9 A number of initiatives are under way to tackle financial fragmentation in the euro area, including plans for consultations between the ECB and other European institutions to promote functioning markets for asset-backed securities collateralized by loans to non-financial corporations, as well as an expanded role for the European Investment Bank in lending to small and medium-sized businesses.
10 RiSk aSSeSSment BANK OF CANADA • FINANCIAL SyStEM REvIEw • JuNE 2013
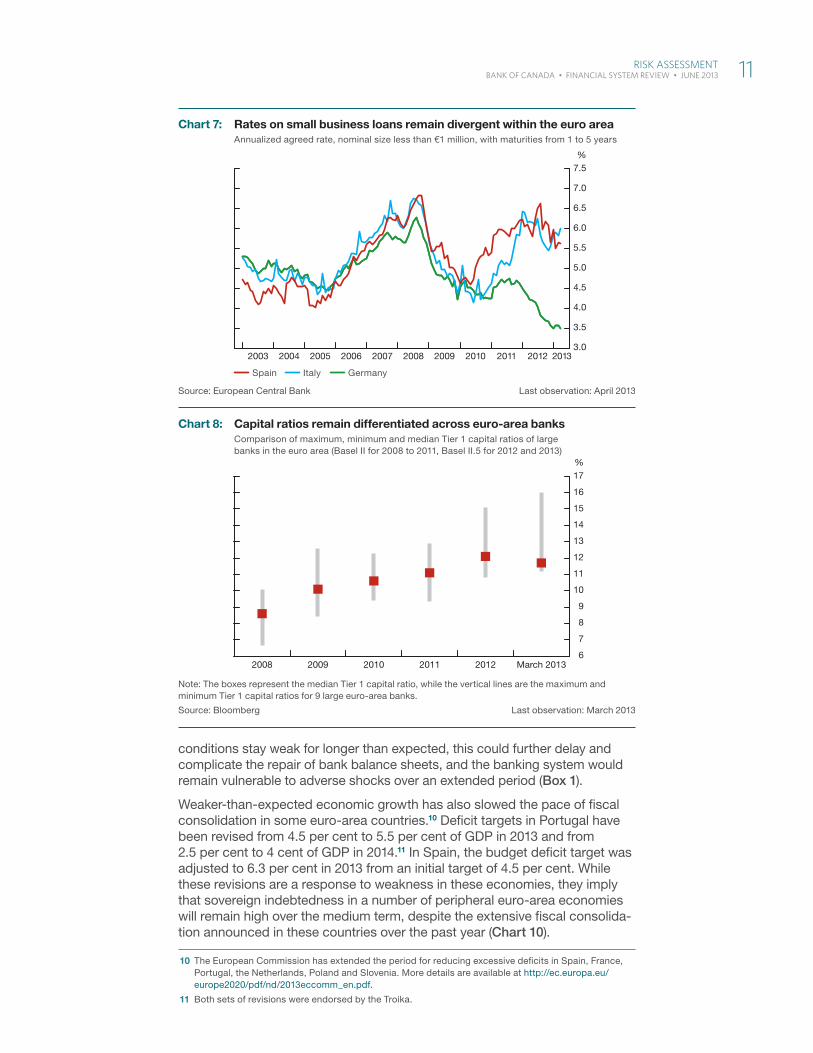
conditions stay weak for longer than expected, this could further delay and complicate the repair of bank balance sheets, and the banking system would remain vulnerable to adverse shocks over an extended period (Box 1).
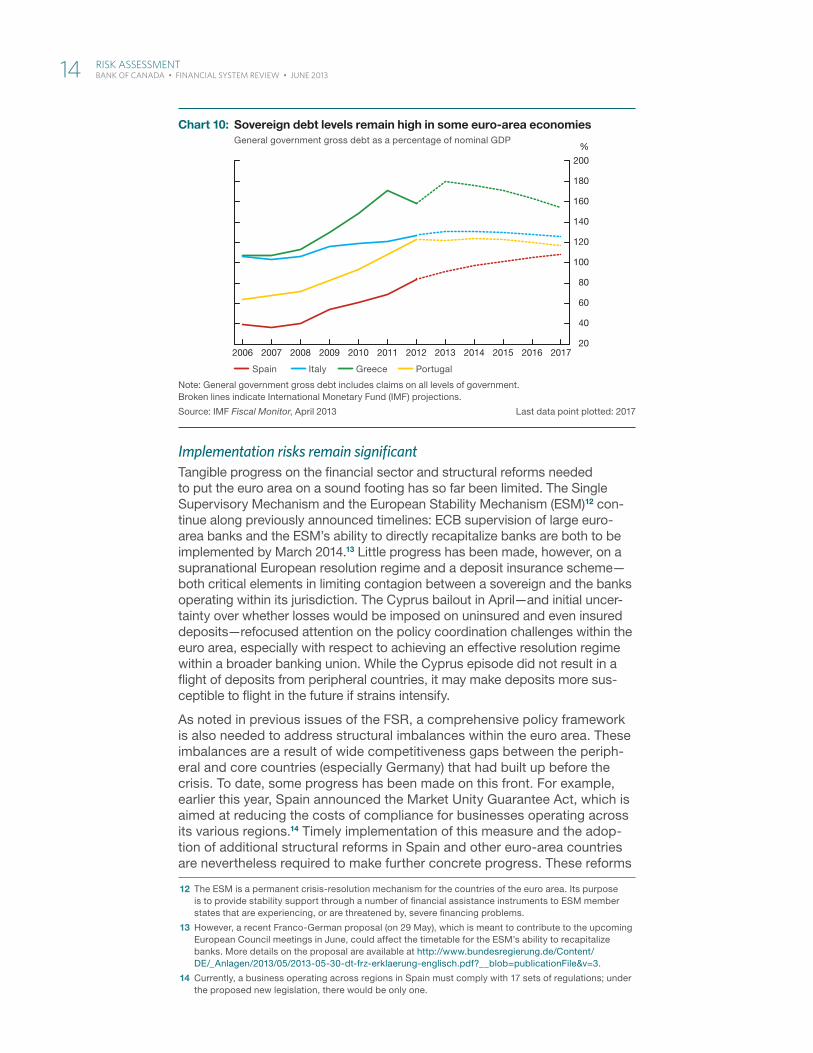
Weaker-than-expected economic growth has also slowed the pace of fiscal consolidation in some euro-area countries.10 Deficit targets in Portugal have been revised from 4.5 per cent to 5.5 per cent of GDP in 2013 and from 2.5 per cent to 4 cent of GDP in 2014.11 In Spain, the budget deficit target was adjusted to 6.3 per cent in 2013 from an initial target of 4.5 per cent. While these revisions are a response to weakness in these economies, they imply that sovereign indebtedness in a number of peripheral euro-area economies will remain high over the medium term, despite the extensive fiscal consolida-tion announced in these countries over the past year (Chart 10).
10 The European Commission has extended the period for reducing excessive deficits in Spain, France, Portugal, the Netherlands, Poland and Slovenia. More details are available at http://ec.europa.eu/europe2020/pdf/nd/2013eccomm_en.pdf.
11 Both sets of revisions were endorsed by the Troika.
Source: European Central Bank Last observation: April 2013
Spain Italy Germany
2003 2004 2005 2006 2007 2008 2009 2010 2011 2012 2013
%
3.0
3.5
4.0
4.5
5.0
5.5
6.0
6.5
7.0
7.5
Chart 7: Rates on small business loans remain divergent within the euro areaAnnualized agreed rate, nominal size less than €1 million, with maturities from 1 to 5 years
Note: The boxes represent the median Tier 1 capital ratio, while the vertical lines are the maximum and minimum Tier 1 capital ratios for 9 large euro-area banks.
Source: Bloomberg Last observation: March 2013
6
7
8
9
10
11
12
13
14
15
16
17%
2008 2009 2010 2011 2012 March 2013
Chart 8: Capital ratios remain differentiated across euro-area banksComparison of maximum, minimum and median Tier 1 capital ratios of large banks in the euro area (Basel II for 2008 to 2011, Basel II.5 for 2012 and 2013)
RiSk aSSeSSment 11 BANK OF CANADA • FINANCIAL SyStEM REvIEw • JuNE 2013
Note: The sample includes 6 Canadian banks, 8 U.S. banks, 9 euro-area banks and 5 U.K. banks.
Sources: Regulatory fi lings of Canadian banks Last observations: United States and Canada, March 2013; and Bloomberg other countries, December 2012
Canada United States Euro area United Kingdom
2006 2007 2008 2009 2010 2011 2012 20130
1
2
3
4
5
6
7
8%
Chart 9: The number of non-performing loans at euro-area banks remains elevated and is creeping higherNon-performing loans as a percentage of total loans
Box 1
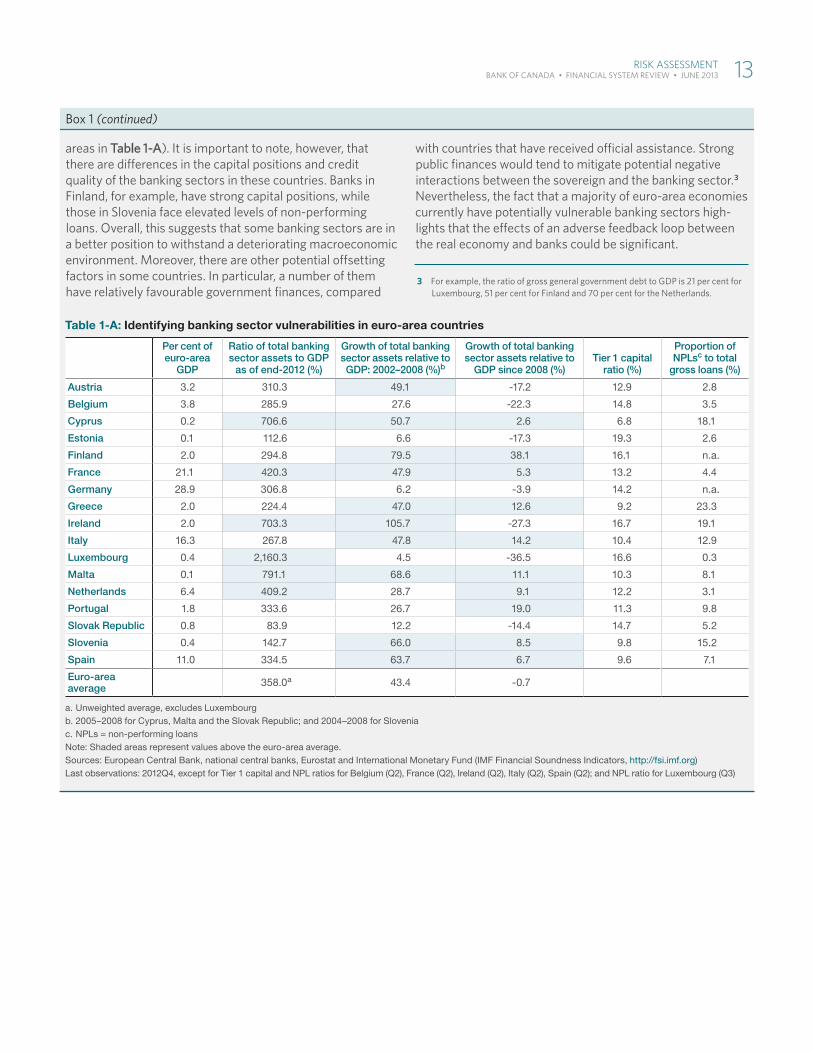
Banking Risk and Potentially Vulnerable Euro-Area Countries Banking sector vulnerabilities vary across euro-area coun-tries . to assess such vulnerabilities, this box examines two main indicators: the size of the banking sector relative to the economy, and the growth of banking sector assets relative to economic growth . For the latter indicator, two time periods are examined: 2002−2008, to highlight the relative growth in the banking sector prior to the global fi nancial crisis; and 2008 to the present to illustrate developments since the crisis . vulnerable economies are defi ned as those that (i) currently have a ratio of banking sector assets to GDP that is above the euro-area average; or (ii) have experienced a cumulative increase in banking sector assets relative to GDP that has been greater than the average for the euro area .
this method is both simple and intuitive, since banking sec-tors exhibiting these characteristics will tend to be more vulnerable to further economic weakness . Nevertheless, the method does have limitations . For example, using euro-area averages as a “benchmark threshold” is a simple
approximation . However, since the average size of the banking sector in the euro area is quite large by international standards,1 it provides a high threshold for identifying coun-tries with vulnerable banking systems . to complement these size-based indicators, we also report regulatory tier 1 capital ratios and ratios for non-performing loans .
A number of euro-area economies saw rapid growth in their banking sectors in the years leading up to the global fi nancial crisis .2 A majority of these countries are identifi ed as currently having banking sectors that could represent a broad-based source of vulnerability during a prolonged period of economic weakness (as indicated by the shaded
1 the average ratio of banking sector assets to GDP in the euro area is 358 per cent, compared with about 200 per cent in Canada and 96 per cent in the united States . the u .S . average takes into account only the assets of commercial banks .
2 this is illustrated by the growth in the banking sector-to-GDP ratio over 2002–2008 shown in table 1-A .
(continued…)
12 RiSk aSSeSSment BANK OF CANADA • FINANCIAL SyStEM REvIEw • JuNE 2013
Box 1 (continued)
areas in Table 1-A) . It is important to note, however, that there are diff erences in the capital positions and credit quality of the banking sectors in these countries . Banks in Finland, for example, have strong capital positions, while those in Slovenia face elevated levels of non-performing loans . Overall, this suggests that some banking sectors are in a better position to withstand a deteriorating macroeconomic environment . Moreover, there are other potential off setting factors in some countries . In particular, a number of them have relatively favourable government fi nances, compared
with countries that have received offi cial assistance . Strong public fi nances would tend to mitigate potential negative interactions between the sovereign and the banking sector .3 Nevertheless, the fact that a majority of euro-area economies currently have potentially vulnerable banking sectors high-lights that the eff ects of an adverse feedback loop between the real economy and banks could be signifi cant .
3 For example, the ratio of gross general government debt to GDP is 21 per cent for Luxembourg, 51 per cent for Finland and 70 per cent for the Netherlands .
Table 1-A: Identifying banking sector vulnerabilities in euro-area countries
Per cent of euro-area
GDP
Ratio of total banking sector assets to GDP
as of end-2012 (%)
Growth of total banking sector assets relative to GDP: 2002–2008 (%)b
Growth of total banking sector assets relative to
GDP since 2008 (%)Tier 1 capital
ratio (%)
Proportion of NPLsc to total
gross loans (%)
Austria 3.2 310.3 49.1 -17.2 12.9 2.8
Belgium 3.8 285.9 27.6 -22.3 14.8 3.5
Cyprus 0.2 706.6 50.7 2.6 6.8 18.1
Estonia 0.1 112.6 6.6 -17.3 19.3 2.6
Finland 2.0 294.8 79.5 38.1 16.1 n.a.
France 21.1 420.3 47.9 5.3 13.2 4.4
Germany 28.9 306.8 6.2 -3.9 14.2 n.a.
Greece 2.0 224.4 47.0 12.6 9.2 23.3
Ireland 2.0 703.3 105.7 -27.3 16.7 19.1
Italy 16.3 267.8 47.8 14.2 10.4 12.9
Luxembourg 0.4 2,160.3 4.5 -36.5 16.6 0.3
Malta 0.1 791.1 68.6 11.1 10.3 8.1
Netherlands 6.4 409.2 28.7 9.1 12.2 3.1
Portugal 1.8 333.6 26.7 19.0 11.3 9.8
Slovak Republic 0.8 83.9 12.2 -14.4 14.7 5.2
Slovenia 0.4 142.7 66.0 8.5 9.8 15.2
Spain 11.0 334.5 63.7 6.7 9.6 7.1
Euro-area average 358.0a 43.4 -0.7
a. Unweighted average, excludes Luxembourgb. 2005–2008 for Cyprus, Malta and the Slovak Republic; and 2004–2008 for Sloveniac. NPLs = non-performing loansNote: Shaded areas represent values above the euro-area average. Sources: European Central Bank, national central banks, Eurostat and International Monetary Fund (IMF Financial Soundness Indicators, http://fsi.imf.org)Last observations: 2012Q4, except for Tier 1 capital and NPL ratios for Belgium (Q2), France (Q2), Ireland (Q2), Italy (Q2), Spain (Q2); and NPL ratio for Luxembourg (Q3)
RiSk aSSeSSment 13 BANK OF CANADA • FINANCIAL SyStEM REvIEw • JuNE 2013
Implementation risks remain significantTangible progress on the financial sector and structural reforms needed to put the euro area on a sound footing has so far been limited. The Single Supervisory Mechanism and the European Stability Mechanism (ESM)12 con-tinue along previously announced timelines: ECB supervision of large euro-area banks and the ESM’s ability to directly recapitalize banks are both to be implemented by March 2014.13 Little progress has been made, however, on a supranational European resolution regime and a deposit insurance scheme—both critical elements in limiting contagion between a sovereign and the banks operating within its jurisdiction. The Cyprus bailout in April—and initial uncer-tainty over whether losses would be imposed on uninsured and even insured deposits—refocused attention on the policy coordination challenges within the euro area, especially with respect to achieving an effective resolution regime within a broader banking union. While the Cyprus episode did not result in a flight of deposits from peripheral countries, it may make deposits more sus-ceptible to flight in the future if strains intensify.
As noted in previous issues of the FSR, a comprehensive policy framework is also needed to address structural imbalances within the euro area. These imbalances are a result of wide competitiveness gaps between the periph-eral and core countries (especially Germany) that had built up before the crisis. To date, some progress has been made on this front. For example, earlier this year, Spain announced the Market Unity Guarantee Act, which is aimed at reducing the costs of compliance for businesses operating across its various regions.14 Timely implementation of this measure and the adop-tion of additional structural reforms in Spain and other euro-area countries are nevertheless required to make further concrete progress. These reforms
12 The ESM is a permanent crisis-resolution mechanism for the countries of the euro area. Its purpose is to provide stability support through a number of financial assistance instruments to ESM member states that are experiencing, or are threatened by, severe financing problems.
13 However, a recent Franco-German proposal (on 29 May), which is meant to contribute to the upcoming European Council meetings in June, could affect the timetable for the ESM’s ability to recapitalize banks. More details on the proposal are available at http://www.bundesregierung.de/Content/DE/_Anlagen/2013/05/2013-05-30-dt-frz-erklaerung-englisch.pdf?__blob=publicationFile&v=3.
14 Currently, a business operating across regions in Spain must comply with 17 sets of regulations; under the proposed new legislation, there would be only one.
Note: General government gross debt includes claims on all levels of government. Broken lines indicate International Monetary Fund (IMF) projections.
Source: IMF Fiscal Monitor, April 2013 Last data point plotted: 2017
Spain Italy Greece Portugal
2006 2007 2008 2009 2010 2011 2012 2013 2014 2015 2016 201720
40
60
80
100
120
140
160
180
200
%
Chart 10: Sovereign debt levels remain high in some euro-area economiesGeneral government gross debt as a percentage of nominal GDP
14 RiSk aSSeSSment BANK OF CANADA • FINANCIAL SyStEM REvIEw • JuNE 2013
will also need to include measures to enhance labour market flexibility and mobility in the region. Improvements in funding conditions for stressed sovereigns should not be used as an excuse to delay or dilute the necessary fiscal and structural reforms.
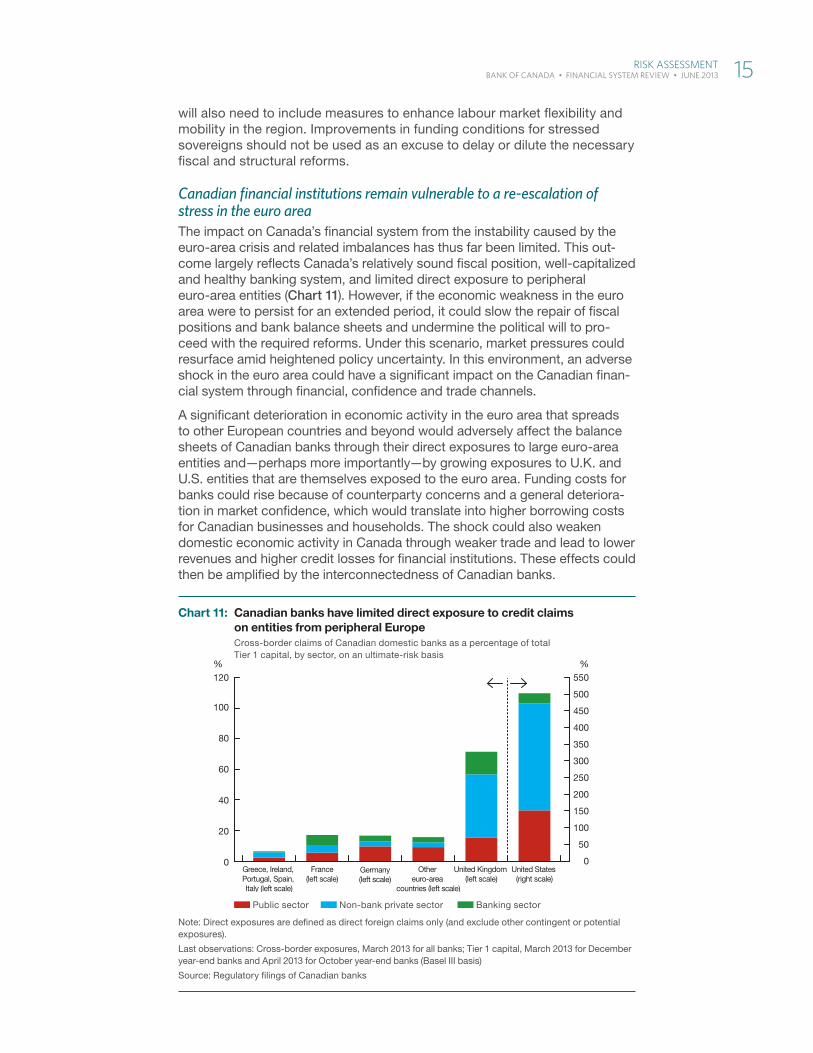
Canadian financial institutions remain vulnerable to a re-escalation of stress in the euro areaThe impact on Canada’s financial system from the instability caused by the euro-area crisis and related imbalances has thus far been limited. This out-come largely reflects Canada’s relatively sound fiscal position, well-capitalized and healthy banking system, and limited direct exposure to peripheral euro-area entities (Chart 11). However, if the economic weakness in the euro area were to persist for an extended period, it could slow the repair of fiscal positions and bank balance sheets and undermine the political will to pro-ceed with the required reforms. Under this scenario, market pressures could resurface amid heightened policy uncertainty. In this environment, an adverse shock in the euro area could have a significant impact on the Canadian finan-cial system through financial, confidence and trade channels.
A significant deterioration in economic activity in the euro area that spreads to other European countries and beyond would adversely affect the balance sheets of Canadian banks through their direct exposures to large euro-area entities and—perhaps more importantly—by growing exposures to U.K. and U.S. entities that are themselves exposed to the euro area. Funding costs for banks could rise because of counterparty concerns and a general deteriora-tion in market confidence, which would translate into higher borrowing costs for Canadian businesses and households. The shock could also weaken domestic economic activity in Canada through weaker trade and lead to lower revenues and higher credit losses for financial institutions. These effects could then be amplified by the interconnectedness of Canadian banks.
Note: Direct exposures are defi ned as direct foreign claims only (and exclude other contingent or potential exposures).
Last observations: Cross-border exposures, March 2013 for all banks; Tier 1 capital, March 2013 for December year-end banks and April 2013 for October year-end banks (Basel III basis)
Source: Regulatory fi lings of Canadian banks
Public sector Non-bank private sector Banking sector
0
20
40
60
80
100
120
%%
550
500
450
400
350
300
250
200
150
100
50
0 Greece, Ireland,
Portugal, Spain, Italy (left scale)
France(left scale)
Germany(left scale)
Other euro-area
countries (left scale)
United Kingdom (left scale)
United States (right scale)
Chart 11: Canadian banks have limited direct exposure to credit claims on entities from peripheral EuropeCross-border claims of Canadian domestic banks as a percentage of total Tier 1 capital, by sector, on an ultimate-risk basis
RiSk aSSeSSment 15 BANK OF CANADA • FINANCIAL SyStEM REvIEw • JuNE 2013
Deficient Global DemandGlobal economic activity continues to be restrained by deficient demand. This is partly the result of the asymmetric adjustment of the global current account imbalances that built up prior to the financial crisis. Since the crisis, a number of key countries with current account deficits have deleveraged, while the necessary offsetting increase in domestic demand in countries with current account surpluses has been slow to materialize. In this context, slow global economic growth has impeded the process of balance-sheet repair, thus prolonging the financial system’s vulnerability to adverse shocks. This situation carries two main elements of risk, as discussed in the December FSR: (i) the risk of a more protracted period of deficient demand that could further prolong such vulnerability; and (ii) the risk of tail events that could trigger a renewed global recession. Over the past six months, the second element of risk has noticeably diminished, while the first has increased (and in part materialized).
The diminished near-term tail risk since the December FSR reflects favour-able developments on a number of fronts. In the United States, uncertain-ties related to the “fiscal cliff”15 have been partially resolved—although the possibility of a disruptive showdown over the debt ceiling remains—and private demand is picking up. In Japan, bold policy actions have improved the outlook for economic activity. And in the euro area, as has already been discussed, the risks of a near-term intensification of the financial crisis have decreased.
However, there is a risk that the global economic recovery will be more prolonged than currently anticipated. The recession in the euro area could be more protracted and the recovery weaker than expected. In the United States, the medium-term fiscal challenges could undermine economic activity. Growth in Japan could falter if the structural reforms needed to address fiscal imbalances and help promote long-term growth are delayed or diluted. Finally, in China, economic growth could moderate, triggered or exacerbated by financial sector vulnerabilities.
Overall, the risks to the Canadian financial system from deficient global demand are judged to remain elevated, unchanged from December.
Near-term risks to global economic growth have decreasedOn balance, developments in the United States have been positive, with noticeable improvements in the housing market and in household balance sheets. The fiscal cliff was largely averted by the American Taxpayer Relief Act of 2012, mitigating a key near-term uncertainty related to U.S. economic growth that was outlined in the December FSR. Nonetheless, uncertainty regarding the U.S. fiscal outlook continues to pose some near-term risks to both U.S. and global economic growth. The key concern relates to the legislated limit on the U.S. debt (the “debt ceiling”), which, if not resolved in a timely manner, could adversely affect economic activity. The debt ceiling could become binding in the second half of 2013, and would then require a legislated agreement to raise it, potentially resulting in more fiscal tightening in the near term than is currently expected. In the extreme, delays related to raising the debt ceiling could stoke market fears of a technical default by the United States on its debt obligations.
15 The “fiscal cliff” refers to a number of expiring tax provisions and automatic spending cuts (also known as sequestration) that were scheduled to come into effect in January 2013.
16 RiSk aSSeSSment BANK OF CANADA • FINANCIAL SyStEM REvIEw • JuNE 2013
Despite this backdrop of ongoing fiscal uncertainty, the U.S. household sector has made considerable progress in repairing its balance sheet and lowering its vulnerability to adverse shocks: the household debt-to-income ratio has fallen noticeably from its peak at the end of 2007, while the ratio of net worth to income is recovering from the trough reached in 2009. Underpinning this repair is the recovery in the U.S. real estate market, which has gained further traction in the past year. Notably, house prices have begun to rise, following five years of declines. Given the still-large exposure of the U.S. banking system to the housing market, its continued recovery will further reduce balance-sheet vulnerabilities for banks.
In Japan, the monetary and fiscal measures announced since the December FSR have boosted the outlook for near-term growth. In addition to the monetary stimulus discussed earlier in this FSR, the Japanese government in January announced a fiscal stimulus package totalling about 2.5 per cent of GDP. These developments have strengthened the outlook for real output growth in Japan for 2013 and 2014.
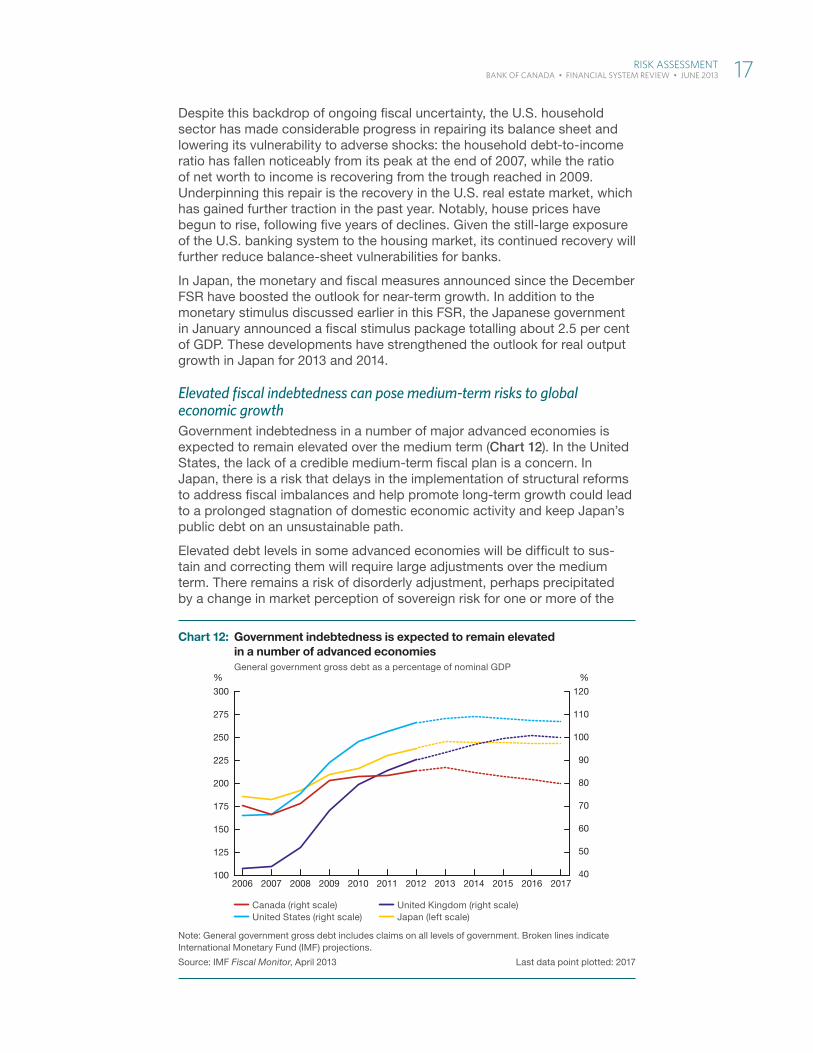
Elevated fiscal indebtedness can pose medium-term risks to global economic growthGovernment indebtedness in a number of major advanced economies is expected to remain elevated over the medium term (Chart 12). In the United States, the lack of a credible medium-term fiscal plan is a concern. In Japan, there is a risk that delays in the implementation of structural reforms to address fiscal imbalances and help promote long-term growth could lead to a prolonged stagnation of domestic economic activity and keep Japan’s public debt on an unsustainable path.
Elevated debt levels in some advanced economies will be difficult to sus-tain and correcting them will require large adjustments over the medium term. There remains a risk of disorderly adjustment, perhaps precipitated by a change in market perception of sovereign risk for one or more of the
Note: General government gross debt includes claims on all levels of government. Broken lines indicate International Monetary Fund (IMF) projections.
Source: IMF Fiscal Monitor, April 2013 Last data point plotted: 2017
Canada (right scale) United States (right scale)
United Kingdom (right scale) Japan (left scale)
2006 2007 2008 2009 2010 2011 2012 2013 2014 2015 2016 201740
50
60
70
80
90
100
110
120
100
125
150
175
200
225
250
275
300
%%
Chart 12: Government indebtedness is expected to remain elevated in a number of advanced economies
General government gross debt as a percentage of nominal GDP
RiSk aSSeSSment 17 BANK OF CANADA • FINANCIAL SyStEM REvIEw • JuNE 2013
advanced economies, leading to higher debt-servicing costs and reduced economic activity. Such an outcome would accentuate the current defi-ciency in global demand.
Weaker-than-anticipated growth in China would deepen the deficiency in global demandDuring the financial crisis and resulting global recession, robust growth in China and other emerging economies helped to temper the downturn in global activity. While economic growth in China remains strong relative to the advanced economies, it has moderated over the past two years. There are concerns that economic activity in China could be weaker than is currently anticipated, either because of a domestic shock or in response to external factors. If that were to occur, the deficiency in global demand would worsen.
The slow pace of financial sector reforms in China (including the limited flex-ibility in the exchange rate) has contributed to the buildup of vulnerabilities in China’s financial system, including housing market imbalances, local government borrowing, and the lack of transparency about credit risk and maturity mismatches in a rapidly expanding shadow banking sector.16 These vulnerabilities are closely interrelated, and a materialization of one could trigger the others and weaken economic activity, both in China and globally. For example, a sharp correction in China’s housing market could have a sig-nificant real and financial impact, given the importance of housing assets for Chinese households and the financial system. Since some shadow banking entities have substantial exposures to the real estate sector, such a scenario would also make it more difficult for them to deliver on promised returns, leading to liquidity strains and, in the extreme, runs on the institutions as investor confidence is undermined. This could exacerbate the initial housing market shock.
Economic activity in China could also be adversely affected by external developments. For example, if the recession in the euro area is more pro-tracted and the recovery more gradual than currently expected, it would weaken export-related activity in China. This weakness could have signifi-cant economy-wide impacts, if it is not offset by increased government stimulus. While there is fiscal room for authorities to offset adverse shocks, there may be some reluctance to do so, as that could exacerbate the finan-cial system vulnerabilities described above.
Further weakening in global demand could lead to a deterioration in the balance sheets of Canadian banksCanadian banks have increased their resilience to adverse shocks in recent years by boosting the level and quality of their capital, and improving liquidity management. Weaker global economic growth would nonetheless affect Canada’s financial system in several ways. First, weaker exports to affected regions would dampen economic activity in Canada, increase unemployment and lead to higher loan losses for banks. The trade channel would be especially important if the United States experiences a significant downturn. If growth slows in China, the impact on Canada’s economy from lower commodity prices could be substantial. Second, a marked slowdown in global economic growth may lead to a broad-based sell-off of risky assets, including credit instruments, equities and commodities. If a global economic shock originates from the realization of risks in China’s financial
16 An introduction to the Chinese shadow banking system is provided by “Shadow Banking in China: Expanding Scale, Evolving Structure,” available at http://www.frbsf.org/banking-supervision/publications/asia-focus/2013/april/.
18 RiSk aSSeSSment BANK OF CANADA • FINANCIAL SyStEM REvIEw • JuNE 2013
system, there could be heightened volatility in the market for benchmark assets, such as U.S. Treasuries, given China’s elevated holdings of these assets. Increased volatility and a general decline in market confidence could lead to higher funding costs for Canadian banks. In turn, these effects could translate into rising costs for loans and tighter lending conditions for Canadian businesses and households, while creating an adverse feedback loop between the decline in economic activity and stress in the financial system.
Canadian Household Finances and the Housing MarketThe elevated level of household indebtedness and imbalances in some seg-ments of the housing market continue to be the most important domestic sources of risk to financial stability in Canada. Recent international experi-ence shows that vulnerabilities in the household sector, especially those related to leveraged exposures to the housing market, can be a key element in triggering or exacerbating adverse economic and financial events.
Since the December FSR, there has been a constructive evolution of imbalances in household finances and the housing market. The pace of household debt accumulation has continued to slow and is now broadly in line with the growth rate of disposable income. Developments in the housing market have been encouraging and are largely consistent with the Bank’s projection: resale activity has levelled off after dropping from historically high levels, housing starts have moderated and house prices have stopped rising in most major urban markets.
Despite these positive developments, concerns remain. The level of indebt-edness is still elevated, and the Bank’s stress-test simulations suggest that households are vulnerable to adverse economic shocks. Moreover, in some market segments, housing valuations remain stretched, and there continue to be signs of overbuilding. These imbalances, which built up over many years, will take some time to correct. While a gradual unwinding of imbal-ances is expected, there is a risk of a sharper correction.
Overall, the Governing Council judges that the risks associated with high levels of household debt and housing market imbalances have decreased, but remain within the “elevated” category.
The growth of household debt continues to moderateIn the fourth quarter of 2012, the household sector debt-to-disposable-income ratio was little changed relative to the previous quarter (Chart 13).17
Data received since the December FSR indicate that credit growth has continued to slow, as expected (Chart 14). Consequently, the household credit-to-GDP gap has decreased (Chart 15).18, 19
17 Since the National Balance Sheet Accounts data for 2012Q4 were released, there have been upward histor-ical revisions to disposable income. Absent other revisions, this could suggest a somewhat lower trajectory for the debt-to-disposable-income ratio over the past couple of years than is currently shown in Chart 13.
18 The credit-to-GDP gap is the percentage deviation between the credit-to-GDP ratio and an estimate of its trend.
19 The total credit-to-GDP gap is relatively unchanged over the past two quarters, as the slowdown in the growth of household credit was roughly offset by the pickup in the growth of business credit. International evidence has shown that the total credit-to-GDP gap is a useful guide for identifying a potential buildup of imbalances in the banking sector. For more information on the construction of the credit-to-GDP gap, see Box 3 in the June 2011 FSR.
RiSk aSSeSSment 19 BANK OF CANADA • FINANCIAL SyStEM REvIEw • JuNE 2013
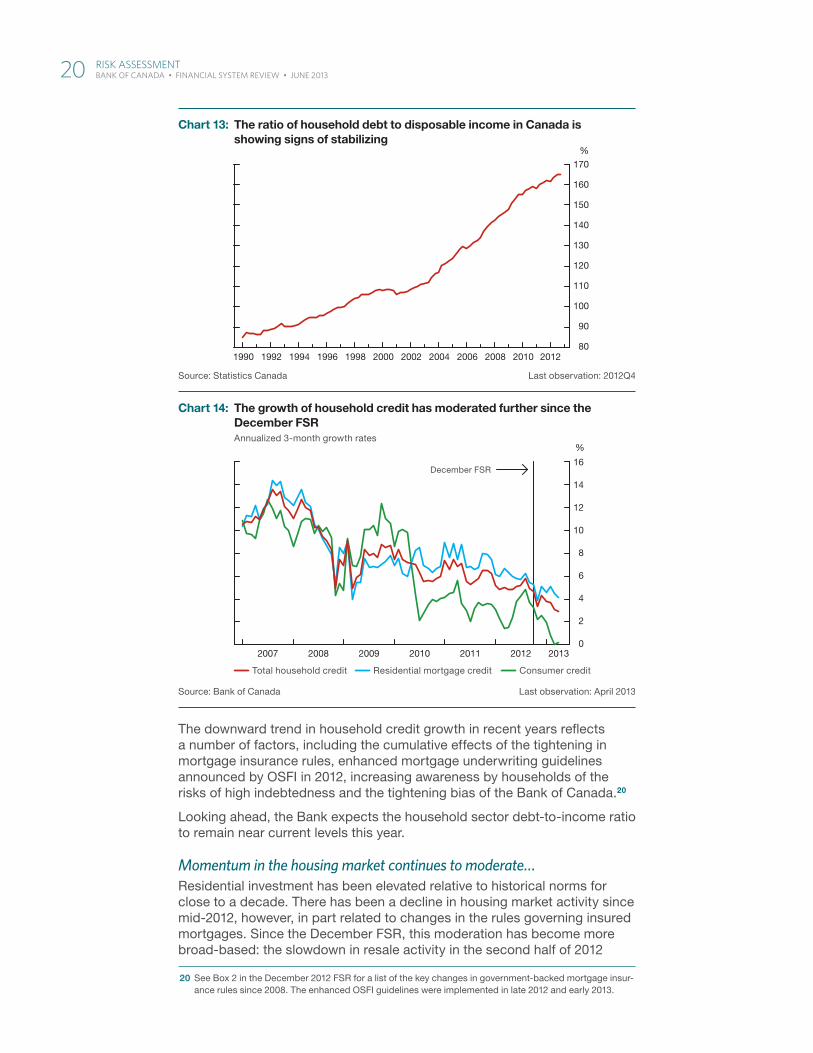
The downward trend in household credit growth in recent years reflects a number of factors, including the cumulative effects of the tightening in mortgage insurance rules, enhanced mortgage underwriting guidelines announced by OSFI in 2012, increasing awareness by households of the risks of high indebtedness and the tightening bias of the Bank of Canada.20
Looking ahead, the Bank expects the household sector debt-to-income ratio to remain near current levels this year.
Momentum in the housing market continues to moderate…Residential investment has been elevated relative to historical norms for close to a decade. There has been a decline in housing market activity since mid-2012, however, in part related to changes in the rules governing insured mortgages. Since the December FSR, this moderation has become more broad-based: the slowdown in resale activity in the second half of 2012
20 See Box 2 in the December 2012 FSR for a list of the key changes in government-backed mortgage insur-ance rules since 2008. The enhanced OSFI guidelines were implemented in late 2012 and early 2013.
Units of measure (top of axis):
Verifi ed vs. supplied data, cross-referenced w/ prior artwork
Left alt scale, if applicable
Aligned to outer edgeof axis labels, rag inward towards chart
Chart axes:
Tick marks (major and, if necessary, minor)
“Bookend” tick marks at ends of bottom axis (left/right)
Bottom axis labels placed & verifi ed
Chart bottom region:
Legend items placed and styled
Order verifi ed vs prior artwork
All superscripts, special symbols, etc. as required
Chart footer:
Note(s):
Source(s):
Last observation: (if applicable)
Data presentation styles:
Line styles & stacking order:
Canada/1st
US/2nd
Euro zone/3rd
Japan/4th
UK/5th
Canada/1st (projected)
US/2nd (proj’d)
Euro zone/3rd (proj’d)
Japan/4th (proj’d)
UK/5th (proj’d)
All axis lines & ticks
Fill styles & stacking order:
Canada/1st
US/2nd
Euro zone/3rd
Japan/4th UK/5th projected
Canada/1st (projected)
US/2nd (proj’d)
Euro zone/3rd (proj’d)
Japan/4th (proj’d)
UK/5th (proj’d)
Control range
Axis lines & ticks
Additional common styles:
dot black
red line plus dot in-chart label
Chart 14: Title+ 2nd line
Sub-title
Source: Bank of Canada Last observation: April 2013
Total household credit Residential mortgage credit Consumer credit
2007 2008 2009 2010 2011 2012 20130
2
4
6
8
10
12
14
16
%
December FSR
Chart 14: The growth of household credit has moderated further since the December FSRAnnualized 3-month growth rates
Source: Statistics Canada Last observation: 2012Q4
1990 1992 1994 1996 1998 2000 2002 2004 2006 2008 2010 201280
90
100
110
120
130
140
150
160
170 %
Chart 13: The ratio of household debt to disposable income in Canada is showing signs of stabilizing
20 RiSk aSSeSSment BANK OF CANADA • FINANCIAL SyStEM REvIEw • JuNE 2013
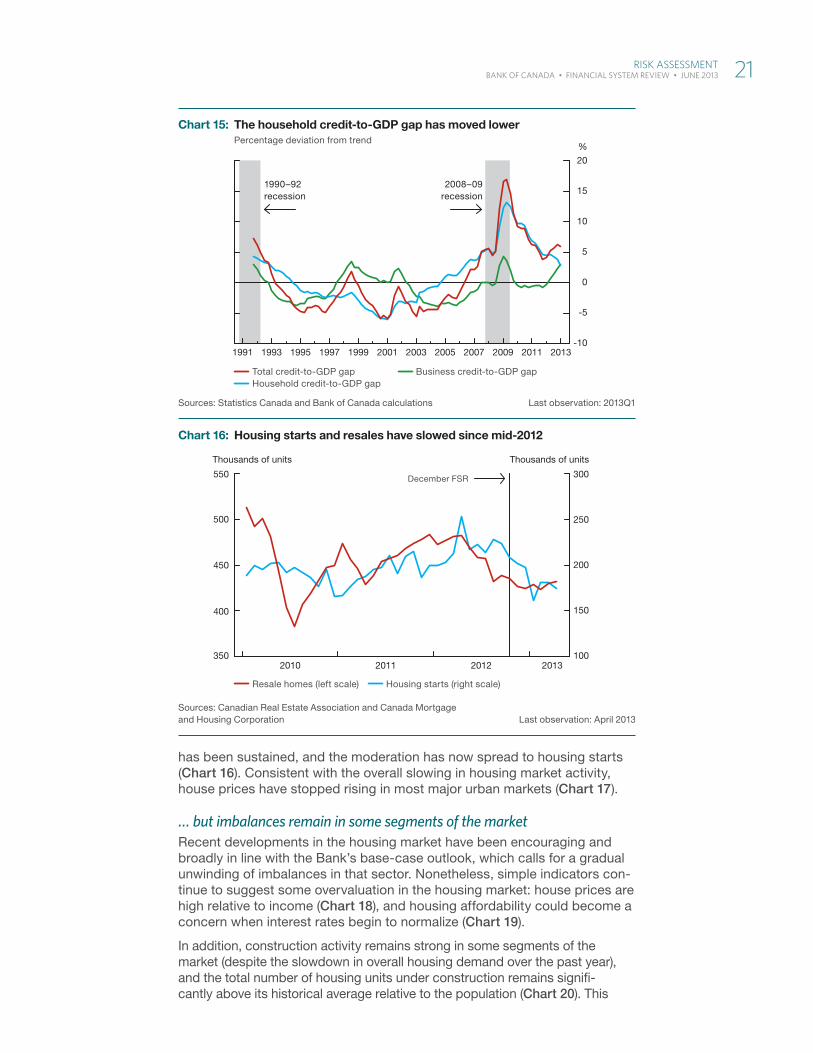
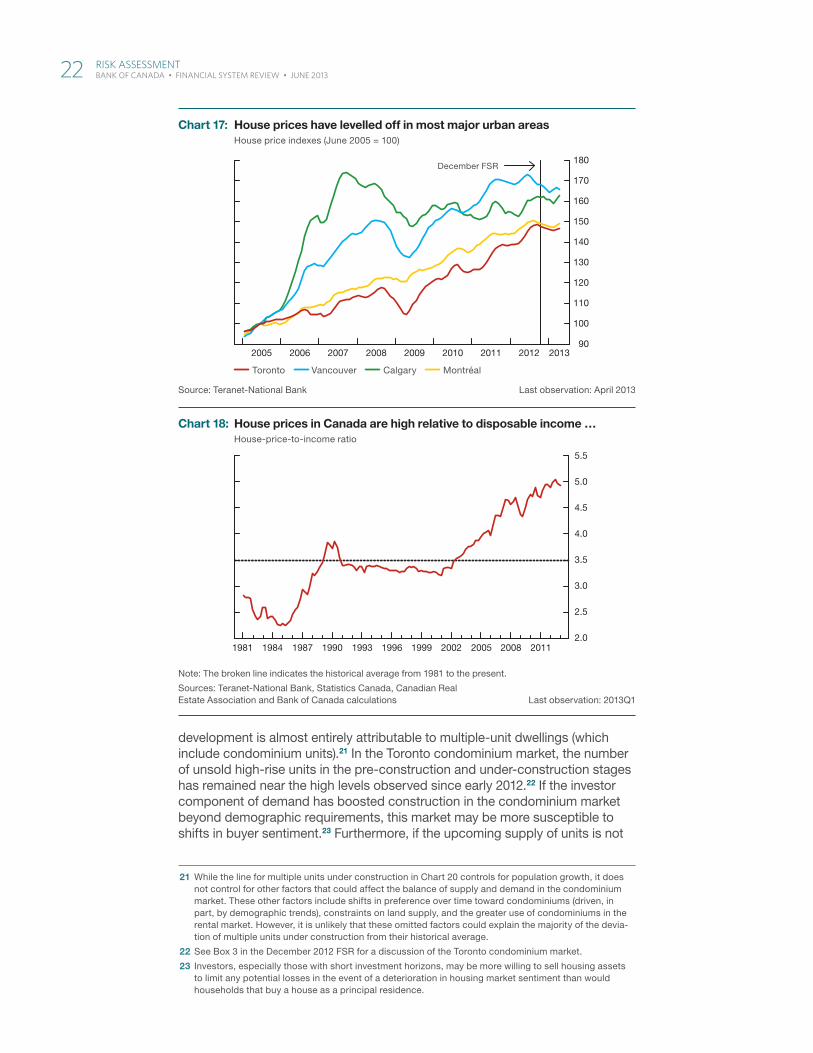
has been sustained, and the moderation has now spread to housing starts (Chart 16). Consistent with the overall slowing in housing market activity, house prices have stopped rising in most major urban markets (Chart 17).
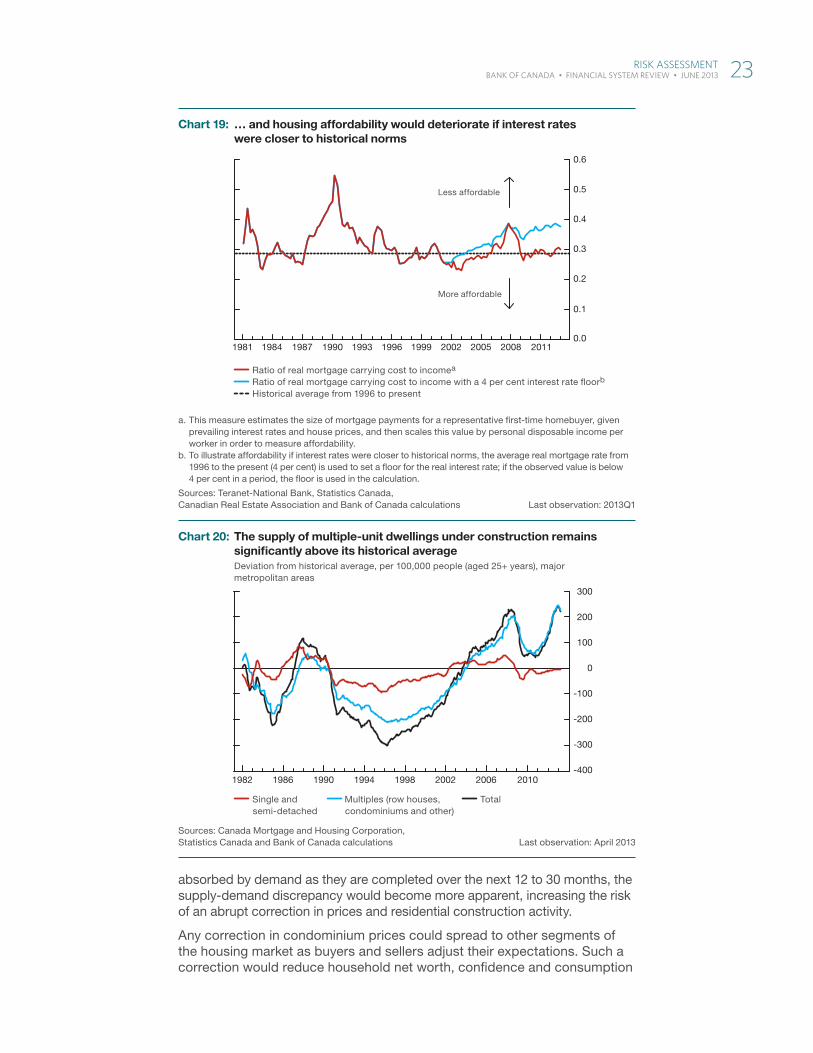
… but imbalances remain in some segments of the marketRecent developments in the housing market have been encouraging and broadly in line with the Bank’s base-case outlook, which calls for a gradual unwinding of imbalances in that sector. Nonetheless, simple indicators con-tinue to suggest some overvaluation in the housing market: house prices are high relative to income (Chart 18), and housing affordability could become a concern when interest rates begin to normalize (Chart 19).
In addition, construction activity remains strong in some segments of the market (despite the slowdown in overall housing demand over the past year), and the total number of housing units under construction remains signifi-cantly above its historical average relative to the population (Chart 20). This
Sources: Statistics Canada and Bank of Canada calculations Last observation: 2013Q1
Total credit-to-GDP gap Household credit-to-GDP gap
Business credit-to-GDP gap
1991 1993 1995 1997 1999 2001 2003 2005 2007 2009 2011 2013-10
-5
0
5
10
15
20
%
2008–09recession
1990–92recession
Chart 15: The household credit-to-GDP gap has moved lowerPercentage deviation from trend
Sources: Canadian Real Estate Association and Canada Mortgage and Housing Corporation Last observation: April 2013
Resale homes (left scale) Housing starts (right scale)
2010 2011 2012 2013100
150
200
250
300
350
400
450
500
550
Thousands of unitsThousands of units
December FSR
Chart 16: Housing starts and resales have slowed since mid-2012
RiSk aSSeSSment 21 BANK OF CANADA • FINANCIAL SyStEM REvIEw • JuNE 2013
development is almost entirely attributable to multiple-unit dwellings (which include condominium units).21 In the Toronto condominium market, the number of unsold high-rise units in the pre-construction and under-construction stages has remained near the high levels observed since early 2012.22 If the investor component of demand has boosted construction in the condominium market beyond demographic requirements, this market may be more susceptible to shifts in buyer sentiment.23 Furthermore, if the upcoming supply of units is not
21 While the line for multiple units under construction in Chart 20 controls for population growth, it does not control for other factors that could affect the balance of supply and demand in the condominium market. These other factors include shifts in preference over time toward condominiums (driven, in part, by demographic trends), constraints on land supply, and the greater use of condominiums in the rental market. However, it is unlikely that these omitted factors could explain the majority of the devia-tion of multiple units under construction from their historical average.
22 See Box 3 in the December 2012 FSR for a discussion of the Toronto condominium market.
23 Investors, especially those with short investment horizons, may be more willing to sell housing assets to limit any potential losses in the event of a deterioration in housing market sentiment than would households that buy a house as a principal residence.
Note: The broken line indicates the historical average from 1981 to the present.
Sources: Teranet-National Bank, Statistics Canada, Canadian Real Estate Association and Bank of Canada calculations Last observation: 2013Q1
1981 1984 1987 1990 1993 1996 1999 2002 2005 2008 20112.0
2.5
3.0
3.5
4.0
4.5
5.0
5.5
Chart 18: House prices in Canada are high relative to disposable income …House-price-to-income ratio
Source: Teranet-National Bank Last observation: April 2013
Toronto Vancouver Calgary Montréal
2005 2006 2007 2008 2009 2010 2011 2012 201390
100
110
120
130
140
150
160
170
180December FSR
Chart 17: House prices have levelled off in most major urban areasHouse price indexes (June 2005 = 100)
22 RiSk aSSeSSment BANK OF CANADA • FINANCIAL SyStEM REvIEw • JuNE 2013
absorbed by demand as they are completed over the next 12 to 30 months, the supply-demand discrepancy would become more apparent, increasing the risk of an abrupt correction in prices and residential construction activity.
Any correction in condominium prices could spread to other segments of the housing market as buyers and sellers adjust their expectations. Such a correction would reduce household net worth, confidence and consumption
a. This measure estimates the size of mortgage payments for a representative fi rst-time homebuyer, given prevailing interest rates and house prices, and then scales this value by personal disposable income per worker in order to measure affordability.
b. To illustrate affordability if interest rates were closer to historical norms, the average real mortgage rate from 1996 to the present (4 per cent) is used to set a fl oor for the real interest rate; if the observed value is below 4 per cent in a period, the fl oor is used in the calculation.
Sources: Teranet-National Bank, Statistics Canada, Canadian Real Estate Association and Bank of Canada calculations Last observation: 2013Q1
Ratio of real mortgage carrying cost to incomea
Ratio of real mortgage carrying cost to income with a 4 per cent interest rate fl oorb
Historical average from 1996 to present
1981 1984 1987 1990 1993 1996 1999 2002 2005 2008 20110.0
0.1
0.2
0.3
0.4
0.5
0.6
Less affordable
More affordable
Chart 19: … and housing affordability would deteriorate if interest rates were closer to historical norms
Sources: Canada Mortgage and Housing Corporation, Statistics Canada and Bank of Canada calculations Last observation: April 2013
Single and semi-detached
Multiples (row houses, condominiums and other)
Total
1982 1986 1990 1994 1998 2002 2006 2010-400
-300
-200
-100
0
100
200
300
Chart 20: The supply of multiple-unit dwellings under construction remains signifi cantly above its historical averageDeviation from historical average, per 100,000 people (aged 25+ years), major metropolitan areas
RiSk aSSeSSment 23 BANK OF CANADA • FINANCIAL SyStEM REvIEw • JuNE 2013
spending, with negative spillovers to income and employment. These adverse effects would weaken the credit quality of banks’ loan portfolios and could lead to tighter lending conditions for households and businesses. This chain of events could then feed back into the housing market, causing the drop in house prices to overshoot.
Microdata on household balance sheets provide further insight into the vulner-ability of some Canadian households to adverse shocks. Summary indicators of vulnerability—such as the percentage of households with a debt-service ratio above 40 per cent—have been relatively stable in recent years. However, this reflects the current low interest rate environment, which keeps debt-service burdens stable despite rising indebtedness.24 When interest rates rise, debt-service ratios for households can be expected to increase, leaving them more vulnerable to an adverse income shock.25
Household loans in arrears would rise markedly under a stress test involving a labour market shockTo illustrate the vulnerability of the Canadian household sector to an adverse shock in the labour market, we conducted a stress test similar to the one presented in the December FSR. The stress scenario includes a 3-percentage-point rise in the unemployment rate and a six-week increase in the average duration of unemployment. Consistent with the assumed deterioration in labour market conditions, the scenario also includes declines in credit growth, income growth and financial asset prices, as well as a 220-basis-point increase in risk premiums for household borrowing.26 The policy rate is held constant to illus-trate what would happen in the absence of mitigating policy action.
The simulation suggests that the share of vulnerable households (as measured by those with a debt-service ratio above 40 per cent) could increase from about 6½ per cent in 2012 to over 8 per cent in 2015. In addi-tion, household loan arrears (a key metric for the health of banks’ balance sheets) could more than double, from about 0.5 per cent at the start of 2013 to 1.2 per cent by the end of 2015 (Chart 21).27 These results are broadly unchanged from the stress test in the December FSR.
Since a number of simplifying assumptions were necessary to conduct the simulation,28 the result indicates a possible outcome only and does not represent a comprehensive assessment of all possible risk channels. Nevertheless, the simulation underscores the need for banks to carefully
24 Consistent with the increase in the aggregate debt-to-income ratio, the incidence of highly indebted households (defined as households with a debt-to-gross-income ratio above 250 per cent) has risen markedly over recent years, from 10.5 per cent in 2009 to 13.5 per cent in 2012.
25 Household exposure to interest rate risk remains elevated. Notwithstanding the sharp increase in the popularity of fixed rates for mortgages originated since the start of 2012, roughly one-third of the current stock of household debt is still financed at variable rates.
26 The assumed profiles for these variables are comparable to those shown in Table 2 of the December 2012 FSR. The unemployment rate rises by 3 percentage points between 2013Q3 and 2014Q3 and stays at this level until the end of the simulation period (2015Q4). The increase in risk premiums leads to higher borrowing costs for new mortgage and consumer loans.
27 Data for the value of loan arrears (including off-balance-sheet arrears) are not available before 1997. However, the number of on-balance-sheet mortgages in arrears—which shows a level and trend similar to the value of mortgage loan arrears and total arrears—is available back to the early 1990s. These data indicate that the number of mortgages in arrears peaked at 0.7 per cent in 1992, compared with 1.2 per cent in our stress-test simulation. Total household loans in arrears in the United States peaked at almost 9 per cent in early 2010.
28 The model used for the stress-test simulation does not account for the possibility that households may use pre-approved limits on personal lines of credit and credit cards to meet their financial needs during a period of unemployment. While accumulating more debt would increase the vulnerability of these households to future shocks, it may nonetheless prevent them from becoming insolvent in the near term. In addition, the model does not allow households to avoid insolvency by selling relatively illiquid assets.
24 RiSk aSSeSSment BANK OF CANADA • FINANCIAL SyStEM REvIEw • JuNE 2013
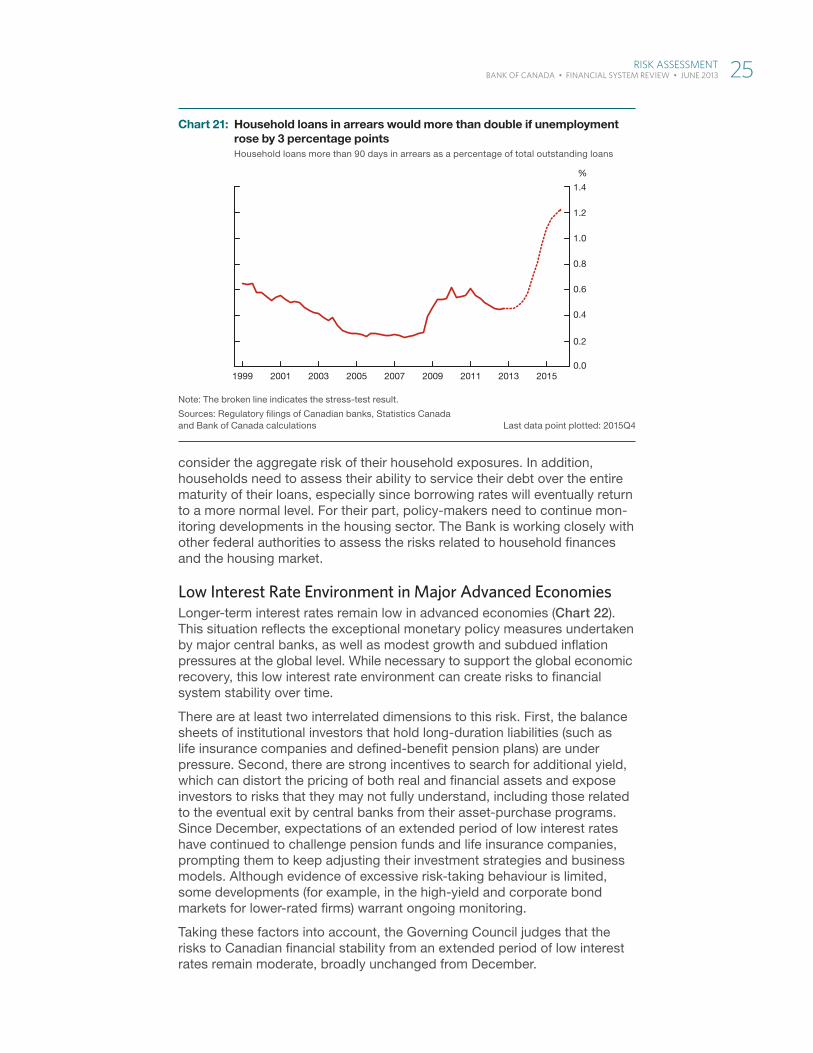
consider the aggregate risk of their household exposures. In addition, households need to assess their ability to service their debt over the entire maturity of their loans, especially since borrowing rates will eventually return to a more normal level. For their part, policy-makers need to continue mon-itoring developments in the housing sector. The Bank is working closely with other federal authorities to assess the risks related to household finances and the housing market.
Low Interest Rate Environment in Major Advanced EconomiesLonger-term interest rates remain low in advanced economies (Chart 22). This situation reflects the exceptional monetary policy measures undertaken by major central banks, as well as modest growth and subdued inflation pressures at the global level. While necessary to support the global economic recovery, this low interest rate environment can create risks to financial system stability over time.
There are at least two interrelated dimensions to this risk. First, the balance sheets of institutional investors that hold long-duration liabilities (such as life insurance companies and defined-benefit pension plans) are under pressure. Second, there are strong incentives to search for additional yield, which can distort the pricing of both real and financial assets and expose investors to risks that they may not fully understand, including those related to the eventual exit by central banks from their asset-purchase programs. Since December, expectations of an extended period of low interest rates have continued to challenge pension funds and life insurance companies, prompting them to keep adjusting their investment strategies and business models. Although evidence of excessive risk-taking behaviour is limited, some developments (for example, in the high-yield and corporate bond markets for lower-rated firms) warrant ongoing monitoring.
Taking these factors into account, the Governing Council judges that the risks to Canadian financial stability from an extended period of low interest rates remain moderate, broadly unchanged from December.
Note: The broken line indicates the stress-test result.
Sources: Regulatory fi lings of Canadian banks, Statistics Canadaand Bank of Canada calculations Last data point plotted: 2015Q4
%
1999 2001 2003 2005 2007 2009 2011 2013 20150.0
0.2
0.4
0.6
0.8
1.0
1.2
1.4
Chart 21: Household loans in arrears would more than double if unemployment rose by 3 percentage pointsHousehold loans more than 90 days in arrears as a percentage of total outstanding loans
RiSk aSSeSSment 25 BANK OF CANADA • FINANCIAL SyStEM REvIEw • JuNE 2013
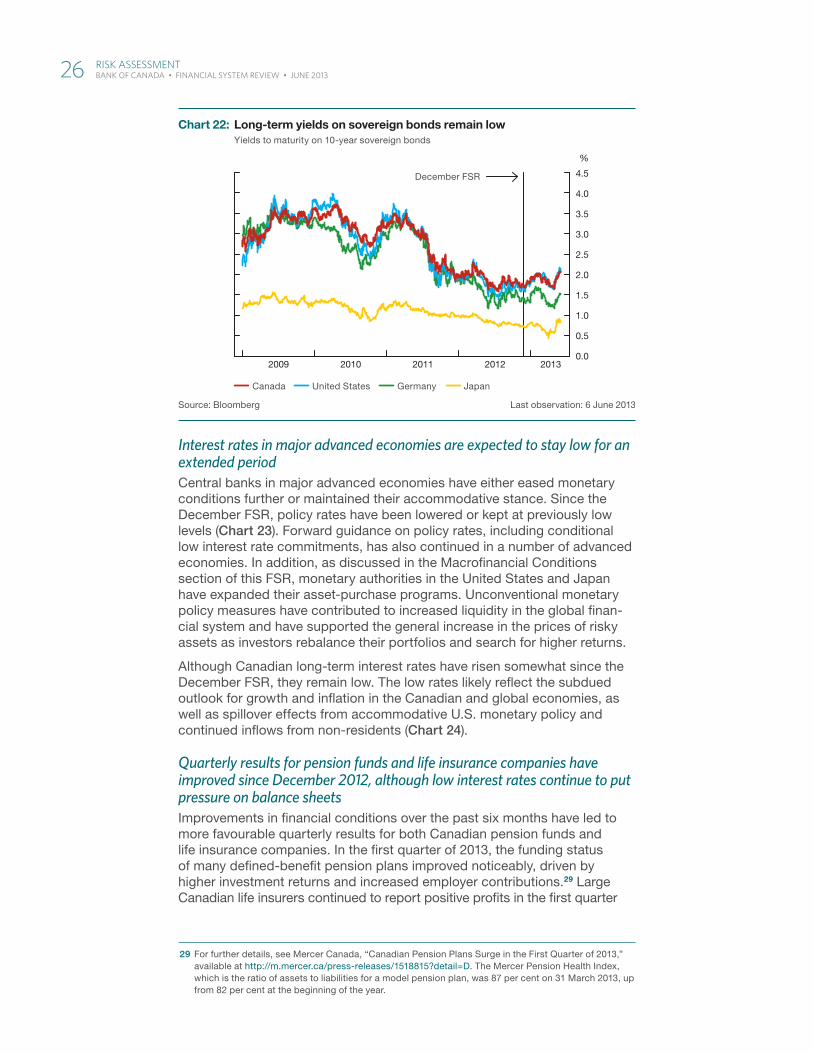
Interest rates in major advanced economies are expected to stay low for an extended periodCentral banks in major advanced economies have either eased monetary conditions further or maintained their accommodative stance. Since the December FSR, policy rates have been lowered or kept at previously low levels (Chart 23). Forward guidance on policy rates, including conditional low interest rate commitments, has also continued in a number of advanced economies. In addition, as discussed in the Macrofinancial Conditions section of this FSR, monetary authorities in the United States and Japan have expanded their asset-purchase programs. Unconventional monetary policy measures have contributed to increased liquidity in the global finan-cial system and have supported the general increase in the prices of risky assets as investors rebalance their portfolios and search for higher returns.
Although Canadian long-term interest rates have risen somewhat since the December FSR, they remain low. The low rates likely reflect the subdued outlook for growth and inflation in the Canadian and global economies, as well as spillover effects from accommodative U.S. monetary policy and continued inflows from non-residents (Chart 24).
Quarterly results for pension funds and life insurance companies have improved since December 2012, although low interest rates continue to put pressure on balance sheetsImprovements in financial conditions over the past six months have led to more favourable quarterly results for both Canadian pension funds and life insurance companies. In the first quarter of 2013, the funding status of many defined-benefit pension plans improved noticeably, driven by higher investment returns and increased employer contributions.29 Large Canadian life insurers continued to report positive profits in the first quarter
29 For further details, see Mercer Canada, “Canadian Pension Plans Surge in the First Quarter of 2013,” available at http://m.mercer.ca/press-releases/1518815?detail=D. The Mercer Pension Health Index, which is the ratio of assets to liabilities for a model pension plan, was 87 per cent on 31 March 2013, up from 82 per cent at the beginning of the year.
File information (for internal use only): Sovereign Bonds.indd
Last output: 01:23:31 PM; Jun 12, 2013
Source: Bloomberg Last observation: 6 June 2013
Canada United States Germany Japan
2009 2010 2011 2012 2013
%
0.0
0.5
1.0
1.5
2.0
2.5
3.0
3.5
4.0
4.5December FSR
Chart 22: Long-term yields on sovereign bonds remain lowYields to maturity on 10-year sovereign bonds
26 RiSk aSSeSSment BANK OF CANADA • FINANCIAL SyStEM REvIEw • JuNE 2013
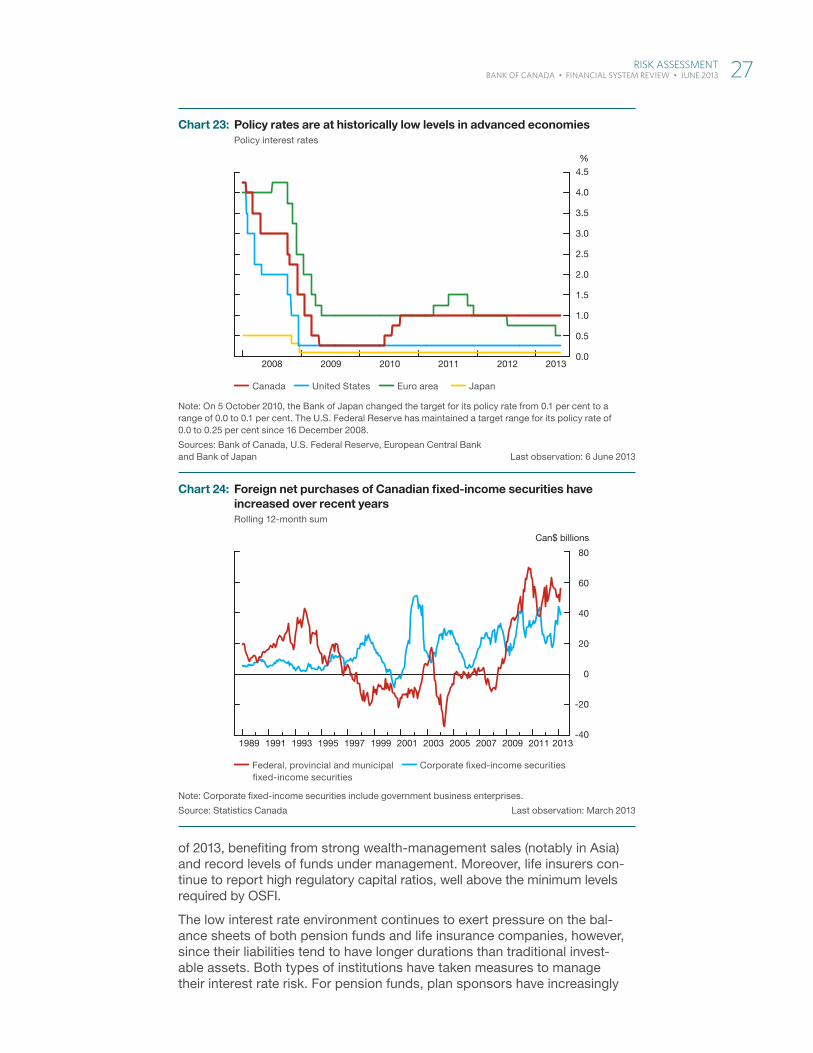
of 2013, benefiting from strong wealth-management sales (notably in Asia) and record levels of funds under management. Moreover, life insurers con-tinue to report high regulatory capital ratios, well above the minimum levels required by OSFI.
The low interest rate environment continues to exert pressure on the bal-ance sheets of both pension funds and life insurance companies, however, since their liabilities tend to have longer durations than traditional invest-able assets. Both types of institutions have taken measures to manage their interest rate risk. For pension funds, plan sponsors have increasingly
File information (for internal use only): Policy Rates EN.indd
Last output: 01:24:08 PM; Jun 12, 2013
Note: On 5 October 2010, the Bank of Japan changed the target for its policy rate from 0.1 per cent to a range of 0.0 to 0.1 per cent. The U.S. Federal Reserve has maintained a target range for its policy rate of 0.0 to 0.25 per cent since 16 December 2008.
Sources: Bank of Canada, U.S. Federal Reserve, European Central Bank and Bank of Japan Last observation: 6 June 2013
Canada United States Euro area Japan
2008 2009 2010 2011 2012 2013
%
0.0
0.5
1.0
1.5
2.0
2.5
3.0
3.5
4.0
4.5
Chart 23: Policy rates are at historically low levels in advanced economiesPolicy interest rates
Units of measure (top of axis):
Verifi ed vs. supplied data, cross-referenced w/ prior artwork
Left alt scale, if applicable
Aligned to outer edgeof axis labels, rag inward towards chart
Chart axes:
Tick marks (major and, if necessary, minor)
“Bookend” tick marks at ends of bottom axis (left/right)
Bottom axis labels placed & verifi ed
Chart bottom region:
Legend items placed and styled
Order verifi ed vs prior artwork
All superscripts, special symbols, etc. as required
Chart footer:
Note(s):
Source(s):
Last observation: (if applicable)
Data presentation styles:
Line styles & stacking order:
Canada/1st
US/2nd
Euro zone/3rd
Japan/4th
UK/5th
Canada/1st (projected)
US/2nd (proj’d)
Euro zone/3rd (proj’d)
Japan/4th (proj’d)
UK/5th (proj’d)
All axis lines & ticks
Fill styles & stacking order:
Canada/1st
US/2nd
Euro zone/3rd
Japan/4th UK/5th projected
Canada/1st (projected)
US/2nd (proj’d)
Euro zone/3rd (proj’d)
Japan/4th (proj’d)
UK/5th (proj’d)
Control range
Axis lines & ticks
Additional common styles:
dot black
red line plus dot in-chart label
Chart 24: Title+ 2nd line
Sub-title
Correct overall chart width, axis-to-axis
No extra white space between bottom green line & page edge
SPA
CE
SPA
CE
...... ...t-1 t+1 t+2 t+3 t+4 t+5 t+6 t+7 t+8 t+9 t+10 t+11t-2t-3t-4t-5t-6t-7 0
2009Q1various
alignment
options
Q1 Q1 Q1 Q1Q2 Q2 Q2 Q2 Q2Q3 Q3 Q3 Q3 Q3Q4 Q4 Q4 Q4 Q42010 2011 ...
Chart axes (continued):
Range labels centered BETWEEN marks, and/or
Point labels centered ON marks
File information (for internal use only): Foreign Net Purchases EN.indd
Last output: 02:11:22 PM; Jun 07, 2013
Note: Corporate fi xed-income securities include government business enterprises.
Source: Statistics Canada Last observation: March 2013
Federal, provincial and municipal fi xed-income securities
Corporate fi xed-income securities
-40
-20
0
20
40
60
80
1989 1991 1993 1995 1997 1999 2001 2003 2005 2007 2009 2011 2013
Can$ billions
Chart 24: Foreign net purchases of Canadian fi xed-income securities have increased over recent yearsRolling 12-month sum
RiSk aSSeSSment 27 BANK OF CANADA • FINANCIAL SyStEM REvIEw • JuNE 2013
adopted liability-driven investment (LDI) strategies to mitigate the impact of changes in interest rates on the funding status of their plans.30 Some of the larger Canadian pension plans are also using leverage to increase invest-ment returns and limit the possible impact of interest rate risk. Life insur-ance companies, meanwhile, have been rebalancing their business models by repricing some products, exiting others and implementing extensive hedging programs.31
While effective in mitigating interest rate risk, some of the strategies pursued by pension funds and life insurance companies can increase other types of risk. For example, leveraged LDI strategies can expose pension plans to refinancing and counterparty risk. Anecdotal information suggests that there has not been a noticeable rise in the use of leveraged LDI strategies by pension funds over the past six months.
Investor risk tolerance has increased since DecemberThe ongoing low interest rate environment creates incentives for increased risk taking as reflected, in part, by tighter spreads in the U.S. corporate bond market. Current strong valuations in this market are supported by solid corporate balance sheets32 and low default rates. Most of the recent bond issuance has refinanced existing debt at lower rates, which improves the issuers’ risk profile. Risk associated with refinancing has also decreased, since new bond issuance has generally been for longer maturities.
A prolonged period of low interest rates may, however, lead to a deteriora-tion in credit standards. The issuance of covenant-lite loans33 in the United States has risen significantly over the past six months, although anecdotal evidence suggests that covenants generally remain more restrictive and loan spreads are higher than before the crisis. In addition, recent issuances of pay-in-kind bonds34 and the elevated leveraged buyout activity in the first quarter of 2013 suggest that the use of leverage has risen.35 Default risks can also be underestimated in a low interest rate environment. By reducing debt-service costs, low rates may disguise underlying weakness in credit quality and keep some highly leveraged borrowers afloat. Prolonged periods of low rates can also encourage forbearance by banks, which may artificially depress default rates.
30 These strategies typically involve increasing the average duration of the fund’s portfolio by allocating more of the fund’s assets to longer-term fixed-income securities.
31 Under Canadian accounting and actuarial standards, Canadian insurers have had to respond to low interest rates much sooner than many foreign insurers. This means that the low interest rate environment is affecting the current earnings for Canadian insurers more than those of their international peers (especially those in the United States). As a result, Canadian institutions have responded more quickly than their foreign peers to adjust their business models and strategies to the low interest rate environment.
32 For example, the cash-to-debt ratio for a typical U.S. high-yield company is approximately 12 per cent, which is close to its all-time high of 14 per cent in late 2010 and early 2011, and is well above its low of 7 per cent prior to the financial crisis.
33 Covenants refer to the contractual obligations in a loan agreement that set out specific standards of future conduct and performance for the borrower. These include adherence to a maximum leverage ratio, and minimum interest and fixed-charge coverage ratios over the term of the loan. Covenant-lite loans are loans in which some of the traditional covenants are not included in the loan agreement.
34 A pay-in-kind bond pays interest in the form of additional bonds rather than in cash. These additional bonds normally do not make cash payments until the pay-in-kind bond has matured.
35 The value of announced leveraged buyouts in 2013Q1 was approximately US$50 billion, which repre-sents a post-2007 quarterly high.
28 RiSk aSSeSSment BANK OF CANADA • FINANCIAL SyStEM REvIEw • JuNE 2013
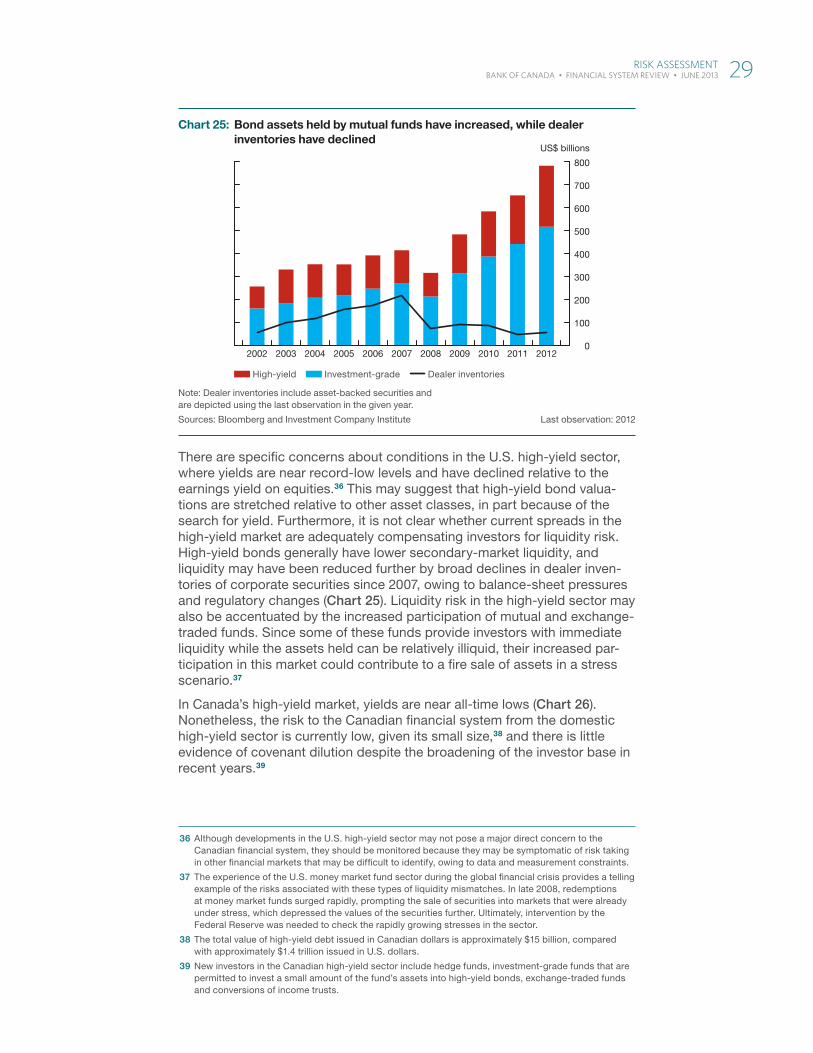
There are specific concerns about conditions in the U.S. high-yield sector, where yields are near record-low levels and have declined relative to the earnings yield on equities.36 This may suggest that high-yield bond valua-tions are stretched relative to other asset classes, in part because of the search for yield. Furthermore, it is not clear whether current spreads in the high-yield market are adequately compensating investors for liquidity risk. High-yield bonds generally have lower secondary-market liquidity, and liquidity may have been reduced further by broad declines in dealer inven-tories of corporate securities since 2007, owing to balance-sheet pressures and regulatory changes (Chart 25). Liquidity risk in the high-yield sector may also be accentuated by the increased participation of mutual and exchange-traded funds. Since some of these funds provide investors with immediate liquidity while the assets held can be relatively illiquid, their increased par-ticipation in this market could contribute to a fire sale of assets in a stress scenario.37
In Canada’s high-yield market, yields are near all-time lows (Chart 26). Nonetheless, the risk to the Canadian financial system from the domestic high-yield sector is currently low, given its small size,38 and there is little evidence of covenant dilution despite the broadening of the investor base in recent years.39
36 Although developments in the U.S. high-yield sector may not pose a major direct concern to the Canadian financial system, they should be monitored because they may be symptomatic of risk taking in other financial markets that may be difficult to identify, owing to data and measurement constraints.
37 The experience of the U.S. money market fund sector during the global financial crisis provides a telling example of the risks associated with these types of liquidity mismatches. In late 2008, redemptions at money market funds surged rapidly, prompting the sale of securities into markets that were already under stress, which depressed the values of the securities further. Ultimately, intervention by the Federal Reserve was needed to check the rapidly growing stresses in the sector.
38 The total value of high-yield debt issued in Canadian dollars is approximately $15 billion, compared with approximately $1.4 trillion issued in U.S. dollars.
39 New investors in the Canadian high-yield sector include hedge funds, investment-grade funds that are permitted to invest a small amount of the fund’s assets into high-yield bonds, exchange-traded funds and conversions of income trusts.
Units of measure (top of axis):
Verifi ed vs. supplied data, cross-referenced w/ prior artwork
Left alt scale, if applicable
Aligned to outer edgeof axis labels, rag inward towards chart
Chart axes:
Tick marks (major and, if necessary, minor)
“Bookend” tick marks at ends of bottom axis (left/right)
Bottom axis labels placed & verifi ed
Chart bottom region:
Legend items placed and styled
Order verifi ed vs prior artwork
All superscripts, special symbols, etc. as required
Chart footer:
Note(s):
Source(s):
Last observation: (if applicable)
Data presentation styles:
Line styles & stacking order:
Canada/1st
US/2nd
Euro zone/3rd
Japan/4th
UK/5th
Canada/1st (projected)
US/2nd (proj’d)
Euro zone/3rd (proj’d)
Japan/4th (proj’d)
UK/5th (proj’d)
All axis lines & ticks
Fill styles & stacking order:
Canada/1st
US/2nd
Euro zone/3rd
Japan/4th UK/5th projected
Canada/1st (projected)
US/2nd (proj’d)
Euro zone/3rd (proj’d)
Japan/4th (proj’d)
UK/5th (proj’d)
Control range
Axis lines & ticks
Additional common styles:
dot black
red line plus dot in-chart label
Chart 25: Title+ 2nd line
Sub-title
Correct overall chart width, axis-to-axis
No extra white space between bottom green line & page edge
SPA
CE
SPA
CE
...... ...t-1 t+1 t+2 t+3 t+4 t+5 t+6 t+7 t+8 t+9 t+10 t+11t-2t-3t-4t-5t-6t-7 0
2009Q1various
alignment
options
Q1 Q1 Q1 Q1Q2 Q2 Q2 Q2 Q2Q3 Q3 Q3 Q3 Q3Q4 Q4 Q4 Q4 Q42010 2011 ...
Chart axes (continued):
Range labels centered BETWEEN marks, and/or
Point labels centered ON marks
File information (for internal use only): Bond Assets EN.indd
Last output: 02:06:52 PM; Jun 06, 2013
Note: Dealer inventories include asset-backed securities and are depicted using the last observation in the given year.
Sources: Bloomberg and Investment Company Institute Last observation: 2012
High-yield Investment-grade Dealer inventories
2002 2003 2004 2005 2006 2007 2008 2009 2010 2011 20120
100
200
300
400
500
600
700
800
US$ billions
Chart 25: Bond assets held by mutual funds have increased, while dealer inventories have declined
RiSk aSSeSSment 29 BANK OF CANADA • FINANCIAL SyStEM REvIEw • JuNE 2013
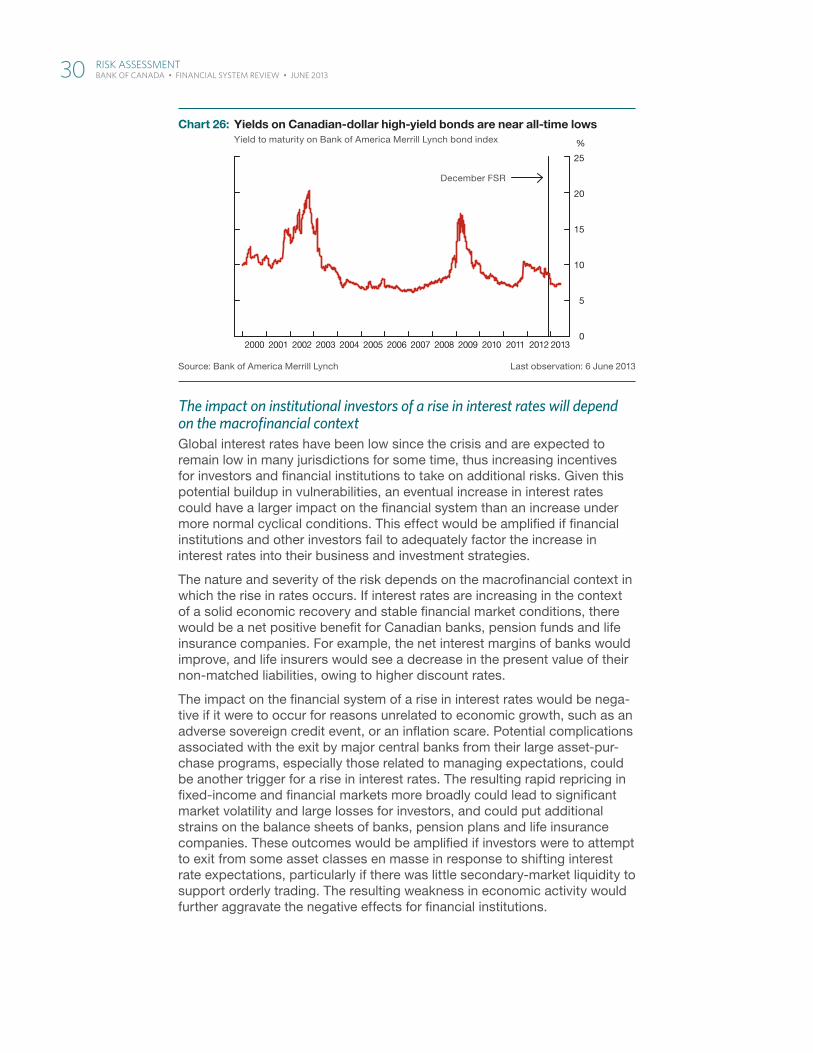
The impact on institutional investors of a rise in interest rates will depend on the macrofinancial contextGlobal interest rates have been low since the crisis and are expected to remain low in many jurisdictions for some time, thus increasing incentives for investors and financial institutions to take on additional risks. Given this potential buildup in vulnerabilities, an eventual increase in interest rates could have a larger impact on the financial system than an increase under more normal cyclical conditions. This effect would be amplified if financial institutions and other investors fail to adequately factor the increase in interest rates into their business and investment strategies.
The nature and severity of the risk depends on the macrofinancial context in which the rise in rates occurs. If interest rates are increasing in the context of a solid economic recovery and stable financial market conditions, there would be a net positive benefit for Canadian banks, pension funds and life insurance companies. For example, the net interest margins of banks would improve, and life insurers would see a decrease in the present value of their non-matched liabilities, owing to higher discount rates.
The impact on the financial system of a rise in interest rates would be nega-tive if it were to occur for reasons unrelated to economic growth, such as an adverse sovereign credit event, or an inflation scare. Potential complications associated with the exit by major central banks from their large asset-pur-chase programs, especially those related to managing expectations, could be another trigger for a rise in interest rates. The resulting rapid repricing in fixed-income and financial markets more broadly could lead to significant market volatility and large losses for investors, and could put additional strains on the balance sheets of banks, pension plans and life insurance companies. These outcomes would be amplified if investors were to attempt to exit from some asset classes en masse in response to shifting interest rate expectations, particularly if there was little secondary-market liquidity to support orderly trading. The resulting weakness in economic activity would further aggravate the negative effects for financial institutions.
Units of measure (top of axis):
Verifi ed vs. supplied data, cross-referenced w/ prior artwork
Left alt scale, if applicable
Aligned to outer edgeof axis labels, rag inward towards chart
Chart axes:
Tick marks (major and, if necessary, minor)
“Bookend” tick marks at ends of bottom axis (left/right)
Bottom axis labels placed & verifi ed
Chart bottom region:
Legend items placed and styled
Order verifi ed vs prior artwork
All superscripts, special symbols, etc. as required
Chart footer:
Note(s):
Source(s):
Last observation: (if applicable)
Data presentation styles:
Line styles & stacking order:
Canada/1st
US/2nd
Euro zone/3rd
Japan/4th
UK/5th
Canada/1st (projected)
US/2nd (proj’d)
Euro zone/3rd (proj’d)
Japan/4th (proj’d)
UK/5th (proj’d)
All axis lines & ticks
Fill styles & stacking order:
Canada/1st
US/2nd
Euro zone/3rd
Japan/4th UK/5th projected
Canada/1st (projected)
US/2nd (proj’d)
Euro zone/3rd (proj’d)
Japan/4th (proj’d)
UK/5th (proj’d)
Control range
Axis lines & ticks
Additional common styles:
dot black
red line plus dot in-chart label
Chart 26: Title+ 2nd line
Sub-title
Correct overall chart width, axis-to-axis
No extra white space between bottom green line & page edge
SPA
CE
SPA
CE
...... ...t-1 t+1 t+2 t+3 t+4 t+5 t+6 t+7 t+8 t+9 t+10 t+11t-2t-3t-4t-5t-6t-7 0
2009Q1various
alignment
options
Q1 Q1 Q1 Q1Q2 Q2 Q2 Q2 Q2Q3 Q3 Q3 Q3 Q3Q4 Q4 Q4 Q4 Q42010 2011 ...
Chart axes (continued):
Range labels centered BETWEEN marks, and/or
Point labels centered ON marks
File information (for internal use only): Canadian Dollar EN.indd
Last output: 02:14:53 PM; Jun 07, 2013
Source: Bank of America Merrill Lynch Last observation: 6 June 2013
2000 2001 2002 2003 2004 2005 2006 2007 2008 2009 2010 2011 2012 20130
5
10
15
20
25
%
December FSR
Chart 26: Yields on Canadian-dollar high-yield bonds are near all-time lowsYield to maturity on Bank of America Merrill Lynch bond index
30 RiSk aSSeSSment BANK OF CANADA • FINANCIAL SyStEM REvIEw • JuNE 2013
Safeguarding Financial StabilityThe key risks to Canada’s financial system arise from a combination of the stresses in the euro area, deficient global demand, the vulnerability of Canadian households and financial institutions to adverse housing and labour market shocks, and the potential effects of low interest rates on risk-taking behaviour in the major economies. Over the past six months, there have been some positive developments with respect to strains in the euro area and imbalances in the Canadian household sector. While the overall level of risk to Canada’s financial system has decreased somewhat relative to the December FSR, the Governing Council judges that it remains high.
A number of policy actions would help to further mitigate these key risks. In the euro area, a comprehensive, clear and credible policy framework is needed to ensure the full implementation of the banking union within the common currency area. This would involve timely implementation of current plans for a single banking supervisor and supplementing it with a common deposit insur-ance system and an effective cross-border regime for bank resolution. Further structural and product market reforms would be required in both debtor and creditor euro-area countries for competitiveness gaps to continue narrowing, including measures to enhance labour market flexibility and mobility. Additional work is also necessary to deal with issues related to fiscal oversight and mutualization of the costs of the financial crisis. It would be imprudent to use the easing in sovereign funding stresses over the past six months as a reason for delaying or diluting the needed reforms in the euro area.
In the United States and Japan, credible plans are required to address medium-term fiscal challenges. In China, continued reform of the financial sector and greater flexibility in nominal exchange rates are necessary to help foster sustainable and balanced global economic growth.
For monetary authorities in advanced economies, managing the timing and manner of the eventual unwinding of the extraordinary monetary stimulus and liquidity in their financial systems will be an important challenge. Effective communication of their eventual exit strategies will be essential to minimize any unintended consequences for the global financial system. In particular, expectations will need to be carefully managed leading up to and during the exit process.
In Canada, imbalances in the household sector, which built up over many years, will take some time to correct and require continued vigilance. Since the December FSR, OSFI’s mortgage underwriting guidelines (announced in June 2012) have been fully implemented by all federally regulated financial institutions. This will further improve the risk-management practices at banks and strengthen the resilience of Canada’s mortgage market. In its 2013 budget, the Government of Canada announced changes to limit the use of portfolio insurance40 and prohibit the use of any government-backed insured mortgages as collateral in securitization vehicles that are not spon-sored by Canada Mortgage and Housing Corporation.41 These measures will increase market discipline in residential lending and reduce taxpayer exposure to the housing sector.
To further mitigate risks, households should ensure that their borrowing and the resulting debt costs can be serviced by their disposable income, even during a period of rising interest rates. Financial institutions must ensure that they have rigorous lending practices in place and are actively monitoring
40 This refers to the purchase of insurance by financial institutions on portfolios of low-ratio mortgages.
41 Details are available at http://www.budget.gc.ca/2013/doc/bb/brief-bref-eng.html.
RiSk aSSeSSment 31 BANK OF CANADA • FINANCIAL SyStEM REvIEw • JuNE 2013
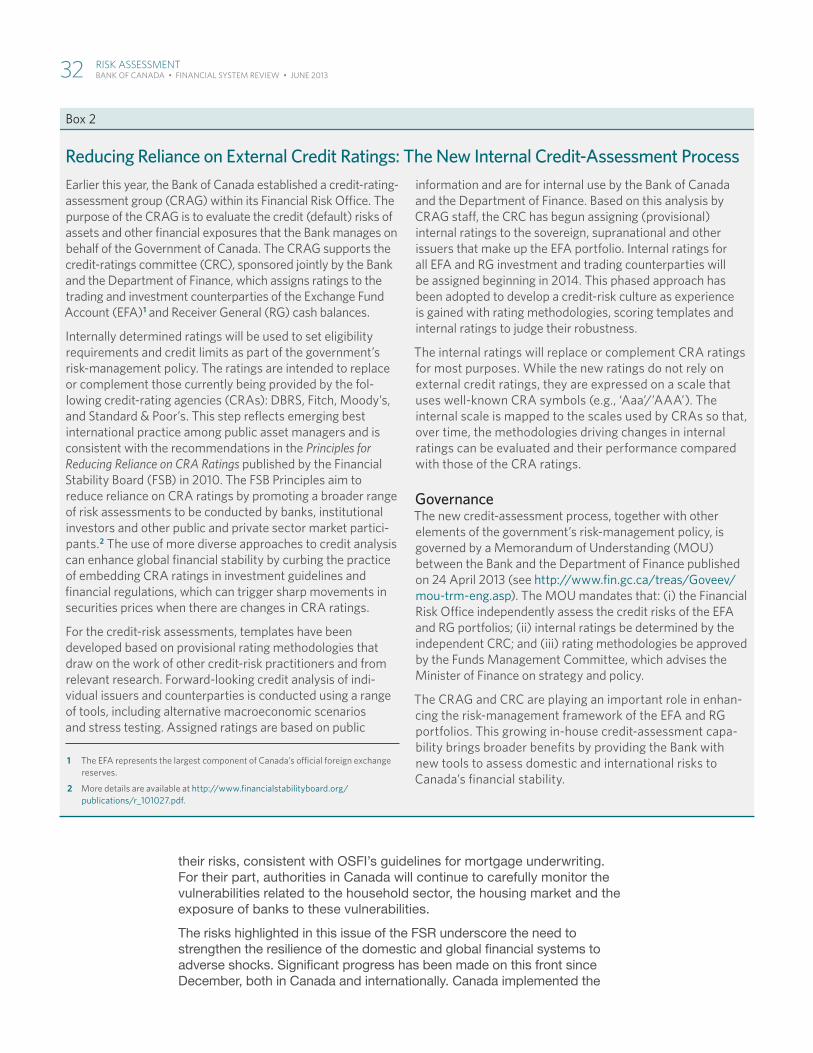
their risks, consistent with OSFI’s guidelines for mortgage underwriting. For their part, authorities in Canada will continue to carefully monitor the vulnerabilities related to the household sector, the housing market and the exposure of banks to these vulnerabilities.
The risks highlighted in this issue of the FSR underscore the need to strengthen the resilience of the domestic and global financial systems to adverse shocks. Significant progress has been made on this front since December, both in Canada and internationally. Canada implemented the
Box 2
Reducing Reliance on External Credit Ratings: The New Internal Credit-Assessment ProcessEarlier this year, the Bank of Canada established a credit -rating-assessment group (CRAG) within its Financial Risk Offi ce . the purpose of the CRAG is to evaluate the credit (default) risks of assets and other fi nancial exposures that the Bank manages on behalf of the Government of Canada . the CRAG supports the credit-ratings committee (CRC), sponsored jointly by the Bank and the Department of Finance, which assigns ratings to the trading and investment counterparties of the Exchange Fund Account (EFA)1 and Receiver General (RG) cash balances .
Internally determined ratings will be used to set eligibility requirements and credit limits as part of the government’s risk-management policy . the ratings are intended to replace or complement those currently being provided by the fol-lowing credit-rating agencies (CRAs): DBRS, Fitch, Moody’s, and Standard & Poor’s . this step refl ects emerging best international practice among public asset managers and is consistent with the recommendations in the Principles for Reducing Reliance on CRA Ratings published by the Financial Stability Board (FSB) in 2010 . the FSB Principles aim to reduce reliance on CRA ratings by promoting a broader range of risk assessments to be conducted by banks, institutional investors and other public and private sector market partici-pants .2 the use of more diverse approaches to credit analysis can enhance global fi nancial stability by curbing the practice of embedding CRA ratings in investment guidelines and fi nancial regulations, which can trigger sharp movements in securities prices when there are changes in CRA ratings .
For the credit-risk assessments, templates have been developed based on provisional rating methodologies that draw on the work of other credit-risk practitioners and from relevant research . Forward-looking credit analysis of indi-vidual issuers and counterparties is conducted using a range of tools, including alternative macroeconomic scenarios and stress testing . Assigned ratings are based on public
1 the EFA represents the largest component of Canada’s offi cial foreign exchange reserves .
2 More details are available at http://www .fi nancialstabilityboard .org/publications/r_101027 .pdf .
information and are for internal use by the Bank of Canada and the Department of Finance . Based on this analysis by CRAG staff , the CRC has begun assigning (provisional) internal ratings to the sovereign, supranational and other issuers that make up the EFA portfolio . Internal ratings for all EFA and RG investment and trading counterparties will be assigned beginning in 2014 . this phased approach has been adopted to develop a credit-risk culture as experience is gained with rating methodologies, scoring templates and internal ratings to judge their robustness .
the internal ratings will replace or complement CRA ratings for most purposes . while the new ratings do not rely on external credit ratings, they are expressed on a scale that uses well-known CRA symbols (e .g ., ‘Aaa’/’AAA’) . the internal scale is mapped to the scales used by CRAs so that, over time, the methodologies driving changes in internal ratings can be evaluated and their performance compared with those of the CRA ratings .
Governancethe new credit-assessment process, together with other elements of the government’s risk-management policy, is governed by a Memorandum of understanding (MOu) between the Bank and the Department of Finance published on 24 April 2013 (see http://www .fin .gc .ca/treas/Goveev/mou-trm-eng .asp) . the MOu mandates that: (i) the Financial Risk Offi ce independently assess the credit risks of the EFA and RG portfolios; (ii) internal ratings be determined by the independent CRC; and (iii) rating methodologies be approved by the Funds Management Committee, which advises the Minister of Finance on strategy and policy .
the CRAG and CRC are playing an important role in enhan-cing the risk-management framework of the EFA and RG portfolios . this growing in-house credit-assessment capa-bility brings broader benefi ts by providing the Bank with new tools to assess domestic and international risks to Canada’s fi nancial stability .
32 RiSk aSSeSSment BANK OF CANADA • FINANCIAL SyStEM REvIEw • JuNE 2013
Basel III capital rules at the start of 2013 (the beginning of the internationally agreed-upon phase-in period that extends to 2019), and Canadian banks are now publicly reporting capital ratios based on the new rules. In March, OSFI published a list of six federally regulated systemically important banks42 and established a 1 per cent common equity surcharge for these banks. They are expected to meet this additional capital requirement by no later than 1 January 2016. The 2013 federal budget also announced plans to implement a comprehensive risk-management framework for domestic systemically important institutions that will include higher capital requirements, enhanced supervision and recovery and resolution plans, additional disclosure require-ments, and a “bail-in” regime under which losses would be borne by creditors before any public support is provided, in the event that a bank fails. In Quebec, the Autorité des marchés financiers designated Desjardins Group as a systemically important provincially regulated institution.
The Government of Canada has also started reducing its reliance on external credit ratings, as agreed by the G-20 leaders in 2010. In particular, the Bank has set up a new credit-assessment group to support a joint Bank of Canada/Department of Finance credit-ratings committee. The new group will evaluate the credit risk of assets that the Bank manages on behalf of the Government of Canada (Box 2).
A central counterparty (CCP) for the Canadian repo market was put in place in 2012 to enhance the resilience of this core funding market. Since the December FSR, the clearing services provided by the CCP have expanded to include blind repos and cash trades.43 Meanwhile, the Bank of Canada is continuing to implement new international risk-management standards for its oversight of systemically important financial market infrastructure. There has also been further progress in Canada with respect to the G-20 leaders’ com-mitment that all standardized over-the-counter derivatives are to be cleared through CCPs. Canadian institutions have steadily moved their interest rate derivatives transactions to LCH.Clearnet’s SwapClear service, located in London. In April, SwapClear, which is the largest global CCP for the interest rate derivatives market, was designated as being systemically important for the Canadian financial system and is now subject to Bank of Canada over-sight. The Bank carries out this function through multilateral arrangements for oversight co-operation. The co-operative oversight of SwapClear will allow for effective control of systemic risk within this critical market, thereby improving the resilience of the Canadian financial system.
At the international level, the BCBS published revisions to the Liquidity Coverage Ratio that strengthen minimum standards for the funding liquidity of banks. These standards are outlined in a report in this issue on page 37. The BCBS and IOSCO have also published a near-final policy framework for margin requirements for over-the-counter derivatives transactions that are not centrally cleared. Finally, the FSB is working toward a set of integrated recommendations for strengthening the regulation and oversight of shadow banking.44 These recommendations will be released in the autumn of 2013.
Notwithstanding this progress, much remains to be done. Policy-makers need to ensure full, timely and consistent implementation of agreed global standards as the implementation of financial sector reforms has been
42 These are: the Bank of Montreal, Bank of Nova Scotia, Canadian Imperial Bank of Commerce, National Bank of Canada, Royal Bank of Canada, and Toronto-Dominion Bank.
43 More details on the fixed-income CCP and the various phases associated with its development are provided in the report, “Reducing Systemic Risk: Canada’s New Central Counterparty for the Fixed-Income Market,” in the June 2012 FSR, pp. 43−49.
44 A report on page 55 in this issue of the FSR discusses the shadow banking sector in Canada.
RiSk aSSeSSment 33 BANK OF CANADA • FINANCIAL SyStEM REvIEw • JuNE 2013

somewhat uneven across countries. Currently, only 14 of 27 BCBS jurisdic-tions have issued final Basel III regulations. Also, as part of its Regulatory Consistency Assessment Programme, the BCBS published a study (in January 2013) that found considerable variation in the methods used by global banks to measure risk-weighted assets in their trading books. Because these differences can undermine the credibility of reported bank capital ratios, the BCBS is following up on its findings and is expected to report on policy options in July. Finally, the FSB’s peer review report on resolution regimes (April 2013) shows that further work is needed to put legislation in place and provide authorities with powers to allow for the orderly resolution of systemically important financial institutions.
34 RiSk aSSeSSment BANK OF CANADA • FINANCIAL SyStEM REvIEw • JuNE 2013
ReportsReports examine selected issues of relevance to the financial system.
IntroductionThis section of the Financial System Review features three reports on topics related to the financial system: new international standards for strengthening liquidity-risk management by banks; the impact of regulatory changes on the market for collateral; and areas of the Canadian shadow banking sector that require monitoring because of their potential to pose systemic risk.
In The Basel III Liquidity Standards: An Update, Tamara Gomes and Carolyn Wilkins describe the most recent changes to the Basel III Liquidity Coverage Ratio, explaining the motivation for the changes and how they will strengthen banks’ liquidity-risk-management practices. The authors also provide an update on ongoing work to finalize the design of the Net Stable Funding Ratio, focusing on important considerations to achieve the objective of more-stable funding for banks.
In the report The Market for Collateral: The Potential Impact of Financial Regulation, Jorge Cruz Lopez, Royce Mendes and Harri Vikstedt analyze cyclical and structural changes affecting the market for collateral globally and in Canada. The report focuses primarily on the effects of over-the-counter derivatives reforms and Basel III liquidity regulations on the demand for collateral assets. The authors conclude that the increased demand for collateral is manageable, given the scope for an efficient allocation of col-lateral based on market-pricing mechanisms, the current and expected future supply of high-quality assets, the multi-year time frame over which regulations will be implemented, and the ability of regulators and market participants to expand collateral eligibility criteria on a risk-adjusted basis or to provide prudent collateral transformation services.
Monitoring and Assessing Risks in Canada’s Shadow Banking Sector by Toni Gravelle, Timothy Grieder and Stéphane Lavoie describes the structure and evolution of the main activities of this sector and identifies potential areas of systemic risk. The authors find that, overall, the Canadian shadow banking sector is smaller relative to both the traditional banking sector and the Canadian economy than its U.S. counterpart. In addition, the composition of the sector is fairly conservative, with a large portion of activities conducted by or involving regulated entities and backed by an explicit government guarantee. Nonetheless, the report identifies areas that warrant focused monitoring, including the strong growth in the securitization of insured mort-gages by specialized mortgage lenders, the increasing use of repos by some pension funds to obtain leverage and the funding of longer-term assets such as residential mortgages with the issuance of short-term asset-backed com-mercial paper.
RePORtS 35 BANK OF CANADA • FINANCIAL SyStEM REvIEw • JuNE 2013

the Basel iii Liquidity Standards: an UpdateTamara Gomes and Carolyn Wilkins
IntroductionBanks play a crucial role in financing economic activity by acting as intermediaries between savers and bor-rowers; the maturity transformation performed by banks is an integral part of financial intermediation that contributes to the efficient allocation of resources in the economy. These activities expose banks to a number of risks, however, including funding-liquidity risk. As became evident during the financial crisis that began in 2007, inadequate management of liquidity risk can create severe problems for individual banks, contribute to contagion across the broader financial system and lead to a breakdown in financial intermediation.
This report considers the motivation for the Basel III liquidity framework, which is rooted in the failures in liquidity-risk management that were exposed by the financial crisis. It reviews the evolution of the Liquidity Coverage Ratio (LCR) over the observation period established to evaluate the standard, including the subsequent revisions, as well as outstanding issues to be addressed. Finally, the report provides an update on work to complete the Net Stable Funding Ratio (NSFR), focusing on objectives and key considerations that should factor into its final design and calibration.
The deficiencies in liquidity-risk management revealed by the financial crisis spurred several countries, including Canada, to strengthen prudential guidance and monitoring of liquidity-risk management. The Basel Committee on Banking Supervision (BCBS) was also motivated to reinforce global principles and standards for the measurement and management of liquidity risk. “Basel III: International Framework for Liquidity Risk Measurement, Standards and Monitoring,” pub-lished in December 2010 (BCBS 2010b), provides a fundamental review of the risk-management practices
of banks related to funding liquidity.1 The Basel III framework is centred on two standards: the LCR and the NSFR, which were developed to meet two separate, but complementary, objectives. The aim of the LCR is to promote short-term resilience to adverse liquidity shocks by ensuring that a bank has enough high-quality liquid assets (HQLA) to survive an acute stress scenario that lasts for one month. The goal of the NSFR is to promote structural resilience over a longer time horizon by encouraging banks to finance their activities with more-stable (including longer-term) sources of funding. This framework is complemented by a set of monitoring indicators for supervisors.
The BCBS also established an observation period, which began in 2011, to allow authorities time to review the liquidity standards, with particular emphasis on mitigating potential unintended consequences for market functioning and economic activity. Based on analysis that was completed over the 2011–12 period, the BCBS made some substantive changes to the LCR, which were published in January 2013 after being endorsed by the Governors and Heads of Supervision of the BCBS (BIS 2013). Work is currently under way to address some outstanding issues related to the LCR by the end of 2013, including developing a public disclosure framework and assessing interactions between the LCR and central bank liquidity. With the LCR largely finalized, the focus has turned to further developing and finalizing the NSFR by the end of 2014.2
1 There is a long history of BCBS discussion on the management of liquidity risk by banks. For example, the BCBS first published a framework for managing and measuring liquidity risk in 1992. More recently, the Working Group on Liquidity, a BCBS subgroup established in 2006, has issued reports that updated and strengthened these documents (BCBS 2000, 2008).
2 See BIS (2013). Banks will be required to implement the LCR during the 2015–18 phase-in period. The NSFR will be implemented as of 1 January 2018.
the BaSeL iii LiqUidity StandaRdS: an UPdate 37 BANK OF CANADA • FINANCIAL SyStEM REvIEw • JuNE 2013
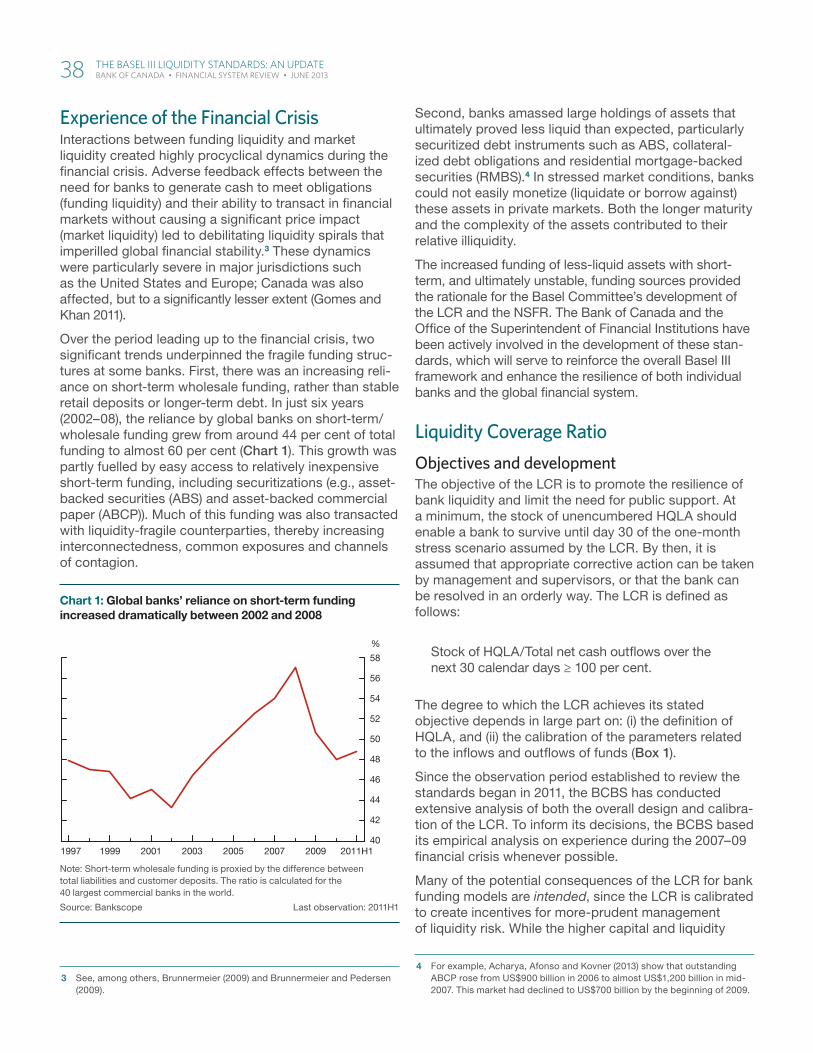
Experience of the Financial CrisisInteractions between funding liquidity and market liquidity created highly procyclical dynamics during the financial crisis. Adverse feedback effects between the need for banks to generate cash to meet obligations (funding liquidity) and their ability to transact in financial markets without causing a significant price impact (market liquidity) led to debilitating liquidity spirals that imperilled global financial stability.3 These dynamics were particularly severe in major jurisdictions such as the United States and Europe; Canada was also affected, but to a significantly lesser extent (Gomes and Khan 2011).
Over the period leading up to the financial crisis, two significant trends underpinned the fragile funding struc-tures at some banks. First, there was an increasing reli-ance on short-term wholesale funding, rather than stable retail deposits or longer-term debt. In just six years (2002–08), the reliance by global banks on short-term/wholesale funding grew from around 44 per cent of total funding to almost 60 per cent (Chart 1). This growth was partly fuelled by easy access to relatively inexpensive short-term funding, including securitizations (e.g., asset-backed securities (ABS) and asset-backed commercial paper (ABCP)). Much of this funding was also transacted with liquidity-fragile counterparties, thereby increasing interconnectedness, common exposures and channels of contagion.
3 See, among others, Brunnermeier (2009) and Brunnermeier and Pedersen (2009).
Second, banks amassed large holdings of assets that ultimately proved less liquid than expected, particularly securitized debt instruments such as ABS, collateral-ized debt obligations and residential mortgage-backed securities (RMBS).4 In stressed market conditions, banks could not easily monetize (liquidate or borrow against) these assets in private markets. Both the longer maturity and the complexity of the assets contributed to their relative illiquidity.
The increased funding of less-liquid assets with short-term, and ultimately unstable, funding sources provided the rationale for the Basel Committee’s development of the LCR and the NSFR. The Bank of Canada and the Office of the Superintendent of Financial Institutions have been actively involved in the development of these stan-dards, which will serve to reinforce the overall Basel III framework and enhance the resilience of both individual banks and the global financial system.
Liquidity Coverage RatioObjectives and developmentThe objective of the LCR is to promote the resilience of bank liquidity and limit the need for public support. At a minimum, the stock of unencumbered HQLA should enable a bank to survive until day 30 of the one-month stress scenario assumed by the LCR. By then, it is assumed that appropriate corrective action can be taken by management and supervisors, or that the bank can be resolved in an orderly way. The LCR is defined as follows:
Stock of HQLA/Total net cash outflows over the next 30 calendar days ≥ 100 per cent.
The degree to which the LCR achieves its stated objective depends in large part on: (i) the definition of HQLA, and (ii) the calibration of the parameters related to the inflows and outflows of funds (Box 1).
Since the observation period established to review the standards began in 2011, the BCBS has conducted extensive analysis of both the overall design and calibra-tion of the LCR. To inform its decisions, the BCBS based its empirical analysis on experience during the 2007–09 financial crisis whenever possible.
Many of the potential consequences of the LCR for bank funding models are intended, since the LCR is calibrated to create incentives for more-prudent management of liquidity risk. While the higher capital and liquidity
4 For example, Acharya, Afonso and Kovner (2013) show that outstanding ABCP rose from US$900 billion in 2006 to almost US$1,200 billion in mid-2007. This market had declined to US$700 billion by the beginning of 2009.
Note: Short-term wholesale funding is proxied by the difference between total liabilities and customer deposits. The ratio is calculated for the 40 largest commercial banks in the world.
Source: Bankscope Last observation: 2011H1
1997 1999 2001 2003 2005 2007 200940
42
44
46
48
50
52
54
56
58
2011H1
%
Chart 1: Global banks’ reliance on short-term funding increased dramatically between 2002 and 2008
38 the BaSeL iii LiqUidity StandaRdS: an UPdate BANK OF CANADA • FINANCIAL SyStEM REvIEw • JuNE 2013
standards may impose additional costs on banks, sev-eral studies (e.g., BCBS 2010a; FSB-BCBS 2010) antici-pate significant benefits from the standards in terms of mitigating procyclicality and reducing the probability and severity of banking crises.
The goal over the observation period is to limit unintended consequences for the sound functioning of financial markets, the extension of credit and real economic activity. This analysis has led to several key changes to the LCR, many of them to address previ-ously identified shortcomings, including those noted in Northcott and Zelmer (2009) and Gomes and Khan (2011). The changes are intended to accomplish several objectives: (i) help to ensure that the LCR functions as intended during both normal times and periods of stress, (ii) reduce perverse impacts on asset and funding markets, (iii) mitigate potential impediments to the smooth functioning of central bank operations and (iv) limit unintended consequences for economic activity.
Broadly speaking, there were four major changes to the original formulation of the LCR published in 2010. First, the BCBS reinforced the principle that the pool of HQLA is intended to be used if required. The LCR rules now explicitly state that, while prudent liquidity-risk manage-ment requires the accumulation of HQLA in normal periods, banks may draw down this pool as needed, and that supervisors will assess the situation and adjust their response flexibly, according to the circumstances, if a bank reports an LCR below the minimum require-ment. This will help to mitigate the risk that supervisory and market pressures will induce unwarranted hoarding of liquidity during periods of stress to meet prudential requirements.
Second, the pool of eligible HQLA was expanded to incorporate a broader range of assets, including those that have demonstrated resilient market liquidity, even during periods of stress. Among these additional assets are lower-rated non-financial corporate debt, high-quality non-financial equities and high-quality RMBS. Given that these assets are less liquid and bear more credit risk than other HQLA, they are subject to higher haircuts and are limited to a maximum of 15 per cent of the HQLA pool. This change allows banks to harness gains from diversification: a broader pool of assets reduces concentration on banks’ balance sheets and could decrease the possibility of asset fire sales and a severe deterioration of market liquidity during periods of stress.
Third, the BCBS calibrated inflow and outflow rates for the LCR based on the experience of the financial crisis. Careful attention was also applied to potential knock-on effects, since calibration rates will influence relative costs and therefore the incentive to undertake certain activities. As mentioned earlier, some increased costs are intended. For example, unsecured funding sourced from other financial institutions is assigned a 100 per cent outflow rate.5 During a systemic crisis, unsecured funding from other financial institutions is very fragile; hence, the rules aim to reduce undue reli-ance on this source of funding. This calibration is sym-metric for both inflows and outflows. The inflow rate is also 100 per cent for the lending bank, consistent with banks’ internal risk-management assumptions.
5 This means that regulated banks must hold an amount of HQLA that is equal to these transactions and that matures in 30 days or less.
Box 1
Defi nition of the Liquidity Coverage Ratiothree broad groups of assets qualify as high-quality liquid assets (HQLA) in the numerator of the ratio:
• Level 1 assets—Include cash, central bank reserves and cash substitutes such as top-rated sovereign debt . these assets can make up an unlimited amount of total liquid assets and are measured at full value (i .e ., no haircuts) .
• Level 2A assets—Include lower-rated public debt and high-rated covered bonds and non-fi nancial corporate bonds . these assets are restricted to a maximum of 40 per cent of the total pool of liquid assets and are given a minimum haircut of 15 per cent .
• Level 2B assets—Supervisors may also choose to include lower-rated non-fi nancial corporate debt, high-quality
non-fi nancial equities (each at a minimum 50 per cent haircut) and high-quality residential mortgage-backed securities (RMBS, at a minimum 25 per cent haircut) . All Level 2B assets are restricted to a maximum of 15 per cent of the total pool of liquid assets .
the denominator of the LCR is defi ned as the total expected cash outfl ows minus the total expected cash infl ows under the specifi ed stress scenario for the subsequent 30 calendar days . these fi gures are calculated by multiplying outstanding balances by the assumed stress outfl ow and infl ow rates; total expected cash infl ows are calculated up to an aggregate cap of 75 per cent of total expected cash outfl ows . For more details on the categories of outfl ows and infl ows, as well as the rates at which they are calibrated, see BCBS (2013) .
the BaSeL iii LiqUidity StandaRdS: an UPdate 39 BANK OF CANADA • FINANCIAL SyStEM REvIEw • JuNE 2013
However, other calibrations could have unduly increased the cost of core financial services, with unintended adverse implications for credit creation in the broader economy. For example, the outflow rate previously assumed for backup liquidity lines was 100 per cent, which was much higher than measured historical experience. This could have had negative implications for non-financial corporate firms (Gomes and Khan 2011). Since many firms require these backstops to issue commercial paper, this requirement could have prohibitively raised the costs of market funding for firms’ liquidity-management practices. As a result, the assumed outflow rate on these facilities was reduced from 100 per cent to 30 per cent, which is more in line with observed experience over periods of stress.6 These considerations, together with historical experi-ence, motivated changes to the assumed outflow rates in other areas, including certain deposits, committed liquidity lines and obligations related to trade finance. Other preliminary calibrations were inconsistent with central bank operations and could have inappropriately influenced policy implementation, providing the motiva-tion to reduce to zero the assumed outflow rates associ-ated with all transactions secured by central banks.
Finally, the BCBS decided to institute a phase-in period for the implementation of the LCR, beginning in January 2015 (when the minimum requirement is 60 per cent), with full implementation to be completed by January 2019. This phase-in period is aligned with that for the requirements of the Basel III capital framework. The rules also allow individual countries that are receiving financial support for macroeconomic and structural reforms to choose a different implementation schedule (BCBS 2013).7 This should ensure that banks will strengthen their liquidity-risk management and meet the LCR standard, while still being able to provide credit to the real economy. Canadian banks, which have been subject to prudential liquidity monitoring and reporting for some time, are well placed to meet these requirements.
Outstanding issuesAlthough the overall design and calibration of the LCR were finalized in January 2013, the BCBS is examining three outstanding issues (BIS 2013):
6 The outflow rate determines how much HQLA banks need to hold against potential outflows assumed under the specified stress scenario. In this case, for example, under the original rules, banks would have needed to hold HQLA equal to the amount of potential outflows, owing to calls on backup liquidity lines. With the change to the rules, banks now need to hold HQLA equal to 30 per cent of potential outflows.
7 For example, this may include countries undertaking multilateral aid programs.
(i) The BCBS is developing requirements to reinforce consistency and transparency in the disclosure practices of the funding and liquidity practices of banks. Consistent with the Pillar 3 framework of the Basel Capital Accord, enhanced disclosure will support market discipline to reinforce regulatory and supervisory actions, and will reduce the risks asso-ciated with the lack of transparency that contributed to uncertainty during the crisis. This work will need to balance these benefits with the potential for negative market signals during a period of financial stress.
(ii) The BCBS is exploring the use of market-based indi-cators of liquidity to supplement existing measures based on asset classes and credit ratings. Keeping in mind that supervisors may choose to apply stricter requirements than those stipulated by the LCR, this work will improve the ability of supervisors to evaluate the liquidity properties of assets that are currently eligible as HQLA.8
(iii) Finally, the BCBS is assessing the interactions between the LCR and the provision of central bank liquidity.
This work is expected to be completed by the end of 2013.
Net Stable Funding RatioObjectives and developmentThe NSFR is designed to reduce the ex ante exposure of banks to funding-liquidity risk by promoting a more- stable funding profile relative to the maturity profile of assets and off-balance-sheet exposures. It is intended to complement the LCR by creating incentives for structural changes to bank funding profiles over a time horizon that is longer than 30 days, thereby promoting a structurally sound banking system. Specifically, the NSFR aims to reduce undue reliance on wholesale short-term funding and to encourage better manage-ment of liquidity risk from off-balance-sheet exposures.
Extending the term and otherwise improving the sta-bility of a bank’s funding profile reduces its exposure to the risk of maturity mismatches. Funding long-term assets (e.g., mortgage loans) with short-term wholesale liabilities exposes banks to “rollover” risk, where banks are unable to refinance previously loaned funds without significantly increased costs, or to “run” risk, where creditors flee. If either of these risks materializes, a bank may be unable to fund its operations and redeem com-mitments to its clients without fire sales of potentially illiquid assets.
8 Note that the Basel Pillar 1 standards are minimum requirements, and supervisors may choose to apply higher standards under Pillar 2.
40 the BaSeL iii LiqUidity StandaRdS: an UPdate BANK OF CANADA • FINANCIAL SyStEM REvIEw • JuNE 2013
Several forms of structural funding ratios are used to monitor and manage this risk. For example, banks and supervisors often use maturity “gap” or “ladder” analysis to identify gaps in contractual inflows and outflows that could give rise to liquidity risk. An example is the metric for contractual maturity mismatches that is included in the Basel III liquidity-monitoring metrics (BCBS 2013). Simpler metrics include: (i) the core funding ratio, which is a simple ratio of (unweighted) assets to stable funding;9 and (ii) short-term funding as a share of total funding, which limits the overall proportion of less-stable funding in a bank’s funding profile.
In the 2010 proposal for the NSFR, the BCBS chose a measure that takes into account the defined risk char-acteristics of both assets and liabilities and captures a broad range of on- and off-balance-sheet activities.10 The NSFR is defined so that the amount of “available stable funding” is greater than the amount of “required stable funding”:
Available stable funding/Required stable funding > 100 per cent.
Available stable funding includes capital, preferred stock and liabilities with remaining maturities equal to one year or more, and the share of deposits and wholesale funding “with maturities of less than one year that would be expected to stay with the institution for an extended period in an idiosyncratic stress event” (BCBS 2010b). These categories were assigned weights in the 2010 ver-sion based on their recognized stability.
Required stable funding is calculated as the sum of unencumbered assets plus off-balance-sheet exposures and other activities. Items pertaining to required stable funding are assigned a factor that is inversely related to their assessed market liquidity; in other words, the more liquid the asset, the less stable funding is needed. For example, immediately available cash is assigned a factor of zero per cent, since it is assumed to be directly on hand, whereas retail loans with a remaining maturity of less than one year are assigned a factor of 85 per cent, since they will not be fully repaid until a later date.
The NSFR must be met continuously and reported to supervisors at least quarterly (see BCBS 2010b for more details). The NSFR is calibrated using a one-year time horizon for the demarcation of long-term/stable funding; this is consistent with current market structures, where most money market funding has a maximum tenor of 12 months.
9 A practical example is the core funding ratio used in New Zealand’s pru-dential regime (RBNZ 2011).
10 The proposed metric was also designed to discourage overreliance on borrowing from other banks, which can increase interlinkages and spread contagion during periods of stress.
The academic literature suggests that meeting this new requirement will impose costs on banks, impinging on profitability and potentially raising the cost of lending (Härle et al. 2010; King 2012). At the same time, research indicates that increasing the NSFR would reduce the probability of bank failures, with the weakest banks feeling the largest effects (Vazquez and Federico 2012; BCBS 2010a). By reinforcing stable ex ante funding structures, the NSFR should bolster confidence in individual banks and reduce the probability of financial crises.
Important considerations in the development of a structural funding requirementA number of key factors should be considered in the development of a structural funding requirement over the remainder of the observation period to reinforce its benefits and to avoid unintended consequences.
First, while the NSFR should curb excessive maturity mismatches in banks, it should not unduly hinder the ability of banks to perform maturity transformation and provide credit and liquidity to the broader financial system, including households, firms and markets. Some level of maturity mismatch is inherent in the role that banks play as financial intermediaries, and there may be benefits to the use of short-term borrowing. For example, short-term retail deposits that are the back-bone of traditional retail banking can be a stable source of liquidity, unlike short-term wholesale funding. Short-term debt-like contracts can also act as a device that enforces discipline for managers of financial institutions and could be an optimal private response to govern-ance concerns (Calomiris and Kahn 1991; Diamond and Rajan 2000, 2001). Short-term funding can also provide incentives for creditors to monitor bank managers and thus mitigates agency and moral hazard problems (Diamond 1984).
Nonetheless, as the proportion of unstable funding of a bank increases, its structural funding profile weakens. For example, a bank that funds long-term mortgages with very short-term wholesale unsecured funding is more exposed to rollover risk and run risk than a bank that funds mortgages with stable deposits and long-term debt. Reliance on short-term funding may also be excessive if the bank deals with many creditors and it is difficult to commit to an aggregate maturity structure (Brunnermeier and Oehmke 2013). Separately, unstable funding profiles are closely related to the interventions by central banks to facilitate access to financial institu-tions to refinancing during periods of stress (Farhi and Tirole 2012).
From a systemic point of view, banks can contribute to the weakening of their funding profile if they adopt risky balance-sheet strategies because they do not
the BaSeL iii LiqUidity StandaRdS: an UPdate 41 BANK OF CANADA • FINANCIAL SyStEM REvIEw • JuNE 2013
distinguish between the individual riskiness of their assets and the importance of the assets to the financial system as a whole (Morris and Shin 2008). As well, the monitoring by creditors may not be fully effective (Kashyap, Rajan and Stein 2008), owing to negative externalities such as fire sales or if creditors have less incentive to monitor, since they have a higher priority than equity holders to residual claims if the firm enters bankruptcy. In the case of systemically important banks in particular, creditors expect to incur few, or no, losses in the event of insolvency. Thus, there may be social gains from introducing a standard that places a cap on the mismatch between required and available stable funding. The difficult task for policy-makers is to find the right balance when determining this limit.
Second, the NSFR must be defined to support financial stability by reducing funding risk at the bank level and, equally, by promoting stabilizing system-wide dynamics in times of financial stress. During the crisis, the tenor of bank funding shortened dramatically, with long-term funding markets accessible only to a handful of banks, and at punitive costs. This occurred in Canada as well, despite the relative health of Canadian banks, albeit to a lesser extent than in other jurisdictions, such as the United States and Europe.11 Structural funding requirements should not only account for banks’ own responses in these stress situations, but must also ensure that banks’ individual responses do not exacer-bate procyclicality or hinder efforts by authorities to address market dislocations.
11 In fact, the Bank of Canada did introduce extraordinary liquidity facilities to ease funding pressures, lending for periods up to 12 months. For details, see Zorn, Wilkins and Engert (2009).
Finally, the NSFR should be designed to complement the other prudential requirements, such as the LCR, capital requirements and the leverage ratio. There is evidence that this is the case. For example, King (2010) finds that increasing liquid assets to reach higher liquidity requirements will help banks to meet strengthened capital requirements by reducing risk-weighted assets. The NSFR may also interact with other regulatory initiatives; for example, because the NSFR will encourage the issuance of longer-term debt, it can reinforce the availability of a bank’s liabilities that can be bailed-in in the event of failure. However, since inter-actions and incentives depend on detailed calibrations of the standard, as well as its overall design, further assessment of the NSFR with respect to other key ele-ments of the Basel framework would be beneficial.12
ConclusionThe Basel III liquidity framework incorporates a number of important measures that will increase the resilience of banks to short-term liquidity shocks, as well as promo-ting a more structurally sound funding profile for them and enhancing their incentives to better assess and manage liquidity risk. The resulting improved measure-ment and management of liquidity risk, together with the other important elements of Basel III, will contribute to reducing the probability and impact of financial stress. Canadian banks are well placed to meet these new requirements.
12 For example, some industry participants think that the design of the NSFR needs to take into account interactions with the leverage ratio, as well as potential cliff effects (AFME 2012).
ReferencesAcharya, V., G. Afonso and A. Kovner. 2013. “How Do
Global Banks Scramble for Liquidity? Evidence from the Asset-Backed Commercial Paper Freeze of 2007.” Department of Finance, New York University, Stern School of Business.
Association for Financial Markets in Europe (AFME). 2012. “Net Stable Funding Ratio.”
Bank for International Settlements (BIS). 2013. “Group of Governors and Heads of Supervision Endorses Revised Liquidity Standard for Banks.” Press release. 6 January.
Basel Committee on Banking Supervision (BCBS). 2000. “Sound Practices for Managing Liquidity in Banking Organisations.”
—. 2008. “Principles for Sound Liquidity Risk Management and Supervision.”
—. 2010a. “An Assessment of the Long-Term Economic Impact of Stronger Capital and Liquidity Requirements.”
—. 2010b. “Basel III: International Framework for Liquidity Risk Measurement, Standards and Monitoring.”
42 the BaSeL iii LiqUidity StandaRdS: an UPdate BANK OF CANADA • FINANCIAL SyStEM REvIEw • JuNE 2013
Basel Committee on Banking Supervision (BCBS). 2013. “Basel III: The Liquidity Coverage Ratio and Liquidity Risk Monitoring Tools.”
Brunnermeier, M. K. 2009. “Deciphering the Liquidity and Credit Crunch 2007–2008.” Journal of Economic Perspectives 23 (1): 77–100.
Brunnermeier, M. K. and M. Oehmke. 2013. “The Maturity Rat Race.” Journal of Finance 68 (2): 483–521.
Brunnermeier, M. K. and L. H. Pedersen. 2009. “Market Liquidity and Funding Liquidity.” Review of Financial Studies 22 (6): 2201–238.
Calomiris, C. W. and C. M. Kahn. 1991. “The Role of Demandable Debt in Structuring Optimal Banking Arrangements.” American Economic Review 81 (3): 497–513.
Diamond, D. W. 1984. “Financial Intermediation and Delegated Monitoring.” Review of Economic Studies 51 (3): 393–414.
Diamond, D. W. and R. G. Rajan. 2000. “A Theory of Bank Capital.” Journal of Finance 55 (6): 2431–465.
—. 2001. “Liquidity Risk, Liquidity Creation, and Financial Fragility: A Theory of Banking.” Journal of Political Economy 109 (2): 287–327.
Farhi, E. and J. Tirole. 2012. “Collective Moral Hazard, Maturity Mismatch, and Systemic Bailouts.” American Economic Review 102 (1): 60–93.
Financial Stability Board and the Basel Committee on Banking Supervision (FSB-BCBS). 2010. “Assessing the Macroeconomic Impact of the Transition to Stronger Capital and Liquidity Requirements.”
Gomes, T. and N. Khan. 2011. “Strengthening Bank Management of Liquidity Risk: The Basel III Liquidity Standards.” Bank of Canada Financial System Review (December): 35–42.
Härle, P., E. Lüders, T. Pepanides, S. Pfetsch, T. Poppensieker and U. Stegemann. 2010. “Basel III and European Banking: Its Impact, How Banks Might Respond, and the Challenges of Implementation.” McKinsey Working Papers on Risk No. 26.
Kashyap, A. K., R. G. Rajan and J. C. Stein. 2008. “Rethinking Capital Regulation.” In Maintaining Stability in a Changing Financial System, 1–45. Proceedings of a symposium held by the Federal Reserve Bank of Kansas City, August. Jackson Hole: Federal Reserve Bank of Kansas City.
King, M. R. 2010. “Mapping Capital and Liquidity Requirements to Bank Lending Spreads.” BIS Working Paper No. 324.
—. 2012. “The Basel III Net Stable Funding Ratio and Bank Net Interest Margins.” Unpublished manuscript.
Morris, S. and H. S. Shin. 2008. “Financial Regulation in a System Context.” Brookings Papers on Economic Activity (Fall): 229–74.
Northcott, C. A. and M. Zelmer. 2009. “Liquidity Standards in a Macroprudential Context.” Bank of Canada Financial System Review (December): 35–40.
Reserve Bank of New Zealand (RBNZ). 2011. “Liquidity Policy.” Prudential Supervision Department, Document No. BS13. Available at http://www.rbnz.govt.nz/finstab/banking/regulation/3675928.pdf.
Vazquez, F. and P. Federico. 2012. “Bank Funding Structures and Risk: Evidence from the Global Financial Crisis.” IMF Working Paper No. WP/12/29.
Zorn, L., C. Wilkins and W. Engert. 2009. “Bank of Canada Liquidity Actions in Response to the Financial Market Turmoil.” Bank of Canada Review (Autumn): 3–22.
the BaSeL iii LiqUidity StandaRdS: an UPdate 43 BANK OF CANADA • FINANCIAL SyStEM REvIEw • JuNE 2013

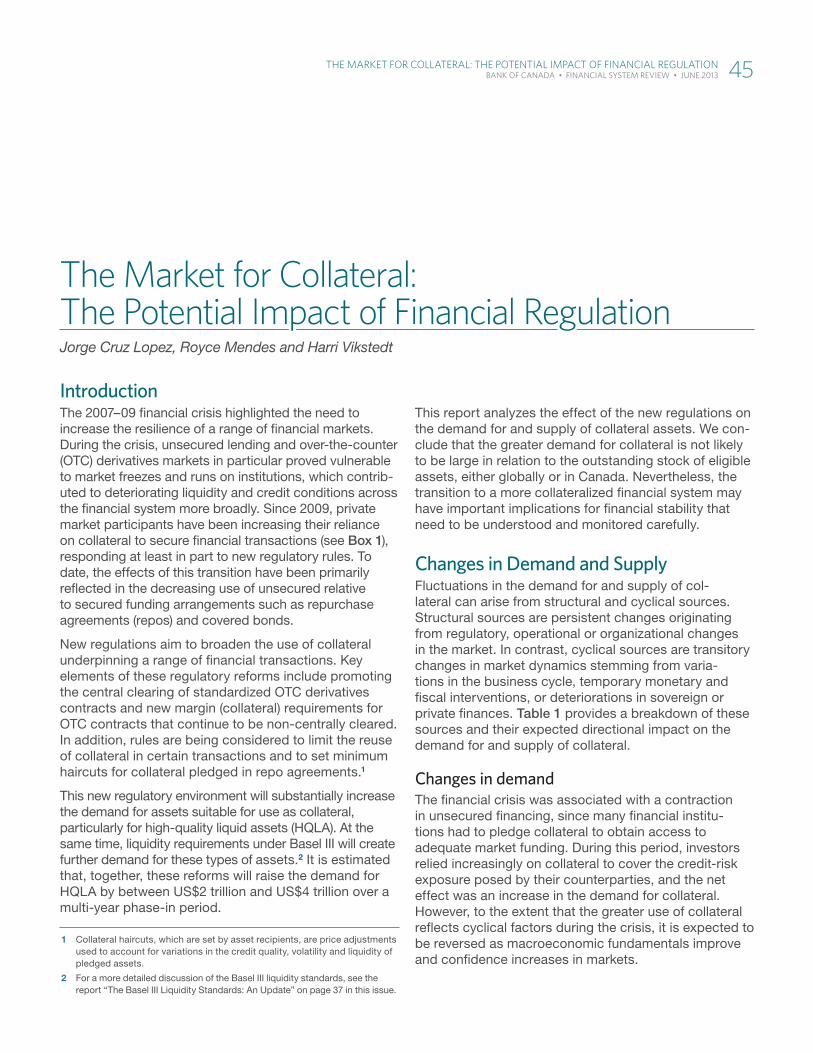
the market for Collateral: the Potential impact of Financial RegulationJorge Cruz Lopez, Royce Mendes and Harri Vikstedt
IntroductionThe 2007–09 financial crisis highlighted the need to increase the resilience of a range of financial markets. During the crisis, unsecured lending and over-the-counter (OTC) derivatives markets in particular proved vulnerable to market freezes and runs on institutions, which contrib-uted to deteriorating liquidity and credit conditions across the financial system more broadly. Since 2009, private market participants have been increasing their reliance on collateral to secure financial transactions (see Box 1), responding at least in part to new regulatory rules. To date, the effects of this transition have been primarily reflected in the decreasing use of unsecured relative to secured funding arrangements such as repurchase agreements (repos) and covered bonds.
New regulations aim to broaden the use of collateral underpinning a range of financial transactions. Key elements of these regulatory reforms include promoting the central clearing of standardized OTC derivatives contracts and new margin (collateral) requirements for OTC contracts that continue to be non-centrally cleared. In addition, rules are being considered to limit the reuse of collateral in certain transactions and to set minimum haircuts for collateral pledged in repo agreements.1
This new regulatory environment will substantially increase the demand for assets suitable for use as collateral, particularly for high-quality liquid assets (HQLA). At the same time, liquidity requirements under Basel III will create further demand for these types of assets.2 It is estimated that, together, these reforms will raise the demand for HQLA by between US$2 trillion and US$4 trillion over a multi-year phase-in period.
1 Collateral haircuts, which are set by asset recipients, are price adjustments used to account for variations in the credit quality, volatility and liquidity of pledged assets.
2 For a more detailed discussion of the Basel III liquidity standards, see the report “The Basel III Liquidity Standards: An Update” on page 37 in this issue.
This report analyzes the effect of the new regulations on the demand for and supply of collateral assets. We con-clude that the greater demand for collateral is not likely to be large in relation to the outstanding stock of eligible assets, either globally or in Canada. Nevertheless, the transition to a more collateralized financial system may have important implications for financial stability that need to be understood and monitored carefully.
Changes in Demand and SupplyFluctuations in the demand for and supply of col-lateral can arise from structural and cyclical sources. Structural sources are persistent changes originating from regulatory, operational or organizational changes in the market. In contrast, cyclical sources are transitory changes in market dynamics stemming from varia-tions in the business cycle, temporary monetary and fiscal interventions, or deteriorations in sovereign or private finances. Table 1 provides a breakdown of these sources and their expected directional impact on the demand for and supply of collateral.
Changes in demandThe financial crisis was associated with a contraction in unsecured financing, since many financial institu-tions had to pledge collateral to obtain access to adequate market funding. During this period, investors relied increasingly on collateral to cover the credit-risk exposure posed by their counterparties, and the net effect was an increase in the demand for collateral. However, to the extent that the greater use of collateral reflects cyclical factors during the crisis, it is expected to be reversed as macroeconomic fundamentals improve and confidence increases in markets.
the maRket FOR COLLateRaL: the POtentiaL imPaCt OF FinanCiaL RegULatiOn 45 BANK OF CANADA • FINANCIAL SyStEM REvIEw • JuNE 2013
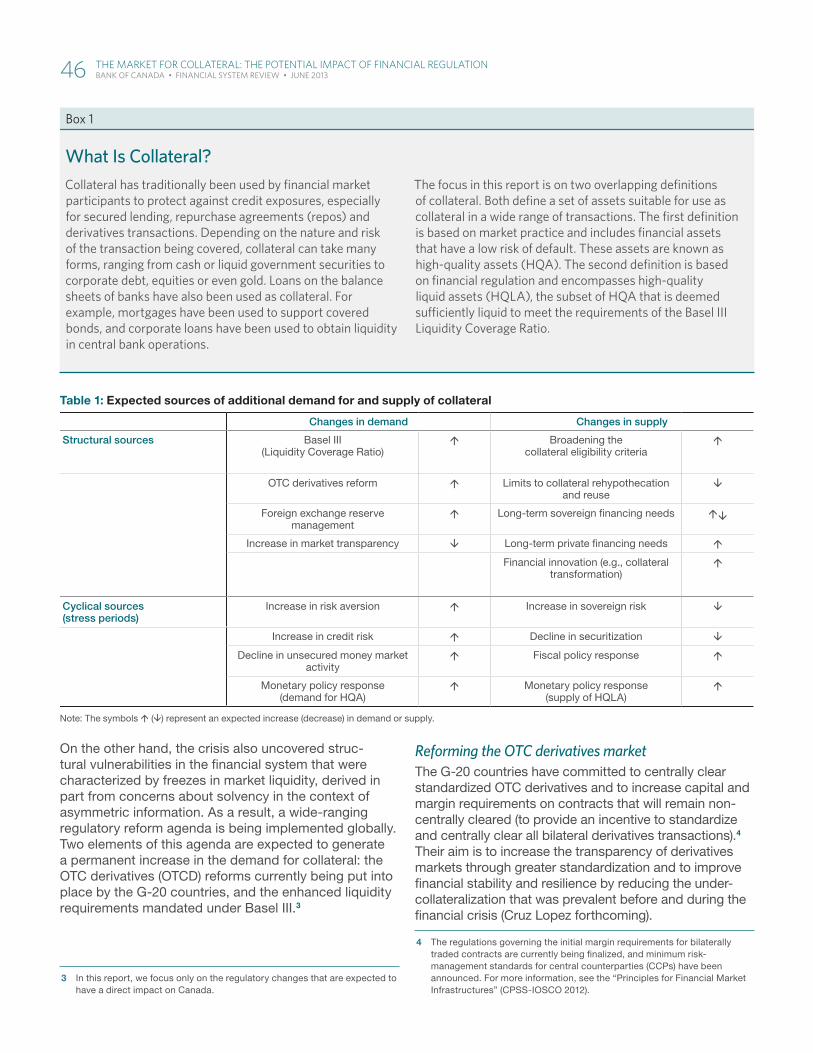
On the other hand, the crisis also uncovered struc-tural vulnerabilities in the financial system that were characterized by freezes in market liquidity, derived in part from concerns about solvency in the context of asymmetric information. As a result, a wide-ranging regulatory reform agenda is being implemented globally. Two elements of this agenda are expected to generate a permanent increase in the demand for collateral: the OTC derivatives (OTCD) reforms currently being put into place by the G-20 countries, and the enhanced liquidity requirements mandated under Basel III.3
3 In this report, we focus only on the regulatory changes that are expected to have a direct impact on Canada.
Reforming the OTC derivatives marketThe G-20 countries have committed to centrally clear standardized OTC derivatives and to increase capital and margin requirements on contracts that will remain non-centrally cleared (to provide an incentive to standardize and centrally clear all bilateral derivatives transactions).4 Their aim is to increase the transparency of derivatives markets through greater standardization and to improve financial stability and resilience by reducing the under-collateralization that was prevalent before and during the financial crisis (Cruz Lopez forthcoming).
4 The regulations governing the initial margin requirements for bilaterally traded contracts are currently being finalized, and minimum risk-management standards for central counterparties (CCPs) have been announced. For more information, see the “Principles for Financial Market Infrastructures” (CPSS-IOSCO 2012).
Table 1: Expected sources of additional demand for and supply of collateral
Changes in demand Changes in supply
Structural sources Basel III (Liquidity Coverage Ratio)
Broadening the collateral eligibility criteria
OTC derivatives reform Limits to collateral rehypothecationand reuse
Foreign exchange reserve management
Long-term sovereign fi nancing needs
Increase in market transparency Long-term private fi nancing needs
Financial innovation (e.g., collateral transformation)
Cyclical sources (stress periods)
Increase in risk aversion Increase in sovereign risk
Increase in credit risk Decline in securitization
Decline in unsecured money market activity
Fiscal policy response
Monetary policy response (demand for HQA)
Monetary policy response (supply of HQLA)
Note: The symbols () represent an expected increase (decrease) in demand or supply.
Box 1
What Is Collateral?Collateral has traditionally been used by fi nancial market participants to protect against credit exposures, especially for secured lending, repurchase agreements (repos) and derivatives transactions . Depending on the nature and risk of the transaction being covered, collateral can take many forms, ranging from cash or liquid government securities to corporate debt, equities or even gold . Loans on the balance sheets of banks have also been used as collateral . For example, mortgages have been used to support covered bonds, and corporate loans have been used to obtain liquidity in central bank operations .
the focus in this report is on two overlapping defi nitions of collateral . Both defi ne a set of assets suitable for use as collateral in a wide range of transactions . the fi rst defi nition is based on market practice and includes fi nancial assets that have a low risk of default . these assets are known as high-quality assets (HQA) . the second defi nition is based on fi nancial regulation and encompasses high-quality liquid assets (HQLA), the subset of HQA that is deemed suffi ciently liquid to meet the requirements of the Basel III Liquidity Coverage Ratio .
46 the maRket FOR COLLateRaL: the POtentiaL imPaCt OF FinanCiaL RegULatiOn BANK OF CANADA • FINANCIAL SyStEM REvIEw • JuNE 2013
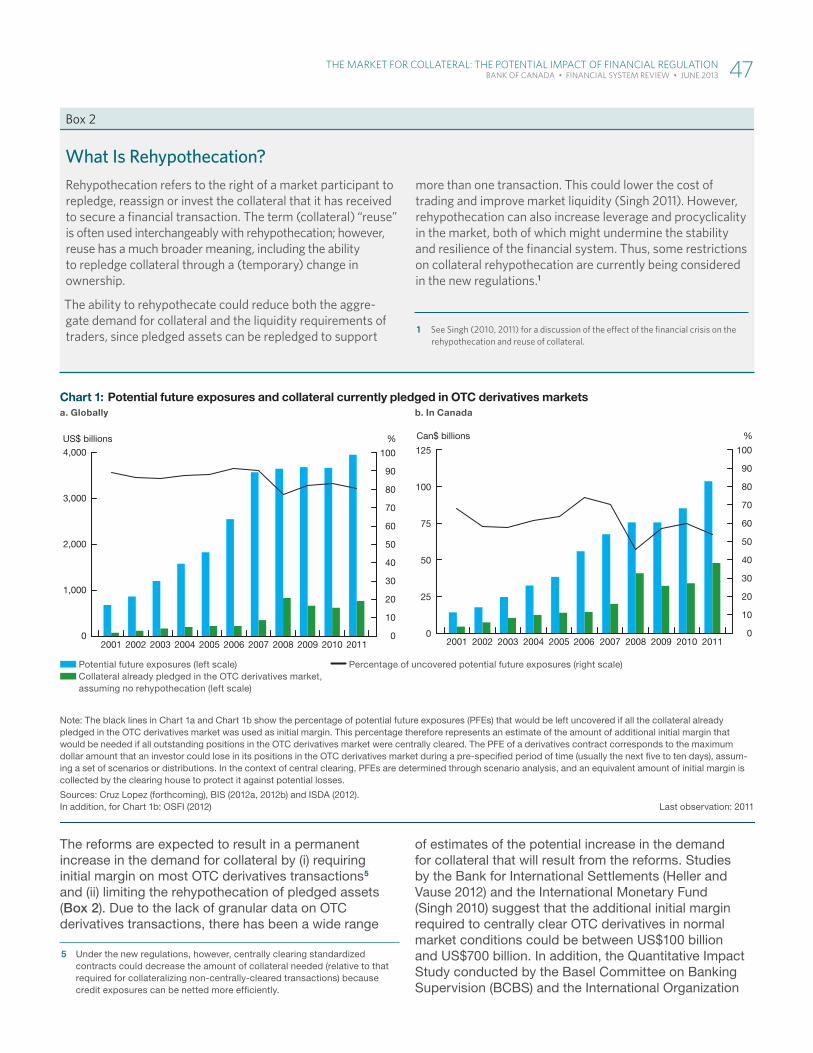
The reforms are expected to result in a permanent increase in the demand for collateral by (i) requiring initial margin on most OTC derivatives transactions5 and (ii) limiting the rehypothecation of pledged assets (Box 2). Due to the lack of granular data on OTC derivatives transactions, there has been a wide range
5 Under the new regulations, however, centrally clearing standardized contracts could decrease the amount of collateral needed (relative to that required for collateralizing non-centrally-cleared transactions) because credit exposures can be netted more efficiently.
of estimates of the potential increase in the demand for collateral that will result from the reforms. Studies by the Bank for International Settlements (Heller and Vause 2012) and the International Monetary Fund (Singh 2010) suggest that the additional initial margin required to centrally clear OTC derivatives in normal market conditions could be between US$100 billion and US$700 billion. In addition, the Quantitative Impact Study conducted by the Basel Committee on Banking Supervision (BCBS) and the International Organization
Box 2
What Is Rehypothecation?Rehypothecation refers to the right of a market participant to repledge, reassign or invest the collateral that it has received to secure a fi nancial transaction . the term (collateral) “reuse” is often used interchangeably with rehypothecation; however, reuse has a much broader meaning, including the ability to repledge collateral through a (temporary) change in ownership .
the ability to rehypothecate could reduce both the aggre-gate demand for collateral and the liquidity requirements of traders, since pledged assets can be repledged to support
more than one transaction . this could lower the cost of trading and improve market liquidity (Singh 2011) . However, rehypothecation can also increase leverage and procyclicality in the market, both of which might undermine the stability and resilience of the fi nancial system . thus, some restrictions on collateral rehypothecation are currently being considered in the new regulations .1
1 See Singh (2010, 2011) for a discussion of the eff ect of the fi nancial crisis on the rehypothecation and reuse of collateral .
Data presentation styles:
Line styles & stacking order:
Canada/1st
US/2nd
Euro zone/3rd
Japan/4th
UK/5th
Canada/1st (projected)
US/2nd (proj’d)
Euro zone/3rd (proj’d)
Japan/4th (proj’d)
UK/5th (proj’d)
All axis lines & ticks
Fill styles & stacking order:
Canada/1st
US/2nd
Euro zone/3rd
Japan/4th UK/5th projected
Canada/1st (projected)
US/2nd (proj’d)
Euro zone/3rd (proj’d)
Japan/4th (proj’d)
UK/5th (proj’d)
Control range
Axis lines & ticks
Additional common styles:
dot black
red line plus dot in-chart label
Chart 8-A: Title+ 2nd lineSub-title
Units of measure (top of axis):
Verifi ed vs. supplied data, cross-referenced w/ prior artwork
Left alt scale, if applicable
Aligned to outer edgeof axis labels, rag inward towards chart
Chart axes:
Tick marks (major and, if necessary, minor)
“Bookend” tick marks at ends of bottom axis (left/right)
Bottom axis labels placed & verifi ed
Chart bottom region:
Legend items placed and styled
Order verifi ed vs prior artwork
All superscripts, special symbols, etc. as required
Chart footer:
Note(s):
Source(s):
Last observation: (if applicable)
File information (for internal use only): Chart 1-A,B Panel -- Potential future exposures Global -- EN.indd
Last output: 06/10/13
Note: The black lines in Chart 1a and Chart 1b show the percentage of potential future exposures (PFEs) that would be left uncovered if all the collateral already pledged in the OTC derivatives market was used as initial margin. This percentage therefore represents an estimate of the amount of additional initial margin that would be needed if all outstanding positions in the OTC derivatives market were centrally cleared. The PFE of a derivatives contract corresponds to the maximum dollar amount that an investor could lose in its positions in the OTC derivatives market during a pre-specifi ed period of time (usually the next fi ve to ten days), assum-ing a set of scenarios or distributions. In the context of central clearing, PFEs are determined through scenario analysis, and an equivalent amount of initial margin is collected by the clearing house to protect it against potential losses.
Sources: Cruz Lopez (forthcoming), BIS (2012a, 2012b) and ISDA (2012).In addition, for Chart 1b: OSFI (2012) Last observation: 2011
Potential future exposures (left scale) Collateral already pledged in the OTC derivatives market, assuming no rehypothecation (left scale)
Percentage of uncovered potential future exposures (right scale)
2001 2002 2003 2004 2005 2006 2007 2008 2009 2010 201100
10
20
30
40
50
60
70
80
90
100
1,000
2,000
3,000
4,000
US$ billions %
Chart 1: Potential future exposures and collateral currently pledged in OTC derivatives marketsa. Globally b. In Canada
2001 2002 2003 2004 2005 2006 2007 2008 2009 2010 20110
10
20
30
40
50
60
70
80
90
100
0
25
50
75
100
125
Can$ billions %
the maRket FOR COLLateRaL: the POtentiaL imPaCt OF FinanCiaL RegULatiOn 47 BANK OF CANADA • FINANCIAL SyStEM REvIEw • JuNE 2013
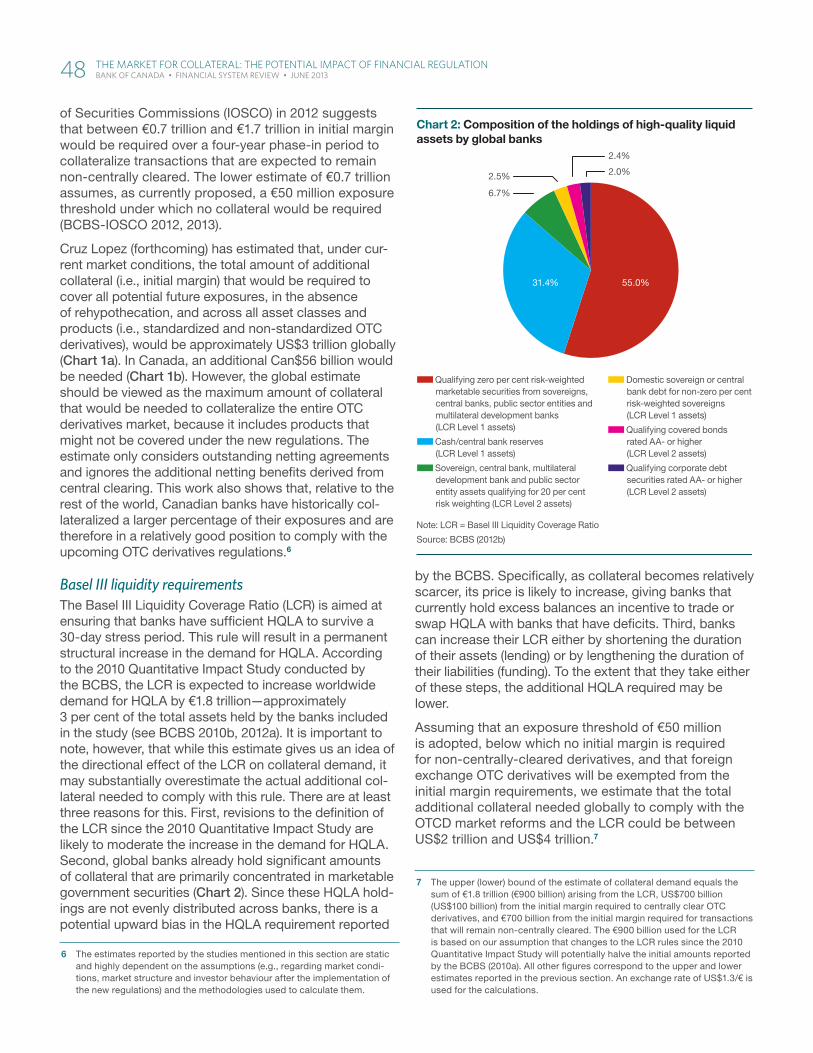
of Securities Commissions (IOSCO) in 2012 suggests that between €0.7 trillion and €1.7 trillion in initial margin would be required over a four-year phase-in period to collateralize transactions that are expected to remain non-centrally cleared. The lower estimate of €0.7 trillion assumes, as currently proposed, a €50 million exposure threshold under which no collateral would be required (BCBS-IOSCO 2012, 2013).
Cruz Lopez (forthcoming) has estimated that, under cur-rent market conditions, the total amount of additional collateral (i.e., initial margin) that would be required to cover all potential future exposures, in the absence of rehypothecation, and across all asset classes and products (i.e., standardized and non-standardized OTC derivatives), would be approximately US$3 trillion globally (Chart 1a). In Canada, an additional Can$56 billion would be needed (Chart 1b). However, the global estimate should be viewed as the maximum amount of collateral that would be needed to collateralize the entire OTC derivatives market, because it includes products that might not be covered under the new regulations. The estimate only considers outstanding netting agreements and ignores the additional netting benefits derived from central clearing. This work also shows that, relative to the rest of the world, Canadian banks have historically col-lateralized a larger percentage of their exposures and are therefore in a relatively good position to comply with the upcoming OTC derivatives regulations.6
Basel III liquidity requirementsThe Basel III Liquidity Coverage Ratio (LCR) is aimed at ensuring that banks have sufficient HQLA to survive a 30-day stress period. This rule will result in a permanent structural increase in the demand for HQLA. According to the 2010 Quantitative Impact Study conducted by the BCBS, the LCR is expected to increase worldwide demand for HQLA by €1.8 trillion—approximately 3 per cent of the total assets held by the banks included in the study (see BCBS 2010b, 2012a). It is important to note, however, that while this estimate gives us an idea of the directional effect of the LCR on collateral demand, it may substantially overestimate the actual additional col-lateral needed to comply with this rule. There are at least three reasons for this. First, revisions to the definition of the LCR since the 2010 Quantitative Impact Study are likely to moderate the increase in the demand for HQLA. Second, global banks already hold significant amounts of collateral that are primarily concentrated in marketable government securities (Chart 2). Since these HQLA hold-ings are not evenly distributed across banks, there is a potential upward bias in the HQLA requirement reported
6 The estimates reported by the studies mentioned in this section are static and highly dependent on the assumptions (e.g., regarding market condi-tions, market structure and investor behaviour after the implementation of the new regulations) and the methodologies used to calculate them.
by the BCBS. Specifically, as collateral becomes relatively scarcer, its price is likely to increase, giving banks that currently hold excess balances an incentive to trade or swap HQLA with banks that have deficits. Third, banks can increase their LCR either by shortening the duration of their assets (lending) or by lengthening the duration of their liabilities (funding). To the extent that they take either of these steps, the additional HQLA required may be lower.
Assuming that an exposure threshold of €50 million is adopted, below which no initial margin is required for non-centrally-cleared derivatives, and that foreign exchange OTC derivatives will be exempted from the initial margin requirements, we estimate that the total additional collateral needed globally to comply with the OTCD market reforms and the LCR could be between US$2 trillion and US$4 trillion.7
7 The upper (lower) bound of the estimate of collateral demand equals the sum of €1.8 trillion (€900 billion) arising from the LCR, US$700 billion (US$100 billion) from the initial margin required to centrally clear OTC derivatives, and €700 billion from the initial margin required for transactions that will remain non-centrally cleared. The €900 billion used for the LCR is based on our assumption that changes to the LCR rules since the 2010 Quantitative Impact Study will potentially halve the initial amounts reported by the BCBS (2010a). All other figures correspond to the upper and lower estimates reported in the previous section. An exchange rate of US$1.3/€ is used for the calculations.
Note: LCR = Basel III Liquidity Coverage Ratio
Source: BCBS (2012b)
Qualifying zero per cent risk-weighted marketable securities from sovereigns, central banks, public sector entities and multilateral development banks(LCR Level 1 assets)
Cash/central bank reserves (LCR Level 1 assets)
Sovereign, central bank, multilateral development bank and public sector entity assets qualifying for 20 per cent risk weighting (LCR Level 2 assets)
Domestic sovereign or central bank debt for non-zero per cent risk-weighted sovereigns (LCR Level 1 assets)
Qualifying covered bonds rated AA- or higher (LCR Level 2 assets)
Qualifying corporate debt securities rated AA- or higher (LCR Level 2 assets)
6.7%
2.5% 2.0%
2.4%
31.4% 55.0%
Chart 2: Composition of the holdings of high-quality liquid assets by global banks
48 the maRket FOR COLLateRaL: the POtentiaL imPaCt OF FinanCiaL RegULatiOn BANK OF CANADA • FINANCIAL SyStEM REvIEw • JuNE 2013
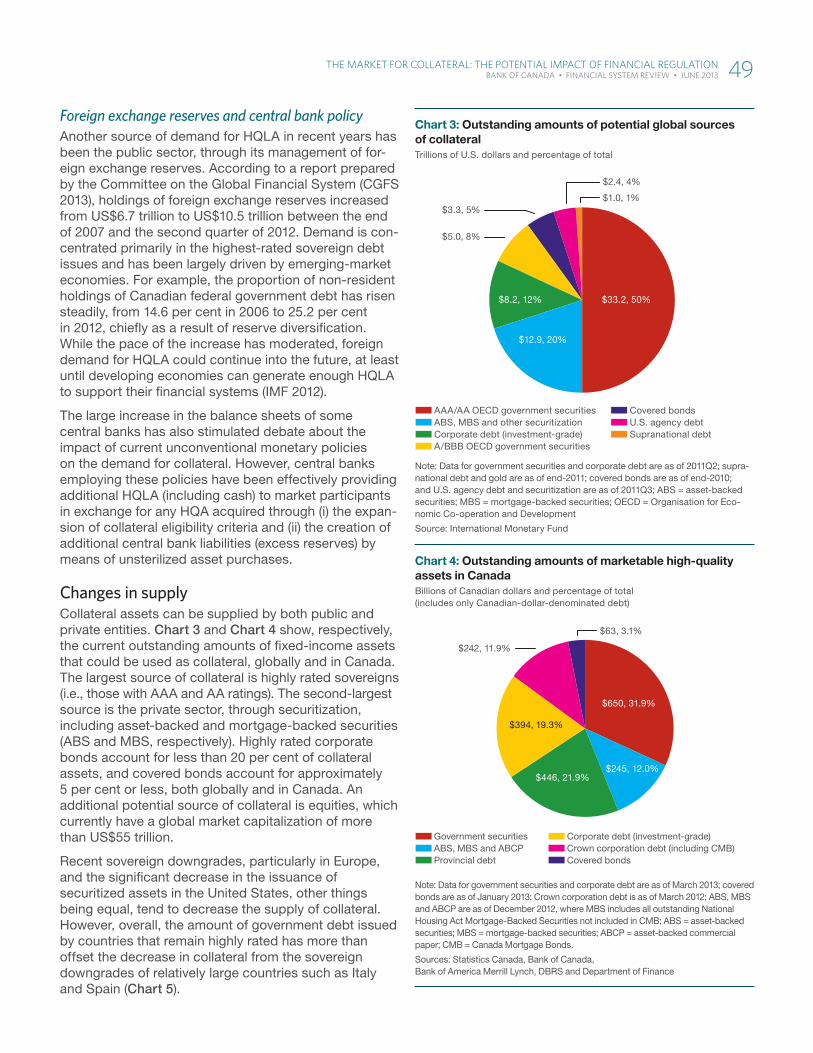
Foreign exchange reserves and central bank policyAnother source of demand for HQLA in recent years has been the public sector, through its management of for-eign exchange reserves. According to a report prepared by the Committee on the Global Financial System (CGFS 2013), holdings of foreign exchange reserves increased from US$6.7 trillion to US$10.5 trillion between the end of 2007 and the second quarter of 2012. Demand is con-centrated primarily in the highest-rated sovereign debt issues and has been largely driven by emerging-market economies. For example, the proportion of non-resident holdings of Canadian federal government debt has risen steadily, from 14.6 per cent in 2006 to 25.2 per cent in 2012, chiefly as a result of reserve diversification. While the pace of the increase has moderated, foreign demand for HQLA could continue into the future, at least until developing economies can generate enough HQLA to support their financial systems (IMF 2012).
The large increase in the balance sheets of some central banks has also stimulated debate about the impact of current unconventional monetary policies on the demand for collateral. However, central banks employing these policies have been effectively providing additional HQLA (including cash) to market participants in exchange for any HQA acquired through (i) the expan-sion of collateral eligibility criteria and (ii) the creation of additional central bank liabilities (excess reserves) by means of unsterilized asset purchases.
Changes in supplyCollateral assets can be supplied by both public and private entities. Chart 3 and Chart 4 show, respectively, the current outstanding amounts of fixed-income assets that could be used as collateral, globally and in Canada. The largest source of collateral is highly rated sovereigns (i.e., those with AAA and AA ratings). The second-largest source is the private sector, through securitization, including asset-backed and mortgage-backed securities (ABS and MBS, respectively). Highly rated corporate bonds account for less than 20 per cent of collateral assets, and covered bonds account for approximately 5 per cent or less, both globally and in Canada. An additional potential source of collateral is equities, which currently have a global market capitalization of more than US$55 trillion.
Recent sovereign downgrades, particularly in Europe, and the significant decrease in the issuance of securitized assets in the United States, other things being equal, tend to decrease the supply of collateral. However, overall, the amount of government debt issued by countries that remain highly rated has more than offset the decrease in collateral from the sovereign downgrades of relatively large countries such as Italy and Spain (Chart 5).
Note: Data for government securities and corporate debt are as of 2011Q2; supra-national debt and gold are as of end-2011; covered bonds are as of end-2010; and U.S. agency debt and securitization are as of 2011Q3; ABS = asset-backed securities; MBS = mortgage-backed securities; OECD = Organisation for Eco-nomic Co-operation and Development
Source: International Monetary Fund
AAA/AA OECD government securities ABS, MBS and other securitization Corporate debt (investment-grade) A/BBB OECD government securities
Covered bonds U.S. agency debt Supranational debt
$5.0, 8%
$3.3, 5%$1.0, 1%
$2.4, 4%
$12.9, 20%
$8.2, 12% $33.2, 50%
Chart 3: Outstanding amounts of potential global sources of collateralTrillions of U.S. dollars and percentage of total
Note: Data for government securities and corporate debt are as of March 2013; covered bonds are as of January 2013; Crown corporation debt is as of March 2012; ABS, MBS and ABCP are as of December 2012, where MBS includes all outstanding National Housing Act Mortgage-Backed Securities not included in CMB; ABS = asset-backed securities; MBS = mortgage-backed securities; ABCP = asset-backed commercial paper; CMB = Canada Mortgage Bonds.
Sources: Statistics Canada, Bank of Canada, Bank of America Merrill Lynch, DBRS and Department of Finance
Government securities ABS, MBS and ABCP Provincial debt
Corporate debt (investment-grade) Crown corporation debt (including CMB) Covered bonds
$242, 11.9%
$446, 21.9%$245, 12.0%
$650, 31.9%
$394, 19.3%
$63, 3.1%
Chart 4: Outstanding amounts of marketable high-quality assets in CanadaBillions of Canadian dollars and percentage of total (includes only Canadian-dollar-denominated debt)
the maRket FOR COLLateRaL: the POtentiaL imPaCt OF FinanCiaL RegULatiOn 49 BANK OF CANADA • FINANCIAL SyStEM REvIEw • JuNE 2013
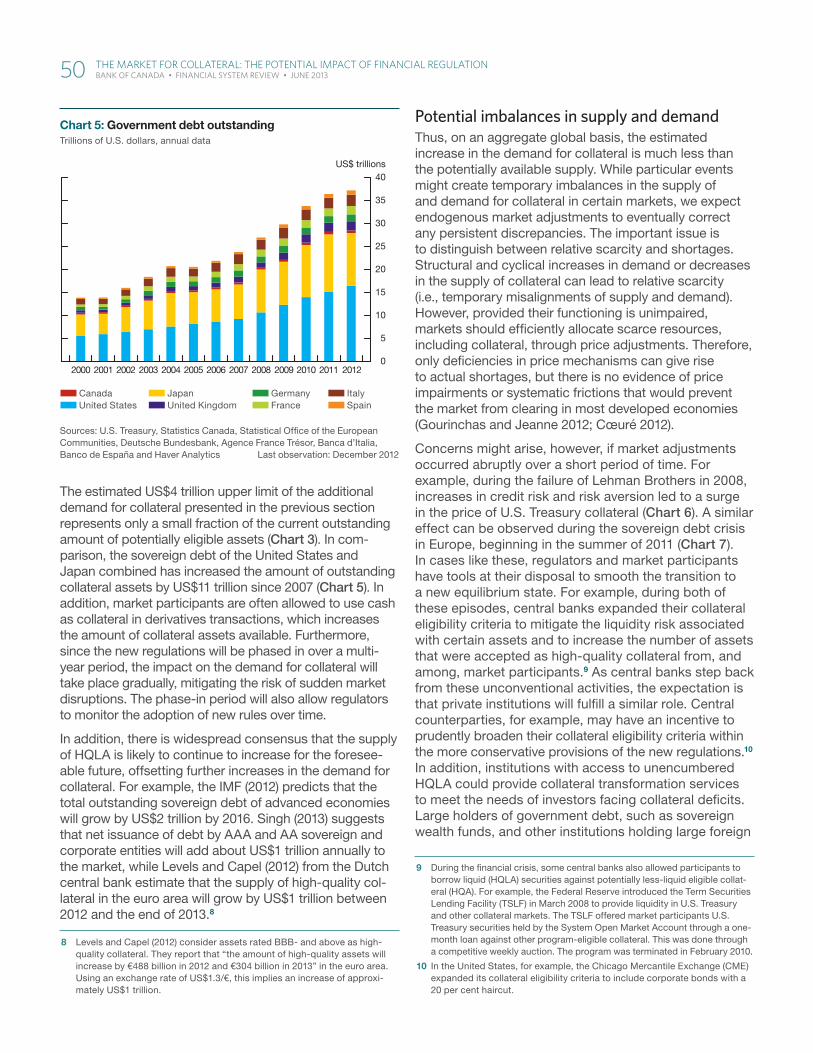
The estimated US$4 trillion upper limit of the additional demand for collateral presented in the previous section represents only a small fraction of the current outstanding amount of potentially eligible assets (Chart 3). In com-parison, the sovereign debt of the United States and Japan combined has increased the amount of outstanding collateral assets by US$11 trillion since 2007 (Chart 5). In addition, market participants are often allowed to use cash as collateral in derivatives transactions, which increases the amount of collateral assets available. Furthermore, since the new regulations will be phased in over a multi-year period, the impact on the demand for collateral will take place gradually, mitigating the risk of sudden market disruptions. The phase-in period will also allow regulators to monitor the adoption of new rules over time.
In addition, there is widespread consensus that the supply of HQLA is likely to continue to increase for the foresee-able future, offsetting further increases in the demand for collateral. For example, the IMF (2012) predicts that the total outstanding sovereign debt of advanced economies will grow by US$2 trillion by 2016. Singh (2013) suggests that net issuance of debt by AAA and AA sovereign and corporate entities will add about US$1 trillion annually to the market, while Levels and Capel (2012) from the Dutch central bank estimate that the supply of high-quality col-lateral in the euro area will grow by US$1 trillion between 2012 and the end of 2013.8
8 Levels and Capel (2012) consider assets rated BBB- and above as high-quality collateral. They report that “the amount of high-quality assets will increase by €488 billion in 2012 and €304 billion in 2013” in the euro area. Using an exchange rate of US$1.3/€, this implies an increase of approxi-mately US$1 trillion.
Potential imbalances in supply and demand Thus, on an aggregate global basis, the estimated increase in the demand for collateral is much less than the potentially available supply. While particular events might create temporary imbalances in the supply of and demand for collateral in certain markets, we expect endogenous market adjustments to eventually correct any persistent discrepancies. The important issue is to distinguish between relative scarcity and shortages. Structural and cyclical increases in demand or decreases in the supply of collateral can lead to relative scarcity (i.e., temporary misalignments of supply and demand). However, provided their functioning is unimpaired, markets should efficiently allocate scarce resources, including collateral, through price adjustments. Therefore, only deficiencies in price mechanisms can give rise to actual shortages, but there is no evidence of price impairments or systematic frictions that would prevent the market from clearing in most developed economies (Gourinchas and Jeanne 2012; Cœuré 2012).
Concerns might arise, however, if market adjustments occurred abruptly over a short period of time. For example, during the failure of Lehman Brothers in 2008, increases in credit risk and risk aversion led to a surge in the price of U.S. Treasury collateral (Chart 6). A similar effect can be observed during the sovereign debt crisis in Europe, beginning in the summer of 2011 (Chart 7). In cases like these, regulators and market participants have tools at their disposal to smooth the transition to a new equilibrium state. For example, during both of these episodes, central banks expanded their collateral eligibility criteria to mitigate the liquidity risk associated with certain assets and to increase the number of assets that were accepted as high-quality collateral from, and among, market participants.9 As central banks step back from these unconventional activities, the expectation is that private institutions will fulfill a similar role. Central counterparties, for example, may have an incentive to prudently broaden their collateral eligibility criteria within the more conservative provisions of the new regulations.10 In addition, institutions with access to unencumbered HQLA could provide collateral transformation services to meet the needs of investors facing collateral deficits. Large holders of government debt, such as sovereign wealth funds, and other institutions holding large foreign
9 During the financial crisis, some central banks also allowed participants to borrow liquid (HQLA) securities against potentially less-liquid eligible collat-eral (HQA). For example, the Federal Reserve introduced the Term Securities Lending Facility (TSLF) in March 2008 to provide liquidity in U.S. Treasury and other collateral markets. The TSLF offered market participants U.S. Treasury securities held by the System Open Market Account through a one-month loan against other program-eligible collateral. This was done through a competitive weekly auction. The program was terminated in February 2010.
10 In the United States, for example, the Chicago Mercantile Exchange (CME) expanded its collateral eligibility criteria to include corporate bonds with a 20 per cent haircut.
Sources: U.S. Treasury, Statistics Canada, Statistical Offi ce of the European Communities, Deutsche Bundesbank, Agence France Trésor, Banca d’Italia, Banco de España and Haver Analytics Last observation: December 2012
Canada United States
Japan United Kingdom
Germany France
Italy Spain
0
5
10
15
20
25
30
35
40
2000 20082007200620052004200320022001 2009 2010 2011 2012
US$ trillions
Chart 5: Government debt outstandingTrillions of U.S. dollars, annual data
50 the maRket FOR COLLateRaL: the POtentiaL imPaCt OF FinanCiaL RegULatiOn BANK OF CANADA • FINANCIAL SyStEM REvIEw • JuNE 2013
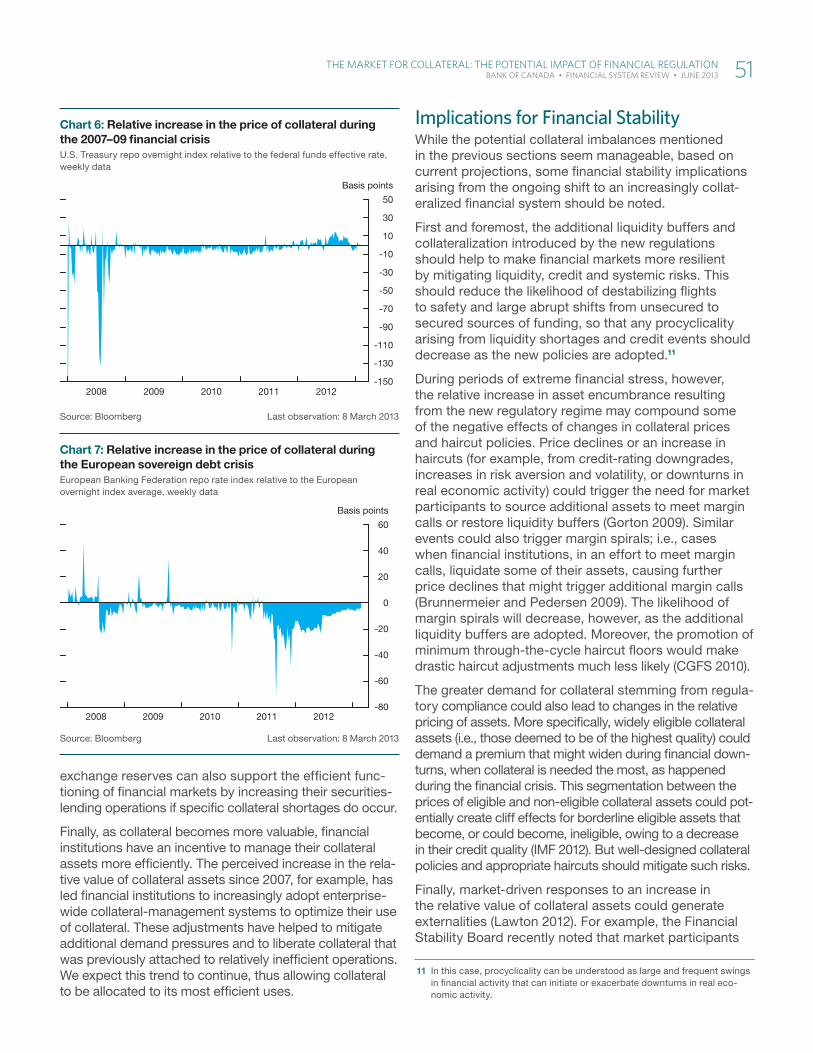
exchange reserves can also support the efficient func-tioning of financial markets by increasing their securities- lending operations if specific collateral shortages do occur.
Finally, as collateral becomes more valuable, financial institutions have an incentive to manage their collateral assets more efficiently. The perceived increase in the rela-tive value of collateral assets since 2007, for example, has led financial institutions to increasingly adopt enterprise-wide collateral-management systems to optimize their use of collateral. These adjustments have helped to mitigate additional demand pressures and to liberate collateral that was previously attached to relatively inefficient operations. We expect this trend to continue, thus allowing collateral to be allocated to its most efficient uses.
Implications for Financial StabilityWhile the potential collateral imbalances mentioned in the previous sections seem manageable, based on current projections, some financial stability implications arising from the ongoing shift to an increasingly collat-eralized financial system should be noted.
First and foremost, the additional liquidity buffers and collateralization introduced by the new regulations should help to make financial markets more resilient by mitigating liquidity, credit and systemic risks. This should reduce the likelihood of destabilizing flights to safety and large abrupt shifts from unsecured to secured sources of funding, so that any procyclicality arising from liquidity shortages and credit events should decrease as the new policies are adopted.11
During periods of extreme financial stress, however, the relative increase in asset encumbrance resulting from the new regulatory regime may compound some of the negative effects of changes in collateral prices and haircut policies. Price declines or an increase in haircuts (for example, from credit-rating downgrades, increases in risk aversion and volatility, or downturns in real economic activity) could trigger the need for market participants to source additional assets to meet margin calls or restore liquidity buffers (Gorton 2009). Similar events could also trigger margin spirals; i.e., cases when financial institutions, in an effort to meet margin calls, liquidate some of their assets, causing further price declines that might trigger additional margin calls (Brunnermeier and Pedersen 2009). The likelihood of margin spirals will decrease, however, as the additional liquidity buffers are adopted. Moreover, the promotion of minimum through-the-cycle haircut floors would make drastic haircut adjustments much less likely (CGFS 2010).
The greater demand for collateral stemming from regula-tory compliance could also lead to changes in the relative pricing of assets. More specifically, widely eligible collateral assets (i.e., those deemed to be of the highest quality) could demand a premium that might widen during financial down-turns, when collateral is needed the most, as happened during the financial crisis. This segmentation between the prices of eligible and non-eligible collateral assets could pot-entially create cliff effects for borderline eligible assets that become, or could become, ineligible, owing to a decrease in their credit quality (IMF 2012). But well-designed collateral policies and appropriate haircuts should mitigate such risks.
Finally, market-driven responses to an increase in the relative value of collateral assets could generate externalities (Lawton 2012). For example, the Financial Stability Board recently noted that market participants
11 In this case, procyclicality can be understood as large and frequent swings in financial activity that can initiate or exacerbate downturns in real eco-nomic activity.
Source: Bloomberg Last observation: 8 March 2013
2008 2009 2010 2011 2012-150
-130
-110
-90
-70
-50
-30
-10
10
30
50
Basis points
Chart 6: Relative increase in the price of collateral during the 2007–09 fi nancial crisisU.S. Treasury repo overnight index relative to the federal funds effective rate, weekly data
Source: Bloomberg Last observation: 8 March 2013
2008 2009 2010 2011 2012-80
-60
-40
-20
0
20
40
60
Basis points
Chart 7: Relative increase in the price of collateral during the European sovereign debt crisisEuropean Banking Federation repo rate index relative to the European overnight index average, weekly data
the maRket FOR COLLateRaL: the POtentiaL imPaCt OF FinanCiaL RegULatiOn 51 BANK OF CANADA • FINANCIAL SyStEM REvIEw • JuNE 2013
are increasingly using collateral transformation services to mitigate the effects of collateral scarcity (FSB 2013).12 Although this type of response might help to smooth the structural shift in the demand for collateral, if not managed carefully, it could give rise to some unintended consequences. Collateral transformation could increase the interconnectedness of financial institutions and the complexity of financial markets, both of which could make it more difficult for investors and regulators to monitor certain vulnerabilities. In addition, collateral transformation services could concentrate counterparty risk in a few large financial institutions (FSA 2012). Nevertheless, collateral transformation activity is cur-rently not large (or central) enough to be of concern for financial stability (Stein 2013) and the focus, for now, should be on monitoring its evolution (FSB 2013). Moreover, any increase in interconnectedness from this source should be viewed against the backdrop of the probably much larger decrease in interconnectedness that is the intended result of, for example, much greater central clearing.
12 This involves the upgrade (swapping) of assets not deemed eligible for use as collateral to assets that are eligible (or to cash). This is somewhat analogous to securities lending and the use of repos.
ConclusionThe recent financial and sovereign debt crises made it clear that regulatory changes were needed to address weaknesses in the global financial system. While some of these policy changes will increase the structural demand for collateral, the prevailing view is that wide-spread shortages are unlikely to occur, for at least four reasons. First, price adjustments will correct any imbalances in demand and supply and provide incen-tives to efficiently redistribute collateral from those with a surplus to those with a deficit. Second, recent and future expected increases in the amount of HQLA should satisfy most, if not all, of the expected additional demand. Third, the multi-year time frame over which new regulations will be implemented should mitigate any abrupt changes in collateral prices or business practices. Fourth, regulators and market participants can expand their collateral eligibility criteria on a risk-adjusted basis, or provide prudent collateral transforma-tion services to increase the pool of assets regarded as safe or to help efficiently allocate collateral across market participants.
Authorities should closely monitor the transition to a more collateralized financial system, however, to assess and alleviate the potential risks posed by private sector responses to any collateral scarcity that might arise.
ReferencesBank for International Settlements (BIS). 2012a.
“Statistical Release: OTC Derivatives Statistics at End-December 2011.”
—. 2012b. “Statistical Release: OTC Derivatives Statistics at End-June 2012.”
Basel Committee on Banking Supervision (BCBS). 2010a. “Results of the Comprehensive Quantitative Impact Study.”
—. 2010b. “Basel III: International Framework for Liquidity Risk Measurement, Standards and Monitoring.” Consultative Document.
—. 2012a. “Results of the Basel III Monitoring Exercise as of 30 June 2011.”
—. 2012b. “Results of the Basel III Monitoring Exercise as of 31 December 2011.”
Basel Committee on Banking Supervision and Board of the International Organization of Securities Commissions (BCBS-IOSCO). 2012. “Margin Requirements for Non-Centrally-Cleared Derivatives.” Consultative Document.
—. 2013. “Margin Requirements for Non-Centrally-Cleared Derivatives.” Second Consultative Document.
Brunnermeier, M. K. and L. H. Pedersen. 2009. “Market Liquidity and Funding Liquidity.” Review of Financial Studies 22: 2201–238.
Cœuré, B. 2012. “Collateral Scarcity—A Gone or a Going Concern?” Speech to the Joint Central Bank Seminar on Collateral and Liquidity in Amsterdam, 1 October.
52 the maRket FOR COLLateRaL: the POtentiaL imPaCt OF FinanCiaL RegULatiOn BANK OF CANADA • FINANCIAL SyStEM REvIEw • JuNE 2013
Committee on Payment and Settlement Systems and Technical Committee of the International Organization of Securities Commissions (CPSS-IOSCO). 2012. “Principles for Financial Market Infrastructures.” Policy Report.
Committee on the Global Financial System (CGFS). 2010. “The Role of Margin Requirements and Haircuts in Procyclicality.” CGFS Papers No. 36.
—. 2013. “Asset Encumbrance, Financial Reform and the Demand for Collateral Assets.” CGFS Papers No. 49.
Cruz Lopez, J. A. “Mind the Gap: Under-Collateralization in the Global and Canadian OTCD Markets.” Bank of Canada Discussion Paper (forthcoming).
Financial Services Authority (FSA). 2012. “Collateral Upgrade Transactions (Includes Liquidity Swaps).” Consultative Report. Finalised Guidance No. FG/12/06.
Financial Stability Board (FSB). 2013. “Meeting of the Financial Stability Board in Zurich on 28 January.” Press release.
Gorton, G. 2009. “Information, Liquidity, and the (Ongoing) Panic of 2007.” American Economic Review 99 (2): 567–72.
Gourinchas, P.-O. and O. Jeanne. 2012. “Global Safe Assets.” Unpublished manuscript, University of California and Johns Hopkins University.
Heller, D. and N. Vause. 2012. “Collateral Requirements for Mandatory Central Clearing of Over-the-Counter Derivatives.” BIS Working Paper No. 373.
International Monetary Fund (IMF). 2012. “Safe Assets: Financial System Cornerstone?” Chapter 3 in IMF Global Financial Stability Report: The Quest for Lasting Stability, 81–122.
International Swaps and Derivatives Association, Inc. (ISDA). 2012. “ISDA Margin Survey 2012.” Available at http://www2.isda.org/functional-areas/research/surveys/margin-surveys/.
Lawton, D. 2012. “EMIR: The Bigger Picture and Looking Forward.” Speech to the Tradetech Conference, 22 November.
Levels, A. and J. Capel. 2012. “Is Collateral Becoming Scarce? Evidence for the Euro Area.” Journal of Financial Market Infrastructures 1 (1): 29–53.
Office of the Superintendent of Financial Institutions Canada. 2012. “Financial Data—Banks.” Retrieved from http://www.osfi-bsif.gc.ca/osfi/index_e.aspx?ArticleID=554 on 12 November 2012.
Singh, M. 2010. “Collateral, Netting and Systemic Risk in the OTC Derivatives Market.” International Monetary Fund Working Paper No. WP/10/99.
—. 2011. “Velocity of Pledged Collateral: Analysis and Implications.” International Monetary Fund Working Paper No. WP/11/256.
—. 2013. “The Changing Collateral Space.” International Monetary Fund Working Paper No. WP/13/25.
Stein, J. 2013. “Overheating in Credit Markets: Origins, Measurement, and Policy Responses.” Speech to a Research Symposium at the Federal Reserve Bank of St. Louis, 7 February.
the maRket FOR COLLateRaL: the POtentiaL imPaCt OF FinanCiaL RegULatiOn 53 BANK OF CANADA • FINANCIAL SyStEM REvIEw • JuNE 2013

Monitoring and Assessing Risks in Canada’s Shadow Banking SectorToni Gravelle, Timothy Grieder and Stéphane Lavoie
IntroductionThe global financial crisis illustrated how financial stability can be threatened by shocks and vulnerabilities originating not only within the banking sector, but also in less-regu-lated parts of the financial system. Vulnerabilities can also arise from activities linking various parts of the system that create complex webs of exposures and interdependen-cies. Hence, lessons from the crisis have reinforced the importance for authorities, both globally and in Canada, to take a system-wide approach to monitoring and assessing potential vulnerabilities within the global financial system, including in the shadow banking sector. This is of particular importance, given that the ongoing regulatory reform that is critical to reduce the risk that financial excesses will undermine the future stability of the financial system will raise the costs faced by banks and constrain their activities to some degree, creating additional incentives for credit-intermediation activities to move to the shadow banking sector.
Shadow banking is often described as credit intermedia-tion that takes place at least partly outside the traditional banking system. Such intermediation, if appropriately conducted, can provide valuable market-based alternatives to bank funding and support economic activity. It can also be a source of financial innovation and help to enhance the overall efficiency and resilience of the financial system.
International work on shadow banking is focused on addressing the weaknesses exposed by the crisis and guarding against the re-emergence of systemic risks. At the Financial Stability Board (FSB), this work follows two main complementary tracks: (i) an annual monitoring exercise to assess global trends and potential risks in the shadow banking system worldwide and (ii) the development of policy recommendations to strengthen the oversight and regulation
of shadow banking. The policy recommendations being developed follow some general principles, stating that such regulatory measures should be:1
� focused, targeting the externalities and risks that shadow banking creates;
� proportionate to the risks to the financial system;
� forward looking and adaptable to emerging risks and innovations;
� designed and implemented in an effective manner, balancing the need for international consistency against the need to take account of jurisdictional differences; and
� regularly assessed and reviewed following implemen-tation, and improved as necessary.
Domestically, the Bank of Canada and other authorities have stepped up their collaborative efforts to monitor the evolution of Canada’s shadow banking sector and assess potential risks that may stem from it. In an earlier FSR report, Chapman, Lavoie and Schembri (2011) discuss the main characteristics of the sector, vulner-abilities exposed by the crisis and possible reforms. This report takes a closer look at the structure and evolution of the shadow banking sector in Canada, including its main subsectors. It also introduces a framework to assess risks and identifies areas for monitoring.
1 This work focuses on five priority areas: mitigating spillovers between the regular and shadow banking systems; reducing the susceptibility of money market funds to “runs”; assessing and mitigating systemic risks posed by shadow banking entities; assessing and aligning incentives associated with securitization; and dampening risks and procyclical incentives associated with repos and securities lending. For an overview of the Financial Stability Board’s initial policy recommendations, see FSB (2012a).
MonitoRing And ASSeSSing RiSkS in CAnAdA’S ShAdow BAnking SeCtoR 55 BANK OF CANADA • FiNANCiAl SyStem Review • JuNe 2013
Measurement and Risk-Assessment FrameworkMeasuring the shadow banking sector There are two broad approaches to measuring the shadow banking sector: an entity-based approach and an activity-based one. The measure of shadow banking used by the FSB (2012b) in its annual monitoring exercise is based on assets held by “other financial institutions” and focuses on non-bank financial entities such as hedge funds, money market funds (MMFs), finance companies and structured investment vehicles. However, an entity-based measure may omit shadow banking activities undertaken by banks that may contribute to systemic risk. It may also lead to a different treatment of economically equivalent activities simply because they are conducted by different types of entities.
In the Canadian context, Chapman, Lavoie and Schembri (2011) measure shadow banking using an activity-based approach, focusing on bank-like intermediation activities conducted primarily through markets. This approach not only encompasses market segments such as repos, securitization and MMFs, it captures economic-ally equivalent functions performed by regulated and unregulated entities. Given the prominent role of banks in most of these market segments in Canada, it also allows for the inclusion of activities that potentially pose systemic risks but are not considered “banking” activities in the traditional sense, even though the intermediation chain often involves a bank. As a result, this approach is broader than the typical regulatory policy discussions regarding shadow banking, which focus on credit inter-mediation conducted outside the perimeter of regulation, since it also includes activities involving regulated entities and, in some areas, an explicit government guarantee.
While an activity-based approach may be better suited to assess risks, it is still necessary to take into account entities that are engaged in these activities, especially to enable the design of appropriate policy recommendations and regulations. Hence, both the activity- and entity-based approaches provide useful perspectives.
Risk-assessment frameworkThe framework used in this report to assess activities undertaken in the Canadian shadow banking sector focuses on four risk factors (consistent with the approach developed by the FSB 2011), and on the extent to which the activities exhibit those factors, which are:
� maturity transformation, where short-term liabilities are used to finance longer-term assets;
� liquidity transformation, where the assets being financed are illiquid and cannot be easily converted into cash;
� leverage, which can occur both within individual enti-ties or build up at various stages of the intermediation chain; and
� imperfect credit-risk transfer, where some credit exposures are held off-balance-sheet or implicit sup-port is provided by an entity that could expose this entity to losses.
Although the first three factors are also inherent in ordinary banking, the presence of any of the four can leave shadow banking entities and the markets in which they undertake these activities vulnerable to “runs” (i.e., the sudden disappearance of liquidity). This, in turn, can contribute to the propagation or amplification of shocks to the financial system as a whole and undermine finan-cial stability. This is particularly true if the runs occur on a large scale, or if important interdependencies and link-ages are suddenly disrupted. Such risk creation may take place at the level of an individual shadow banking entity, but it can also be part of a complex chain of transactions in which these risks are realized in stages and create multiple forms of feedback between the shadow banking sector and the regulated banking system.
Shadow banking in CanadaShadow banking activity in Canada grew significantly in the period leading up to the financial crisis, but has since declined modestly (Chart 1).2, 3 Using the activity-based definition, the size of the shadow banking sector in Canada is about 40 per cent of the traditional banking sector, down from an average of about 50 per cent during the decade up to 2008 (Chart 2).4
To put the size of the Canadian shadow banking sector in perspective, it was estimated to be roughly 40 per cent of nominal Canadian GDP at the end of 2012, while in the United States, shadow banking was approximately 95 per cent of U.S. GDP at the end of 2011. It is also important to note that the composition
2 Our measure is based on the outstanding stock of liabilities generated by shadow banking activities in Canada. For an example of how the activity-based measure has been used elsewhere, see the U.S. case (OFR 2012, Box B).
3 Note that in Chapman, Lavoie and Schembri (2011), the estimated size of the repo component was based on turnover data. In this report, we use outstanding Canadian-dollar repo liabilities at Canadian chartered banks. Thus, although the repo segment is also smaller both in absolute terms and as a share of the total shadow banking sector, its measurement is more consistent with that of other segments of the shadow banking sector. The current estimate is conservative, since it excludes the roughly $16 billion in repo liabilities at non-bank securities brokers (based on data from the Investment Industry Regulatory Organization of Canada as of the end of 2011).
4 Our measure of traditional bank liabilities comprises gross deposits (including longer-term Canadian-dollar unsecured debt), subordinated debt and the foreign currency deposits of Canadian residents.
56 MonitoRing And ASSeSSing RiSkS in CAnAdA’S ShAdow BAnking SeCtoR BANK OF CANADA • FiNANCiAl SyStem Review • JuNe 2013
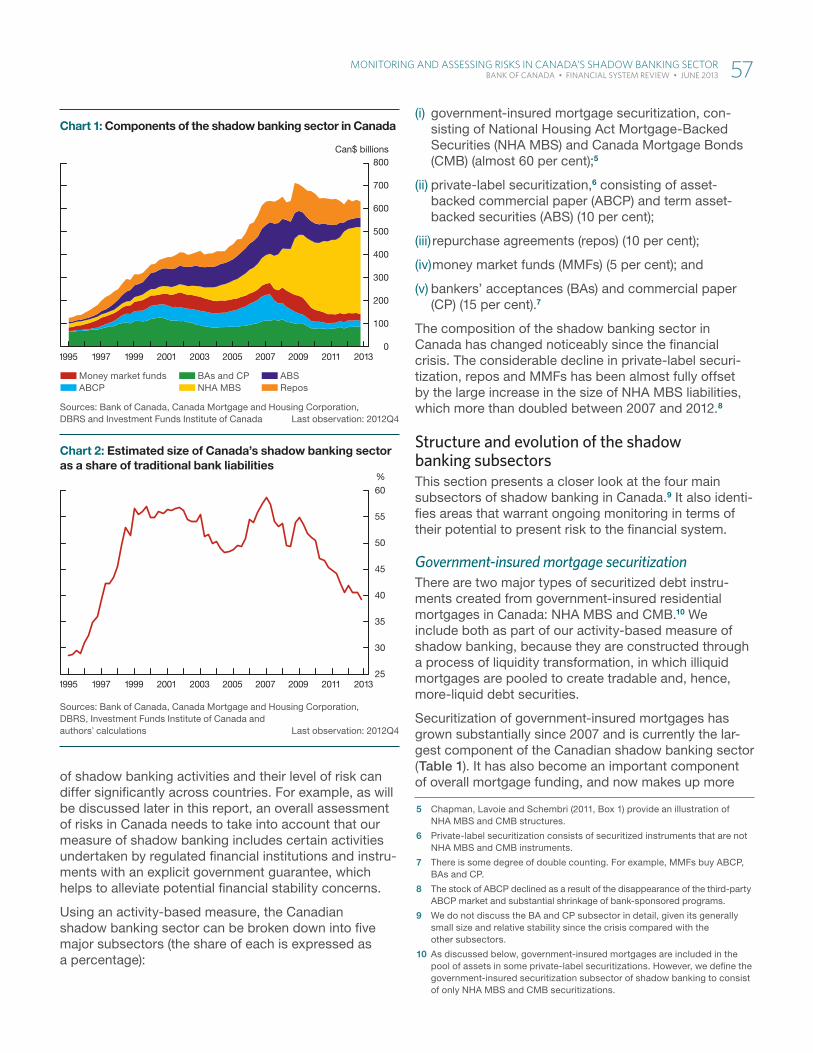
of shadow banking activities and their level of risk can differ significantly across countries. For example, as will be discussed later in this report, an overall assessment of risks in Canada needs to take into account that our measure of shadow banking includes certain activities undertaken by regulated financial institutions and instru-ments with an explicit government guarantee, which helps to alleviate potential financial stability concerns.
Using an activity-based measure, the Canadian shadow banking sector can be broken down into five major subsectors (the share of each is expressed as a percentage):
(i) government-insured mortgage securitization, con-sisting of National Housing Act Mortgage-Backed Securities (NHA MBS) and Canada Mortgage Bonds (CMB) (almost 60 per cent);5
(ii) private-label securitization,6 consisting of asset-backed commercial paper (ABCP) and term asset-backed securities (ABS) (10 per cent);
(iii) repurchase agreements (repos) (10 per cent);
(iv) money market funds (MMFs) (5 per cent); and
(v) bankers’ acceptances (BAs) and commercial paper (CP) (15 per cent).7
The composition of the shadow banking sector in Canada has changed noticeably since the financial crisis. The considerable decline in private-label securi-tization, repos and MMFs has been almost fully offset by the large increase in the size of NHA MBS liabilities, which more than doubled between 2007 and 2012.8
Structure and evolution of the shadow banking subsectorsThis section presents a closer look at the four main subsectors of shadow banking in Canada.9 It also identi-fies areas that warrant ongoing monitoring in terms of their potential to present risk to the financial system.
Government-insured mortgage securitizationThere are two major types of securitized debt instru-ments created from government-insured residential mortgages in Canada: NHA MBS and CMB.10 We include both as part of our activity-based measure of shadow banking, because they are constructed through a process of liquidity transformation, in which illiquid mortgages are pooled to create tradable and, hence, more-liquid debt securities.
Securitization of government-insured mortgages has grown substantially since 2007 and is currently the lar-gest component of the Canadian shadow banking sector (Table 1). It has also become an important component of overall mortgage funding, and now makes up more
5 Chapman, Lavoie and Schembri (2011, Box 1) provide an illustration of NHA MBS and CMB structures.
6 Private-label securitization consists of securitized instruments that are not NHA MBS and CMB instruments.
7 There is some degree of double counting. For example, MMFs buy ABCP, BAs and CP.
8 The stock of ABCP declined as a result of the disappearance of the third-party ABCP market and substantial shrinkage of bank-sponsored programs.
9 We do not discuss the BA and CP subsector in detail, given its generally small size and relative stability since the crisis compared with the other subsectors.
10 As discussed below, government-insured mortgages are included in the pool of assets in some private-label securitizations. However, we define the government-insured securitization subsector of shadow banking to consist of only NHA MBS and CMB securitizations.
Sources: Bank of Canada, Canada Mortgage and Housing Corporation, DBRS and Investment Funds Institute of Canada Last observation: 2012Q4
Money market funds ABCP
BAs and CP NHA MBS
ABS Repos
1995 1997 1999 2001 2003 2005 2007 2009 2011 20130
100
200
300
400
500
600
700
800Can$ billions
Chart 1: Components of the shadow banking sector in Canada
Sources: Bank of Canada, Canada Mortgage and Housing Corporation, DBRS, Investment Funds Institute of Canada and authors’ calculations Last observation: 2012Q4
25
30
35
40
45
50
55
60%
1995 1997 1999 2001 2003 2005 2007 2009 2011 2013
Chart 2: Estimated size of Canada’s shadow banking sector as a share of traditional bank liabilities
MonitoRing And ASSeSSing RiSkS in CAnAdA’S ShAdow BAnking SeCtoR 57 BANK OF CANADA • FiNANCiAl SyStem Review • JuNe 2013
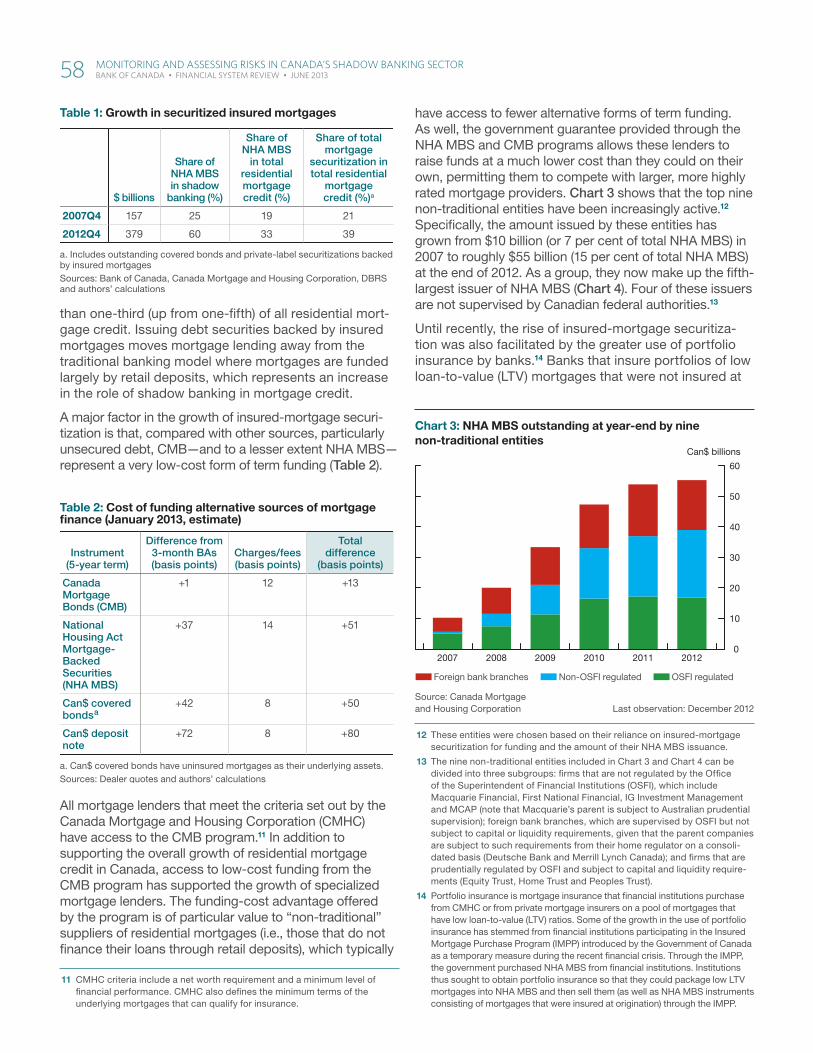
than one-third (up from one-fifth) of all residential mort-gage credit. Issuing debt securities backed by insured mortgages moves mortgage lending away from the traditional banking model where mortgages are funded largely by retail deposits, which represents an increase in the role of shadow banking in mortgage credit.
A major factor in the growth of insured-mortgage securi-tization is that, compared with other sources, particularly unsecured debt, CMB—and to a lesser extent NHA MBS—represent a very low-cost form of term funding (Table 2).
All mortgage lenders that meet the criteria set out by the Canada Mortgage and Housing Corporation (CMHC) have access to the CMB program.11 In addition to supporting the overall growth of residential mortgage credit in Canada, access to low-cost funding from the CMB program has supported the growth of specialized mortgage lenders. The funding-cost advantage offered by the program is of particular value to “non-traditional” suppliers of residential mortgages (i.e., those that do not finance their loans through retail deposits), which typically
11 CMHC criteria include a net worth requirement and a minimum level of financial performance. CMHC also defines the minimum terms of the underlying mortgages that can qualify for insurance.
have access to fewer alternative forms of term funding. As well, the government guarantee provided through the NHA MBS and CMB programs allows these lenders to raise funds at a much lower cost than they could on their own, permitting them to compete with larger, more highly rated mortgage providers. Chart 3 shows that the top nine non-traditional entities have been increasingly active.12 Specifically, the amount issued by these entities has grown from $10 billion (or 7 per cent of total NHA MBS) in 2007 to roughly $55 billion (15 per cent of total NHA MBS) at the end of 2012. As a group, they now make up the fifth-largest issuer of NHA MBS (Chart 4). Four of these issuers are not supervised by Canadian federal authorities.13
Until recently, the rise of insured-mortgage securitiza-tion was also facilitated by the greater use of portfolio insurance by banks.14 Banks that insure portfolios of low loan-to-value (LTV) mortgages that were not insured at
12 These entities were chosen based on their reliance on insured-mortgage securitization for funding and the amount of their NHA MBS issuance.
13 The nine non-traditional entities included in Chart 3 and Chart 4 can be divided into three subgroups: firms that are not regulated by the Office of the Superintendent of Financial Institutions (OSFI), which include Macquarie Financial, First National Financial, IG Investment Management and MCAP (note that Macquarie’s parent is subject to Australian prudential supervision); foreign bank branches, which are supervised by OSFI but not subject to capital or liquidity requirements, given that the parent companies are subject to such requirements from their home regulator on a consoli-dated basis (Deutsche Bank and Merrill Lynch Canada); and firms that are prudentially regulated by OSFI and subject to capital and liquidity require-ments (Equity Trust, Home Trust and Peoples Trust).
14 Portfolio insurance is mortgage insurance that financial institutions purchase from CMHC or from private mortgage insurers on a pool of mortgages that have low loan-to-value (LTV) ratios. Some of the growth in the use of portfolio insurance has stemmed from financial institutions participating in the Insured Mortgage Purchase Program (IMPP) introduced by the Government of Canada as a temporary measure during the recent financial crisis. Through the IMPP, the government purchased NHA MBS from financial institutions. Institutions thus sought to obtain portfolio insurance so that they could package low LTV mortgages into NHA MBS and then sell them (as well as NHA MBS instruments consisting of mortgages that were insured at origination) through the IMPP.
Table 1: Growth in securitized insured mortgages
$ billions
Share of NHA MBS in shadow
banking (%)
Share of NHA MBS
in total residential mortgage credit (%)
Share of total mortgage
securitization in total residential
mortgage credit (%)a
2007Q4 157 25 19 21
2012Q4 379 60 33 39
a. Includes outstanding covered bonds and private-label securitizations backed by insured mortgagesSources: Bank of Canada, Canada Mortgage and Housing Corporation, DBRS and authors’ calculations
Table 2: Cost of funding alternative sources of mortgage fi nance (January 2013, estimate)
Instrument (5-year term)
Difference from 3-month BAs (basis points)
Charges/fees (basis points)
Total difference
(basis points)
Canada Mortgage Bonds (CMB)
+1 12 +13
National Housing Act Mortgage-Backed Securities (NHA MBS)
+37 14 +51
Can$ covered bonds a
+42 8 +50
Can$ deposit note
+72 8 +80
a. Can$ covered bonds have uninsured mortgages as their underlying assets.Sources: Dealer quotes and authors’ calculations
Source: Canada Mortgage and Housing Corporation Last observation: December 2012
Foreign bank branches Non-OSFI regulated OSFI regulated
0
10
20
30
40
50
60
2007 2008 2009 2010 2011 2012
Can$ billions
Chart 3: NHA MBS outstanding at year-end by nine non-traditional entities
58 MonitoRing And ASSeSSing RiSkS in CAnAdA’S ShAdow BAnking SeCtoR BANK OF CANADA • FiNANCiAl SyStem Review • JuNe 2013
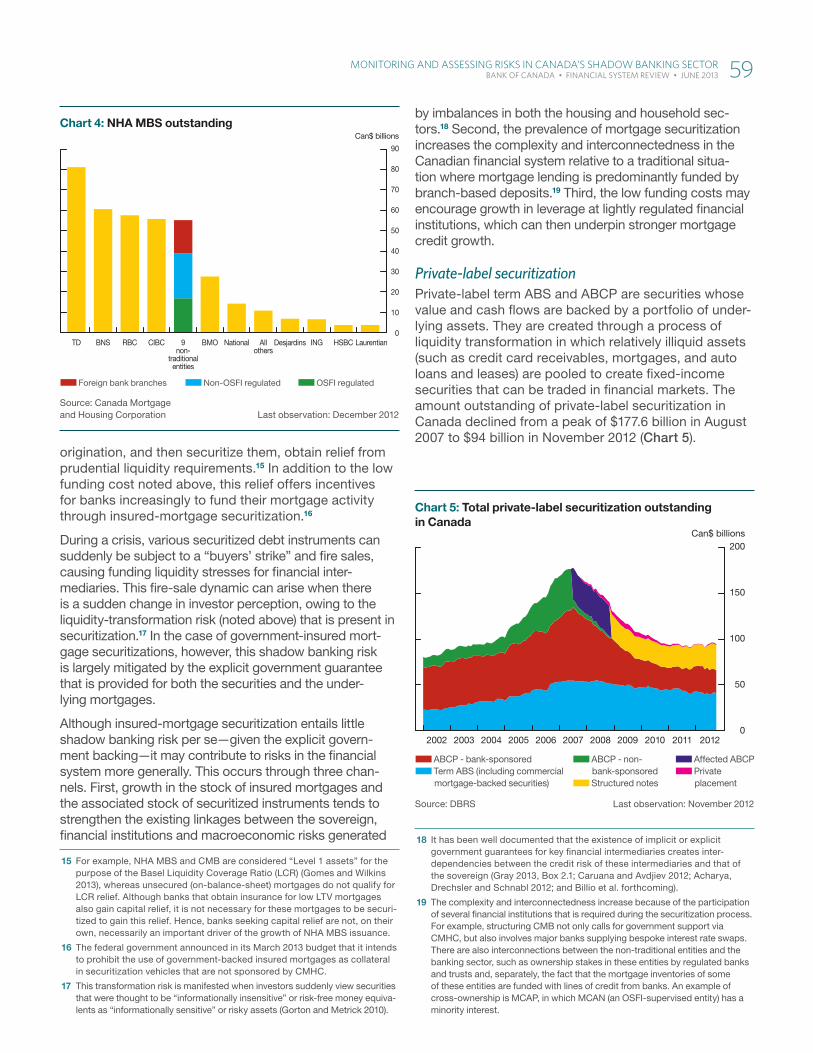
origination, and then securitize them, obtain relief from prudential liquidity requirements.15 In addition to the low funding cost noted above, this relief offers incentives for banks increasingly to fund their mortgage activity through insured-mortgage securitization.16
During a crisis, various securitized debt instruments can suddenly be subject to a “buyers’ strike” and fire sales, causing funding liquidity stresses for financial inter-mediaries. This fire-sale dynamic can arise when there is a sudden change in investor perception, owing to the liquidity-transformation risk (noted above) that is present in securitization.17 In the case of government-insured mort-gage securitizations, however, this shadow banking risk is largely mitigated by the explicit government guarantee that is provided for both the securities and the under-lying mortgages.
Although insured-mortgage securitization entails little shadow banking risk per se—given the explicit govern-ment backing—it may contribute to risks in the financial system more generally. This occurs through three chan-nels. First, growth in the stock of insured mortgages and the associated stock of securitized instruments tends to strengthen the existing linkages between the sovereign, financial institutions and macroeconomic risks generated
15 For example, NHA MBS and CMB are considered “Level 1 assets” for the purpose of the Basel Liquidity Coverage Ratio (LCR) (Gomes and Wilkins 2013), whereas unsecured (on-balance-sheet) mortgages do not qualify for LCR relief. Although banks that obtain insurance for low LTV mortgages also gain capital relief, it is not necessary for these mortgages to be securi-tized to gain this relief. Hence, banks seeking capital relief are not, on their own, necessarily an important driver of the growth of NHA MBS issuance.
16 The federal government announced in its March 2013 budget that it intends to prohibit the use of government-backed insured mortgages as collateral in securitization vehicles that are not sponsored by CMHC.
17 This transformation risk is manifested when investors suddenly view securities that were thought to be “informationally insensitive” or risk-free money equiva-lents as “informationally sensitive” or risky assets (Gorton and Metrick 2010).
by imbalances in both the housing and household sec-tors.18 Second, the prevalence of mortgage securitization increases the complexity and interconnectedness in the Canadian financial system relative to a traditional situa-tion where mortgage lending is predominantly funded by branch-based deposits.19 Third, the low funding costs may encourage growth in leverage at lightly regulated financial institutions, which can then underpin stronger mortgage credit growth.
Private-label securitizationPrivate-label term ABS and ABCP are securities whose value and cash flows are backed by a portfolio of under-lying assets. They are created through a process of liquidity transformation in which relatively illiquid assets (such as credit card receivables, mortgages, and auto loans and leases) are pooled to create fixed-income securities that can be traded in financial markets. The amount outstanding of private-label securitization in Canada declined from a peak of $177.6 billion in August 2007 to $94 billion in November 2012 (Chart 5).
18 It has been well documented that the existence of implicit or explicit government guarantees for key financial intermediaries creates inter-dependencies between the credit risk of these intermediaries and that of the sovereign (Gray 2013, Box 2.1; Caruana and Avdjiev 2012; Acharya, Drechsler and Schnabl 2012; and Billio et al. forthcoming).
19 The complexity and interconnectedness increase because of the participation of several financial institutions that is required during the securitization process. For example, structuring CMB not only calls for government support via CMHC, but also involves major banks supplying bespoke interest rate swaps. There are also interconnections between the non-traditional entities and the banking sector, such as ownership stakes in these entities by regulated banks and trusts and, separately, the fact that the mortgage inventories of some of these entities are funded with lines of credit from banks. An example of cross-ownership is MCAP, in which MCAN (an OSFI-supervised entity) has a minority interest.
Source: Canada Mortgage and Housing Corporation Last observation: December 2012
Foreign bank branches Non-OSFI regulated OSFI regulated
0
10
20
30
40
50
60
70
80
90
TD BNS RBC CIBC BMO National Allothers
9non-
traditionalentities
Desjardins ING HSBC Laurentian
Can$ billions
Chart 4: NHA MBS outstanding
Source: DBRS Last observation: November 2012
ABCP - bank-sponsored Term ABS (including commercial mortgage-backed securities)
ABCP - non-bank-sponsored
Structured notes
Affected ABCP Private placement
0
50
100
150
200
2002 2003 2004 2005 2006 2007 2008 2009 2010 2011 2012
Can$ billions
Chart 5: Total private-label securitization outstanding in Canada
MonitoRing And ASSeSSing RiSkS in CAnAdA’S ShAdow BAnking SeCtoR 59 BANK OF CANADA • FiNANCiAl SyStem Review • JuNe 2013
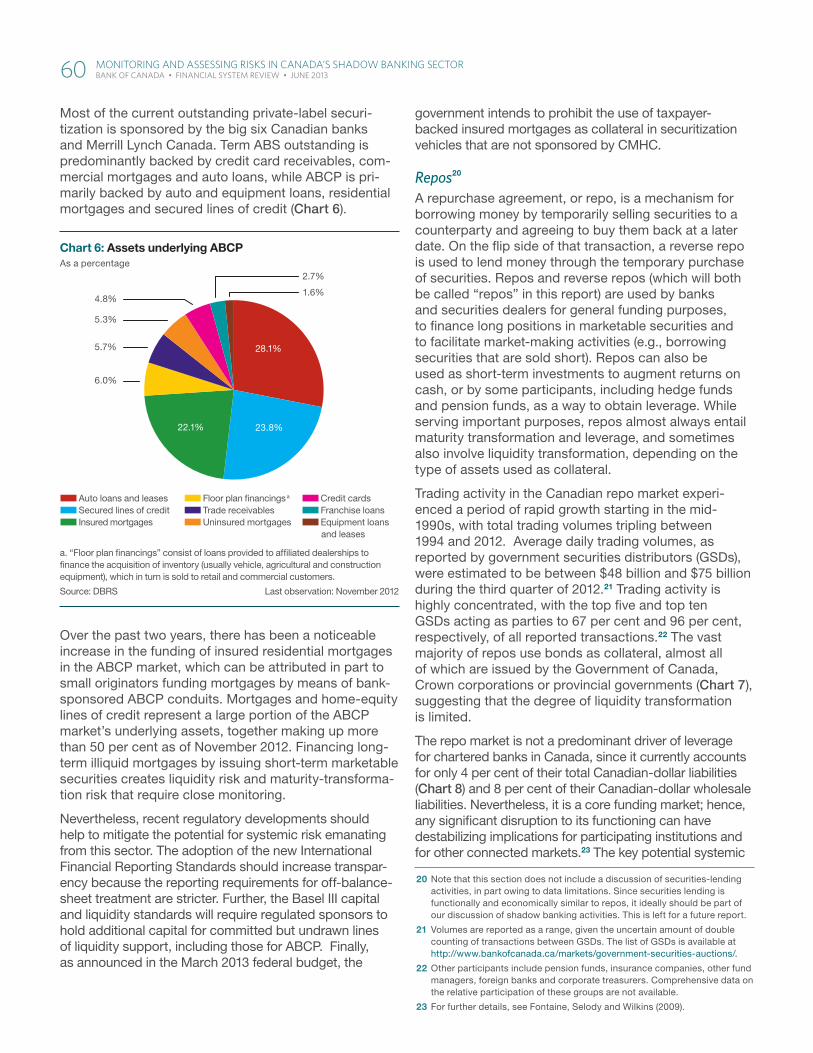
Most of the current outstanding private-label securi-tization is sponsored by the big six Canadian banks and Merrill Lynch Canada. Term ABS outstanding is predominantly backed by credit card receivables, com-mercial mortgages and auto loans, while ABCP is pri-marily backed by auto and equipment loans, residential mortgages and secured lines of credit (Chart 6).
Over the past two years, there has been a noticeable increase in the funding of insured residential mortgages in the ABCP market, which can be attributed in part to small originators funding mortgages by means of bank-sponsored ABCP conduits. Mortgages and home-equity lines of credit represent a large portion of the ABCP market’s underlying assets, together making up more than 50 per cent as of November 2012. Financing long-term illiquid mortgages by issuing short-term marketable securities creates liquidity risk and maturity-transforma-tion risk that require close monitoring.
Nevertheless, recent regulatory developments should help to mitigate the potential for systemic risk emanating from this sector. The adoption of the new International Financial Reporting Standards should increase transpar-ency because the reporting requirements for off-balance-sheet treatment are stricter. Further, the Basel III capital and liquidity standards will require regulated sponsors to hold additional capital for committed but undrawn lines of liquidity support, including those for ABCP. Finally, as announced in the March 2013 federal budget, the
government intends to prohibit the use of taxpayer-backed insured mortgages as collateral in securitization vehicles that are not sponsored by CMHC.
Repos20
A repurchase agreement, or repo, is a mechanism for borrowing money by temporarily selling securities to a counterparty and agreeing to buy them back at a later date. On the flip side of that transaction, a reverse repo is used to lend money through the temporary purchase of securities. Repos and reverse repos (which will both be called “repos” in this report) are used by banks and securities dealers for general funding purposes, to finance long positions in marketable securities and to facilitate market-making activities (e.g., borrowing securities that are sold short). Repos can also be used as short-term investments to augment returns on cash, or by some participants, including hedge funds and pension funds, as a way to obtain leverage. While serving important purposes, repos almost always entail maturity transformation and leverage, and sometimes also involve liquidity transformation, depending on the type of assets used as collateral.
Trading activity in the Canadian repo market experi-enced a period of rapid growth starting in the mid-1990s, with total trading volumes tripling between 1994 and 2012. Average daily trading volumes, as reported by government securities distributors (GSDs), were estimated to be between $48 billion and $75 billion during the third quarter of 2012.21 Trading activity is highly concentrated, with the top five and top ten GSDs acting as parties to 67 per cent and 96 per cent, respectively, of all reported transactions.22 The vast majority of repos use bonds as collateral, almost all of which are issued by the Government of Canada, Crown corporations or provincial governments (Chart 7), suggesting that the degree of liquidity transformation is limited.
The repo market is not a predominant driver of leverage for chartered banks in Canada, since it currently accounts for only 4 per cent of their total Canadian-dollar liabilities (Chart 8) and 8 per cent of their Canadian-dollar wholesale liabilities. Nevertheless, it is a core funding market; hence, any significant disruption to its functioning can have destabilizing implications for participating institutions and for other connected markets.23 The key potential systemic
20 Note that this section does not include a discussion of securities-lending activities, in part owing to data limitations. Since securities lending is functionally and economically similar to repos, it ideally should be part of our discussion of shadow banking activities. This is left for a future report.
21 Volumes are reported as a range, given the uncertain amount of double counting of transactions between GSDs. The list of GSDs is available at http://www.bankofcanada.ca/markets/government-securities-auctions/.
22 Other participants include pension funds, insurance companies, other fund managers, foreign banks and corporate treasurers. Comprehensive data on the relative participation of these groups are not available.
23 For further details, see Fontaine, Selody and Wilkins (2009).
a. “Floor plan fi nancings” consist of loans provided to affi liated dealerships to fi nance the acquisition of inventory (usually vehicle, agricultural and construction equipment), which in turn is sold to retail and commercial customers.
Source: DBRS Last observation: November 2012
Auto loans and leases Secured lines of credit Insured mortgages
Floor plan fi nancings a
Trade receivables Uninsured mortgages
Credit cards Franchise loans Equipment loans and leases
6.0%
5.7%
5.3%
4.8%1.6%
2.7%
28.1%
22.1% 23.8%
Chart 6: Assets underlying ABCPAs a percentage
60 MonitoRing And ASSeSSing RiSkS in CAnAdA’S ShAdow BAnking SeCtoR BANK OF CANADA • FiNANCiAl SyStem Review • JuNe 2013
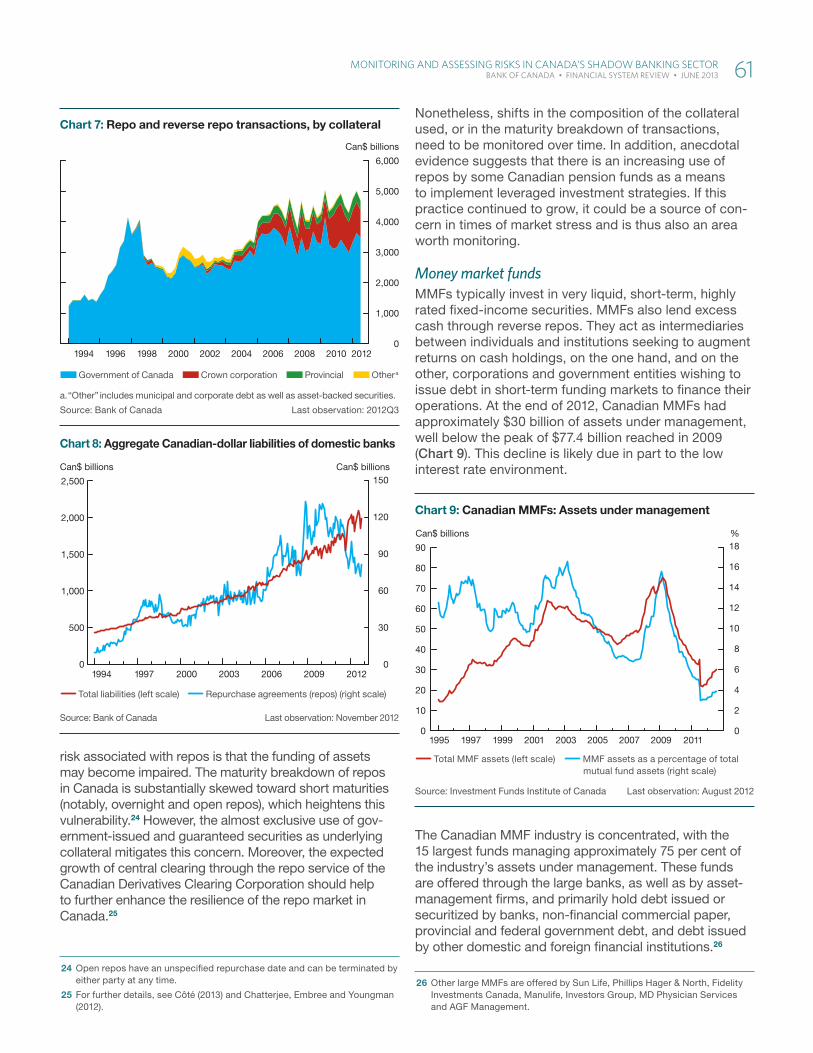
risk associated with repos is that the funding of assets may become impaired. The maturity breakdown of repos in Canada is substantially skewed toward short maturities (notably, overnight and open repos), which heightens this vulnerability.24 However, the almost exclusive use of gov-ernment-issued and guaranteed securities as underlying collateral mitigates this concern. Moreover, the expected growth of central clearing through the repo service of the Canadian Derivatives Clearing Corporation should help to further enhance the resilience of the repo market in Canada.25
24 Open repos have an unspecified repurchase date and can be terminated by either party at any time.
25 For further details, see Côté (2013) and Chatterjee, Embree and Youngman (2012).
Nonetheless, shifts in the composition of the collateral used, or in the maturity breakdown of transactions, need to be monitored over time. In addition, anecdotal evidence suggests that there is an increasing use of repos by some Canadian pension funds as a means to implement leveraged investment strategies. If this practice continued to grow, it could be a source of con-cern in times of market stress and is thus also an area worth monitoring.
Money market fundsMMFs typically invest in very liquid, short-term, highly rated fixed-income securities. MMFs also lend excess cash through reverse repos. They act as intermediaries between individuals and institutions seeking to augment returns on cash holdings, on the one hand, and on the other, corporations and government entities wishing to issue debt in short-term funding markets to finance their operations. At the end of 2012, Canadian MMFs had approximately $30 billion of assets under management, well below the peak of $77.4 billion reached in 2009 (Chart 9). This decline is likely due in part to the low interest rate environment.
The Canadian MMF industry is concentrated, with the 15 largest funds managing approximately 75 per cent of the industry’s assets under management. These funds are offered through the large banks, as well as by asset-management firms, and primarily hold debt issued or securitized by banks, non-financial commercial paper, provincial and federal government debt, and debt issued by other domestic and foreign financial institutions.26
26 Other large MMFs are offered by Sun Life, Phillips Hager & North, Fidelity Investments Canada, Manulife, Investors Group, MD Physician Services and AGF Management.
Source: Investment Funds Institute of Canada Last observation: August 2012
0
10
20
30
40
50
60
70
80
90
0
2
4
6
8
10
12
14
16
18%
1995 1997 1999 2001 2003 2005 2007 2009 2011
Can$ billions
Total MMF assets (left scale) MMF assets as a percentage of total mutual fund assets (right scale)
Chart 9: Canadian MMFs: Assets under management
a. “Other” includes municipal and corporate debt as well as asset-backed securities.
Source: Bank of Canada Last observation: 2012Q3
1994 1996 1998 2000 2002 2004 2006 2008 2010 20120
1,000
2,000
3,000
4,000
5,000
6,000
Can$ billions
Government of Canada Crown corporation Provincial Other a
Chart 7: Repo and reverse repo transactions, by collateral
Source: Bank of Canada Last observation: November 2012
0
30
60
90
120
150
1994 1997 2000 2003 2006 2009 2012
Can$ billionsCan$ billions
0
500
1,000
1,500
2,000
2,500
Chart 8: Aggregate Canadian-dollar liabilities of domestic banks
Total liabilities (left scale) Repurchase agreements (repos) (right scale)
MonitoRing And ASSeSSing RiSkS in CAnAdA’S ShAdow BAnking SeCtoR 61 BANK OF CANADA • FiNANCiAl SyStem Review • JuNe 2013
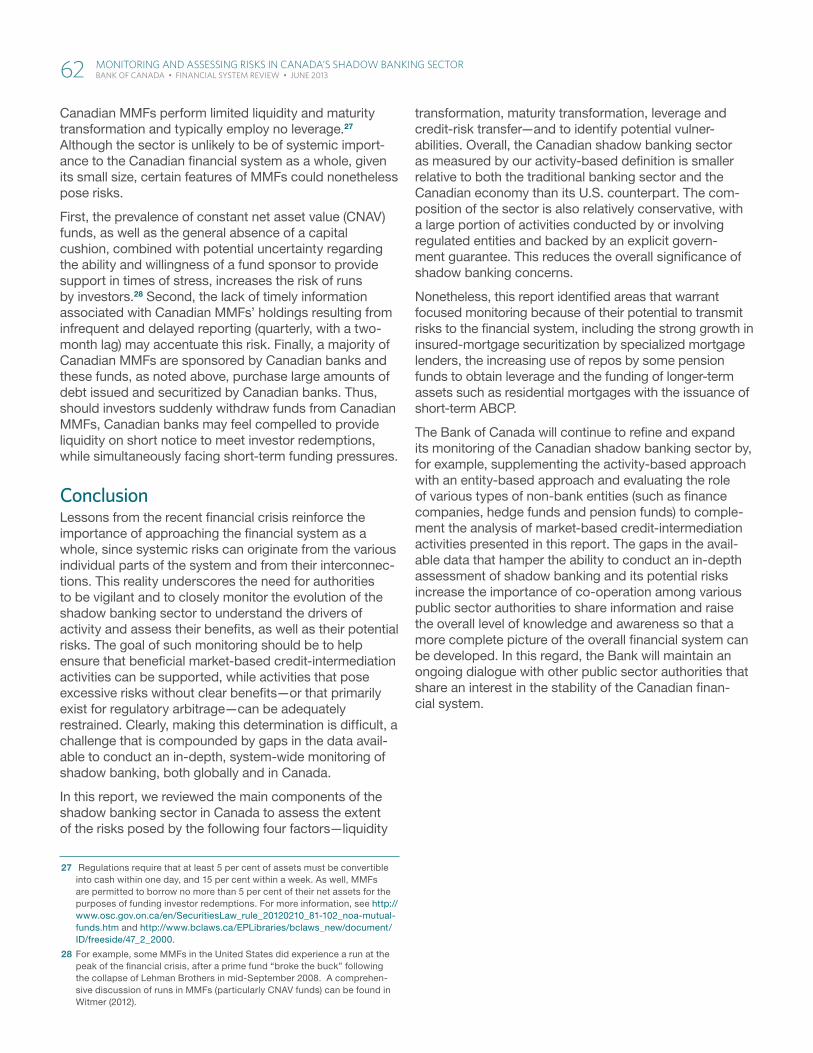
Canadian MMFs perform limited liquidity and maturity transformation and typically employ no leverage.27 Although the sector is unlikely to be of systemic import-ance to the Canadian financial system as a whole, given its small size, certain features of MMFs could nonetheless pose risks.
First, the prevalence of constant net asset value (CNAV) funds, as well as the general absence of a capital cushion, combined with potential uncertainty regarding the ability and willingness of a fund sponsor to provide support in times of stress, increases the risk of runs by investors.28 Second, the lack of timely information associated with Canadian MMFs’ holdings resulting from infrequent and delayed reporting (quarterly, with a two-month lag) may accentuate this risk. Finally, a majority of Canadian MMFs are sponsored by Canadian banks and these funds, as noted above, purchase large amounts of debt issued and securitized by Canadian banks. Thus, should investors suddenly withdraw funds from Canadian MMFs, Canadian banks may feel compelled to provide liquidity on short notice to meet investor redemptions, while simultaneously facing short-term funding pressures.
ConclusionLessons from the recent financial crisis reinforce the importance of approaching the financial system as a whole, since systemic risks can originate from the various individual parts of the system and from their interconnec-tions. This reality underscores the need for authorities to be vigilant and to closely monitor the evolution of the shadow banking sector to understand the drivers of activity and assess their benefits, as well as their potential risks. The goal of such monitoring should be to help ensure that beneficial market-based credit-intermediation activities can be supported, while activities that pose excessive risks without clear benefits—or that primarily exist for regulatory arbitrage—can be adequately restrained. Clearly, making this determination is difficult, a challenge that is compounded by gaps in the data avail-able to conduct an in-depth, system-wide monitoring of shadow banking, both globally and in Canada.
In this report, we reviewed the main components of the shadow banking sector in Canada to assess the extent of the risks posed by the following four factors—liquidity
27 Regulations require that at least 5 per cent of assets must be convertible into cash within one day, and 15 per cent within a week. As well, MMFs are permitted to borrow no more than 5 per cent of their net assets for the purposes of funding investor redemptions. For more information, see http://www.osc.gov.on.ca/en/SecuritiesLaw_rule_20120210_81-102_noa-mutual-funds.htm and http://www.bclaws.ca/EPLibraries/bclaws_new/document/ID/freeside/47_2_2000.
28 For example, some MMFs in the United States did experience a run at the peak of the financial crisis, after a prime fund “broke the buck” following the collapse of Lehman Brothers in mid-September 2008. A comprehen-sive discussion of runs in MMFs (particularly CNAV funds) can be found in Witmer (2012).
transformation, maturity transformation, leverage and credit-risk transfer—and to identify potential vulner-abilities. Overall, the Canadian shadow banking sector as measured by our activity-based definition is smaller relative to both the traditional banking sector and the Canadian economy than its U.S. counterpart. The com-position of the sector is also relatively conservative, with a large portion of activities conducted by or involving regulated entities and backed by an explicit govern-ment guarantee. This reduces the overall significance of shadow banking concerns.
Nonetheless, this report identified areas that warrant focused monitoring because of their potential to transmit risks to the financial system, including the strong growth in insured-mortgage securitization by specialized mortgage lenders, the increasing use of repos by some pension funds to obtain leverage and the funding of longer-term assets such as residential mortgages with the issuance of short-term ABCP.
The Bank of Canada will continue to refine and expand its monitoring of the Canadian shadow banking sector by, for example, supplementing the activity-based approach with an entity-based approach and evaluating the role of various types of non-bank entities (such as finance companies, hedge funds and pension funds) to comple-ment the analysis of market-based credit-intermediation activities presented in this report. The gaps in the avail-able data that hamper the ability to conduct an in-depth assessment of shadow banking and its potential risks increase the importance of co-operation among various public sector authorities to share information and raise the overall level of knowledge and awareness so that a more complete picture of the overall financial system can be developed. In this regard, the Bank will maintain an ongoing dialogue with other public sector authorities that share an interest in the stability of the Canadian finan-cial system.
62 MonitoRing And ASSeSSing RiSkS in CAnAdA’S ShAdow BAnking SeCtoR BANK OF CANADA • FiNANCiAl SyStem Review • JuNe 2013
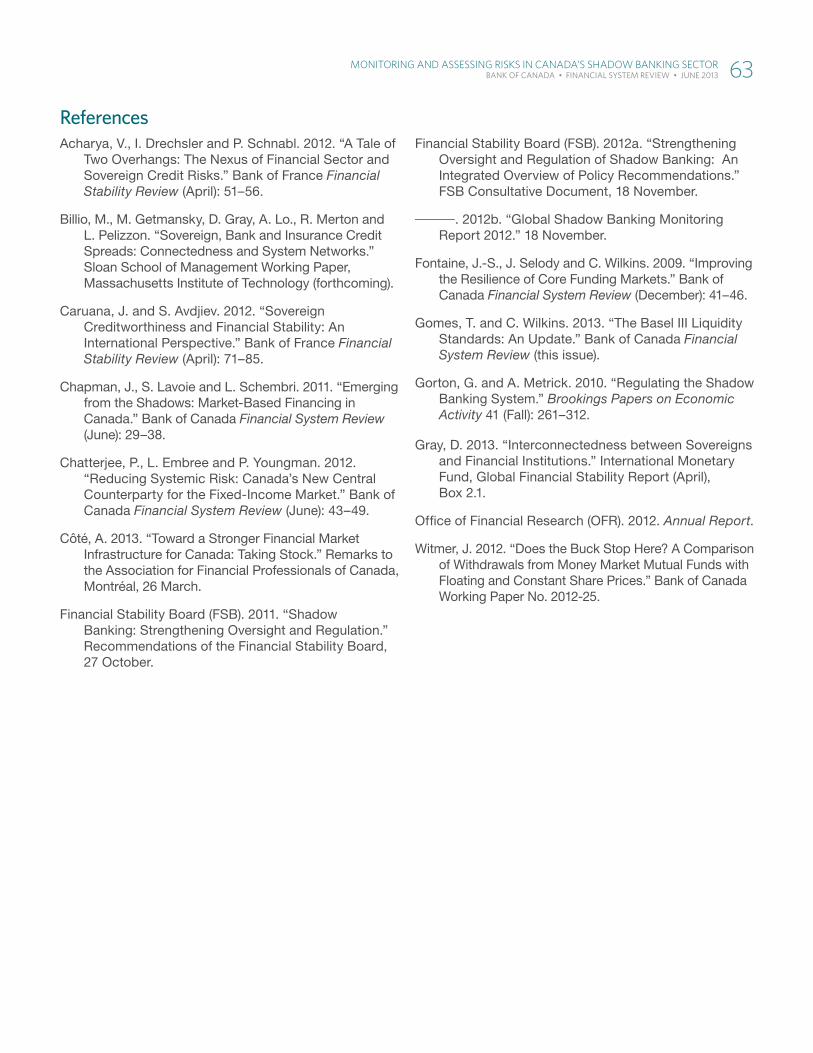
ReferencesAcharya, V., I. Drechsler and P. Schnabl. 2012. “A Tale of
Two Overhangs: The Nexus of Financial Sector and Sovereign Credit Risks.” Bank of France Financial Stability Review (April): 51–56.
Billio, M., M. Getmansky, D. Gray, A. Lo., R. Merton and L. Pelizzon. “Sovereign, Bank and Insurance Credit Spreads: Connectedness and System Networks.” Sloan School of Management Working Paper, Massachusetts Institute of Technology (forthcoming).
Caruana, J. and S. Avdjiev. 2012. “Sovereign Creditworthiness and Financial Stability: An International Perspective.” Bank of France Financial Stability Review (April): 71–85.
Chapman, J., S. Lavoie and L. Schembri. 2011. “Emerging from the Shadows: Market-Based Financing in Canada.” Bank of Canada Financial System Review (June): 29–38.
Chatterjee, P., L. Embree and P. Youngman. 2012. “Reducing Systemic Risk: Canada’s New Central Counterparty for the Fixed-Income Market.” Bank of Canada Financial System Review (June): 43–49.
Côté, A. 2013. “Toward a Stronger Financial Market Infrastructure for Canada: Taking Stock.” Remarks to the Association for Financial Professionals of Canada, Montréal, 26 March.
Financial Stability Board (FSB). 2011. “Shadow Banking: Strengthening Oversight and Regulation.” Recommendations of the Financial Stability Board, 27 October.
Financial Stability Board (FSB). 2012a. “Strengthening Oversight and Regulation of Shadow Banking: An Integrated Overview of Policy Recommendations.” FSB Consultative Document, 18 November.
—. 2012b. “Global Shadow Banking Monitoring Report 2012.” 18 November.
Fontaine, J.-S., J. Selody and C. Wilkins. 2009. “Improving the Resilience of Core Funding Markets.” Bank of Canada Financial System Review (December): 41–46.
Gomes, T. and C. Wilkins. 2013. “The Basel III Liquidity Standards: An Update.” Bank of Canada Financial System Review (this issue).
Gorton, G. and A. Metrick. 2010. “Regulating the Shadow Banking System.” Brookings Papers on Economic Activity 41 (Fall): 261–312.
Gray, D. 2013. “Interconnectedness between Sovereigns and Financial Institutions.” International Monetary Fund, Global Financial Stability Report (April), Box 2.1.
Office of Financial Research (OFR). 2012. Annual Report.
Witmer, J. 2012. “Does the Buck Stop Here? A Comparison of Withdrawals from Money Market Mutual Funds with Floating and Constant Share Prices.” Bank of Canada Working Paper No. 2012-25.
MonitoRing And ASSeSSing RiSkS in CAnAdA’S ShAdow BAnking SeCtoR 63 BANK OF CANADA • FiNANCiAl SyStem Review • JuNe 2013

abbreviationsA more comprehensive list of financial and economic terms, as well as information on Canada’s payment, clearing and settlement systems, is available at www.bankofcanada.ca.
ABCP: asset-backed commercial paper
ABS: asset-backed securities
AFME: Association for Financial Markets in Europe
BA: bankers’ acceptance
BCBS: Basel Committee on Banking Supervision
BIS: Bank for International Settlements
CCP: central counterparty
CGFS: Committee on the Global Financial System
CMB: Canada Mortgage Bonds
CME: Chicago Mercantile Exchange
CMHC: Canada Mortgage and Housing Corporation
CNAV: constant net asset value
CP: commercial paper
CPSS: Committee on Payment and Settlement Systems
CRA: credit-rating agency
CRAG: credit-rating-assessment group
CRC: credit-ratings committee
EC: European Commission
ECB: European Central Bank
EFA: Exchange Fund Account
ESM: European Stability Mechanism
FRO: Financial Risk Office
FSA: Financial Services Authority
FSB: Financial Stability Board
G-20: Group of 20
GDP: gross domestic product
GSD: government securities distributor
HQA: high-quality assets
HQLA: high-quality liquid assets
IMF: International Monetary Fund
IMPP: Insured Mortgage Purchase Program
IOSCO: International Organization of Securities Commissions
ISDA: International Swaps and Derivatives Association, Inc.
LCR: Liquidity Coverage Ratio
LDI: liability-driven investment
LTV: loan-to-value
MBS: mortgage-backed securities
MMF: money market fund
MOU: memorandum of understanding
NHA MBS: National Housing Act Mortgage-Backed Securities
NPLs: non-performing loans
NSFR: Net Stable Funding Ratio
OECD: Organisation for Economic Co-operation and Development
OFR: Office of Financial Research
OSFI: Office of the Superintendent of Financial Institutions
OTC: over-the-counter
OTCD: OTC derivatives
PFE: potential future exposure
RBNZ: Reserve Bank of New Zealand
RG: Receiver General
RMBS: residential mortgage-backed security
S&P: Standard & Poor’s
TSLF: Term Securities Lending Facility
TSX: Toronto Stock Exchange
aBBReviatiOnS 65 BANK OF CANADA • FINANCIAL SyStEM REvIEw • JuNE 2013