Embed Size (px)
Citation preview

Financial Asset ReturnsDistributional Properties of Financial Asset Returns
Financial Time Series and Their Characteristics
Egon ZakrajsekDivision of Monetary Affairs
Federal Reserve Board
Summer School in Financial MathematicsFaculty of Mathematics & Physics
University of LjubljanaSeptember 14–19, 2009

Financial Asset ReturnsDistributional Properties of Financial Asset Returns
Basics of Asset Returns
Most financial studies involve returns—instead of prices—of assets:
Asset returns is a complete and scale-free summary of theinvestment opportunity for an average investors.
Return series have more attractive statistical properties than priceseries.
Several definitinos of asset returns.
Define,Pt = price of an asset in period t (assume no dividends)

Financial Asset ReturnsDistributional Properties of Financial Asset Returns
One-Period Simple Return
Holding the asset from one period from date t− 1 to date t wouldresult in a simple gross return:
1 +Rt =Pt
Pt−1or Pt = Pt−1(1 +Rt)
Corresponding one-period simple net return or simple return:
Rt =Pt
Pt−1− 1 =
Pt − Pt−1
Pt−1

Financial Asset ReturnsDistributional Properties of Financial Asset Returns
Multiperiod Simple Return
Holding the asset for k periods between dates t− k and t gives ak-period simple gross return:
1 +Rt[k] =Pt
Pt−k=
Pt
Pt−1× Pt−1
Pt−2× · · · × Pt−k+1
Pt−k
= (1 +Rt)(1 +Rt−1) · · · (1 +Rt−k)
=k−1∏j=0
(1 +Rt−j)
k-period simple gross return is just the product of the kone-period simple gross returns involved—compound return
k-period simple net return:
Rt[k] =Pt − Pt−k
Pt−k

Financial Asset ReturnsDistributional Properties of Financial Asset Returns
Time Interval
Actual time interval is important in discussing and comparing returns(e.g., monthly, annual).
If the time interval is not given, it is implicitly assumed to be oneyear.
If the asset was held for k years, then the annualized (average)returns is defined as
Annualized{Rt[k]} =
k−1∏j=0
(1 +Rt−j)
1/k
− 1
= exp
1k
k−1∑j=0
ln(1 +Rt−j)
− 1
Arithmetic averages are easier to compute than geometric ones!

Financial Asset ReturnsDistributional Properties of Financial Asset Returns
Continuously Compounded Returns
The natural log of the simple gross return of an asset is called thecontinuously compounded return or log return:
rt = ln(1 +Rt) = lnPt
Pt−1= pt − pt−1 where pt = lnPt
Advantages of log returns:
Easy to compute multiperiod returns:
rt[k] = ln(1 +Rt[k]) = ln [(1 +Rt)(1 +Rt−1) · · · (1 +Rt−k+1)]= rt + rt−1 + · · ·+ rt−k
More tractable statistical properties.

Financial Asset ReturnsDistributional Properties of Financial Asset Returns
Portfolio Return
The simple net return of a portfolio consisting of N assets is aweighted average of the simple net returns of the assets involved,where the weight on each asset is the fraction of the portfolio’s valueinvestment in that asset:
Rp,t =N∑
i=1
wiRit
The continuously compounded returns of a portfolio, however, do nothave this convenient property!Useful approximation:
rp,t ≈N∑
i=1
wirit if Rit ”small”

Financial Asset ReturnsDistributional Properties of Financial Asset Returns
Dividend Payments
If an asset pays dividends periodically, the definition of asset returnsmust be modified:
Dt = dividend payment of an asset between periods t− 1 and t
Pt = price of the asset at the end of period t
Total returns:
Rt =Pt +Dt
Pt−1− 1 and rt = ln(Pt +Dt)− lnPt−1
Most reference indexes include dividend payments:
German DAX index exception.
CRSP and MSCI indexes include reference indexes without(“price index”) and with dividends (“total return index”).
Financial Asset ReturnsDistributional Properties of Financial Asset Returns
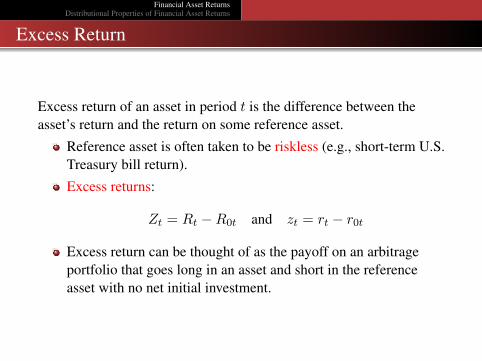
Excess Return
Excess return of an asset in period t is the difference between theasset’s return and the return on some reference asset.
Reference asset is often taken to be riskless (e.g., short-term U.S.Treasury bill return).
Excess returns:
Zt = Rt −R0t and zt = rt − r0t
Excess return can be thought of as the payoff on an arbitrageportfolio that goes long in an asset and short in the referenceasset with no net initial investment.

Financial Asset ReturnsDistributional Properties of Financial Asset Returns
Motivation
Early work in finance imposed strong assumptions on the statisticalproperties of asset returns:
Normality of log-returns:Convenient assumption for many applications (e.g.,Black-Scholes model for option pricing)Consistent with the Law of Large Numbers for stock-indexreturns
Time independency of returns:To some extent, an implications of the Efficient MarketHypothesisEMH only imposes unpredictability of returns

Financial Asset ReturnsDistributional Properties of Financial Asset Returns
Returns as Random Variable
Assume that the random variable X (i.e., log-return) has the followingcumulative distribution function (CDF):
FX(x) = Pr[X ≤ x] =∫ x
−∞fX(u)du
fX = probability distribution function (PDF) of X

Financial Asset ReturnsDistributional Properties of Financial Asset Returns
Moments of a Random Variable
The mean (expected value) of X:
µ = E[X] =∫ ∞−∞
xfX(x)dx
The variance of X:
σ2 = V [X] = E[(X − µ)2] =∫ ∞−∞
(x− µ)2fX(x)dx
The k-th noncentral moment:
mk = E[Xk] =∫ ∞−∞
xkfX(x)dx
The k-th central moment:
µk = E[(X −m1)k] =∫ ∞−∞
(x−m1)kfX(x)dx

Financial Asset ReturnsDistributional Properties of Financial Asset Returns
Skewness
The third central moment measures the skewness of the distribution:
µ3 = E[(X −m1)3]
Standardized skewness coefficient:
S[X] = E
[(X − µσ
)3]
=µ3
σ3
When S[X] is negative, large realizations of X are more oftennegative than positive (i.e., crashes are more likely than booms)
For normal distribution S[X] = 0
Financial Asset ReturnsDistributional Properties of Financial Asset Returns
Kurtosis
The fourth central moment measures the tail heaviness/peakedness ofthe distribution:
µ4 = E[(X −m1)4]
Standardized kurtosis coefficient:
K[X] = E
[(X − µσ
)4]
=µ4
σ4
Large K[X] implies that large realizations (positive or negative)are more likely to occur
For normal distribution K[X] = 3Define excess kurtosis as K[X]− 3
Financial Asset ReturnsDistributional Properties of Financial Asset Returns
Descriptive Statistics of Returns
Let {rt : t = 1, 2, . . . , T} denote a time-series of log-returns that weassume to be the realizations of a random variable.
Measures of location:Sample mean (or average) is the simplest estimate of location:
r = µ =1T
T∑t=1
rt
Mean is very sensitive to “outliers”Median (MED) is robust to outliers:
MED = Pr[rt ≤ Q(0.5)] = Pr[rt > Q(0.5)] = 0.5
Other robust measures of location: α-trimmed means andα-winsorized means

Financial Asset ReturnsDistributional Properties of Financial Asset Returns
Descriptive Statistics of Returns (cont.)
Measures of dispersion:Sample standard deviation (square root of variance) is thesimplest estimate of dispersion:
s = σ =
√√√√ 1T − 1
T∑t=1
(rt − r)2
Std. deviation is very sensitive to “outliers”Median Absolute Deviation (MAD) is robust to outliers:
MAD = med(|rt −MED|)
Under normality s = 1.4826×MAD
Inter Quartile Range (IQR) is robust to outliers:
IQR = Q(0.75)−Q(0.25)
Under normality s = IQR/1.34898

Financial Asset ReturnsDistributional Properties of Financial Asset Returns
Descriptive Statistics of Returns (cont.)
Skewness:Sample skewness coefficient is the simplest estimate ofasymmetry:
S =
√√√√ 1T
T∑t=1
[rt − rs
]3If S < 0, the distribution is skewed to the leftIf S > 0, the distribution is skewed to the right
Octile Skewness (OS) is robust to outliers:
OS =[Q(0.875)−Q(0.5)]− [Q(0.5)−Q(0.125)]
Q(0.875)−Q(0.125)
If distribution is symmetric then OS = 0−1 ≤ OS ≤ 1

Financial Asset ReturnsDistributional Properties of Financial Asset Returns
Descriptive Statistics of Returns (cont.)
Kurtosis:Sample kurtosis coefficient is the simplest estimate of asymmetry:
K =
√√√√ 1T
T∑t=1
[rt − rs
]4
If K < 3, the distribution has thinner tails than normalIf K > 3, the distribution has thicker tails than normal
Left/Right Quantile Weights (LQW/RQW) are robust to outliers:
LQW =
[Q(
0.8752
)+Q
(0.125
2
)]−Q(0.25)
Q(
0.8752
)−Q
(0.125
2
)RQW =
[Q(
1+0.8752
)+Q
(1− 0.875
2
)]−Q(0.75)
Q(
1+0.8752
)−Q
(1− 0.875
2
)Distinguishes left and right tail heaviness−1 < LQW, RQW < 1

Financial Asset ReturnsDistributional Properties of Financial Asset Returns
Distribution of Sample Moments
Under normality, the following results hold as T →∞:√T (µ− µ) ∼ N(0, σ2)√T (σ2 − σ2) ∼ N(0, 2σ4)√T (S − 0) ∼ N(0, 6)√T (K − 3) ∼ N(0, 24)
These asymptotic results for the sample moments can be used toperform statistical tests about the distribution of returns.

Financial Asset ReturnsDistributional Properties of Financial Asset Returns
Tests of Normality
We consider unconditional normality of the return series{rt : t = 1, 2, . . . , T}.Three broad classes of tests for the null hypothesis of normality:
Moments of the distribution (Jarque-Bera; Doornik & Hansen)
Properties of the empirical distribution function(Kolmogorov-Smirnov; Anderson-Darling; Cramer-von Mises)
Properties of the ranked series (Shapiro-Wilk)

Financial Asset ReturnsDistributional Properties of Financial Asset Returns
Jarque-Bera (1987) Test
Based on the idea that under the null hypothesis, skewness and excesskurtosis are jointly equal to zero.
Jarque-Bera test statistic:
JB = T
[S2
6+
(K − 3)2
24
]
Under the null hypothesis JB ∼ χ2(2)Doornik & Hansen (2008) test is based on transformations of Sand K that are much closer to normality

Financial Asset ReturnsDistributional Properties of Financial Asset Returns
Kolmogorov-Smirnov (1933) Test
Compares the empirical distribution function (EDF) with with anassumed theoretical CDF F ∗(x; θ) (i.e., normal distribution)
The return series {rt : t = 1, 2, . . . , T} is drawn from anunknown CDF Fr(·)Approximate Fr by its EDF Gr:
Gr(x) =1T
T∑t=1
I(rt ≤ x)
Compare the EDF with F ∗(x; θ) to see if they are “close:”
H0 : Gr(x) = F ∗(x; θ) ∀xHA : Gr(x) 6= F ∗(x; θ) for at least one value of x

Financial Asset ReturnsDistributional Properties of Financial Asset Returns
Kolmogorov-Smirnov (1933) Test (cont.)
Kolmogorov-Smirnov test statistic:
KS = supx|F ∗(x; θ)−Gr(x)|
Critical values have been tabulated for known µ and σ2
Lilliefors modification of the Kolmogorov-Smirnov test whentesting against N(µ, σ2)