Embed Size (px)
Citation preview

A SURVEY OF ADULTS IN AUSTRALIA
APRIL 2018
FINANCIAL WELLBEING
Contributing researchers
Stephen Prendergast
David Blackmore
Emeritus Professor Elaine Kempson Personal Finance Research Centre (PFRC), University of Bristol
Professor Roslyn Russell and Jozica Kutin RMIT University
Survey design and fieldwork
Campbell White Julie Harris
Australia steering committee
Gerard Brody, Consumer Action Law Centre Robert Drake, (formerly) Financial Literacy Australia Laura Higgins, Australian Securities and Investments Commission (ASIC) Professor Roslyn Russell, RMIT University
ANZ project team
Financial Inclusion: Michelle Commandeur and Margaret Dwyer
Research and Insights: Simon Edwards and Myra Foley
Design and editorial
Loud&Clear and Emily Ross Bespoke
For further information
Separate reports (including accessible versions) outlining key findings in Australia and New Zealand can be found at bluenotes.anz.com/financialwellbeing
ANZ welcomes your comments and queries about this survey. Please contact:
Michelle Commandeur ANZ Head of Financial Inclusion [email protected]
Cover photo: Sarah-Kate’s mother Sharon recently participated in Saver Plus, ANZ’s flagship program to support savings and financial wellbeing in the Australian community. www.anz.com/saverplus
© ANZ Banking Group Limited, published April 2018
WITH SPECIAL THANKS
2
CONTENTS
Foreword 4
Executive summary 5
Financial wellbeing in Australia at a glance 8
Updating our survey 10
Survey design 14
Key findings 15
Conclusion 30
Appendices
1. Literature review
Financial Wellbeing: Evolution of the concept, meaning and application 31
What does it mean to have financial wellbeing? 32
Evolution of the financial wellbeing concept 32 Financial literacy Financial capability Financial wellbeing
What are the drivers of financial wellbeing? 34 Socio-economic factors Individual factors
Australian initiatives to support financial wellbeing 36
Bibliography 37
2. Survey methodology 39
3. Technical appendix 40
3
FOREWORD
This survey is the sixth in a series which has explored financial literacy, attitudes and behaviours since 2002.
1 University of Bristol, School of Geographical Sciences
2 Kempson, Elaine & Finney, Andrea & Poppe, Christian (2017). Financial Well-Being A Conceptual Model and Preliminary Analysis. 10.13140/RG.2.2.18737.68961.
Our survey has evolved to encompass a broader view of financial wellbeing, informed by the work of Professor Elaine Kempson and other international and domestic thought leaders. Thanks to Professor Kempson for her guidance, to YouGovGalaxy for conducting the survey in Australia and New Zealand, and to long-time research contributors Stephen Prendergast (Prescience Research) and David Blackmore for their high quality analysis over many years.
Our Australian steering committee members have provided invaluable insights as we have transitioned to this new survey. Laura Higgins (Senior Executive Leader, Financial Capability) and the team at ASIC have provided helpful guidance and support and a willingness to share their own learnings in the spirit of collaboration and co-design.
Special thanks also to Gerard Brody (CEO, Consumer Action Law Centre), Robert Drake (until very recently General Manager, Grants at Financial Literacy Australia) and Professor Roslyn Russell (RMIT University).
Finally, thanks to the participants across Australia and New Zealand, from Perth to Dunedin, of all backgrounds and ages, who have given their time to this survey and so graciously shared details of their financial circumstances, habits and attitudes.
FINANCIAL WELLBEING SCORE
Professor Elaine Kempson at the Personal Finance Research Centre (PFRC)1 et al. have proposed a model that describes the influence of factors such as behaviour, knowledge and experience, attitudes, motivations and environmental factors on financial wellbeing2.
This survey applied the PFRC model to estimate an overall financial wellbeing score for each respondent. The score was derived from measures of the three components of financial wellbeing:
• The ability to meet financial commitments such as bills and loan payments;
• The extent to which people felt comfortable with their current and future financial situation, and to which their finances enabled them to enjoy life; and
• Resilience for the future or the ability to cope with a significant unexpected expense or fall in income.
Respondents received a score out of 100 for each of these components. The three scores were then added together and divided by three to provide an overall financial wellbeing score out of 100. More detail on the methodology and specific survey questions is provided in the Appendix.
4
FINANCIAL WELLBEING REPORT
EXECUTIVE SUMMARY
EXECUTIVE SUMMARY
This report sets out insights from a survey measuring the financial wellbeing of Australian adults3. It is the sixth in a series of comprehensive surveys that ANZ has conducted since 2002.
3 3,578 adult Australians were surveyed. A separate report outlining specific insights from the same survey conducted in New Zealand (1,521 adults) is available at www.bluenotes.anz.com/financialwellbeing
4 We considered the categories of ‘Financially distressed/Financially unstable/Financially exposed/Financially well’ (applied by Kempson et al., Momentum Financial Wellness Index, UK), ‘Low/Medium/Good/Very Good’ (based on 2009 NZ Financial Knowledge Survey), ‘Financially distressed’/’Financially stressed’ (applied by Martin North et al., Digital Finance Analytics), and ‘Just about managing’ (JAM) (first described by Frayne and in wide use in UK political discourse).
5 Data from this survey was post weighted to latest Australian Bureau of Statistics (ABS) population estimates for age, gender and location. This has enabled an extrapolation of the survey data to the entire Australian population.
Financial wellbeing is a term that recognises that finances are inextricably linked with our individual and social wellbeing.
Key findings:
Four categories4 of relative financial wellbeing were identified:
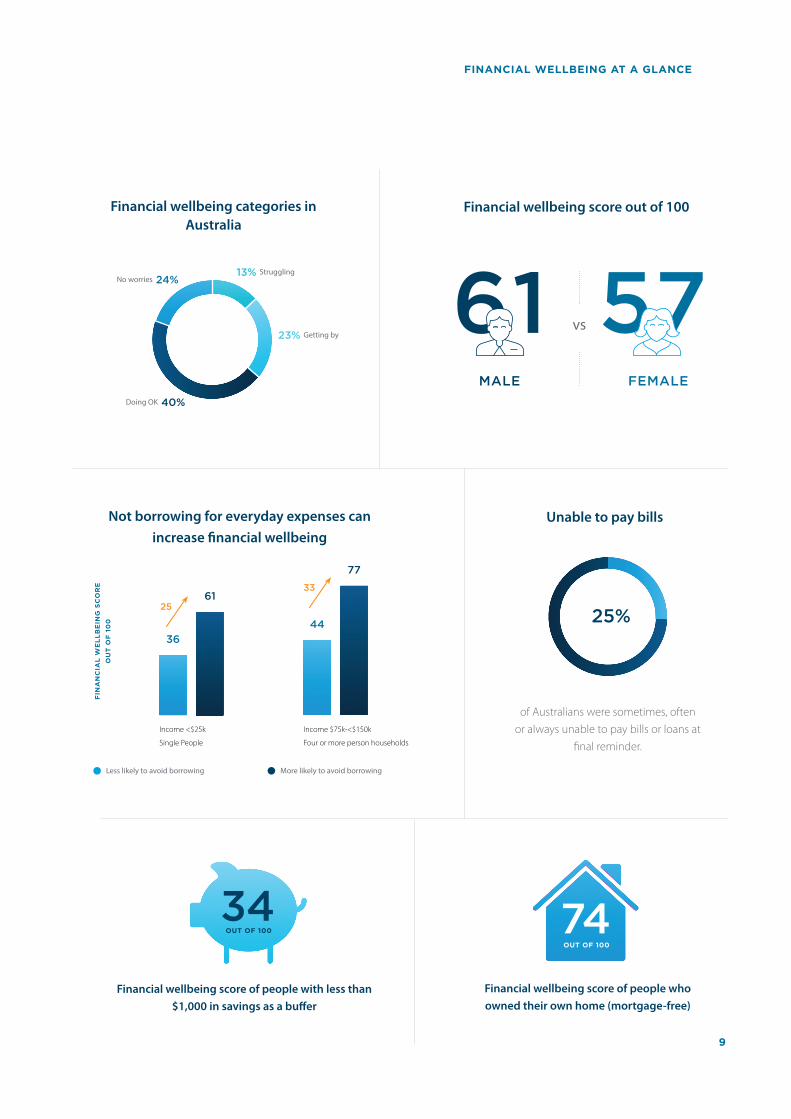
• No worries: Twenty-four per cent of respondents (which could be extrapolated to around 4.5 million people5 in Australia) had no real financial worries. They had behaviours that contributed positively to financial wellbeing, high levels of confidence in managing money and substantial amounts in savings, investments and superannuation. Their financial wellbeing score was greater than 80 out of 100, see breakout box ‘Financial Wellbeing Score’ page 4.
• Doing OK: Forty per cent of respondents (around 7.4 million Australians) sat in the middle of the range, generally doing OK. Thirty-nine per cent of this group described their current financial situation as ‘fair’ or ‘good’ and 45% were relatively confident about their financial situation over the next 12 months. Their financial wellbeing scores ranged from 51 to 80 out of 100.
• Getting by: Twenty-three per cent of respondents (around 4.4 million people) were just getting by. Thirty-five per cent of the group described their financial situation as ‘bad’, and 31% were not confident about their financial situation over the next 12 months. Financial behaviour scores were below average in this group, as were measures of confidence in their money management skills and belief in their ability to control their financial future. They had financial wellbeing scores ranging from 31 to 50 out of 100.
• Struggling: The remaining 13% of respondents (around 2.4 million people) appeared to be struggling. Most of this group (85%) described their current financial situation as ‘bad’ (81% said they had no savings, while 75% found it a constant struggle to meet bills and credit payments). Few (7%) were confident about their financial situation over the next 12 months. They had financial wellbeing scores of 30 or less.
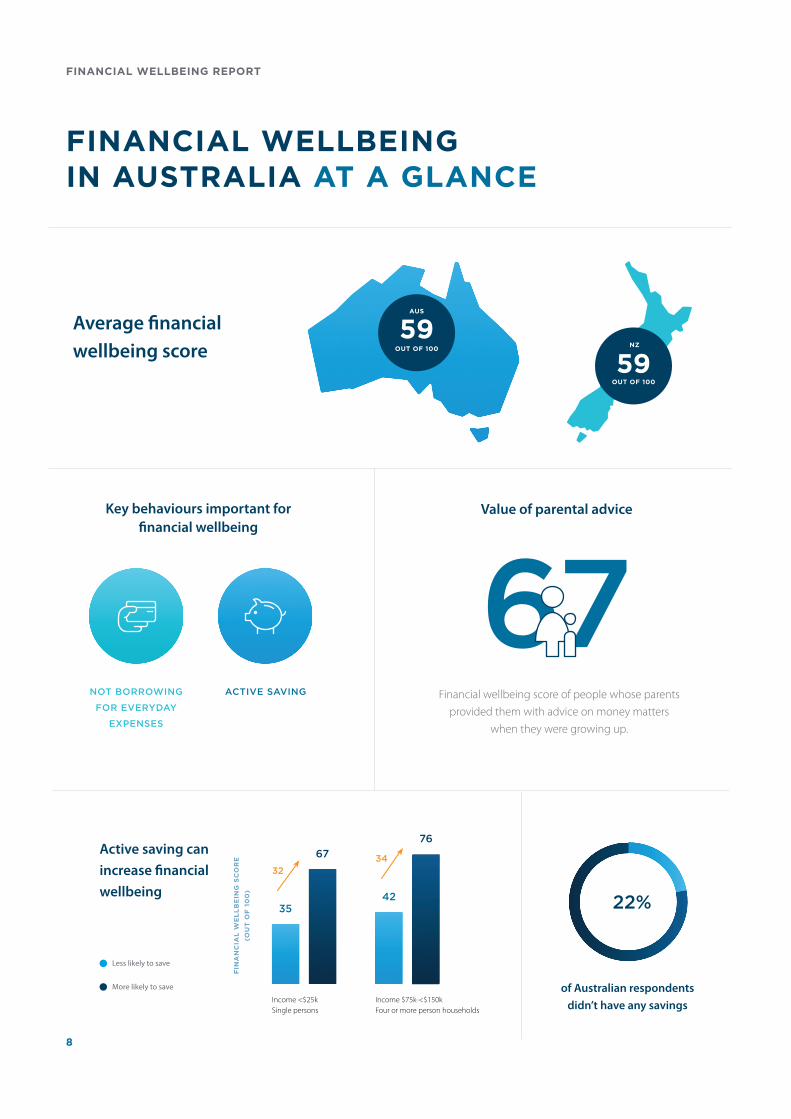
The average financial wellbeing score for adult Australians was 59 out of 100.
5
Two specific behaviours – active saving and not borrowing for everyday expenses – were key to financial wellbeing.
The study showed that two behaviours – active saving and not borrowing for everyday expenses – contributed 19% and 16% respectively to explaining differences in people’s overall level of financial wellbeing. Other aspects of financial behaviour examined in this research showed little influence on financial wellbeing. We acknowledge that not everyone is in a position to save or to avoid borrowing for everyday expenses.
Socio-economic circumstances played an important role in determining financial wellbeing.
The study showed that people’s socio-economic circumstances contributed 30% to explaining differences in financial wellbeing.
It also showed the relationship between socio-economic circumstances and financial wellbeing to be a complex one. It drew attention to the fact that financial wellbeing is, in part, a ‘state of mind’ based on people’s feelings and expectations about their current and future financial situation and, as a result, is not based solely on their income or on how much they have in savings and investments. Consequently, while income was found to be an important influence6, the survey showed that people could have relatively high levels of financial wellbeing without necessarily having particularly high incomes; similarly, many people with only limited amounts in savings and investments were also found to have relatively high levels of financial wellbeing.
6 Household income accounted for 7% of the explained variation in financial wellbeing. Behaviour change will always be moderated by income which remains a fundamental backdrop to financial wellbeing. Income allows people to save and avoid borrowing for daily expenses, as well as having a direct effect on financial wellbeing.
Other findings:
Having less than $1,000 in savings and investments was strongly associated with low levels of financial wellbeing.
The results indicate that having a savings buffer of at least $1,000 was associated with higher financial wellbeing. The mean financial wellbeing score for those with less than $1,000 in savings was 34 (compared with 59 for the total population). The mean financial wellbeing score rose sharply to 50 for those in the next category ($1,000 to $4,999 in savings and investments).
People who owned their own homes (mortgage-free) had greater financial wellbeing.
There was no clear relationship between the size of mortgage debt and financial wellbeing; even mortgage debt of over $250,000 did not result in lower financial wellbeing. Those who were mortgage-free had an average financial wellbeing score of 74 out of 100. Those with a mortgage on their home had an average financial wellbeing score of 58, while those who rented had a score of 50.
People who had considerable variation from month-to-month in their household income recorded financial wellbeing scores 17 points below the national average of 59.
Some 25% of those in the group struggling with their financial situation were in this category.
6
FINANCIAL WELLBEING REPORT
EXECUTIVE SUMMARY
Psychological factors had an influence on financial wellbeing, particularly people’s confidence in their money management skills and belief in the power to control their own lives and exert some control over their finances.
Sixty-five per cent of respondents were confident in their ability to manage their money day-to-day, and 45% felt on top of their money.
The research highlighted that self-belief and confidence to make financial decisions and manage everyday finances were two critical psychological factors influencing overall financial wellbeing.
Those most confident in their day-to-day money management skills had a financial wellbeing score that was considerably higher than those who were the least confident in their money management skills (average scores of 73 and 32 respectively).
Those with low levels of belief that they determine what happens in their life had far lower financial wellbeing scores (average score of 46) than those with the highest levels of self-belief (average score of 66).
7 Kempson, Elaine & Finney, Andrea & Poppe, Christian (2017). Financial Well-Being A Conceptual Model and Preliminary Analysis. 10.13140/RG.2.2.18737.68961.
8 ANZ (2018) Financial Wellbeing: A survey of adults in New Zealand.
Detailed knowledge and experience of financial products or services had only limited direct influence on financial wellbeing.
This is not to say that financial knowledge is irrelevant; clearly those with better financial knowledge should be in a position to make better financial decisions. However the research shows that, regardless of people’s knowledge, other factors such as psychological influences, social and economic circumstances and the ability to actually take action (that is behaviour) are more important influences on financial wellbeing.
This is an important finding suggesting the reframing of our approach from measuring financial literacy to considering the broader definition and model of financial wellbeing is appropriate. The new findings are consistent with those from recent similar research in Norway7 and New Zealand8.
7
FINANCIAL WELLBEING IN AUSTRALIA AT A GLANCE
59OUT OF 100
NZ
Average financial wellbeing score
Income <$25k Single persons
Active saving can
increase financial
wellbeing35
67
42
76
Less likely to save
More likely to save
FIN
AN
CIA
L W
EL
LB
EIN
G S
CO
RE
(OU
T O
F 1
00
)
Income $75k-<$150k Four or more person households
3234
of Australian respondents
didn’t have any savings
22%
ACTIVE SAVING
Key behaviours important for financial wellbeing
NOT BORROWING
FOR EVERYDAY
EXPENSES
67Financial wellbeing score of people whose parents
provided them with advice on money matters when they were growing up.
Value of parental advice
59OUT OF 100
AUS
8
FINANCIAL WELLBEING REPORT
FINANCIAL WELLBEING AT A GLANCE
Financial wellbeing categories in Australia
23% Getting by
13% StrugglingNo worries 24%
Doing OK 40%
Financial wellbeing score out of 100
61 57MALE FEMALE
vs
Financial wellbeing score of people with less than
$1,000 in savings as a buffer
Financial wellbeing score of people who
owned their own home (mortgage-free)
Not borrowing for everyday expenses can
increase financial wellbeing
36
61
44
77
25
33
FIN
AN
CIA
L W
EL
LB
EIN
G S
CO
RE
OU
T O
F 1
00
Less likely to avoid borrowing More likely to avoid borrowing
Income <$25k
Single People
Income $75k-<$150k
Four or more person households
Unable to pay bills
of Australians were sometimes, often or always unable to pay bills or loans at
final reminder.
25%
OUT OF 100
74OUT OF 100
34
9
UPDATING OUR SURVEY
9 Part of an online survey of 5,099 randomly selected Australian and New Zealand adults conducted between 30 November-8 December 2017. The New Zealand report is available at http://www.bluenotes.anz.com/financialwellbeing
10 Previous surveys conducted by ANZ can be sourced at http://www.anz.com/about-us/corporate-sustainability/community/investing/
SURVEY HISTORY
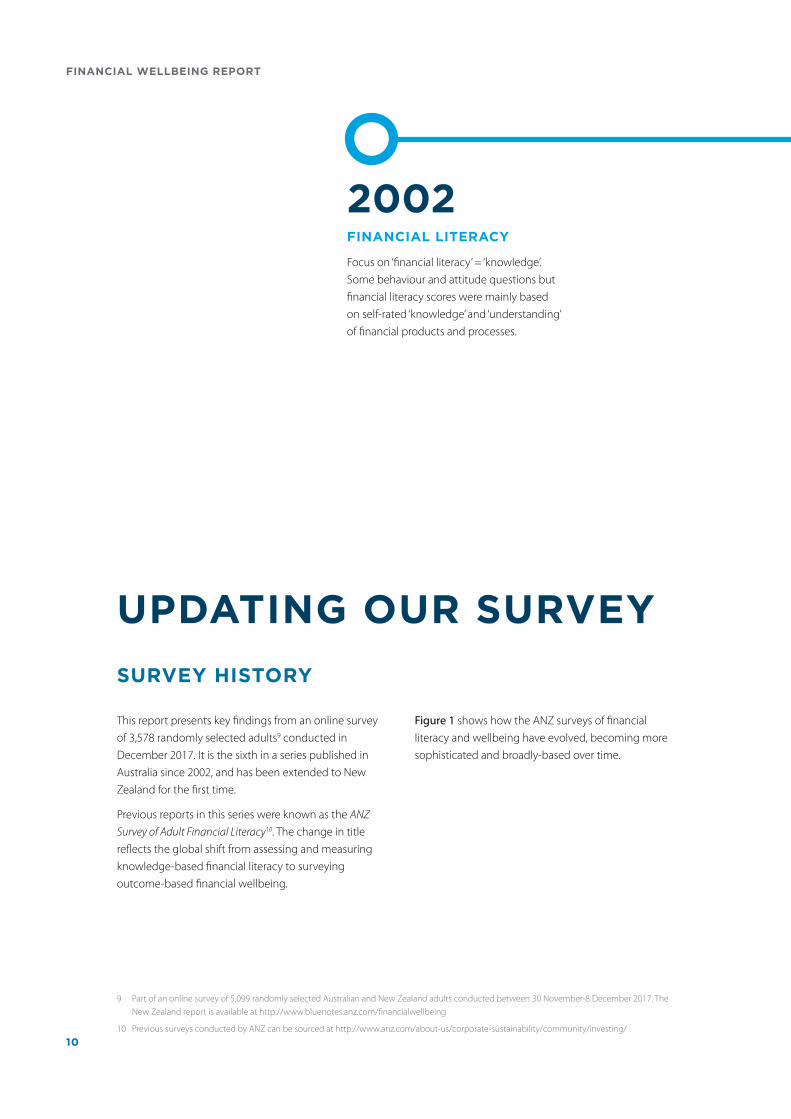
This report presents key findings from an online survey of 3,578 randomly selected adults9 conducted in December 2017. It is the sixth in a series published in Australia since 2002, and has been extended to New Zealand for the first time.
Previous reports in this series were known as the ANZ Survey of Adult Financial Literacy10. The change in title reflects the global shift from assessing and measuring knowledge-based financial literacy to surveying outcome-based financial wellbeing.
Figure 1 shows how the ANZ surveys of financial literacy and wellbeing have evolved, becoming more sophisticated and broadly-based over time.
2002FINANCIAL LITERACY
Focus on ‘financial literacy’ = ‘knowledge’. Some behaviour and attitude questions but financial literacy scores were mainly based on self-rated ‘knowledge’ and ‘understanding’ of financial products and processes.
10
FINANCIAL WELLBEING REPORT
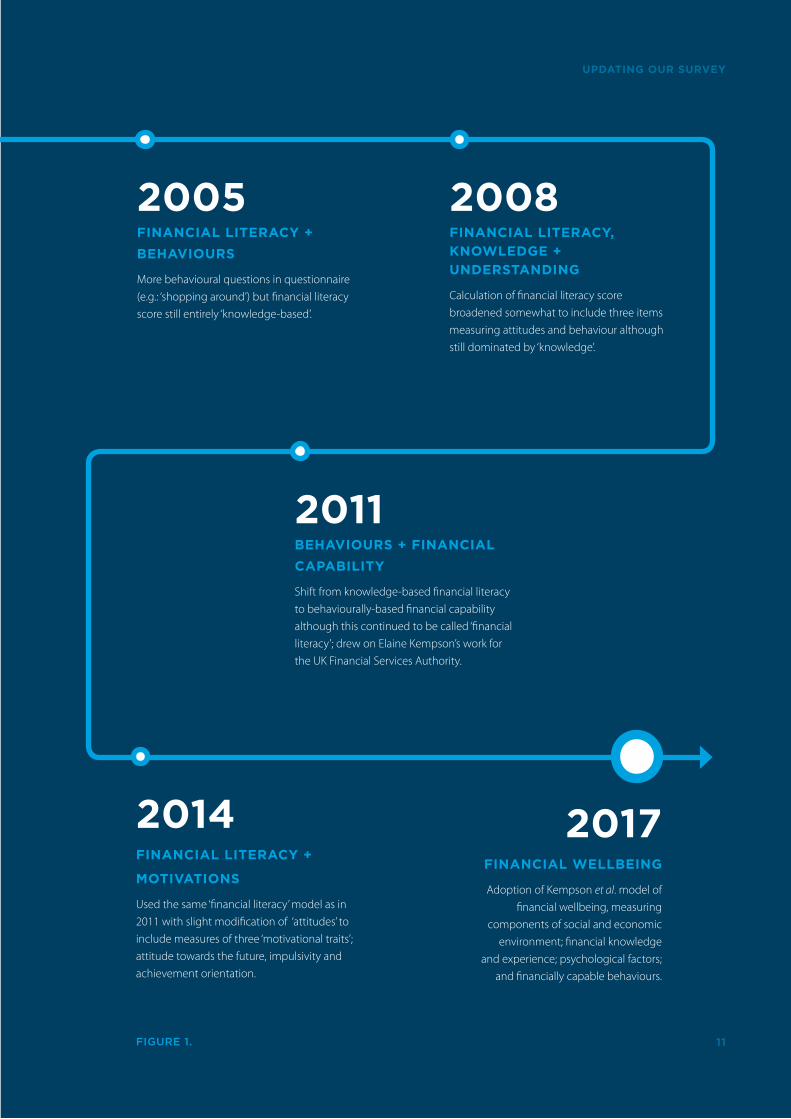
2011BEHAVIOURS + FINANCIAL
CAPABILITY
Shift from knowledge-based financial literacy to behaviourally-based financial capability although this continued to be called ‘financial literacy’; drew on Elaine Kempson’s work for the UK Financial Services Authority.
2005FINANCIAL LITERACY +
BEHAVIOURS
More behavioural questions in questionnaire (e.g.: ‘shopping around’) but financial literacy score still entirely ‘knowledge-based’.
2008FINANCIAL LITERACY,
KNOWLEDGE +
UNDERSTANDING
Calculation of financial literacy score broadened somewhat to include three items measuring attitudes and behaviour although still dominated by ‘knowledge’.
2017FINANCIAL WELLBEING
Adoption of Kempson et al. model of financial wellbeing, measuring
components of social and economic environment; financial knowledge
and experience; psychological factors; and financially capable behaviours.
2014FINANCIAL LITERACY +
MOTIVATIONS
Used the same ‘financial literacy’ model as in 2011 with slight modification of ‘attitudes’ to include measures of three ‘motivational traits’; attitude towards the future, impulsivity and achievement orientation.
UPDATING OUR SURVEY
FIGURE 1. 11
UPDATING OUR SURVEYSince 2002, ANZ has been collaborating with a range of stakeholders to understand financial literacy and to design initiatives to improve money management skills in the Australian community.
11 Schagen, S. ‘The Evaluation of NatWest Face 2 Face With Finance’: NFER, 1997 (this definition was adopted from UK research with a view to international consistency).
12 Also reflected in the ASIC National Financial Literacy Strategy 2014-17 p6 (2014) which defines financial literacy as ‘a combination of financial knowledge, skills, attitudes and behaviours necessary to make sound financial decisions, based on personal circumstances, to improve financial wellbeing.’
13 This conceptualisation drew on work by the PFRC, University of Bristol (e.g. Measuring financial capability: an exploratory study June 2005).
Engagement with stakeholders – such as financial counsellors, community organisations, government agencies, consumer advocates and education specialists – and our research have helped us develop programs to build financial capability.
The 2002, 2005 and 2008 ANZ Adult Financial Literacy Surveys evaluated people’s financial knowledge and numeracy. They were based on the definition of financial literacy as ‘the ability to make informed judgments and to take effective decisions regarding the use and management of money’11. A broader interpretation of financial literacy was reflected in the 2011 survey to make more explicit the role played by people’s financial attitudes, behaviour and experiences12. Behavioural indicators or measures of financial literacy included keeping track of finances and financial control13.
Collaborators on the new 2017 Financial Wellbeing survey included Elaine Kempson, YouGovGalaxy, Prescience Research, David Blackmore and a steering committee that included representatives from Consumer Action Law Centre, Financial Literacy Australia, ASIC and RMIT University.
Changing definitions and focus from financial literacy to financial wellbeing would inevitably result in the disruption of time-series data from previous ANZ surveys. In designing the 2017 survey, ANZ and research partners carefully considered the treatment of valuable time-series data from previous surveys. Moving to a contemporary international model based on financial wellbeing was considered a priority, while maintaining insights from the time-series where there was value in doing so. We also moved from a telephone to an online methodology.
Some time-series questions were extended to the 2017 survey. Questions around financial behaviour remained, although some were altered and additional questions around financial knowledge and skills were added. New questions were also introduced to measure changes in income and spending patterns, general health, mental health and social capital.
Survey sampling procedures were designed to ensure the final sample reflected the latest Australian Bureau of Statistics (ABS) estimates of the age, gender and geographic distribution of the Australian population.
12
FINANCIAL WELLBEING REPORT
The 2017 survey was designed to investigate key drivers of financial wellbeing in Australia and New Zealand; enabling comparison of financial wellbeing in those countries with Norway14 and others.
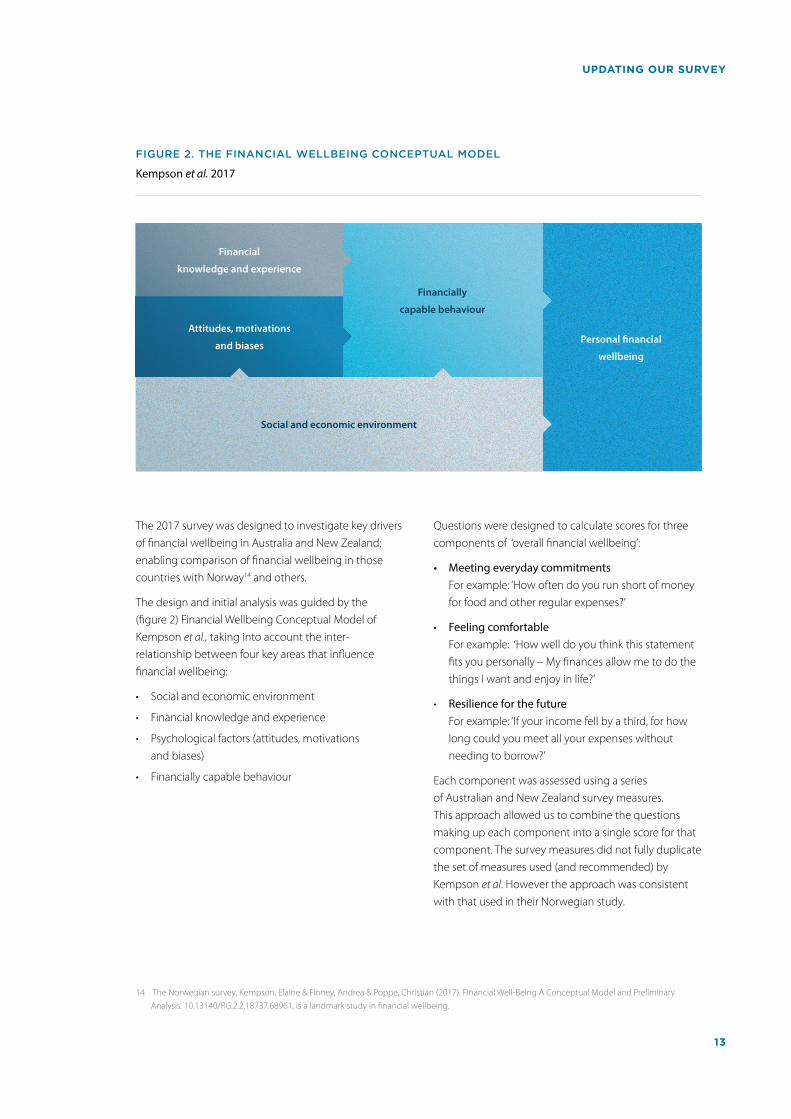
The design and initial analysis was guided by the (figure 2) Financial Wellbeing Conceptual Model of Kempson et al., taking into account the inter-relationship between four key areas that influence financial wellbeing:
• Social and economic environment
• Financial knowledge and experience
• Psychological factors (attitudes, motivations and biases)
• Financially capable behaviour
14 The Norwegian survey, Kempson, Elaine & Finney, Andrea & Poppe, Christian (2017). Financial Well-Being A Conceptual Model and Preliminary Analysis. 10.13140/RG.2.2.18737.68961, is a landmark study in financial wellbeing.
Questions were designed to calculate scores for three components of ‘overall financial wellbeing’:
• Meeting everyday commitments For example: ‘How often do you run short of money for food and other regular expenses?’
• Feeling comfortable For example: ‘How well do you think this statement fits you personally – My finances allow me to do the things I want and enjoy in life?’
• Resilience for the future For example: ‘If your income fell by a third, for how long could you meet all your expenses without needing to borrow?’
Each component was assessed using a series of Australian and New Zealand survey measures. This approach allowed us to combine the questions making up each component into a single score for that component. The survey measures did not fully duplicate the set of measures used (and recommended) by Kempson et al. However the approach was consistent with that used in their Norwegian study.
Personal financial
well-being
Financially
capable behaviour
Social & economic enviroment
Financially
knowledge & skills
Attitudes, motivations
& biasesPersonal financial
wellbeing
Financially
capable behaviour
Social and economic environment
Financial
knowledge and experience
Attitudes, motivations
and biases
UPDATING OUR SURVEY
Kempson et al. 2017
FIGURE 2. THE FINANCIAL WELLBEING CONCEPTUAL MODEL
13
SURVEY DESIGNThe questionnaire was divided into six sections:
15 Kempson, Elaine & Finney, Andrea & Poppe, Christian (2017). Financial Well-Being A Conceptual Model and Preliminary Analysis. 10.13140/RG.2.2.18737.68961.
Section A: Screening demographics, product holdings and financial habits including payment methods and who people consult about their finances.
Section B: Wellbeing including 11 questions taken from Kempson’s financial wellbeing model.
Section C: Financial capability and knowledge including 21 questions that were an amalgamation of metrics from Kempson et al. and the ANZ Adult Financial Literacy Survey 2014, as well as several new questions). Financial knowledge questions were reduced from previous years and focused on three key areas; managing your money day-to-day, improving your financial situation over the longer term and planning for retirement.
Section D: Attitudes and motivations including questions taken from the Kempson et al. questionnaire.
Section E: New topics including thinking about ageing; cost of housing stress; talking about your money situation.
Section F: Profiling demographics including education, household structure, sources of income, language spoken, net assets and net debts.
A wellbeing score was created using an aggregate of these questions. Each item was converted to a standardised score out of 100 and then the mean across all items was calculated.
Research contributors Stephen Prendergast (Prescience Research) and David Blackmore developed the survey and provided advice to the steering committees in Australia and New Zealand, who then gave guidance around finalising the modelling and segmentation. This involved decisions around how best to understand key drivers of financial wellbeing in Australia and New Zealand. YouGovGalaxy helped with survey design and conducted the survey fieldwork in Australia and New Zealand.
This study is the first in Australia and New Zealand to almost wholly rely on the model of financial wellbeing developed by Elaine Kempson and colleagues. Our use of this model acknowledges its efficacy in describing the connection between financial wellbeing and a person’s financial knowledge and experience, attitudes and motivations, behaviours as well as social and environmental factors.
We have applied the definition of financial wellbeing as ‘the extent to which someone is able to meet all their current commitments and needs comfortably, and has the financial resilience to maintain this in the future15’.
A summary of the survey methodology is included in Appendix 2 (page 39).
14
FINANCIAL WELLBEING REPORT
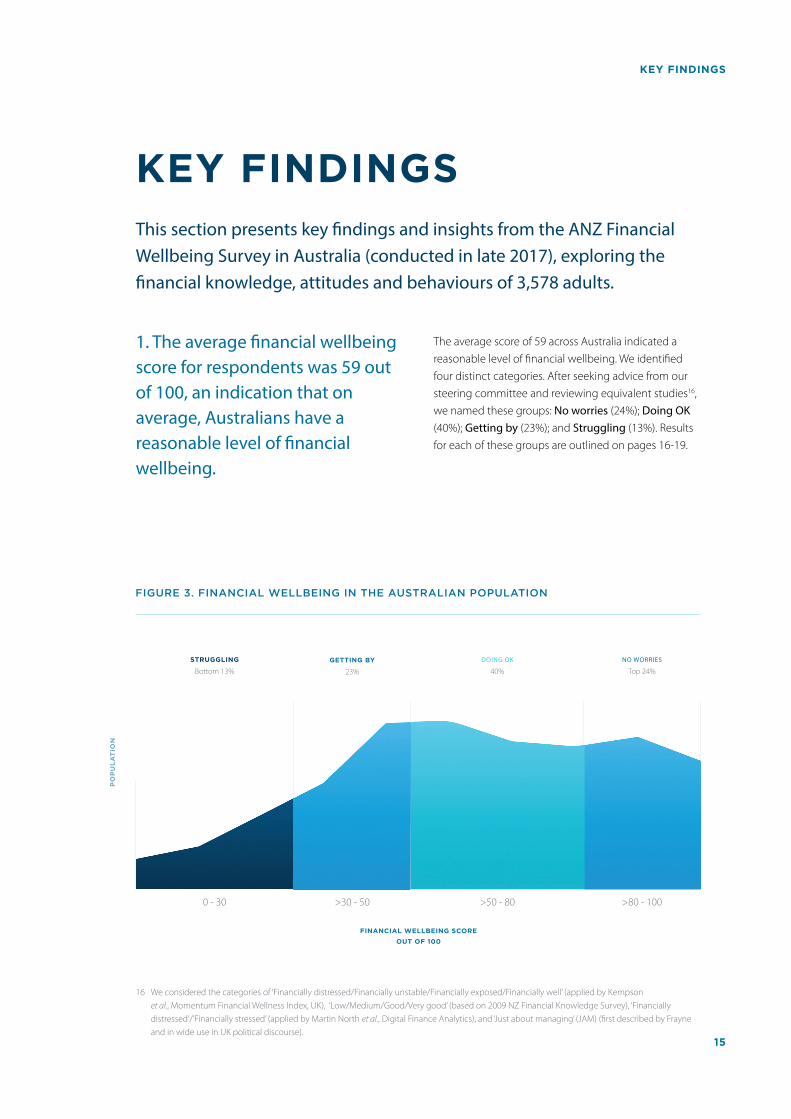
KEY FINDINGSThis section presents key findings and insights from the ANZ Financial Wellbeing Survey in Australia (conducted in late 2017), exploring the financial knowledge, attitudes and behaviours of 3,578 adults.
16 We considered the categories of ‘Financially distressed/Financially unstable/Financially exposed/Financially well’ (applied by Kempson et al., Momentum Financial Wellness Index, UK), ‘Low/Medium/Good/Very good’ (based on 2009 NZ Financial Knowledge Survey), ‘Financially distressed’/’Financially stressed’ (applied by Martin North et al., Digital Finance Analytics), and ‘Just about managing’ (JAM) (first described by Frayne and in wide use in UK political discourse).
1. The average financial wellbeing score for respondents was 59 out of 100, an indication that on average, Australians have a reasonable level of financial wellbeing.
The average score of 59 across Australia indicated a reasonable level of financial wellbeing. We identified four distinct categories. After seeking advice from our steering committee and reviewing equivalent studies16, we named these groups: No worries (24%); Doing OK (40%); Getting by (23%); and Struggling (13%). Results for each of these groups are outlined on pages 16-19.
FIGURE 3. FINANCIAL WELLBEING IN THE AUSTRALIAN POPULATION
STRUGGLING
Bottom 13% GETTING BY
23%
DOING OK
40%
NO WORRIES
Top 24%
0 - 30 >30 - 50 >50 - 80 >80 - 100
KEY FINDINGS
FINANCIAL WELLBEING SCORE
OUT OF 100
PO
PU
LA
TIO
N
15
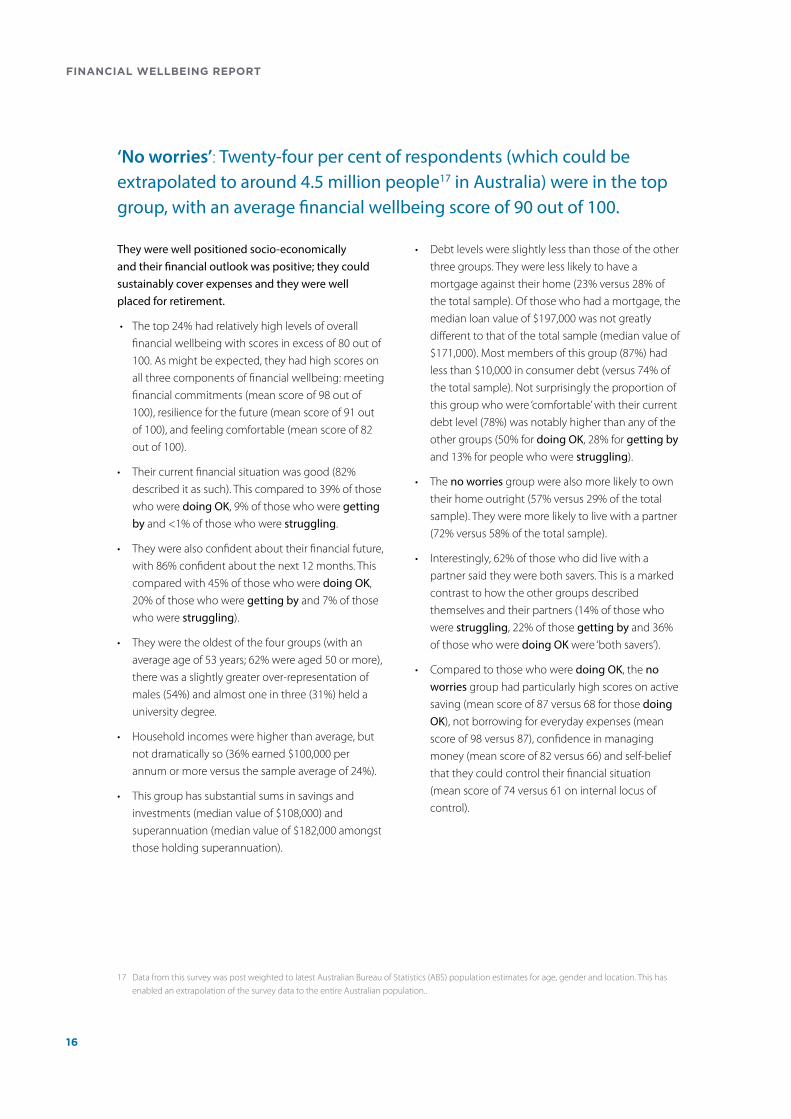
‘No worries’: Twenty-four per cent of respondents (which could be extrapolated to around 4.5 million people17 in Australia) were in the top group, with an average financial wellbeing score of 90 out of 100.
17 Data from this survey was post weighted to latest Australian Bureau of Statistics (ABS) population estimates for age, gender and location. This has enabled an extrapolation of the survey data to the entire Australian population..
They were well positioned socio-economically and their financial outlook was positive; they could sustainably cover expenses and they were well placed for retirement.
• The top 24% had relatively high levels of overall financial wellbeing with scores in excess of 80 out of 100. As might be expected, they had high scores on all three components of financial wellbeing: meeting financial commitments (mean score of 98 out of 100), resilience for the future (mean score of 91 out of 100), and feeling comfortable (mean score of 82 out of 100).
• Their current financial situation was good (82% described it as such). This compared to 39% of those who were doing OK, 9% of those who were getting by and <1% of those who were struggling.
• They were also confident about their financial future, with 86% confident about the next 12 months. This compared with 45% of those who were doing OK, 20% of those who were getting by and 7% of those who were struggling).
• They were the oldest of the four groups (with an average age of 53 years; 62% were aged 50 or more), there was a slightly greater over-representation of males (54%) and almost one in three (31%) held a university degree.
• Household incomes were higher than average, but not dramatically so (36% earned $100,000 per annum or more versus the sample average of 24%).
• This group has substantial sums in savings and investments (median value of $108,000) and superannuation (median value of $182,000 amongst those holding superannuation).
• Debt levels were slightly less than those of the other three groups. They were less likely to have a mortgage against their home (23% versus 28% of the total sample). Of those who had a mortgage, the median loan value of $197,000 was not greatly different to that of the total sample (median value of $171,000). Most members of this group (87%) had less than $10,000 in consumer debt (versus 74% of the total sample). Not surprisingly the proportion of this group who were ‘comfortable’ with their current debt level (78%) was notably higher than any of the other groups (50% for doing OK, 28% for getting by and 13% for people who were struggling).
• The no worries group were also more likely to own their home outright (57% versus 29% of the total sample). They were more likely to live with a partner (72% versus 58% of the total sample).
• Interestingly, 62% of those who did live with a partner said they were both savers. This is a marked contrast to how the other groups described themselves and their partners (14% of those who were struggling, 22% of those getting by and 36% of those who were doing OK were ‘both savers’).
• Compared to those who were doing OK, the no worries group had particularly high scores on active saving (mean score of 87 versus 68 for those doing OK), not borrowing for everyday expenses (mean score of 98 versus 87), confidence in managing money (mean score of 82 versus 66) and self-belief that they could control their financial situation (mean score of 74 versus 61 on internal locus of control).
16
FINANCIAL WELLBEING REPORT
KEY FINDINGS
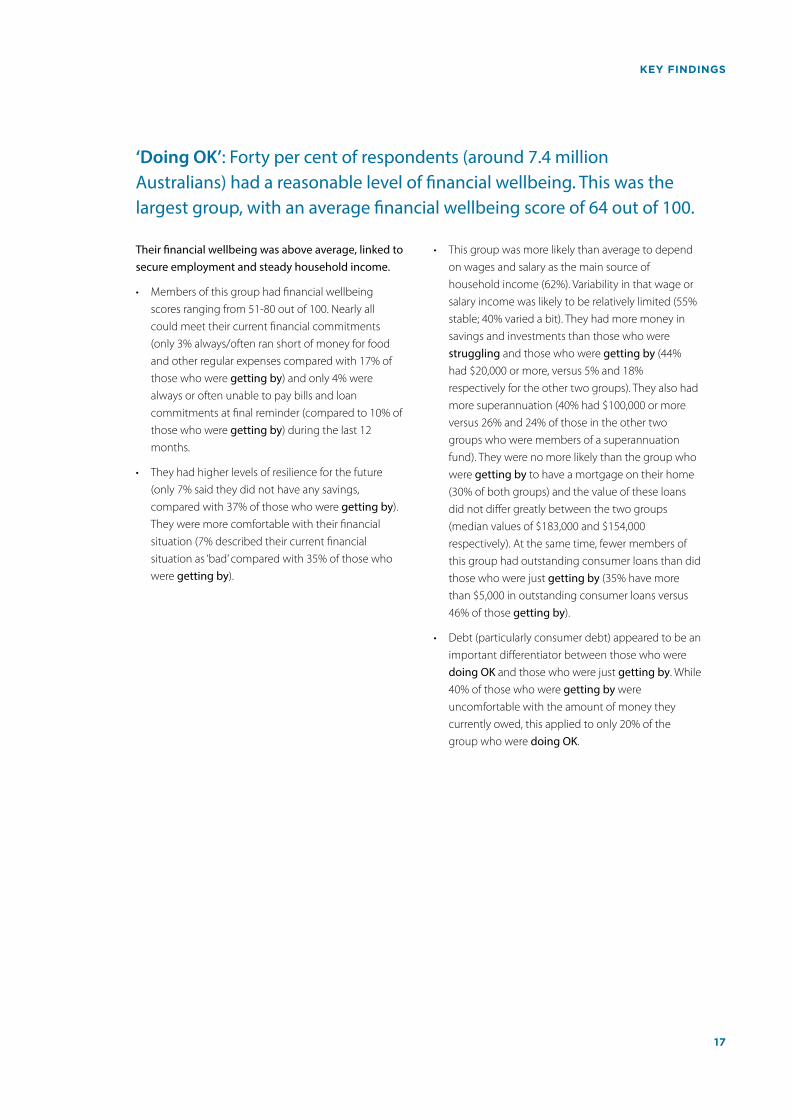
‘Doing OK’: Forty per cent of respondents (around 7.4 million Australians) had a reasonable level of financial wellbeing. This was the largest group, with an average financial wellbeing score of 64 out of 100.
Their financial wellbeing was above average, linked to secure employment and steady household income.
• Members of this group had financial wellbeing scores ranging from 51-80 out of 100. Nearly all could meet their current financial commitments (only 3% always/often ran short of money for food and other regular expenses compared with 17% of those who were getting by) and only 4% were always or often unable to pay bills and loan commitments at final reminder (compared to 10% of those who were getting by) during the last 12 months.
• They had higher levels of resilience for the future (only 7% said they did not have any savings, compared with 37% of those who were getting by). They were more comfortable with their financial situation (7% described their current financial situation as ‘bad’ compared with 35% of those who were getting by).
• This group was more likely than average to depend on wages and salary as the main source of household income (62%). Variability in that wage or salary income was likely to be relatively limited (55% stable; 40% varied a bit). They had more money in savings and investments than those who were struggling and those who were getting by (44% had $20,000 or more, versus 5% and 18% respectively for the other two groups). They also had more superannuation (40% had $100,000 or more versus 26% and 24% of those in the other two groups who were members of a superannuation fund). They were no more likely than the group who were getting by to have a mortgage on their home (30% of both groups) and the value of these loans did not differ greatly between the two groups (median values of $183,000 and $154,000 respectively). At the same time, fewer members of this group had outstanding consumer loans than did those who were just getting by (35% have more than $5,000 in outstanding consumer loans versus 46% of those getting by).
• Debt (particularly consumer debt) appeared to be an important differentiator between those who were doing OK and those who were just getting by. While 40% of those who were getting by were uncomfortable with the amount of money they currently owed, this applied to only 20% of the group who were doing OK.
17
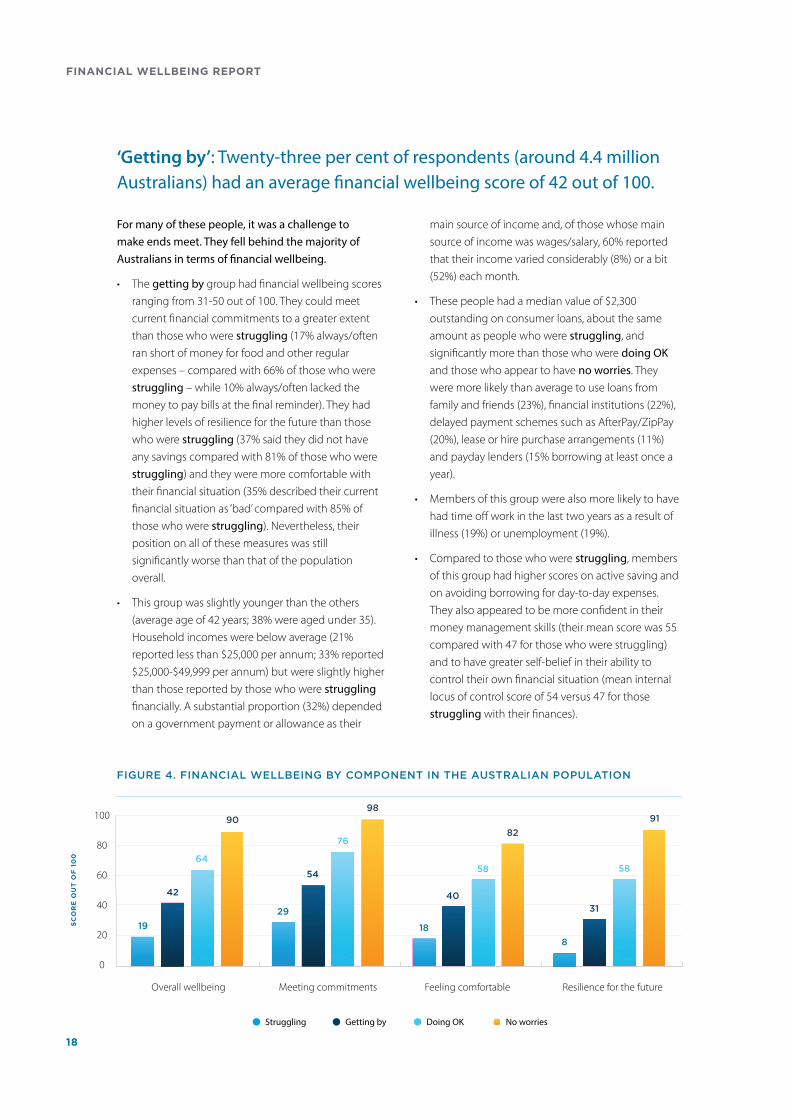
‘Getting by’: Twenty-three per cent of respondents (around 4.4 million Australians) had an average financial wellbeing score of 42 out of 100.
For many of these people, it was a challenge to make ends meet. They fell behind the majority of Australians in terms of financial wellbeing.
• The getting by group had financial wellbeing scores ranging from 31-50 out of 100. They could meet current financial commitments to a greater extent than those who were struggling (17% always/often ran short of money for food and other regular expenses – compared with 66% of those who were struggling – while 10% always/often lacked the money to pay bills at the final reminder). They had higher levels of resilience for the future than those who were struggling (37% said they did not have any savings compared with 81% of those who were struggling) and they were more comfortable with their financial situation (35% described their current financial situation as ‘bad’ compared with 85% of those who were struggling). Nevertheless, their position on all of these measures was still significantly worse than that of the population overall.
• This group was slightly younger than the others (average age of 42 years; 38% were aged under 35). Household incomes were below average (21% reported less than $25,000 per annum; 33% reported $25,000-$49,999 per annum) but were slightly higher than those reported by those who were struggling financially. A substantial proportion (32%) depended on a government payment or allowance as their
main source of income and, of those whose main source of income was wages/salary, 60% reported that their income varied considerably (8%) or a bit (52%) each month.
• These people had a median value of $2,300 outstanding on consumer loans, about the same amount as people who were struggling, and significantly more than those who were doing OK and those who appear to have no worries. They were more likely than average to use loans from family and friends (23%), financial institutions (22%), delayed payment schemes such as AfterPay/ZipPay (20%), lease or hire purchase arrangements (11%) and payday lenders (15% borrowing at least once a year).
• Members of this group were also more likely to have had time off work in the last two years as a result of illness (19%) or unemployment (19%).
• Compared to those who were struggling, members of this group had higher scores on active saving and on avoiding borrowing for day-to-day expenses. They also appeared to be more confident in their money management skills (their mean score was 55 compared with 47 for those who were struggling) and to have greater self-belief in their ability to control their own financial situation (mean internal locus of control score of 54 versus 47 for those struggling with their finances).
19
29
18
8
42
54
40
31
64
76
58 58
9098
82
91
SC
OR
E O
UT
OF
10
0
No worries Doing OK Getting by Struggling
Overall wellbeing Meeting commitments Feeling comfortable Resilience for the future
FIGURE 4. FINANCIAL WELLBEING BY COMPONENT IN THE AUSTRALIAN POPULATION
100
80
60
40
20
0
18
FINANCIAL WELLBEING REPORT

‘Struggling’: Overall, 13% of respondents (around 2.4 million Australians) had an average financial wellbeing score of 19 out of 100.
18 A further 7% paid rent or board to someone else who lived in the house.
People in this group were struggling to meet day-to-day financial commitments, were not feeling comfortable with their financial situation and had little financial resilience for the future.
• This group comprised 13% of Australians with a relatively low financial wellbeing score (30 or less). Members of this group were struggling to meet their current financial commitments (66% always/often ran short of money for food and other regular expenses; 40% always/often lacked the money to pay bills at the final reminder). They had limited financial resilience (81% said they did not have any savings at all) and they were not feeling comfortable about their financial situation (85% described their current financial situation as ‘bad’).
• Socio-demographically, members of this group were more likely than average to be women (59%), to live in a single adult household (21% alone; 13% single parent), to have been divorced or separated (40%), to have a household income of under $25,000 (30%) and to have a government payment or allowance as their main source of income (43%). For those whose main source of income was wages/salary, for most that income varied either considerably (26%) or a bit (48%), each month.
• The majority were renting their home on the private market (47%) or from a government agency (10%)18, only 8% owned their home outright.
• 27% had experienced at least one period of unemployment in the last two years.
• 46% suffered from a long-term health condition, impairment or disability.
• 49% reported that they lacked parental advice about financial matters when they were growing up (compared with 31% of the total sample).
• Their financial behaviour showed above average use of loans from family and friends (32%), financial institutions (24%), delayed payment schemes such as AfterPay/ZipPay (24%), payday lenders (16% borrowed at least once a year) and lease or hire purchase arrangements (10%).
• Given their circumstances, it was not unexpected to find members of this group had the lowest scores on the key behaviours of active saving and avoiding borrowing for everyday expenses. They also had relatively low levels of confidence in their money management skills (mean score of 47 versus the population average of 65) and limited belief in their ability to control their financial situation (mean score of 47 versus the population average of 61).
KEY FINDINGS
FIGURE 5. AUSTRALIANS WHO WERE
STRUGGLING
(13% with lowest financial wellbeing scores)
Didn’t have any savings
81%
Had less than a month without needing to borrow if income fell by a third
82%
Sometimes, often or always ran short of money for food or other regular expenses
95%
Sometimes, often or always were unable to pay bills or loans at final reminder
75%
19
The extent to which someone is able to meet all their current commitments and needs comfortably, and has the financial resilience to maintain this in the future1 9 “ Professor Elaine Kempson defining financial wellbeing
19 Kempson, Elaine & Finney, Andrea & Poppe, Christian (2017). Financial Well-Being A Conceptual Model and Preliminary Analysis. 10.13140/RG.2.2.18737.68961.
20 R2 from Regression modelling
2. The research showed that application of the five domains of the Kempson model explained 69%20 of a person’s financial wellbeing.
Figure 6 summarises the relationships between people’s financial wellbeing and the five domains which influence it; their financial behaviour, psychological factors, financial knowledge and experience, socio-demographic status and economic characteristics.
It provides a context and methodology (multiple linear regression) for identifying and better understanding the factors that are the key drivers of people’s financial wellbeing.
Five domains of the Kempson model
explained 69% of financial wellbeing for
Australian respondents
69%
“
20
FINANCIAL WELLBEING REPORT
KEY FINDINGS
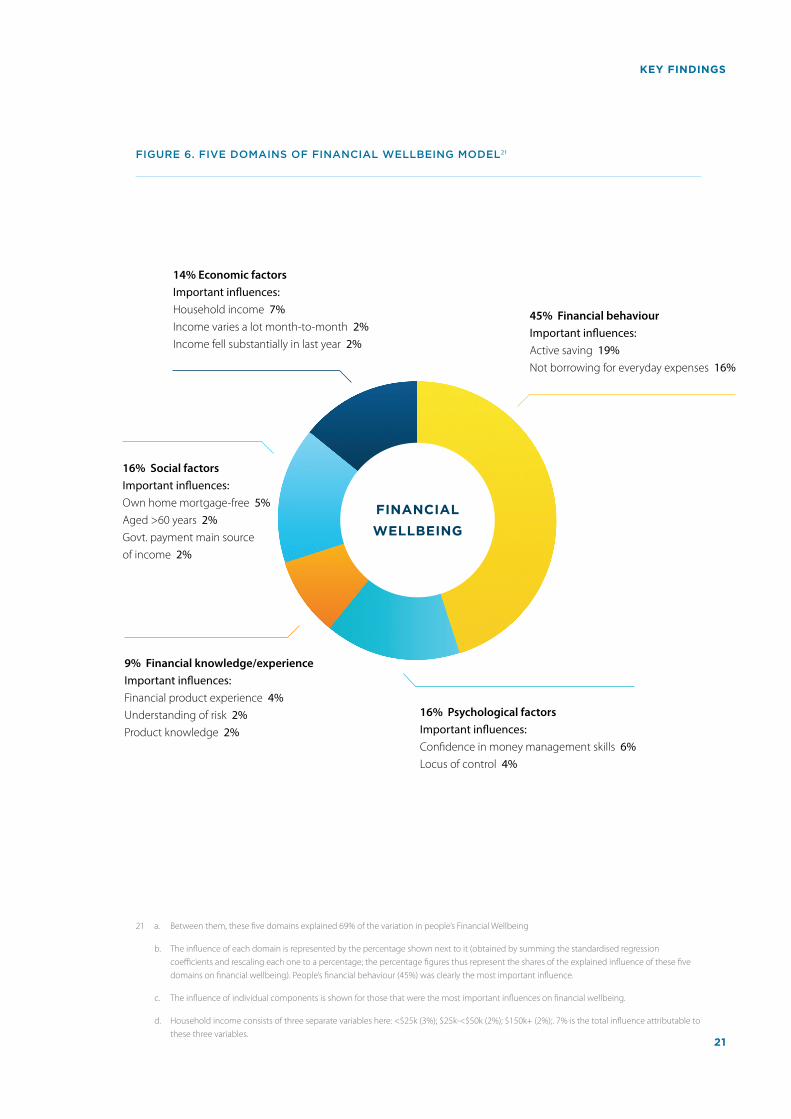
FIGURE 6. FIVE DOMAINS OF FINANCIAL WELLBEING MODEL21
21 a. Between them, these five domains explained 69% of the variation in people’s Financial Wellbeing
b. The influence of each domain is represented by the percentage shown next to it (obtained by summing the standardised regression coefficients and rescaling each one to a percentage; the percentage figures thus represent the shares of the explained influence of these five domains on financial wellbeing). People’s financial behaviour (45%) was clearly the most important influence.
c. The influence of individual components is shown for those that were the most important influences on financial wellbeing.
d. Household income consists of three separate variables here: <$25k (3%); $25k-<$50k (2%); $150k+ (2%);. 7% is the total influence attributable to these three variables.
45% Financial behaviour Important influences: Active saving 19% Not borrowing for everyday expenses 16%
16% Psychological factors Important influences: Confidence in money management skills 6% Locus of control 4%
9% Financial knowledge/experience Important influences: Financial product experience 4% Understanding of risk 2% Product knowledge 2%
16% Social factors Important influences: Own home mortgage-free 5% Aged >60 years 2% Govt. payment main source of income 2%
14% Economic factors Important influences: Household income 7% Income varies a lot month-to-month 2% Income fell substantially in last year 2%
FINANCIAL
WELLBEING
21
3. Behaviour had a major impact on financial wellbeing.
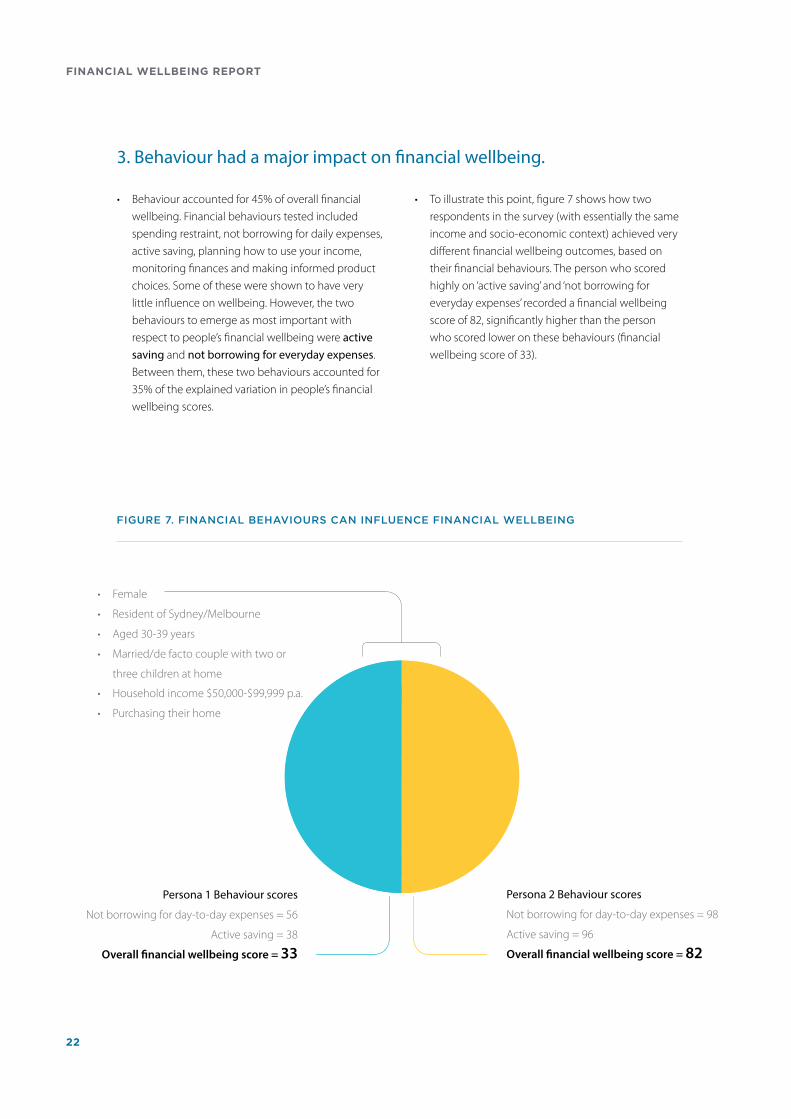
• Behaviour accounted for 45% of overall financial wellbeing. Financial behaviours tested included spending restraint, not borrowing for daily expenses, active saving, planning how to use your income, monitoring finances and making informed product choices. Some of these were shown to have very little influence on wellbeing. However, the two behaviours to emerge as most important with respect to people’s financial wellbeing were active saving and not borrowing for everyday expenses. Between them, these two behaviours accounted for 35% of the explained variation in people’s financial wellbeing scores.
• To illustrate this point, figure 7 shows how two respondents in the survey (with essentially the same income and socio-economic context) achieved very different financial wellbeing outcomes, based on their financial behaviours. The person who scored highly on ‘active saving’ and ‘not borrowing for everyday expenses’ recorded a financial wellbeing score of 82, significantly higher than the person who scored lower on these behaviours (financial wellbeing score of 33).
• Female
• Resident of Sydney/Melbourne
• Aged 30-39 years
• Married/de facto couple with two or
three children at home
• Household income $50,000-$99,999 p.a.
• Purchasing their home
Persona 1 Behaviour scores
Not borrowing for day-to-day expenses = 56
Active saving = 38
Overall financial wellbeing score = 33
Persona 2 Behaviour scores
Not borrowing for day-to-day expenses = 98
Active saving = 96
Overall financial wellbeing score = 82
FIGURE 7. FINANCIAL BEHAVIOURS CAN INFLUENCE FINANCIAL WELLBEING
22
FINANCIAL WELLBEING REPORT
KEY FINDINGS
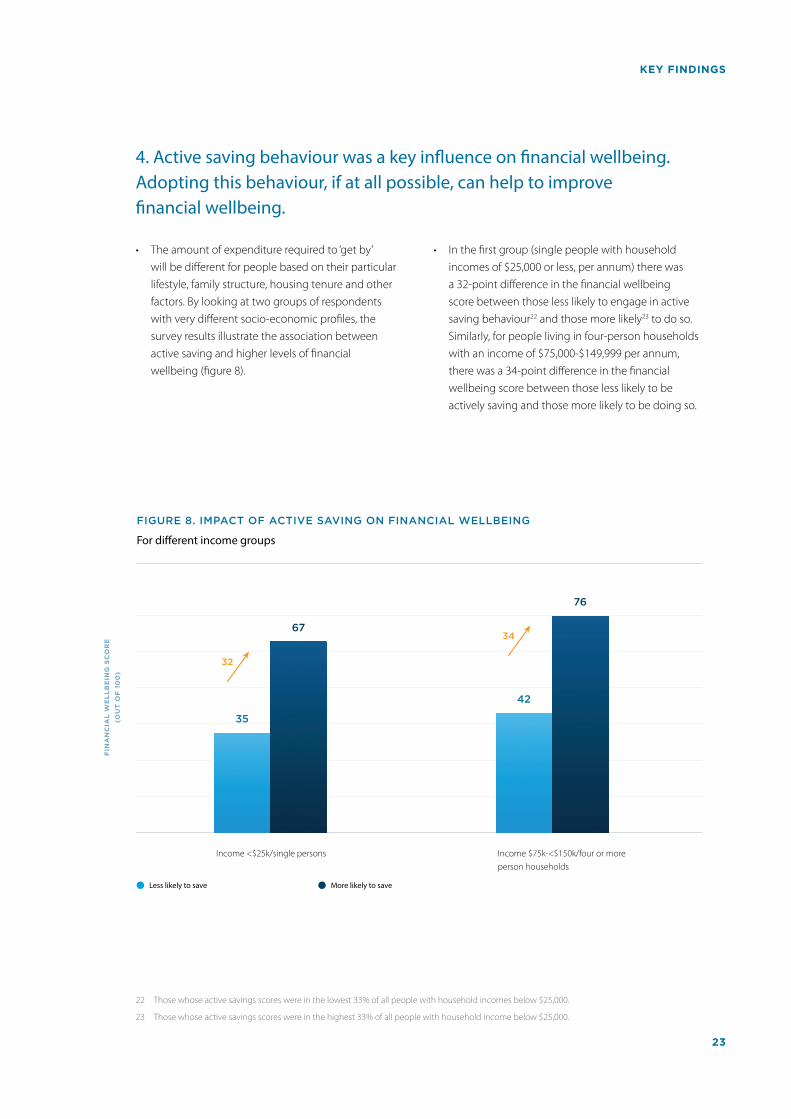
4. Active saving behaviour was a key influence on financial wellbeing. Adopting this behaviour, if at all possible, can help to improve financial wellbeing.
22 Those whose active savings scores were in the lowest 33% of all people with household incomes below $25,000.
23 Those whose active savings scores were in the highest 33% of all people with household income below $25,000.
• The amount of expenditure required to ‘get by’ will be different for people based on their particular lifestyle, family structure, housing tenure and other factors. By looking at two groups of respondents with very different socio-economic profiles, the survey results illustrate the association between active saving and higher levels of financial wellbeing (figure 8).
• In the first group (single people with household incomes of $25,000 or less, per annum) there was a 32-point difference in the financial wellbeing score between those less likely to engage in active saving behaviour22 and those more likely23 to do so. Similarly, for people living in four-person households with an income of $75,000-$149,999 per annum, there was a 34-point difference in the financial wellbeing score between those less likely to be actively saving and those more likely to be doing so.
Income <$25k/single persons Income $75k-<$150k/four or more person households
35
42
67
76
FIGURE 8. IMPACT OF ACTIVE SAVING ON FINANCIAL WELLBEING
For different income groups
FIN
AN
CIA
L W
EL
LB
EIN
G S
CO
RE
(OU
T O
F 1
00
)
Less likely to save More likely to save
32
34
23
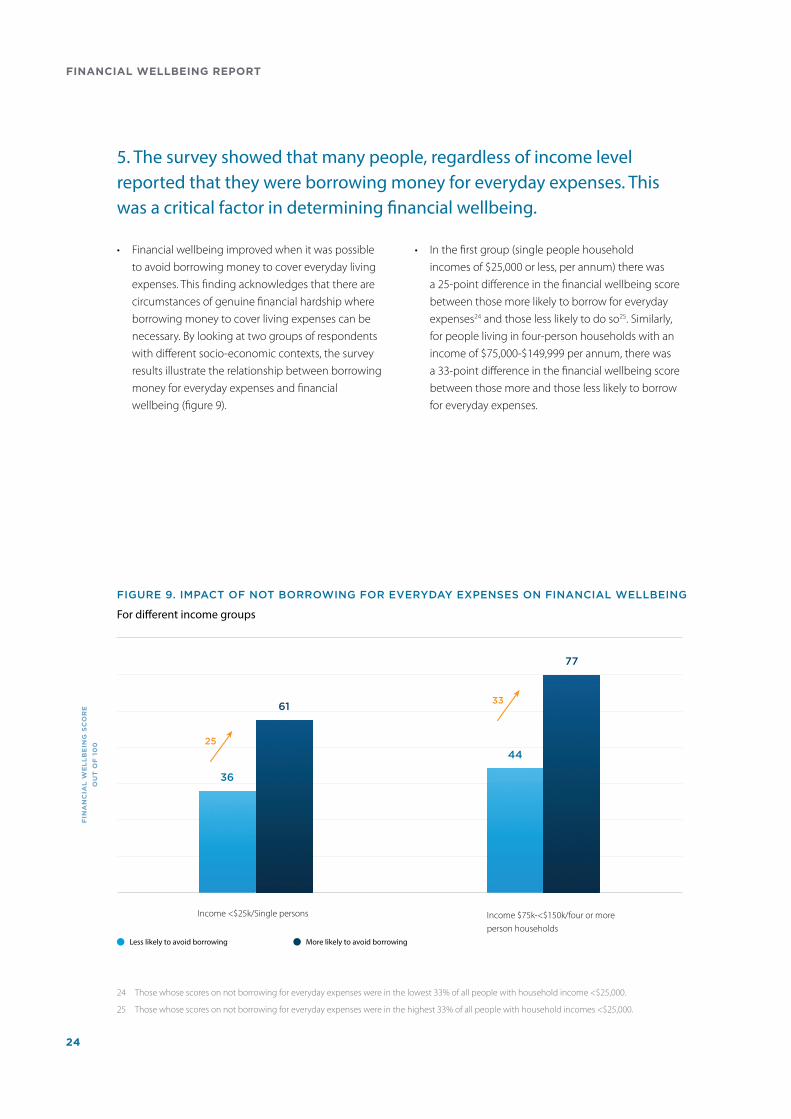
5. The survey showed that many people, regardless of income level reported that they were borrowing money for everyday expenses. This was a critical factor in determining financial wellbeing.
24 Those whose scores on not borrowing for everyday expenses were in the lowest 33% of all people with household income <$25,000.
25 Those whose scores on not borrowing for everyday expenses were in the highest 33% of all people with household incomes <$25,000.
• Financial wellbeing improved when it was possible to avoid borrowing money to cover everyday living expenses. This finding acknowledges that there are circumstances of genuine financial hardship where borrowing money to cover living expenses can be necessary. By looking at two groups of respondents with different socio-economic contexts, the survey results illustrate the relationship between borrowing money for everyday expenses and financial wellbeing (figure 9).
• In the first group (single people household incomes of $25,000 or less, per annum) there was a 25-point difference in the financial wellbeing score between those more likely to borrow for everyday expenses24 and those less likely to do so25. Similarly, for people living in four-person households with an income of $75,000-$149,999 per annum, there was a 33-point difference in the financial wellbeing score between those more and those less likely to borrow for everyday expenses.
Income <$25k/Single persons Income $75k-<$150k/four or more person households
36
44
61
77
FIGURE 9. IMPACT OF NOT BORROWING FOR EVERYDAY EXPENSES ON FINANCIAL WELLBEING
For different income groups
FIN
AN
CIA
L W
EL
LB
EIN
G S
CO
RE
OU
T O
F 1
00
Less likely to avoid borrowing More likely to avoid borrowing
25
33
24
FINANCIAL WELLBEING REPORT
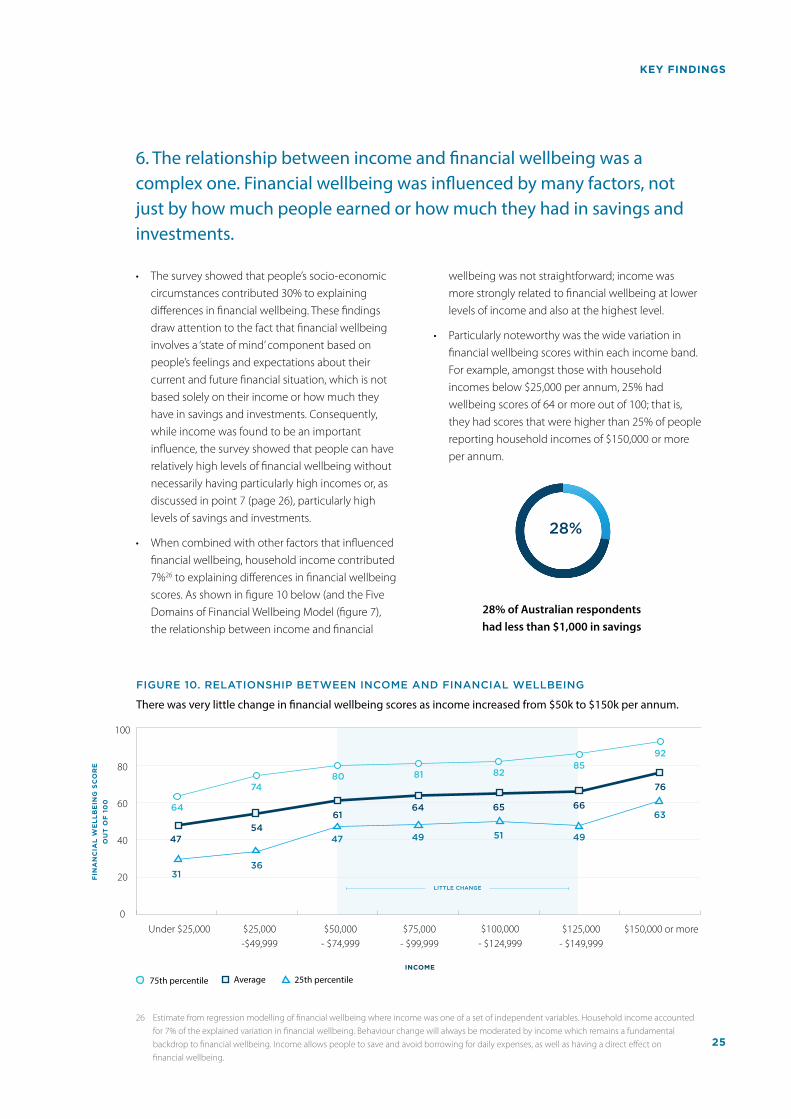
6. The relationship between income and financial wellbeing was a complex one. Financial wellbeing was influenced by many factors, not just by how much people earned or how much they had in savings and investments.
26 Estimate from regression modelling of financial wellbeing where income was one of a set of independent variables. Household income accounted for 7% of the explained variation in financial wellbeing. Behaviour change will always be moderated by income which remains a fundamental backdrop to financial wellbeing. Income allows people to save and avoid borrowing for daily expenses, as well as having a direct effect on financial wellbeing.
• The survey showed that people’s socio-economic circumstances contributed 30% to explaining differences in financial wellbeing. These findings draw attention to the fact that financial wellbeing involves a ‘state of mind’ component based on people’s feelings and expectations about their current and future financial situation, which is not based solely on their income or how much they have in savings and investments. Consequently, while income was found to be an important influence, the survey showed that people can have relatively high levels of financial wellbeing without necessarily having particularly high incomes or, as discussed in point 7 (page 26), particularly high levels of savings and investments.
• When combined with other factors that influenced financial wellbeing, household income contributed 7%26 to explaining differences in financial wellbeing scores. As shown in figure 10 below (and the Five Domains of Financial Wellbeing Model (figure 7), the relationship between income and financial
wellbeing was not straightforward; income was more strongly related to financial wellbeing at lower levels of income and also at the highest level.
• Particularly noteworthy was the wide variation in financial wellbeing scores within each income band. For example, amongst those with household incomes below $25,000 per annum, 25% had wellbeing scores of 64 or more out of 100; that is, they had scores that were higher than 25% of people reporting household incomes of $150,000 or more per annum.
KEY FINDINGS
28% of Australian respondents
had less than $1,000 in savings
28%
25th percentile Average 75th percentile
LITTLE CHANGE
Under $25,000 $25,000 - $49,999
$50,000 - $74,999
$75,000 - $99,999
$100,000 - $124,999
$125,000 - $149,999
$150,000 or more
INCOME
64
7480 81 82
8592
4754
6164 65 66
76
63
514947
3631
FIGURE 10. RELATIONSHIP BETWEEN INCOME AND FINANCIAL WELLBEING
There was very little change in financial wellbeing scores as income increased from $50k to $150k per annum.
100
80
60
40
20
0
49
FIN
AN
CIA
L W
EL
LB
EIN
G S
CO
RE
OU
T O
F 1
00
25
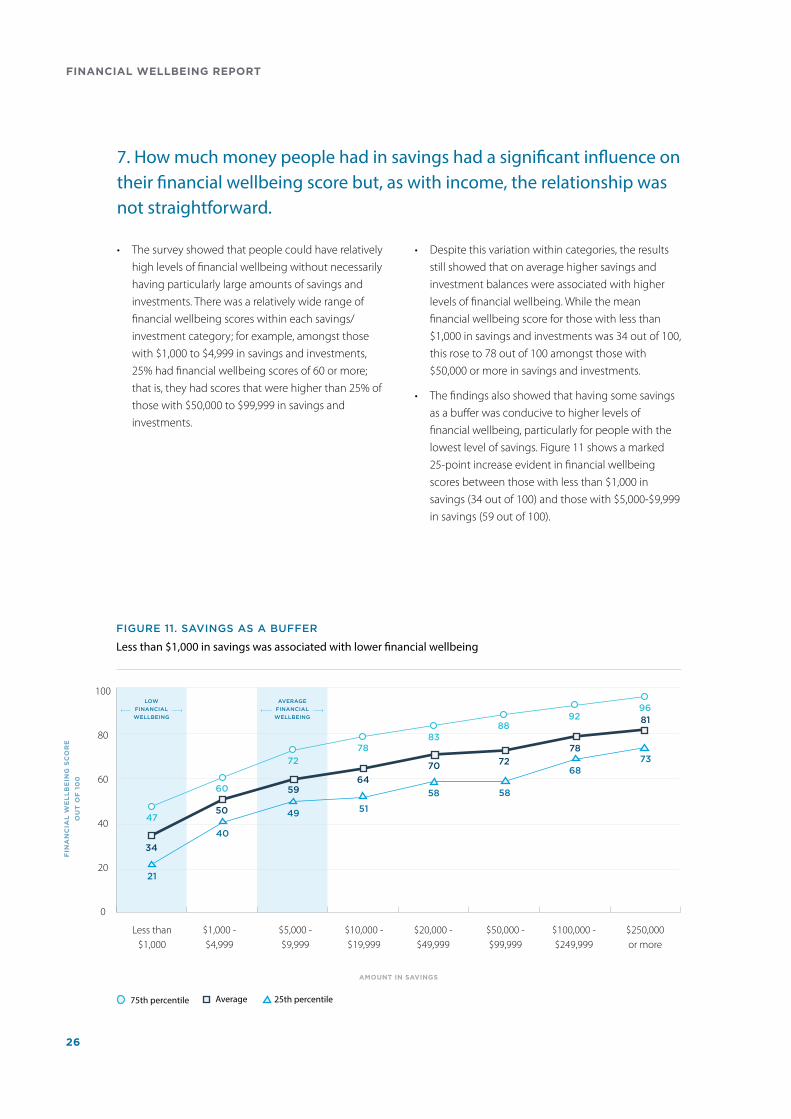
7. How much money people had in savings had a significant influence on their financial wellbeing score but, as with income, the relationship was not straightforward.
• The survey showed that people could have relatively high levels of financial wellbeing without necessarily having particularly large amounts of savings and investments. There was a relatively wide range of financial wellbeing scores within each savings/investment category; for example, amongst those with $1,000 to $4,999 in savings and investments, 25% had financial wellbeing scores of 60 or more; that is, they had scores that were higher than 25% of those with $50,000 to $99,999 in savings and investments.
• Despite this variation within categories, the results still showed that on average higher savings and investment balances were associated with higher levels of financial wellbeing. While the mean financial wellbeing score for those with less than $1,000 in savings and investments was 34 out of 100, this rose to 78 out of 100 amongst those with $50,000 or more in savings and investments.
• The findings also showed that having some savings as a buffer was conducive to higher levels of financial wellbeing, particularly for people with the lowest level of savings. Figure 11 shows a marked 25-point increase evident in financial wellbeing scores between those with less than $1,000 in savings (34 out of 100) and those with $5,000-$9,999 in savings (59 out of 100).
LOW
FINANCIAL
WELLBEING
FIGURE 11. SAVINGS AS A BUFFER
Less than $1,000 in savings was associated with lower financial wellbeing
47
60
100
80
60
40
20
0
FIN
AN
CIA
L W
EL
LB
EIN
G S
CO
RE
OU
T O
F 1
00
AMOUNT IN SAVINGS
Less than $1,000
$1,000 - $4,999
$5,000 - $9,999
$10,000 - $19,999
$20,000 - $49,999
$50,000 - $99,999
$100,000 - $249,999
$250,000 or more
25th percentile Average 75th percentile
AVERAGE
FINANCIAL
WELLBEING
72
7883
8892
96
34
50
5964
70 72
78
81
21
40
49 51
58 58
6873
26
FINANCIAL WELLBEING REPORT

8. The research showed how factors such as home ownership, age and the way parents teach their children about money when they are growing up influenced financial wellbeing scores in Australia.
Social factors accounted for 16% of the explained variation in people’s overall financial wellbeing. Specifically, the influence of the following factors is worth highlighting:
• Home ownership: People who owned their own home had higher levels of financial wellbeing. The average financial wellbeing score was 74 out of 100 for those who owned their home outright, 58 for those with a mortgage on their home and 50 for those who rented. There was no clear relationship between the size of mortgage debt and financial wellbeing (figure 12).
• Aside from the direct and indirect effects of income on financial wellbeing characteristics such as level of education and occupation were also associated with differing levels of financial wellbeing. When considering these results, it is important to keep in mind that while some groups did have higher levels of household income (this was an important influence on financial wellbeing), people in these groups also had higher scores on other key influences on financial wellbeing such active saving, not borrowing for expenses and confidence in money management.
• As earlier analysis has shown, it would not be correct to attribute the higher levels of financial wellbeing solely to higher levels of household income. With that in mind, we noted that people who were either currently working in upper white collar occupations, or who had done so in the past, had higher levels of
financial wellbeing (mean score of 66 out of 100) than those who were either currently or formerly employed in middle/lower white collar occupations (mean score of 57), upper blue collar occupations (mean score of 60) or lower blue collar occupations (mean score of 50). Those who had completed a university degree exhibited higher levels of financial wellbeing (mean score of 67) than those who had not done so (mean score of 57).
• Age also played a role in financial wellbeing, with older people generally having higher levels of financial wellbeing. There were no doubt many factors influencing this. People aged 60 years or more were more likely to own their own home, and to have had longer to accumulate superannuation and other assets. Of people aged 60 years or more:
- 63% owned their home outright (versus 16% of those aged under 60 years);
- median savings/investment balances were $28,000 (versus $4,800 for people under 60); and
- median superannuation balances were $197,300 (versus $42,000 for people under 60).
• Parental advice is also important – people whose parents did not provide them with advice on money matters when they were growing up had lower levels of financial wellbeing on average (56 out of 100) than those whose parents did provide such advice (67).
KEY FINDINGS
47 50 5258
74
FIN
AN
CIA
L W
EL
LB
EIN
G S
CO
RE
OU
T O
F 1
00
Paid rent to a government agency
Paid rent to a private landlord
Paid rent/board to someone who lived in the house
Owned home (had a mortgage)
Owned home (mortgage-free)
100
80
60
40
20
0
FIGURE 12. IMPACT OF HOME OWNERSHIP STATUS ON FINANCIAL WELLBEING
27
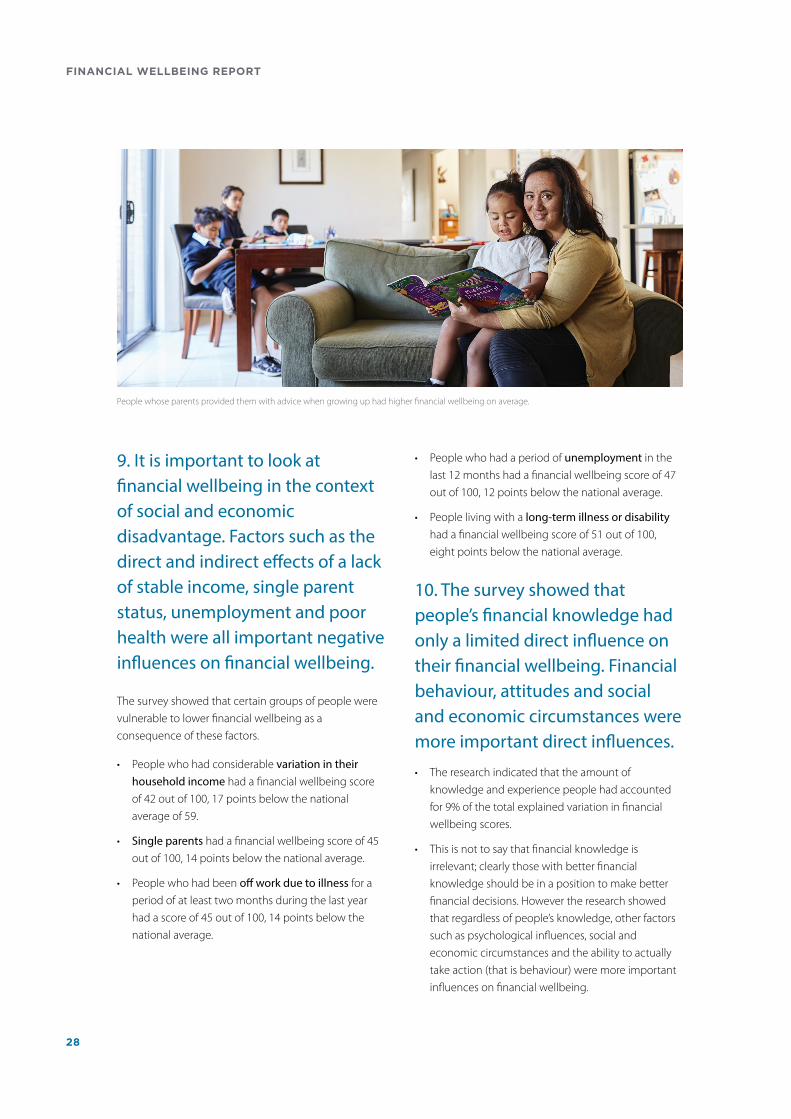
9. It is important to look at financial wellbeing in the context of social and economic disadvantage. Factors such as the direct and indirect effects of a lack of stable income, single parent status, unemployment and poor health were all important negative influences on financial wellbeing.
The survey showed that certain groups of people were vulnerable to lower financial wellbeing as a consequence of these factors.
• People who had considerable variation in their household income had a financial wellbeing score of 42 out of 100, 17 points below the national average of 59.
• Single parents had a financial wellbeing score of 45 out of 100, 14 points below the national average.
• People who had been off work due to illness for a period of at least two months during the last year had a score of 45 out of 100, 14 points below the national average.
• People who had a period of unemployment in the last 12 months had a financial wellbeing score of 47 out of 100, 12 points below the national average.
• People living with a long-term illness or disability had a financial wellbeing score of 51 out of 100, eight points below the national average.
10. The survey showed that people’s financial knowledge had only a limited direct influence on their financial wellbeing. Financial behaviour, attitudes and social and economic circumstances were more important direct influences.
• The research indicated that the amount of knowledge and experience people had accounted for 9% of the total explained variation in financial wellbeing scores.
• This is not to say that financial knowledge is irrelevant; clearly those with better financial knowledge should be in a position to make better financial decisions. However the research showed that regardless of people’s knowledge, other factors such as psychological influences, social and economic circumstances and the ability to actually take action (that is behaviour) were more important influences on financial wellbeing.
People whose parents provided them with advice when growing up had higher financial wellbeing on average.
28
FINANCIAL WELLBEING REPORT
11. People rated their knowledge of bank accounts and products to manage their money day-to-day as substantially better than their knowledge of longer-term financial investments which might improve their financial situation and prepare them for retirement.
• While 51% of people rated their knowledge of day-to-day banking and finance products as good27 knowledge of investment and retirement products was rated substantially lower. Just 32% of respondents considered they had good28 knowledge of investment and retirement products.
12. The survey showed that psychological factors, including aspects of people’s personality and their attitudes towards money, had an impact on financial wellbeing scores.
We found that psychological factors accounted for 16% of the explained variation in people’s financial wellbeing. People’s outlook on life had an important impact on their financial wellbeing score.
The research highlighted that self-belief and confidence to make financial decisions and manage everyday finances were two critical psychological factors influencing overall financial wellbeing.
• People who were the most confident in their day-to-day money management skills had a financial wellbeing score of 73 out of 100. This dropped to a score of 32 for those who were the least confident in money management skills. Nevertheless, it is worth noting that 9% of those with high confidence scores of 80 or more out of 100 actually had financial wellbeing scores below 40 out of 100. This indicated that some people may have been over-confident when assessing their money management skills.
27 Sum of responses 1 & 2 on a five point scale 1 (very good) to 5 (very poor).
28 Sum of responses 1 & 2 on a five point scale 1 (very good) to 5 (very poor).
• Internal locus of control (i.e. the belief that people can determine what happens in their own life) had an impact on financial wellbeing scores. Of particular interest is the deterioration in financial wellbeing scores for those at the bottom end of the scale who did not believe they had much control over their lives (average wellbeing score of 46 versus 66 for those at the top of the scale).
13. High levels of income variability were associated with lower levels of financial wellbeing. People running their own business and women were over-represented in the group that reported very variable income. • While comprising only 9% of respondents, those
whose household income varied considerably from month-to-month had lower financial wellbeing (mean score of 42 out of 100) than those whose income only varied a bit (mean score of 56) or whose income was stable (mean score of 64).
• Those whose income did vary considerably were more likely than average to be self-employed (23%) in a business of which they were the sole employee (79% of those with highly variable incomes who owned their business) and which turned over less than $100,000 per year (54% of this group). There was also a slight over-representation of women in this group (58% females versus 42% males). Amongst those whose income varied considerably from month to month, these subgroups all exhibited below average levels of financial wellbeing.
KEY FINDINGS
29
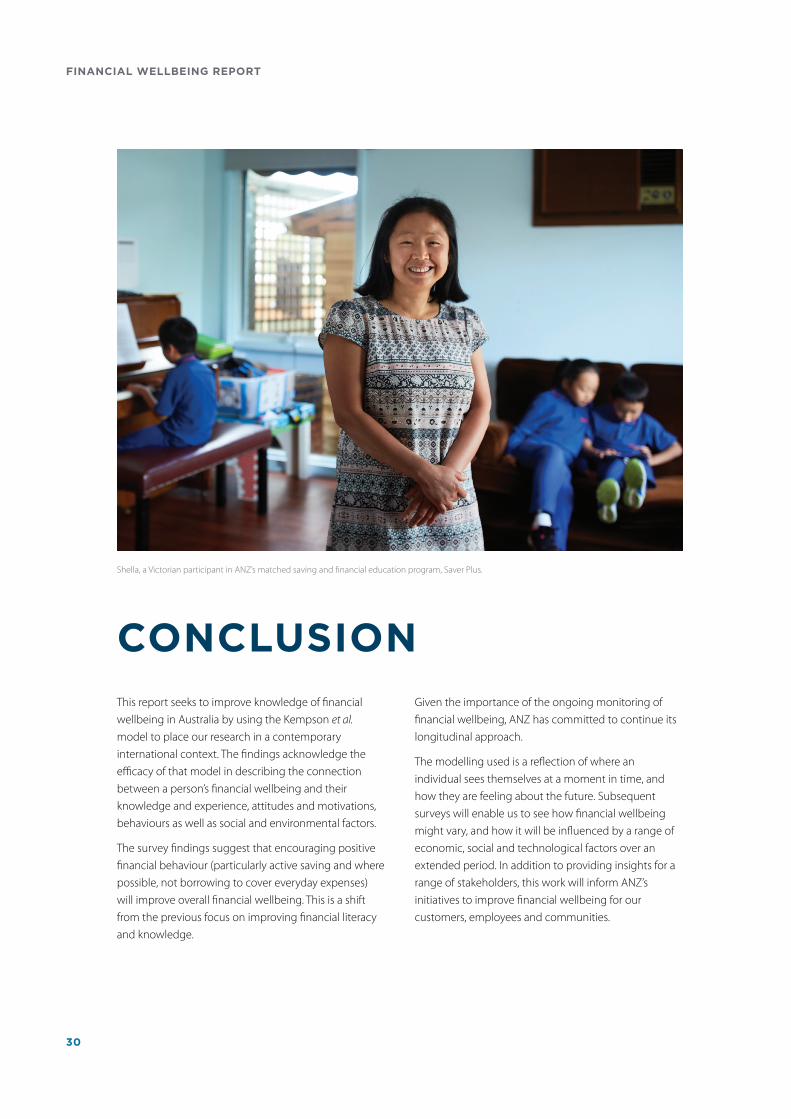
CONCLUSIONThis report seeks to improve knowledge of financial wellbeing in Australia by using the Kempson et al. model to place our research in a contemporary international context. The findings acknowledge the efficacy of that model in describing the connection between a person’s financial wellbeing and their knowledge and experience, attitudes and motivations, behaviours as well as social and environmental factors.
The survey findings suggest that encouraging positive financial behaviour (particularly active saving and where possible, not borrowing to cover everyday expenses) will improve overall financial wellbeing. This is a shift from the previous focus on improving financial literacy and knowledge.
Given the importance of the ongoing monitoring of financial wellbeing, ANZ has committed to continue its longitudinal approach.
The modelling used is a reflection of where an individual sees themselves at a moment in time, and how they are feeling about the future. Subsequent surveys will enable us to see how financial wellbeing might vary, and how it will be influenced by a range of economic, social and technological factors over an extended period. In addition to providing insights for a range of stakeholders, this work will inform ANZ’s initiatives to improve financial wellbeing for our customers, employees and communities.
Shella, a Victorian participant in ANZ’s matched saving and financial education program, Saver Plus.
30
FINANCIAL WELLBEING REPORT
APPENDICES
APPENDICES
29 See Gerrans et al., (2014) The relationship between personal financial wellness and financial wellbeing: a structural equation modelling approach. Journal of Family and Economic Issues, 25: 145-160.
30 https://uwaterloo.ca/canadian-index-wellbeing/about-canadian-index-wellbeing/wellbeing-around-world
1. LITERATURE REVIEW
Financial Wellbeing: Evolution of the concept, meaning and application
Roslyn Russell and Jozica Kutin, RMIT University
The concept of financial wellbeing has gained prominence in research and policy over the last few years. While it may be tempting to view the term as yet another buzzword in the field of personal finance, it is in reality proving useful as a construct. The term ‘financial wellbeing’ is inherently intuitive and understandable to everyday people, practitioners and researchers alike. Other terms increasingly used in the literature and in industry that are analogous (but not necessarily interchangeable)29 to financial wellbeing are financial health, financial wellness and financial fitness: all reflecting health-related concepts.
The major strength of the term ‘financial wellbeing’ is that it explicitly recognises that finances are inextricably linked with wellbeing. By combining the terms (finance and wellbeing) it reduces one of the biggest barriers to people focusing on their finances – that is the inclination to consider financial issues as separate from or unrelated to the other elements of life.
Financial wellbeing combines concepts related to the fields of personal finance and the broader area of personal wellbeing. Both fields have long histories, have evolved in parallel and draw from a number of common disciplines including economics, psychology, and health (Bowman, Banks, Fela, Russell, & de Silva, 2016). While financial wellbeing can stand alone as a concept it is also a subset of personal wellbeing and should be understood within the context of the individual’s life within a household, community and society.
Improving personal wellbeing has become an important policy priority in many countries30. This has led researchers to prioritise understanding it, measuring it and exploring ways to best improve the factors that lead to wellbeing.
Wellbeing indices include elements such as housing, income, education, security, connectedness, health and life satisfaction (Capic, Li, & Cummins, 2017), democratic or civic engagement, living standards, environment, leisure and culture, time use or work-life balance, and community vitality (Canadian Index of Wellbeing, 2016; OECD, 2017). Wellbeing is associated with happiness (Hayes, Evans, & Finney, 2016a, 2016b) and the Australian Unity measure of happiness includes having financial control as being one of the three factors that comprise ‘the golden triangle of happiness’ along with personal relationships and a sense of purpose (Australian Unity, 2017; Cummins et al., 2007).
Financial wellbeing is also becoming increasingly recognised in industry as being important for employees. Reduced productivity due to financial stress is costly to employees and organisations (AMP Life, 2016). Estimates are that nearly half of Australian workers worry about their financial situation and can spend almost 10% of paid work hours thinking about financial issues (Map My Plan Ltd, 2015), and 24% are financially stressed (AMP Life, 2016). High levels of financial stress within a workplace increases turnover and number of sick days taken and it is estimated that it can cost Australian employers between $47 billion- $60 billion (AMP Life, 2016; Map My Plan Ltd, 2015).
31
What does it mean to have financial wellbeing?
There are a number of definitions of financial wellbeing that are being used in academic literature, industry reports and government policies – all having very similar meanings. The commonly agreed components of financial wellbeing are being able to meet financial commitments; have resources to enjoy life, and ability to cope with unexpected financial shocks. There is also in most definitions a temporal consideration to financial wellbeing. One should feel in control and satisfied with the present financial situation, while having positive views and plans for one’s financial future. To varying degrees financial wellbeing definitions include subjective measures of feelings and satisfaction about financial situations, and objective measures of financial management behaviours. This approach mirrors that of personal wellbeing measures which usually include objective indicators about levels of health, education and lifestyle; more subjective type measures of satisfaction with life; and also emotions and thoughts (Vlaev & Elliott, 2014).
Internationally there has been a groundswell of work to further our understanding of financial wellbeing. Primarily the recent work31 has come from the USA – the Consumer Financial Protection Bureau (CFPB) (Consumer Financial Protection Bureau, 2015); the UK – Momentum & University of Bristol (Hayes et al., 2016a, 2016b); UK /Norway – Kempson, Finney, and Poppe (2017) and Australia – Centre for Social Impact, Muir et al. (2017).
31 See Kempson et al. (2017) for discussion of earlier definitions and work on financial wellbeing.
32 Kempson et al. (2017) and Bowman et al. (2016) have provided comprehensive reviews of the evolution of terms from financial literacy, financial capabilities to financial wellbeing. These pieces of research also include discussions on how related concepts such as financial resilience and financial inclusion fit into our current framework of financial wellbeing.
Evolution of the financial wellbeing concept
As the personal finance area of research and practice has evolved over time, so too has the terminology and our understanding of how to create a financially healthy population. Following is a brief overview of the evolution of terminology relevant to understanding financial wellbeing32.
As our understanding grows and new terms are introduced, it does not mean older terms become redundant. The growth in knowledge and research has induced the need for terminology that is more reflective of current understanding, and is intuitive and comprehensive. Each term retains its place in understanding financial wellbeing.
Financial literacy
Fifteen-to-twenty years ago, the literature in personal finance predominantly focused on individual levels of ‘financial literacy’. In short, financial literacy refers to individual knowledge and skills in managing money. This era of work which focused on measuring and improving financial literacy reflected the dominant but flawed belief that more knowledge would or should result in effective financial behaviour. The focus on financial literacy neglected to include external environmental conditions that impact on people’s financial situation. The state of the economy, responsibilities of institutions, people’s income and opportunity for employment and household circumstances were largely left out of the picture. The underlying assumption was that individuals who experienced financial hardship only needed more financial knowledge to improve their financial situation.
32
FINANCIAL WELLBEING REPORT
Financial literacy is generally measurable through questions that have right or wrong answers, are usually mathematical in nature and involve being able to understand financial terms and documents (Klapper et al., 2015). In relating this to a public health analogy, it would be akin to knowing the facts about nutrition, exercise and healthy lifestyle habits. Of course, simply knowing the facts does not make us healthy until we translate that knowledge into behaviour. Having said that, effective behaviour is less likely to occur without knowledge. Literacy or knowledge is important, but it is not sufficient for wellbeing.
Financial capability
Around 10 years ago, research began to focus on the importance of taking action and adopting certain behaviours. Atkinson, McKay, Kempson and Collard (2006) in the UK provided the most comprehensive and seminal work that developed the concept of financial capability. The important contributions from this research were that financial capability includes sets of behaviours and not just knowledge, it is not a singular concept but is comprised of five domains: making ends meet, keeping track of finances, planning for the future, choosing appropriate financial products and staying informed.
Johnson and Sherraden (2007) added a critical element to our understanding of the term financial capability by explicitly including ‘opportunity’ to act on knowledge. This highlighted the importance of external factors and how they can either inhibit or provide opportunities to develop capabilities. Financial capability is not just an individual responsibility, it incorporates the role of institutions in enabling financial inclusion, provision of adequate income and opportunities to learn and implement behaviours.
Financial wellbeing
Financial wellbeing is the most holistic concept to date. It answers the need for a term that included elements that we knew were important in explaining differences in people’s financial situations that were not adequately focused upon in the past. Models of financial wellbeing include a range of external factors. Socio-economic indicators such as income, employment, health and social support make a significant difference to the level of financial wellbeing.
It does incorporate the need for knowledge (financial literacy), behaviours (capabilities), and is heavily influenced by attitudes and psychological traits. They also include consideration of the present and the future. Financial wellbeing will be different for everyone but an effective index will include objective as well as subjective measures. The following section summarises the drivers of financial wellbeing as indicated in the most current measures.
LITERATURE REVIEW
33
What are the drivers of financial wellbeing?
33 Please note that while the Kempson et al. (2017) model was developed using UK and Norwegian data, the survey used to test the model was disseminated in Norway.
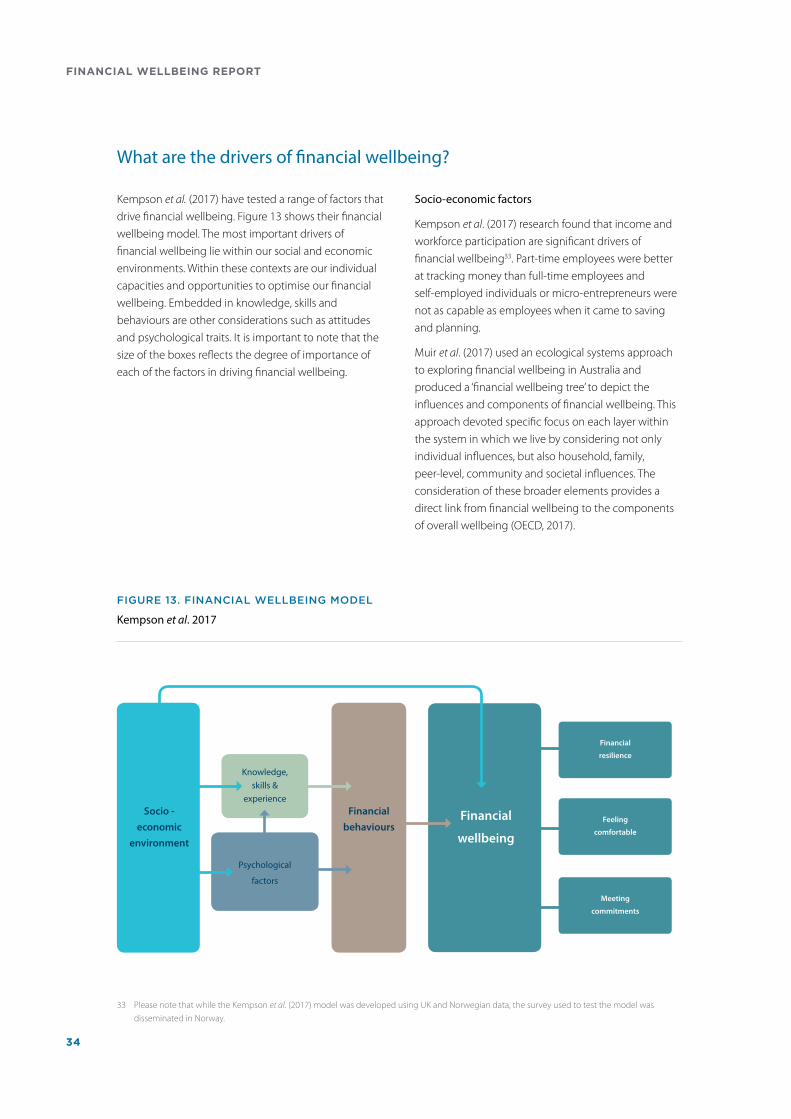
Kempson et al. (2017) have tested a range of factors that drive financial wellbeing. Figure 13 shows their financial wellbeing model. The most important drivers of financial wellbeing lie within our social and economic environments. Within these contexts are our individual capacities and opportunities to optimise our financial wellbeing. Embedded in knowledge, skills and behaviours are other considerations such as attitudes and psychological traits. It is important to note that the size of the boxes reflects the degree of importance of each of the factors in driving financial wellbeing.
Socio-economic factors
Kempson et al. (2017) research found that income and workforce participation are significant drivers of financial wellbeing33. Part-time employees were better at tracking money than full-time employees and self-employed individuals or micro-entrepreneurs were not as capable as employees when it came to saving and planning.
Muir et al. (2017) used an ecological systems approach to exploring financial wellbeing in Australia and produced a ‘financial wellbeing tree’ to depict the influences and components of financial wellbeing. This approach devoted specific focus on each layer within the system in which we live by considering not only individual influences, but also household, family, peer-level, community and societal influences. The consideration of these broader elements provides a direct link from financial wellbeing to the components of overall wellbeing (OECD, 2017).
Socio -
economic
environment
Financial
behavioursFinancial
wellbeing
Psychological
factors
Financial
resilience
Feeling
comfortable
Meeting
commitments
Knowledge, skills &
experience
Kempson et al. 2017
FIGURE 13. FINANCIAL WELLBEING MODEL
34
FINANCIAL WELLBEING REPORT
LITERATURE REVIEW
While the Kempson et al. research did not specifically measure variables such as social capital or community socio-economic status, the Muir et al. research did and found that social capital was significantly associated with financial wellbeing. In personal wellbeing measures, social capital may reflect social connectedness and relationships; it is having people in your life who support you and having access to resources if needed. The Muir et al. ‘financial wellbeing tree’ model also included life stressors and personal health as important contributors to wellbeing.
The Hayes et al. (2016b) Momentum UK Financial Wellness index included three macro factors that influence financial wellbeing. It used unemployment rate, which of course impacted income and indicated strength of the economy, and changes in GDP per capita that could give an average income per person. The World Bank data used in the index included a Purchasing Power Parity which accounted for cost of living across countries. The third macro indicator used in the UK index was the Gini coefficient which is a measure of inequality.
Individual factors
Within the Kempson et al. framework are factors that relate to individual capacities such as knowledge, financial behaviours and psychological traits. Kempson et al. found the most important financial capabilities or behaviours to financial wellbeing were active saving, not borrowing for everyday expenses and restrained spending. The psychological traits that were most significant to those behaviours were reduced impulsivity, a future time orientation, internal locus of control and self-control. Knowledge was found to be the least important of the individual capacities in influencing financial wellbeing.
Muir et al., found similar individual factors to be important, especially among the objective behavioural measures of meeting expenses and having money left over, being in control and feeling financially secure. Muir et al. also found having savings and building resilience for unexpected expenses were both important. Muir and Hayes et al. specifically included financial inclusion as a significant driver of financial wellbeing – this element could be also seen as an external factor with responsibility lying predominantly with financial institutions.
Muir et al. did not specifically include psychological traits but found that personal health was an important driver of financial wellbeing. Having a disability or poor physical or mental health was detrimental to financial wellbeing.
Hayes et al. included many of the individual capabilities and objective measures included in the Kempson and Muir models and also included having assets and financial confidence.
35
Australian initiatives to support financial wellbeing
34 https://www.dss.gov.au/communities-and-vulnerable-people/programmes-services/financial-wellbeing-and-capability
35 http://goodshepherdmicrofinance.org.au/services/no-interest-loan-scheme-nils/
36 https://www.bsl.org.au/services/money-matters/saver-plus/
37 https://www.moneysmart.gov.au/
38 http://www.financialliteracy.gov.au/research-and-evaluation/financial-attitudes-and-behaviour-tracker
39 http://www.moneyminded.com.au/
In Australia, as in many countries, the promotion of financial wellbeing is generally undertaken through a multi-sector partnership approach. Government, business and community organisations work together to provide a multitude of resources and initiatives aimed at improving the financial wellbeing of individuals and families. Government policies that directly influence the financial wellbeing of Australians cross three federal departments – the Department of Social Services, ASIC and the Department of Human Services.
The Australian Government has formally adopted the term ‘financial wellbeing’ in its policies aimed at assisting vulnerable people in the community. The ‘Financial wellbeing and capability’34 program includes a broad spectrum of services from emergency relief to financial counselling and initiatives and products aimed at building financial resilience such as Good Shepherd Microfinance’s No Interest Loans (NILS)35 and ANZ and the Brotherhood of St Laurence’s matched savings program, Saver Plus36.
ASIC contributes to the financial wellbeing of Australians in a number of ways. The MoneySmart37 website includes financial guidance for consumers, calculators and tools relevant to a range of cohorts and life events that impact financial wellbeing. ASIC also protects the rights of consumers and regulates credit markets and financial services. Tracking of Australians’ financial attitudes and behaviours38 is undertaken regularly by ASIC and helps determine what resources and information might improve financial wellbeing.
Financial education has been introduced into the Australian school curriculum and ASIC has developed the MoneySmart Teaching Program to equip teachers to build the financial capability of students. An evaluation of the program showed that it positively impacted teachers’ own financial capabilities and their ability and confidence to teach financial skills to their students (ASIC, 2017). The evaluation found that the MoneySmart school program was associated with higher levels of financial knowledge and capability among students.
The most widely used financial education program in Australia is MoneyMinded39. The program developed by ANZ has reached over 500,000 people across Australia and the Asia Pacific region since 2003. It has improved the financial wellbeing of many cohorts including sole parents, people who are unemployed, people with disability and new migrants (Russell, Kutin, Stewart and Rankin, 2017).
36
FINANCIAL WELLBEING REPORT
FINANCIAL WELLBEING
Bibliography
Allin, P., & Hand, D. J. (2017). New statistics for old? – Measuring the wellbeing of the UK. Journal of the Royal Statistical Society: Series A (Statistics in Society), 180(1), 3-43. doi:10.1111/rssa.12188
AMP Life. (2016). Financial wellness in the Australian workplace. Retrieved from Parramatta, Australia: https://www.ampcapital.com.au/goals/MyLifeGoals/media/contents/Articles/2016/December/October-2016_Financial-wellness-in-the-Australian-workplace_FINAL.pdf
ASIC. (2017). Independent evaluation of ASIC’s MoneySmart Teaching Program. Report 554. Retrieved from Canberra, Australia: http://download.asic.gov.au/media/4563536/rep554-published-4-december-2017.pdf
Atkinson, A., McKay, S., Kempson, E., & Collard, S. (2006). Levels of financial capability in the UK: Results of a baseline survey. Consumer Research 47. Retrieved from Personal Finance Research Centre, University of Bristol, United Kingdom: http://www.pfrc.bris.ac.uk/publications/Reports/Fincap_baseline_results_06.pdf
Australian Unity. (2017). What makes us happy? Retrieved from South Melbourne, Australia: http://www.australianunity.com.au/health-insurance/sitecore/content/about-us/home/wellbeing/what-makes-us-happy
Bowman, D., Banks, M., Fela, G., Russell, R., & de Silva, A. (2016). Understanding financial wellbeing in times of insecurity. Working paper. Retrieved from Brotherhood of St Laurence, Fitzroy, Australia: http://library.bsl.org.au/jspui/bitstream/1/9423/1/Bowman_etal_Understanding_financial_wellbeing_2017.pdf
Canadian Index of Wellbeing. (2016). How are Canadians Really Doing? The 2016 CIW National Report. Retrieved from Canadian Index of Wellbeing and University of Waterloo, Ontario, Canada: https://uwaterloo.ca/canadian-index-wellbeing/sites/ca.canadian-index-wellbeing/files/uploads/files/c011676-nationalreport-ciw_final-s_0.pdf
Capic, T., Li, N., & Cummins, R. A. (2017). Confirmation of subjective wellbeing set-points: Foundational for subjective social indicators. Social Indicators Research. doi:10.1007/s11205-017-1585-5
CFFC. (2015). National strategy for financial capability. June 2015. Retrieved from Auckland, New Zealand: https://www.cffc.org.nz/assets/Uploads/National-Strategy-for-Financial-Capability-June-2015.pdf
CFFC. (2017a). Briefing to the incoming Minister of Commerce and Consumer Affairs. Prepared by the Commission for Financial Capability. Retrieved from Auckland, New Zealand: https://www.cffc.org.nz/assets/CFFC-BIM-NOV.pdf
CFFC. (2017b). Recipes for retirement. Annual report 2016/2017. Commission for Financial Capability. Retrieved from Auckland, New Zealand: https://www.cffc.org.nz/assets/Uploads/CFFC-Annual-Report-2016-2017-Web.pdf
CFFC. (2017 ). Statement of intent. 2017-2020. Retrieved from Auckland, New Zealand: https://www.cffc.org.nz/assets/Uploads/CFFC-Statement-of-Intent-010817.pdf
CFLRI. (2012). National strategy for financial literacy. Annual report 2012. Commission for Financial Literacy and Retirement Income. Retrieved from Auckland, New Zealand: https://www.cffc.org.nz/assets/Documents/National-Strategy-for-Financial-Literacy-Annual-Report-2012.pdf
Cigna International. (2017). Live well. 2017 Cigna 360 wellbeing survey. Retrieved from Wellington, New Zealand: https://www.cigna.com.hk/iwov-resources/docs/en/about-cigna/news/Cigna360Wellbeing_Survey2017.pdf
Colmar Brunton. (2014). New Zealand Financial Behaviour Index. Wave Seven – November 2014. Retrieved from Auckland, New Zealand: https://www.cffc.org.nz/assets/Documents/FBI-Financial-Behaviour-Index-November-2014.pdf
Consumer Financial Protection Bureau. (2015). Measuring financial wellbeing: A guide to using the CFPB Financial Wellbeing Scale. Retrieved from http://files.consumerfinance.gov/f/201512_cfpb_financial-wellbeing-user-guide-scale.pdf
Cummins, R. A., Hughes, J., Tomyn, A., Gibson, A., Woerner, J., & Lai, L. (2007). The wellbeing of Australians: Carer health and wellbeing. Report 17.1. Retrieved from Australian Centre on Quality of Life and School of Psychology, Deakin University and Australian Unity,
Geelong, Australia: http://www.carersaustralia.com.au/storage/Wellbeing-Index-Special-Report-October-2007.pdf
EY Sweeney. (2017). Independent evaluation of ASIC’s MoneySmart Teaching Program. Volume 2: Case studies. EY Sweeney Ref No. 24488. Retrieved from Sydney, Australia: http://download.asic.gov.au/media/4563530/ey-sweeney-case-studies.pdf
Financial Literacy & Savings Partner Working Group. (2015). Whanau and low-income household savings report. Retrieved from Auckland, New Zealand: http://www.mbie.govt.nz/info-services/infrastructure-growth/maori-economic-development/documents-image-library/hkkar-whanau-and-low-income-household-savings-report.pdf
Gerrans, P., Speelman, C., & Campitelli, G. (2014). The relationship between personal financial wellness and financial wellbeing: A structural equation modelling approach. Journal of Family Economic Issues, 35, 145-160. doi:10.1007/s10834-013-9358-z
37
Hayes, D., Evans, J., & Finney, A. (2016a). Momentum Household Financial Wellness Index: Wave one. Retrieved from Personal Finance Research Centre, University of Bristol, United Kingdom: https://www.researchgate.net/publication/318672509_Momentum_UK_Household_Financial_Wellness_Index_2016/overview
Hayes, D., Evans, J., & Finney, A. (2016b). Momentum UK Household Financial Wellness Index. Quantitative methodology. Retrieved from Personal Finance Research Centre, University of Bristol, United Kingdom: http://www.bristol.ac.uk/media-library/sites/geography/pfrc/pfrc1610_momentum-methodology-report.pdf
Hayes, D., Evans, J., & Finney, A. (2017). Momentum UK Household Financial Wellness Index 2017. Summary report. Retrieved from Personal Finance Research Centre, University of Bristol, United Kingdom: https://www.momentumgim.co.uk/wps/wcm/connect/mgim2/3a6e04d0-4d20-47f9-b1e2-26ed81db67bb/Final+summary+report+-+Financial+Wellness+2017.pdf?MOD=AJPERES
Johnson, E., & Sherraden, M. S. (2007). From financial literacy to financial capability among youth. Journal of Sociology and Social Welfare, 34(3), 119-145. Kempson, E., Finney, A., & Poppe, C. (2017). Financial wellbeing: A conceptual model and preliminary analysis. Final edition. Consumption Research Norway SIFO. SIFO Project Note no. 3. Consumption Research Norway SIFO. Oslo, Norway. Retrieved from http://www.bristol.ac.uk/geography/research/pfrc/themes/fincap/financial-wellbeing-conceptual-model/
Klapper, L., Lusardi, A., & van Oudheusden, P. (2015). Financial literacy around the world: Insights from the Standard & Poor’s ratings services global financial literacy survey. Retrieved from Washington, D.C.: http://gflec.org/wp-content/uploads/2015/11/3313-Finlit_Report_FINAL-5.11.16.pdf?x87657
Mackay, L., Schofield, G., Jarden, A., & Prendergast, K. (2015). Sovereign Wellbeing Index. Retrieved from Auckland, New Zealand: http://ebooks.sovereign.co.nz/sov_executive_report_2015_ebook/
Mackay, L. M., Jarden, A., Prendergast, K., & Schofield, G. M. (2015). 2014 Sovereign Wellbeing Index. Mini report series. Retrieved from Human Potential Centre, AUT University, Auckland, New Zealand: http://www.mywellbeing.co.nz/mw/report/wealth-and-wellbeing-in-new-zealand.pdf
Malatest International. (2015). Evaluation of the Wainuiomata Sorted workplace programme. Retrieved from Wellington, New Zealand: http://www.financialliteracy.gov.au/media/559985/evaluationofthewainuiomatasortedworkplaceprogramme-nz-2015.pdf
Map My Plan Ltd. (2015). The financial fitness of working Australians. Retrieved from Sydney, Australia: https://s3.mapmyplan.com.au/pdf/MMP-Financial-Index-Report.pdf
Muir, K., Hamilton, M., Noone, J., Marjolin, A., Salignac, F., & Saunders, P. (2017). Exploring financial wellbeing in the Australian context. Retrieved from Sydney, Australia: http://www.financialliteracy.gov.au/media/560752/research-unsw-fla-exploringfinancialwellbeingintheaustraliancontext-report-201709.pdf
New Zealand Government. (2015). Building financial capability in New Zealand. Retrieved from Auckland, New Zealand: https://www.cffc.org.nz/assets/Uploads/Financial-Capability-Government-Statement.pdf
OECD. (2017). How’s life? 2017: Measuring wellbeing. Retrieved from OECD Publishing, Paris, France: http://www.oecd-ilibrary.org/economics/how-s-life_23089679
Perry, B. (2017). The material wellbeing of NZ households: Overview and key findings from the 2017 household incomes report and the companion report using non-income measures. Retrieved from Ministry of Social Development, Wellington, New Zealand: https://www.msd.govt.nz/documents/about-msd-and-our-work/publications-resources/monitoring/household-income-report/2017/incomes-report-overview.pdf
Russell, R., Kutin, J., Green, R., Banks, M., & Di lorio, A. (2016). Women and money in Australia: Across the generations. Retrieved from RMIT University, Melbourne, Australia: https://www.academia.edu/31292558/WOMEN_AND_MONEY_IN_AUSTRALIA_ACROSS_THE_GENERATIONS?auto=download
Russell, R., Kutin, J., Stewart, M., & Rankin, G. (2017) MoneyMinded Impact Report 2017. http://www.financialliteracy.gov.au/media/560892/mm-impact-2017.pdf
Vlaev, I., & Elliot, A. (2014). Financial wellbeing components. Social Indicators Research, 118(3), 1103-1123. doi:10.1007/s11205-013-0462-0
38
FINANCIAL WELLBEING REPORT

2. SURVEY METHODOLOGY
The 2017 ANZ Financial Wellbeing Survey was conducted in Australia as both an online and CATI (Computer Assisted Telephone Interview):
Online Survey:
• 30 minutes duration
• Nationally representative sample of Australian adults, aged 18 years and over
• Total responses received: n=3,578
• Panel: SSI [www.surveysampling.com/services/data-collection/online-surveys/]
• Australia-wide
• Quotas set for age, gender and location
• Data post-weighted to latest ABS population estimates for age, gender and location
• Fieldwork dates: 30 Nov – 8 Dec 2017
CATI Survey:
• 8 minutes duration
• The CATI survey was run in parallel with online to provide comparisons of key measures to assist in the transition phase from the methodology used in previous surveys
• Adults aged 18 years and over
• Total responses received: n=1,000
• Source for landline and mobile telephone numbers: Sample Pages Australia –specifically their landline and mobile random direct dial (RDD) products.
• Sample approach:
• Geographic strata set to ensure the distribution of respondents across states and metro/regional areas reflects the latest ABS data population estimates.
• Respondents for landlines called randomly selected from the household
• The target respondent for the Mobile RDD sample was the person who is the owner and main user of the phone.
• 60% of respondents were from the Mobile RDD sample frame and 40% from the landline RDD sample frame. No other quotas were set.
• Data weighting – Final CATI data set weighted by age, gender and location using the latest ABS population estimates. Additional weighting was used to correct for the likelihood of a respondent being selected in the landline RDD sample. This took into account the number of people living in the household as well as the distribution across landline and mobile-only households.
• CATI supplier: Q and A Research [qandaresearch.com.au]
• Fieldwork dates: 4-10 Dec 2017
SURVEY METHODOLOGY
39

3. TECHNICAL APPENDIX
40 Elaine Kempson, Andrea Finney & Christian Poppe, Financial Well-Being – A Conceptual Model and Preliminary Analysis, SIFO Project Note no. 3 – 2017
41 See figure 2 (page 13) in the body of the report.
42 Due to the need to investigate several other topics, not all influencing factors were included in this survey.
43 That is, the number of standard deviations the respondent’s score is from the mean of a normalised distribution with a mean of zero and a standard deviation of one.
44 These are shown for Australia only but the patterns for New Zealand were much the same.
45 YouGovGalaxy post weighted the survey data by age, gender and geographic location in line with adjusted census estimates provided by the Australian Bureau of Statistics and Stats NZ. An adjustment for ethnicity was also applied to the New Zealand data.
This research project was based on the model of financial wellbeing proposed by Elaine Kempson et al. (initially as in the Norwegian study40; and as modified in subsequent deliberations and discussions between her and the ANZ research team). This defines financial wellbeing as ‘the extent to which someone is able to meet all their current commitments and needs comfortably, and has the financial resilience to maintain this in the future’; this definition suggests financial wellbeing is comprised of three components; meeting commitments, feeling comfortable and resilience for the future. The model also posits that people’s financial wellbeing is influenced by various factors including their behaviour, personality traits and attitudes, knowledge and experience, as well as social and economic factors41. A set of survey questions has been developed by Kempson et al. to measure the components of financial wellbeing and the things which influence it, and these questions provided the basis42 for an online survey of 3,578 Australian and 1,521 New Zealand adults which was conducted by YouGovGalaxy during December 2017.
Variable derivation
The data obtained from this survey underwent a process in which each survey variable relevant to the model framework was made suitable for use in constructing the separate model components. Following Kempson’s recommended approach, this involved making sure that every variable to be used in the analysis included all valid cases in the sample. Missing responses (such as ‘don’t know’ and ‘prefer not to answer’) were recoded to the most relevant meaningful response category; typically, to either a middle value within the scale, or to the most common (‘modal’) value.
To facilitate interpretation of the components, response categories were re-ordered where necessary to ensure that a low score corresponded to low capability and a high score to high capability.
Finally the analysis variables were allocated to the relevant level and element of the conceptual framework, for example, a component of financial wellbeing, a type of behaviour or a particular financial attitude.
Component derivation
In keeping with the approach used by Kempson, Principal Components Analysis (PCA) was used to construct the model components from the survey variables cleaned and derived as described above. All analysis was undertaken within each component of the conceptual framework, with variables allocated to specific components, based on this conceptual structure.
The reliability and sampling adequacy of the data used to establish each component were tested using Cronbach’s alpha and the Kaiser-Meyer-Olkin (KMO) statistics respectively; no serious data inadequacies were revealed by this process.
PCA creates a standardised score43 for each respondent so for ease of interpretation these were rescaled to take on a potential score ranging from a true minimum of 0 to a true maximum of 100. In keeping with Kempson’s approach, where the minimum and maximum possible component scores were not obtained by any respondent, we created ‘fake’ cases with the minimum score on each variable contributing to that component, and if necessary another with the maximum score on each variable. The PCA was re-run including these two minimum/maximum cases, ensuring all respondents scores were truly scaled between 0 and 100. The ‘fake’ cases were then removed.
In addition, for detailed reporting purposes we also calculated simple average scores for each component. This approach was developed because of its transparency and also, because the scores are not standardised and thus support more ready comparisons between subgroups as well as across different data sets. The approach involved rescaling each contributing variable to a score out of 100, summing the relevant variables for each component and then obtaining the mean score out of 100 for the component. Table 1 summarises the outcome of this process; it shows the final set of questions used to create each component, the component loadings44 as well as the weighted45 scores derived from the PCA and simple average approaches for both Australia and New Zealand. Examination of the scores presented in this table shows very little difference between the results obtained for Australia and New Zealand and very little difference between the scores derived from the PCA and those calculated by averaging the scaled scores each component variable. It should be noted that the PCA scores were used for all of the modelling work described in the next section but that the average scores were used for reporting levels of financial wellbeing in the body of the report.
40
FINANCIAL WELLBEING REPORT

TECHNICAL APPENDIX
TABLE 1
Items used to define each component of the financial wellbeing model and weighted mean scores for each of the model components (Australia and New Zealand)
FINANCIAL WELLBEING
Item Loading in
Component PCA score
Weighted PCA Scores
(out of 100)
Weighted Average Scores
(out of 100)
Aust Mean
NZ Mean
Aust Mean
NZ Mean
Meeting commitments
B5
B6
B8
How often do you run short of money for food or other regular expenses?
Which of the following statements best describes how well you are meeting your bills and credit commitments at the moment?
In the past 12 months, how often have you been unable to pay bills or loan commitments at the final reminder due to lack of money?
0.891
0.828
0.850
71 73 70 72
Feeling comfortable
B4
B1
B2
B7
How often do you have any money left over after you have paid for food and other regular expenses?
How would you describe your current financial situation?
How confident are you about your financial situation in the next 12 months?
How well do you think this statement fits you personally?
My finances allow me to do the things I want and enjoy life.
0.813
0.888
0.844
0.837
55 54 55 54
Financial resilience
B9
B10
B11
B12
If tomorrow you had to meet an unexpected expense that is equivalent to a month’s income for your household, how much of it would you be able to cover from money you have available either in cash or in your bank account?
Would you need to borrow, overdraw your account or use a credit card to meet an unexpected expense equivalent to a month’s income?
If your income fell by a third, for how long could you meet all your expenses without needing to borrow?
Thinking about the total income of your household, approximately how many month’s income do you have in savings?
0.889
0.810
0.753
0.795
54 52 53 52
Overall
financial
wellbeing
Derived from all of the above items 59 59 59 59
41

TABLE 1 (CONTINUED)
Items used to define each component of the financial wellbeing model and weighted mean scores for each of the model components (Australia and New Zealand)
FINANCIAL BEHAVIOUR
Item Loading in
Component PCA score
Weighted PCA Scores
out of 100
Weighted Average Scores
out of 100
Aust Mean
NZ Mean
Aust Mean
NZ Mean
Planning/ budgeting
C7
C8
C9
For your regular income, how often do you make a plan or a budget for how it will be used? Do you plan exactly how you will use the income or only make a rough plan?
How often do you keep to the plan you make for using your income(s)?
0.896
0.895
0.906
60 60 60 60
Spending restraint C1a
C1b
How well do these statements fit you personally?
I run short of money because I overspend
I am impulsive and tend to buy things even when I can’t really afford them
0.907
0.907
74 74 74 74
Not borrowing for day-to-day expenses
C5
C6
C2c
How often do you have to borrow money or go into debt to buy food or to pay expenses because you have run short of money?
How often do you have to borrow money to pay off debts?
How often do you tend to do any of the following? Overdraw or go into negative balance where your account is below $0 on your everyday transaction account
0.908
0.890
0.727
83 82 82 80
Monitoring finances
C10
C11
Do you know how much money you spent personally in the last week?
How often do you check your account(s) (e.g. everyday transaction account, credit card account) including finding out your balance and checking transactions that have been made?
0.774
0.774 73 78 71 74
Active saving C3
C4a
C4b
C4c
How often do you save money so that you could cover major unexpected expenses or a fall in income?
How well do these statements fit you personally?
I try to save money to have something to fall back on in the future
I try to save money regularly even if it is only a small amount
I always make sure I have money saved for bad times
0.816
0.914
0.878
0.914
63 60 63 60
Informed product choice
C15
C16
C17
C18
Before you got this <INSERT NAME OF PRODUCT RANDOMLY SELECTED FROM C14>, did you personally search for information from a range of sources?
Before you got this <INSERT NAME OF SECOND PRODUCT RANDOMLY SELECTED FROM C14>, did you personally search for information from a range of sources?
Did you personally consider many different alternatives before you decided which <INSERT NAME OF PRODUCT RANDOMLY SELECTED FROM C14> to get?
How carefully did you personally check the detailed terms and conditions of the <INSERT NAME OF PRODUCT RANDOMLY SELECTED FROM C14> before you got it?
0.907
0.844
0.865
57 55 56 54
Informed decision- making
C19a
C21
C19b
How well do these statements fit you personally. I always get information or advice when I have an important financial decision to make
Please indicate how strongly you agree or disagree that this statement describes you personally. I try to stay informed about money matters and finances.
I spend a lot of time considering the options before I make financial decisions
0.834
0.532
0.854
66 66 66 66
42
FINANCIAL WELLBEING REPORT
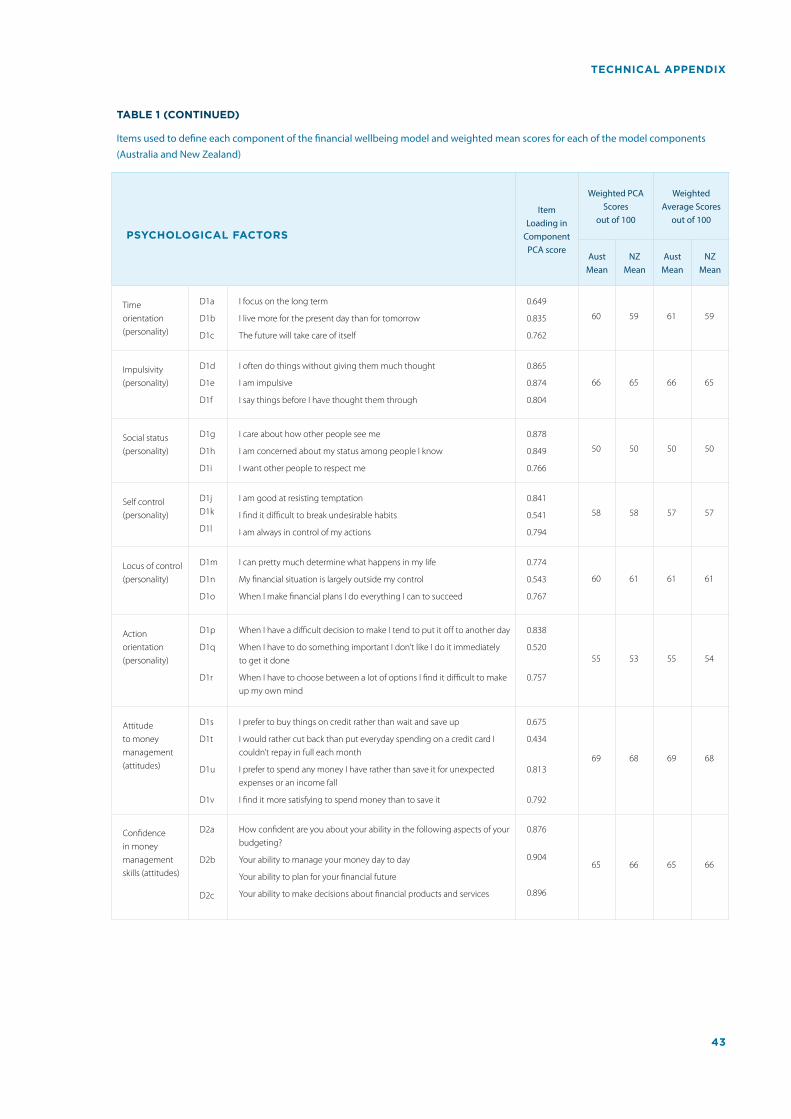
TECHNICAL APPENDIX
TABLE 1 (CONTINUED)
Items used to define each component of the financial wellbeing model and weighted mean scores for each of the model components (Australia and New Zealand)
PSYCHOLOGICAL FACTORS
Item Loading in
Component PCA score
Weighted PCA Scores
out of 100
Weighted Average Scores
out of 100
Aust Mean
NZ Mean
Aust Mean
NZ Mean
Time orientation (personality)
D1a
D1b
D1c
I focus on the long term
I live more for the present day than for tomorrow
The future will take care of itself
0.649
0.835
0.762
60 59 61 59
Impulsivity (personality)
D1d
D1e
D1f
I often do things without giving them much thought
I am impulsive
I say things before I have thought them through
0.865
0.874
0.804
66 65 66 65
Social status (personality)
D1g
D1h
D1i
I care about how other people see me
I am concerned about my status among people I know
I want other people to respect me
0.878
0.849
0.766
50 50 50 50
Self control (personality)
D1j D1k
D1l
I am good at resisting temptation
I find it difficult to break undesirable habits
I am always in control of my actions
0.841
0.541
0.794
58 58 57 57
Locus of control (personality)
D1m
D1n
D1o
I can pretty much determine what happens in my life
My financial situation is largely outside my control
When I make financial plans I do everything I can to succeed
0.774
0.543
0.767
60 61 61 61
Action orientation (personality)
D1p
D1q
D1r
When I have a difficult decision to make I tend to put it off to another day
When I have to do something important I don’t like I do it immediately to get it done
When I have to choose between a lot of options I find it difficult to make up my own mind
0.838
0.520
0.757
55 53 55 54
Attitude to money management (attitudes)
D1s
D1t
D1u
D1v
I prefer to buy things on credit rather than wait and save up
I would rather cut back than put everyday spending on a credit card I couldn’t repay in full each month
I prefer to spend any money I have rather than save it for unexpected expenses or an income fall
I find it more satisfying to spend money than to save it
0.675
0.434
0.813
0.792
69 68 69 68
Confidence in money management skills (attitudes)
D2a
D2b
D2c
How confident are you about your ability in the following aspects of your budgeting?
Your ability to manage your money day to day
Your ability to plan for your financial future
Your ability to make decisions about financial products and services
0.876
0.904
0.896
65 66 65 66
43
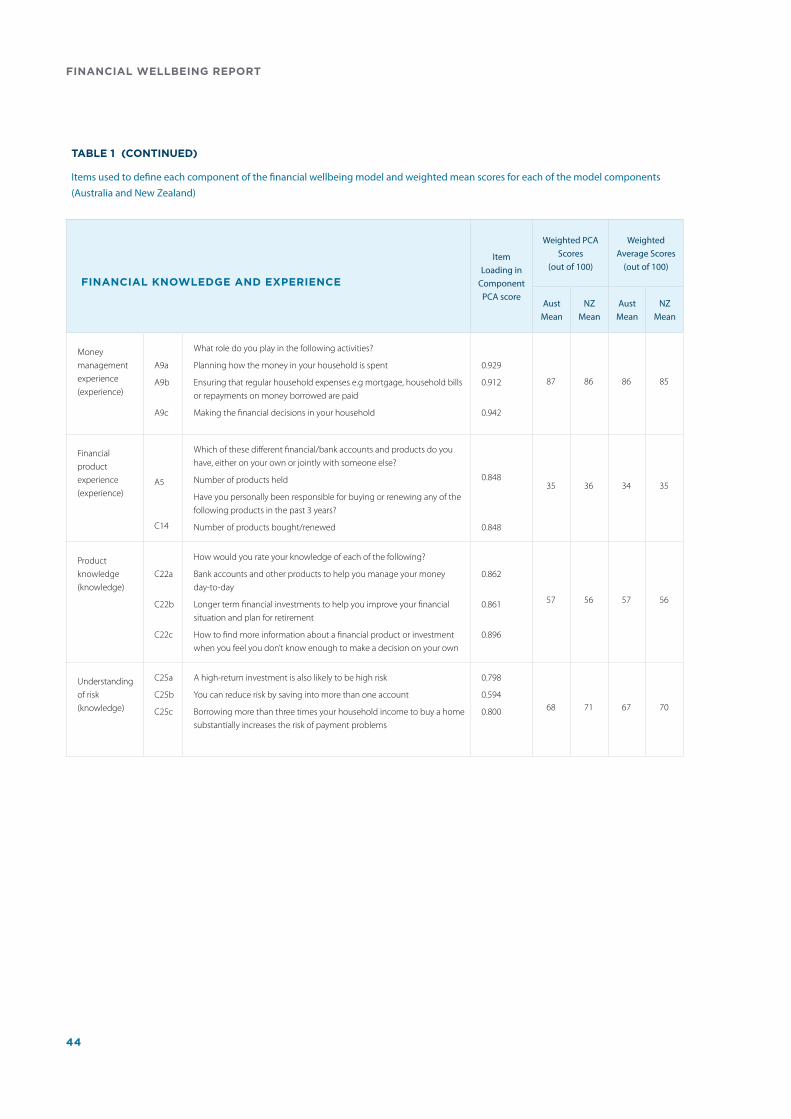
TABLE 1 (CONTINUED)
Items used to define each component of the financial wellbeing model and weighted mean scores for each of the model components (Australia and New Zealand)
FINANCIAL KNOWLEDGE AND EXPERIENCE
Item Loading in
Component PCA score
Weighted PCA Scores
(out of 100)
Weighted Average Scores
(out of 100)
Aust Mean
NZ Mean
Aust Mean
NZ Mean
Money management experience (experience)
A9a
A9b
A9c
What role do you play in the following activities?
Planning how the money in your household is spent
Ensuring that regular household expenses e.g mortgage, household bills or repayments on money borrowed are paid
Making the financial decisions in your household
0.929
0.912
0.942
87 86 86 85
Financial product experience (experience)
A5
C14
Which of these different financial/bank accounts and products do you have, either on your own or jointly with someone else?
Number of products held
Have you personally been responsible for buying or renewing any of the following products in the past 3 years?
Number of products bought/renewed
0.848
0.848
35 36 34 35
Product knowledge (knowledge)
C22a
C22b
C22c
How would you rate your knowledge of each of the following?
Bank accounts and other products to help you manage your money day-to-day
Longer term financial investments to help you improve your financial situation and plan for retirement
How to find more information about a financial product or investment when you feel you don’t know enough to make a decision on your own
0.862
0.861
0.896
57 56 57 56
Understanding of risk (knowledge)
C25a
C25b
C25c
A high-return investment is also likely to be high risk
You can reduce risk by saving into more than one account
Borrowing more than three times your household income to buy a home substantially increases the risk of payment problems
0.798
0.594
0.800 68 71 67 70
44
FINANCIAL WELLBEING REPORT

TECHNICAL APPENDIX
INFLUENCES ON FINANCIAL WELLBEING
Following the approach described by Kempson et al., the next analytic task was to use multiple linear regression analysis to examine relationships between overall financial well-being (and its three individual components) and other domains and components of the model. The aim of this task was to identify the key drivers of financial wellbeing from each of the model; that is, financially capable behaviour, financial knowledge and experience, psychological factors and key socio-demographic, economic and environmental characteristics.
As most of the socio-economic and environmental variables were categorical, dummy coding was used to convert each category of the parent variable into a set of individual binary variables for use in the regression analysis. For each categorical variable, it was necessary to exclude one of the binary variables created from the regression as its value could be perfectly predicted from the other binary variables in the set. The categories excluded in this way were males, 18-24 year olds, buying a home with a mortgage, having a stable income, working in an upper white collar occupation, having a university degree, family structure of a couple with no children living at home, having less than $1,000 in consumer debt, less than $100,000 in mortgage debt and a household income in the range $75,000 to $99,999. It should be kept in mind that the regression coefficients reported for the other categories are expressed relative to these excluded categories; these excluded categories are shown as appropriate in the following results tables.
Table 2 shows the standardised regression coefficients (ß) for all those variables that were statistically significant predictors of one or more components of financial wellbeing in Australia while Table 3 shows the same information for New Zealand. All components have been shown for the key domains of behaviour, psychological factors and knowledge and experience, even where these were not statistically significant predictors of financial wellbeing. The tables demonstrate the key importance of behaviours (particularly active saving and not borrowing for expenses) as predictors of financial wellbeing; as well as confidence in money management skills, household income at relatively low and high levels, variability in household income and outright home ownership also play important roles in this. They also illustrate a high degree of similarity in the importance of these predictors in both the Australian and New Zealand models.
45
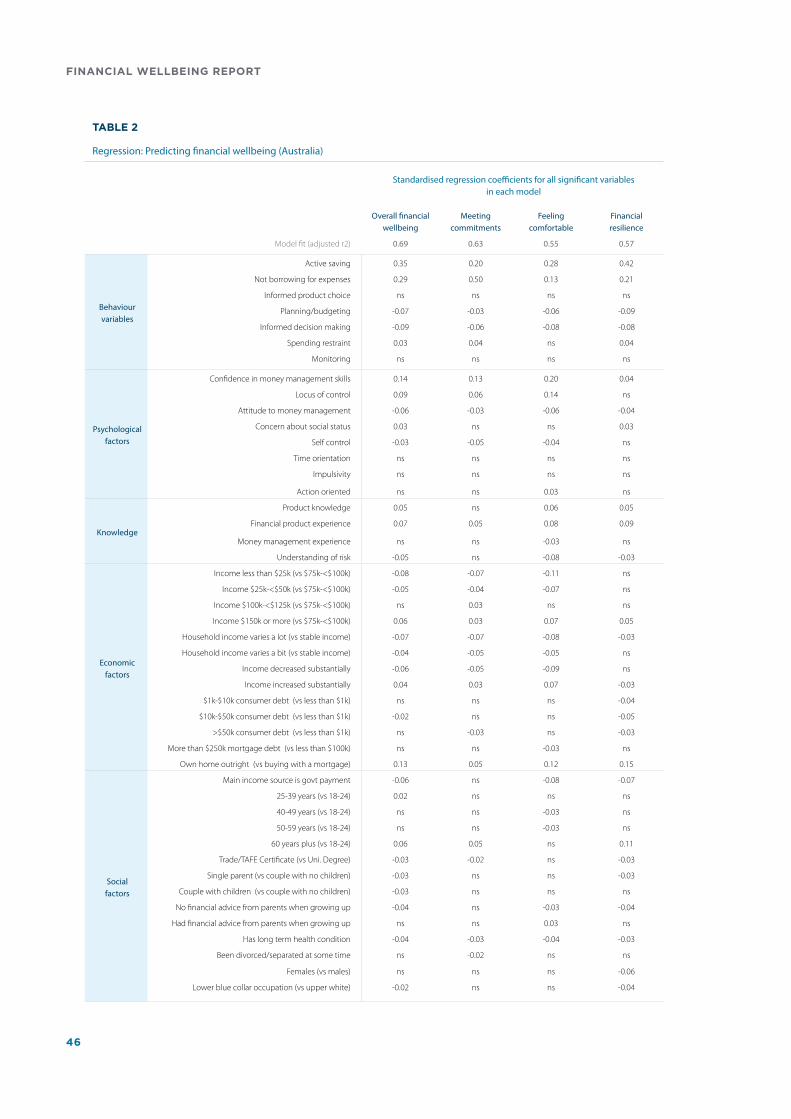
TABLE 2
Regression: Predicting financial wellbeing (Australia)
Model fit (adjusted r2)
Standardised regression coefficients for all significant variables in each model
Overall financial wellbeing
Meeting commitments
Feeling comfortable
Financial resilience
0.69 0.63 0.55 0.57
Behaviour variables
Active saving 0.35 0.20 0.28 0.42
Not borrowing for expenses 0.29 0.50 0.13 0.21
Informed product choice ns ns ns ns
Planning/budgeting -0.07 -0.03 -0.06 -0.09
Informed decision making -0.09 -0.06 -0.08 -0.08
Spending restraint 0.03 0.04 ns 0.04
Monitoring ns ns ns ns
Psychological factors
Confidence in money management skills 0.14 0.13 0.20 0.04
Locus of control 0.09 0.06 0.14 ns
Attitude to money management -0.06 -0.03 -0.06 -0.04
Concern about social status 0.03 ns ns 0.03
Self control -0.03 -0.05 -0.04 ns
Time orientation ns ns ns ns
Impulsivity ns ns ns ns
Action oriented ns ns 0.03 ns
Knowledge
Product knowledge 0.05 ns 0.06 0.05
Financial product experience 0.07 0.05 0.08 0.09
Money management experience ns ns -0.03 ns
Understanding of risk -0.05 ns -0.08 -0.03
Economic factors
Income less than $25k (vs $75k-<$100k) -0.08 -0.07 -0.11 ns
Income $25k-<$50k (vs $75k-<$100k) -0.05 -0.04 -0.07 ns
Income $100k-<$125k (vs $75k-<$100k) ns 0.03 ns ns
Income $150k or more (vs $75k-<$100k) 0.06 0.03 0.07 0.05
Household income varies a lot (vs stable income) -0.07 -0.07 -0.08 -0.03
Household income varies a bit (vs stable income) -0.04 -0.05 -0.05 ns
Income decreased substantially -0.06 -0.05 -0.09 ns
Income increased substantially 0.04 0.03 0.07 -0.03
$1k-$10k consumer debt (vs less than $1k) ns ns ns -0.04
$10k-$50k consumer debt (vs less than $1k) -0.02 ns ns -0.05
>$50k consumer debt (vs less than $1k) ns -0.03 ns -0.03
More than $250k mortgage debt (vs less than $100k) ns ns -0.03 ns
Own home outright (vs buying with a mortgage) 0.13 0.05 0.12 0.15
Social factors
Main income source is govt payment -0.06 ns -0.08 -0.07
25-39 years (vs 18-24) 0.02 ns ns ns
40-49 years (vs 18-24) ns ns -0.03 ns
50-59 years (vs 18-24) ns ns -0.03 ns
60 years plus (vs 18-24) 0.06 0.05 ns 0.11
Trade/TAFE Certificate (vs Uni. Degree) -0.03 -0.02 ns -0.03
Single parent (vs couple with no children) -0.03 ns ns -0.03
Couple with children (vs couple with no children) -0.03 ns ns ns
No financial advice from parents when growing up -0.04 ns -0.03 -0.04
Had financial advice from parents when growing up ns ns 0.03 ns
Has long term health condition -0.04 -0.03 -0.04 -0.03
Been divorced/separated at some time ns -0.02 ns ns
Females (vs males) ns ns ns -0.06
Lower blue collar occupation (vs upper white) -0.02 ns ns -0.04
46
FINANCIAL WELLBEING REPORT
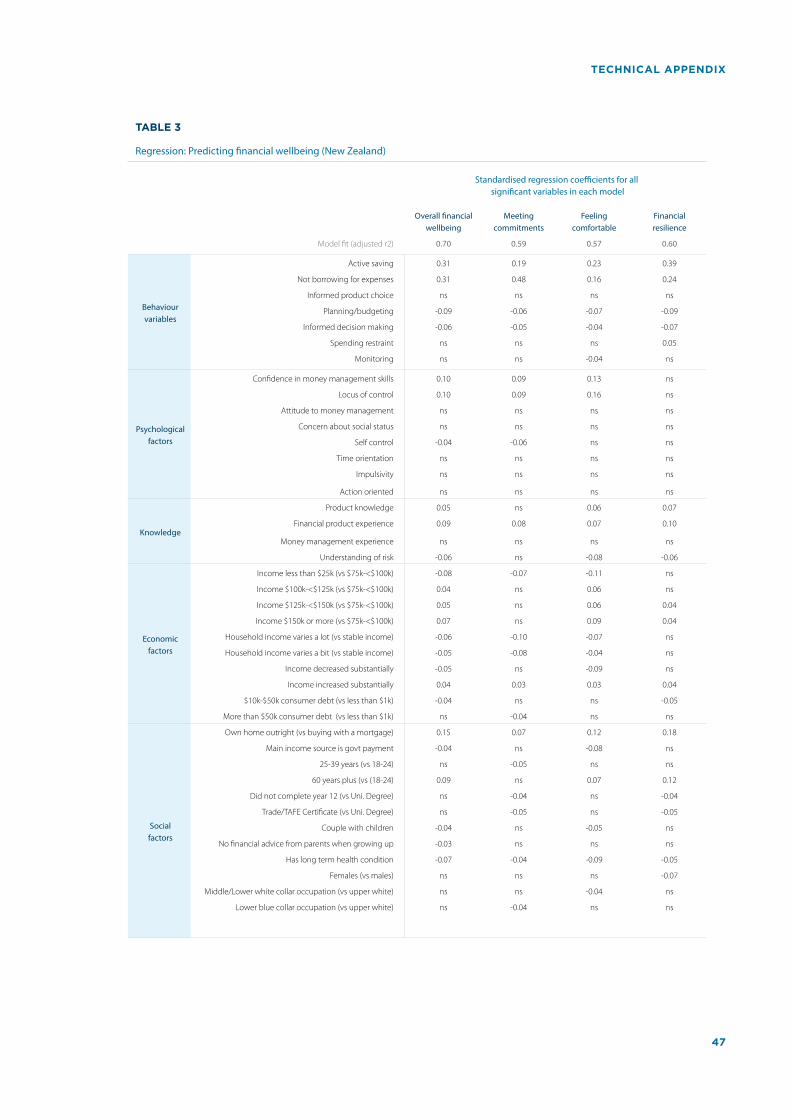
TECHNICAL APPENDIX
TABLE 3
Regression: Predicting financial wellbeing (New Zealand)
Model fit (adjusted r2)
Standardised regression coefficients for all significant variables in each model
Overall financial wellbeing
Meeting commitments
Feeling comfortable
Financial resilience
0.70 0.59 0.57 0.60
Behaviour variables
Active saving 0.31 0.19 0.23 0.39
Not borrowing for expenses 0.31 0.48 0.16 0.24
Informed product choice ns ns ns ns
Planning/budgeting -0.09 -0.06 -0.07 -0.09
Informed decision making -0.06 -0.05 -0.04 -0.07
Spending restraint ns ns ns 0.05
Monitoring ns ns -0.04 ns
Psychological factors
Confidence in money management skills 0.10 0.09 0.13 ns
Locus of control 0.10 0.09 0.16 ns
Attitude to money management ns ns ns ns
Concern about social status ns ns ns ns
Self control -0.04 -0.06 ns ns
Time orientation ns ns ns ns
Impulsivity ns ns ns ns
Action oriented ns ns ns ns
Knowledge
Product knowledge 0.05 ns 0.06 0.07
Financial product experience 0.09 0.08 0.07 0.10
Money management experience ns ns ns ns
Understanding of risk -0.06 ns -0.08 -0.06
Economic factors
Income less than $25k (vs $75k-<$100k) -0.08 -0.07 -0.11 ns
Income $100k-<$125k (vs $75k-<$100k) 0.04 ns 0.06 ns
Income $125k-<$150k (vs $75k-<$100k) 0.05 ns 0.06 0.04
Income $150k or more (vs $75k-<$100k) 0.07 ns 0.09 0.04
Household income varies a lot (vs stable income) -0.06 -0.10 -0.07 ns
Household income varies a bit (vs stable income) -0.05 -0.08 -0.04 ns
Income decreased substantially -0.05 ns -0.09 ns
Income increased substantially 0.04 0.03 0.03 0.04
$10k-$50k consumer debt (vs less than $1k) -0.04 ns ns -0.05
More than $50k consumer debt (vs less than $1k) ns -0.04 ns ns
Social factors
Own home outright (vs buying with a mortgage) 0.15 0.07 0.12 0.18
Main income source is govt payment -0.04 ns -0.08 ns
25-39 years (vs 18-24) ns -0.05 ns ns
60 years plus (vs (18-24) 0.09 ns 0.07 0.12
Did not complete year 12 (vs Uni. Degree) ns -0.04 ns -0.04
Trade/TAFE Certificate (vs Uni. Degree) ns -0.05 ns -0.05
Couple with children -0.04 ns -0.05 ns
No financial advice from parents when growing up -0.03 ns ns ns
Has long term health condition -0.07 -0.04 -0.09 -0.05
Females (vs males) ns ns ns -0.07
Middle/Lower white collar occupation (vs upper white) ns ns -0.04 ns
Lower blue collar occupation (vs upper white) ns -0.04 ns ns
47
SUMMARY DOMAIN SCORES
46 See figure 6 (page 21).
To facilitate reporting it was decided to create overall scores for each domain (that is, behaviour, psychological factors, knowledge and experience, social and economic factors) from each of the significant predictors shown in Tables 2 and 3. While these domains were not necessarily interpretable constructs (e.g.: an overall score on the psychological factors), it was felt they would be useful to summarise the regression results. The predictor variables used to calculate each domain score were allocated a weight which reflected their ability to predict overall financial wellbeing; as the aim was to predict an actual wellbeing score, the unstandardised, signed regression coefficients were used for this purpose. The weighted predictor variables were summed to create a total score for each domain and finally, the five domain scores created in this way were used as predictors in a regression on overall financial wellbeing. The standardised regression coefficients from this regression for each of the five domains were converted to percentages which reflected their relative contribution to the explanatory power of the model46.
FINANCIAL WELLBEING GROUPS
It was also decided to allocate respondents into four groups based on their financial wellbeing scores. We elected to follow the same strategy as that used in Momentum UK Household Financial Wellness Index project which involved taking the highest and lowest financial wellbeing scores and dividing this range into four equal groups. As our lowest score was zero and our highest 100, this approach meant the four categories would be defined by financial wellbeing scores of 0 to 25, >25 to 50, >50 to 75 and >75 to 100.
While this distribution was satisfactory for the Australian data, the smaller New Zealand sample meant the 0 to 25 group contained too few respondents for us to be comfortable with the estimates made from it. For this reason, we extended the ‘bottom’ range from 0 to 25 to 0 to 30 which gave us a more robust sample for this low scoring group. The remaining groups were also adjusted slightly to accommodate this change.
48
FINANCIAL WELLBEING REPORT

Australia and New Zealand Banking Group
Limited (ANZ) ABN 11 005 357 522.
ANZ’s colour blue is a trade mark of ANZ.