Embed Size (px)
Citation preview

FINANCIALSWHAT WAS AN ACCOUNTING VIEW OF OUR FINANCIAL PERFORMANCE DURING 2014 AND HOW WE STOOD AT THE END OF THE YEAR?

182 Approaching Our Financial Statements
184 Accounting Mini-series
188 Consolidated Statement of Profit or Loss
189 Consolidated Statement of Profit or Loss and Other Comprehensive Income
190 Consolidated Statement of Financial Position
192 Company Statement of Financial Position
193 Consolidated Statement of Changes in Equity
194 Consolidated Statement of Cash Flows
195 Significant Accounting Policies
203 Critical Accounting Estimates and Judgments
260 Financial Risk Management
271 Scheme of Control Statement
274 Five-year Summary: CLP Group Statistics – Economic, Environmental and Social
278 Five-year Summary: Scheme of Control Financial & Operating Statistics
235 17. Finance Lease Receivables
236 18. Derivative Financial Instruments
237 19. Available-for-sale Investments
238 20. Trade and Other Receivables
240 21. Bank Balances, Cash and Other Liquid Funds
241 22. Trade and Other Payables
242 23. Bank Loans and Other Borrowings
244 24. Obligations under Finance Leases
244 25. Deferred Tax
246 26. Fuel Clause Account
247 27. SoC Reserve Accounts
248 28. Share Capital
249 29. Reserves
251 30. Perpetual Capital Securities
253 32. Commitments and Operating Lease Arrangements
258 34. Contingent Liabilities
Cash flows related252 31. Notes to the Consolidated Statement of Cash Flows
206 Notes to the Financial Statements
Non-statement specific206 1. General Information
206 2. Business Combination
211 4. Segment Information
254 33. Related Party Transactions
Financial results related210 3. Revenue
214 5. Other Gain
214 6. Operating Profit
215 7. Finance Costs and Income
216 8. Income Tax Expense / (Credit)
217 9. Earnings Attributable to Shareholders
217 10. Dividends
217 11. Earnings per Share
Financial position related218 12. Fixed Assets, Leasehold Land and Land Use Rights under Operating Leases and Investment Property
222 13. Goodwill and Other Intangible Assets
225 14. Investments in and Advances to Subsidiaries
227 15. Interests in Joint Ventures
234 16. Interest in an Associate
More on risk management, with figures
Here you can learn more about our SoC business
Our policy choices and practices when we apply the accounting standards. Some of these are here, others are incorporated in the Notes
Areas of management judgments or estimates whose effects are significant
These are the ins and outs of our cash
Shows our financial resources and obligations
A bigger picture of our financial performance, it also tells you about the changes in our resources which do not pass through earnings
Tells you about our earnings for the year
CLP Holdings 2014 Annual Report 181

This statement sums up the Group’s economic resources (non-current assets and working capital), obligations (debts and other non-current liabilities) and owners’ equity at a particular point of time, in this case, our year end at 31 December 2014. It also shows how the economic resources contributed by lenders and shareholders are used in the business. In the past, we used to call this statement a “balance sheet” because at any given time, assets must equal liabilities plus owners’ equity (in other words, be in balance). The current name reflects its function more accurately.
This statement divides the cash flows into operating, investing and financing cash flows. While the operating profit underlies the operating cash flows, certain non-cash charges or credits, such as depreciation, amortisation and fair value changes on derivatives, mean the operating cash flows and the operating profit are different. Investing cash flows are the cash flows arising from the purchase or disposal of non-current assets. Financing cash flows represent the cash flows between the Group, its shareholders and lenders.
This statement comprises (a) profit or loss and (b) other comprehensive income (“OCI”). The objective of this statement is to present all income or expenses (transactions with non-owners) in a performance statement. OCI represents certain income and expenses which are not recognised in profit or loss as required or permitted by the relevant accounting standards.
An example of OCI in CLP is the exchange losses arising from the translation of our India and Australia businesses in 2014 which decreased our net assets in these two regions. Transactions with owners such as dividends are presented in the statement of changes in equity.
Statement of profit or loss and other comprehensive income“Financial performance measured by recording the flow of resources over a period of time”
Statement offinancial position“A snapshot, taken at a point in time, of all the assets the company owns and all the claims against those assets”
Statement ofcash flows“Where the company gets its cash and how it spends it”
APPROACHING OUR FINANCIAL STATEMENTS
Financial Statements DecodedThe purpose of financial statements is to communicate the Group’s financial information to its stakeholders, especially shareholders,
investors and lenders. In this section we try to help readers who are not familiar with accounting rules and financial expressions to
understand our financial information, by explaining the functions and relationships between the essential financial statements: the
statement of profit or loss and other comprehensive income, the statement of financial position and the statement of cash flows.
For comprehensive and authoritative definitions and explanations, readers should turn to the relevant accounting standards, but
we hope this section offers useful guidance.
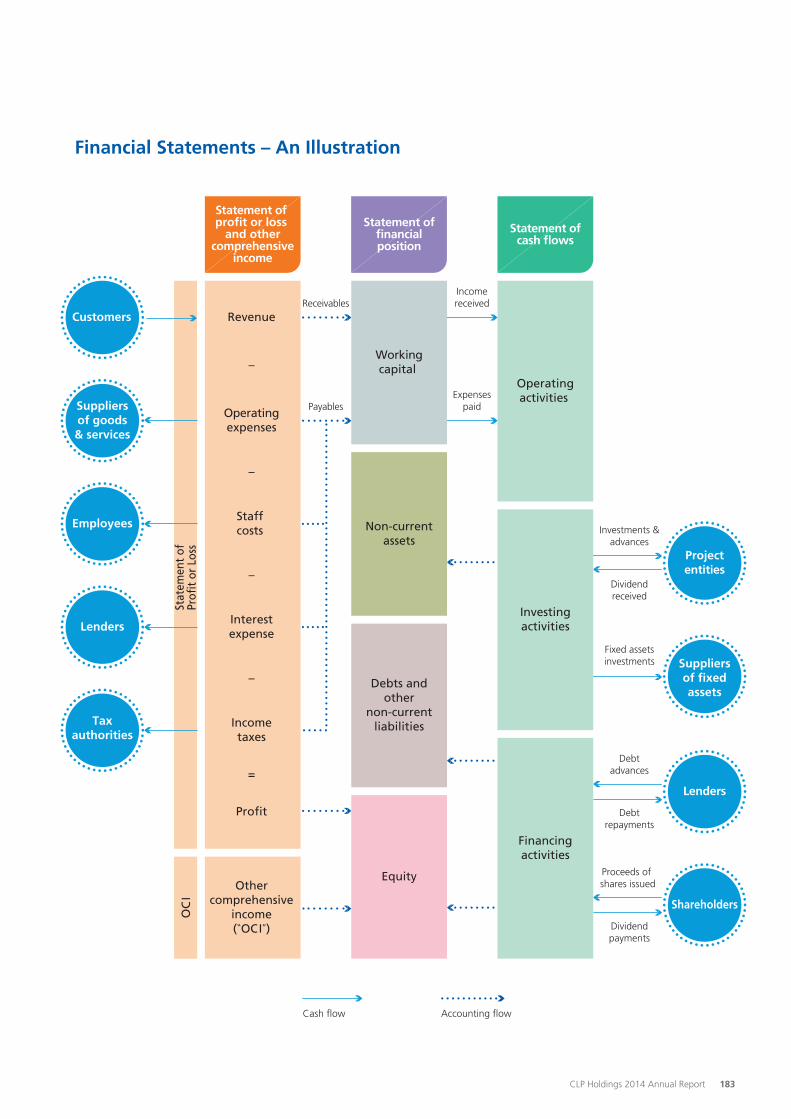
Financial Statements IllustratedThe diagram opposite illustrates the relationships between the statement of profit or loss and other comprehensive income, the
statement of financial position and the statement of cash flows, as well as their links with the Group’s stakeholders.
On the one hand, the Group earns revenue from customers through the deployment of non-current assets and working
capital. On the other hand, it pays operating expenses to suppliers of goods and services, incurs staff and interest costs and
also invests in additional non-current assets. The net balance of revenue, operating expenses and staff and interest costs is the
operating profit. After deducting income taxes charged by tax authorities, this profit is available for payment to lenders and
for distribution to shareholders (dividends) in return for their contribution of funds to the Group in the form of debt and equity.
The Group also makes investments and advances to its project entities and receives dividend income from them in return.
182 CLP Holdings 2014 Annual Report
Suppliersof goods& services
Employees
Operatingactivities
Investingactivities
Financingactivities
Revenue
–
–
–
–
=
Operatingexpenses
Staffcosts
Interestexpense
Incometaxes
Pro�t
Othercomprehensive
income(“OCI”)
OC
I
ReceivablesIncomereceived
Expensespaid
Statement of pro�t or loss
and othercomprehensive
income
Statement of�nancialposition
Statement ofcash �ows
Stat
emen
t of
Pr
o�t
or L
oss
Payables
Lenders
Taxauthorities
Non-currentassets
Debts andother
non-currentliabilities
Workingcapital
Equity
Fixed assetsinvestments
Projectentities
Investments &advances
Dividendreceived
Lenders
Debtadvances
Debtrepayments
Shareholders
Proceeds of shares issued
Dividendpayments
Cash �ow Accounting �ow
Customers
Suppliersof �xedassets
Financial Statements – An Illustration
CLP Holdings 2014 Annual Report 183
instruments. HKAS 32 does not look to
the legal form of instruments. Instead, it
focuses on the instruments’ contractual
rights and obligations. A critical feature
in differentiating a liability from equity is
the existence of a contractual obligation
of the issuer of a financial instrument to
deliver cash or another financial asset to
the holders. In practice, the classification
is far from straightforward as some
financial instruments contain both debt
and equity features.
To illustrate how the classification
principles are applied, let’s go through
some common features found in most
financial instruments:
1. Redeemable or non-redeemable
An equity instrument is usually non-
redeemable. If a financial instrument has
a fixed date of redemption, or which
give the holders an option to redeem at
some point in time, this instrument has
to be classified as a liability. However,
if the option to redeem the financial
instrument is at the discretion of the
issuer (i.e. the issuer has the right but not
the obligation to pay cash to buy back
the instrument), it may be classified as an
equity instrument, subject to a further
examination of other rights attaching
to the financial instrument, especially in
relation to the returns component.
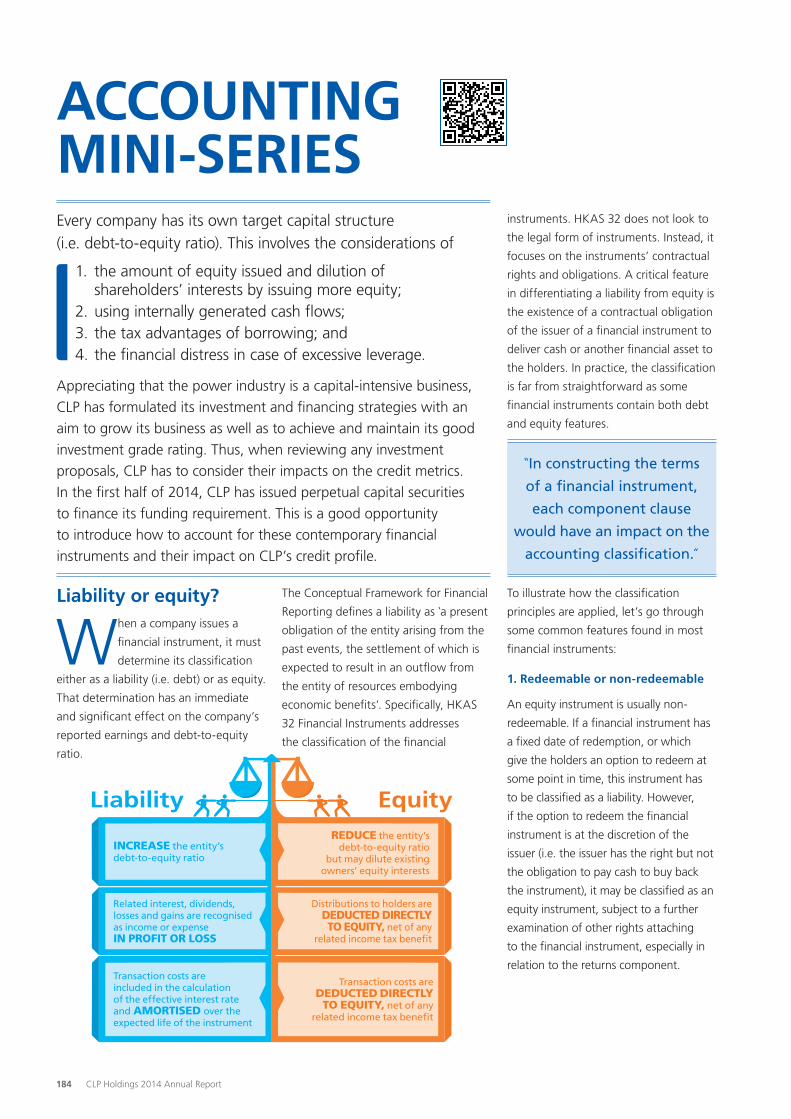
Liability or equity?
When a company issues a
financial instrument, it must
determine its classification
either as a liability (i.e. debt) or as equity.
That determination has an immediate
and significant effect on the company’s
reported earnings and debt-to-equity
ratio.
The Conceptual Framework for Financial
Reporting defines a liability as ‘a present
obligation of the entity arising from the
past events, the settlement of which is
expected to result in an outflow from
the entity of resources embodying
economic benefits’. Specifically, HKAS
32 Financial Instruments addresses
the classification of the financial
“In constructing the terms
of a financial instrument,
each component clause
would have an impact on the
accounting classification.”
Every company has its own target capital structure (i.e. debt-to-equity ratio). This involves the considerations of
1. the amount of equity issued and dilution of shareholders’ interests by issuing more equity;2. using internally generated cash flows;3. the tax advantages of borrowing; and4. the financial distress in case of excessive leverage.
Appreciating that the power industry is a capital-intensive business,
CLP has formulated its investment and financing strategies with an
aim to grow its business as well as to achieve and maintain its good
investment grade rating. Thus, when reviewing any investment
proposals, CLP has to consider their impacts on the credit metrics.
In the first half of 2014, CLP has issued perpetual capital securities
to finance its funding requirement. This is a good opportunity
to introduce how to account for these contemporary financial
instruments and their impact on CLP’s credit profile.
184 CLP Holdings 2014 Annual Report
Liability Equity
Transaction costs are included in the calculation of the effective interest rate and amortised over the expected life of the instrument
Related interest, dividends, losses and gains are recognised as income or expense iN ProFit or Loss
iNcrease the entity’s debt-to-equity ratio
reduce the entity’s debt-to-equity ratio
but may dilute existing owners’ equity interests
Distributions to holders are deducted directLy to equity, net of any
related income tax benefit
Transaction costs are deducted directLy
to equity, net of any related income tax benefit
ACCOUNTING MINI-SERIES

What is credit rating?
Acorporate credit rating is
an evaluation of the credit
worthiness of a company,
including the company’s ability to pay
the principal as well as interest at the
scheduled dates and the likelihood of
default.
Credit ratings are not based on
mathematical formulas. Instead,
credit rating agencies assign ratings to
companies based on their evaluation of
qualitative and quantitative information
of these companies. They use letter
designations such as A, B, C. Higher
grades are intended to represent a
lower probability of default. A corporate
debt is considered “investment grade”
if its credit rating is BBB- or higher by
Standard & Poor’s or Baa3 or higher by
Moody’s. CLP Holdings has a corporate
rating of A- from Standard & Poor’s and
A2 from Moody’s.
The credit rating has a material impact
on the yield of a debt instrument. If an
issuer has a better rating than its peers,
it should be able to issue debt at a lower
cost than those entities having similar
business parameters.
When an instrument is not a pure debt
or equity, credit rating agencies assign
the “equity credit” to the instrument
by assessing whether the instrument is
more equity-like or debt-like in terms
of its effect on the issuer’s corporate
credibility. An equity credit of 50%
means that when computing standard
credit metrics, the credit rating agencies
would split the principal amount of
that instrument 50% equity, 50%
debt. Distributions would also be split;
50% dividends, 50% interest expense.
Different credit rating agencies use
different methodologies to assess the
weighting between equity-like or debt-
like instruments; as a result different
equity credits may be assigned.
CLP Holdings 2014 Annual Report 185
2. Mandatory or discretionary returns
When distribution to the holders of a
financial instrument is at the discretion
of the issuer, the instrument is an equity
instrument. If distribution is mandatory,
the financial instrument has to be
classified as a liability. When classifying
an instrument, one should not only assess
the obligations related to the principal
payment, but also the coupon payment.
A typical example of this is a perpetual
debt instrument.
The holders of a perpetual debt
instrument generally have no right to
receive principal repayments. However,
they usually have the contractual right
to receive interest payments indefinitely.
Purely looking at the non-redeemable
nature of the principal may indicate that
this instrument is an equity instrument.
However, the obligation to pay interest
indefinitely alters its classification.
Though the principal will never be repaid,
the value of the instrument is wholly
derived from the mandatory interest
payments. Therefore, the perpetual
debt instrument should be classified as a
liability in its entirety.
3. Dividend pusher and dividend stopper
Sometimes a financial instrument contains
certain special provisions such as “dividend
pusher” and “dividend stopper”. One
example of “dividend pusher” is that the
holders of a financial instrument will
receive a distribution automatically when
a distribution is made to the ordinary
shares. “Dividend stopper” is a converse
situation. A distribution cannot be made
to the ordinary shares unless a distribution
is made on the financial instrument.
As the distribution to the ordinary shares
is at the discretion of the issuer, both the
dividend pusher and the dividend stopper
clauses of the financial instrument do
not introduce a contractual obligation to
the issuer (i.e. the issuer has discretion to
determine the delivery of cash or another
financial asset). Thus the instrument
should be classified as equity in its entirety.
“Classifying an instrument as equity can strengthen the
balance sheet by reducing the gearing ratio of an entity. This
enhances the capital structure and improves credit metrics.”
RATING DESCRIPTIONSMOODY’S STANDARD & POOR’S
Aaa
Aa1Aa2Aa3
A1A2A3
Baa1Baa2Baa3
AAA
AA+AAAA-
A+AA-
BBB+BBBBBB-
HIGHEST / EXTREMELY STRONG
HIGH / VERY STRONG
MEDIUM / ADEQUATE
UPPER-MEDIUM / STRONG

186 CLP Holdings 2014 Annual Report
Is there an optimal gearing for a company?
CLP Power Hong Kong has issued an aggregate of US$750 million perpetual capital securities in 2014 with the following key contractual terms:
• Perpetual and non-callable in the first
5.5 years.
• Subject to conditions as mentioned
below, securities holders can receive
distribution at a fixed rate of 4.25%
per annum in the first 5.5 years,
floating thereafter and with fixed step
up margins at year 10.5 and at year
25.5, payable semi-annually in arrears,
cumulative and compounding.
• Coupon deferrable at the discretion
of CLP unless CLP Power Hong Kong
declares or pays dividend to CLP
Holdings within the 6-month period
prior to the scheduled distribution
date (Dividend Pusher) or other
circumstances including distribution,
payment or repurchase of junior or
parity obligations.
• If CLP elects to defer distribution to the
holders, CLP Power Hong Kong will
also defer dividend distribution to CLP
Holdings (Dividend Stopper).
Accounting classification:
Based on the above criteria, the perpetual
capital securities are classified as equity
because:
1. the securities are non-redeemable with
the option to redeem at the discretion
of CLP; and
2. distributions are also at the discretion
of CLP.
The perpetual capital securities are
presented as non-controlling interests in
the consolidated financial statements and
any coupon payments on the securities
are deducted directly to equity.
Impacts on credit metrics:
The issuance of perpetual capital
securities allows CLP Power Hong Kong
to achieve:
• 50% equity credit for life from
Moody’s; and
• 50% equity credit for the first 5.5 years
from issuance from Standard & Poor’s.
How are our perpetual capital securities being accounted for and the impact on our credit metrics?
An optimal gearing means an optimal mix of debt and equity in a company’s capital structure where its cost of capital is minimised so that the company’s value can be maximised.
The cost of capital is the cost of a company’s sources
of funds. One must calculate both the cost of debt
and the cost of equity to determine a company’s
cost of capital. The cost of capital is the minimum return
that investors expect for providing capital to the company.
A rate of return larger than the cost of capital is usually
required.
Because of tax advantages on debt issuance and its priority
repayment, it is usually cheaper to issue debt rather than
equity. However, beyond certain leverage, the cost of
issuing new debt will be greater than the cost of issuing
new equity because adding more debt will increase the
default risk of the company. This will increase the interest
rate that the company must pay in order to borrow money.
Increasing default risk due to increasing debt financing will
drive up the cost of equity of the company as well.
CLP’s financing strategy aims to achieve the optimal
gearing by monitoring the risk profile of the Company
to reduce its cost of equity and preserving strong credit
metrics in order to maintain good investment grade credit
ratings for its debt.
5.5 YEARS 10.5 YEARS
Callable on any distribution payment date
Floating rate re-fix every 6 months + initial spread + further step up
Callable on any distribution payment date
Floating rate re-fix every 6 months + initial spread
Non-callable
Fixed 4.25%
Callable on any distribution payment date
Floating rate re-fix every 6 months + initial spread + step up
25.5 YEARSSTART
Increasing debt will increase
default risk
Weighted Average Cost of Capital= proportion of equity x cost of equity
+ proportion of debt x cost of debt
GEARING = DEBT / EQUITY
CO
ST
OF
CA
PIT
AL
(%)
OPTIMAL GEARING
Deferrable cumulative distribution payable semi-annually in arrears
Perpetual

CLP Holdings 2014 Annual Report 187
INDEPENDENT AUDITOR’S REPORT
To the Shareholders of CLP Holdings Limited(incorporated in Hong Kong with limited liability)
We have audited the consolidated financial statements of CLP Holdings Limited (the “Company”) and its subsidiaries (together,
the “Group”) set out on pages 188 to 270 which comprise the consolidated and company statements of financial position as
at 31 December 2014, and the consolidated statement of profit or loss, the consolidated statement of profit or loss and other
comprehensive income, the consolidated statement of changes in equity and the consolidated statement of cash flows for the
year then ended, and a summary of significant accounting policies and other explanatory information.
Directors’ Responsibility for the Consolidated Financial Statements
The directors of the Company are responsible for the preparation of consolidated financial statements that give a true and
fair view in accordance with Hong Kong Financial Reporting Standards issued by the Hong Kong Institute of Certified Public
Accountants, and the Hong Kong Companies Ordinance, and for such internal control as the directors determine is necessary to
enable the preparation of consolidated financial statements that are free from material misstatement, whether due to fraud or
error.
Auditor’s Responsibility
Our responsibility is to express an opinion on these consolidated financial statements based on our audit and to report our
opinion solely to you, as a body, in accordance with section 80 of Schedule 11 to the Hong Kong Companies Ordinance and for
no other purpose. We do not assume responsibility towards or accept liability to any other person for the contents of this report.
We conducted our audit in accordance with Hong Kong Standards on Auditing issued by the Hong Kong Institute of Certified
Public Accountants. Those standards require that we comply with ethical requirements and plan and perform the audit to obtain
reasonable assurance about whether the consolidated financial statements are free from material misstatement.
An audit involves performing procedures to obtain audit evidence about the amounts and disclosures in the consolidated
financial statements. The procedures selected depend on the auditor’s judgment, including the assessment of the risks of
material misstatement of the consolidated financial statements, whether due to fraud or error. In making those risk assessments,
the auditor considers internal control relevant to the entity’s preparation of consolidated financial statements that give a true and
fair view in order to design audit procedures that are appropriate in the circumstances, but not for the purpose of expressing
an opinion on the effectiveness of the entity’s internal control. An audit also includes evaluating the appropriateness of
accounting policies used and the reasonableness of accounting estimates made by the directors, as well as evaluating the overall
presentation of the consolidated financial statements.
We believe that the audit evidence we have obtained is sufficient and appropriate to provide a basis for our audit opinion.
Opinion
In our opinion, the consolidated financial statements give a true and fair view of the state of affairs of the Company and of the
Group as at 31 December 2014 and of the Group’s profit and cash flows for the year then ended in accordance with Hong Kong
Financial Reporting Standards and have been properly prepared in accordance with the Hong Kong Companies Ordinance.
PricewaterhouseCoopers
Certified Public Accountants
Hong Kong, 26 February 2015

CONSOLIDATED STATEMENT OF PROFIT OR LOSS
188 CLP Holdings 2014 Annual Report
for the year ended 31 December 2014
The notes and disclosures on pages 195 to 270 are an integral part of these consolidated financial statements.
2014 2013
Note HK$M HK$M
Revenue 3 92,259 104,530
Expenses
Purchases of electricity, gas and distribution services (40,234) (49,040)
Operating lease and lease service payments (3,607) (12,963)
Staff expenses (3,980) (3,017)
Fuel and other operating expenses (24,777) (23,763)
Depreciation and amortisation (6,791) (7,592)
(79,389) (96,375)
Other gain 5 2,025 751
Operating profit 6 14,895 8,906
Finance costs 7 (4,180) (6,522)
Finance income 7 131 173
Share of results, net of income tax
Joint ventures 15 1,562 2,671
An associate 16 796 612
Profit before income tax 13,204 5,840
Income tax (expense) / credit 8 (1,268) 232
Profit for the year 11,936 6,072
Earnings attributable to:
Shareholders 9 11,221 6,060
Perpetual capital securities holders 152 –
Other non-controlling interests 563 12
11,936 6,072
Dividends 10
First to third interim dividends paid 4,093 4,017
Fourth interim dividend declared 2,526 2,476
6,619 6,493
Earnings per share, basic and diluted 11 HK$4.44 HK$2.40

CLP Holdings 2014 Annual Report 189
CONSOLIDATED STATEMENT OF PROFIT OR LOSSAND OTHER COMPREHENSIVE INCOMEfor the year ended 31 December 2014
2014 2013
HK$M HK$M
Profit for the year 11,936 6,072
Other comprehensive income
Items that can be reclassified to profit or loss
Exchange differences on translation (2,972) (5,774)
Cash flow hedges (638) 128
Fair value changes on available-for-sale investments 80 10
Reclassification adjustment upon loss of joint control of joint ventures (422) –
Reclassification adjustment upon sale of a subsidiary – (8)
Share of other comprehensive income of joint ventures 24 9
(3,928) (5,635)
Items that cannot be reclassified to profit or loss
Fair value gain on revaluation upon transfer from fixed asset
to investment property – 2,055
Share of other comprehensive income of joint ventures (74) 250
(74) 2,305
Other comprehensive income for the year, net of tax (4,002) (3,330)
Total comprehensive income for the year 7,934 2,742
Total comprehensive income attributable to:
Shareholders 7,221 2,727
Perpetual capital securities holders 152 –
Other non-controlling interests 561 15
7,934 2,742
The notes and disclosures on pages 195 to 270 are an integral part of these consolidated financial statements.
This statement of profit or loss and other comprehensive income includes not only
conventional profit for the year, but also “other comprehensive income”. The concept of other
comprehensive income is explained on page 182. Further details of other comprehensive
income attributable to shareholders are presented in Note 29.

CONSOLIDATED STATEMENT OF FINANCIAL POSITION
190 CLP Holdings 2014 Annual Report
as at 31 December 2014
2014 2013
Note HK$M HK$M
Non-current assets
Fixed assets 12(A) 128,133 126,876
Leasehold land and land use rights under operating leases 12(B) 5,696 1,806
Investment property 12(C) 2,554 2,221
Goodwill and other intangible assets 13 31,129 23,847
Interests in joint ventures 15 11,176 19,940
Interest in an associate 16 786 1,675
Finance lease receivables 17 898 989
Deferred tax assets 25 3,828 3,084
Derivative financial instruments 18 3,120 3,118
Available-for-sale investments 19 1,707 1,263
Other non-current assets 111 147
189,138 184,966
Current assets
Inventories – stores and fuel 3,618 1,482
Renewable energy certificates 1,086 997
Trade and other receivables 20 15,719 17,953
Finance lease receivables 17 50 49
Derivative financial instruments 18 659 1,005
Bank balances, cash and other liquid funds 21 4,393 5,233
25,525 26,719
Current liabilities
Customers’ deposits 20(a) (4,653) (4,506)
Trade and other payables 22 (21,619) (19,325)
Income tax payable (790) (141)
Bank loans and other borrowings 23 (9,636) (7,118)
Obligations under finance leases 24 (1) (2,763)
Derivative financial instruments 18 (709) (1,279)
(37,408) (35,132)
Net current liabilities (11,883) (8,413)
Total assets less current liabilities 177,255 176,553

CLP Holdings 2014 Annual Report 191
2014 2013
Note HK$M HK$M
Financed by:
Equity
Share capital 28 23,243 12,632
Share premium – 8,119
Reserves 29
Declared dividends 2,526 2,476
Others 62,244 64,134
Shareholders’ funds 88,013 87,361
Perpetual capital securities 30 5,791 –
Other non-controlling interests 2,155 120
95,959 87,481
Non-current liabilities
Bank loans and other borrowings 23 57,799 48,933
Obligations under finance leases 24 26 25,213
Deferred tax liabilities 25 13,418 8,548
Derivative financial instruments 18 3,062 3,440
Fuel clause account 26 2,966 1,464
Scheme of Control (SoC) reserve accounts 27 1,131 28
Asset decommissioning liabilities 27(A) 1,082 539
Other non-current liabilities 1,812 907
81,296 89,072
Equity and non-current liabilities 177,255 176,553
The more familiar name for the Statement of Financial Position is “Balance Sheet”.
William Mocatta Richard Lancaster Benjamin Lau
Vice Chairman Chief Executive Officer Acting Chief Financial Officer
Hong Kong, 26 February 2015
The notes and disclosures on pages 195 to 270 are an integral part of these consolidated financial statements.

COMPANY STATEMENT OF FINANCIAL POSITION
192 CLP Holdings 2014 Annual Report
as at 31 December 2014
2014 2013
Note HK$M HK$M
Non-current assets
Fixed assets 12(A) 156 172
Investments in subsidiaries 14 51,271 52,350
Advance to a subsidiary 14 39 39
Other non-current assets 4 14
51,470 52,575
Current assets
Trade and other receivables 20 54 55
Bank balances and cash 3 3
57 58
Current liabilities
Trade and other payables 22 (258) (223)
Bank loans and other borrowings 23 – (816)
(258) (1,039)
Net current liabilities (201) (981)
Total assets less current liabilities 51,269 51,594
Financed by:
Equity
Share capital 28 23,243 12,632
Share premium – 8,119
Reserves 29
Declared dividends 2,526 2,476
Others 25,500 27,767
51,269 50,994
Non-current liabilities
Bank loans and other borrowings 23 – 600
Equity and non-current liabilities 51,269 51,594
William Mocatta Richard Lancaster Benjamin Lau
Vice Chairman Chief Executive Officer Acting Chief Financial Officer
Hong Kong, 26 February 2015
The notes and disclosures on pages 195 to 270 are an integral part of these financial statements.

CLP Holdings 2014 Annual Report 193
CONSOLIDATED STATEMENT OF CHANGES IN EQUITYfor the year ended 31 December 2014
Attributable to Shareholders Perpetual Other Non-
Share Share Capital controlling Total Capital Premium Reserves Total Securities Interests Equity
HK$M HK$M HK$M HK$M HK$M HK$M HK$M
Balance at 1 January 2013 12,632 8,119 70,376 91,127 – 74 91,201
Profit for the year – – 6,060 6,060 – 12 6,072
Other comprehensive income
for the year – – (3,333) (3,333) – 3 (3,330)
Sale of a subsidiary – – – – – 35 35
Dividends paid
2012 fourth interim – – (2,476) (2,476) – – (2,476)
2013 first to third interim – – (4,017) (4,017) – – (4,017)
Dividends paid to other
non-controlling interests
of subsidiaries – – – – – (4) (4)
Balance at 31 December 2013 12,632 8,119 66,610 87,361 – 120 87,481
Balance at 1 January 2014 12,632 8,119 66,610 87,361 – 120 87,481
Profit for the year – – 11,221 11,221 152 563 11,936
Other comprehensive income
for the year – – (4,000) (4,000) – (2) (4,002)
Transition to no-par value regime
(Note 28) 10,611 (8,119) (2,492) – – – –
Issue of perpetual capital securities
(Note 30) – – – – 5,791 – 5,791
Acquisitions of subsidiaries (Note 2) – – – – – 2,170 2,170
Dividends paid
2013 fourth interim – – (2,476) (2,476) – – (2,476)
2014 first to third interim – – (4,093) (4,093) – – (4,093)
Distributions to perpetual capital
securities holders – – – – (152) – (152)
Dividends paid to other
non-controlling interests
of subsidiaries – – – – – (696) (696)
Balance at 31 December 2014 23,243 – 64,770 88,013 5,791 2,155 95,959
The notes and disclosures on pages 195 to 270 are an integral part of these consolidated financial statements.

CONSOLIDATED STATEMENT OF CASH FLOWS
194 CLP Holdings 2014 Annual Report
for the year ended 31 December 2014
2014 2013
Note HK$M HK$M HK$M HK$M
Operating activities Net cash inflow from operations 31(A) 23,431 21,798 Interest received 130 205 Income tax paid (1,595) (982)
Net cash inflow from operating activities 21,966 21,021
Investing activities Capital expenditure (9,192) (8,462) Capitalised interest paid (294) (236) Proceeds from disposal of fixed assets 105 258 Additions of other intangible assets (1,287) (1,144) Acquisitions of subsidiaries / business 2 (8,172) (954) Deposits / proceeds from sales of subsidiaries 15(A) 283 1,708 (Increase) / decrease in available-for-sale investments (358) 21 Deferred consideration paid – (339) Investments in and advances to joint ventures (1,835) (185) Dividends received from Joint ventures 1,105 1,911 An associate 900 803 Available-for-sale investments 64 24 Increase in bank deposits with maturities of more than three months (2) –
Net cash outflow from investing activities (18,683) (6,595)
Net cash inflow before financing activities 3,283 14,426
Financing activities Proceeds from long-term borrowings 30,305 11,275 Repayment of long-term borrowings (23,572) (18,712) Repayment of obligations under finance leases (811) (2,546) Settlement of obligation under finance lease 2 (5,338) – Increase in short-term borrowings 1,160 648 Interest and other finance costs paid (3,723) (5,612) Advances repayment to non-controlling interests (336) – Issue of perpetual capital securities 5,791 – Distributions paid to perpetual capital securities holders (115) – Dividends paid to shareholders (6,569) (6,493) Dividends paid to other non-controlling interests of subsidiaries (696) (4)
Net cash outflow from financing activities (3,904) (21,444)
Net decrease in cash and cash equivalents (621) (7,018)Cash and cash equivalents at beginning of year 4,784 11,890Effect of exchange rate changes (127) (88)
Cash and cash equivalents at end of year 31(B) 4,036 4,784
The notes and disclosures on pages 195 to 270 are an integral part of these consolidated financial statements.
Acquisition of subsidiary or business refers to acquisition of a business operation with or
without legal entity respectively.

CLP Holdings 2014 Annual Report 195
SIGNIFICANT ACCOUNTING POLICIES
Apart from the accounting policies presented within the corresponding notes to the financial statements, other significant
accounting policies are set out below.
1. Basis of Preparation
The Company, CLP Holdings Limited, and its subsidiaries are collectively referred to as the Group in the consolidated
financial statements.
The financial statements have been prepared in accordance with Hong Kong Financial Reporting Standards (HKFRS) issued
by the Hong Kong Institute of Certified Public Accountants (HKICPA). They have been prepared under the historical cost
convention, as modified by the revaluation of certain financial assets and financial liabilities (including derivative financial
instruments) and investment property which have been measured at fair value.
In accordance with the transitional and saving arrangement for Part 9 of the Hong Kong Companies Ordinance (Cap.
622), “Accounts and Audit” as set out in sections 76 to 87 of Schedule 11 to the Hong Kong Companies Ordinance (Cap.
622), the consolidated financial statements are prepared in accordance with applicable requirements of the predecessor
Companies Ordinance (Cap. 32) for this financial year and the comparative period.
The preparation of financial statements in conformity with HKFRS requires the use of certain critical accounting estimates. It
also requires management to exercise their judgment in the process of applying the Group’s accounting policies. The areas
involving a higher degree of judgment or complexity, or areas where assumptions and estimates are especially significant to
the consolidated financial statements, are disclosed in Critical Accounting Estimates and Judgments on pages 203 to 205.
2. Changes in Accounting Policies
(A) Adoption of amendments to standards effective 1 January 2014
The Group has adopted the following amendments to standards effective 1 January 2014 for the first time for the
financial year beginning on 1 January 2014:
• Amendments to HKAS 32 Offsetting Financial Assets and Financial Liabilities
• Amendments to HKAS 36 – Recoverable Amount Disclosures for Non-Financial Assets
• Annual Improvements to HKFRS 2010-2012 Cycle
The adoption of these revised HKFRS has had no significant impact on the results and financial position of the Group.
(B) New standards and amendments to standards that have been issued but are not yet effective
The following new standards and amendments to standards have been issued and are mandatory for adoption by the
Group for accounting periods beginning on or after 1 January 2015. The Group has not early adopted them:
• Amendments to HKAS 28 and HKFRS 10 Sale or Contribution of Assets between an Investor and its Associate or
Joint Venture
• Amendments to HKFRS 11 Accounting for Acquisitions of Interests in Joint Operations
• HKFRS 9 (2014) Financial Instruments
• HKFRS 15 Revenue from Contracts with Customers
• Annual Improvements to HKFRS 2011-2013 Cycle
• Annual Improvements to HKFRS 2012-2014 Cycle
HKFRS 9 (2014) introduces new requirements for classification and measurement of financial instruments, a new
expected credit loss model that replaces the incurred loss impairment model used in HKAS 39, and a new hedge
accounting model which represents a substantial overhaul of hedge accounting that will enable entities to better
reflect their risk management activities in their financial statements. The adoption of HKFRS 9 (2014) may have an
effect on the Group’s classification and treatment of fair value changes of existing available-for-sale investments,
impairment of financial assets and the application of hedge accounting.

196 CLP Holdings 2014 Annual Report
SIGNIFICANT ACCOUNTING POLICIES
2. Changes in Accounting Policies (continued)
(B) New standards and amendments to standards that have been issued but are not yet effective (continued)
HKFRS 15 Revenue from Contracts with Customers replaces HKAS 18 Revenue, HKAS 11 Construction Contracts and
related interpretations. It establishes that revenue is recognised when a customer obtains control of a good or service
and thus has the ability to direct the use and obtain the benefits from the good or service. The Group is assessing the
impact of HKFRS 15.
Apart from the aforementioned, the adoption of these new standards and amendments to standards is not expected
to have any significant impact on the results and financial position of the Group.
3. Consolidation
(A) Basis of consolidation
The consolidated financial statements of the Group incorporate the financial statements of the Company and its
subsidiaries made up to 31 December and include the Group’s interests in joint ventures and associates and joint
operations on the basis set out in (C) and (D) below.
The financial statements of subsidiaries acquired during the year are included in the consolidated financial statements
from the date on which control is transferred to the Group. They are de-consolidated from the date that control
ceases.
Intercompany transactions, balances and unrealised gains on transactions between Group entities are eliminated on
consolidation. Unrealised losses are also eliminated unless the transaction provides evidence of an impairment of the
asset transferred. Where necessary to ensure consistency with the policies adopted by the Group, adjustments are
made to the financial statements of subsidiaries, joint ventures and associates.
(B) Subsidiaries
Subsidiaries are all entities over which the Group has control. The Group controls an entity when the Group is exposed
to, or has rights to, variable returns from its involvement with the entity and has the ability to affect those returns
through its power to direct the activities of the entity.
Investments in subsidiaries together with advances from the Company which are neither planned nor likely to be
settled in the foreseeable future, are carried on the statement of financial position of the Company at cost less
impairment. Cost is adjusted to reflect changes in consideration arising from contingent consideration amendments
within the measurement period. Provision for impairment in a subsidiary is made when the recoverable amount of the
subsidiary is lower than the Company’s respective cost of investment. The results of subsidiaries are accounted for by
the Company on the basis of dividends received and receivable.
(C) Joint ventures and associates
A joint venture is an arrangement in which the Group has joint control, whereby the Group has rights to the net assets
of the arrangement, rather than rights to its assets and obligation for its liabilities. Joint control is the contractually
agreed sharing of control of an arrangement, which exists only when decisions about the relevant activities require
unanimous consent of the parties sharing control.
An associate is an entity over which the Group has significant influence but not control nor joint control over the
financial and operating policies, generally accompanying a shareholding of between 20% and 50% of the voting
rights.
Investments in joint ventures / associates are accounted for using the equity method. They are initially recognised
at cost. Subsequent to initial recognition, the consolidated financial statements include the Group’s share of post-
acquisition profit or loss and other comprehensive income, until the date on which joint control or significant influence
ceases. Distributions received from an investee reduce the carrying amounts of the investments.

CLP Holdings 2014 Annual Report 197
3. Consolidation (continued)
(C) Joint ventures and associates (continued)
In the consolidated statement of financial position, interests in joint ventures / associates comprise the carrying
amounts of the investments and its net advances made to the joint ventures / associates (where the advances are
neither planned nor likely to be settled in the foreseeable future).
When the Group’s share of losses of a joint venture / associate equals or exceeds its interest therein, the Group does
not recognise further losses, unless it has incurred obligations or made payments on behalf of the joint ventures /
associates.
The Group determines at each reporting date whether there is any objective evidence that the investment in the joint
venture or associate is impaired. If this is the case, the group calculates the amount of impairment as the difference
between the recoverable amount of the joint venture / associate and its carrying value.
Unrealised gains on transactions between the Group and its joint ventures / associates are eliminated to the extent
of the Group’s interest in the joint ventures / associates. Unrealised losses are also eliminated unless the transaction
provides evidence of an impairment of the assets transferred.
Dilution gains or losses arising in investments in joint ventures / associates are recognised in profit or loss.
(D) Joint operations
A joint operation is an arrangement in which the Group has joint control (as explained in (C) above), whereby the
Group has rights to the assets, and obligations for the liabilities, relating to the arrangement.
When Group entity undertakes its activities under joint operations, the Group as a joint operator recognises its direct
right to, and its share of jointly held assets, liabilities, revenues and expenses of joint operations. These have been
incorporated in the financial statements under appropriate headings.
(E) Change in ownership interests
Transactions with non-controlling interests are treated as transactions with equity owners of the Group. For purchases
of ownership interests from non-controlling interests, the difference between any consideration paid and the relevant
share of the carrying value of net assets of a subsidiary acquired is recorded in equity. For disposal of ownership
interests to non-controlling interests that do not result in loss of control, gains or losses on disposals to non-controlling
interests are also recorded in equity.
If the ownership interest in a joint venture or associate is reduced but joint control or significant influence is retained,
only a proportionate share of the amounts previously recognised in other comprehensive income is reclassified to profit
or loss where appropriate.
For changes in ownership interests that result in loss of control of subsidiaries, loss of joint control in joint ventures
or loss of significant influence in associates, any retained interest in the entity is remeasured to its fair value, with the
change in carrying amount recognised in profit or loss. The fair value is the initial carrying amount for the purposes
of subsequent accounting for the retained interest as a joint venture, associate or financial asset. In addition, any
amounts previously recognised in other comprehensive income in respect of that entity are reclassified to profit or loss.
A quick guide to the classification of different entities:
Control → Subsidiary
Joint Control → Joint Venture or Joint Operation
Significant Influence → Associate
Less than Significant Influence → Available-for-sale Investment
198 CLP Holdings 2014 Annual Report
SIGNIFICANT ACCOUNTING POLICIES
4. Impairment of Non-Financial Assets
Non-financial assets that have indefinite useful lives are not subject to amortisation. They are tested for impairment
whenever events or changes in circumstances indicate that the carrying amount may not be recoverable and, in any case,
at least annually. Non-financial assets that are subject to amortisation are reviewed for impairment whenever events
or changes in circumstances indicate that the carrying amount may not be recoverable. Goodwill is tested annually for
impairment.
For the purposes of assessing impairment, assets are grouped at the lowest levels for which there are separately identifiable
cash flows (cash generating units). Goodwill arising from a business combination is allocated to cash generating units that
are expected to benefit from the synergies of the combination. An impairment loss is recognised for the amount by which
the carrying amount of an asset or a cash generating unit exceeds its recoverable amount. The recoverable amount is the
higher of the fair value of an asset or a cash generating unit less costs of disposal and its value in use.
An impairment loss recognised in prior years for an asset other than goodwill is reversed when there is a favourable change
in the estimates used to determine the recoverable amount of an asset. A reversal of the impairment loss is limited to
the asset’s carrying amount (net of accumulated amortisation or depreciation) that would have been determined had no
impairment loss been recognised in prior years.
Indefinite useful life ≠ Infinite useful life
An indefinite useful life only means that there is no foreseeable
limit to the period over which an asset is expected to generate
cash flows to the Group. It does not necessarily mean that it will
generate such cash flows forever.
Readers who would like to revisit our expanded discussion on
impairment assessment can find this on our website as part of
our accounting “mini-series”.
5. Derivative Financial Instruments and Hedging Activities
A derivative is initially recognised at fair value on the date a derivative contract is entered into and is subsequently
remeasured at its fair value. The method of recognising the resulting gain or loss depends on whether the derivative
is designated as a hedging instrument, and if so, the nature of the item being hedged. The Group designates certain
derivatives as either fair value hedges, which are hedges of the fair value of recognised financial assets or financial liabilities
or firm commitments (e.g. fixed interest rate loans and foreign currency trade receivables) or cash flow hedges, which are
hedges of the cash flows of recognised financial assets or financial liabilities or highly probable forecast transactions (e.g.
floating interest rate loans, future purchases of fuels denominated in US dollar).
The Group documents at the inception of the transaction the intended relationship between hedging instruments and
hedged items, as well as its risk management objectives and strategy for undertaking various hedge transactions. The
Group also documents its assessment, both at hedge inception and on an ongoing basis, of whether the derivatives that
are used in hedging transactions have been and will continue to be highly effective in offsetting changes in fair values or
cash flows of hedged items.
(A) Fair value hedges
Changes in the fair values of derivatives that are designated and qualify as fair value hedges are recognised in profit
or loss, which offset any changes in the fair values recognised in profit or loss of the corresponding hedged asset or
liability that are attributable to the hedged risk and achieve the overall hedging result.
(B) Cash flow hedges
The effective portion of changes in the fair values of derivatives that are designated and qualify as cash flow hedges
is recognised in other comprehensive income. The gain or loss relating to the ineffective portion is recognised
immediately in profit or loss.

CLP Holdings 2014 Annual Report 199
5. Derivative Financial Instruments and Hedging Activities (continued)
(B) Cash flow hedges (continued)
Amounts accumulated in equity are reclassified to profit or loss in the periods when the hedged items affect profit
or loss. Such reclassification from equity will offset the effect on profit or loss of the corresponding hedged item to
achieve the overall hedging result. However, when the highly probable forecast transaction that is hedged results
in the recognition of a non-financial asset (for example, inventory or fixed assets), the gains and losses previously
deferred in equity are transferred from equity and included in the initial measurement of the cost of the asset at the
time of acquisition. The deferred amounts are ultimately recognised in cost of goods sold in the case of inventory or in
depreciation in the case of fixed assets.
When a hedging instrument expires or is sold, terminated or exercised, or when a hedge no longer meets the criteria
for hedge accounting, then hedge accounting is discontinued prospectively, any cumulative gain or loss existing in
equity at that time remains in equity and is reclassified from equity to profit or loss in the same period as the hedged
forecast cash flows ultimately affect profit or loss. When a forecast transaction is no longer expected to occur, the
cumulative gain or loss that has been deferred in equity is reclassified to profit or loss immediately.
(C) Derivatives not qualifying for hedge accounting or held for trading purposes
Certain derivative financial instruments do not qualify for hedge accounting or held for trading purposes. Changes in
the fair values of these derivative financial instruments are recognised immediately in profit or loss.
The Group enters into sale and purchase transactions for commodities within the ordinary course of business.
Transactions that take the form of contracts that are within the scope of HKAS 39 are fair valued at the end of each
reporting period. Contracts that were entered into and continue to be held for the purpose of receipt or delivery of
commodities in accordance with the Group’s expected sale, purchase or usage requirements are not within the scope
of HKAS 39 but need to be assessed at inception to determine if they contain embedded derivatives.
An embedded derivative is one or more implicit or explicit terms in a contract that affect the cash flows of the contract
in a manner similar to a stand-alone derivative instrument. Any embedded derivative that meets the separation
criterion shall be separated from its host contract and measured as if it were a stand-alone derivative if its economic
characteristics are not closely related to those of the host contract.
6. Inventory
Inventory comprises stores and fuel and is stated at the lower of cost and net realisable value. Cost is calculated on
the weighted average basis for stores, coal and gas. Net realisable value is determined on the basis of anticipated sales
proceeds less estimated selling expenses.
7. Renewable Energy Products
(A) Renewable Energy Schemes
Renewable energy and energy efficiency schemes operate through the creation, trade and surrender of energy
products. The major national schemes affecting the Group’s Australia business require the surrender of certificates
including Large Scale Generation Certificates (LGCs) and Small-Scale Technology Certificates (STCs). The Group’s
Australia business is also required to surrender certificates under various State based schemes.
Forward purchased renewable energy products are designated as held for trading or own use to satisfy relevant
regulatory requirements. Renewable energy products that are held for trading are held at fair value through profit or
loss.
The renewable and efficiency products held for own use are accounted for on an accrual basis. That is, when a buy or
sell contract is entered into, no recording is made until legal title transfers.

200 CLP Holdings 2014 Annual Report
SIGNIFICANT ACCOUNTING POLICIES
7. Renewable Energy Products (continued)
(B) Carbon Units
Under the Clean Energy Legislation Package in Australia, the Group was entitled to transitional assistance in the form
of free carbon units and cash. This scheme has since been repealed and no carbon units have been received by the
Group in the current financial year. In the prior year, carbon compensation in the form of cash received and free
carbon units received through transitional assistance were initially recognised at fair value as a government grant and
subsequently released to profit or loss on a systematic basis being a straight line method over the relevant period.
The carbon tax liability at each reporting date was recognised based on the expected weighted average price of carbon
units for the obligation period. Purchased carbon units were measured at cost on initial recognition and carried at that
cost.
8. Current and Deferred Tax
The tax expense for the period comprises current and deferred tax. Tax is recognised in profit or loss, except to the extent
that it relates to items recognised either in other comprehensive income or directly in equity. In this case, the tax is also
recognised in either other comprehensive income or equity, respectively.
The current tax charge is calculated on the basis of the tax laws enacted or substantively enacted at the end of the
reporting period in the countries where the Company and its subsidiaries operate and generate taxable income.
Management periodically evaluate positions taken in tax returns with respect to situations in which applicable tax
regulation is subject to interpretation. It establishes provisions where appropriate on the basis of amounts expected to be
paid to the tax authorities.
Deferred tax is provided in full, using the liability method, on temporary differences arising between the tax bases of assets
and liabilities and their carrying amounts in the consolidated financial statements. However, deferred tax is not accounted
for if it arises from initial recognition of an asset or liability in a transaction other than a business combination that at the
time of the transaction affects neither accounting nor taxable profit or loss. Deferred tax is determined using tax rates (and
laws) that have been enacted or substantively enacted by the end of the reporting period and are expected to apply when
the related deferred tax asset is realised or the deferred tax liability is settled. Deferred tax assets are recognised to the
extent that it is probable that future taxable profit will be available against which the temporary differences can be utilised.
Deferred tax is also provided on temporary differences arising on investments in subsidiaries, joint ventures and associates,
except where the timing of the reversal of the temporary difference is controlled by the Group and it is probable that the
temporary difference will not reverse in the foreseeable future.
9. Employee Benefits
(A) Retirement benefits
The Group operates and / or participates in a number of defined contribution plans in Hong Kong, including the CLP
Group Provident Fund Scheme (GPFS) administered by Bank Consortium Trust Company Limited and the Mandatory
Provident Fund (MPF) scheme administered by HSBC Life (International) Limited. These schemes are set up as required
under the Hong Kong Mandatory Provident Fund Schemes Ordinance. The assets of these schemes are held in separate
trustee-administered funds. The pension plans are funded by payments from employees and by the participating
companies of the Group, and provide benefits linked to contributions and investment returns on the plans. The Group
has no further legal or constructive payment obligations if the fund does not hold sufficient assets to pay all employees
the benefit relating to employee service in the current and prior periods, once the contributions have been paid.
The Group’s employees outside Hong Kong are primarily covered by the respective defined contribution schemes in
accordance with local legislation and practices.
Contributions to the defined contribution plans are recognised as expenses in the year to which the contributions
relate, except to the extent that they are capitalised as part of the cost of qualifying assets.

CLP Holdings 2014 Annual Report 201
9. Employee Benefits (continued)
(B) Incentive bonus and employee leave entitlement
Provisions are made for the estimated liability for incentive bonus and employee leave entitlement as a result of
services rendered by employees up to the end of the reporting period, where there is a contractual obligation or past
practice has created a constructive obligation.
10. Foreign Currency Translation
Items included in the financial statements of each of the Group entities are measured using the currency of the primary
economic environment in which the entity operates (the functional currency). The consolidated financial statements are
presented in the Hong Kong dollar, which is the Company’s functional and the Group’s and the Company’s presentation
currency.
Foreign currency transactions are translated into the relevant functional currency using the exchange rates prevailing at
the dates of the transactions or valuation where items are remeasured. Foreign exchange gains and losses resulting from
the settlement of such transactions and from the translation of monetary assets and liabilities denominated in foreign
currencies by using the exchange rates at the end of the reporting period are recognised in profit or loss, except when
deferred in other comprehensive income as qualifying cash flow hedges or qualifying net investment hedges.
For subsidiaries, joint ventures and associates that have a functional currency different from the Group’s presentation
currency for the purpose of consolidation, assets and liabilities for each statement of financial position presented are
translated using the closing rate at the end of the reporting period; whilst income and expenses for each statement of
profit or loss presented are translated at the average exchange rate for the reporting period (unless this average rate is not
a reasonable approximation of the cumulative effect of the rates prevailing on the transaction dates, in which case income
and expenses are translated at the date of the transactions). All resulting exchange differences are recognised in other
comprehensive income and as a separate component of equity.
Goodwill and fair value adjustments arising on the acquisition of a foreign entity are treated as assets and liabilities of the
foreign entity and translated using the closing rate at the end of the reporting period.
Upon disposal of a foreign operation (that is, a disposal of the Group’s entire interest in a foreign operation, or a disposal
involving loss of control over a subsidiary / loss of joint control over a joint venture / loss of significant influence over an
associate that includes a foreign operation), all of the exchange differences accumulated in equity in respect of that
operation are reclassified to profit or loss.
In the case of a partial disposal that does not result in the Group losing control over a subsidiary that includes a foreign
operation, the proportionate share of accumulated exchange differences are re-attributed to non-controlling interests and
are not recognised in profit or loss. For all other partial disposals (that is, reductions in the Group’s ownership interest in
a joint venture or associate that do not result in the Group losing joint control or significant influence) the proportionate
share of the accumulated exchange difference is reclassified to profit or loss.
Monetary assets and liabilities are assets to be received and
liabilities to be paid in fixed money amounts. For example, a
trade receivable is a monetary asset (the amount to be received
is fixed) but a fixed asset is not a monetary asset because it is
uncertain how much you will receive if the fixed asset is to be
sold.
A company entity can have both functional currency and
presentation currency; however, a consolidation group can
only have presentation currency but not functional currency.
This is because presentation currency is a matter of choice but
functional currency is based on the different primary economic
environment in which each group entity is operating.

202 CLP Holdings 2014 Annual Report
SIGNIFICANT ACCOUNTING POLICIES
10. Foreign Currency Translation (continued)
The following exchange rates have been used in the preparation of Group financial statements:
2014 2013
Average Closing Average Closing
Australian dollar / Hong Kong dollar 6.9735 6.3540 7.4429 6.9154
Indian rupee / Hong Kong dollar 0.1272 0.1227 0.1323 0.1256
Renminbi (RMB) / Hong Kong dollar 1.2573 1.2496 1.2629 1.2808
11. Leases
Leases of assets in which a significant portion of the risks and rewards of ownership are retained by the lessor are classified
as operating leases. Payments made under an operating lease and the corresponding cumulative lease income / expense is
amortised on a straight-line basis over the term of the lease to profit or loss.
Leases of assets where the lessee has substantially all the risks and rewards of ownership are classified as finance leases.
Finance leases are capitalised at their commencement at the lower of the fair value of the leased asset and the present
value of the minimum lease payments. A fixed asset held under a finance lease is depreciated over the shorter of its useful
life or the lease term. The corresponding rental obligations, net of finance charges, are included as obligations under
finance leases in current and non-current liabilities. Where assets are leased out under a finance lease, the present value of
the lease receipts is recognised as a receivable.
For a finance lease, each lease receipt / payment is allocated between the receivable / liability and finance income / charges
so as to achieve a constant rate on the finance balance outstanding. The interest element of the lease receipt / payment
is recognised in profit or loss over the lease period so as to produce a constant periodic rate of interest on the remaining
balance of the receivable / liability for each period.
In the case of an energy supply or a power purchase contractual arrangement, where the fulfilment of the arrangement
is dependent on the use of specific assets and the arrangement conveys a right to use these assets, such a contractual
arrangement is accounted for as containing a finance or an operating lease. Payments for services and the cost of inputs
of the arrangement are excluded from the calculation of the minimum lease payments and are recognised as lease service
income / payment. In respect of the power purchase arrangement between CLP Power Hong Kong Limited (CLP Power
Hong Kong) and Castle Peak Power Company Limited (CAPCO) prior to acquisition of CAPCO as a subsidiary (Note 2), the
effective interest rate of the finance lease obligation was a variable rate akin to a price index which moved with reference
to the return allowed under the SoC Agreement and accordingly, the finance charge had been treated as contingent rent.
Contingent rent was recognised as an expense in the period in which it was incurred.

CLP Holdings 2014 Annual Report 203
CRITICAL ACCOUNTING ESTIMATES AND JUDGMENTS
In preparing the consolidated financial statements, management are required to exercise significant judgments in the selection
and application of accounting principles, as well as in making key estimates and assumptions. The following is a review of the
more significant judgments and uncertainties made, in respect of which different amounts may be reported under a different set
of conditions or using different assumptions.
1. Deferred Tax
At 31 December 2014 a deferred tax asset of HK$2,913 million (2013: HK$2,542 million) in relation to unused tax losses
(Note 25) was recognised in the consolidated statement of financial position. Estimating the deferred tax asset to be
recognised requires a process that involves determining appropriate tax provisions, forecasting future years’ taxable income
and assessing our ability to utilise tax benefits through future earnings. In cases where the actual future profits generated
are less than expected, a material reversal of the deferred tax asset may arise, which would be recognised in profit or loss
for the period in which such a reversal takes place. The Group’s deferred tax asset arises mainly from tax losses in our
Australia and India businesses. The current financial models indicate that the tax losses can be utilised in the foreseeable
future, taking into account that there are no expiry date for utilising losses in Australia, and in India the expiry ranges from
eight years to no expiry. Management believe that any reasonable changes in the model assumptions would not affect
management’s view as at the close of 2014. However, any unexpected changes in assumptions and estimates and in tax
regulations could affect the recoverability of this deferred tax asset in future.
2. Asset Impairment
The Group has made substantial investments in fixed assets, joint ventures and associate. The Group conducts impairment
reviews of these assets whenever events or changes in circumstances indicate that their carrying amounts may not be
recoverable. The Group also tests annually whether goodwill has suffered any impairment in accordance with the relevant
accounting standards.
Determining whether an asset or a cash generating unit is impaired requires an estimation of the value in use, which
requires the Group to estimate the future cash flows, a growth rate (that reflects the economic environments in which
the Group operates) and a pre-tax discount rate (that reflects the current market assessments of the time value of money
and the risks specific to the asset) in order to calculate the present value. Where the expected cash flows are less than the
asset’s carrying amount, an impairment loss may arise. During 2014, after reviewing the business environment as well as
the Group’s strategies and past performance of the investments, management concluded that there were impairment for
Narrabri Coal Seam Gas Project in Australia of HK$2,254 million (Note 13(b)), fixed assets and goodwill of Dali Yang_er
Hydropower Development Co., Ltd. totalled HK$197 million and investment in a joint venture in Australia of HK$59 million
(2013: EnergyAustralia Holdings Limited (EnergyAustralia)’s generation assets of HK$4,347 million, investments in CSEC
Guohua International Power Company Limited (CSEC Guohua) and CLP Guohua Shenmu Power Company Limited (Shenmu)
totalled HK$297 million and finance lease receivables of Paguthan Plant (Paguthan) of HK$519 million).
Apart from the assets impaired, the generation assets in Australia as explained in No. 3 below and the sensitivity analysis
set out in Note 13(a), the latest annual impairment models for other relevant assets indicated that sufficient headroom
(meaning the excess of the recoverable amount over carrying value) existed. Management believe that any reasonably
possible changes in the assumptions used in the models would not affect management’s view on impairment at 2014 year
end.
204 CLP Holdings 2014 Annual Report
CRITICAL ACCOUNTING ESTIMATES AND JUDGMENTS
3. Assessment of the Carrying Value of Generation Assets in Australia
The recoverable amount assessment for the generation asset cash generating units in Australia is based on value in use
calculations, applying a discounted cash flow methodology. The value in use calculations use cash flow projections as at 31
December 2014 based on the Group’s Business Plan covering a period of ten years. Projections for a period of greater than
five years have been used on the basis that a longer projection period represents the long dated nature of our generation
assets and a more appropriate reflection of future cash flows from anticipated legislative, regulatory and structural changes
in the industry.
The aggregated carrying value of the cumulative assets to which this assessment relates, amounted to HK$12,416 million
(A$1,954 million) at 31 December 2014.
The key assumptions used in the value in use calculation are as follows:
National Energy Market (NEM) modellingCritical judgment exists in estimating forward electricity pool prices (the forward curve), generation volumes, retail
volumes and gas prices. The forward curve has a significant impact on the accounting for certain items including value in
use calculations for impairment purposes. Given the continued structural changes in the National Energy Market and an
imbalance in the supply and demand equilibrium, risk is introduced in market modelling which heightens the criticality of
this judgment area. As part of making these critical judgments, risks do exist in the assumptions made around supply and
demand in regards to the Group’s generation assets in Australia. Where contraction of demand and supply side response
vary from the assumptions made, significant reductions in the value of the assets could eventuate.
Operating and fuel costsOperating costs are escalated by relevant cost drivers using activity-based costing principles. Non-contracted fuel costs are
based on management’s estimate of the future fuel prices.
Discount rateDiscount rates reflect the current market assessments of the time value of money and are based on the estimated cost of
capital. The pre-tax discount rates are calculated based on the post-tax discount rate applicable to each cash generating
unit adjusted for the relevant impact and timing of tax cash flows. The pre-tax discount rates used ranged from 10.9% to
13.0%.
Terminal growth rateTerminal value growth rates have been utilised in estimating cash flows beyond a period of ten years. The terminal growth
rate for the current period is 2.5% (2013: 2.5%) primarily reflecting inflation.
Changes in any or all of the key assumptions outlined above could result in a material reduction in the carrying value of
these generation assets.
4. Asset Retirement Obligations
CLP Power Hong Kong and CAPCO have been investing in the transmission and distribution network and power stations
respectively to supply electricity to the customers in its supply area in Hong Kong. CLP Power Hong Kong and CAPCO
expect that the land currently used for its transmission and distribution network and generation facilities will continue to
be used for generation and distribution of electricity supply in order to maintain the electricity supply to customers for the
foreseeable future. It is considered remote that the transmission and distribution network and the power stations would
be removed from the existing land sites. As such, an asset retirement obligation has not been recognised upfront in the
respective accounts of CLP Power Hong Kong and CAPCO in accordance with the requirements of accounting standards.

CLP Holdings 2014 Annual Report 205
5. SoC-related Accounts
As stipulated in the SoC, the balances in the Tariff Stabilisation Fund and the Rate Reduction Reserve shall represent
liabilities in the financial statements of CLP Power Hong Kong and shall not accrue to the benefit of its shareholders save
as provided for by the SoC. CLP Power Hong Kong also has the obligation to maintain the Fuel Clause Account, which
represents the difference between an agreed standard cost of fuel and the actual fuel costs. The Group considers that CLP
Power Hong Kong is required under the SoC to discharge its obligations arising from the SoC upon the expiry of the SoC
Agreement to customers such that these account balances meet the definition of a liability.
6. Lease Accounting
The application of HK(IFRIC)-Int 4 “Determining whether an Arrangement contains a Lease” has resulted in finance lease
accounting being applied to CLP Power Hong Kong as lessee (for its Electricity Supply Contract with CAPCO) prior to
acquisition of CAPCO as a subsidiary (Note 2), whilst being applied to CLP India Private Limited (CLP India) as lessor (for the
Power Purchase Agreement (PPA) with its off-taker). In determining whether an arrangement contains a lease, the Group
considers the right to use an asset is conveyed if the purchaser has the ability or right to operate the asset or to control
physical access to the underlying assets while obtaining or controlling more than an insignificant amount of the output
of the asset, or that it is remote that parties other than the purchaser will take more than an insignificant amount of the
output and the price paid is neither contractually fixed per unit of output nor equal to the current market price per unit
of output as of the time of delivery. In addition, to apply finance lease accounting, a number of assumptions in the lease
models have been made, such as the determination of minimum lease payments, implicit interest rates and residual values
of the power plants at the end of contract periods. For the power purchase arrangement between CLP Power Hong Kong
and CAPCO, in determining the minimum lease payments, the assumption had been made that the return contained in
the lease was a variable rate return which moved with reference to the return allowed under the SoC and accordingly, the
finance charge had been treated as contingent rent. Any future changes to these assumptions will affect the value of the
lease assets and liabilities recognised and the corresponding lease income and expenses.
7. Revenue Recognition
The Group records revenue for retail and wholesale energy sales under the accrual method. Retail electricity and gas
revenues are recognised when the commodity is provided to customers on the basis of periodic cycle meter readings
and include an estimated accrual for the value of the commodity consumed from the meter reading date to the end
of the reporting period. The unbilled revenue is calculated at the end of the reporting period based on estimated daily
consumption after the meter reading date to the end of the reporting period. Estimated daily consumption is derived
using historical customer profiles adjusted for weather, long unbilled customers and other measurable factors affecting
consumption. Unbilled revenue of the Group (included in trade and other receivables) totalled HK$5,118 million at 31
December 2014 (2013: HK$7,216 million).
8. Contingent Liabilities
Please refer to Note 34 for the Group’s contingent liabilities and the judgments made.
9. Fair Value Estimation of Derivative Financial Instruments and Investment Property
Please refer to “Financial Risk Management” No. 2 Fair Value Estimation and Hierarchy of Financial Instruments on pages
266 to 268 for derivative financial instruments. For fair value estimation of investment property, please refer to Note 12(C).

NOTES TO THE FINANCIAL STATEMENTS
206 CLP Holdings 2014 Annual Report
1. General Information
The Company is a limited liability company incorporated in Hong Kong and listed on the Stock Exchange of Hong Kong.
The principal activity of the Company is investment holding, whilst the principal activities of the subsidiaries are the
generation and supply of electricity in Hong Kong, India and Australia, and investment holding of power projects in
Mainland China, Southeast Asia and Taiwan.
The financial operations of the Company’s major subsidiaries, CLP Power Hong Kong and CAPCO, (collectively referred as
SoC Companies) are governed by a SoC entered with the Hong Kong Government. Our electricity business in Hong Kong is
therefore also referred to as the SoC business. The main features of the SoC Agreement are summarised on pages 271 and
272, which are unaudited by PricewaterhouseCoopers.
These financial statements have been approved for issue by the Board of Directors on 26 February 2015.
2. Business Combination
Accounting Policy
Acquisitions of subsidiaries are accounted for using the acquisition method of accounting. The consideration
transferred for the acquisition is measured at the fair value of the assets given, equity instruments issued and liabilities
incurred or assumed at the date of exchange. The consideration transferred includes the fair value of any asset or
liability resulting from a contingent consideration arrangement. Acquisition-related costs are expensed as incurred.
Identifiable assets acquired and liabilities and contingent liabilities assumed in a business combination are measured
initially at their fair values at the acquisition date. The Group recognises any non-controlling interest in the acquiree at
the non-controlling interest’s proportionate share of the acquiree’s identifiable net assets.
Any contingent consideration to be transferred by the Group is recognised at fair value at the acquisition date.
Subsequent changes to the fair value of the contingent consideration that is deemed to be an asset or liability is
recognised either in profit or loss or other comprehensive income as appropriate. Contingent consideration that is
classified as equity is not remeasured, and its subsequent settlement is accounted for within equity.
The excess of the consideration transferred and the amount of any non-controlling interest in the acquiree plus the
acquisition-date fair value of any previous equity interest in the acquiree over the fair value of the Group’s share of
the identifiable net assets acquired, is recorded as goodwill. If the total of consideration transferred, non-controlling
interest recognised and previously held interest measured at fair value is less than the fair value of the net assets of the
subsidiary acquired, in the case of a bargain purchase, the difference is recognised directly in profit or loss.
If the business combination is achieved in stages, the acquisition date carrying value of the acquirer’s previously held
equity interest in the acquiree is remeasured to fair value at the acquisition date; any gains or losses arising from such
re-measurement are recognised in profit or loss.
On 12 May 2014 the Group completed the acquisition of a further 30% interest in CAPCO and the remaining 51%
interest in Hong Kong Pumped Storage Development Company, Limited (PSDC).
The acquisitions were based on the agreements, signed on 19 November 2013, (a) whereby each of CLP Power Hong Kong
and China Southern Power Grid International (HK) Co., Limited (CSG HK), a wholly-owned subsidiary of China Southern
Power Grid Co., Limited (CSG) would acquire half of ExxonMobil Energy Limited (EMEL)’s 60% equity interest in, and
associated shareholder’s advances to, CAPCO; and (b) whereby CLP Power Hong Kong agreed to acquire all of EMEL’s
51% equity interest in, and associated shareholder’s advances to, PSDC. The acquisitions enabled the Group to consolidate
its regulated businesses in Hong Kong and allowed it to exercise a greater degree of control over its generation activities.

CLP Holdings 2014 Annual Report 207
2. Business Combination (continued)
The aggregate cash consideration was HK$13,510 million (HK$11,583 million for the CAPCO acquisition and HK$1,927
million for the PSDC acquisition). The Group has carried out a consideration allocation exercise in accordance with HKFRS 3
(Revised) Business Combinations (HKFRS 3), which is illustrated as follows:
CAPCO PSDC
HK$M HK$M
Settlement of a pre-existing finance lease payable by the Group to CAPCO 5,338 –
Acquisition of shareholder’s advances from EMEL to CAPCO / PSDC 7,036 56
Acquisition of identifiable net assets and liabilities (791) 1,871
11,583 1,927
With respect to CAPCO, the consideration allocated to the settlement of a pre-existing finance lease payable of HK$5,338
million is calculated as the difference between the fair value of the finance lease payable of HK$34,076 million and its
carrying amount of HK$27,683 million, net of deferred tax of HK$1,055 million. This amount of HK$5,338 million is
recognised in the Group’s consolidated statement of profit or loss (Note 5).
The Group owned a 40% equity interest in CAPCO and a 49% equity interest in PSDC (Initial Equity Investments) before
the acquisitions. The acquisition of the additional 30% equity interest in CAPCO and 51% equity interest in PSDC gives the
Group control over both CAPCO and PSDC. Therefore CAPCO and PSDC have become subsidiaries of the Group from 12
May 2014. The acquisitions have been treated as “step acquisitions” under HKFRS 3.
According to HKFRS 3, a step acquisition is accounted for using the acquisition method of accounting. Therefore the
Initial Equity Investments are remeasured to fair value at the acquisition date and any gain or loss arising is recognised in
the statement of profit or loss. The Initial Equity Investments are deemed to have been disposed of, in return, with the
consideration transferred for the total 70% equity interest in CAPCO and the total 100% equity interest in PSDC. The fair
values of the Initial Equity Investments form one of the components to calculate goodwill, along with the consideration
transferred and non-controlling interests, if any, less the fair value of the identifiable net assets of CAPCO and PSDC. The
aggregate gain on deemed disposal of the Initial Equity Investments is HK$7,363 million (HK$5,599 million with respect to
CAPCO and HK$1,764 million with respect to PSDC). This is recognised in the Group’s consolidated statement of profit or
loss (Note 5).

208 CLP Holdings 2014 Annual Report
NOTES TO THE FINANCIAL STATEMENTS
2. Business Combination (continued)
The following tables summarise the fair value of assets acquired and liabilities assumed from the acquisitions of CAPCO
and PSDC respectively and the illustration of the acquisition method of accounting and the calculation of goodwill:
CAPCO
Fair value of net assets:
HK$M
Fixed assets 193
Leasehold land and land use rights under operating leases 3,811
Finance lease receivable 34,076
Inventories – stores and fuel 2,291
Trade and other receivables 1,416
Trade and other payables (24,684)
Income tax payable (365)
Bank loans and other borrowings (4,347)
Deferred tax liabilities (4,590)
Other non-current liabilities (566)
Net assets 7,235
Acquisition method of accounting:
HK$M HK$M
Consideration for 70% equity interest in CAPCO
Cash consideration (791)
Fair value of existing 40% interest in joint venture (a) 6,063
Total consideration for 70% equity interest in CAPCO 5,272
Non-controlling interests (b) 2,170
Less:
Fair value of net assets (7,235)
Consolidation adjustment on settlement of the pre-existing
finance lease and the associated deferred tax 5,338
Fair value of net assets attributable to the Group (1,897)
Goodwill (c) 5,545
Notes:
(a) The fair value of existing 40% interest in CAPCO was derived from the consideration paid for the acquisition of the 30% interest of HK$4,547 million (being the consideration of HK$11,583 million less the amount paid for the acquisition of the shareholder’s advances of HK$7,036 million).
(b) The Group recognised the non-controlling interests in CAPCO at the non-controlling interests’ proportionate share of the fair value of CAPCO’s identifiable net assets and liabilities as set out above.
(c) Goodwill of HK$5,545 million was recognised which represented the future economic benefits arising from assets acquired that are not currently individually identified and separately recognised. The goodwill is allocated to the Hong Kong segment. None of the goodwill recognised is expected to be deductible for income tax purposes.

CLP Holdings 2014 Annual Report 209
2. Business Combination (continued)
PSDC
Fair value of net assets:
HK$M
Fixed assets 1
Intangible assets 5,607
Trade and other receivables 104
Trade and other payables (113)
Income tax payable (7)
Bank loans and other borrowings (204)
Deferred tax liabilities (893)
Other non-current liabilities (826)
Net assets 3,669
Acquisition method of accounting:
HK$M HK$M
Consideration for 100% equity interest in PSDC
Cash consideration 1,871
Fair value of existing 49% interest in joint venture 1,798
Total consideration for 100% equity interest in PSDC 3,669
Less: Fair value of net assets (3,669)
Goodwill (note) –
Note: The Group has determined that the consideration is equal to the fair value of the identifiable net assets of PSDC at the date of the acquisition and therefore no goodwill is recognised.
Acquisition-related costs are included in fuel and other operating expenses in the consolidated statement of profit or loss.
These totalled HK$39 million, which comprised mainly stamp duty and legal and professional fees.
The respective business of CAPCO and PSDC have been integrated into the existing business of CLP Power Hong Kong
through the electricity supply and pumped storage service arrangements with CLP Power Hong Kong and therefore, no
additional revenue is contributed by CAPCO and PSDC. The profit included in the consolidated statement of profit or
loss from May to December 2014 contributed by CAPCO and PSDC was HK$2,072 million. Had CAPCO and PSDC been
consolidated from 1 January 2014, the consolidated statement of profit or loss would have included profit of HK$3,096
million.

210 CLP Holdings 2014 Annual Report
NOTES TO THE FINANCIAL STATEMENTS
3. Revenue
Accounting Policy
Revenue primarily represents sales of electricity and gas, engineering and maintenance service fees, other electricity-
related revenue such as temporary electricity supply works and reconnection fees and adjustments stipulated under
the SoC. It is measured at the fair value of the consideration received or receivable, net of applicable tax, discounts and
rebates.
Sales of electricity and gas are based on actual and accrued consumption or the amount billed in accordance with the
terms of the contractual agreements where applicable during the year. Other revenue is recognised when services are
rendered or sales are completed.
Lease service income comprises servicing income and fuel costs received from lessees with respect to the leased assets.
Finance lease income represents the interest element of the lease receipts on lease receivables and is recognised over
the lease period using the effective interest method. Operating lease income is recognised on a straight-line basis over
the term of the lease. Interest income is recognised on a time proportion basis using the effective interest method.
An analysis of the Group’s revenue is as follows:
2014 2013
HK$M HK$M
Sales of electricity 79,034 88,555
Sales of gas 7,976 8,388
Operating lease income under PPA 3,334 2,778
Lease service income under PPA 456 626
Finance lease income under PPA 151 252
Other revenue (note) 2,328 3,290
93,279 103,889
Transfer for SoC (from) / to revenue (Note 27) (1,020) 641
92,259 104,530
Note: Including carbon compensation in the form of cash assistance and free carbon units totalling HK$924 million (A$130 million) (2013: HK$1,923 million (A$259 million)) received by EnergyAustralia under the Energy Security Fund (ESF) with respect to Yallourn Power Station up to 30 June 2014 when the ESF was terminated after the carbon tax repeal. The compensation received was recognised as revenue over the relevant period on a systematic basis.
The operating lease income under PPA relates to Jhajjar, whose
PPA has been accounted for as an operating lease.
The lease service income and finance lease income under PPA
relate to Paguthan. In accordance with HK(IFRIC)-Int 4 and
HKAS 17, servicing income and fuel costs received by Paguthan
from the lessee with respect to the leased assets are not part of
the minimum lease payments and are recognised as lease service
income.

CLP Holdings 2014 Annual Report 211
4. Segment Information
Accounting Policy
Operating segments are reported in a manner consistent with the internal reporting provided to the Chief Executive
Officer, who is the chief operating decision-maker of the Group. In accordance with the Group’s internal organisation
and reporting structure, the operating segments are based on geographical regions.
Segment revenue is based on the geographical region in which the electricity is generated and / or services are
rendered. Segment capital additions represent the total costs incurred during the year to acquire fixed assets and other
segment assets that are expected to be used for more than one year. Unallocated items comprise mainly corporate
expenses, corporate assets, and the Company’s liquid funds and borrowings.
The Group operates, through its subsidiaries, joint ventures, joint operations and an associate, in five major geographical
regions – Hong Kong, Mainland China, India, Southeast Asia and Taiwan, and Australia. In accordance with the Group’s
internal organisation and reporting structure, the operating segments are based on geographical regions. Substantially all
the principal activities of the Group in each region are for the generation and supply of electricity which are managed and
operated on an integrated basis.
This year the segment information format includes the presentation of EBITDAF and one-off
items (definitions see below). This is in accordance with changes in internal reporting made
during the year.
EBITDAF = Earnings before interest, taxes, depreciation and amortisation, and fair value
adjustments. For this purpose, fair value adjustments include fair value gains or losses
on derivative financial instruments relating to transactions not qualifying as hedges and
ineffectiveness of cash flow hedges.
One-off items refer to unusual and infrequent events such as acquisition / disposal, impairment
of non-current assets, property valuation gain / loss, change in law or natural catastrophe.
They are considered irrelevant for assessing the underlying performance of the Group and are
separately disclosed to allow a better understanding and comparison of the financial results.
Details of the one-off items can be found on page 34.

212 CLP Holdings 2014 Annual Report
NOTES TO THE FINANCIAL STATEMENTS
4. Segment Information (continued)
Information about the Group’s operations by geographical region is as follows:
Southeast Mainland Asia Unallocated Hong Kong China India & Taiwan Australia Items Total
HK$M HK$M HK$M HK$M HK$M HK$M HK$M
For year ended 31 December 2014
Revenue 35,623 909 4,821 8 50,895 3 92,259
EBITDAF of subsidiaries 17,926 501 1,934 (27) 1,292 (542) 21,084Share of results, net of income tax Joint ventures 411 891 – 321 (61) – 1,562 An associate – 796 – – – – 796
EBITDAF of the Group 18,337 2,188 1,934 294 1,231 (542) 23,442Depreciation and amortisation (3,923) (412) (567) – (1,845) (44) (6,791)Fair value adjustments (18) – – – 620 – 602Finance costs (1,954) (211) (920) – (1,019) (76) (4,180)Finance income 9 9 42 3 28 40 131
Profit / (loss) before income tax 12,451 1,574 489 297 (985) (622) 13,204Income tax (expense) / credit (1,807) (102) (219) – 860 – (1,268)
Profit / (loss) for the year 10,644 1,472 270 297 (125) (622) 11,936Earnings attributable to Perpetual capital securities holders (152) – – – – – (152) Other non-controlling interests (549) (14) – – – – (563)
Earnings / (loss) attributable to shareholders 9,943 1,458 270 297 (125) (622) 11,221Excluding: One-off items (2,198) 158 – – 881 – (1,159)
Operating earnings 7,745 1,616 270 297 756 (622) 10,062
Capital additions 7,940 537 461 – 1,777 18 10,733Impairment provisions Fixed assets and leasehold land and land use rights under operating leases – 195 – – 67 – 262 Goodwill and other intangible assets – 2 – – 2,223 – 2,225 Interests in joint ventures – – – – 59 – 59 Receivables and others 30 – 27 – 720 – 777
At 31 December 2014Fixed assets 97,372 5,364 11,259 – 13,982 156 128,133Goodwill and other intangible assets 5,545 5,471 29 – 20,084 – 31,129Interests in joint ventures 18 9,177 – 1,723 258 – 11,176Interest in an associate – 786 – – – – 786Deferred tax assets – 95 6 – 3,727 – 3,828Other assets 15,819 5,024 5,341 70 12,251 1,106 39,611
Total assets 118,754 25,917 16,635 1,793 50,302 1,262 214,663
Bank loans and other borrowings 40,644 3,516 8,656 – 14,619 – 67,435Current and deferred tax liabilities 12,322 1,483 403 – – – 14,208Obligations under finance leases – – – – 27 – 27Other liabilities 24,571 1,611 724 3 9,909 216 37,034
Total liabilities 77,537 6,610 9,783 3 24,555 216 118,704

CLP Holdings 2014 Annual Report 213
4. Segment Information (continued)
The difference between total assets and total liabilities represents shareholders’ financing.
Southeast Mainland Asia Unallocated Hong Kong China India & Taiwan Australia Items Total
HK$M HK$M HK$M HK$M HK$M HK$M HK$M
For year ended 31 December 2013
Revenue 34,172 991 4,371 14 64,976 6 104,530
EBITDAF of subsidiaries 14,768 620 1,109 (26) 321 (386) 16,406Share of results, net of income tax Joint ventures 1,235 1,188 – 262 (14) – 2,671 An associate – 612 – – – – 612
EBITDAF of the Group 16,003 2,420 1,109 236 307 (386) 19,689Depreciation and amortisation (4,412) (213) (424) – (2,506) (37) (7,592)Fair value adjustments 83 – 5 – 4 – 92Finance costs (3,685) (205) (957) – (1,620) (55) (6,522)Finance income 11 4 80 5 44 29 173
Profit / (loss) before income tax 8,000 2,006 (187) 241 (3,771) (449) 5,840Income tax (expense) / credit (1,010) (151) 78 – 1,315 – 232
Profit / (loss) for the year 6,990 1,855 (109) 241 (2,456) (449) 6,072Earnings attributable to other non-controlling interests – (12) – – – – (12)
Earnings / (loss) attributable to shareholders 6,990 1,843 (109) 241 (2,456) (449) 6,060Excluding: One-off items – 372 293 – 2,582 – 3,247
Operating earnings 6,990 2,215 184 241 126 (449) 9,307
Capital additions 9,292 483 1,243 – 2,139 39 13,196Impairment provisions Fixed assets and leasehold land and land use rights under operating leases – 38 – – 3,862 – 3,900 Goodwill and other intangible assets – – – – 773 – 773 Interests in joint ventures – 297 – – – – 297 Receivables and others – 3 716 – 897 – 1,616
At 31 December 2013Fixed assets 93,782 5,405 11,628 – 15,889 172 126,876Goodwill and other intangible assets – 40 29 – 23,778 – 23,847Interests in joint ventures 9,478 8,349 – 1,789 324 – 19,940Interest in an associate – 1,675 – – – – 1,675Deferred tax assets – 60 3 – 3,021 – 3,084Other assets 10,044 3,177 5,443 87 15,702 1,810 36,263
Total assets 113,304 18,706 17,103 1,876 58,714 1,982 211,685
Bank loans and other borrowings 28,293 3,457 8,479 – 14,406 1,416 56,051Current and deferred tax liabilities 8,193 188 308 – – – 8,689Obligations under finance leases 27,947 – – – 29 – 27,976Other liabilities 13,768 400 1,426 3 15,708 183 31,488
Total liabilities 78,201 4,045 10,213 3 30,143 1,599 124,204

214 CLP Holdings 2014 Annual Report
NOTES TO THE FINANCIAL STATEMENTS
5. Other Gain
2014 2013
HK$M HK$M
Net gain on CAPCO and PSDC acquisitions (Note 2)
Gain on deemed disposal of previously owned interests in joint ventures 7,363 –
Loss on settlement of a pre-existing finance lease payable (5,338) –
2,025 –
Gain on bargain purchase of Mount Piper and Wallerawang (note) – 751
2,025 751
Note: In 2013, the gain on bargain purchase arose from the acquisitions of Mount Piper Power Station and Wallerawang Power Station that underpin the Delta Western GenTrader contracts previously acquired.
6. Operating Profit
Operating profit is stated after charging / (crediting) the following:
2014 2013
HK$M HK$M
Charging
Staff costs
Salaries and other costs 3,684 2,715
Retirement benefits costs (a) 296 302
Auditor’s remuneration
Audit 37 34
Permissible audit related and non-audit services (b) 7 12
Operating lease expenditure on the agreement with Ecogen 276 311
Net loss on disposal of fixed assets 282 173
Impairment of *
Fixed assets and leasehold land and land use rights under operating leases 262 150
Goodwill and other intangible assets 2,225 176
Inventories – stores and fuel 41 –
Finance lease receivables – 519
Impairment and other provisions for EnergyAustralia’s generation assets – 4,437
Net fair value (gain) / loss on non-financing related derivative financial instruments
Cash flow hedges, reclassified from equity to
Purchases of electricity, gas and distribution services (331) (437)
Fuel and other operating expenses (167) (201)
Transactions not qualifying as hedges (602) (91)
Ineffectiveness of cash flow hedges – (1)
Net exchange loss / (gain) 126 (73)
Crediting
Revaluation gain on investment property (245) –
Gain on termination of an energy agreement in Australia (216) –
Net rental income from properties (47) (7)
* Excluding the impairment of EnergyAustralia’s generation assets in 2013

CLP Holdings 2014 Annual Report 215
6. Operating Profit (continued)
Notes:
(a) The retirement benefit plans for staff employed by the Group entities in Hong Kong are regarded as defined contribution schemes. The current scheme, GPFS, provides benefits linked to contributions and investment returns on the scheme. Contributions paid to defined contribution schemes, including GPFS and MPF as required under the Hong Kong Mandatory Provident Fund Schemes Ordinance, totalled HK$222 million (2013: HK$218 million), of which HK$64 million (2013: HK$62 million) was capitalised.
Staff employed by the Group entities outside Hong Kong are primarily covered by defined contribution schemes in accordance with local legislation and practices. Total contributions amounted to HK$161 million (2013: HK$189 million).
(b) Permissible audit-related and non-audit services comprise Sustainability Report assurance, audits of CLP’s provident funds, auditor’s attestation and accounting / tax advisory services for business development.
7. Finance Costs and Income
Accounting Policy
Borrowing costs are recognised as an expense in the year in which they are incurred, except to the extent that they
are capitalised when they are directly attributable to the acquisition, construction or production of an asset which
necessarily takes a substantial period of time to get ready for its intended use.
2014 2013
HK$M HK$M
Finance costs
Interest expenses on
Bank loans and overdrafts 1,430 1,537
Other borrowings
Wholly repayable within five years 265 253
Not wholly repayable within five years 872 917
Tariff Stabilisation Fund (a) 1 1
Customers’ deposits, fuel clause over-recovery and others 110 31
Finance charges under finance leases (b) 922 2,753
Other finance charges 372 444
Net fair value loss / (gain) on financing related derivative financial instruments
Cash flow hedges, reclassified from equity 677 895
Fair value hedges (666) 1,027
Not designated as hedges (1) (3)
Ineffectiveness of cash flow hedges 33 18
Loss / (gain) on hedged items in fair value hedges 658 (992)
Other net exchange gain on financing activities (197) (88)
4,476 6,793
Less: amount capitalised (c) (296) (271)
4,180 6,522
Finance income
Interest income on short-term investments and bank deposits 131 173
Notes:
(a) CLP Power Hong Kong is required to credit, to a Rate Reduction Reserve in its financial statements, a charge of the average of one-month Hong Kong interbank offered rate on the average balance of the Tariff Stabilisation Fund under the SoC (Note 27).
(b) Finance charges under finance leases primarily related to contingent rent in respect of the power purchase arrangement between CLP Power Hong Kong and CAPCO accounted for as finance lease in accordance with HK(IFRIC)-Int 4 and HKAS 17 prior to acquisition of CAPCO as a subsidiary (Note 2).
(c) Finance costs have been capitalised at average interest rates of 1.33% – 9.80% (2013: 3.17% – 10.68%) per annum.

216 CLP Holdings 2014 Annual Report
NOTES TO THE FINANCIAL STATEMENTS
8. Income Tax Expense / (Credit)
Income tax in the consolidated statement of profit or loss represents the income tax of the Company and subsidiaries and
is analysed below:
2014 2013
HK$M HK$M
Current income tax
Hong Kong 1,303 534
Outside Hong Kong 268 305
1,571 839
Deferred tax
Hong Kong 503 473
Outside Hong Kong (806) (1,544)
(303) (1,071)
1,268 (232)
Hong Kong profits tax has been provided at the rate of 16.5% (2013: 16.5%) on the estimated assessable profits for
the year. Income tax on profits assessable outside Hong Kong has been provided at the rates prevailing in the respective
jurisdictions.
The income tax on the Group’s profit before income tax differs from the theoretical amount that would arise using the
Hong Kong profits tax rate as follows:
2014 2013
HK$M HK$M
Profit before income tax 13,204 5,840
Less: Share of results of joint ventures and associate, net of income tax (2,358) (3,283)
10,846 2,557
Calculated at an income tax rate of 16.5% (2013: 16.5%) 1,790 422
Effect of different income tax rates in other countries (217) (501)
Income not subject to tax (393) (182)
Expenses not deductible for tax purposes 204 178
Revenue adjustment for SoC not subject to tax (Note 27) 168 (105)
Over-provision in prior years (645) (53)
Derecognition of deferred tax assets 360 –
Tax losses not recognised 1 9
Income tax expense / (credit) 1,268 (232)
Accounting Policy No. 8

CLP Holdings 2014 Annual Report 217
9. Earnings Attributable to Shareholders
Earnings attributable to shareholders have been dealt with in the financial statements of the Company to the extent of
HK$6,844 million (2013: HK$7,384 million).
CLP Holdings is the investment holding company. Its earnings were mainly derived from
dividends of subsidiaries.
10. Dividends
2014 2013
HK$ HK$
per share HK$M per share HK$M
First to third interim dividends paid 1.62 4,093 1.59 4,017
Fourth interim dividend declared 1.00 2,526 0.98 2,476
2.62 6,619 2.57 6,493
At the Board meeting held on 26 February 2015, the Directors declared the fourth interim dividend of HK$1.00 per share
(2013: HK$0.98 per share). The fourth interim dividend is not reflected as dividends payable in the financial statements,
but as a separate component of the shareholders’ funds at 31 December 2014.
11. Earnings per Share
The earnings per share are computed as follows:
2014 2013
Earnings attributable to shareholders (HK$M) 11,221 6,060
Weighted average number of shares in issue (thousand shares) 2,526,451 2,526,451
Earnings per share (HK$) 4.44 2.40
Basic and fully diluted earnings per share are the same as the Company did not have any dilutive equity instruments
throughout the year ended 31 December 2014 (2013: nil).

218 CLP Holdings 2014 Annual Report
NOTES TO THE FINANCIAL STATEMENTS
12. Fixed Assets, Leasehold Land and Land Use Rights under Operating Leases and Investment Property
Accounting Policy
(A) Fixed assets and leasehold land and land use rights under operating leases
Fixed assets are stated at cost less accumulated depreciation and accumulated impairment losses. Cost includes
expenditure that is directly attributable to the acquisition of the fixed asset. Cost may also include transfer
from equity of any gains / losses on qualifying cash flow hedges of foreign currency purchases of fixed assets.
Subsequent costs are included in the asset’s carrying amount or recognised as a separate asset, only when it is
probable that future economic benefits associated with the item will flow to the Group and the cost of the item
can be measured reliably. For any asset replacement, the carrying amount of the replaced part is derecognised.
All other repairs and maintenance are recognised as expenses in the period in which they are incurred.
Fixed assets employed for the electricity business in Hong Kong, also referred to as SoC fixed assets, represent
a major portion of the assets of the Group. Depreciation of fixed assets and amortisation of leasehold land is
on a straight-line basis using the rates authorised under the SoC which reflect the pattern in which the assets’
economic benefits are consumed.
Leasehold land unexpired term of the lease
Cable tunnels 100 years
Buildings and civil structures at power stations 35 years
Ash lagoon 35 years
Other buildings and civil structures 60 years
Overhead lines (33 kV and above) 60 years
Overhead lines (below 33 kV) 45 years
Cables 60 years
Switchgear and transformers 50 years
Generating plant 25 years
Substation miscellaneous 25 years
Meters 15 years
System control equipment, furniture, tools, communication and office equipment 10 years
Computers and office automation equipment other than those forming
part of the generating plant 5 years
Motor vehicles and marine craft 5 years
Refurbished or improved assets remaining original life plus
any life extension
Fixed assets used for the non-SoC business primarily relate to the electricity businesses located outside Hong
Kong. Amortisation of leasehold land and depreciation of fixed assets are calculated, using the straight-line
method, to allocate their costs to their estimated residual values over the unexpired term of the lease or their
estimated useful lives, as appropriate. Their estimated useful lives are similar to those of the SoC fixed assets and
are set out below:

CLP Holdings 2014 Annual Report 219
12. Fixed Assets, Leasehold Land and Land Use Rights under Operating Leases and Investment Property (continued)
Accounting Policy (continued)
(A) Fixed assets and leasehold land and land use rights under operating leases (continued)
Leasehold land unexpired term of the lease
Buildings 10 – 60 years
Generating plant 15 – 35 years
Switchgear and transformers 17 – 45 years
Gas storage plant 25 years
Other equipment 10 – 30 years
Computers, furniture and fittings and office equipment 3 – 15 years
Motor vehicles 3 – 10 years
Freehold land not depreciable
The assets’ residual values and useful lives are reviewed and adjusted, if appropriate, at the end of each
reporting period. For plant under construction, no depreciation is provided until the construction is completed
and the assets are ready for their intended use. Leasehold land commences amortisation from the time when the
land interest becomes available for its intended use. An asset’s carrying amount is written down immediately to
its recoverable amount if the asset’s carrying amount is greater than its estimated recoverable amount. The gain
or loss on disposal of a fixed asset is the difference between the net sales proceeds and the carrying amount of
the relevant asset, and is recognised in profit or loss.
(B) Investment Properties
Investment properties include properties that are being constructed or developed for future use as investment
properties. Land held under operating leases is accounted for as an investment property when the rest of the
definition of an investment property is met. In such cases, the operating leases concerned are accounted for as if
they were finance leases. Investment properties are measured initially at cost, including related transaction costs.
Subsequent to initial recognition, investment properties are measured at fair value, unless they are still in the
course of construction or development at the end of the reporting period and their fair value cannot be reliably
measured at that time. Fair value is based on active market prices, adjusted, if necessary, for any difference in the
nature, location or condition of the specific asset. If the information is not available, the Group uses alternative
valuation methods such as recent prices on less active markets or discounted cash flow projections. Any gains
and losses arising from changes in the fair value or from the retirement or disposal of an investment property are
recognised in profit or loss in the period in which they arise.
If an item of owner occupied property becomes an investment property because its use has changed, any
difference resulting between the carrying amount and the fair value of this item at the date of transfer is
recognised directly in revaluation reserve within equity.

220 CLP Holdings 2014 Annual Report
NOTES TO THE FINANCIAL STATEMENTS
12. Fixed Assets, Leasehold Land and Land Use Rights under Operating Leases and Investment Property (continued)
Fixed assets, leasehold land and land use rights under operating leases and investment property totalled HK$136,383
million (2013: HK$130,903 million), which included assets under construction with book value of HK$13,776 million (2013:
HK$11,597 million). Movements in the accounts are as follows:
(A) Fixed Assets
Group
Plant, Machinery Land Buildings and Equipment Freehold Leased Owned Leased (note) Owned Leased (note) Total
HK$M HK$M HK$M HK$M HK$M HK$M HK$M
Net book value at 1 January 2013 865 538 13,242 5,617 84,760 27,441 132,463Acquisition of business 62 – – – 17 – 79Sale of a subsidiary – – (74) – (1,578) (178) (1,830)Additions 41 – 964 363 7,542 3,139 12,049Revaluation surplus – 2,055 – – – – 2,055Transfers and disposals (34) (2,073) (190) (7) 5,012 (5,422) (2,714)Depreciation – (14) (323) (358) (3,825) (2,127) (6,647)Impairment charge – – (75) – (3,807) – (3,882)Exchange differences (108) – (71) – (4,058) (460) (4,697)
Net book value at 31 December 2013 826 506 13,473 5,615 84,063 22,393 126,876
Cost 842 601 17,462 12,219 135,460 48,126 214,710Accumulated depreciation and impairment (16) (95) (3,989) (6,604) (51,397) (25,733) (87,834)
Net book value at 31 December 2013 826 506 13,473 5,615 84,063 22,393 126,876
Net book value at 1 January 2014 826 506 13,473 5,615 84,063 22,393 126,876Acquisition of subsidiaries (Note 2) – – 5,544 (5,477) 22,333 (22,206) 194Additions – – 1,178 18 7,379 569 9,144Transfers and disposals (79) (6) 251 (41) (527) (65) (467)Depreciation – (14) (482) (115) (4,432) (678) (5,721)Impairment charge (1) – (180) – (80) – (261)Exchange differences (34) – (132) – (1,465) (1) (1,632)
Net book value at 31 December 2014 712 486 19,652 – 107,271 12 128,133
Cost 727 592 30,932 – 186,235 30 218,516Accumulated depreciation and impairment (15) (106) (11,280) – (78,964) (18) (90,383)
Net book value at 31 December 2014 712 486 19,652 – 107,271 12 128,133
Note: At 31 December 2013, these leased assets included mainly CAPCO’s operational generating plant and associated fixed assets of net book value of HK$27,947 million, which were deployed for the generation of electricity supplied to CLP Power Hong Kong under the Electricity Supply Contract between the two parties. This arrangement was accounted for as finance leases in accordance with HK(IFRIC)-Int 4 and HKAS 17. Following the acquisition of CAPCO as a subsidiary (Note 2), these leased assets have been reclassified as owned assets.
Company
The net book value of fixed assets of the Company was HK$156 million (2013: HK$172 million), comprising mainly
office furniture, fittings and equipment. The additions, disposals and depreciation for the year were HK$29 million
(2013: HK$39 million), HK$1 million (2013: HK$1 million) and HK$44 million (2013: HK$37 million) respectively.

CLP Holdings 2014 Annual Report 221
12. Fixed Assets, Leasehold Land and Land Use Rights under Operating Leases and Investment Property (continued)
(B) Leasehold Land and Land Use Rights under Operating Leases
Group
2014 2013
HK$M HK$M
Net book value at 1 January 1,806 1,866Acquisition of subsidiaries (Note 2) 3,811 –Additions 214 3Amortisation (131) (48)Impairment charge (1) (18)Exchange differences (3) 3
Net book value at 31 December 5,696 1,806
Cost 6,258 2,237Accumulated amortisation and impairment (562) (431)
Net book value at 31 December 5,696 1,806
(C) Investment Property
Group
2014 2013
HK$M HK$M
At 1 January 2,221 –Additions 88 –Revaluation surplus 245 –Transfers – 2,221
At 31 December 2,554 2,221
The Group’s investment property is located at Argyle Street, Kowloon. It was revalued at 31 December 2014 and the
valuations of the property were with reference to an independent valuation prepared by DTZ Debenham Tie Leung
Limited (“DTZ”) based on the highest and best use approach. In formulating the optimal development of the property,
DTZ has taken into account the development constraints stipulated on the covenants of the Government Leases
and subsequent modifications. DTZ has adopted the residual valuation method, which is a modification of income
approach based on discounted cash flows, by making reference to the development potential of the subject property
after deduction of costs for completion of the development. The valuation relies upon a series of assumptions which
produce an estimation of the expected current market value of the property held for development or redevelopment.
These assumptions include the statutory and non-statutory restrictions associated with development that may be
imposed by the Government. Comparable transactions of similar development in the locality were gathered for gross
development value assessment. The valuations are performed and reported twice a year, in line with the Group’s
reporting dates, to management.
The recurring fair value measurement of the Group’s investment property is categorised within Level 3 of the fair
value hierarchy at 31 December 2014. The significant unobservable input used other than assumptions made in
relation to development potential of the property is discount rate, cost of development and estimated return in the
future for the property. The discount rate used is 5% (2013: 4%) and the higher the rate, the lower the fair value of
the property.

222 CLP Holdings 2014 Annual Report
NOTES TO THE FINANCIAL STATEMENTS
12. Fixed Assets, Leasehold Land and Land Use Rights under Operating Leases and Investment Property (continued)
(D) Tenure of Leasehold Land and Land Use Rights
The tenure of leasehold land and land use rights (under finance or operating leases) and investment property of the
Group is as follows:
2014 2013
HK$M HK$M
Held in Hong Kong
On long-term leases (over 50 years) 2,671 2,341
On medium-term leases (10 – 50 years) 5,935 2,063
On short-term leases (less than 10 years) 5 6
8,611 4,410
Held outside Hong Kong
On medium-term leases (10 – 50 years) 125 123
8,736 4,533
13. Goodwill and Other Intangible Assets
Accounting Policy
(A) Goodwill
Goodwill arises on the acquisition of subsidiaries and represents the excess of the consideration transferred, the
amount of any non-controlling interest in the acquiree and the acquisition-date fair value of any previous equity
interest in the acquiree over the fair value of the identifiable net assets acquired.
For the purpose of impairment testing, goodwill acquired in a business combination is allocated to each of the
cash generating units, or groups of cash generating units, that is expected to benefit from the synergies of the
combination. Each unit or group of units to which the goodwill is allocated represents the lowest level within
the entity at which the goodwill is monitored for internal management purposes. Goodwill is monitored at the
operating segment level.
Goodwill impairment reviews are undertaken at least annually or if events or changes in circumstances indicate a
potential impairment. The carrying value of the cash generating unit containing the goodwill is compared to the
recoverable amount, which is the higher of value in use and the fair value less costs of disposal. Any impairment
is recognised immediately as an expense and is not subsequently reversed.
(B) Other intangible assets
Intangible assets other than goodwill are measured initially at cost or, if acquired in a business combination,
fair value at the acquisition date. An intangible asset with a finite useful life is amortised on a straight-line basis
over its useful life of 1 – 34 years or using the unit of production method and carried at cost less accumulated
amortisation and accumulated impairment losses.

CLP Holdings 2014 Annual Report 223
13. Goodwill and Other Intangible Assets (continued)
Capacity
Goodwill (a) Licences (b) Right (c) Others (d) Total
HK$M HK$M HK$M HK$M HK$M
Net carrying value at 1 January 2013 22,225 2,506 – 3,748 28,479
Sale of a subsidiary – – – (112) (112)
Additions – 177 – 967 1,144
Amortisation – (5) – (892) (897)
Impairment charge – (33) – (740) (773)
Exchange differences (3,116) (365) – (513) (3,994)
Net carrying value at 31 December 2013 19,109 2,280 – 2,458 23,847
Cost 19,109 2,458 – 5,500 27,067
Accumulated amortisation and impairment – (178) – (3,042) (3,220)
Net carrying value at 31 December 2013 19,109 2,280 – 2,458 23,847
Net carrying value at 1 January 2014 19,109 2,280 – 2,458 23,847
Acquisition of subsidiaries (Note 2) 5,545 – 5,607 – 11,152
Additions – 198 8 1,081 1,287
Write-off – – – (16) (16)
Amortisation – (3) (181) (755) (939)
Impairment charge (2) (2,223) – – (2,225)
Exchange differences (1,548) (252) – (177) (1,977)
Net carrying value at 31 December 2014 23,104 – 5,434 2,591 31,129
Cost 23,106 2,223 5,615 6,090 37,034
Accumulated amortisation and impairment (2) (2,223) (181) (3,499) (5,905)
Net carrying value at 31 December 2014 23,104 – 5,434 2,591 31,129
Notes:
(a) Goodwill mostly arose from the previous acquisitions of energy retail business in Australia of HK$17,350 million (2013: HK$18,883 million) and the acquisition of CAPCO (Note 2) under Hong Kong electricity business of HK$5,545 million (2013: nil) in current year. In accordance with the Group’s accounting policies, the Group has assessed the recoverable amount of goodwill for the corresponding cash generating units and determined that such goodwill has not been impaired. The recoverable amount of the cash generating units tested for impairment has been determined based on value in use calculations. The value in use calculations use cash flow projections as at 31 December 2014 based on an approved Business Plan which has a forecast covering a period of ten years and necessary updates. Projections for a period of greater than five years have been used on the basis that a longer projection period represents the long dated nature of our generation and electricity supply assets and a more appropriate reflection of future cash flows from anticipated legislative, regulatory and structural changes in the industry.
The key assumptions used in the value in use calculations are as follows:
Energy retail business in Australia
• Electricity pool prices, generation volumes, dispatch levels and gas prices were derived using modelling of the electricity wholesales market. The modelling is prepared internally, where possible, using observable inputs. Given recent changes in market dynamics associated with increased supply, lower customer demand and lower wholesale prices, as a result, various scenarios exist in the long term regarding grid based demand and the potential supply side response. This can have a significant impact on the valuation (refer to “Critical Accounting Estimates and Judgments” No. 3 Assessment of the Carrying Value of Generation Assets in Australia). The modelling used of the electricity wholesale and gas markets is based on past experience and observable market activity.

224 CLP Holdings 2014 Annual Report
NOTES TO THE FINANCIAL STATEMENTS
13. Goodwill and Other Intangible Assets (continued)
Notes (continued):
• Retail prices are sensitive to regulatory changes (i.e. regulation and deregulation of retail tariffs). In absence of any known or expected changes to the current pricing structure, our retail price path assumptions are based on management estimates and expectations on current market conditions and our expectation of regulatory outcomes.
• The electricity and gas volumes for purchases and sales represent the forecast projections in the EnergyAustralia Business Plan. External information was used to verify and align internal estimates.
• Electricity and gas network (distribution) cost assumptions are based on published regulated price paths. When no estimates are available, network costs are assumed to escalate by the relevant Consumer Price Index.
• Customer account numbers growth for electricity and gas aligns with the EnergyAustralia Business Plan.
• Terminal value growth rates have been utilised in estimating cash flows beyond a period of ten years. The terminal growth rate for the current period is 3.0% (2013: 3.0%).
• The cash flow projections are discounted using a pre-tax discount rate of 12.1% (2013: 12.8%). The discount rates reflect the current market assessments of the time value of money and are based on the estimated cost of capital.
It is estimated that adverse changes in key assumptions, in isolation, would lead to the following decreases in recoverable value within the Retail cash generating unit in Australia:
Recoverable Amount
HK$M
Reduction in tariff (1%) (note) (2,160)
Reduction in retail gross margin (2.5%) (note) (1,620)
Increase in discount rate (50 basis points) (1,874)
Note: The reduction in tariff and retail gross margin has only been applied to residential customers only and no change to Commercial and Industrial (C&I) customers.
The sensitivities above are based on a change in an assumption while holding all other assumptions constant. In practice, this is unlikely to occur, and changes in some of the assumptions may be correlated. The recoverable amount of the Retail cash generating unit exceeds its carrying value when applying each of the sensitivities above in isolation.
Hong Kong electricity business
• Goodwill arose from the CAPCO acquisition has been allocated to the CLP Power Hong Kong and CAPCO combined cash generating unit as the acquisition is considered to benefit the whole SoC business.
• The electricity tariff for the supply of electricity in meeting the demand of customers in Hong Kong over the forecast periods is determined with reference to the rate-setting mechanism under the SoC.
• The forecast for electricity demand is based on the load forecast to support local infrastructure development and meeting customer load requirements, maintaining safety and supply reliability, and meeting environmental requirements.
• Expenditure for the supply of electricity in meeting the forecast demand are based on committed purchase contracts where applicable, and inputs on costs trend as specific to the electricity business in Hong Kong. Such forecast aligns with the projection in the Business Plan for our Hong Kong electricity business, with capital expenditures for the period 2014 to 2018 aligning with those forecasted in the approved development plan.
• Terminal value of the cash generating unit is adopted to estimate the cash flows to be generated for the periods beyond ten years. This is expressed as a multiple of net asset values which corresponds to our return model based on fixed assets investment. The terminal value is a multiple of 1.2 times of the net asset values forecasted as at the end of 2024.
• The cash flow projections are discounted using a pre-tax discount rate of 12.05%, or a post-tax discount rate of 9.99% which reflects the SoC return rate applicable to the electricity business in Hong Kong.
(b) The Group has a 20% working level interest in certain petroleum licences giving the Group the right to exploration, extraction and production of petroleum within the licence area located near the town of Narrabri, New South Wales (the Narrabri Coal Seam Gas Project). During the year, additional drilling data and analysis has become available in relation to the Narrabri Coal Seam Gas Project. The key changes from this additional information included delays in the estimated date of output commencing, a reduction in the estimated total gas reserves and a fall in estimated daily production.
These factors, in combination, have caused a substantial decline in value of this investment based on a value in use calculation incorporating a pre-tax weighted average cost of capital of 13.0%. As a result, an impairment provision of HK$2,223 million (A$350 million) (2013: nil) has been recognised. Together with provisions for other related assets, impairment provision for Narrabri Coal Seam Gas Project amounted to HK$2,254 million (A$355 million) or HK$1,578 million (A$248 million) after tax (2013: nil).
(c) Capacity right represents the right to use 50% of the pumped storage capacity of Phase 1 of the Guangzhou Pumped Storage Power Station in Conghua, Guangzhou and the corresponding right to use the associated transmission facilities until 2034. Such right was acquired through the PSDC acquisition in May 2014 (Note 2).
(d) The balance includes contracted customers and other identifiable intangible assets from EnergyAustralia.
A more detailed discussion and explanation on goodwill can be found on our website as part
of our accounting “mini-series”.

CLP Holdings 2014 Annual Report 225
14. Investments in and Advances to Subsidiaries
2014 2013
HK$M HK$M
Unlisted shares, at cost 23,635 23,635
Provision for impairment losses (100) (100)
Advances to subsidiaries, less provisions (note) 27,736 28,815
51,271 52,350
Note: The advances to subsidiaries are unsecured, interest-free and have no fixed repayment terms (Note 33(D)). These advances are considered equity in nature.
Apart from the above advances to subsidiaries which are considered equity in nature, the Company has also made an
advance to CLP Engineering Limited of HK$39 million (2013: HK$39 million), which is interest-free and due on or after 30
June 2016 upon demand. This advance is classified as a long-term receivable in the Company’s financial statements.
The table below lists the principal subsidiaries of the Group at 31 December 2014:
% of Ownership Interest at Place of Issued Share Capital / 31 December Incorporation /Name Registered Capital 2013 and 2014 Business Principal Activity
CLP Power Hong Kong Limited HK$20,400,007,269.65 divided into 100 Hong Kong Generation and
2,488,320,000 ordinary shares Supply of Electricity
Castle Peak Power Company HK$50,000,000 divided into 70 (a),(b) Hong Kong Generation and Sale
Limited 500,000 ordinary shares of Electricity
Hong Kong Pumped Storage HK$10,000,000 divided into 100 (a),(b) Hong Kong / Provision of Pumped
Development Company, Limited 100,000 ordinary shares Mainland China Storage Services
Hong Kong Nuclear Investment HK$300,000,000 divided into 100 Hong Kong / Power Projects
Company Limited 300,000 ordinary shares Mainland China Investment Holding
CLP Engineering Limited HK$49,950,000 divided into 100 Hong Kong Engineering Services
4,995 ordinary shares
CLP Power Asia Limited 1,000 ordinary shares of 100 British Virgin Islands / Power Projects
US$1 each International and Investment Holding
Mainland China
CLP Power China Limited 192,000,000 ordinary shares of 100 (b) British Virgin Islands / Power Projects
US$1 each Mainland China Investment Holding
and Hong Kong
CLP Power International Limited 692,000 ordinary shares of 100 (b) British Virgin Islands / Power Projects
US$1,000 each International Investment Holding
CLP Properties Limited HK$150,000,000 divided into 100 Hong Kong Property Investment
15,000,000 ordinary shares Holding
Accounting Policy No. 3(B)
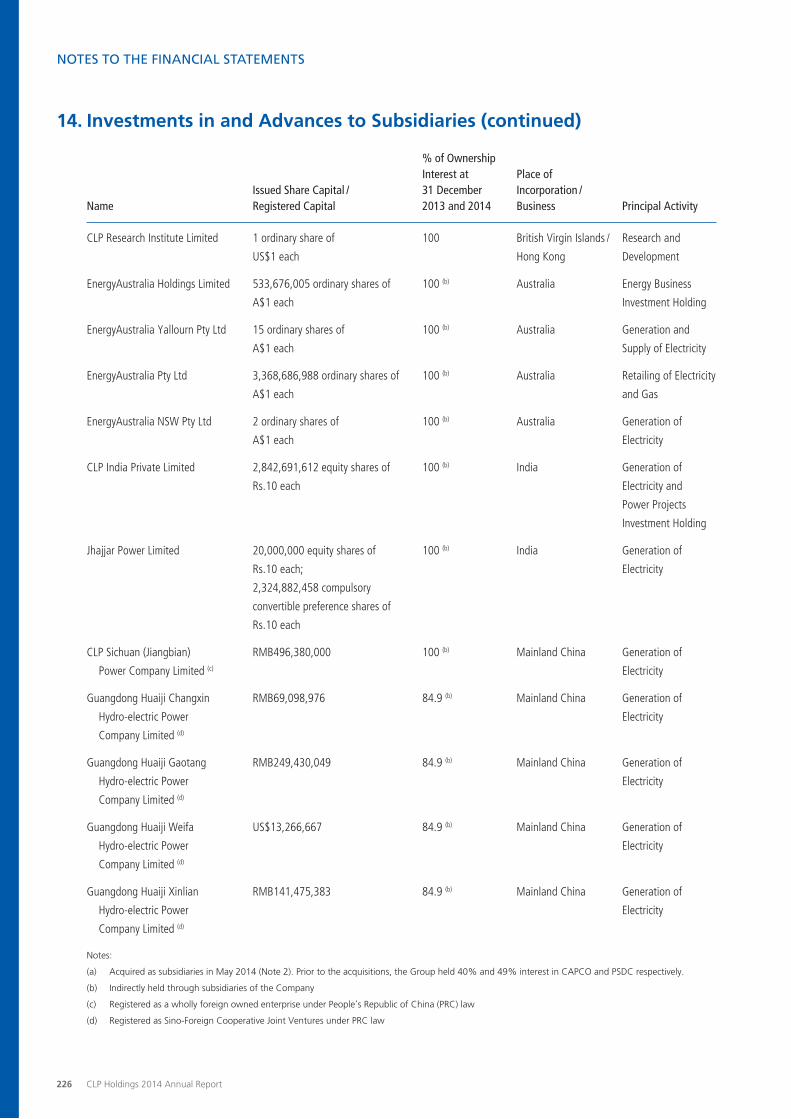
226 CLP Holdings 2014 Annual Report
NOTES TO THE FINANCIAL STATEMENTS
14. Investments in and Advances to Subsidiaries (continued)
% of Ownership Interest at Place of Issued Share Capital / 31 December Incorporation /Name Registered Capital 2013 and 2014 Business Principal Activity
CLP Research Institute Limited 1 ordinary share of 100 British Virgin Islands / Research and
US$1 each Hong Kong Development
EnergyAustralia Holdings Limited 533,676,005 ordinary shares of 100 (b) Australia Energy Business
A$1 each Investment Holding
EnergyAustralia Yallourn Pty Ltd 15 ordinary shares of 100 (b) Australia Generation and
A$1 each Supply of Electricity
EnergyAustralia Pty Ltd 3,368,686,988 ordinary shares of 100 (b) Australia Retailing of Electricity
A$1 each and Gas
EnergyAustralia NSW Pty Ltd 2 ordinary shares of 100 (b) Australia Generation of
A$1 each Electricity
CLP India Private Limited 2,842,691,612 equity shares of 100 (b) India Generation of
Rs.10 each Electricity and
Power Projects
Investment Holding
Jhajjar Power Limited 20,000,000 equity shares of 100 (b) India Generation of
Rs.10 each; Electricity
2,324,882,458 compulsory
convertible preference shares of
Rs.10 each
CLP Sichuan (Jiangbian) RMB496,380,000 100 (b) Mainland China Generation of
Power Company Limited (c) Electricity
Guangdong Huaiji Changxin RMB69,098,976 84.9 (b) Mainland China Generation of
Hydro-electric Power Electricity
Company Limited (d)
Guangdong Huaiji Gaotang RMB249,430,049 84.9 (b) Mainland China Generation of
Hydro-electric Power Electricity
Company Limited (d)
Guangdong Huaiji Weifa US$13,266,667 84.9 (b) Mainland China Generation of
Hydro-electric Power Electricity
Company Limited (d)
Guangdong Huaiji Xinlian RMB141,475,383 84.9 (b) Mainland China Generation of
Hydro-electric Power Electricity
Company Limited (d)
Notes:
(a) Acquired as subsidiaries in May 2014 (Note 2). Prior to the acquisitions, the Group held 40% and 49% interest in CAPCO and PSDC respectively.
(b) Indirectly held through subsidiaries of the Company
(c) Registered as a wholly foreign owned enterprise under People’s Republic of China (PRC) law
(d) Registered as Sino-Foreign Cooperative Joint Ventures under PRC law

CLP Holdings 2014 Annual Report 227
14. Investments in and Advances to Subsidiaries (continued)
Summarised financial information for the year ended 31 December 2014 of CAPCO, which has material non-controlling
interests, is set out below:
HK$M
Results for the year
Revenue 15,510
Profit for the year 3,115
Other comprehensive income for the year (2)
Total comprehensive income for the year 3,113
Dividends paid to non-controlling interests 683
Net assets
Non-current assets 29,262
Current assets 5,820
Current liabilities (28,926)
Non-current liabilities (5,186)
970
Cash flows
Net cash inflow from operating activities 3,346
Net cash outflow from investing activities (20)
Net cash outflow from financing activities (3,326)
Net change in cash and cash equivalents –
15. Interests in Joint Ventures
2014 2013
HK$M HK$M
Share of net assets 10,121 10,186
Goodwill 47 162
Carrying amounts 10,168 10,348
Advances (a) 103 9,592
Loan (b) 905 –
11,176 19,940
Notes:
(a) Advances to joint ventures are unsecured, interest-free and have no fixed repayment terms. These advances are considered equity in nature.
(b) Loan to a joint venture is unsecured, carries interest at 90% of the People’s Bank of China’s over five years Renminbi benchmark lending rate (2013: nil) and with final maturity in September 2022. The current portion of the loan of HK$94 million (2013: nil) was included in other receivables.
Accounting Policy No. 3(C)

228 CLP Holdings 2014 Annual Report
NOTES TO THE FINANCIAL STATEMENTS
15. Interests in Joint Ventures (continued)
The Group’s interests in joint ventures are analysed as follows:
2014 2013
Share of Advances Share of
Net Assets Goodwill and loan Total Net Assets Goodwill Advances Total
HK$M HK$M HK$M HK$M HK$M HK$M HK$M HK$M
CAPCO (Note 2) – – – – 199 – 9,178 9,377
CSEC Guohua
and Shenmu (A) 2,741 – – 2,741 3,142 114 – 3,256
ShenGang Natural Gas
Pipeline Company
Limited (B) 611 – 905 1,516 – – – –
CLP Guangxi
Fangchenggang
Power Company
Limited
(Fangchenggang) (C) 1,443 – – 1,443 1,767 – – 1,767
OneEnergy Taiwan Ltd
(OneEnergy Taiwan) (D) 1,473 – – 1,473 1,340 – 192 1,532
Shandong Zhonghua
Power Company,
Limited (SZPC) (E) 1,036 – – 1,036 1,044 – – 1,044
PSDC (Note 2) – – – – 13 – 69 82
Others (F) 2,817 47 103 2,967 2,681 48 153 2,882
10,121 47 1,008 11,176 10,186 162 9,592 19,940

CLP Holdings 2014 Annual Report 229
15. Interests in Joint Ventures (continued)
Summarised financial information of significant joint ventures and the Group’s share of results and net assets are as
follows:
For year ended 31 December 2014
Fangcheng- OneEnergy
CAPCO (a) gang SZPC Taiwan Others Total
HK$M HK$M HK$M HK$M HK$M HK$M
Revenue 4,539 2,288 8,403 – 2,249 17,479
Depreciation and amortisation (28) (185) (947) – (802) (1,962)
Interest income – 16 6 – 22 44
Interest expense (5) (180) (326) (2) (502) (1,015)
Other expenses (3,268) (1,333) (5,062) (1) (533) (10,197)
Share of results of joint ventures – – – 530 – 530
Profit before income tax 1,238 606 2,074 527 434 4,879
Income tax expense (211) (143) (564) – (67) (985)
Profit for the year 1,027 463 1,510 527 367 3,894
Other comprehensive income (2) – – 2 (67) (67)
Total comprehensive income 1,025 463 1,510 529 300 3,827
Group’s share
Profit for the year (b) 411 324 444 264 119 1,562
Other comprehensive income (1) – – 1 (50) (50)
Total comprehensive income 410 324 444 265 69 1,512
Dividends from joint ventures 145 607 406 45 293 1,496
Notes:
(a) The share of results of CAPCO related to the period from 1 January 2014 to 12 May 2014 (prior to acquisition as a subsidiary).
(b) The Group’s share of results of joint ventures included impairment provision for a joint venture in Australia of HK$59 million (2013: CSEC Guohua and Shenmu of HK$297 million).

230 CLP Holdings 2014 Annual Report
NOTES TO THE FINANCIAL STATEMENTS
15. Interests in Joint Ventures (continued)
For year ended 31 December 2013
CSEC
Guohua and Fangcheng- OneEnergy
CAPCO Shenmu gang SZPC Taiwan Others Total
HK$M HK$M HK$M HK$M HK$M HK$M HK$M
Revenue 14,865 17,026 2,975 8,607 – 2,558 46,031
Depreciation and amortisation (83) (859) (181) (914) – (758) (2,795)
Interest income – 1 12 8 – 9 30
Interest expense (16) (505) (193) (349) (6) (452) (1,521)
Other expenses (11,042) (14,406) (1,742) (5,809) (5) (576) (33,580)
Share of results of joint ventures – – – – 456 – 456
Profit before income tax 3,724 1,257 871 1,543 445 781 8,621
Income tax expense (638) (571) – (438) – (144) (1,791)
Non-controlling interests – (679) – – – – (679)
Profit for the year 3,086 7 871 1,105 445 637 6,151
Other comprehensive income 4 – – – 5 276 285
Total comprehensive income 3,090 7 871 1,105 450 913 6,436
Group’s share
Profit for the year 1,234 12 610 325 222 268 2,671
Other comprehensive income 2 – – – 2 255 259
Total comprehensive income 1,236 12 610 325 224 523 2,930
Dividends from joint ventures 1,258 65 639 289 15 276 2,542

CLP Holdings 2014 Annual Report 231
15. Interests in Joint Ventures (continued)
At 31 December 2014
CSEC
Guohua and Fangcheng- OneEnergy
Shenmu gang SZPC Taiwan Others Total
HK$M HK$M HK$M HK$M HK$M HK$M
Non-current assets 28,427 5,706 9,219 2,942 17,972 64,266
Cash and cash equivalents 17 444 481 4 1,064 2,010
Other current assets 3,791 561 890 – 1,055 6,297
Current financial liabilities
(excluding trade and other payables) (7,913) (261) (2,309) – (1,659) (12,142)
Other current liabilities (4,224) (1,687) (923) (1) (1,103) (7,938)
Non-current financial liabilities
(excluding trade and other payables) (3,116) (2,668) (3,796) – (6,101) (15,681)
Other non-current liabilities (1,378) (33) (37) – (257) (1,705)
Shareholders’ loans – – – – (2,672) (2,672)
Non-controlling interests (6,469) – – – – (6,469)
Net assets 9,135 2,062 3,525 2,945 8,299 25,966
Group’s share of net assets 2,741 1,443 1,036 1,473 3,428 10,121
Goodwill – – – – 47 47
Carrying amounts 2,741 1,443 1,036 1,473 3,475 10,168
Advances and loan – – – – 1,008 1,008
2,741 1,443 1,036 1,473 4,483 11,176

232 CLP Holdings 2014 Annual Report
NOTES TO THE FINANCIAL STATEMENTS
15. Interests in Joint Ventures (continued)
At 31 December 2013
CSEC
Guohua and Fangcheng- OneEnergy
CAPCO Shenmu gang SZPC Taiwan Others Total
HK$M HK$M HK$M HK$M HK$M HK$M HK$M
Non-current assets 28,346 31,834 5,118 9,915 3,042 15,466 93,721
Cash and cash equivalents – 40 1,311 242 25 634 2,252
Other current assets 6,476 3,584 665 849 2 1,243 12,819
Current financial liabilities
(excluding trade and other
payables) (5,077) (8,415) (267) (2,398) – (1,127) (17,284)
Other current liabilities (1,516) (2,659) (1,275) (421) (4) (123) (5,998)
Non-current financial liabilities
(excluding trade and other
payables) (800) (5,767) (2,995) (4,598) – (7,765) (21,925)
Other non-current liabilities (3,987) (1,593) (32) (40) – (1,192) (6,844)
Shareholders’ loans (22,946) – – – (384) (648) (23,978)
Non-controlling interests – (6,775) – – – – (6,775)
Net assets 496 10,249 2,525 3,549 2,681 6,488 25,988
Group’s share of net assets 199 3,142 1,767 1,044 1,340 2,694 10,186
Goodwill – 114 – – – 48 162
Carrying amounts 199 3,256 1,767 1,044 1,340 2,742 10,348
Advances 9,178 – – – 192 222 9,592
9,377 3,256 1,767 1,044 1,532 2,964 19,940
2014 2013
HK$M HK$M
Share of capital commitments 3,999 1,956
Share of contingent liabilities 60 61
The Group’s capital commitments in relation to its interests in joint ventures are disclosed in Note 32.

CLP Holdings 2014 Annual Report 233
15. Interests in Joint Ventures (continued)
Details of the joint ventures are summarised below:
(A) CSEC Guohua, a joint stock company with 70% of its registered capital owned by China Shenhua Energy Company
Limited and 30% owned by the Group, is incorporated in Mainland China. It holds interests in five coal-fired power
stations, namely Beijing Yire Power Station in Beijing, Panshan Power Station in Tianjin, Sanhe Power Station in Hebei,
Zhungeer Power Station in Inner Mongolia and Suizhong Power Station in Liaoning, with a combined capacity of
7,680MW.
Shenmu is incorporated in Mainland China and 49% of its registered capital is owned by the Group. This company
holds an interest in a coal-fired power station, Shenmu Power Station, with an installed capacity of 220MW.
On 2 April 2014, the Group entered into a share transfer agreement (the Agreement) with a third party to sell the
entire issued share capital and all related shareholder’s loans of CLP Power China (Tianjin) Limited (CLP China Tianjin)
and CLP Power China (Shenmu) Limited (CLP China Shenmu) for a cash consideration of US dollar equivalent of
RMB2,250 million (HK$2,808 million).
It was a condition under the Agreement that CLP China Tianjin would undergo an internal restructuring before
completion of the disposal so that it would own 30% of the registered capital of CSEC Guohua upon completion
of the internal restructuring. CLP China Shenmu owns 49% of the registered capital of Shenmu. Completion of the
sale was subject to the internal shareholding restructuring which in turn required corporate and regulatory approvals,
which should take place not later than 31 December 2014. According to the provisions of the Agreement, the Group
considered that it lost joint control over the joint ventures of CSEC Guohua and Shenmu. Accordingly, the aggregate
interests in these joint ventures were reclassified as other current assets.
Subsequently, however, as of 31 December 2014 the internal restructuring was not completed because certain
regulatory registration procedures remained outstanding and no extension of the completion date of the Agreement
was agreed by the Group and the purchaser. In accordance with the terms of the Agreement, the Agreement lapsed
on 31 December 2014. As a result, the Group regained joint control of CSEC Guohua and Shenmu and the aggregate
interests in CSEC Guohua and Shenmu of HK$2,741 million were reclassified from other current assets to interests in
joint ventures with no effect on profit or loss.
The Group had received from the purchaser a deposit of US$36.5 million (HK$283 million). According to the terms
of the Agreement, the Group shall refund the deposit to the purchaser without interest and without any additional
liability. The deposit was subsequently refunded to the purchaser in January 2015.
(B) ShenGang Natural Gas Pipeline Company Limited is incorporated in Mainland China and 40% of its registered capital
is owned by the Group. This company owns and operates a 20 km pipeline and the associated gas launching and end
stations (the Hong Kong Branch Line) which transports natural gas from PetroChina’s Second West-East Gas Pipeline in
Shenzhen Dachan Island to Black Point Power Station in Hong Kong.
(C) Fangchenggang is incorporated in Mainland China and 70% of its registered capital is owned by the Group. This
company owns and operates a 1,260MW coal-fired power station and two 660MW ultra-supercritical coal-fired units
under construction in Guangxi. All power generated is for supply to the Guangxi power grid.
Under the joint venture agreement, none of the joint venture partners has unilateral control over the economic
activities of Fangchenggang and hence, the Group’s interest is accounted for as a joint venture.
(D) OneEnergy Taiwan is incorporated in the British Virgin Islands and 50% of its ordinary share capital is owned by each
of Mitsubishi Corporation of Japan and the Group. This company owns a 40% interest in Ho-Ping Power Company.

234 CLP Holdings 2014 Annual Report
NOTES TO THE FINANCIAL STATEMENTS
15. Interests in Joint Ventures (continued)
(E) SZPC is incorporated in Mainland China and 29.4% of its registered capital is owned by the Group. This company
owns four coal-fired power stations, namely Shiheng I, Shiheng II, Heze II and Liaocheng, with a combined installed
capacity of 3,060MW. All power generated is for supply to the Shandong power grid.
(F) The Group’s other investments include the following key projects:
• 33.3% interest in the ordinary share capital of Natural Energy Development Co., Ltd., which is incorporated in
Thailand and owns a solar farm in Lopburi Province in Central Thailand, with an installed capacity of 63MW;
• 51% interest in the registered capital of Jinchang Zhenxin PV Power Company Limited, which is incorporated in
Mainland China and owns Jinchang Solar Power Station, with an installed capacity of 85MW in Gansu; and
• 49% interests in the registered capital of various Chinese joint ventures at a carrying amount of HK$1,342 million
(2013: HK$1,379 million) in aggregate. These joint ventures are incorporated in Mainland China and hold interests
in various wind power stations in Shandong and Jilin, with a total installed capacity of 593MW.
16. Interest in an Associate
The balance represents the Group’s share of net assets of Guangdong Nuclear Power Joint Venture Company, Limited
(GNPJVC) at the end of the reporting period.
GNPJVC is unlisted, incorporated and operates in Mainland China, and its registered capital is 25% owned by the Group
and 75% owned by Guangdong Nuclear Investment Company, Limited. GNPJVC constructed and operates the Guangdong
Daya Bay Nuclear Power Station and its principal activity is the generation of electricity for supply to Hong Kong and
Guangdong Province.
Summarised financial information of GNPJVC and the Group’s share of results and net assets are as follows:
2014 2013
HK$M HK$M
Revenue 7,165 6,829
Profit and total comprehensive income 3,184 2,447
Group’s share of profit and total comprehensive income 796 612
Dividends from an associate 1,685 793
Non-current assets 3,060 2,204
Current assets 8,235 9,417
Current liabilities (4,766) (1,731)
Non-current liabilities (3,384) (3,189)
Net assets 3,145 6,701
Group’s share of net assets 786 1,675
At 31 December 2014, the Group’s share of capital commitments of its associate was HK$227 million (2013: HK$194
million).
Accounting Policy No. 3(C)

CLP Holdings 2014 Annual Report 235
17. Finance Lease Receivables
Minimum Lease Present Value of Payments Minimum Lease Payments
2014 2013 2014 2013
HK$M HK$M HK$M HK$M
Amounts receivable under finance leases
Within one year 177 187 50 49
After one year but within five years 1,234 1,470 898 989
1,411 1,657 948 1,038
Less: unearned finance income (463) (619)
Present value of minimum lease payments receivable 948 1,038
Analysed as:
Current (recoverable within 12 months) 50 49
Non-current (recoverable after 12 months) 898 989
948 1,038
The finance lease receivables, accounted for as finance lease in accordance with HK(IFRIC)-Int 4 and HKAS 17, relate to
the 20-year power purchase agreement under which CLP India sells all of its electricity output of Paguthan to its off-taker,
Gujarat Urja Vikas Nigam Limited (GUVNL). The effective interest rate implicit in the finance lease is approximately 13.4%
for both 2014 and 2013. The carrying amounts of the finance lease receivables approximate to their fair values.
Accounting Policy No. 11

236 CLP Holdings 2014 Annual Report
NOTES TO THE FINANCIAL STATEMENTS
18. Derivative Financial Instruments
2014 2013
Assets Liabilities Assets Liabilities
HK$M HK$M HK$M HK$M
Cash flow hedges (note)
Forward foreign exchange contracts 855 55 1,339 32
Foreign exchange options 74 – 89 –
Cross currency interest rate swaps 2,124 1,310 1,399 649
Interest rate swaps 66 1,031 194 638
Energy contracts 22 112 176 263
Fair value hedges
Cross currency interest rate swaps 257 417 250 940
Interest rate swaps 18 122 18 192
Held for trading or not qualifying as accounting hedges
Forward foreign exchange contracts 79 62 104 18
Interest rate swaps 37 24 77 74
Energy contracts 247 638 477 1,913
3,779 3,771 4,123 4,719
Analysed as:
Current 659 709 1,005 1,279
Non-current 3,120 3,062 3,118 3,440
3,779 3,771 4,123 4,719
Recall our accounting “mini-series” on derivatives and hedging?
Please visit our website. Although termed “held for trading or not qualifying as
accounting hedges” above, these derivatives are used as
“economic hedges” or for the purpose of understanding energy
price movements.
Note: Derivative financial instruments qualifying as cash flow hedges at 31 December 2014 have a maturity of up to 14 years (2013: 15 years) from the end of the reporting period.
The maturities of the derivative financial instruments used for hedging will correlate to the timing of the cash flows associated with the corresponding hedged items. As for the energy contracts that are hedges of anticipated future purchases and sales of electricity (cash flow hedge), any unrealised gains or losses on the contracts recognised are deferred in the hedging reserve (through other comprehensive income) and reclassified to profit or loss, as an adjustment to purchased electricity expense or the billed electricity revenue, when the hedged purchase or sale is recognised.
The notional principal amounts of the outstanding derivative financial instruments are as follows:
2014 2013
HK$M HK$M
Forward foreign exchange contracts 100,234 105,081
Foreign exchange options 692 752
Interest rate swaps / cross currency interest rate swaps 46,820 49,289
Energy contracts 12,196 18,003
The maximum exposure to credit risk at the reporting date is the carrying value of the financial instruments.
Accounting Policy No. 5

CLP Holdings 2014 Annual Report 237
19. Available-for-sale Investments
Accounting Policy
Available-for-sale investments are non-derivative financial assets that are either designated in that category or not
classified in any of the other categories of financial instruments including financial assets at fair value through profit or
loss, loans and receivables, and held-to-maturity financial assets. Purchases and sales of financial assets are recognised
on their trade date – the date on which the Group commits to purchase or sell the asset. They are initially recognised
at fair value plus transaction costs and are subsequently carried at fair value.
Changes in the fair value of monetary investments denominated in a foreign currency and classified as available-for-
sale are analysed between translation differences resulting from changes in amortised cost of the investment and other
changes in the carrying amount of the investment. The translation differences on monetary investments are recognised
in profit or loss; translation differences on non-monetary investments are recognised in other comprehensive income.
Changes in the fair value of monetary and non-monetary investments classified as available-for-sale are recognised in
other comprehensive income. When an investment classified as available-for-sale is sold or impaired, the accumulated
fair value adjustments recognised in equity are included in profit or loss.
Dividends on available-for-sale equity investments are recognised in profit or loss when the Group’s right to receive
payments is established.
The Group assesses at the end of each reporting period whether there is objective evidence that an available-for-
sale investment is impaired. A significant or prolonged decline in the fair value of an equity investment below its cost
is evidence that the asset is impaired. If any such evidence exists, the cumulative loss – measured as the difference
between the acquisition cost and the current fair value, less any impairment loss on that investment previously
recognised in profit or loss – is removed from equity and recognised in profit or loss. Impairment losses recognised in
profit or loss on equity investments are not reversed through profit or loss.
Available-for-sale investments are classified as non-current assets unless management intend to dispose of the
investment within 12 months of the end of the reporting period.
The Group’s available-for-sale investments are analysed as follows:
2014 2013
HK$M HK$M
CGN Wind Power Company Limited (CGN Wind) 1,190 1,190
Others 517 73
1,707 1,263
In accordance with the Group’s accounting policy, the unquoted investment in CGN Wind, which is denominated in
Renminbi, is treated for accounting purpose as an available-for-sale investment.
Although termed “available-for-sale” by the accounting standard, investments in this category
are generally held for the long-term.

238 CLP Holdings 2014 Annual Report
NOTES TO THE FINANCIAL STATEMENTS
20. Trade and Other Receivables
Accounting Policy
Trade and other receivables are recognised initially at fair value and subsequently measured at amortised cost using
the effective interest method, less provision for impairment. A provision for impairment of trade and other receivables
is established when there is objective evidence that the Group will not be able to collect all amounts due according
to the original terms of the receivables. Significant financial difficulties of the debtors, probability that the debtor will
enter into bankruptcy or financial reorganisation, and default or delinquency in payments are considered indicators
that the trade receivable is impaired. The amount of the provision is the difference between the asset’s carrying
amount and the present value of estimated future cash flows, discounted at the original effective interest rate. The
carrying amount of the assets is reduced through the use of an allowance account, and the amount of the loss is
recognised in profit or loss. When a trade receivable is uncollectable, it is written off against the allowance account for
trade receivables. Subsequent recoveries of amounts previously written off are recognised in profit or loss.
Group Company
2014 2013 2014 2013
HK$M HK$M HK$M HK$M
Trade receivables (a) 11,040 13,864 – –
Deposits, prepayments and other receivables 2,566 3,187 27 29
Dividend receivables from (b)
Joint ventures 1,127 760 – –
An associate 785 – – –
An available-for-sale investment 64 82 – –
Current accounts with (b)
Subsidiaries – – 27 26
Joint ventures 136 58 – –
An associate 1 2 – –
15,719 17,953 54 55
Trade and other receivables attributed to overseas subsidiaries amounted to HK$11,686 million (2013: HK$14,906 million).
At 31 December 2014, CLP India has obtained payment for some of its receivables from GUVNL through bill discounting
with recourse amounted to HK$123 million (2013: HK$88 million) and the transactions have been accounted for as
collateralised borrowings (Note 23).
The maximum exposure to credit risk at the reporting date is the carrying value of each class of receivable. Further
information relating to credit risk is set out under Financial Risk Management.
Notes:
(a) Trade receivables
17% (2013: 15%) and 62% (2013: 69%) of the gross trade receivables relate to sales of electricity in Hong Kong and sales of electricity and gas in Australia respectively. There is no significant concentration of credit risk with respect to these trade receivables as the customer bases are widely dispersed in different sectors and industries. The trade receivables in currencies other than Hong Kong dollar are denominated in the functional currencies of the respective overseas entities.
The Group has established credit policies for customers in each of its retail businesses. CLP Power Hong Kong’s credit policy in respect of receivables arising from its principal electricity business is to allow customers to settle their electricity bills within two weeks after issue. Customers’ receivable balances are generally secured by cash deposits or bank guarantees from customers for an amount not exceeding the highest expected charge for 60 days of consumption. At 31 December 2014, such cash deposits amounted to HK$4,652 million (2013: HK$4,503 million) and the bank guarantees stood at HK$883 million (2013: HK$867 million). The customer deposits are repayable on demand, bear interest at the HSBC bank savings rate and their carrying value approximates to their fair value. Impairment provisions on trade receivables are recognised on an individual basis once a receivable is more than 90 days overdue and are calculated by reference to the historical past due recovery pattern together with any customer deposits held. For subsidiaries outside Hong Kong, the credit terms for trade receivables range from about 14 to 90 days.

CLP Holdings 2014 Annual Report 239
20. Trade and Other Receivables (continued)
Notes (continued):
(a) Trade receivables (continued)
EnergyAustralia determines its doubtful debt provisioning by grouping together trade receivables with similar credit risk characteristics and collectively assessing them for likelihood of recovery, taking into account prevailing economic conditions. Future cash flows for each group of trade receivables are estimated on the basis of historical loss experience, adjusted to reflect the effects of current conditions. As a result of this credit risk assessment, virtually all of the credit risk groupings have been subject to some level of impairment. Receivable balances relating to known insolvencies are individually impaired. At 31 December 2014, EnergyAustralia held cash deposits of HK$1 million (2013: HK$3 million) in relation to outstanding receivable balances.
The ageing analysis of trade receivables at 31 December based on due date is as follows:
2014 2013
Provision Provision Not Subject to for Not Subject to for impaired impairment impairment Total impaired impairment impairment Total
HK$M HK$M HK$M HK$M HK$M HK$M HK$M HK$M
Not yet due 7,618 727 (56) 8,289 9,412 1,665 (88) 10,989
Overdue
1 − 30 days 123 786 (71) 838 181 905 (67) 1,019
31 − 90 days 129 622 (144) 607 196 782 (167) 811
Over 90 days 745 1,699 (1,138) 1,306 626 1,481 (1,062) 1,045
8,615 3,834 (1,409) 11,040 10,415 4,833 (1,384) 13,864
At 31 December 2014, trade receivables of HK$997 million (2013: HK$1,003 million) were past due but not considered impaired. These related to:
• a number of customers for whom there had been no recent history of default;
• an amount deducted by GUVNL from the past invoices of CLP India netted with refund totalled HK$406 million (Rs.3,306 million) (2013: HK$415 million (Rs.3,306 million)) (Note 34(A)) which is included in the amount aged over 90 days; and
• disputed charges between Jhajjar Power Limited (Jhajjar) and its off-takers. Total disputed amounts were HK$212 million (Rs.1,725 million) at 31 December 2014 (2013: HK$180 million (Rs.1,433 million)), of which HK$206 million (Rs.1,682 million) (2013: HK$101 million (Rs.803 million)) aged over 90 days (Note 34(C)).
According to the accounting standard requirement, when certain receivables are individually
impaired, they are written off directly from the books or through the use of an allowance
account. If no objective evidence of impairment exists for individual receivables, they are
included in a group of receivables with similar credit risk characteristics and collectively
assessed for impairment. The amounts under the caption “Subject to impairment” mainly relate
to EnergyAustralia and are assessed for impairment under this collective approach.
The ageing analysis of trade receivables at 31 December based on invoice date is as follows:
2014 2013
HK$M HK$M
30 days or below 8,596 11,366
31 − 90 days 976 1,292
Over 90 days 1,468 1,206
11,040 13,864

240 CLP Holdings 2014 Annual Report
NOTES TO THE FINANCIAL STATEMENTS
20. Trade and Other Receivables (continued)
Notes (continued):
(a) Trade receivables (continued)
Movements in the provision for impairment are as follows:
2014 2013
HK$M HK$M
Balance at 1 January 1,384 1,117
Provision for impairment 763 1,098
Receivables written off during the year as uncollectable (609) (698)
Amounts reversed (27) (1)
Exchange differences (102) (132)
Balance at 31 December 1,409 1,384
“Ageing analysis based on invoice date” is presented to meet the reporting requirements under
the Listing Rules of the Hong Kong Stock Exchange, whereas “ageing analysis based on due
date” is disclosed in accordance with the requirements of HKFRS.
Invoice date = Date of issue of an invoice
Due date = Invoice date + credit period granted to customers
(b) The amounts receivable from subsidiaries, joint ventures and an associate are unsecured, interest-free and have no fixed repayment terms.
21. Bank Balances, Cash and Other Liquid Funds
Accounting Policy
Cash and cash equivalents comprise cash at banks and on hand, demand deposits with banks and other financial
institutions, short-term highly liquid investments that are readily convertible to cash, subjected to insignificant risk
of change in value and with a maturity of three months or less from date of investment, and bank overdrafts. Bank
overdrafts are shown within borrowings in current liabilities on the statement of financial position.
2014 2013
HK$M HK$M
Trust accounts restricted under TRAA (note) 355 449
Bank deposits 2,424 3,068
Bank balances and cash 1,614 1,716
4,393 5,233
Note: Pursuant to Trust and Retention Account Agreements (TRAA) of CLP India and its subsidiaries with their corresponding lenders, various trust accounts are set up for designated purposes.
The Group’s bank balances, cash and other liquid funds denominated in the currencies other than the functional currency
of the respective entities amounted to HK$1,185 million (2013: HK$1,869 million) which was mostly denominated in
Renminbi (2013: Renminbi).
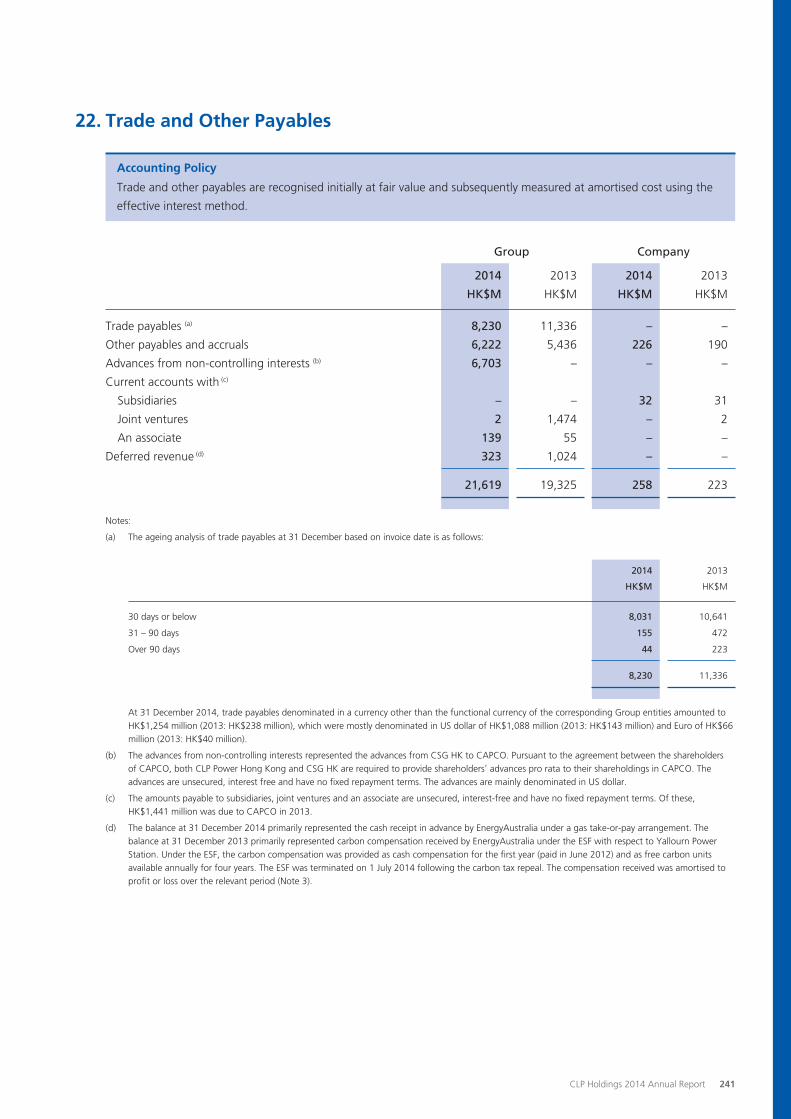
CLP Holdings 2014 Annual Report 241
22. Trade and Other Payables
Accounting Policy
Trade and other payables are recognised initially at fair value and subsequently measured at amortised cost using the
effective interest method.
Group Company
2014 2013 2014 2013
HK$M HK$M HK$M HK$M
Trade payables (a) 8,230 11,336 – –
Other payables and accruals 6,222 5,436 226 190
Advances from non-controlling interests (b) 6,703 – – –
Current accounts with (c)
Subsidiaries – – 32 31
Joint ventures 2 1,474 – 2
An associate 139 55 – –
Deferred revenue (d) 323 1,024 – –
21,619 19,325 258 223
Notes:
(a) The ageing analysis of trade payables at 31 December based on invoice date is as follows:
2014 2013
HK$M HK$M
30 days or below 8,031 10,641
31 – 90 days 155 472
Over 90 days 44 223
8,230 11,336
At 31 December 2014, trade payables denominated in a currency other than the functional currency of the corresponding Group entities amounted to HK$1,254 million (2013: HK$238 million), which were mostly denominated in US dollar of HK$1,088 million (2013: HK$143 million) and Euro of HK$66 million (2013: HK$40 million).
(b) The advances from non-controlling interests represented the advances from CSG HK to CAPCO. Pursuant to the agreement between the shareholders of CAPCO, both CLP Power Hong Kong and CSG HK are required to provide shareholders’ advances pro rata to their shareholdings in CAPCO. The advances are unsecured, interest free and have no fixed repayment terms. The advances are mainly denominated in US dollar.
(c) The amounts payable to subsidiaries, joint ventures and an associate are unsecured, interest-free and have no fixed repayment terms. Of these, HK$1,441 million was due to CAPCO in 2013.
(d) The balance at 31 December 2014 primarily represented the cash receipt in advance by EnergyAustralia under a gas take-or-pay arrangement. The balance at 31 December 2013 primarily represented carbon compensation received by EnergyAustralia under the ESF with respect to Yallourn Power Station. Under the ESF, the carbon compensation was provided as cash compensation for the first year (paid in June 2012) and as free carbon units available annually for four years. The ESF was terminated on 1 July 2014 following the carbon tax repeal. The compensation received was amortised to profit or loss over the relevant period (Note 3).

242 CLP Holdings 2014 Annual Report
NOTES TO THE FINANCIAL STATEMENTS
23. Bank Loans and Other Borrowings
Accounting Policy
Borrowings are recognised initially at fair value of proceeds received, net of transaction costs incurred. Transaction
costs are incremental costs that are directly attributable to the acquisition or issue of a financial liability. Borrowings
are subsequently stated at amortised cost. Any difference between the proceeds (net of transaction costs) and the
redemption value is amortised to profit or loss or capitalised as cost of the qualifying assets over the period of the
borrowings using the effective interest method. Borrowings are classified as current liabilities unless the Group has an
unconditional right to defer settlement of the liability for at least 12 months after the end of the reporting period.
Group Company
2014 2013 2014 2013
HK$M HK$M HK$M HK$M
Current
Short-term bank loans 4,908 1,296 – 816
Long-term bank loans 3,070 4,442 – –
Other long-term borrowings
Medium Term Note (MTN) programme (HKD)
due 2014 and 2015 1,340 1,380 – –
MTN programme (AUD) due 2015 318 – – –
9,636 7,118 – 816
Non-current
Long-term bank loans 28,320 19,471 – 600
Other long-term borrowings
MTN programme (USD) due 2020 to 2027 10,731 10,295 – –
MTN programme (HKD) due 2016 to 2041 9,075 8,895 – –
MTN programme (JPY) due 2021 to 2026 2,022 2,289 – –
MTN programme (AUD) due 2015 to 2023 698 1,104 – –
US private placement notes (USD) due 2017 to 2027 6,953 6,879 – –
57,799 48,933 – 600
Total borrowings 67,435 56,051 – 1,416
Total borrowings included secured liabilities (bank loans and collateralised borrowings) of HK$11,969 million (2013:
HK$11,782 million), analysed as follows:
2014 2013
HK$M HK$M
CLP India and its subsidiaries (a) 8,656 8,325
Subsidiaries in Mainland China (b) 3,313 3,457
11,969 11,782

CLP Holdings 2014 Annual Report 243
23. Bank Loans and Other Borrowings (continued)
Notes:
(a) Bank loans for CLP India and its subsidiaries are secured by fixed and floating charges over their immovable and moveable properties with total carrying amounts of HK$13,937 million (2013: HK$14,089 million). Collateralised borrowings for CLP India were secured by trade receivables, the carrying amounts of which were HK$123 million (2013: HK$88 million).
(b) Bank loans for subsidiaries in Mainland China are secured by rights of receipt of tariff, fixed assets and land use rights, with the carrying amounts of these fixed assets and land use rights of HK$4,924 million (2013: HK$5,434 million).
Bank loans and other borrowings totalling HK$26,791 million (2013: HK$26,342 million) were attributed to overseas
subsidiaries and are non-recourse to the Company.
At 31 December 2014, the Group’s bank loans and other borrowings were repayable as follows:
Bank Loans Other Borrowings Total
2014 2013 2014 2013 2014 2013
HK$M HK$M HK$M HK$M HK$M HK$M
Within one year 7,978 5,738 1,658 1,380 9,636 7,118
Between one and two years 8,273 5,271 1,000 1,686 9,273 6,957
Between two to five years 14,072 7,477 3,631 2,721 17,703 10,198
Over five years 5,975 6,723 24,848 25,055 30,823 31,778
36,298 25,209 31,137 30,842 67,435 56,051
The Company had no bank loans and other borrowings at 31 December 2014 (2013: HK$816 million repayable within one
year and HK$600 million repayable between one and two years).
Another presentation of the Group’s liquidity risk is set out on page 265.
At 31 December 2014 and 2013, all of the Group’s borrowings are either in the functional currencies of the corresponding
Group entities or hedged into those currencies.
The bank loans and other borrowings of the Group are predominantly issued in or swapped into Hong Kong dollar or
Australian dollar. The effective interest rates at the end of the reporting period were as follows:
2014 2013
HK$ A$ HK$ A$
Fixed rate loans and loans swapped from variable rates 1.7% – 4.8% 4.8% – 5.7% 1.8% – 4.9% 3.5% – 9.1%
Variable rate loans and loans swapped from fixed rates 0.7% – 2.1% 4.1% – 4.3% 0.6% – 2.1% 4.2% – 4.8%
The fair values of bank loans and other borrowings approximate to their carrying amounts. The fair values of long-term
borrowings are determined using the expected future payments discounted at market interest rates prevailing at the year
end.
At 31 December 2014, the Group had undrawn bank loans and overdraft facilities of HK$32,533 million (2013:
HK$33,218 million).

244 CLP Holdings 2014 Annual Report
NOTES TO THE FINANCIAL STATEMENTS
24. Obligations under Finance Leases
Minimum Lease Payments
2014 2013
HK$M HK$M
Amounts payable under finance leases
Within one year 1 2,763
After one year but within two years 1 2,752
After two years but within five years 2 7,906
Over five years 23 14,555
27 27,976
Analysed as:
Amount due for settlement within 12 months 1 2,763
Amount due for settlement after 12 months 26 25,213
27 27,976
At 31 December 2013, the Group’s obligations under finance leases arose predominantly from the power purchase
arrangement with CAPCO in respect of the operational generating plant and associated fixed assets of the Hong Kong
electricity business. CAPCO’s power purchase arrangement was accounted for as a finance lease in accordance with
HK(IFRIC)-Int 4 and HKAS 17. The finance lease arrangement was settled during the acquisition of CAPCO as a subsidiary
(Note 2).
25. Deferred Tax
Deferred tax assets and liabilities are netted off when the taxes relate to the same tax authority and where offsetting
is legally enforceable. The following amounts, determined after appropriate offsetting, are shown separately on the
consolidated statement of financial position:
2014 2013
HK$M HK$M
Deferred tax assets 3,828 3,084
Deferred tax liabilities (13,418) (8,548)
(9,590) (5,464)
Deferred tax asset = income tax recoverable in the future
Deferred tax liability = income tax payable in the future
An elaboration of the accounting concepts on deferred tax can be
found on our website as part of our accounting “mini-series”.
Accounting Policy No. 11
Accounting Policy No. 8
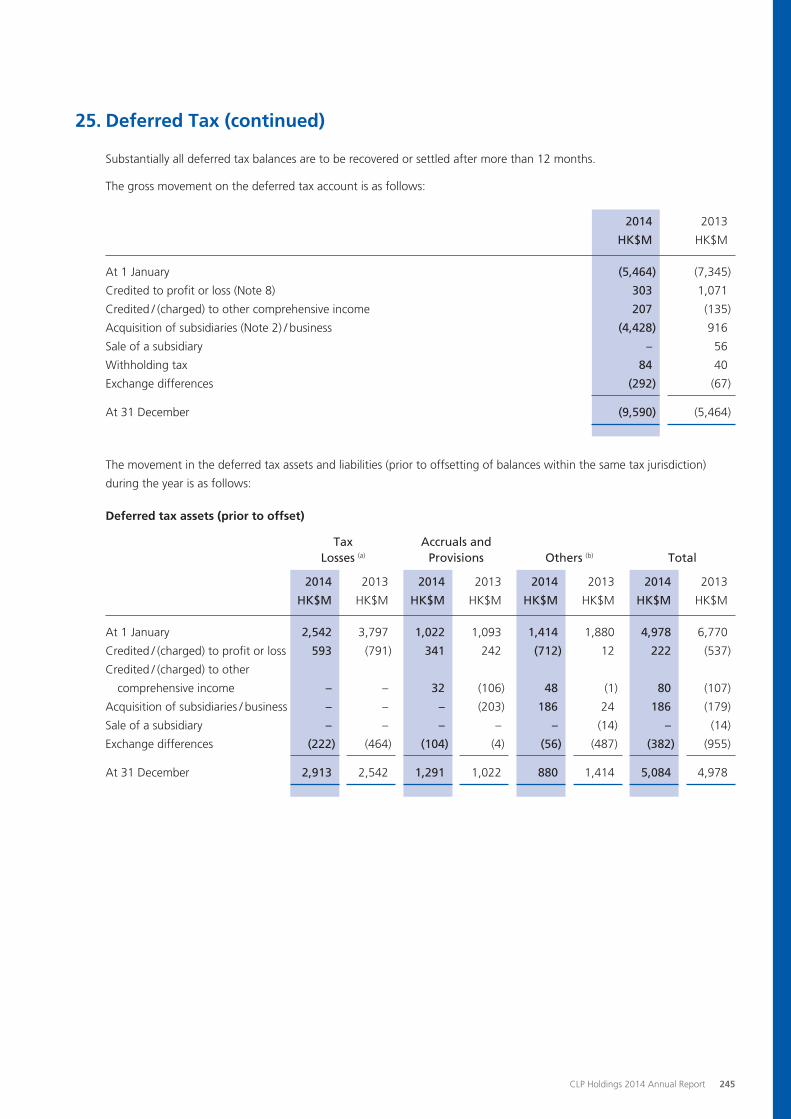
CLP Holdings 2014 Annual Report 245
25. Deferred Tax (continued)
Substantially all deferred tax balances are to be recovered or settled after more than 12 months.
The gross movement on the deferred tax account is as follows:
2014 2013
HK$M HK$M
At 1 January (5,464) (7,345)
Credited to profit or loss (Note 8) 303 1,071
Credited / (charged) to other comprehensive income 207 (135)
Acquisition of subsidiaries (Note 2) / business (4,428) 916
Sale of a subsidiary – 56
Withholding tax 84 40
Exchange differences (292) (67)
At 31 December (9,590) (5,464)
The movement in the deferred tax assets and liabilities (prior to offsetting of balances within the same tax jurisdiction)
during the year is as follows:
Deferred tax assets (prior to offset)
Tax Accruals and Losses (a) Provisions Others (b) Total
2014 2013 2014 2013 2014 2013 2014 2013
HK$M HK$M HK$M HK$M HK$M HK$M HK$M HK$M
At 1 January 2,542 3,797 1,022 1,093 1,414 1,880 4,978 6,770
Credited / (charged) to profit or loss 593 (791) 341 242 (712) 12 222 (537)
Credited / (charged) to other
comprehensive income – – 32 (106) 48 (1) 80 (107)
Acquisition of subsidiaries / business – – – (203) 186 24 186 (179)
Sale of a subsidiary – – – – – (14) – (14)
Exchange differences (222) (464) (104) (4) (56) (487) (382) (955)
At 31 December 2,913 2,542 1,291 1,022 880 1,414 5,084 4,978

246 CLP Holdings 2014 Annual Report
NOTES TO THE FINANCIAL STATEMENTS
25. Deferred Tax (continued)
Deferred tax liabilities (prior to offset)
Withholding / Accelerated Tax Dividend Depreciation Distribution Tax Unbilled Revenue Intangibles Others (b) Total
2014 2013 2014 2013 2014 2013 2014 2013 2014 2013 2014 2013
HK$M HK$M HK$M HK$M HK$M HK$M HK$M HK$M HK$M HK$M HK$M HK$M
At 1 January (7,084) (9,440) (327) (368) (998) (1,545) (1,126) (1,334) (907) (1,428) (10,442) (14,115)
(Charged) / credited
to profit or loss (1,428) 801 (16) (27) 1,007 355 765 199 (247) 280 81 1,608
(Charged) / credited
to other
comprehensive
income – – – – – – – – 127 (28) 127 (28)
Acquisition of
subsidiaries / business (3,535) 1,119 – – – – (1,079) – – (24) (4,614) 1,095
Sale of a subsidiary – 57 – – – – – 5 – 8 – 70
Withholding tax – – 84 40 – – – – – – 84 40
Exchange differences (17) 379 (20) 28 (9) 192 75 4 61 285 90 888
At 31 December (12,064) (7,084) (279) (327) – (998) (1,365) (1,126) (966) (907) (14,674) (10,442)
Notes:
(a) The deferred tax asset arising from tax losses related to the electricity business in Australia of HK$2,251 million (2013: HK$2,542 million) and India of HK$662 million (2013: nil). There is no expiry on the tax losses recognised in Australia. For India, the expiry of tax losses ranging from eight years to no expiry. Apart from unrecognised tax losses arising from various capital transactions in Australia of HK$1,890 million (2013: HK$1,743 million), there are no significant unused tax losses not recognised.
(b) Others mainly relate to temporary differences arising from derivative financial instruments and lease accounting adjustments.
26. Fuel Clause Account
Cost of fuel consumed by CLP Power Hong Kong is passed on to the customers. The variations between the actual cost
of fuel and the fuel cost billed are captured in the fuel clause account. The balance of the account (inclusive of interest)
represents amounts over-recovered or under-recovered and is treated as an amount due to or from customers. Interest
charged to customers on the amount under-recovered is based on the actual borrowing cost of CLP Power Hong Kong,
whilst interest is credited to customers at prime rate on the amount over-recovered. The carrying amount of fuel clause
account approximates to its fair value.
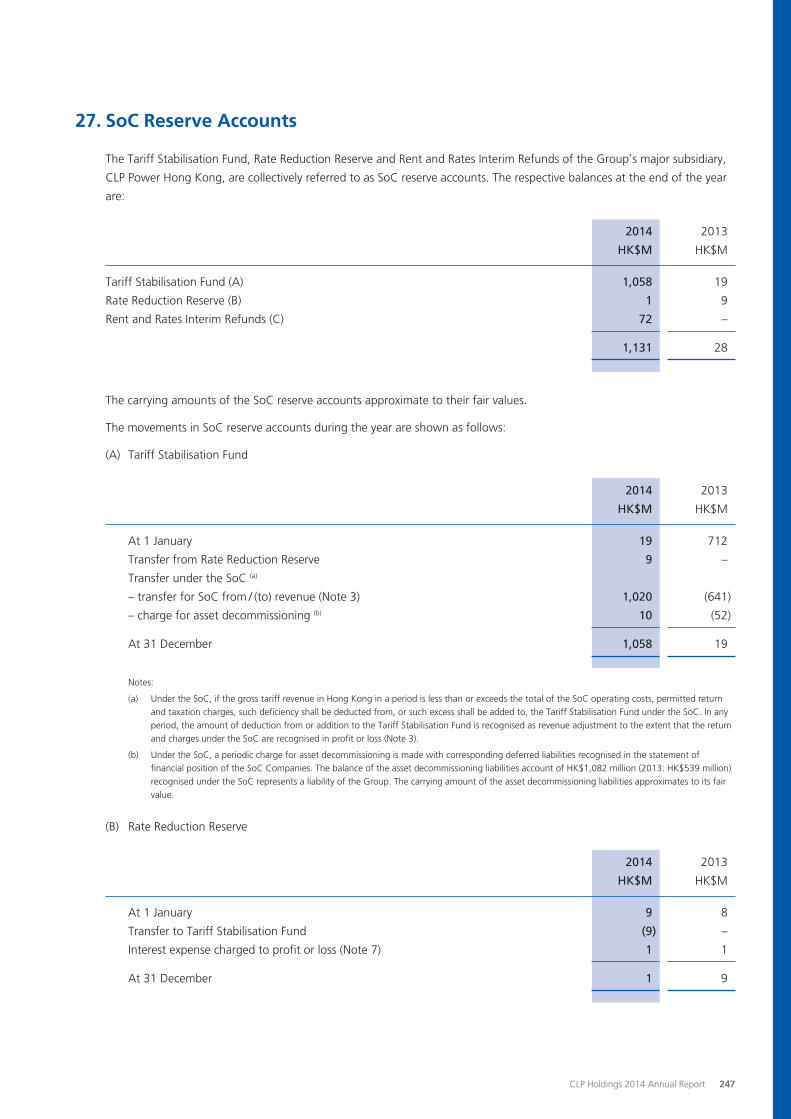
CLP Holdings 2014 Annual Report 247
27. SoC Reserve Accounts
The Tariff Stabilisation Fund, Rate Reduction Reserve and Rent and Rates Interim Refunds of the Group’s major subsidiary,
CLP Power Hong Kong, are collectively referred to as SoC reserve accounts. The respective balances at the end of the year
are:
2014 2013
HK$M HK$M
Tariff Stabilisation Fund (A) 1,058 19
Rate Reduction Reserve (B) 1 9
Rent and Rates Interim Refunds (C) 72 –
1,131 28
The carrying amounts of the SoC reserve accounts approximate to their fair values.
The movements in SoC reserve accounts during the year are shown as follows:
(A) Tariff Stabilisation Fund
2014 2013
HK$M HK$M
At 1 January 19 712
Transfer from Rate Reduction Reserve 9 –
Transfer under the SoC (a)
– transfer for SoC from / (to) revenue (Note 3) 1,020 (641)
– charge for asset decommissioning (b) 10 (52)
At 31 December 1,058 19
Notes:
(a) Under the SoC, if the gross tariff revenue in Hong Kong in a period is less than or exceeds the total of the SoC operating costs, permitted return and taxation charges, such deficiency shall be deducted from, or such excess shall be added to, the Tariff Stabilisation Fund under the SoC. In any period, the amount of deduction from or addition to the Tariff Stabilisation Fund is recognised as revenue adjustment to the extent that the return and charges under the SoC are recognised in profit or loss (Note 3).
(b) Under the SoC, a periodic charge for asset decommissioning is made with corresponding deferred liabilities recognised in the statement of financial position of the SoC Companies. The balance of the asset decommissioning liabilities account of HK$1,082 million (2013: HK$539 million) recognised under the SoC represents a liability of the Group. The carrying amount of the asset decommissioning liabilities approximates to its fair value.
(B) Rate Reduction Reserve
2014 2013
HK$M HK$M
At 1 January 9 8
Transfer to Tariff Stabilisation Fund (9) –
Interest expense charged to profit or loss (Note 7) 1 1
At 31 December 1 9

248 CLP Holdings 2014 Annual Report
NOTES TO THE FINANCIAL STATEMENTS
27. SoC Reserve Accounts (continued)
(C) Rent and Rates Interim Refunds
CLP Power Hong Kong is challenging the amount of Government rent and rates levied dating back to the year of
assessment 2001 / 02. While the original Lands Tribunal judgment and the subsequent judgment on the review of
valuation matters were received in CLP Power Hong Kong’s favour, final resolution of the case will be subject to the
outcome of appeals to the Court of Appeal against the Lands Tribunal judgment on points of law.
The interim refunds received by CLP Power Hong Kong from the Hong Kong Government in 2012 and 2013 totalling
HK$1,641 million had been fully expended in Rent and Rates Special Rebate provided to customers during 2012 and
2013. In 2014, a further interim refund of HK$72 million was received. These interim refunds were made by the Hong
Kong Government without prejudice to the final outcome of the appeals which means that these amounts will be
adjusted by reference to the decisions of the Lands Tribunal and subsequent appeals.
Based on the latest development of the case, CLP Power Hong Kong maintains that it would recover no less than
interim refunds received to date in the final outcome of these appeals. The interim refunds continued to be classified
within the SoC reserve accounts. The Rent and Rates Special Rebate, which was ceased in October 2013, had been
offset against the interim refunds received.
In the event that the final amount recovered on conclusion of these appeals is less than the total amount rebated
to customers, CLP Power Hong Kong will seek to recover any shortfall in the amounts of Rent and Rates Special
Rebate already paid to customers. Similarly, if the final amount recovered exceeds the special rebates paid out, these
additional amounts will be returned to customers.
28. Share Capital
2014 2013 Number of Amount Number of Amount
Ordinary Shares HK$M Ordinary Shares HK$M
Authorised
Ordinary shares of HK$5 each (note) – – 3,000,000,000 15,000
Issued and fully-paid
At 1 January 2,526,450,570 12,632 2,526,450,570 12,632
Transfer from share premium and
capital redemption reserve (note) – 10,611 – –
At 31 December 2,526,450,570 23,243 2,526,450,570 12,632
Note: Under the Hong Kong Companies Ordinance (Cap. 622), which came into force on 3 March 2014, the concept of authorised share capital no longer exists. In accordance with the said Ordinance, the Company’s shares no longer have a par or nominal value. There is no impact on the number of shares in issue or the relative entitlement of any of the shareholders as a result of this transition. In addition, in accordance with the transitional provisions set out in section 37 of Schedule 11 to the said Ordinance, any amount standing to the credit of the share premium account and the capital redemption reserve has become part of the Company’s share capital.

CLP Holdings 2014 Annual Report 249
29. Reserves
Group
Capital Redemption Translation Hedging Other Retained Reserve Reserves Reserves Reserves Profits Total
HK$M HK$M HK$M HK$M HK$M HK$M
Balance at 1 January 2013 2,492 6,641 1,038 485 59,720 70,376
Earnings attributable to shareholders – – – – 6,060 6,060
Other comprehensive income
Exchange differences on translation of
Subsidiaries – (5,929) – – – (5,929)
Joint ventures – 151 – – – 151
An associate – 1 – – – 1
Cash flow hedges
Net fair value losses – – (104) – – (104)
Reclassification to profit or loss – – 257 – – 257
Tax on the above items – – (25) – – (25)
Available-for-sale investments
Reclassification adjustment
for amount included in profit or
loss upon sale – – – 10 – 10
Fair value gain on revaluation upon
transfer from fixed asset to
investment property – – – 2,055 – 2,055
Reclassification adjustment upon sale
of a subsidiary – (8) – – – (8)
Share of other comprehensive income
of joint ventures – – 9 250 – 259
Total comprehensive income
attributable to shareholders – (5,785) 137 2,315 6,060 2,727
Revaluation reserve realised due to
depreciation of fixed assets – – – (2) 2 –
Appropriation of reserves
Subsidiaries – – – 12 (12) –
Joint ventures – – – 52 (52) –
Dividends paid
2012 fourth interim – – – – (2,476) (2,476)
2013 first to third interim – – – – (4,017) (4,017)
Balance at 31 December 2013 2,492 856 1,175 2,862 59,225 (a) 66,610

250 CLP Holdings 2014 Annual Report
NOTES TO THE FINANCIAL STATEMENTS
29. Reserves (continued)
Group
Capital Redemption Translation Hedging Other Retained Reserve Reserves Reserves Reserves Profits Total
HK$M HK$M HK$M HK$M HK$M HK$M
Balance at 1 January 2014 2,492 856 1,175 2,862 59,225 66,610
Earnings attributable to shareholders – – – – 11,221 11,221
Other comprehensive income
Exchange differences on translation of
Subsidiaries – (2,630) – – – (2,630)
Joint ventures – (341) – – – (341)
An associate – 1 – – – 1
Cash flow hedges
Net fair value losses – – (1,003) – – (1,003)
Reclassification to profit or loss – – 179 – – 179
Tax on the above items – – 186 – – 186
Fair value gain on available-for-sale
investments – – – 80 – 80
Reclassification adjustment
upon loss of joint control
of joint ventures – (422) – (146) 146 (422)
Share of other comprehensive
income of joint ventures – – 24 (74) – (50)
Total comprehensive income
attributable to shareholders – (3,392) (614) (140) 11,367 7,221
Transition to no-par value regime
(Note 28) (2,492) – – – – (2,492)
Revaluation reserve realised due to
depreciation of fixed assets – – – (2) 2 –
Appropriation of reserves
Subsidiaries – – – 23 (23) –
Joint ventures – – – 8 (8) –
Dividends paid
2013 fourth interim – – – – (2,476) (2,476)
2014 first to third interim – – – – (4,093) (4,093)
Balance at 31 December 2014 – (2,536) 561 2,751 63,994 (a) 64,770

CLP Holdings 2014 Annual Report 251
29. Reserves (continued)
Company
Capital Redemption Retained Reserve Profits Total
HK$M HK$M HK$M
Balance at 1 January 2013 2,492 26,860 29,352
Profit and total comprehensive income for the year – 7,384 7,384
Dividends paid
2012 fourth interim – (2,476) (2,476)
2013 first to third interim – (4,017) (4,017)
Balance at 31 December 2013 2,492 27,751(a) 30,243
Balance at 1 January 2014 2,492 27,751 30,243
Profit and total comprehensive income for the year – 6,844 6,844
Transition to no-par value regime (Note 28) (2,492) – (2,492)
Dividends paid
2013 fourth interim – (2,476) (2,476)
2014 first to third interim – (4,093) (4,093)
Balance at 31 December 2014 – 28,026 (a) 28,026
Note:
(a) The fourth interim dividend declared for the year ended 31 December 2014 was HK$2,526 million (2013: HK$2,476 million). The balance of retained profits after the fourth interim dividend of the Group was HK$61,468 million (2013: HK$56,749 million) and of the Company was HK$25,500 million (2013: HK$25,275 million).
At 31 December 2014, distributable reserves of the Company amounted to HK$28,026 million (2013: HK$27,751 million).
Distributable reserves of the Company do not equal to the Group’s retained profits because
distributable reserves refer to the amount that a company can distribute to its shareholders
as a legal entity. Consolidated retained profits of the Group are irrelevant in determining the
amount of distributable reserves of the Company itself.
30. Perpetual Capital Securities
During the year, the Group issued a total of US$750 million perpetual capital securities through its wholly owned
subsidiary, CLP Power HK Finance Ltd. The securities are perpetual, non-callable in the first 5.5 years and entitle the
holders to receive distributions at a distribution rate of 4.25% per annum in the first 5.5 years, floating thereafter and with
fixed step up margins at year 10.5 and at year 25.5, payable semi-annually in arrears, cumulative and compounding. The
distributions are at the Group’s discretion, if the issuer and CLP Power Hong Kong, as guarantor of the securities, do not (a)
declare or pay dividends to their shareholders or (b) cancel or reduce their share capitals within each distribution payment
period. As the perpetual capital securities do not contain any contractual obligation to pay cash or other financial assets,
in accordance with HKAS 32, they are classified as equity and for accounting purpose regarded as part of non-controlling
interests.
This year’s accounting “mini-series” tells you why the perpetual capital securities are treated as
equity.

252 CLP Holdings 2014 Annual Report
NOTES TO THE FINANCIAL STATEMENTS
31. Notes to the Consolidated Statement of Cash Flows
(A) Reconciliation of profit before income tax to net cash inflow from operations
2014 2013
HK$M HK$M
Profit before income tax 13,204 5,840Adjustments for: Finance costs 4,180 6,522 Finance income (131) (173) Dividend income from available-for-sale investments (48) (61) Share of results of joint ventures and an associate, net of income tax (2,358) (3,283) Depreciation and amortisation 6,791 7,592 Impairment charge 3,264 6,289 Net loss on disposal of fixed assets 282 173 Revaluation gain on investment property (245) – Gain on deemed disposal of previously owned interest in joint ventures (7,363) – Loss on settlement of a pre-existing finance lease payable 5,338 – Gain on bargain purchase of Mount Piper Power Station and Wallerawang Power Station – (751) Loss on disposal of CLP Huanyu (Shandong) Biomass Heat and Power Company Limited – 23 Gain on sale of interest in Waterloo Investment Holdings Pty Ltd – (24) Fair value gain under fair value hedges and net exchange difference (513) (284) SoC items
Increase in customers’ deposits 149 185 Increase in fuel clause account 1,393 1,770 Increase / (decrease) in Rent and Rates Interim Refunds 72 (525) Decrease in Tariff Stabilisation Fund for asset decommissioning charge for a joint venture (13) (52) Transfer for SoC 1,020 (641)
2,621 737 Decrease / (increase) in trade and other receivables 2,212 (1,175) Decrease in finance lease receivables 68 90 Decrease in cash restricted for specific purposes 94 687 Decrease in derivative financial instruments net liabilities (655) (564) (Decrease) / increase in trade and other payables (3,345) 171 Increase / (decrease) in current accounts due to joint ventures and an associate 35 (11)
Net cash inflow from operations 23,431 21,798
(B) Analysis of balances of cash and cash equivalents
2014 2013
HK$M HK$M
Deposits with banks 2,776 3,510Cash at banks and on hand 1,617 1,723
Bank balances, cash and other liquid funds (Note 21) 4,393 5,233Excluding: Cash restricted for specific purposes (355) (449) Bank deposits with maturity of over three months (2) –
4,036 4,784

CLP Holdings 2014 Annual Report 253
32. Commitments and Operating Lease Arrangements
(A) Capital expenditure on fixed assets, leasehold land and land use rights under operating leases and investment
property, as well as intangible assets contracted or authorised but not recorded in the statement of financial position is
as follows:
Group Company
2014 2013 2014 2013
HK$M HK$M HK$M HK$M
Contracted but not provided for 5,859 5,812 3 6
Authorised but not contracted for 7,746 9,834 262 61
13,605 15,646 265 67
(B) The Group has entered into a number of joint venture arrangements to develop power projects. Equity contributions
required and made by the Group under each project are summarised below:
Total Equity Amount Remaining Expected Year
Contributions Contributed at Balance to for Last
Project Name Required 31 December 2014 be Contributed Contribution
Haifang wind power project RMB92 million RMB18 million RMB74 million 2016
(HK$21 million) (HK$92 million)
CGN CLP Energy Services RMB29 million RMB14 million RMB15 million 2017
(Shenzhen) (HK$17 million) (HK$19 million)
At 31 December 2014, the Group has commitments of HK$901 million (2013: HK$1,063 million) to purchase
renewable energy certificates from certain joint ventures in Australia.
(C) The future aggregate minimum lease payments under non-cancellable operating leases are as follows:
Group Company
2014 2013 2014 2013
HK$M HK$M HK$M HK$M
Within one year 525 843 33 27
Later than one year but not later than five years 1,806 2,993 118 89
Over five years 1,688 6,148 59 65
4,019 9,984 210 181

254 CLP Holdings 2014 Annual Report
NOTES TO THE FINANCIAL STATEMENTS
32. Commitments and Operating Lease Arrangements (continued)
Of the above amount of the Group, HK$1,992 million (2013: nil) relates to a Capacity Purchase Contract between
PSDC and Guangdong Pumped Storage Company, Limited with fixed annual payments for 26 years for the use of
the land, other resources and infrastructural facilities at Guangzhou Pumped Storage Power Station in Conghua,
Guangzhou; and HK$1,163 million (2013: HK$1,589 million) relates to a 20-year Master Hedge Agreement between
EnergyAustralia and Ecogen which ends in 2019. Under the latter Agreement, EnergyAustralia has the right to call
upon electricity from the power stations at predetermined charging rates over the life of the Agreement. At 31
December 2013, HK$7,433 million related to the operating lease element of the Electricity Supply Contract between
CLP Power Hong Kong and CAPCO. The commitments were terminated upon the acquisition of CAPCO as subsidiary
in 2014 (Note 2). Other non-cancellable operating leases are for leases of various offices and equipment.
The operating lease commitments of the Company primarily relate to a 10-year lease of the office at Laguna Verde at
Hung Hom entered with CLP Property Investment Limited, a wholly-owned subsidiary of the Company.
(D) The 25-year power purchase arrangements between Jhajjar and its off-takers are accounted for as operating leases.
Under the agreements, the off-takers are obliged to purchase the output of Jhajjar power plant at predetermined
prices. The future aggregate minimum lease receipts under non-cancellable operating leases are as follows:
2014 2013
HK$M HK$M
Within one year 858 886
Later than one year but not later than five years 3,205 3,315
Over five years 8,104 9,140
12,167 13,341
33. Related Party Transactions
Accounting Policy
Related parties are individuals and companies, including subsidiaries, fellow subsidiaries, joint ventures, associates
and key management personnel, where the individual or company has the ability, directly or indirectly, to control or
jointly control the other party or exercise significant influence over the other party in making financial and operating
decisions. A close family member of any such individual is considered to be a related party.
Related Parties ≠ Connected Parties
They sometimes overlap but should not be confused. Accounting standards define related
parties, while the Listing Rules of the Hong Kong Stock Exchange define connected parties.

CLP Holdings 2014 Annual Report 255
33. Related Party Transactions (continued)
Below are the more significant transactions with related parties for the year ended 31 December:
(A) Purchases of electricity from joint ventures and an associate
Details of electricity supply contracts relating to the electricity business in Hong Kong with joint ventures and an
associate are shown below:
2014 2013
HK$M HK$M
Lease and lease service payment to CAPCO (a) 5,341 17,324
Purchases of nuclear electricity from GNPS (b) 4,935 4,619
Pumped storage service fee to PSDC (c) 175 540
10,451 22,483
(a) Under the Electricity Supply Contract between CLP Power Hong Kong and CAPCO, CLP Power Hong Kong is
obliged to purchase all of CAPCO’s generating capacity. The Electricity Supply Contract provides that the price
paid by CLP Power Hong Kong to CAPCO is sufficient to cover all of CAPCO’s operating expenses under the SoC,
including fuel cost, depreciation, interest expenses and current and deferred taxes, as well as CAPCO’s share of
the return permitted under the SoC.
Pursuant to the requirements of HK(IFRIC)-Int 4 and HKAS 17, the electricity supply arrangement was assessed to
contain leases and service elements. The payment made to CAPCO pursuant to the contract had been allocated to
the different leases and service elements according to the requirements of the standards.
The amount was accounted for up to the date of acquisition of CAPCO as subsidiary (Note 2).
(b) Under the off-take and resale contracts, CLP Power Hong Kong is obliged to purchase the Group’s 25% equity
share of the output from Guangdong Daya Bay Nuclear Power Station (GNPS) and an additional 45% of GNPS’s
output from Guangdong Nuclear Investment Company, Limited (GNIC). The price paid by CLP Power Hong Kong
for electricity generated by GNPS throughout the terms of the power purchase agreements is determined by a
formula based on GNPS’s operating costs and a calculation of profits. The calculation of profits was with reference
to shareholders’ funds and the capacity factor for periods up to 6 May 2014, and with reference to capacity factor
for periods thereafter. The purchase of nuclear electricity under the arrangement was HK$4,867 million (2013:
HK$4,619 million).
Under a separate purchase arrangement with GNIC and GNPJVC, the Group would purchase an approximately
10% of additional nuclear electricity from GNPS on a best endeavour basis from October 2014 to end of 2018, at
the same unit price as that under the off-take and resale arrangement which amounted to HK$68 million for 2014
(2013: nil).

256 CLP Holdings 2014 Annual Report
NOTES TO THE FINANCIAL STATEMENTS
33. Related Party Transactions (continued)
(A) Purchases of electricity from joint ventures and an associate (continued)
(c) Under a capacity purchase contract, PSDC has the right to use 50% of the 1,200MW capacity of Phase 1 of the
Guangzhou Pumped Storage Power Station. CLP Power Hong Kong has entered into a contract with PSDC to
make use of this capacity. The price paid by CLP Power Hong Kong to PSDC is sufficient to cover all of PSDC’s
operating expenses and net return. PSDC’s net return is based on a percentage of its net fixed assets in a manner
analogous to the SoC, subject to a minimum return level.
The amount was accounted for up to the date of acquisition of PSDC as subsidiary (Note 2).
Amounts due to the related parties at 31 December 2014 are disclosed in Note 22.
(B) Rendering of services to joint ventures
In accordance with the CAPCO Operating Service Agreement between CLP Power Hong Kong and CAPCO, CLP
Power Hong Kong is responsible to CAPCO for the efficient and proper construction, commissioning, operation and
maintenance of the electricity generating facilities of CAPCO. In return, CAPCO reimburses CLP Power Hong Kong
for all costs incurred in performance of the agreement. The charges from CLP Power Hong Kong to CAPCO during
the period before the acquisition of CAPCO as a subsidiary (Note 2) amounted to HK$352 million (2013: HK$1,037
million) and a portion of the charges which was accounted for as operating expenses by CAPCO was covered under
the Electricity Supply Contract referred to in (A)(a) above.
Amounts due from the related parties at 31 December 2014 are disclosed in Note 20.
No provision has been made for the amounts owed by the related parties.
(C) The advances made to joint ventures are disclosed under Note 15. At 31 December 2014, the Group did not have any
guarantees which were of a significant amount given to or received from these parties (2013: nil).
(D) The Company provides necessary funding to support its subsidiaries’ operations. Of the total advances of HK$27,736
million (2013: HK$28,815 million) made to its subsidiaries (Note 14), HK$19,456 million (2013: HK$20,141 million)
and HK$4,359 million (2013: HK$4,932 million) were made to CLP Power Asia Limited and CLP Asia Finance Limited
respectively to fund investments in overseas power projects. Advances of HK$2,186 million (2013: HK$2,040 million)
and HK$941 million (2013: HK$1,623 million) were made to CLP Properties Limited for property development and to
CLP Treasury Services Limited for treasury operations purpose respectively.
These advances are unsecured, interest free and have no fixed repayment terms.

CLP Holdings 2014 Annual Report 257
33. Related Party Transactions (continued)
(E) Emoluments of key management personnel
Under HKAS 24 “Related Party Disclosures”, key management personnel are defined as those persons having authority
and responsibility for planning, directing and controlling the activities of the Group, directly or indirectly, including any
directors (whether executive or otherwise) of the Group. The total remuneration of the key management personnel
shown below comprises the Non-executive Directors and the Senior Management Group. Members of the Senior
Management Group include the Executive Director and nine (2013: ten) senior management personnel.
2014 2013
HK$M HK$M
Fees 11 10
Recurring remuneration items (note)
Base compensation, allowances and benefits in kind 54 44
Performance bonus
Annual incentive 50 29
Long-term incentive 23 19
Provident fund contributions 5 4
Non-recurring remuneration item (note)
Other payments 52 21
195 127
Note: Refer to recurring and non-recurring remuneration items on page 154 of Human Resources & Remuneration Committee Report.
At 31 December 2014, the CLP Holdings’ Board was composed of thirteen Non-executive Directors and one Executive
Director. Remuneration of all Directors for the year totalled HK$31 million (2013: HK$63 million). With respect to the
emoluments of the highest paid employees, the five highest paid individuals in the Group during the year included
one Director (2013: three Directors), two members of Senior Management (2013: one member) and two former
members of Senior Management (2013: one former senior executive) of the Group. The total remuneration of these
five highest paid individuals amounted to HK$108 million (2013: HK$88 million). Further details of the remuneration
of the Directors and Senior Management, on a named basis, and remuneration paid to the five highest paid individuals
by bands are disclosed in sections 6 to 9 and 11 (as highlighted) of the Human Resources & Remuneration Committee
Report on pages 153 to 156 and 160 to 162 respectively. These sections form the “auditable” part of the Human
Resources & Remuneration Committee Report and are part of the financial statements.

258 CLP Holdings 2014 Annual Report
NOTES TO THE FINANCIAL STATEMENTS
34. Contingent Liabilities
Accounting Policy
Provisions are recognised when the Group has a present legal or constructive obligation as a result of past events, it
is probable that an outflow of resources will be required to settle the obligation, and the amount has been reliably
estimated. Provisions are measured at the present value of the expenditures expected to be required to settle the
obligation using a pre-tax rate that reflects current market assessments of the time value of money and the risks
specific to the obligation. The increase in the provision due to the passage of time is recognised as interest expense.
Contingent liabilities are possible obligations that arise from past events and whose existence will only be confirmed by
the occurrence or non-occurrence of one or more future events not wholly within the control of the Group. Where it
is not probable that an outflow of economic benefits will be required, or the amount cannot be estimated reliably, the
obligation is disclosed as a contingent liability, unless the probability of outflow of economic benefits is remote.
(A) CLP India – Deemed Generation Incentive Payment and Interests on Deemed Loans
Under the original power purchase agreement between CLP India and its off-taker GUVNL, GUVNL was required
to make a “deemed generation incentive” payment to CLP India when the plant availability of Paguthan was above
68.5% (subsequently revised to 70% in 2003 and 80% in 2013). GUVNL has been making such payments since
December 1997.
In September 2005, GUVNL filed a petition before the Gujarat Electricity Regulatory Commission (GERC) claiming
that the “deemed generation incentive” payment should not be paid for the periods when Paguthan is declared with
availability to generate on “naphtha” as fuel rather than on “gas”. GUVNL’s contention is based on a 1995 Government
of India notification which disallowed “deemed generation incentive” for naphtha-based power plants. The total
amount of the claim plus interest calculated up to June 2005 amounts to about Rs.7,260 million (HK$891 million). CLP
India’s position, amongst other arguments, is that Paguthan is not naphtha-based and therefore the Government of
India notification does not apply to disallow the payments of the “deemed generation incentive”.
GUVNL also claimed that CLP India has wrongly received interest on “deemed loans” under the existing power
purchase agreement. GUVNL’s claim rests on two main grounds: (i) CLP India had agreed that interest paid by GUVNL
for the period from December 1997 to 1 July 2003 was to be refunded; and (ii) interest was to be calculated on a
reducing balance rather than on the basis of a bullet repayment on expiry of the loan term. The total amount of the
claim plus interest for the “deemed loans” amounts to a further Rs.830 million (HK$102 million) (2013: Rs.830 million
(HK$104 million)).
On 18 February 2009, the GERC made an adjudication on GUVNL’s claims. On the issue related to the payment to CLP
India of “deemed generation incentive”, the GERC decided that the “deemed generation incentive” was not payable
when Paguthan was declared with availability to generate on naphtha. However, the GERC also decided that GUVNL’s
claim against CLP India in respect of deemed generation incentive up to 14 September 2002 was time-barred under
the Limitations Act of India. Hence, the total amount of the claim allowed by the GERC was reduced to Rs.2,523
million (HK$310 million). The GERC also dismissed GUVNL’s claim to recover interest on the “deemed loans”.
CLP India filed an appeal with the Appellate Tribunal for Electricity (ATE) against the decision of the GERC. GUVNL also
filed an appeal in the ATE against an order of the GERC rejecting GUVNL’s claims on interest on deemed loans and
the time barring of the deemed generation claim to 14 September 2002. On 19 January 2010, the ATE dismissed both
CLP India and GUVNL’s appeals and upheld the decision of the GERC. CLP India has filed an appeal against the ATE
order in the Supreme Court of India. The appeal petition was admitted on 16 April 2010 but the next date of hearing
has not yet been fixed by the court. GUVNL has also filed a cross appeal challenging those parts of the ATE judgment
which held that GUVNL’s claims before September 2002 were time barred and which disallowed its claims for interest
on “deemed loans”.

CLP Holdings 2014 Annual Report 259
34. Contingent Liabilities (continued)
(A) CLP India – Deemed Generation Incentive Payment and Interests on Deemed Loans (continued)
Following the issue of the ATE’s judgment, GUVNL deducted Rs.3,731 million (HK$458 million) from January to
March 2010 invoices after adjustment for a previous deposit of Rs.500 million (HK$61 million), which included tax on
incentive relating to deemed generation on naphtha, and delayed payment charges on associated incentive calculated
up to March 2010.
Subsequent to the above deduction, CLP India represented to GUVNL that, during April 2004 to March 2006, gas
was available for generation and therefore should not be considered as availability (deemed generation) on naphtha.
GUVNL accepted the representation and refunded the base amount of Rs.292 million (HK$36 million) and interest
of Rs.150 million (HK$18 million) in March 2011. However, during the first and last quarter of 2011, with the spot
gas availability being constrained, Paguthan was forced to declare availability on naphtha for certain periods, which
resulted in deduction of incentive revenue by GUVNL under deemed generation of Rs.17 million (HK$2 million). At
31 December 2014, the total amount of the claim plus interest and tax with respect to the “deemed generation
incentive” amounted to Rs.8,543 million (HK$1,048 million) (2013: Rs.8,543 million (HK$1,073 million)). There have
been no significant developments in this case and no hearing was held during the year. The next hearing has not been
scheduled.
On the basis of legal advice obtained, the Directors are of the opinion that CLP India has a strong case on appeal to
the Supreme Court. In consequence, no provision has been made in the financial statements at this stage in respect of
these matters.
The application of the accounting concepts on provision and contingent liabilities to the
“deemed generation incentive” lawsuit can be found on our website as part of our accounting
“mini-series”.
(B) Indian Wind Power Projects – WWIL’s Contracts
CLP Wind Farms (India) Private Limited, CLP India and its subsidiaries (CLP India group) have invested (or are committed
to invest) in around 634MW of wind power projects to be developed with Wind World India Limited (WWIL). WWIL’s
major shareholder, Enercon GmbH, has commenced litigation against WWIL claiming infringement of intellectual
property rights. CLP India group, as a customer of WWIL, has been named as a defendant. Enercon GmbH is
also seeking an injunction restraining CLP India group’s use of certain rotor blades acquired from WWIL. As at 31
December 2014, the Group considered that CLP India group has good prospects of defending these claims and the
legal proceedings are unlikely to result in any material outflow of economic benefits from the Group.
(C) Jhajjar – Disputed Charges with Off-takers
Jhajjar has disputes with its off-takers over applicable tariff of capacity charges, energy charges relating to transit loss,
coal-handling agent charges and Unscheduled Interchange charges payable as per the Central Electricity Regulatory
Commission (Terms and Conditions of Tariff) Regulations, 2009. Total disputed amounts were Rs.1,725 million (HK$212
million) at 31 December 2014 (2013: Rs.1,433 million (HK$180 million)). Jhajjar has filed a petition against its off-
takers in March 2013. The Group considered that Jhajjar has a strong case and hence, no provision has been made.
(D) Land Premium of a Property in Hong Kong
The Group received a demand note in 2013 from the relevant authorities of the Hong Kong Government in an amount
of HK$280 million as land premium relating to the Group’s office at Laguna Verde at Hung Hom.
As an alternative to paying a land premium, the Group applied for a temporary waiver of the relevant lease approval
which gave rise to the land premium. Under the waiver, an annual waiver fee is payable over the waiver term. While
the Group is appealing on the quantum of the waiver fee, the Group accepted the other terms of the waiver offer and
settled the waiver fees in July 2014. So long as the waiver remains in place, the above land premium will not apply.

FINANCIAL RISK MANAGEMENT
260 CLP Holdings 2014 Annual Report
1. Financial Risk Factors
The Group’s activities expose it to a variety of financial risks: market risk (including foreign currency risk, fair value and
cash flow interest rate risks, and energy portfolio risk), credit risk and liquidity risk. The Group’s overall risk management
programme focuses on the unpredictability of financial markets and seeks to minimise the impact of exchange rate,
interest rate and energy price fluctuations on the Group’s financial performance. The Group uses different derivative
financial instruments to manage its exposure in these areas. Other than limited energy trading activities for the purpose of
understanding price movements engaged by EnergyAustralia, all derivative financial instruments are employed solely for
hedging purposes.
Risk management for Hong Kong operations, predominantly the Company and its major subsidiary CLP Power Hong Kong,
is carried out by the Company’s central treasury department (Group Treasury) under policies approved by the Board of
Directors or the Finance and General Committee of those companies. Overseas subsidiaries conduct their risk management
activities in accordance with policies approved by their respective Boards. Group Treasury identifies, evaluates and monitors
financial risks in close co-operation with the Group’s operating units. The Group has written policies covering specific areas,
such as foreign exchange risk, interest rate risk, credit risk, use of derivative financial instruments and cash management.
Foreign currency risk
The Group operates in the Asia-Pacific region and is exposed to foreign exchange risk arising from future commercial
transactions, and from recognised assets and liabilities and net investments in foreign operations. This is primarily with
respect to Australian dollars, Renminbi and Indian rupees. Additionally, CLP Power Hong Kong has significant foreign
currency obligations relating to its foreign currency denominated debts, US dollar denominated nuclear power purchase
off-take commitments and other fuel-related payments. The Group uses forward contracts and currency swaps to manage
its foreign exchange risk arising from future commercial transactions, and from recognised assets and liabilities which are
denominated in a currency that is not the functional currency of the respective Group entity. Hedging is only considered for
firm commitments and highly probable forecast transactions.
CLP Power Hong Kong
Under the SoC, CLP Power Hong Kong is allowed to pass-through foreign exchange gains and losses arising from future
commercial transactions and recognised liabilities which are denominated in a currency other than Hong Kong dollars,
thus retaining no significant foreign exchange risk over the long term. CLP Power Hong Kong uses forward contracts
and currency swaps to hedge all its debt repayment obligations denominated in foreign currencies for the full tenor, and
a significant portion of its US dollar obligations on fuel and nuclear power purchases, provided that for US dollar the
hedging can be accomplished at rates below the Hong Kong Government’s historical target peg rate of HK$7.8: US$1. The
objective is to reduce the potential impact of foreign exchange movement on electricity tariffs.
At the end of the reporting period, the fair value movement of the derivative financial instrument in a cash flow hedge
relationship is recorded in equity. The extent of the impact to the hedging reserve under equity due to exchange rate
movements, with all other variables held constant, is as follows:
2014 2013
HK$M HK$M
Increase / (decrease) in the hedging reserve
Hong Kong dollar against US dollar
If Hong Kong dollar weakened by 0.6% (2013: 0.6%) 292 364
If Hong Kong dollar strengthened by 0.6% (2013: 0.6%) (292) (364)
Hong Kong dollar against Japanese yen
If Hong Kong dollar weakened by 5% (2013: 5%) 49 45
If Hong Kong dollar strengthened by 5% (2013: 5%) (44) (41)

CLP Holdings 2014 Annual Report 261
Foreign currency risk (continued)
This fluctuation in equity is a timing difference as when the exchange gain or loss is realised in profit or loss, the amount is
recoverable under the SoC.
The Group’s Asia-Pacific Investments
With respect to the power project investments in the Asia-Pacific region, the Group is exposed to both foreign currency
translation and transaction risks.
The Group closely monitors translation risk using a Value-at-Risk (VaR) approach but does not hedge foreign currency
translation risk because translation gains or losses do not affect the project company’s cash flow or the Group’s annual
profit until an investment is sold. At 31 December 2014, the Group’s net investment subject to translation exposure was
HK$53,696 million (2013: HK$51,995 million), arising mainly from our investments in Mainland China, India, Southeast
Asia and Taiwan and Australia. This means that, for each 1% (2013: 1%) average foreign currency movement, our
translation exposure will vary by about HK$537 million (2013: HK$520 million). All the translation exposures are recognised
in other comprehensive income and therefore have no impact on our profit or loss.
We consider that the non-functional currency transaction exposures at the individual project company level, if not
managed properly, can lead to significant financial distress. Our primary risk mitigation is therefore to ensure that project-
level debt financings are implemented on a local currency basis to the maximum extent possible. Each overseas subsidiary
and project company has developed its own hedging programme into local currency taking into consideration any indexing
provision in project agreements, tariff reset mechanisms, lender requirements and tax and accounting implications.
Most foreign currency exposures of the Company and other Group entities are hedged and / or their transactions are
predominantly conducted through the functional currency of the respective entity. The following analysis presents the
Group’s (apart from CLP Power Hong Kong) sensitivity to a reasonably possible change in the functional currencies of the
Group entities against the US dollar and Renminbi, with all other variables held constant. The sensitivity rates in US dollar
and Renminbi used are considered reasonable given the current level of exchange rates and the volatility observed in the
different functional currencies of the Group entities. These are both on a historical basis and market expectations for
future movement at the end of the reporting period and under the economic environments in which the Group operates.
The extent of the impact to post-tax profit or equity due to exchange rate movements of US dollar and Renminbi against
different functional currencies of Group entities, with all other variables held constant, is as follows:
2014 2013
HK$M HK$M
US dollar
If US dollar strengthened by 5% / 10% (2013: 5% / 10%) (note)
Post-tax profit for the year (103) (92)
Equity – hedging reserve (21) (135)
If US dollar weakened by 5% / 10% (2013: 5% / 10%) (note)
Post-tax profit for the year 107 92
Equity – hedging reserve 17 26
Renminbi
If Renminbi strengthened by 2% (2013: 2%)
Post-tax profit for the year 26 53
Equity – hedging reserve – –
If Renminbi weakened by 2% (2013: 2%)
Post-tax profit for the year (26) (53)
Equity – hedging reserve – –
Note: 5% against Indian rupee and 10% against Australian dollar.

262 CLP Holdings 2014 Annual Report
FINANCIAL RISK MANAGEMENT
1. Financial Risk Factors (continued)
Energy portfolio risk
EnergyAustralia purchases and sells substantially all of its electricity energy from a competitive power pool operated by a
statutory and independent corporation, the cost of which is based on spot market prices. Although EnergyAustralia has
a vertically-integrated business structure, it is exposed to risk arising from the electricity generation and retail customer
demand.
In addition to its physical market position, EnergyAustralia enters into trading and non-trading forward electricity contracts
in accordance with EnergyAustralia’s risk management policies. These policies enable EnergyAustralia to enter into
contracts that are considered to be economic hedges against future retail and generation activities. It should be noted that
while mark-to-market gains and losses on economic hedges are recognised in earnings in the period in which they occur,
they will offset the impact of price movements on future profits relating to retail and generation activities occurring at the
time of settlement.
EnergyAustralia is exposed to energy portfolio risk which is associated with the physical asset position of the company
together with the trading assets. EnergyAustralia manages its energy portfolio exposure through an established risk
management framework consisting of policies which place appropriate limits on overall energy market exposures,
delegations of authority on trading, pre-defined product lists, regular reporting of exposures, and segregation of duties.
The corporate governance process also includes the oversight by an Audit & Risk Committee which acts on behalf of the
EnergyAustralia’s Board.
During 2014, EnergyAustralia has switched from VaR to Earnings-at-Risk (EaR) in terms of its financial risk measurement
criteria so as to improve the applicability of its risk analysis to its energy portfolio and to enable the calculation, report and
control of financial risks.
EnergyAustralia uses EaR analysis to measure the potential earning variance from business plan due to the fluctuation
of market prices. EaR uses Monte Carlo simulation to calculate the market risk of a portfolio using historical volatilities
and correlations across a number of risk factors EnergyAustralia is exposed to. This simulation methodology includes all
long (generation and bought contract) and short (retail and sold contract) positions measured over the current and next
financial year. The distribution of value of these positions will vary according to the running regime of EnergyAustralia’s
generation assets, retail load behaviour, contract position, temperature and market price variability. This is measured by
using simulated earnings distribution at a 95% confidence level.
The EaR for EnergyAustralia’s energy portfolio at 31 December 2014 was HK$381 million. No comparative figures have
been presented as it is impractical.
In addition to EaR analysis, EnergyAustralia also uses Volumetric Limits. The Volumetric Limits are measures of the net
physical energy and capacity exposure to spot and forward markets over time in the portfolio. They are used to provide
guidance on portfolio hedging against the maximum long and short volumes allowable in megawatt (MW) terms on an
energy and capacity basis for the net spot and forward market exposures.

CLP Holdings 2014 Annual Report 263
Interest rate risk
The Group’s interest rate risk arises from debt borrowings. Borrowings issued at variable rates expose the Group to cash
flow interest rate risk, whilst borrowings issued at fixed rates expose the Group to fair value interest rate risk. The risks are
managed by monitoring an appropriate mix between fixed and floating rate borrowings, and by the use of interest rate
swaps.
The appropriate level of the fixed / floating mix is determined for each operating company subject to a regular review.
For instance, CLP Power Hong Kong conducts an annual review to determine a preferred fixed / floating interest rate
mix appropriate for its business profile. Each overseas subsidiary and project company has developed its own hedging
programme taking into consideration project debt service sensitivities to interest rate movements, lender requirements, tax
and accounting implications. At 31 December 2014, 58% (2013: 67%) of the Group’s borrowings was at fixed rates.
The sensitivity analysis below presents the effects on the Group’s post-tax profit for the year (as a result of change in
interest expense on floating rate borrowings and impact of shift in yield curve on energy contracts) and equity (as a result
of change in the fair value of derivative instruments which qualify as cash flow hedges). Such amounts accumulated in
equity are reclassified to profit or loss in the periods when the hedged items affect profit or loss, and offset one another in
the profit or loss.
The analysis has been determined based on the exposure to interest rates for both derivative and non-derivative financial
instruments at the end of the reporting period. For floating rate borrowings, the analysis is prepared assuming the amount
of liability outstanding at the end of the reporting period was outstanding for the whole year. The sensitivity to interest
rates used is considered reasonable given the market forecasts available at the end of the reporting period and under the
economic environments in which the Group operates, with all other variables held constant.
2014 2013
HK$M HK$M
Hong Kong dollar
If interest rates were 0.65% (2013: 0.2%) higher
Post-tax profit for the year (96) (17)
Equity – hedging reserve 4 2
If interest rates were 0.65% (2013: 0.2%) lower
Post-tax profit for the year 96 17
Equity – hedging reserve (4) (2)
Indian rupee
If interest rates were 1% (2013: 1%) higher
Post-tax profit for the year (22) (27)
Equity – hedging reserve – –
If interest rates were 1% (2013: 1%) lower
Post-tax profit for the year 22 27
Equity – hedging reserve – –
Australian dollar
If interest rates were 1% (2013: 0.5%) higher
Post-tax profit for the year (189) (26)
Equity – hedging reserve 49 23
If interest rates were 1% (2013: 0.5%) lower
Post-tax profit for the year 177 25
Equity – hedging reserve (49) (24)

264 CLP Holdings 2014 Annual Report
FINANCIAL RISK MANAGEMENT
1. Financial Risk Factors (continued)
Credit risk
The Group has no significant concentrations of credit risk with respect to the sales of electricity and / or gas in Hong Kong
and Australia as their customer bases are widely dispersed in different sectors and industries. The Group has policies
in place to monitor the financial viability of counterparties. CLP Power Hong Kong has established a credit policy to
allow electricity customers to settle their bills within two weeks after issue. To limit the credit risk exposure, CLP Power
Hong Kong also has a policy to require cash deposits or bank guarantees from customers for an amount not exceeding
the highest expected charge for 60 days determined from time to time by reference to the usage of the customers.
EnergyAustralia has policies in place to ensure that sales of products and services are made to major retail customers of an
appropriate credit quality. For EnergyAustralia, receivables are due for settlement no more than 14 to 30 days after issue
and collectability is reviewed on an ongoing basis.
CLP India sell a majority of its electricity output to various state electricity boards in India through power purchase
agreements for 13 to 25 years. Receivables are due for settlement in 15 to 60 days after billing and the management
closely monitor the credit quality and collectability of receivables from those off-takers.
On the treasury side, all finance-related hedging transactions and deposits of the Company and its principal subsidiaries
are made with counterparties with good credit quality in conformance to the Group treasury policies to minimise credit
exposure. Good credit ratings from reputable credit rating agencies and scrutiny of the financial position of non-rated
counterparties are two important criteria in the selection of counterparties. The credit quality of counterparties will
be closely monitored over the life of the transaction. The Group further assigns mark-to-market limits to its financial
counterparties to reduce credit risk concentrations relative to the underlying size and credit strength of each counterparty.
In an attempt to forestall adverse market movement, the Group also monitors potential exposures to each financial
institution counterparty, using VaR methodology. All derivatives transactions are entered into at the sole credit of the
respective subsidiaries, joint ventures and associates without recourse to the Company.
The Group’s exposure to credit risk arises from default of the counterparty, with a maximum exposure equal to the carrying
amount of each financial asset, including trade and other receivables and derivative financial instruments, as reported in
the statement of financial position.
Liquidity risk
Prudent liquidity risk management implies maintaining sufficient cash and making available an adequate amount of
committed credit facilities with staggered maturities to reduce refinancing risk in any year and to fund working capital,
debt servicing, dividend payments, new investments and close out market positions if required. The Group maintains
significant flexibility to respond to opportunities and events by ensuring that committed credit lines are available to meet
future funding requirements. Management also monitor rolling forecasts of the Group’s undrawn borrowing facilities and
cash and cash equivalents on the expected cash flows.
The table below analyses the remaining contractual maturities at the end of the reporting period of the Group’s non-
derivative financial liabilities and derivative financial liabilities (both net settled and gross settled), which are based on
contractual undiscounted cash flows. The Company has no bank loans and other borrowings at 31 December 2014 (2013:
HK$837 million repayable within one year and HK$612 million between one and two years).

CLP Holdings 2014 Annual Report 265
Liquidity risk (continued)
Between Between Within 1 and 2 to Over 1 year 2 years 5 years 5 years Total HK$M HK$M HK$M HK$M HK$M
At 31 December 2014
Non-derivative financial liabilities
Bank loans 8,945 9,254 15,172 7,140 40,511
Other borrowings 2,707 2,136 6,781 29,084 40,708
Obligations under finance leases 3 3 9 40 55
Customers’ deposits 4,653 – – – 4,653
Trade and other payables 21,619 – – – 21,619
Fuel clause account – – 2,966 – 2,966
SoC reserve accounts – – 1,131 – 1,131
Asset decommissioning liabilities – – 1,082 – 1,082
37,927 11,393 27,141 36,264 112,725
Derivative financial liabilities
Net settled
Interest rate swaps 271 229 455 340 1,295
Energy contracts 427 161 258 404 1,250
Gross settled
Forward foreign exchange contracts 38,101 31,740 27,889 678 98,408
Cross currency interest rate swaps 906 1,839 5,594 22,713 31,052
39,705 33,969 34,196 24,135 132,005
At 31 December 2013
Non-derivative financial liabilities
Bank loans 6,873 6,226 9,599 8,822 31,520
Other borrowings 2,602 2,828 5,811 29,891 41,132
Obligations under finance leases 5,409 5,124 13,412 22,710 46,655
Customers’ deposits 4,506 – – – 4,506
Trade and other payables 19,325 – – – 19,325
Fuel clause account – – 1,464 – 1,464
SoC reserve accounts – – 28 – 28
Asset decommissioning liabilities – – 539 – 539
38,715 14,178 30,853 61,423 145,169
Derivative financial liabilities
Net settled
Interest rate swaps 283 218 294 263 1,058
Energy contracts 799 338 1,179 – 2,316
Gross settled
Forward foreign exchange contracts 28,142 31,668 43,189 1,092 104,091
Cross currency interest rate swaps 853 888 4,238 24,605 30,584
30,077 33,112 48,900 25,960 138,049

266 CLP Holdings 2014 Annual Report
FINANCIAL RISK MANAGEMENT
2. Fair Value Estimation and Hierarchy of Financial Instruments
The fair value of financial instruments traded in active markets (such as publicly traded derivatives) is based on quoted
market prices at the end of the reporting period.
The fair value of financial instruments that are not traded in an active market (for example, over-the-counter derivatives)
is determined by using appropriate valuation techniques and making assumptions that are based on market conditions
existing at the end of each reporting period.
For the Group’s financial instruments that are not measured at fair value, their carrying values approximate their fair values.
Financial instruments that are measured at fair value and analysed into the following fair value measurement hierarchy:
Level 1 – quoted prices (unadjusted) in active markets for identical assets or liabilities.
Level 2 – inputs other than quoted prices included within Level 1 that are observable for the asset or liability, either directly
(that is, as prices) or indirectly (that is, derived from prices).
Level 3 – inputs for the asset or liability that are not based on observable market data (that is, unobservable inputs).
The following table presents the Group’s financial instruments that are measured at fair value at 31 December:
Level 1 Level 2 (a) Level 3 (a), (b) Total
HK$M HK$M HK$M HK$M
At 31 December 2014
Financial assets
Available-for-sale investments 480 – 1,227 1,707
Forward foreign exchange contracts – 934 – 934
Foreign exchange options – 74 – 74
Cross currency interest rate swaps – 2,381 – 2,381
Interest rate swaps – 121 – 121
Energy contracts – 150 119 269
480 3,660 1,346 5,486
Financial liabilities
Forward foreign exchange contracts – 117 – 117
Cross currency interest rate swaps – 1,727 – 1,727
Interest rate swaps – 1,177 – 1,177
Energy contracts – 39 711 750
– 3,060 711 3,771

CLP Holdings 2014 Annual Report 267
2. Fair Value Estimation and Hierarchy of Financial Instruments (continued)
Level 1 Level 2 (a) Level 3 (a), (b) Total
HK$M HK$M HK$M HK$M
At 31 December 2013
Financial assets
Available-for-sale investments – – 1,263 1,263
Forward foreign exchange contracts – 1,443 – 1,443
Foreign exchange options – 89 – 89
Cross currency interest rate swaps – 1,649 – 1,649
Interest rate swaps – 289 – 289
Energy contracts – 65 588 653
– 3,535 1,851 5,386
Financial liabilities
Forward foreign exchange contracts – 50 – 50
Cross currency interest rate swaps – 1,589 – 1,589
Interest rate swaps – 904 – 904
Energy contracts – 280 1,896 2,176
– 2,823 1,896 4,719
The Group’s policy is to recognise transfers into / out of fair value hierarchy levels as of the date of the event or change in
circumstances that caused the transfer.
During 2014 and 2013, there were no transfers between Level 1 and Level 2, or into or out of Level 3.
Notes:
(a) The valuation technique and inputs used in the fair value measurements within Level 2 and Level 3 are as follows:
Valuation technique Significant inputs
Available-for-sale investments Discounted cash flow Discount rateForward foreign exchange contracts Discounted cash flow Observable exchange ratesForeign exchange options Garman Kohlhagen Model Observable exchange rates, interest rates and volatility levelsCross currency interest rate swaps Discounted cash flow Observable exchange rates and swap rates of respective currencyInterest rate swaps Discounted cash flow Observable swap rates of respective currencyEnergy contracts Discounted cash flow Brokers’ quotes and observable exchange traded swap and cap rates
(b) Additional information about fair value measurements using significant unobservable inputs (Level 3):
Significant unobservable inputs
Available-for-sale investments (i) Discount rateEnergy contracts (ii) Long term forward electricity price and cap
(i) The valuations are performed and reported twice each year, in line with the Group’s reporting dates, to Group management.
(ii) The finance department of EnergyAustralia includes a team that performs the valuations of non-property assets required for financial reporting purposes, including Level 3 fair values. This team reports directly to EnergyAustralia’s chief financial officer (CFO – EA) and Audit & Risk Committee (ARC – EA). The valuation of Level 3 forward energy contracts involves the use of a short term forward curve which is observable in the liquid market and a long term forward curve which is derived using unobservable inputs. This short term forward curve is reviewed at least once every six months, in line with the Group’s half-yearly reporting dates. While review of the long term forward curve is performed between the CFO – EA, ARC – EA and the valuation team annually due to the lack of market liquidity. Parameter calibrations are delegated to the team with back-testing and review of parameters to be performed annually. Fair value changes analyses are performed on a monthly basis for reasonableness.

268 CLP Holdings 2014 Annual Report
FINANCIAL RISK MANAGEMENT
2. Fair Value Estimation and Hierarchy of Financial Instruments (continued)
The movements of Level 3 financial instruments for the years ended 31 December are as follows:
2014 2013 Available- Available- for-sale Energy for-sale Energy Investments Contracts Total Investments Contracts Total
HK$M HK$M HK$M HK$M HK$M HK$M
Opening balance 1,263 (1,308) (45) 1,263 (2,034) (771)
Total gains / (losses) recognised in
Profit or loss – 864 864 – (971) (971)
Other comprehensive income 3 29 32 – 450 450
Purchases – 42 42 – 681 681
Settlements (39) (219) (258) – 566 566
Closing balance 1,227 (592) 635 1,263 (1,308) (45)
Total gains / (losses) for the year
included in profit or loss and
presented in fuel and other
operating expenses – 864 864 – (971) (971)
In respect of the assets and
liabilities held at the end of the
reporting period, the unrealised
(losses) / gains for the year and
presented in fuel and other
operating expenses – (373) (373) – 237 237
Changing unobservable inputs used in the Level 3 valuation to reasonable alternative assumptions would not change
significantly the fair values recognised.

CLP Holdings 2014 Annual Report 269
3. Offsetting Financial Assets and Financial Liabilities
The following financial assets and liabilities are subject to offsetting, enforceable master netting arrangements or similar
agreements:
Gross Net amounts amounts of of financial recognised assets / financial liabilities Related amounts liabilities / included in not set off in the Gross assets set the respective consolidated statement amounts of off in the line of the of financial position recognised consolidated consolidated Financial financial statement of statement of collateral assets / financial financial Financial received / Net liabilities position position instruments pledged amount
HK$M HK$M HK$M HK$M HK$M HK$M
At 31 December 2014
Financial assets
Bank balances, cash and other
liquid funds 355 – 355 (355) – –
Trade and other receivables 4,239 – 4,239 (2,142) (2,097) –
Derivative financial instruments 1,511 (398) 1,113 (748) – 365
6,105 (398) 5,707 (3,245) (2,097) 365
Financial liabilities
Customers’ deposits 4,652 – 4,652 (2,097) – 2,555
Bank loans and other borrowings 11,109 – 11,109 – (2,497) 8,612
Derivative financial instruments 2,769 (398) 2,371 (751) – 1,620
18,530 (398) 18,132 (2,848) (2,497) 12,787
At 31 December 2013
Financial assets
Bank balances, cash and other
liquid funds 449 – 449 (449) – –
Trade and other receivables 7,164 – 7,164 (1,924) (2,043) 3,197
Derivative financial instruments 2,021 (196) 1,825 (955) – 870
9,634 (196) 9,438 (3,328) (2,043) 4,067
Financial liabilities
Customers’ deposits 4,506 – 4,506 (2,043) – 2,463
Bank loans and other borrowings 11,272 – 11,272 – (2,373) 8,899
Derivative financial instruments 3,948 (196) 3,752 (955) – 2,797
19,726 (196) 19,530 (2,998) (2,373) 14,159
Note: For derivative financial instruments, the Group enters into derivative transactions under International Swaps and Derivatives Association (ISDA) master agreements in which there is a set-off provision. Under certain circumstances, for example, when a credit event such as a default occurs, all outstanding transactions under the agreement are terminated, a termination value is then assessed and only a single net amount is payable in settlement of all transactions. The ISDA agreements do not meet the criteria for offsetting in the consolidated statement of financial position since the Group does not have any currently legally enforceable right to offset recognised amounts. The right to offset is enforceable only on the occurrence of future events such as a default on the bank transactions or other credit events. For other financial instruments, the rights to offset are enforceable in the event of default of payments.

270 CLP Holdings 2014 Annual Report
FINANCIAL RISK MANAGEMENT
4. Capital Management
The primary objective of the Group’s capital management is to safeguard the Group’s ability to continue as a going
concern, maintain a strong credit rating and a healthy capital ratio to support the business and to enhance shareholder
value.
The Group manages its capital structure and makes adjustments to it in light of changes in economic conditions
and business strategies. To maintain or adjust the capital structure, the Group may adjust the dividend payments to
shareholders, issue new shares or raise and repay debts. The Group’s capital management objectives, policies or processes
were unchanged during 2014 and 2013.
The Group monitors capital using “total debt to total capital” and “net debt to total capital” ratios. These ratios are as
follows:
2014 2013
HK$M HK$M
Total debt (a) 67,435 56,051
Net debt (b) 63,042 50,818
Total equity (c) 102,662 87,481
Total capital (based on total debt) (d) 170,097 143,532
Total capital (based on net debt) (e) 165,704 138,299
Total debt to total capital (based on total debt) ratio (%) 39.6 39.1
Net debt to total capital (based on net debt) ratio (%) 38.0 36.7
The slight increase in total debt to total capital and net debt to total capital ratios were mainly due to the moderate net
impact by CAPCO and PSDC acquisitions as incremental debts was largely offset by increase in shareholder’s advances
from CSG HK, issuance of perpetual capital securities and incremental earnings.
Certain entities of the Group are subject to certain loan covenants. For both 2014 and 2013, there is no material non-
compliance with those loan covenants.
Notes:
(a) Total debt equals to bank loans and other borrowings.
(b) Net debt equals to total debt less bank balances, cash and other liquid funds.
(c) Total equity equals to equity plus the advances from non-controlling interests.
(d) Total capital (based on total debt) equals to total debt plus total equity.
(e) Total capital (based on net debt) equals to net debt plus total equity.

CLP Holdings 2014 Annual Report 271
SCHEME OF CONTROL STATEMENT
CLP Power Hong Kong Limited and Castle Peak Power Company Limited
Overview
In Hong Kong, CLP Power Hong Kong Limited (CLP Power Hong Kong) operates a vertically-integrated electricity generation,
transmission and distribution business. The generating plants in Hong Kong are owned by Castle Peak Power Company Limited
(CAPCO), in which CLP Power Hong Kong owned 40% and was further increased to 70% since May 2014. CLP Power Hong
Kong builds and operates CAPCO’s power stations under contract and is the sole customer for CAPCO’s electricity which CLP
Power Hong Kong transmits and distributes to its customers in Kowloon and the New Territories. CLP Power Hong Kong owns
the transmission and distribution network.
Since financial year 1964, the electricity-related operations of CLP Power Hong Kong and CAPCO (the SoC Companies)
have been governed by a Scheme of Control Agreement (SoC) with the Hong Kong Government. The SoC specifies the SoC
Companies’ obligations to supply adequate and reliable electricity supplies to customers at the lowest reasonable cost and the
mechanism for Hong Kong Government to monitor their financial affairs and operating performance. In return, CLP Power
Hong Kong is allowed to charge tariffs designed to recover the operating costs (including tax) and allowed net return of the SoC
Companies.
The current SoC took effect from 1 October 2008. The SoC covers a period of 10 years to 30 September 2018, with the Hong
Kong Government having the right to extend by 5 years on the same terms to 30 September 2023 by giving notice before 1
January 2016. In the event that the 5 years extension option is not exercised by the Hong Kong Government, the SoC Companies
will continue to earn the permitted return until 30 September 2023 on all approved investments.
The current SoC includes a provision to give the SoC Companies protection for stranded costs, which may arise as a result of
future changes to the market structure which adversely impact on the SoC Companies’ ability to recover and to earn returns
on existing investments made in good faith in accordance with the SoC. These costs will include the costs of investments, fuel
and power purchase agreements previously approved by the Hong Kong Government. If stranded costs arise after the SoC
Companies have implemented mitigation measures reasonably required by the Hong Kong Government, the SoC Companies
are entitled to recover them from the market, consistent with international practice. Three years before market changes
are introduced, the SoC Companies and the Hong Kong Government will agree on the amount of stranded costs and the
mechanism for their recovery by the SoC Companies.
Tariff Setting Mechanism
For each year, CLP Power Hong Kong designs the net tariff it charges to cover the SoC Companies’ operating costs and allowed
net return. The net tariff consists of the following components:
(i) basic tariff rate which is derived by taking into account the annual forecast of (a), (b) and (c) below, using the formula
“(a-b) / c”:
(a) the allowed net return and operating costs including the standard cost of fuel; generation, transmission, distribution
and administration expenses; depreciation; interest expenses; and taxes;
(b) 80% of the profit on electricity sale to Mainland China; and
(c) local unit sales as determined by the load forecast.
(ii) fuel clause charge or rebate (Fuel Cost Adjustment) which represents the difference between the costs of fuel (including
natural gas, coal and oil) and the standard cost recovered through the basic tariff rate.
Any difference between the actual profit for SoC operations and the permitted return for the year is transferred to or from a
Tariff Stabilisation Fund. The Tariff Stabilisation Fund does not form part of distributable shareholders’ funds and represents a
liability in the accounts of CLP Power Hong Kong. A charge on the average balance of the Tariff Stabilisation Fund is credited
to the Rate Reduction Reserve in the accounts of CLP Power Hong Kong, which balance as at the end of each year is to be
transferred to the Tariff Stabilisation Fund in the following year.

272 CLP Holdings 2014 Annual Report
SCHEME OF CONTROL STATEMENT
Permitted and Net Return
The permitted and net return that the SoC Companies are allowed under the SoC are calculated as follows:
• The annual permitted return under the SoC is 9.99% of the SoC Companies’ average net fixed assets other than renewable
energy investments; and 11% for renewable energy investments.
• The net return is the permitted return after the deduction or adjustment of the following items:
(a) interest up to a maximum of 8% per annum on borrowed capital arranged for financing fixed assets;
(b) a charge of the average one-month Hong Kong interbank offered rate on the average balance of the Tariff Stabilisation
Fund under the SoC, which is credited to the Rate Reduction Reserve;
(c) an excess capacity adjustment of 9.99% under the SoC on the average excess capacity expenditure less an allowed
interest charge up to 8% per annum on the average excess capacity expenditure;
(d) interest up to 8% per annum on the increase in average balance of the customers’ deposits in excess of the balance as
at 30 September 1998; and
(e) performance related incentives / penalties adjustments are in the range of -0.03% to +0.1% on the average net fixed
assets with respect to customer performance, energy efficiency and renewables performance applicable to each full
calendar year under the SoC.
• The rate of return on average net fixed assets of the SoC Companies for the year ended 31 December 2014 was 9.18% (2013:
9.11%).
The net return is divided between the SoC Companies in accordance with the provisions of the agreements between the SoC
Companies. These provisions state that each company will receive that proportion of the total net return represented by the net
return that company would receive if it were the only company under the SoC and the net return were calculated solely on the
basis of its own financial statements. In year 2014, 66% (2013: 65%) of the net return was allocated to CLP Power Hong Kong
and 34% (2013: 35%) to CAPCO.
The calculations shown on page 273 are in accordance with the SoC and the agreements between the SoC Companies.

CLP Holdings 2014 Annual Report 273
For the year ended 31 December
2014 2013
HK$M HK$M
SoC revenue 36,092 33,184
Expenses
Operating costs 3,842 3,711
Fuel 10,375 9,645
Purchases of nuclear electricity 4,867 4,619
Provision for asset decommissioning (10) 52
Depreciation 3,901 4,475
Operating interest 834 863
Taxation 2,048 1,649
25,857 25,014
Profit after taxation 10,235 8,170
Interest on borrowed capital 856 887
Adjustment for performance (incentives) / penalties (49) (48)
Adjustments required under the SoC
(being share of profit on sale of electricity to
Mainland China attributable to the SoC Companies) (54) (64)
Profit for SoC 10,988 8,945
Transfer (to) / from Tariff Stabilisation Fund (1,030) 693
Permitted return 9,958 9,638
Deduct interest on / Adjustment for
Borrowed capital as above 856 887
Performance (incentives) / penalties as above (49) (48)
Tariff Stabilisation Fund to Rate Reduction Reserve 1 1
808 840
Net return 9,150 8,798
Divisible as follows:
CLP Power Hong Kong 6,070 5,744
CAPCO 3,080 3,054
9,150 8,798
CLP Power Hong Kong’s share of net return
CLP Power Hong Kong 6,070 5,744
Interest in CAPCO 1,852 1,222
7,922 6,966

274 CLP Holdings 2014 Annual Report
FIVE-YEAR SUMMARY: CLP GROUP STATISTICS
Economic
2014 2013 2012 2011 2010
Consolidated Operating Results, HK$MRevenue
Electricity business in Hong Kong (HK) 35,303 33,840 33,643 31,518 29,944Energy business outside HK 56,633 70,352 70,983 59,906 28,124Others 323 338 235 210 342
Total 92,259 104,530 104,861 91,634 58,410
Operating profit 14,895 8,906 13,101 13,188 12,397
EarningsElectricity business in HK 7,777 6,966 6,654 6,339 6,129Other investments / operations 2,907 2,790 3,316 4,492 3,476Gains / (losses) on acquisitions / sales of investments 1,953 (75) – 876 356Provisions for fixed assets, joint ventures and other assets (1,736) (3,696) (409) (1,933) (258)Revaluation gains on properties 245 – – 225 –Tax consolidation benefit from Australia – – 105 – 989Other one-off items from Australia 697 524 (790) (192) 97Unallocated net finance costs (36) (26) (74) (48) (18)Unallocated Group expenses (586) (423) (490) (471) (439)
Total 11,221 6,060 8,312 9,288 10,332
Dividends 6,619 6,493 6,301 6,063 5,967
Capital expenditure, owned and leased assets 9,446 12,052 11,230 15,798 20,032
Depreciation & amortisation, owned and leased assets 6,791 7,592 7,021 6,353 5,065
Consolidated Statement of Cash Flows, HK$MNet cash inflow from operating activities 21,966 21,021 23,915 18,062 16,085
Consolidated Statement of Financial Position, HK$MSoC fixed assets 101,420 67,057 63,599 60,142 57,247Other fixed assets 34,963 63,846 70,730 70,240 60,213Goodwill and other intangible assets 31,129 23,847 28,479 27,369 9,150Interests in joint ventures 11,176 19,940 19,197 18,226 20,476Interests in associates 786 1,675 1,856 1,465 2,378Other non-current assets 9,664 8,601 7,742 9,791 11,177Current assets 25,525 26,719 37,153 27,055 18,714
Total assets 214,663 211,685 228,756 214,288 179,355
Shareholders’ funds 88,013 87,361 91,127 81,259 79,661Perpetual capital securities 5,791 – – – –Other non-controlling interests 2,155 120 74 93 97
Equity 95,959 87,481 91,201 81,352 79,758
Bank loans and other borrowings 67,435 56,051 66,198 65,521 44,623Obligations under finance leases 27 27,976 27,055 27,396 27,100SoC reserve accounts 1,131 28 1,245 643 1,509Other current liabilities 27,771 25,251 28,147 23,642 16,420Other non-current liabilities 22,340 14,898 14,910 15,734 9,945
Total liabilities 118,704 124,204 137,555 132,936 99,597
Equity and total liabilities 214,663 211,685 228,756 214,288 179,355
Per Share Data, HK$Shareholders’ funds per share 34.84 34.58 36.07 33.77 33.11Earnings per share 4.44 2.40 3.45 3.86 4.29Dividends per share 2.62 2.57 2.57 2.52 2.48

CLP Holdings 2014 Annual Report 275
2014 2013 2012 2011 2010
Per Share Data, HK$ (continued)Closing share price
Highest 68.00 69.85 68.95 74.95 64.65Lowest 56.30 60.35 62.30 59.95 52.15As at year-end 67.25 61.30 64.85 66.05 63.10
RatiosReturn on equity, % 12.8 6.8 10.1 1 11.5 13.7Total debt to total capital, % 39.6 39.1 42.1 44.6 35.9Net debt to total capital, % 38.0 36.7 36.8 43.1 33.3EBIT interest cover, times 6 3 4 4 7Price / Earnings, times 15 26 19 17 15Dividend yield, % 3.9 4.2 4.0 3.8 3.9Dividend pay-out (total earnings), % 59.0 107.1 74.5 65.3 57.8Dividend pay-out (operating earnings), % 65.8 69.8 65.9 58.8 65.2
Group Generating Capacity(owned/operated/under construction) 2, MW– by region Hong Kong 6,908 6,908 6,908 6,908 6,908 Mainland China 6,740 5,760 5,911 5,957 5,899 India 3,056 3,026 2,947 2,594 2,461 Southeast Asia & Taiwan 285 285 285 282 868 Australia 4,533 5,533 5,616 5,616 3,211
21,522 21,512 21,667 21,357 19,347
– by status Operational 20,176 20,974 21,175 19,707 17,145 Construction 1,346 538 492 1,650 2,202
21,522 21,512 21,667 21,357 19,347
Notes:
1 The 2012 figure excluded the effect of the 5% share placement on 20 December 2012 to give a more accurate average shareholders’ funds in 2012.
2 Group generating capacity (in MW) is incorporated on the following basis: (a) CAPCO on 100% capacity as stations operated by CLP Power Hong Kong; (b) PSDC (during 2010 to 2013) and Ecogen on 100% as having right to use; and (c) other stations (including PSDC from 2014) on the proportion of the Group’s equity interests.
A ten-year summary is on our website
0
20,000
40,000
60,000
80,000
100,000
Total Assets Earnings Shareholders’ Funds
HK$M
(2,000)
2,000
4,000
6,000
8,000
10,000
12,000
014121110 13
Total earnings
Electricity business in Hong Kong
Other investments / operations (after unallocated costs)
HK$M HK$
Shareholders’ funds per share
Shareholders’ funds
HK$M
Current assets
Non-current assets
0
40,000
80,000
120,000
160,000
200,000
240,000
14131211100
5
10
15
20
25
30
35
40
1413121110

276 CLP Holdings 2014 Annual Report
FIVE-YEAR SUMMARY: CLP GROUP STATISTICS
Environmental
Global HKEx Reporting ESG Initiative Reporting Performance (GRI) G4 GuideIndicators Units 2014 2013 2012 2011 2010 Reference Reference
Resource Use & Emissions (1)
Coal consumed (for power generation) TJ 541,865 433,763 361,819 419,357 370,427 G4-EN3 B2.1Gas consumed (for power generation) TJ 63,268 73,510 86,200 101,166 135,556 G4-EN3 B2.1Oil consumed (for power generation) TJ 2,345 1,973 8,200 1,508 1,272 G4-EN3 B2.1
CO2e emissions from power generation kT 53,258 44,258 38,464 44,450 41,908 G4-EN15 B1.2 (Scopes 1 & 2)CO2 emissions from power generation kT 53,044 44,076 38,319 44,298 41,784 G4-EN15 B1.2 (Scopes 1 & 2) (2)
Nitrogen oxides emissions (NOx) kT 74.6 50.2 42.9 48.1 39.3 G4-EN21 B1.1Sulphur dioxide emissions (SO2) kT 93.0 50.5 35.1 35.8 37.4 G4-EN21 B1.1Total particulates emissions kT 11.5 5.5 4.7 6.2 6.4 G4-EN21 B1.1
Water withdrawal (4) G4-EN8 B2.2 from marine water resources Mm3 4,774.5 4,987.9 4,648.6 4,688.6 4,670.7 from freshwater resources Mm3 52.9 37.2(3) 35.4 37.9 41.7 from municipal sources Mm3 6.6 6.2(3) 5.8 5.5 4.3
Total Mm3 4,834.0 5,031.0 4,689.6 4,732.0 4,716.6
Water discharged (4) G4-EN22 cooling water to marine water bodies Mm3 4,774.5 4,987.9 4,648.6 4,688.6 4,670.7 treated wastewater to marine water bodies Mm3 1.3 1.2 1.1 0.8 0.8 treated wastewater to freshwater bodies Mm3 14.5 10.1 14.0 18.1 18.4 wastewater to sewerage Mm3 1.8 1.5 1.7 1.8 1.6 wastewater to other destinations Mm3 0.1 0.1 0.3 0.6 0.7
Total Mm3 4,792.2 5,000.8 4,665.7 4,710.0 4,692.1
Hazardous waste produced (4)(5) T (solid) / kl (liquid) 484 / 2,783 337 / 1,228 262 / 1,500 799 / 912 803 / 1,167 G4-EN23 B1.3Hazardous waste recycled (4)(5) T (solid) / kl (liquid) 89 / 1,463 34 / 981 25 / 1,023 36 / 831 39 / 844 G4-EN23Non-hazardous waste produced (4)(5) T (solid) / kl (liquid) 21,142 / 78 7,700 / 0 10,830 / 21 6,301 / 0 8,029 / 2 G4-EN23 B1.4Non-hazardous waste recycled (4)(5) T (solid) / kl (liquid) 4,172 / 78 1,853 / 0 2,719 / 4 3,699 / 0 3,199 / 0 G4-EN23
Environmental regulatory non-compliances resulting in fines or prosecutions number 1 0 0 0 0 G4-EN29Environmental licence limit exceedances & other non-compliances number 4 4 1 5 3 G4-EN29
Climate Vision 2050 Target Performance (Equity Basis) (6)
Total renewable energy generation capacity % (MW) 14.1 (2,660) 16.3 (2,579) 20.2 (2,734) 18.3 (2,424) 16.8 (2,286)Non-carbon emitting generation capacity % (MW) 16.7 (3,152) 19.4 (3,071) 23.8 (3,226) 22.0 (2,916) 20.4 (2,778)Carbon dioxide emissions intensity of CLP Group’s generation portfolio kg CO2 / kWh 0.84 (7) 0.82 (7) 0.77 0.80 0.80 G4-EN18 B1.2
Notes:(1) Covered operating facilities where CLP has operational control for the full calendar reporting year.(2) Includes Yallourn and Hallett facilities’ CO2e emissions as CO2 emissions data were not available.(3) Data updated to align with reporting definition.(4) The data has been independently verified at facility level by the third party.(5) Waste categorised in accordance with local regulations.(6) “Equity basis” includes all majority and minority share facilities in the CLP Group portfolio.(7) CGN Wind not included as per the Greenhouse Gas Protocol due to its accounting categorisation.
All 2014 Environmental data have been independently verified by PricewaterhouseCoopers except those numbers which are
shaded in grey.

CLP Holdings 2014 Annual Report 277
FIVE-YEAR SUMMARY: CLP GROUP STATISTICS
Social (1)
Global HKEx Reporting ESG Initiative ReportingPerformance (GRI) G4 GuideIndicators Units 2014 2013 2012 2011 2010 Reference Reference
EmployeesEmployees based on geographical location G4-9 A1.1 Hong Kong number 4,405 4,394 4,345 4,259 4,228 Mainland China number 480 469 539 552 574 Australia number 2,143 1,745 1,302 1,111 939 India number 359 360 391 374 309 Other locations (Southeast Asia & Macau) number – – 4 20 25
Total number 7,387 6,968 6,581 6,316 6,075
Employees eligible to retire within the next five years (2) EU15 Hong Kong % 15.4% 15.2% 14.0% 13.4% 12.5% Mainland China % 11.1% 12.2% 11.9% 9.6% 11.3% Australia % 9.2% 10.9% 11.9% 9.6% 9.5% India % 1.4% 0.8% 0.8% 1.1% 1.3% Other locations (Southeast Asia & Macau)(3) % – – – 0.0% 0.0%
Total % 12.4% 13.0% 12.6% 11.6% 11.3%
Voluntary staff turnover rate (4)(5) G4-LA1 A1.2 Hong Kong % 2.6% 1.9% – – – Mainland China % 2.5% 2.6% – – – Australia % 11.6% 9.4% – – – India % 13.2% 10.1% – – – Other locations (Southeast Asia & Macau) (3) % – – – – –
Training DataTraining per employee (6)(7) average hours 43.4 5.5 5.6 5.4 5.5 G4-LA9 A3.2
Safety (8)
Fatalities (employees only) (9) number 0 0 0 0 1 G4-LA6 A2.1Fatalities (contractors only) (9) number 1 1 N/A N/A N/A G4-LA6 A2.1Fatality Rate (employees only) (10) rate 0.00 0.00 N/A N/A N/A G4-LA6 A2.1Fatality Rate (contractors only) (10) rate 0.01 0.01 N/A N/A N/A G4-LA6 A2.1Lost Time Injury (employees only) (11) number 4 5 N/A N/A N/A G4-LA6Lost Time Injury (contractors only) (11) number 19 28 N/A N/A N/A G4-LA6Lost Time Injury Rate (employees only) (10)(11) rate 0.05 0.06 N/A N/A N/A G4-LA6Lost Time Injury Rate (contractors only) (10)(11) rate 0.15 0.22 N/A N/A N/A G4-LA6Total Recordable Injury Rate (employees only) (10)(12) rate 0.26 0.23 N/A N/A N/A G4-LA6Total Recordable Injury Rate (contractors only) (10)(12) rate 0.51 0.50 N/A N/A N/A G4-LA6Days lost / charged (employees only) (13) number 105 29 240 674 6,010 G4-LA6 A2.2
GovernanceConvicted cases of corruption cases 0 0 0 0 0 G4-SO5 C3.1Breaches of Code of Conduct cases 7 12 14 6 4
Notes:(1) For detailed definitions of the Company boundaries which apply to the Employees data and Safety data, please refer to the “About this Report” chapter of the
Sustainability Report. (2) The percentages given refer to full-time permanent staff within each location, who are eligible to retire within the next five years.(3) There were no permanent staff in “Other locations (Southeast Asia & Macau)” since 2012.(4) Voluntary turnover is employees leaving the organisation voluntarily and does not include dismissal, retirement, separation under a separation scheme or end of
contract.(5) In Mainland China and Australia, voluntary staff turnover rates refer to both permanent and short-term employees. In all other regions, voluntary staff turnover
rates refer to permanent employees only.(6) Training data for Australia does not include Mount Piper and Wallerawang as the data is not available.(7) Training per employee in 2014 is reported in average hours of training. Prior to 2014, Training per employee is reported in average days of training.(8) The system of rules applied in recording and reporting accident statistics complies with the International Labour Organization (ILO) Code of Practice on
Recording and Notification of Occupational Accidents and Diseases. Safety data are based on information at the time of publication.(9) Fatality is the death of an employee or contractor personnel as a result of an occupational injury incident in the course of employment.(10) All rates are normalised to 200,000 worked hours, which is approximately equal to the number of hours worked by 100 people in one year.(11) Lost Time Injury is an occupational injury sustained by an employee for which the employee misses one or more scheduled workdays after the day of the injury.
It does not include the day of the injury, nor days the injured person was not scheduled to work. Lost Time Injury does not include restricted work injury.(12) Total Recordable Injury is the sum of all occupational injuries other than first aid cases, which includes all Fatalities, Lost Time Injury, Restricted Work Injury, and
Medical Treatment Cases.(13) Days lost or charged are the days that the employee was away from work because of an occupational injury or illness, measured in calendar days, not including
the day of the occupational injury or illness.
All 2014 social data have been independently verified by PricewaterhouseCoopers except those numbers which are shaded in grey.

278 CLP Holdings 2014 Annual Report
FIVE-YEAR SUMMARY: SCHEME OF CONTROL FINANCIAL & OPERATING STATISTICSCLP Power Hong Kong Limited and Castle Peak Power Company Limited
2014 2013 2012 2011 2010
SoC Financial Statistics, HK$MCombined Profit & Loss StatementProfit for SoC 10,988 8,945 9,388 8,068 8,420Transfer (to) / from Tariff Stabilisation Fund (1,030) 693 (75) 868 148
Permitted return 9,958 9,638 9,313 8,936 8,568Less: Interest on / Adjustment for Borrowed capital 856 887 859 841 763 Performance (incentives) / penalties (49) (48) (47) (45) (43) Tariff Stabilisation Fund 1 1 2 2 3
Net return 9,150 8,798 8,499 8,138 7,845
Combined Balance SheetNet assets employed Fixed assets 101,420 97,918 95,243 91,187 87,713 Non-current assets 684 1,091 1,904 2,310 1,698 Current assets 6,770 6,778 11,530 4,913 4,367
108,874 105,787 108,677 98,410 93,778 Less: current liabilities 18,518 17,142 22,248 17,439 15,194
Net assets 90,356 88,645 86,429 80,971 78,584 Exchange fluctuation account (565) (939) (907) (1,428) (962)
89,791 87,706 85,522 79,543 77,622
Represented by Equity 42,456 45,067 43,070 41,845 39,960 Long-term loans and other borrowings 28,340 26,873 28,254 25,283 25,248 Deferred liabilities 17,937 15,747 13,486 11,778 10,909 Tariff Stabilisation Fund 1,058 19 712 637 1,505
89,791 87,706 85,522 79,543 77,622
Other SoC InformationTotal electricity sales 35,969 33,064 33,842 30,824 29,917Capital expenditure 7,800 7,479 8,621 7,774 7,748Depreciation 3,901 4,475 4,146 3,863 3,427
SoC Operating StatisticsCustomers and SalesNumber of customers (thousand) 2,460 2,429 2,400 2,378 2,347Sales analysis, millions of kWh Commercial 13,099 12,935 12,917 12,670 12,642 Manufacturing 1,791 1,832 1,890 1,886 1,952 Residential 9,450 8,658 8,900 8,594 8,457 Infrastructure and Public Services 8,585 8,358 8,288 8,018 7,878
Local 32,925 31,783 31,995 31,168 30,929 Export 1,226 1,650 1,838 2,957 2,609
Total Electricity Sales 34,151 33,433 33,833 34,125 33,538
Annual change, % 2.1 (1.2) (0.9) 1.8 (2.2)Local consumption, kWh per person 5,516 5,379 5,466 5,373 5,365Local sales, HK¢ per kWh (average) Basic Tariff 88.6 84.0 84.2 80.1 80.1 Fuel Cost Adjustment * 22.4 22.4 17.8 14.1 11.5
Total Tariff 111.0 106.4 102.0 94.2 91.6 Rent and Rates Special Rebate ** – (1.7) (3.3) – –
Net Tariff 111.0 104.7 98.7 94.2 91.6
Annual change in Basic Tariff, % 5.5 (0.2) 5.1 – 3.4 Annual change in Total Tariff, % 4.3 4.3 8.3 2.8 2.8 Annual change in Net Tariff, % 6.0 6.1 4.8 2.8 2.8

CLP Holdings 2014 Annual Report 279
2014 2013 2012 2011 2010
Generation (Including Affiliated Generating Companies)Installed capacity, MW 8,888 8,888 8,888 8,888 8,888System maximum demand Local, MW 7,030 6,699 6,769 6,702 6,766 Annual change, % 4.9 (1.0) 1.0 (0.9) 5.9 Local and Mainland China, MW 7,502 7,615 7,431 7,798 7,349 Annual change, % (1.5) 2.5 (4.7) 6.1 (3.5)
System load factor, % 57.8 55.7 57.5 55.3 57.2Generation by CAPCO stations, millions of kWh 27,533 26,994 25,894 26,800 26,019Sent out, millions of kWh – From own generation 25,597 25,084 24,102 24,955 24,552 Net transfer from Landfill gas generation 3 4 3 5 5 GNPS / GPSPS / Others 10,084 9,757 11,172 10,558 10,350
Total 35,684 34,845 35,277 35,518 34,907
Fuel consumed, terajoules – Oil 1,785 1,491 7,900 1,044 844 Coal 215,367 205,198 182,651 188,407 148,229 Gas 42,465 47,545 50,420 57,665 83,007
Total 259,617 254,234 240,971 247,116 232,080
Cost of fuel, HK$ per gigajoule – Overall 39.66 38.02 40.56 35.33 34.13Thermal efficiency, % based on units sent out 35.5 35.5 36.0 36.4 38.1Plant availability, % 83.7 85.2 82.1 85.4 79.2
Transmission and DistributionNetwork, circuit kilometres 400kV 555 555 555 555 554 132kV 1,643 1,587 1,581 1,531 1,528 33kV 27 27 27 27 27 11kV 12,475 12,328 12,074 11,809 11,658Transformers, MVA 61,450 60,430 60,136 59,454 58,929Substations – Primary 224 218 216 213 213 Secondary 13,845 13,692 13,536 13,361 13,208
Employees and ProductivityNumber of SoC employees 3,807 3,819 3,791 3,734 3,709Productivity, thousands of kWh per employee 8,635 8,353 8,504 8,375 8,340
* The Fuel Cost Adjustment has replaced the Fuel Clause Charge effective from October 2014.
** While the rent and rates appeals are still progressing, CLP Power Hong Kong provided customers with a Rent and Rates Special Rebate of 3.3 cents and 2.1 cents per unit in 2012 and January to mid October 2013 respectively, rebating to customers all interim refunds received from the Government in 2012 and 2013 for overcharged rent and rates.
A ten-year summary is on our website
GWh
Electricity Sales by Sector Installed Capacity SoC Net Fixed Asset
MW HK$M
PSDC CAPCO CLP Power Hong KongCAPCO
0
5,000
10,000
15,000
20,000
25,000
30,000
35,000
40,000
14131211100
2,000
4,000
6,000
8,000
10,000
14131211100
20,000
40,000
60,000
80,000
100,000
120,000
1413121110
GNPJVCExport
Infrastructure and Public Services
Manufacturing
CommercialResidential