Embed Size (px)
Citation preview

Empowered lives. Resilient nations.
Financing across sectors
for sustainable development
Guidance Note
April 2019
Copyright © UNDP
All rights reservedApril 2019
DisclaimerThe views expressed in this publication are those of the authors and do not necessarily represent those of UNDP.
United Nations Development ProgrammeOne United Nations Plaza, New York, NY, 10017, USA.
Empowered lives. Resilient nations.
Empowered lives. Resilient nations.
Financing across sectors
for sustainable development
Guidance Note
April 2019
4
Guidance Note – Financing across sectors for sustainable development
Table of Contents
List of Figures, Tables and Boxes ...........................................................................................6
Abbreviations .................................................................................................................................8
Acknowledgments .......................................................................................................................10
Overview ...........................................................................................................................................11
1. Background ................................................................................................................................15
1.1 Challenges and opportunities within financing for development ........................16
1.2 What is co-financing and how can it advance the SDGs? ..........................................19
1.3 Co-financing versus similar funding mechanisms .......................................................21
2. Approach and key considerations ...................................................................................23
2.1 Impetus ........................................................................................................................................24
2.2 Basic requirements ..................................................................................................................26
2.3 Variance in co-financing inputs and approaches .........................................................27
2.4 Barriers and enablers ..............................................................................................................28
3. Steps for national authorities, development partners and economists .......39
3.1 Political steps .............................................................................................................................40
3.2 Technical steps ..........................................................................................................................41
3.3 Complementary tools, approaches and guidelines .....................................................42
4. Real-world applications ........................................................................................................45
4.1 SDG planning in Malawi ........................................................................................................46
4.2 Vocational rehabilitation in Sweden .................................................................................53
4.3 School health and nutrition in Zambia ............................................................................55
4.4 Road safety in Great Britain ..................................................................................................57
5
Guidance Note – Financing across sectors for sustainable development
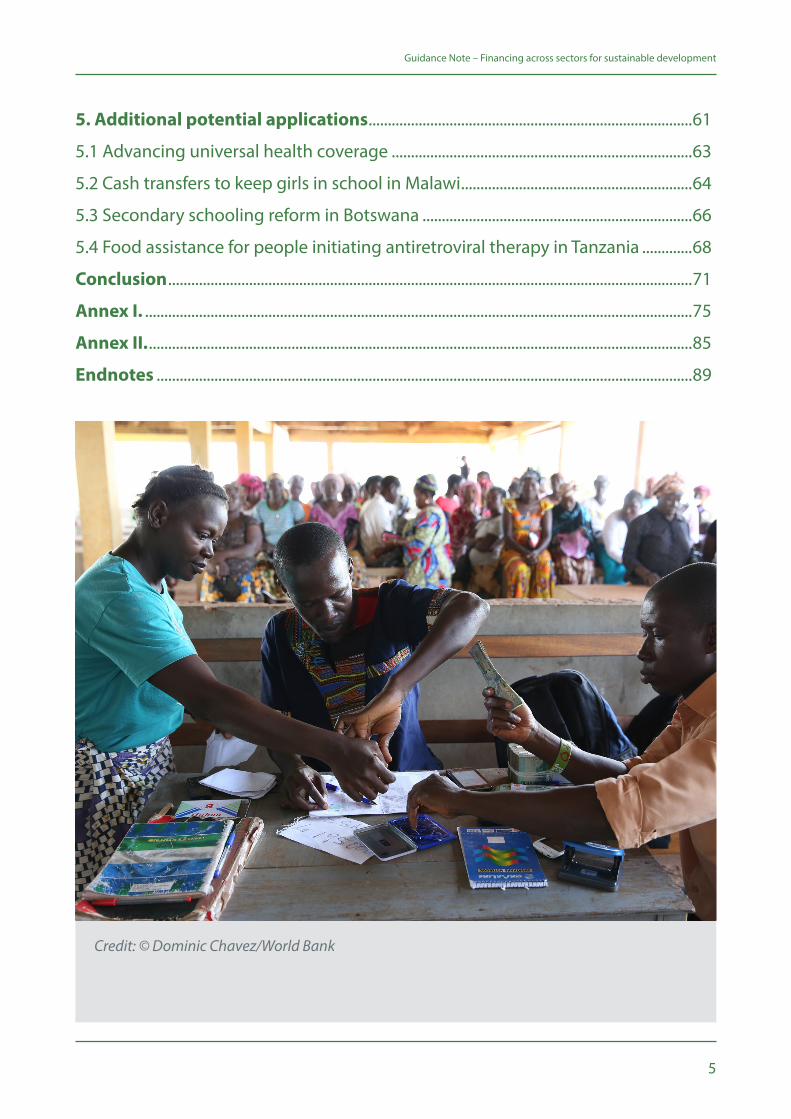
5. Additional potential applications ....................................................................................61
5.1 Advancing universal health coverage ..............................................................................63
5.2 Cash transfers to keep girls in school in Malawi ............................................................64
5.3 Secondary schooling reform in Botswana ......................................................................66
5.4 Food assistance for people initiating antiretroviral therapy in Tanzania .............68
Conclusion ........................................................................................................................................71
Annex I. ..............................................................................................................................................75
Annex II. .............................................................................................................................................85
Endnotes ...........................................................................................................................................89
Credit: © Dominic Chavez/World Bank
6
Guidance Note – Financing across sectors for sustainable development
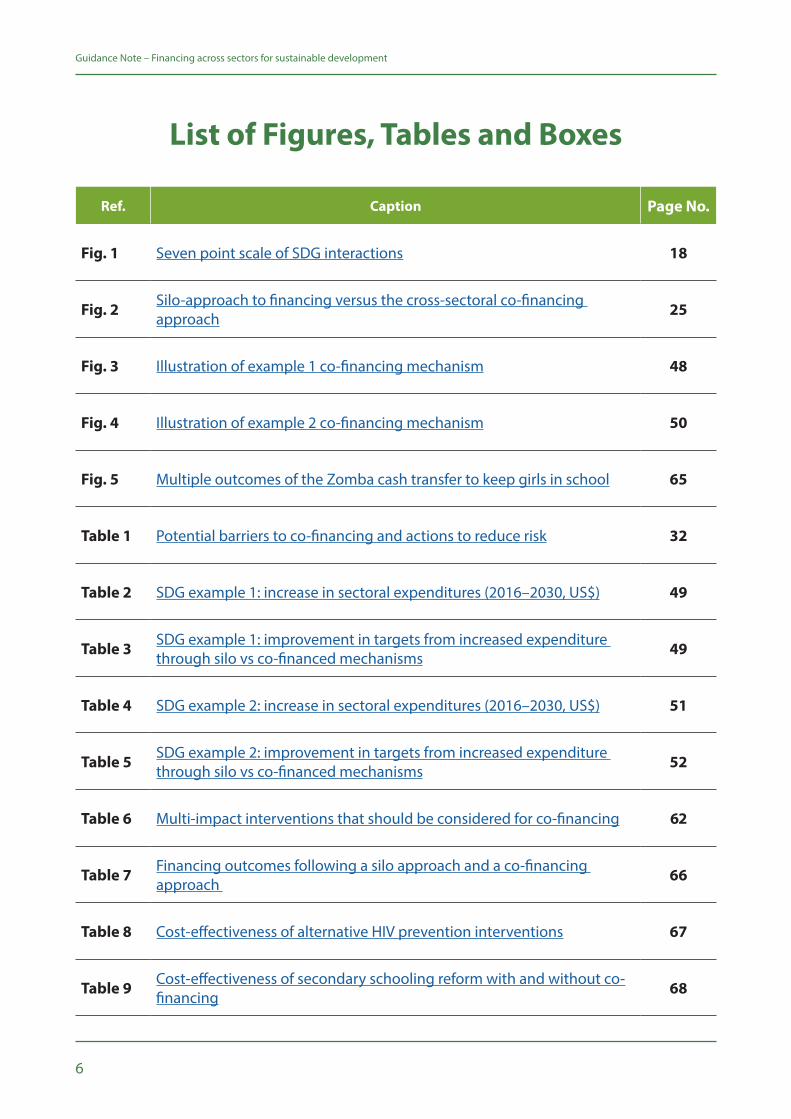
Ref. Caption Page No.
Fig. 1 Seven point scale of SDG interactions 18
Fig. 2 Silo-approach to financing versus the cross-sectoral co-financing approach 25
Fig. 3 Illustration of example 1 co-financing mechanism 48
Fig. 4 Illustration of example 2 co-financing mechanism 50
Fig. 5 Multiple outcomes of the Zomba cash transfer to keep girls in school 65
Table 1 Potential barriers to co-financing and actions to reduce risk 32
Table 2 SDG example 1: increase in sectoral expenditures (2016–2030, US$) 49
Table 3 SDG example 1: improvement in targets from increased expenditure through silo vs co-financed mechanisms 49
Table 4 SDG example 2: increase in sectoral expenditures (2016–2030, US$) 51
Table 5 SDG example 2: improvement in targets from increased expenditure through silo vs co-financed mechanisms 52
Table 6 Multi-impact interventions that should be considered for co-financing 62
Table 7 Financing outcomes following a silo approach and a co-financing approach 66
Table 8 Cost-effectiveness of alternative HIV prevention interventions 67
Table 9 Cost-effectiveness of secondary schooling reform with and without co-financing 68
List of Figures, Tables and Boxes
7
Guidance Note – Financing across sectors for sustainable development
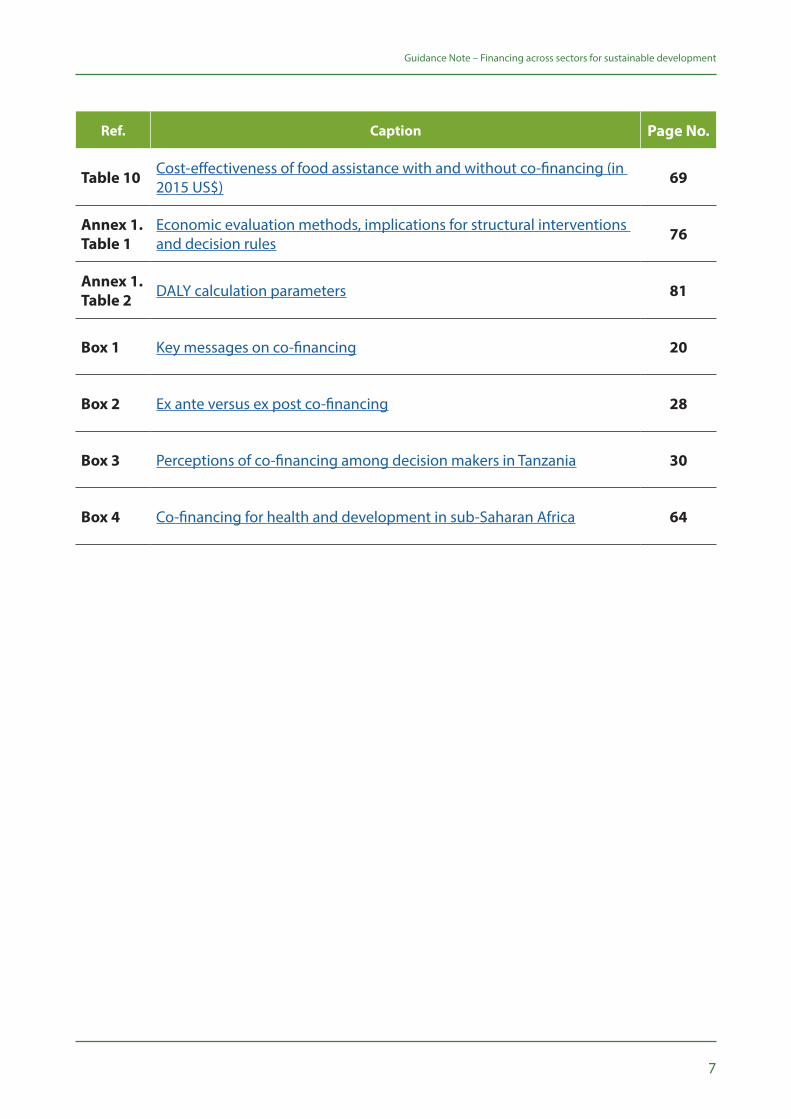
Ref. Caption Page No.
Table 10 Cost-effectiveness of food assistance with and without co-financing (in 2015 US$) 69
Annex 1. Table 1
Economic evaluation methods, implications for structural interventions and decision rules 76
Annex 1. Table 2 DALY calculation parameters 81
Box 1 Key messages on co-financing 20
Box 2 Ex ante versus ex post co-financing 28
Box 3 Perceptions of co-financing among decision makers in Tanzania 30
Box 4 Co-financing for health and development in sub-Saharan Africa 64
8
Guidance Note – Financing across sectors for sustainable development
Abbreviations
AIDS Acquired immunodeficiency syndrome
ART Antiretroviral therapy
BAU Business as usual scenario
CBA Cost-benefit analysis
CCA Cost-consequence analysis
CEA Cost-effectiveness analysis
CER Cost-effectiveness ratio
CMA Cost-minimization analysis
CUA Cost-utility analysis
DALY Disability-adjusted life year
GDP Gross domestic product
Global Fund Global Fund to Fight AIDS, Tuberculosis and Malaria
HIV Human immunodeficiency virus
HSV-2 Herpes simplex virus 2
iSDG Integrated Sustainable Development Goals Model (Millennium Institute)
JICA Japan International Cooperation Agency
LICs Low-income countries
LMICs Low and middle-income countries
MAPS Mainstreaming, Acceleration and Policy Support
MDGs Millennium Development Goals
MICs Middle-income countries
9
Guidance Note – Financing across sectors for sustainable development
NSDPs National sustainable development plans
ODA Official development assistance
PFM Public financial management
PPPs Public-private partnerships
QALY Quality-adjusted life year
RBF Results-based financing
ROI Return on investment
SD Standard deviation
SDGs Sustainable Development Goals
STIs Sexually transmitted infections
STRIVE London School of Hygiene and Tropical Medicine-supported STRIVE Research Consortium
TASAF Tanzania Social Action Fund
TB Tuberculosis
UHC Universal health coverage
UNDP United Nations Development Programme
USAID United States Agency for International Development
WHO World Health Organization
WTP Willingness to pay
10
Guidance Note – Financing across sectors for sustainable development
Acknowledgments
This Guidance Note was authored by: Michelle Remme and Finn McGuire of the London School of Hygiene and Tropical Medicine (LSHTM)-supported STRIVE Research Consortium (STRIVE); Teresa Guthrie, Pallavi Yagnik, Roy Small and Douglas Webb of the United Nations Development Programme (UNDP); and Steven Arquitt of the Millennium Institute (MI). The note benefitted enormously from the inputs and contributions of: Pedro Conceicao, Rogers Dhliwayo, Natalia Linou, Tasneem Mirza and Massimiliano Riva of UNDP; and Rachel Thompson of Chatham House. The Guidance Note is the product of UNDP’s Global Policy Network. It was led by the HIV, Health and Development Group and the Strategic Policy Unit. UNDP is also grateful to Zsuzsanna Schreck for her design work.
We also appreciate the inputs of an Advisory Group for the overall Co-financing project: David Wilson (World Bank), Eugenio Villar, Joe Kutzin, Dorjsuren Bayarsaikhan (WHO), Michael Samson (EPRI), Michael Borowitz (Global Fund to fight AIDS, TB and Malaria), Eileen Stillwaggon (Gettysburg College).
We gratefully acknowledge support for this work from the Government of Japan.
11
Guidance Note – Financing across sectors for sustainable development
Overview
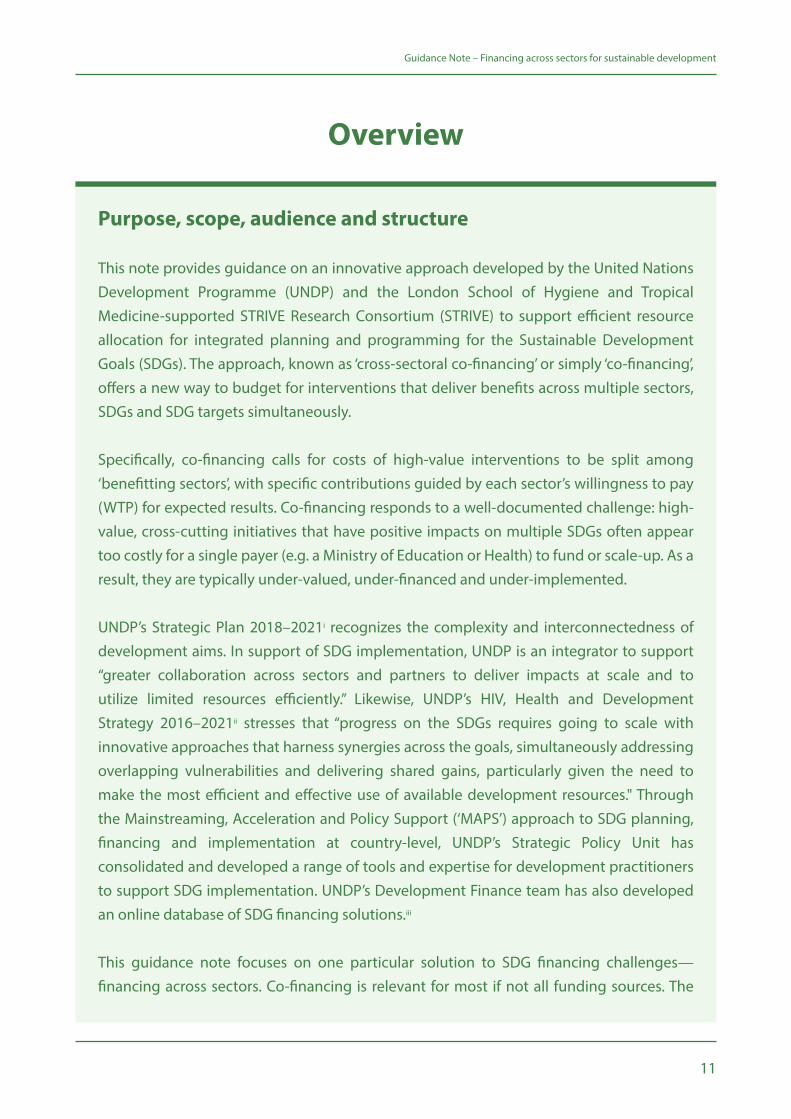
Purpose, scope, audience and structure This note provides guidance on an innovative approach developed by the United Nations Development Programme (UNDP) and the London School of Hygiene and Tropical Medicine-supported STRIVE Research Consortium (STRIVE) to support efficient resource allocation for integrated planning and programming for the Sustainable Development Goals (SDGs). The approach, known as ‘cross-sectoral co-financing’ or simply ‘co-financing’, offers a new way to budget for interventions that deliver benefits across multiple sectors, SDGs and SDG targets simultaneously.
Specifically, co-financing calls for costs of high-value interventions to be split among ‘benefitting sectors’, with specific contributions guided by each sector’s willingness to pay (WTP) for expected results. Co-financing responds to a well-documented challenge: high-value, cross-cutting initiatives that have positive impacts on multiple SDGs often appear too costly for a single payer (e.g. a Ministry of Education or Health) to fund or scale-up. As a result, they are typically under-valued, under-financed and under-implemented.
UNDP’s Strategic Plan 2018–2021i recognizes the complexity and interconnectedness of development aims. In support of SDG implementation, UNDP is an integrator to support “greater collaboration across sectors and partners to deliver impacts at scale and to utilize limited resources efficiently.” Likewise, UNDP’s HIV, Health and Development Strategy 2016–2021ii stresses that “progress on the SDGs requires going to scale with innovative approaches that harness synergies across the goals, simultaneously addressing overlapping vulnerabilities and delivering shared gains, particularly given the need to make the most efficient and effective use of available development resources." Through the Mainstreaming, Acceleration and Policy Support (‘MAPS’) approach to SDG planning, financing and implementation at country-level, UNDP’s Strategic Policy Unit has consolidated and developed a range of tools and expertise for development practitioners to support SDG implementation. UNDP’s Development Finance team has also developed an online database of SDG financing solutions.iii
This guidance note focuses on one particular solution to SDG financing challenges—financing across sectors. Co-financing is relevant for most if not all funding sources. The
12
Guidance Note – Financing across sectors for sustainable development
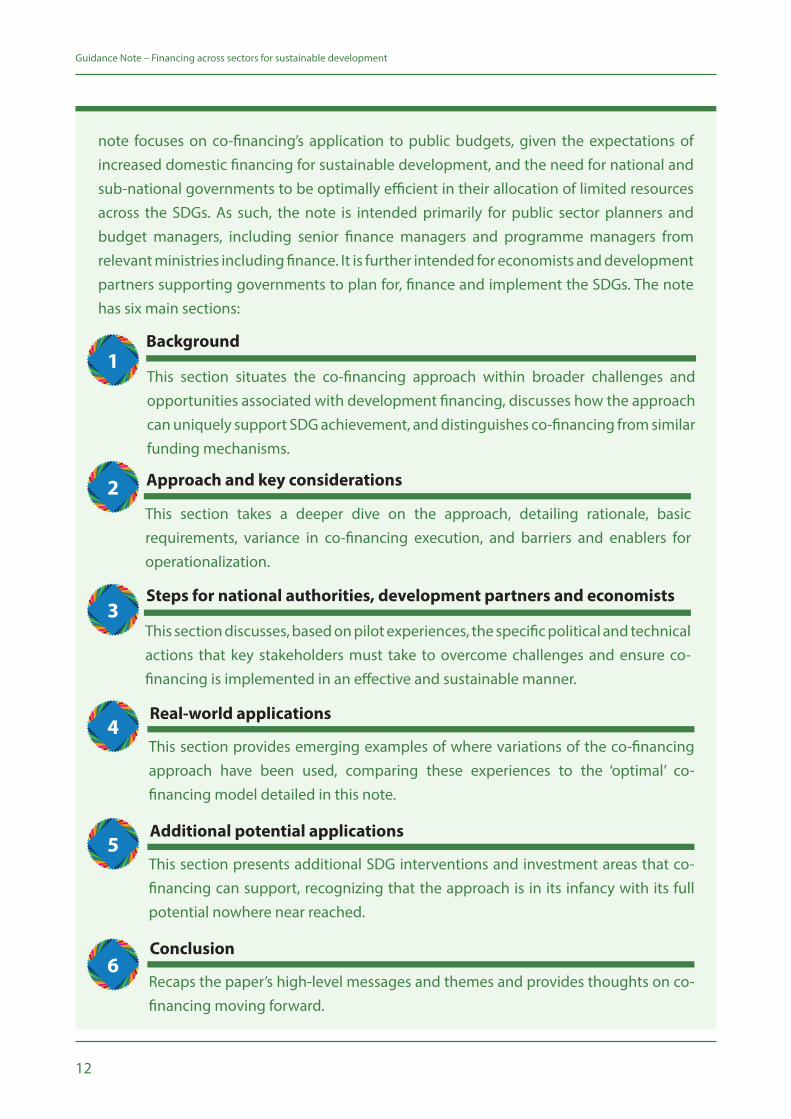
note focuses on co-financing’s application to public budgets, given the expectations of increased domestic financing for sustainable development, and the need for national and sub-national governments to be optimally efficient in their allocation of limited resources across the SDGs. As such, the note is intended primarily for public sector planners and budget managers, including senior finance managers and programme managers from relevant ministries including finance. It is further intended for economists and development partners supporting governments to plan for, finance and implement the SDGs. The note has six main sections:
This section situates the co-financing approach within broader challenges and opportunities associated with development financing, discusses how the approach can uniquely support SDG achievement, and distinguishes co-financing from similar funding mechanisms.
Background
This section takes a deeper dive on the approach, detailing rationale, basic requirements, variance in co-financing execution, and barriers and enablers for operationalization.
Approach and key considerations
This section discusses, based on pilot experiences, the specific political and technical actions that key stakeholders must take to overcome challenges and ensure co-financing is implemented in an effective and sustainable manner.
Steps for national authorities, development partners and economists
This section provides emerging examples of where variations of the co-financing approach have been used, comparing these experiences to the ‘optimal’ co-financing model detailed in this note.
Real-world applications
This section presents additional SDG interventions and investment areas that co-financing can support, recognizing that the approach is in its infancy with its full potential nowhere near reached.
Additional potential applications
Recaps the paper’s high-level messages and themes and provides thoughts on co-financing moving forward.
Conclusion
1
2
3
4
5
6
Credit: © HUMA/World Bank

14
15
BackgroundThis section situates the co-financing approach within broader challenges and opportunities associated with development financing, discusses how the approach can uniquely support SDG achievement, and distinguishes co-financing from similar funding mechanisms.
1
16
Guidance Note – Financing across sectors for sustainable development
Background
1.1 Challenges and opportunities within financing for development
The 2030 Agenda for Sustainable Development is the framework for international cooperation over the 2015–2030 period.iv The Agenda is comprised of 17 Sustainable Development Goals (SDGs) spanning social, economic and environmental dimensions of sustainable development. The SDGs are integrated and indivisible, each with numerous targets (169 in total). The ambition and breadth of the 2030 Agenda suggests that achieving the SDGs will require new partnerships and significant additional fiscal resources.v Initial estimates placed the incremental investment needed for SDG achievement at US$343–360 billion per annum for low-income countries and US$900-944 billion per annum for lower-middle-income countries.vi While much of this could come from expanded and new private investments as well as official development assistance (ODA), the ‘Addis Ababa Action Agenda of the Third International Conference on Financing for Development’ makes clear that domestic resources will be relied upon heavily for SDG financing.vii
The financing for development landscape places an onus on national governments to increase available resources, including through innovative approaches (e.g. taxation of health-harming products). Overall domestic resources for health are increasing, at a rate of 6 percent per year in low and middle income countries (LMICs) and 4 percent in high income countries (HICs). Government health expenditure per capita has doubled in middle income countries since the year 2000.viii The value of these higher investments, in the health sector and beyond, will depend on their overall efficiency.
One logical way to invest more efficiently is to prioritize high-value interventions which deliver impacts across multiple goals, targets and sectors simultaneously. An example is UNDP’s Solar for Health initiative,ix which supports national governments to work with communities, local authorities and the private sector to increase access to quality health services by equipping health centres with solar panels. Such efforts simultaneously save lives (SDG 3), ensure sustainable access to electricity (SDG 7), eliminate use of less reliable and environmentally harmful energy sources (SDGs 12 and 13), and provide private sector partners a smart and socially conscious investment opportunity (SDG 17). Another example is social protection instruments such as social cash transfers, which in different contexts have not only achieved core poverty and inequality alleviation objectives (SDGs 1, 5 and 10) but also improved nutrition (SDG 2), health (SDG 3), education (SDG 4), livelihoods (SDG 8) and other development aims. The need to recognize and leverage spillover
17
Guidance Note – Financing across sectors for sustainable development
benefits also applies to investment areas. For example, evidence indicates that investments in the agriculture, nutrition, and food security sectors would have strong synergies with water and land resources, biodiversity, health, and climate.x–xi
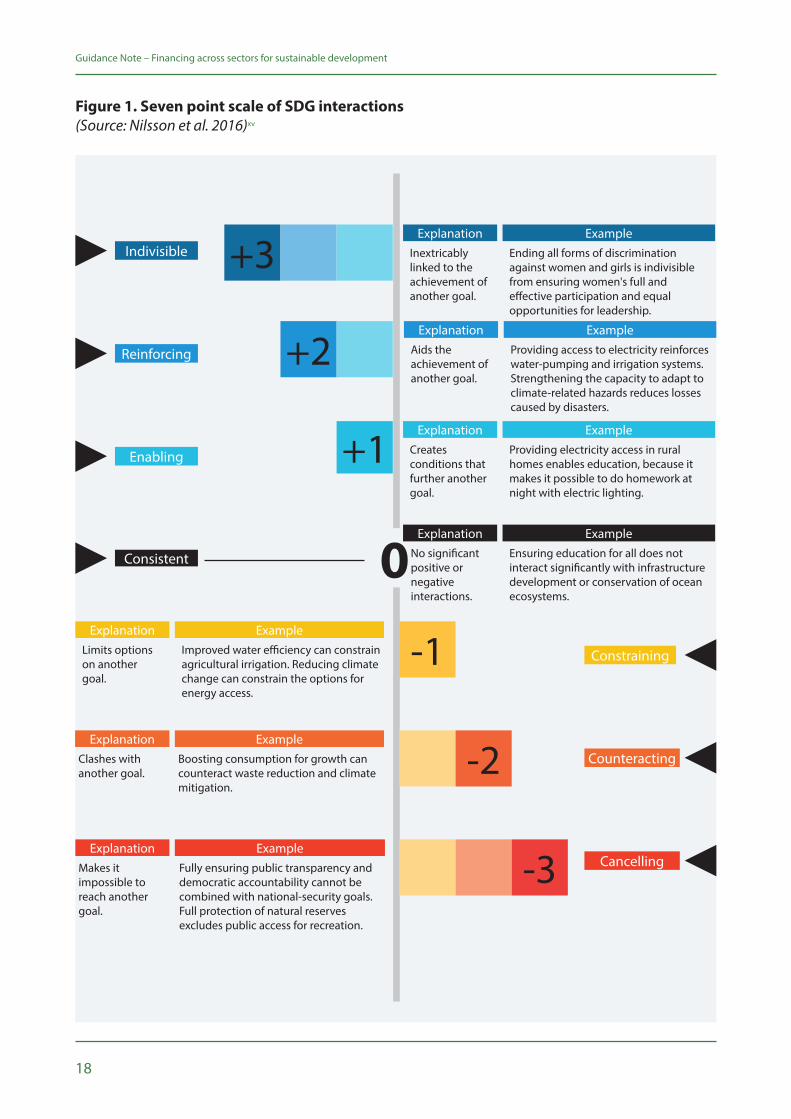
Agenda 2030xii explicitly recognizes the value of integrated programming,1 and the Addis Ababa Action Agenda of the Third International Conference on Financing for Developmentxiii underscores the same point.2 But there are two main challenges to integrated programming and joint financing across sectors. The first is that policymakers predominantly operate in silos and lack the appropriate tools to identify the most powerful interactions across sectoral targets, and thus opportunities to maximize positive interactions and minimize negative ones. In 2016, Nilsson et al. provided a framework within which the range of possible SDG interactions could be understood (Figure 1).xiv The framework goes beyond the notion of the SDGs being ‘indivisible’ to recognize that this does not necessarily mean all goals and targets are mutually supporting in the same way, or that the strength of their support is consistent.
1 A/RES/70/1 ‘Transforming our world: the 2030 Agenda for Sustainable Development’ states, “The interlinkages and integrated nature of the Sustainable Development Goals are of crucial importance in ensuring that the purpose of the new Agenda is realized.”2 The Addis Ababa Action Agenda states, “We will identify actions and address critical gaps relevant to the post-2015 development agenda, including the sustainable development goals, with an aim to harness their considerable synergies, so that implementation of one will contribute to the progress of others.”
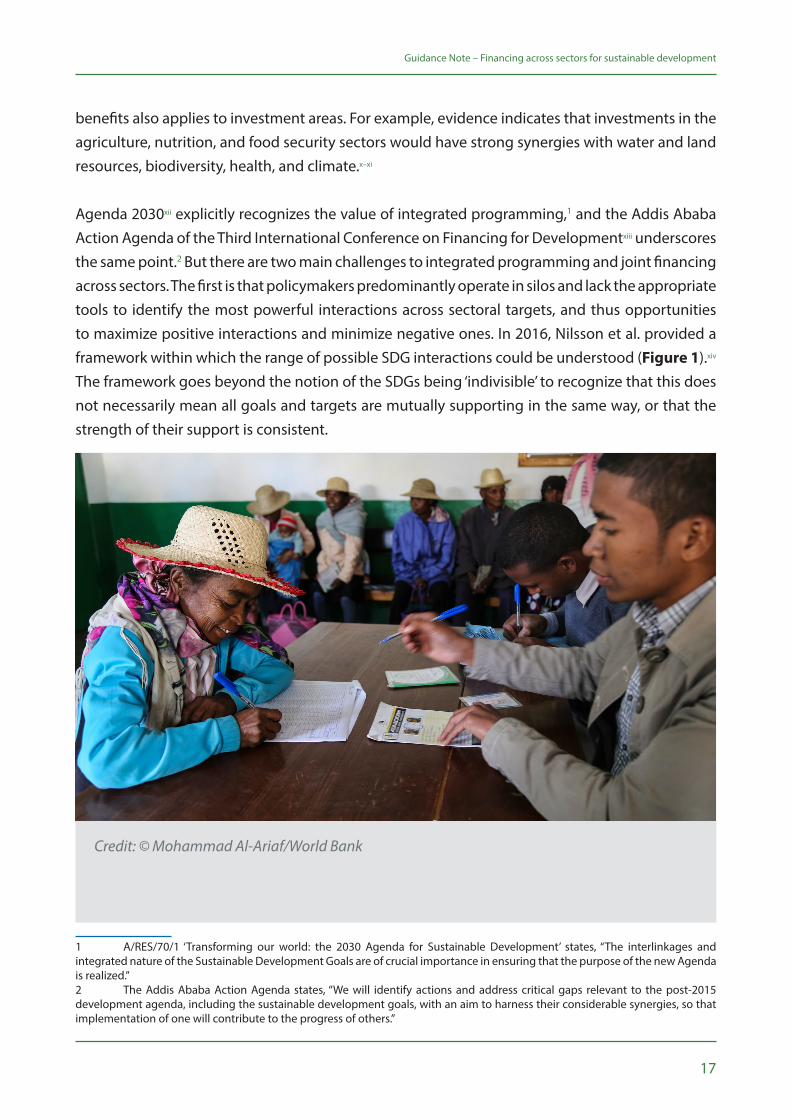
Credit: © Mohammad Al-Ariaf/World Bank
18
Guidance Note – Financing across sectors for sustainable development
Indivisible Inextricably linked to the achievement of another goal.
Ending all forms of discrimination against women and girls is indivisible from ensuring women's full and effective participation and equal opportunities for leadership.
Explanation Example
+3
+2
+1
Aids the achievement of another goal.
Providing access to electricity reinforces water-pumping and irrigation systems. Strengthening the capacity to adapt to climate-related hazards reduces losses caused by disasters.
Explanation Example
Creates conditions that further another goal.
Providing electricity access in rural homes enables education, because it makes it possible to do homework at night with electric lighting.
Explanation Example
Ensuring education for all does not interact significantly with infrastructure development or conservation of ocean ecosystems.
Example
Reinforcing
Enabling
-1
-2
-3
Limits options on another goal.
Improved water efficiency can constrain agricultural irrigation. Reducing climate change can constrain the options for energy access.
Explanation Example
Clashes with another goal.
Boosting consumption for growth can counteract waste reduction and climate mitigation.
Explanation Example
Makes it impossible to reach another goal.
Fully ensuring public transparency and democratic accountability cannot be combined with national-security goals.Full protection of natural reserves excludes public access for recreation.
Explanation Example
Constraining
Counteracting
Cancelling
0Consistent No significant positive or negative interactions.
Explanation
Figure 1. Seven point scale of SDG interactions(Source: Nilsson et al. 2016)xv
19
Guidance Note – Financing across sectors for sustainable development
The second challenge to integrated programming is that resources to achieve the SDGs are currently spread among diverse actors and constrained by systems of public and private finance and ODA flows that may not be fit-for-purpose.xvi When choosing where to allocate their budgets, payers tend to evaluate their options in isolation; joint financing across sectors is rarely considered.
Conventional, sector-specific methods of calculating cost-effectiveness are used that only focus on a narrow set of outcomes, and tend not to consider the spillover benefits to other sectors. The result is that high-value, cross-cutting programmes—programmes critical for the interconnected SDGs—often appear too costly for a single payer (e.g. the Ministry of Education or Health) to fund or scale-up on its own. The programmes thus go under-valued, under-financed and under-implemented. Despite the fact that synergies and trade-offs are widespread and may have a significant impact on outcomes and overall investment needs, governments (and other institutions) do not typically consider the economy or system-wide effects of interventions and SDG investment. One significant consequence of this is that sector-specific spending objectives typically aggregate to more than a single country can reasonably finance through its own resources.xvii–xviii
“On current trends the world will miss the goals by a wide margin unless policies are improved, international cooperation is enhanced, and more public and private resources are brought to bear on financing the investments needed to achieve the SDGs. Focusing on the marginal expansion of government services will not be sufficient to reach the SDGs.” – Guido Schmidt-Traub and Jeffrey D. Sachs of the Sustainable Development Solutions Network (SDSN)xix
1.2 What is co-financing and how can it advance the SDGs?
Co-financing is an innovative financing approach whereby two or more sectors or budget holders, each with different development objectives, co-fund an intervention or broader investment area which advances their respective objectives simultaneously. Specific budgetary contributions from each participating sector or budget holder are determined by weighing the impact each would expect from the intervention or intervention area against their willingness to pay (WTP), or valuation, of that outcome or impact.3 Co-financing does not necessarily require additional resources or increases in capital investment. Rather, it helps optimize allocation of existing resources across sectors to maximize cross-sector outcomes.
The co-financing approach was developed in 2014 by the London School of Hygiene and Tropical Medicine-supported STRIVE Research Consortium (STRIVE)xx and UNDP, in response to the realization that cost-effective structural interventions to tackle HIV were being passed over
3 See Annex 1 for technical detail on the calculation of WTP and sectoral contributions.
20
Guidance Note – Financing across sectors for sustainable development
erroneously because researchers and policymakers were examining such interventions for HIV outcomes only, not capturing spillover benefits to other sectors such as education, social welfare, and gender. Now, given the depth, breadth and integrated nature of Agenda 2030, as well as the need for more resources, co-financing is especially relevant. Described as a “significant methodological breakthrough for economic evaluation of multisectoral interventions”,xxi the approach can uniquely support achievement of the SDGs by ensuring that win-win interventions which deliver high impacts across multiple goals and targets at once are adequately valued, prioritized and implemented.
By increasing focus on addressing root causes of development, and promoting integrated approaches to complex development challenges, co-financing requires government sectors to move beyond silos and to plan and work together, including through effective cross-sectoral governance, planning and financing mechanisms.xxii Another advantage of co-financing is its generalizability. The approach can benefit any sector willing to engage; it can increase allocative efficiencies in financing for any development intervention or investment area which contributes to the achievement of the SDGs and has cross-cutting benefits.
Box 1. Key messages on co-financing
• High-value, win-win interventions are needed to realize the broad and interconnected SDGs. However, these interventions are less likely to be prioritized, financed and taken to scale where sectors evaluate costs and benefits in isolation. The result is suboptimal resource allocation and missed opportunities to increase overall well-being.
• High-value interventions can be funded more efficiently through an appropriate pooling of public resources across sectors which benefit, with contributions guided by each sector’s WTP for expected results.
• The co-financing approach supports integrated and flexible operational and financing mechanisms at national and sub-national level, leading to more effective and efficient SDG implementation and financing.
“Through determining the right policies, including innovative methods of (co)-financing for development, we can achieve our aspirations to end extreme poverty by 2030 and also ensure healthy lives for all. Achieving such ambitious goals is not just about the need for more resources overall, it’s about spending what we do have more effectively and efficiently.” – Douglas Webb, Mandeep Dhaliwal, and Pedro Conceicao of UNDPxxiii
21
Guidance Note – Financing across sectors for sustainable development
1.3 Co-financing versus similar funding mechanisms
Co-financing represents a particular sub-type of cross-sector collaboration and should not be confused with other financial mechanisms that have similar but not identical characteristics. Thus, while important to understand what cross-sectoral co-financing is, it is equally important to understand what it is not.
Most similar are co-financing mechanisms that engage budget holders with the same objectives. A common model of this co-financing type is the joint funding of a programme by development partners and a corresponding government ministry, e.g. a programme funded jointly by the Global Fund to Fights AIDS, Tuberculosis and Malaria (Global Fund) and the Ministry of Health. This type of co-financing or counterpart financing mechanism brings together budgets from different payers aiming to jointly achieve the same goal, such as to reduce hunger or to reduce HIV transmission and mortality. Co-financing as described in this note does not refer to this type of mechanism, but rather to funding that is cross-sectoral where various sectors/ministries combine, or pool, their own budgeted funds for a specific intervention or programme with the aim of achieving multiple sector-specific objectives.
Another financial mechanism is where governments implement ‘integrated budgets’, such as for gender-related activities. This approach has tended to allocate a certain portion of various ministries’ budgets to gender activities within those various ministries to achieve gender-related objectives. Those funds have not been pooled for a common gender intervention or programme with multisectoral outcomes, and therefore are not strictly cross-sectoral co-financing as described herein. Often referred to as ‘mainstreaming’, this mechanism has also been applied to climate change activities.
Finally, sector budget holders could choose to finance interventions outside of their traditional jurisdiction independently. This approach, uncommonly applied, would rely on a sector perceiving an intervention outside of its traditional jurisdiction to provide sufficient benefits to its core objectives to be worth financing. This approach would not constitute cross-sectoral co-financing if it involves only a single budget holder. However, it would constitute cross-sectoral co-financing if the sector budget holder co-invests in an area outside of its mandate based upon its WTP for expected results.

22
23
Approach and key considerationsThis section takes a deeper dive on the approach, detailing rationale, basic requirements, variance in co-financing execution, and barriers and enablers for operationalization.
2
24
Guidance Note – Financing across sectors for sustainable development
2.1 Impetus
The co-financing approach was borne of a particular opportunity encouraged by the SDGs – namely to help sectors consider the effects of an intervention or investment beyond their primary mandates or interests. That is, in the conventional cost-effectiveness framework, each sector decides which programmes to finance based on its own cost-effectiveness calculations, for its own specific outcomes. For instance, when deciding how to spend a fixed amount of money, the agricultural sector will likely choose the intervention option that generates the highest agricultural yields. It is unlikely to factor in any downstream impacts (e.g. school completion rates). When programme outcomes are assessed from a single sector perspective, they may be undervalued, and as a result under-provided. Some programmes may not be funded at all, if they are not deemed a cost-effective investment from any single sector’s perspective. Alternatively, when other perspectives are considered, a programme that does not appear to provide value for money from a single sector’s perspective may look significantly different. An example is the health sector assessing the value of a deworming programme. The primary outcome of interest for the Ministry of Health is, naturally, the health benefits of the programme. However, the health benefits may not be sufficient to incentivize the Ministry of Health to fund the programme, because the Ministry may be able to achieve similar health benefits through another health intervention that costs less. If evidence were to suggest that the deworming programme also has educational benefits, this would not change the perceived value for money to the health sector, since the health sector does not internalize education objectives. Likewise, the deworming programme may not be good value for money for the Ministry of Education to fund alone, given its focus on education outcomes. However, if the cost of the programme could be distributed between both the health and education sectors, the programme may become more attractive (cost-effective), given the lower cost each sector would need to contribute to implement it.
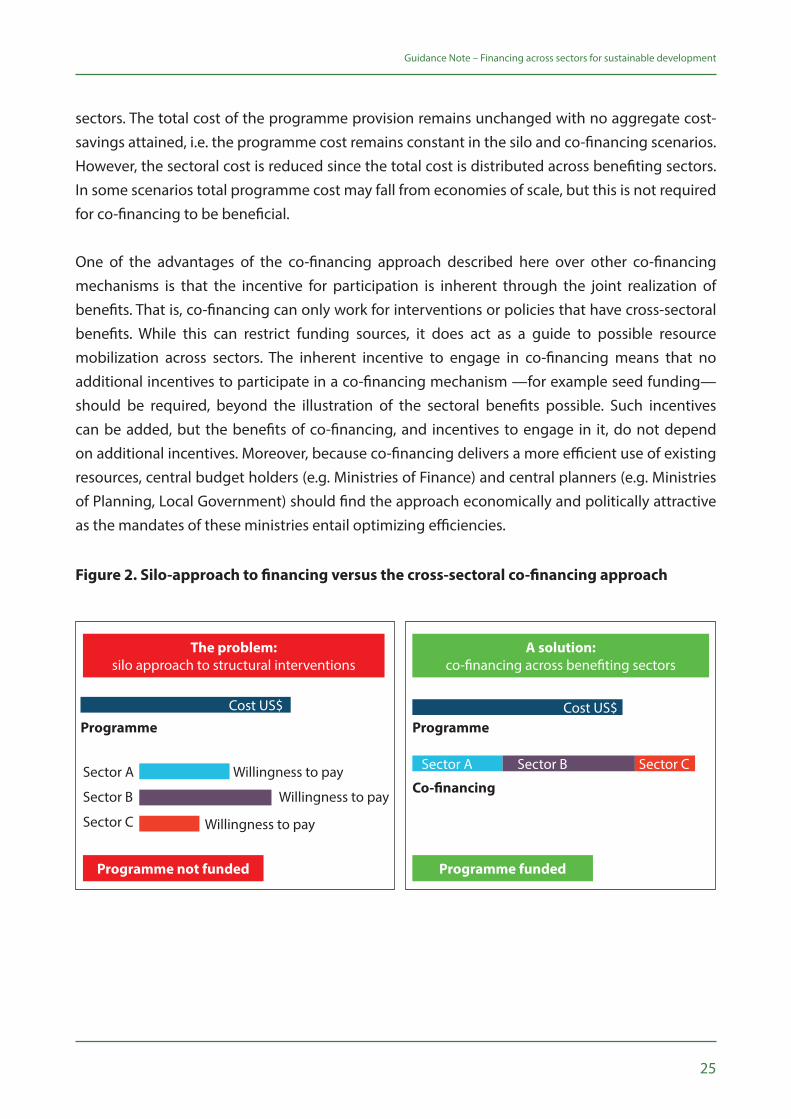
The co-financing approach encourages government sectors to pool resources for mutually beneficial interventions, rather than evaluating interventions in isolation from other sectors’ objectives and budgets.xxiv The analytical model for co-financing encourages specific sectoral contributions to be determined by what each sector is currently paying to achieve its defined outcomes. For co-financing to be efficiency-enhancing for any particular sector, it would have to cost that sector less to achieve a unit of outcome through the co-financed intervention than it would through its current least efficient intervention or programme. This can also be viewed as each sector’s WTP for anticipated outcomes (see Annex 1 for details on calculating WTP and sectoral contributions). Figure 2 compares the silo approach, most common in public financing, with the cross-sectoral co-financing approach. The figure illustrates that the sectoral benefits from co-financing are realized through distribution of the total programme cost across benefiting
25
Guidance Note – Financing across sectors for sustainable development
sectors. The total cost of the programme provision remains unchanged with no aggregate cost-savings attained, i.e. the programme cost remains constant in the silo and co-financing scenarios. However, the sectoral cost is reduced since the total cost is distributed across benefiting sectors. In some scenarios total programme cost may fall from economies of scale, but this is not required for co-financing to be beneficial.
One of the advantages of the co-financing approach described here over other co-financing mechanisms is that the incentive for participation is inherent through the joint realization of benefits. That is, co-financing can only work for interventions or policies that have cross-sectoral benefits. While this can restrict funding sources, it does act as a guide to possible resource mobilization across sectors. The inherent incentive to engage in co-financing means that no additional incentives to participate in a co-financing mechanism —for example seed funding—should be required, beyond the illustration of the sectoral benefits possible. Such incentives can be added, but the benefits of co-financing, and incentives to engage in it, do not depend on additional incentives. Moreover, because co-financing delivers a more efficient use of existing resources, central budget holders (e.g. Ministries of Finance) and central planners (e.g. Ministries of Planning, Local Government) should find the approach economically and politically attractive as the mandates of these ministries entail optimizing efficiencies.
Figure 2. Silo-approach to financing versus the cross-sectoral co-financing approach
The problem: silo approach to structural interventions
Programme not funded
Programme
Sector A
Sector B
Sector C
Willingness to pay
Willingness to pay
Willingness to pay
Cost US$
A solution: co-financing across benefiting sectors
ProgrammeCost US$
Co-financing
Sector A Sector B Sector C
Programme funded
26
Guidance Note – Financing across sectors for sustainable development
Two categories of programmes benefit from co-financing: (1) programmes that are underfunded by the implementing sector, because their sectoral benefit is less than the societal multisectoral and total benefit (i.e. the paying sector only finances the programme to the extent that it benefits from its implementation and any benefits to other sectors are disregarded); and (2) programmes that are not funded at all, because they are not cost-effective from any single sector perspective (i.e. their sectoral benefit is less than the sectoral cost). This problem is likely to occur for programmes where the choice is either full provision or no provision.4
2.2 Basic requirements
Co-financing of interventions with multisectoral impacts relies on: (1) recognition of the multiple benefits of an intervention or investment area; and (2) a willingness of different payers to jointly fund implementation. To model the desirability of co-financing an intervention and the relative value for each sector or payer, the following data is required:
1. Multiple expected outcomes of the intervention or programme that cut across sectors. 2. Total cost of the intervention or programme.3. Alternative interventions that each payer/sector could invest in to get the same outcomes and
the cost of achieving one unit of outcome through those interventions (i.e. a measure of the opportunity cost or WTP of each sector or budget holder).
Based on these data, each sector or budget holder’s fair share would be determined by the total sector-specific units of outcome generated by the intervention, multiplied by the cost of achieving this outcome through its next best alternative intervention. If the sum of these shares is greater than the total cost of the intervention, there is an overall saving achievable through co-financing. The equation is outlined below, and the detailed economic methodology is available in Annex 1.
• Sector A’s co-financing share = No. of units of outcome Sector A x WTP per unit of outcome Sector A
• Sector B’s co-financing share = No. of units of outcome Sector B x WTP per unit of outcome Sector B
• Joint WTP = Sector A’s share + Sector B’s share
• Co-financing beneficial if Joint WTP > Total programme cost
Ideally, the intervention would have clear and tangible outcomes that could be measured over time, so as to quantify the benefits and cost-savings made for each sector. A sound monitoring and evaluation framework is essential, with the systematized collection of agreed indicators. Co-financing is also facilitated through the establishment of regulatory and legislative frameworks
4 For example, this often occurs in health care due to horizontal equity considerations, whereby a programme must be delivered to the whole patient population who would benefit, or not at all.
27
Guidance Note – Financing across sectors for sustainable development
which provide incentives and allow for budget sharing. Clear accountability for actions is critical, including through existing and new cross-sectoral coordination mechanisms.
2.3 Variance in co-financing inputs and approaches
While basic requirements must be met for an approach to satisfy this note’s definition of co-financing, co-financing approaches can nonetheless vary in their execution. First, while this note focuses on the application of co-financing to domestic public budgets, the approach need not be restricted to this; it can similarly support efficient allocation of other sources of funding, such as from donors, development partners or blended financing in public-private partnerships. Second, co-financing need not be operationalized at national-level, and in fact may in some cases be more feasible at sub-national level. Third, co-financing can be used either: (1) when central budget holders determine how much of total resources to allocate to different sector budgets/the budgets of specific large programmes (ex ante co-financing); or (2) after different line ministries have received budgetary allocations from the central budget holder and are considering how to efficiently finance a specific intervention with multiple outcomes across sectors (ex post co-financing). The difference between ex ante and ex post co-financing is further examined in Box 2.
28
Guidance Note – Financing across sectors for sustainable development
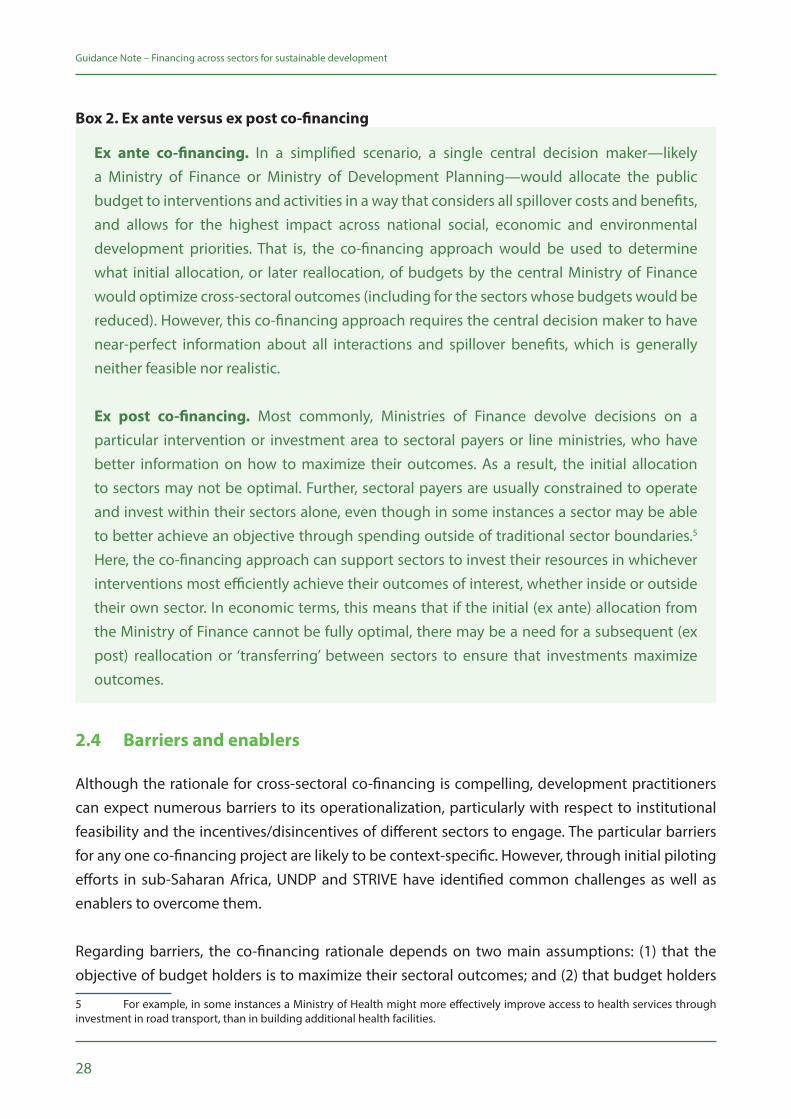
Box 2. Ex ante versus ex post co-financing
Ex ante co-financing. In a simplified scenario, a single central decision maker—likely a Ministry of Finance or Ministry of Development Planning—would allocate the public budget to interventions and activities in a way that considers all spillover costs and benefits, and allows for the highest impact across national social, economic and environmental development priorities. That is, the co-financing approach would be used to determine what initial allocation, or later reallocation, of budgets by the central Ministry of Finance would optimize cross-sectoral outcomes (including for the sectors whose budgets would be reduced). However, this co-financing approach requires the central decision maker to have near-perfect information about all interactions and spillover benefits, which is generally neither feasible nor realistic.
Ex post co-financing. Most commonly, Ministries of Finance devolve decisions on a particular intervention or investment area to sectoral payers or line ministries, who have better information on how to maximize their outcomes. As a result, the initial allocation to sectors may not be optimal. Further, sectoral payers are usually constrained to operate and invest within their sectors alone, even though in some instances a sector may be able to better achieve an objective through spending outside of traditional sector boundaries.5 Here, the co-financing approach can support sectors to invest their resources in whichever interventions most efficiently achieve their outcomes of interest, whether inside or outside their own sector. In economic terms, this means that if the initial (ex ante) allocation from the Ministry of Finance cannot be fully optimal, there may be a need for a subsequent (ex post) reallocation or ‘transferring’ between sectors to ensure that investments maximize outcomes.
2.4 Barriers and enablers
Although the rationale for cross-sectoral co-financing is compelling, development practitioners can expect numerous barriers to its operationalization, particularly with respect to institutional feasibility and the incentives/disincentives of different sectors to engage. The particular barriers for any one co-financing project are likely to be context-specific. However, through initial piloting efforts in sub-Saharan Africa, UNDP and STRIVE have identified common challenges as well as enablers to overcome them.
Regarding barriers, the co-financing rationale depends on two main assumptions: (1) that the objective of budget holders is to maximize their sectoral outcomes; and (2) that budget holders
5 For example, in some instances a Ministry of Health might more effectively improve access to health services through investment in road transport, than in building additional health facilities.
29
Guidance Note – Financing across sectors for sustainable development
are solely constrained by their budget when making decisions about the interventions in which to invest. In reality, these assumptions do not always hold. On the first assumption, political economy theory suggests that the driving objective of policymakers may be to maximize not the efficiency and results generated by their spending but rather the budgetary amount under their control. If so, sectors/ministries may not be amenable to sharing decision making and losing financial controlxxv over limited resources. On the second assumption, government departments/district authorities are often restricted by budgeting guidelines and mandates which set boundaries for what they can invest in. Public financial management (PFM) and reform is notoriously challenging where institutional structures are rigid and resistant to change. Sectors can be subject to discrete regulatory and financial structures, some of which may be inflexible, making cross-sectoral co-financing difficult to establish.
Two additional and related barriers are likely. First, the continuing focus on sectoral inputs rather than outcomes may lead to resistance to co-financing. An example is a Ministry of Education that overly focuses on inputs such as building schools instead of outcomes such as completion of primary education. Recent movements away from input-based budgeting towards programme/output-based budgeting are helping to address this barrier. Second, while evidence continues to mount on the impact of interventions across sectors, many countries lack the capacity to generate needed evidence through multiple outcome assessments. This compromises assessments of the willingness of different sectors to invest in integrated programmes. A 2017 qualitative study in Tanzania elicited insights and perceptions from decision makers directly involved in planning and budgeting, on the institutional feasibility of adopting a co-financing framework in resource allocation.xxvi
30
Guidance Note – Financing across sectors for sustainable development
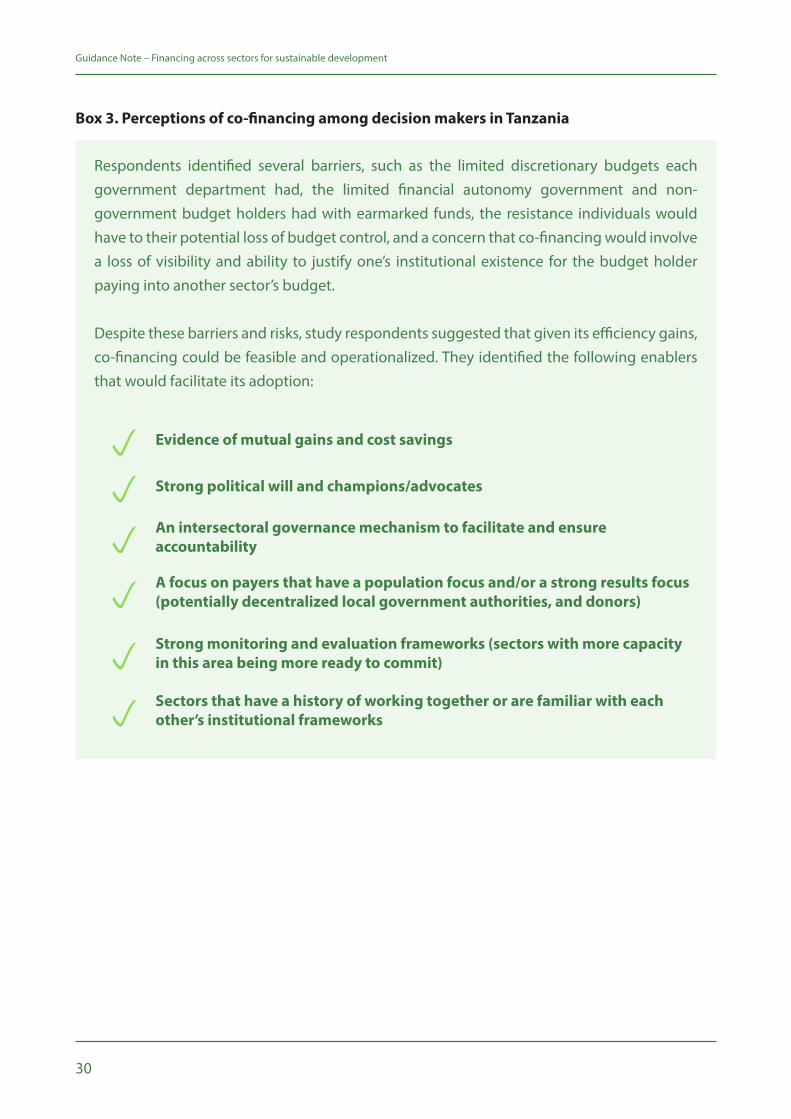
Respondents identified several barriers, such as the limited discretionary budgets each government department had, the limited financial autonomy government and non-government budget holders had with earmarked funds, the resistance individuals would have to their potential loss of budget control, and a concern that co-financing would involve a loss of visibility and ability to justify one’s institutional existence for the budget holder paying into another sector’s budget.
Despite these barriers and risks, study respondents suggested that given its efficiency gains, co-financing could be feasible and operationalized. They identified the following enablers that would facilitate its adoption:
p Evidence of mutual gains and cost savings
p Strong political will and champions/advocates
pAn intersectoral governance mechanism to facilitate and ensure accountability
pA focus on payers that have a population focus and/or a strong results focus (potentially decentralized local government authorities, and donors)
pStrong monitoring and evaluation frameworks (sectors with more capacity in this area being more ready to commit)
pSectors that have a history of working together or are familiar with each other’s institutional frameworks
Box 3. Perceptions of co-financing among decision makers in Tanzania
31
Guidance Note – Financing across sectors for sustainable development
The issues raised through the qualitative study in Tanzania (Box 3), and the barriers to co-financing generally, require extensive discussion between the various stakeholders and the public finance ‘architect’ (usually the Ministry of Finance). In discussions it is important to stress that although there may be loss of control over some funds, financing is for a high-impact project and the contributing ministries would get credit for the project’s outcomes as well as for working innovatively and coherently for the greater public good. Incentive funding for achievement of project goals could help overcome resistance.
One of the key enablers of co-financing is that, unlike many other forms of cross-sectoral policy, co-financing acknowledges and accepts that sectors typically attempt to maximize their sectoral policy goals, regardless of external sector effects. That is, the approach does not rely on ‘good will’ but rather leverages sectoral self-interest to uncover scenarios whereby mutual gain can be achieved through cooperation. By demonstrating the mutual benefits of joint action, co-financing overcomes a major bottleneck that can hinder other types of cross-sectoral action. It does not require any participants to act from an altruistic stance or outside of self-interest. In this same spirit, while many collaborative arrangements require a shared or common goal—providing rationale for the collaboration—co-financing is additionally relevant where sectors have dissimilar goals which are capable of being achieved in concert.
While at a conceptual level the co-financing approach overcomes some of the major barriers of cross-sectoral work generally, organizational and structural barriers may still impede implementation. Initiation of co-financing still requires a sector or ministry taking the lead in implementation. Such ministries may struggle in developing initial buy-in if there is a general lack of integrated policymaking, coordination structures and collaboration among government ministries. As such, any existing structures or points of contact between sectors and ministries should be utilized to launch discussions.xxvii Table 1 outlines thematic barriers that may be faced in implementing and sustaining a co-financing approach, together with potential actions to reduce risk. The options to reduce risk are more impactful when pursued together. Each situation must be explored carefully for potential barriers and enablers, with appropriate responses undertaken early in the process.
32
Guidance Note – Financing across sectors for sustainable development
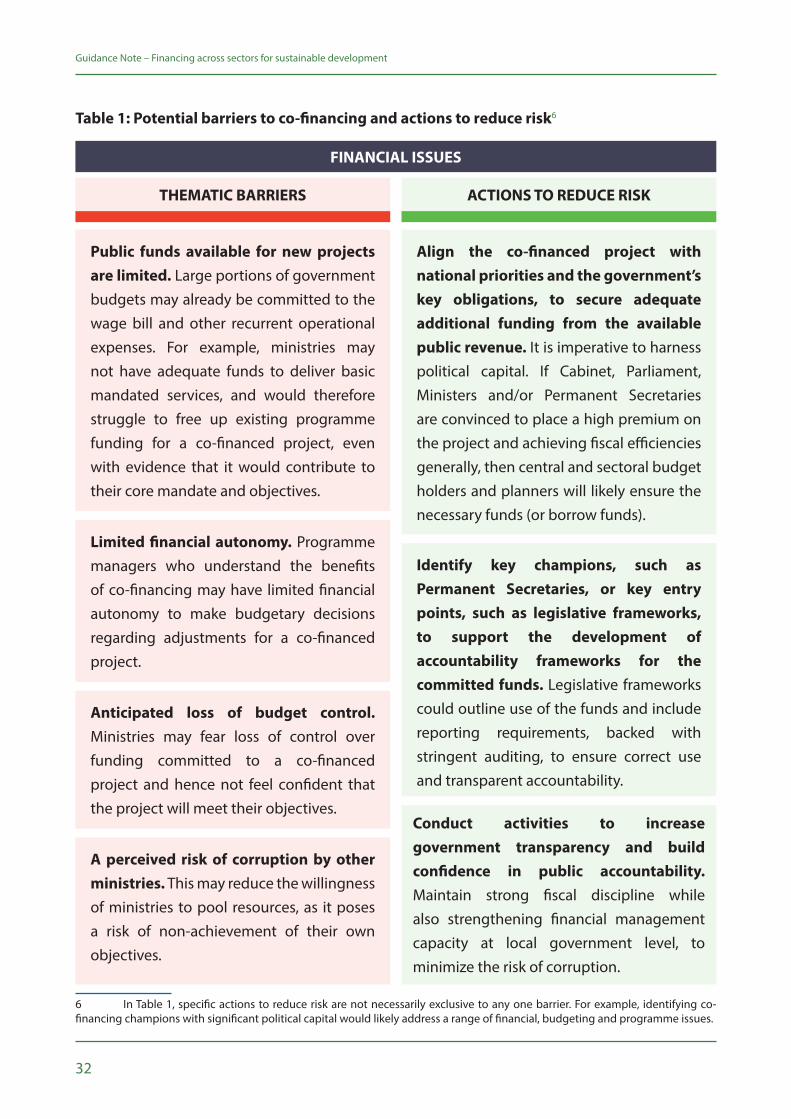
Table 1: Potential barriers to co-financing and actions to reduce risk6
6 In Table 1, specific actions to reduce risk are not necessarily exclusive to any one barrier. For example, identifying co-financing champions with significant political capital would likely address a range of financial, budgeting and programme issues.
Public funds available for new projects are limited. Large portions of government budgets may already be committed to the wage bill and other recurrent operational expenses. For example, ministries may not have adequate funds to deliver basic mandated services, and would therefore struggle to free up existing programme funding for a co-financed project, even with evidence that it would contribute to their core mandate and objectives.
Align the co-financed project with national priorities and the government’s key obligations, to secure adequate additional funding from the available public revenue. It is imperative to harness political capital. If Cabinet, Parliament, Ministers and/or Permanent Secretaries are convinced to place a high premium on the project and achieving fiscal efficiencies generally, then central and sectoral budget holders and planners will likely ensure the necessary funds (or borrow funds).
Limited financial autonomy. Programme managers who understand the benefits of co-financing may have limited financial autonomy to make budgetary decisions regarding adjustments for a co-financed project.
Identify key champions, such as Permanent Secretaries, or key entry points, such as legislative frameworks, to support the development of accountability frameworks for the committed funds. Legislative frameworks could outline use of the funds and include reporting requirements, backed with stringent auditing, to ensure correct use and transparent accountability.
Anticipated loss of budget control. Ministries may fear loss of control over funding committed to a co-financed project and hence not feel confident that the project will meet their objectives.
A perceived risk of corruption by other ministries. This may reduce the willingness of ministries to pool resources, as it poses a risk of non-achievement of their own objectives.
THEMATIC BARRIERS ACTIONS TO REDUCE RISK
FINANCIAL ISSUES
Conduct activities to increase government transparency and build confidence in public accountability. Maintain strong fiscal discipline while also strengthening financial management capacity at local government level, to minimize the risk of corruption.
33
Guidance Note – Financing across sectors for sustainable development
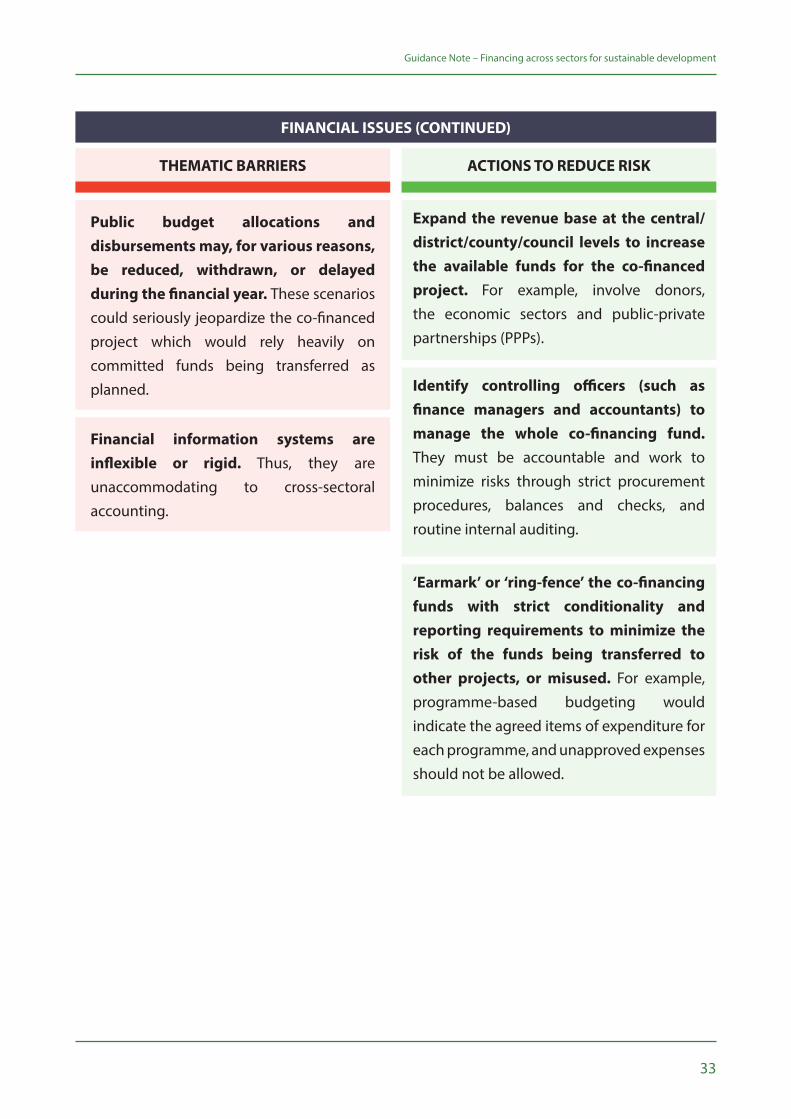
Financial information systems are inflexible or rigid. Thus, they are unaccommodating to cross-sectoral accounting.
THEMATIC BARRIERS ACTIONS TO REDUCE RISK
FINANCIAL ISSUES (CONTINUED)
Expand the revenue base at the central/district/county/council levels to increase the available funds for the co-financed project. For example, involve donors, the economic sectors and public-private partnerships (PPPs).
Identify controlling officers (such as finance managers and accountants) to manage the whole co-financing fund. They must be accountable and work to minimize risks through strict procurement procedures, balances and checks, and routine internal auditing.
‘Earmark’ or ‘ring-fence’ the co-financing funds with strict conditionality and reporting requirements to minimize the risk of the funds being transferred to other projects, or misused. For example, programme-based budgeting would indicate the agreed items of expenditure for each programme, and unapproved expenses should not be allowed.
Public budget allocations and disbursements may, for various reasons, be reduced, withdrawn, or delayed during the financial year. These scenarios could seriously jeopardize the co-financed project which would rely heavily on committed funds being transferred as planned.
34
Guidance Note – Financing across sectors for sustainable development
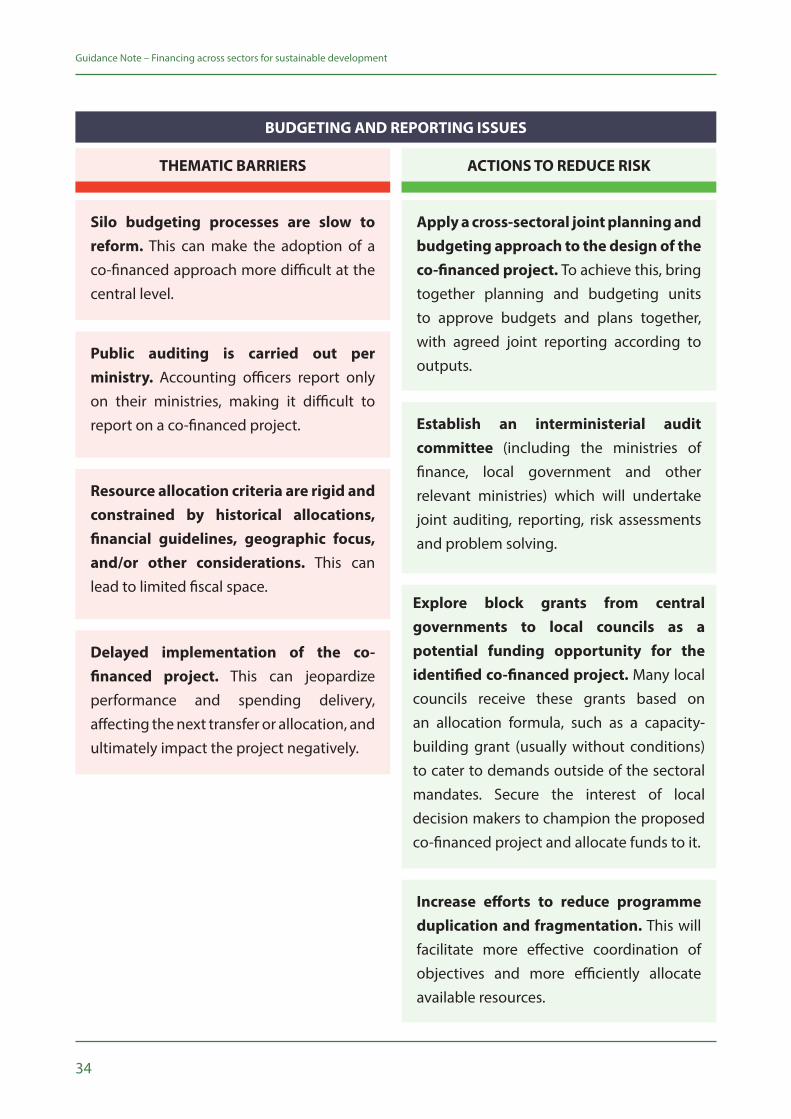
Silo budgeting processes are slow to reform. This can make the adoption of a co-financed approach more difficult at the central level.
Apply a cross-sectoral joint planning and budgeting approach to the design of the co-financed project. To achieve this, bring together planning and budgeting units to approve budgets and plans together, with agreed joint reporting according to outputs.
Public auditing is carried out per ministry. Accounting officers report only on their ministries, making it difficult to report on a co-financed project. Establish an interministerial audit
committee (including the ministries of finance, local government and other relevant ministries) which will undertake joint auditing, reporting, risk assessments and problem solving.
Resource allocation criteria are rigid and constrained by historical allocations, financial guidelines, geographic focus, and/or other considerations. This can lead to limited fiscal space.
Delayed implementation of the co-financed project. This can jeopardize performance and spending delivery, affecting the next transfer or allocation, and ultimately impact the project negatively.
THEMATIC BARRIERS ACTIONS TO REDUCE RISK
BUDGETING AND REPORTING ISSUES
Explore block grants from central governments to local councils as a potential funding opportunity for the identified co-financed project. Many local councils receive these grants based on an allocation formula, such as a capacity-building grant (usually without conditions) to cater to demands outside of the sectoral mandates. Secure the interest of local decision makers to champion the proposed co-financed project and allocate funds to it.
Increase efforts to reduce programme duplication and fragmentation. This will facilitate more effective coordination of objectives and more efficiently allocate available resources.
35
Guidance Note – Financing across sectors for sustainable development
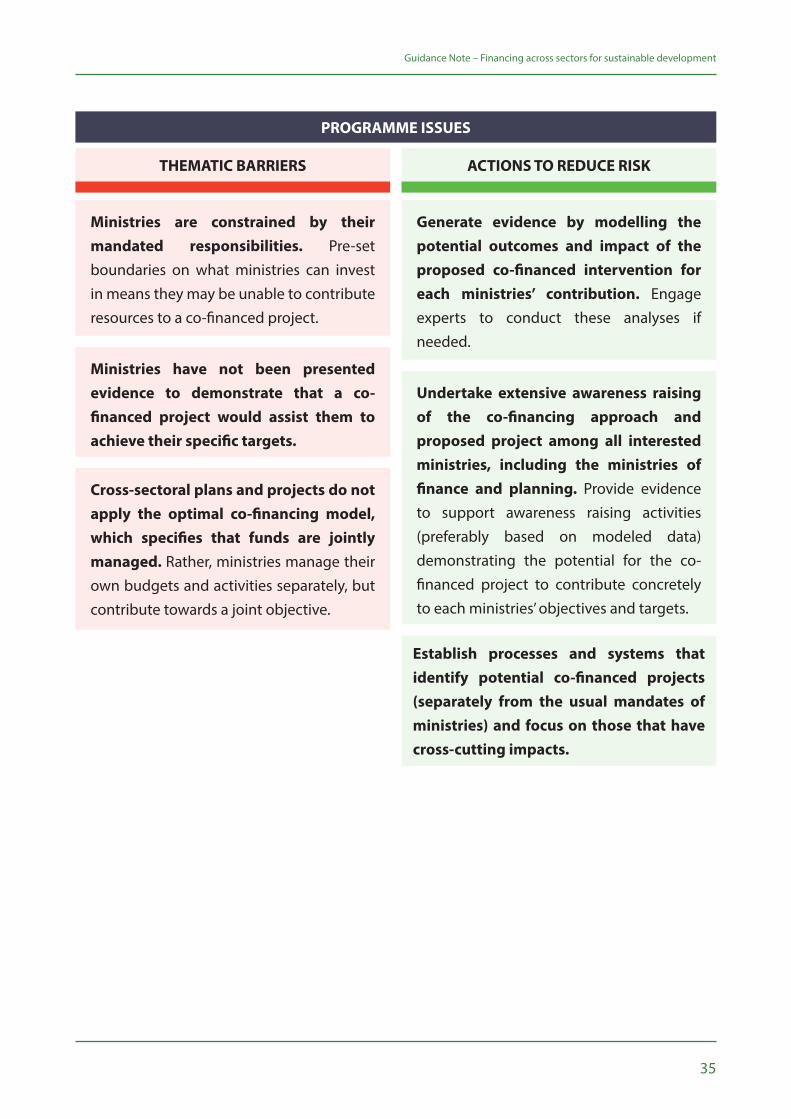
Ministries are constrained by their mandated responsibilities. Pre-set boundaries on what ministries can invest in means they may be unable to contribute resources to a co-financed project.
Generate evidence by modelling the potential outcomes and impact of the proposed co-financed intervention for each ministries’ contribution. Engage experts to conduct these analyses if needed.
Ministries have not been presented evidence to demonstrate that a co-financed project would assist them to achieve their specific targets.
Undertake extensive awareness raising of the co-financing approach and proposed project among all interested ministries, including the ministries of finance and planning. Provide evidence to support awareness raising activities (preferably based on modeled data) demonstrating the potential for the co-financed project to contribute concretely to each ministries’ objectives and targets.
Cross-sectoral plans and projects do not apply the optimal co-financing model, which specifies that funds are jointly managed. Rather, ministries manage their own budgets and activities separately, but contribute towards a joint objective.
THEMATIC BARRIERS ACTIONS TO REDUCE RISK
PROGRAMME ISSUES
Establish processes and systems that identify potential co-financed projects (separately from the usual mandates of ministries) and focus on those that have cross-cutting impacts.
36
Guidance Note – Financing across sectors for sustainable development
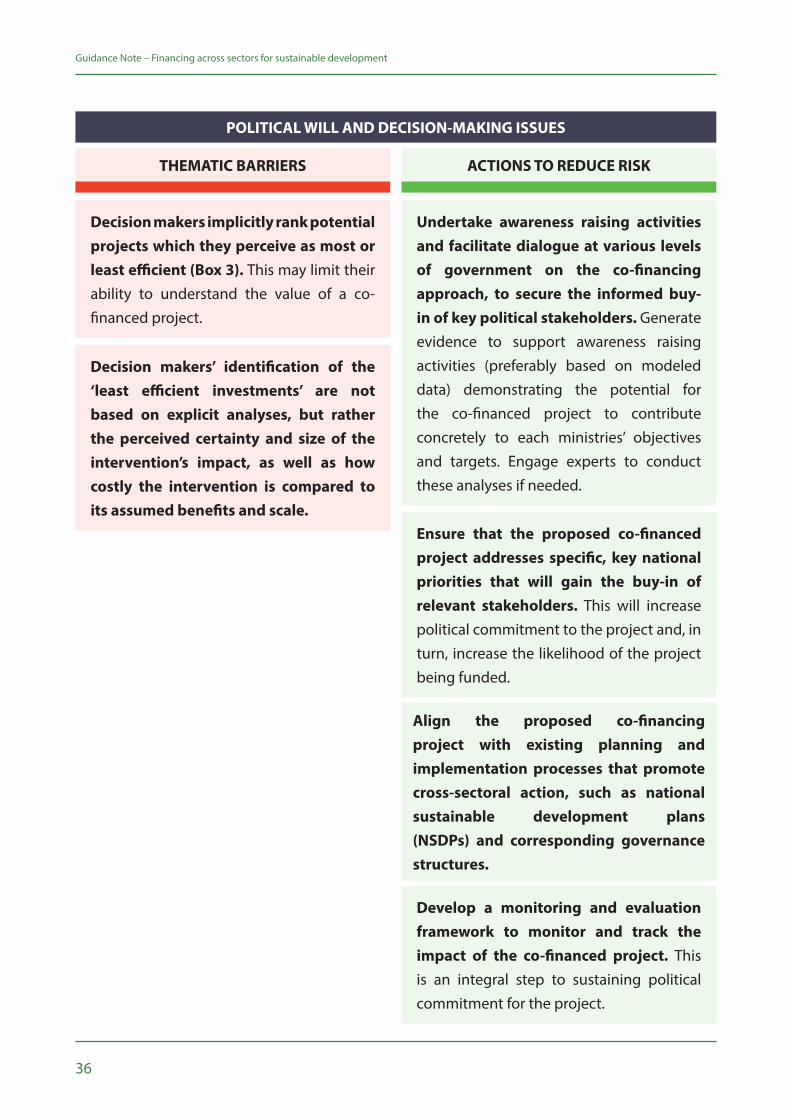
Decision makers implicitly rank potential projects which they perceive as most or least efficient (Box 3). This may limit their ability to understand the value of a co-financed project.
Undertake awareness raising activities and facilitate dialogue at various levels of government on the co-financing approach, to secure the informed buy-in of key political stakeholders. Generate evidence to support awareness raising activities (preferably based on modeled data) demonstrating the potential for the co-financed project to contribute concretely to each ministries’ objectives and targets. Engage experts to conduct these analyses if needed.
Ensure that the proposed co-financed project addresses specific, key national priorities that will gain the buy-in of relevant stakeholders. This will increase political commitment to the project and, in turn, increase the likelihood of the project being funded.
Decision makers’ identification of the ‘least efficient investments’ are not based on explicit analyses, but rather the perceived certainty and size of the intervention’s impact, as well as how costly the intervention is compared to its assumed benefits and scale.
THEMATIC BARRIERS ACTIONS TO REDUCE RISK
POLITICAL WILL AND DECISION-MAKING ISSUES
Align the proposed co-financing project with existing planning and implementation processes that promote cross-sectoral action, such as national sustainable development plans (NSDPs) and corresponding governance structures.
Develop a monitoring and evaluation framework to monitor and track the impact of the co-financed project. This is an integral step to sustaining political commitment for the project.
Credit: © Mohammad Al-Arief/World Bank

38
39
This section discusses, based on pilot experiences, the specific political and technical actions that key stakeholders must take to overcome challenges and ensure co-financing is implemented in an effective and sustainable manner.
3
Steps for national authorities, development partners and economists
40
Guidance Note – Financing across sectors for sustainable development
Because co-financing requires institutional behaviour change, it involves significant political commitment, dedicated technical preparation and, from development partners and economists, ongoing high quality policy support. This section details the political and technical steps involved in the co-financing approach, focusing on initial important steps to operationalize co-financing, as longer-term steps depend on the type of project selected, and the agreed structure of the funding mechanism. Initial buy-in or at least strong interest from affected ministries, especially finance, is paramount.
The steps outlined below are for illustrative purposes. Each co-financing case will be unique and all steps may not apply or occur in the same sequence.
3.1 Political steps
• Raise awareness and understanding of the co-financing approach and its benefits in potentially interested ministries. Information-sharing sessions would need to identify the correct departments, units and persons within the selected ministries.
• Through discussion with the above-mentioned ministries/units/persons, identify any existing projects in the country that are oriented around national development priorities/SDGs and could be co-financed.
• Explore and promote co-financing for a range of potential interventions with cross-cutting development impacts.
• Market the concept and benefits of co-financing to a range of stakeholders beyond the above-mentioned ministries, including development partners, civil society, affected populations, and academic institutions.
• Through multisectoral discussions of the potential projects, select the one project (or more) which has political support, could be financed across multiple sectors, and whose impact across sectors could be measured over time. This agreement requires full buy-in and support from all relevant ministries and stakeholders.
• Develop the concept note/briefing for the proposed project and arrange dissemination and consultation on the project and its implementation.
• Hold one-on-one meetings with senior officials (Permanent Secretaries/Ministers) from ministries that could be involved, as well as the President’s Office. Obtain their approval to continue with the negotiations to allocate resources from their annual budget to the selected project.
• Hold one-on-one meetings with the senior officials from the respective Ministry of Finance who would be responsible for approving the piloting of the cross-sectoral financing arrangement.
• Conduct orientation sessions for the President’s Office, Chief Secretary, key ministries, Permanent Secretaries/Ministers, development partners and other relevant persons. Senior personnel should
41
Guidance Note – Financing across sectors for sustainable development
nominate relevant staff in their ministries to take the process forward and to be responsible for the project’s implementation.
• Set up a steering committee or technical working group with selected officials from the ministries investing in the project as well as the Ministry of Finance, and hold regular meetings for planning, implementation and evaluation. Develop the terms of reference and action plan for the steering committee (see Annex 2).
• Develop a set of evidence-based responses to dispel misconceptions of the co-financing approach. For instance: Co-financing does not require additional resources or increasing capital investment. It merely involves re-allocating existing public budgets to achieve a more efficient allocation of resources across sectors for greater impact.
• Embed cross-sectoral co-financing within NSDPs or their relevant sub-components, including an integrated SDG framework.
3.2 Technical steps
• Examine budgeting guidelines and processes for co-financing, and identify sectors that could set aside resources for co-financed interventions.
• Consider leveraging any existing co-financing mechanisms to support the co-financing of new, existing and/or scaled-up interventions.
• Identify potential innovative domestic funding sources that could be added to the co-financing pool, such as revenues from excise taxes on health-harming products (e.g. tobacco, alcohol and sugar-sweetened beverages).xxviii
• Identify potential development partner funding that could be added to the co-financing pool. For example, the Global Fund provides 'incentive funding' to reward high-impact programmes that leverage financing at the country level. Many development banks prioritize good governance and the efficient use of resources.7
• Undertake estimations of ministry budgets’ potential contributions, and model the potential outcomes from these investments for those contributing ministries (see Annex 1: Detailed Technical Methodology).
• Develop a detailed implementation plan with clear roles and responsibilities. Identify which body, ministry or agency will be lead implementer.
• Identify the output, outcome and impact indicators that will be used to monitor the project and to attribute its impact to the various contributing ministries. The approach/framework developed for results-based financing (RBF)xxix might be applicable to co-financed projects.
7 For instance, in 2012 the African Development Bank hosted a high-level dialogue among African Ministers of Finance and Health. The dialogue resulted in the Tunis Declaration on Value for Money, Sustainability and Accountability in the Health Sector. The Tunis Declaration calls for greater collaboration among Ministries of Finance and Health, Parliamentarians, development partners and civil society to deliver equitable, efficient and sustainable health services in Africa.
42
Guidance Note – Financing across sectors for sustainable development
• Set up the monitoring and evaluation framework and the routine collection of the agreed indicators.
• Ensure a strong public financial accounting system that maintains tight control over all incoming funds and their use. All contributing ministries will require transparency and accountability.
• Implement the plan and ensure strong management of all aspects, with careful monitoring and transparent reporting on the progress and outcomes.
Once the co-financed initiative has been agreed and the technical aspects determined, more detailed implementation planning would be required, dependent upon the type of project and the selected implementing body, ministry or agency.
3.3 Complementary tools, approaches and guidelines
The co-financing approach is included within UNDP’s broader compendium of tools, approaches and guidelines for development practitioners (UN country teams and external partners) to support SDG implementation. UNDP offers a range of instruments which complement the co-financing approach and can be used at different stages of operationalization, from meeting basic requirements to assessing barriers/enablers and executing the political and technical steps. For example:
• The mainstreaming tool ‘Institutional and Coordination Mechanisms: Guidance Note on Facilitating Integration and Coherence for SDG Implementation'xxx can help governments achieve the type of joint planning and budgeting processes/guidelines, as well as cross-sectoral governance structures, co-financing relies upon.
• Acceleration and prioritization tools on modelling for sustainable developmentxxxi, especially the economy-wide models, can support governments to assess the impacts of different policies and investments across national priorities.
• The ‘SDG Accelerator and Bottleneck Assessment’xxxii tool can support countries to identify ‘accelerator’ policies and programmes which deliver multiplier effects across the SDGs, as well as solutions to bottlenecks associated with these. These are potentially the interventions that could be co-financed.
• ‘Institutional and Context Analysis for Sustainable Development Goals — Guidance Note’ xxxiii can support the identification of co-financing barriers and enablers, including the incentives and disincentives of affected stakeholders, as well as windows of political opportunity.
• ‘Financing the 2030 Agenda — An Introductory Guidebook for UNDP Country Offices’xxxiv can help contextualize the co-financing approach within broader discussions and available tools concerning financing for sustainable development.
43
Guidance Note – Financing across sectors for sustainable development
The Mainstreaming, Acceleration and Policy Support (MAPS)8 approach to SDG implementation features country missions and is a concrete opportunity to advocate the co-financing approach to national stakeholders. The April 2018 Discussion Paper ‘MAPS Mission Engagement and SDG Implementation Support’xxxv reviews MAPS country support missions over the 2016–2017 period. The paper notes, “One of the most consistent areas of demand from recent MAPS countries is for advice on financing national development priorities.”
8 MAPS is the dedicated common UN approach under the auspices of the UNDG to support SDG implementation in countries. Mainstreaming is the support given to governments as they ‘land’ the agenda at national and local levels, incorporating it into their strategies, plans, and budgets, while strengthening their data systems. Acceleration means steering resources towards high-impact areas capable of advancing multiple goals and targets at once. It also means carefully considering and managing trade-offs between goals and targets, and identifying and overcoming barriers to speed up progress. Finally, Policy Support concentrates on ensuring that the full spectrum of skills and technical support within the UN development system is available to countries and provided in a timely, coordinated and demand-driven manner at lowest possible cost.

44
45
Real-world applicationsThis section provides emerging examples of where variations of the co-financing approach have been used, comparing these experiences to the ‘optimal’ co-financing model detailed in this note.
4
46
Guidance Note – Financing across sectors for sustainable development
While there is a significant history and body of literature on cross-sector collaboration in general, cross-sectoral co-financing is nascent and the approach detailed herein is a theoretical economic framework which has yet to be optimally scaled. However, there are a growing number of real-world examples which approximate the assumed optimal model of co-financing; these examples illustrate recognition of sectoral interdependencies, and willingness to apply a progressive shared financing approach in response.
The key distinction between the real-world examples and the optimal model presented in Section 2 is that the real-world examples do not explicitly recognize and measure the magnitude of benefits disaggregated by sector, with cost sharing proportionate to the sector-specific benefits. Drawbacks from lacking or not pursuing evidence on the benefit to each sector may include a reduced willingness of all relevant sectors to engage in co-financing, and inequitable distribution of costs across sectors. Regardless, though imperfect, the real-world examples show a range of co-financing possibilities. Each case is unique in terms of the intervention financed, sectors involved and financial and regulatory frameworks developed around implementation.
4.1 SDG planning in Malawi
In 2017, the Government of Malawi requested UNDP’s support to integrate the co-financing approach into its integrated SDG (iSDG) planning framework—an interactive system dynamics model that helps prioritize and mainstream the SDGs into national planning processes.9 The relevance of co-financing to iSDG modelling is two-fold. First, the iSDG model is geared towards informing a more optimal initial allocation of government resources across sectors and SDGs. To achieve maximum impact, certain sector budgets may need to be increased at the expense of others. However, this does not necessarily mean that the sector with a reduced budget will see its outcomes affected negatively. The Malawi example demonstrates that ex ante co-financing or reallocation would still benefit the ‘losing’ sectors, and generate better sectoral outcomes than if they had each invested the resources internally. Second, as noted throughout, the co-financing approach can help identify ‘accelerator’ interventions that generate multiple impacts across goals and targets, and would thus be eligible for pooled cross-sectoral financing.
Identification and quantification of co-financing options in the iSDG-Malawi Model
The analysis set out to identify cases where a sector could achieve better impacts on its SDG targets by making an incremental investment in another sector’s interventions, rather than spending the same amount on its own sectoral interventions. Simulations with iSDG Malawi demonstrated that the policies with the largest multiplier impact were climate change adaptation (SDG 13), as well as increased health expenditure with greater allocation to reproductive health (SDG 3). Based on
9 The official report is forthcoming.
47
Guidance Note – Financing across sectors for sustainable development
this, iterative simulations were run for investments in climate change mitigation and health to illustrate the potential benefits of co-financing for these areas. Sectors in the iSDG model that would benefit most from investments in these areas were identified as potential co-payers. These included the poverty alleviation sector, the labour/industry sector, and the agricultural sector. For each co-financing case, two scenarios were modeled:
• Silo budgeting scenario: where the co-payers would receive an increased budget (as a percentage of Gross Domestic Product/GDP) and spend that increase within their own sector.
• Co-financing scenario: where the co-payers would receive the same increased budget, but spend it in the other sector.
In order to assess the potential benefits of co-financing, both the silo budget and co-financing scenarios were run and target achievements were independently compared to the ‘business as usual’ (BAU) scenario - the current situation of no incremental increase in budget. The incremental benefit of investing one sector’s resources in another sector was quantified as the difference in the achievement of each target between the co-financing and the silo budgeting scenario.10 This approach allows for an estimate of efficiency gains, in terms of improved outcomes from the same level of expenditure, and shows how more integrated and cross-sectoral financing could generate synergies and increase overall impact. This effectively captures two types of efficiency gains:
1. Gains from relaxing the constraints of what types of interventions each sector can invest in, and allowing for a sector to invest in another sector’s interventions to optimize the achievement of its targets and goal;
2. Synergistic gains from pooling resources from additional sectors to jointly reallocate towards one ‘accelerator’ investment area or intervention, and thereby amplify overall impacts.
The assumption underlying the first set of gains is that the co-paying sector is reallocating its funds to leverage the existing expenditures in the implementing sector, and that this investment is only beneficial because it builds on the existing investment. It can therefore be categorized as ‘co-financing’, because the co-paying sector and the implementing sector’s expenditures are implicitly pooled.11
10 Targets that were expressed in proportions or relative indicators were translated into natural units of outcome, using data on Malawi’s population size in each year (generated by the model). This allowed for an estimate of additional benefits in more tangible units, such as number of people living in poverty, number of people employed, or number of deaths averted.11 It does not imply that it would be more efficient for a co-paying sector to fully finance a specific intervention in another sector, or that in the absence of any financing from the implementing sector it would still be in the interest of the former to reallocate its resources from its internal interventions to this external intervention. This assumption reflects real-world resource allocation, which tends to be incremental.
48
Guidance Note – Financing across sectors for sustainable development
One limitation12 of the analysis is that transaction costs of coordination were not taken into account. The costs (both time and financial) of setting up and implementing a co-financing mechanism should not be underestimated. These would need to be incorporated when estimating the net benefit of cross-sectoral transfers. Reallocating sectoral budgets after the initial central allocation will cost more than adjusting the initial allocation.
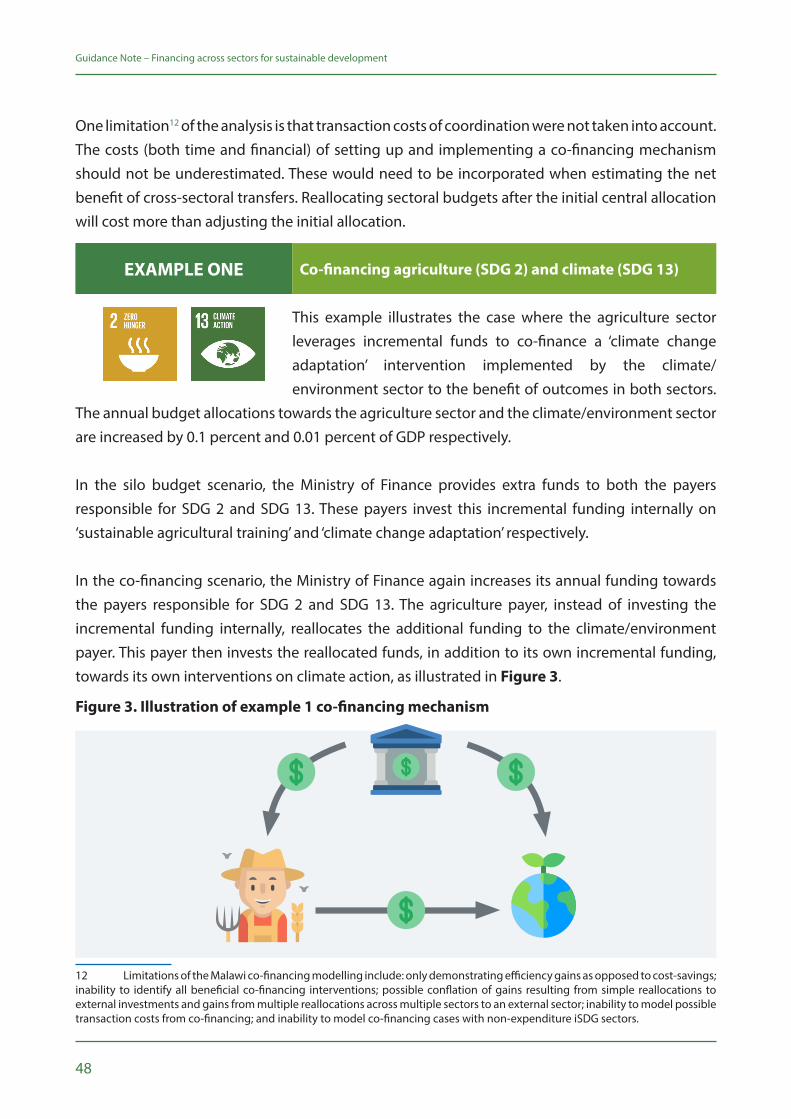
This example illustrates the case where the agriculture sector leverages incremental funds to co-finance a ‘climate change adaptation’ intervention implemented by the climate/environment sector to the benefit of outcomes in both sectors.
The annual budget allocations towards the agriculture sector and the climate/environment sector are increased by 0.1 percent and 0.01 percent of GDP respectively.
In the silo budget scenario, the Ministry of Finance provides extra funds to both the payers responsible for SDG 2 and SDG 13. These payers invest this incremental funding internally on ‘sustainable agricultural training’ and ‘climate change adaptation’ respectively.
In the co-financing scenario, the Ministry of Finance again increases its annual funding towards the payers responsible for SDG 2 and SDG 13. The agriculture payer, instead of investing the incremental funding internally, reallocates the additional funding to the climate/environment payer. This payer then invests the reallocated funds, in addition to its own incremental funding, towards its own interventions on climate action, as illustrated in Figure 3.
12 Limitations of the Malawi co-financing modelling include: only demonstrating efficiency gains as opposed to cost-savings; inability to identify all beneficial co-financing interventions; possible conflation of gains resulting from simple reallocations to external investments and gains from multiple reallocations across multiple sectors to an external sector; inability to model possible transaction costs from co-financing; and inability to model co-financing cases with non-expenditure iSDG sectors.
EXAMPLE ONE Co-financing agriculture (SDG 2) and climate (SDG 13)
Figure 3. Illustration of example 1 co-financing mechanism
49
Guidance Note – Financing across sectors for sustainable development
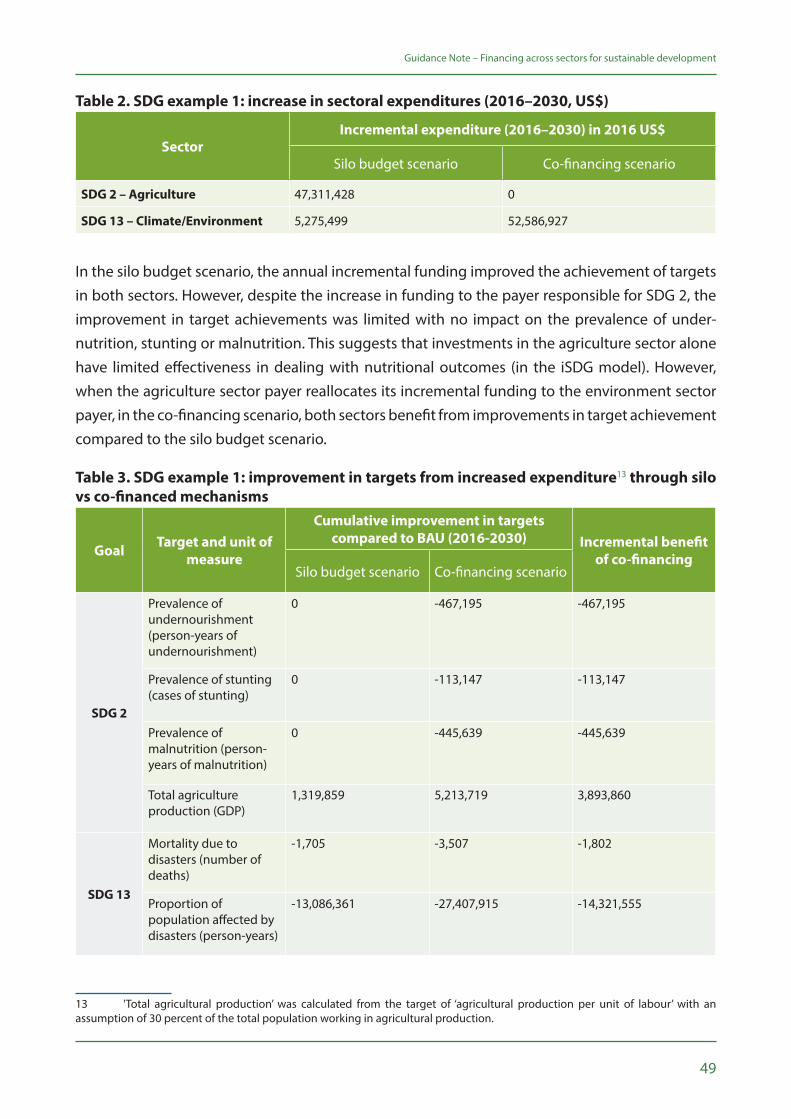
Table 2. SDG example 1: increase in sectoral expenditures (2016–2030, US$)
SectorIncremental expenditure (2016–2030) in 2016 US$
Silo budget scenario Co-financing scenario
SDG 2 – Agriculture 47,311,428 0
SDG 13 – Climate/Environment 5,275,499 52,586,927
In the silo budget scenario, the annual incremental funding improved the achievement of targets in both sectors. However, despite the increase in funding to the payer responsible for SDG 2, the improvement in target achievements was limited with no impact on the prevalence of under-nutrition, stunting or malnutrition. This suggests that investments in the agriculture sector alone have limited effectiveness in dealing with nutritional outcomes (in the iSDG model). However, when the agriculture sector payer reallocates its incremental funding to the environment sector payer, in the co-financing scenario, both sectors benefit from improvements in target achievement compared to the silo budget scenario.
Table 3. SDG example 1: improvement in targets from increased expenditure13 through silo vs co-financed mechanisms
Goal Target and unit of measure
Cumulative improvement in targets compared to BAU (2016-2030) Incremental benefit
of co-financingSilo budget scenario Co-financing scenario
SDG 2
Prevalence of undernourishment (person-years of undernourishment)
0 -467,195 -467,195
Prevalence of stunting (cases of stunting)
0 -113,147 -113,147
Prevalence of malnutrition (person-years of malnutrition)
0 -445,639 -445,639
Total agriculture production (GDP)
1,319,859 5,213,719 3,893,860
SDG 13
Mortality due to disasters (number of deaths)
-1,705 -3,507 -1,802
Proportion of population affected by disasters (person-years)
-13,086,361 -27,407,915 -14,321,555
13 'Total agricultural production’ was calculated from the target of ‘agricultural production per unit of labour’ with an assumption of 30 percent of the total population working in agricultural production.
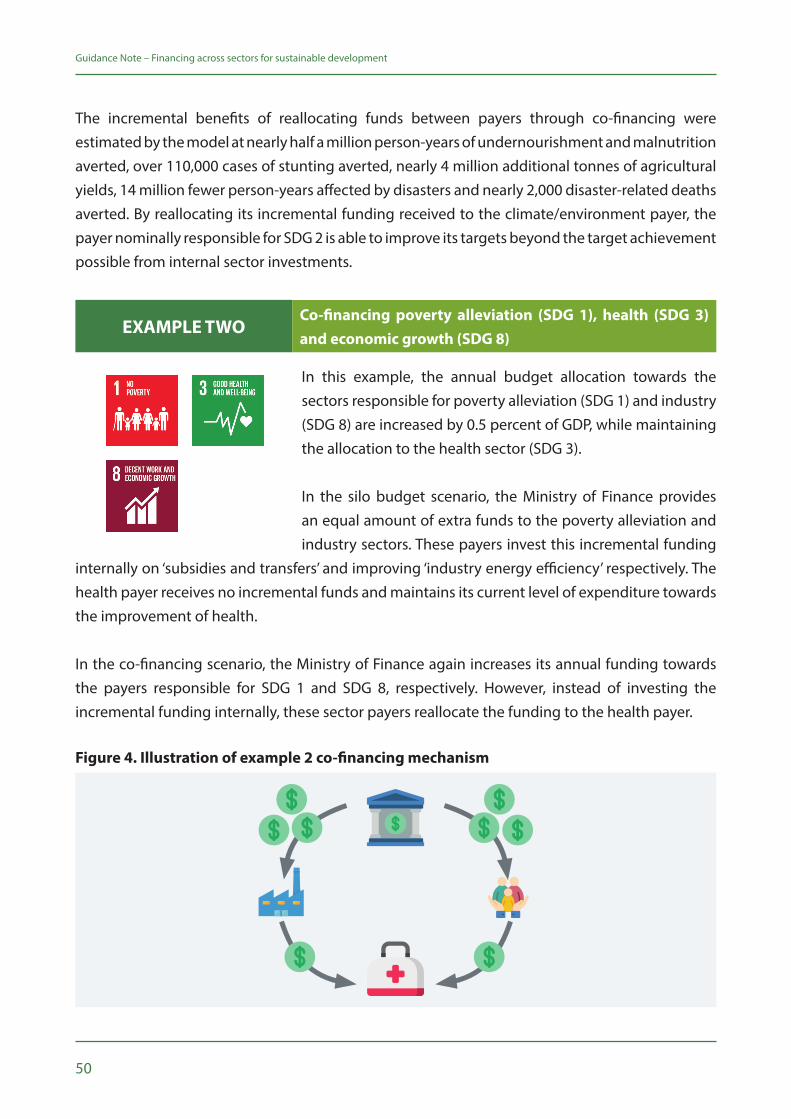
50
Guidance Note – Financing across sectors for sustainable development
The incremental benefits of reallocating funds between payers through co-financing were estimated by the model at nearly half a million person-years of undernourishment and malnutrition averted, over 110,000 cases of stunting averted, nearly 4 million additional tonnes of agricultural yields, 14 million fewer person-years affected by disasters and nearly 2,000 disaster-related deaths averted. By reallocating its incremental funding received to the climate/environment payer, the payer nominally responsible for SDG 2 is able to improve its targets beyond the target achievement possible from internal sector investments.
In this example, the annual budget allocation towards the sectors responsible for poverty alleviation (SDG 1) and industry (SDG 8) are increased by 0.5 percent of GDP, while maintaining the allocation to the health sector (SDG 3).
In the silo budget scenario, the Ministry of Finance provides an equal amount of extra funds to the poverty alleviation and industry sectors. These payers invest this incremental funding
internally on ‘subsidies and transfers’ and improving ‘industry energy efficiency’ respectively. The health payer receives no incremental funds and maintains its current level of expenditure towards the improvement of health.
In the co-financing scenario, the Ministry of Finance again increases its annual funding towards the payers responsible for SDG 1 and SDG 8, respectively. However, instead of investing the incremental funding internally, these sector payers reallocate the funding to the health payer.
EXAMPLE TWOCo-financing poverty alleviation (SDG 1), health (SDG 3) and economic growth (SDG 8)
Figure 4. Illustration of example 2 co-financing mechanism
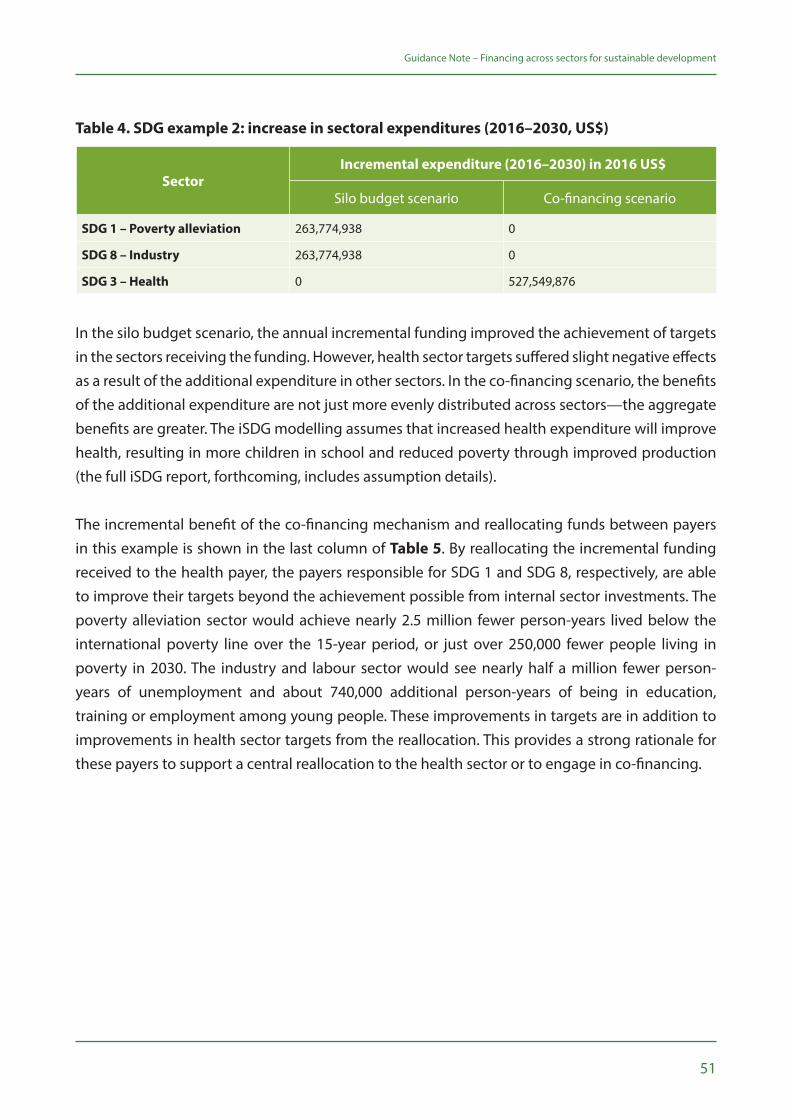
51
Guidance Note – Financing across sectors for sustainable development
SectorIncremental expenditure (2016–2030) in 2016 US$
Silo budget scenario Co-financing scenario
SDG 1 – Poverty alleviation 263,774,938 0
SDG 8 – Industry 263,774,938 0
SDG 3 – Health 0 527,549,876
Table 4. SDG example 2: increase in sectoral expenditures (2016–2030, US$)
In the silo budget scenario, the annual incremental funding improved the achievement of targets in the sectors receiving the funding. However, health sector targets suffered slight negative effects as a result of the additional expenditure in other sectors. In the co-financing scenario, the benefits of the additional expenditure are not just more evenly distributed across sectors—the aggregate benefits are greater. The iSDG modelling assumes that increased health expenditure will improve health, resulting in more children in school and reduced poverty through improved production (the full iSDG report, forthcoming, includes assumption details).
The incremental benefit of the co-financing mechanism and reallocating funds between payers in this example is shown in the last column of Table 5. By reallocating the incremental funding received to the health payer, the payers responsible for SDG 1 and SDG 8, respectively, are able to improve their targets beyond the achievement possible from internal sector investments. The poverty alleviation sector would achieve nearly 2.5 million fewer person-years lived below the international poverty line over the 15-year period, or just over 250,000 fewer people living in poverty in 2030. The industry and labour sector would see nearly half a million fewer person-years of unemployment and about 740,000 additional person-years of being in education, training or employment among young people. These improvements in targets are in addition to improvements in health sector targets from the reallocation. This provides a strong rationale for these payers to support a central reallocation to the health sector or to engage in co-financing.
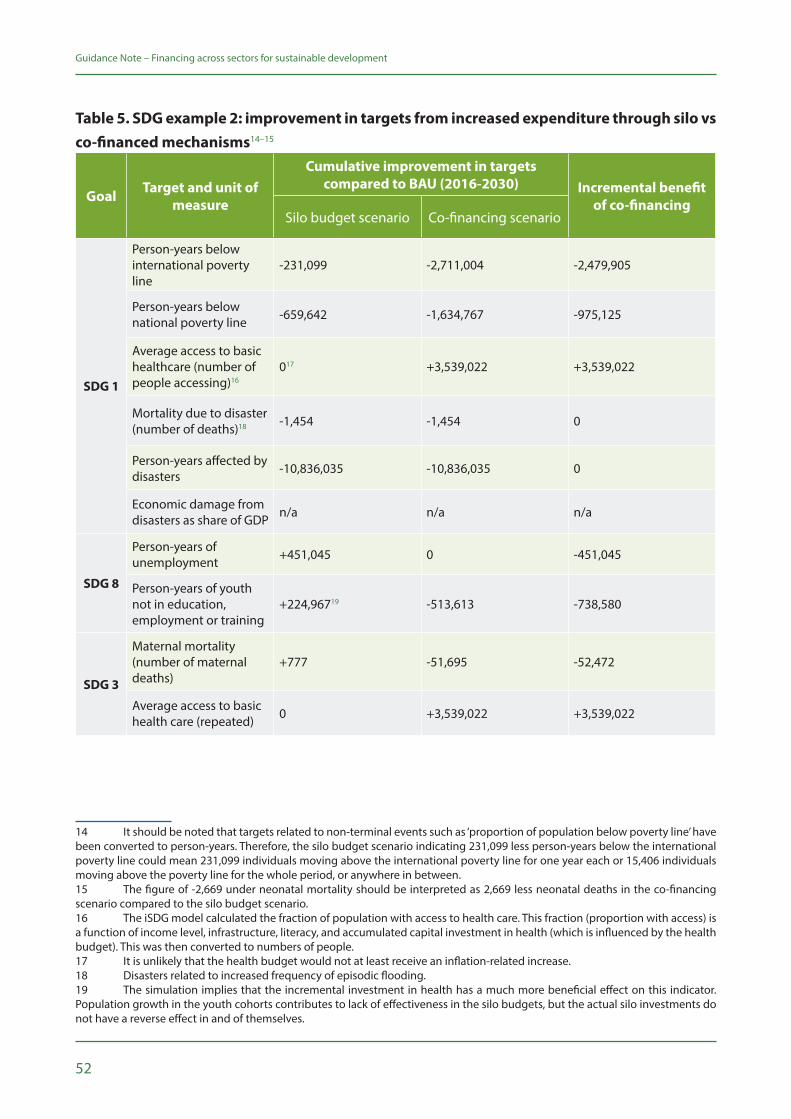
52
Guidance Note – Financing across sectors for sustainable development
Table 5. SDG example 2: improvement in targets from increased expenditure through silo vs co-financed mechanisms14–15
Goal Target and unit of measure
Cumulative improvement in targets compared to BAU (2016-2030) Incremental benefit
of co-financingSilo budget scenario Co-financing scenario
SDG 1
Person-years below international poverty line
-231,099 -2,711,004 -2,479,905
Person-years below national poverty line -659,642 -1,634,767 -975,125
Average access to basic healthcare (number of people accessing)16
017 +3,539,022 +3,539,022
Mortality due to disaster (number of deaths)18 -1,454 -1,454 0
Person-years affected by disasters -10,836,035 -10,836,035 0
Economic damage from disasters as share of GDP n/a n/a n/a
SDG 8
Person-years of unemployment +451,045 0 -451,045
Person-years of youth not in education, employment or training
+224,96719 -513,613 -738,580
SDG 3
Maternal mortality (number of maternal deaths)
+777 -51,695 -52,472
Average access to basic health care (repeated) 0 +3,539,022 +3,539,022
14 It should be noted that targets related to non-terminal events such as ‘proportion of population below poverty line’ have been converted to person-years. Therefore, the silo budget scenario indicating 231,099 less person-years below the international poverty line could mean 231,099 individuals moving above the international poverty line for one year each or 15,406 individuals moving above the poverty line for the whole period, or anywhere in between.15 The figure of -2,669 under neonatal mortality should be interpreted as 2,669 less neonatal deaths in the co-financing scenario compared to the silo budget scenario.16 The iSDG model calculated the fraction of population with access to health care. This fraction (proportion with access) is a function of income level, infrastructure, literacy, and accumulated capital investment in health (which is influenced by the health budget). This was then converted to numbers of people.17 It is unlikely that the health budget would not at least receive an inflation-related increase.18 Disasters related to increased frequency of episodic flooding.19 The simulation implies that the incremental investment in health has a much more beneficial effect on this indicator. Population growth in the youth cohorts contributes to lack of effectiveness in the silo budgets, but the actual silo investments do not have a reverse effect in and of themselves.
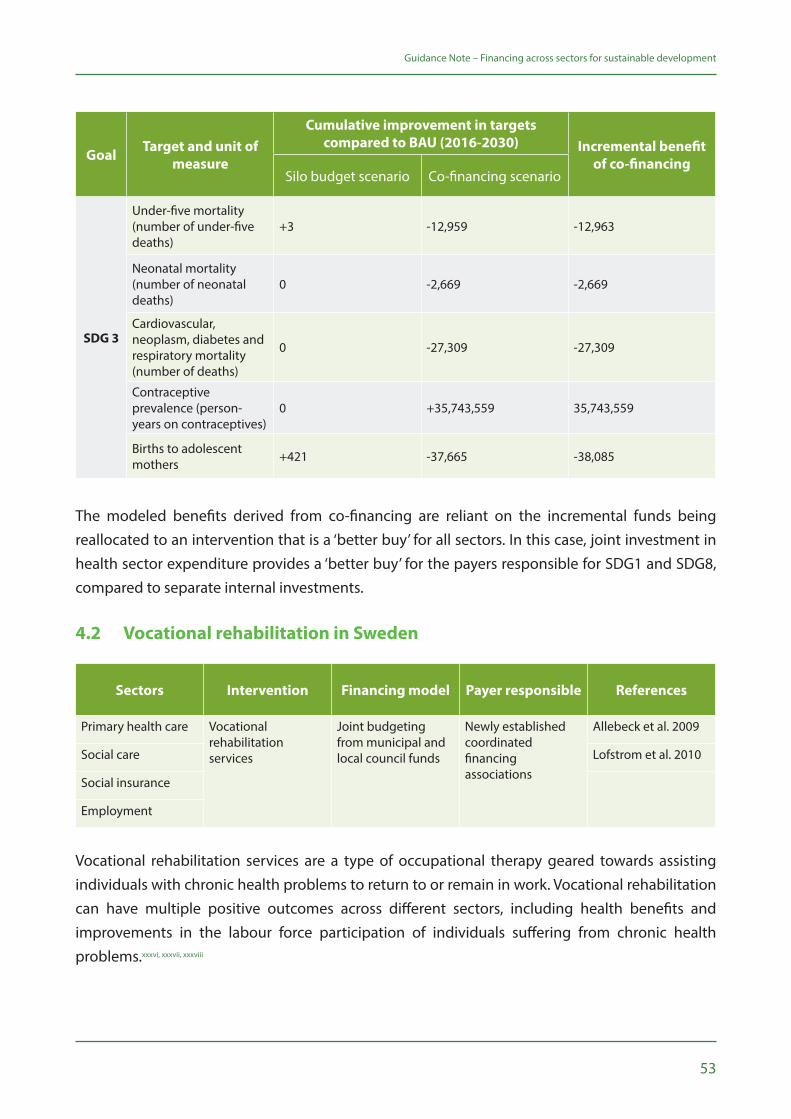
53
Guidance Note – Financing across sectors for sustainable development
Goal Target and unit of measure
Cumulative improvement in targets compared to BAU (2016-2030) Incremental benefit
of co-financingSilo budget scenario Co-financing scenario
SDG 3
Under-five mortality (number of under-five deaths)
+3 -12,959 -12,963
Neonatal mortality (number of neonatal deaths)
0 -2,669 -2,669
Cardiovascular, neoplasm, diabetes and respiratory mortality (number of deaths)
0 -27,309 -27,309
Contraceptive prevalence (person-years on contraceptives)
0 +35,743,559 35,743,559
Births to adolescent mothers +421 -37,665 -38,085
The modeled benefits derived from co-financing are reliant on the incremental funds being reallocated to an intervention that is a ‘better buy’ for all sectors. In this case, joint investment in health sector expenditure provides a ‘better buy’ for the payers responsible for SDG1 and SDG8, compared to separate internal investments.
4.2 Vocational rehabilitation in Sweden
Sectors Intervention Financing model Payer responsible References
Primary health care Vocational rehabilitation services
Joint budgeting from municipal and local council funds
Newly established coordinated financing associations
Allebeck et al. 2009
Social care Lofstrom et al. 2010
Social insurance
Employment
Vocational rehabilitation services are a type of occupational therapy geared towards assisting individuals with chronic health problems to return to or remain in work. Vocational rehabilitation can have multiple positive outcomes across different sectors, including health benefits and improvements in the labour force participation of individuals suffering from chronic health problems.xxxvi, xxxvii, xxxviii
54
Guidance Note – Financing across sectors for sustainable development
Over the past few decades, the growth in specialist and long-term care has led to an increasingly fragmented system of welfare services. In response, there has been a push to improve collaboration between organizations delivering welfare services. Sweden, recognizing these cross-sector benefits, has been a pioneer in experimenting with collaborative models of delivering welfare services. One such experiment—SOCSAM—encouraged the integration of organizations involved in vocational rehabilitation services delivery. The trial SOCSAM legislation was active between 1994 and 2003.
A co-financing approach was trialled, allowing the payers responsible for social security, social welfare and health services to voluntarily pool up to 5 percent of their sectoral budgets and form a financing association to manage these joint budgets.xxxix The pooled fund was flexible in that it could be spent across the whole spectrum of care required in vocational rehabilitation cases, governed by the financing association with representatives from each sector. A representative from the employment sector was often involved in the financing association without financial contribution to the arrangement. The legislation specified the responsibilities of the local political board and the financial framework, but each trial area was free to decide what services should be included.
The overarching objective of the co-financing approach was to improve collaboration between the sectors with vested interests in the delivery of vocational rehabilitation, in order to improve efficiency. Recent increases in labour market non-participation due to long-term chronic health problems provided an incentive for the separate organizations to change the model of care. Moreover, each investing sector had an independent rationale for contributing to the joint budget. The social insurance sector would reduce the number of individuals out of work and in need of sickness or unemployment benefits, thereby reducing the financial burden on the sector.
The health sector would benefit from the health gains achieved both directly from the vocational therapy and indirectly from avoided health care costs associated with unemployment, as there was growing recognition of the detrimental health effect of unemployment.xl Likewise, the social care sector would improve long-term care outcomes and relieve sectoral financial pressures. Therefore, although each payer holds distinct objectives, their objectives were interdependent. Co-financing enabled payers to collaborate to achieve welfare gains across sectoral boundaries.
Quantitative evaluations were ambiguous to the effect of the trial, with limited evidence that the legislation caused reductions in social insurance expenditure and limited impacts on patient health outcomes.xli Qualitative evaluations, however, found a positive effect of the coordinated care and co-financing model. Staff working in health centres that adopted the approach reported better collaboration across the professional spectrum of caregiving teams. The evaluations led to
55
Guidance Note – Financing across sectors for sustainable development
SOCSAM legislation becoming permanent in 2004, allowing local government to voluntarily set up similar cross-sector financing associations to achieve more integrated care.
4.3 School health and nutrition in Zambia
Sectors Intervention Financing model Payer responsible References
Education School health and nutrition programme
Different payers with different objectives fund various components of the programme20
Local government authorities
Robison et al. 2004
Health care Freund et al. 2005
It is universally accepted that poor health and malnutrition have detrimental impacts on educational performance while increasing early drop-out and absenteeism rates. The provision of quality schools, textbooks and teachers can only result in positive educational outcomes if children are present and in a condition to learn.xlii Additionally, no single sector can fully address the issue of poor health and malnutrition. The causes and consequences of malnutrition are multifaceted and require a coordinated multi-stakeholder approach.
In Zambia, the Ministry of Education acknowledged that school-aged children were suffering from malnutrition, malaria, micronutrient deficiencies, and heavy worm infestation, all impacting academic performance. This contributed to the Ministry advancing child health and nutrition as a national priority. In response, the Communities Supporting Health, HIV and AIDS, Nutrition, Gender, and Equity Education in Schools (CHANGES) programme was designed. CHANGES is a multisectoral education programme, one component of which is School Health and Nutrition (SHN). From 2001–2003, Zambia’s education sector piloted SHN in 120 schools.
The SHN component was developed by the Ministry of Education, Ministry of Health, and Ministry of Community Development and Social Services as a first step towards developing a national school health and nutrition policy. During the design of the SHN, various health and education stakeholders identified intestinal parasites, bilharzia/schistosomiasis, micronutrient deficiencies (vitamin A and iron) as well as HIV and AIDS as the primary health issues faced by school-aged children. The link between health, nutrition and cognitive ability was central throughout the design of the programme. Research was commissioned documenting the benefits of selected health interventions on health outcomes and possible cognitive benefits for students.
The objective of the SHN pilot was to improve educational outcomes and equity among children attending school through the provision of health and nutrition interventions. The SHN
20 No documentation was found on the financial mechanism used for the programme. From inference, it seems that there was no explicit pooling of finances, with the payers (USAID, JICA and Gates) all using their own independent mechanisms.
56
Guidance Note – Financing across sectors for sustainable development
programme delivered a number of health interventions within schools including deworming and supplementation of vitamin A and iron. Teachers were trained as proxy health workers to assess students’ conditions and deliver the interventions with oversight from government health workers. The teacher time dedicated to the provision of health interventions can be viewed as education inputs being utilized for provision of a health intervention.
SHN was piloted in three districts of Zambia’s Eastern Province where health and education indicators were poor. The pilot programme was initially funded by the Education Programme of the United States Agency for International Development (USAID) while the drugs were supplied through the health sector with funding from the Japan International Cooperation Agency (JICA) and the Bill and Melinda Gates Foundation. Therefore, SHN engaged payers (though not public expenditure in this case) with different objectives, recognizing the programme to be mutually beneficial. The programme engaged the Ministry of Education, Ministry of Health and Ministry of Community Development and Social Services in different components of cross-sectoral collaboration. A joint memorandum of understanding was signed between the stakeholders while implementation guidelines outlining process roles were developed and disseminated. Oversight was provided by SHN cross-sectoral committees at provincial and district levels while separate cross-sectoral monitoring and evaluation teams tracked implementation progress through a SHN-specific information system.xliii
A key component of the approach was the simplicity of its organization. Rather than attempting to fully integrate the different components and stakeholders of the programme, the approach relied on collaboration and utilizing the resources of each sector for implementation. The programme benefited from leveraging current health sector drug supply chains, linking them to school distribution networks.
By 2003, over 400 teachers and health workers had been trained and 40,000 pupils had received deworming drugs and micronutrient supplements under the SHN programme. A phased randomized controlled trial was used to assess the impact of the co-financed intervention. A positive health impact was found, with the prevalence of infection with parasitic worms reduced by 75 percent from baseline and the intensity of remaining infections reduced. Similarly, positive educational outcomes were observed, as children who received the treatment performed significantly better in standardized cognitive tests. This positive educational effect was more pronounced the longer treatment was received, illustrating a positive cumulative effect. Additionally, the intervention was shown to offset some of the initial imbalance in educational outcomes between girls and boys, with girls’ scores increasing more than boys’ scores. Finally, it was observed that teachers were highly effective in delivering the interventions.xliv
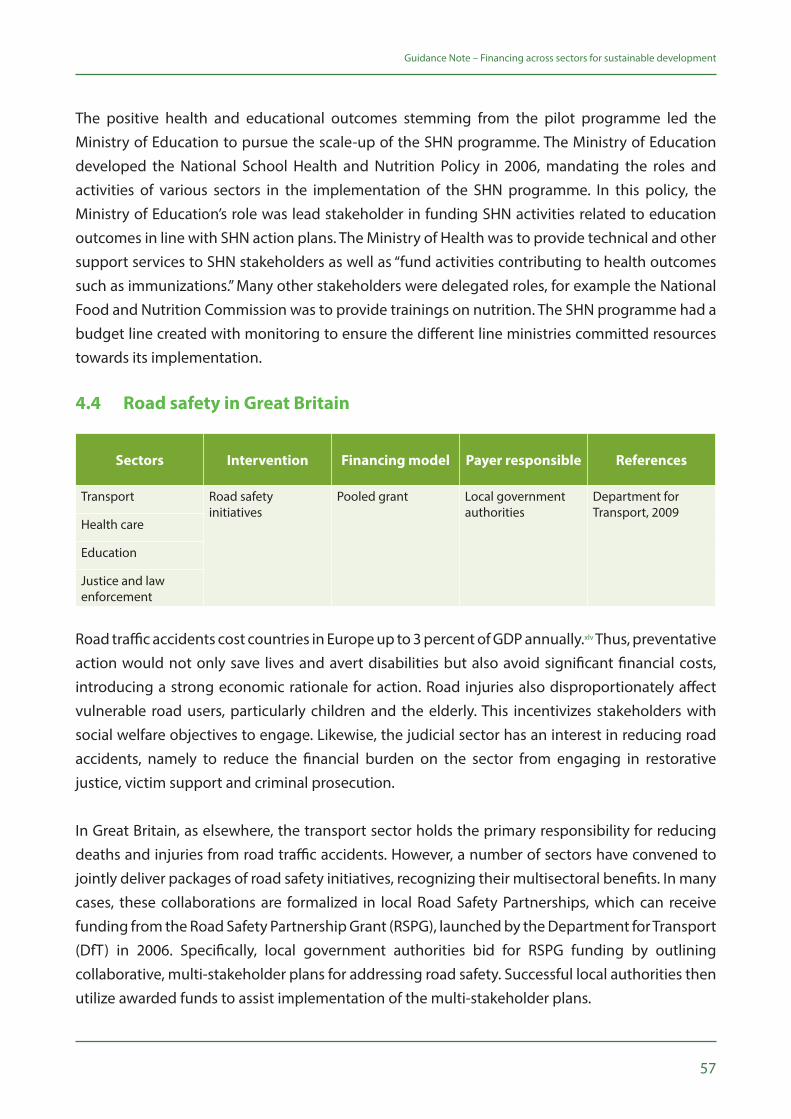
57
Guidance Note – Financing across sectors for sustainable development
The positive health and educational outcomes stemming from the pilot programme led the Ministry of Education to pursue the scale-up of the SHN programme. The Ministry of Education developed the National School Health and Nutrition Policy in 2006, mandating the roles and activities of various sectors in the implementation of the SHN programme. In this policy, the Ministry of Education’s role was lead stakeholder in funding SHN activities related to education outcomes in line with SHN action plans. The Ministry of Health was to provide technical and other support services to SHN stakeholders as well as “fund activities contributing to health outcomes such as immunizations.” Many other stakeholders were delegated roles, for example the National Food and Nutrition Commission was to provide trainings on nutrition. The SHN programme had a budget line created with monitoring to ensure the different line ministries committed resources towards its implementation.
4.4 Road safety in Great Britain
Sectors Intervention Financing model Payer responsible References
Transport Road safety initiatives
Pooled grant Local government authorities
Department for Transport, 2009
Health care
Education
Justice and law enforcement
Road traffic accidents cost countries in Europe up to 3 percent of GDP annually.xlv Thus, preventative action would not only save lives and avert disabilities but also avoid significant financial costs, introducing a strong economic rationale for action. Road injuries also disproportionately affect vulnerable road users, particularly children and the elderly. This incentivizes stakeholders with social welfare objectives to engage. Likewise, the judicial sector has an interest in reducing road accidents, namely to reduce the financial burden on the sector from engaging in restorative justice, victim support and criminal prosecution.
In Great Britain, as elsewhere, the transport sector holds the primary responsibility for reducing deaths and injuries from road traffic accidents. However, a number of sectors have convened to jointly deliver packages of road safety initiatives, recognizing their multisectoral benefits. In many cases, these collaborations are formalized in local Road Safety Partnerships, which can receive funding from the Road Safety Partnership Grant (RSPG), launched by the Department for Transport (DfT) in 2006. Specifically, local government authorities bid for RSPG funding by outlining collaborative, multi-stakeholder plans for addressing road safety. Successful local authorities then utilize awarded funds to assist implementation of the multi-stakeholder plans.
58
Guidance Note – Financing across sectors for sustainable development
The RSPG was introduced to supplement the Road Safety Grant, which supports core road safety activities. Projects were approved in three rounds: 2007–9, 2008–10, and 2009–11. The DfT invited proposals from local authorities and then selected a sample for funding. Project submissions were required to include evaluation plans. Of the 156 submissions, 56 projects covering a broad spectrum of interventions were approved. In one example, as part of the funding for the Greater Manchester project, the RSPG financed the evaluation of a police enforcement programme aiming to seize unlicensed vehicles. Another intervention financed under the grant, implemented by Bristol City Council and Life Cycle UK, educated cyclists of the dangers of not using proper safety equipment.
Projects were largely delivered by partnerships of local organizations, coordinated by a project manager. The RSPG represented less than 2 percent of government funding support for local road safety. Costs to run the RSPG—i.e. for bid submission and evaluation, reporting requirements to DfT, and monitoring and evaluation—were estimated at £1 million.
Many of the projects financed under the RSPG underwent independent post-intervention assessments. A sample of RSPG schemes cost an estimated £6 million while delivering annual casualty reduction benefits valued at £11.5 million. These estimates represent a 190 percent return on investment (ROI), showing these particular RSPG projects to be potentially beneficial to all local partners.xlvi Further, the type of projects which the RSPG financed would likely not have been implemented if funding were not specifically dedicated to cross-sector partnerships. Some projects, originally financed by the RSPG, were planned for continuation after the expiration of the grant scheme using mainstream funding. The impact of RSPG funds was not evaluated against an alternative scenario in which the broader Road Safety Grant would have just been increased by an equivalent sum. However, the available ROI analyses of RSPG projects suggest that the RSPG delivered high-value projects.
Finally, many of the experiences and barriers faced during the RSPG process are useful for those supporting co-financing to consider and prepare for:
• There are extra administrative costs required for a specific bidding process from local authorities and assessment of bids. For the RSPG, these costs totalled about £1 million for the three Partnership Grant rounds, or about 9 percent of the programme’s value. Incremental process changes introduced for the latest round reduced administrative costs to 6–7 percent.
• In some cases, participation by partner organizations was fully realized as originally envisaged (or promised). It is important to define and then maintain partner relationships and contributions (whether financial or in-kind) throughout the project and possibly beyond.
59
Guidance Note – Financing across sectors for sustainable development
• In some areas there was a capacity/capability gap within the local authority to be able to cope with the governance requirements of the overall grant scheme.
• Individual project evaluations varied in quality.
More broadly, the real-world examples of co-financing presented in this section demonstrate that the approach can be operationalized and deliver greater value for money and impact in different contexts, at different programmatic scales, and with the engagement of different payers and partners. In other words, there is no one-size-fits-all co-financing model. A key takeaway is that the most impactful investment areas for a particular sector to achieve its primary outcome/s of interest or responsibility may not be investment areas under its traditional purview or mandate. Co-financing requires planners and financial decision makers, within sectors and/or at central levels, to prioritize evidence, revisit programmatic and budgetary constraints, and strengthen intersectoral collaboration and governance capacities. The next section examines additional potential applications of co-financing based on existing programme evaluations and peer-reviewed literature.
Credit: © Dominic Chavez/World Bank

60
61
Additional potential applicationsThis section presents additional SDG interventions and investment areas that co-financing can support, recognizing that the approach is in its infancy with its full potential nowhere near reached.
5
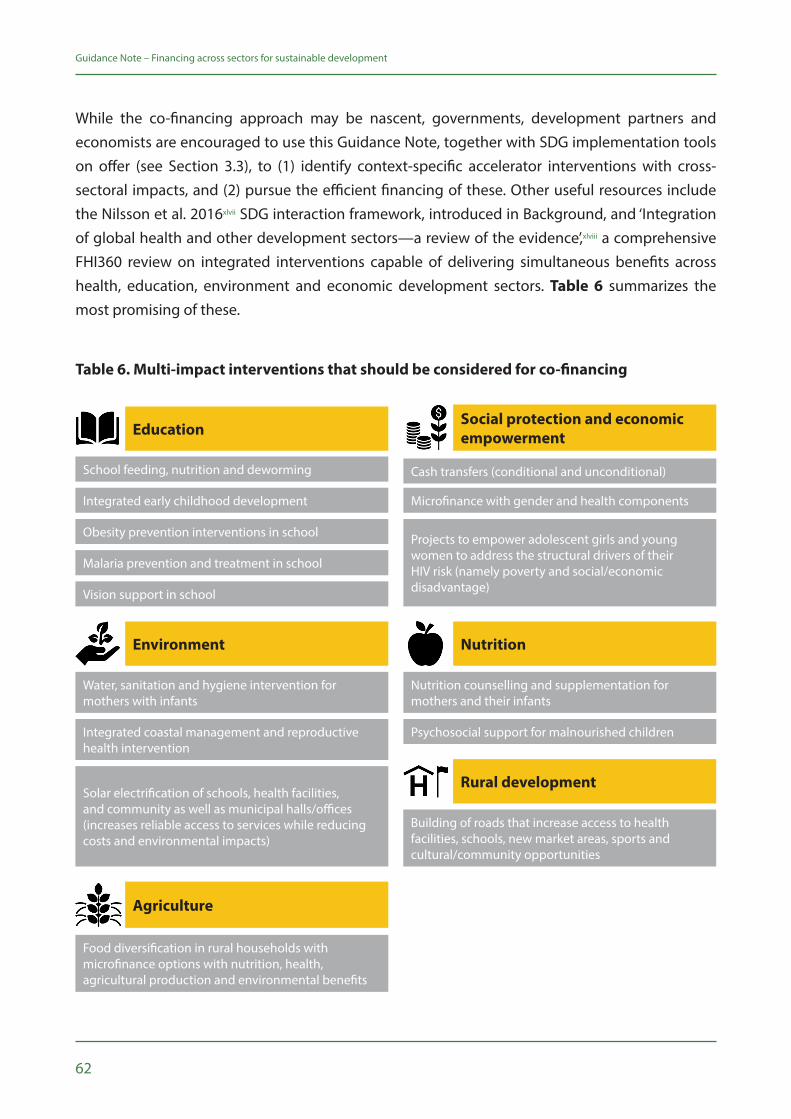
62
Guidance Note – Financing across sectors for sustainable development
While the co-financing approach may be nascent, governments, development partners and economists are encouraged to use this Guidance Note, together with SDG implementation tools on offer (see Section 3.3), to (1) identify context-specific accelerator interventions with cross-sectoral impacts, and (2) pursue the efficient financing of these. Other useful resources include the Nilsson et al. 2016xlvii SDG interaction framework, introduced in Background, and ‘Integration of global health and other development sectors—a review of the evidence’,xlviii a comprehensive FHI360 review on integrated interventions capable of delivering simultaneous benefits across health, education, environment and economic development sectors. Table 6 summarizes the most promising of these.
Education
School feeding, nutrition and deworming
Integrated early childhood development
Obesity prevention interventions in school
Malaria prevention and treatment in school
Vision support in school
Social protection and economic empowerment
Cash transfers (conditional and unconditional)
Microfinance with gender and health components
Projects to empower adolescent girls and young women to address the structural drivers of their HIV risk (namely poverty and social/economic disadvantage)
Nutrition
Nutrition counselling and supplementation for mothers and their infants
Psychosocial support for malnourished children
Environment
Water, sanitation and hygiene intervention for mothers with infants
Integrated coastal management and reproductive health intervention
Solar electrification of schools, health facilities, and community as well as municipal halls/offices (increases reliable access to services while reducing costs and environmental impacts)
Agriculture
Food diversification in rural households with microfinance options with nutrition, health, agricultural production and environmental benefits
Rural development
Building of roads that increase access to health facilities, schools, new market areas, sports and cultural/community opportunities
Table 6. Multi-impact interventions that should be considered for co-financing
63
Guidance Note – Financing across sectors for sustainable development
The remainder of this section provides a deeper exploration of some of the potential applications of co-financing. The potential applications covered were selected because they are tied to existing projects and/or have been rigorously evaluated from an academic perspective. The examples are largely focused on health and HIV, in line with the majority of co-financing evidence and focus to date. The examples, however, offer important insights and lessons about the applicability and utility of co-financing.
5.1 Advancing universal health coverage
Health is a precondition for and an outcome and indicator of sustainable development. The goal of universal health coverage (UHC: SDG target 3.8) is to ensure that all people obtain needed health services without suffering financial hardship. Transforming health systems to achieve UHC and other SDG 3 targets is estimated to require an additional US$371 billion per year by 2030, for 67 low- and middle-income countries (LMICs) representing 95 percent of the total population in LMICs. Many of these countries, particularly middle-income countries, have the capacity to self-finance the needed investment. Even with projected increases in domestic health spending, however, a US$20–54 billion annual funding gap would remain.xlix
Adequately and appropriately financing UHC and SDG 3 will require a range of inputs, including continued international financial assistance, greater domestic financing and new approaches which unlock private capital, for example social impact bonds for health.l-li The increased and more efficient use of domestic funds remains critical. Within this context, a major opportunity lies in leveraging non-health sector financing for health-related objectives. Ensuring the seamless utilization of essential health and medical services throughout a person’s lifecycle requires more than simply reducing financial barriers. Complementary measures outside the health sector must also be taken, to cultivate socio-economic environments that shape healthy behaviours, increase demand for health services, and enable quality services to be accessed more easily.21
From a co-financing perspective, several programmes have emerged as especially valuable for UHC objectives. An example is UNDP’s work with governments and other stakeholders in sub-Saharan Africa to equip health centres with solar panels. This work simultaneously increases access to quality health services, ensures sustainable access to basic electricity, and reduces environmentally damaging carbon dioxide (CO2) emissions from traditional fuel sources.22–lii Another example is social protection. Randomized control trials have consistently shown that social protection increases demand for, and uptake of, essential health and medical services.
21 Some of the most successful UHC approaches, such as those adopted in Brazil, Japan, Mexico and Thailand, have gone beyond strengthening health systems to also improve the social, economic and environmental conditions of people’s daily lives.22 As of October 2018, solar systems are in operation at 652 facilities in eight countries, ensuring better access to health services for an estimated 20 million people.
64
Guidance Note – Financing across sectors for sustainable development
A World Bank evaluationliii of Tanzania’s Social Action Fundliv (TASAF), for example, found that the cash transfers led to a considerable increase in the coverage of community-based health insurance among beneficiaries (20 percent of beneficiaries had health insurance, compared to less than 3 percent in the control group). Better health outcomes from social protection have also been consistently observed in nutrition,lv maternal and child healthlvi and, most recently, HIV prevention.lvii Social protection accomplishes these health outcomes while simultaneously achieving core objectives of poverty alleviation, reducing economic and gender inequalities, and promoting human capital among vulnerable households.
Box 4. Co-financing for health and development in sub-Saharan Africa
With support from the Government of Japan, UNDP and STRIVE are supporting several governments in sub-Saharan Africa to co-finance health, UHC and sustainable development. The countries are at various stages of operationalization. For example:
• South Africa is focusing on HIV prevention interventions, including the expansion of cash transfer programmes for young women aged 15–24. South Africa included co-financing as an innovative financing mechanism within its National Strategic Plan for HIV, TB and STIs 2017–2022.lviii
• Ghana is focusing on improving pedestrian road safety in Accra.
• Malawi requested to include but go beyond SDG target 3.8 on UHC. UNDP and the Millennium Institute have finalized a co-financing input for the ‘iSDG Malawi model’, detailed in Section 4. Further, scale-up of the national social cash transfer programme has been identified as a potential area of interest.
• Tanzania intends to focus on a district development project (with health impacts) under TASAF and the local government development grant.
5.2 Cash transfers to keep girls in school in Malawi
The Zomba cash transfer23 intervention implemented and evaluated in Malawi illustrates the potential benefits of cross-sectoral co-financing. The intervention consisted of a monthly cash transfer of about US$10 provided to schoolgirls and out-of-school girls with the objective of keeping them in school. About 30 percent of the cash was given directly to the girls, while the remaining amount went to their guardians. After only 18 months of implementation, the evaluation found a range of positive educational and health outcomes among the girls who were in school at baseline.lix
23 Cash transfers’ central feature is the provision of a pre-determined amount of cash to eligible individuals and households, typically the poor or vulnerable. Cash transfers can be conditional or unconditional. Unconditional cash transfers are provided without obligations on recipients. Conditional cash transfers require co-responsibilities, or conditions, which participants must first satisfy to receive the cash. Often these conditions are tied to uptake of social services, such as in education and/or health.
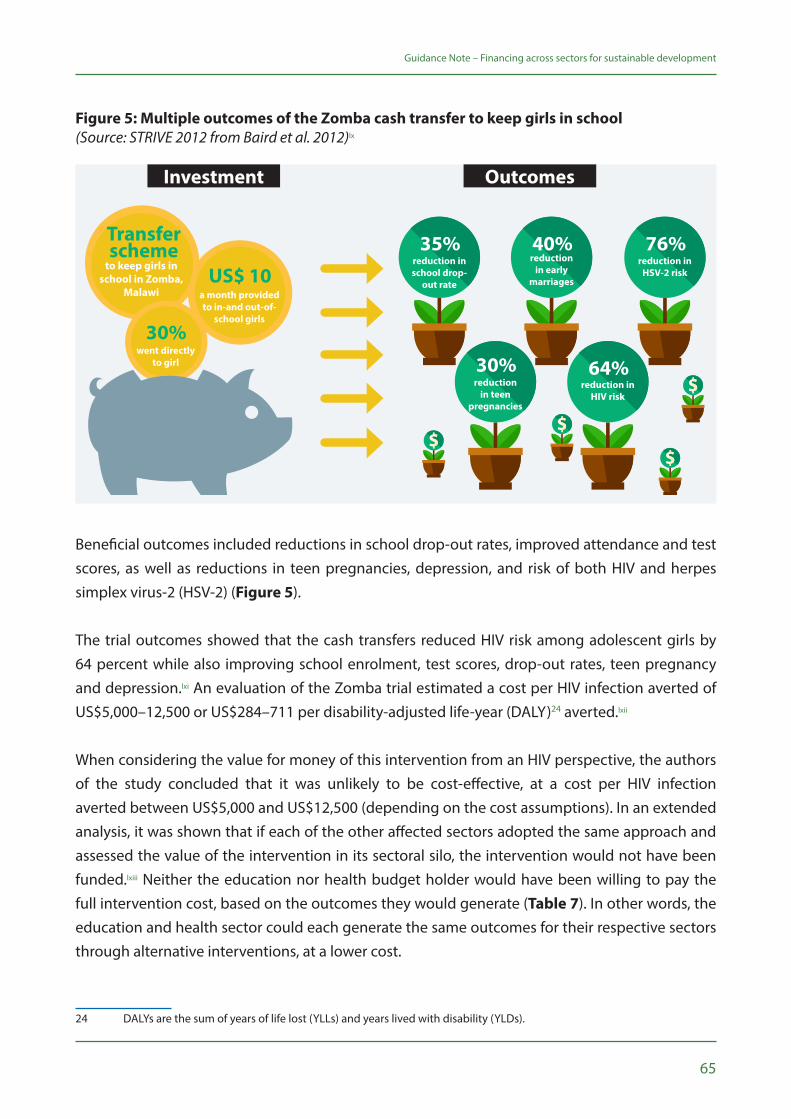
65
Guidance Note – Financing across sectors for sustainable development
Figure 5: Multiple outcomes of the Zomba cash transfer to keep girls in school(Source: STRIVE 2012 from Baird et al. 2012)lx
Beneficial outcomes included reductions in school drop-out rates, improved attendance and test scores, as well as reductions in teen pregnancies, depression, and risk of both HIV and herpes simplex virus-2 (HSV-2) (Figure 5).
The trial outcomes showed that the cash transfers reduced HIV risk among adolescent girls by 64 percent while also improving school enrolment, test scores, drop-out rates, teen pregnancy and depression.lxi An evaluation of the Zomba trial estimated a cost per HIV infection averted of US$5,000–12,500 or US$284–711 per disability-adjusted life-year (DALY)24 averted.lxii
When considering the value for money of this intervention from an HIV perspective, the authors of the study concluded that it was unlikely to be cost-effective, at a cost per HIV infection averted between US$5,000 and US$12,500 (depending on the cost assumptions). In an extended analysis, it was shown that if each of the other affected sectors adopted the same approach and assessed the value of the intervention in its sectoral silo, the intervention would not have been funded.lxiii Neither the education nor health budget holder would have been willing to pay the full intervention cost, based on the outcomes they would generate (Table 7). In other words, the education and health sector could each generate the same outcomes for their respective sectors through alternative interventions, at a lower cost.
24 DALYs are the sum of years of life lost (YLLs) and years lived with disability (YLDs).
a month provided to in-and out-of-
school girls
US$ 10to keep girls in
school in Zomba, Malawi
Transfer scheme
went directly to girl
30%
reduction in school drop-
out rate
35%reduction
in early marriages
40%reduction in
HSV-2 risk
76%
reduction in teen
pregnancies
30%reduction in
HIV risk
64%
Investment Outcomes
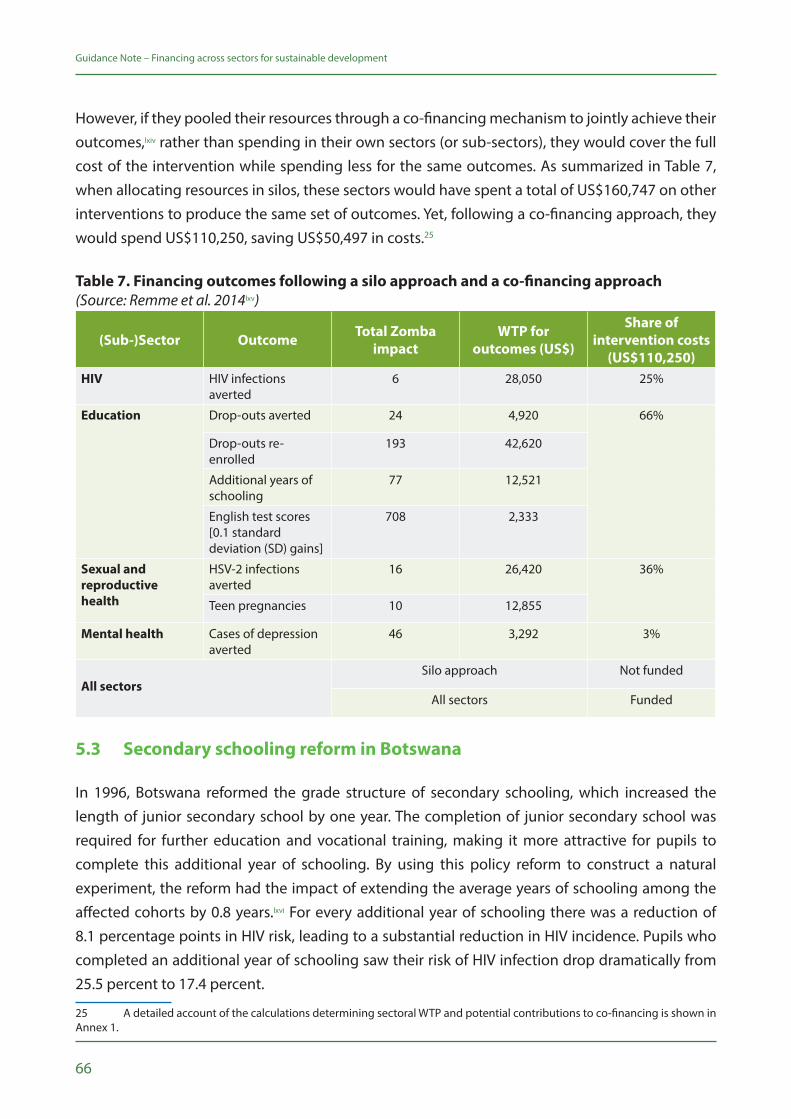
66
Guidance Note – Financing across sectors for sustainable development
However, if they pooled their resources through a co-financing mechanism to jointly achieve their outcomes,lxiv rather than spending in their own sectors (or sub-sectors), they would cover the full cost of the intervention while spending less for the same outcomes. As summarized in Table 7, when allocating resources in silos, these sectors would have spent a total of US$160,747 on other interventions to produce the same set of outcomes. Yet, following a co-financing approach, they would spend US$110,250, saving US$50,497 in costs.25
Table 7. Financing outcomes following a silo approach and a co-financing approach (Source: Remme et al. 2014lxv)
(Sub-)Sector Outcome Total Zomba impact
WTP for outcomes (US$)
Share of intervention costs
(US$110,250)HIV HIV infections
averted6 28,050 25%
Education Drop-outs averted 24 4,920 66%
Drop-outs re-enrolled
193 42,620
Additional years of schooling
77 12,521
English test scores [0.1 standard deviation (SD) gains]
708 2,333
Sexual and reproductive health
HSV-2 infections averted
16 26,420 36%
Teen pregnancies 10 12,855
Mental health Cases of depression averted
46 3,292 3%
All sectorsSilo approach Not funded
All sectors Funded
5.3 Secondary schooling reform in Botswana
In 1996, Botswana reformed the grade structure of secondary schooling, which increased the length of junior secondary school by one year. The completion of junior secondary school was required for further education and vocational training, making it more attractive for pupils to complete this additional year of schooling. By using this policy reform to construct a natural experiment, the reform had the impact of extending the average years of schooling among the affected cohorts by 0.8 years.lxvi For every additional year of schooling there was a reduction of 8.1 percentage points in HIV risk, leading to a substantial reduction in HIV incidence. Pupils who completed an additional year of schooling saw their risk of HIV infection drop dramatically from 25.5 percent to 17.4 percent.
25 A detailed account of the calculations determining sectoral WTP and potential contributions to co-financing is shown in Annex 1.
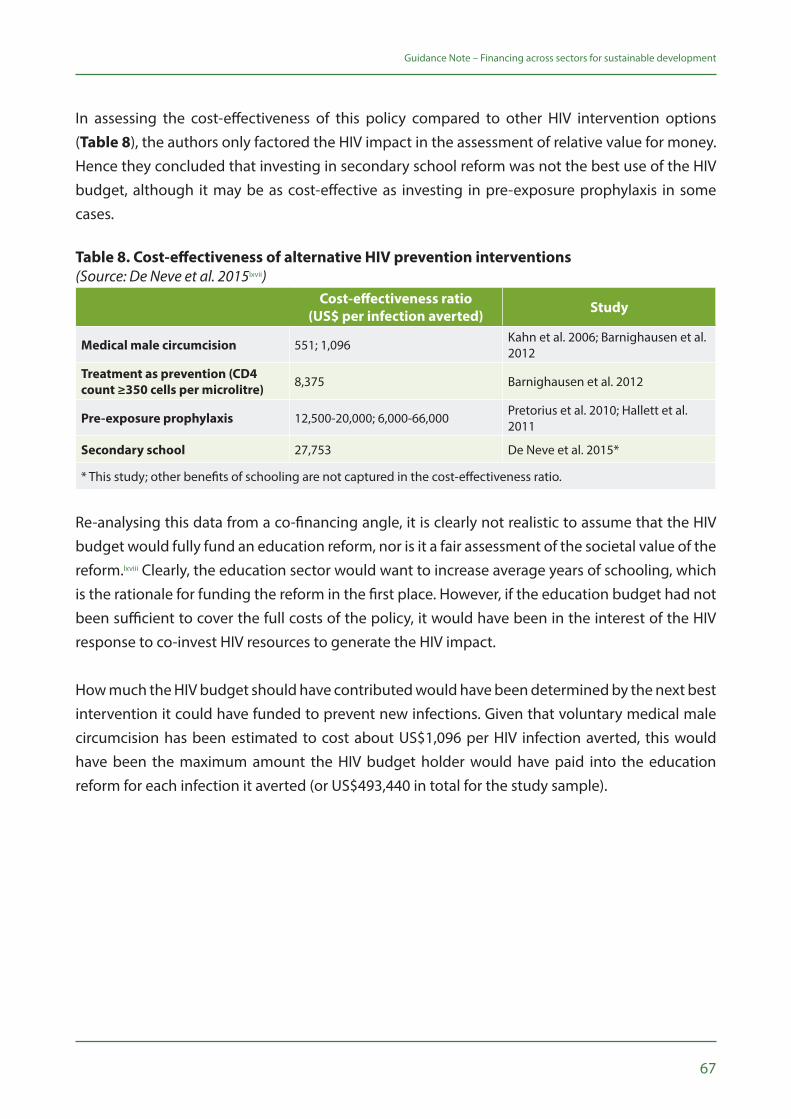
67
Guidance Note – Financing across sectors for sustainable development
In assessing the cost-effectiveness of this policy compared to other HIV intervention options (Table 8), the authors only factored the HIV impact in the assessment of relative value for money. Hence they concluded that investing in secondary school reform was not the best use of the HIV budget, although it may be as cost-effective as investing in pre-exposure prophylaxis in some cases.
Table 8. Cost-effectiveness of alternative HIV prevention interventions(Source: De Neve et al. 2015lxvii)
Cost-effectiveness ratio (US$ per infection averted) Study
Medical male circumcision 551; 1,096 Kahn et al. 2006; Barnighausen et al. 2012
Treatment as prevention (CD4 count ≥350 cells per microlitre) 8,375 Barnighausen et al. 2012
Pre-exposure prophylaxis 12,500-20,000; 6,000-66,000 Pretorius et al. 2010; Hallett et al. 2011
Secondary school 27,753 De Neve et al. 2015*
* This study; other benefits of schooling are not captured in the cost-effectiveness ratio.
Re-analysing this data from a co-financing angle, it is clearly not realistic to assume that the HIV budget would fully fund an education reform, nor is it a fair assessment of the societal value of the reform.lxviii Clearly, the education sector would want to increase average years of schooling, which is the rationale for funding the reform in the first place. However, if the education budget had not been sufficient to cover the full costs of the policy, it would have been in the interest of the HIV response to co-invest HIV resources to generate the HIV impact.
How much the HIV budget should have contributed would have been determined by the next best intervention it could have funded to prevent new infections. Given that voluntary medical male circumcision has been estimated to cost about US$1,096 per HIV infection averted, this would have been the maximum amount the HIV budget holder would have paid into the education reform for each infection it averted (or US$493,440 in total for the study sample).
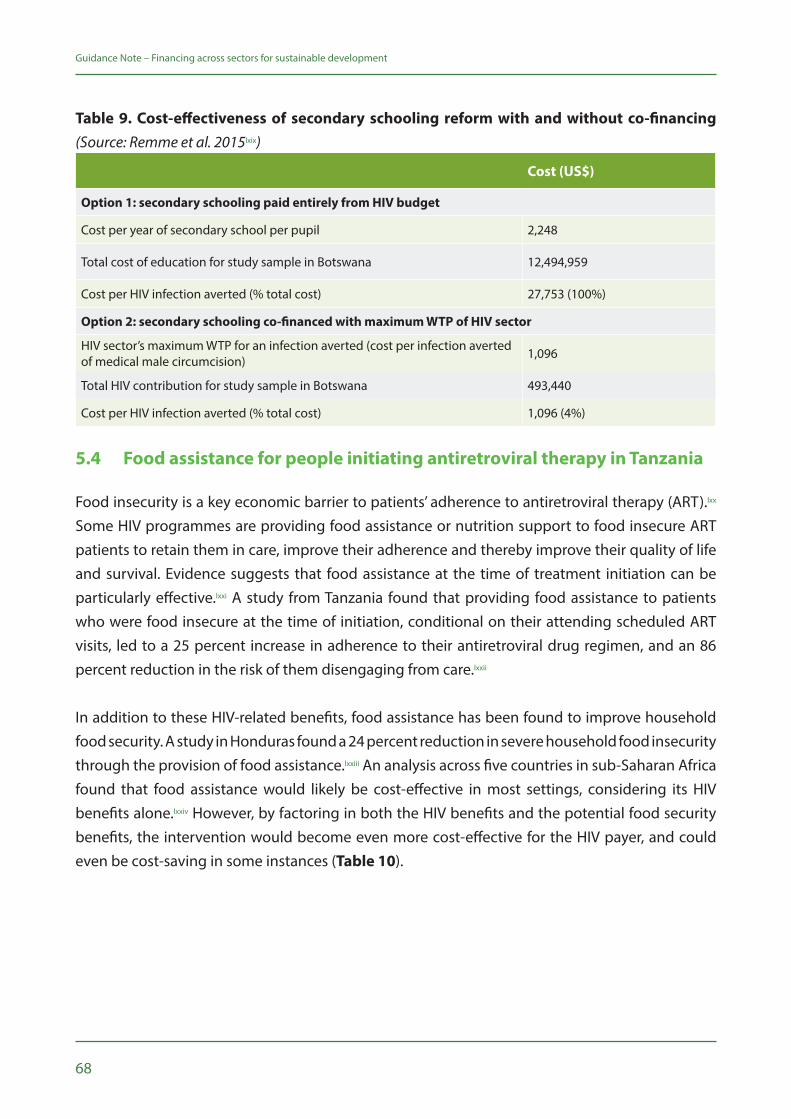
68
Guidance Note – Financing across sectors for sustainable development
Table 9. Cost-effectiveness of secondary schooling reform with and without co-financing (Source: Remme et al. 2015lxix)
Cost (US$)
Option 1: secondary schooling paid entirely from HIV budget
Cost per year of secondary school per pupil 2,248
Total cost of education for study sample in Botswana 12,494,959
Cost per HIV infection averted (% total cost) 27,753 (100%)
Option 2: secondary schooling co-financed with maximum WTP of HIV sector
HIV sector’s maximum WTP for an infection averted (cost per infection averted of medical male circumcision) 1,096
Total HIV contribution for study sample in Botswana 493,440
Cost per HIV infection averted (% total cost) 1,096 (4%)
5.4 Food assistance for people initiating antiretroviral therapy in Tanzania
Food insecurity is a key economic barrier to patients’ adherence to antiretroviral therapy (ART).lxx Some HIV programmes are providing food assistance or nutrition support to food insecure ART patients to retain them in care, improve their adherence and thereby improve their quality of life and survival. Evidence suggests that food assistance at the time of treatment initiation can be particularly effective.lxxi A study from Tanzania found that providing food assistance to patients who were food insecure at the time of initiation, conditional on their attending scheduled ART visits, led to a 25 percent increase in adherence to their antiretroviral drug regimen, and an 86 percent reduction in the risk of them disengaging from care.lxxii
In addition to these HIV-related benefits, food assistance has been found to improve household food security. A study in Honduras found a 24 percent reduction in severe household food insecurity through the provision of food assistance.lxxiii An analysis across five countries in sub-Saharan Africa found that food assistance would likely be cost-effective in most settings, considering its HIV benefits alone.lxxiv However, by factoring in both the HIV benefits and the potential food security benefits, the intervention would become even more cost-effective for the HIV payer, and could even be cost-saving in some instances (Table 10).
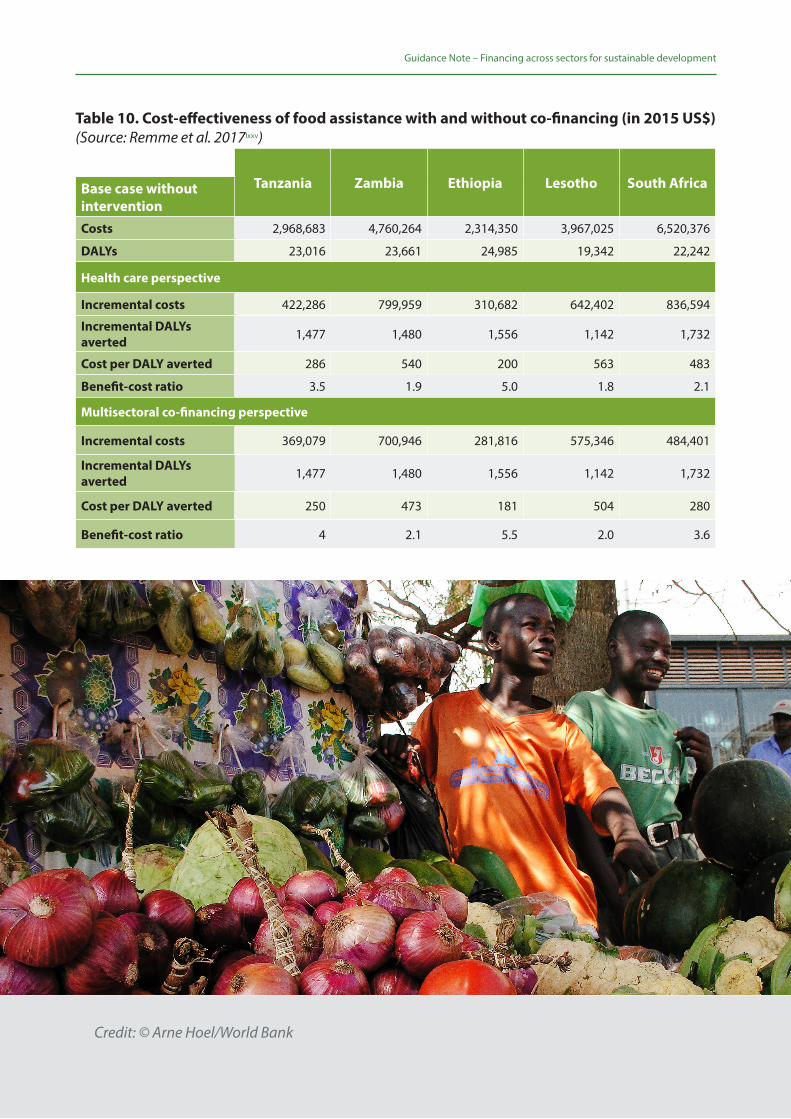
69
Guidance Note – Financing across sectors for sustainable development
Table 10. Cost-effectiveness of food assistance with and without co-financing (in 2015 US$) (Source: Remme et al. 2017lxxv)
Tanzania Zambia Ethiopia Lesotho South AfricaBase case without interventionCosts 2,968,683 4,760,264 2,314,350 3,967,025 6,520,376
DALYs 23,016 23,661 24,985 19,342 22,242
Health care perspective
Incremental costs 422,286 799,959 310,682 642,402 836,594
Incremental DALYs averted 1,477 1,480 1,556 1,142 1,732
Cost per DALY averted 286 540 200 563 483
Benefit-cost ratio 3.5 1.9 5.0 1.8 2.1
Multisectoral co-financing perspective
Incremental costs 369,079 700,946 281,816 575,346 484,401
Incremental DALYs averted 1,477 1,480 1,556 1,142 1,732
Cost per DALY averted 250 473 181 504 280
Benefit-cost ratio 4 2.1 5.5 2.0 3.6
Credit: © Arne Hoel/World Bank

70
71
ConclusionThis section recaps the paper’s high-level messages and themes and provides thoughts on co-financing moving forward.
6
72
Guidance Note – Financing across sectors for sustainable development
Recognizing the scope, ambition and integrated nature of the SDGs, together with increased expectations for more domestic funding to finance development, this note describes a SDG financing solution—financing across sectors, or co-financing, for high-value/impact, cross-cutting interventions or ‘accelerators.’
Operationalizing co-financing requires: fundamental shifts in how budget holders evaluate programme costs and benefits, and thus allocate scarce resources; fit-for-purpose institutional structures and processes that support greater collaboration, transparency and accountability; and understanding different stakeholders’ complex and context-specific incentives to engage (or not engage). Given such requirements, this Guidance Note’s co-financing approach is best applied in tandem with a range of complementary tools from UNDP and other development practitioners through the MAPS initiative, including those on SDG accelerator identification and implementation, economy-wide modelling of investments, and institutional and context analyses.
While co-financing is nascent, there have been several real-world examples in which different sectors have recognized the interconnectedness of their goals, or the multiple impacts of specific programmes, and have thus participated in a jointly funded approach. For example, UNDP, the Millennium Institute and STRIVE have supported Malawi to model SDG interactions and outcomes under the co-financing approach, comparing this against the traditional siloed approach. Compared to the siloed approach, the co-financing approach yielded greater impact, better value for money and cost savings. At the same time, none of the examples described in this note achieved the optimal model of co-financing, wherein specific sectoral investments are determined through cost-effectiveness evaluations of WTP for expected outcomes. UNDP and STRIVE, with support from the Government of Japan, are helping countries in sub-Saharan Africa to achieve optimal co-financing for UHC, health and development.
Moving forward, as more win-win interventions for SDG achievement are identified, the co-financing approach should be increasingly explored to support efficient allocation of resources. While the focus of the co-financing to date has largely been on domestic budgets, the approach is similarly relevant to other funding sources, including donors, UN agencies, non-governmental organizations, other development partners and public–private partnerships. Supporting all development practitioners to optimize their investments is crucial to achieving the ambition of the 2030 Agenda for Sustainable Development and the SDGs.

Credit: © Dominic Chavez/World Bank

74
75
AnnexDetailed Technical MethodologyI.
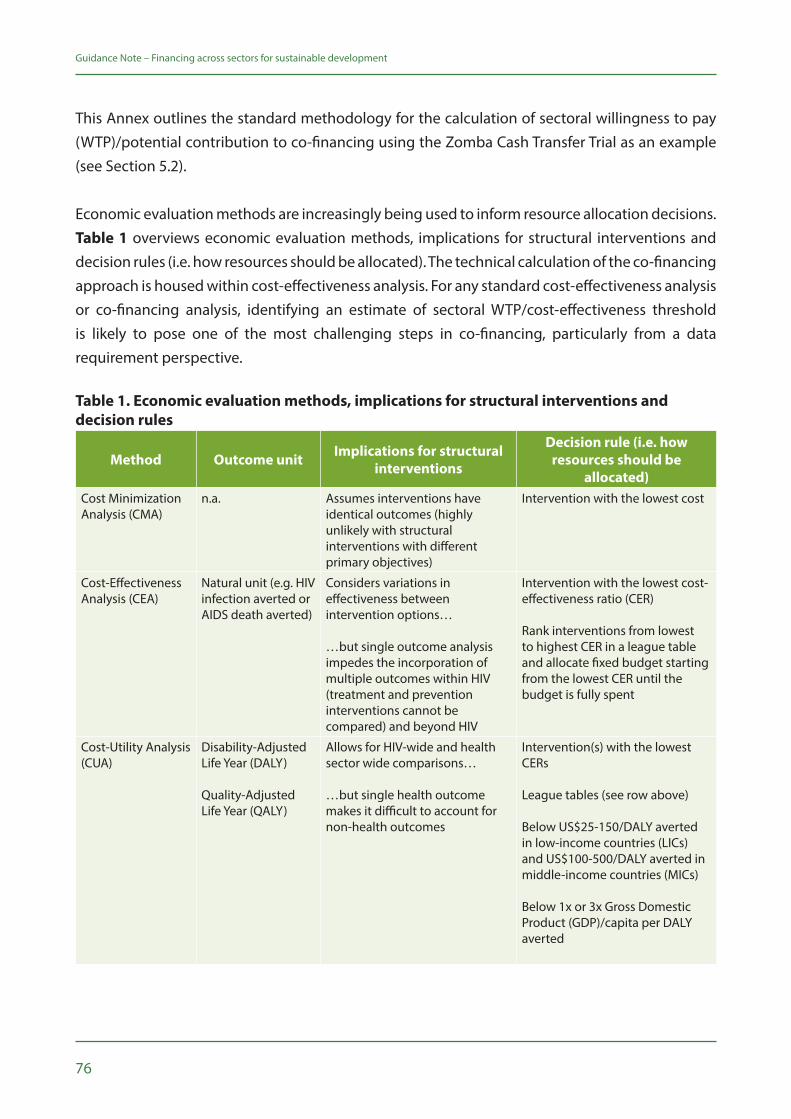
76
Guidance Note – Financing across sectors for sustainable development
This Annex outlines the standard methodology for the calculation of sectoral willingness to pay (WTP)/potential contribution to co-financing using the Zomba Cash Transfer Trial as an example (see Section 5.2).
Economic evaluation methods are increasingly being used to inform resource allocation decisions. Table 1 overviews economic evaluation methods, implications for structural interventions and decision rules (i.e. how resources should be allocated). The technical calculation of the co-financing approach is housed within cost-effectiveness analysis. For any standard cost-effectiveness analysis or co-financing analysis, identifying an estimate of sectoral WTP/cost-effectiveness threshold is likely to pose one of the most challenging steps in co-financing, particularly from a data requirement perspective.
Table 1. Economic evaluation methods, implications for structural interventions and decision rules
Method Outcome unit Implications for structural interventions
Decision rule (i.e. how resources should be
allocated)Cost Minimization Analysis (CMA)
n.a. Assumes interventions have identical outcomes (highly unlikely with structural interventions with different primary objectives)
Intervention with the lowest cost
Cost-Effectiveness Analysis (CEA)
Natural unit (e.g. HIV infection averted or AIDS death averted)
Considers variations in effectiveness between intervention options…
…but single outcome analysis impedes the incorporation of multiple outcomes within HIV (treatment and prevention interventions cannot be compared) and beyond HIV
Intervention with the lowest cost-effectiveness ratio (CER)
Rank interventions from lowest to highest CER in a league table and allocate fixed budget starting from the lowest CER until the budget is fully spent
Cost-Utility Analysis (CUA)
Disability-Adjusted Life Year (DALY)
Quality-Adjusted Life Year (QALY)
Allows for HIV-wide and health sector wide comparisons…
…but single health outcome makes it difficult to account for non-health outcomes
Intervention(s) with the lowest CERs League tables (see row above)
Below US$25-150/DALY averted in low-income countries (LICs) and US$100-500/DALY averted in middle-income countries (MICs)
Below 1x or 3x Gross Domestic Product (GDP)/capita per DALY averted
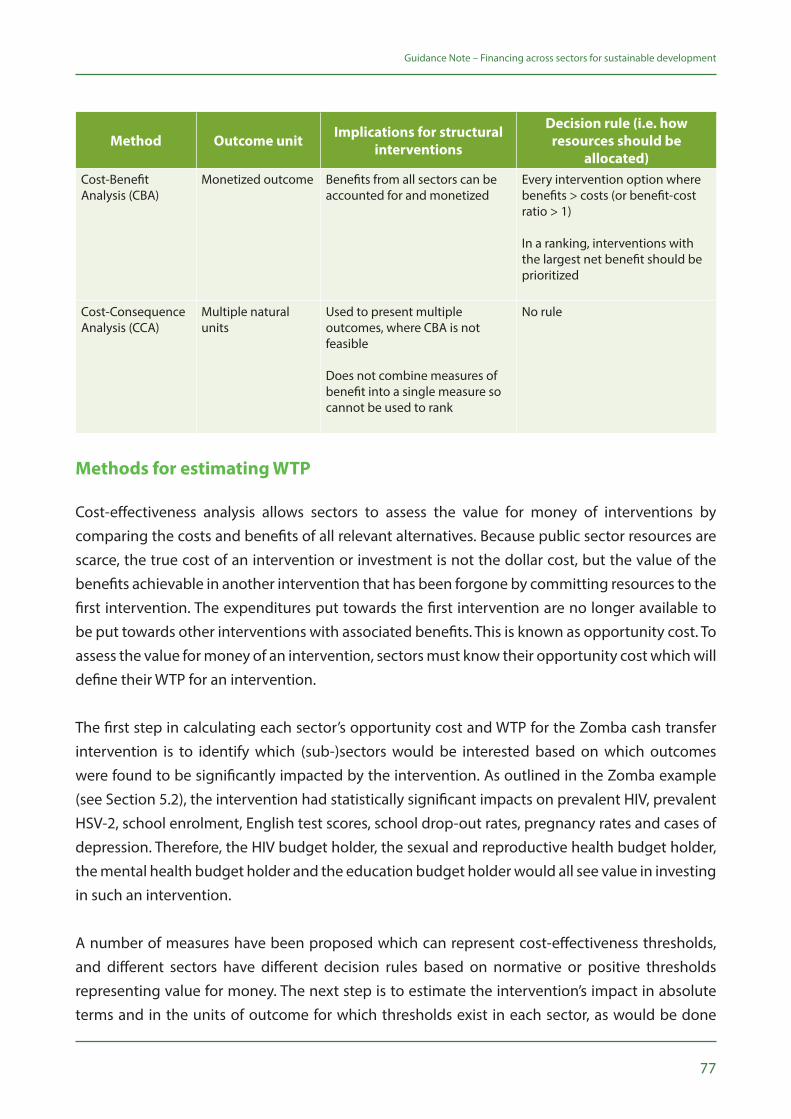
77
Guidance Note – Financing across sectors for sustainable development
Method Outcome unit Implications for structural interventions
Decision rule (i.e. how resources should be
allocated)Cost-Benefit Analysis (CBA)
Monetized outcome Benefits from all sectors can be accounted for and monetized
Every intervention option where benefits > costs (or benefit-cost ratio > 1) In a ranking, interventions with the largest net benefit should be prioritized
Cost-Consequence Analysis (CCA)
Multiple natural units
Used to present multiple outcomes, where CBA is not feasible Does not combine measures of benefit into a single measure so cannot be used to rank
No rule
Methods for estimating WTP
Cost-effectiveness analysis allows sectors to assess the value for money of interventions by comparing the costs and benefits of all relevant alternatives. Because public sector resources are scarce, the true cost of an intervention or investment is not the dollar cost, but the value of the benefits achievable in another intervention that has been forgone by committing resources to the first intervention. The expenditures put towards the first intervention are no longer available to be put towards other interventions with associated benefits. This is known as opportunity cost. To assess the value for money of an intervention, sectors must know their opportunity cost which will define their WTP for an intervention.
The first step in calculating each sector’s opportunity cost and WTP for the Zomba cash transfer intervention is to identify which (sub-)sectors would be interested based on which outcomes were found to be significantly impacted by the intervention. As outlined in the Zomba example (see Section 5.2), the intervention had statistically significant impacts on prevalent HIV, prevalent HSV-2, school enrolment, English test scores, school drop-out rates, pregnancy rates and cases of depression. Therefore, the HIV budget holder, the sexual and reproductive health budget holder, the mental health budget holder and the education budget holder would all see value in investing in such an intervention.
A number of measures have been proposed which can represent cost-effectiveness thresholds, and different sectors have different decision rules based on normative or positive thresholds representing value for money. The next step is to estimate the intervention’s impact in absolute terms and in the units of outcome for which thresholds exist in each sector, as would be done
78
Guidance Note – Financing across sectors for sustainable development
in any standard cost-effectiveness analysis. In the health sector, outcomes are often presented in DALYs, a generic unit measure of health, to allow comparison between interventions treating different conditions and capturing both morbidity and mortality effects. For education outcomes, CERs were found for enrolment in percentage, additional years of schooling, drop-outs averted and 0.1 standard deviations in test scores. The absolute impact of the indicators was calculated using the percentage-point difference between control and treatment groups and multiplying by the size of the sample in the trial. Below, the specific identification of education and health sector cost-effectiveness thresholds and the conversion of the health impact into DALYs are outlined.
Identification of WTP thresholds in the health sector
Cost-effectiveness analysis has, to date, been most frequently applied to the health sector. As previously mentioned there are a number of methodologies utilized in estimating cost-effectiveness thresholds. Historically, the World Health Organization (WHO) has recommended a normative cost-effectiveness threshold of 1–3 times GDP per capita as representing value for money. This cost-effectiveness threshold was used in the Zomba cash transfer example. Malawi’s GDP per capita in 2009 was US$339 which was used as a lower bound estimate of the health sector’s WTP. Three times this amount (US$1,017) was used as an estimated upper bound. These thresholds were used for the HIV, mental health and sexual and reproductive health budget holders.
Recently, however, the methodology of using GDP per capita as a benchmark measure for a cost-effectiveness threshold has been questioned. Movement has been towards using measures of opportunity cost that accommodate and account for the resources available to the budget holder and the marginal productivity of current sectoral expenditure. In cases where a budget constraint is fixed (as is common among sectors whose annual budgets are set by ministries of finance), considering whether an intervention is cost-effective equates to asking whether the additional health benefits offered are greater than the health expected to be lost as a consequence of the additional cost. Recent literature has provided initial empirical estimates of country-level cost-effectiveness thresholds for low- and middle-income countries.lxxvi lxxvii These estimates base thresholds on the opportunity cost of sectoral expenditures, with the thresholds therefore reflecting the marginal productivity of expenditure.
It is recommended to use a positive estimate of the opportunity cost of health care expenditure, recognizing that data limitations may sometimes impede the quality of such an estimate. Most important is transparency in the calculation of the threshold used and recognition of the possible limitations of the methodological approach adopted.
79
Guidance Note – Financing across sectors for sustainable development
Identification of lower and upper bound WTP thresholds in the education literature
While cost-effectiveness analysis is regularly used in the assessment of interventions and policies in the health sector, it is less frequently used in the education sector and other non-health sectors. A review of cost-effective education interventions in developing countries conducted by the Abdul Latif Jameel Poverty Action Lab (J-PAL) for school attendance was used to elicit a cost-effectiveness threshold for the education sector.26 Four interventions are included for Africa: information for parents on returns to education (Madagascar); deworming through primary schools (Kenya); free primary school uniforms (Kenya); and merit scholarships for girls (Kenya). Each intervention’s CER is presented as the number of additional years of school participation obtained per US$100 spent. We translated this in a cost per additional year of participation (US$100/CER). The lowest CER was used as the lowest WTP for an additional year of schooling and the highest CER as the highest WTP, i.e. providing parents with information on the returns to education and merit scholarships for girls respectively.
For school enrolment and test scores, a review by Evans and Ghosh 2008lxxviii was used as a starting point. Studies from this review evaluating interventions that were implemented in sub-Saharan African countries that had the lowest and the highest CER were retained. For test scores, CER figures reported in Evans and Ghosh 2008 for studies with randomized designs were used, since they were expressed in the same unit (0.1 standard deviation gain) as had been calculated for the Zomba trial. For school enrolment, the studies from sub-Saharan Africa with the lowest CER (Glick and Sahn 2006lxxix) and highest CER (Handa 2002lxxx) were selected and reviewed. Glick and Sahn 2006 modeled the cost-effectiveness of school consolidation with multi-grade elimination, which had the lowest CER expressed per additional student enrolled (translated from Malagasy francs to US$ based on the 1994 exchange rate reported in the study).
For Handa 2002, the highest estimated CER that the author concluded was worth considering was for another supply-side intervention consisting of the construction of additional schools to improve accessibility (70 schools per province). The total cost was estimated at US$49 million (assumed 1998 US$). The projected enrolment gain was 13 percent, but the author did not indicate how much this represented in absolute numbers of additional students enrolled. We used data from the other intervention modeled in the paper to deduce the total primary school age population under consideration. For the adult literacy intervention, the author indicated that 490,000 illiterate household heads are in the bottom quartile, which represent 59 percent of all households in this quartile. We therefore calculate that there are 490,000/0.59 x 4 = 3,322,033 households in total. In the survey sample of 8,250 households, there were 2,293 girls and 2,203 boys, or 4,496 children,
26 Findings are summarized on their website: https://www.povertyactionlab.org/policy-insights/education
80
Guidance Note – Financing across sectors for sustainable development
between 7 and 11 years old—the primary school age. The ratio of households to students was therefore used to estimate the total number of school aged children targeted with the school construction intervention, i.e. 3,322,033/1.835 = 1,810,408. The 13 percent increase in enrolment in this population therefore corresponded to an additional 235,353 children enrolled, or a CER of US$208 (1998 US$).
In terms of drop-outs averted, only one study was found with this measure and programme costs, i.e. Duflo et al. 2006,lxxxi which evaluated an intervention in Kenya to reduce the costs of primary schooling by providing free uniforms. This intervention is also considered above for additional years of schooling. The study reported a reduction in drop-out rates among girls from 12.4 percent to 9.9 percent. It benefited an average of 28 girls in 328 schools, or 9,184 girls in total. The reduction in drop-out thus corresponds to 230 female drop-outs averted. At a total cost of US$93,152 (284 per school in 328 schools), this represents a cost per drop-out averted of US$406 (2005 US$). All the CERs from these reviews were adjusted to 2009 US$ using the United States inflation rates from the World Bank (World Development Indicators). Where the year of the currency was unclear, it was assumed that it was for the year before the study was submitted for publication (Handa 2002) or published (Duflo et al. 2006).
Finally, all CERs in 2009 US$ were adjusted to Malawi using the ratio of the CER to the 2009 GDP per capita of the country in which the intervention was implemented. For example, the cost per drop-out averted of 2009 US$455 in Kenya (Duflo et al. 2006) represented 60 percent of Kenya’s 2009 GDP per capita of US$755 in 2009 US$; or US$204 in Malawi (59 percent of Malawi’s 2009 GDP per capita US$339).
Conversion of health outcomes to DALYs
The health outcomes of the Zomba trial were estimated in the following natural units: HIV infections averted, HSV-2 infections averted, teen pregnancies averted and depression cases averted. Since the WHO cost-effectiveness thresholds used are for costs per DALY averted, these had to be translated into DALY equivalents.
For HIV infections averted, the associated DALYs were estimated based on the standard DALY formulae27 and parameters relevant for the target population, with both a no ART and a full ART scenario (see table below). For the no ART scenario, 25.76 DALYs per HIV infection was estimated. For the scenario with full ART coverage, 15.66 DALYs per HIV infection was estimated. The latter estimate was used in the analysis.
27 See Murray, C.J., et al., Global Burden of Disease and Risk Factors 2006: Washington, DC: World Bank and Oxford University Press.
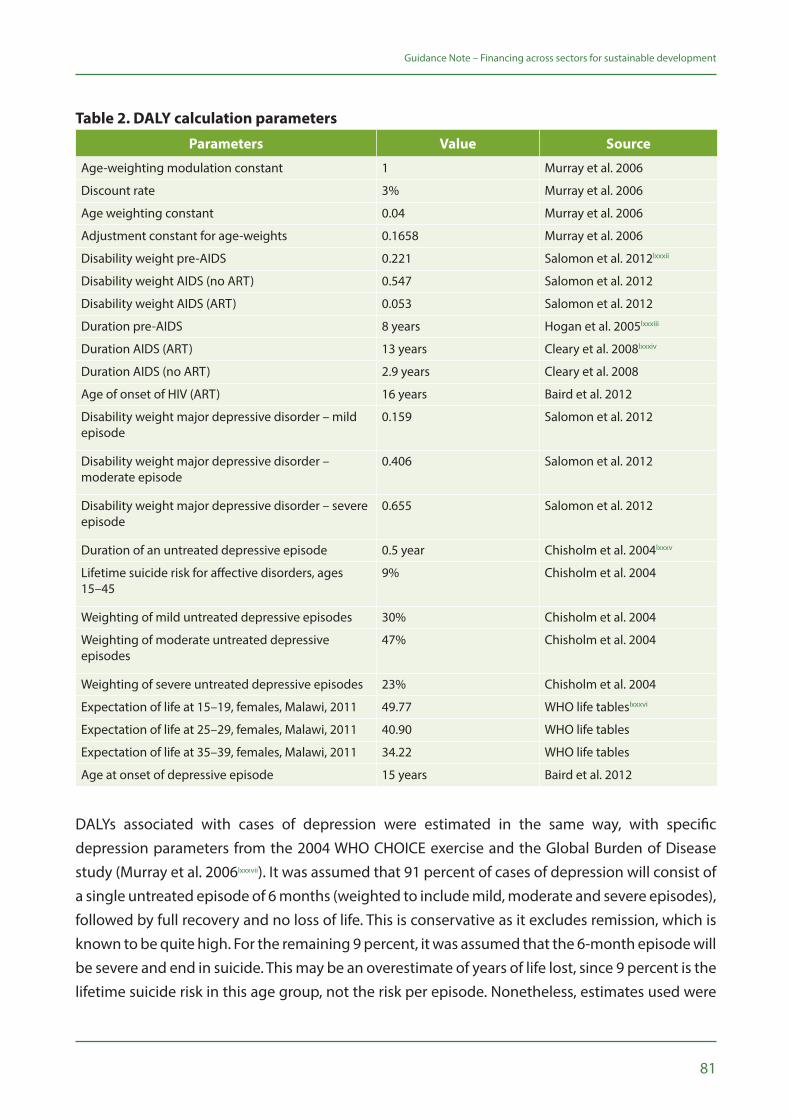
81
Guidance Note – Financing across sectors for sustainable development
Table 2. DALY calculation parameters
Parameters Value Source
Age-weighting modulation constant 1 Murray et al. 2006
Discount rate 3% Murray et al. 2006
Age weighting constant 0.04 Murray et al. 2006
Adjustment constant for age-weights 0.1658 Murray et al. 2006
Disability weight pre-AIDS 0.221 Salomon et al. 2012lxxxii
Disability weight AIDS (no ART) 0.547 Salomon et al. 2012
Disability weight AIDS (ART) 0.053 Salomon et al. 2012
Duration pre-AIDS 8 years Hogan et al. 2005lxxxiii
Duration AIDS (ART) 13 years Cleary et al. 2008lxxxiv
Duration AIDS (no ART) 2.9 years Cleary et al. 2008
Age of onset of HIV (ART) 16 years Baird et al. 2012
Disability weight major depressive disorder – mild episode
0.159 Salomon et al. 2012
Disability weight major depressive disorder –moderate episode
0.406 Salomon et al. 2012
Disability weight major depressive disorder – severe episode
0.655 Salomon et al. 2012
Duration of an untreated depressive episode 0.5 year Chisholm et al. 2004lxxxv
Lifetime suicide risk for affective disorders, ages 15–45
9% Chisholm et al. 2004
Weighting of mild untreated depressive episodes 30% Chisholm et al. 2004
Weighting of moderate untreated depressive episodes
47% Chisholm et al. 2004
Weighting of severe untreated depressive episodes 23% Chisholm et al. 2004
Expectation of life at 15–19, females, Malawi, 2011 49.77 WHO life tableslxxxvi
Expectation of life at 25–29, females, Malawi, 2011 40.90 WHO life tables
Expectation of life at 35–39, females, Malawi, 2011 34.22 WHO life tables
Age at onset of depressive episode 15 years Baird et al. 2012
DALYs associated with cases of depression were estimated in the same way, with specific depression parameters from the 2004 WHO CHOICE exercise and the Global Burden of Disease study (Murray et al. 2006lxxxvii). It was assumed that 91 percent of cases of depression will consist of a single untreated episode of 6 months (weighted to include mild, moderate and severe episodes), followed by full recovery and no loss of life. This is conservative as it excludes remission, which is known to be quite high. For the remaining 9 percent, it was assumed that the 6-month episode will be severe and end in suicide. This may be an overestimate of years of life lost, since 9 percent is the lifetime suicide risk in this age group, not the risk per episode. Nonetheless, estimates used were
82
Guidance Note – Financing across sectors for sustainable development
34.77 DALYs in 9 percent of cases and 0.31 DALYs in 91 percent of cases, or a weighted average of 3.41 DALYs per depressive episode.
For teen pregnancies, DALY equivalents were estimated based on the second edition of the Disease Control Priorities Project.lxxxviii The figures reported for family planning—a US$131 per birth averted in sub-Saharan Africa corresponding to US$34 per DALY averted, or 3.8 DALYs per birth averted— were used. This did not appear unreasonable given Malawi’s high maternal and infant mortality rates, as well as increased mortality risks among young adolescent women.
For HSV-2 infections averted, it was decided to use a conservative estimate of disability from a high-income setting, which only considers the psychosocial adult morbidity of genital herpes, leading to lower mental health scores. This excludes potential sequelae from meningitis, erythema multiforme and neonatal herpes, for lack of data parameters. Also, to avoid double counting, the co-factor effect of HSV-2 on HIV transmission is not accounted for.lxxxix In Canada, it was estimated that the cost per case of genital herpes averted through screening would be US$8,200. Based on the quality of life weights derived from this study, it is estimated that this would correspond to US$140,000 per QALY gained.xc For the analysis, it was considered that this translated to 0.06 QALYs lost per genital herpes infection, and converted directly to 0.06 DALYs per HSV-2 infection.
Conclusion
The above outlines some of the technical calculations of the Zomba cash transfer co-financing case. Each case of co-financing pursued will be unique in the sectors involved and intervention selected, as well as in data requirements and availability. However, the general methodology for the calculation of outcomes, assessment of sectoral WTP, and distribution of costs across sectors will remain based on the same principles.
Credit: © Dominic Chavez/World Bank

84
85
AnnexAction Plan for the Steering Committee (Example)
II.
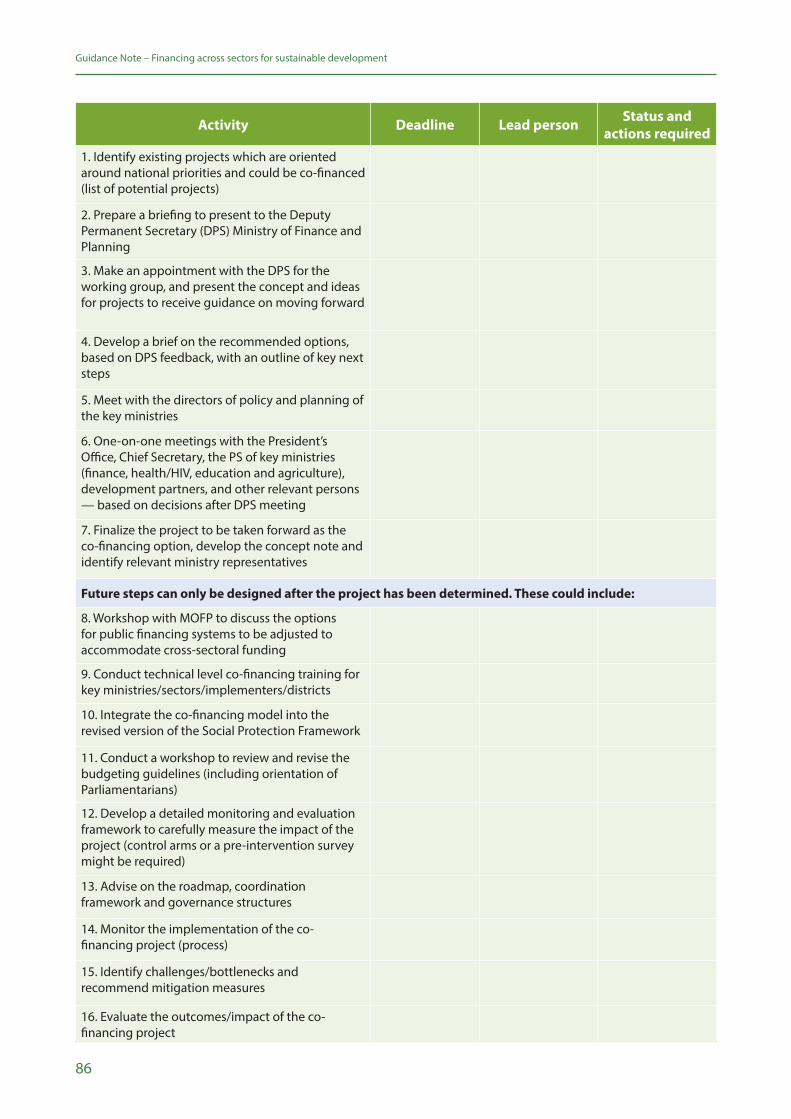
86
Guidance Note – Financing across sectors for sustainable development
Activity Deadline Lead person Status and actions required
1. Identify existing projects which are oriented around national priorities and could be co-financed (list of potential projects)
2. Prepare a briefing to present to the Deputy Permanent Secretary (DPS) Ministry of Finance and Planning
3. Make an appointment with the DPS for the working group, and present the concept and ideas for projects to receive guidance on moving forward
4. Develop a brief on the recommended options, based on DPS feedback, with an outline of key next steps
5. Meet with the directors of policy and planning of the key ministries
6. One-on-one meetings with the President’s Office, Chief Secretary, the PS of key ministries (finance, health/HIV, education and agriculture), development partners, and other relevant persons — based on decisions after DPS meeting
7. Finalize the project to be taken forward as the co-financing option, develop the concept note and identify relevant ministry representatives
Future steps can only be designed after the project has been determined. These could include:
8. Workshop with MOFP to discuss the options for public financing systems to be adjusted to accommodate cross-sectoral funding
9. Conduct technical level co-financing training for key ministries/sectors/implementers/districts
10. Integrate the co-financing model into the revised version of the Social Protection Framework
11. Conduct a workshop to review and revise the budgeting guidelines (including orientation of Parliamentarians)
12. Develop a detailed monitoring and evaluation framework to carefully measure the impact of the project (control arms or a pre-intervention survey might be required)
13. Advise on the roadmap, coordination framework and governance structures
14. Monitor the implementation of the co-financing project (process)
15. Identify challenges/bottlenecks and recommend mitigation measures
16. Evaluate the outcomes/impact of the co-financing project

87
Guidance Note – Financing across sectors for sustainable development
Credit: © Sofie Tesson/Taimani Films/World Bank

88

89
Endnotes
90
Guidance Note – Financing across sectors for sustainable development
i UNDP (2018). UNDP Strategic Plan, 2018-2021. Available at: http://strategicplan.undp.org/ii UNDP (2016). HIV, Health and Development Strategy 2016-2021. Available at: http://www.undp.org/content/undp/en/home/librarypage/hiv-aids/hiv--health-and-development-strategy-2016-2021.htmliii UNDP. Financing Solutions for Sustainable Development. Available at: http://www.sdfinance.undp.org/content/sdfinance/en/home/iv A/RES/70/1. Transforming our world: the 2030 Agenda for Sustainable Development. Resolutionadopted by the General Assembly on 25 September 2015. Available at: http://www.un.org/ga/search/view_doc.asp?symbol=A/RES/70/1&Lang=Ev Deen, T. 2015. U.N. Targets Trillions of Dollars to Implement Sustainable Development Agenda. Inter Press Service News Agency. Available at: http://www.ipsnews.net/2015/08/u-n-targets-trillions-of-dollars-to-implement-sustainable-development-agenda/vi Schmidt-Traub, G. 2015. Investment Needs to Achieve the Sustainable Development Goals: Understanding the Billions and Trillions. SDSN Working Paper Version 2. Available at: http://unsdsn.org/wp-content/uploads/2015/09/151112-SDG-Financing-Needs.pdfvii A/RES/69/313. Addis Ababa Action Agenda of the Third International Conference on Financing for Development (Addis Ababa Action Agenda). Resolution Adopted by the General Assembly on 27 July 2015. Available at: https://www.un.org/en/development/desa/population/migration/generalassembly/docs/globalcompact/A_RES_69_313.pdf
viii WHO (2018). Public Spending on Health: A Closer Look at Global Trends. Available at: https://www.who.int/health_financing/documents/health-expenditure-report-2018/en/ix UNDP. Solar for Health. Available at: http://www.undp-globalfund-capacitydevelopment.org/en/about-us/solar-for-health/x SDSN (2013). Solutions for Sustainable Agriculture and Food Systems. Technical report for the Post-2015 Development Agenda. Available at: http://unsdsn.org/wp-content/uploads/2014/02/130919-TG07-Agriculture-Report-WEB.pdfxi Foley, JA, et al. Solutions for a cultivated planet. Nature 2011; 478: 337-342.xii A/RES/70/1. Transforming our world: the 2030 Agenda for Sustainable Development. Resolution adopted by the General Assembly on 25 September 2015. Available at: http://www.un.org/ga/search/view_doc.asp?symbol=A/RES/70/1&Lang=Exiii A/RES/69/313. Addis Ababa Action Agenda of the Third International Conference on Financing for Development (Addis Ababa Action Agenda). Resolution Adopted by the General Assembly on 27 July 2015. Available at: http://www.un.org/en/ga/search/view_doc.asp?symbol=A/RES/69/313
xiv Nilsson, M, Griggs, D and Visbeck, M. Policy: Map the interactions between Sustainable Development Goals. Nature 2016; 534: 320-322.xv A/RES/69/313. Addis Ababa Action Agenda of the Third International Conference on Financing for Development (Addis Ababa Action Agenda). Resolution Adopted by the General Assembly on 27 July 2015. Available at: http://www.un.org/en/ga/search/view_doc.asp?symbol=A/RES/69/313
91
Guidance Note – Financing across sectors for sustainable development
xvi A/RES/69/313. Addis Ababa Action Agenda of the Third International Conference on Financing for Development (Addis Ababa Action Agenda). Resolution Adopted by the General Assembly on 27 July 2015. Available at: http://www.un.org/en/ga/search/view_doc.asp?symbol=A/RES/69/313
xvii Hagen-Zanker, J, and McCord, A. 2011. The feasibility of financing sectoral development targets. ODI Project Briefing No 55. Available at: https://www.odi.org/sites/odi.org.uk/files/odi-assets/publications-opinion-files/6325.pdf
xviii Schmidt-Traub, G, and Sachs, JD. 2015. Financing Sustainable Development: Implementing the SDGs through Effective Investment Strategies and Partnerships. SDSN Working Paper. Available at:http://unsdsn.org/wp-content/uploads/2015/04/150408-SDSN-Financing-Sustainable-Development-Paper.pdfxix Schmidt-Traub, G. 2015. Investment Needs to Achieve the Sustainable Development Goals: Understanding the Billions and Trillions. SDSN Working Paper Version 2. Available at: http://unsdsn.org/wp-content/uploads/2015/09/151112-SDG-Financing-Needs.pdfxx Remme, M, et al. Financing structural interventions: going beyond HIV-only value for money assessments. AIDS 2014; 28: 425-434.xxi Stillwaggon, Eileen. Better economic tools for evaluating health and development investments. AIDS 2014; 28(3): 435-437.xxii Waage, J, et al. Governing the UN Sustainable Development Goals: interactions, infrastructures, and institutions. Lancet Global Health 2015; 3(5): E251-252.xxiii UNDP. 2015. Co-financing for health and development – an affordable innovation. Available at: http://www.undp.org/content/undp/en/home/blog/2015/7/13/Co-financing-for-health-and-development-an-affordable-innovation.htmlxxiv Remme, M, et al. Financing structural interventions: going beyond HIV-only value for money assessments. AIDS 2014; 28: 425-434.xxv Hauck K, and Smith, PC. 2015. The Politics of Priority Setting in Health: a Political Economy Perspective – Working Paper 414. Center for Global Development. Available at: https://www.cgdev.org/publication/politics-priority-setting-health-political-economy-perspective-working-paper-414xxvi Remme M, Harman S, Vassall A. Understanding the barriers and enablers to pooling health and non-health budgets to co-finance interventions with multi-sectoral benefits: the case of Tanzania. 2017 iHEA World Congress. Boston; 2017.xxvii There is a wide literature on cross-sector working towards the achievement of the SDGs. See e.g. United Nations Department of Economic and Social Affairs (2018). Working Together: Integration, Institutions and the Sustainable Development Goals. World Public Sector Report 2018. Available at: http://workspace.unpan.org/sites/Internet/Documents/UNPAN98152.pdfxxviii Sugar, Tobacco and Alcohol Taxes (STAX) Group. Sugar, tobacco, and alcohol taxes to achieve the SDGs. Lancet 2018; 391(10138): 2400-2401. See also UNDP. Financing Solutions for Sustainable Development: Taxes on Tobacco. Available at: http://www.undp.org/content/sdfinance/en/home/solutions/taxes-on-tobacco/
92
Guidance Note – Financing across sectors for sustainable development
xxix World Bank (2013). Africa Health Forum: Results-Based Financing for Health. Available at: http://siteresources.worldbank.org/INTAFRICA/Resources/AHF-results-based-financing.pdfxxx UNDP (2017). Institutional and Coordination Mechanisms: Guidance Note on Facilitating Integration and Coherence for SDG Implementation. Available at: http://www.undp.org/content/undp/en/home/librarypage/sustainable-development-goals/institutional-and-coordination-mechanisms---guidance-note.html
xxxi UNDP and UN DESA. Modelling Tools for Sustainable Development. Available at: https://un-modelling.github.io/xxxii UNDP (2017). SDG Accelerator and Bottleneck Assessment. Available at: http://www.undp.org/content/undp/en/home/librarypage/sustainable-development-goals/sdg-accelerator-and-bottleneck-assessment.html
xxxiii UNDP (2017). Institutional and Context Analysis for the Sustainable Development Goals. Available at: https://www.undp.org/content/dam/2030agenda/Publications/INSTITUTIONAL%20AND%20CONTEXT%20ANALYSIS%2021%20March%202017%20CLEAN.pdfxxxiv UNDP (2018). Financing the 2030 Agenda – An Introductory Guidebook for UNDP Country Offices. Available at: http://www.undp.org/content/undp/en/home/librarypage/poverty-reduction/2030-agenda/financing-the-2030-agenda.html
xxxv UNDP (2018). MAPS Mission Engagement and SDG Implementation Support. UNDP review of 2016-2017 Mainstreaming, Acceleration and Policy Support country missions. Available at: https://unstats.un.org/unsd/unsystem/Documents-Sept2018/BG-Item6-MAPS.pdfxxxvi Knapp, M, et al. Supported employment: cost-effectiveness across six European sites. World Psychiatry 2013; 12(1): 60-68.xxxvii Radford, K, et al. Return to work after traumatic brain injury: cohort comparison and economic evaluation. Brain Inj 2013; 27(5): 507-520xxxviii Burns, T, et al. A randomised controlled trial of time-limited individual placement and support: IPS-LITE trial. Br J Psychiatry 2015; 207(4): 351-356. xxxix Pike, B, and Mongan, D. 2014. The integration of health and social care services. Health Research Board. Available at: http://www.hrb.ie/fileadmin/publications_files/The_integration_of_health_and_social_care_services_2014.pdf
xl Wilson, SH and Walker, GM. Unemployment and health: a review. Public Health 1993; 107(3): 153-162.xli Hultberg, EL, Lönnroth K, and Allebeck, P. Co-financing as a means to improve collaboration between primary health care, social insurance and social service in Sweden. A qualitative study of collaboration experiences among rehabilitation partners. Health Policy 2003; 64(2):143-52.xlii Suhrcke, M, and Nieves, C. 2011. The impact of health and health behaviours on education outcomes in high-income countries: a review of the evidence. World Health Organization Regional Office for Europe. Available at: http://www.euro.who.int/en/publications/abstracts/impact-of-health-and-health-behaviours-on-educational-outcomes-in-high-income-countries-the-a-review-of-the-evidence
93
Guidance Note – Financing across sectors for sustainable development
xliii Robison, W, et al. 2004. A Healthy Child in a Healthy School Environment: A look at the CHANGES Program in Zambia. Creative Associates International, for USAID. Available at: http://www.beps.net/publications/ZambiaCHANGES.pdfxliv Freund, P, Graybill, E, and Keith, N. 2005. Health and Education Working Together: A Case Study of a Successful School Health and Nutrition Model. Creative Associates International. Available at: https://www.creativeassociatesinternational.com/wp-content/uploads/2014/05/ZambiaHealth_EdFINAL.pdfxlv McDaid, D, Sassi, F, and Merkur, S. Eds. 2015. Promoting Health, Preventing Disease: The economic case. European Observatory on Health Systems and Policies Series. Available at: http://www.euro.who.int/__data/assets/pdf_file/0006/283695/Promoting-Health-Preventing-Disease-Economic-Case.pdf?ua=1xlvi Department for Transport (DfT). 2009. Review of the Road Safety Partnership Grant Scheme. Available at: https://webarchive.nationalarchives.gov.uk/+/http:/www.dft.gov.uk/pgr/roadsafety/rspg/rspg.pdfxlvii Nilsson, M, Griggs, D and Visbeck, M. Policy: Map the interactions between Sustainable Development Goals. Nature 2016; 534: 320-322.xlviii FHI 360 (2014). Integration of global health and other development actors –a review of the evidence. Available at: https://www.fhi360.org/sites/default/files/media/documents/sap-integration-ofglobal-health-full.pdf
xlix Stenberg, K, et al. Financing transformative health systems towards achievement of the health sustainable development goals: a model for projected resource needs in 67 low-income and middle-income countries. Lancet Global Health 2017; 5(9): 875-887. Available at: http://www.thelancet.com/journals/langlo/article/PIIS2214-109X(17)30263-2/fulltextl Gustafsson-Wright, E, and Boggid-Jones, I (2017). Rallying behind maternal and newborn health: A new impact bond launches in India. Brookings. Available at: https://www.brookings.edu/blog/education-plus-development/2017/11/29/rallying-behind-maternal-and-newborn-health-a-new-impact-bond-launches-in-india/li UNDP. Financing Solutions for Sustainable Development – Goal 3: Good Health and well-being. Available at: http://www.undp.org/content/sdfinance/en/home/sdg/goal-3--good-health-and-well-being.htmllii UNDP (2018). HIV, Health and Development Annual Report 2017-2018. Available at: http://www.undp.org/content/undp/en/home/librarypage/hiv-aids/hiv--health-and-development-annual-report-2017-2018.htmlliii World Bank (2014). Community-based Conditional Cash Transfers in Tanzania – results from a randomized trial. Available at: https://issuu.com/world.bank.publications/docs/9781464801419
liv Tanzania Social Action Fund. Available at: http://www.tasaf.go.tz/lv FAO (2015). Nutrition and social protection. Available at: http://www.fao.org/3/a-i4819e.pdf
94
Guidance Note – Financing across sectors for sustainable development
lvi For example, a 2013 systematic review of studies from 8 countries on CCT programmes found that the programmes increased antenatal visits, skilled attendance at birth, delivery at a health facility, and tetanus toxoid vaccination for mothers. The programmes also reduced the incidence of low birthweight. See Glassman, A, et al. Impact of Conditional Cash Transfers on Maternal and Newborn Health. J Health Popul Nutr 2013; 31(4 Suppl 2); S48-S66.lvii UNDP (2014). Discussion Paper: Cash Transfers and HIV Prevention. Available at: http://www.undp.org/content/undp/en/home/librarypage/hiv-aids/discussion-paper--cash-transfers-and-hiv-prevention.htmllviii South Africa’s National Strategic Plan for HIV, TB and STIs 2017 – 2022. Available at: https://sanac.org.za/download-the-full-version-of-the-national-strategic-plan-for-hiv-tb-and-stis-2017-2022-2/lix Baird, SJ, et al. Effect of a cash transfer programme for schooling on prevalence of HIV and herpes simplex type 2 in Malawi: a cluster randomised trial. Lancet 2012; 379(9823): 1320-1329.lx Baird, SJ, et al. Effect of a cash transfer programme for schooling on prevalence of HIV and herpes simplex type 2 in Malawi: a cluster randomised trial. Lancet 2012; 379(9823): 1320-1329.lxi Baird, SJ, et al. Effect of a cash transfer programme for schooling on prevalence of HIV and herpes simplex type 2 in Malawi: a cluster randomised trial. Lancet 2012; 379(9823): 1320-1329.lxii Vassall, A, Remme, M, and Watts, C. 2011. Social Policy: Going upstream. Copenhagen Consensus Center and Rush Foundation. Available at: https://www.copenhagenconsensus.com/sites/default/files/vassall_et_all.pdflxiii Remme, M, et al. Financing structural interventions: going beyond HIV-only value for money assessments. AIDS 2014; 28: 425-434.lxiv Remme, M, et al. Paying girls to stay in school: a good return on HIV investment? Lancet 2012; 379(9832): P2150.lxv Remme, M, et al. Financing structural interventions: going beyond HIV-only value for money assessments. AIDS 2014; 28: 425-434.lxvi De Neve, JW, et al. Length of secondary schooling and risk of HIV infection in Botswana: evidence from a natural experiment. Lancet Glob Health 2015; 3(8): E470-477.lxvii De Neve, JW, et al. Length of secondary schooling and risk of HIV infection in Botswana: evidence from a natural experiment. Lancet Glob Health 2015; 3(8): E470-477. lxviii Remme, M, et al. Secondary schooling might be as good an HIV investment as male circumcision. Lancet Glob Health 2015; 3(10): PE591.lxix Remme, M, et al. Secondary schooling might be as good an HIV investment as male circumcision. Lancet Glob Health 2015; 3(10): PE591. lxx Singer, AW, Weiser, SD, and McCoy, SI. Does Food Insecurity Undermine Adherence to Antiretroviral Therapy? A Systematic Review. AIDS Behav 2015; 19(8): 1510-26.lxxi de Pee, S, et al. The enabling effect of food assistance in improving adherence and/or treatment completion for antiretroviral therapy and tuberculosis treatment: a literature review. AIDS Behav 2014; 18(Suppl 5): S531-41.
95
Guidance Note – Financing across sectors for sustainable development
lxxii McCoy, SI, et al. Cash vs. food assistance to improve adherence to antiretroviral therapy among HIV-infected adults in Tanzania. AIDS 2017; 31(6): 815-25.lxxiii Palar, K, et al. Impact of food support on food security and body weight among HIV antiretroviral therapy recipients in Honduras: a pilot intervention trial. AIDS Care 2015; 27(4): 409-415.lxxiv Remme, M, et al. Economic returns to investing in a food-based intervention for people living with HIV initiating antiretroviral therapy in East and Southern Africa. In submission.lxxv Remme, M, et al. Economic returns to investing in a food-based intervention for people living with HIV initiating antiretroviral therapy in East and Southern Africa. In submission.lxxvi Ochalek, JM, Lomas, J, and Claxton, KP. Cost per DALY averted thresholds for low- and middle-income countries: evidence from cross country data. Discussion Paper. CHE Research Paper. Centre for Health Economics. University of York, York, UK. Available at: http://eprints.whiterose.ac.uk/135883/
lxxvii Woods, B, et al. Country-Level Cost-Effectiveness Thresholds: Initial Estimates and the Need for Further Research. Value in Health 2016; 19(8): 929-935.lxxviii Evans, DK, and Ghosh, A. 2008. Prioritizing Educational Investments in Children in the Developing World. WR-587. Labor and Population working paper series. RAND.lxxix Glick, P, and Sahn, DE. The demand for primary schooling in Madagascar: Price, quality, and the choice between public and private providers. Journal of Development Economics, 2006; 79(1): 118-145.lxxx Handa, S. Raising primary school enrolment in developing countries: The relative importance of supply and demand. Journal of Development Economics 2002; 69(1): 103-128lxxxi Duflo, E, et al. 2006. Education and HIV/AIDS Prevention: Evidence from a Randomized Evaluation in Western Kenya. Policy Research Working Paper 4024. World Bank: Washington, DC.lxxxii Salomon, JA, et al. Common values in assessing health outcomes from disease and injury: disability weights measurement study for the Global Burden of Disease Study 2010. Lancet, 2012; 380(9859): 2129-43.lxxxiii Hogan, DR, et al. Cost effectiveness analysis of strategies to combat HIV/AIDS in developing countries. BMJ 2005; 331(7530): 1431-7.lxxxiv Cleary, SM, McIntyre, D, and Boulle, AM. Assessing efficiency and costs of scaling up HIV treatment. AIDS 2008; 22 Suppl 1: S35-42.lxxxv Chisholm, D, et al. Reducing the global burden of depression: population-level analysis of intervention cost-effectiveness in 14 world regions. Br J Psychiatry, 2004; 184: 393-403. lxxxvi WHO. Global Health Observatory Data Repository 2013.lxxxvii Murray, CJ, et al. Global Burden of Disease and Risk Factors 2006: Washington, DC: World Bank and Oxford University Press.lxxxviii Levine, R, et al. Chapter 57: Contraception. In Jamison, DT, et al. Disease Control Priorities in Developing Countries. 2nd edition. Washington DC. The International Bank for Reconstruction and Development/the World Bank. New York. Oxford University Press, 2006. Available at: https://www.ncbi.nlm.nih.gov/books/NBK11771/
96
Guidance Note – Financing across sectors for sustainable development
lxxxix Freeman, EE, et al. Proportion of new HIV infections attributable to herpes simplex 2 increases over time: simulations of the changing role of sexually transmitted infections in sub-Saharan African HIV epidemics. Sex Transm Infect 2007; 83(Suppl 1): i17-24.xcFisman, DN. Health related quality of life in genital herpes: a pilot comparison of measures. Sex Transm Infect 2005; 81(3): 267-70.
97
Guidance Note – Financing across sectors for sustainable development
Empowered lives. Resilient nations.
Financing across sectors
for sustainable development
Guidance Note
April 2019