Embed Size (px)
Citation preview
Financing for Development and the SDGsAn analysis of financial flows, systemic issues and interlinkages
By Jesse Griffiths • April 2018

Contents
A: Executive summary 3
B: An overview of the state of developmentfinance resources 6
B1: Private finance 6
B2: Public finance 11
C: An analysis of key systemic issues 16
International monetary system 16
Global financial system 17
Sovereign debt crises 19
Trade and investment rules 19
International tax cooperation 20
D: Can the global economic governance system deliver? 21
E: Conclusions and recommendations 23
References 26
Funding for this paper has been supported by the Deutsche Gesellschaft für Internationale Zusammenarbeit (GIZ) GmbH to provide a contribution to the AAAA follow-up process and to current discussions on integrated financing concepts. The authors are entirely responsible for the contents of this paper, which do not necessarily reflect the positions of GIZ.

Financing for development and the SDGs 3
A: Executive summary
The Sustainable Development Goals (SDGs)1 are ambitious objectives: not only do they call for an end to poverty and hunger, they also recognise the need to fight inequality, including gender inequality, protect the environment, provide decent work, ensure sustainable consumption and production and achieve global peace. Unlike the Millennium Development Goals that preceded them, they apply equally to all nations.
It is already clear that we are not on track to meet the SDGs. For example, though there has been significant progress in the fight against poverty, this has been slow – very large numbers of people remain in abject poverty, women and girls particularly, and many countries and groups are being left behind.2 Over 200 million people are unemployed worldwide, and 42 per cent of those that do have jobs work in ‘vulnerable occupations’.3 Inequality is a defining feature of the global and many national economies: much growth in recent years has directed resources towards the wealthy, and according to International Monetary Fund (IMF) researchers: “the share held by the one per cent wealthiest population is rising at the expense of the bottom 90 per cent population.”4
It is clear that significant reforms of the global financial and economic system are needed if the promise of the SDGs is to be met. This paper examines the features of different development financing sources, systemic issues in the global economy and the way it is governed, and sets out a programme of reform for developed country policymakers.
Private finance
Domestic private investment is large, stable and rising, accounting for over 25 per cent of GDP in developing countries, which is why mobilising such investment has been a crucial development financing strategy.
Financing for domestic private investment comes from a number of sources, but a strong banking sector is normally the bedrock. This often means significant state involvement, with public development banks accounting for around a quarter of all assets in banking systems globally. One critical reason that banks, including public development banks, have been so important is their ability to mobilise longer-term investment. Given that domestic banking systems, including publicly oriented actors, are so important, it is unfortunate that so little research is focused on this critical subject.
The second major source of financing for domestic private investment is the reinvestment of earnings by companies themselves. Again an important role is played by state-owned enterprises, which make up more than 40 of the top 100 multinational corporations in developing countries.
Despite the prominence given to capital markets and capital market-related actors in much current discourse, they have tended to play a smaller role than banks, and become important only in later stages of development.
International private capital flows are far smaller in scale than domestic private investment, with foreign direct investment (FDI) typically accounting for less than three per cent of GDP in developing countries. There are costs and benefits to FDI, and development impacts can vary significantly depending on: the extent to which FDI represents new finance for productive capacity; whether it ‘crowds in’ or ‘crowds out’ additional domestic investment; and the extent to which FDI results in technology transfer or other beneficial effects for the local economy. This means that attracting FDI should never be the sole goal: the issue is how to attract the right kind of investment, and manage it to gain development benefits.
Other international private capital flows – portfolio investment and bank lending – have proven short term, extremely volatile and a drain of finance out of developing countries in recent years. The UN estimates that portfolio investment (buying stocks and shares) has been a negative net flow for five of the past ten years. Other private investment, mainly through the international banking system, has been a negative flow for the last six years.
The volatility of this short-term international private investment is often driven by external factors, making it even more difficult for developing countries to manage. For example, the recent drain of short-term private capital out of developing countries has been driven by the collapse in commodity prices in 2015, the monetary policies of developed countries, and the recent strength of the dollar. In addition, external private borrowing, and hence debt, has increased in recent years, which increases macroeconomic risks for developing countries even further.
The volatile nature of much international private capital, and the fact that it is often driven by external factors, means that it is centrally important for developing countries to protect themselves from external shocks transmitted through the international financial system. However, this has had very high costs for developing country governments, who have been transferring large sums to developed countries in order to build reserves.
All these points underscore why domestic strategies for managing private investment are critical for ensuring high quality investment and protecting against risks, yet such strategies have not been the focus of discussion around private investment at the international level.

4 Financing for development and the SDGs
Public finance
Domestic public finance is a major development resource, but the revenue bases and tax collecting capacity of developing countries are more limited than developed countries. Low-income countries and lower-middle income countries have particular problems, raising less than 15 per cent of GDP in revenue on average, compared to around 20 per cent for upper-middle income countries.
Due to difficulties in collecting other sources of revenue, trade taxes are particularly important in low-income countries since they are relatively easy to collect. Other revenue sources tend to be small owing to the large informal sector, and because of the difficulties of levying income tax on populations with very low levels of income. The influence of international financial institutions and the impact of trade negotiations have, however, reduced the scope for using trade taxes to fill the public financing gap.
Corporate taxation plays a key role in developing countries’ revenue bases, accounting for over 20 per cent of developing countries’ tax take. This is why tackling the significant tax losses to multinational tax avoidance and evasion – which estimates put in the hundreds of billions of dollars – is a particularly important agenda. In addition, the ‘race to the bottom’ on tax incentives, driven by international tax competition, is eroding the corporate income tax base in many developing countries and needs to be reversed. This is important because the evidence shows that such tax incentives have relatively little impact on investment, but they do reduce revenue for public investment, which is important for private sector growth.
Low tax bases and tax losses due to tax competition, tax avoidance and tax evasion contribute to significant public resource shortfalls for basic services and social protection, particularly in low-income countries. In addition, the infrastructure ‘investment gap’ is primarily due to these shortfalls in public finance, as around three quarters of infrastructure investment is financed by the public sector in developing countries. Often infrastructure investments, particularly in low-income countries, are not profit-making propositions, or are too high risk for private investors. Therefore, while private finance is vitally important for development, as we have seen, it is a mistake to suggest that it can be a substitute for these shortfalls in public expenditure, including in infrastructure.
Borrowing is one strategy to increase public resource mobilisation, but increases debt risks, which have been rising over the past few years.
International transfers of resources to developing countries in the form of Official Development Assistance (ODA) and climate finance, designed to help fill these gaps, have proved far smaller than promised. Despite increases, ODAODA has only reached around halfway to the UN target of 0.7 per cent of GDP. Too much ‘upward accountability’ to donors often undermines the effectiveness of ODA. For example, the ‘tying’ of aid to the use of donor firms continues to be a major problem, reducing the effectiveness of aid and increasing costs.
Systemic issues
Since the collapse of the Bretton Woods system in the 1970s, the international monetary system has allowed exchange rates to be volatile. This can be very damaging for developing countries, as it makes macroeconomic planning difficult and adversely affects investment. Persistent trade imbalances make the system even more unstable. The fact that the dollar is the global reserve currency exacerbates these problems by magnifying the impact of American monetary and fiscal policy decisions on the rest of the world. The global monetary system therefore has significant impacts on macroeconomic stability in developing countries, as well as determining underlying incentives for international private capital flows.
Further risks to macroeconomic stability and impacts on capital allocation arise from the global financial system. Since the global financial crisis, a wide-ranging package of financial sector reforms has been introduced. However it is not clear that the reforms have fixed underlying problems, and the risk of further financial and economic crises remains high. The non-bank financial sector – which is very lightly regulated – continues to grow, and now represents more than 40 per cent of total financial system assets. Efforts to deal with ‘too big to fail’ institutions have been undercut by the continued growth of the biggest banks.
Developing countries have become increasingly vulnerable to external financial markets and actors. Private capital flows to developing countries have been driven by the external economic situation, in particular the monetary policies of developed countries. As a result, developing country governments have been forced to transfer significant funds to developed countries, to build reserves to protect themselves against future crises.
A: Executive summary
Financing for development and the SDGs 5
Sovereign debt crises continue to be a major feature of the international system, with debilitating effects on the countries that experience them. Since the 1950s, there have been more than 600 cases where unsustainable sovereign debt has had to be restructured. Debt risks have been rising in developing countries, and the possibility of a wave of sovereign debt defaults has increased significantly. A recent study found that 116 developing countries breach one, several or all major debt sustainability indicator thresholds. The nature of developing country debt has also changed significantly, with an increasingly high percentage borrowed from private sources: the global debt of the non-financial sector stood at 225 per cent of global GDP in 2015, two thirds of which were private sector liabilities.
Trade growth has slowed markedly since the global financial crisis, and is now in a period of decline. The global production and trading system has major impacts on developing countries’ economies, in particular by making many low-income countries highly dependent on the volatile price of commodities. Improving developing countries’ market access to developed countries is important, but is a limited financing strategy for countries trying to break out of commodity dependence. Least developed countries (LDCs) already had tariff-free access for 90 per cent of their exports by value in 2014. Economies that have developed rapidly have historically made use of strategic ‘protectionist’ trade policies to support the growth of their industrial sector – which has been a key motor for rapid development in almost every country in the world – with liberalisation being undertaken when strategically sensible. Unfortunately, existing trade rules often place significant limits on policy space, denying developing countries the policies that have proved successful in the past.
Finally, the ineffectiveness of international tax cooperation efforts means that, globally, countries are encouraged to compete with each other – including in ways that erode the tax revenue of other countries. For example, many countries are using harmful tax practices, and tax treaties may also reduce tax rates in developing countries without necessarily leading to increased investment.
Global economic governance
There are an enormous variety of international institutions that create rules or set standards in the financial and economic sector, but coordination between them remains ad hoc. The G20 was upgraded to a heads of state meeting in 2009 to bring greater coordination to the global response to the crisis. However, despite an expanding work programme it suffers from having no standing secretariat, meaning that each year its agenda is determined by the host country, and implementation falls to other existing agencies.
The number of important economic governance institutions where all developing countries can participate on an equal footing is very limited. Developing country governments are excluded almost entirely from a number of important institutions. For example, the OECD has taken on a major role in standard setting on international tax issues, but out of 35 member countries only two are developing countries.
It is neither possible nor desirable for all issues to be decided at a global level, but there are many areas where the weakness of global governance systems has major negative consequences for developing countries. Two issues stand out, both for their importance and because they have been integral to United Nations Financing for Development discussions: the need for an intergovernmental body on tax, and a sovereign debt workout mechanism.
Conclusions
It is clear that, from the perspective of national level policymakers in developing countries, different sources of financing are interlinked, and the use of each source is constrained by global economic issues and rules. Therefore the most useful frame of reference when thinking of reforms should be the national level: the key question is how to help developing countries adopt the policies that best suit their circumstances.
It is also clear that reforms will need to be ambitious both because of the scale of the issues identified above, and because of the high level of ambition of the SDGs.
This paper ends by making recommendations aimed at policymakers in developed countries on how they can support changes at the international level and change their own policies, in order to enhance the policy space for developing countries to chart their own paths to prosperity.
A: Executive summary

6 Financing for development and the SDGs
B: An overview of the state of development finance resources
This section provides an analysis of the scale, trends and features of different development financing sources, examining private finance first, then public finance. Inevitably, the quality of data at the global level and in many developing countries means that the following analysis should be read as an assessment of overall scale, trends and features of different finance resources. For example, the available data does not always distinguish between public and private investment, and there are often significant potential overlaps between what may be regarded as international capital flows and domestic resources. Systemic problems linked to illicit financial flows, tax avoidance and evasion mean that the data on international private capital flows is particularly problematic. For example, efforts to make use of favourable tax and investment regimes can lead to perverse practices such as ‘round tripping’, where domestic investment is repackaged as international to make use of incentives, or to change its tax treatment.
B1: Private finance
Domestic private investment represents a large, stable and rising share of GDP in developing countries, which is why mobilising such investment has been a crucial development financing strategy. By 2013 middle-income countries had reached over 30 per cent of GDP as domestic investment (of which around two thirds is private investment), while low-income countries had reached around 25 per cent of GDP.5 Most of this difference is explained by lower levels of public investment in low-income countries, which is heavily influenced by revenue mobilisation difficulties in those countries – a subject we will explore in Section B2.
In addition to not proving volatile, domestic investment in developing countries does not appear to have been greatly affected by the global financial crisis, having increased as a percentage of GDP for developing countries in the years following the crisis. This is in direct contrast to external investment, which has been highly volatile, as we will see shortly.6 This stability and great size of domestic private investment – it dwarfs inflows of capital for developing countries as a whole – shows why domestic resource mobilisation has been at the heart of the Financing for Development agenda since the first conference in Monterrey in 2002.7
Financing for domestic private investment comes from a number of sources, but a strong banking sector is normally the bedrock of successful development financing strategies, and this often means significant state involvement. In broad terms, financing for domestic private investment can arise from the following main sources: (a) the banking system; (b) reinvestment of earnings by companies; and (c) capital markets and related actors, including institutional investors. The banking system is the bedrock of financial systems in most developing countries, and the majority of academics emphasise the importance of banks in domestic development finance mobilisation.8 The main reason for this is that banks are better at reducing uncertainty, both over time – as they are more likely to hold a balanced portfolio of safe and risky assets9 – and at a project level, as they have a deeper relationship with their clients, including assessing risks carefully.10
Public actors are heavily involved in the financial sector in most developing countries, not just through regulation, which we will discuss in Section C, but critically through the ownership of public development banks, which account for around a quarter of all assets in banking systems globally.11 According to World Bank research, “in the European Union [state-owned financial institutions, or SFIs] represent 30 per cent of the total financial system … [while in] BRIC countries alone … the market share of SFIs is substantially higher.”12

Financing for development and the SDGs 7
As Figure 1 shows, the majority of the ten largest public development banks in the world are from developing countries. The main reasons for state involvement include: to improve the allocation of capital within the banking sector by directing finance to important sectors; to fill gaps in the supply of credit; or to build demand by helping develop bankable projects. In addition, public institutions can play a critical role in promoting economic stability by behaving counter-cyclically, and have the potential to drive up standards for the banking sector as a whole.13
One critical reason that banks, including public development banks, have been so important, is their ability to mobilise longer-term investment. As Figure 2 shows, banks are the single most common source of long-term finance that firms can mobilise outside their own resources. Figure 2 uses the common definition for long-term finance of funding with maturity of more than one year.14 However, long-term credit tends to be scarce in low-income countries. One study found that, “in some countries in Africa, short-term credit accounts for up to 90 per cent of bank financing [compared to] 50-60 per cent for developing countries as a whole.”15
Figure 1: Ten largest national development banks in the world economy16
Figure 2: Sources of external finance for purchases of fixed assets by firm size, 2006-1417
B: An overview of the state of development finance resources
B U C E NT E R FO R F I N A N C E , L AW & P O LI C Y4 www.bu.edu/gdpGEGI@GDPCenterPardee School of Global Studies/Boston University
China’s contributions are a major part of this story, but not all of it. Aside from C6 swaps, currency swaps from the People’s Bank of China and other China-led financial institutions amount to 31 percent of the total non-C6 liquidity support and 38 percent of the growth in liquidity support for EMDs. On a national level, China accounts for 31 percent of the growth in national reserve assets and 28 percent of global reserves—up from 25 percent in 2006.
Longer Run Development FinanceLonger-run development finance has also experienced a resurgence, increasing nearly twofold since the global crisis. The United Nation’s SDGs have shifted from a micro-level focus to more ambitious economy-wide goals in terms of infrastructure provision, climate change, and social inclusion. In this realm, there has been a stepwise increase in global development finance. Some of the advanced econ-omy-led MDBs saw modest increases in their base capital, and two significant new EMD-led multi-lateral development banks were launched in the Asian Infrastructure Investment Bank and the New Development Bank.
For decades the policy and academic attention to development banking has focused on the World Bank Group and the advanced economy-backed MDBs. What is often overlooked is the fact that the assets of national development banks, now at $4.8 trillion, are four times the size of the MDB system. Table 2 lists the ten largest national development banks, which represent just over 70 percent of the assets of all NDBs in the world economy.
Table 2: Ten Largest NDBs in the World Economy
Source: NDB annual reports
The China Development Bank (CDB) is the largest NDB in the world, and played a key role in China structural transformation and economic growth. The KfW, started in part with the Marshall Plan funds, is the largest NDB in the advanced economies, recently playing the catalyzing role in transforming Germany’s economy toward cleaner energy technologies (Griffith-Jones, 2016).
Building upon initial research on NDBs in UNCTAD’s 2015 Trade and Development Report, EMD-led MDBs and NDBs are 67 percent of all development finance in the world economy. In the case of de-velopment banking, the growth of the CDB accounts for roughly 90 percent of the growth in develop-ment bank finance since the crisis. Whereas the CDB held $371 billion in assets in 2006, they were approaching $2 billion in 2016. China is also a key player in the Asian Infrastructure Investment Bank and the New Development Bank.
NDB Country Total Assets in USD (millions)
Total lending in USD (millions)
1 China Development Bank China 1,957,057 1,427,801
2 KfW Bankengrup Germany 536,820 477,054
3 Banco Nacional de Desenvolvimento Econômico e Social (BNDES) Brazil 251,114 175,098
4 Korea Development Bank South Korea 235,151 124,554
5 Japan Bank for International Cooperation Japan 161,597 124,463
6 Development Bank of Japan, Inc. Japan 141,171 119,056
7 IDBI Bank Ltd. India 55,714 32,129
8 Bank for Development and Foreign Economic Affairs (Vnesheconombank) Russia 53,284 28,409
9 Banco Nacional de Obras y Servicios Públicos S.N.C. (Banobras) Mexico 34,151 17,985
10 Bank for Investment and Development of Vietnam Vietnam 30,680 20,714
3,456,738 2,547,264 GLOBAL FINANCIAL DEVELOPMENT REPORT 2015/2016 O V E R V I E W 7
WHY DO WE CARE ABOUT LONG-TERM FINANCE? SCARCITY AND IMPACT
The limited use of long-term fi nance observed in developing countries is not necessarily a problem in itself. To the contrary, this lim-ited use can be optimal since it refl ects both demand and supply of contracts with longer-term maturities and involves trade-offs in how risk is shared between users and provid-ers. In well-functioning markets, borrowers and lenders may prefer short-term contracts over longer-term contracts for a number of reasons.
Depending on the kind of asset being fi nanced, short-term fi nance may be preferred. Firms and households tend to match the maturity structure of their assets and liabilities. Firms, for example, generally prefer short-term loans to fi nance working capital, such as payroll, and inventory and use longer-term fi nancing to acquire fi xed assets, equipment, and the like (Hart and Moore 1995).
fi nancing 11 percent of purchases of fi xed assets through banks, compared with 26 per-cent for large fi rms. In contrast, the use of equity is less than 5 percent for fi rms of all sizes.
The global fi nancial crisis of 2008 ex-acerbated these differences in the use and provision of long-term fi nance. Initially in 2008–09, the crisis led to a reduction in ratios of total debt to total assets, or dele-veraging—mostly for small and medium en-terprises (SMEs) in high-income countries—as shown in the top half of fi gure O.3. By 2011, however, deleveraging was occurring across the board in all countries and for all fi rm sizes, and although the impact remained larger in the high-income world, larger fi rms were even more affected than SMEs. The bottom half of fi gure O.3 shows a different trend, this time focusing on long-term debt use. Looking only at fi rms using long-term fi nance in the precrisis period, the fi gures reveal that the crisis led to a signifi cant re-duction in long-term debt use by SMEs in developing countries. Again, by 2011 fi rms of all sizes had been affected by declining long-term debt use, but the impact remained signifi cantly greater in developing countries and for small fi rms.
For large fi rms that are able to access mar-kets for long-term fi nance, developments in the bond and syndicated loan markets had an adverse impact. Despite the signifi cant development of equity, bond, and syndicated loan markets before the crisis, particularly in developing countries it is still mostly a few large fi rms that tap these markets. Although these large fi rms in developing countries gen-erally do not show a shorter maturity struc-ture than similar size fi rms in high-income countries, a larger share of their fi nancing takes place in international markets com-pared with fi rms in high-income countries. Hence when the crisis led to a signifi cant fall in syndicated lending that originated in the high-income countries, developing-country fi rms were especially affected. The fi nancing of infrastructure projects, for which syndi-cated loans are key at the early stages, was severely affected.
Bank Trade credit Equity Other
Fixe
d as
set p
urch
ases
fina
nced
, %
Small firms (< 20) Medium firms (20–99) Large firms (100+)
30
25
20
15
10
5
0
11
20
26
68
64 3 4 5
3 2
FIGURE O.2 Sources of External Finance for Purchases of Fixed Assets by Firm Size, 2006–14
Source: Calculations for 123 countries, based on Enterprise Surveys (database), International Finance Corporation and World Bank, Washington, DC, http://www.enterprisesurveys.org.Note: The fi gure shows the average percentage of purchases of fi xed assets that was fi nanced from specifi c external sources—banks, trade credit, equity, and other sources—as opposed to internal sources. Equity fi nance includes owners’ contribution or new equity share issues (not retained earnings, which are counted as internal sources of fi nance). The “other” category of external fi nancing includes issues of new debt, nonbank fi nancial institutions, money lenders, family, and friends. Firm size is defi ned based on the number of employees. Calculations of the average for each fi rm size use sampling weights.

8 Financing for development and the SDGs
Given that domestic banking systems – including publicly oriented actors – are so important, it is unfortunate that so little research is focused on this critical subject. The World Bank’s survey of public development banks, which is the most comprehensive effort to draw together what is known about them, concluded that, “despite their size and importance, little is known about [public development banks]”.18 In addition, data on the scale of not for profit financial institutions, including co-operatives, in developing countries as a whole does not appear to be available, but one review found that in “...emerging markets, the share of cooperative banks is generally lower [than in Europe], but there are several countries where they play a non-negligible role.”19
The second major source of financing for domestic private investment is the reinvestment of earnings by companies. Again, state-owned enterprises often play an important role here. In many countries, reinvestment of earnings is the largest source of private investment. For example, a study of data from India over a 15-year period found that: “nearly 54 per cent of the new financing, on average, is funded by internal savings, while external funds contribute only 46 per cent.”20 As we saw for the banking sector, there is often considerable state involvement. UNCTAD estimates, for example, that in developing and transition countries, more than 40 of the top 100 non-financial multinational corporations are state-owned.21
Despite the prominence given to capital markets and capital market-related actors in much current discourse, they have tended to play a smaller role than banks, and become important only in later stages of development. Capital markets tend to be weak sources of financing in developing countries as a whole. Bond markets for company bonds are very shallow in developing countries – they represent only around 5 per cent of GDP even for middle-income countries.22 Government ‘sovereign’ bonds predominate in the bond markets, but they were still only equivalent to 30 per cent of GDP in middle-income countries in 2010.23 Stock market size tends to correlate with development: poorer countries have weaker stock markets. In 2010 for example, “the depth of equity markets in high-income countries stood at nearly 60 per cent of GDP, while in middle-income countries and lower-income countries it stood at only 28 per cent and 20 per cent respectively.”24 Though the World Bank has promoted capital market development, their flagship report recognised that the poorer a country is, the less capital markets have to offer.25
Institutional investors such as pension and insurance funds tend to be far smaller in size in developing countries compared to developed countries, and as Figure 3 shows hold very low levels of assets as a share of GDP in low-income countries.
Figure 3: Institutional investor assets by country income group, 2000-1126
International private capital flows are far smaller in scale than domestic private investment. For example, FDI as a share of developing country GDP was 2.4 per cent in 2003, rose to 3.2 per cent in 2008, and fell again after the financial crisis to 2.1 per cent in 2012.27 Foreign direct investment is foreign investment where the investor is thought to take an active interest in the management of the company – normally assumed when they own 10 per cent or more of the company. It is made up of three elements: equity capital, reinvested earnings and intra-company loans. Other private flows (see below) are smaller, more volatile, and – in net terms – often negative for developing countries.
There are costs and benefits to foreign direct investment, and development impacts can vary significantly, meaning that attracting foreign direct investment should never be the goal. The issue is how to attract the right kind of investment, and manage it to gain development benefits. While FDI dropped after the global financial crisis, then recovered but fell again significantly in 2016, as the Inter-Agency Task Force on Financing for Development notes, it “has tended to be more stable and longer-term than the other types of cross-border finance”. However, “there are significant differences in the quantity and quality of foreign direct investment inflows accruing to different regions and countries,” and “foreign direct investment flows to LDCsand small island developing states [are] concentrated in extractives industries, where their development impact is limited.”28 In addition, developing countries lose a consistently large proportion of GDP to investors repatriating profits from FDI – over two per cent of total GDP between 2005 and 2012, for example.29
B: An overview of the state of development finance resources
GLOBAL FINANCIAL DEVELOPMENT REPORT 2015/2016 O V E R V I E W 7
WHY DO WE CARE ABOUT LONG-TERM FINANCE? SCARCITY AND IMPACT
The limited use of long-term fi nance observed in developing countries is not necessarily a problem in itself. To the contrary, this lim-ited use can be optimal since it refl ects both demand and supply of contracts with longer-term maturities and involves trade-offs in how risk is shared between users and provid-ers. In well-functioning markets, borrowers and lenders may prefer short-term contracts over longer-term contracts for a number of reasons.
Depending on the kind of asset being fi nanced, short-term fi nance may be preferred. Firms and households tend to match the maturity structure of their assets and liabilities. Firms, for example, generally prefer short-term loans to fi nance working capital, such as payroll, and inventory and use longer-term fi nancing to acquire fi xed assets, equipment, and the like (Hart and Moore 1995).
fi nancing 11 percent of purchases of fi xed assets through banks, compared with 26 per-cent for large fi rms. In contrast, the use of equity is less than 5 percent for fi rms of all sizes.
The global fi nancial crisis of 2008 ex-acerbated these differences in the use and provision of long-term fi nance. Initially in 2008–09, the crisis led to a reduction in ratios of total debt to total assets, or dele-veraging—mostly for small and medium en-terprises (SMEs) in high-income countries—as shown in the top half of fi gure O.3. By 2011, however, deleveraging was occurring across the board in all countries and for all fi rm sizes, and although the impact remained larger in the high-income world, larger fi rms were even more affected than SMEs. The bottom half of fi gure O.3 shows a different trend, this time focusing on long-term debt use. Looking only at fi rms using long-term fi nance in the precrisis period, the fi gures reveal that the crisis led to a signifi cant re-duction in long-term debt use by SMEs in developing countries. Again, by 2011 fi rms of all sizes had been affected by declining long-term debt use, but the impact remained signifi cantly greater in developing countries and for small fi rms.
For large fi rms that are able to access mar-kets for long-term fi nance, developments in the bond and syndicated loan markets had an adverse impact. Despite the signifi cant development of equity, bond, and syndicated loan markets before the crisis, particularly in developing countries it is still mostly a few large fi rms that tap these markets. Although these large fi rms in developing countries gen-erally do not show a shorter maturity struc-ture than similar size fi rms in high-income countries, a larger share of their fi nancing takes place in international markets com-pared with fi rms in high-income countries. Hence when the crisis led to a signifi cant fall in syndicated lending that originated in the high-income countries, developing-country fi rms were especially affected. The fi nancing of infrastructure projects, for which syndi-cated loans are key at the early stages, was severely affected.
Bank Trade credit Equity Other
Fixe
d as
set p
urch
ases
fina
nced
, %Small firms (< 20) Medium firms (20–99) Large firms (100+)
30
25
20
15
10
5
0
11
20
26
68
64 3 4 5
3 2
FIGURE O.2 Sources of External Finance for Purchases of Fixed Assets by Firm Size, 2006–14
Source: Calculations for 123 countries, based on Enterprise Surveys (database), International Finance Corporation and World Bank, Washington, DC, http://www.enterprisesurveys.org.Note: The fi gure shows the average percentage of purchases of fi xed assets that was fi nanced from specifi c external sources—banks, trade credit, equity, and other sources—as opposed to internal sources. Equity fi nance includes owners’ contribution or new equity share issues (not retained earnings, which are counted as internal sources of fi nance). The “other” category of external fi nancing includes issues of new debt, nonbank fi nancial institutions, money lenders, family, and friends. Firm size is defi ned based on the number of employees. Calculations of the average for each fi rm size use sampling weights.

Financing for development and the SDGs 9
There are three aspects to FDI’s’s contribution to development that are all important for developing countries to manage. First, the extent to which FDI represents new finance for productive capacity can be low, as mergers and acquisitions can make up a significant percentage of the total. Second, FDI can have a positive or negative effect on domestic investment – in other words it may ‘crowd in’ or ‘crowd out’ additional investment. Third, the extent to which FDI results in technology transfer, learning and other beneficial effects on the local economy – such as growth of local suppliers to FDI firms – varies greatly.
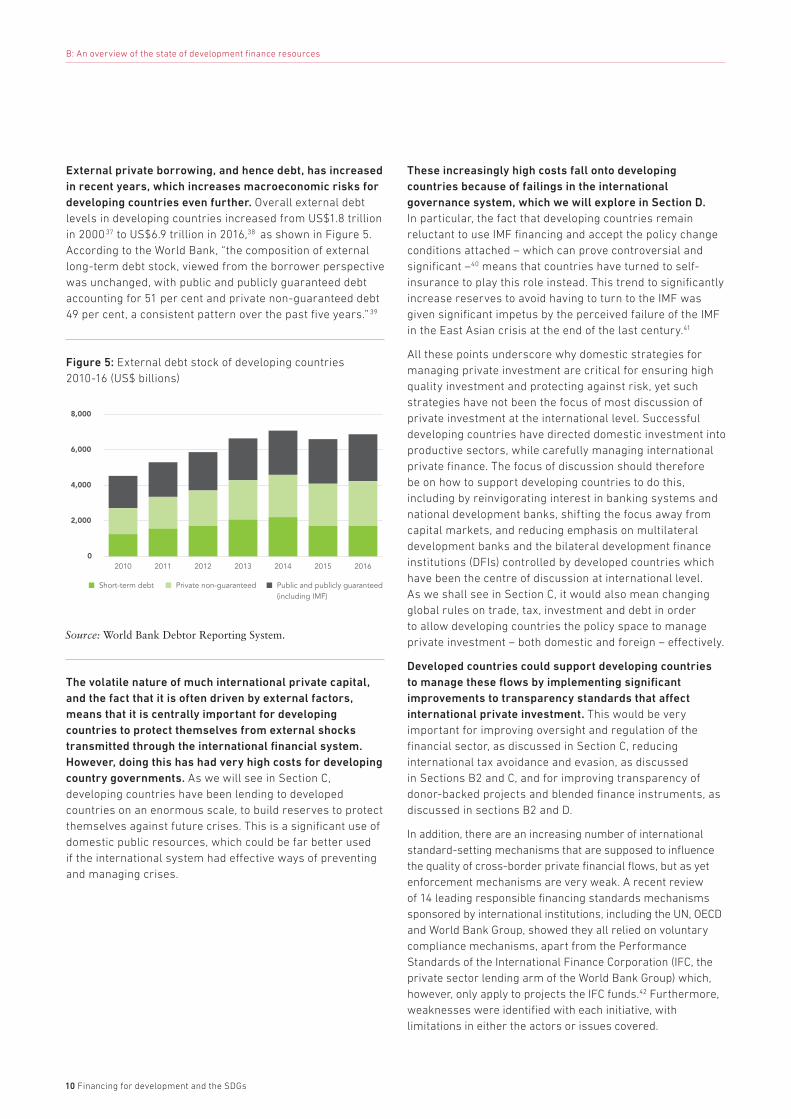
Other international private capital flows – portfolio investment and bank lending – have proven short-term, extremely volatile and a financial drain from developing countries in recent years. Figure 4 shows the trends between 2000 and 2016, highlighting that net private financial flows turned negative in 2014. Portfolio investment includes both purchases and sales of stocks and shares, and hence reflects the extent to which foreign investors increased their holdings in developing country equities. It tends to be shorter term, and can be highly volatile, meaning in some years it can represent a net inflow for developing countries, and in other years a net outflow. The UN estimates that portfolio investment has been a negative net flow for five of the past ten years for which data is available.30 It is important to note, as the Inter-Agency Task Force report does,31 that these flows are primarily driven by institutional investors, confirming that capital markets and capital market actors should be treated with caution as financing sources for developing countries.
‘Other investment’ has been a negative flow for the last six years,32 and is mainly made up of ‘international bank claims’ – in other words the net total of how much foreign banks owe or are owed in developing countries, plus what is owed in the domestic banking system of foreign currencies. The volatility of this flow emphasises how developing countries can be vulnerable to external factors, as “bank flows have demonstrated particularly high volatility, reflecting deleveraging by a number of international banks since the financial crisis.”33
The volatility of short-term international private investment is often driven by external factors, making it even more difficult for developing countries to manage. As the Inter-Agency Task Force report summarises, “to date, private international capital flows have been subject to volatility, driven by trends in the global economy and by short-term investment horizons.”34 For example, the main explanatory factors for the switch in net private capital flows noted above are external: a collapse in commodity prices in 2015, alongside “monetary conditions and interest rates in major advanced economies and the strength of the dollar.”35 The central role of the dollar exacerbates this trend by magnifying the global importance of US policy, and is discussed further in Section C.
Figure 4: Cross-border net financial flows to developing countries and economies in transition, 2000 –2016 ($billions)36
B: An overview of the state of development finance resources
54 Financing for Development: Progress and Prospects
3. Addressing risks to financial stability
Given the volatility of capital flows, as well as sys-temic risks to the real economy from excessive finan-cial leverage, it is important for countries to design robust regulatory frameworks, potentially including
capital account management tools. The emerging market financial crises of the 1990s, along with the 2008 global crisis, underscored the need for regu-latory frameworks that consider all areas of finan-cial intermediation, from microfinance to complex derivative instruments.
Figure 5Trends in cross-border net financial flows to developing countries and economies in transition, 2000 –2016 (Billions of United States dollars)
-600
-400
-200
0
200
400
600
800
2000 2001 2002 2003 2004 2005 2006 2007 2008 2009 2010 2011 2012 2013 2014 2015 2016
Total net �ows
Direct investment
Portfolio investment
Other �ows including cross-border bank loans
Source: IMF World Economic Outlook database, October 2016, and UN/DESA calculations.Note: The composition of countries is based on the country classification located in the statistical annex of the United Nations World Economic Situation and Prospects.
Figure 6Distribution of foreign direct investment, by sector, 2015 (Percentage)
Source: UNCTAD Foreign Direct Investment Statistics database.
0%
10%
20%
30%
40%
50%
60%
70%
80%
90%
100%
Developing economies
Business activities
Finance
Trade
Others
Transport, storage, and communications
Mining and quarrying
Landlocked developing countries
Small island developing States
Least developed countries
10 Financing for development and the SDGs
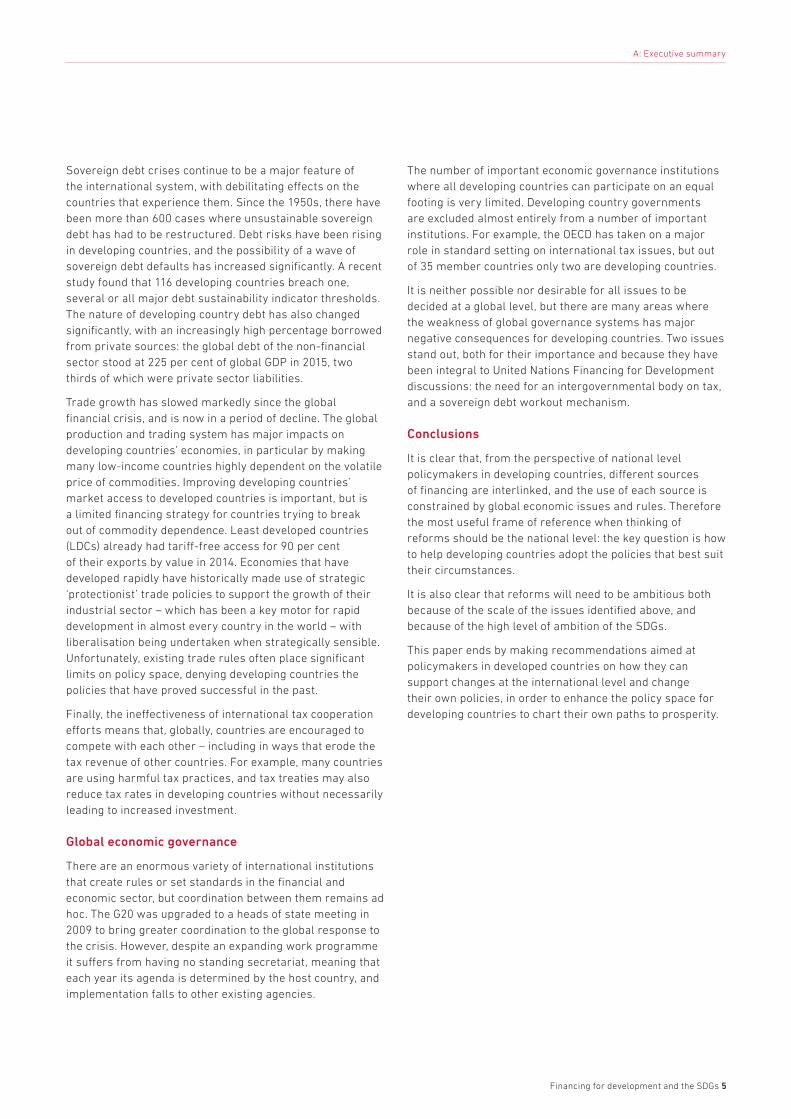
External private borrowing, and hence debt, has increased in recent years, which increases macroeconomic risks for developing countries even further. Overall external debt levels in developing countries increased from US$1.8 trillion in 2000 37 to US$6.9 trillion in 2016,38 as shown in Figure 5. According to the World Bank, “the composition of external long-term debt stock, viewed from the borrower perspective was unchanged, with public and publicly guaranteed debt accounting for 51 per cent and private non-guaranteed debt 49 per cent, a consistent pattern over the past five years.” 39
Figure 5: External debt stock of developing countries 2010-16 (US$ billions)
The volatile nature of much international private capital, and the fact that it is often driven by external factors, means that it is centrally important for developing countries to protect themselves from external shocks transmitted through the international financial system. However, doing this has had very high costs for developing country governments. As we will see in Section C, developing countries have been lending to developed countries on an enormous scale, to build reserves to protect themselves against future crises. This is a significant use of domestic public resources, which could be far better used if the international system had effective ways of preventing and managing crises.
These increasingly high costs fall onto developing countries because of failings in the international governance system, which we will explore in Section D. In particular, the fact that developing countries remain reluctant to use IMF financing and accept the policy change conditions attached – which can prove controversial and significant –40 means that countries have turned to self-insurance to play this role instead. This trend to significantly increase reserves to avoid having to turn to the IMF was given significant impetus by the perceived failure of the IMF in the East Asian crisis at the end of the last century.41
All these points underscore why domestic strategies for managing private investment are critical for ensuring high quality investment and protecting against risk, yet such strategies have not been the focus of most discussion of private investment at the international level. Successful developing countries have directed domestic investment into productive sectors, while carefully managing international private finance. The focus of discussion should therefore be on how to support developing countries to do this, including by reinvigorating interest in banking systems and national development banks, shifting the focus away from capital markets, and reducing emphasis on multilateral development banks and the bilateral development finance institutions (DFIs) controlled by developed countries which have been the centre of discussion at international level. As we shall see in Section C, it would also mean changing global rules on trade, tax, investment and debt in order to allow developing countries the policy space to manage private investment – both domestic and foreign – effectively.
Developed countries could support developing countries to manage these flows by implementing significant improvements to transparency standards that affect international private investment. This would be very important for improving oversight and regulation of the financial sector, as discussed in Section C, reducing international tax avoidance and evasion, as discussed in Sections B2 and C, and for improving transparency of donor-backed projects and blended finance instruments, as discussed in sections B2 and D.
In addition, there are an increasing number of international standard-setting mechanisms that are supposed to influence the quality of cross-border private financial flows, but as yet enforcement mechanisms are very weak. A recent review of 14 leading responsible financing standards mechanisms sponsored by international institutions, including the UN, OECD and World Bank Group, showed they all relied on voluntary compliance mechanisms, apart from the Performance Standards of the International Finance Corporation (IFC, the private sector lending arm of the World Bank Group) which, however, only apply to projects the IFC funds.42 Furthermore, weaknesses were identified with each initiative, with limitations in either the actors or issues covered.
5
O V E R V I E W
Trends in Debt Stocks 2016
External debt stock posts a moderate increase
The total external debt outstanding of low- and mid-dle-income countries rose 4.1 percent in 2016 to $6.9 trillion. This marked a return to the upward trajec-tory that has characterized the external debt of this group of countries throughout the past decade, inter-rupted only by the slight contraction in 2015. The rise was driven by a combination of net debt inflows of $248 billion and year-on-year exchange rate adjustments in relation to the U.S. dollar (more than half the debt of low- and middle-income countries is denominated in currencies other than U.S. dollars). Short-term debt stocks were virtually static, ending the year at much the same level as 2015, with the upturn driven by long-term debt inflows. Public and publicly guaranteed debt and private non-guaranteed debt rose in tandem, posting gains of 5 percent and 6.8 percent, respectively. But China, which accounted for 21 percent of the combined external debt stock of low- and middle-income countries at the end of 2016, drove the trend. External debt stocks to low- and middle-income countries excluding China recorded a slower, 3.2 percent accumulation in 2016, and a markedly different borrowing pattern with public and publicly guaranteed debt rising 4.5 per-cent, far faster than private non-guaranteed debt, up only 2.8 percent, as the pace of corporate borrowing slowed in most of the largest borrowers.
The composition of external long-term debt stock, viewed from the borrower perspective was unchanged, with public and publicly guaranteed debt accounting for 51 percent and private non-guaran-teed debt 49 percent, a consistent pattern over the past five years. Short-term debt, as a share of total external debt outstanding, was 25 percent, down marginally from 2015, but unchanged in relation to low- and middle-income countries’ imports (25 per-cent): short-term debt is primarily trade-related. Risks associated with short-term debt were mitigated by international reserves, which were, on average, 81 percent of external debt stocks for the same period.
Many low- and middle-income countries are experiencing a deterioration in debt indicators
On average, the external debt burden of low- and middle-income countries remained moderate. The ratio of external debt to GNI averaged 26 percent at the end of 2016, only marginally above the prior year average of 25 percent. The ratio of external debt to exports breeched 100 percent, rising to an average of 107 percent, up from 98 percent in 2015. These ratios, calculated using the current, end-2016 U.S. dollar value of GNI and export earnings mask both increased debt service costs arising from appreciation of the U.S. dollar and the deterioration of both the external debt-to-GNI and external debt- to-export ratios in an increasing number of low- and middle-income countries.
Source: World Bank Debtor Reporting System. Source: World Bank Debtor Reporting System and International Monetary Fund.
0
2,000
4,000
6,000
8,000
2016201520142013201220112010
Short-term debt Private non-guaranteed Public and publicly guaranteed (including IMF)
0
10
20
30
40
50
Above 100%60-100%40-60%30-40%Below 30%
2010 2016
Figure O.4 External Debt-to-GNI Ratio: Low- and Middle-Income Country Distribution 2010 and 2016Percent
Figure O.3 External Debt Stock of Low- and Middle-Income Countries, 2010–2016$ billion
B: An overview of the state of development finance resources

Financing for development and the SDGs 11
B2: Public finance
Domestic public finance is a major development resource, but the revenue bases and tax collecting capacity of developing countries – particularly in low-income countries – are more limited than developed countries. Upper middle-income countries tend to raise consistently more than other categories of developing country, raising over 20 per cent of GDP as government revenue in total in 2011, compared to lower middle-income and lower-income countries, which managed less than 15 per cent.43 However, the gap between different categories of country is to an important extent structural. This is why, according to a thorough review of the evidence, “the tax share in GDP of today’s developing countries looks very similar to what it did a century ago in the now-developed economies of the world.”44 As one study points out, the reasons for this are all linked to the facts of development: poorer countries have large informal sectors that are hard to tax, and tend to have weaker institutions.45 The issue of weak institutions has sometimes been reduced to issues of the technical capacity of revenue authorities, but in fact goes far beyond that, including, “…fragmented polities, and a lack of transparency due to weak news media,” for example.46
Due to difficulties in collecting other sources of revenue, trade taxes are particularly important in lower-income countries, but their ability to collect these has been curtailed through interaction with international institutions. The reason that lower-income countries tend to rely more on trade taxes, as Figure 6 shows, is that these are relatively easy to collect, and because other revenue sources, particularly income tax, tend to be small owing to the large informal sector and the difficulties of levying income tax on populations with very low levels of income. However, during the 1990s conditionalities from the IMF and Word Bank promoted a significant shift away from trade taxes in favour of VAT.47 In addition, international trade negotiations and trade treaties also seek to reduce trade taxes. This is not to suggest that trade taxes should be higher in developing countries, but rather that they are an essential policy option, and one which Nobel laureate Joseph Stiglitz and others have suggested do not necessarily have the negative consequences that the IMF and others have claimed.48
Figure 6: Income taxes versus trade taxes, for countries with different levels of income49
B: An overview of the state of development finance resources
104 Journal of Economic Perspectives
Such shares are plotted in the next two figures: in the cross-section for the year 2000 (Figure 4) and in the time series throughout the twentieth century (Figure 5). (Data sources are the same as for Figures 2 and 3.) In both figures, we plot the income-tax share on the vertical axis and the trade-tax share on the horizontal axis. In the cross section as well as the time series, we find a clear negative correlation between the two tax bases and a clear correlation with income. High-income countries depend more on income taxes and many of them do not use trade taxes at all (witness the multiple X’s at zero trade taxes). On the other hand, middle-income countries and, especially, low-income countries use trade taxes much more. That said, we also see quite a bit of heterogeneity unrelated to income. Figure 5 illustrates how the move from trade taxes to income taxes is a clear feature of the historical development of taxation. As we found when comparing Figures 2 and 3, the cross-sectional and time-series patterns in Figures 4 and 5 are strikingly similar.
Figure 6 uses an alternate method to illustrate how low-income countries typi-cally have different and narrower tax bases than high-income countries: it plots top statutory income-tax rates in the 1990s for a 67-country sample (from Gordon and Lee 2005) against the share of income taxes in GDP (from Baunsgaard and
Figure 4 Income Taxes versus Trade Taxes, for Countries with Different Levels of Income
Sources: Baunsgaard and Keen (2005) and the Penn World Tables.Note: Figure 4 plots the share of income taxes in GDP on the y-axis versus the share of trade taxes in GDP on the x-axis (as of 1999) for countries that were high-, middle-, or low-income in 2000.
0
.2
.4
.6
.8
Shar
e of
inco
me
taxe
s in
GD
P (1
999)
0 .2 .4 .6Share of trade taxes in GDP (1999)
High-income in 2000 Middle-income in 2000 Low-income in 2000
Fitted values

12 Financing for development and the SDGs
Given that corporate taxation plays a key role in developing countries’ revenue bases, tackling the significant tax losses to multinational tax avoidance and evasion is particularly important. Corporate taxes account for 21 per cent of developing countries’ tax take, compared with only 11 per cent in developed countries (see Figure 7), helping to compensate for the difficulties in raising other taxes noted above. The use of offshore financial centres, intra-company operations within multinational corporations and financial secrecy allow multinationals to transfer financial resources out of developing countries.
The scale of the problem is, by its nature, impossible to quantify precisely, but all available figures suggest there is a significant loss of resources by developing countries, both in terms of lost resources for investment or consumption expenditure, and lost tax revenues. For example the Report of the High Level Panel on Illicit Financial Flows from Africa found that the “amount lost annually by Africa through illicit financial flows is ... likely to exceed US$50 billion by a significant amount.”50 UNCTAD found, “an estimated US$100 billion annual tax revenue loss for developing countries is related to inward investment stocks directly linked to offshore investment hubs”51 – only one aspect of the problem of tax losses through opaque multinational corporate structures. Tax losses to money already transferred to offshore financial centres have been estimated at US$190 billion per year.52 The IMF estimates that around US$200 billion in revenue is lost to developing countries annually because of the ‘spillover’ effects of tax policies in other countries.53
Figure 7: Composition of government revenues54
B: An overview of the state of development finance resources
World Investment Report 2015: Reforming International Investment Governance182
institutional structures and collection capabilities. In contrast, indirect taxes are easier to collect. Lower shares of social contributions and personal income taxes and higher shares of indirect taxes seem to be associated with lower collection capabilities and a greater reliance on corporate income taxes.
Interestingly, corporates are instrumental in collecting all three of these categories. While they do not actually pay personal income taxes and indirect taxes out of their own pockets in theory (leaving aside specific fiscal issues such as non-recoverable VAT) they collect these taxes on behalf of government through their payrolls and from their customers. This role, not explicitly quantified in the assessment of corporate contributions, represents a significant additional
element of fiscal value added – of crucial importance in developing countries with large informal economies.
Looking specifically at the (paid) contribution of corporates (domestic and foreign firms) across all three categories of government revenues – taxes, social contributions and other revenues – confirms the significantly higher relative contribution in developing countries (almost half of government revenues) compared with developed countries (one third) (figure V.5). The difference is caused, as noted before, by higher revenues from corporate taxes (income taxes as well as taxes on international trade and other levies) and from relatively higher corporate contributions to other revenues, especially from natural resources and property. Relative to the size of the economies, the
Figure V.3. Composition of government revenues, by region (Per cent)
Composition of government revenues Share of total government revenues (%)
Composition of tax component only Share of total taxes (%)
Income tax component
Corporate income tax
Personal income tax
Goods and services
Internationaltrade
Others
Taxes Social contributions
Other revenues (e.g. royalties on natural resources, grants)
LDCs
Transition economies
Latin America andthe Caribbean
Asia
Africa
Developing economies
Developed economies
Global
Memorandum item:51
54
61
62
53
60
56
56
0
14
16
7
2
10
25
23
49
32
23
31
45
30
19
21
16*
20
21
20
30
21
11
12
10*
16
4
14
20
12
39
34
41
31
63
46
33
49
35
37
21
27
4
6
10
6
0
2
12
5
7
14
7
12
15
14
Source: UNCTAD analysis, based on the ICTD Government Revenue Dataset. Note: The classification is generally based on the standard IMF Government Finance Statistics classification. However, in the left-hand graph the category “other
revenues” includes grants (these are very small, at 1.5 per cent of total government revenues in developing economies). In the right-hand graph, income taxes (corporate and personal) reflect the IMF category “taxes on income, profit and capital gains” (“payable by corporations and other enterprises” and “payable by individuals”). The residual category “others” includes taxes on payroll and workforce, taxes on property and other taxes. Data with (*) subject to very limited coverage. Full details on data sources and methods provided in annex I.

Financing for development and the SDGs 13
In addition, the ‘race to the bottom’ on tax incentives, driven by international tax competition, is eroding the corporate income tax base in many developing countries. For example, ActionAid estimates that statutory corporate tax exemptions alone cost developing countries US$138 billion per year.55 However a report by the IMF, OECD, World Bank and UN found that, “tax incentives generally rank low in investment climate surveys in low-income countries, and there are many examples in which they are reported to be redundant – that is, investment would have been undertaken even without them.”56
Another IMF study found that domestic “taxation is not a significant driver for the location of foreign firms in sub-Saharan Africa, while other investment climate factors, such as infrastructure, human capital and institutions, are.”57 In other words, public investment is a far more important driver of longer-term FDI than lower domestic taxes, but this investment is itself harmed by lower tax revenues. However, as we shall see in Sections C and D, international rule setting on tax, and the lack of participation of developing countries, facilitates rather than suppresses this problem.
There are significant public resource shortfalls for basic services and social protection, particularly inLDCs, which are partly caused by low tax bases, and tax losses due to tax competition, tax avoidance and evasion. Public expenditure is vital for delivering basic social services, including health and education for all. However the range of public goods that require public expenditure is broader than this. The 2030 Agenda for Sustainable Development includes the provision of social protection ‘floors’ (minimum expenditure levels), including pensions, unemployment and disability payments, for example. As the Inter-Agency Task Force report notes, “financing social protection generally comes from the budget: thus tax revenues are first and foremost the basis of financing.” These shortfalls have gendered implications, as women’s health needs and socially constructed caring roles mean they are particularly reliant on public services and social protection.
In addition, the infrastructure ‘investment gap’ is primarily due to these shortfalls in public finance. In developing countries, “three quarters of infrastructure is financed by the public sector.”58 This has been the case historically, and will continue to be the case in future as many infrastructure investments, particularly in low-income countries, are not profit-making propositions, or are too high risk for private investors. In China, for example, one study found that, “almost all infrastructure financing is undertaken by the public sector, with private financing as a proportion of GDP close to zero.”59
While private finance is vitally important for development, it is a mistake to suggest that it can be a substitute for these shortfalls in public expenditure, including in infrastructure. In fact, as we have seen, insufficient public expenditure is a significant barrier for investment. As the Inter-Agency Task Force put it, “... public investments in basic infrastructure, health and education and many other areas provide the preconditions without which markets cannot function.”60 This is why the push by the World Bank Group and others to increase the use of public-private partnerships (PPPs) in infrastructure has been misguided: too often there is no revenue stream to repay the private sector investment, so the repayments are made by the government. PPPs have too often proved expensive, and because they can be used to keep government expenditures off-budget, have resulted in hidden debts.61
Borrowing is one strategy to increase public resource mobilisation, but increases debt risks, which have been rising over the past few years. Public external borrowing has increased in recent years, but rises in GDP mean the external debt stock to GDP ratio had fallen until 2011, when it started rising again. Short-term debt has also been increasing as a share of the total.62 Annual debt service on external debt has risen to US$575 billion.63 The nature of developing country debt has also changed significantly, with an increasingly high percentage borrowed from private sources, domestic as well as external.64 This commercial debt has higher interest rates and can prove difficult to restructure rapidly if it becomes unsustainable, for example when a crisis hits.
In addition, domestic borrowing from domestic capital markets, banks and other sources has been increasing overall, though it varies between countries. According to the IMF, “domestic public debt increased from 14 to 19 per cent of GDP from 2007 to 2014 [in emerging markets], compared to a stable ratio of 13 per cent of GDP for the average low-income country.”65 The implications of rising levels of public debt and the shift towards borrowing from private sources are increased risks of debt crises, which are explored in Section C.
International transfers of resources to developing countries in the form of ODA and climate finance, designed to help fill these gaps, have proved far less than promised. ODA doubled in real terms, from US$71 billion in 2000 to US$143 billion in 2016, but ODA as a percentage of GNI rose from 0.22 per cent for OECD Development Assistance Committee (DAC) members to 0.32 per cent over the same period, less than half of the UN target of 0.7 per cent.66
B: An overview of the state of development finance resources
14 Financing for development and the SDGs
In addition, the OECD DAC definition of ODA allows for a significant portion of the money to be spent in the donor country itself. This issue has hit the headlines in recent years because of a spike in one category of in-donor ODA expenditure: costs associated with the arrival of refugees. As the OECD DAC notes, “between 2015 and 2016, ODA for in-donor refugee costs rose by 27.5 per cent in real terms, from US$12.1 billion to US$15.4 billion, and its share of total net ODA increased from 9.2 per cent to 10.8 per cent.”67
Country Programmable Aid is a subset of ODA, which the OECD DAC has designed to be, “much closer to capturing the flows of aid that go to the partner countries than the concept of ODA.”68 Country Programmable Aid stood at just US$103 billion in 2015, the last year for which figures are currently available.69
Promises to provide US$100 billion annually in new and additional climate finance appear to have resulted in little additional public finance transfer. In 2009, at the Copenhagen UNFCCC summit, developed countries committed to “... a goal of mobilising jointly US$100 billion dollars a year by 2020 to address the needs of developing countries” 70 from a mix of sources. The OECD estimated that bilateral public climate finance was around US$23 billion per year in 2013 and 2014, but that 84 per cent of this was accounted for by ODA.71
In countries where ODA is a significant resource, it can have a major economic impact on the extent to which it supports successful national strategies, but too much ‘upward accountability’ to donors often undermines this objective. ODA is a major addition to domestic resources in many low-income countries. In 2010, for example, it represented more than 10 per cent of GDP in 37 countries.72 Perhaps the best example of the problem of upward accountability is in the current discussion about the use ofODA to support private investment. In broad terms, international development cooperation has three main impacts on private investment, each damaged by the tendency for upwards accountability to donors:
1. Spending power to procure goods and services. There is significant potential for a ‘double dividend’ from ODA if more could be spent in the recipient country, boosting demand for goods and services from local suppliers. However, the potential for this double dividend is damaged by the continued practice of many countries of ‘tying’ ODA – using it to support firms from the donor country. Development actors have long been committed to untying aid, starting with a recommendation from the OECD DAC in 2001, and reinforced by successive international agreements including the Addis Ababa Action Agenda.73
However, in 2015, 16.5 per cent of aid within the scope of the DAC’s 2001 recommendation was still tied – almost US$5 billion.74 In reality, the levels of tying may be much higher than reported, as the majority of bilateral aid falls outside the scope of the DAC’s recommendation, and much ODA reported as untied may still be tied in practice, through informal barriers that prevent firms outside the donor country from competing. Of the aid contracts reported to the OECD DAC in 2014 that fell under the scope of the DAC recommendation on untying, 46 per cent by value were awarded to firms in the donor country.75 In addition, tying aid dilutes the sustainable development focus of ODA, and increases the costs of projects by an estimated 15–30 per cent.76
2. Impacts on economic growth of investments in public goods. As we have seen ODA, which supports investment in public goods and services such as health, education, water, sanitation and infrastructure, can help stimulate private investment, which depends on the provision of these goods. This has long been a traditional focus of ODA. However, the current switch by many donors away from these modalities towards the use of ODA for subsidies to businesses (known as ‘blending’ in donor parlance) is likely to reduce the amount available for public investments: there is an opportunity cost to such a switch.77
3. Subsidies to businesses. Though the above two impacts of ODA on private investment are arguably the most important, it is this third that is dominating discussion in many international forums. The use of subsidies to promote private investment in key sectors can be a tool of industrial policy, but needs to be carefully managed within a national strategic framework, as discussed above.
However, evidence suggests that the promotion of subsidies (or ‘blending’, ‘catalysing’ or ‘leveraging’) by donors will result in greater use of their own development finance institutions, which have not traditionally been integrated into national strategies. This brings an increased risk that decisions will be tied to the interests or perspectives of the donor country. For example, a recent study of the European Union’s blending projects found that four main development banks used to implement projects were all European, including two bilaterals, the European Investment Bank and the European Bank for Reconstruction and Development.78
B: An overview of the state of development finance resources

Financing for development and the SDGs 15
In addition to an increased risk of tying, the promotion of ‘blending’ – the use of ODA to subsidise private investments – has significant opportunity costs, and carries significant development risks that need to be recognised. The most obvious opportunity cost is that blending is a mechanism better suited to middle-income rather than low-income countries, and is not well suited to sectors or regions where commercial returns are low, such as the provision of public services.79 This also means it is difficult to imagine blended finance making an important contribution to the ‘leave no-one behind’ agenda that underpins the SDGs.80 The UN Secretary General has previously elegantly summarised the various risks and problems with blending when reporting to the UN’s Development Cooperation Forum:
“Lack of clarity about additionality and purpose; limited influence of donors and recipients on investment design and implementation, diminished transparency and accountability, misalignment of private sector and country priorities; danger of increased debt burden; inattention to small- and medium-sized enterprises; the opportunity cost incurred when use of public money to mobilise private resources does not have the same or a larger development impact than if it had been devoted directly to a developmental purpose; and the risks of misappropriation.”81
Improving the quality of aid through implementing internationally agreed aid effectiveness principles should once again become a key focus of ODA reform, including through reforms to technical assistance, which should focus on becoming demand-driven. Commitments to improve the effectiveness of aid have been set out in detail and agreed at the international level at a series of summits in Paris, Accra and Busan, and most recently discussed at a High Level Meeting of the Global Partnership for Effective Development Cooperation in Kenya in 2016. Though progress has been made, the monitoring report for this meeting82 showed that there is still a lot of work to do, and this agenda needs to be re-energised.
In addition to the issue of untying aid raised above, one key area for reform would be the use of ODA to support capacity development through technical assistance (also known as technical cooperation). At the Accra High Level Forum on Aid Effectiveness in 2008, aid providers agreed that their, “support for capacity development will be demand-driven and designed to support country ownership.”83 This was partly in response to a series of critical reports by civil society organisations84 and the OECD DAC.85
Since then, little attention has been paid to this critical aid modality, despite it accounting for a significant proportion of ODA, particularly in certain countries. A recent study found that, “In 2014, Germany, France and Japan….channelled 54 per cent, 41 per cent and 33 per cent respectively, of their real bilateral assistance into [technical cooperation].”86 The findings of this study led the chair of the Reality of Aid global network of CSOs to conclude that, “…to date it seems that technical cooperation remains largely insulated from donors’ efforts to improve the quality and effectiveness of their aid, largely ignoring the principles of democratic ownership and partnership.”87
A recommitment to putting aid effectiveness back at the centre of the debate where it belongs could begin with a commitment to genuinely untie all ODA, and the launch of a renewed drive to make sure that technical assistance becomes truly demand-driven.
B: An overview of the state of development finance resources

16 Financing for development and the SDGs
C: An analysis of key systemic issues
As we have seen, the financial resources available to developing countries and how they can be used are constrained by the position of developing countries within the international monetary, financial and economic systems, to which we will now turn.
International monetary system
Since the collapse of the Bretton Woods system in the 1970s, the international monetary system has been prone to significant swings in exchange rates. The current international monetary framework is not really a ‘system’ at all; it has evolved haphazardly since the collapse of the Bretton Woods system. Though exchange rates are often described as ‘freely floating’, there are in practice a wide variety of different arrangements in place. Some countries peg their currencies to a hard currency such as the dollar or a basket of currencies, but this means of course that their macroeconomic framework follows that of another country. This can build up significant problems, as Argentina discovered at the beginning of this century. In reality, the size of the foreign exchange market, which dwarfs global GDP, means that government efforts to manage exchange rates can always come unstuck.
This has meant that exchange rates can be volatile, which can be very damaging for developing countries. Figure 8 below shows IMF estimates of exchange rate volatility in the decades leading up to the financial crises. This level of volatility creates significant risks, particularly for the poorest countries, making macroeconomic planning difficult and adversely affecting investments. Investments that could be profitable with stable exchange rates may become unprofitable when risks are accounted for, or may be avoided by risk-averse investors. Exchange rate volatility also increases debt and balance of payments risks, as devaluations increase the cost of servicing foreign debts and make imports more expensive.
Figure 8: Estimates of exchange rate volatility88
Persistent trade imbalances make the system more unstable. Risks have altered in recent years. The slowdown in world trade and the collapse in commodity prices, which we will discuss later, have contributed to developing countries switching from a consistent current account surplus in recent years to a deficit in 2015, which reached close to US$100 billion in 2016.89 This contributes to the rising debt levels that we will discuss later, as this deficit is normally financed by capital imports: by borrowed money. Globally, current account imbalances remain at relatively high levels of GDP, though lower than the peak that contributed to the global financial crisis. The composition of the imbalances has shifted as shown in Figure 9.

Financing for development and the SDGs 17
Figure 9: Current account balances 2002-16 (% GDP)90
The fact that the dollar is the global reserve currency exacerbates these problems. The dollar’s central role allows the US to borrow cheaply and continue borrowing indefinitely, as it can always ‘print more dollars’. This means that American monetary and fiscal policy decisions impact on the rest of the world. For example, the recent appreciation of the dollar has a significant impact on commodity exporters as, “most commodities are priced in dollars and most commodity contracts are settled in dollars.”91 In addition, there can be enormous systemic risks arising from the dollar’s position.
The huge scale of borrowing by the US government, financed in large part by China and other emerging countries eager to buy US securities to build their reserves in the decade before the global crisis, allowed the US government to maintain low interest rates, fuelling the disastrous private sector borrowing bubble that was one of the key causes of the crisis.
The global monetary system therefore has significant impacts on macroeconomic stability in developing countries, as well as determining underlying incentives for international private capital flows. Further risks to macroeconomic stability and impacts on capital allocation arise from the global financial system, to which we will now turn.
Global financial system
At the request of the G20, the Financial Stability Board and related institutions have, since the global financial crisis, coordinated a wide-ranging package of financial sector reforms. These have included work on bank capital requirements (‘Basel III’), financial sector compensation, over the counter derivatives, resolution mechanisms for insolvent financial institutions, and regulation of shadow banking institutions.92 The reforms have had significant impacts on the global financial sector, in particular by increasing the amount of capital that banks are required to hold, and increasing the proportion of this capital compared to the amount they lend.93
However it is not clear that the reforms have fixed underlying problems, and the risk of further financial and economic crises remains high. The non-bank financial sector – which is very lightly regulated – continues to grow. As the Financial Stability Board (FSB) notes, “non-bank financial intermediation, including by insurance companies and pension funds, has grown in several advanced economies....and [emerging market and developing economies] since the crisis, and now represents more than 40 per cent of total financial system assets.”94 The FSB has a “narrow measure” of shadow banking, focusing on activities “that may give rise to financial stability risks.” This “grew 3.2 per cent to US$34 trillion in 2015... equivalent to 69 per cent of GDP” of the 27 jurisdictions studied.95
Efforts to fix ‘too big to fail’ banks have focused on improving their ability to shoulder losses, and on regulators’ mechanisms for resolving insolvencies to prevent problems of one institution (or several) spreading around the system.96 However, IMF staff have estimated that, “the balance sheet size of the world’s largest banks at least doubled, and in some cases quadrupled, over the ten years prior to the financial crisis... [and] their size has been relatively stable since.”97 This is problematic, as the same paper notes that large banks have “lower capital, fragile funding, more market-based activities, and more organisational complexity” than smaller banks.98
Finally, as we have seen, private debt levels have risen to record levels: the global debt of the non-financial sector stood at 225 per cent of global GDP in 2015, two thirds of which were private sector liabilities.99
C: An analysis of key systemic issues
2017 EXTERNAL SECTOR REPORT
INTERNATIONAL MONETARY FUND 5
2016 Developments
2. Global current account imbalances were broadly unchanged in 2016, with only minor compositional shifts. Following a marked narrowing in the aftermath of the Global Financial Crisis (GFC), overall global imbalances remained unchanged in recent years, at about 1.9 percent of world GDP (Figure 1, left panel). The configuration of current accounts saw only minor shifts during 2016, with some narrowing of China’s surplus and of deficits of key emerging and developing economies (EMDEs)—Brazil, Indonesia, Mexico, South Africa—amid a slightly higher surplus for Japan and a higher deficit for the United States. Most currencies, with the notable exception of the yen, depreciated in nominal terms against the U.S. dollar (Figure 1, right panel). These nominal changes vis-à-vis the dollar implied important real depreciations for the United Kingdom (related to Brexit), China (capital outflow pressures), and a few EMDEs, notably Mexico (partly reflecting trade-policy risks) and South Africa (partly due to political developments). These real depreciations were accompanied by large real appreciations for Japan as well as for some EMDEs (Brazil, Indonesia), whose currencies strengthened on the back of improving outlooks and policies. The euro and the U.S. dollar were broadly unchanged in real terms during 2016.
Figure 1. Evolution of Global Current Account Balances and Exchange Rates, 2002-16
The Reconfiguration of Imbalances Since 2013
3. The relatively small current account shifts during 2016 built on an earlier trend of increasing imbalances in AEs. The most noticeable development since the narrowing of imbalances in the years immediately following the GFC was the reconfiguration that started in 2013. The latter was characterized by a marked shrinking of surpluses (into small deficits) in oil-exporting economies and a narrowing of current account deficits in EMDEs, accompanied by growing imbalances in AEs (Figure 2, left panel). The current constellation of imbalances entails an increased concentration in AEs—with large and persistent surpluses in some countries (Germany, Japan, Korea, the Netherlands, Singapore, Switzerland,
-3
-2
-1
0
1
2
3
2002 2004 2006 2008 2010 2012 2014 2016
USA GBR Deficit EMs AE Comm. ExpOther Deficit EA (other) CHN DEU/NLDJPN Surplus AEs Other Surplus Oil exportersDiscrepancy
Sources: World Economic Outlook, International Financial Statistics, Global Statistics Database and IMF staff calculations.1/Surplus AEs: Hong Kong SAR, Korea, Singapore, Sweden, Switzerland, Taiwan POC; AE Commodity Exporters: Australia, Canada, New Zealand; Deficit EMs: Brazil, India, Indonesia, Mexico, South Africa, Turkey; Oil Exporters: WEO definition plus Norway.2/ 2016 average relative to 2015 average.
Current Account Balances, 2002-16 1/(percent of world GDP)
SAUAUS
TUR
ZAF
GBR
BRA
CAN
USA
MEX
IDNIND
POLFRA
BEL
ESP
ITAMYS
HKG
CHN
EA
JPN
RUSSWE
CHETHA
KOR
DEU
NLDSGP
-15
-12
-9
-6
-3
0
3
6
9
12
15
-20 -15 -10 -5 0 5 10 15
REER
(+
=ap
prec
iatio
n)
Nominal Exchange Rate (vis-a-vis USD, +=appreciation)
Nominal and Real Effective Exchange Rate, 2016 2/(percentage change)

18 Financing for development and the SDGs
As the FSBnotes, “... the financial crisis has slowed down, but not reversed, the long-term trend toward higher global financial integration,”100 and developing countries have become increasingly vulnerable to external financial markets and actors. Private capital flows to developing countries have been driven by the external economic situation and policies of other countries – in particular low interest rates and quantitative easing policies in the developed world, which has encouraged capital to flow to developing countries in search of higher yields. At the same time, there has been a “significant increase in the presence of foreign investors and lenders in domestic financial markets of [developing countries] as well as the presence of their residents in international financial markets, rendering them highly vulnerable to global boom-bust cycles generated by policy shifts in major financial centres.”101
The monetary policies used in response to the crisis have also created issues for financial markets, which may cause significant problems in the future. For example, they have pushed the interest rate for government debts into negative territory, affecting the pension funds that buy most of these assets. This may be one reason why so much attention has recently focused on how to help such actors invest more in developing countries. However, as we have seen, this strategy does not have a strong development rationale, particularly for low-income countries, and would connect developing countries even further to unstable international capital markets.
Developing countries have been transferring funds to developed countries on an enormous scale, to build reserves and protect themselves against future crises arising from the global monetary and financial system. This has largely taken the form of buying assets in developed countries and, “in the first quarter of 2016, 64 per cent of official reported reserves were held in assets denominated in US dollars”.102 It is a misconception that this is driven only by a small number of large developing countries: the phenomenon has been widespread. For example, 16 developing countries, including three low-income countries, invested more than five per cent of their GDP in building reserves between 2011 and 2012.103
It is clear that efforts to reform the global monetary and financial system must have far higher ambitions if the risk of another major global or regional crisis is to be averted. In the aftermath of the global financial crisis there were numerous calls for a ‘Bretton Woods 2’ conference to redesign the system to prevent global crises in the future. This would still be merited, but the political will generated by the last crisis did not prove sufficient, and it may unfortunately take another crisis before sufficient momentum gathers behind an ambitious global redesign of the monetary and financial system.
In the meantime, progress can be made across a range of issues, including through the UN’s Financing for Development process, as set out in Section E. It is clear, from the perspective of developing countries, that international efforts to reduce the risks caused by global financial markets are extremely important, which is why it is so important to reform the governance of the FSB and related institutions so that they take all countries’ interests into account and end the dominance of existing financial centres in rule-setting (see Section D).
Reforms that help developing countries better protect themselves from destabilising private capital flows should be promoted. Countries such as China and India have relied heavily on strict capital controls – which regulate both capital inflows and outflows. Emerging economies used the G20 to shift the IMF’s position on this issue,104 so that it now accepts that free movement of capital is not the desired end-point, and that capital controls can be a useful part of their policy toolkit.
In addition to supporting developing countries to take a more active approach in managing their capital account to prevent destabilising financial flows and promote longer term investment, additional resources could be created to bolster their reserves, increasing their ability to protect themselves while reducing the fiscal cost of these measures. The UN has already put such a proposal on the table, suggesting a form of global ‘quantitative easing’ with the annual issuance of new Special Drawing Rights (SDRs, a kind of global reserve asset issued at the IMF), which would then be allocated to developing countries. The UN proposes that new SDRs would be allocated each year, with US$100-167 billion going annually to developing countries.105
C: An analysis of key systemic issues

Financing for development and the SDGs 19
Sovereign debt crises
Sovereign debt crises continue to be a major feature of the international system, with debilitating effects on the countries that experience them. Since the 1950s, there have been more than 600 cases where unsustainable sovereign debt has had to be restructured.106
Debt risks have been rising in developing countries, and the possibility of a wave of sovereign debt defaults has increased significantly. Thanks to economic growth and international debt relief initiatives, developing country debt levels had previously fallen, but have increased significantly since the global financial crisis. On average, sovereign debt as a share of GDP in emerging markets and developing countries has increased by 12 percentage points since 2007, and by 2016 these economies on average had government debt equivalent to 47 per cent of GDP.107
In September 2017, the IMF assessed only 11 out of 67 low-income countries to be at low risk of debt distress, while 30 would breach critical thresholds if there were an external shock, 20 will breach them under the IMF’s baseline scenario, and six are already in debt distress. A recent study found that 116 developing countries breach one, several or all major debt sustainability indicator thresholds.108
The nature of developing country debt has also changed significantly, with an increasingly high percentage borrowed from private sources, external as well as domestic.109 This commercial debt has higher interest rates and can prove difficult to restructure if it becomes unsustainable, for example when a crisis hits.
Debt levels are also reaching record highs globally. As we have noted, the global debt of the non-financial sector stood at 225 per cent of global GDP in 2015. 110 As the FSB has noted, “robust growth in bond market issuance, induced by a decline in yields over the past years [see graph below] has pushed the amount of outstanding debt securities to record levels.”111
Trade and investment rules
Trade growth has slowed markedly since the global financial crisis, and is now in a period of decline. There was a 10 per cent fall in value terms in 2015, and again in 2016, affecting all regions.112 The IMF points to the slowdown in investment growth as a key factor, while the trade slump also contributes to reduced investment,113 showing how financing for development is closely linked to trade issues.
‘Free’ trade agreements (FTAs) concluded outside the World Trade Organization also increasingly include measures that go well beyond trade tariffs, in particular reducing or ‘harmonising’ regulation in order to facilitate foreign investment. Free trade agreements also often include entire chapters concerning conditions and protections for foreign investment, which have attracted considerable criticism for constraining policy space in signatory countries. This is reflected in the Addis Ababa Action Agenda, (AAAA) which commits governments to designing “trade and investment agreements with appropriate safeguards so as not to constrain domestic policies and regulation in the public interest.”114
The global production and trading system has major impacts on developing countries’ economies, in particular by making many low-income countries highly dependent on the volatile price of commodities. As the Inter-Agency Task Force report notes, “...the rise of global value chains...requires specialised production capabilities at a demanding level of quality and quantity...which largely confine least developed countries’ participation in value chains to upstream activities such as raw material provision.”115 Many LDCsremain heavily dependent on commodities, and hence are vulnerable to volatile commodity prices. Commodity prices collapsed in 2015, wiping out the gains of the previous decade.116
In addition to creating major macroeconomic volatility, including of the exchange rate, and significantly impacting on investment levels,117 this has an obvious major impact on public resources. Falls in tax revenues associated with declining export volumes (particularly for LDCs which, as we have noted, are likely to be more dependent on trade taxes), and losses associated with balance of payment problems can result in far reduced protections against further shocks. For example, according to the IMF, “there were seven commodity exporters with reserve levels of less than three months of prospective imports in 2014, a number set to reach 15 (out of 26) by end 2016,”118 making these countries extremely vulnerable to crises as they are perilously close to being unable to finance imports in the near future.
C: An analysis of key systemic issues

20 Financing for development and the SDGs
Improving market access for developing countries to developed countries, particularly LDCs, is important, but is a limited financing strategy for countries trying to break out of commodity dependence. The Addis Ababa Action Agenda gives the example of fishery subsidies that encourage over-fishing globally, including in developing countries’ waters. Fisheries are important for both livelihoods and nutrition across the developing world,119 and the scale of global over-fishing makes this an issue of global importance. Progress towards eliminating all harmful subsidies would be welcome. However, LDCs already have tariff-free access for the vast majority of their exports – 90 per cent by value in 2014 for example120 – though UNCTAD estimates that non-tariff barriers are “substantial” on typical least developed country exports.121 The volatility and low value added of commodity exports explains why, even at the peak of the commodity boom, LDCs’ share of total global exports reached only 1.1 per cent.122
For developing countries to make use of trade to help finance their development, they need significant ‘policy space’ to tailor trade rules to support their industrial strategy, and to suit their own particular circumstances. Economies that have developed rapidly have historically made use of strategic ‘protectionist’ trade policies to support the growth of their industrial sector – which has been a key motor for rapid development in almost every country in the world – with liberalisation being undertaken when strategically sensible.123
In addition, as already noted, given limited tax bases, trade taxes are often an important source of revenue: for example UNCTAD estimates that trade taxes account for an average of 25 per cent of government revenue in sub-Saharan Africa.124 This is why developed country positions on trade negotiations, which normally see liberalisation on both sides as the key endpoint, are mistaken and are likely to reduce rather than increase trading opportunities, insofar as they damage developing countries’ opportunities for development. For example, UNCTAD estimated that, if Cape Verde were to liberalise tariffs in line with a trade agreement it was negotiating in 2011 with the EU, it would lead to a 16 per cent drop in overall government revenue.125
Unfortunately, existing trade rules often place significant limits on policy space, denying developing countries the policies that have proved successful in the past. For example, the WTO does not allow companies to apply subsidies linked to sourcing domestically, or on export performance. Meanwhile, the proliferation of bilateral trade and investment agreements restrict the use of procurement and competition policy to promote domestic industries, and the increasing power of investor-state dispute provisions in these treaties gives multinationals the power to challenge governments’ efforts to promote domestic industry. 126
Developing countries have, for the most part, resisted developed country efforts to use the WTO to further limit their policy space, but this is an ongoing issue, with the digital economy emerging as a key battleground. For example, the intergovernmental organisation of developing countries, the South Centre, has raised serious concerns about the United States’ WTO submission on e-commerce, many elements of which have received support from the EU and Japan. The submission can be seen as a major effort, driven by the interests of large technology companies, to force open markets in developing countries.127
Finally, many trade and investment treaties have been criticised for affecting developing countries’ policy choices in a broad set of areas that reach well beyond trade tariffs. As one analysis of trends in trade agreements put it, these include “regulatory harmonisation, investment and competition policy and intellectual property rights,”128 all of which are critical aspects of developing countries’ strategies.
International tax cooperation
The ineffectiveness of international tax cooperation efforts means that, globally, countries are encouraged to compete with each other, including in ways that erode the tax revenue of other countries. This is often called the ‘race to the bottom’, and adds to the problems of revenue losses caused by tax avoidance and tax evasion described in Section B.
Many countries are using harmful tax practices, including special deals with multinationals, which erode the tax base of other countries. Harmful tax practices can help multinational corporations avoid paying the official corporate income tax rate in the countries where they do business. These practices include providing ‘patent boxes’ and other generous tax incentives, often cemented through secret tax deals between governments and corporations.
Developing countries have also been encouraged to grant multinationals tax incentives that significantly erode the corporate income tax base, without commensurate benefits in terms of investment. As noted, ActionAid estimates that statutory corporate tax exemptions alone cost developing countries US$138 billion per year,129 while the evidence that these are important for attracting investment is weak.
Tax treaties between developed and developing countries may also reduce tax rates in developing countries without necessarily leading to increased investment. IMF researchers note, “one estimate, for instance, is that treaties with the Netherlands led to foregone revenue for developing countries of at least EUR 770 million in 2011.”130 An extensive review of the evidence of the impact of tax treaties found that, “evidence about positive effects of tax treaties on the volume of FDI is, at best, inconclusive.”131
C: An analysis of key systemic issues

Financing for development and the SDGs 21
D: Can the global economic governance system deliver?
There are an enormous variety of international institutions that create rules or set standards in the financial and economic sector, but coordination between them remains ad hoc. The United Nations Economic and Social Council (Ecosoc), established by the UN Charter132 in 1946, was intended to be the coordination mechanism for global economic institutions. It also has the power to convene conferences and submit conventions and other recommendations to the General Assembly. However, Ecosoc has not proved to be as powerful as its sister organisation, the Security Council, and most of the more powerful institutions under its mandate,133 including the IMF and World Bank, have in practice operated as autonomous agencies. In addition, there are a number of important bodies that fall outside the UN system, in particular the WTO.
The Financial Stability Board, also outside the UN system, brings together a number of other standard setting bodies.134 The G20 was upgraded to a heads of state meeting in 2009 to bring greater coordination to the global response to the crisis. However, despite an expanding work programme, it suffers from having no standing secretariat, meaning that each year its agenda is determined by the host country, and implementation falls to other existing agencies.
Given the major problems of the global economic, financial and monetary systems highlighted above, it is clear that this fragmented architecture makes coordinated and significant reform more difficult, which is why the UN’s commission of experts on reforms of the international and monetary system sensibly proposed the G20 be replaced by a Global Economic Coordination Council elected by all members of the UN.
The number of important economic governance institutions where all developing countries can participate on an equal footing is very limited. Universal membership and ‘one member one vote’ applies to many UN bodies, such as the United Nations Industrial Development Organisation (UNIDO), with policymaking bodies elected by the membership.135 However, a number of bodies, in particular the World Bank Group and the IMF, have a constituency system that limits developing countries’ representation. As Figure 10 below shows, developed countries maintain the vast majority of voting shares at these institutions, which is particularly problematic given that the impacts of any decisions made occur overwhelmingly in developing countries.
Figure 10: Share of voting rights at IFIs of developing countries, 2000 –2016 (%)136
105Addressing systemic issues
sistency in the design of policies for dealing with capital flows. The review of experiences showed that countries have relied on a combination of poli-cies in response to capital flows, including the use of macroprudential policies to contain risks from financial cycles. Further IMF staff analysis of how macroprudential policies can contribute to increas-ing resilience to large and volatile capital flows is expected to be discussed by the IMF Executive Board in June 2017.
4. Global economic governance The Addis Agenda welcomes recent reforms to the international financial architecture, and calls for additional measures to ensure that international mechanisms and institutions keep pace with the increased complexity of the world, and respond to the imperatives of sustainable development. Govern-ance reforms to ensure a more inclusive and repre-sentative international architecture are being imple-mented gradually but unevenly across international organizations.
4 .1 . International financial institutions
As reported in the 2016 Task Force report, the IMF quota and governance reforms agreed to in 2010 became effective in January 2016, doubling the
quota resources, increasing the aggregate voting rights of developing countries, as well as improving their representation on the IMF board. The World Bank Group and IMF are currently discussing fur-ther reforms to their governance and voting rights. In October 2015, the governors of the World Bank Group agreed to consider realignment of Interna-tional Bank for Reconstruction and Development and International Finance Corporation sharehold-ing alongside consideration of a capital increase in 2017. An IMF general review of quotas—its fif-teenth—had also been due for conclusion in the autumn of 2017; but, in October 2016, the gover-nors of the IMF agreed to reset the timetable for completing the review to the Spring Meetings of 2019 and no later than the Annual Meetings of 2019, subject to adoption by the Board of Governors, in order to provide adequate time to build the neces-sary broad consensus. For both institutions, the last agreed reforms occurred in 2010. At the IMF, final implementation of the 2010 reform is largely com-plete, while at the World Bank implementation is still underway, as Member States subscribe to the additional shares agreed to be created. As shown in figure 2, the uneven speed of take up of new shares at the World Bank has resulted in countries in devel-oped regions actually gaining voting rights. The IMF
Figure 2Share of voting rights at IFIs of countries in developing regions, 2000 –2016 (Percentage)
Source: United Nations Statistics Division database.
25
30
35
40
45
50
2000 2005 2010 2015 2016
IBRD vote share
IMF vote share
IFC vote share

22 Financing for development and the SDGs
Developing country governments are excluded almost entirely from a number of important institutions. For example, the OECD has taken on a major role in standard setting on international tax issues, but its 35 country membership contains only two developing countries: Turkey and Mexico, which are both upper-middle income countries.137 Developing countries have been encouraged to join the OECD’s Inclusive Framework, but this requires a membership fee and a commitment to implementing the Base Erosion and Profit Shifting (BEPS) standard, which was negotiated without the full participation of developing countries.
More worryingly, this skews decision-making on tax towards many of the countries that are intimately linked to the problems of tax avoidance and evasion. For example, the Financial Secrecy Index list contains 12 jurisdictions that are OECD members or territories linked to OECD members in its top 25.138 Similarly, the Financial Stability Board’s membership is comprised of G20 countries plus smaller countries that are problematic financial centres, including Switzerland, Singapore and the Netherlands.139 In addition, several important institutions including the International Accounting Standards Board and the credit ratings agencies are private bodies.
It is neither possible nor desirable for all issues to be decided at a global level, however there are several issues where the lack of global governance has major negative consequences for developing countries. For example, the international community has largely given up on efforts to help commodity producers stabilise their export income and capture a greater share of the global value chain. The collapse of the International Coffee Agreement in the mid-1980s led to producer countries’ share of total income from coffee sales plunging from around half to just 10 per cent, and it has not recovered since.140
Two issues stand out both for their importance, and because they have been integral to Financing for Development discussions: the need for an intergovernmental body on tax, and a sovereign debt workout mechanism. An intergovernmental body on tax to provide a platform for international tax cooperation was centrally important to negotiations in Addis Ababa in 2015, and was the main demand of the G77 group of developing countries, but a minority of developed nations blocked it.141
Political commitments were made to prevent debt crises or resolve them quickly where prevention failed at the three Financing for Development conferences in Monterrey, Doha and Addis, and important progress has been made at the UN on defining the scope of the task. These commitments include promoting responsible lending and borrowing, producing better data and assessments of debt and debt sustainability, and protecting developing countries against litigation by predatory vulture funds. In recent years, UN bodies have significantly stepped up efforts to prepare the ground for an effective and fair debt workout mechanism:
• In 2015, UNCTAD released its Roadmap and Guide for Sovereign Debt Workouts, which establishes principles for debt workouts and proposes a Debt Workout Institution.142
• In 2014, the UN General Assembly passed a Resolution that mandated an ad hoc committee to negotiate a multilateral legal framework for sovereign debt restructurings.143
• In 2015, the UN General Assembly adopted Basic Principles on Sovereign Debt Restructuring Processes,144 which built on principles defined earlier by UNCTAD. The Resolution also contains a mandate for a follow-up process.
Finally, public transparency is weak in many international financial institutions. One important initiative that would apply to both public and private actors is the Open Contracting Global Principles, which were developed by the Open Contracting Partnership in October 2013 in consultation with governments, the private sector and civil society organisations. In practical terms, transparency includes full disclosure of contracts and of pre-studies, bid documents and performance evaluations, among others. They correctly argue that the proactive disclosure of documents and information relating to public contracting, including public-private partnerships, is key to enabling “meaningful understanding, effective monitoring, efficient performance and accountability for outcomes”.145 The public arms of the World Bank Group have shown that a transparency policy based on the presumption of disclosure of all documents with limited exceptions can work.146
D: Can the global economic governance system deliver?

Financing for development and the SDGs 23
E: Conclusions and recommendations
It is clear from the above analysis that, from the perspective of national level policymakers in developing countries, different sources of financing are interlinked, and the use of each source is constrained by global economic issues and rules. Therefore the most useful frame of reference when thinking about reforms should be the national level: the key question is how to help developing countries adopt the policies that best suit their circumstances so they can chart their own paths to prosperity.
This recognition is at the heart of the Addis Ababa Action Agenda, which says that, “cohesive nationally owned sustainable development strategies, supported by integrated national financing frameworks, will be at the heart of our efforts.”147 It is also central to the means of implementation for the SDGs, which commits governments to “respect each country’s policy space and leadership to establish and implement policies for poverty eradication and sustainable development.”148
It is also clear that reforms will need to be ambitious both because of the scale of the issues identified above, and because of the high level of ambition of the SDGs.
Using the same structure as the paper, we will now summarise the key conclusions and suggest recommendations that are aimed at policymakers in developed countries, focusing on how they can support changes at the international level to enhance the policy space of developing countries, and change their own policies to improve opportunities for developing countries. Where the proposed reforms may have a medium-term time horizon, practical next steps have also been identified.
Private finance – supporting development strategies and reducing vulnerability
Domestic finance, both public and private, will continue to provide the lion’s share of investment, while foreign investment needs to be strategically managed to support this and ensure knowledge transfer. Ensuring that investment is directed to productive uses and aligned to a coherent national strategy is the key challenge for developing country policymakers. To support developing countries to pursue such strategies, in the short term, developed country policymakers could:
• Shift the focus of donor discussions towards supporting national development banks, and recognise the risks, limitations and opportunity costs of blended financing mechanisms.
• Commit to implementing open contracting principles in publicly controlled entities and support their adoption across the private sector, as a key step towards ensuring that foreign investors can be effectively held accountable.
We have seen in recent decades that developing countries have become deeply integrated into the global financial system: this makes them more vulnerable to crises caused by external factors than ever before. Supporting developing countries’ efforts to protect themselves from the volatility and crisis risks of international capital flows should be the primary focus of international discussions, while initiatives that involve increasing developing countries’ integration into the global financial system should be treated with caution. Important steps that developed countries could take to support this agenda include:
• Support developing countries’ use of capital controls and capital account regulation as a fundamental policy tool to protect countries from destabilising international capital movements, and agree to the removal of any obstacles to these important policies from all trade and investment agreements.
• Practical next steps would include funding a full review, led by experts from the global South, of trade agreements and investment treaties to identify all areas where they may limit developing countries’ ability to prevent and manage crises, regulate capital flows, protect human rights and ensure sustainable development. This could be funded as a contribution to the next Financing for Development forum by a single donor country, or a grouping, and overseen by a multi-stakeholder steering group.
• Support the idea that the next Financing for Development conference should focus on deeper reforms to help create a more stable global monetary and financial system. This could be kicked off by funding the UN to develop a full plan for how their proposals to issue new international reserve assets and allocate these to developing countries could be implemented.
• Recognise that proposals to further integrate developing countries into global financial markets, such as through shifting institutional investors’ funding towards infrastructure, come with significant risks attached, and that private financing options may entail risks for the public purse.
• Practical next steps could begin by persuading the World Bank Group to refrain from promoting public-private partnerships, and instead support developing countries to objectively compare the public borrowing option, or other alternatives, to the true costs and benefits of a public-private partnership (PPP) over the lifetime of a project, taking into account the full fiscal implications over the long term and the risk comparison of each option.

24 Financing for development and the SDGs
Public finance – filling the finance gap with stable, predictable funding
The main source of finance to help developing countries increase and improve basic services, social protection, environmental protection, infrastructure and other vital public investments will always be domestic tax revenues, which is why it is critically important to stop the tax avoidance, evasion and tax competition that is undermining tax collection.
• Longer-term work towards a fairer international tax system could be kicked off by undertaking a rigorous study, jointly with developing countries, of the merits, risks and feasibility of more fundamental alternatives to the current international tax system, such as unitary taxation, with special attention paid to the likely impact of these alternatives on developing countries.
• In the shorter term, the EU currently has the chance to be a leading player in transparency to prevent tax avoidance and evasion by:
– Implementing effectively its commitment to publicly accessible registries of the beneficial owners of companies, in the context of the revised Anti-Money Laundering Directive, and extending this to all trusts and similar legal structures in the future.
– Adopting full country by country reporting for all large companies, and ensuring that this information is publicly available in an open data format that is machine readable and centralised in a public registry.
Low-income countries in particular face severe domestic public financing shortfalls owing to low tax bases, and would benefit if the international public finance they received were increased to promised levels, was not tied to donor priorities, and became more predictable. Developed countries should:
• Set out clear timetables for meeting their 0.7 per cent Overseas Development Assistance commitment, with sufficient resources directed to LDCs and lower-middle income countries where public financing needs are greater.
• Push the OECD DAC to undertake a process leading to the untying of all Overseas Development Assistance both in policy and in practice, and calling for all revisions to the rules on Overseas Development Assistance to be driven by development effectiveness principles.
• Agree to stop counting in-donor costs against the 0.7 per cent commitment, and seek to ensure as much Overseas Development Assistance as possible can be programmed by developing countries to support their priorities, using Country Programmable Aid as a benchmark.
• Meet climate financing commitments by providing public climate finance that is not double counted as Overseas Development Assistance, but instead is adequate, new and additional.
• Support demand-driven capacity development, including by pledging the finance necessary to support developing country capacity building plans, in a way that is fully untied, predictable, coordinated and channeled through a host country managed fund.
• Longer-term efforts to increase the scale of public fiscal transfers to developing countries could be helped by reinvigorating plans for the mobilisation of innovative public finance to contribute to filling the public financing gap, including through the introduction of a financial transactions tax, with revenues committed to financing international sustainable development.
E: Conclusions and recommendations

Financing for development and the SDGs 25
Improving global rules to allow more policy space for developing countries
It is clear that a host of developed country economic policies – including trade, tax and monetary policies – have major impacts on financing for development: the ‘policy coherence for development’ (PCD) agenda remains as relevant as ever. This agenda means ensuring that all government policies align with development objectives, including the SDGs. Policy coherence for development is also in the interests of developed countries who would benefit from a more prosperous, stable world. Important steps that developed countries could make include:
• Recognise that existing rules and agreements often undermine policy coherence for development.
• Practical next steps could include funding a full review, led by experts from the global South, of all intellectual property rights regimes’ impacts on developing countries through FTAss, to identify any adverse impacts on public health, the environment and technology development, among other areas. This could be funded as a contribution to the next Financing for Development forum by a single donor country, or a grouping, and overseen by a multi-stakeholder steering group.
• Move to a different approach to negotiating bilateral or regional treaties with developing countries. For example, if negotiating or renegotiating tax treaties with developing countries, governments could:
– Conduct and publish a comprehensive impact assessment to analyse the impact on the developing country and ensure that negative impacts are avoided.
– Fully respect source country rights to tax the profits generated by business activities in their countries, and stop reducing withholding tax rates.
– Ensure full transparency around every step of treaty negotiations.
• Change domestic laws and policies to support policy coherence for development, for example by following the lead of the UK, Ireland, France and Belgium in enacting laws to stop vulture funds from undermining debt restructuring processes.
Reforming global economic governance to increase the influence of developing countries
The system of global economic governance is not working well enough to deliver the SDGs, in large part because developing countries often have a limited role in, or are excluded from, decision-making. Supporting the G77 to lead a push for major reforms before or at the next UN Financing for Development conference will be critically important. Reforms that are of paramount importance are:
• The establishment of an intergovernmental tax body under the auspices of the UN with the aim of ensuring developing countries can participate equally in the global reform of international tax rules. This should become the main forum for international cooperation in tax matters and related transparency issues. The tax body should be adequately funded and allow full access to observers, including civil society and parliamentarians. One of the key priorities of the commission should be to negotiate and adopt an international convention on tax cooperation and related transparency.
• The creation of a Debt Workout Institution within the UN system, independent of creditors and debtors, to facilitate debt restructuring processes.
• The Reform of voting at the International Financial Institutions, primarily extending the use of double majority voting at the IMF – requiring relevant majorities of both votes and countries for all decisions.
• Practical next steps could include implementing genuine equality in voting shares between borrowing and non-borrowing countries at the World Bank Group in the next round of reform, as a first step towards more significant reform.
• Setting up a process to establish a Global Economic Coordination Council at the UN to assess developments and provide leadership on economic issues while taking into account social, human rights and ecological factors.
• Single countries can also contribute to progress, for example by:
– Supporting UN leadership on improving debt resolution by mobilising long term funding for the UN agencies that are undertaking the crucial work in this area.
– Mobilising independent, long term, predictable funding to support developing countries to develop their own proposals for global governance reform.
E: Conclusions and recommendations

26 Financing for development and the SDGs
1 http://www.undp.org/content/undp/en/home/sustainable-develop-ment-goals.html
2 United Nations, “The Sustainable Development Goals Report 2016” (New York: United Nations, 2016), https://unstats.un.org/sdgs/report/2016/The%20Sustainable%20Development%20Goals%20Report%202016.pdf.
3 ILO, “World Employment and Social Outlook 2016: Trends for Youth,” Report, 2016, vii, http://www.ilo.org/global/research/global-reports/youth/2016/WCMS_513739/lang--en/index.htm.decent work opportu-nities in both developed and developing economies as well as gender inequalities and migration trends among young people.”,”URL”:”http://www.ilo.org/global/research/global-reports/youth/2016/WCMS_513739/lang--en/index.htm”,”shortTitle”:”World Employment and Social Outlook 2016”,”language”:”en”,”author”:[{“family”:”ILO”,”given”:””}],”issued”:{“-date-parts”:[[“2016”]]},”accessed”:{“date-parts”:[[“2017”,7,24]]}},”locat-or”:”vii”}],”schema”:”https://github.com/citation-style-language/schema/raw/master/csl-citation.json”}
4 Era Dabla-Norris et al., “Causes and Consequences of Income Inequality: A Global Perspective” (Washington D.C.: IMF, 2015), 13.”event-place”:”Washington D.C.”,”author”:[{“family”:”Dabla-Norris”,”-given”:”Era”},{“family”:”Kochhar”,”given”:”Kalpana”},{“family”:”Sup-haphiphat”,”given”:”Nujin”},{“family”:”Frantisek”,”given”:”Ricka”},{“fam-ily”:”Evridiki”,”given”:”Tsounta”}],”issued”:{“date-parts”:[[“2015”]]}},”lo-cator”:”13”}],”schema”:”https://github.com/citation-style-language/schema/raw/master/csl-citation.json”}
5 Jesse Griffiths, “The State of Finance for Developing Countries 2014: An Assessment of the Scale of All Sources of Finance Available to Develop-ing Countries,” December 2014, 13, http://eurodad.org/files/pdf/1546315-the-state-of-finance-for-developing-countries-2014-1450105202.pdf.
6 Griffiths, 13.7 United Nations, “Monterrey Consensus on Financing for Development,”
2002, http://www.un.org/esa/ffd/monterrey/MonterreyConsensus.pdf.8 See for example, Allen and Gale, 1996, Boot and Thakor, 1997, Lin 2007,
Banerjee, 2009.9 Allen, F. and D. Gale (1997) ‘Financial Markets, Intermediaries, and Inter-
temporal Smoothing’, Journal of Political Economy 105 pp 523-4610 Boot, A. and A. Thakor (1997) ‘Financial System Architecture’, Review of
Financial Studies 10, pp 693-73311 José de Luna-Martínez and Carlos Vicente, “Global Survey of Develop-
ment Banks,” Policy Research Working Paper (World Bank, 2012), http://documents.worldbank.org/curated/en/313731468154461012/pdf/WPS5969.pdf.
12 de Luna-Martínez and Vicente, 2.13 María José Romero, “Public Development Banks: Towards a Better
Model,” April 2017, 6, http://eurodad.org/files/pdf/1546743-public-devel-opment-banks-towards-a-better-model.pdf.
14 World Bank Group, “Global Financial Development Report 2015/2016 : Long-Term Finance,” 2015, 6.
15 http://www.un.org/esa/ffd/wp-content/uploads/2014/11/13-Novem-ber_PrivateFinance.pdf
16 Kevin Gallagher and William Kring, “Remapping Global Economic Gov-ernance: Rising Powers and Global Development Finance,” 2017, https://www.bu.edu/gdp/files/2017/10/Gallagher.Kring_.Final_.11-17.pdf.
17 World Bank Group, “Global Financial Development Report 2015/2016 : Long-Term Finance,” 6.
18 de Luna-Martínez and Vicente, “Global Survey of Development Banks,” 2.19 Heiko Hesse and Martin Čihák, “Cooperative Banks and Financial Stabili-
ty,” IMF Working Paper, no. WP/07/2 (2007): 3.20 Tatiana Didier and Sergio Schmukler, “The Financing and Growth of Firms
in China and India. Evidence from Capital Markets” (Washington DC: World Bank Development Research Group, 2013), 41, http://www-wds.world-bank.org/external/default/WDSContentServer/IW3P/IB/2013/04/08/000158349_20130408085153/Rendered/PDF/wps6401.pdf.
21 UNCTAD, “World Investment Report 2017. Investment and the Digital Economy” (Geneva: UNCTAD, 2017), 30, http://unctad.org/en/Publication-sLibrary/wir2017_en.pdf.
22 UNTT Working Group on Sustainable Development Financing, “Challenges in Raising Private Sector Resources for Financing Sustainable Develop-ment” (United Nations, 2013), 19, https://sustainabledevelopment.un.org/content/documents/2106Chapter%203-challenges%20in%20raising%20private%20sector%20resources.pdf.
23 UNTT Working Group on Sustainable Development Financing, “Challenges in Raising Private Sector Resources for Financing Sustainable Develop-ment.”
24 UNTT Working Group on Sustainable Development Financing, 20.
25 World Bank, “Global Financial Development Report 2013: Re-thinking the Role of the State in Finance,” 2012, http://siteresources.worldbank.org/EXTGLOBALFINREPORT/Re-sources/8816096-1346865433023/8827078-1346865457422/GDF_2013_Report.pdf.
26 World Bank Group, “Global Financial Development Report 2015/2016 : Long-Term Finance,” 32.
27 Griffiths, “The State of Finance for Developing Countries 2014: An As-sessment of the Scale of All Sources of Finance Available to Developing Countries,” 26.
28 IATF, “Financing for Development: Progress and Prospects. Report of the Inter-Agency Task Force on Financing for Development 2017” (New York: United Nations, 2017), 52–53, https://developmentfinance.un.org/sites/developmentfinance.un.org/files/Report_IATF-2017.pdf.
29 Griffiths, “The State of Finance for Developing Countries 2014: An As-sessment of the Scale of All Sources of Finance Available to Developing Countries,” 20.
30 United Nations, “World Economic Situation and Prospects 2017” (New York: United Nations, 2017), https://www.un.org/development/desa/dpad/wp-content/uploads/sites/45/publication/2017wesp_full_en.pdf.
31 IATF, “Financing for Development: Progress and Prospects. Report of the Inter-Agency Task Force on Financing for Development 2017,” 53.
32 United Nations, “World Economic Situation and Prospects 2017.”33 IATF, “Financing for Development: Progress and Prospects. Report of the
Inter-Agency Task Force on Financing for Development 2017,” 53.34 IATF, 52.35 Yılmaz Akyüz and Vicente Paolo Yu III, “The Financial Crisis and the Global
South: Impact and Prospects” (South Centre, 2017), 15, https://www.southcentre.int/wp-content/uploads/2017/05/RP76_The-Financial-Cri-sis-and-the-Global-South-Impact-and-Prospects_EN.pdf.
36 IATF, 54.37 World Bank Group, “International Debt Statistics 2016,” 2016.38 World Bank Group, “International Debt Statistics 2018” (Washington D.C.,
2017), 5, http://databank.worldbank.org/data/download/site-content/IDS-2018.pdf.
39 World Bank Group, 5.40 Jesse Griffiths and Konstantinos Todoulos, “Conditionally Yours. An Anal-
ysis of the Policy Conditions Attached to IMF Loans” (Brussels: Eurodad, 2014), http://eurodad.org/files/pdf/533bd19646b20.pdf.
41 Paul Blustein, The Chastening: Inside The Crisis That Rocked The Global Financial System And Humbled The IMF (Cambridge, MA: Perseus, 2003).
42 Mathieu Vervynckt, “The-Responsible-Finance-Standards-of-Multilater-al-Institutions-State-of-Play” (Eurodad, September 2016), http://www.eu-rodad.org/files/pdf/1546638-the-responsible-finance-standards-of-mul-tilateral-institutions-state-of-play-.pdf.
43 Griffiths, “The State of Finance for Developing Countries 2014: An As-sessment of the Scale of All Sources of Finance Available to Developing Countries,” 14.
44 Timothy Besley and Torsten Persson, “Why Do Developing Countries Tax So Little?,” Journal of Economic Perspectives 28, no. 4 (November 2014): 102, https://doi.org/10.1257/jep.28.4.99.
45 Besley and Persson, 100.46 Besley and Persson, 100.47 M. Shahe Emran and Joseph E. Stiglitz, “On Selective Indirect Tax Reform
in Developing Countries,” Journal of Public Economics 89, no. 4 (2005): 599–623.
48 Emran and Stiglitz.49 Besley and Persson, “Why Do Developing Countries Tax So Little?”50 “Report of the High Level Panel on Illicit Financial Flows from Africa” (AU/
ECA Conference of Ministers of Finance, Planning and Economic Develop-ment, 2015), 13, https://www.uneca.org/sites/default/files/Publication-Files/iff_main_report_26feb_en.pdf.
51 UNCTAD, “World Investment Report 2015” (Geneva: UNCTAD, 2015), 200, http://unctad.org/en/PublicationsLibrary/wir2015_en.pdf.
52 Gabriel Zucman, “Taxing across Borders: Tracking Personal Wealth and Corporate Profits,” Journal of Economic Perspectives 28, no. 4 (November 2014): 121–48, https://doi.org/10.1257/jep.28.4.121.
53 Ernesto Crivelli, Ruud de Mooij, and Michael Keen, “Base Erosion, Profit Shifting and Developing Countries” (IMF, 2015), https://www.imf.org/en/Publications/WP/Issues/2016/12/31/Base-Erosion-Profit-Shift-ing-and-Developing-Countries-42973.
54 UNCTAD, “World Investment Report 2015,” 182.55 ActionAid International. (2013). “Give us a break: how big companies are
getting tax free deals.”(Johannesburg, ActionAid International.)
References

Financing for development and the SDGs 27
56 IMF et al., “Options for Low Income Countries’ Effective and Efficient Use of Tax Incentives for Investment,” 2015, 3, https://www.imf.org/external/np/g20/pdf/101515.pdf.
57 Tinda Kidiane, “The Quest for Non-Resource-Based FDI : Do Taxes Matter?” (IMF, 2014), 3, http://www.imf.org/en/Publications/WP/Is-sues/2016/12/31/The-Quest-for-Non-Resource-Based-FDI-Do-Taxes-Matter-41281.
58 IATF, “Financing for Development: Progress and Prospects. Report of the Inter-Agency Task Force on Financing for Development 2017,” 12.
59 Sophia Chong and Emily Poole, “Financing Infrastructure: A Spectrum of Country Approaches,” 70, accessed April 3, 2017, https://www.rba.gov.au/publications/bulletin/2013/sep/pdf/bu-0913-8.pdf.
60 IATF, “Financing for Development: Progress and Prospects. Report of the Inter-Agency Task Force on Financing for Development 2017,” 72.
61 María José Romero, “What Lies beneath? A Critical Assessment of PPPs and Their Impact on Sustainable Development,” April 2015, http://euro-dad.org/files/pdf/1546450-what-lies-beneath-a-critical-assessment-of-ppps-and-their-impact-on-sustainable-development-1450105297.pdf.
62 Bodo Ellmers, “The Evolving Nature of Developing Country Debt and Solutions for Change,” July 2016, http://eurodad.org/files/pdf/1546625-the-evolving-nature-of-developing-country-debt-and-solutions-for-change-1474374793.pdf.
63 Ellmers.64 United Nations, “World Economic Situation and Prospects 2017,” 101–2.65 https://www.imf.org/en/News/Articles/2015/09/28/04/53/sores011416b 66 All figures in this paragraph taken from: http://www.oecd.org/dac/devel-
opment-aid-rises-again-in-2016-but-flows-to-poorest-countries-dip.htm [Accessed 31/10/17 at 10:55 CET]
67 OECD DAC, “Development Aid Rises Again in 2016” (Paris, 2017), 1, http://www.oecd.org/dac/financing-sustainable-development/development-fi-nance-data/ODA-2016-detailed-summary.pdf.
68 CPA removes from ODA items that are unpredictable by nature, entail no cross-border flows, do not form part of cooperation agreements between governments, or are not country programmable by the donor.
69 http://stats.oecd.org/Index.aspx?DataSetCode=CPA [accessed 31/10/17 at 19.23 CET]
70 The Copenhagen Accord recommits to making climate finance “new and additional” (paragraph 97) but does not explicitly link this to the US$100 billion commitment.
71 OECD and Climate Finance Initiative, “Climate Finance in 2013-14 and the USD 100 Billion Goal” (Paris, 2015), 22, http://www.keepeek.com/Digi-tal-Asset-Management/oecd/environment/climate-finance-in-2013-14-and-the-usd-100-billion-goal_9789264249424-en.
72 Concord, “Global Financial Flows, Aid and Development,” AidWhatch (Brussels, 2012), 34, http://eurodad.org/files/integration/2013/03/2013_AW-Briefing-paper_Global-financial-flows-aid-and-development1.pdf.
73 United Nations, “Addis Ababa Action Agenda of the Third International Conference on Financing for Development,” Paragraph 58.
74 Polly Meeks, “Unravelling Tied Aid” (Brussels: Eurodad, 2017), 1, http://eurodad.org/files/pdf/1546810-unravelling-tied-aid.pdf.
75 Meeks, “Unravelling Tied Aid,” 2.76 Clay, Edward J, Matthew Geddes & Luisa Natali (2009): Untying Aid: Is it
working? p. 2777 Jesse Griffiths, “Financing for Development. Current Issues for Interna-
tional Development Cooperation” (Brussels: Eurodad, 2017), http://www.eurodad.org/files/pdf/1546842-financing-for-development-current-is-sues-for-international-development-cooperation-.pdf.
78 Pereira, “Blended Finance: What It Is, How It Works and How It Is Used,” 28.
79 Javier Pereira, “Blended Finance: What It Is, How It Works and How It Is Used,” February 2017, http://eurodad.org/files/pdf/58a1e294657ab.pdf.
80 Polly Meeks, “Mixed Messages: The Rhetoric and the Reality of Using Blended Finance to ‘Leave No-One Behind’” (Brussels: Eurodad, 2017), http://eurodad.org/files/pdf/1546844-mixed-messages-the-rheto-ric-and-the-reality-of-using-blended-finance-to-leave-no-one-be-hind--1511464491.pdf.
81 United Nations, “Trends and Progress in International Development Cooperation. Report of the Secretary-General” (New York, 2014), 7, http://www.un.org/ga/search/view_doc.asp?symbol=E/2014/77.
82 OECD/UNDP, “Making Development Co-Operation More Effective. 2016 Progress Report” (Paris: OECD, 2016), http://www.keepeek.com/Digi-tal-Asset-Management/oecd/development/making-development-co-op-eration-more-effective_9789264266261-en.
83 “The Accra Agenda for Action,” para 14, accessed December 21, 2017,
http://www.oecd.org/dac/effectiveness/34428351.pdf.84 Romilly Greenhill, “Real Aid 2: Making Technical Assistance Work” (Ac-
tionAid International, 2006), www.actionaid.org.uk/doc_lib/real_aid2.pd.85 OECD DAC, “Development Co-Operation Report 2005” (Paris: OECD, 2006),
http://www.oecd-ilibrary.org/docserver/download/4306011e.pdf?expires=1513875479&id=id&accname=guest&checksum=F3C33CB4BD2AFD-EC7D789100B05E4035.
86 IBON International and 11.11.11, “Reality of Aid 2016 - Technical Coopera-tion as an Aid Modality: Demand-Led or Donor-Driven?,” 2016, 12, http://eurodad.org/files/pdf/1546691-reality-of-aid-2016-report-technical-co-operation-as-an-aid-modality-demand-led-or-donor-driven-.pdf.
87 IBON International and 11.11.11, 5.88 Peter Clark, Natalia Tamirisa, and Shang-Jin Wei, A New Look at Ex-
change Rate Volatility and Trade Flows (Washington D.C.: IMF, 2004).89 IMF WEO database https://www.imf.org/external/pubs/ft/weo/2017/02/
weodata/index.aspx 90 https://www.imf.org/~/media/Files/Publications/PP/2017/2017-exter-
nal-sector-report.ashx91 Yilmaz Akyüz, “The Commodity- Finance Nexus. Twin Boom and Double
Whammy” (Geneva: The South Centre, 2017), 3, https://www.southcentre.int/wp-content/uploads/2017/10/RP80_The-Commodity-Finance-Nexus-Twin-Boom-and-Double-Whammy_EN.pdf.
92 Financial Stability Board, “Implementation and Effects of the G20 Fi-nancial Regulatory Reforms 3 July 2017 3rd Annual Report” (FSB, 2017), http://www.fsb.org/wp-content/uploads/P030717-2.pdf.
93 Financial Stability Board, 27.94 Financial Stability Board, 33.95 Financial Stability Board, “Global Shadow Banking Monitoring Report
2016” (FSB, 2017), 3, http://www.fsb.org/wp-content/uploads/glob-al-shadow-banking-monitoring-report-2016.pdf.
96 Financial Stability Board, “Implementation and Effects of the G20 Finan-cial Regulatory Reforms 3 July 2017 3rd Annual Report.”
97 Mr Luc Laeven, Lev Ratnovski, and Hui Tong, Bank Size and Systemic Risk, 14 (International Monetary Fund, 2014), 7.
98 Laeven, Ratnovski, and Tong, 8.99 IATF, “Financing for Development: Progress and Prospects. Report of the
Inter-Agency Task Force on Financing for Development 2017,” 90.100 Financial Stability Board, “Implementation and Effects of the G20 Finan-
cial Regulatory Reforms 3 July 2017 3rd Annual Report,” 34.101 Akyüz and Yu III, “The Financial Crisis and the Global South: Impact and
Prospects,” 17.102 United Nations, “World Economic Situation and Prospects 2017,” 74.103 Griffiths, “The State of Finance for Developing Countries 2014: An As-
sessment of the Scale of All Sources of Finance Available to Developing Countries,” 18.
104 http://www.brettonwoodsproject.org/2012/12/art-571589/ 105 UNDESA, “World Economic and Social Survey 2012. In Search of New
Development Finance,” 2012, http://www.un.org/en/development/desa/policy/wess/wess_current/2012wess.pdf.
106 Udaibir S. Das, Michael G. Papaioannou and Christoph Trebesch (2012).“Sovereign Debt Restructurings 1950–2010: Literature Survey, Data, andStylized Facts”, pp. 30-36.107 World Bank Group, “Global Economic Prospects. A Fragile Recovery”
(Washington D.C.: World Bank Group, 2017), 49, https://openknowledge.worldbank.org/bitstream/handle/10986/26800/9781464810244.pdf.
108 Erlassjahr.de, “Global Sovereign Indebtedness Monitor 2017,” 2017, http://erlassjahr.de/wordpress/wp-content/uploads/2017/03/Global-Sover-eign-Indebtedness-Monitor-2017.pdf.
109 United Nations, “World Economic Situation and Prospects 2017,” 101–2.110 IATF, “Financing for Development: Progress and Prospects. Report of the
Inter-Agency Task Force on Financing for Development 2017,” 90.111 Financial Stability Board, “Implementation and Effects of the G20 Finan-
cial Regulatory Reforms 3 July 2017 3rd Annual Report,” 39.112 IATF, “Financing for Development: Progress and Prospects. Report of the
Inter-Agency Task Force on Financing for Development 2017,” 7.113 IATF, IMF summarised on p8.114 United Nations, “Addis Ababa Action Agenda of the Third International
Conference on Financing for Development” (Addis Ababa, 2015), 91.115 IATF, “Financing for Development: Progress and Prospects. Report of the
Inter-Agency Task Force on Financing for Development 2017,” 20–21.116 Akyüz and Yu III, “The Financial Crisis and the Global South: Impact and
Prospects,” 18.117 For a good summary of the macroeconomic impacts of commodity price
volatility, see: https://www.coc.org/rbw/macroeconomic-impacts-com-
References

28 Financing for development and the SDGs
modity-price-volatility-g20-report-july-2012 118 IMF, “Macroeconomic Developments and Prospects in Low-Income Devel-
oping Countries - 2016” (IMF, 2017), http://www.imf.org/en/Publications/Policy-Papers/Issues/2017/01/13/PP5086-Macroeconomic-Develop-ments-and-Prospects-in-Low-Income-Developing-Countries-2016.
119 S Bahety and J Mukiibi, “WTO Fisheries Subsidies Negotiations: Main Issues and Interests of Least Developed Countries” (Geneva: CUTS Inter-national), accessed November 19, 2017, http://unctad.org/meetings/en/Contribution/ditc-ted-21032017-OceansForum-CUTS.pdf.
120 UNCTAD, “Improving Market Access for the Least Developd Countries in the 2030 Agenda for Sustainable Development,” Post-2015 Policy Brief (Geneva, 2015), 2, http://unctad.org/en/PublicationsLibrary/press-pb2015d11_en.pdf.
121 UNCTAD, 3.122 UNCTAD, 2.123 Ha Joon Chang, Kicking Away the Ladder: Development Strategy in His-
torical Perspective (Anthem, 2002).124 UNCTAD Secretariat, 2014. ‘ The Role of Trade in Financing for Sustain-
able Development’ UNCTAD Discussion Paper.125 UNCTAD. 2011. ‘Who is Benefiting from Trade Liberalization in Cape
Verde? A Gender Perspective’ UNCTAD/OSG/2011/2. 126 ActionAid, “What a Way to Make a Living. Using Industrial Policy to Create
More and Better Jobs” (ActionAid International, 2016), 25, http://eurodad.org/files/pdf/56fbe7bcd9a34.pdf.
127 The South Centre, “The High Stakes in MC11 for Developing Countries’ Fu-ture Development Prospects” (Geneva, 2017), https://www.southcentre.int/wp-content/uploads/2017/10/IN_High-Stakes-in-MC11-30-Oct-2017_EN-1.pdf.
128 Tessa Khan, “Unfair Trade? Preferential Trade Agreements, Human Rights and Inequalities,” Development 57, no. 3–4 (2014): 423–32.equality and the fulfillment of human rights of the recent proliferation of preferential trade agreements (PTAs
129 ActionAid International. (2013). “Give us a break: how big companies are getting tax free deals.”(Johannesburg, ActionAid International.)
130 IMF, “Spillovers in International Corporate Taxation” (Washington D.C.: IMF, 2014), 27, https://www.imf.org/external/np/pp/eng/2014/050914.pdf.
131 Francis Weyzig, “Analysing Effects of Dutch Corporate Tax Policy on Developing Countries” (Ministry of Foreign Affairs of the Netherlands, 2013), 63, https://www.government.nl/documents/reports/2013/11/14/iob-study-evaluation-issues-in-financing-for-development-analysing-ef-
fects-of-dutch-corporate-tax-policy-on-developing-countries.132 http://www.un.org/en/sections/un-charter/chapter-x/index.html See
Chapter X133 An Ecosoc organogram is available here: http://www.un.org/en/ecosoc/
about/pdf/ecosoc_chart.pdf 134 http://www.fsb.org/about/fsb-members/#standard 135 http://www.unido.org/who-we-are/structure.html 136 https://www.scribd.com/document/349166136/Report-Financing-for-De-
velopment-IATF-2017137 http://www.oecd.org/about/membersandpartners/list-oecd-member-
countries.htm 138 Switzerland, USA, Cayman Islands (UK), Luxembourg, Germany, Japan,
UK, Jersey (UK), Guernsey (UK), Turkey, BVI (UK), Austria http://www.financialsecrecyindex.com/introduction/fsi-2015-results
139 http://www.fsb.org/about/fsb-members/ 140 UNECA, “Making the Most of Africa’s Commodities: Industrializing for
Growth, Jobs and Economic Transformation,” 2013, 89, https://www.une-ca.org/sites/default/files/PublicationFiles/unera_report_eng_final_web.pdf.
141 https://www.theguardian.com/global-development/2015/jul/16/out-come-document-addis-ababa-ffd3-financing-for-development
142 UNCTAD, “Sovereign Debt Workouts: Going Forward Roadmap and Guide”, (Geneva: UNCTAD, 2015)
143 United Nations General Assembly, Towards the establishment of a multilateral legal framework for sovereign debt restructuring processes, A/68/304, (17 September 2014)
144 United Nations General Assembly, Basic Principles on Sovereign Debt Restructuring Processes, A/69/319, (29 September 2015)
145 Open Contracting website. See: https://www.open-contracting.org/get-started/global-principles/
146 World Bank, “Toward Greater Transparency through Access to Informa-tion. The World Bank’s Disclosure Policy.” (Washington D.C.: World Bank, 2009), http://documents.worldbank.org/curated/en/241111468161347673/pdf/511890BR0REVIS101Official0Use0only1.pdf.
147 United Nations, “Addis Ababa Action Agenda of the Third International Conference on Financing for Development,” 5.
148 UN General Assembly, “Transforming Our World: The 2030 Agenda for Sustainable Development,” Resolution adopted by the General Assembly on 25 September 2015 (New York, 2015), Target 17.5, http://www.un.org/ga/search/view_doc.asp?symbol=A/RES/70/1&Lang=E.
References

Financing for development and the SDGs 29
Eurodad
The European Network on Debt and Development (Eurodad) is a network of 46 civil society organisations (CSOs) from 19 European countries, which works for transformative yet specific changes to global and European policies, institutions, rules and structures to ensure a democratically controlled, environmentally sustainable financial and economic system that works to eradicate poverty and ensure human rights for all.
www.eurodad.org

ContactEurodadRue d’Edimbourg 18-261050 BrusselsBelgium
Tel: +32 (0) 2 894 4640
www.eurodad.org
facebook.com/Eurodadtwitter.com/eurodad