Embed Size (px)
Citation preview

Briefing
Policy Department D - Budgetary AffairsAuthor: Alexandre MathisEuropean ParliamentPE 490.701
EN
Financing public expenditure:some key figures at EU and national levels
The Member States' structure of revenue is stable over time and their sources of revenue are diversified.Moreover, the size of the Member States' budget is generally increasing.
Conversely, the financing structure of the European Union has changed over time and the sources ofrevenue are not diversified. The EU budget size is levelling off.
Very small in size compared to national budgets, the EU budget is an investment budget with a strongleverage effect, i.e. one euro spent from the EU budget generates more than one euro in investment.
Today, around 83% of the total EU revenue comes from two resources which are, in fact, financialtransfers from national budgets (GNI- and VAT-based resources) and cannot be seen as true ownresources for the EU as defined in the Treaty. In particular, the VAT-based resource, contrary to its name, isnot levied on the final consumer but collected on a Member State statistically computed VAT base.
In addition, specific arrangements granted to some Member States to reduce their contributions increasethe inconsistency among Member States and the complexity of the system. Therefore, the currentsystem to finance the EU is difficult to understand for most EU citizens.
1 Trend on revenues: an increase for the Member States, a levelling for the EU
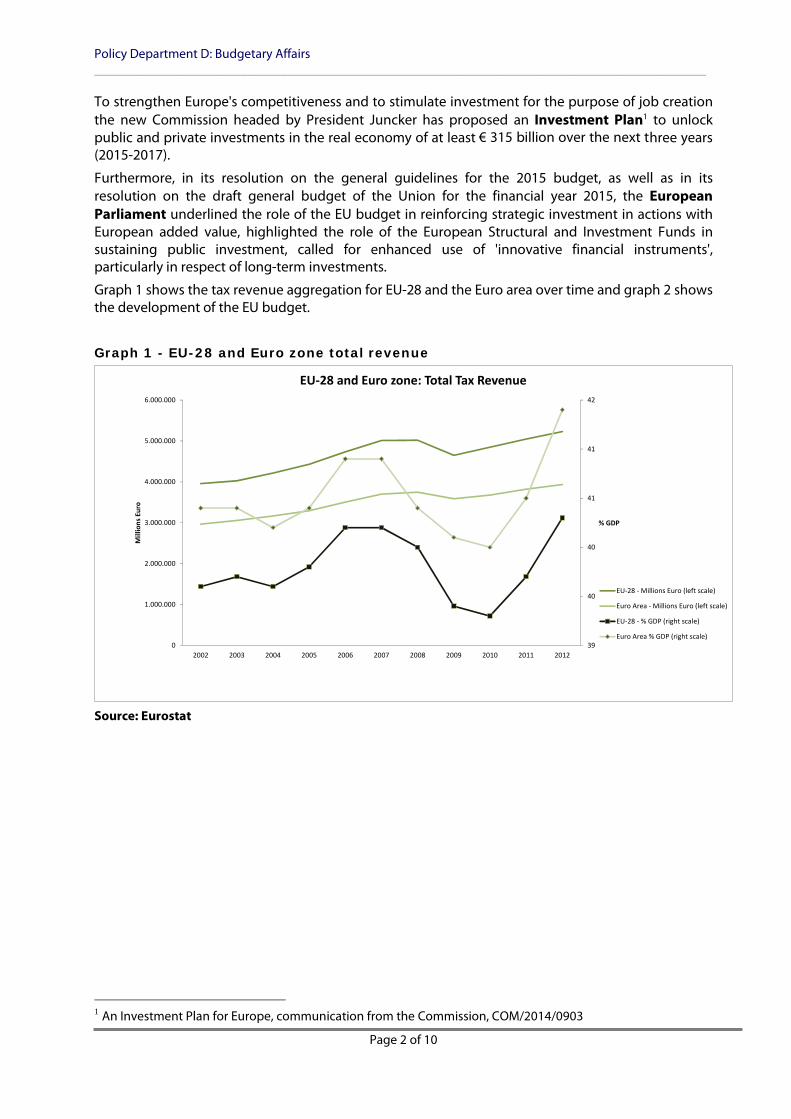
Over time, revenues to finance national budgets or the EU budget display a different picture.Excluding the 2008 fall which result from the financial crisis, tax revenues to finance national budgetsare increasing. The last two years show a sharp increase. However, the EU revenues exhibit a flatdevelopment.
Moreover, the size cannot be compared: around 40% of GDP for the Member States and around1% for the EU budget.
However, the difference is not only coming from the size of the budgets but also from the particularnature of the EU budget.
The EU budget is an investment budget with a strong leverage effect. The EU budget pools theresources and creates economies of scale. The 28 national budgets and the European budget (the29 one) are complement each other.
The EU budget finances actions that Member States can fund more effectively by working together.Moreover, the EU budget funds investment projects that otherwise would not be realised.
Actually, 94 % of it goes back to the Member States and European citizens through EU policies andprogrammes, and therefore the EU budget is a tool to boost investment, growth and jobs in Europe.
Policy Department D: Budgetary Affairs____________________________________________________________________________________________
Page 2 of 10
To strengthen Europe's competitiveness and to stimulate investment for the purpose of job creationthe new Commission headed by President Juncker has proposed an Investment Plan1 to unlockpublic and private investments in the real economy of at least € 315 billion over the next three years(2015-2017).
Furthermore, in its resolution on the general guidelines for the 2015 budget, as well as in itsresolution on the draft general budget of the Union for the financial year 2015, the EuropeanParliament underlined the role of the EU budget in reinforcing strategic investment in actions withEuropean added value, highlighted the role of the European Structural and Investment Funds insustaining public investment, called for enhanced use of 'innovative financial instruments',particularly in respect of long-term investments.
Graph 1 shows the tax revenue aggregation for EU-28 and the Euro area over time and graph 2 showsthe development of the EU budget.
Graph 1 - EU-28 and Euro zone total revenue
39
40
40
41
41
42
0
1.000.000
2.000.000
3.000.000
4.000.000
5.000.000
6.000.000
2002 2003 2004 2005 2006 2007 2008 2009 2010 2011 2012
% GDP
Mill
ions
Eur
o
EU-28 and Euro zone: Total Tax Revenue
EU-28 - Millions Euro (left scale)
Euro Area - Millions Euro (left scale)
EU-28 - % GDP (right scale)
Euro Area % GDP (right scale)
Source: Eurostat
1 An Investment Plan for Europe, communication from the Commission, COM/2014/0903

Financing public expenditure: some key figures at EU and national levels____________________________________________________________________________________________
Page 3 of 10
Graph 2 - European Union Resources
0
0,2
0,4
0,6
0,8
1
1,2
1,4
0
20000
40000
60000
80000
100000
120000
140000
160000
2000 2001 2002 2003 2004 2005 2006 2007 2008 2009 2010 2011 2012 2013
% GN
I
Mill
ions
Eur
o
European Union Resources
million euro (left scale) % GNI (right scale)
Source: European Commission - EU Budget 2013 - Financial Report
2 Structure of the revenue: where the revenue comes from
2.1 Member States' revenue: A common structure, stable over time
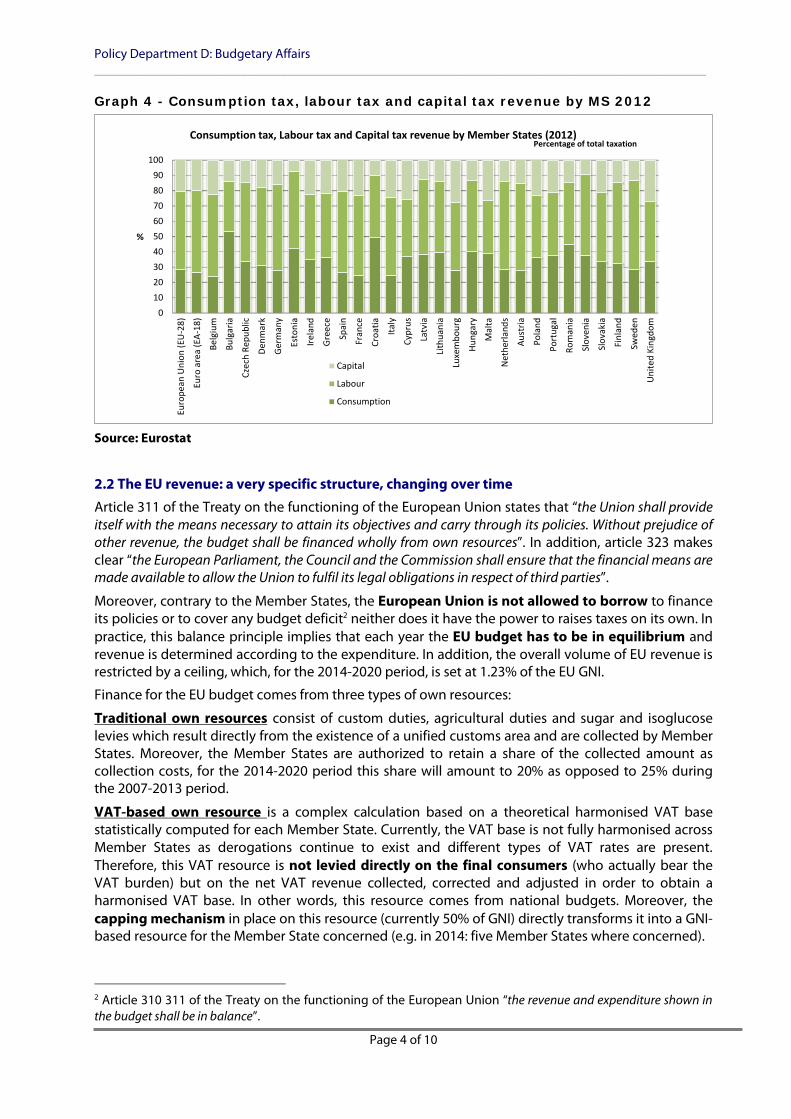
Consumption, labour income and capital constitute the different tax bases. The distribution of thetotal tax revenue for EU-28 by these three types of tax base for the latest year available (2012) isshown in the graph below.
Labour income provides the largest source of revenue, around half of the total, followed byconsumption taxes, around one third, followed by capital at around one fifth.
Within the consumption figure, VAT represents the greatest share. Revenue from VAT accounts for17% of the total tax revenue.
This structure of revenue is stable over time. However, the structure differs for the "new" MemberStates where a higher proportion of their revenue comes from consumption taxation and asomewhat lower proportion from labour. Bulgaria and Croatia stand out with around half of allrevenue coming from consumption taxes.
Graph 3 - EU-28 tax revenue by economic function 2012
Capital20,8 %
Labour51 %
VAT17,4 %
Other11,1 %
Consumption28,5 %
EU-28 Tax revenue by economic function2012
Capital
Labour
VAT
Consumption
Percentage of total taxationPercentage of total taxation
Source: Eurostat
Policy Department D: Budgetary Affairs____________________________________________________________________________________________
Page 4 of 10
Graph 4 - Consumption tax, labour tax and capital tax revenue by MS 2012
0102030405060708090
100
Euro
pean
Uni
on (E
U-2
8)
Euro
are
a (E
A-18
)
Belg
ium
Bulg
aria
Czec
h Re
publ
ic
Denm
ark
Ger
man
y
Esto
nia
Irela
nd
Gre
ece
Spai
n
Fran
ce
Croa
tia
Italy
Cypr
us
Latv
ia
Lith
uani
a
Luxe
mbo
urg
Hung
ary
Mal
ta
Net
herla
nds
Aust
ria
Pola
nd
Port
ugal
Rom
ania
Slov
enia
Slov
akia
Finl
and
Swed
en
Uni
ted
King
dom
%
Consumption tax, Labour tax and Capital tax revenue by Member States (2012)
Capital
Labour
Consumption
Percentage of total taxation
Source: Eurostat
2.2 The EU revenue: a very specific structure, changing over time
Article 311 of the Treaty on the functioning of the European Union states that “the Union shall provideitself with the means necessary to attain its objectives and carry through its policies. Without prejudice ofother revenue, the budget shall be financed wholly from own resources”. In addition, article 323 makesclear “the European Parliament, the Council and the Commission shall ensure that the financial means aremade available to allow the Union to fulfil its legal obligations in respect of third parties”.
Moreover, contrary to the Member States, the European Union is not allowed to borrow to financeits policies or to cover any budget deficit2 neither does it have the power to raises taxes on its own. Inpractice, this balance principle implies that each year the EU budget has to be in equilibrium andrevenue is determined according to the expenditure. In addition, the overall volume of EU revenue isrestricted by a ceiling, which, for the 2014-2020 period, is set at 1.23% of the EU GNI.
Finance for the EU budget comes from three types of own resources:
Traditional own resources consist of custom duties, agricultural duties and sugar and isoglucoselevies which result directly from the existence of a unified customs area and are collected by MemberStates. Moreover, the Member States are authorized to retain a share of the collected amount ascollection costs, for the 2014-2020 period this share will amount to 20% as opposed to 25% duringthe 2007-2013 period.
VAT-based own resource is a complex calculation based on a theoretical harmonised VAT basestatistically computed for each Member State. Currently, the VAT base is not fully harmonised acrossMember States as derogations continue to exist and different types of VAT rates are present.Therefore, this VAT resource is not levied directly on the final consumers (who actually bear theVAT burden) but on the net VAT revenue collected, corrected and adjusted in order to obtain aharmonised VAT base. In other words, this resource comes from national budgets. Moreover, thecapping mechanism in place on this resource (currently 50% of GNI) directly transforms it into a GNI-based resource for the Member State concerned (e.g. in 2014: five Member States where concerned).
2 Article 310 311 of the Treaty on the functioning of the European Union “the revenue and expenditure shown inthe budget shall be in balance”.

Financing public expenditure: some key figures at EU and national levels____________________________________________________________________________________________
Page 5 of 10
It should also be stressed that any frauds to VAT like “carrousel fraud” directly impact the EUrevenue. In 2013, the European Commission estimated the total losses, including fraud and evasionbut also legal tax avoidance, bankruptcies and financial insolvencies to 1.5% of the EU GDP.
GNI-based own resource is a fixed percentage of Member States' GNI. Initially created to play therole of balancing the EU budget, this resource has grown to represent more than two thirds ofthe total revenue, around 74% in 2013.
Finally, other revenue, which is not called own resources, comes from fines to companies breachingEU competition law or other EU laws, contributions of non-EU countries to specific EU programmesand taxes on EU staff.
Graph 5 - EU resources in % of total EU resources 2013
VAT-based own resources9,4
GNI-based own resources73,7
Traditional own resources(TOR)10,3
Other revenue6,5
EU Resourcesin % of total EU Resources, 2013
VAT-based own resources
GNI-based own resources
Traditional own resources (TOR)
Other revenue
Source: European Commission - EU Budget 2013 - Financial Report
Graph 6 - EU resources 2000-2013
0%
10%
20%
30%
40%
50%
60%
70%
80%
90%
100%
2000 2001 2002 2003 2004 2005 2006 2007 2008 2009 2010 2011 2012 2013
%
EU Resources2000-2013
Other revenue
Traditional own resources(TOR)VAT-based own resources
GNI-based own resources
In percentage of total EU revenue
Source: European Commission - EU Budget 2013 - Financial Report

Policy Department D: Budgetary Affairs____________________________________________________________________________________________
Page 6 of 10
Compared to the share of VAT revenue in the total revenue for Member States, the share of the VAT-based resource in the EU budget is much smaller, more than 17% of the total revenue for MemberStates against around 9% in the EU budget. In addition, the way the VAT-based resource is computed,and the capping mechanism, make it closer to the GNI resource rather than to the "real" MemberStates VAT levied on the final consumer.
To sum up, the current system of resources can be seen as far from the spirit of the Treaty on ownresources. Own resources are not “genuine” as around 83% of EU revenue comes directly from thenational budgets (GNI-based resource and VAT-based resource) and are contributions rather thanown resources.
Finally, the way Member States record their contributions to the EU budget in their own nationalbudgets is diverse3. Some attribute their contributions to the EU budget directly as appropriationsand, therefore, as a reduction of the central government income but the majority consider theircontributions as government expenditure and, therefore, opening the argument for a reduction ingovernment expenditure.
Moreover, additional corrections granted to some Member States in the financing of the EU budgetincrease the complexity and opacity of the system.
At the request of the European Parliament in the context of the difficult negotiations over the newMultiannual Financial Framework 2014-2020 a High Level Group on Own Resources was created onFebruary 2014 to reflect on finding more transparent, simple, fair and democraticallyaccountable ways to finance the EU. The group will deliver its final recommendations by 2016, atthe mid-term review of the current Multiannual Financial Framework.
The group is chaired by former Italian Prime Minister and EU Commissioner Mario Monti and iscomposed of members designated by the European Parliament4, the European Commission and theCouncil.
It is for the first time that such a high level group is established at the inter-institutional level. Itdemonstrate the awareness of European actors that somehow, in this issue lies one of the keys toaddressing a range of budgetary challenges and to unlocking the real economic potential of theEU budget. Ignoring the issue could entail high opportunity costs for cohesion, growth and politicalintegration. Own resources are an issue which can be only be confronted together by all MemberStates and by all institutions. A viable way out of the gridlock pre-supposes a shared understanding ofthe functioning and the role of the EU budget and its financing side in particular.
The First Assessment Report delivered by end of 2014 depicts the present financing system of theEU budget, which is mainly based on what is perceived as national contributions rather thangenuine own resources. It also describes recent reform efforts and provides guidelines for theupcoming work, in particular the criteria and broader issues which need to be examined further tocreate the conditions for reform. It acknowledges the great obstacles to reform the current systemand aims at finding practical answers, in particular by enlarging the debate to "a comprehensiveanalysis of the problem, comprising economic, budgetary, institutional and political aspects", whichhas not been done in the past. All these relevant questions will have to be addressed in the upcomingworking process in 2015 and 2016.
3 « How do Member States handle contribution to the EU budget in their national budgets”, EuropeanParliament study by J. Mortensen, J. Nuñez Ferrer and F. Infelise, October 2014.4 European Parliament members are: Ivailo Kalfin, Former MEP, Deputy Prime-Minister of Bulgaria and Ministerof Labor and Social Policy; Alain Lamassoure, MEP (EPP) and Guy Verhofstadt, MEP, (ALDE).

Financing public expenditure: some key figures at EU and national levels____________________________________________________________________________________________
Page 7 of 10
2.3 EU budget financing: discrepancies between Member States,
The following table shows the specific arrangements applicable to some Member States. 12 MemberStates out of 28 (i.e. around 43% of all Member States) enjoy specific arrangements in one orseveral ways.
Table 1 - Specific revenue arrangements to some Member States
MemberState
CappingVAT base
(50%GNI)
Reduced VAT call rate
in %
(Normal call rate0.3%)
Reduced GNIcontribution
Lump sum reduction
In million EUR
Op-outadjustment
Deductionfor not
taking partin Unionaction or
policy
UKRebate
Reducedparticipation
in bearingcost of UK
rebate
Reduction of75% of the
amount due2007-2013 2014-2020 2007-
2013 2014-2020
Denmark 130 peryear
Germany 0.15 0.15
Ireland
Croatia
Cyprus
Luxembourg
Malta
Netherlands 0.10 0.15 695 per
year
Austria
0.225
30 in 2014
20 in 2015
10 in 2016
Slovenia
Sweden 0.10 0.15 185 per
year
UnitedKingdom
Source: Council Regulation 608/2014 26 May 2014 (Official Journal of the European Union L 1687.6.2014)
Outside the capping of the VAT base to 50% of the GNI which, currently, is theoretically granted to allMember States, a quarter of the Member States enjoy specific resource arrangements. Moreover, thenew 2014-2020 period does not see any reduction in the number of specific resource arrangements.
It should be also mentioned that the high percentage5 that Member States are authorised to retain ascosts for the collection of the traditional own resources can be seen as another form of rebate forMember States with high customs duty collection. Currently, more than half of the traditional ownresources is collected by just a handful of Member States6.
5 25% then 20% for the new Multiannual Financial Framework for 2014-2020. A Commission Staff Working Paper- SEC (2011) 876 - shows that these percentages of collection costs do not correspond to the actual costsincurred.6 DE, UK and NL

Policy Department D: Budgetary Affairs____________________________________________________________________________________________
Page 8 of 10
2.4 Member States' contributions to financing the EU budget: divergences
The two graphs below express Member States' contributions to the EU budget both in euro per capitaand as a percentage of their GDP for 2013. In order to ease the reading, these two graphs presentMember States ranked from high to low.
A comparison of the two graphs shows interesting information. Some Member States which present arather high contribution in terms of per capita figures are actually contributing at a lower levelrelative to their wealth measured by the GDP.
Luxembourg's contribution, which is the highest value in terms of euro per capita, is far below theaverage with a contribution of 0.68% of its GDP. However, Luxembourg’s case can be seen asparticular as most of its GDP is the result of the work of commuters and, therefore, can explain its lowpercentage in terms of GDP in the financing of the EU budget. Croatia has just joint the EuropeanUnion and stands the lowest in the two measurements.
With a contribution per capita of 318 euro, well above the EU average, Germany stands at the EUaverage in terms of percentage of GDP.
Actually, 24 Member States contributions’ are located in a narrow range between 0.90% and 1.07% oftheir GDP (it should be noted that this range is smaller than the average plus and minus one time thestandard deviation).
Both in terms of euro per capita and in percentage of GDP, the United Kingdom's contribution isbelow the average. Furthermore, the United Kingdom ranks third for the lowest contribution in termof percentage of GDP with 0.76%.
Graph 7 - Contribution to EU Budget per capita (in EUR), 2013
0
125
250
375
500
625
EUR
Contribution to the EU Budget per capita, 2013(in EUR)
Source: Eurostat; European Commission - EU Budget 2013 - Financial Report

Financing public expenditure: some key figures at EU and national levels____________________________________________________________________________________________
Page 9 of 10
Graph 8 - Contribution to EU Budget as % of GDP, 2013
0
0,3
0,6
0,9
1,2
%
Contribution to the EU budget, 2013as % of Member State of GDP
Source: Eurostat; European Commission - EU Budget 2013 - Financial Report

Policy Department D: Budgetary Affairs___________________________________________________________________________________________________________________________________________
DisclaimerThe content of this document is the sole responsibility of the author and any opinions expressed therein do not necessarily represent the official position of the European Parliament. It is addressed to theMembers and staff of the EP for their parliamentary work. Reproduction and translation for non-commercial purposes are authorised, provided the source is acknowledged and the European Parliament is givenprior notice and sent a copy.This document is available on the Internet at: http://www.europarl.europa.eu/studiesContact: [email protected] completed in January 2015.Catalogue number: QA-02-15-060-EN-C (paper) ISBN: 978-92-823-6514-4 (paper) DOI: 10.2861/110740 (paper)Catalogue number: QA-02-15-060-EN-N (pdf) ISBN: 978-92-823-6515-1 (pdf) DOI: 10.2861/339748 (pdf) © European Union, 2015
ANNEX - EU National contributions, 2013
GDP (millionEUR)1 Population1 GDP per capita (in
EUR)
Contribution toEU budget
(million EUR)2
Contribution toEU budget percapita (in EUR)
Contribution toEU budget per
capita per day (inEUR)
Contribution as% of GDP
Contribution as% of EU budget
Allocatedexpenditure as % ofEU allocated budget
(%)(1) (2) (3)=(1)/(2)*1.000.000 (4) (5)=4/2 (6)=(5)/365 (7)=4/1 (8) (9)
Belgium 382.692 11.161.642 34.286 3.931 352,21 0,96 1,03% 3,2% 5,4%Bulgaria 39.940 7.284.552 5.483 423 58,04 0,16 1,06% 0,3% 1,5%Czech Republic 149.491 10.516.125 14.215 1.445 137,41 0,38 0,97% 1,2% 3,6%Denmark 248.975 5.602.628 44.439 2.606 465,14 1,27 1,05% 2,1% 1,1%Germany 2.737.600 82.020.578 33.377 26.125 318,52 0,87 0,95% 21,0% 9,7%Estonia 18.613 1.320.174 14.099 190 144,13 0,39 1,02% 0,2% 0,7%Ireland 164.050 4.591.087 35.732 1.521 331,22 0,91 0,93% 1,2% 1,4%Greece 182.054 11.062.508 16.457 1.794 162,18 0,44 0,99% 1,4% 5,4%Spain 1.022.988 46.727.890 21.892 10.376 222,04 0,61 1,01% 8,3% 10,2%France 2.059.852 65.578.819 31.410 21.874 333,56 0,91 1,06% 17,6% 10,6%Croatia 43.128 4.262.140 10.119 227 53,21 0,15 0,53% 0,2% 0,2%Italy 1.560.024 59.685.227 26.138 15.748 263,85 0,72 1,01% 12,7% 9,3%Cyprus 16.504 865.878 19.060 170 196,36 0,54 1,03% 0,1% 0,2%Latvia 23.372 2.023.825 11.548 248 122,69 0,34 1,06% 0,2% 0,8%Lithuania 34.631 2.971.905 11.653 349 117,58 0,32 1,01% 0,3% 1,4%Luxembourg 45.478 537.039 84.683 310 578,17 1,58 0,68% 0,2% 1,2%Hungary 97.948 9.908.798 9.885 920 92,87 0,25 0,94% 0,7% 4,4%Malta 7.263 421.364 17.236 78 184,03 0,50 1,07% 0,1% 0,1%Netherlands 602.658 16.779.575 35.916 4.745 282,76 0,77 0,79% 3,8% 1,7%Austria 313.067 8.451.860 37.041 3.028 358,21 0,98 0,97% 2,4% 1,4%Poland 389.695 38.533.299 10.113 3.831 99,41 0,27 0,98% 3,1% 12,0%Portugal 165.690 10.487.289 15.799 1.679 160,09 0,44 1,01% 1,3% 4,6%Romania 142.245 20.020.074 7.105 1.369 68,38 0,19 0,96% 1,1% 4,1%Slovenia 35.275 2.058.821 17.134 368 178,80 0,49 1,04% 0,3% 0,6%Slovakia 72.134 5.410.836 13.331 713 131,85 0,36 0,99% 0,6% 1,5%Finland 193.443 5.426.674 35.647 2.032 374,36 1,03 1,05% 1,6% 1,1%Sweden 420.849 9.555.893 44.041 3.769 394,40 1,08 0,90% 3,0% 1,2%United Kingdom 1.899.098 63.896.071 29.722 14.510 227,08 0,62 0,76% 11,7% 4,7%EU28 13.068.757 507.162.571 25.768 124.378 245,24 0,67 0,95% 100% 100%
1Eurostat data2Commission document "EU budget 2013 financial report". The difference with the "total own resources payments presented in Table 2 comes from the exclusion of traditional own resources (customsduty, etc.)