Embed Size (px)
Citation preview
ECONOMIC GROWTH CENTER YALE UNIVERSITY
P.O. Box 208629 New Haven, CT 06520-8269
http://www.econ.yale.edu/~egcenter/
CENTER DISCUSSION PAPER NO. 967
Finding Missing Markets (and a disturbing epilogue):Evidence from an Export Crop Adoption and
Marketing Intervention in Kenya
Nava AshrafHarvard Business School
Jameel Poverty Action Lab
Xavier GinéThe World Bank
Dean KarlanYale University
Innovations for Poverty ActionJameel Poverty Action Lab
December 2008
Notes: Center Discussion Papers are preliminary materials circulated to stimulate discussions and criticalcomments.
We wish to thank Jonathan Campaigne, Vince Groh and Zack Lenawamuro for their work atDrumNet, and their patience and collaboration with this research. We also would like to thank IDSfor the data collection efforts and IDRC, SAGA, and the World Bank for funding. Richard Akresh,Steve Boucher, Paul Dower, Steve Jaffee, Doug Miller and Julius Okello provided valuablecomments. Sara Nadel from Innovations for Poverty Action, Guillem Roig and Paola de Baldomeroprovided excellent research assistance. Karlan thanks the National Science Foundation for support.All errors are our own.
This paper can be downloaded without charge from the Social Science Research Networkelectronic library at: http://ssrn.com/abstract=1317794
An index to papers in the Economic Growth Center Discussion Paper Series is located at:http://www.econ.yale.edu/~egcenter/publications.html
Finding Missing Markets (and a disturbing epilogue):Evidence from an Export Crop Adoption and Marketing
Intervention in Kenya
Nava Ashraf Xavier Giné Dean Karlan Harvard Business School The World Bank Yale University,Jameel Poverty Action Lab Innovations for Poverty Action,
and Jameel Poverty Action Lab
January 2008
AbstractIn much of the developing world, many farmers grow crops for local or personal consumption
despite export options which appear to be more profitable. Thus many conjecture that one or
several markets are missing. We report here on a randomized controlled trial conducted by
DrumNet in Kenya that attempts to help farmers adopt and market export crops. DrumNet
provides smallholder farmers with information about how to switch to export crops, makes in-
kind loans for the purchase of the agricultural inputs, and provides marketing services by
facilitating the transaction with exporters. The experimental evaluation design randomly assigns
pre-existing farmer self-help groups to one of three groups: (1) a treatment group that receives
all DrumNet services, (2) a treatment group that receives all DrumNet services except credit, or
(3) a control group. After one year, DrumNet services led to an increase in production of export
oriented crops and lower marketing costs; this translated into household income gains for new
adopters. However, one year after the study ended, the exporter refused to continue buying the
cash crops from the farmers because the conditions of the farms did not satisfy European export
requirements. DrumNet collapsed in this region as farmers were forced to sell to middlemen and
defaulted on their loans. The risk of such events may explain, at least partly, why many
seemingly more profitable export crops are not adopted.
JEL Codes: O12, Q17, F13.Keywords: Field Experiment, Export Crop, Food Safety Standards
2
1. Introduction
Why do farmers continue to grow crops for local markets when crops for export
markets are thought to be much more profitable? Several answers are possible: missing
information about the profitability of these crops, lack of access to the necessary capital
to make the switch possible, lack of infrastructure necessary to bring the crops to export
outlets, high risk of the export markets (e.g., from hold-up problems selling to exporters),
lack of human capital necessary to adopt successfully a new agricultural technology, and
misperception by researchers and policymakers about the true profit opportunities and
risk of crops grown for export markets.
We conduct a clustered randomized control trial with DrumNet, a project of Pride
Africa, to evaluate whether a package of services can help farmers adopt, finance and
market export crops, and thus make more income. The experimental design includes two
treatments, one with credit and one without, and a control group. The intervention is a
package of services. Thus, the design does not permit isolating the reasons for the failure,
with the exception of credit. In addition to evaluating the impact of these packages, we
examine whether there are heterogeneous treatment effects on the basis of prior
experience growing export crops.
This experiment is motivated by a recent push in development to build sustainable
interventions that help complete missing markets (e.g., the initiative launched jointly in
2006 by the Bill and Melinda Gates Foundation and the Rockefeller Foundation). Other
similar interventions include the use of mobile phones to obtain real-time prices for fish
in markets along the shore by boat owners returning with their catches (Jensen, 2007) and
3
an intervention in India to provide internet kiosks in small villages in order to better
inform villagers of market opportunities (Upton and Fuller, 2005).
Two approaches seem plausible for measuring impact of such interventions: one
infers impact by examining the convergence of market prices (Jensen, 2007); a second
compares the welfare, or change in welfare, of participants and non-participants. We
employ the second approach. This design requires the assumption that there is no general
equilibrium effects as a result of the intervention (e.g., increase of prices of non-export
crops as a result of many farmers taking up export crops), and evidence we present
supports this assumption.
To evaluate such a program, one should be concerned that entrepreneurial and
motivated individuals (those with the unobservable “spunk”) are most likely to
participate; hence a randomized control trial seems necessary in order to measure the
impact of such interventions convincingly. To the best of our knowledge, no such
randomized controlled trial has been completed to date on an export crop adoption and
marketing intervention. The literature on agricultural extension services, reviewed by
Birkhaeuser et al. (1991) and Anderson and Feder (2003), and on technology adoption,
reviewed by Feder et al. (1985) stress that both data quality and methodological issues
are important qualifiers to the prevailing evidence in favor of high returns from extension
or adoption. They conclude that more evaluative work is needed to better assist
policymakers.1
We find positive but not overwhelming one-year impacts from DrumNet.
DrumNet leads to more farmers growing export crops, increasing their production and
1 Foster and Rosenzweig (1995), Bandiera and Rasul (2004), Conley and Udry (2005) and Munshi (2004) also review the literature on agricultural technology adoption but focus on the role of social learning as a driver of adoption. This is the topic of our companion paper Ashraf, Gine and Karlan (2007).
4
lowering their marketing costs. While we do not find a statistically significant impact on
income for the full sample, we do find a statistically and economically significant
increase for first-time growers of export oriented crops.
The epilogue to this project is more dismal. One year after the evaluation ended,
the export firm that had been buying the horticulture stopped because of lack of
compliance with European export requirements (EurepGap). This led to the collapse of
DrumNet as farmers were forced to undersell to middlemen, leaving sometimes a harvest
of unsellable crops and thus defaulting on their loans. Afterwards it was reported to us
anecdotally that the farmers returned to growing local crops. We discuss the implications
(albeit without direct evidence): farmers may not be adopting export crops because of the
risk of the export market.
This paper proceeds as follows: Section 2 provides some background information
regarding the Kenyan horticultural market and the DrumNet program. Section 3 describes
the research design in more detail. Section 4 analyzes the decision to participate in
DrumNet. Section 5 analyzes the impact of DrumNet. Section 6 discusses the viability of
the DrumNet business model. Section 7 documents the EurepGap export requirements
and Section 8 explains how its implementation affected DrumNet and concludes.
2. The DrumNet Program and Context
Kenya’s horticultural sector2 has received a great deal of attention over the past
decade due to the rapid and sustained growth of its exports to Europe (Jaffee 1994, 1995,
2004; Dolan and Humphrey, 2000; Minot and Ngigi, 2002; Muendo and Tschirley,
2004). In 2004, it exported over 30,000 tons of French beans to European markets. The 2 Horticulture sector is defined here to include fruit and vegetable production and marketing, but not flowers.
5
UK absorbed more than 60 percent of exports, while France and the Netherlands captured
15 and 12 percent, respectively. As explained in Markandya et al. (1999) and Asfaw et al.
(2007), the strength of the Kenyan horticultural export sector can be attributed to (i)
Nairobi’s role as an African hub for air transport, (ii) preferential treatment under the
Lomé Convention between African Caribbean Pacific (APC) countries and the EU, and
(iii) a critical mass of export firms with world-class management skills. Despite the lack
of consensus on the actual contribution of small landholders to total horticulture exports3,
there is evidence suggesting that this contribution has declined over time, largely due to
the cost and difficulty of complying with the new export production requirements that
will be discussed in Section 7 (Okello and Swinton, 2007; Okello, Narrod and Roy, 2007;
Jaffee 2004).
When designing the DrumNet program, PRIDE Africa identified several stylized
constraints that smallholder farmers faced. First, smallholder farmers had little
information on pricing and exporting opportunities. Second, they lacked reliable
production contracts with large brokers or exporters. Farmers feared international price
fluctuations or believed that exporters would employ hold-up tactics given the
perishability of the produce, such as lowering the promised price or grading the crop at a
lower quality, while exporters feared that farmers would renege on their promise to sell
back the produce or would misuse the inputs jeopardizing the quality of the crop. Third,
farmers did not have relationships with financial institutions, and thus lacked access to
3 Estimates range from 30 percent in Dolan and Humphrey (2000) to 70 percent by the Horticultural Crops Development Authority, a parastatal agency funded by USAID, in Harris et al. (2001). Okello, Narrod and Roy (2007) report that while 60 percent of all French bean production in Kenya in the 1980s was done by smallholders, the share dropped to about 30 percent by 2003.

6
credit, and finally, the farmers had difficulty coordinating and financing the use of trucks
to transport the crop (see also Axinn, 1988; Kimenye, 1995; Freeman and Silim, 2002).
DrumNet was therefore designed as a horticultural export and cashless micro-credit
program that tried to overcome these barriers by linking smallholder farmers to
commercial banks, retail providers of farm inputs, transportation services, and exporters.
The model resembles an out-grower scheme (Grosh, 1994) but with one key difference.
As a third neutral party, DrumNet hoped to convince both farmers and exporters that the
other party would honor their commitment. In addition, with DrumNet there should be
higher monitoring and information exchanges thanks to the frequent interaction between
the staff and farmers.
A farmer that wants to be a member of DrumNet has to satisfy the following
requirements: (i) be a member of a registered farmer group (also known as self help
group or SHG) with the Department of Social Services, (ii) express an interest, through
the SHG, in growing crops marketed by DrumNet, namely French beans, baby corn or
passion fruit, (iii) have irrigated land, and (iv) be able to meet the first Transaction
Insurance Fund (TIF) commitment (roughly USD 10 or the equivalent of a week’s
laborer wages).
DrumNet clients first receive a four week orientation course in which the process is
explained. Farmers learn about the need to employ Good Agricultural Practices on their
farms to ensure the quality and safety of their produce, they open a personal savings
account with a local commercial bank and, for those in the credit-treatment group, they
make the first cash contribution to the Transaction Insurance Fund (TIF) that will serve as
partial collateral for their initial line of credit. They also decide on the TIF percentage
7
that DrumNet will automatically deduct from each future marketing transaction.
Maximum loan size is four times their balance in the TIF. The initial TIF amount depends
on the specific crop the farmer wants to grow and the area under cultivation.4
To ensure repayment, DrumNet organizes farmers into groups of 5 members each
who are jointly liable for the individual loans taken out. At harvest time, DrumNet
negotiates price with the exporter and arranges the produce pick-up at pre-specified
collection points. Usually, there is a collection point for every 4 or 5 SHGs. In each
collection point, a transaction agent is appointed among the members to serve as liaison
between DrumNet and the farmers.5 At these collection points, farmers grade their
produce and package it, although the exporter has the final word on the grading.6
In the credit-treatment group, DrumNet also works with local agricultural retail
stores to coordinate the in-kind loans. The retailers are trained in basic DrumNet record
keeping and submit receipts to DrumNet to receive payment.
Once the produce is delivered to the exporter at the collection points, the exporter
pays DrumNet who in turn will deduct any loan repayment, pre-specified TIF percentage
and credits the remainder to individual bank savings accounts that each farmer opened
4 For example, passion fruit in one quarter of an acre requires an investment of Ksh 5,000 (USD 67) but does not bear fruit for 6 months. The initial TIF for passion fruit is Ksh 1,250. French beans and baby corn only require an investment of Ksh 3,000 per one quarter of an acre and harvesting takes place after 3 months. In Kirinyaga, both French beans and baby corn can be grown and harvested all year. 5 Transaction agents are responsible for coordinating activities within farmer groups. The number of these agents has expanded from approximately 10 in early 2004 to 35 in January 2005. One member of each new farmer group is nominated as the transaction agent, receives additional training, and serves as the main point of contact for DrumNet, facilitating the market transactions. These farmers communicate frequently with the DrumNet staff, both in person in the office and via mobile phones. They are an important conduit of information about pickup schedules, market prices, approved field practices, and shifting grading standards. 6 Anecdotal evidence suggest that some export buyers arbitrarily change the rejection rate especially in periods of oversupply (Okello and Swinton, 2007), but we have no evidence that the buyer from DrumNet engaged in such practices.
8
when they registered. Initially, DrumNet focused on passion fruit, a profitable but
challenging crop sold both in export and local markets. The favorable climate and small
farms in Kirinyaga favors this fruit crop. Beginning in 2004, the DrumNet team began
also to support the production of two other crops in high demand with Kenyan exporters:
French beans and baby corn. These crops have additional advantages over passion fruit
— they are less capital intensive, simpler to grow, and have shorter growing periods
leading to faster economic returns. Because of this, very few SHG members that
participated in DrumNet decided to grow passion fruit. Instead, they focused on French
beans and, to a lesser extent, baby corn. The type of French beans chosen by DrumNet is
the extra fine from the amy variety, exported as fresh produce and preferred by the UK
supermarkets. Due to its higher labor requirements, it is better suited for smallholder
farms than the bobby type from the paulista variety, mainly produced for canning by
larger plantations.
3. Data and Design of Evaluation
The evaluation was conducted in the Gichugu division of the Kirinyaga district of
Kenya. First, in December 2003, we collected from the Ministry of Agriculture a list of
all horticulture SHGs in Gichugu that had been registered since 2000. There were 96
registered SHGs comprising approximately 3,000 farmers, although many of these 96
were inactive or disbanded groups. After screening out the inactive or disbanded groups
(via a brief filter survey to the SHG leader), we were left with 36 viable SHGs for the
evaluation.
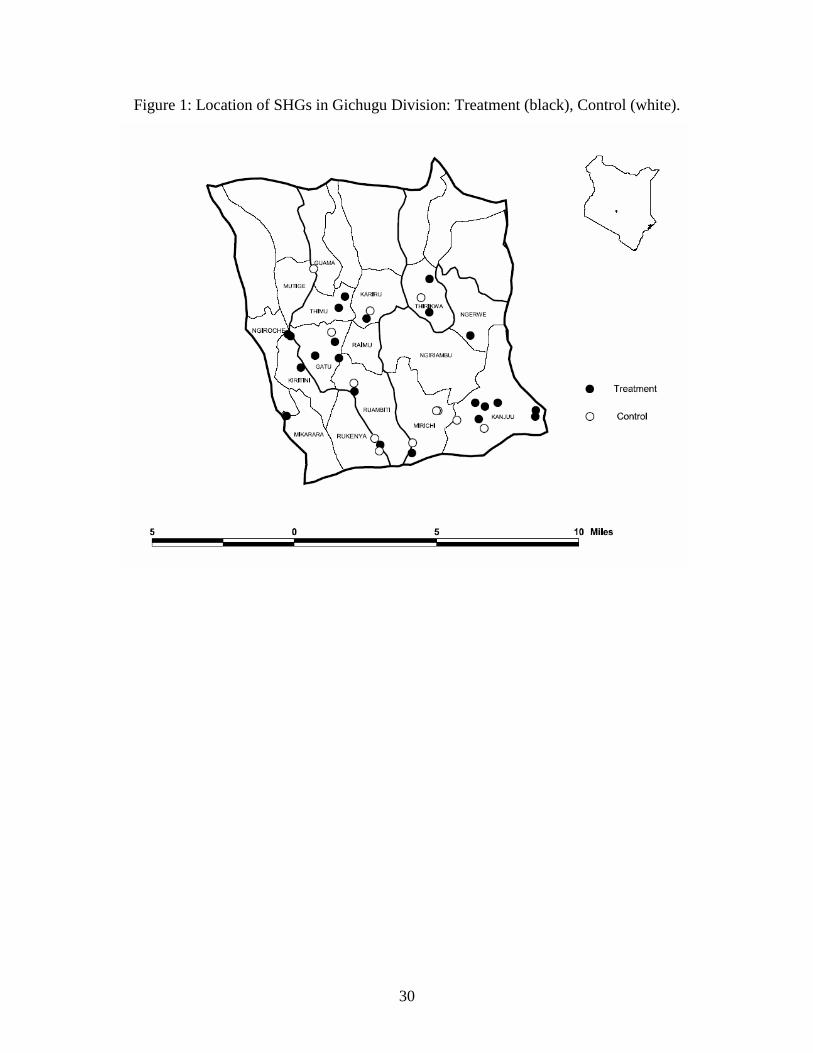
We randomly assigned the 36 SHGs into three experimental groups of 12 SHG’s
each: (1) “treatment-credit”: all DrumNet services, totaling 373 individuals, (2)
9
“treatment-no credit”: all DrumNet services except credit, totaling 377 individuals, and
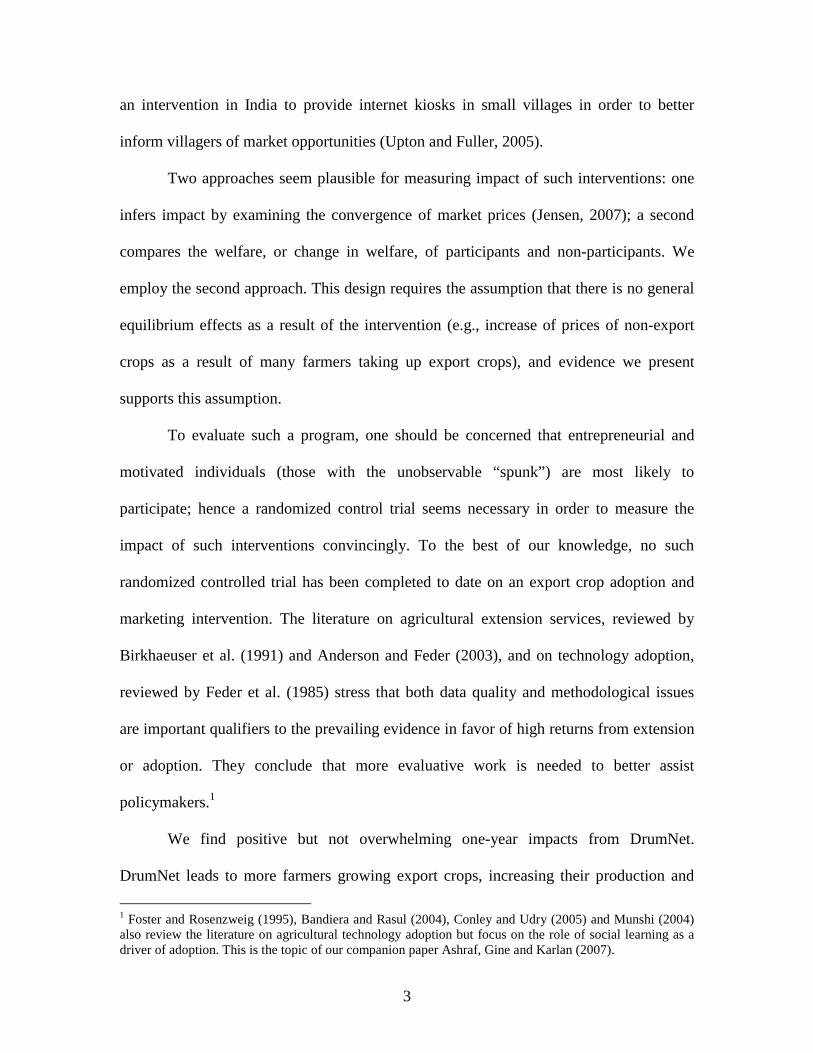
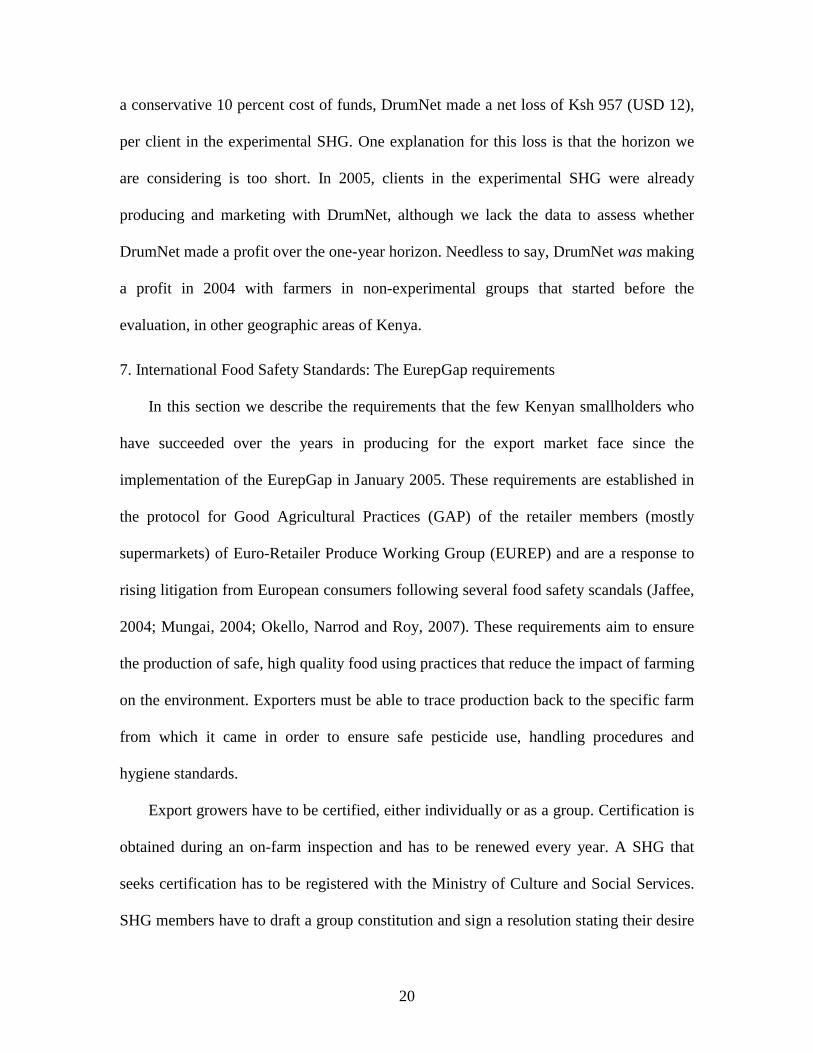
(3) “control”: no DrumNet services, totaling 367 individuals. Figure 1 presents a map of
Gichugu with the location of the treatment and control SHGs.7
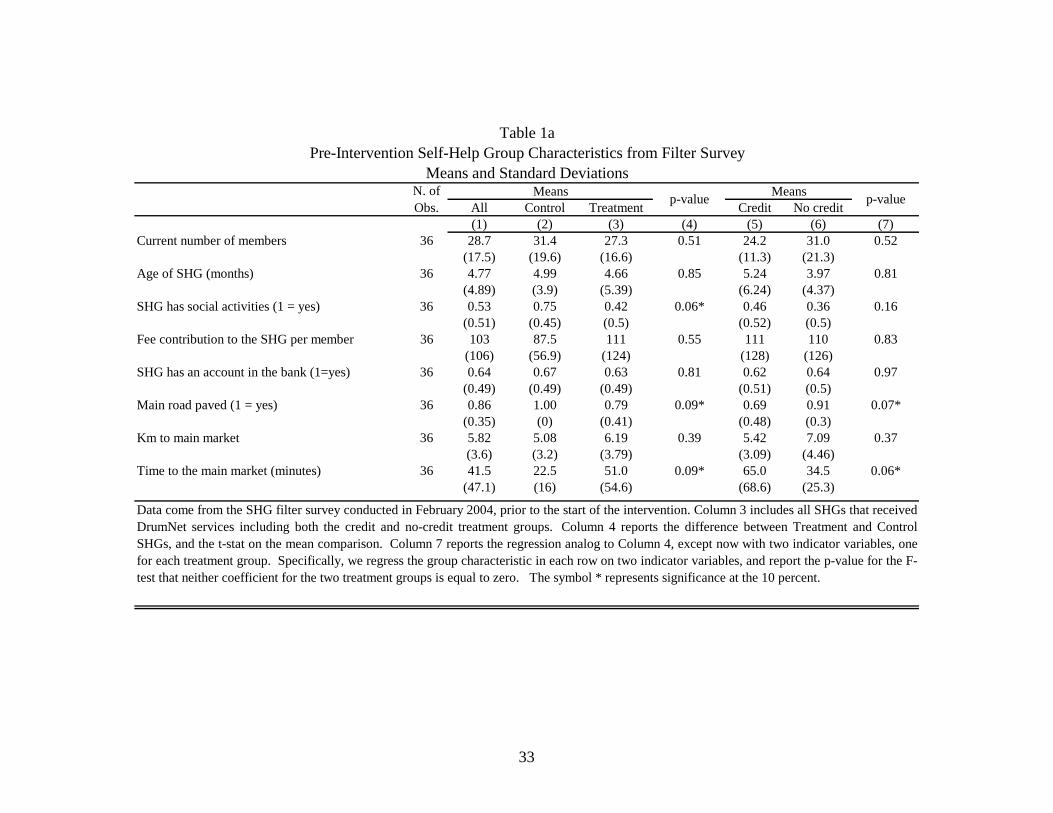
After the randomization was done, we verified that the three groups were similar
statistically on the limited variables available from the filter survey (i.e., number of
members in 2004, SHG age since creation, access to paved road, percentage of members
that were already growing export oriented crops, etc.). Table 1a reports these
orthogonality checks. Column 4 reports the p-value of the t-test of the differences
between the treatment group and the controls. Column 5 and 6 then show the breakdown
for each of the two treatment groups, and column 7 reports the p-value of the F-test that
neither coefficient for the two treatment groups is equal to zero. Although credit SHGs
start off slightly worse than control SHGs in terms of infrastructure and remoteness,
overall the three experimental groups seem quite similar. Note that in the analysis, since
we have baseline data, we will include SHG fixed effects and all baseline controls of
Table 1b. Thus any remaining differences in levels of fixed characteristics (but not trends
in time-varying characteristics) that occurred due to the small sample will be controlled
for through the SHG fixed effects and individual-level baseline control variables.
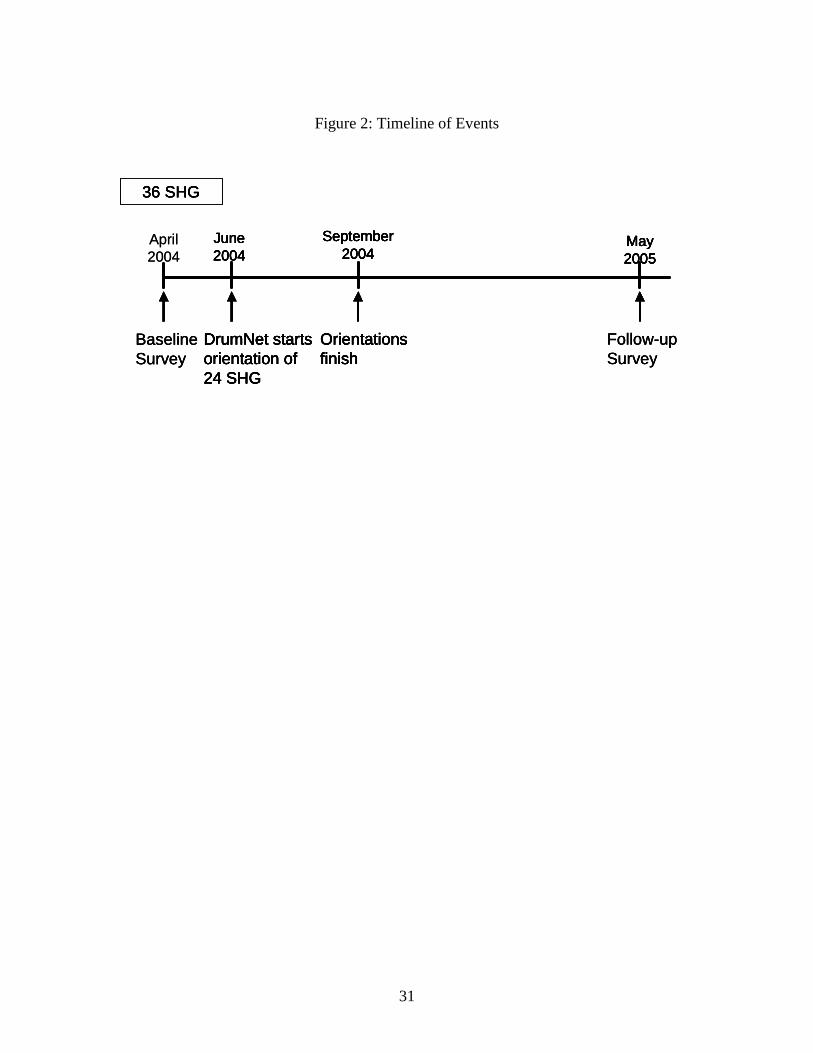
In April 2004, immediately after the filter survey was completed, we conducted a
baseline of 726 farmers from the selected 36 SHGs. At the time of the baseline survey,
DrumNet had not yet started operations or marketing, and thus no one had heard of it.
During the follow-up survey in May 2005, we expanded the sample to include 391
7 Since the area is rather small, potential contamination of the control group is a concern. However, in the follow-up interview fewer than 15 percent of members in control SHGs had heard about DrumNet.
10
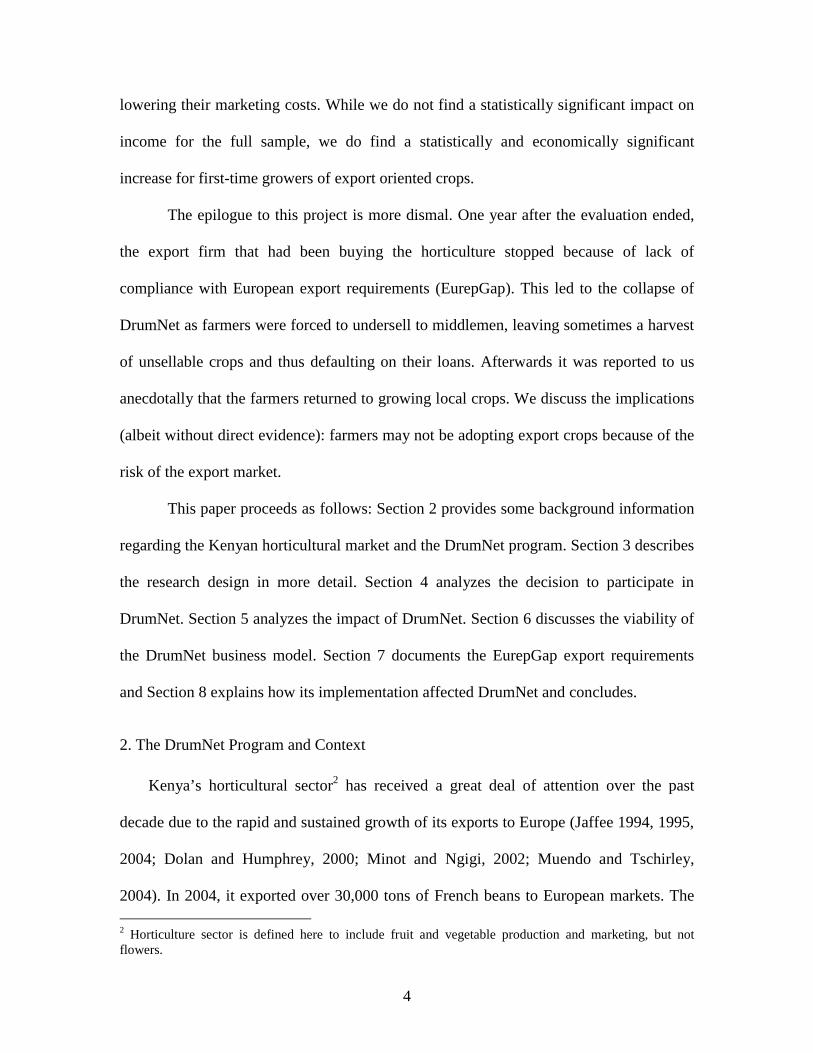
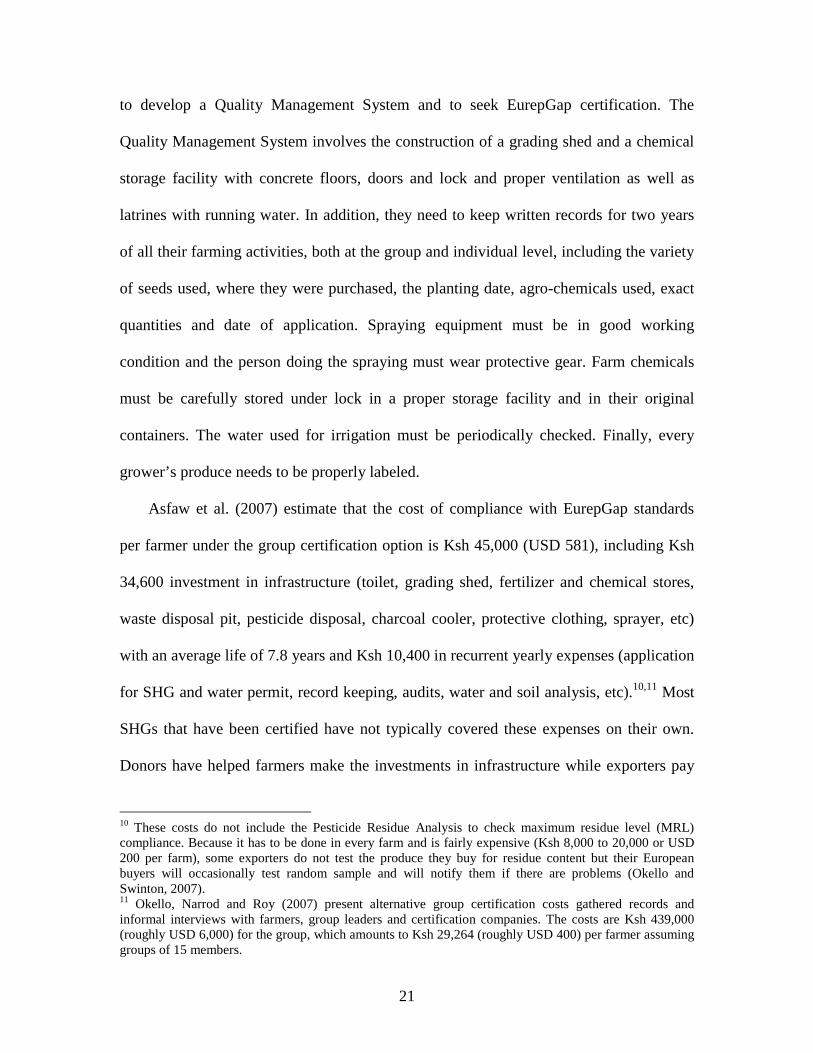
additional SHG members registered at the time of the baseline but not included in the
baseline survey. See Figure 2 for a Timeline of Events.
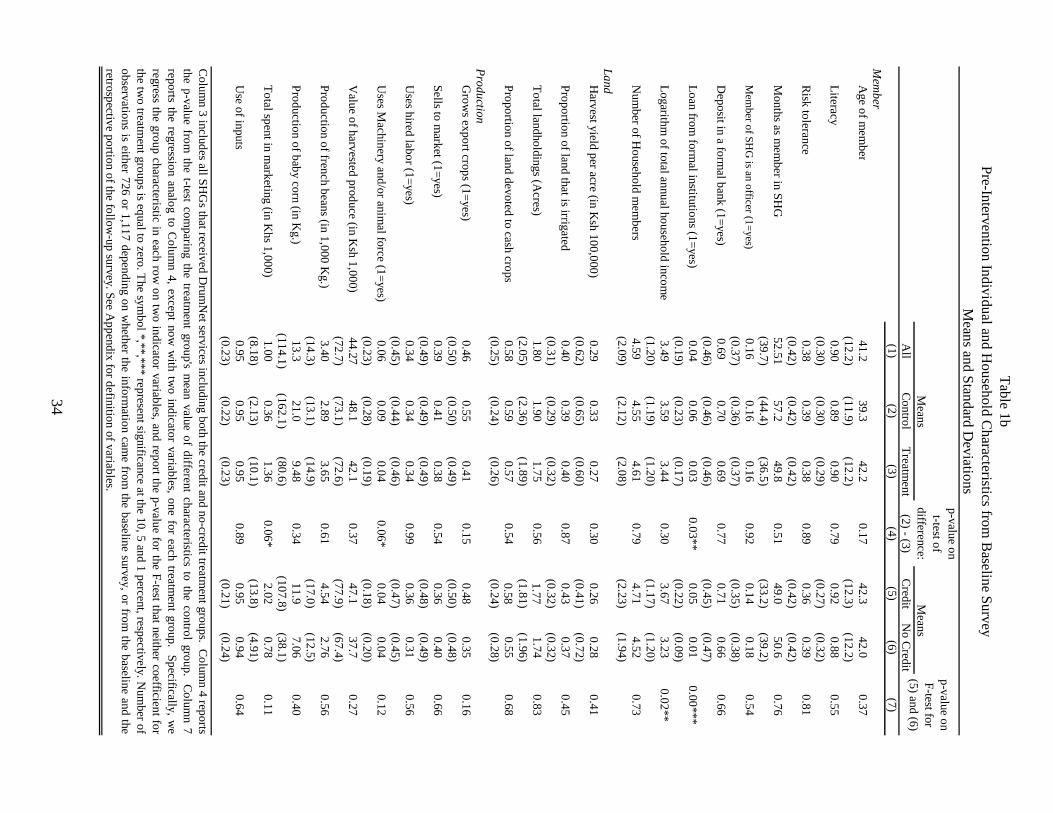
Table 1b compares the baseline characteristics across treatment and control groups.
All members used in the analysis were registered members at the time of the baseline.
Table 1c reports the number of observations per variables at baseline and at follow-up.
Some variables have at most 726 non-missing observations if the information was only
elicited in April 2004 or 1,117 if we also asked the question retrospectively at follow-up
for the additional sample of 391 members that were included in the follow-up but were
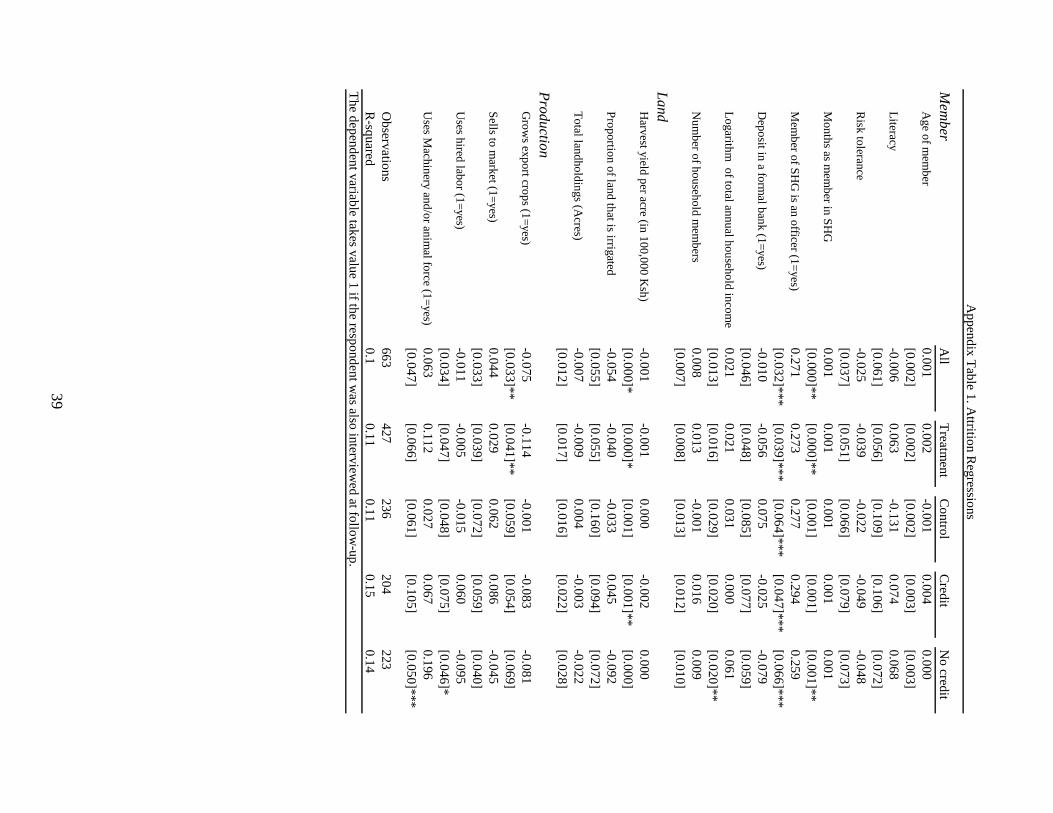
not in the baseline. We reached 86% of the baseline individuals in the follow-up survey.
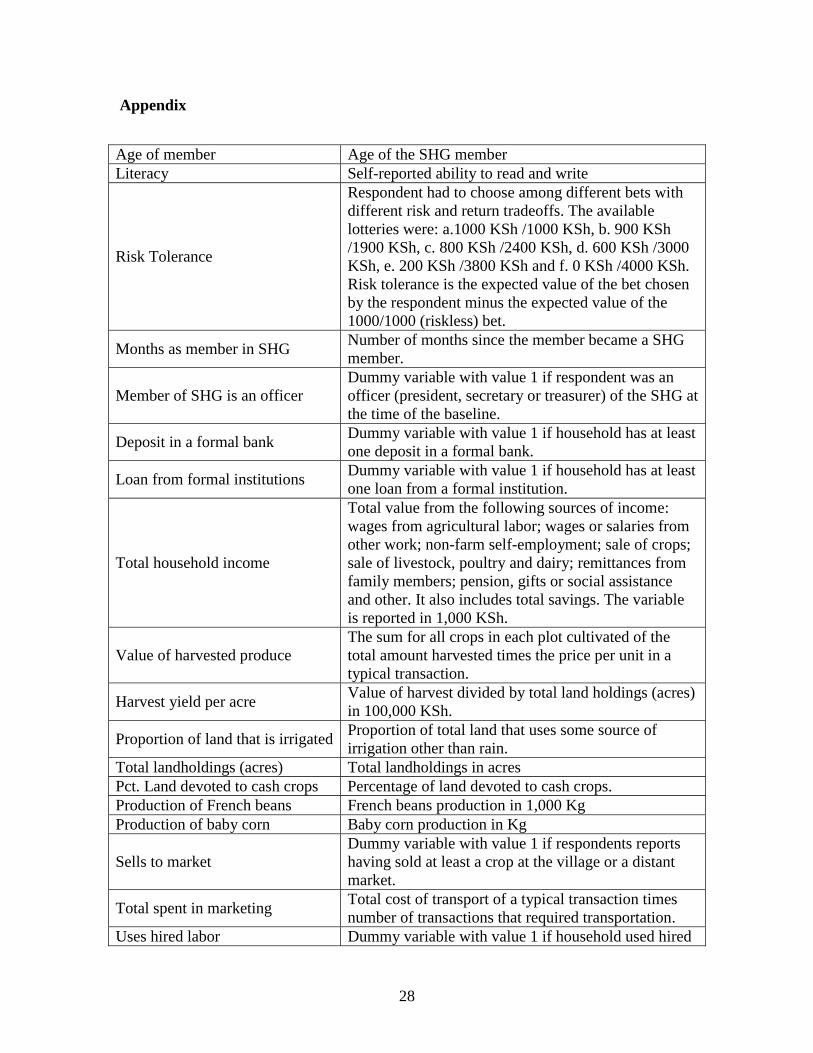
Appendix Table 1 compares the baseline characteristics of those reached in the follow-up
to those not reached.
About half of the household income of these farmers came from farm activities,
while the rest came from employment (both formal and informal), remittances, or
pensions and gifts. Most farmers own the land they cultivate, and the median farm size
was one acre. Farmers grew subsistence crops (beans, maize, potatoes, and kale) half of
the time and cash crops such as coffee, bananas, or tomatoes 34 percent of the time. Only
twelve percent of the farmers were already growing French beans, and nobody baby corn,
the main horticulture crops promoted by DrumNet.
Farm operations are typically done using only manual human labor, with fewer than
five percent utilizing animal labor or machinery to boost productivity. This is not
surprising given the small size of the farms. In addition, three quarters of those surveyed
rely solely on family labor, not requiring hired labor to plant or harvest crops.
11
To market their produce, nearly all used the traditional networks of brokers, resellers,
and other intermediaries (see also Harris et al., 2001). A few marketed produce directly to
consumers locally, and none reported marketing their produce in regional market centers
or directly to large-scale end-buyers.8 Only six percent of the farmers reported access to
motorized transport (public transport, car, or truck) for hauling their produce; nearly all
transport by foot, bicycle, or animal drawn cart. Most farmers have little control over
which intermediaries they work with – three-quarters reported having relationships with
three or fewer brokers and a 45 percent reported working exclusively with a single
broker. Most produce transactions are cash-on-delivery, and most occur at the farm gate.
Although these traditional arrangements are convenient for the farmer, they erode any
advantages of price comparison and informed decision making, generally placing the
farmer at a disadvantage.
4. Participation Decision
Using the baseline data, we now examine the decision to participate in the program
offered by DrumNet. We examine the take-up decision for two reasons. First, we want to
examine potential distributional implications of this program. Are the better off farmers
more likely to join, or does the program succeed in achieving its goal of reaching the
poor? Second, by examining the take-up decision, we hope to learn something about why
this intervention was potentially needed in the first place.
While 41 percent of the members from credit groups joined DrumNet, only 27
percent did so when credit was not included as a DrumNet service. If we look at SHGs
8 The prime exception was coffee, which in this region is almost exclusively marketed through cooperatives.
12
rather than individuals, ten out of twelve SHGs in the treatment-credit group joined
DrumNet, compared to only five out of twelve from the treatment group without credit.
This provides some evidence that, at a minimum for increasing take-up, credit is
perceived by farmers as an important factor for cultivation of export-oriented crops.
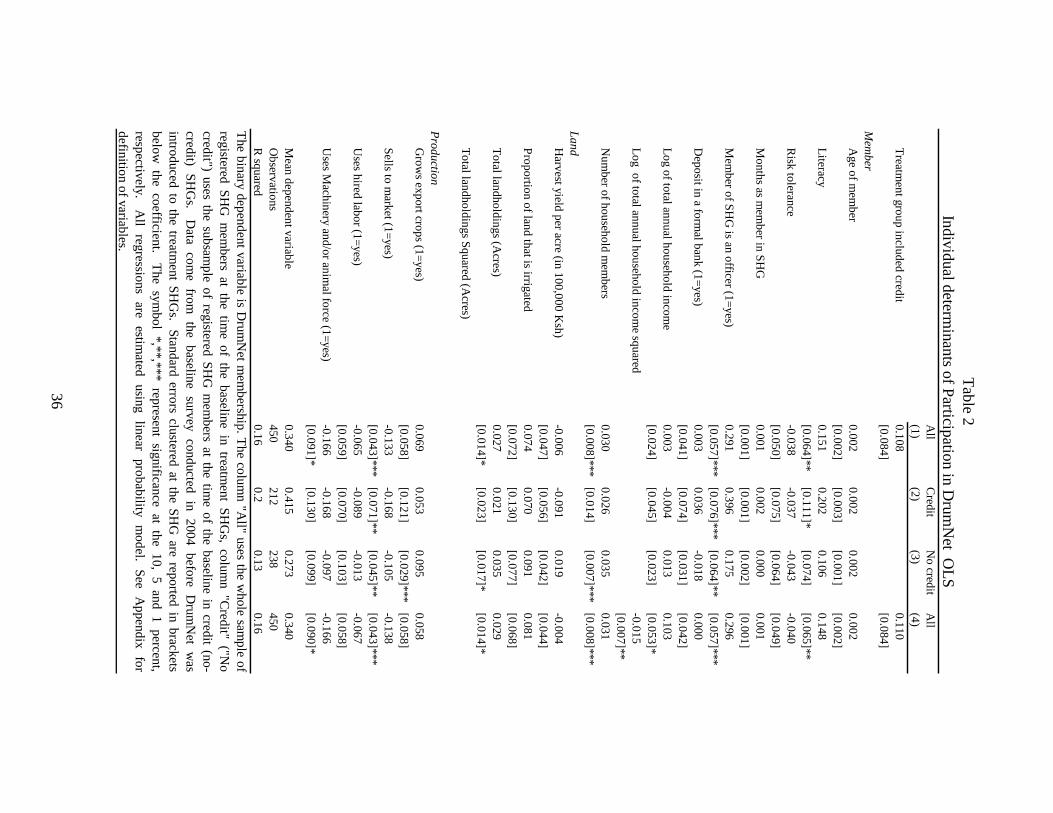
Table 2 shows the determinants of participation in DrumNet. Column 1 examines
both treatment groups and includes an indicator variable for the credit treatment.
Columns 2 and 3 show the determinants of take-up for the credit and no-credit groups
separately. Since the results in Columns 2 and 3 do not differ much, we focus here on the
results from Column 1.
We examine a few hypotheses regarding the take-up decision. First, is offering credit
an important determinant? We find that the credit indicator is positive but not significant
statistically. When the same specification is run including only the credit indicator (i.e.,
none of the other covariates), we find that it is significant at the 10 percent level (result
not shown in tables).
Second, are farmers who join more educated? If education is required to understand
the potential benefits of DrumNet, we would expect a positive correlation. On the other
hand, if educated farmers are already more advanced, accessing export markets, they may
see no additional value in the DrumNet services and refuse the offer to join. We find that
literacy, as defined by the self-reported ability to read and write, is positively correlated
with joining DrumNet.
Third, does household income predict take-up? This is particularly important to
examine for the treatment groups separately, to examine whether DrumNet without credit
13
only reaches those with higher income. We find no statistically significant linear
correlation between household income and participation.
Fourth, how does yield per acre in the previous season and landholdings correlate
with take-up? We find that members in the credit group with relatively high harvest yield
per acre are less likely to participate in DrumNet (p-value is 0.106). This perhaps is due
to farmers with high yields being satisfied with what they grow and not wanting to
change crop varieties. In addition, households with larger total landholdings are more
likely to join DrumNet and the same is true for households of larger size (both are
statistically significant).
Fifth, we look at whether those who participate used more or less advanced prior
farming practices. We may expect that more advanced farming techniques (accessing
markets directly, hiring labor, using machinery, etc.) are indications of farmers willing
and eager to take on new ideas to increase profits, or on the other hand may indicate
farmers less in need of the services of DrumNet, hence less likely to participate. We find
that those who sell directly to the market (i.e., do not use brokers) are less likely to join
DrumNet. Those who use machinery and/or animals rather than just human labor are also
less likely to join DrumNet, and using hired labor is also negatively correlated, but not
significant statistically, with participation in DrumNet.
Finally, we examine whether risk tolerance as measured through hypothetical choice
questions on the survey instrument, are predictive of take-up. We find that it is
uncorrelated with take-up.
Overall, it seems that it is neither the wealthiest farmers nor those that use the most
efficient techniques the ones that sign up for DrumNet, nor is it the poorest in the SHG,
14
given the positive correlations of literacy and leadership in the SHG and take-up. This
evidence points towards an inverted U-shape relationship between income and take-up,
indicating that the wealthiest and poorest are least likely to join. Column (4) includes a
quadratic term in log income. As expected, both the linear and quadratic term are
significant and have the expected sign. The coefficients on the log income terms imply a
maximum at the median log income: the further above and the further below median log
income, the less likely an individual is to take-up DrumNet. This pattern is the same in
both credit and no-credit group (not shown), thus we conclude that including credit in the
package of DrumNet services does not change the composition of participants with
respect to income.
5. Impact of DrumNet
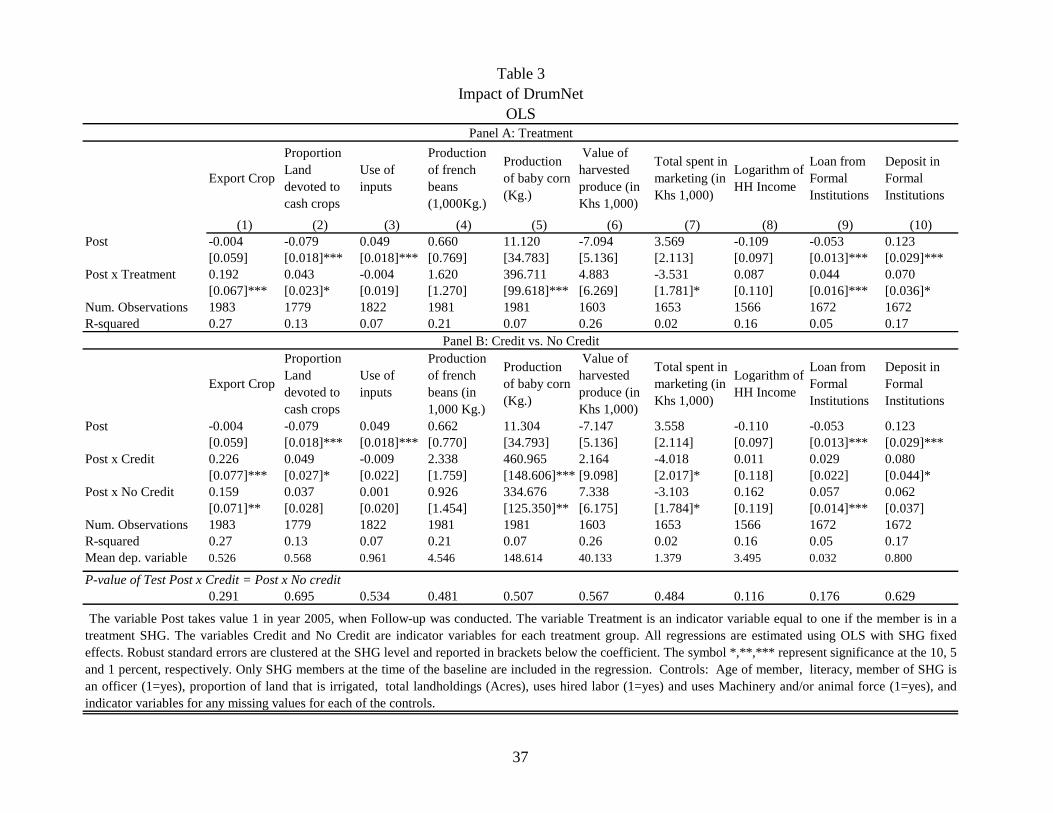
Table 3 presents the basic impact analysis. We use both baseline and follow-up data
to construct a difference-in-difference estimate of impact. We include fixed effects for
each SHG and all individual-level baseline controls of Table 1b. The coefficient of “Post
x Treatment” identifies the impact of DrumNet on farmer outcomes. In Panel A we report
results for the pooled treatment groups, and in Panel B we separately estimate the impact
of DrumNet with and without credit. The econometric specification is as follows:
(1) Yijt = αj + βPostt + δ Postt xTreatmentj + Xij’γ + εijt,
and
(2) Yij = αj + βPostt + δCPostt xCreditj + δNCPostt xNo Creditj + Xij’γ + εijt,
where Yij is the outcome measure, αj is a SHG fixed effect, Postt is a dummy that
takes value 0 in 2004 and 1 in year 2005, Treatmentj is a dummy that takes value 1 is the
15
SHG j is a treatment SHG, Xij is the set of baseline controls reported in Table 1b and εij is
the error term, clustered within SHG. In specification (2), the dummies Creditj and No
Creditj are defined analogously. We include the set of baseline controls because, despite
the random assignment, assignment to treatment was correlated with certain observable
characteristics.
The outcome measures will walk through the agricultural process in order to
examine at what steps DrumNet causes change. We examine, in chronological order:
whether export crops are grown, the percentage of area devoted to cash crops, use of
inputs, production of export crops, value of harvest, marketing expenditures and
household income. We also examine use of lending or savings services from other formal
financial institutions.
First, we find the immediate effect on growing an export crop is strong and
significant: treatment individuals are 19.2 percentage points more likely to be growing an
export crop than control individuals, and likewise a greater proportion of their land is
dedicated to cash crops (Columns 1 and 2). We do not find any increase in expenditure
on inputs (Column 3).
Next we examine production of export crops in Kgs and find large increases for baby
corn but insignificant increases for French beans (Column 4 and 5). Most farmers that
were already growing export crops were only growing French beans, not baby corn.
Thus, the increased production of baby corn can be attributed to DrumNet entirely. The
more difficult to measure outcomes of the value of the produce was positive but
statistically insignificant (Column 6). Marketing expenditures were lower for treatment
members compared to control members (Column 7).
16
For the log of household income (Column 8), we find on the full sample a positive
but statistically insignificant result.
Finally, members in treatment SHGs seem to be obtaining loans for formal sources
(other than DrumNet) and are also more likely to have a deposit with a formal institution
(Columns 9 and 10). The finding on increased borrowing from formal sources is
explained below. The finding on the increased number of members with a savings
account in a formal institution is not surprising because DrumNet opened an account with
all SHG members that did not have one previously to facilitate transactions.
In Panel B, we estimate the intent-to-treat effect for the credit and no-credit groups
separately. Surprisingly, despite the differential take-up rates, we do not find many
significant differences between the credit and no-credit groups even on the intent-to-treat
specification employed. This may be because the offer of credit may have changed the
type of farmer who agreed to participate, and this “type” may be correlated with
unobservables which effect success of the program. Note from the earlier discussion that
we do not observe many differences in selection on observables between the credit and
no-credit groups, but we also are only able to explain about one third of the variation in
the take-up decision.
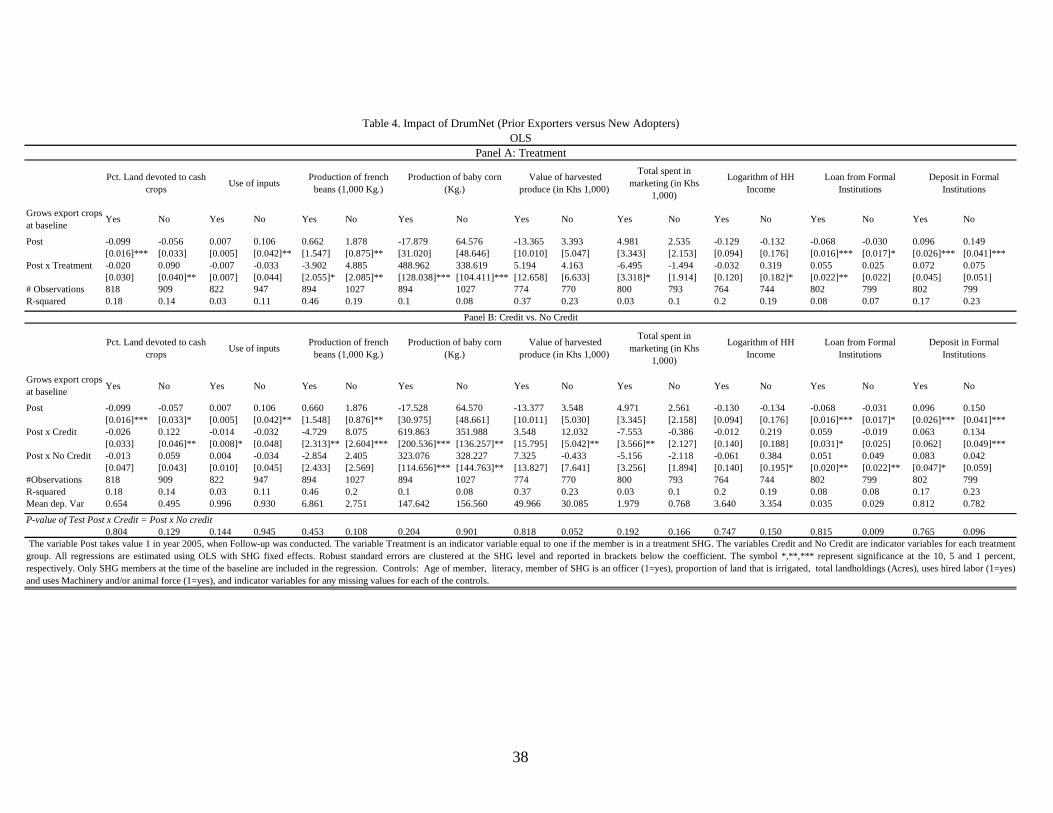
In Table 4, we examine important heterogeneous treatment effects for those who
were already growing DrumNet export crops versus those that were not. For each
outcome variable we employ the above specifications (1) and (2), also presented in Table
3.
We find that those who benefit the most are precisely first-time growers of export
crops. Prior growers do not devote more land to cash crops nor do they increase
17
production of French beans, but first-time adopters do both. Both prior growers and new
adopters increase their production of baby corn, since as mentioned before, baby corn
was introduced by DrumNet. Interestingly, only prior growers perceive a reduction in
marketing costs. This could be explained by the fact that first-time adopters were only
selling at the farm-gate, while old adopters where hauling their produce to be exported to
markets.
Most importantly, we find here that income is significantly larger for first-time
exporters, an increase of 31.9 percent for the pooled treatment group. Panel B shows this
broken down for the credit and no-credit group, but the difference between these two
groups is not significant statistically (although the point estimate is higher for the non-
credit group).
Using the marketing transaction data also collected at the time of the survey, we also
tested whether treatment SHGs benefited from an access to higher prices than they would
otherwise (note that whereas a large intervention of this sort may actually shift market
prices, DrumNet, relative to the market as a whole, was too small to realistically cause
general equilibrium shift in overall market prices). To examine prices available to
farmers in the study, we use all transaction data available, including those conducted at
farm-gate as well as at a local or distant market. The dependent variable is the price per
relevant unit of the crop: Kg for French beans and coffee, 90 Kg bag for maize and beans
and bunches for bananas. We run a pooled regression which includes crop fixed effects
and a crop by crop specification for the main crops grown. Analogous to the impact
Tables 3 and 4, all regressions include SHG fixed effects and all household baseline
controls of Table 1b. Standard errors are also clustered at the SHG level, our unit of
18
randomization. Table 5 reports the results. All coefficients of interest but one (No Credit
x Post in the Maize regression), are insignificant, thus, we conclude that there are no
differences between unit prices perceived by members of Treatment and Control SHGs
even if Treatment group is split into Credit and No-credit groups. The point estimates of
Treatment x Post in column (3) and Credit x Post and No credit x Post in column (4) are
all negative and insignificant, indicating that treatment groups did not receive on average
higher prices for French beans. The DrumNet administrative data show an average net
transaction price in 2005 of Ksh 25 per Kg, compared to a lower mean transaction price
for French beans in 2005 of Ksh 19.5 per Kg. Thus, while transactions with DrumNet
were possibly more profitable than with middlemen, the average price of French beans in
the treatment group fails to show it. Notice in contrast that the Post coefficient of French
beans, maize and coffee is positive and significant, indicating that on average, the price
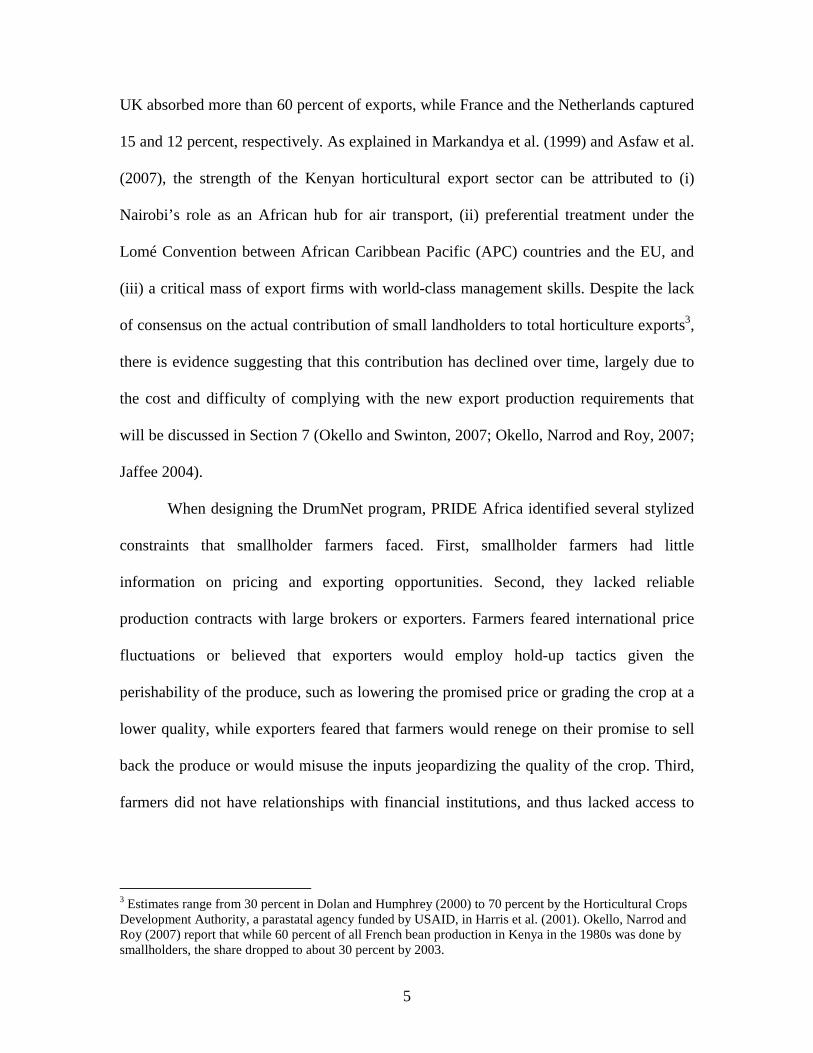
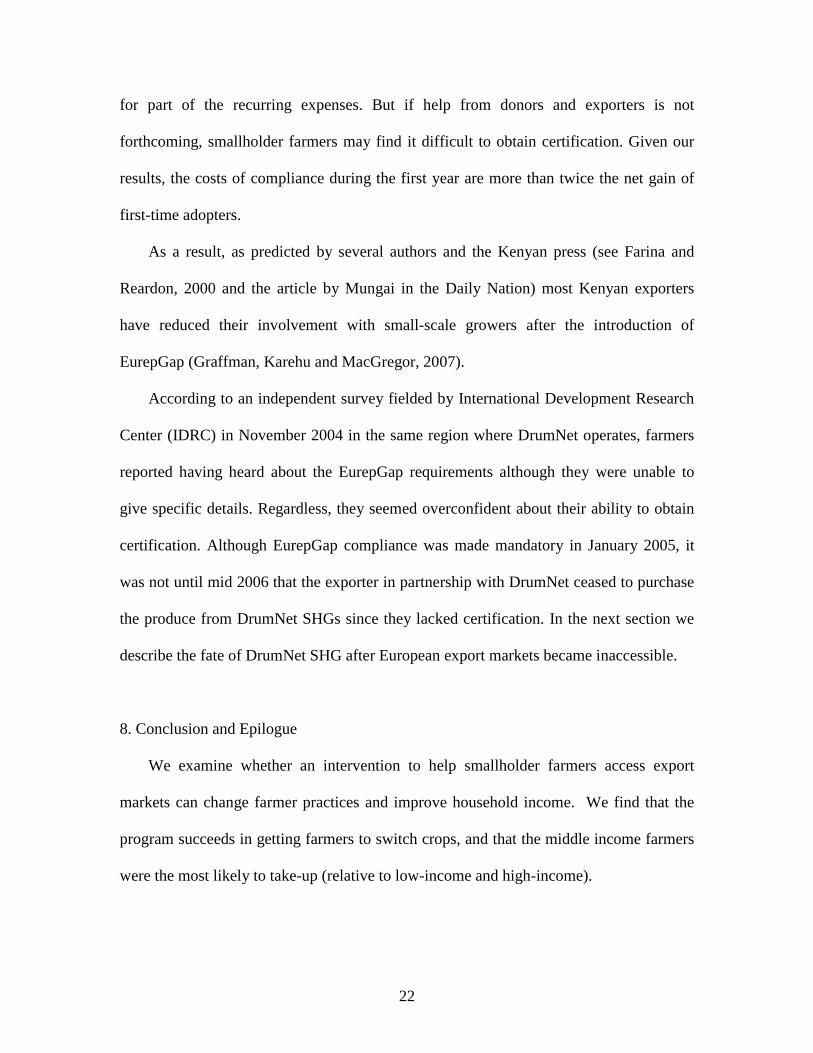
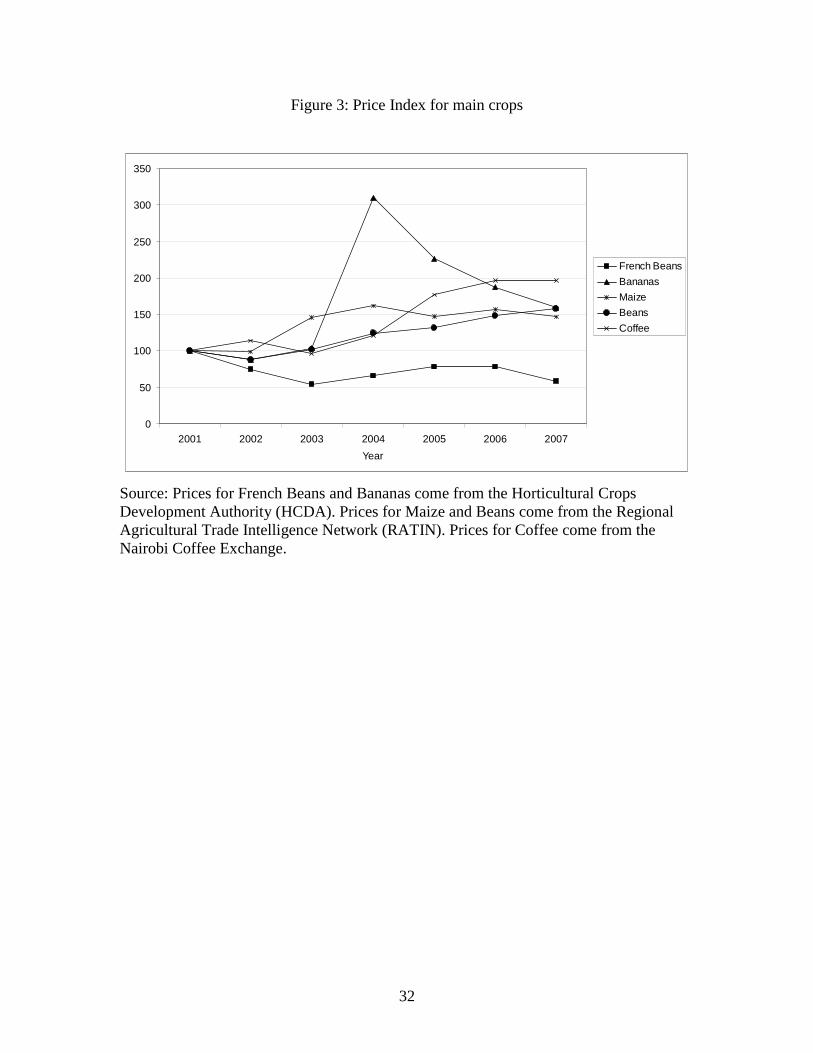
of these crops was higher in 2005 than in 2004. Figure 3 plots the Kenya-wide price
index of the same crops, taking year 2001 as the base year.9 Consistent with the Post
coefficient of Table 5, Figure 3 shows an increase in prices from 2004 to 2005 for the
same crops.
Finally, we interviewed the few local input suppliers that serve Gichugu and we
found anecdotally that the price of inputs (fertilizer, pesticides and seeds) was not
affected either by the presence of DrumNet. This is not surprising, since in aggregate
DrumNet was fairly small compared to the market as a whole.
9 Price data for French beans and bananas come from the Horticultural Crops Development Authority (HCDA), for maize and beans come from the Regional Agricultural Trade Intelligence Network (RATIN) and finally prices for coffee come from the Nairobi Coffee Exchange.
19
6. Business Viability
In this section we assess whether DrumNet was profitable from a business
standpoint. The monthly cost of the DrumNet main regional office in Kerugoya for an
average month during the study was KSh 93,000 (USD 1,200), and included the rental,
salaries, transportation, utilities, marketing and communication expenses. In addition, the
Kerugoya office benefited from two “market intelligence” offices in the nearby markets
of Karatina and Wakulima where the staff would check on local prices and report to
Kerugoya. These offices were fully staffed from January until June 2004, and were
closed in December 2004. Therefore, the monthly costs for these two offices during the
study period was KSh 3,860 (USD 50). These monthly costs do not include a motor
vehicle owned by the Kerugoya office nor expenses from the Pride Africa Nairobi
national office, even though DrumNet was a project of Pride Africa.
At the time of the study, DrumNet was already operating with some SHGs that were
growing passion fruit, French beans and baby corn. By the end of the study, they were
working with 43 collection points, 14 of which were established for the study. In order to
calculate the cost of the study to DrumNet, we calculate a monthly cost per collection
point and multiply it by the number of study collection points.
To compute the sustainability of DrumNet as a business, we compute the annualized
cost of running DrumNet per member and compare it to the income generated from the
commission that DrumNet charged in each transaction. DrumNet registered 294 farmers
in the month of June 2004 for the study, although they did not start generating revenues
until September 2004. Unfortunately, we only have administrative data from DrumNet
for 2004, so we can only assess business profitability from June to December. Assuming
20
a conservative 10 percent cost of funds, DrumNet made a net loss of Ksh 957 (USD 12),
per client in the experimental SHG. One explanation for this loss is that the horizon we
are considering is too short. In 2005, clients in the experimental SHG were already
producing and marketing with DrumNet, although we lack the data to assess whether
DrumNet made a profit over the one-year horizon. Needless to say, DrumNet was making
a profit in 2004 with farmers in non-experimental groups that started before the
evaluation, in other geographic areas of Kenya.
7. International Food Safety Standards: The EurepGap requirements
In this section we describe the requirements that the few Kenyan smallholders who
have succeeded over the years in producing for the export market face since the
implementation of the EurepGap in January 2005. These requirements are established in
the protocol for Good Agricultural Practices (GAP) of the retailer members (mostly
supermarkets) of Euro-Retailer Produce Working Group (EUREP) and are a response to
rising litigation from European consumers following several food safety scandals (Jaffee,
2004; Mungai, 2004; Okello, Narrod and Roy, 2007). These requirements aim to ensure
the production of safe, high quality food using practices that reduce the impact of farming
on the environment. Exporters must be able to trace production back to the specific farm
from which it came in order to ensure safe pesticide use, handling procedures and
hygiene standards.
Export growers have to be certified, either individually or as a group. Certification is
obtained during an on-farm inspection and has to be renewed every year. A SHG that
seeks certification has to be registered with the Ministry of Culture and Social Services.
SHG members have to draft a group constitution and sign a resolution stating their desire
21
to develop a Quality Management System and to seek EurepGap certification. The
Quality Management System involves the construction of a grading shed and a chemical
storage facility with concrete floors, doors and lock and proper ventilation as well as
latrines with running water. In addition, they need to keep written records for two years
of all their farming activities, both at the group and individual level, including the variety
of seeds used, where they were purchased, the planting date, agro-chemicals used, exact
quantities and date of application. Spraying equipment must be in good working
condition and the person doing the spraying must wear protective gear. Farm chemicals
must be carefully stored under lock in a proper storage facility and in their original
containers. The water used for irrigation must be periodically checked. Finally, every
grower’s produce needs to be properly labeled.
Asfaw et al. (2007) estimate that the cost of compliance with EurepGap standards
per farmer under the group certification option is Ksh 45,000 (USD 581), including Ksh
34,600 investment in infrastructure (toilet, grading shed, fertilizer and chemical stores,
waste disposal pit, pesticide disposal, charcoal cooler, protective clothing, sprayer, etc)
with an average life of 7.8 years and Ksh 10,400 in recurrent yearly expenses (application
for SHG and water permit, record keeping, audits, water and soil analysis, etc).10,11 Most
SHGs that have been certified have not typically covered these expenses on their own.
Donors have helped farmers make the investments in infrastructure while exporters pay
10 These costs do not include the Pesticide Residue Analysis to check maximum residue level (MRL) compliance. Because it has to be done in every farm and is fairly expensive (Ksh 8,000 to 20,000 or USD 200 per farm), some exporters do not test the produce they buy for residue content but their European buyers will occasionally test random sample and will notify them if there are problems (Okello and Swinton, 2007). 11 Okello, Narrod and Roy (2007) present alternative group certification costs gathered records and informal interviews with farmers, group leaders and certification companies. The costs are Ksh 439,000 (roughly USD 6,000) for the group, which amounts to Ksh 29,264 (roughly USD 400) per farmer assuming groups of 15 members.
22
for part of the recurring expenses. But if help from donors and exporters is not
forthcoming, smallholder farmers may find it difficult to obtain certification. Given our
results, the costs of compliance during the first year are more than twice the net gain of
first-time adopters.
As a result, as predicted by several authors and the Kenyan press (see Farina and
Reardon, 2000 and the article by Mungai in the Daily Nation) most Kenyan exporters
have reduced their involvement with small-scale growers after the introduction of
EurepGap (Graffman, Karehu and MacGregor, 2007).
According to an independent survey fielded by International Development Research
Center (IDRC) in November 2004 in the same region where DrumNet operates, farmers
reported having heard about the EurepGap requirements although they were unable to
give specific details. Regardless, they seemed overconfident about their ability to obtain
certification. Although EurepGap compliance was made mandatory in January 2005, it
was not until mid 2006 that the exporter in partnership with DrumNet ceased to purchase
the produce from DrumNet SHGs since they lacked certification. In the next section we
describe the fate of DrumNet SHG after European export markets became inaccessible.
8. Conclusion and Epilogue
We examine whether an intervention to help smallholder farmers access export
markets can change farmer practices and improve household income. We find that the
program succeeds in getting farmers to switch crops, and that the middle income farmers
were the most likely to take-up (relative to low-income and high-income).
23
Comparing members that were offered credit to those that were not, we find that
credit increases participation in DrumNet but does not translate into higher income gains
relative to the non-credit treatment group. This suggests that access to credit is not
necessarily the primary explanation for why farmers are not accessing these markets on
their own.
We find a significant increase in household income but only for farmers who were
not previously accessing export markets. This implies that in order to generate positive
economic returns at the household level, such interventions should focus intensely on
deepening outreach to new farmers, not merely facilitating transactions for farmers
already exporting crops.
As with any empirical research, external validity is of utmost concern. These
results are encouraging; profitable solutions exist to improve horticultural choices by
farmers and increase household income. However, as with any program, many local
conditions and organizational characteristics may have been necessary conditions for
finding these positive impacts. Furthermore, the heterogeneous results regarding credit
and no-credit require further research to understand more fully. With further carefully
designed evaluations, we can learn more about why these interventions are necessary in
the first place, and such information can then be used for designing even better
interventions that focus directly on the source of the problem.
The epilogue to this project is not good. One year after the follow-up data were
collected, the exporter refused to continue buying the crops from DrumNet farmers since
none of the SHGs had obtained EurepGap certification. DrumNet lost money on its loan
to the farmers and collapsed, but equally importantly farmers were forced to sell to
24
middlemen, sometimes leaving a harvest to rot. As reported to us by DrumNet, the
farmers were outraged but powerless, and subsequently returned to growing what they
had been growing before (e.g., local crops such as maize).
Two lessons can be drawn from the DrumNet experience. First, on the positive
side, DrumNet succeeded in building trust in the horticultural markets by convincing
farmers to make specific investments even when some feared holdup problems with the
export buyers, and by convincing buyers to trust farmers and purchase their produce. The
second lesson, however, was that because DrumNet’s success depended on their farmers
being certified, it should have secured the resources to cover the substantial infrastructure
and maintenance costs to achieve it. The eventual collapse of the transactions thus may
have generated a loss of trust, the exact problem DrumNet was designed to solve.

25
References
Anderson, J and G. Feder (2003) “Rural Extension Services”, World Bank Policy Research Paper 2970, World Bank, Washington, DC. Asfaw, S., D. Mithofer and H. Waibel (2007). Investment in EU Private Food-safety Standards Compliance: Does it Pay Off for Small-scale Producers in Sub-Saharan Africa? Leibnitz University of Hannover, mimeo. Ashraf, N., X. Gine and D. Karlan (2007) “Cheaper to talk (than to Trust): Network Formation in Rural Kenya”, mimeo World Bank. Axinn, G. (1988), Guide on Alternative Extension Approaches, FAO, Rome. Bandiera, O and I. Rasul (2006), “Social Networks and Technology Adoption in Mozambique”, Economic Journal 116:862-902. Birkhaeuser, D., R.E. Evenson and G. Feder (1991), “The Economic Impact of Agricultural Extension: A Review”, Economic Development and Cultural Change 39(3), 607-50. Conley, T. and C. Udry (2005), “Learning about a New Technology: Pineapple in Ghana” mimeo Yale University. Dolan, C., and J. Humphrey (2000). “Governance and Trade in Fresh vegetables. The Impact of UK Supermarkets on the African Horticultural Industry.” Journal of Development Studies 37:147-177. Farina, E.M.M.Q. and T. Reardon (2000)“Agrifood Grades and Standards in Extended Mercosur: Their Role in Changing Agrifood Systems” American Journal of Agricultural Economics 82:1170-1176. Feder, G., R. Just and D. Zilberman (1985) “Adoptions of Agricultural Innovations in Developing Countries: A Survey”, Economic Development and Cultural Change 33:255-298. Foster and Rosenzweig (1995) “Learning by Doing and Learning from Others: Human Capital and Technical Change in Agriculture”, Journal of Political Economy 103: 1176:1209. Freeman, H. and S. Silim (2002) “Commercialization of smallholder irrigation: The case of horticultural crops in semi-arid areas of eastern Kenya” in Private Irrigation in sub-Saharan Africa, edited by Sally, H. and C. Abernethy. Colombo, Sri Lanka: International Groh, V. (2004) “DrumNet Project: Technical Report to IDRC”, mimeo. Grosh, B. (1994) “Contract Farming in Africa: an Application of the New Institutional Economics”, Journal of African Economies, 3(2): 231-261.

26
Harris, C., Hegarty, P.V., Kherallah, M.X., Mukindia, C. A. Ngige, J.A., Sterns, P.A. and J. Tatter (2001) The Impacts of Standards on the Food Sector of Kenya. Michigan: Michigan State University. Jaffee, S. (1994) “Contract Farming in the Shadow of Competitive Markets: The Experience of Kenyan Horticulture.” In Little , P. and M. Watts. Living Under Contract: Contract Farming and Agrarian Transformation in Sub-Saharan Africa. University of Wisconsin Press. Madison, Wisconsin. Jaffee, S. (1995). “The Many Faces of Success: The Development of Kenyan Horticultural Exports.” In Jaffee, S and J. Morton (eds) Marketing Africa’s High Value Foods. The World Bank . Washington, D.C. Jaffee, S. (2004) “From Challenge to Opportunity: The Transformation of the Kenyan Fresh Vegetable Trade in the Context of Emerging Food Safety and Other Standards” World Bank Paper. Jensen, R. (2007) “The Digital Provide: Information (technology), market performance and welfare in the South Indian fisheries sector”, Quarterly Journal of Economics 122(3): 879-924. Kenya, GoK, (2004). Kirinyaga District Development Plan, 2002-2008. Government Pinter. Nairobi. Kenya, GoK, (2003). Central Province Annual Report 2003. Provincial Director of Agriculture. Nyeri, Kenya. Kimenye, L. (1995), “Kenya’s experience in promoting smallholder vegetables for European markets”, African Rural and Urban Studies, 2(2-3): 121-141. Markandya, A., L. Emerton and S. Mwale (1999). “Preferential trading arrangements between Kenya and the EU: a case study of the environmental effects of the horticulture sector”, World Bank Discussion Paper, 42, 83-100. Minot, N. and M. Ngigi, (2002). “Horticulture Development in Kenya and Ivory Coast”. A Paper Prepared for the IFRI Workshop on “Successes in African Agriculture”, Lusaka, June 10th –12th, 2002. Mungai, N. (2004) “EU Safety Rules Could Destroy Horticulture: The Protocol on Good Agricultural Practices Will Have a Profound Impact on Both Large and Small-Scale Farmers, although the Biggest Impact Will Be on the Latter” Daily Nation, May 15th, p.11.
27
Munshi, K. (2004) “Social Learning in a Heterogeneous Population: Technology Diffusion in the Indian Green Revolution”, Journal of Development Economics 73(1):185-215. Okello, J., C. Narrod and D. Roy (2007) “Food Safety Requirements in African Green Bean Exports and Their Impact on Small Farmers”, IFPRI Discussion Paper 737, Washington, DC. Okello, J. and S. Swinton (2007) “Compliance with International Food Safety Standards in Kenya’s Green Bean Industry: Comparison of a Small and a Large-scale Farm Producing for Export” Review of Agricultural Economics 29(2):269-285. Upton, D. and V. Fuller (2005) "The E-Choupal: Just Enough Bandwidth in Developing Agriculture." In The Broadband Explosion, edited by R. Austin and S. Bradley. Boston: Harvard Business School Press.
28
Appendix
Age of member Age of the SHG member Literacy Self-reported ability to read and write
Risk Tolerance
Respondent had to choose among different bets with different risk and return tradeoffs. The available lotteries were: a.1000 KSh /1000 KSh, b. 900 KSh /1900 KSh, c. 800 KSh /2400 KSh, d. 600 KSh /3000 KSh, e. 200 KSh /3800 KSh and f. 0 KSh /4000 KSh. Risk tolerance is the expected value of the bet chosen by the respondent minus the expected value of the 1000/1000 (riskless) bet.
Months as member in SHG Number of months since the member became a SHG member.
Member of SHG is an officer Dummy variable with value 1 if respondent was an officer (president, secretary or treasurer) of the SHG at the time of the baseline.
Deposit in a formal bank Dummy variable with value 1 if household has at least one deposit in a formal bank.
Loan from formal institutions Dummy variable with value 1 if household has at least one loan from a formal institution.
Total household income
Total value from the following sources of income: wages from agricultural labor; wages or salaries from other work; non-farm self-employment; sale of crops; sale of livestock, poultry and dairy; remittances from family members; pension, gifts or social assistance and other. It also includes total savings. The variable is reported in 1,000 KSh.
Value of harvested produce The sum for all crops in each plot cultivated of the total amount harvested times the price per unit in a typical transaction.
Harvest yield per acre Value of harvest divided by total land holdings (acres) in 100,000 KSh.
Proportion of land that is irrigated Proportion of total land that uses some source of irrigation other than rain.
Total landholdings (acres) Total landholdings in acres Pct. Land devoted to cash crops Percentage of land devoted to cash crops. Production of French beans French beans production in 1,000 Kg Production of baby corn Baby corn production in Kg
Sells to market Dummy variable with value 1 if respondents reports having sold at least a crop at the village or a distant market.
Total spent in marketing Total cost of transport of a typical transaction times number of transactions that required transportation.
Uses hired labor Dummy variable with value 1 if household used hired
29
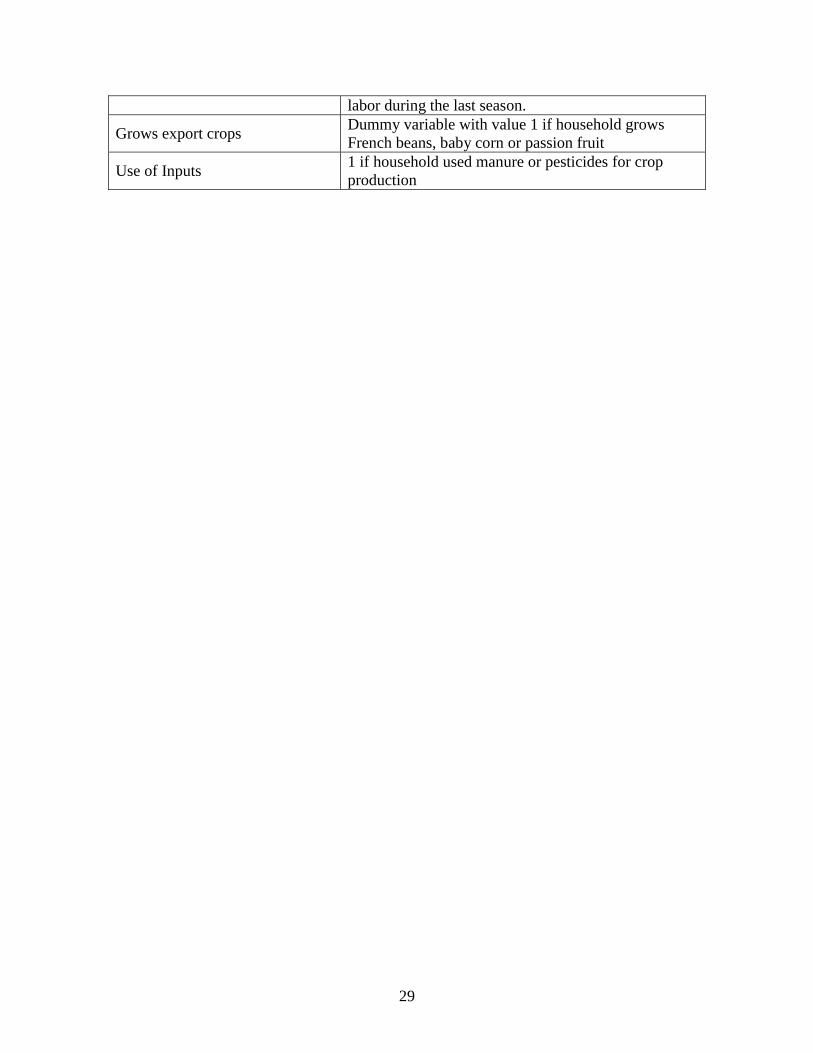
labor during the last season.
Grows export crops Dummy variable with value 1 if household grows French beans, baby corn or passion fruit
Use of Inputs 1 if household used manure or pesticides for crop production
30
Figure 1: Location of SHGs in Gichugu Division: Treatment (black), Control (white).
31
Figure 2: Timeline of Events
April 2004
Baseline Survey
36 SHG
June 2004
May 2005
DrumNet starts orientation of 24 SHG
September 2004
Orientations finish
Follow-up Survey
April 2004
Baseline Survey
36 SHG
June 2004
May 2005
DrumNet starts orientation of 24 SHG
September 2004
Orientations finish
Follow-up Survey
Baseline Survey
36 SHG
June 2004
May 2005
DrumNet starts orientation of 24 SHG
September 2004
Orientations finish
36 SHG
June 2004
May 2005
DrumNet starts orientation of 24 SHG
September 2004
Orientations finish
June 2004
May 2005
DrumNet starts orientation of 24 SHG
September 2004
Orientations finish
Follow-up Survey
32
Figure 3: Price Index for main crops
0
50
100
150
200
250
300
350
2001 2002 2003 2004 2005 2006 2007
Year
French Beans
Bananas
Maize
Beans
Coffee
Source: Prices for French Beans and Bananas come from the Horticultural Crops Development Authority (HCDA). Prices for Maize and Beans come from the Regional Agricultural Trade Intelligence Network (RATIN). Prices for Coffee come from the Nairobi Coffee Exchange.
33
All Control Treatment Credit No credit(1) (2) (3) (4) (5) (6) (7)
Current number of members 36 28.7 31.4 27.3 0.51 24.2 31.0 0.52(17.5) (19.6) (16.6) (11.3) (21.3)
Age of SHG (months) 36 4.77 4.99 4.66 0.85 5.24 3.97 0.81(4.89) (3.9) (5.39) (6.24) (4.37)
SHG has social activities (1 = yes) 36 0.53 0.75 0.42 0.06* 0.46 0.36 0.16(0.51) (0.45) (0.5) (0.52) (0.5)
Fee contribution to the SHG per member 36 103 87.5 111 0.55 111 110 0.83(106) (56.9) (124) (128) (126)
SHG has an account in the bank (1=yes) 36 0.64 0.67 0.63 0.81 0.62 0.64 0.97(0.49) (0.49) (0.49) (0.51) (0.5)
Main road paved (1 = yes) 36 0.86 1.00 0.79 0.09* 0.69 0.91 0.07*(0.35) (0) (0.41) (0.48) (0.3)
Km to main market 36 5.82 5.08 6.19 0.39 5.42 7.09 0.37(3.6) (3.2) (3.79) (3.09) (4.46)
Time to the main market (minutes) 36 41.5 22.5 51.0 0.09* 65.0 34.5 0.06*(47.1) (16) (54.6) (68.6) (25.3)
Data come from the SHG filter survey conducted in February 2004, prior to the start of the intervention. Column 3 includes all SHGs that receivedDrumNet services including both the credit and no-credit treatment groups. Column 4 reports the difference between Treatment and ControlSHGs, and the t-stat on the mean comparison. Column 7 reports the regression analog to Column 4, except now with two indicator variables, onefor each treatment group. Specifically, we regress the group characteristic in each row on two indicator variables, and report the p-value for the F-test that neither coefficient for the two treatment groups is equal to zero. The symbol * represents significance at the 10 percent.
p-value
Table 1aPre-Intervention Self-Help Group Characteristics from Filter Survey
Means and Standard DeviationsN. of Obs.
Meansp-value
Means
34
All
Control
Treatm
entC
reditN
o Credit
(1)(2)
(3)(4)
(5)(6)
(7)M
ember
Age of m
ember
41.239.3
42.20.17
42.342.0
0.37(12.2)
(11.9)(12.2)
(12.3)(12.2)
Literacy
0.900.89
0.900.79
0.920.88
0.55(0.30)
(0.30)(0.29)
(0.27)(0.32)
Risk tolerance
0.380.39
0.380.89
0.360.39
0.81(0.42)
(0.42)(0.42)
(0.42)(0.42)
Months as m
ember in SH
G52.51
57.249.8
0.5149.0
50.60.76
(39.7)(44.4)
(36.5)(33.2)
(39.2)M
ember of SH
G is an officer (1=
yes)0.16
0.160.16
0.920.14
0.180.54
(0.37)(0.36)
(0.37)(0.35)
(0.38)D
eposit in a formal bank (1=
yes)0.69
0.700.69
0.770.71
0.660.66
(0.46)(0.46)
(0.46)(0.45)
(0.47)L
oan from form
al institutions (1=yes)
0.040.06
0.030.03**
0.050.01
0.00***(0.19)
(0.23)(0.17)
(0.22)(0.09)
Logarithm
of total annual household income
3.493.59
3.440.30
3.673.23
0.02**(1.20)
(1.19)(1.20)
(1.17)(1.20)
Num
ber of Household m
embers
4.594.55
4.610.79
4.714.52
0.73(2.09)
(2.12)(2.08)
(2.23)(1.94)
LandH
arvest yield per acre (in Ksh 100,000)
0.290.33
0.270.30
0.260.28
0.41(0.62)
(0.65)(0.60)
(0.41)(0.72)
Proportion of land that is irrigated
0.400.39
0.400.87
0.430.37
0.45(0.31)
(0.29)(0.32)
(0.32)(0.32)
Total landholdings (A
cres)1.80
1.901.75
0.561.77
1.740.83
(2.05)(2.36)
(1.89)(1.81)
(1.96)P
roportion of land devoted to cash crops0.58
0.590.57
0.540.58
0.550.68
(0.25)(0.24)
(0.26)(0.24)
(0.28)P
roductionG
rows export crops (1=
yes)0.46
0.550.41
0.150.48
0.350.16
(0.50)(0.50)
(0.49)(0.50)
(0.48)Sells to m
arket (1=yes)
0.390.41
0.380.54
0.360.40
0.66(0.49)
(0.49)(0.49)
(0.48)(0.49)
Uses hired labor (1=
yes)0.34
0.340.34
0.990.36
0.310.56
(0.45)(0.44)
(0.46)(0.47)
(0.45)U
ses Machinery and/or anim
al force (1=yes)
0.060.09
0.040.06*
0.040.04
0.12(0.23)
(0.28)(0.19)
(0.18)(0.20)
Value of harvested produce (in K
sh 1,000)44.27
48.142.1
0.3747.1
37.70.27
(72.7)(73.1)
(72.6)(77.9)
(67.4)P
roduction of french beans (in 1,000 Kg.)
3.402.89
3.650.61
4.542.76
0.56(14.3)
(13.1)(14.9)
(17.0)(12.5)
Production of baby corn (in K
g.)13.3
21.09.48
0.3411.9
7.060.40
(114.1)(162.1)
(80.6)(107.8)
(38.1)T
otal spent in marketing (in K
hs 1,000)1.00
0.361.36
0.06*2.02
0.780.11
(8.18)(2.13)
(10.1)(13.8)
(4.91)U
se of inputs0.95
0.950.95
0.890.95
0.940.64
(0.23)(0.22)
(0.23)(0.21)
(0.24)
Means
Table 1b
Pre-Intervention Individual and Household C
haracteristics from B
aseline SurveyM
eans and Standard D
eviations
Colum
n3
includesallSH
Gs
thatreceivedD
rumN
etservicesincluding
boththe
creditandno-credittreatm
entgroups.C
olumn
4reports
thep-value
fromthe
t-testcom
paringthe
treatment
group'sm
eanvalue
ofdifferent
characteristicsto
thecontrol
group.C
olumn
7reports
theregression
analogto
Colum
n4,
exceptnow
with
two
indicatorvariables,
onefor
eachtreatm
entgroup.
Specifically,w
eregress
thegroup
characteristicin
eachrow
ontw
oindicator
variables,and
reportthe
p-valuefor
theF-test
thatneither
coefficientfor
thetw
otreatm
entgroupsis
equaltozero.T
hesym
bol*,**,***representsignificance
atthe10,5
and1
percent,respectively.Num
berof
observationsis
either726
or1,117
dependingon
whether
theinform
ationcam
efrom
thebaseline
survey,or
fromthe
baselineand
theretrospective portion of the follow
-up survey. See Appendix for definition of variables.
Means
p-value on t-test of
difference: (2) - (3)
p-value on F-test for
(5) and (6)

35
All Control Treatment Credit No Credit All Control Treatment Credit No Credit(1) (2) (3) (4) (5) (1) (2) (3) (4) (5)
MemberAge of member 1,117 367 750 373 377 956 303 653 316 337Literacy 1,117 367 750 373 377 956 303 653 316 337Risk tolerance 726 263 463 216 247 956 303 653 316 337Months as member in SHG 726 263 463 216 247 956 303 653 316 337Member of SHG is an officer (1=yes) 1,117 367 750 373 377 956 303 653 316 337Deposit in a formal bank (1=yes) 725 263 462 215 247 947 300 647 315 332Loan from formal institutions (1=yes) 726 263 463 216 247 946 301 645 314 331Logarithm of total annual household income 713 259 454 215 239 853 282 571 295 276Number of Household members 726 263 463 216 247 956 303 653 316 337
LandHarvest yield per acre (in Ksh 100,000) 726 263 463 216 247 956 303 653 316 337Proportion of land that is irrigated 1,117 367 750 373 377 956 303 653 316 337Total landholdings (Acres) 1,117 367 750 373 377 956 303 653 316 337Proportion of land devoted to cash crops 990 302 688 344 344 789 267 522 289 233
ProductionGrows export crops (1=yes) 1,052 334 718 355 363 889 268 621 298 323Sells to market (1=yes) 726 263 463 216 247 956 303 653 316 337Uses hired labor (1=yes) 1,117 367 750 373 377 956 303 653 316 337Uses Machinery and/or animal force (1=yes) 1,117 367 750 373 377 956 303 653 316 337Value of harvested produce (in Ksh 1,000) 699 257 442 208 234 904 289 615 302 313Production of french beans (in 1,000 Kg.) 1,051 334 717 355 362 930 294 636 309 327Production of baby corn (in Kg.) 1,051 334 717 355 362 930 294 636 309 327Total spent in marketing (in Khs 1,000) 722 263 459 213 246 931 294 637 309 328Use of inputs 1,032 317 715 354 361 790 267 523 290 233
Follow-upProportion of respondents reached at follow-up 0.86 0.83 0.87 0.85 0.89
Baseline Follow-up
Table 1cNumber of observations at baseline and follow-up
36
All
Credit
No credit
All
(1)(2)
(3)(4)
Treatm
ent group included credit0.108
0.110[0.084]
[0.084]M
ember
Age of m
ember
0.0020.002
0.0020.002
[0.002][0.003]
[0.001][0.002]
Literacy
0.1510.202
0.1060.148
[0.064]**[0.111]*
[0.074][0.065]**
Risk tolerance
-0.038-0.037
-0.043-0.040
[0.050][0.075]
[0.064][0.049]
Months as m
ember in S
HG
0.0010.002
0.0000.001
[0.001][0.001]
[0.002][0.001]
Mem
ber of SH
G is an officer (1=
yes)0.291
0.3960.175
0.296[0.057]***
[0.076]***[0.064]**
[0.057]***D
eposit in a formal bank (1=
yes)0.003
0.036-0.018
0.000[0.041]
[0.074][0.031]
[0.042]L
og of total annual household income
0.003-0.004
0.0130.103
[0.024][0.045]
[0.023][0.053]*
Log of total annual household incom
e squared-0.015[0.007]**
Num
ber of household mem
bers0.030
0.0260.035
0.031[0.008]***
[0.014][0.007]***
[0.008]***L
andHarvest yield per acre (in 100,000 K
sh)-0.006
-0.0910.019
-0.004[0.047]
[0.056][0.042]
[0.044]P
roportion of land that is irrigated0.074
0.0700.091
0.081[0.072]
[0.130][0.077]
[0.068]T
otal landholdings (Acres)
0.0270.021
0.0350.029
[0.014]*[0.023]
[0.017]*[0.014]*
Total landholdings S
quared (Acres)
Production
Grow
s export crops (1=yes)
0.0690.053
0.0950.058
[0.058][0.121]
[0.029]***[0.058]
Sells to m
arket (1=yes)
-0.133-0.168
-0.105-0.138
[0.043]***[0.071]**
[0.045]**[0.043]***
Uses hired labor (1=
yes)-0.065
-0.089-0.013
-0.067[0.059]
[0.070][0.103]
[0.058]U
ses Machinery and/or anim
al force (1=yes)-0.166
-0.168-0.097
-0.166[0.091]*
[0.130][0.099]
[0.090]*
Mean dependent variable
0.3400.415
0.2730.340
Observations
450212
238450
R squared
0.160.2
0.130.16
Table 2
Individual determinants of Participation in D
rumN
et OL
S
The
binarydependent
variableis
Drum
Net
mem
bership.The
column
"All"
usesthe
whole
sample
ofregistered
SHG
mem
bersat
thetim
eof
thebaseline
intreatm
entSH
Gs,
column
"Credit"
("No
credit")uses
thesubsam
pleof
registeredSH
Gm
embers
atthe
time
ofthe
baselinein
credit(no-
credit)SH
Gs.
Data
come
fromthe
baselinesurvey
conductedin
2004before
Drum
Net
was
introducedto
thetreatm
entSH
Gs.
Standarderrors
clusteredat
theSH
Gare
reportedin
bracketsbelow
thecoefficient.
The
symbol
*,**,***represent
significanceat
the10,
5and
1percent,
respectively.A
llregressions
areestim
atedusing
linearprobability
model.
SeeA
ppendixfor
definition of variables.
37
Export Crop
Proportion Land devoted to cash crops
Use of inputs
Production of french beans (1,000Kg.)
Production of baby corn (Kg.)
Value of harvested produce (in Khs 1,000)
Total spent in marketing (in Khs 1,000)
Logarithm of HH Income
Loan from Formal Institutions
Deposit in Formal Institutions
(1) (2) (3) (4) (5) (6) (7) (8) (9) (10)Post -0.004 -0.079 0.049 0.660 11.120 -7.094 3.569 -0.109 -0.053 0.123
[0.059] [0.018]*** [0.018]*** [0.769] [34.783] [5.136] [2.113] [0.097] [0.013]*** [0.029]***Post x Treatment 0.192 0.043 -0.004 1.620 396.711 4.883 -3.531 0.087 0.044 0.070
[0.067]*** [0.023]* [0.019] [1.270] [99.618]*** [6.269] [1.781]* [0.110] [0.016]*** [0.036]*Num. Observations 1983 1779 1822 1981 1981 1603 1653 1566 1672 1672R-squared 0.27 0.13 0.07 0.21 0.07 0.26 0.02 0.16 0.05 0.17
Export Crop
Proportion Land devoted to cash crops
Use of inputs
Production of french beans (in 1,000 Kg.)
Production of baby corn (Kg.)
Value of harvested produce (in Khs 1,000)
Total spent in marketing (in Khs 1,000)
Logarithm of HH Income
Loan from Formal Institutions
Deposit in Formal Institutions
Post -0.004 -0.079 0.049 0.662 11.304 -7.147 3.558 -0.110 -0.053 0.123[0.059] [0.018]*** [0.018]*** [0.770] [34.793] [5.136] [2.114] [0.097] [0.013]*** [0.029]***
Post x Credit 0.226 0.049 -0.009 2.338 460.965 2.164 -4.018 0.011 0.029 0.080[0.077]*** [0.027]* [0.022] [1.759] [148.606]*** [9.098] [2.017]* [0.118] [0.022] [0.044]*
Post x No Credit 0.159 0.037 0.001 0.926 334.676 7.338 -3.103 0.162 0.057 0.062[0.071]** [0.028] [0.020] [1.454] [125.350]** [6.175] [1.784]* [0.119] [0.014]*** [0.037]
Num. Observations 1983 1779 1822 1981 1981 1603 1653 1566 1672 1672R-squared 0.27 0.13 0.07 0.21 0.07 0.26 0.02 0.16 0.05 0.17Mean dep. variable 0.526 0.568 0.961 4.546 148.614 40.133 1.379 3.495 0.032 0.800
P-value of Test Post x Credit = Post x No credit 0.291 0.695 0.534 0.481 0.507 0.567 0.484 0.116 0.176 0.629
The variable Post takes value 1 in year 2005, when Follow-up was conducted. The variable Treatment is an indicator variable equal to one if the member is in atreatment SHG. The variables Credit and No Credit are indicator variables for each treatment group. All regressions are estimated using OLS with SHG fixedeffects. Robust standard errors are clustered at the SHG level and reported in brackets below the coefficient. The symbol *,**,*** represent significance at the 10, 5and 1 percent, respectively. Only SHG members at the time of the baseline are included in the regression. Controls: Age of member, literacy, member of SHG isan officer (1=yes), proportion of land that is irrigated, total landholdings (Acres), uses hired labor (1=yes) and uses Machinery and/or animal force (1=yes), andindicator variables for any missing values for each of the controls.
Panel A: Treatment
Table 3Impact of DrumNet
OLS
Panel B: Credit vs. No Credit
38
Grows export crops at baseline
Yes No Yes No Yes No Yes No Yes No Yes No Yes No Yes No Yes No
Post -0.099 -0.056 0.007 0.106 0.662 1.878 -17.879 64.576 -13.365 3.393 4.981 2.535 -0.129 -0.132 -0.068 -0.030 0.096 0.149[0.016]*** [0.033] [0.005] [0.042]** [1.547] [0.875]** [31.020] [48.646] [10.010] [5.047] [3.343] [2.153] [0.094] [0.176] [0.016]*** [0.017]* [0.026]*** [0.041]***
Post x Treatment -0.020 0.090 -0.007 -0.033 -3.902 4.885 488.962 338.619 5.194 4.163 -6.495 -1.494 -0.032 0.319 0.055 0.025 0.072 0.075[0.030] [0.040]** [0.007] [0.044] [2.055]* [2.085]** [128.038]*** [104.411]*** [12.658] [6.633] [3.318]* [1.914] [0.120] [0.182]* [0.022]** [0.022] [0.045] [0.051]
# Observations 818 909 822 947 894 1027 894 1027 774 770 800 793 764 744 802 799 802 799R-squared 0.18 0.14 0.03 0.11 0.46 0.19 0.1 0.08 0.37 0.23 0.03 0.1 0.2 0.19 0.08 0.07 0.17 0.23
Grows export crops at baseline
Yes No Yes No Yes No Yes No Yes No Yes No Yes No Yes No Yes No
Post -0.099 -0.057 0.007 0.106 0.660 1.876 -17.528 64.570 -13.377 3.548 4.971 2.561 -0.130 -0.134 -0.068 -0.031 0.096 0.150[0.016]*** [0.033]* [0.005] [0.042]** [1.548] [0.876]** [30.975] [48.661] [10.011] [5.030] [3.345] [2.158] [0.094] [0.176] [0.016]*** [0.017]* [0.026]*** [0.041]***
Post x Credit -0.026 0.122 -0.014 -0.032 -4.729 8.075 619.863 351.988 3.548 12.032 -7.553 -0.386 -0.012 0.219 0.059 -0.019 0.063 0.134[0.033] [0.046]** [0.008]* [0.048] [2.313]** [2.604]*** [200.536]*** [136.257]** [15.795] [5.042]** [3.566]** [2.127] [0.140] [0.188] [0.031]* [0.025] [0.062] [0.049]***
Post x No Credit -0.013 0.059 0.004 -0.034 -2.854 2.405 323.076 328.227 7.325 -0.433 -5.156 -2.118 -0.061 0.384 0.051 0.049 0.083 0.042[0.047] [0.043] [0.010] [0.045] [2.433] [2.569] [114.656]*** [144.763]** [13.827] [7.641] [3.256] [1.894] [0.140] [0.195]* [0.020]** [0.022]** [0.047]* [0.059]
#Observations 818 909 822 947 894 1027 894 1027 774 770 800 793 764 744 802 799 802 799R-squared 0.18 0.14 0.03 0.11 0.46 0.2 0.1 0.08 0.37 0.23 0.03 0.1 0.2 0.19 0.08 0.08 0.17 0.23Mean dep. Var 0.654 0.495 0.996 0.930 6.861 2.751 147.642 156.560 49.966 30.085 1.979 0.768 3.640 3.354 0.035 0.029 0.812 0.782
P-value of Test Post x Credit = Post x No credit0.804 0.129 0.144 0.945 0.453 0.108 0.204 0.901 0.818 0.052 0.192 0.166 0.747 0.150 0.815 0.009 0.765 0.096
The variable Post takes value 1 in year 2005, when Follow-up was conducted. The variable Treatment is an indicator variable equal to one if the member is in a treatment SHG. The variables Credit and No Credit are indicator variables for each treatmentgroup. All regressions are estimated using OLS with SHG fixed effects. Robust standard errors are clustered at the SHG level and reported in brackets below the coefficient. The symbol *,**,*** represent significance at the 10, 5 and 1 percent,respectively. Only SHG members at the time of the baseline are included in the regression. Controls: Age of member, literacy, member of SHG is an officer (1=yes), proportion of land that is irrigated, total landholdings (Acres), uses hired labor (1=yes)and uses Machinery and/or animal force (1=yes), and indicator variables for any missing values for each of the controls.
Pct. Land devoted to cash crops
Logarithm of HH Income
Total spent in marketing (in Khs
1,000)
Value of harvested produce (in Khs 1,000)
Use of inputsProduction of french
beans (1,000 Kg.)Production of baby corn
(Kg.)Loan from Formal
InstitutionsDeposit in Formal
Institutions
Panel B: Credit vs. No Credit
Pct. Land devoted to cash crops
Logarithm of HH Income
Loan from Formal Institutions
Use of inputsProduction of baby corn
(Kg.) Value of harvested
produce (in Khs 1,000)
Total spent in marketing (in Khs
1,000)
Deposit in Formal Institutions
Table 4. Impact of DrumNet (Prior Exporters versus New Adopters)OLS
Production of french beans (1,000 Kg.)
Panel A: Treatment
39
Mem
berA
llT
reatment
Control
Credit
No credit
Age of m
ember
0.0010.002
-0.0010.004
0.000[0.002]
[0.002][0.002]
[0.003][0.003]
Literacy
-0.0060.063
-0.1310.074
0.068[0.061]
[0.056][0.109]
[0.106][0.072]
Risk tolerance
-0.025-0.039
-0.022-0.049
-0.048[0.037]
[0.051][0.066]
[0.079][0.073]
Months as m
ember in S
HG
0.0010.001
0.0010.001
0.001[0.000]**
[0.000]**[0.001]
[0.001][0.001]**
Mem
ber of SH
G is an officer (1=
yes)0.271
0.2730.277
0.2940.259
[0.032]***[0.039]***
[0.064]***[0.047]***
[0.066]***D
eposit in a formal bank (1=
yes)-0.010
-0.0560.075
-0.025-0.079
[0.046][0.048]
[0.085][0.077]
[0.059]L
ogarithm of total annual household incom
e0.021
0.0210.031
0.0000.061
[0.013][0.016]
[0.029][0.020]
[0.020]**N
umber of household m
embers
0.0080.013
-0.0010.016
0.009[0.007]
[0.008][0.013]
[0.012][0.010]
LandH
arvest yield per acre (in 100,000 Ksh)
-0.001-0.001
0.000-0.002
0.000[0.000]*
[0.000]*[0.001]
[0.001]**[0.000]
Proportion of land that is irrigated
-0.054-0.040
-0.0330.045
-0.092[0.055]
[0.055][0.160]
[0.094][0.072]
Total landholdings (A
cres)-0.007
-0.0090.004
-0.003-0.022
[0.012][0.017]
[0.016][0.022]
[0.028]P
roductionG
rows export crops (1=
yes)-0.075
-0.114-0.001
-0.083-0.081
[0.033]**[0.041]**
[0.059][0.054]
[0.069]S
ells to market (1=
yes)0.044
0.0290.062
0.086-0.045
[0.033][0.039]
[0.072][0.059]
[0.040]U
ses hired labor (1=yes)
-0.011-0.005
-0.0150.060
-0.095[0.034]
[0.047][0.048]
[0.075][0.046]*
Uses M
achinery and/or animal force (1=
yes)0.063
0.1120.027
0.0670.196
[0.047][0.066]
[0.061][0.105]
[0.050]***
Observations
663427
236204
223R
-squared0.1
0.110.11
0.150.14
Appendix T
able 1. Attrition R
egressions
The dependent variable takes value 1 if the respondent w
as also interviewed at follow
-up.