Embed Size (px)
Citation preview
Finding our Voice with ShareholdersPresentation to Marketing Executives ConferenceOklahoma City, Oklahoma
September 29, 2014
Doug Petitt
Chief Information Officer
Vice President Information Technology and Customer Service
Gas55%
Gas55%
Page 2
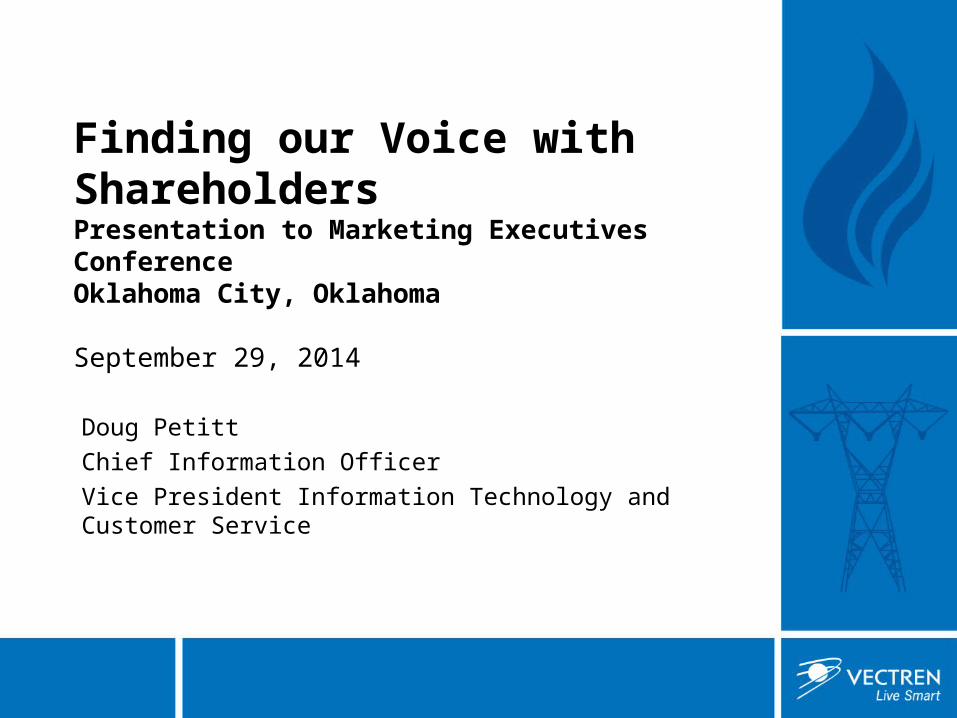
12th largest public company in Indiana (by 2013 revenue)– $5.1 billion in assets– $2.4 billion in revenues
Serve more than 1 million gas customers in three territories:– Vectren Energy Delivery of
Indiana – South (150 thousand Electric customers)
– Vectren Energy Delivery of Indiana – North
– Vectren Energy Delivery of Ohio Market cap $ 3.3 Bn
Vectren at a glance
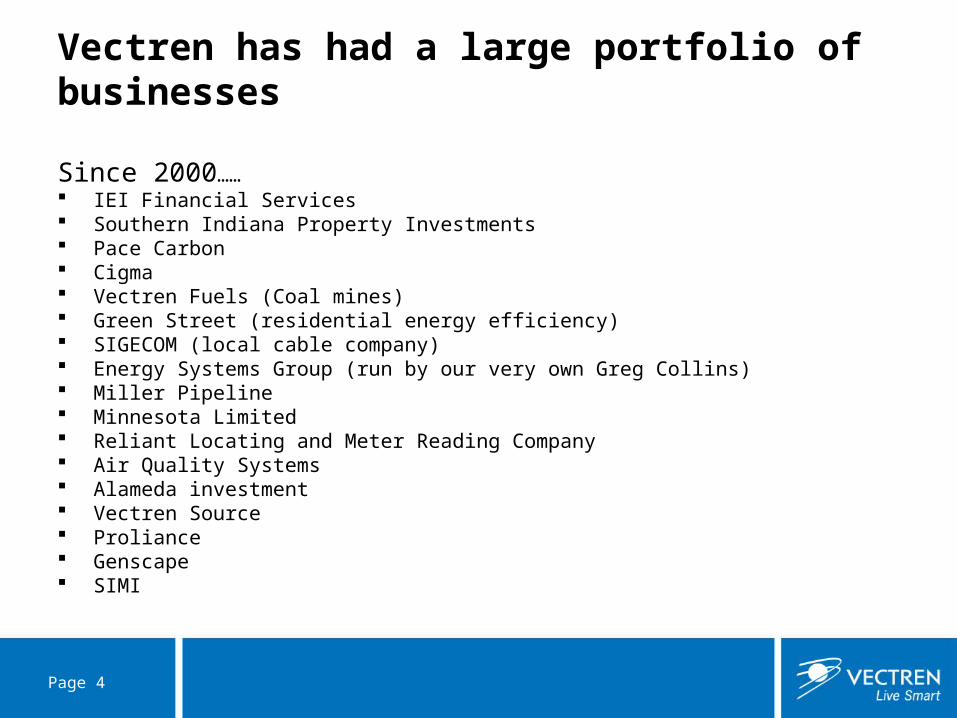
Vectren has had a large portfolio of businesses
Since 2000…… IEI Financial Services Southern Indiana Property Investments Pace Carbon Cigma Vectren Fuels (Coal mines) Green Street (residential energy efficiency) SIGECOM (local cable company) Energy Systems Group (run by our very own Greg Collins) Miller Pipeline Minnesota Limited Reliant Locating and Meter Reading Company Air Quality Systems Alameda investment Vectren Source Proliance Genscape SIMI
Page 4
We have been on the path of De-risking our Company,
resulting in consistent Earnings Growth
Our “de-risking” strategy … part 1
Spent the better part of the last 7 or 8 years unwinding/exiting businesses. Most recently we:
Sold Vectren Source to Direct Energy in 2011
Purchased Minnesota Limited in 2011
Shut down Green Street in 2013
Sold ProLiance to Energy Transfer Partners In 2013
Sold Vectren Fuels to Sunrise Coal (Hallador Energy) in 2014
Purchased Chevron Energy Services in 2014
We have deliberately minimized our commodity exposure
Page 6
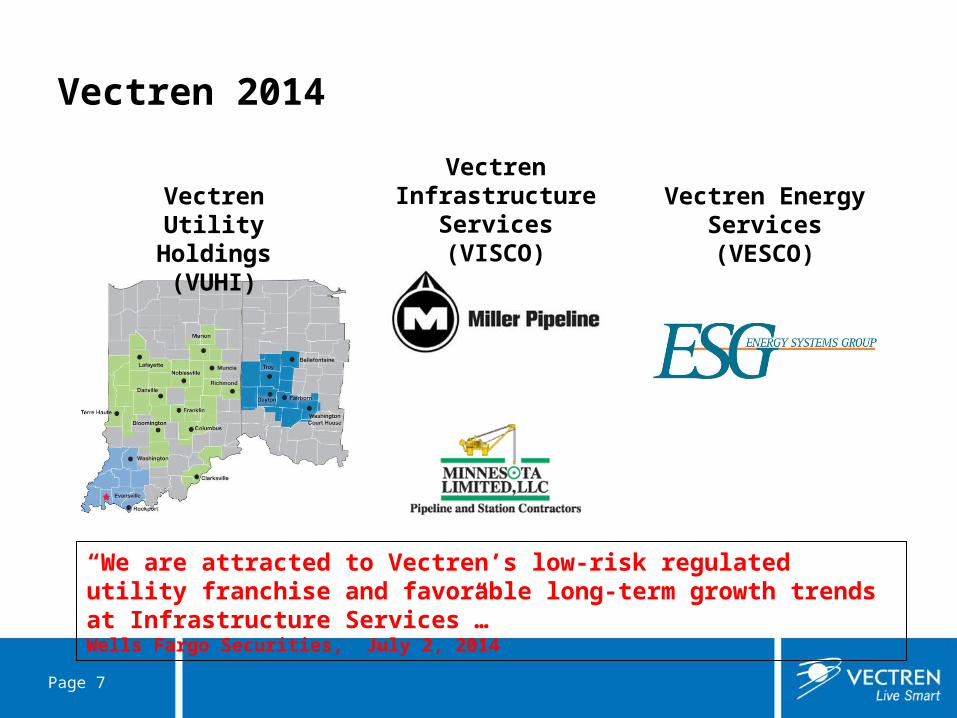
Vectren 2014
Page 7
Vectren Utility Holdings (VUHI)
Vectren Infrastructure
Services (VISCO)Vectren Energy
Services (VESCO)
“We are attracted to Vectren’s low-risk regulated utility franchise and favorable long-term growth trends at Infrastructure Services”…Wells Fargo Securities, July 2, 2014
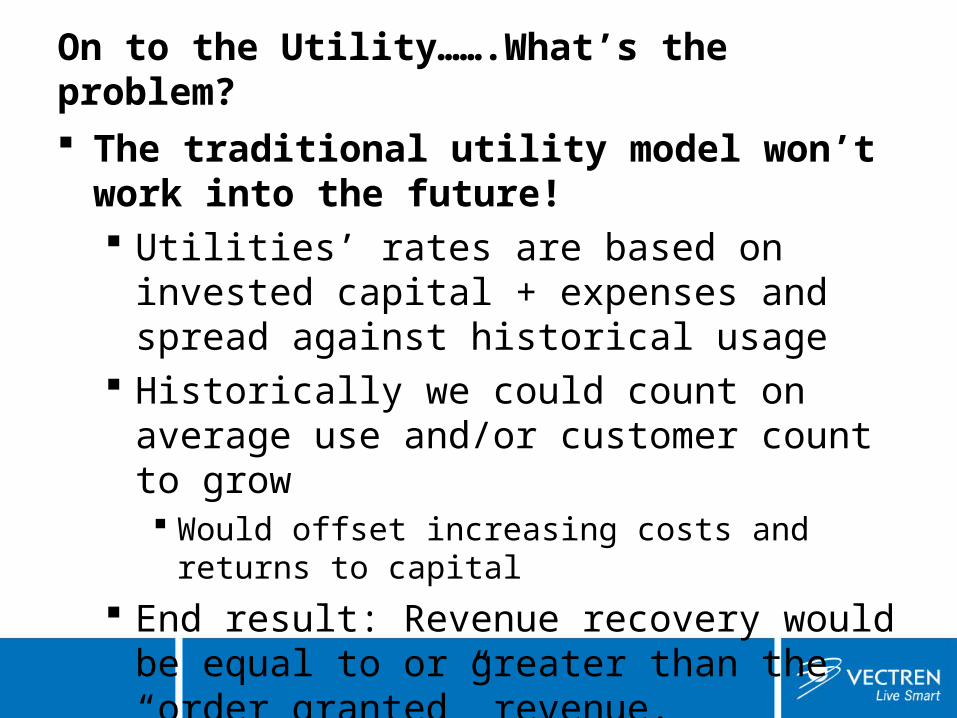
On to the Utility…….What’s the problem? The traditional utility model won’t work into
the future! Utilities’ rates are based on invested capital +
expenses and spread against historical usage Historically we could count on average use
and/or customer count to grow Would offset increasing costs and returns to capital
End result: Revenue recovery would be equal to or greater than the “order granted” revenue.
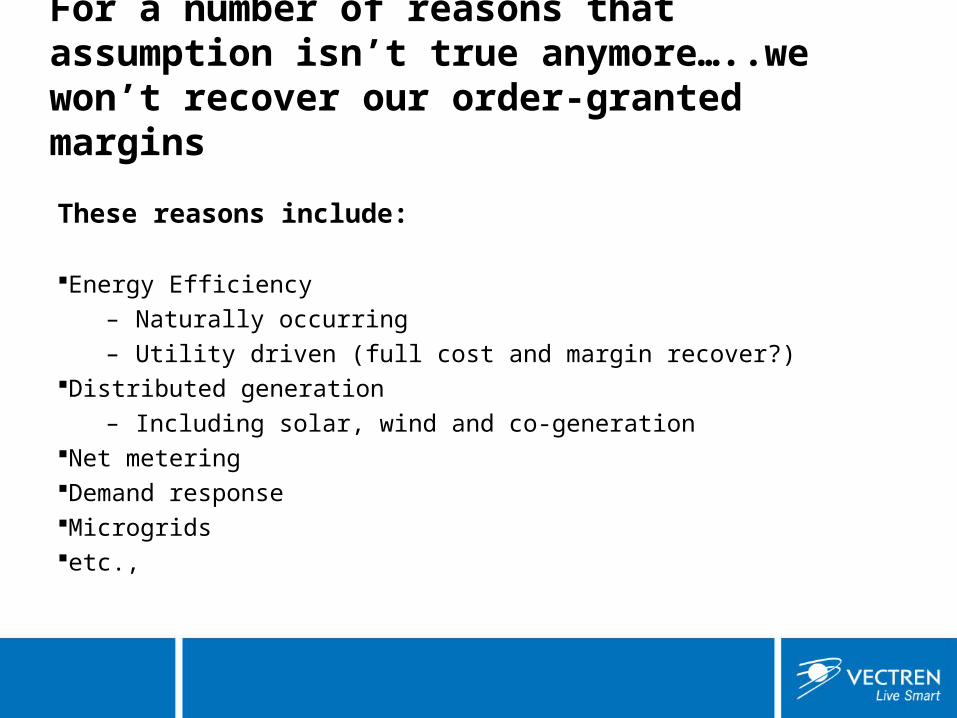
For a number of reasons that assumption isn’t true anymore…..we won’t recover our order-granted margins
These reasons include:
Energy Efficiency– Naturally occurring– Utility driven (full cost and margin recover?)
Distributed generation – Including solar, wind and co-generation
Net meteringDemand responseMicrogridsetc.,
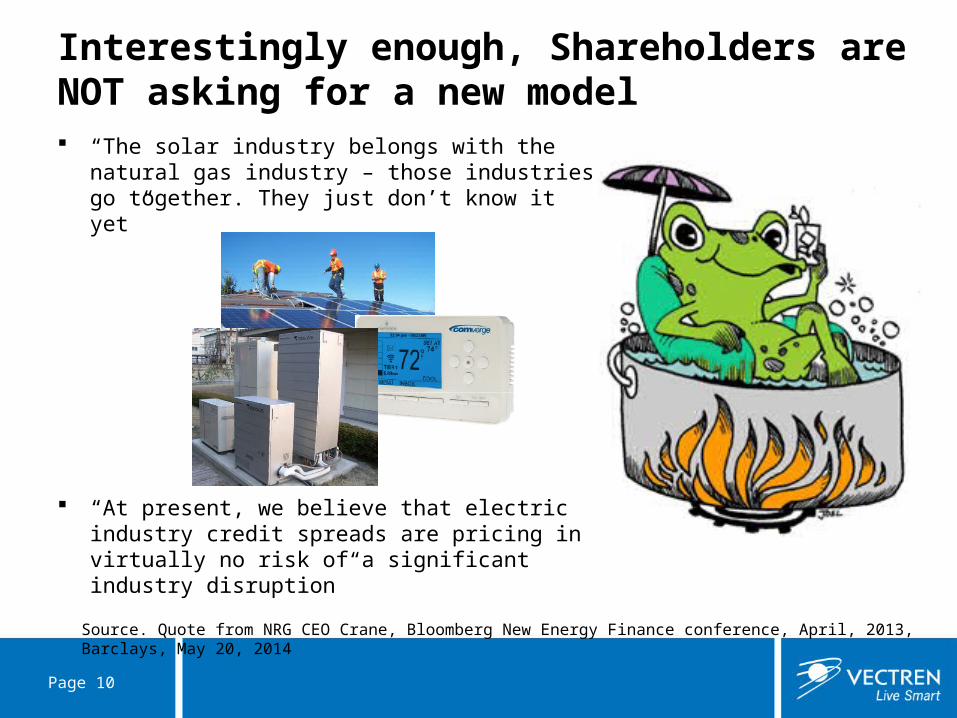
Interestingly enough, Shareholders are NOT asking for a new model
Page 10
“The solar industry belongs with the natural gas industry – those industries go together. They just don’t know it yet”
“At present, we believe that electric industry credit spreads are pricing in virtually no risk of a significant industry disruption”
Source. Quote from NRG CEO Crane, Bloomberg New Energy Finance conference, April, 2013, Barclays, May 20, 2014
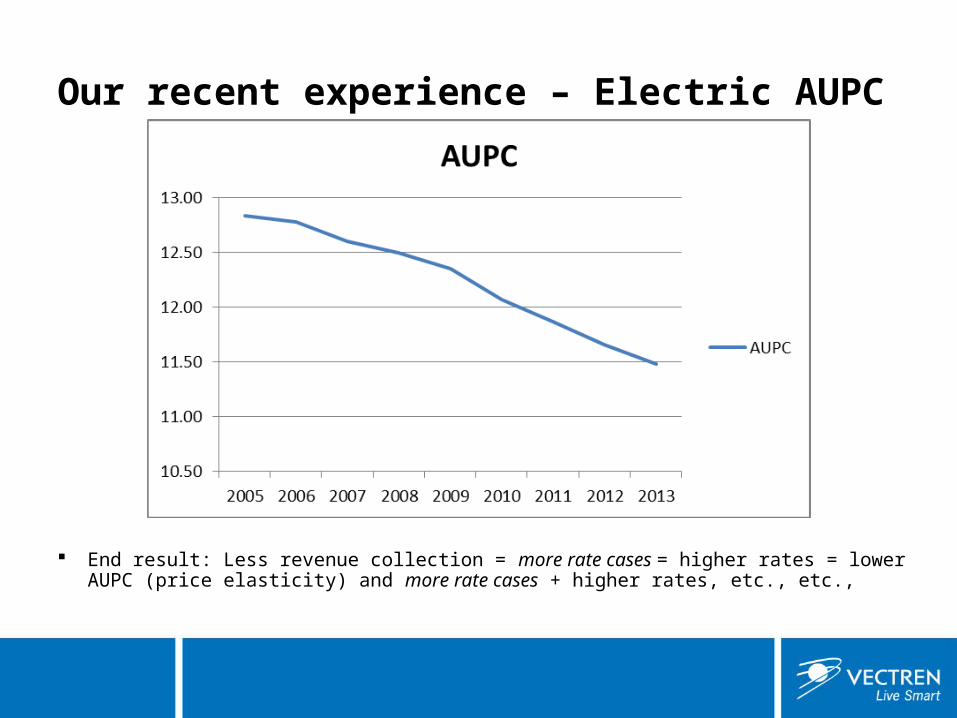
Our recent experience – Electric AUPC
End result: Less revenue collection = more rate cases = higher rates = lower AUPC (price elasticity) and more rate cases + higher rates, etc., etc.,
The challenge …
Page 12

We’ve dealt with this in the past
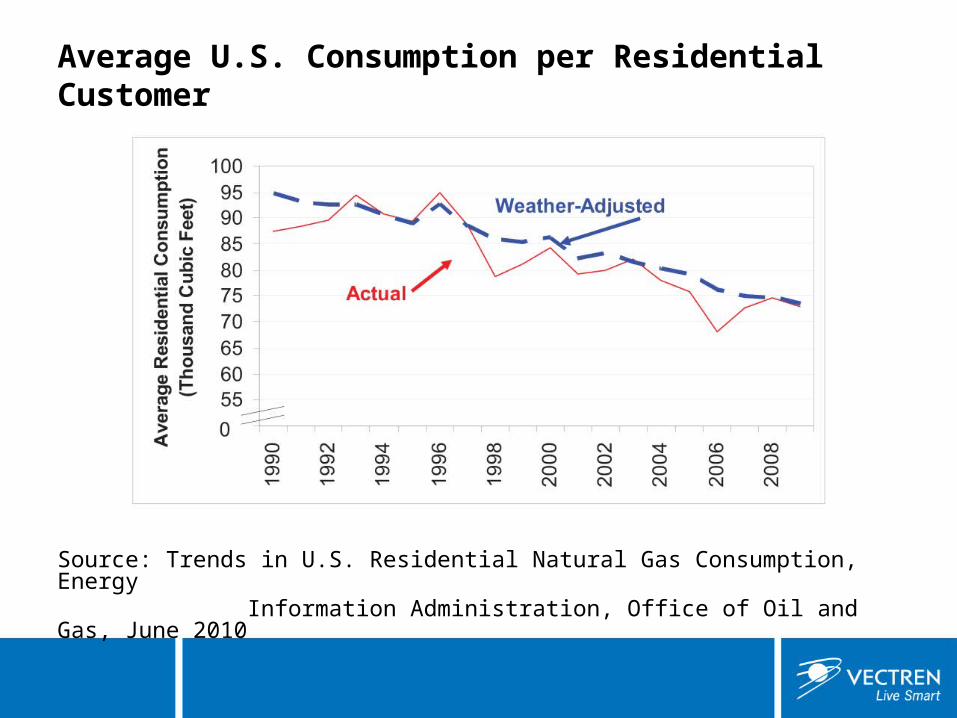
Average U.S. Consumption per Residential Customer
Source: Trends in U.S. Residential Natural Gas Consumption, Energy Information Administration, Office of Oil and Gas, June 2010
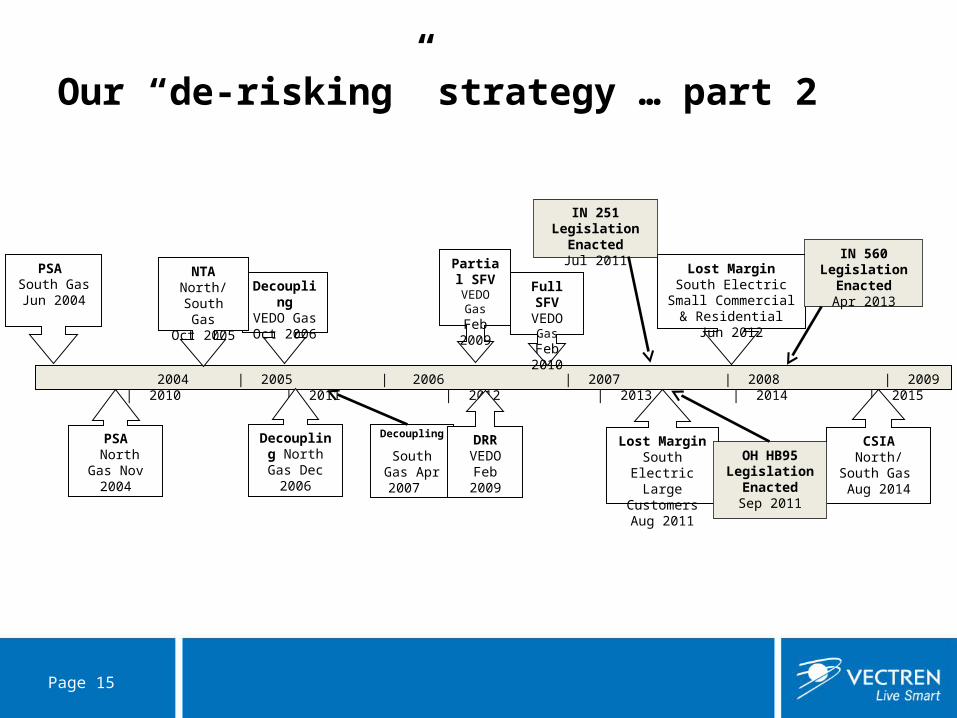
Our “de-risking” strategy … part 2
Page 15
D Decoupling North Gas
Decoupling
South Gas Apr 200706
ecoupling North Gas Dec 2006
2004 | 2005 | 2006 | 2007 | 2008 | 2009 | 2010 | 2011 | 2012 | 2013 | 2014 | 2015
DecouplingVEDO GasOct 2006
NTANorth/South
GasOct 2005
PSA South Gas Jun
2004
PSA North Gas Nov 2004
Lost MarginSouth Electric
Large CustomersAug 2011
Partial SFV
VEDO GasFeb 2009
Lost MarginSouth Electric
Small Commercial & Residential Jun 2012
Decoupling North Gas Dec 2006
Full SFVVEDO GasFeb 2010
CSIANorth/South
Gas Aug 2014
DRRVEDO
Feb 2009
IN 251 Legislation EnactedJul 2011
IN 560 Legislation EnactedApr 2013
OH HB95 Legislation
EnactedSep 2011
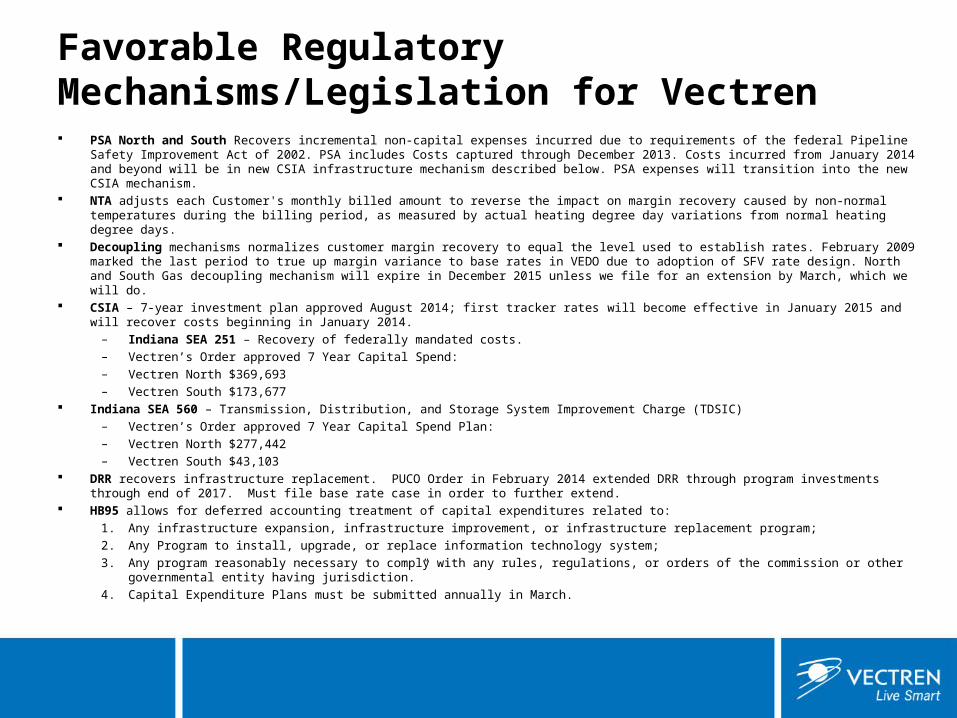
Favorable Regulatory Mechanisms/Legislation for Vectren PSA North and South Recovers incremental non-capital expenses incurred due to requirements of the federal Pipeline Safety Improvement
Act of 2002. PSA includes Costs captured through December 2013. Costs incurred from January 2014 and beyond will be in new CSIA infrastructure mechanism described below. PSA expenses will transition into the new CSIA mechanism.
NTA adjusts each Customer's monthly billed amount to reverse the impact on margin recovery caused by non-normal temperatures during the billing period, as measured by actual heating degree day variations from normal heating degree days.
Decoupling mechanisms normalizes customer margin recovery to equal the level used to establish rates. February 2009 marked the last period to true up margin variance to base rates in VEDO due to adoption of SFV rate design. North and South Gas decoupling mechanism will expire in December 2015 unless we file for an extension by March, which we will do.
CSIA – 7-year investment plan approved August 2014; first tracker rates will become effective in January 2015 and will recover costs beginning in January 2014.– Indiana SEA 251 – Recovery of federally mandated costs. – Vectren’s Order approved 7 Year Capital Spend:– Vectren North $369,693– Vectren South $173,677
Indiana SEA 560 – Transmission, Distribution, and Storage System Improvement Charge (TDSIC) – Vectren’s Order approved 7 Year Capital Spend Plan:– Vectren North $277,442– Vectren South $43,103
DRR recovers infrastructure replacement. PUCO Order in February 2014 extended DRR through program investments through end of 2017. Must file base rate case in order to further extend.
HB95 allows for deferred accounting treatment of capital expenditures related to:
1. Any infrastructure expansion, infrastructure improvement, or infrastructure replacement program;
2. Any Program to install, upgrade, or replace information technology system;
3. Any program reasonably necessary to comply with any rules, regulations, or orders of the commission or other governmental entity having jurisdiction.”
4. Capital Expenditure Plans must be submitted annually in March.
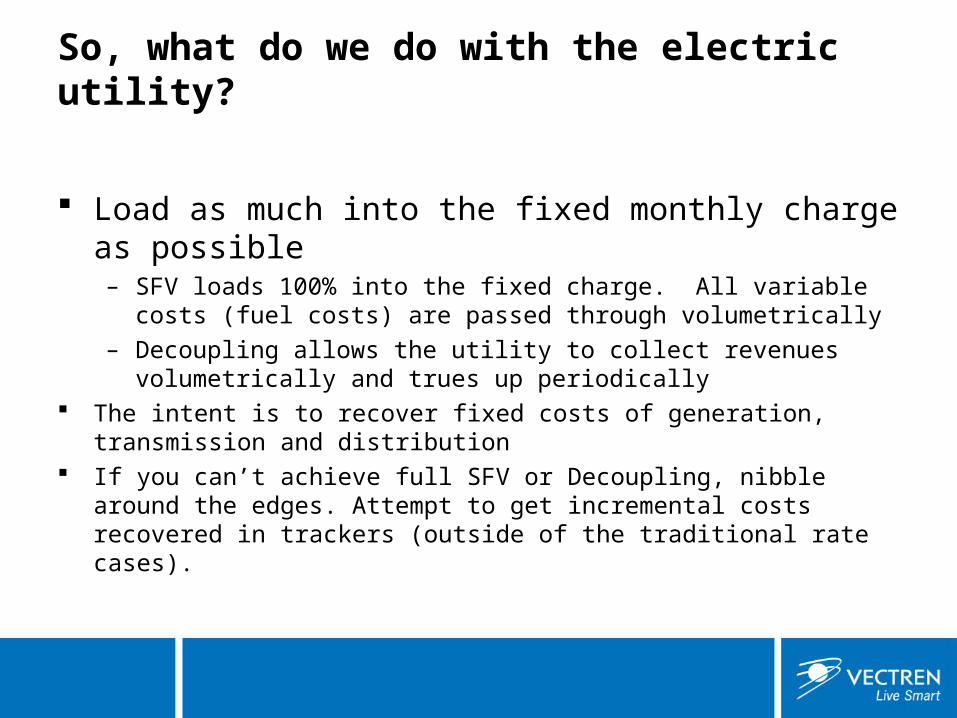
So, what do we do with the electric utility?
Load as much into the fixed monthly charge as possible– SFV loads 100% into the fixed charge. All variable costs (fuel costs) are
passed through volumetrically– Decoupling allows the utility to collect revenues volumetrically and trues
up periodically The intent is to recover fixed costs of generation, transmission and distribution If you can’t achieve full SFV or Decoupling, nibble around the edges. Attempt
to get incremental costs recovered in trackers (outside of the traditional rate cases).
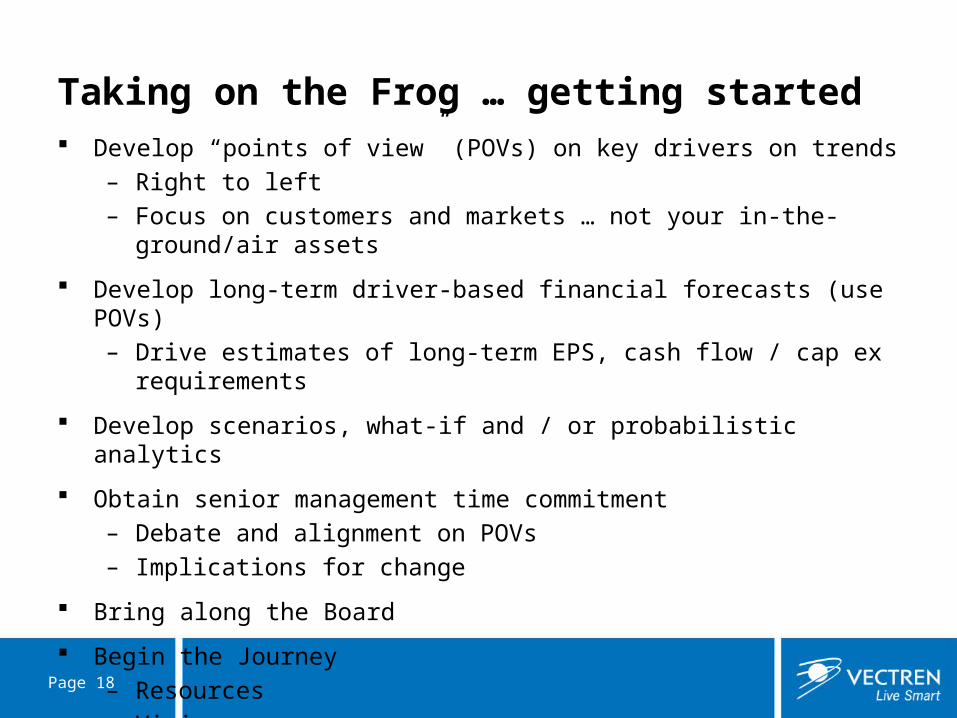
Taking on the Frog … getting started Develop “points of view” (POVs) on key drivers on trends
– Right to left– Focus on customers and markets … not your in-the-ground/air assets
Develop long-term driver-based financial forecasts (use POVs)– Drive estimates of long-term EPS, cash flow / cap ex requirements
Develop scenarios, what-if and / or probabilistic analytics
Obtain senior management time commitment – Debate and alignment on POVs – Implications for change
Bring along the Board
Begin the Journey– Resources– Vision
Page 18
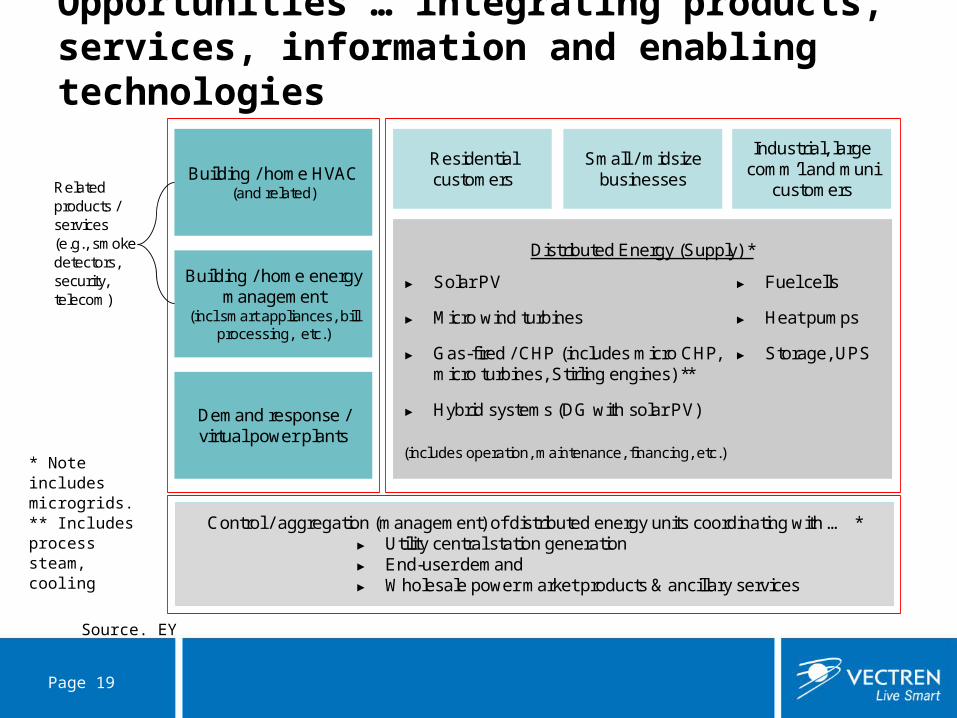
Opportunities … integrating products, services, information and enabling technologies
Page 19
Related products / services (e.g., smoke detectors, security, telecom)
Control / aggregation (management) of distributed energy units coordinating with … *► Utility central station generation► End-user demand► Wholesale power market products & ancillary services
Building / home HVAC(and related)
Building / home energy management
(incl smart appliances, bill processing, etc.)
Demand response / virtual power plants
Residential customers
Small / midsize businesses
Industrial, large comm’l and muni
customers
Distributed Energy (Supply) *
► Solar PV
► Micro wind turbines
► Gas-fired / CHP (includes micro CHP, micro turbines, Stirling engines) **
► Hybrid systems (DG with solar PV)
► Fuel cells
► Heat pumps
► Storage, UPS
(includes operation, maintenance, financing, etc.)* Note includes microgrids.** Includes process steam, cooling
Source. EY
20
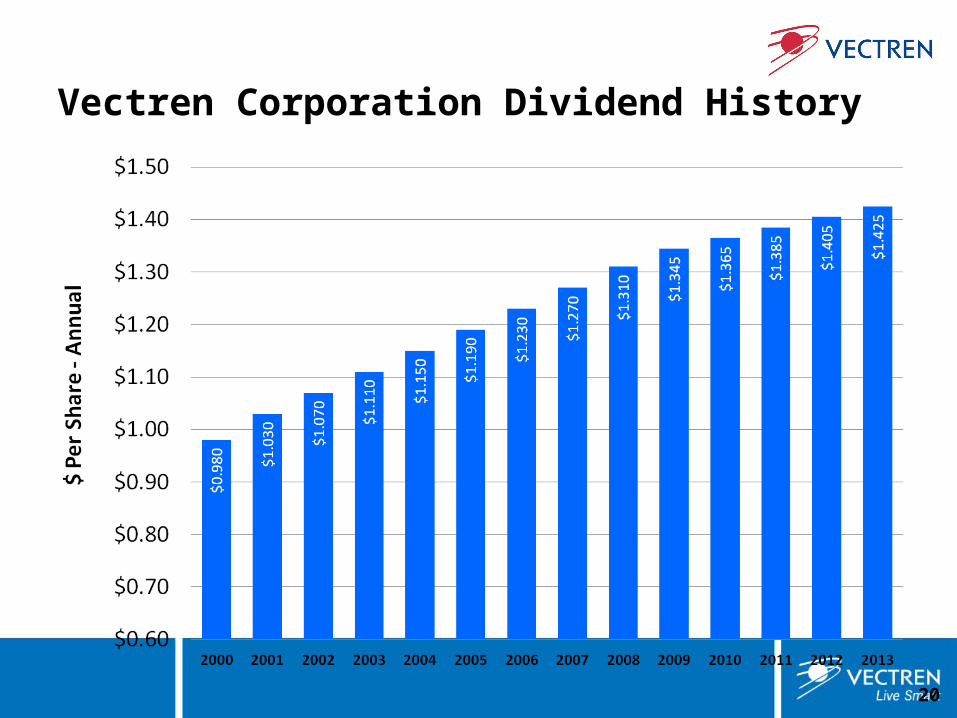
Vectren Corporation Dividend History
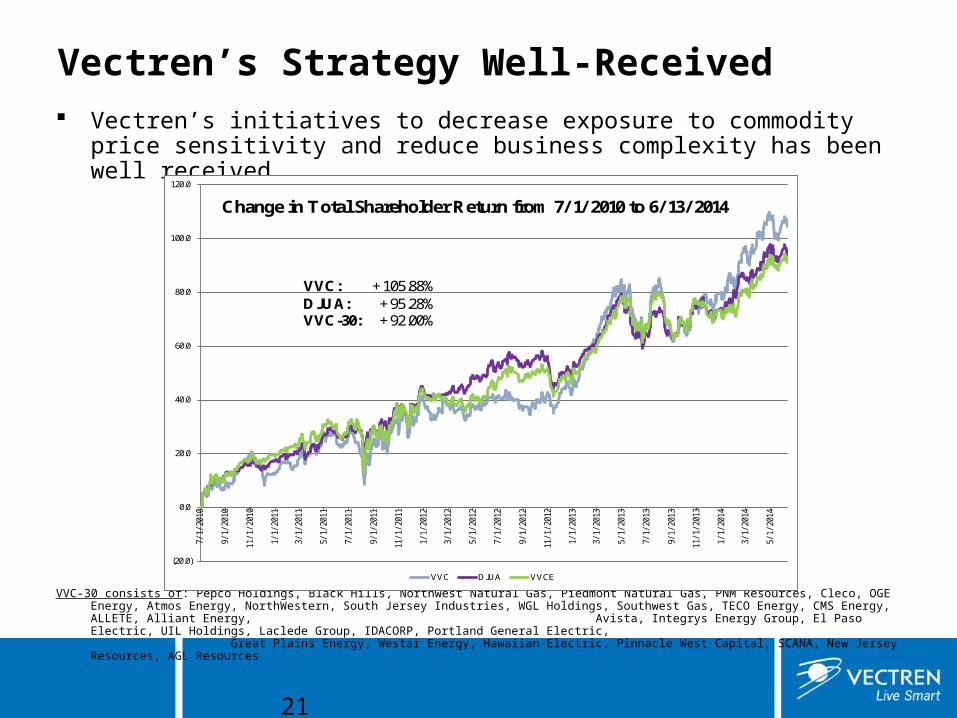
Vectren’s initiatives to decrease exposure to commodity price sensitivity and reduce business complexity has been well received
VVC-30 consists of: Pepco Holdings, Black Hills, Northwest Natural Gas, Piedmont Natural Gas, PNM Resources, Cleco, OGE Energy, Atmos Energy, NorthWestern, South Jersey Industries, WGL Holdings, Southwest Gas, TECO Energy, CMS Energy, ALLETE, Alliant Energy, Avista, Integrys Energy Group, El Paso Electric, UIL Holdings, Laclede Group, IDACORP, Portland General Electric, Great Plains Energy, Westar Energy, Hawaiian Electric, Pinnacle West Capital, SCANA, New Jersey Resources, AGL Resources
(20.0)
0.0
20.0
40.0
60.0
80.0
100.0
120.0
7/1/2010
9/1/2010
11/1/2010
1/1/2011
3/1/2011
5/1/2011
7/1/2011
9/1/2011
11/1/2011
1/1/2012
3/1/2012
5/1/2012
7/1/2012
9/1/2012
11/1/2012
1/1/2013
3/1/2013
5/1/2013
7/1/2013
9/1/2013
11/1/2013
1/1/2014
3/1/2014
5/1/2014
VVC DJUA VVCE
Change in StockPrice from 7/ 1/ 2010 to 6/ 13/ 2014
VVC: +105.88%DJUA: +95.28%VVC-30: +92.00%
Vectren’s Strategy Well-Received
21
(20.0)
0.0
20.0
40.0
60.0
80.0
100.0
120.0
7/1/2010
9/1/2010
11/1/2010
1/1/2011
3/1/2011
5/1/2011
7/1/2011
9/1/2011
11/1/2011
1/1/2012
3/1/2012
5/1/2012
7/1/2012
9/1/2012
11/1/2012
1/1/2013
3/1/2013
5/1/2013
7/1/2013
9/1/2013
11/1/2013
1/1/2014
3/1/2014
5/1/2014
VVC DJUA VVCE
Change in TotalShareholder Return from 7/ 1/ 2010 to 6/ 13/ 2014
VVC: +105.88%DJUA: +95.28%VVC-30: +92.00%
The game is changing…..
Conclusion
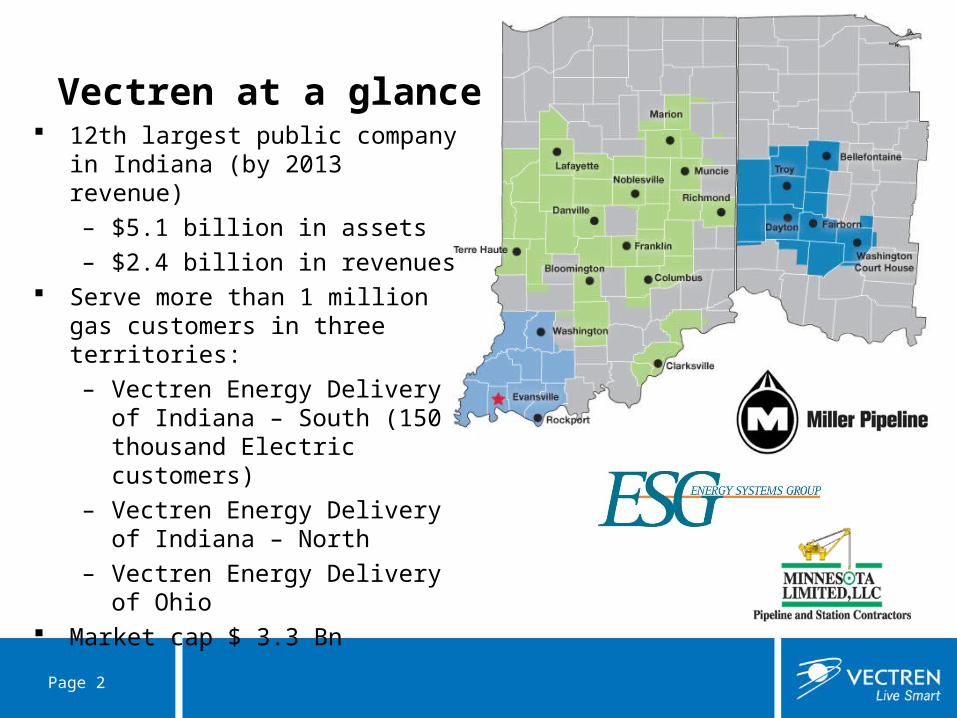
How do you satisfy Shareholders?– Satisfy your Customers!– Have constructive relationships with your Regulators!– Focus on long term shareholder value creation
o Consistent and predictable earnings (do what you said you were going to do
o Appreciable stock growtho Dividend growth o Predictable earnings