Embed Size (px)
Citation preview

HAL Id: tel-01697620https://tel.archives-ouvertes.fr/tel-01697620
Submitted on 31 Jan 2018
HAL is a multi-disciplinary open accessarchive for the deposit and dissemination of sci-entific research documents, whether they are pub-lished or not. The documents may come fromteaching and research institutions in France orabroad, or from public or private research centers.
L’archive ouverte pluridisciplinaire HAL, estdestinée au dépôt et à la diffusion de documentsscientifiques de niveau recherche, publiés ou non,émanant des établissements d’enseignement et derecherche français ou étrangers, des laboratoirespublics ou privés.
Finding pathways for enhancing irrigated farmingsystems in Lebanon
Mohamad El Khansa
To cite this version:Mohamad El Khansa. Finding pathways for enhancing irrigated farming systems in Lebanon. Agri-cultural sciences. Université Montpellier, 2017. English. �NNT : 2017MONTT104�. �tel-01697620�

Page 0 of 166
THÈSE POUR OBTENIR LE GRADE DE DOCTEUR
DE L’UNIVERSITÉ DE MONTPELLIER
En Doctorat Eaux Continentales
École doctorale GAIA
Unité de recherche : HSM-Hydrosciences Montpellier
Finding pathways for enhancing irrigated
farming systems in Lebanon
Présentée par Mohamad El Khansa Le 30 Novembre 2017
Devant le jury composé de Fabienne TROLARD STOLL, Directeur de Recherche
Hatem BELHOUCHETTE, Chargé de Recherche
Salem DARWICH, Professeur
Roger MOUSSA, Directeur de Recherche
Samir MEDAWAR, Professeur
Rabi H. MOHTAR, Professeur
Severin PISTRE, Professeur des universités
Président du jury
Membre du jury
Membre du jury
Membre du jury
Rapporteur
Rapporteur
Directeur de Thèse.

Page 1 of 166
Acknowledgement
This thesis would not have been possible without the valuable contribution of a number of
esteemed persons who have supported me during all the last four years.
I would like first to thank my thesis supervisor Prof. Séverin Pistre for his leadership throughout
this journey, and his insightful guidance and encouragement.
And I would like secondly to express my sincere gratitude to my advisor Dr. Hatem Belhouchette
for the continuous support of my Ph.D. study and related research; for his patience, motivation,
and immense knowledge. His guidance helped me in all the time of research and writing of this
thesis. I could not have imagined having a better advisor and mentor for my study.
I am indebted also to Prof. Salem Darwich who encouraged me in the first place to continue
pursuing my Ph.D. degree, and generously supported me throughout the steps taken.
Besides my advisors, I would like to thank the rest of my thesis committee: Dr. Pierre Ruelle, and
Prof. Roger Moussa for their insightful comments and encouragement, but also for the hard
question which incented me to widen my research from various perspectives.
My sincere thanks also go to Dr. Roza Chenoune, Mariem Baccar, and Farah Kanj for their
valuable inputs which helped making this work achievable.
I am also grateful to the Mediterranean Agronomic Institute of Montpellier, management and
staff, who provided the right atmosphere for me to work during the past years. Without this
precious support, it would not be possible to conduct this research.
My deepest thanks go to H.E. Minister Hussein El Hajj Hassan, for his support and
understanding of this late journey.
Last but not the least, I would like to thank my family:
My Parents and my Brother, for whom I am glad that we have witnessed together the completion
of this delayed, unfinished business.
My wife, all the words would not be enough to express my sincere gratitude for her support,
patience, encouragement, and care.
And my Son and Daughters, for their special encouragement, and whom I am blissful to see them
motivated to continue higher education.
Mohamad El Khansa

Page 2 of 166
Table of contents Abstract 9
Résumé 12
General introduction ............................................................................................................................... 14
CHAPTER 1: THE AGRICULTURAL SECTOR IN LEBANON: LIMITS AND OPPORTUNITIES .......................... 17
GENEREAL OBJECTIVES ................................................................................................................. 18
1. BACKGROUND INFORMATION ................................................................................................. 18
1.1 Introduction – Country Characteristics.................................................................................. 18
1.2 Agro-Climatic Zones in Lebanon ............................................................................................ 20
1.3 Agriculture Sector in Lebanon ................................................................................................ 21
1.3.1 Local Agricultural Production and Trade .......................................................................... 22
1.3.2 Cultivated Area ................................................................................................................... 25
1.3.3 Agricultural Labor .............................................................................................................. 26
1.3.4 Challenges and Opportunities of the Agriculture Sector .................................................... 27
2. STATUS OF WATER ....................................................................................................................... 29
2.1 Sources of Water ....................................................................................................................... 29
2.2 Exploitation ............................................................................................................................... 30
2.3 Water Uses by Sector ................................................................................................................ 33
2.4 Effects of Climate Change ........................................................................................................ 35
2.5 Irrigation Practices and Water Availability ........................................................................... 36
3. OBJECTIVES OF THE STUDY ..................................................................................................... 40
3.1 General objective .......................................................................................................................... 40
3.2 Methodological approach for conducting this study ................................................................. 41
CHAPTER 2: PLANNING FOR THE LEBANESE AGRICULTURE SECTOR ...................................................... 46
OBJECTIVES OF THE CHAPTER ................................................................................................................. 47
1. ROLES AND FUNCTIONS OF AGRICULTURAL POLICIES ................................................. 47
2. CHRONOLOGICAL EVOLUTION OF AGRICULTURAL POLICY IN LEBANON ............ 48
2.1 The 1960s and the war years: from immobility to reconstruction .............................................. 49
2.2 The 2010-2014 Agricultural Development Strategy ..................................................................... 51
2.3 Results of 2010-2014 Agricultural Development Strategy ........................................................... 53
2.4 The 2015-2019 Strategy of the Ministry of Agriculture ............................................................... 55
3. AVAILABLE SUBSIDIES FOR THE AGRICULTURAL SECTOR .......................................... 59
Page 3 of 166
3.1. Current Subsidies ........................................................................................................................... 59
3.2 Subsidized Agricultural Products .................................................................................................. 60
CHAPTER 3: ASSESSING THE DIVERSITY OF IRRIGATED FARMING PRODUCTION SYSTEMS
PERFORMANCES IN SEMI-ARID AREAS: LEBANON CASE STUDY. ........................................................ 70
1. INTRODUCTION ............................................................................................................................. 71
2. MATERIALS AND METHODS ...................................................................................................... 72
2.1 Characteristics of the Study Area .................................................................................................. 72
2.2 Farming systems and performance characterization ................................................................... 74
2.2.1 Survey at farm level.................................................................................................................... 74
2.2.2 Farm Typology ........................................................................................................................... 79
2.2.3 Sensitivity Analysis ..................................................................................................................... 81
3. RESULTS ........................................................................................................................................... 83
3.1 Estimation of quantities of irrigation water per crop. .................................................................. 83
3.2 Farming and cropping systems diversity. ...................................................................................... 85
3.3 Farm typology .................................................................................................................................. 86
3.3.1 Results of principal component analysis (PCA) ......................................................................... 86
3.3.2 Description of farm types ........................................................................................................... 87
3.4 Analysis of socio-economic and environmental indicators........................................................... 89
3.5 Productivity analysis ....................................................................................................................... 92
3.6 Sensitivity analysis ........................................................................................................................... 94
4. Conclusion .......................................................................................................................................... 95
CHAPTER 4: WHICH STRATEGY TO PROMOTE IRRIGATED FARMING SYSTEMS? .................................... 97
OBJECTIVES OF THE CHAPTER ................................................................................................................. 98
1. INTRODUCTION .............................................................................................................................. 98
2. MATERIALS AND METHODS ........................................................................................................... 99
2.1 Study Areas ...................................................................................................................................... 99
2.1.1Farms Surveys ........................................................................................................................... 101
2.1.2 Typology ................................................................................................................................... 102
3. GENERAL APPROACH: A COMBINATION OF A BIOPHYSICAL MODEL WITH A BIO-
ECONOMIC MODEL. ................................................................................................................... 104
3.1 Biophysical model (Cropwat) ....................................................................................................... 105
3.2 The bio-economic model ................................................................................................................ 106

Page 4 of 166
4. SCENARIO DESCRIPTION ......................................................................................................... 109
5. INDICATORS SELECTION FOR MULTI-CRITERIA EVALUATION ................................ 110
6. FARMING SYSTEMS PERSPECTIVES ..................................................................................... 111
6.1 Irrigation scenario ......................................................................................................................... 111
6.2 Scenario « price of water »: for what price water should be sold? ........................................... 116
6.3- Scenario “cropping systems innovation”: which alternative for the current cropping systems?
120
6.4 Combined scenario: Which strategy to promote irrigation? ................................................ 124
6.5- Which strategy to promote irrigated agriculture in the three villages? ............................. 129
GENERAL DISCUSSION ........................................................................................................................... 132
1. INTRODUCTION ........................................................................................................................... 132
2. MAJOR RESULTS ......................................................................................................................... 133
3. LIMITS OF THE WORK ............................................................................................................... 136
4. MODEL RE-USABILITY .............................................................................................................. 137
5. PERSPECTIVES FOR APPLICATION OF THE APPROACH ............................................... 138
REFERENCES ........................................................................................................................................... 140
Annex 1 150
Annex 2 154
Annex 3 158
Annex 4 160

Page 5 of 166
List of Tables
Table 1: Temperature, precipitation, relative humidity, and number of rainy days in major cities of
Lebanon (Source: CAS Statistical Yearbook 2006-2013) .......................................................................... 20
Table 2: Lebanon Status of Available Water, 2010 (MoEW, 2012) ........................................................... 31
Table 3: Total Renewable Water Resources in Middle Eastern Countries ................................................. 32
Table 4: Yearly Water Balance (Adapted from Fadel et al, 2010, FAO, 2008, and MoA, 2003) .............. 33
Table 5: Water shares estimations per sector (Source: CAS Statistical Yearbook 2009) ........................... 34
Table 6: Changes in temperature (Tmax, Tmin) and Precipitation (Prcp %) over Beirut, Zahle, Daher and
Cedars from the PRECIS model for winter (DJF), spring (MAM), summer (JJA) and autumn (SON),
2025-2044 (source: MoE, 2011) ................................................................................................................. 36
Table 7: Planned irrigation reservoirs to be constructed. (Source: MoA, 2013) ........................................ 39
Table 8: Data of purchased local wheat from 1993 to 2005 and calculated subsidy (Adapted from DGCB
website) ....................................................................................................................................................... 61
Table 9: Quantities of DGCB purchased wheat from the major wheat producing areas of Lebanon (2005-
2010) (Source; DGCB website) .................................................................................................................. 63
Table 10:Sugar Beet and sugar production and the subsidized prices 1995-2006 (Source: DGBS) .......... 65
Table 11: Number of villages having tobacco permits and their respective average yearly production
(RTTL website) ........................................................................................................................................... 66
Table 12: Projected rates to be collected from farmers 2011-2020 ............................................................ 69
Table 13:distribution of surveyed farms according to farm size intervals, source of irrigation and farm
production orientation. ................................................................................................................................ 75
Table 14: Average prices of crops received by farmers according to the way of marketing 2011-2013.
(NA=Not available). ................................................................................................................................... 76
Table 15: Criteria and variables used for farm typology ............................................................................ 81
Table 16: sensitivity analysis proposed to test farm income and farm productivity sensitivities of the
selected farm types. ..................................................................................................................................... 83
Table 17: calculation of the amount of irrigation water per crop, source of irrigation, number of
irrigation, irrigation system, and month. .................................................................................................... 83
Table 18: Average input costs, receipt and farm income for each farm type ............................................ 87
Table 19: Farm area per farm type and receipts contribution per category of crops in the total farm type
receipts. ...................................................................................................................................................... 88
Table 20: Statistical comparison of socio-economic and environmental indicators' performances
between the different farm types (Tukey-Kramer test, * significant, ** highly significant ....................... 92
Table 21: Number of total farmers and farmers surveyed in the three villages ...................................... 102
Table 22: Description of the identified four farm types ............................................................................ 104
Table 23: Amounts of available irrigation water for each farm type ........................................................ 108
Table 24: Evolution of the irrigated area and the amounts of irrigation water for different water prices in
the Qemamine village. .............................................................................................................................. 117
Table 25: Cropping patterns variation for different irrigation water prices. ............................................ 117
Table 26: Evolution of the share of the irrigated area and the amounts of irrigation water by farm for
different water prices in the Marjhine village. ......................................................................................... 118
Table 27: Variation of cropping patterns for different water prices in the Marjhine village. .................. 118

Page 6 of 166
Table 28: Variation of Crop patterns for different water prices ............................................................... 120
Table 29: Variation of the irrigated surface, the amounts of irrigation and the average farm income for
each type of farm in the three villages. .................................................................................................... 124
Table 30: Variation of the irrigated surface, the amounts of water irrigation and the average farm
income in the three villages. ..................................................................................................................... 128

Page 7 of 166
List of Figures:
Figure 1: Topographical map of Lebanon ................................................................................................... 19
Figure 2: Registered levels of precipitation in Lebanon from 1967 to 2005 .............................................. 21
Figure 3: Map of the Fertile Crescent showing ancient and modern borders ............................................. 22
Figure 4: Major Agricultural Crops in Lebanon (% of Total Production) .................................................. 22
Figure 5: Value of Lebanon’s Imports and Exports of Agricultural products 1963-2013 .......................... 24
Figure 6: Export by destination of Lebanese agricultural products ............................................................ 24
Figure 7: Major exported products from Lebanon ...................................................................................... 24
Figure 8: Rural, urban, and total population progress in Lebanon 1963-2013 ........................................... 25
Figure 9: Map showing the distribution of agricultural areas in Lebanon .................................................. 26
Figure 10: Number of agriculture holdings in Lebanon versus size ........................................................... 27
Figure 11: Average size of holdings and their distribution across Lebanon ............................................... 28
Figure 12: Distribution of Karst aquifers across Lebanon………………………………………………...29
Figure 13: Distribution of springs across Lebanon .................................................................................... 30
Figure 14: Per capita Agricultural Water use in Lebanon (MM³/person/year) .......................................... 34
Figure 15: Irrigation water requirement (MCM/year) per region, 2010………………………………….36
Figure 16: Irrigation water distribution method, 2010…………………………………………………….37
Figure 17: Distribution of irrigated crops across Lebanon ......................................................................... 37
Figure 18: Main steps of the general methodology of the work ................................................................. 45
Figure 19: Role of agricultural policies cycles ........................................................................................... 48
Figure 20: 2010 - 2014 Agricultural Development Strategy ...................................................................... 53
Figure 21: The orientations of the new strategy 2015-2019 ....................................................................... 56
Figure 22: Represented a visual summary for the chronological evolution of agricultural policies in
Lebanon. ..................................................................................................................................................... 59
Figure 23: Map of Lebanon Showing Deir Al Ahmar district in Baalbek-Hermel Governorate ................ 73
Figure 24: Simplified diagram showing the irrigation canal network, the spatial distribution of crops in
the study region, the source of irrigation of each crop, and the shared percentage of area for each crop. . 83
Figure 25: Farm holding sizes in the study area. ........................................................................................ 85
Figure 26: Behavior of major crops cultivated in the study area. .............................................................. 86
Figure 27: The correlation scatter plot related to the tested variables. ....................................................... 87
Figure 28: Variation of farm productivity calculated as total farm income by total farm cost production. (*
significant, ** highly significant, Tukey-Kramer test). .............................................................................. 94
Figure 29: Farm income variation with and without the support of the production ................................... 94
Figure 30: Map of Lebanon showing the locations of the three study areas ............................................. 100
Figure 31: Irrigated surface by farm type. ................................................................................................ 112
Figure 32: Farm income by farm type with and without irrigation ........................................................... 112
Figure 33: Crop selection in the baseline and the irrigation scenarios in the Qemamine village. ............ 114
Figure 34: Crop pattern under the baseline and irrigation scenarios in the Marjhine village. .................. 115
Figure 35: Crop patterns under the baseline and the irrigation scenarios in the Maroun El Ras village .. 116
Figure 36: Variation of the average farm income by farm type. ............................................................... 119
Figure 37: cropping patterns by representative farm type in the Qemamine village ................................ 121
Figure 38: Cropping patterns by representative farm type and by village in the Marjhine village ........... 122
Figure 39: Cropping patterns by representative farm type and scenario in the Maroun El Ras village. ... 123
Figure 40: Variation of the cropping patterns for the tobacco farm type in the Maroun El Ras village ... 123

Page 8 of 166
Figure 41: Variation of cropping patterns by farm type and by scenario in the Qemamine village ......... 125
Figure 42: Variation of cropping patterns by farm and by scenario in the Marjhine village .................... 126
Figure 43: Variation of the cropping patterns by scenario for the mix farms in the de Maroun El Ras
village. ....................................................................................................................................................... 127
Figure 44: Variation of cropping patterns by scenario for the Tobacco farms in the Maroun El Ras village.
.................................................................................................................................................................. 128

Page 9 of 166
List of abbreviations:
ARDP Agricultural and Rural Development Programme BHG Baalbek-Hermel Governorate CAS Central Administration of Statistics CDR Council for Development and Construction DGCB Directorate General of Cereals and Beetroot DPA Desertification Prone Area ESCWA United Nations Economic and Social Commission for Western Asia EU European Union FAO Food and Agriculture Organization of the United Nations
FTmix_o_l Farm type of older farmers who cultivate a mix of crops (cereals, vegetables legumes, and orchards) and earn relatively low income.
FTmix_y_l Farm type of young farmers who cultivate a mix of crops (cereals, vegetables legumes, and orchards) and earn relatively low income.
FTtab_o_h Farm type dominated by tobacco cultivation, and characterized by older farmers who earn high income.
FTTtab_y_h Farm type dominated by tobacco cultivation, and characterized by young farmers who earn high income.
GDP Gross Domestic Product GNI Gross National Income HAC Hierarchical Ascendant Classification HASAD Hilly Areas Sustainable Agricultural Development IDAL Investment Development Authority of Lebanon IFAD International Fund for Agricultural Development km2 Square Kilometers LBP Lebanese pound MENA Middle East North Africa MoA Ministry of Agriculture MoE Ministry of Environment MoET Ministry of Economy and Trade MoF Ministry of Finance
MoEW Ministry of Energy and Water MoSA Ministry of Social Affairs PCA Principal Component Analysis SALMA Sustainable Agriculture Livelihoods in Margin Areas UNDP United Nations Development Programme USD United States Dollars WTO World Trade organization WUA Water Users Association

Page 10 of 166
Abstract
Rural populations in the arid zones, and more particularly in Lebanon, often face economic and
climatic pressures which impact their food security, their income but also the natural resources.
In response to these pressures, most agricultural development policies in these areas have been
based on the intensification of agriculture by providing direct or indirect support to farmers.
Nevertheless, for many observers these policies are still not very effective today. In Lebanon
these policies are also highly criticized because of the low agricultural production, and especially
because of its low efficiency compared to the resources mobilized.
This research work has the objective to assess the behavior of the farming systems in the MENA
region with regard to its production efficiency, in terms of water and inputs use. Another
objective is to test the sensitivity of these systems to variations in subsidies and prices, and
subsequently propose and evaluate new options to enhance the agricultural production
performance.
The results of the characterization of the functioning of farms show that they are highly
dependent on direct or indirect state subsidies. This analysis shows that 4 out of 5 farms produce
tobacco with more or less surfaces. This result is due mainly to the important support given to
this crop. It also appears that, overall, the incomes of the farms studied have increased with
intensification, but often at the expense of the environment.
The scenarios tested in this study, follow the intent of the State to invest in water storage to
increase the availability of irrigation water for farmers. This strategy aims at the diversification
of cultivated crops and to increase the income of farmers. In these scenarios, it will also be
necessary to test several prices for irrigation in a context of very low prices for the agricultural
produce.
Simulations using bio-economic modeling based on nonlinear programming showed five
production strategies trajectories. These trajectories depend on the quantity of water available,
the aid granted to each crop, and the produce selling price. Similarly, these farms are considered
very vulnerable to the variation in governmental support, but also to the volatility of market
prices. More surprisingly, these farms appeared to be insensitive to the increase in irrigated water
supply. Income per farm increased on average by 10 to 20% with larger water availability. This
increase in income is mainly dependent on the initial cropping patterns of the farms.
Beyond the results obtained, this work emphasizes the need to reconsider the methods of analysis

Page 11 of 166
based on bio-economic modeling, the creation of database dedicated to the modeling of farms,
but also on the urgent consideration of recovery measures in drylands for a more sustainable
agriculture.
Key words: agricultural policy, typologies, agricultural exploitation, agro-economic
performance, indicators, bio-economic modeling, scenarios.

Page 12 of 166
Résumé
Les populations rurales dans les zones arides et plus particulièrement au Liban sont souvent
confrontées à des pressions économiques et climatiques qui impactent leur sécurité alimentaire,
leurs revenus mais également les ressources naturelles. En réponse à ces pressions, la plupart des
politiques agricoles de développement au niveau de ces zones ont été basées sur l'intensification
de l'agriculture en octroyant des aides directes ou indirectes.
Néanmoins, pour plusieurs observateurs ces politiques restent aujourd’hui peu efficaces. Au
Liban, ces politiques sont également très critiquées à cause de la faible production agricole et
surtout à cause de sa faible efficience par rapport aux ressources mobilisées.
L’objectif de ce travail est d’abord de caractériser la diversité des systèmes de production au
Liban en se basant sur plusieurs enquêtes auprès des agriculteurs et une analyse de composante
principale. Dans un deuxième temps, nous avons proposé et testé, pour différents types
d’exploitations agricoles, des scénarios de relance agricole construits en concertation avec les
acteurs locaux.
Les résultats de la caractérisation du fonctionnement des exploitations agricoles montrent que ces
dernières sont très tributaires des aides directes ou indirectes octroyées par l’Etat. Il ressort de
cette analyse que 4 exploitations sur 5 produisent du tabac avec des surfaces plus ou moins
importante. Ce résultat est dû principalement au soutien important octroyé à cette culture. Il
ressort également, que globalement les revenus des exploitations étudiées ont augmenté avec
l’intensification de l’agriculture, mais souvent au dépend de l’environnement.
Les scénarios testés dans cette étude, font suite au souhait de l’Etat de construire des nouveaux
lacs collinaires avant d’augmenter les disponibilités en eau d’irrigation. Cette stratégie vise la
diversification des cultures cultivées, le revenu des agriculteurs. Il sera également question au
niveau de ces scénarios de tester plusieurs prix pour l’irrigation dans un contexte marqué par des
prix très bas.
Les simulations à l’aide de la modélisation bioéconomique basée sur la programmation non
linéaire ont montré 5 trajectoires de stratégies de production. Ces trajectoires sont tributaires des
quantités d’eau disponibles, des aides accordées à chaque culture et à leur prix de vente. De
même, ces exploitations sont jugées très vulnérables à la variation du nouveau des aides, mais

Page 13 of 166
également par rapport à la volatilité des prix du marché. Plus étonnant, ces exploitations sont
apparues peu sensibles à l’augmentation des disponibilités en eau d’irrigation. Le revenu par
exploitation a augmenté en moyenne de 10 à 20% avec des disponibilités en eau plus
importantes. Cette augmentation en revenu est surtout tributaire à la structure initiale des
exploitations.
Au-delà des résultats obtenus, ce travail a mis l’accent sur la nécessité de reconsidérer les
méthodes d’analyse basées sur la modélisation bioéconomique, la création de bases de données
dédiée à la modélisation des exploitations agricoles, mais également sur l’urgence de la réflexion
autour des mesures de relance dans les zones arides pour une agriculture plus durable.
Mots clés: politique agricole, typologies, exploitation agricole, performance agro-économique,
indicateurs, modélisation bioéconomique, scénarios.

Page 14 of 166
General introduction
The problem of water scarcity has already made its way to the top of the international
development and environmental agenda, especially in arid and semi-arid areas (United Nations,
2014; Springer & Duchin, 2014; FAO & WWC, 2015).
In the Middle East and Northern Africa (MENA) region, where semi-aridity prevails, water
scarcity is the main limiting factor for the development of the agricultural sector (Selvaraju,
2013). The economies of the countries in this part of the world rely heavily on agriculture as a
source of food and income offering employment to more than 35 percent of the population and
contributing around 13 percent of the region’s GDP (Verner, 2012). However, it is estimated that
around 70% of “agricultural production is currently rain-fed, which leaves the region highly
vulnerable to temperature and precipitation changes, and the associated implications for food
security, social security, and rural livelihoods” (World Bank, 2014). Irrigated areas represent
around 28 percent of the total cultivated land, but produces more than 50 percent of the total
agricultural production (FAO, 2007; Selvaraju, 2013).
To meet the increased demand for water, governments in the region were investing in provision
of more irrigation water to farmers through dams and reservoirs construction (Sowers et al.,
2011). That has been in line with the global tendency since the beginnings of the 20th century to
provide “new” water to farmers (Gleick et al., 2011).
In all cases, however, the prevailing agricultural production systems remain unable to meet the
food needs of most of these countries, as shown by their food trade deficits (World Bank, 2014).
For this reason, the countries of the region have initiated, since decades, agricultural policies that
advocate the intensification of their production systems (Selvaraju, 2013). These policies
encourage greater use of subsidized inputs, as well as support for the purchase of famers’
production at subsidized prices compared to international market prices is often practiced
(Sowers et al., 2011; Breisinger et al, 2010) to help support farmers.
Historically, agricultural production in the MENA region is often cited as being very inefficient
in terms of input valuation (Jemaa & Dhif, 2005). There are many reasons for this: low soil
fertility, demanding water stress, unqualified and poorly mechanized labour force, etc. (World

Page 15 of 166
Bank, 2014). Nevertheless, for some researchers, the implementation of these intensification
policies was associated with improvements in both overall agricultural production and the
productivity of these systems (Lee et al, 2001; Belloumi & Matoussi, 2009). Others believe that
this improvement in the performance of irrigated agricultural systems is partially artificial,
because the cost of agricultural support remains high, but does not necessarily lead to better
performance in terms of production (Breisinger et al, 2010).
The objectives of this research work is to analyse the farm income and environmental impacts
performance of agricultural production, as well as the productivity of several typical irrigated
farms in Lebanon in relation to key inputs. This productivity has been tested with and without
support for agriculture as it is practiced today. Furthermore, a bio-economic model has been
created in order to explore different production strategies favoured by greater water availability
to the farmers. This type of model would allow simulating several socio-economic and
environmental indicators, which in turn facilitate the impact assessment of different scenarios on
the performance and sustainability of the studied farming systems.
These objectives are performed by using the following tools:
(1) A farmers’ survey to investigate the cropping patterns practiced by farmers
(2) A farm typology to allow the grouping of existing farms based on their biophysical and
socio-economic characteristics.
(3) A sensitivity analysis of farmers’ income in relation to to prices and subsidies
variabilities.
(4) An integrated assessment approach using a combination of a biophysical model
(Cropwat) with a bio-economic model. Definition and implementation of selected scenarios
(base and alternative scenarios) and analysis of their impacts at farm scale by running a set of
relevant variables through the Cropwat-bio-economic farm model, are performed.
This thesis document is composed of the present introduction and four more chapters, in addition
to a final general discussion and a comprehensive list of references at the end.
Chapter one describes the general context of the work including biophysical and agricultural
conditions of the study areas in Lebanon, within the broader socio-economic and climatic

Page 16 of 166
conditions that characterizes the country. It will be also question to emphasis the constraints and
opportunities of agricultural sector in Lebanon in link with the irrigation water issue. This
chapter will be concluded by presenting the objectives of the thesis and the main methodology
followed to answer these objectives.
Chapter two examines the policies and plans that have been dominating the agriculture sector
and the farmers in Lebanon in last decades. This will help us to present the main policies applied
and describing the main subsidies and price support accorded for each type of crop.
Chapter three addresses the analysis of the farm income and the environmental impacts and
performance of agricultural production, as well as the productivity of several typical irrigated
farms in Lebanon in relation to key inputs, and considering market conditions and governmental
subsidies as it is practiced today.
Chapter four describes the use of a bio-economic model based on non-linear programming, to
propose and evaluate scenarios to improve the agricultural production in three different Lebanese
regions with different socioeconomic and biophysical contexts. These scenarios include mainly
irrigation water quantity and price variation.
The last chapter is reserved to discuss the main results obtained in this research work, as well as,
to present the main limits and advantages in using the general methodology (including data
quality and model structure) proposed in this thesis.
Overall, starting from our results, it will be also question to discuss the current production
strategies in Lebanon and in dry land areas by taking into consideration the current socio-
economic and biophysical contexts.

Page 17 of 166
Chapter 1: The agricultural sector in Lebanon: limits and opportunities

Page 18 of 166
GENEREAL OBJECTIVES
The scope of this chapter is to cover the agro-climatic zones which characterize Lebanon, along
with the different aspects of the Lebanese agriculture sector and its importance in the national
socio-economic context. Water scarcity and its impacts on the agriculture sector and the
livelihood of rural people are emphasized. Current farming systems and patterns are also
presented and analyzed in relation to the availability of irrigation water followed by an
elaboration of the objectives, methodology and results of this research.
1. BACKGROUND INFORMATION
1.1 Introduction – Country Characteristics
Lebanon is a small mountainous country on the east shore of the Mediterranean Sea, covering a
total area of 10,450 km2. Its topography is somewhat rectangular in shape with its length almost
three times its width, with alteration of lowlands and highlands which run parallel from north to
south as follows (Figure 1):
1) The coastal strip on the Mediterranean Sea which is a maritime plain
2) Mount Lebanon, the western range of rugged mountains
3) The Béqaa Valley, a central highland plateau characterized by its fertile soil
4) The Eastern Lebanon mountain range (also known as Anti-Lebanon) that stretches across
the eastern border with Syria
The resident population in Lebanon was estimated at 4.547 million in 2014. Having a Gross
National Income (GNI) of $10,030 per capita, Lebanon is considered an upper middle income
country (World Bank, 2015). The major economic sectors in Lebanon are mainly distributed
between services (~76%) and industry (~20%) with agriculture having a minor contribution to
the overall national economy of around 4% (CAS, 2014). Nevertheless, the agriculture sector
plays a major role in social and economic stability in rural areas (MoA, 2014). A strong link is

Page 19 of 166
found between agriculture and poverty since more than 20% of families in this sector are
considered very poor (World Bank, 2010a).
On the climate side, Lebanon faces water shortages during the dry season which extends from
July through October, with around 60% of the country’s area threatened by desertification (MoA,
2003). This situation is expected to become more acute in the future due to climate change
effects (World Bank, 2013). Water scarcity rather than land resources is currently the limiting
factor of the expansion of agricultural production in the country (IFAD, 2008).
Figure 1: Topographical map of Lebanon

Page 20 of 166
1.2 Agro-Climatic Zones in Lebanon
Lebanon is dominated by a Mediterranean climate which is characterized by a cold rainy winter
and a semi-hot dry summer. However, minor topographical variations throughout the country
result in local modifications of the major climatic pattern as demonstrated in table 1. Along the
coastal strip, mean annual temperature varies between 19.5 °C and 21.5 °C with summers being
hot and humid with no precipitation. In Mount Lebanon, the gradual decrease in temperature
with increasing altitude (approximately 3°C for each 500 m elevation) causes colder winters and
more precipitation and snow. The lowest temperatures are usually recorded in January and the
highest in August (MoA, 2003). Since the Béqaa Valley and the Anti-Lebanon Mountains are
shielded from the influence of the Mediterranean Sea by Mount Lebanon, they receive less
precipitation and humidity which cause them to experience a wider variation in daily and yearly
temperatures (Collelo, 1987). Snow usually covers only the top of the two mountains for a period
of around two months in winter season, covering a surface area of 2500 km² on average (Shaban
et al, 2013).
Table 1: Temperature, precipitation, relative humidity, and number of rainy days in major cities of Lebanon (Source: CAS
Statistical Yearbook 2006-2013)
According to the National Lebanese Meteorological Service, eight distinctive eco-climatic zones
are defined in Lebanon based on the quantity of rainfall as a major criterion (Abi-Saleh & Safi,
1998). The coastal strip has three eco-climatic zones: Northern, Central, and Southern zones.
Mount Lebanon has only two: Northern and Southern zones, and the Béqaa valley has also three
zones: Northern, Central, and Southern.

Page 21 of 166
Levels of precipitation in Lebanon reach an average of 955 mm annually, as per the data
represented in figure 2, for the period stretching between 1967 and 2005. However, the trend of
precipitation at the national level has been decreasing with time, which is considered alarming.
The same trend has been recorded at the level of the East Mediterranean region where a
reduction of 17% to 20% was observed between 1951 and 2008, with high year to year
variability (Kelley et al, 2015). In Lebanon, fluctuations in precipitation between years are not
very substantial with a standard deviation of 81.17 mm only. However, more acute fluctuations
were observed by Yau & Ryan (2013) in the area of Baalbek over the period of 10 years between
1994 and 2004. During that time, an average of 539 mm per year with a standard deviation of
160 mm was registered.
Figure 2: Registered levels of precipitation in Lebanon from 1967 to 2005 (Adapted from Shaban 2008)
1.3 Agriculture Sector in Lebanon
Lebanon is located within the “Fertile Crescent”, which is a crescent-shaped area on the east side
of the Mediterranean containing the comparatively fertile land amongst the otherwise arid or
semi-arid areas (Figure 3). It was a major location for the emergence of pre-historic farming
(Smith and Nesbitt, 1995). Thanks to its diversity in micro-climates and soil types resulting in
suitable land conditions, Lebanon although being small in size, benefits from agriculture as the
third main sector. This diversity in microclimate also allows Lebanon to produce a wide variety
of agricultural products that range from temperate zone crops such as apples and stone fruits to
tropical and subtropical crops as banana and citrus. The following sections elaborate the status of
local agricultural production in Lebanon, cultivated areas, labor forces and challenges faced in
this sector.

Page 22 of 166
Figure 3: Map of the Fertile Crescent showing ancient and modern borders (source: Britannica)
1.3.1 Local Agricultural Production and Trade
Local production of agricultural produce in Lebanon is mainly distributed between fruit trees
(32%), olives (23%), cereals (20%), vegetables (16%), pulses (4%), industrial crops (4%), and
fodder crops (1%) as represented in figure 4 (MoA, 2012). Potato production usually ranks first
amongst the top 10 commodities produced in Lebanon with a total production of 412,000 tons in
2013. Tomato production comes next with a volume of 325,000 tons in 2013 followed by
cucumbers, apples, wheat, bananas, oranges, olives, onions, and grapes. In terms of production
value, tomatoes rank first with more than USD 120,000 thousands as recorded in 2013
(BankMed, 2016).
Figure 4: Major Agricultural Crops in Lebanon (% of Total Production)
The value of agricultural production had increased by 11% between 2007-2011 from USD 1.40
billion to USD 1.56 billion. Still, the local production covers only 20% of the national food
consumption. The remaining gap to meet local demand is covered through food imports, whilst
0%
5%
10%
15%
20%
25%
30%
35%
Fruit Trees Olive Trees Cereals Vegetables Pulses Industrial
Crops
Forage
Crops
Pe
rce
nta
ge
of
cult
iva
tio
n
Type of Crop

Page 23 of 166
the level of export is relatively low; noting that it has recently shifted towards lucrative
production, with higher focus on export.
In 2013 for example, the total value of agricultural and food export reached only 22% of the
value of import, $0.76 billion versus $3.43 billion (MoA, 2014). This difference was even more
prominent in earlier years, as represented in figure 5 which compares the values of import and
export of agricultural products from 1961 to 2013. Since the early 1960s up to the mid-1970s, the
level of export with respect to import increased from 25% up to a maximum of 53% in 1973.
However, after 1975, that number gradually decreased to a minimum of 9% in 1997. A fact most
probably related to the impact of the Lebanese civil war and its aftermath, following its end in
1990. After that period, export levels slowly started to recuperate and gradually increased to
reach the most recent level of 22% in 2013.
During the 2000s however, figures fluctuated due to several reasons. After a drop by an
estimated 10% in 2009 as a result of the global economic recession, the level recovered during
the following year only to relapse following the start of the crisis in Syria. Afterwards, levels of
exports re-increased when the farmers and traders have found alternative, more secure, trade
routes (IDAL, 2015). On the other hand, despite the fluctuating differences between the levels of
exports and imports, it can be noticed that both values are steadily increasing with time. Between
1961 and 2013, the level of imports increased by more than 32 folds from US$100,000,000 to
US$3,270,000,000 whereas the increase in the level of exports was less prominent and reached
19 folds from US$38,000,000 to US$700,000,000. According to the Lebanese Customs and as
published by IDAL(IDAL 2015), major destinations for Lebanese agricultural exports include:
Saudi Arabia (KSA), Syria, Jordan, Kuwait and United Arab Emirates (UAE) encompassing a
total of 69% of exports (figure 6). Major exported agricultural commodities include potatoes,
apples, citrus and banana (figure 7).

Page 24 of 166
Figure 5: Value of Lebanon’s Imports and Exports of Agricultural products 1963-2013 (Source: FAOSTAT)
Figure 6: Export by destination of Lebanese agricultural products (source: Lebanese Customs, 2014)
Figure 7: Major exported products from Lebanon (source: Lebanese Customs, 2015)
$,0.00
$,0.50
$,1.00
$,1.50
$,2.00
$,2.50
$,3.00
$,3.50
1960 1970 1980 1990 2000 2010 2020
Bill
ion
US$
Year
Import Value Export Value

Page 25 of 166
The food production sector by itself has witnessed numerous fluctuations since the 1960s. The
Lebanese food production industry was comparably shy to today’s levels, where the average
value of food production reached almost $0.5 billion between 1960 through 1980. Afterwards,
the sector bloomed and steadily increased. Maximum production values even reached a
maximum of $1.4 billion in 1996, 123% of today’s values. Then, the sector faced a noticeable
decrease starting by a 10% decline from 1996 to 1997 reaching $1.28 billion. Figures after that
year remained below this level and averaged at around $1.2 billion between 1998 until 2014. The
latter decrease in production level might be associated with a major shift in rural population in
favour of the growing cities, as shown in Figure 8.
Figure 8: Rural, urban, and total population progress in Lebanon 1963-2013 (Source: FAOSTAT)
1.3.2 Cultivated Area
According to the most recent Agricultural Census (2010), Lebanon has an agricultural area
estimated at 332,000 hectares (ha) covering 32% of its surface area (FAO, 2014). The cultivated
agricultural land covers around 231,000 ha, out of which the half is irrigated. In 2010, the
agricultural holding size reached 1.37 ha in average, and the area of irrigated land reached 1.23
ha (MoA, 2014). Land use has gradually shifted from production systems based on cereals
toward high value-added crops (mainly fruits and vegetables). Lebanon has a higher added value
of agriculture per square kilometre than many nearby countries, which reflects a higher intensity
in production whilst focusing on more valued fruits and vegetables (FAO, 2017). As figure 9
shows, the major regions for agricultural production in Lebanon lies in the 1) Béqaa valley (with
more than 40% of the country’s cultivated land); 2) the North, mainly in Koura and Akkar , and
3) the coast of South Lebanon from Sidon to Tyr which is characterized by the presence of
0
1000
2000
3000
4000
5000
6000
1963 1970 1977 1984 1991 1998 2005 2012
x 1
00
0
Year
Total Population
Rural
Urban

Page 26 of 166
intensive agriculture systems under greenhouse conditions. Mount Lebanon and Nabatiyeh
regions are also important areas for Lebanon’s agriculture, despite having comparatively less
cultivated areas land due to their rough landscape (IDAL, 2015).
Figure 9: Map showing the distribution of agricultural areas in Lebanon (source: FAO, 2010)
1.3.3 Agricultural Labor
The agriculture sector in Lebanon directly provides jobs for 6% of the labour force at the
national level and 25% at level of rural areas inhabitants. Around 170,000 Lebanese citizens
depend for their livelihood, totally or partially, on agriculture (MoA, 2014). In 2010, more than
200,000 individuals of mixed nationalities worked full-time in Lebanese farms, and the number
of seasonal family workers reached almost 240,000 with more than 6.5 million days for
nonfamily labor (MoA, 2014). It is generally noticed that many of Lebanon’s poorest families
rely on the sector of agriculture as a primary source of income. In the Béqaa Valley and in South
Lebanon for example, where some of the poorest families in the country reside, agriculture
represents up to 80% of the total GDP and is considered the major income earning sector as well
as the major employer (Darwish et al, 2009), whilst being the fourth largest employer at the level
of the country. Female farmers constitute some 9% of the total active farmers in Lebanon and are
mainly involved in dairy production, food preserves and subsistence farming.

Page 27 of 166
The Syrian crisis since 2011 greatly affected all economic sectors in Lebanon and especially
agriculture. Prior to that situation, Lebanon was already suffering from high rates of
unemployment and mismatches in the labor market. However, after the massive influx of Syrian
refugees, the labor supply was further increased by 30 to 50%. That greatly affected women,
youth and unskilled laborers and significantly lowered agricultural wages. In some areas as the
Béqaa valley, daily wages dropped by up to 60% as Syrian refugees gradually replaced Lebanese
labor force. (FAO, 2014)
1.3.4 Challenges and Opportunities of the Agriculture Sector
Lebanon’s agriculture sector faces institutional, policy, technological, and financial resource
constraints that result in low performance. With the limited availability of water and land
resources plus the increasing urbanization, additional challenges are put for the sector’s
future development in the country. The Lebanese Ministry of Agriculture (MoA, 2003)
and FAO, 2014 have both published a list of the major setbacks that are currently facing
the sector. The list can thus be summarized as follows:
§ Small sized and fragmented agricultural holdings as demonstrated in figure 10 in
proportion and in figure 11 in distribution
Figure 10: Number of agriculture holdings in Lebanon versus size (MoA, 2012)
0
10000
20000
30000
40000
50000
60000
Nu
mb
er
of
Ho
lde
rs
Hectars
Page 28 of 166
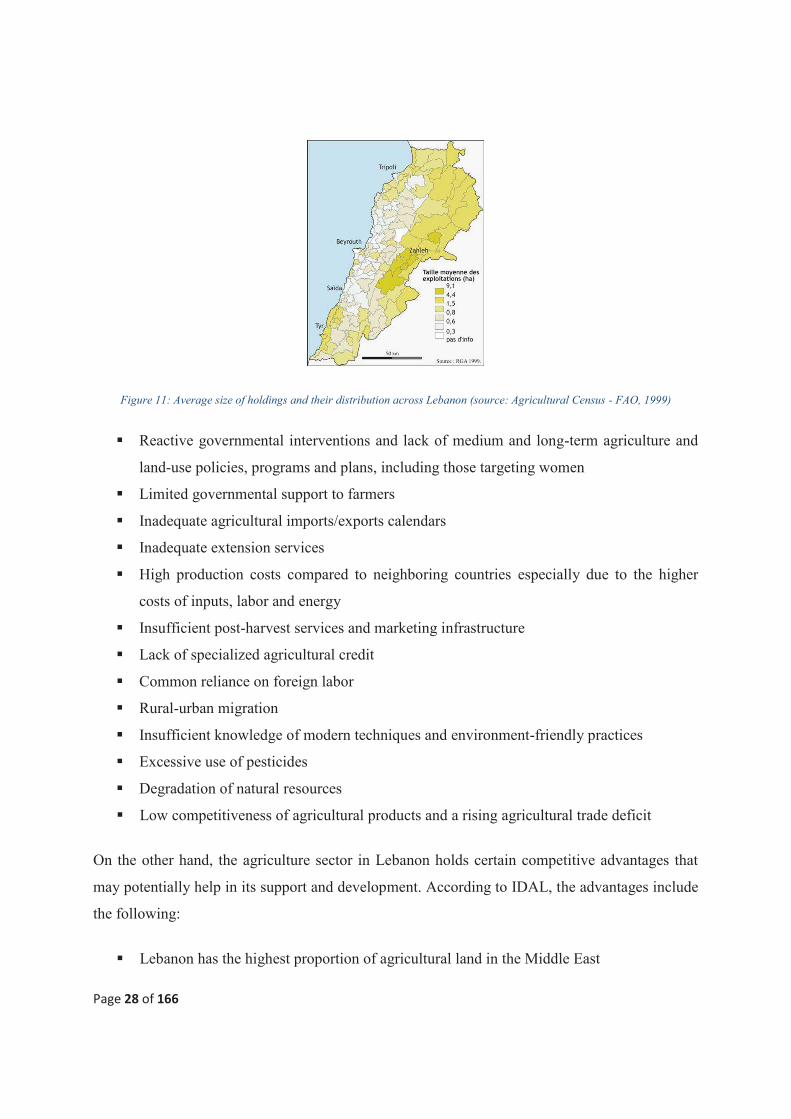
Figure 11: Average size of holdings and their distribution across Lebanon (source: Agricultural Census - FAO, 1999)
§ Reactive governmental interventions and lack of medium and long-term agriculture and
land-use policies, programs and plans, including those targeting women
§ Limited governmental support to farmers
§ Inadequate agricultural imports/exports calendars
§ Inadequate extension services
§ High production costs compared to neighboring countries especially due to the higher
costs of inputs, labor and energy
§ Insufficient post-harvest services and marketing infrastructure
§ Lack of specialized agricultural credit
§ Common reliance on foreign labor
§ Rural-urban migration
§ Insufficient knowledge of modern techniques and environment-friendly practices
§ Excessive use of pesticides
§ Degradation of natural resources
§ Low competitiveness of agricultural products and a rising agricultural trade deficit
On the other hand, the agriculture sector in Lebanon holds certain competitive advantages that
may potentially help in its support and development. According to IDAL, the advantages include
the following:
§ Lebanon has the highest proportion of agricultural land in the Middle East
Page 29 of 166
§ Lebanon’s climatic, soil, and abundant water resources bring key characteristics capable
of highlighting the country as an ideal location for agricultural activity
§ Microclimatic variability allows Lebanon to cultivate a wide range of crops that would
normally grow in both cold and tropical countries
§ Existence of certain institutional support to the sector that is able to support exporters
financially and non-financially in attempt to increase the level of exports to expand the
access to new markets (IDAL, 2017).
2. STATUS OF WATER
Based on its geomorphologic and hydro-geologic characteristics, Lebanon is divided into three
provinces: West Lebanon, the Béqaa, and Anti-Lebanon. These provinces are subdivided into
smaller basins and sub-basins units (Khair et al, 1992). Lebanon is generally considered lucky
compared to other countries in the region because of its relative richness in water considering its
area (Tables 2 and 3). The rainy season usually stretches from November to March followed by a
period with little rainfall in spring and none in summer. Annual levels of precipitation on the
coast ranges between 600 mm and 800 mm whereas Mount Lebanon gets up to 2,000 mm
annually but typically between 1,000 mm to 1,400 mm. Rainfall in central and northern Béqaa on
the other hand is low and reaches 200 mm to 600 mm annually, while the southern plain attains
600 mm to 1,000 mm (Ministry of Environment/Ecodit, 2010). Finally, the levels of precipitation
on the Anti-Lebanon Mountain chain ranges from 600 mm to 1,000 mm in the Harmon. (Haddad
et al, 2014).
2.1 Sources of Water
As the case with most Mediterranean countries, karst aquifers are the major source for ground
water in Lebanon. Karst is a term used to describe a landscape that contains caves and extensive
underground water systems that result from the dissolution by water and weathering of soluble
rocks (referred as Karstic rocks) such as limestone, marble, and gypsum. Karst aquifers dominate
in Lebanon, as demonstrated in figure 12, since about 80% of the country’s rock exposure are
mostly limestone or dolostone (Doummar, 2014). Lebanese aquifers are characterized by their
large storage capacity and long residence time, though not exploited sustainably (El-Hakim &
Bakalowicz, 2006). The permeable limestone layers in alternation with clay and the presence of

Page 30 of 166
cracks and fissures allow deep water percolation to nourish the ground water on one hand, and
enable the emergence of water springs on the other (MoA, 2003).
Lebanon has 40 rivers, 17 of which are perennial. The most important river is considered to be
the Litani River which represents alone about 28% of the total surface water. In addition, around
2,000 springs are scattered around the country, as represented in figure 13, with an average water
flow rate of 10-15 litres per second (Comair, 2011).
Only two important water dams have been constructed so far. The first and biggest is the
Karaoun in the southern Béqaa valley with a total capacity of around 224 MM³, and which is
used for hydropower production and irrigation. The smaller one, Chabrouh dam in Mount
Lebanon has a capacity of 15 MM³ and is intended for potable water consumption (Fadel et al,
2014; MoEW 2012).
Figure 12: Distribution of Karst aquifers across Lebanon Figure 13: Distribution of springs across
(source: Doummar J., AUB, 2014) Lebanon (source: Doummar J., AUB, 2014)
2.2 Exploitation
The total renewable water in Lebanon averages around 2,350 MM³ per year with surface water
constituting 93.6% of the total amount and ground water 6.4%. However, only 18.6% (MoEW,
2010) of this resource is actually being exploited. Tables 2 and 3 elaborate the level of renewable

Page 31 of 166
water recourses of Lebanon internally and compared to other neighbouring and Arab countries in
the Middle Est, respectively. Out of the 700 MM³ extracted from ground water, only 500 MM³
are replenished naturally, and due to the repetitive annual deficit of 200 MM³, a significant
lowering of the water table occurs along with an increased salinity.
The richness of Lebanon’s water resources has also been unfortunately threatened by both
physical and man-made challenges. Shaban (2013) classified the challenges in two major groups
mainly 1) Physical and 2) Anthropogenic. Physical challenges include the morphological and
hydrological aspects of the country, the dominating climatic oscillations, and the transboundary
nature of major water resources. Anthropogenic challenges on the other hand encompass the
increasing water demand, deterioration of water quality, and improper water management.
Table 2: Lebanon Status of Available Water, 2010 (MoEW, 2012)
Area Surface water
(MM³/year)
Used surface
water
(MM³/year)
Groundwater
from public
wells
(MM³/year)
Groundwater
from private
wells
(MM³/year)
Number of
private wells
Beirut and
Mount
Lebanon
449 186 89 119 18,398
North
Lebanon 381 175 54 109 9,966
South
Lebanon 307 307 71 70 7,282
Béqaa 289 206 53 140 7,178
Lebanon
Total 1,425 649 267 438 42,824

Page 32 of 166
Table 3: Total Renewable Water Resources in Middle Eastern Countries
Surface Water (1) Mean groundwater
Recharge (1)
Total
renewable
water
resources (1)
Ratio of
Water used to
Total
renewable
water
resources (2)
Volume
(MM³/year) %
Volume
(MM³/year) %
Volume
(MM³/year) %
Bahrain 0 0 127 100 127 205.8*
Egypt 55,500 97.6 1,384 2.4 56,884 113.8**
Iraq 72,651 94.5 4,228.4 5.5 76,880 87.3**
Jordan 746 60 507 40 1,253 90.5*
Kuwait 0.1 0.06 160 99.9 160.1 2,075**
Lebanon 2,200 93.6 150 6.4 2,350 18.6*
Oman 918 62.5 550 37.5 1,468 83.9*
Palestine 0 0 679 100 679 NA
Qatar 1.4 1.6 85 98.4 86.4 381*
Saudi Arabia 5,000 62.5 3,000 37.5 8,000 936.2*
Syrian Arab
Republic
9,880 66.9 4,898 33.1 14,779 99.8*
United Arab
Emirates
190 59.6 129 40.4 319 1,867*
Yemen 1500 60 1,000 40 2,500 168.6*
Total 14,8587.1 89.8 16,897.4 10.2 165,485.5 -
*reference year 2005
** reference year 2000
(1) ESCWA Water Development Report 2: State of Water Resources in the ESCWA Region, 2007.
(2) ESCWA Water Development Report 5: Issues in Sustainable Water Resources Management and
Water Services, 2013.
According to Fadel et al, 2010, many studies and reports have made estimates of the water
balance in Lebanon but were found to be inconsistent. As presented through the study and as
summarized in table 4, Lebanon receives an average annual precipitation volume of 8,600
MM³/year out of which 505 MM³ is usually lost due to evapotranspiration. Another 12% is lost
Page 33 of 166
as ground water and renders un-exploitable as seepage to the sea and neighboring aquifers.
Additionally, almost 8% of the water goes to Syria and Palestine through trans-border rivers.
The remaining potentially available 30% of the water is not sustainably exploited in Lebanon as
a result of the abovementioned challenges facing the country. Lebanon does not receive
incoming surface water flow because of its higher elevation compared to its neighbouring
countries (FAO, 2008).
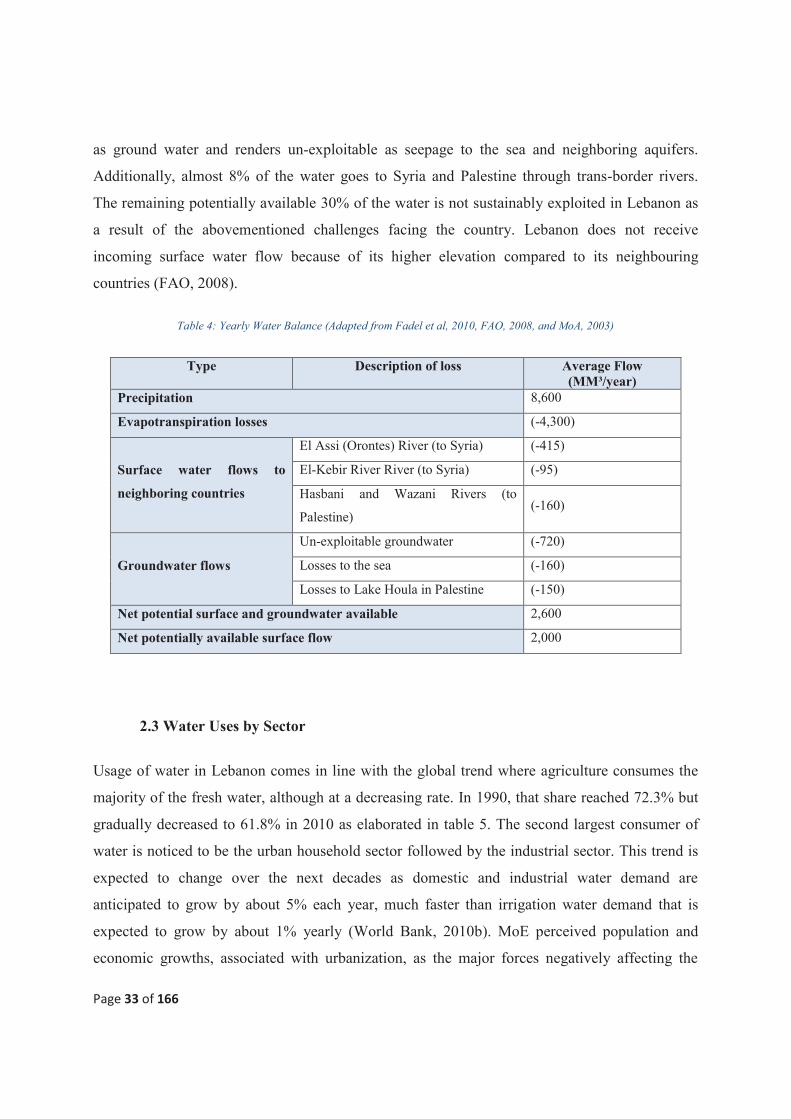
Table 4: Yearly Water Balance (Adapted from Fadel et al, 2010, FAO, 2008, and MoA, 2003)
Type Description of loss Average Flow
(MM³/year)
Precipitation 8,600
Evapotranspiration losses (-4,300)
Surface water flows to
neighboring countries
El Assi (Orontes) River (to Syria) (-415)
El-Kebir River River (to Syria) (-95)
Hasbani and Wazani Rivers (to
Palestine) (-160)
Groundwater flows
Un-exploitable groundwater (-720)
Losses to the sea (-160)
Losses to Lake Houla in Palestine (-150)
Net potential surface and groundwater available 2,600
Net potentially available surface flow 2,000
2.3 Water Uses by Sector
Usage of water in Lebanon comes in line with the global trend where agriculture consumes the
majority of the fresh water, although at a decreasing rate. In 1990, that share reached 72.3% but
gradually decreased to 61.8% in 2010 as elaborated in table 5. The second largest consumer of
water is noticed to be the urban household sector followed by the industrial sector. This trend is
expected to change over the next decades as domestic and industrial water demand are
anticipated to grow by about 5% each year, much faster than irrigation water demand that is
expected to grow by about 1% yearly (World Bank, 2010b). MoE perceived population and
economic growths, associated with urbanization, as the major forces negatively affecting the

Page 34 of 166
quality and quantity of water resources in Lebanon (MOE/UNDP/ECODIT, 2011). Figure 14
demonstrates Lebanon’s per capita agricultural water use compared to other countries in the
Middle East.
Table 5: Water shares estimations per sector (Source: CAS Statistical Yearbook 2009)
Year Unit Household
sector
Industrial
sector
Agricultural
sector Lebanon
1990 Million m
3 271 65 875 1211
% 22.3 5.4 72.3 100
1994 Million m
3 205 130 950 1285
% 16.0 10.1 73.9 100
2000 Million m
3 245 205 920 1370
% 17.8 15.0 67.2 100
2005 Million m
3 380 140 887 1407
% 27.0 10.0 63.0 100
2010 Million m
3 467 163 1020 1650
% 28.3 9.9 61.8 100
Figure 14: Per capita Agricultural Water use in Lebanon (MM³/person/year) (ESCWA, 2007)
0
200
400
600
800
1000
1200
1400
1600
1800
MM
³/p
ers
on
/ye
ar

Page 35 of 166
2.4 Effects of Climate Change
Little number of studies has been done to anticipate the effects of climate change on water
resources and water supply in Lebanon. Generally, climate change is expected to negatively
affect the availability of water in the coming years especially after augmenting the effects of
maladapted practices such as overgrazing, deforestation and forest urbanization, which are in
turn expected to accelerate desertification and land degradation.
The latter is thus expected to pose serious threats to Lebanon’s food and water security (Asmar,
2011). The latest report of the Intergovernmental Panel on Climate Change (IPCC) mentions that
the Mediterranean region is most likely to witness an increase in the frequency and intensity of
drought by the early and late 21st century (IPCC, 2013).
Moreover, the same report expects a decrease of 20% to 30% in average precipitation and an
increase in temperature of 2°C to 3°C in the eastern Mediterranean for the period 1986-2005 to
2081-2100. Another study by Farajalla et al. (2014) using the PRECIS model expects an increase
of 1°C on the coast to 2°C in the mainland by 2040 and up to 3.5°C to 5°C higher by 2090.
This increase in temperature is coupled with a projected decrease of 10 to 20% in precipitation
by 2040 and by 25 to 45% by the year 2090, compared to the present. Therefore, the latter
expected conditions will result in a significantly extended hot and dry climate having 9
additional days of drought by 2040 and 18 days by 2090 (MoE, 2011).
The projected scenario for climate change in Lebanon for the period 2025-2043, considering four
different point references in the country, is summarized in table 6. On the other hand, while some
attributed the effect to lower future precipitation (MOE/UNDP/ECODIT, 2011), others like Bou-
Zeid and El-Fadel (2002) predicted a decrease of 15% in water availability in 2020, associated
with a 6% increase agricultural water demand resulting from a 0.6 to 2.1°C temperature increase
and not from lower precipitation.

Page 36 of 166
Table 6: Changes in temperature (Tmax, Tmin) and Precipitation (Prcp %) over Beirut, Zahle, Daher and Cedars from the PRECIS model for winter (DJF), spring (MAM), summer (JJA) and autumn (SON), 2025-2044 (source: MoE, 2011)
2.5 Irrigation Practices and Water Availability
Irrigation is a key requirement for agricultural productivity in most parts of Lebanon given its
prevailing Mediterranean climatic features with scarce precipitation during the main summer
growing season. Irrigated areas were found to have increased from about 40,000 ha in the early
1960s to around 113,000 ha in 2010, amounting to about 50% of the cultivated land (MOA,
2012). Nearly 65% of those areas are completely irrigated whereas the remaining 35% benefit
from complementary irrigation. Water scarcity, rather than land resources, is currently the
limiting factor behind the expansion of agricultural production in Lebanon. Irrigation helped the
intensification of cropping systems especially for the high added-value production of vegetables
and fruit. Nonetheless, water efficiency in most existing irrigation schemes, especially with those
that utilize open canals and flood irrigation, is usually quite low mainly in large to medium
scaled irrigation despite their relatively low number.
The Ministry of Energy and Water (MoEW) estimated the national irrigation water requirement
at 810 MM³ in 2010 (MoEW, 2012). The Béqaa valley alone was seen consuming around 50%
of that quantity, as demonstrated in figure 15, knowing that the MoEW estimated the irrigated
area of Lebanon at 90,000 ha in its calculations. And by having 70% of irrigation water
distributed and delivered in open canals, irrigation is the largest consumer of national water with
the lowest efficiency, as represented in figure 16. Only 6% of irrigation water is applied through

Page 37 of 166
drip systems in Lebanon, compared to 18% in Europe (Sauer et al. 2010). However, when
adding the area irrigated by drip irrigation using private wells, the percentage rises to around
25% (MoA, 2012). Figure 17 elaborated the distribution of irrigated crops across the Lebanese
territory. Around 50 percent of small and medium irrigation schemes lack of proper maintenance
because the revenues generated from irrigation are not sufficient to cover maintenance costs
(Word Bank, 2003).
Figure 15: Irrigation water requirement (MCM/year) per region, 2010 Figure 16: Irrigation water distribution method, 2010
Figure 17: Distribution of irrigated crops across Lebanon
Lebanon’s dam capacity represents 5% of the total renewable water resources in Lebanon, which
is far below the level of other countries in the region. At present, Lebanon has only one large
10%
27%
13%
50%
Beirut and Mount
Lebanon
North Lebanon
South Lebanon
Bekaa 71%
23%
6%
Canals
Sprinklers
Drip

Page 38 of 166
dam, Qaraoun Dam in the Béqaa valley, with a storage capacity of 220 million m³ and has
recently completed the construction of another dam for potable water supply, and the Chabrouh
Dam in Mount Lebanon with a storage capacity of 8 million m³. Historically, Lebanese rural
areas were familiar, and sometimes dependent, on the presence of water reservoirs within or
closely near the villages (Karaa et Al., 2004) Uses of these small lakes are mainly for irrigating
crops and watering farm animals. These uses, as well as other uses, such as recreational, are still
applicable. In the past two decades, tens of artificial small irrigation lakes were constructed by in
all regions of Lebanon either by the government (MoA, MoEW) or through projects funded
externally (World Bank, EU and IFAD, international NGOs and Charities).
Insufficient water storage capacity is a major constraint facing irrigation water demand (World
Bank, 2010b). The Government of Lebanon plans to increase the water storage capacity from its
present level of 235 MM³ to higher levels of about 880 MM³ as well as taking drastic measures
to improve the water supply and distribution efficiencies (MoEW. 2012). The plan foresees a
USD 48 million investment per annum till year 2030. About 60% of the investment is dedicated
to the construction of new 12 dams and 18 large hill lakes. The remaining 40% are directed
towards the modernization of the distribution networks.
These plans are expected to increase irrigation potential by 30 to 50% by 2030, which will in
turn lead to a substantial increase in agriculture production (World Bank, 2010a). This would be
translated by increasing the irrigated area by another 50,000 ha, and rehabilitation or
modernization of irrigation systems in 30,000 ha (MOE/UNDP/ECODIT, 2011). Additionally,
the Ministry of Agriculture (MoA) is planning to construct more than 110 small irrigation
reservoirs in the coming 5-7 years from different sources of funding as detailed in table 7.
Generally, the proposed reservoirs are to be from 20,000 m³ to 100,000 m³ in capacity. Uses of
these small lakes will mainly be directed for irrigating crops and watering farm animals, but
other uses, such as recreational, will also be applicable.

Page 39 of 166
Table 7: Planned irrigation reservoirs to be constructed. (Source: MoA, 2013)
Source of Funding Number of lakes Time interval
MoA Budget 45 2013-2017
HASAD Project 40 2013-2020
SALMA Project 16-18 2014-2019
ARDP Project 8-10 2013-2015
This official policy to increase the water storage capacity has more emphasis in desertification
prone areas (DPA) according to the Lebanese National Action Plan to Combat Desertification
(MoA, 2010a). The region of Baalbek- Hermel in the Béqaa Valley falls within one of the most
desertification prone areas in the country with a high poverty index (MoSA 2008). The low
precipitation and the lack of abundant irrigation water resources in the region have forced the
farmers to adopt cropping systems which require lower amounts of water providing lower yields,
and thus lower profits, such as winter cereals. These conditions forced some farmers to plant
illicit crops (cannabis) which are low water demanding crops and generate high profits. Within
this context, the government and local officials vow to increase the availability of water
resources by constructing small artificial irrigation lakes in the region in order to help farmers
improve their livelihood.
However, the water availability for farmers nowadays remains relying on annual climate
fluctuation. Scientific research on the impacts of constructing such reservoirs in Lebanon is rare
knowing that at a global level, more attention from researchers has been directed to evaluate the
possible impact of large reservoirs and basins (Maestre-Valero et al, 2013).
Similar to the case in Lebanon, the tendency for augmenting water storage capacity is a common
policy in the regions of Middle East and North Africa (MENA). To meet the increased demand
for water, governments in those regions were investing in the provision of more irrigation water
by the construction of more dams and reservoirs with various capacities (Sowers et al., 2011). In
fact, that was a global tendency since the beginning of the last century and that aimed to provide
“new” water for farmers (Gleick et al., 2011). However, some researchers favored the
improvement in the performance of irrigation systems and the need to elaborate adequate
institutional procedures to more efficiently distribute and use the already available water (Al-

Page 40 of 166
Weshah 2000; Ward and Pulido-Velazquez 2012). Nevertheless, new studies argued that merely
investing in the modernization of irrigation schemes in arid and semi-arid zones may lead to
negative consequences. For instance, improved applied water use efficiency was often associated
with increase in plot sizes, water consumption, and energy costs (European Commission, 2012;
Raz, 2014; Contor and Taylor, 2013; Pfeiffer and Lin, 2014; Fernández-García et.al, 2014).
The water use efficiency at the farm level in MENA countries is still under-investigation. The
absence of reliable data and measurements, including the amount of irrigation water applied,
hinder water efficiency research in arid and semi-arid areas (Buytaert et al. 2012). The water use
rights in the region are based on the religious doctrines (Sharia’a) and doctrines of the colonial
era (Morill & Simas, 2009). For example, agricultural water in Lebanon is priced based on the
area of irrigated land rather than on the volume of water applied (World Bank, 2015). To propose
adopting expensive irrigation technology to the farmers in this region, where most are
smallholders and poor, is generally not a realistic proposal (Perry, 2001). Even in Europe, where
modern efficient irrigation technology has been long promoted, only 18% of total irrigation
systems are drip irrigation (Sauer et al. 2010).
3. OBJECTIVES OF THE STUDY
3.1 General objective
The prevailing agricultural production systems remain unable to meet the food needs of most of
the countries in the MENA region (World Bank, 2014). These countries, including Lebanon,
have initiated since decades agricultural policies that advocate the intensification of their
production systems (Selvaraju, 2013). The common two pillars for such policies were:
1. Provision of more water: investing in providing more irrigation water to farmers through
the construction of dams reservoirs and irrigation networks (Sowers et al., 2011).
2. Financial support to farmers. This is usually practiced by the following two ways:
a. Subsidizing some agricultural production inputs; and thus encouraging greater use
of the subsidized inputs.

Page 41 of 166
b. The purchase of famers’ production at subsidized prices compared to international
market prices (Sowers et al., 2011; Breisinger et al, 2010).
However, many questions rise today about the efficacy of such policies targeting to promote
agricultural intensification. For many researchers the efficacy of such a policy will depend
mainly on the initial structure of the studied farms, the level of subsidies accorded for each crops,
and also to the level of initial crop diversity observed at the farm.
The general objectives of this thesis are the following:
1. Assessing the behavior of the farming systems with respect to its production efficiency,
in terms of water and inputs use.
2. Testing the sensitivity of these systems to variations in subsidies and prices.
3. Proposing and evaluating new options to enhance the agricultural production
performance.
From these objectives we have identified some specific questions for this thesis:
(1) What are the characteristics of the farming systems in terms of diversity, and how this would affect the farmers’ behaviors in face of interventions?
(2) How sensitive are those farms by considering their structure, the objective of their production, and the presence or not of the subsidies?
(3) In region where the irrigation is planned to be introduced:
a) What production strategy the farmers should fallow?
b) What price of water is to be fairly used without compromising the production?
3.2 Methodological approach for conducting this study
Agriculture facilitates a link between socio-economic and natural environment and faces several
problems to manage its multiple functions in a sustainable way (Ewert et al., 2009). Policy is
considered as an important pillar to balance these multiple functions of agriculture and
sustainable development. The efficacy of policy designs and their functioning can be improved
by understating their possible impacts on agriculture and via agriculture on sustainable

Page 42 of 166
development (see chapter 2). The complex issues of sustainability and sustainable development
and impacts of policy changes can be addressed through Integrated Assessment and Modeling
(IAM) (Harris, 2002).
In this study we used the scenarios and indicators based approach at regional level, using the
farm typology-CropWat- non-linear programming-Indicators modeling chain (Van Ittersum et
al., 2008; Belhouchette et al., 2010). This modeling chain allows ex-ante assessment of policies
and innovations on the economic, social and environmental performance of farming systems in
several dryland regions (Belhouchette et al., 2012; Souissi et al., 2016).
The limitations on time and data availability restricted us to consider only four representative
arable farms types in three contrasted regions. Our target here was not to represent all the
biophysical and socio-economic diversity of farming systems in Lebanon, but to i) select the
most prevailing farming types in Lebanon in order to characterize their production strategies and
the test operational scenarios targeting to promote their production, and ii) propose a generic
methodology that could be applied for different socio-economic and biophysical conditions, and
various type of socio-economic and environmental policies in different dryland areas.
The proposed methodology is composed from three main steps (Figure 18):
Step 1: Characterizing farms systems diversity
This step allowed us to:
i) Identify the main soil, climatic, technical, agronomic, and socio-economic constraints
explaining the current farming system diversity in one of the main agricultural production
area in Lebanon: Béqaa valley (see chapter 3). In this step, in addition to the clustering
analysis issue, the main challenge was to collect and estimate quantitative biophysical
and socio-economic data representing the main structure and functioning farms in the
study area.
ii) Discuss the production strategy of the clustered farms base on their initial farm
structure (access to water, farm size, cultivated crops, etc). Several socio-economic and
environmental indicators were mobilized for such an analysis.

Page 43 of 166
Step 2: Sensitivity Analysis
Performing a sensitivity analysis of the clustered farms with respect to specific subsidies,
product prices, and irrigation water price. This analysis makes it possible to draw some
conclusions about the sustainability of the currents farming systems with uncertain socio-
economic and climate contexts.
For this part of the work (Steps 1nad 2), we selected the area of Deir Al Ahmar as study
area because it is representative (hotspot) of many other irrigated areas in Lebanon. The
area is located within the country’s most desertification prone area (Baalbek-Hermel).
The introduction of irrigation in the second half of the 20th century created diversified
agricultural production systems in this area, which includes cereals, vegetables and fruit
trees. The sustainability of its current cropping and farming systems has been addressed
within the context of the weak agriculture sector in the country. Uncertainty on water
price and subsidies for production has been always of concern (See 2.1 in Chapter 3).
Step 3: simulating alternative scenarios targeting to promote farm profitability.
The main targets of this step were to:
i) Propose a set of solutions, which can help in promoting irrigated crops (alternative
scenarios) for increasing total farm profitability. For this purpose, different scenarios of
technological innovation and policy changes, and their combination, are considered.
ii) Identify the list of environmental and economic indicators likely to reflect the impact
of the above defined alternative scenarios at field and farm scale, i.e. whether these
alternative scenarios, when compared to the reference scenario (current situation), would
change the area of irrigated crops as well as the economic and environmental indicators
or not.
More concretely this step deals with the simulation of reference (or baseline or current) as
well as alternative scenarios and calculation of socio-economic and environmental
indicators by using farm typology-cropwat-nonlinear programming- indictors modelling
Page 44 of 166
chain. The aim of using the farm typology was to select representative farms at regional
scale.
The first model (CropWat, at field scale) is to simulate the input and output variables of
the main crops cultivated under a wide range of biophysical conditions (water scarcity,
soil type, weather condition, etc.). The goal of this step is to get for each activity (crop by
rotation, technique and soil type) the input/output coefficient (yields and externalities)
and to use them as input in the bio-economic model (based on nonlinear programming)
model at farm level. The aim of using the bio-economic model is then to run the model
for clustered farms in the region and to calculate the economic and environmental
indicators at farm scale (For more details see chapter 3 section 6).
iii) All indicators were calculated and expressed at farm scale. The agronomic and
environmental indicators were first calculated at field scale by using the CropWat model
and then aggregated at farm scale (For more detail see chapter 3, section 6).
For this second part of the work, we selected three different villages as study area. One in the
South (Maroun El Ras), the second is in the North (Qemamine), and the third is located in the
Beqaa Valley, on the eastern part of the country. The three locations are located in the most
densification prone areas (MoA, 2002), and they relatively vary in their cropping patterns and the
access to irrigation water. The main intervention done in these three areas was the construction
of an irrigation lake in each, by the Lebanese government (See 2.1 in Chapter 4). The lakes water
storage capacities are as follows: 20,000m3 in Maroun El Ras, 22,000 m3 in Marjhine and
40,000 m3 in Qemamine.

Page 45 of 166
Figure 18: Main steps of the general methodology of the work

Page 46 of 166
Chapter 2: Planning for the Lebanese Agriculture Sector

Page 47 of 166
OBJECTIVES OF THE CHAPTER
Agricultural policies play a crucial cornerstone in the agricultural sector, based upon which long
term plans and initiatives are placed. The latter may be adapted following the status of food
security, land use and management, development of new technologies, and consumer behavior.
Additionally, a major condition which has been directing agricultural policies in many countries
encompasses the climate change and its factors. Regular evaluation, monitoring, and ultimately
adaptations of policies are usually performed regularly to meet the changing conditions and
strategic objectives priory set.
Developing countries in general, although being some rich in the agricultural resources, may
sometimes face hurdles in the optimization of the entire value chain and its market. It can be
noticed that many developing countries, including Lebanon, rely on exporting agricultural
produce while importing commodities and foodstuffs instead of developing the sector and its
lined industries. This can be linked to an inappropriate vision or unclear strategy, if existing,
which might be subject to change with the changing political infrastructure of the country.
1. ROLES AND FUNCTIONS OF AGRICULTURAL POLICIES
Agricultural policy plays a critical role in determining the rate and pattern of economic growth in
many countries. Major influence is even provided to a set of policies and investments in other
indirect sectors, but which have a broad impact on the agricultural sector productivity, such as
education, health and sanitary facilities, and transportation infrastructure. On the other hand,
other commodity-specific set of policies are able to directly affect agricultural commodities
and/or techniques of production which include taxes, subsidies or other controls measures
targeting specific outputs and inputs as well as macro-prices (interest rates, wage, and exchange
rates).
Therefore, the role of agricultural policies cycles within key factors which are presented in figure
19:
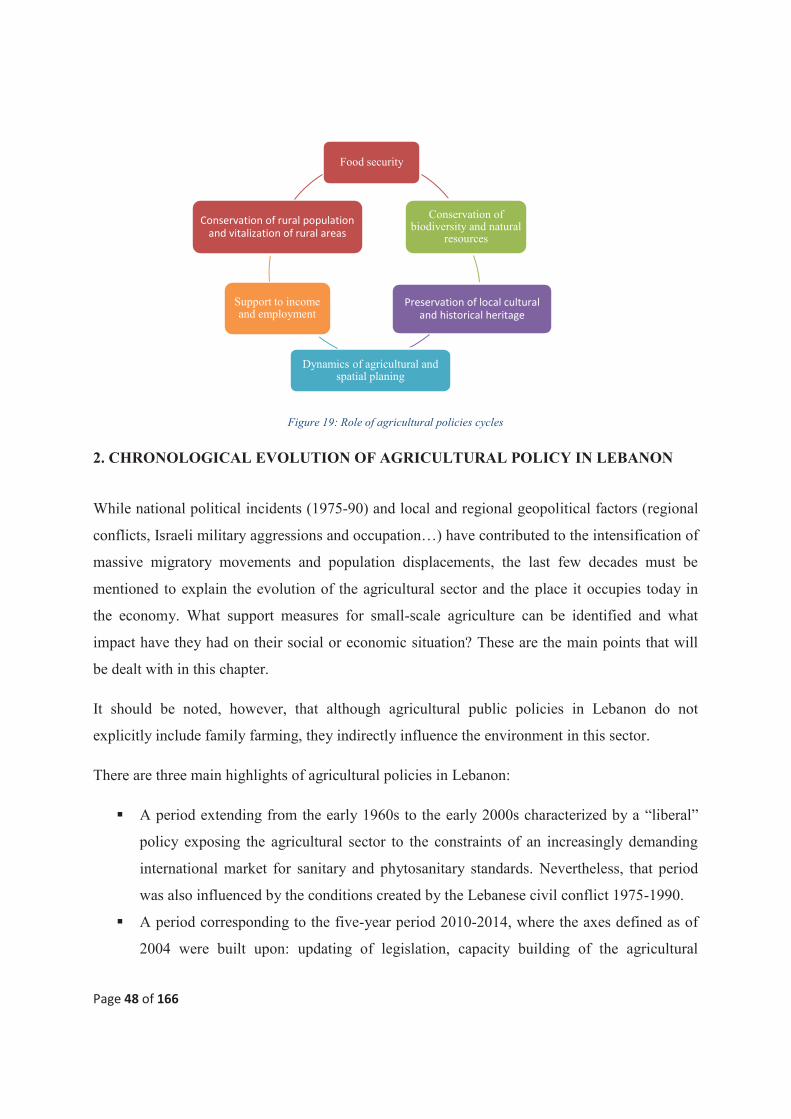
Page 48 of 166
Figure 19: Role of agricultural policies cycles
2. CHRONOLOGICAL EVOLUTION OF AGRICULTURAL POLICY IN LEBANON
While national political incidents (1975-90) and local and regional geopolitical factors (regional
conflicts, Israeli military aggressions and occupation…) have contributed to the intensification of
massive migratory movements and population displacements, the last few decades must be
mentioned to explain the evolution of the agricultural sector and the place it occupies today in
the economy. What support measures for small-scale agriculture can be identified and what
impact have they had on their social or economic situation? These are the main points that will
be dealt with in this chapter.
It should be noted, however, that although agricultural public policies in Lebanon do not
explicitly include family farming, they indirectly influence the environment in this sector.
There are three main highlights of agricultural policies in Lebanon:
§ A period extending from the early 1960s to the early 2000s characterized by a “liberal”
policy exposing the agricultural sector to the constraints of an increasingly demanding
international market for sanitary and phytosanitary standards. Nevertheless, that period
was also influenced by the conditions created by the Lebanese civil conflict 1975-1990.
§ A period corresponding to the five-year period 2010-2014, where the axes defined as of
2004 were built upon: updating of legislation, capacity building of the agricultural
Food security
Conservation of biodiversity and natural
resources
Preservation of local cultural and historical heritage
Dynamics of agricultural and spatial planing
Support to income and employment
Conservation of rural population and vitalization of rural areas

Page 49 of 166
administration, infrastructure and use of natural resources, support for farmers, quality of
products, improvement of sectors, financial environment, environmental protection.
§ The current period is characterized by the promulgation of the strategy planned for the
five-year period 2015-2019 and deepening the guidelines adopted in 2010 by proposing
new actions to strengthen the competitiveness of agriculture, modernize institutions and
to develop both the installation of young farmers and private agricultural investments.
2.1 The 1960s and the war years: from immobility to reconstruction
Agriculture expanded considerably in the 1950s and 1960s. The latter was mainly based on the
export of fresh fruit and vegetables to neighboring countries, particularly in the Gulf countries
with many farmers operating in sectors with little support. The absence of agrarian reforms
(adopted in most neighboring countries, from Egypt to Iraq or Syria) benefited a class of owners
and families who had taken their titles from their relations with the Ottoman regime (owners of
Béqaa, Akkar or Mont-Liban) or their influence during the French mandate. Smallholder farmers
often had an unfavorable status of shares, with rural poverty often the case. Thus, agricultural
and rural exodus constituted an outlet for family labor force in small farms, often subject to
fragmentation.
Until the mid-1950s, Lebanon was a main exporter of fruit and vegetable products in the region.
During the years 1955-1960, the period of the establishment of most public bodies, the Ministry
of Agriculture created (1955). The policy applied to the agricultural sector is a liberal policy,
encouraging exports and opening its markets to foreign products.
Political conflicts (civil war 1975-1990) prevented any concrete interventions by the State. A
region such as the Béqaa was involved in the cultivation of cannabis, whose profitability ensured
profits allowing an accumulation of mobile and immobile assets. Cannabis substitution programs
by sunflower or other crops have been financed by European and international donors since the
mid-1970s. The Israeli aggressions later caused damage of the agricultural infrastructure; trade in
products, displacement of the population which weighed heavily on the functioning of the
agricultural sector. The conflictual political environment would not be conducive to the
deployment of a coherent and organized agricultural policy.

Page 50 of 166
The agricultural growth model was marginalized during the 1990’s and 2000s years and
economic policy was centered on services, real estate, and infrastructure construction. The
interventions were punctual and the developed actions were limited to few supports as mentioned
earlier. The liberal orientation was then confirmed during the post-war period. A free trade
agreement was signed in 2000 with neighboring Syria. Two other multilateral agreements were
also signed, the first in 1997 with the Arab League (GAFTA or Free Trade Agreement of the
Arab League) and the second in 2005 with the European Union. These agreements eliminated
and/or reduced tariffs and allowed for free access of industrial goods and agricultural products to
European markets. Lebanon also accentuates its openness to the international environment by
signing numerous other bilateral trade agreements. The agro-export orientation of agriculture
resulted in the adoption of the "export plus" program launched in 2001. Its aim was to increase
exports, find new markets, and improve quality of the Lebanese agriculture produce. Transport
subsidies by type of produce and by destination were also allocated for this purpose.
While some farms, which have been poorly integrated into international markets, were able to
absorb the effects of unfavorable competition, others were marginalized if not excluded from the
markets due to lack of preparation and support to meet the new standards imposed by the
agreements.
It should be noted that the early 2000s was rich in contributions on agricultural policies. By the
end of June 2003, the European Union had made public a three-year work. The report, entitled
"Elements of Agricultural Policy and Their Master Plan, the Transversal Components", which
finely describes the functioning of Lebanese agriculture, called for a stronger institutional
support. FAO, for its part, delivered a report in 2004 also advocating the importance of having an
agricultural strategy. In addition to the FAO studies, the French cooperation also provided
studies on so-called strategic value chains: meat and milk, fruits and vegetables, and grape vine
and wine.
Local conflicts combined with an institutional and political crisis accentuated in 2004 and after,
could be reasons of why the many recommendations of the abovementioned studies was not be
implemented.
In 2000, an agricultural strategy was set out for the five-year period between 2010 and 2014.

Page 51 of 166
2.2 The 2010-2014 Agricultural Development Strategy
In the official document "Agricultural Sector Development Strategy 2010-2014", the Ministry of
Agriculture (MoA) set the objective of rehabilitating the agricultural sector and aimed to increase
the contribution of the agriculture GDP from 5% to 8% of the national GDP, improving the
situation of agricultural employment, both in terms of job qualification and increase in number,
by reducing the trade balance deficit, and by stimulating the production of strategic crops such as
cereals in order to improve the rate of food self-sufficiency of the country. The issue of the food
safety of agricultural and food products was also raised as a priority strategic objective.
The agricultural strategy was deliberately voluntarist, but with a liberal option, since the State
intervenes less directly in the production activity than through regulatory powers and technical
services (extension, research, teaching).
The strategy was organized around eight main axes:
§ The first axis concerned the updating of legislation (laws, decrees and decisions). The
context has evolved and the authorities are trying to provide a framework for the
interventions of the actors of the agricultural sector. They advocate the adoption of a law
on farmers, insurances against natural disasters, organic farming and a law on
professional grouping.
§ Axis 2 aims, on the one hand, to strengthen the human resources capacities of the
Ministry and its related institutions and the administrations (General Directorate of
Cooperatives, Lebanese Agricultural Research Institute -LARI-, The Green Plan, the
Agricultural Technical Schools) and on the other hand, the improvement of the
functioning of the Ministry of Agriculture. Other institutions associated with it are
addressed in axis 2: other public administrations or the sector of non-governmental
organizations (NGOs), which are quite dense in the country and significantly present in
the agricultural and rural sector. The Prime Minister has prerogatives through the Council
for Development and Reconstruction - CDR - which finances many rural facilities and
the Authority for the Development of Investment in Lebanon (IDAL) in charge of
subsidizing exports. The Ministry of the Interior, for example, is involved with forestry;
the Ministry of Health with the food safety sector; the Ministry of Labor with social

Page 52 of 166
security issues for agricultural activities and fishing; Ministry of Industry with the
promotion of industrial processing of agricultural products; Ministry of Energy and
Water with the sector of major hydraulic infrastructures (dams, pipelines); and the
Ministry of Environment with the forestry sector, the fight against desertification and the
preservation of biodiversity.
§ Axis 3 focuses on agricultural infrastructure and improving the efficiency of the use of
natural resources, rural infrastructure (secondary rural roads), irrigation and water
mobilization systems (hill lakes and dams), and development of marginal lands.
§ Axis 4 addresses the strengthening of the system of technical supervision of farmers
through consultancies and vocational training in various fields (production, marketing,
management ...).
§ Axis 5 relates to the quality control of products of plant or animal origin. The aim is to
train personnel to the standards of hygiene (commercial and sanitary) standards. This
orientation concerns LARI laboratories, as well as the control structures in the sea ports
(Saida, Tripoli and Beirut), the Beirut airport, and the land border crossings.
§ Axis 6 aims to develop the value chains by improving the packaging and marketing of
agricultural products. The selected crop production includes potatoes, grapes, almonds,
cereals, green beans, feed, olives, citrus fruits, bananas, vegetables, medicinal and
aromatic plants as well as cut flowers. In the animal sector, support is given to dairy,
livestock, fisheries, poultry, and beekeeping sectors. These value chains are characterized
by their importance in terms of food security (cereals and milk in particular), in a period
of rising agricultural prices, and by their comparative advantages, both actual and
potential.
§ Axis 7 aims to improve the financial environment for agriculture. The public authority
aims to encourage financing for the sector, particularly for small farmers excluded from
regular financing schemes.
§ Axis 8 aims to protect and conserve natural resources (soils, forests, biodiversity,
pastures, and marine fauna). The aim of the Ministry of Agriculture is to adopt a national
scheme for so-called homogeneous regions, which allows farmers to choose the most
suitable products for the local environment. A plan to combat desertification was defined
within the framework of this four-year plan. For forests, a management program is also
planned to improve the management and development of forested areas.

Page 53 of 166
2.3 Results of 2010-2014 Agricultural Development Strategy
Despite a difficult national political context (institutional crisis) and heavy geopolitical factors
(conflict in Syria) that hampered the realization of the above mentioned strategy, significant
changes have taken place in the Lebanese agriculture.
§ Changes resulting from the implementation of the 2010-2014 strategy
Among the major changes observed as a result of the implementation of the 2010-2014 strategy
was the increase in the budget of the Ministry of Agriculture from 41 billion LBP in 2009 to 78
billion in 2010, 88 billion 2011 and 100 billion in 2012. This increase in the budget allowed the
strengthening of its human capacities and technical support to farmers. Between 2010 and 2013,
the Ministry hired 350 agricultural engineers, veterinarians, assistants, agricultural technicians,
chemists, computer experts, and managers in the general directorate of the ministry, the general
directorate of cooperatives, the Lebanese Agronomic Research Institute and the Green Plan.
Coordination between institutions involved in the function of the agricultural sector
(environment, foreign affairs for the signing of external trade agreements) had improved.
Technical support services also strengthened through the establishment of extension centers in
the regions, which resulted in increased numbers of training and extension sessions, and field
visits to farms. Extension and agricultural consultancy activities in all regions also involved
smallholder farmers.
§ Support to small-scale agriculture through the "Kafalat program"
1- Update of legislation 2- Capacity building of
the agricultural administration
3- Infrastructure and use of natural resources
4- Support for farmers
Product quality and improvement
5- Protection of the environment
Figure 20: 2010 - 2014 Agricultural Development Strategy

Page 54 of 166
The State has initiated an innovative program to finance farmers knowing agricultural financing
was one of the weakest points of agriculture in the country, especially after the Agricultural,
Industrial and Land Credit Bank (BCAIF), which was created in 1954, ceased function due to a
lack of public funds. For this reason, the State supported the "Kafalat Institution" - founded in
1998 - by a pool of banking institutions as a guarantee for granting subsidized credits to
beneficiaries, having the interest supported by the Central Bank of Lebanon. Kafalat helps
financing business activities of different sectors, and not exclusively the agricultural sector.
Seizing the opportunity of a project funded by the European Union and initiated in partnership
with Kafalat, a credit system was specifically allocated to small farmers. The funds were targeted
to support project owners, particularly women and youth based in the agricultural sector.
Kafalat provides mainly two types of credit for farmers:
• "Kafalat petit agriculteur" (small farmers), which aims to support small farmers, agro-food
establishments, and fishermen. It provides microcredits up to a maximum of 65,000,000 LBP
over 7 years with no obligation for the provision of guarantees and with a grace period of one
year.
• "Kafalat Trees" for farmers wishing to grow fruit trees. This loan can go up to 480 million LBP
repayable over 10 years with a grace period of three years, as the time required for trees to reach
production.
In addition, the farmer must provide a guarantee not exceeding 50% of the loan value. The
program aims to stimulate small and medium-sized farmers to involve in agricultural investment
and subsequently increase not only the productivity of their farms but also to generate
employment. It should be noted that this new program of Kafalat initiated in 2011 within the
framework of the (Agriculture and Rural Development Program) ARDP, co-financed by the
European Union and Kafalat SAL, and executed by the Ministry of Agriculture in Lebanon.
During 2013 - 2014 the total number of guarantees issued by Kafalat reached 106 distributed to
amongst all the regions of Lebanon, of which the Béqaa region alone benefited 47 beneficiaries,
approximately half of those issued by the program.
However, the impact of this program has been modest up to November 2013 where only 46
credits had been granted.

Page 55 of 166
§ The Green Plan
The Green Plan is part of the axis for the protection and development of natural resources. It
works on the construction of hill lakes, concrete reservoirs and the adoption of more water-
efficient irrigation methods. A large number of villages (1,707) and more than 3,000 farmers
benefited from this program between 2010 and 2012 according to the Green Plan Annual Report.
§ The Reforestation
In terms of reforestation, the Ministry of Agriculture has implemented a national program of
planting 40 million trees over a 20-year period involving different actors (ministries,
municipalities, non-governmental organizations, civil society and the private sector) at the
national, regional and local levels. This program aims at improving the afforestation rate of the
country.
§ Cooperative organizations
As part of the 2010-2014 strategy, the Ministry of Agriculture adopted a cooperative
development plan that is based mainly on improving decisions and legislations, training and
assigning of human resources. Supported by donors, the plan encouraged women's cooperatives
across Lebanon. Cooperatives are usually located in rural areas and help in the processing of raw
agricultural produce of farmers from their surroundings. The support to cooperatives would thus
vitalize the value chain and the involvement in the end of cycle processing to extend shelf-life
and help maintain the production of traditional Lebanese foods.
2.4 The 2015-2019 Strategy of the Ministry of Agriculture
The 2015-2019 strategy reiterates the orientations defined during the previous strategy. The
rehabilitation of the agricultural sector was translated by an increase in the state budget. Special
attention is given to quality production in order to increase exports and ensure food safety. The
program is underway against a backdrop of structural crisis that is hampering the adoption of
more effective financial laws and instruments.
The share allocated to the Ministry of Agriculture must rise to 1% of public expenditure
compared to 0.5% currently. It must be acknowledged that the agricultural strategy does not call
into question the agro-exporting model promoted by all public interventions and introduces too
few economic reforms giving interest to small-scale agriculture.

Page 56 of 166
The general objective of the Ministry of Agriculture for the years 2015-2019 is to develop the
institutional role of the management of the agricultural sector and to improve its status, so that it
can face challenges and crises in coordination with other concerned parties. The specific
objectives of this strategy are as follows:
§ SO1. Provide a safe and quality food
§ SO2. Improve the contribution of agriculture to the economic and social development of
the country
§ SO3. Promote the sustainable management of natural and genetic resources
Figure 21: The orientations of the new strategy 2015-2019
The strategy defines eight main Courses of Action:
§ Course of Action I: Improve food safety and quality of locally produced and imported
products.
The quality of agri-food
products and marketing
Natural resource manage
ment
Capacity building of decision-
makers and local actors

Page 57 of 166
Proposed actions: formulation of a national food safety policy based on strategic
principles for coordinated and harmonized efforts among concerned institutions;
establishment of an integrated and comprehensive food safety system (from farm to fork);
and provision of safe food from domestic production and imports.
§ Course of Action II: Increase productivity and competitiveness of the Lebanese
agricultural products.
Proposed actions: improving the value chains and increasing the value-added for products
of plant and animal origin; strengthening sanitary and phytosanitary measures; increasing
agricultural exports; enhancing domestic marketing channels; developing national plans
for the conservation and expansion of agriculture and irrigated areas; improving legal
status of farmers and farmers organizations; providing support to small-scale farmers and
producers; and encouraging youth and women to engage in agriculture-related
investments.
§ Course of Action III: Improve the good governance and sustainable use of natural
resources.
Proposed actions: adopting good governance and promoting sustainable use of forests
and pasture lands; improving management of medicinal and aromatic plants and wild
fruit trees sectors; promoting investment in the fisheries and aquaculture and improving
sustainable management of the sector; and modernizing the irrigation system in Lebanon
and encouraging the use of alternative sources of water and energy in agriculture.
§ Course of Action IV: Strengthening agricultural extension and education.
Proposed actions: development of a pluralistic extension system relying on a common
vision and integrated approach of education, research and extension in order to meet
farmers’ needs; promoting partnerships between the public sector, universities, research
centres and associations providing extension services; and upgrading of technical
agricultural schools to meet market demand. The strategy specific objectives are three-
fold: I) To provide safe and quality food; II) To improve the contribution of agriculture to
the economic and social development of the country; III) To promote the sustainable
management of natural and genetic resources.
§ Course of Action V: Strengthening agricultural research and laboratories.

Page 58 of 166
Proposed actions: building and strengthening capacities of the Lebanese Agricultural
Research Institute (LARI) laboratories; enhancing agricultural scientific research; and
improving biodiversity and genetic resources.
§ Course of Action VI: Development of the cooperative sector and mutual funds.
Proposed actions: improving and strengthening capacities of the General Directorate of
Cooperatives; evaluating the status of cooperatives and mutual funds; re-activating the
Cooperative Credit Union and the General National Union of Cooperative Associations;
and supporting and activating the mutual fund providing farmers insurance against
natural disasters.
§ Course of Action VII: Development of the Ministry of Agriculture capacities.
Proposed actions: reinforcing capacities and updating of the organizational structure of
MoA and its affiliated institutions (General Directorate of Cooperatives and the Lebanese
Agricultural Research Institute); reviewing and updating the existing legislations and
regulations governing the sector; developing MoA capacities in negotiation skills;
fostering partnerships with various stakeholders from the private and public sectors; and
strengthening the capacities of MoA in disaster and crisis risk management.
§ Course of Action VIII: Responding to climate change impacts.
Proposed actions: mainstreaming of the Ministry of Agriculture activities related to
climate change; introducing adaptation measures; conducting studies to estimate
greenhouse gas emissions from the agricultural sector, land use changes and forestry.
This strategy will contribute through its various courses of actions/areas of intervention to
reducing impacts of climate change and GHG emissions in the agricultural sector.
For the expected outputs following the 5 years for the first three objectives are as follows:
1- SO1: contribution to a 50% reduction in the level of exported products previously refused
due to safety and quality reasons by 2019, a decrease in the non-compliance rate of
internal inspection samples by 60% by 2019, a 25% reduction in the level of food
contamination in the follow-up analysis to be carried out through follow-up surveys by
2019, and within 50% of registered establishments by 2019.

Page 59 of 166
2- SO2: 10% increase in agricultural exports by 2019, decrease in export rejections, increase
in broiler production to 62 million birds by 2019, increase in domestic production of milk
and dairy products to 40% by 2019 of total domestic consumption, conversion of 25,000
hectares to irrigated agricultural land by 2019 and increase in the number of small
farmers, youth and women benefiting from subsidized loans.
3- SO3: 5% increase in total forested areas by 2019, increase in the quantity and value of
forest crops to 85 million USD by 2019, sage and oregano to 185,000 kg by 2019, the
establishment of a forested area and pastures on which a sustainable management plan is
applied, an increase in the number of registered fishermen from 6,000 in 2013 to 8,000 by
2019, increasing the amount of production per unit of fishing activities, increasing the
quantity of aquaculture production to 9,000 by 2019 (4,500 tons in 2013), increase in fish
and aquatic stocks over a period of 10 years and the increase of the conversion ratio to
modern irrigation on the total irrigated area of 15% by 2019.
Figure 22: Represented a visual summary for the chronological evolution of agricultural policies in Lebanon.
3. AVAILABLE SUBSIDIES FOR THE AGRICULTURAL SECTOR
3.1. Current Subsidies
1990-1992:
Reconstruction
period favoring the
development of the
service sector
Agriculture was not
in the priority of
public policies,
2005-2009:
Agricultural sector
where everything is
allowed, there is no
control, arbitrary use
of phytosanitary
products
……

Page 60 of 166
Lebanon has never adopted a sustainable official strategy for subsidies of the agriculture sector.
However, subsidies were offered to some agricultural sectors through several governmental
bodies.
For instance, the Ministry of Agriculture (MoA) is not the main channel of public spending on
agriculture in the country. Since 2008, a number of public institutions supported the agriculture
sector as follows:
1. The Ministry of Economy and Trade contributed US$ 94.8 million as subsidy to imported
wheat prices after the termination of support to the local wheat production. However, in
the 2010-2014 strategy, the Ministry re-applied the support of local wheat production.
2. The Ministry of Finance (MoF) paid US$ 51.1 million as tobacco subsidies, in addition to
subsidizing, by US$5.3 million, the interest rate of a credit program for agriculture
productive projects run by the Central Bank of Lebanon.
3. The Investment Development Authority of Lebanon (IDAL) allocated US$19.9 million
for its Export Plus program, in which it partly subsidizes the transportation costs of
Lebanese exporters of fruit and vegetables.
4. The Ministry of Energy and Water (MoEW) and the Lebanese Litani Authority (LRA)
are major contributors to agriculture support through guide irrigation investment
programs and subsidized irrigation water delivered to the farmers. However, no accurate
yearly data are available.
5. Also the international donors’ community has been contributing substantially to financing
agriculture projects in Lebanon. However, no comprehensive data on yearly contributions
have been made yet (World Bank, 2010a).
Much of the little given support is not directly directed to local farmers. Rather the support is
contributed to imported or exported products or to exporters rather than directly to farmers,
knowing that the Ministry of Agriculture, although having enough infrastructure and human
resources, still has limited budget and financial resources.
3.2 Subsidized Agricultural Products
The main agriculture value chains that have been receiving significant governmental subsidies
include: wheat, sugar beet, tobacco, and irrigation water.

Page 61 of 166
Wheat and Sugar Beet
In 1959, the Office of Cereals and Sugar Beet was created within the Ministry of National
Economy for the purpose to ensure the provision of bread in terms of quality and safety at the
national level, and to promote the production of cereals (namely wheat, barley, and corn) and
sugar beet in the country. The office was later renamed the Directorate General of Cereals and
Beetroot (DGCB).
Wheat
The DGCB has been authorized to subsidize the domestic production of wheat by purchasing the
production of local farmers at above market prices and selling it at market prices to flour mills or
traders and/or compensate to domestic farmers per area of cultivated land (MoET, 2017). The
DGCB also subsidies imported wheat used by local mills to stabilize the domestic local bread
prices, for social reasons, and under the permission from the Council of Ministers (CoM) of
Lebanon.
The DGCB had been channeling subsidies to local wheat producers since its foundation. The
amount of yearly subsidy had been a function of quantities produced, purchasing price put by the
government, and the international market price of wheat (Table 8).
Table 8: Data of purchased local wheat from 1993 to 2005 and calculated subsidy (Adapted from DGCB website)
Wheat Production
Year
Subsidized Price
(US$)
International
Price (US$)
Quantities received
from Farmers
(Ton)
Subsidy
(US$)
1995 220 194 16,182 420732
1996 267 238 17,515 507935
1997 267 184 24,380 2023540
1998 267 140 29,142 3701034
1999 267 150 38,193 4468581
2000 267 140 67,323 8550021
2001 264 140 70,417 8731708
2002 250 130 66,375 7965000
2003 250 150 53,669 5366900
2004 250 150 60,728 6072800

Page 62 of 166
2005 250 150 73,000 7300000
2006 250 200 65000 3250000
In 2005, a major turning point for this support program occurred when the CoM decided to phase
out the subsidy for local wheat production over a period of three years starting 2006, and to
terminate the DGCB. The plan was to reduce the subsidies by one third each year. However, in
2006, the wheat farmers were unable to sell their production due to low international wheat
prices. The government was forced to renew the work in the subsidy program year by year. And
in 2010, it decided to keep the DGCB and renew the subsidy program on continuous basis.
Subsidy cost to wheat and bread averaged between LBP129 billion between 2007 and 2011.
However, most of the bulk value of this subsidy was spent on subsidizing local bread made of
imported wheat, where the wheat subsidy for direct farmers had been relatively low (MoF,
2012).
In 2007, with the onset of the crisis in world food prices, local farmers were able to sell their
wheat at better prices compared to the government price, in both local and international market.
Only part of the wheat harvest was sold to the government, which was able to resell it at a higher
price and made profit. The DGCB purchased the wheat at LBP 375,000 per ton and sold it for an
average of LBP 507,984 per ton, making LBP1.1 billion of profit. In 2008, no wheat was sold to
the government.
In 2009, after the food prices had eased globally, the government returned to subsidizing wheat,
but with a new condition. Subsidy was provided to farmers based on the surface area cultivated
with wheat rather than the quantity of grain produced. A ceiling of 4-5 ton of wheat per hectare
was set, based on the area of cultivation. Wheat was purchased by DGCB at LBP 475,000 per
ton and sold at LBP 268,462 per ton.
In 2010, weather conditions affected badly the wheat harvest, reducing it in some areas of
Lebanon only to 40% of normal productivity. In effort to compensate the affected farmers, the
government decided to purchase the grain at LBP 375,000 per ton, with an additional support of
LBP 1,000,000 per hectare of cultivated wheat land.

Page 63 of 166
In summary, and after two years of no support to wheat farmers in 2007 and 2008, the
Government of Lebanon payed wheat subsidies of LBP 200 million and LBP 7.8 billion in 2009
and 2010, respectively.
Table 9: Quantities of DGCB purchased wheat from the major wheat producing areas of Lebanon (2005-2010) (Source; DGCB
website)
Year Béqaa North
Lebanon
South
Lebanon
Total
(tons)
2005 64898 6622 1391 72911
2006 58241 5655 1492 65388
2007 5789 2279 278 8346
2008 - - - -
2009 35095 1010 583 36688
2010 9981 585 328 10893
Following the latter information, the cultivation of wheat has been shown not to have a
significantly high ratio of cost to profit. On the other hand, that cultivation plays a crucial step of
agricultural rotation and ultimately food security at the level of the country in the long term, the
same strategy being already focused on by developed countries such as the United States,
Canada and European countries. Moreover, the locally produced wheat cultivation has the
potential of being better monitored and controlled across the value chain from cultivation to
harvest and storage thus having the capability to better maintain the quality and safety at the
level of the end consumer. Ultimately, direct subsidies are also socially able to help and
encourage farmers to invest in agriculture in their rural areas, which decreases urban-rural
migration while increasing income generating opportunities; knowing that the goal of
subsidizing wheat wouldn’t be targeted towards international competition rather than achieving a
socio-economic stability.
Sugar beet
Lebanese farmers started sugar beet cultivation in the 1940s. This cultivation experienced a boost
in the late 1950s upon the establishment of a new sugar beet factory in the Béqaa valley. With
the support of the government subsidies, sugar beet cultivation flourished till the year of 1985,

Page 64 of 166
when the factory stopped production due to security reasons caused by the Israeli occupation of
the South Béqaa Valley.
From 1985 to 1991, the cultivation of sugar beets was halted in the absence of governmental
support and the inability to market the produce at the levels of neither local nor export market.
In 1991, with the relative regain of security in the region, and within the context to its efforts to
fight the cultivation of illicit crops, the State has decided to return to subsidizing of sugar beet
cultivation. An action which lasted till year 2000 when the government decided to stop the
support (Decision No. 45 of 20/09/2000). The interruption in offering subsidies to farmers lasted
until 2004, when support was reinstated again by the government by (Resolution No. 63 dated
30/01/2004, amended by Decree No. 26 dated 18/03/2004). In that time, the government posed
the following conditions:
1. A fixed price of LBP 102,000 to pay a ton of sugar beet.
2. Minimum sweetness of sugar beet at 15%.
3. Total area planted with sugar beet not to exceed 3,000 hectares per year at the national
level.
4. Priority for small farmers. A farmer could benefit of 5 hectares maximum per year.
5. The yield at a rate of 55 tons per hectare is acceptable. Any additional yield, and up to
25% only, is compensated at half price (LBP 51000 per ton).
6. Support would be only for sugar beet cultivation and not for sugar processing.
On 13/10/2005, the government took the Decision No. 42 to phase out the support of wheat
and sugar beet production in three years and at the end of which the DGCB would be
terminated. During this period, the government would compensate the farmers but with a
decreasing subsidy by one third annually, until the support stops. The transition period was
inconsistent in terms of sugar beet production and it ended with nearly total termination of
this cultivation in the country. Table 10 shows the production of sugar beet and the respective
subsidized price given from 1995 to 2006.
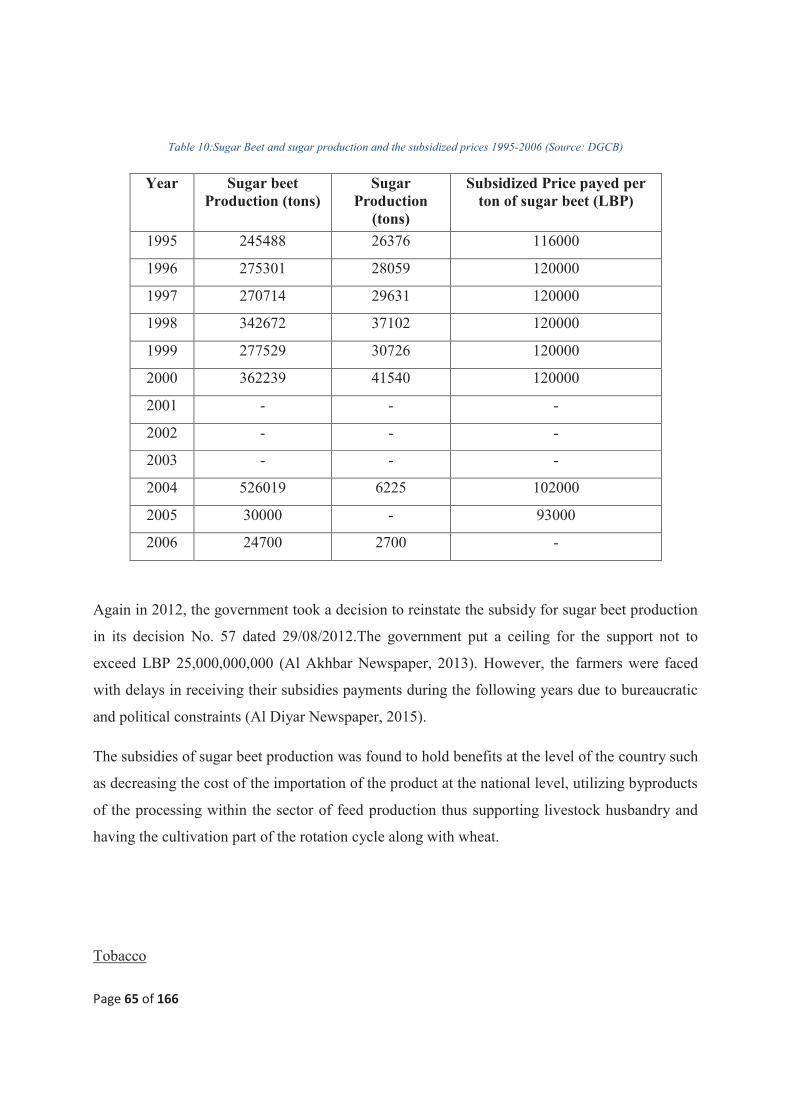
Page 65 of 166
Table 10:Sugar Beet and sugar production and the subsidized prices 1995-2006 (Source: DGCB)
Year Sugar beet
Production (tons)
Sugar
Production
(tons)
Subsidized Price payed per
ton of sugar beet (LBP)
1995 245488 26376 116000
1996 275301 28059 120000
1997 270714 29631 120000
1998 342672 37102 120000
1999 277529 30726 120000
2000 362239 41540 120000
2001 - - -
2002 - - -
2003 - - -
2004 526019 6225 102000
2005 30000 - 93000
2006 24700 2700 -
Again in 2012, the government took a decision to reinstate the subsidy for sugar beet production
in its decision No. 57 dated 29/08/2012.The government put a ceiling for the support not to
exceed LBP 25,000,000,000 (Al Akhbar Newspaper, 2013). However, the farmers were faced
with delays in receiving their subsidies payments during the following years due to bureaucratic
and political constraints (Al Diyar Newspaper, 2015).
The subsidies of sugar beet production was found to hold benefits at the level of the country such
as decreasing the cost of the importation of the product at the national level, utilizing byproducts
of the processing within the sector of feed production thus supporting livestock husbandry and
having the cultivation part of the rotation cycle along with wheat.
Tobacco

Page 66 of 166
The Régie Libanaise des Tabacs et Tombacs (abbreviated by Regie) was established in 1935 as a
monopoly company to control the tobacco sector in Lebanon and Syria. In 1952, the company
was nationalized and separated from the Syrian side; and later in 1991 it became owned by the
Lebanese state (RLTT, 2017). The Regie is under direct control of the Ministry of Finance
(MoF). Its financial operations (expenses, losses, net profits… etc.) are directly linked to the
Lebanese public treasury.
The mission of the Regie can be summarized in the two following points:
1. To subsidize the local production of tobacco through a price support program in which
the Regie purchase the tobacco from licensed farmers at a price higher than the
international market price.
2. To exclusively import and export tobacco leaves and products, and to exclusively
produce tobacco products in Lebanon.
The Regie worked by giving farmers licenses to plant tobacco and tombac until the year 1968
where it replaced the licenses with special permits. The latter allowed framers to produce more
tobacco per capita. In 1994, the Regie acquired exclusivity to import and export tobacco leaves
and products, and to produce tobacco products in Lebanon. The exclusivity was granted by
means of MoF Decision No. 10412/1.
The number of farmers with permits is currently 24,000. They produce around 8,000 tons of
tobacco in around 458 villages (Table 11). According to RTTL data, around 57% of tobacco is
produced in the southern part of the country with Béqaa and North Lebanon producing 22% and
20% respectively.
Table 11: Number of villages having tobacco permits and their respective average yearly production (RTTL website)
Béqaa North
Lebanon
South
Lebanon
Number of villages 117 148 193
Tobacco production (tons) 1800 1600 4500
Each permit allows for a maximum ceiling of 400 kilograms of tobacco with each farmer is
restricted to one village, being an actual tobacco farmer (RTTL, 2017; Kabbani et al, 2008).

Page 67 of 166
As an average the Regie pays 12,000 LBP/kg for the tobacco purchased from the farmers in the
South, and between 10,000 - 11,000 LBP/kg for the tobacco purchased form Béqaa and Akkar;
respectively. The southern tobacco is sold in the international market for an average 6000
LBP/kg for that which comes mostly from the variety “Saada 6”. Tobacco of the Béqaa (mainly
the variety American Barley) and Akkar (mainly the variety Bafra Baladi) is sold at of 5,000
LBP/kg only. (Kabbani et al, 2008; Anon, 2001).
The Regie pays farmers the subsidized prices partly from the reselling of tobacco leaf abroad,
from sale revenues of its domestic tobacco products, and mostly from the high taxes imposed on
imported tobacco products.
The tobacco subsidy has been playing a socio-economic and political role mainly in South
Lebanon, and in some parts of Béqaa and North Lebanon, mainly through the following:
1. Generating income to rural communities, especially in fragile semi-arid areas of the
country (MoA, 2003).
2. Securing employment for 37,000 people including 24,000 farmers whose 82% of them
have holdings less than 0.4 hectare (International Labour Organization, 2002; Kabbani et
al, 2008).
3. Helping replace illicit crop in the Baalbek-Hermel area.
The tobacco subsidy reached is some years nearly the double in size the MoA’s budget.
However this type of Price Support Program (PSP) for tobacco, which is similar to programs in
some other tobacco producing countries like the USA (Womach, 1995), has been controversial
for years.
1. The tobacco subsidy is becoming expensive for the national economy, especially with the
economic crisis affecting Lebanon in the last decades. However, others say this support is
bearable, since price subsidies of bread and the domestic production of tobacco does not
account for more than a negligible 0.03% of the GDP (Le Borgne, 2016).
2. The Lebanese parliament ratified the WHO’s “Framework Convention on Tobacco
Control” in December 2005 (Salti et al, 2015). This fact will affect the whole tobacco
industry and its major players.

Page 68 of 166
3. The program does not encourage the national efforts to reduce smoking in the country,
because legislators are worried of actions which may affect the livelihood of tobacco
farmers, in the absence of viable economic alternatives (Nakkash & Al Kadi, 2014).
4. Lebanon is trying to access the World Trade organization (WTO). The WTO opposes the
PSPs and considers they encourage the dumping behavior of products in the markets
(MoET, 2010).
Due to political and socio-economic conditions, any attempt to abolish the tobacco subsidy is
likely to cause friction in the country. The World Bank, which addresses the tobacco subsidies
several times, proposed some measures to be taken in order to mitigate any frictions (World
Bank, 2010). These measures include the following:
1. Learning lessons from other countries who replaced the PSP of tobacco with direct
income support (DIS) program like Turkey, New Zealand, and Mexico.
2. Provision of effective extension services to help farmers adopt alternative crops instead
of tobacco.
3. Investing in provision of more irrigation water storage capacity and infrastructure as an
integral part of introducing alternative profitable crops to tobacco.
4. Re-investing any savings in strategic objectives such as the marketing agricultural
products, farming system productivity, and food quality and safety.
Irrigation Water
Sector wise, crop irrigation is the largest water consumer in Lebanon. It has always been a
burden on the budget, and the government expected a deficit of about $82 million for the period
of 2011-2015 (World Bank, 2012).
Three tariffs are generally used in the country for irrigation water:
1. Charging per area: the dominant tariff model, estimated at around 60% of irrigation water
distributed nationwide. Farmers pay lump sums charges based on area irrigated. Rate is
USD 400/ha on average.

Page 69 of 166
2. Charging per hour: around 30% of irrigation water delivered. Farmers pay per delivering
time to their fields. Rate averages USD 6 per hour
3. Charging per volume: around 10%, and used in case of pressurized networks with water
meters. Rate is USD 0.12/m3 on average (MoEW, 2010).
These rates are far below the actual cost of irrigation water. The MoEW put a plan to increase
the three tariffs rates in 10 years in order to recover the cost of operation and maintenance,
administrative costs, depreciation, and debt service (Table 12). The Ministry is planning also to
increase the tariffs collection rate for irrigation water from less than 10% to 60%. Nevertheless
MoEW is expecting a yearly USD 15 million yearly deficit by 2020.
For the moment, irrigation tariffs are not enough to cover O&M costs, resulting in making about
50 percent of small and medium irrigation schemes without proper maintenance. Even the
biggest irrigation water project in the country, the Litany River Authority, is charging famers less
than 50% of the water operation and maintenance costs (World Bank, 2010b).
Table 12: Projected rates to be collected from farmers 2011-2020
Year 2011 2012 2013 2014 2015 2016 2017 2018 2019 2020
Tariffs
volumetric (USD/m³) 0.12 0.12 0.12 0.12 0.14 0.14 0.17 0.17 0.17 0.21
per hour (USD/hour) 6 6 6 6 7.2 7.2 8.64 8.64 8.64 10.37
per area (USD/ha) 400 400 400 400 480 480 576 576 576 691.2
Based on the above, it is clear the Lebanon has never adopted a holistic strategy to address
developing its agricultural sector. The recent tendency of the Ministry of agriculture to produce
and implement strategic plans for the sector was a major improvement in the way, but enough
though. The importance of the agriculture sector for the security of the country and the livelihood
of its farmers necessitate the adoption of strategic plans at the State level, in which all relevant
stakeholders, governmental and non-governmental, are involved in elaboration and
implementation.

Page 70 of 166
Chapter 3: Assessing the diversity of irrigated farming production systems
performances in Semi-Arid areas: Lebanon Case Study.

Page 71 of 166
Assessing the diversity of irrigated farming production systems performances in
Semi-Arid areas: Lebanon Case Study.
Mohamad El Khansa1,2,*, Roza Chenoune1, Salem Darwich3, Mariem Baccar1
,Farah Kanj1,Severin Pistre4, Hatem Belhouchette1,5.
Abstract
In the pursuit to meet the food needs, countries in the Middle East and North Africa
(MENA) have adopted policies which advocate the intensification of their
agricultural production systems through subsidizing product prices, and inputs such
as water, nitrogen, and pesticides. The productivity of several typical irrigated
farms in a semi-dry area of Lebanon considering key inputs in relation to subsidies
was analysed. Farm income and environmental impacts were taken into
consideration. The majority of irrigated farms were found very dependent on direct
or indirect support levels granted to farmers. Intensification allowed farmers to
increase income, but often at the cost of environment.
Keywords: productivity, performance, subsidies, irrigation, intensification, semi-
arid.
1. INTRODUCTION
The economy of the Middle East and North Africa (MENA) region relies heavily on agriculture
as a source of food and income that offers employment to more than 35 percent of the population
and contributes around 13 percent of the region’s GDP (Verner, 2012).
In many cases, however, the prevailing agricultural production systems remain unable to meet
the food needs of most of these countries, as shown by their food trade deficits (World Bank,
2014). For this reason, the countries of the region have initiated agricultural policies that
advocate the intensification of their production systems (Selvaraju, 2013). These policies
encourage greater use of subsidized inputs such as water, nitrogen, and pesticides (Sowers et al.,
2011; Breisinger et al, 2010) to help support farmers. In addition, support for the purchase of

Page 72 of 166
famers’ production at subsidized prices compared to international market prices is often
practiced (Breisinger et al, 2010). This support often includes products for consumption such as
wheat in Tunisia (Laajimi et al 2017), and Lebanon (Ministry of Finance, 2012), or products that
have an important social role in terms of labour required, such as horticultural crops in Egypt
(Minot et al, 2010).
Historically, agricultural production in the MENA region is often cited as being very inefficient
in terms of input valuation (Jemaa & Dhif, 2005). There are many reasons for this: low soil
fertility, demanding water stress, unqualified and poorly mechanized labour force, etc. (World
Bank, 2014). Nevertheless, for several authors, the implementation of these intensification
policies was associated with improvements in both overall agricultural production and the
productivity of these systems (Lee et al, 2001; Belloumi & Matoussi, 2009).
Others believe that this improvement in the performance of irrigated agricultural systems is
partially artificial, because the cost of agricultural support remains high, but does not necessarily
lead to better performance in terms of production (Breisinger et al, 2010).
The objective of this article is to analyse the farm income and environmental impacts
performance of agricultural production, as well as the productivity of several typical irrigated
farms in Lebanon in relation to key inputs. This productivity has been tested with and without
support for agriculture as it is practiced today.
2. MATERIALS AND METHODS
2.1 Characteristics of the Study Area
Lebanon lies on the eastern shores of the Mediterranean. It is characterized by two
mountain ranges, Mount Lebanon and Anti-Lebanon, and between them lies a large agricultural
plain, the Béqaa Valley, which covers over one third of the country’s area. The study area for
this research is located in the Baalbek-Hermel Governorate (Mohafaza). The latter constitutes the
northern part of the Béqaa Valley, which is a major agricultural production area situated in the
east of the country and is made up of 2 governorates: Béqaa and Baalbek-Hermel (figure 23).

Page 73 of 166
Figure 23: Map of Lebanon Showing Deir Al Ahmar district in Baalbek-Hermel Governorate
Baalbek-Hermel is the most desertification prone area in Lebanon, characterized by cold
winters and hot summers with a strong gradient heat. The average annual rainfall is around 400
mm (MoA, 2003). Precipitation is concentrated mainly from November to February. Water
runoff from melting ice in the mountains is a major water source for agriculture.
The Governorate represents 19% of permanent crops and 29% of annual crops at national
level. It also hosts 25% of the total agricultural cultivated area, and 28% of the irrigated area.
The main figures of the contribution of the Governorate to main national agricultural produce
totals are 30% of cereals, 36% of pulses, 33% of vegetables, 55% of stone fruits, 39% of grapes,
and 36% of industrial crops (MoA, 2012).
The district of Deir Al Ahmar is a major agricultural production area (Figure 23). It has a
relatively well developed irrigated area compared to the rest of the region. The irrigated system
in the district is characterized by a network of open concrete canals bringing water from “El
Yammouneh” spring in addition to two hill lakes for irrigation (capacities of 35,000 m³ and
75,000 m³, respectively), as well as private wells.

Page 74 of 166
As declared by the representatives of Béqaa water authorities, the district benefits from
around 32% of the amount delivered from the Yammouneh spring through an open concrete
canal. The channel at the entrance is divided into two main canals of equal size: one of them
irrigates the hilly areas including two small hill lakes. The second canal irrigates the plain area.
Mediterranean red soil (ferruginous) is the dominant soil type in the study area. It is a
colluvial fertile soil with a depth of between 2 and 3 m. Second in dominance is the shallow
calcareous soil (Baccar, 2013).
Until the early 20th century, and due to prevailing drought, the common agricultural
system which prevailed across the Baalbek-Hermel plain was the cereal (barley)-legume
rotations associated with raising sheep (Yau & Ryan, 2013). Intensification started deliberately
in the 1970s, mainly due to the uncontrolled digging of wells with the beginning of the civil war
(Jomaa et al, 2015). This allowed farmers in the district to practice more intensive production in
areas where only rain-fed crops were grown.
Later on intensification was enhanced by the introduction of subsidies for wheat
production (in the 1960s) and tobacco premiums (in the 1990s, to replace illicit crops).
2.2 Farming systems and performance characterization
In order to assess the performance of farming systems in the study area, a general methodology
was adopted based on the three following steps:
(5) A farmers’ survey to investigate the cropping patterns practiced by farmers as well as the
relevant socio-economic context.
(6) A farm typology to allow the grouping of existing farms based on their biophysical and
socio-economic characteristics.
(7) A sensitivity analysis of farmers’ income in relation to to prices and subsidies
variabilities.
2.2.1 Survey at farm level.
· Selection of representative farms
According to MoA’s agricultural census of 2010, 486 farmers were active in agricultural
production in the district of Deir Al Ahmar; most of them irrigate their crops. In November 2013,
a sample of 97 farmers out of 486 were selected and given a quantitative questionnaire
containing closed questions (dichotomous, multiple choice) and open questions (qualitative).

Page 75 of 166
20% of farms found at Deir El Ahmar district level were therefore surveyed over the course of
this study. The questionnaire covered the farmer’s socio-economic profile, farming practices,
production, costs incurred, and marketing access strategies.
In order to have a statistically sound sample of farmers, and which may represent the different
cropping patterns in the region, data from MoA’s agricultural census of 2010 were used to help
select representative farms according to the following three criteria: farm size, source of
irrigation, and farm production orientation (Table 13).
Table 13:distribution of surveyed farms according to farm size intervals, source of irrigation and farm production orientation.
Number of
Interval of farm size
(ha) Source of irrigation Farm production orientation
< 3 3-5 5-9 > 9 Lakes Canal well cereals industrial
crops fruit trees
vegetables
Surveyed farms 36 25 19 17 56 38 3 21 12 31 31
Farms in Deir El
Ahmar
176 115 98 97 108 234 108 175 165 73 73
% of surveyed
farms (%)
20 21 20 18 51 16 2 12 7 42 42
· Farm size: The district of Deir Al Ahmar is characterized by small farm sizes, where 38.2% of
the farms have less than 3 hectares, 23.5% have between 3 and 5 hectares, 29.5% have between 5
and 9 hectares, and only 8.8% of farmers have more than 9 hectares.
· Source of irrigation (Lake, canal, wells): among the 486 farmers found in Deir Al Ahmar
district, 234 irrigate using water from canals, 144 using water from the two lakes, and 108 using
water from wells. The irrigation source choice can notably be explained by the proximity of the
farm to the irrigation source, but also by the price of irrigation water. The cost of a cubic meter
of irrigation water is 100 LBP/m3, 143 LBP/m3, 716 LBP/m3 for canals, the two lakes, and wells,
respectively.
· Cropping systems specialization based on dominant crop area: the specialization distinction
was specified in the census of 2010. Four farm production orientations were identified by the
census: cereals (dominated by winter durum wheat and winter barley), industrial crops
(dominated by tobacco), fruit trees (dominated by grape vines), and vegetables (dominated by
onions and potatoes) which are represented by 175, 165, 73 and 73 farms, respectively.
Table 13 shows that only 3 farms irrigated with well water were surveyed. This seemed
sufficient since potato is the only well-irrigated crop within the study zone. In addition, farmers

Page 76 of 166
use roughly the same pumps with relatively similar flow rates, and therefore the same irrigation
doses (Baccar, 2013).
· Data Collection
Questionnaires were filled in during individual face-to-face interviews with the 97 selected
farmers. In addition to sizes of area cultivated with different crops, farmers were asked to specify
quantities and costs of the inputs they use in the production of their crops including fertilizers,
pesticides, water labour (permanent and seasonal), etc. They were also asked to specify the
marketing channels (direct, intermediary, and export) of their produce and the prices they
received for each channel (Table 14).
Table 14: Average prices of crops received by farmers according to the way of marketing 2011-2013. (NA=Not available).
Crop Prices per way of marketing
(LBP/kg)
Direct Intermediary Exporter
Apple 1600 1184 1600
Barley 375 488 750
Cherries 1200 1114 NA
Chickpeas 3000 NA 2250
Cucumber 1175 1057 NA
Eggplant NA 1000 NA
Garlic NA 500 600
Grapes 1725 1595 1485
Lentils NA 1050 NA
Melon NA 900 NA
Olive 1425 933 NA
Onion 443 452 600
Pear 1000 NA NA
Potato 506 495 691
Tobacco 10847 NA NA
Wheat 390 400 750
The data obtained from the questionnaire allowed us to quantify the costs and gross margins
resulting from the farming activities for each farmer (Table 15).
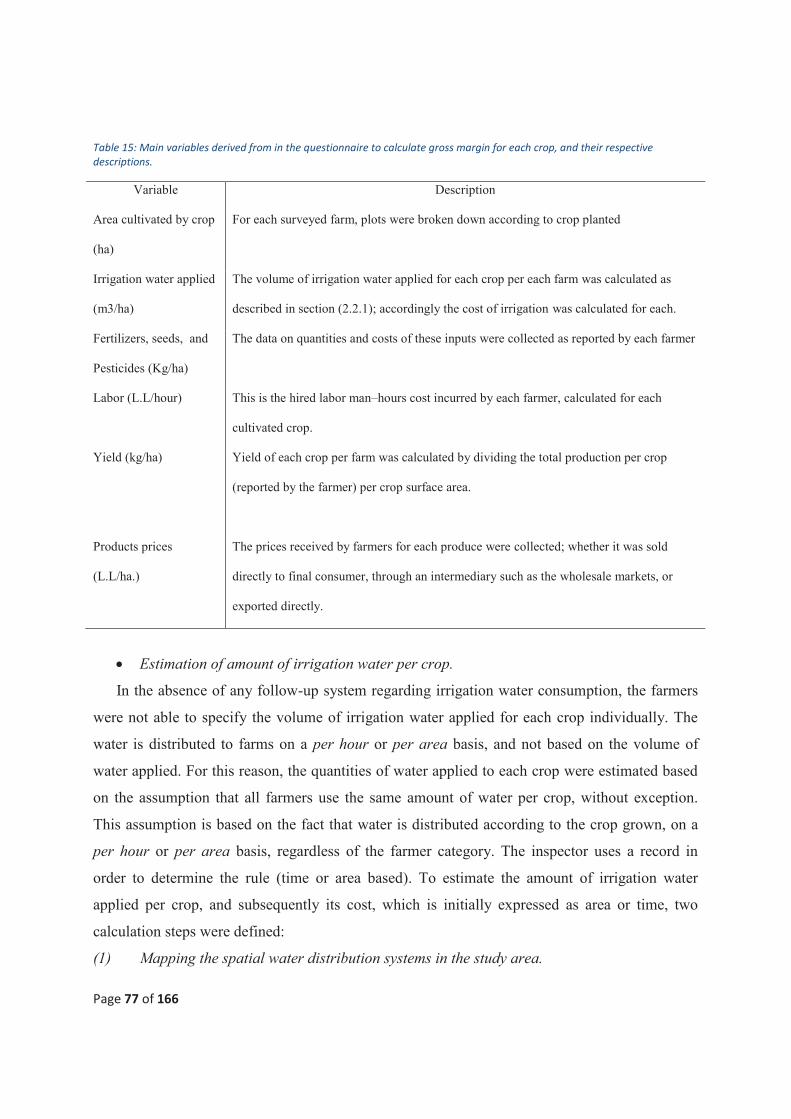
Page 77 of 166
Table 15: Main variables derived from in the questionnaire to calculate gross margin for each crop, and their respective
descriptions.
Variable Description
Area cultivated by crop
(ha)
For each surveyed farm, plots were broken down according to crop planted
Irrigation water applied
(m3/ha)
The volume of irrigation water applied for each crop per each farm was calculated as
described in section (2.2.1); accordingly the cost of irrigation was calculated for each.
Fertilizers, seeds, and
Pesticides (Kg/ha)
The data on quantities and costs of these inputs were collected as reported by each farmer
Labor (L.L/hour) This is the hired labor man–hours cost incurred by each farmer, calculated for each
cultivated crop.
Yield (kg/ha) Yield of each crop per farm was calculated by dividing the total production per crop
(reported by the farmer) per crop surface area.
Products prices
(L.L/ha.)
The prices received by farmers for each produce were collected; whether it was sold
directly to final consumer, through an intermediary such as the wholesale markets, or
exported directly.
· Estimation of amount of irrigation water per crop.
In the absence of any follow-up system regarding irrigation water consumption, the farmers
were not able to specify the volume of irrigation water applied for each crop individually. The
water is distributed to farms on a per hour or per area basis, and not based on the volume of
water applied. For this reason, the quantities of water applied to each crop were estimated based
on the assumption that all farmers use the same amount of water per crop, without exception.
This assumption is based on the fact that water is distributed according to the crop grown, on a
per hour or per area basis, regardless of the farmer category. The inspector uses a record in
order to determine the rule (time or area based). To estimate the amount of irrigation water
applied per crop, and subsequently its cost, which is initially expressed as area or time, two
calculation steps were defined:
(1) Mapping the spatial water distribution systems in the study area.

Page 78 of 166
The topography of the Deir Al Ahmar district is mainly composed of two areas: the mountainous
area, which is dominated by arboriculture - itself mostly represented by grape vines irrigated
using water from the two lakes – and the plain, where vegetable farming dominates, and potato
crops irrigated with water from the canal and private wells. Cereals grown across the plain,
mostly represented by durum wheat and barley, are often dry-farmed. The distribution of the
crops according to the topography of the district, the irrigation source per crop (lake, canal,
well), the percentage of area occupied by each crop at Deir Al Ahmar level, the time required, or
the irrigated area per crop, were all determined by expert opinion, and based on regional
statistics (MoA, 2012). The valuation was carried out by gathering:
- 2 officials from the Ministry of Agriculture with access to regional statistics regarding crop
land-use at Governorate level in Lebanon.
- 2 representatives from the Béqaa Water Establishment, as well as 2 mayors, who contributed
data concerning area or time-based irrigation rules per crop. These rules are relatively fixed
according to the type of year.
- 10 farms, representative of cereal, vegetable and fruit tree production.
(2) Estimation of water flow for each source of irrigation water
· Canals
According to Béqaa Water Establishment officials in the region, the diverter in the main channel
which brings water to both villages delivers water equally into the two branching channels (see
section 3.1). Thus the water flowing through the hill canal is the same as that of the plain canal
Considering the volume capacity of each lake (lake 1: capacity of 35,000 m³ and lake 2: 75,000
m³) and the number of days required to fill them (five days and ten days for lake 1 and lake 2,
respectively) communicated by the mayors, the equation deduced was that the average flow in
the channel that supply the lakes is 300 m3/h.
For crops irrigated by submersion (see table 18, section 3.1), the main rule, as explained by the
mayors, is that each channel simultaneously irrigates 5 farms in winter, 4 farms in the spring and
autumn, and 3.5 farms in summer. Thus, the calculated average flows are 60 m3/h and 75 m3/h,
and 84 m3/ha for winter, spring and autumn and summer seasons, respectively.
For crops irrigated using sprinklers (potato and onion, see table 18, section 3.1), the mayors
estimate the average flow of a sprinkler to be 15m3/ha.
Considering the number of irrigation hours dedicated to each crop and the number and frequency
Page 79 of 166
of irrigation applications for the same crop communicated by the farmers, the total amount of
irrigation water was estimated (table 18, section 3.1).
· Lakes
To irrigate using lake water, irrigation is often conducted in pipes with two main diameters and
associated flux. Lake water irrigation concerns grape vines, apple and olive trees. These
diameters of 4” and 5” allow drip water flows of 13 and 17 m3/h, respectively. In our study an
average flow of 15 m3/ha was considered.
For the two lakes, the main rule of irrigation is based on surface. According to key farmers,
irrigation of one Dunum (0.1 ha) takes 10 minutes on average. Using the area of each irrigated
crop, the frequency and the number of irrigation applications per crop, and the mean water flow
from the lakes provided by the farm survey (section 2.2.1), it was possible to determine the
quantities of irrigation water used per crop (see table 18, section 3.1).
· Wells
Our interviews with the experts and farmers, as described in section 2.2.1, highlight the fact that
irrigation using well water is solely used for potato crops. Such irrigation takes place using
sprinklers whose flow is estimated to be 15m3/h.
As for irrigation using lake water, its rule is area-based. The same procedure is then applied to
estimate the total amount of irrigation water per crop and farm (table 18, section 3.1).
2.2.2 Farm Typology
To classify the different farms in the study area according to their cropping patterns, a principal
component analysis (PCA), followed by Hierarchical Ascendant Classification (HAC) was
performed. Nine variables were taken into consideration as described in table 16. Variables were
selected based on the criteria set by Norman (1995), namely the “farm production intensification
level”.
· Criteria explaining resource endowment
Whereas resource endowment can include a long array of resources and assets, only two of the
most important endowments were captured in this study, namely environmental potential and
financial resources. The rationale for considering these two endowments only is that they are the
ones which are likely to have the highest influence on production decisions and farm
productivity. In a dry land area particularly, the environmental potential is often associated with
the level of access to natural resources such as land and water. In our study, land holding (i.e.,

Page 80 of 166
size of farm owned by the household) and the size of the area that has access to irrigation water
were considered.
This study considers the level of total farm income as a proxy for capturing the farm financial
potential. Availability//lack of a certain minimum level of financial resources determines the
household’s ability to purchase and use different productivity-enhancing factors of production
(e.g. irrigation, chemical fertilizers or labour).
· Criteria explaining production goals:
These factors include the farmer’s choice of portfolio (e.g., between crops, choice of cereals,
and/or legumes and/or vegetables). Another important factor in this category is the orientation of
agricultural production expressed by the share of each crop in the total farm agricultural income.
Farm households in dry areas may either produce in order to meet their subsistence needs or for
the market so as to raise the much needed cash income.
· Criteria explaining levels of production intensification
The first two structural criteria (Criteria explaining production goals and Criteria explaining
levels of production intensification) can have a considerable impact on the farm households’
decisions regarding the types and quantities of factors of production such as seeds, fertilizers,
pesticides, irrigation, and labour.
Two multivariate statistical techniques were used: i) Principal Component Analysis (PCA) and
ii) Hierarchical Ascendant Classification (HAC) (Chenoune et al., 2016), to establish distinct
farm typologies. The PCA was applied in order to linearly transform the original set of variables,
into a substantially smaller set of uncorrelated variables that represent most of the information in
the original set (Bidogeza et al., 2009).
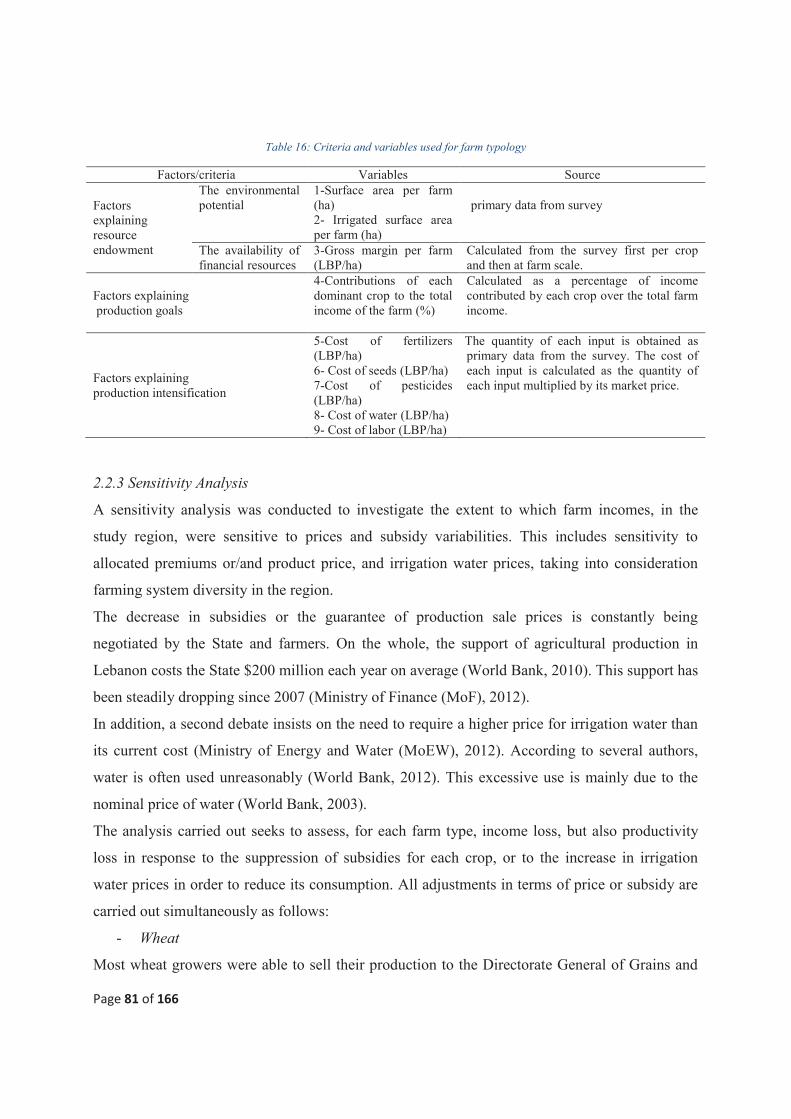
Page 81 of 166
Table 16: Criteria and variables used for farm typology
Factors/criteria Variables Source
Factors explaining resource endowment
The environmental potential
1-Surface area per farm (ha) 2- Irrigated surface area per farm (ha)
primary data from survey
The availability of financial resources
3-Gross margin per farm (LBP/ha)
Calculated from the survey first per crop and then at farm scale.
Factors explaining production goals
4-Contributions of each dominant crop to the total income of the farm (%)
Calculated as a percentage of income contributed by each crop over the total farm income.
Factors explaining production intensification
5-Cost of fertilizers (LBP/ha) 6- Cost of seeds (LBP/ha) 7-Cost of pesticides (LBP/ha) 8- Cost of water (LBP/ha) 9- Cost of labor (LBP/ha)
The quantity of each input is obtained as primary data from the survey. The cost of each input is calculated as the quantity of each input multiplied by its market price.
2.2.3 Sensitivity Analysis
A sensitivity analysis was conducted to investigate the extent to which farm incomes, in the
study region, were sensitive to prices and subsidy variabilities. This includes sensitivity to
allocated premiums or/and product price, and irrigation water prices, taking into consideration
farming system diversity in the region.
The decrease in subsidies or the guarantee of production sale prices is constantly being
negotiated by the State and farmers. On the whole, the support of agricultural production in
Lebanon costs the State $200 million each year on average (World Bank, 2010). This support has
been steadily dropping since 2007 (Ministry of Finance (MoF), 2012).
In addition, a second debate insists on the need to require a higher price for irrigation water than
its current cost (Ministry of Energy and Water (MoEW), 2012). According to several authors,
water is often used unreasonably (World Bank, 2012). This excessive use is mainly due to the
nominal price of water (World Bank, 2003).
The analysis carried out seeks to assess, for each farm type, income loss, but also productivity
loss in response to the suppression of subsidies for each crop, or to the increase in irrigation
water prices in order to reduce its consumption. All adjustments in terms of price or subsidy are
carried out simultaneously as follows:
- Wheat
Most wheat growers were able to sell their production to the Directorate General of Grains and

Page 82 of 166
Beetroot Subsidy (DGBS) at the Ministry of Economy and Trade at premium prices, determined
annually (MoF, 2012). The DGBS aims to keep wheat prices stable in the face of cheaper
imported wheat. It purchases the wheat from local producers at a unified price and resells it on
the market at market price. Farmers usually register their farms at the DGBS, but are not obliged
to sell it their harvest.
The sensitivity analysis here explored the point at which wheat prices drop so as to be in line
with international prices as presented in table 17.
- Tobacco
Tobacco growers were given permits with a pre-determined quantity of production each (400
kg/farm) as well as premium prices, also decided by the national “Regie Libanaise Des Tabacs Et
Tombacs” (Regie) each year according to produce quality. These policies favoured farmers also
by securing the marketing channels for their produce, in addition to the premiums received
which are usually around 10 times the local market values for tobacco.
This sensitivity analysis explored the suppression of the specific premiums allocated to tobacco
as requested by several policy observatories (Chaaban et al, 2010) (table 17).
- Grape
Grape farmers in Deir Al Ahmar district were able to sell their produce to the local governmental
cooperative at prices 40-50% higher than local grape prices (Kanj , 2013). The cooperative has a
special agreement with a French company to which they export the produce of a specified quality
required by the company.
In this analysis, grape producers would sell their produce at market price.
- Potato
The traditional market of Lebanese potato is the Arab Gulf States, which imported most of the
exported 135,387 tons of fresh potato in 2016 (Investment Development Authority of Lebanon
(IDAL), 2016). However, this important market is threatened by competition from other potato
producers like Turkey and Pakistan (Leeters, 2016).
This analysis includes the case where potato producers lose the ability to export their produce at
the price of 650 LL/Kg, and are forced to market locally at 450 LBP/Kg (see table 17).
- Irrigation water
A fourth analysis assumes the farmers will pay the real cost of water which is 2.5 times the
current pricing ranges. The new price is set to include the real operation and maintenance costs
of delivering the water to farmers (World Bank, 2003) (Table 17).

Page 83 of 166
Table 17: sensitivity analysis proposed to test farm income and farm productivity sensitivities of the selected farm types.
Items Current situation Sensitivity analysis
Wheat Price paid by Directorate General of Grains
and Beetroot Subsidy: 580 LBP/Kg market price of 350 LBP/Kg is considered.
Tobacco Price paid by the Regie is 10,000 LBP/Kg market price of 2000 LBP/Kg is considered.
Grapes Price paid through the Coop is 1650 LBP/Kg market price of 1000 LBP/Kg is considered.
Potato Exported market price is 650 LBP/Kg the national market price of 450 LBP is considered.
Irrigation
water
Current average irrigation water prices from
canal, lake and well are 100, 143, and 716
LL/m3, respectively
The real irrigation water price is applied: 2.5 times the
current average irrigation water price.
3. RESULTS
3.1 Estimation of quantities of irrigation water per crop.
Figure 24 shows a simplified map of the irrigation distribution system in the study area as
explained in section 2.2.1. The hilly areas are supplied with irrigation water through the hill
canal and the hill lakes, whereas the plain is irrigated through the plain canal and the wells. The
figure shows the percentage composition of cultivated crops in the hilly and plain areas.
Figure 24: Simplified diagram showing the irrigation canal network, the spatial distribution of crops in the study region, the
source of irrigation of each crop, and the shared percentage of area for each crop.

Page 84 of 166
Table 18 presents the quantities of irrigation water used for each crop, according to the source
and the method of irrigation (drip system, sprinklers, and submersion). This table shows that
cucumber crops use the most irrigation water per hectare (4650 m3/ha). However, they only take
up a small area in comparison with other crops (figure 24). In terms of farmed area, potato crops
use the most water in comparison with other crops. Potato crops require 1620 to 1800 m3/ha on
average per hectare, and take up 28% and 13.5% of the total farmed area at the level of the two
irrigated zones (figure 24). On the other hand, even if wheat and barley use as much water as
potato crops per hectare, only 10% of the total area taken up by these two crops is irrigated.

Page 83 of 166
Table 18: calculation of the amount of irrigation water per crop, source of irrigation, number of irrigation, irrigation system, and month.
Crops and source of irrigation Amount of water Jan Feb Mar Apr Mai Jun July Aug Sep Oct Nov Dec Total
Crops irrigated from canal by submersion Canal water flow (m3/ha) 60 60 75 75 75 84 84 84 75 75 75 60
Wheat
Number of hours/ha 10 10 20
Number of irrigation 1 1 2
Amount (m3/ha) 750 750 1500
Barley
Number of hours/ha 10 10 20
Number of irrigation 1 1 2
Amount (m3/ha) 750 750 1500
Tobacco
Number of hours/ha 10 10 20
Number of irrigation 1 1 2
Amount (m3/ha) 750 750 1500
Chickpeas
Number of hours/ha 10 10
Number of irrigation 2 2
Amount (m3/ha) 1300 1300
cucumber
Number of hours/ha 8 10 18
Number of irrigation 4 3 7
Amount (m3/ha) 2400 2250 4650
Crops irrigated from canal by sprinkler Canal water flow (m3/ha) 15 15 15 15 15 15 15 15 15 15 15 15
Onion
Number of hours/ha 10 10 10 10 10 10 60
Number of irrigation 1 1 2 1 2 2 9
Amount (m3/ha) 150 150 300 150 300 300 1450
Potato
Number of hours/ha 10 10 10 30
Number of irrigation 3 5 4 12
Amount (m3/ha) 450 750 600 1800
Crops irrigated from lacs by drip irrigation Lac water flow (m3/ha) 55 55 55 55 55 55 55 55 55 55 55 55
Vineyard
Number of hours/ha 1.67 1.67 3.35
Number of irrigation 1 1 2
Amount (m3/ha) 91.6 91.6 183.2
Apple
Number of hours/ha 1.67 1.67 1.67 5.0
Number of irrigation 2 3 2 7
Amount (m3/ha) 183.7 275.6 183.7 643
Olive tree
Number of hours/ha 1.67 1.67 1.67 5.0
Number of irrigation 1 1 1 3
Amount (m3/ha) 91.65 91.65 91.65 274.5
Crops irrigated from wells by sprinkler Lac water flow (m3/ha) 15 15 15 15 15 15 15 15 15 15 15 15
Potato
Number of hours/ha 12 8 8 28
Number of irrigation 3 5 4 12
Amount (m3/ha) 540 600 480 1620

Page 85 of 166
3.2 Farming and cropping systems diversity.
The average land holding in the Deir Al Ahmar district was 8.8 ha per farm, but with a high
variability (Figure 25). The frequency analysis shows that more than 60% of the farms have a
surface area of less than 7 ha with 45% having less than 5 ha (Figure 25). Furthermore, only
about 8 % of farms have large holdings of more than 24 ha – a common pattern in dryland areas
such as Tunisia (Jouili, 2015) Morocco (ElAnsari, 2017) and Egypt (Lowder et al, 2014).
There was considerable variability for each crop in both the average and median values of the
quantities and then costs of labour, irrigation water, nitrogen fertilizer, seeds and pesticides used
and receipts obtained (Figure 26). This demonstrates the wide diversity of crop production
practices in the Deir Al Ahmar district. The highest crop receipts are observed for tobacco, tuber
bulb crops (mainly potato) and grapes. For example, the median receipts for tobacco, tuber bulbs
and legumes were 1 532 000, 874 000 and 1 667 000, respectively. The corresponding figures for
cereals, vegetables and grapes were only 196 000, 131 000 and 147 000, respectively. Similar
variabilities were observed for yields of cereals and vegetables. The combined variability in the
intensity of input use and the associated receipts may lead to a large variability of technical
efficiency in crop production. This finding is consistent with the findings of previous studies
carried out in dryland areas (Belloumi and Matoussi, 2009; Tayebi, 2014).
Figure 25: Farm holding sizes in the study area.

Page 86 of 166
3.3 Farm typology
3.3.1 Results of principal component analysis (PCA)
The statistical analysis based on the PCA (principal component analysis) and the hierarchical
component analysis (HAC) enabled us to break the farm households down into five
homogeneous categories presenting the same characteristics with respect to the variables selected
for the typology as described in section 2.2.2.
Two correlation axes were chosen on the basis of the Kaiser criterion which involves the choice
of axes whose eigenvalues are greater than 1 while also yielding a “good proportion” of the total
variation. This means that the sum of the inertia (variation) explained by each of the axes may
account for a significant part of the total inertia. The results of the PCA and the HAC revealed
that the distribution of farm household categories as a function of the selected criteria (also
called discriminant variables) represented by two correlation axes, accounts for 50.4% of total
variability (Figures 26 and 27). Axis 1 (28.2%) is associated with farm area, and costs of seeds
and irrigation water. Axis 2 (22.2%) is associated with temporary and permanent labour costs
and phytosanitary costs.
Figure 26: Behavior of major crops cultivated in the study area.

Page 87 of 166
Figure 27: The correlation scatter plot related to the tested variables.
3.3.2 Description of farm types
Based on the statistical analyses conducted using PCA and HAC, five distinct farm types
were identified. They were established in such a way that they may be homogeneous within the
classes, showing the same characteristics with respect to the variables selected for establishing
typology, as described in section 2.2.2. Accordingly, the farm household types identified were
(table 19 and table 20):
Table 19: Average input costs, receipt and farm income for each farm type
Farm
types*
Nb**
Input costs (LL/ha)
Recipe
(LL/ha)
Farm
income
(LL/ha) Seeds Fertiliz
ers
Irrigation
Summer
Irrigatio
n Winter
Phytosanitar
y
Temporary
Labour
Permanent
Labour
SIPG 31 9676 215167 110804 4559 586005 285286 140569 15120365 13768301 IPO-T 7 2261443 894831 231715 38701 345057 329298 25167 19622130 15473112 TEMC-O 21 173857 238202 0 61313 23840 418279 0 2129730 1214239 ID 12 431507 576258 92764 35458 405652 956237 45815 17315158 14766123 VIPT 26 76584 607783 49121 29075 407224 2360979 90050 20141524 16516147
* SIPG, IPO-T, TEMC-OT, ID and VIPT are semi-intensive predominantly-grape, intensive predominantly-onion-tobacco, traditional extensive mixed cereal-olive, intensive diversified and very intensive predominantly-tobacco
farms, respectively. ** Number of farms per category of farm types

Page 88 of 166
Table 20: Farm area per farm type and receipts contribution per category of crops in the total farm type receipts.
Farm
types*
Area
farm
(ha)
Recipe contribution per class of crops in the total farm type recipe (%)
Vegetables Tubers_bulbs Tobacco Legumes Fruit
trees Cereals Olive Grapes
SIPG 5.53 0.5 0 12 0.5 0 0 0 87 IPO-T 25.47 0 73 19 3 1 3 0 1 TEMC-O 12.33 0 0 0 0 0 84 16 0 ID 10.17 2 19 43 5 7 4 0 20 VIPT 4.22 2 2 61 3 8 2 5 17
* SIPG, IPO-T, TEMC-OT, ID and VIPT are semi-intensive predominantly-grapes, intensive
predominantly-onion-tobacco, traditional extensive mixed cereal-olive, intensive diversified, and
very intensive predominantly-tobacco farms, respectively.
Vegetables include mainly cucumber; Tubers_bulbs includes mainly onion and garlic Legumes
includes mainly chickpeas and cereals include mainly winter soft wheat and winter barley.
(1) Semi-intensive predominantly-grapes farms (SIPG):
Intensive predominantly-grape farms included farms with a small area (5.5 ha on
average), which predominantly produced grapes (87% of total receipts) and tobacco (12% of
total receipts) with moderate input intensity. These farms have, on average, costs of 215167,
115363, 586005, and 425854 LBP/ha respectively for seeds, nitrogen fertilizer, water irrigation,
phytosanitary applications and total permanent and temporary labour. This category included one
of the farms which have the highest gross margins averaging 13768301 LBP/ha.
(2) Intensive predominantly-onion, tobacco farms (IPO-T):
The intensive vegetables farms included farms with more than 25 ha as an average area,
which mainly cultivated potato and onion crops (73% of total receipts) and tobacco (19% of total
receipts). These farms were characterized by a high intensity of application of seeds, nitrogen
fertilizer, water irrigation, phytosanitary applications and total permanent and temporary labour
at 2261443, 894831, 270416, 345057 and 354466 LBP/ha, respectively, and gross margins of
15473112 LBP/ha.
(3) Traditional extensive mixed cereal-olive farms (TMC-O):
The Traditional extensive mixed cereal-legume farms mostly cultivated cereal crops
(barley and soft wheat) by intercropping or not with olive trees. Both crops guaranteed 84 and
16% of total farm receipts, respectively. These farms are characterized by the use of minimum
inputs of 173857, 238202, 61313, 23840 and 418279 LBP/ha, for seeds, nitrogen fertilizer, water
irrigation, phytosanitary applications and total permanent and temporary labours, respectively.
Page 89 of 166
They are medium sized farms with an average area of 12.3 ha and the lowest farm income of
1214239 LL/ha in comparison with other farm types.
(4) Intensive diversified farms (ID):
The intensive predominantly-tobacco farms included farms with medium areas (10.2 ha
on average), which predominantly produced tobacco (43% of total farm receipts), vegetables
represented mainly by onion and potato crops (19% of total farm receipts) and grapes (19% of
total farm receipts). These farms are characterized by a moderate use of input intensities (in
comparison with other farm types) of 431507, 576258, 128222, 956237, 405652 and 1002052,
for seeds, nitrogen fertilizer, water irrigation, phytosanitary applications and total permanent and
temporary labour, respectively. These farms are also characterized by a high farm income of
14766123 LBP/ha.
(5) Very intensive predominantly-tobacco farms (VIPT):
Intensive predominantly-tobacco farms included farms with very small areas (4.2 ha on
average), which predominantly produced tobacco (61% of total farm receipts). The rest of the
receipts are generated by grapes (17.4% of total farm receipts) and other diverse crops. These
farms are characterized by a very high use of input intensities (in comparison with other farm
types) of 76584, 607783, 78196, 407224 and 2451029 LL/ha, for seeds, nitrogen fertilizer, water
irrigation, phytosanitary applications and total permanent and temporary labour, respectively.
These farms are also characterized by having the highest farm income of 16516147 LBP/ha.
3.4 Analysis of socio-economic and environmental indicators
- Farm income
All farm types, except for traditional extensive mixed cereal-olive farms, are making
statistically the same farm income (table 19). For these farms, the average income is similar to
the average gross national income per capita (12,336,700 LBP in 2013, (World Bank, 2017).
This result is rather surprising, for in most dryland areas, farm income per farm household is
often far lower to the national income per capita (Kumar et al, 2014). It can be explained by the
presence of irrigation (full or partial irrigation) and by a significant support towards production
on behalf of the State.
Page 90 of 166
For traditional extensive mixed cereal-olive farms, farm income is almost 10 times less
than other farm types and gross national income per capita (table 19). For many authors these
farms are often pluriactive (Bush, 2016). For lack of time, growing crops using an extensive
method allows farmers to gain extra farm income without getting too involved in agricultural
production. This situation is similar to other dryland areas (Sais plain in Morocco, Setif plain in
Algeria, Western Medjerda in Tunisia) where agriculture was essentially based on extensive
cereal production, before intensification policies were implemented (El Ansari et al, 2017 ;
Souissi et al., 2017). These cereal-based farms have been following different intensification
pathways since the 1980s, and relatively diverse farms can be observed today (Baccar et al.,
2017).
- Phytosanitary use
Statistically, extensive traditional cereal-olive farms have a significantly lower use of
pesticides than semi-intensive predominantly-grape farms and very intensive predominantly-
tobacco farms (table 19, table 21). The very high pesticide rate notably used on predominantly-
grape farms and very intensive predominantly-tobacco farms, can be explained by the absence of
agronomic preventive measures for this type of production (grape and tobacco). Indeed, tobacco,
which is very sensitive to diseases and weeds, is often grown as a monoculture or as the
dominant crop in very short crop rotations along with winter cereals and legumes (Kabbani et al,
2008). As for grapes, the cost of phytosanitary treatments represents at least 40% of total
production costs (table 19).
- Water irrigation use
Statistically, intensive predominantly-onion and tobacco farms use higher irrigation water
quantities than the other three types of farms (table 7, table 9, table 21). This result is relatively
in line with previous work carried out in similar regions which showed an excessive use of
irrigation water for vegetable farming (Katerji et al, 2008). These farms are often very vulnerable
to climate change and their future is dependent on the presence of irrigation water (Souissi et al.,
2017).
At the level of dryland regions as a whole, the appearance of water was often followed by
a fast expansion of the areas dedicated to very profitable crop farming such as onion or potato. It
is the case of the Saïs plain in Morocco and the Sidi Bouzid plain in Tunisia, where surface areas
dedicated to crop farming have increased by 10% (El Ansari et al., 2017) and 15% (Ferchiou,

Page 91 of 166
2017) respectively in the last 10 years. This type of production receives a lot of criticism today at
dryland area level where water resources are very limited and where the durability/resilience of
these systems are being questioned (Chartzoulakis and Bertaki, 2015).
- Fertilizer use
As expected, semi-intensive predominantly-grape farms and traditional extensive mixed
cereal-olive farms statistically use lower quantities than others in terms of nitrogen fertilization
(table 19, table 21). The two main crops (grape and cereal) on these farms use 25 kg/ha and 100
kg/ha of nitrogen on average, respectively, in comparison with crops such as onion (167 kg/ha),
potato (230 kg/ha) (data not shown). This result concurs with several recent studies based in
dryland areas, which insist on the risk of nitrogen pollution. This risk is all the more important
that irrigation is often poorly planned or limiting (Belhouchette et al., 2012 ; Souissi et al., 2017).
- Labour use
The labour force required at very intensive predominantly-tobacco farm level is
statistically larger than on other farms (table 19, table 21). This difference can be explained by
needs for phytosanitary treatments, for fertilization, but also for the harvest which is often done
manually, which are relatively high in comparison with other farms. For all farms in the study,
with the exception of the intensive predominantly-onion and tobacco, labour accounts for at least
30% of the total farm costs (table 21).

Page 92 of 166
Table 21: Statistical comparison of socio-economic and environmental indicators' performances between the different farm
types (Tukey-Kramer test, * significant, ** highly significant)
Variable FARM TYPE Q statistic p-value inference
Farm income IPO-T vs TEMC-OT 4.36 0.02 * p<0.05
Farm income TEMC-OT vs ID 4.31 0.02 * p<0.05
Farm income TEMC-OT vs FT5 5.17 0.00 ** p<0.01
Water SIPG vs IPO-T 7.63 0.00 ** p<0.01
Water IPO-T vs TEMC-OT 5.53 0.00 ** p<0.01
Water IPO-T vs ID 7.13 0.00 ** p<0.01
Water IPO-T vs VIPT 10.27 0.00 ** p<0.01
Labour SIPG vs VIPT 9.22 0.00 ** p<0.01
Labour IPO-T vs VIPT 10.70 0.00 ** p<0.01
Labour TEMC-OT vs VIPT 4.87 0.01 ** p<0.01
Labour ID vs VIPT 9.05 0.00 ** p<0.01
Pesticides SIPG vs TEMC-OT 4.83 0.01 ** p<0.01
Pesticides TEMC-OT vs VIPT 4.53 0.02 * p<0.05
Fertilizer SIPG vs IPO-T 6.94 0.00 ** p<0.01
Fertilizer SIPG vs ID 4.26 0.03 * p<0.05
Fertilizer SIPG vs VIPT 4.69 0.01 * p<0.05
Fertilizer IPO-T vs TEMC-OT 3.98 0.04 * p<0.05
Fertilizer IPO-T vs VIPT 4.06 0.04 * p<0.05
Total cost SIPG vs IPO-T 6.33 0.00 ** p<0.01
Total cost SIPG vs VIPT 8.13 0.00 ** p<0.01
Total cost IPO-T vs TEMC-OT 4.44 0.02 * p<0.05
Total cost TEMC-OT vs VIPT 4.89 0.01 ** p<0.01
Total cost ID vs VIPT 5.09 0.00 ** p<0.01
Productivity SIPG vs IPO-T 4.96 0.01 ** p<0.01
Productivity SIPG vs TEMC-OT 4.43 0.02 * p<0.01
Productivity SIPG vs VIPT 5.03 0.00 ** p<0.01
3.5 Productivity analysis
Figure 28 shows the variation of the total productivity of each farm. This productivity is
calculated as the ratio between the gross margin per hectare and per farm, and the total farm
operational cost.

Page 93 of 166
This analysis shows that semi-intensive predominantly-grape farms and very intensive
predominantly-tobacco farms statistically have the highest productivity; i.e. 8.7 and 5.5
LBP/LBP, respectively. Nevertheless, for different reasons, these two farm types are rather
negligible at dryland zone level. Integrated production carried out by semi-intensive
predominantly-grape farms is becoming heavily dependent on exportation contracts signed with
the EU countries, although the majority of exports are still towards the Gulf countries. This
requires specifications for integrated farming with very strict phytosanitary treatments, and
consequently a production exclusively for farmers/investors with significant production means
(Leeters, 2016).
As for the tobacco crop, which prevails in very intensive predominantly-tobacco farms,
but is also found on most farms in Lebanon (including in our sample), its dominance can be
explained by a purchase price guaranteed by the State which is ten times higher than the actual
Lebanese market price (Kabbani et al, 2008). Indeed, tobacco was historically introduced in
Lebanon in order to replace illegal crops (Hamadeh et al, 2015).
Intensive predominantly-onion, tobacco farms and intensive diversified farms are also
very productive, with a productivity rate (i.e. 3.7 LBP/LBP and 5.5 LBP/LBP, respectively) that
is similar to very intensive predominantly-tobacco farms. These two farm types were developed
with the introduction of irrigation which both served to intensify traditional systems, and to
diversify production (legumes, vegetables, arboriculture, etc.). This diversification has made it
possible to increase the resilience of these systems but also to keep part of the production for
household consumption, in a context heavy with uncertainty and with a significant volatility of
agricultural produce prices (El Ansari et al., 2017; Souissi et al., 2017).
This study also confirms the low productivity of traditional agricultural systems such as
traditional extensive mixed cereal-olive farms. This low productivity can also be explained by
the low resource levels used (financial, labour) for this type of production (table 7, table 20).
This type of production, which was very common in dryland areas, has progressively
disappeared with the introduction of irrigation as shown by the studies carried out in Tunisia
(Souissi et al., 2017), in Algeria (Daoudi and Colin, 2016) and in Egypt (Abou-Mandour and
Abdel Hakim, 1995). Nowadays this type of production mostly exists in areas where irrigation
water is very scares, in order to offer pluri-active households extra income and/or guarantee part
of the household's food supplies by consuming part of their own agricultural production

Page 94 of 166
(Chenoune et al., 2017). Leftover cereals also play an important role in ovine food supplies,
sheep breeding being relatively common in dryland areas (Belhouchette et al., 2012).
Figure 28: Variation of farm productivity calculated as total farm income by total farm cost production. (* significant, ** highly
significant, Tukey-Kramer test).
3.6 Sensitivity analysis
Figure 29 shows the productivity of farms which do not receive any production support
as mentioned in paragraph 2.2.3.
Figure 29: Farm income variation with and without the support of the production

Page 95 of 166
This analysis shows that all farms have observed a decrease in gross margin which varies
between 11 and 77%. The highest decrease in gross margin is that of farms dominated by
tobacco or grapes. This decrease is of 78, 64 and 55% for very intensive predominantly-tobacco
farms, intensive diversified farms and semi-intensive predominantly-grape farms, respectively. It
is less significant for intensive predominantly-onion, tobacco farms (35%) and traditional
extensive mixed cereal-olive farms (11%).
Following these decreases, the average income per farm becomes much lower than the
national Lebanese average income. This result concurs with other countries at the level of
dryland areas, which often do not receive much support (Hassine, 2015). This result shows that
without the intervention of the State, these farms would probably not be sustainable. Within
Lebanon's highly sensitive geopolitical context, this support plays a decisive role in the stability
of local populations.
This decrease in gross margin was followed by a significant decrease in productivity, thus
reaching 77, 61, 54 and 42% for very intensive predominantly-tobacco farms, intensive
diversified farms, semi-intensive predominantly-grape farms and intensive predominantly-onion,
tobacco farms, respectively. For traditional extensive mixed cereal-olive farms, productivity only
decreased by 20%.
This result also shows that these farms, without any support from the State, would
probably scarcely be competitive, because of their high production costs in comparison with
neighbouring countries (MoA, 2010).
4. Conclusion
Intensification in the semi-arid area of Baalbek-Hermel started deliberately in the 1970’s.
This intensification was mainly promoted using uncontrolled pumping of underground water,
produce premiums, and export.
Our results showed that intensification pathways led to five different types of farming
systems, except for conventional extensive cereal farms. Although these farming types follow
different trajectories, they still achieve similar incomes with different potential environmental
impacts.
The majority of farms proved sensitive because they are based either on the virtual value
of premiums paid by the government, or on fluctuating market prices. Even if some farms seem

Page 96 of 166
diversified in production, they are still sensitive, because they still rely, in major percentage, on
premiums.
Conventional extensive cereal farms are marginal, though less sensitive. However, these
farms cannot be economically sustainable unless they have other sources of income.
Beyond the results obtained at study zone level, this study shows that the intensification
of agriculture has allowed farmers to increase their incomes, but often at the cost of
environmental degradation. However, this improvement remains very dependent on direct or
indirect support levels granted to farmers. Considering the geopolitical crises which these
regions are going through, real questions regarding the resilience/durability of agricultural
production systems are being raised, since voices are rising, asking for a decrease in the support
offered to these farmers.

Page 97 of 166
Chapter 4: Which strategy to promote irrigated farming systems?

Page 98 of 166
OBJECTIVES OF THE CHAPTER
This chapter aims to propose and evaluate, by mobilizing a bio-economic model based on non-
linear programming, stimulus scenarios to improve the agricultural production of farms in
Lebanon. This chapter follows the first three chapters which have shown that agriculture in
Lebanon is very diversified, but in most cases it remains less productive and, above all,
inefficient.
Therefore, in three different socioeconomic and biophysical contexts, this chapter will test
scenarios that aim, as part of an overall State strategy to increase the availability of irrigation
water for farmers, as well as the diversification of the current cropping systems, and to test the
possibility of promoting irrigated crops with different tariff options on irrigation water.
1. INTRODUCTION
In many of tis regions, Lebanon faces water shortages during the dry season which extends from
July through October and is expected to become more acute in the future, due to climate change
(World Bank, 2013). Around 60% of the country’s area is threatened by desertification (MoA,
2003). Thus, irrigation has been a key requirement for agricultural productivity in most parts of
the country, and helped in fostering the relative intensification of the cropping systems,
especially for the high value-added production such vegetables and fruit.
Within this context, the Government of Lebanon has plans to increase potential irrigation water
by 30-50 percent in 2030, which would lead in turn to a substantial increase in agricultural
production (World Bank, 2010b). That comes in line with the behavior of most governments in
the MENA region to provide more irrigation water to farmers (Sowers et al., 2011) as well with
the global tendency since the beginnings of the 20th century to provide “new” water to farmers
(Gleick et al., 2011). However, no studies have been made in Lebanon to determine the
feasibility of such plans at the farm level, as well as the impacts of these major interventions on
the diversity and sustainability of the local agricultural production systems. In absence of such
studies, modelling would be a feasible option for decision makers as well as for other
stakeholders to explore options when addressing major interventions.
Many innovations at cropping system level impact the whole farm system by changing the flow
of farm resources across farm activities (Flichman et al., 2011). Using farm models has
increasingly been proposed for assessing the feasibility of prototypes of cropping systems at

Page 99 of 166
farm level, and evaluating their impacts on household food production, farm income, and the
environment. Such models are often called bio-economic model as a way to stress the mixing of
knowledge about the biophysical and economic aspects of farming (Jasssen & Van Ittersum,
2007). A priori, one should not expect accurate predictions from these coupled bio-economic
models, because of their complexity and the difficulty of measuring certain key input variables,
such as labour availability for the different farm and off-farm activities, family income, and
intra-farm consumption of agricultural products. This type of models can rather be used to
explore ‘what if’ scenarios and to understand their outcomes including their inevitable
uncertainty (Affholder et al., 2014).
Within this framework, we have mobilized a bio-economic model in order to explore different
production strategies allowed by greater water availability to the farmers. This type of model
would prompt us to simulate several socio-economic and environmental indicators, which in turn
allow us to assess the impact of these different scenarios on the performance and sustainability of
the scenarios studied.
2. MATERIALS AND METHODS
2.1 Study Areas
Three study locations were selected to represent the most densification prone areas as identified
in the National Action Plan to Combat Desertification (MoA, 2002). As a part of the
interventions planned by the Ministry of Agriculture (MoA), three hill lakes were constructed in
the three villages to provide more irrigation water to poor farmers. Funds for the construction of
hill lakes were provided by the International Fund for Agriculture Development (IFAD).
The first location is the village of Marjhine which is located to the North-West of the Hermel
Caza in the Mohafazat of Baalbek-Hermel, at around 25 km from the Hermel city. The altitude
of the village ranges between 1710 m and 1750 m from sea level and the village area is around
12 km2.
The second location is the village of Maroun al Ras in Bent Jbeil Caza, Mohafazat Nabatiyeh, at
around 2 km from the city of Bint Jbeil in the southern part of Lebanon, with an altitude of
around 950 meters from sea level. The surface area of the village is around 10 km2.

Page 100 of 166
The third location is the village of Qemamine in the Mohafaza of North Lebanon, Dannieh Caza,
at around 828m from sea level. The village surface area is around 12 km2, and it is at around 45
km away from the city of Tripoli (Fig. 30).
In Maroun al Ras, the average annual temperature in the area is around 20°c t and the annual
rainfall is around 300mm. While the village has a typical Mediterranean climate with a dry
summer and wet winter, the cadastral boundaries of the two other villages, Marjhine and
Qemamine, are characterized by a typical rainfall of the highest mountains of the western slopes
of Mount Lebanon, with an annual average between 1200 and 1300mm in the south and varying
between 900 and 1000mm in the north. The average annual temperature in the area is around
10°c. Climatic data were obtained from the nearest weather stations: Rmeich weather station is
the nearest to Maroun al Ras, and Sir El Dannieh weather station for Marjhine and Qemamine.
Figure 30: Map of Lebanon showing the locations of the three study areas
Page 101 of 166
2.2 Farms Surveys
We explore in this a farms’ survey performed in the three selected locations in 2012 to identify
the main cropping systems practice in the three villages (Darwich, 2012). The main issues
addressed in the questionnaire include the following:
1. Farmer characteristics: age, sex, education, marital status, agricultural activity, etc...
2. Farms characteristics: area, production, acquisition mode, fragmentation, location, etc...
3. Family activities: family labor, wages, labor, gender, activity within the farm, etc...
4. Land form and crop production type: crop name, size, irrigation mode, cost of production
(irrigation, fertilization, pesticides, etc...), production, consumption, sale price, point of
sale, marketing, total value of production, income, etc...
5. Animal production: type of animal, numbers, and production cost (concentrate, treatment,
etc...), production, consumption, sale price, point of sale, marketing, total value of
production, income, etc...
6. Marketing: marketing channels, marketing problems.
7. Materials and farm equipment: number of tractors, pumps, generators, wells, milking
equipment, barns, greenhouse, etc...
8. Investments and off-farm: type of investment, amount, credit, funding source, etc...
9. Non-Agricultural Resources and external resources of family members: retirement, trade,
private sector employee, public sector employee, remittances, etc...
10. Current Crops before and after the construction of hill lakes: previous crops, reasons, new
cultures, types, satisfaction, etc...
The survey was followed by focus group discussions with key stakeholders (concerned
municipalities, mukhtars, local cooperative, and NGOs) and key farmers in order to validate
information collected. A total of 84 questionnaires were filled by a professional team and
supervised by the consultant (Table 22).

Page 102 of 166
Table 22: Number of total farmers and farmers surveyed in the three villages
Village name Total Number of farmers Number of farmers surveyed
Maroun El Ras 81 52
Qemamine 26 17
Marjhine 21 15
Total 128 84
As mentioned above, the survey included detailed questions about the cultural practices for each
crop, Management including the inputs types, quantities, application dates and methods, sowing,
harvesting and tillage events, water management, and nutrient management. The current average
produce sale prices and the costs of each input (fertilizers, pesticides, seeds, and irrigation) were
specified in the survey, as well as the application costs for each.
Twelve principal crops were identified, with clear distinction whether these crops are irrigated or
rain-fed. The principal crops are tobacco, cereal (mainly wheat and barley), vegetables (mainly
beans and lentils) and olives (main tree cultivated) in the three villages. Combined with the
results of surveys on the actual associated cultural practices (irrigation, fertilization …), these
crops were identified as the current principal agricultural activities.
2.3 Typology
To classify the different farms in the three study areas according to their cropping patterns, a
farm typology was performed by Darwich (2012). A principal component analysis (PCA),
followed by Hierarchical Ascendant Classification (HAC) was performed. Eight variables were
taken into consideration namely: farmer’s age, farm size, percentage of cultivated land in
proximity to the hill lake, installation date, family labour, gross income per dunum, percent Crop
to gross margin, and percent Tobacco to gross margin. Variables were selected based on the
criteria set by Norman (1995), namely the “farm production intensification level”. (Figures A, B,
and C in Annex 3).

Page 103 of 166
The typology procedure revealed four farm types in the study areas (Table 23).
i. Farm type 1 (FTTtab_y_h): is represented by farms cultivating the tobacco as a main crop
in term of production. The tobacco ensures a very high farm income estimated to 875 815
LL/dn. They are farms recently installed (19 years as an average) and managed by young
farm (44 years old as an average). Those farms cultivated also as marginal crops wheat
and barley. They are exclusively located in the Maroun el Ras village and represented by
24 farms. The farm average area is 7 dn.
ii. Farm type 2 (FTtab_o_h): is represented by farms cultivating mainly the tobacco with a
high farm income (but less than the group 1). The average calculated farm income is
estimated to 579378 LL/dn. However, inversely to group 1, the farmers are older than in
the FTtab_y_h (61 years old) and the farms are installed since 39 years ago. Those farms
are exclusively installed in the Maroun El Ras region and represented by 15 farm types.
They cultivate in addition to Tobacco cereals (mainly wheat and barley), vegetables
(mainly onions), legume crops (mainly chickpeas) and orchards (mainly olives). The
farm average area is 6 dn.
iii. Farm type 3 (FTmix_y_l): this farm type is characterized by a low farm income (around
129 544 LL/dn). The farmers are young (43 years old as an average) and they are
installed 16 years ago. Those farms are identified as mixed farms and cultivate cereals,
vegetables, legumes and orchards. They are represented by 6 farms in Maroun El Ras, 5
farms in Marjhine and 8 farms in Qemamine. The farm average area is 12.1 dn.
iv. Farm type 4 (FTmix_o_l): those farms are identical to the farms in the farm type 3 (a low
farm income: 131504 LL/dn), but the farmers in this group are older than the previous
ones and those farms were installed 31 years ago (an average estimation). They are mixed
farms cultivating cereals, vegetables, legumes and tress. They are represented by 9 farms
in Marjhine and 9 farms in Qemamine. The farm average area is 23.2 dn.

Page 104 of 166
Table 23: Description of the identified four farm types
Area Price Yield Total cost
Self
Consumption
farm type FTtab_y_h
Unit Dunum LL/kg Kg LL/dunum %
Wheat 1.54 1417 113 60735 4%
Tobacco 5.17 12250 115 211869 0%
Barley 0.05 1000 50 18650 0%
farm type FTtab_o_h
wheat 7 1186 108 58318 18%
Tobacco 9.01 12267 115 212133 1%
Barley 0.15 1000 100 37301 0%
Chikpeas 0.27 2500 85 109893 0%
Olives 0.27 0 0 0 0%
Onions 0.23 1000 110 42743 0%
farm type FTmix_y_l
wheat 5.6 1250 296 159475 13%
Potato 0.27 1000 500 107262 20%
Chikpeas 0.93 2500 75 96964 19%
Barley 1.33 600 317 118119 0%
Apple 2.53 1000 300 116621 0%
Cherry 0.93 0 0 0 0%
Onions 0.53 800 600 233143 10%
farm type FTmix_o_l
wheat 13.24 778 153 82358 8%
Potato 3.13 950 1000 214524 5%
Chikpeas 2.41 3333 50 64643 8%
Barley 0.36 5000 138 51289 0%
Apple 3.61 0 0 0 0%
Cherry 0.36 0 0 0 0%
Peach 0.12 2000 1000 518314 0%
3. GENERAL APPROACH: A COMBINATION OF A BIOPHYSICAL
MODEL WITH A BIO-ECONOMIC MODEL.
In this work use a combination of a biophysical model a bio-economic model which involves the
following steps:
1- Description of the data base used to run the models and scenarios based on technological
innovations as alternative activities.

Page 105 of 166
2- The description of the Cropwat model and the bio-economic farm model in order to reproduce
respectively the experimentally observed variables (yield, leaching nitrogen, and soil salt
accumulation) and the observed crop pattern for the selected farm type.
3- Running the calibrated Cropwat for the main crop rotations identified in the 3 villages. The
purpose of this step is to associate for each activity (crop, crop management and soil type) the
respective average yield and water consumption.
4- Definition and implementation of the selected scenarios (base and alternative scenarios) and
analysis of their impacts at farm scale by running a set of relevant variables through the
Cropwat-bio-economic farm model.
3.1 The biophysical model (Cropwat)
The purpose of the biophysical modeling part is to simulate for each crop activity, the yields for
a wide range of cropping systems, biophysical conditions and crop practices, with and without
irrigation. The simulation involves the simulation for each current and alternative crops the yield
and the water consumption under rain-fed or irrigated conditions. For each activity, the impact of
water stress on yields for rain-fed and irrigated crops was computed by running the CROPWAT
model. Observed Irrigation schedule (irrigation timing (date) and irrigation application (mm)) are
implemented on the CROPWAT model as observed in the survey.
The soil and climate data used for running the Cropwat model were derived from Berdaguer et
al., 2012. Daily weather data, temperature, rainfall, humidity, radiation and weed speed
pertaining to year 2010 were collected from the nearest stations (Rachaya, Nabatiyeh and
Marjouaayoun). Rainfall and temperature the data are available for 28 years (1947-1975).
The cropwat is first used to reproduce the observed yield for the current crops and then the
simulate water stress impact on yield and water consumption and yield under irrigation regime.
Concerning the crop parameters used in the crop model to simulate, yield and water consumption
are detailed in Berdaguer et al., (2012). Those parameters are mainly:
- Cultural coefficient (Kc): This parameter is extracted from the FAO journal (56) and local
bibliography (table A, Annex 2).

Page 106 of 166
- Crop phenology (cycle): those data are collected from the survey for the current crop and from
the FAO journal for the alternative activities. That information concern mainly sowing, the
flowering, the grain filling and the maturity dates (table B, Annex 2).
- Maximum rooting depth: it is a very important parameter for the calculation of soil water hold
capacity. This parameter is estimated for each crop from the CropSyst manual (Stockle et al.,
2003) and FAO journal. (table C, Annex 2).
- Yield reduction under water stress: to estimate the impact of water stress on yield reduction, the
Ky coefficient was estimated by using local expert knowledge and the FAO journal No.33. To
calculate Ky, we calculate first the maximum evapotranspiration (ETm), which is estimated from
the reference evapotranspiration (ETo) by using the following equation:
The yield reduction for each stage (Kystc) estimated is estimated from the cumulated yield
reduction (ky) during the crop hole cycle by using the following equation:
Where:
Kystc: The yield reduction for each stage, ky: cumulated yield reduction during the crop cycle
(table D, Annex 2).
ETm: the cumulated maximum evapotranspiration during the crop cycle and ETmstc: maximum
evapotranspiration for each crop phenology stage.
3.2 The bio-economic model
For this study a bio-economic farm model was developed in order to assess the economic and
environmental impacts (water consumption) of agricultural and environmental policies and
technological innovations on farm and crop system behavior. It is a static model which optimizes
ETm = ETo x Kc
∑ ETmstc x Ky
Kystc =
∑ ETm

Page 107 of 166
an objective function to determine which decisions are taken, with and without irrigation. It is a
primal-based approach, in which technology is explicitly represented, using engineering
production coefficients generated from biophysical models. These engineering coefficients
constitute the essential linkage between the biophysical (Cropwat in this study) and economic
models (Annex 4).
Concretely the current bio-economic model is developed/ adapted based on the Berdaguer Study
(2012). Thus the objective function is expressed as following :
With: Z = expected farm income
MB is the crop income by technique (T: irrigated, rain-fed).
X(C,T) is the area reserved for each crop and technique (T: irrigated, rain-fed)
The bio-economic model optimizes the farm income by selecting the more profitable crops with
and without irrigation and for several water prices. This optimization is realized by considering
various agronomic, biophysical and socio-economic constraints:
Land constraint
The total added area for the selected crops should be even less or equal to the total farm land.
with: Td is the total area land for each farm type.
∑ X(C,T) ≤ Td Ca, D
MaxZ = ∑ [MB(C,T × X(C,T] TA

Page 108 of 166
Water constraint
The total added amounts of water used by the selected crops should be even less or equal to the
available water by farm type.
With : E(C,T) is the requested water amount for the selected crops and by technique (irrigated,
rainfed).
Ed is the total available water by farm type. Those amounts are estimated as following table 24:
Table 24: Amounts of available irrigation water for each farm type
Farm types Available water (m3//ha/year)
FTtab_y_h 250
FTtab_o_h 250
FTmix_y_l 1048
FTmix_o_l 1540
Labor constraint
The total labor of the selected crops should be less than the available labor by farm type.
With: W(C,T) is the total consumed labor for each crop and technique (irrigated, rain-fed)
Wd is the total available labor by farm type.
AW is the hired labor.
∑ E(C,T) x X(C,T) ≤ Ed C, D
∑ W(C,T) x X(C,T) ≤ Wd + AW C, D

Page 109 of 166
Rotation constraint
Even if the developed model is a static model, we consider here a constraint for rotation. The
method followed in this study is to fix the maximum of the area that could be allocated for each
crop as explained in the following equation.
With : X(B,T) is the area of each crop by technique (irrigated, rainfed).
F(B) is the frequency of presence of each crop.
In addition we consider the following equation to express the fact that the area of legume crops
(L) should be less than the area of cereals (C)
With : X(L,T) is the area of each crop by technique (irrigated, rainfed).
X(C,T) : is the area of cereal crops.
Constraints for tree crops
We consider here the area reserved for tree crops as fixed as shown in the following equation.
With: X(Cp,T) is the area reserved for each tree crops by technique (rainfed, irrigated).
SAU arboriculture is the total area reserved for the tree crops by farm type.
4. SCENARIOS DESCRIPTION
Two main scenarios were developed and tested in the current research. Here is the description:
∑ X(B,T) ≤ ∑ X(B,T) x F(B) D
∑ X(L,T) ≤ ∑ X(C,T) L, T C, D
∑ X(Cp,T) = SAUarbo Cp, T

Page 110 of 166
1- The baseline scenario: The cropping patterns as practiced before the introduction of the three
hill lakes.
2- The irrigation scenario: the impacts of the activation of hill lakes on agricultural activities and
the farmers’ decisions expressed as scenario analysis. This scenario means concretely: The
increase of water availability for irrigation in the context of mobilization of a large quantity of
water after hill lake construction. This quantity is specified for each region as following: Maroun
El Ras (20 000 m3), Marjhine (22 000 m3) and Qemamine (40 000 m3).
3- Scenario « price of water »: for what price water should be sold?
In this scenario, as the price of one m3 of water is not yet defined by the communities in the
study areas, we considered as initial price of water the price used by Berdaguer (2012) in the
Marjaayoun region (150 LL/m3). Afterwards, a sensitivity analysis was made by testing a range
of prices between 120 and 255 LBP/m3. The behavioral cropping responses of farmers to
different prices were measured.
4- Technological innovations scenario: innovations supposed to be promoted or not at the farms
by the institutions or by the WUA (complementary irrigation, promotion of crops with a high
added value). In the current application, the innovation concerns the application of the irrigation
for all crops except for the Tobacco.
5- Combined scenario: The cumulative impacts of the three previous scenarios are compared to
the baseline scenario.
Each alternative scenario will be compared to a reference baseline scenario interpreted as a
projection in time including the most probable trends in water availability.
The data used to run the bio-economic model for each farm type and production technique (rain-
fed, irrigated) is shown in the annex 1.
5. INDICATORS SELECTION FOR MULTI-CRITERIA EVALUATION
The target of this part is to develop and test a multi-perspective set of economic, social and
environmental indicators of the sustainability and multi-functionality of systems, policies and
innovations in agriculture, and to establish, as much as possible, threshold values for these

Page 111 of 166
indicators and/or to enable trade-off analysis. Three main types (domains) of indicators will be
developed: i) Environmental indicators in relation to the efficiency of water, ii) profitability and
social indicators (farm income and labor) and iii) food safety and sovereignty in relation to the
crop production, and strategic cultivated crops.
6. FARMING SYSTEMS PERSPECTIVES
6.1 Irrigation scenario
In the current scenario the irrigation water is available for all farms. However, the amounts of
available water for irrigation are different from one village to another. In fact, starting from the
storage capacity of each lake, the available water for each farm type is: 1538 m3/ha for
Qemamine, 1048m3/ha for Marjhine and 250 m3/ha for Maroun El Ras.
The results analysis showed different behaviors when the irrigation scenario is applied:
1- In the three villages, the four farmers groups irrigate less than 25% of the total cultivated
area. This result is due to the low amounts of available water for irrigation.
2- FTmix-Y-l is the group with the highest percentage of irrigated area (22% of the total
surface), followed by farm type FTmix-o-l (16%) and then the FTTab-o-h and the
FTTab-y-h with 4%, and 0%, respectively (Figure 31). This result could be explained in
different ways :
i) Farmers tend to increase their irrigated land percentage in proportion with the
amounts of irrigation water made available to them.
ii) FTTab-o-h and the FTTab-y-h farmers choose to cultivate rain-fed tobacco and
cereals because their high profitability even if they are not irrigated (subsidy to
tobacco is discussed in the next chapter).

Page 112 of 166
Figure 31: Irrigated surface by farm type.
As a direct consequence of the practiced crop patterns, the average farm income increases in the
farmer group FTmix-o-l from 5,732,531 LBP to 7,450,454 LBP and even more with the group
FTmix-Y-l, from 3,656,279 LBP to 5,082,742 LBP (Figure 32). However, the provision of more
water for irrigation doesn’t increase the farm revenue in the other two groups which cultivate
mainly tobacco and cereals. This result could be explained by adaptation of farmers to the low
availability of water in this village, and the high profitability of tobacco in rain-fed condition.
Figure 32: Farm income by farm type with and without irrigation
16%
22%
4%
0%
5%
10%
15%
20%
25%
FTmix-o-l FTmix-Y-l FTtab-o-h FTtab-y-h
Pe
rce
nta
ge
of
irr
iga
ted
su
rfa
ce
(%)
Farm types
0
2000000
4000000
6000000
8000000
10000000
12000000
14000000
FTmix-o-l FTmix-Y-l FTtab-o-h FTtab-y-h
Gro
ss M
arg
in (
LL)
Farm types
Baseline Scenario_irrigation

Page 113 of 166
In order to understand those results, and in reference to section 3.3 above (typology), the
dominating farmers groups in each study areas are as follows:
i) Qemamine is dominated by farm type FTmix-y-l.
ii) Marjhine is dominated by farm type FTmix-o-l.
iii) Maroun al Ras is entirely dominate by farm types FTTab-y-h and FTTab-o-h
Accordingly, farmer behaviors in terms of selection of crops and their management are analyzed
as follows:
- Qemamine: In this village, farmers continue to cultivate the same crops but with different
techniques. In fact in the current situation (baseline), farmers in this village cultivate as an
average 7 crops composed mainly by cereals (wheat, barley), legume crops (chickpea),
vegetables (potatoes) and few orchards (cherry, peach). All those crops are cultivated with
irrigation.
By applying irrigation, farmers in Qemamine maintain the same cultivated crops but by irrigating
the total area of potatoes (3.06 dn), cherry (0.36 dn) and peach (0.12 dn) (Figure 33). The farm
decision in term of crop patterns proves that the potato is the most profitable crop when it is
irrigated.
In Qemamine, a farmer decided to cultivate cereals which is very profitable when is cultivated
without irrigation.

Page 114 of 166
Figure 33: Crop selection in the baseline and the irrigation scenarios in the Qemamine village.
- Marjhine : Here farmers adopted the same strategy than in the Qemamine village. In fact,
currently farmers cultivate cereals, legume crops, orchards (mainly apple tree) and potatoes. By
irrigating, the same crops are maintained but by irrigating potatoes, cherry and a part of apple
trees (figure 34). As in Qemamine, a large part of the apple area (1.63 dn) and cereals are
cultivated without irrigation. Those crops seem to be less profitable then the other crops when
they are irrigated.
0
2
4
6
8
10
12
14
Su
rface o
f cro
p p
er
farm
(dn
)
Crops
Baseline Scénario_irrigation

Page 115 of 166
Figure 34: Crop pattern under the baseline and irrigation scenarios in the Marjhine village.
- Maroun El Ras : Two behaviors are observed in this village. First, farmers cultivating tobacco
usually plant at least the third of the area with wheat. Here, the irrigation introduces only few
modification characterized by the irrigation of olive trees (0.27 dn) and chickpea (0.33 dn). This
behavior is mainly explained by the low amount of available irrigation water (250 m3/dn). In this
case, farmers use only a part of available water. The second type of farmer cultivates mainly
Tobacco and marginally cereals (figure 35). In this case, farmer doesn’t use water, preferring
cultivating tobacco and cereals as rain-fed crops.
0
1
2
3
4
5
6
dry Wheat dry Barley dryChickpeas
irrigatedpotato
dry apple irrigatedapple
irrigatedcherry
Su
rface o
f cro
p p
er
farm
(dn
)
Crops
Baseline Scénario_irrigation

Page 116 of 166
Figure 35: Crop patterns under the baseline and the irrigation scenarios in the Maroun El Ras village
6.2 Scenario « price of water »: for what price water should be sold?
As a second scenario we tested several price for irrigation water:
120, 135, 150, 165, 180, 195, 210, 225, 240, and 255 LBP/m3. From this analysis several
behaviors are identified by farm and village:
- Qemamine : All the farms in this village are not sensitive to the water price variation. In fact,
for a higher water prices, farmers use the same amounts of water but with an important drop in
farm income. In this case the average farm income decreases from 7,515,050 LBP to 6,743,991
LBP when the price of water increasing respectively from 135 LBP/m3 to 240 LBP/m3 (Table
25). For those prices the irrigated area remains almost the same (15% of the total area).
For a price greater than 255 LBP/m3 the modifications are more important. For price of 255
LBP/m3, the irrigated area decrease from 15% to 2%. In this case the total water mobilized for
irrigation by farm will drop from 1494 m3/ha to 91m3/ha (Table 26). In such context only peach
and cherry remain irrigated. In fact, with 255 LBP/m3 as water price, it will be not profitable to
irrigated apple trees.
77%
22%
1%
Tobacco Wheat Barley

Page 117 of 166
Table 25: Evolution of the irrigated area and the amounts of irrigation water for different water prices in the Qemamine village.
Price of water LBP 210 225 240 255
Surface irrigated % 15% 15% 15% 2%
Water applied m3 1494 1494 1494 91
Table 26: Cropping patterns variation for different irrigation water prices.
Culture Technique
Water prices (LBP/m3
)
120 135 150 165 180 195 210 225 240 255
Wheat Rainfed 13.2 13.21 13.21 13.21 13.21 13.21 13.21 13.21 13.21 13.21
Barley Rainfed
0.38 0.38 0.38 0.38 0.38 0.38 0.38 0.38 0.38 0.38
Chickpea Rainfed
2.49 2.49 2.49 2.49 2.49 2.49 2.49 2.49 2.49 2.49
Potatoes Rainfed
3.06
Potatoes Irrigated 3.06 3.06 3.06 3.06 3.06 3.06 3.06 3.06 3.06
Apple Rainfed 3.54 3.54 3.54 3.54 3.54 3.61 3.61 3.61 3.61 3.61
Apple Irrigated
0.07 0.07 0.07 0.07 0.07
Cherry Irrigated
0.36 0.36 0.36 0.36 0.36 0.36 0.36 0.36 0.36 0.36
Peach Irrigated
0.12 0.12 0.12 0.12 0.12 0.12 0.12 0.12 0.12 0.12
- Marjhine : Farms in the Marjhine village are more sensitive to water price variation then in
the Qemamine ones. In fact, by increasing the irrigation water price, we observed two behaviors
in the irrigated area. Concretely, the average part of irrigated area decreases progressively from
22 to 14 and then 8% when the price of water increases respectively from 210 LBP/m3 to 225
LBP/m3 and then 240 LBP/m3 (Table 27).
As a consequence, the average amounts of irrigated water decreases respectively from 1048
m3/ha, to 471 m3/ha and then 114 m3/ha. For a low price of water (210 LL/m3), three main crops
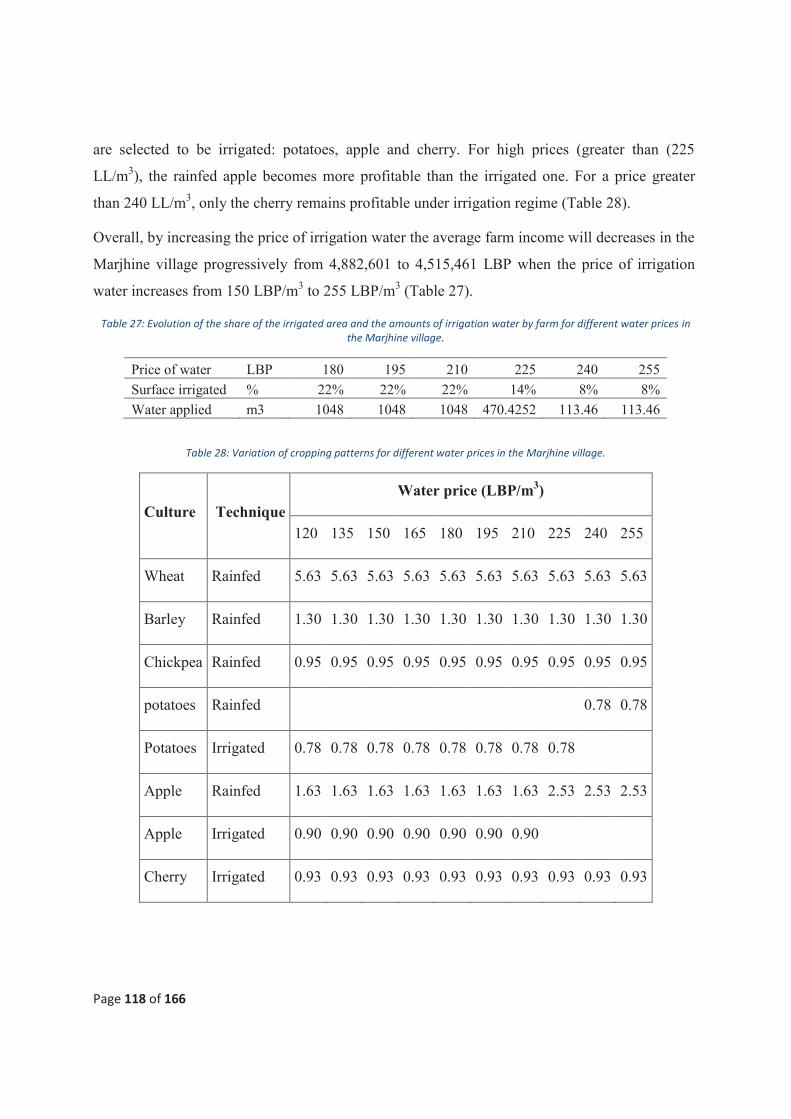
Page 118 of 166
are selected to be irrigated: potatoes, apple and cherry. For high prices (greater than (225
LL/m3), the rainfed apple becomes more profitable than the irrigated one. For a price greater
than 240 LL/m3, only the cherry remains profitable under irrigation regime (Table 28).
Overall, by increasing the price of irrigation water the average farm income will decreases in the
Marjhine village progressively from 4,882,601 to 4,515,461 LBP when the price of irrigation
water increases from 150 LBP/m3 to 255 LBP/m3 (Table 27).
Table 27: Evolution of the share of the irrigated area and the amounts of irrigation water by farm for different water prices in
the Marjhine village.
Price of water LBP 180 195 210 225 240 255
Surface irrigated % 22% 22% 22% 14% 8% 8%
Water applied m3 1048 1048 1048 470.4252 113.46 113.46
Table 28: Variation of cropping patterns for different water prices in the Marjhine village.
Culture Technique
Water price (LBP/m3)
120 135 150 165 180 195 210 225 240 255
Wheat Rainfed 5.63 5.63 5.63 5.63 5.63 5.63 5.63 5.63 5.63 5.63
Barley Rainfed 1.30 1.30 1.30 1.30 1.30 1.30 1.30 1.30 1.30 1.30
Chickpea Rainfed 0.95 0.95 0.95 0.95 0.95 0.95 0.95 0.95 0.95 0.95
potatoes Rainfed 0.78 0.78
Potatoes Irrigated 0.78 0.78 0.78 0.78 0.78 0.78 0.78 0.78
Apple Rainfed 1.63 1.63 1.63 1.63 1.63 1.63 1.63 2.53 2.53 2.53
Apple Irrigated 0.90 0.90 0.90 0.90 0.90 0.90 0.90
Cherry Irrigated 0.93 0.93 0.93 0.93 0.93 0.93 0.93 0.93 0.93 0.93

Page 119 of 166
- Maroun El Ras: As expected, farms in this village were not sensitive to the water price
variation. In fact, the amount of irrigation water used by mix farms remains largely under the
total water available (Table 29). In such conditions, only the chickpea and the olive trees will be
irrigated. By increasing the water irrigation price from 120 LBP/m3 to 255 LBP/m3, the average
farm income in this village decreases marginally from 12,553,829 LBP to 12,538,360 LBP
(Figure 36).
The same farm behavior is observed for the farm dominated by tobacco. In this case, farmers’
prefer cultivating the very profitable rain-fed tobacco than cultivate other irrigated crop (Figure
36).
Figure 36: Variation of the average farm income by farm type.
0
2000000
4000000
6000000
8000000
10000000
12000000
14000000
120 135 150 165 180 195 210 225 240 255
Vari
ati
on
of
gro
ss m
arg
in p
er
farm
(L
L)
Price of water (LL/m3)
FTmix-o-l FTmix-Y-l FTtab-o-h FTtab-y-h

Page 120 of 166
Table 29: Variation of Crop patterns for different water prices
Culture Technique
Water prices (LBP/m3)
120 135 150 165 180 195 210 225 240 255
Tobacco Rainfed 9.90 9.90 9.90 9.90 9.90 9.90 9.90 9.90 9.90 9.90
Wheat Rainfed 6.36 6.36 6.36 6.36 6.36 6.36 6.36 6.36 6.36 6.36
Barley Rainfed 0.13 0.13 0.13 0.13 0.13 0.13 0.13 0.13 0.13 0.13
Chickpea Irrigated 0.33 0.33 0.33 0.33 0.33 0.33 0.33 0.33 0.33 0.33
Olives Irrigated 0.27 0.27 0.27 0.27 0.27 0.27 0.27 0.27 0.27 0.27
6.3- Scenario “cropping systems innovation”: which alternative for the current
cropping systems?
The objective of this scenario is to analyze, for each representative farm by village, the farm
behavior by proposing for farmers new crops to be cultivated. Those crops are selected to be
suitable (adapted) to biophysical and agronomic conditions of each village. The alternative crops
could be grown in rainfed or irrigated conditions. In this scenario, the water irrigation price is
fixed at 150 LBP/m3 and the total available water by farm is about 20 000m3, 40 000 m3 and
22 000 m3 for respectively Maroun El Ras, Marjhine and Qemamine villages. The main results
of this scenario are summarized as following:
- Qemamine : In this village farmers decided to cultivate two main new crops : lupine and
eggplant. Those crops replaced the chickpeas and the barley which completely disappeared. The
area reserved for potatoes will be considerably reduced from 2 dn to 0.4 dn. The eggplant will be
the more profitable crop and cultivated for 2.7 dn (Figure 37). In this case the total available
water will be consecrated for eggplant and lupine. All the orchards (peach, cherry and apple) will
be cultivated only as rainfed crops. By adopting this strategy, the average farm income will
increase by almost 104% in the Qemamamine village. In fact, the average farm income increases

Page 121 of 166
from 7,450,454 LBP to 15,201,394 LBP by cultivating two new crops.
Figure 37: cropping patterns by representative farm type in the Qemamine village
- Marjhine : The implementation of alternative crops in the Marjhine village doesn’t change in a
significant way the currents farms behaviors. In fact, no alternative crops were adopted by
farmers. However, other modifications are observed and represented mainly by the disappearing
of barley and the increase of wheat, potatoes and chickpea. In fact, the area of those crops
increases from 5.63 to 6.14 dn, 0.93 to 1.13 dn and 0.78 to 1.39 dn respectively for wheat,
chickpea and potatoes (Figure 38). This strategy will mobilize the total available water: 1048
m/ha. Consequently, the average farm income increases from 4,838,585 to 5,082,742 LBP (Table
30).
0
2
4
6
8
10
12
14
16
rainfed rainfed rainfed rainfed irrigated irrigated irrigated irrigated rainfed irrigated
Wheat Barley Chickpeas apple potato apple cherry peach Lupine Eggplant
Su
rafc
e o
f each
cro
p p
er
farm
(d
n)
Cropping patterns
Scénario_irrigation scénario_culture alternatives

Page 122 of 166
Figure 38: Cropping patterns by representative farm type and by village in the Marjhine village
- Maroun El Ras: Currently farms in this village cultivate mainly tobacco. By implanting
irrigation and new cropping systems the farmer behavior doesn’t change in a significant. In fact,
the tobacco is a very profitable crop even if cultivated without irrigation. For the mix farms, the
introduction of new crops will be traduced by the adopting of eggplants and lupine as alternative
crops instead of barley (Figure 39). Even that, the share of irrigated area remains very small and
less than 4% of the total area. The main constraint in this case is the low amounts of available
water by farm which is estimated to be 250m3/ha. However, even that the average farm income
increases from 12,545,427 to 12,725,198 LBP (Table 30).
For farmers cultivating mainly tobacco; only small area will be reserved for eggplant and lupine
as alternative crops. Thus, only a small part of available irrigation water, 50m3/ha over 250m3/ha,
will be used to irrigate eggplant and lupine. The area of those two crops remains very marginal
and doesn’t exceed 1ha in all cases (Figure 40). Consequently, the average farm income remains
almost the same: 5,270,767 L.L (Table 30).
0.00
1.00
2.00
3.00
4.00
5.00
6.00
7.00
rainfed rainfed rainfed rainfed irrigated irrigated irrigated
Wheat Barley Chickpeas apple potato apple cherry
Su
rafc
e o
f each
cro
p p
er
farm
(d
n
Cropping patterns
scénario_irrigation scénario_cultures alternatives

Page 123 of 166
Figure 39: Cropping patterns by representative farm type and scenario in the Maroun El Ras village.
Figure 40: Variation of the cropping patterns for the tobacco farm type in the Maroun El Ras village
0
2
4
6
8
10
12
rainfed rainfed rainfed irrigated rainfed irrigated irrigated
Tobacco Wheat Barley Chickpeas Chickpeas olives Eggplantsu
rface o
f cro
ps p
er
farm
(d
n)
Cropping patterns
Scénario_irrigation scénario_culture_alternatives
0
1
2
3
4
5
6
rainfed rainfed rainfed rainfed irrigated
Tobacco Wheat Barley Lupine EggplantSu
rface o
f cro
ps p
er
farm
(d
n)
Cropping patterns
Scénario_irrigation Scénario_cultures alternatives

Page 124 of 166
Table 30: Variation of the irrigated surface, the amounts of irrigation and the average farm income for each type of farm in the
three villages.
Villages
Share of irrigated area (%) Amounts of water
(m3/farm)
Average farm income
(LBP/farm)
S_irrigation S_ alternative crops
S_irrigation S_ alternative crops
S_irrigation S_ alternative crops
Qemamine 16 13 1538 1538 7,450,454 15,201,394
Marjhine 22 23 1048 1048 4,838,585 5,082,742
Maroun El
ras_Mixte 4 4 200 250 12,545,427 12,725,198
Maroun El
ras_Tabac 0 1 0 50 6,568,317 5,270,767
6.4 Combined scenario: Which strategy to promote irrigation?
The objective of this scenario is to test the possibility to give more water for irrigation than the
amounts initially proposed. This scenario will be tested by combining alternative crops and by
fixing the irrigation water price at 50LBP/m3. Concretely, this scenario assumes 3077m3/ha,
2200m3/ha and 500m3/ha as water irrigation availability for respectively Qemamine, Marjhine
and Maroun El Ras villages. The results showed that:
- Qemamine : In this scenario, the irrigated surface will increase from 16% of the total area to
35%. The increase of irrigated area doesn’t mean an important modification in the farm cropping
patterns. In fact, farmers in this village, continue to cultivate, as currently, cereals, legume crops,
vegetables and orchards in small surfaces. However, as irrigated crops, farmers will cultivate the
more profitable crops such as eggplants (3 dn), lupine (2.5 dn), apple (2 dn), cherry (0.36 dn),
and peach (0.12 dn) (Figure 41). Consequently the average farm income in the Qemamine
village will increase from 7,515,050 LBP to LBP 17,024,112 (Table 31). In addition, the total
available water will be used and the wheat will be cultivated exclusively as rainfed crop.

Page 125 of 166
Figure 41: Variation of cropping patterns by farm type and by scenario in the Qemamine village
- Marjhine : Farms in Marjhine are often smaller than in Qemamine. However, in this village
farmers, as in Qemamine, cultivate mainly cereals, legume crops and orchards. Thus, face to this
scenario, the farmer behavior is similar to the Qemamine one. Concretely, farmer decided to
irrigate the more profitable crops, such as potatoes (1.4 dn), apple (2.3 dn), and Cherry (0.93 dn)
(Figure 42). Overall, the irrigated area increases from 22% to 38% of the total farm area and the
average farm income in Marjhine increases by 12%; from 4,871,283 to 5,515,736 L.L (Table
31). Here also, the total available water will be used by farmers.
0
2
4
6
8
10
12
14
16
rainfed rainfed irrigated irrigated rainfed irrigated rainfed irrigated rainfed
Wheat apple apple cherry peach Eggplan Lupine Lupine potato
Su
rface o
f cro
ps p
er
farm
(d
n)
Cropping patterns
Scénario_irrigation Scénario_Combiné

Page 126 of 166
Figure 42: Variation of cropping patterns by farm and by scenario in the Marjhine village
- Maroun El Ras: In this village, farmers cultivate mainly tobacco. Initially in the irrigation
scenario, no changes were observed in the current cropping patterns, because Tobacco and
cereals are very profitable even in rainfed management. In the combined scenario, mix farms in
the Maroun El Ras village remain not sensitive to the increase of water availability and the
decrease of irrigation water price (50 LBP/m3). Thus, the irrigation area increases slightly from
4 to 9% of the total farm area. In fact, tobacco remains exclusively managed as rainfed crop. The
only modification here will be the irrigation of a small part of the area reserved to wheat (0.9 dn)
(Figure 43). The irrigated crop, such as chickpea, eggplant and olive trees, remains very
marginal and doesn’t exceed 1 dn. Overall the average farm income remains stable 12,756,652.9
LBP (Table 31).
0
1
2
3
4
5
6
7
rainfed rainfed irrigated rainfed irrigated irrigated
Wheat Chickpeas potato apple apple cherry
Su
rface o
f cro
ps p
er
farm
(d
n)
Cropping patterns
Scénario_Irrigation Scénario_Combiné

Page 127 of 166
Figure 43: Variation of the cropping patterns by scenario for the mix farms in the de Maroun El Ras village.
However, the cropping patterns of farms in Maroun El Ras, cultivating currently only tobacco
(almost 90% of the total farm area) change considerably under the combined scenario. In fact,
even if the tobacco remains the major crop, the surface of this crop decreases by 20% (figure 44)
In fact, winter rainfed (1.22 dn) and irrigated (1.7 dn) winter wheat will replace progressively
tobacco. In addition, a small area will be reserved in this scenario for lupine and eggplant as
alternative crops. Consequently, the average farm income will increase significantly from
4,960,949.1 LBP to 5,281,004.19 LBP (Table 31). In both cases the total available water will be
used by farmers.
0
1
2
3
4
5
6
7
8
9
10
rainfed rainfed irrigated rainfed irrigated rainfed irrigated irrigated
Tobacco Wheat Wheat Barley Chickpeas Chickpeas olives Eggplant
Su
rface o
f cro
ps p
er
farm
(d
n)
Cropping pattens
Scénario_Irrigation Scénario_Combiné

Page 128 of 166
Figure 44: Variation of cropping patterns by scenario for the Tobacco farms in the Maroun El Ras village.
Table 31: Variation of the irrigated surface, the amounts of water irrigation and the average farm income in the three villages.
Villages
Irrigated area (%) Amount of used water (m3/farm) Farm income (LBP/farm)
S_irrigation S_Combined S_irrigation S_Combined S_irrigation S_Combined
Qemamine 16 35 1538 3077 7450454 17024112
Marjhine 22 38 1048 2200 4838585 5515736
Maroun El Ras_Mix 4 9 200 500 12545427 12756653
Maroun El Ras_Tobacco 0 26 0 500 6568317 5281004
0.00
0.50
1.00
1.50
2.00
2.50
3.00
3.50
4.00
4.50
rainfed rainfed irrigated irrigated rainfed
Tobacco Wheat Wheat Eggplant Lupine
Su
rafc
e o
f cro
ps p
er
farm
(d
n)
Cropping patterns
Scénario_irrigation Scénario_Combiné

Page 129 of 166
6.5- Which strategy to promote irrigated agriculture in the three villages?
The main objective of this report was to analyze the socio-economic and the environmental
behaviors of farms when irrigation water will be mobilized. This water will be supplied from
three small lakes in the Marjhine, Maroun El Ras and Qemamine villages with a retention
capacity of respectively 40 000 m3, 20 000 m3 et 22 000 m3. To achieve this work several steps
were followed:
1- Farms in the three villages were interviewed. These surveys concerned 44 farms at
Maroun El Ras, 14 at Marjhine and 17 at Qemamine. They served to identify the main
current crops, their management in term of irrigation (amounts and timing) as well as the
total production and cost of each crop. In parallel, additional information about the
potential and adaptive alternative crops were also collected.
2- A modeling chain, combining crop model (CropWat), bio-economic model (linear
programming model) and socio-economic and environmental indicators, was developed
for this study. To run models several data were collected from farmer surveys, agriculture
ministry and from bibliography.
3- Four scenarios were developed and their effects on farms behaviors were simulated by
using the modeling chain. Those scenarios were simulated on four representative farms in
the three villages. Those scenarios are composed by a baseline scenario (business as
usual) and three alternative scenarios combining different water prices, water availability
and alternative crops.
From this analysis several conclusions and recommendations are identified:
1- All farms are very few diversified with low average farm revenue. Three main farm
strategies are identified:
i- Farmers with large experience and large farms (more than 13 dn). They mainly
cultivate cereals, legume crops and marginally orchards. Their average farm
income is estimated to 6,000,000 LBP/year ;
ii- Farmers with less experience and with small farms (less than 6 dn). Those
farmers cultivate the same type of crops than the first group but with a lower
average farm income estimated at 3,500,000 LBP/year ;

Page 130 of 166
iii- Farmers in Maroun El Ras characterized by a large experience and large farms
(more than 9.5 dn). They cultivate mainly Tobacco and cereals (wheat, barley).
This combination of crops ensures for farmers the highest average farm income
between the three village 12,300,000 LBP/year ;
iv- Farmers, in Maroun El Ras, with less experience and small farms (less than 5.5
dn). Those farmers cultivate mainly tobacco and their average revenue is
estimated to 4,700,000 LBP/year.
2- The introduction of the irrigation from the three lakes causes very few changes in
cropping patters as well as the average farm revenue. However, the sensitivity of farms
to the irrigation will be different depending on the initial cultivated cropping systems. In
fact, mainly farms cultivating currently cereals and legumes will be positively affected
by the implementation of irrigation water. In this case, mainly potatoes will be fully
irrigated. In addition, farmers will irrigate partially orchards (cherry, peach and apple). In
this case the average farm income increases between 10 to 20%. Overall, even if more
crops are irrigated and the average farm income increases, farms continue to cultivate
mainly rainfed cereals.
Farms specialized in tobacco are very few sensitive to irrigation. For those farms, more
the area reserved for tobacco is important less it is sensitive to irrigation. In this case
farmers prefer cultivate the more profitable rainfed tobacco than the irrigated one.
Overall, the average farm income remains almost the same if the irrigation scenario is
implemented.
3- In order to test the farms sensitivity to water total cost, several prices of water were
simulated. In parallel, several socio-economic and environmental indicators were
calculated. All farms seem to be very few sensitive to water price variability.
In fact, the cereal farms seem to be the less sensitive ones to the water price variability.
However, even if the current cropping patterns vary very few by increasing water price, the
average farm income decrease dramatically. In this case, farmers prefer cultivate rainfed crops.
For almost all farms, the more profitable price for water is around 120 LL/m3. However, we
should check if such price could cover the real water cost (installation cost, maintenance
cost…).

Page 131 of 166
Overall, for farms cultivating tobacco, no changes in cropping patterns or average farm income
are notified.
4- A second scenario based on alternative crops was also simulated. Those crops are originally
marginally cultivated in the three villages. Those crops are selected because they are suitable
to the biophysical and agronomic conditions of the three villages. By introducing new crops,
farmers should have more flexibility to select the more profitable and adaptive crops. By
implementing this scenario, all farmers chosen to include few modifications in their current
systems, but all of them showed an increase in their farm income.
The more important increase in farm income was observed for the cereal farms for which the
current farm income was tripled. In these farms, even if the area reserved for alternative
crops (eggplants, lupine) remains marginal, those crops ensured for farmers a significant
increase in farm income.
By proposing alternative crops, the tobacco farms, which were not sensitive to the water
scenario, adopted mainly eggplants and lupine as new crops. However, this modification
generates only a small increase in the average farm income.
From this scenario it seems that a great effort should be achieved by the Lebanese
government and the NGO’s to promote this type of alternative crops. Such decision implies
an important investment to be made with probably an important transaction cost that should
be estimated.
Overall, it is concluded that the promotion of irrigated crops in a context like the three
villages cannot be achieved in a realistic way by implementing individual incentive
measures such as decreasing water irrigation price and provision of new crops. This result
can explain the current low share of irrigated crops in the three villages. Overall, this study
shows that the most effective and realistic way to promote irrigation in the three villages is
to implement combined agronomic and socio-economic measures like the ones used in the
combined scenario. It has increased the irrigated area significantly for all the farms of the
three villages.

Page 132 of 166
General Discussion
CHAPTER OBJECTIVES
The objectives of this chapter are to discuss the important results obtained from this research,
and how these results can be used in the evaluation of current agricultural policies in Lebanon.
Also possible perspectives of the methodology used and the results obtained are to be presented.
1. INTRODUCTION
Since the 1950s, Lebanon has attempted to modernize its agricultural sector to meet the demand
of a relatively dense population living in an area of 10452 km2. Nevertheless, the unsustainable
policies adopted along the years has marginalized the sector, and today the country only produce
nearly one quarter of its food consumption.
The interventions of the state were mostly through price support programs (PSP) such as for
tobacco, wheat, and sugar beet. Our research shows that such interventions have promoted the
intensification of agricultural production and have allowed farmers to increase their incomes.
However, that comes often at the cost of environmental degradation. And this improvement
remains dependent on direct or indirect support levels granted to farmers, which raises questions
regarding the sustainability and resilience of agricultural production systems.
The objective of research is to analyse the farm income and environmental impacts of
agricultural production, as well as the productivity of several typical irrigated farms in Lebanon
in relation to key inputs, especially irrigation water. This productivity has been tested with and
without support for agriculture as it is practiced today. This is complemented by mobilizing a
bio-economic model based on non-linear programming, stimulus scenarios to improve the
agricultural production of farms in Lebanon.
To perform the work, first farmers’ survey to investigate the cropping patterns practiced by
farmers as well as the relevant socio-economic context was done. Second a farm typology to
allow the grouping of existing farms based on their biophysical and socio-economic
characteristics was performed. The typology was then complemented by a sensitivity analysis of
farmers’ income in relation to to prices and subsidies variabilities.

Page 133 of 166
And finally, in different sites in Lebanon with different socioeconomic and biophysical contexts,
scenarios were tested using the bio-economic model. These scenarios aim to increase the
availability of irrigation water for farmers, as well as the diversification of the current cropping
systems, and to test the possibility of promoting irrigated crops with different tariff options on
irrigation water.
2. MAJOR RESULTS
Although no quantification of volume of irrigation water available in the studies areas, we
managed to estimate the quantities of irrigation water used for each crop, according to the source
and the method of irrigation (drip system, sprinklers, and submersion). And our work in different
regions of the country demonstrated the wide diversity of crop production practices.
Our results showed that intensification pathways led by provision of more irrigation water,
produce price premiums, and export has resulted in the appearance of five different types of
farming systems. These farming types follow different pathways in responding to opportunities,
however, all still achieve similar incomes with different potential environmental impacts,
especially on diversity. For example the semi-intensive predominantly-grapes farms (SIPG)
achieved 13768301 LL/ha as gross revenue; similarly, the intensive predominantly-onion,
tobacco farms (IPO-T), the intensive diversified farms (ID), and the very intensive
predominantly-tobacco farms (VIPT) earned gross revenues of 15473112 LBP/ha, 14766123
LBP/ha and 16516147 LBP/ha, respectively. Whereas, farmers of the traditional extensive mixed
cereal-olive group (TMC-O) have earned only 1214239 LL/ha as gross income. The latter group
resembles farmers groups in other countries of the region, like Tunisia and Morocco (El Ansari
et al, 2017; Souissi et al., 2017). In comparison with the average gross national income per
capita, which reached 12,336,700 LBP in 2013, (World Bank, 2017), one can assume that
farmers are making a relatively good living by practicing agricultural production.
Sensitivity analysis showed that the majority of these farms proved to be sensitive because they
are based either on the virtual value of premiums paid by the government, or on fluctuating
market prices. Even if some farms seem diversified in production, they are still sensitive to a
lesser extent, because subsidized crops still constitute a major part of their total agricultural
production.

Page 134 of 166
Conventional extensive cereal farms are marginal, are less sensitive especially to the water price
variability. However, these farms which produce mainly cereals and non-irrigated olives cannot
be economically sustainable unless they are supported with other sources of family income.
Tobacco and cash crops (grapes, potato, onions, etc) were associated with greater use of inputs
such as water, pesticides, and fertilizers, whereas the traditional production farm type dominated
by cereals and olives used much less resources.
The provision of more irrigation water through the construction of the three lakes caused very
few changes in cropping patterns in the villages concerned, as well as the average farm revenue.
The sensitivity of the farms to irrigation availability is highly depending on the nature initial
practiced cropping systems. In fact, most farms benefited only from supplemental irrigation for
their arable crops and partially irrigated orchards. The average farm income in this case would
increase between 10 to 20% only. Similar cases were recorded in the Saïs plain in Morocco and
the Sidi Bouzid plain in Tunisia, where surface areas dedicated to crop farming have increased
by 10% (El Ansari et al., 2017) and 15% (Ferchiou, 2017) respectively after the introduction of
more water for the farmers. More irrigation water allows farmers semi-dry areas to introduce to
introduce irrigated cash crops (vegetables and legumes) which could enhance the income and
livelihood of farmers in the marginalized rural areas. However, this type of intervention receives
a lot of criticism today at dryland area level where water resources are very limited and where
the durability/resilience of these systems are being questioned (Chartzoulakis and Bertaki, 2015).
Farmers in the study areas proved they can make a living for farming with little available water.
The accumulated experiences of the farmers during long years of farming under stressful
environmental conditions make the farms more resilient. Our results show that even if more
water is made available to the farmers, their strategies relatively remain the same. They would
increase their amount of irrigation water use, but without drastically changing their cropping
patterns.
The mere assumption that providing some additional millions cubic meter of irrigation water
would increase irrigated surfaces by some thousands of hectares, is not a valid assumption. A
proof of the inefficiency of this policy is the MENA region itself where governments in the
region were investing in provision of more irrigation water to farmers for decades, and have
invested billions of dollars through the construction of dams and reservoirs ranging from huge

Page 135 of 166
ones such as the Aswan Dam to small catchments down the creeks (Sowers et al., 2011). Still the
region is struggling to provide enough agricultural production to feed its people. There is a need
of improved institutional procedures to more efficiently distribute and use the available existing
water, indeed (Al-Weshah 2000; Ward and Pulido-Velazquez 2012). In this work we proposed
introducing new crops, in addition to the provision of water, in order to shift higher the
productivity potential of the farms. Our model showed positive results of such intervention.
Other interventions, technological and/or economical, could also be tested in other scenarios.
The practiced cropping patterns and the crop management options to be decided by farmers
themselves are by far important factors to consider rather one single intervention such as
providing more water.
PSP for tobacco and wheat production is still a corner stone in the cropping systems of
marginalized, prone to desertification areas of the country. For instance, when the government
stopped subsidizing the sugar beet production, the whole sugar production industry vanished.
Tobacco has been cultivated for long time in the region of South Lebanon as a vital support to
poor farmers in that semi-arid, economically marginalized areas in the mid-20th century. It was
then introduced in the Béqaa plain by the government within the context of its effort to prohibit
the cultivation of illicit crops. Some national and international entities are advocating the
stoppage of tobacco support program because of its high cost as well as for health reasons
(World Bank 2010a; MoET, 2010; Chaaban et 2010; Nakkash et al 2014).
However any attempt to stop the tobacco PSP would cause a social friction; and the related
accidents in the 1960s and 1970s is enough as proof. Wheat would also be a similar case. Any
removal of the current support to the agriculture sector by the state before identifying alternatives
for concerned farmers would disturb the sector.
Nevertheless, policy makers should start looking at the agriculture sector from a holistic point of
view, and from a narrow angle of intervening in sporadic, unrelated actions. The socio-economic
context which mostly dictates the behaviour of farmers should be always be taken into account
when making interventions. Other contexts include the available resources in the country,
regional and international context, the economy of scale, etc.

Page 136 of 166
3. LIMITS OF THE WORK
Availability of data: A major constraint to the work with the absence of data in the study areas.
The absence of reliable data and measurements has always been a major obstacle for researches
and decisions makers in arid and semi-arid areas, especially the developing ones (Buytaert et al.
2012). Farmers never keep farm records. Public institutions have no systematic approach to
follow up with farmers. Water authorities do not measure irrigation water distributed.
Cooperatives documentation is usually restricted to commercial activities. Working within this
environment of minimum data available prevented from collecting and harmonizing data from
different sources, and required more time and efforts to understand the real situation of
agricultural production in the study areas. The survey of on-farm management practices was the
most reliable source.
Limits in representation of cropping systems: In this work, cropping patterns characteristics were
limited to the main cultivated crops without considering varieties, two soil types, and two types
of crop management (irrigated vs rain-fed). We tried to compensate for this limitation through
increasing the sample size of the surveyed, as mentioned latter. We set our surveys sampling to
be between 15-30% of total farms in the different study areas. Still that does not ensure adequate
representation of all observed activities on the farms of each specific farm type observed. A
better way would be to conduct the same type of scenario approach on individual farm types
instead of average ones. However, this would require the collection of large biophysical, socio-
economic and institutional farm data, which is often very difficult either because of the
unavailability of records or because individual farm data are usually considered confidential
information and are not available for researchers (Buytaert et al. 2012; Zander et al., 2009).
Farmers’ adaptation with time: Farmers usually adapt their management strategies to stay in the
business in front of food systems challenges. As the time passes, more information become
available to farmers which help them to take decisions in order to adapt to the challenges created
by new the interventions (Belhouchette et al., 2011). This process usually is either a reactive
process or a proactive one depending on the farmer’s flexibility and his ability to expect future
conditions. Our model so far does not take this fact into account because such a model is
complex multi-years dynamic farm model one, and requires information which is not available at
present. Addressing this issue in the future would be a major enhancement of the model.

Page 137 of 166
4. MODEL RE-USABILITY
The estimation of applied irrigation water in an area where water is distributed based on time and
surface rather than volume; this estimation model, though simple, would be useful for other
regions of Lebanon where the sane water distribution systems are widely practiced.
This work might be the first in Lebanon where farmers have been characterized based on their
cropping patterns. We used in this work a bio-economic model based linear programming. Bio-
economic farm models are often used to simulate management decisions about resources
allocation. The model works on integrating different biophysical processes with economic and
social contexts (Barbier and Bergeron, 1999). Our model, like most models, faces the challenge
of sufficiently representing the local farming systems variability. And by doing the typology of
the surveyed farms, we avoided the misrepresentation encountered usually when considering
individual farms (Kanellopoulos et al. 2010) to describe the different activities of a farm type.
Within the difficulty to represent all the diversity of farming systems observe in Lebanon, our
aim was to least give some answers regarding the pathways that farmers can follow when water
will be more available to them, and to propose a methodology that can be applied for other
farming systems amongst the prevailing socio-economic and biophysical conditions, in Lebanon
and outside it.
The combining of Cropwat and the bio-economic model we managed to set up assessments for a
wide range of conditions and factors affecting the production processes including (i) biophysical
conditions (soil, weather), (ii) types of crop, land use system or agro management (cereals,
legumes, perennial crops), (iii) types of production (irrigated, rain-fed) and (iv) types of socio-
economic contexts (price support programs, provision of water by the state). This combined
model can also be re-used for simulating different policy scenarios combining biophysical, crop
diversity and socio-economic conditions (e.g. ending subsidies, price liberalization, water
provision, etc.) as well as new techniques that may be released by private sector and or the
government extension services (e.g. new plant varieties, new cropping techniques, etc.).

Page 138 of 166
The estimation of applied irrigation water in an area where water is distributed based on time and
surface rather than volume; this estimation model, though simple, would be useful for other
regions of Lebanon where the sane water distribution systems are widely practiced.
5. PERSPECTIVES FOR APPLICATION OF THE APPROACH
This research, although has its limitations, opens the door to consider simulation of prospected
results before taking a final decision of any important intervention in the agriculture sector. For
instance, our work proved that water provision is not the magic solution to agriculture production
in Lebanon, as has been long perceived by many governmental institutions, national and
international donor organizations and NGOs. However, poorly planned investment in the
modernization of irrigation schemes in arid and semi-arid zones may lead to negative
consequences (European Commission, 2012). Improved applied water use was often associated
with increased plot sizes and water consumption from the source (Raz, 2014; Contor and Taylor,
2013; Pfeiffer and Lin, 2014) and rising in water and energy costs (García et.al, 2014).
Investment of hundreds of millions of dollars are being planned or the in the pipeline for the
irrigation sector (MoEW 2010). It is worthy to test the possible scenarios before immersing in
the huge investment. And since the country has a large variability in socio-economic and
biophysical conditions, any analysis should be done at different locations to more representative,
as has been shown in our results. Our model here could be a good starting point as it is able to
catch this variability, even if it’s not perfect. Some improvement will be needed and other
modules can be added to make the model more flexible, e.g. dynamics, structural change,
investment, and perennial modules. This would be the subject of future studies.
And what applies to irrigation water might be true to other interventions. For example, the
Ministry of Agriculture has developed three strategic plans between 1994 and 2014 (MoA,
2014). All these plans included some major actions to be taken for the purpose of reshaping the
agriculture sector to be more productive. But such actions should be evaluated in advance to
measure their effectiveness and their impacts on the livelihoods of farmers, as well as their
environmental impacts. Our approach that took into account the heterogeneity of farming
conditions, because different farms have different biophysical and socio-economic constraints.
Previous feasibilities studies of large investment interventions mostly considered the targeted

Page 139 of 166
regions as a whole without considering the heterogeneity of farms. Here, modelling could be a
cost effective tool in the hands of the policy makers.
This approach also can serve as a good decision tool for farmers or a group of farmers (e.g.
farmers’ cooperatives). It facilitates the modeling of a farm decision-making problem modeled
an integrative modeling framework which could help the decision-making process for farmers to
address changes in their environment. This would help re-thinking farm planning on the
individual, or regional levels as a decision making process, in which decisions are made
continuously to react to changes in the environment whether these changes are new available
information, new technology, or environmental and/or market shocks.
We do advocate using of integrated assessment approach modelling in the planning of
interventions in the agricultural sectors. Such models could be adapted to a diversity of
situations. And it can be used by organizations of deferent levels and sizes, whether
governmental, intergovernmental, NGO, or local.

Page 140 of 166
REFERENCES
Affholder, F., Jourdain, D., Corbeels, M., Alary, V., Naudin, K., Bonnal, P., Scopel, E., Gérard,
F., Quirion, P. and Belhouchette, H. (2015). Is" bio-economic" farm modelling of any help for
farming system design? 131-132
Al Akhbar Newspaper. 2013. http://al-akhbar.com/node/177260. Accessed on 3 September,
2017.
Al Diyar Newspaper. 2015. http://www.addiyar.com/article/851293. Accessed on 3 September,
2017.
Al-Weshah, R. A. (2000). Optimal use of irrigation water in the Jordan Valley: a case study.
Water Resources Management, 14(5), 327-338.
Anonymous. 2001. Tobacco Fact in Lebanon. p. 17.
Asmar, F. (2011). Country Pasture/Forage Resource Profiles, Lebanon. Food and Agriculture
Organization of the United Nations (FAO). Rome, pp. 43
Baccar, M. (2013). Estimation des quantités d’eau utilisées par culture et par village en fonction
des ressources hydriques disponibles : établissement d’un modèle hydroagricole pour la région
de Deir el ahmar, Liban. Mémoire de Master. .Institut Agronomique Méditerranéen de
Montpellier.
Baccar, M., Bouaziz, A., Dugué, P., & Le Gal, P. Y. (2017). Shared environment, diversity of
pathways: dynamics of family farming in the Saïs Plain (Morocco). Regional Environmental
Change, 17(3), 739-751.
BankMed. 2016. Analysis of Lebanon’s Food Market - January 2016. Market & Economic
Research Division, Bankmed, Beirut, pp. 20. Accessed on 27 September 2017.
https://www.bankmed.com.lb/BOMedia/subservices/categories/News/20160107123010225.pdf
Barbier, B., & Bergeron, G. (1999). Impact of policy interventions on land management in
Honduras: results of a bioeconomic model. Agricultural Systems, 60(1), 1-16.
Belhouchette, H., Louhichi, K., Therond, O., Mouratiadou, I., Wery, J., Van Ittersum, M., &
Flichman, G. (2011). Assessing the impact of the Nitrate Directive on farming systems using a
bio-economic modelling chain. Agricultural Systems, 104(2), 135-145.

Page 141 of 166
Belhouchette, H., Blanco, M., Wéry, J., & Flichman, G. (2012). Sustainability of irrigated
farming systems in a Tunisian region: A recursive stochastic programming analysis. Computers
and electronics in agriculture, 86, 100-110.
Belloumi, M., & Matoussi, M. S. (2009). Measuring agricultural productivity growth in MENA
countries. Journal of Development and agricultural economics, 1(4), 103-113.
Bidogeza, J. C., Berentsen, P. B. M., De Graaff, J., & Lansink, A. O. (2009). A typology of farm
households for the Umutara Province in Rwanda. Food Security, 1(3), 321-335.
Bou-Zeid, E., & El-Fadel, M. (2002). Climate change and water resources in Lebanon and the
Middle East. Journal of water resources planning and management, 128(5), 343-355.
Breisinger, C., Van Rheenen, T., Ringler, C., Pratt, A. N., Minot, N., Aragon, C., ... & Zhu, T.
(2010). Food security and economic development in the Middle East and North Africa.
International Food Policy Research Institute, 1-52.
Bush, R. C. (2016). Family farming in the Near East and North Africa. (Working Paper No. 151)
Retrieved from: http://eprints.whiterose.ac.uk/109506/1/FAO_UNDP_NENA_family-
Farming.pdf
Buytaert, W., Friesen, J., Liebe, J., & Ludwig, R. (2012). Assessment and management of water
resources in developing, semi-arid and arid regions. Water Resources Management, 26(4), 841-
844.
Central Administration of Statistics (CAS). 2014. Lebanon National Accounts 2012-2013
http://www.cas.gov.lb/images/PDFs/National%20Accounts/Lebanon_National_Accounts_2012_
2013_Comments_%26amp;_tables.pdf.
Chaaban, J., Naamani, N., & Salti, N. (2010). The economics of tobacco in Lebanon: an
estimation of the social costs of tobacco consumption. Beirut: American University in Beirut
Tobacco Control Research Group.
Chenoune, R., Belhouchette, H., Paloma, S. G., & Capillon, A. (2016). Assessing the diversity of
smallholder rice farms production strategies in Sierra Leone. NJAS-Wageningen Journal of Life
Sciences, 76, 7-19.
Chenoune, R., Allen, T., Komarek, A. M., Guillermo, F., Alain, C., & Hatem, B. (2017).
Assessing consumption-production-resources nexus decisions for rice-focused agricultural
households in Sierra Leone. Land Use Policy, 67, 597-607.
Chartzoulakis, K., & Bertaki, M. (2015). Sustainable water management in agriculture under
climate change. Agriculture and Agricultural Science Procedia, 4, 88-98.

Page 142 of 166
Collelo, Thomas, ed. (1987). Lebanon: A Country Study. Washington: GPO for the Library of
Congress, pp. 282.
Contor, B. A., & Taylor, R. G. (2013). Why improving irrigation efficiency increases total
volume of consumptive use. Irrigation and Drainage, 62(3), 273-280.
Daoudi, A., & Colin, J. P. (2016, March). Land policy and land markets on the agricultural
frontier in arid Algeria. In proc. The 17th Annual Land and Poverty Conference 2016: Scaling
up Responsible Land Governance (pp. 1-26).
Darwish, T. (2006). Soil Map of Lebanon: 1: 50 000. CNRS, Remote Sensing Center.
Darwish, R., Farajalla, N., & Masri, R. (2009). The 2006 war and its inter‐temporal economic
impact on agriculture in Lebanon. Disasters, 33(4), 629-644.
Darwish, T., Atallah, T., El Moujabber, M., & Khatib, N. (2005). Salinity evolution and crop
response to secondary soil salinity in two agro-climatic zones in Lebanon. Agricultural Water
Management, 78(1), 152-164.
Doummar, J. (2014). Karst Groundwater Resources in Lebanon & Formation of Caves.
American University of Beirut, Geology Department, Beirut, pp.33. Accessed on 27 September
2017. https://www.aub.edu.lb/hydroGeo_doummar/Documents/Presentation%20UFS.pdf.
Ec-European Commission. (2012). A blueprint to Safeguard Europe’s Water Resources. COM
(2012), 673.
El Ansari L., Chenoune R., Yigezu A.Y., Gary C., Belhouchette H. (2017). Assessment of the
sustainability of three farm household types in a dryland area, in terms of agro-biodiversity,
productive efficiency and own consumption: a case study from the Saïss region of Morocco. Ag.
Sys., Submitted, pp. 42.
Fadel, A., Lemaire, B. J., Atoui, A., Vinçon‐Leite, B., Amacha, N., Slim, K., & Tassin, B.
(2014). First assessment of the ecological status of Karaoun Reservoir, Lebanon. Lakes &
Reservoirs: Research & Management, 19(2), 142-157.
Ferchiou A. (2017). Quelles mesures de relances pour l’agriculture familiale en zone aride :
Evaluation intégrée par la modélisation bio économique des ménages agricoles de Sidi Bouzid.
PhD thesis, pp. 238.
Flichman, G. (Ed.). (2011). Bio-economic models applied to agricultural systems. Springer
Science & Business Media.
Frenken, K. (2009). Irrigation in the Middle East region in figures AQUASTAT Survey-2008.
Water Reports, (34).pp.402.

Page 143 of 166
Food and Agriculture Organization of the United Nations (FAO). (2014). Lebanon Plan of Action for Resilient Livelihoods 2014-2018: A Summary. Rome, pp. 16. Food and Agriculture Organization of the United Nations (FAO) & World Water Council (WWC). (2015). TOWARDS A WATER AND FOOD SECURE FUTURE: Critical Perspectives for Policy-makers. pp.76. Available online: http://www.fao.org/3/a-i4560e.pdf (Accessed on May 2nd 2015). García, I. F., Díaz, J. R., Poyato, E. C., Montesinos, P., & Berbel, J. (2014). Effects of
modernization and medium term perspectives on water and energy use in irrigation districts.
Agricultural systems, 131, 56-63.
Gleick, P. H., Christian-Smith, J., & Cooley, H. (2011). Water-use efficiency and productivity:
rethinking the basin approach. Water International, 36(7), 784-798.
Haddad, E. A., Farajalla, N., Camargo, M., Lopes, R. L., & Vieira, F. V. (2014). Climate change
in Lebanon: Higher-order regional impacts from agriculture. Region, 1(1), 9-24.
Hamade, K., Malorgio, G., & Midmore, P. (2015). Contrasting Quantitative and Qualitative
Approaches to Rural Development Analysis: The Case of Agricultural Intensification in
Lebanon. Journal of Agricultural Economics, 66(2), 492-518.
Hassine, N. B. (2015). Economic inequality in the Arab region. World Development, 66, 532-
556.
International Labour Organization, 2002. Lebanon: Child Labour on Tobacco Plantations: A
Rapid Assessment. Investigating the Worst Forms of Child Labour Report No. 17. Geneva, p. 56.
Investment Development Authority of Lebanon (IDAL). (2015). Agriculture Fact Book 2015.
Accessed on 27 September 2017.
http://www.investinlebanon.gov.lb/Content/uploads/Publication/160301115823510~Agriculture
%20Factsheet%202015.pdf
Investment Development Authority of Lebanon (IDAL). (2016). Agri Plus Program 2016 Annual
Report (In Arabic). Retrieved from:
http://investinlebanon.gov.lb/Content/uploads/CorporatePageRubric/170605021244958~Agri%2
0Plus%20Arabic%20AR%202016.pdf
Investment Development Authority of Lebanon (IDAL). (2017). Agriculture. Accessed on 27
September 2017. http://investinlebanon.gov.lb/en/sectors_in_focus/agriculture
Janssen, S., & Van Ittersum, M. K. (2007). Assessing farm innovations and responses to policies:
a review of bio-economic farm models. Agricultural systems, 94(3), 622-636.

Page 144 of 166
Jemaa, M. M. B., & Dhif, M. A. (2005, September). Agricultural productivity and technological
gap between MENA region and some European countries: A meta-frontier approach. In
Economic Research Forum (pp. 1-20).
Jomaa, I., Sbeih, M. S., & Jaubert, R. (2015). Sharp expansion of intensive groundwater
irrigation, semi-arid environment at the northern Béqaa Valley Lebanon. Natural Resources,
6(6), 381-390.
Jouili, M. (2009, June). Tunisian agriculture: Are small farms doomed to disappear?. In 111
EAAE-IAAE Seminar ‘Small Farms: decline or persistence’.
Kabbani, N., Bazzi, A., Asrawi, F., & Darwish, M. R. (2008). Raw tobacco price subsidy:
implications for farm income and natural productive resources. International Development
Research Center (IDRC).
Kanellopoulos, A., Berentsen, P., Heckelei, T., Van Ittersum, M., & Lansink, A. O. (2010).
Assessing the forecasting performance of a generic bio‐economic farm model calibrated with
two different PMP variants. Journal of Agricultural Economics, 61(2), 274-294.
Kanj F. (2013). Diagnostic des systèmes agricoles et évaluation de la performance de certaines
cultures dans la région de Deir Al Ahmar, Béqaa (Liban). Mémoire (Master 2) : Université
Libanaise, Beyrouth (Liban)
Karaa K., Karam F., Tarabey N. (2004) Participatory water saving management and water
culturalheritage: Lebanon country report.In : Hamdy A. (ed.), Tüzün M. (ed.), Lamaddalena N.
(ed.),Todorovic M. (ed.), Bogliotti C. (ed.). Participatory water saving management and water
cultural heritage.Bari : CIHEAM,. p. 185-198 (Options Méditerranéennes : Série B. Etudes et
Recherches; n. 48)
Katerji, N., Mastrorilli, M., & Rana, G. (2008). Water use efficiency of crops cultivated in the
Mediterranean region: review and analysis. European Journal of Agronomy, 28(4), 493-507.
Kumar, M. D., Foster, J. D., Saleth, R. M., Singh, O. P., & Sivamohan, M. V. K. (2014).
HUMAN DEVELOPMENT, INCLUSIVE GROWTH AND POVERTY ALLEVIATION
THROUGH WATER SECURITY: GLOBAL EVIDENCE. (Occasional Paper No. 7-0314)
Retrieved from:
https://www.researchgate.net/profile/Dinesh_M/publication/313441636_Human_Development_I
nclusive_Growth_and_Poverty_Alleviation_through_Water_Security_Global_Evidence/links/58
9ad40ca6fdcc32dbdf0b3b/Human-Development-Inclusive-Growth-and-Poverty-Alleviation-
through-Water-Security-Global-Evidence.pdf
Kelley, C. P., Mohtadi, S., Cane, M. A., Seager, R., & Kushnir, Y. (2015). Climate change in the
Fertile Crescent and implications of the recent Syrian drought. Proceedings of the National
Academy of Sciences, 112(11), 3241-3246.

Page 145 of 166
Laajimi, A., Schroeder, K., Meyers, W., & Binfield, J. (2017). The Tunisia wheat market in the
context of world price volatility: A stochastic partial equilibrium approach. Journal of Food
Products Marketing, 23(4), 367-383.
Laithy, H., Abu-Ismail, K., & Hamdan, K. (2008). Poverty, Growth and Income Distribution in
Lebanon (No. 13). International Policy Centre for Inclusive Growth. pp.25.
Lebidi F. (2004). Project of rural development of the high Béqaa valley: mission report on
irrigation study. Scientific Report. CIHEAM-IAMB, p.59
Le Borgne, Eric; Jacobs, Thomas James. (2016). Lebanon - Promoting poverty reduction and
shared prosperity: systematic country diagnostic. Washington, D.C. : World Bank Group.pp
157.
Lee, D. R., C. B. Barrett, P. Hazell, and D. Southgate. 2001. “Assessing Tradeoffs and Synergies
among Agricultural Intensification, Economic Development and Environmental Goals:
Conclusions and Implications for Policy.” In Tradeoffs or Synergies? Agricultural
Intensification, Economic Development and the Environment, Ch. 24, edited by D. R. Lee and C.
B. Barrett. Wallingford, UK: CABI Publishing.
Leeters, J. (2016). Export Value Chain Analysis-Fresh Fruit and Vegetables Lebanon.
(Publication number: RVO-008-1701/RP-CBI). Retrieved from:
http://www.bureauleeters.nl/data/126-gejt2dqdXvdS/export-value-chain-fruit-vegetables-
lebanon-2016.pdf
Lowder, S. K., Skoet, J., & Singh, S. (2014). What do we really know about the number and
distribution of farms and family farms in the world. Background paper for the State of Food and
Agriculture, 8. (Working Paper No. 14-02) Retrieved from:
https://www.researchgate.net/profile/Sarah_Lowder/publication/261727193_What_do_we_really
_know_about_the_number_and_distribution_of_farms_and_family_farms_in_the_world_Backgr
ound_paper_for_the_State_of_Food_and_Agriculture_2014/links/0a85e53774c4fdc264000000.p
df
Maestre-Valero, J. F., Martínez-Granados, D., Martínez-Alvarez, V., Calatrava, J. (2013). Socio-
Economic Impact of Evaporation Losses from Reservoirs Under Past, Current and Future Water
Availability Scenarios in the Semi-Arid Segura Basin. Water Resources Management 27:1411–
1426.
Makhzoumi, J., Talhouk, S., Zurayk, R., & Sadek, R. (2012). Landscape approach to bio-cultural
diversity conservation in rural Lebanon. In Perspectives on Nature Conservation-Patterns,
Pressures and Prospects. Prof. John Tiefenbacher (Ed.), InTech. p.179-198.

Page 146 of 166
Mandour, M. A., & Hakim, T. A. (1995). Egyptian agriculture: Its characteristics, historical
development and current challenges. Options Mediterraneennes. Serie B: Etudes et Recherches
(CIHEAM). no. 9.
Ministry of Agriculture (MoA). (2003). National Action Plan to Combat Desertification. Beirut.
Lebanon.
Ministry of Agriculture (MoA). (2010). Strategy for the Advancement of the Agricultural Sector
2010-2014. Lebanon, Internal Report, pp.41 (in Arabic).
Ministry of Agriculture (MoA). (2012). Résultat Globaux du Module de Base du Recensement
de L’Agriculture 2010. Beirut. Lebanon. Internal Report, p.187.
Ministry of Agriculture (MoA). (2014). Ministry’s Strategy 2015-2019. Lebanon, Internal
Report, pp.78 (in Arabic).
Ministry of Economy and Trade (MoET). 2010. Tobacco Newsletter. Issue No.6. Beirut,
Lebanon, p.7.
Ministry of Economy and Trade (MoET). 2017.
http://www.economy.gov.lb/index.php/serviceSubCat/1/13. Accessed on 14 August 2017.
Ministry of Energy and Water (MoEW). (2010). National Water Sector Strategy. Beirut. pp.103
Ministry of Environment, United Nations Development Program, ECODIT
(MOE/UNDP/ECODIT). (2011). State and Trends of the Lebanese Environment. pp. 353.
Ministry of Finance (MoF). (2012). Wheat and Bread Subsidies Policies: 2007 – 2011. Thematic
Reports. Lebanon.
Ministry of Social Affairs (MoSA). (2008). Mapping of Human Poverty and Living Conditions
in Lebanon 2004. Beirut, Lebanon, pp. 308 (in Arabic).
Minot, N., Chemingui, M. A., Thomas, M., Dewina, R., & Orden, D. (2010). Trade liberalization
and poverty in the Middle East and North Africa. International Food Policy Research Institute
Washington, USA.
Morill, J and Simas,J. (2009). Comparative Analysis of Water Laws in MNA Countries. In:
“Water in the Arab World: Management Perspectives and Innovations”, edited by Jagannathan,
NV et al. The International Bank of Reconstruction and Development/The World Bank. p 285-
334.
Nakkash, R. and Al Kadi, L., 2014. Support for tobacco control research, dissemination and
networking: final technical report. IDRC Project Number: 105792. Beirut, Lebanon, p.121.

Page 147 of 166
Norman, P., & Smith, L. (1995). The theory of planned behaviour and exercise: An investigation
into the role of prior behaviour, behavioural intentions and attitude variability. European Journal
of Social Psychology, 25(4), 403-415.
Perry, C. J. (2001). Charging for irrigation water: The issues and options, with a case study from
Iran (Vol. 52). IWMI, pp 17.
Pfeiffer, L., & Lin, C. Y. C. (2014). Does efficient irrigation technology lead to reduced
groundwater extraction? Empirical evidence. Journal of Environmental Economics and
Management, 67(2), 189-208.
Raz, A. E. (2012). Successful implementation of large-scale drip irrigation projects: an
exploratory study of the socio-economic impact of the APMIP among smallholders in India. In
International CIPA Conference 2012 on Plasticulture for a Green Planet 1015 (pp. 283-294).
Régie Libanaise des Tabacs et Tombacs. 2017. http://www.rltt.com.lb. Accessed on August 17,
2017. In Arabic.
Ruiz-Martinez, I., Marraccini, E., Debolini, M., & Bonari, E. (2015). Indicators of agricultural
intensity and intensification: a review of the literature. Italian Journal of Agronomy, 10(2), 74-
84.
Salti, N., Chaaban, J., Nakkash, R. and Alaouie, H., 2013. The effect of taxation on tobacco
consumption and public revenues in Lebanon. Tobacco control, pp.tobaccocontrol-2012.
Sauer, T., Havlík, P., Schneider, U. A., Schmid, E., Kindermann, G., & Obersteiner, M. (2010).
Agriculture and resource availability in a changing world: The role of irrigation. Water
Resources Research, 46(6).
Schlueter, M., McAllister, R. R. J., Arlinghaus, R., Bunnefeld, N., Eisenack, K., Hoelker, F., ...
& Stöven, M. (2012). New horizons for managing the environment: A review of coupled social‐
ecological systems modeling. Natural Resource Modeling, 25(1), 219-272.
Selvaraju, R. (2013). Implications of climate change for agriculture and food security in the
Western Asia and Northern Africa region. In M.V.K. Sivakumar, R. Lal, R. Selvaraju & I.
Hamdan (Eds.), Climate Change and Food Security in West Asia and North Africa (pp. 27-51).
Springer Netherlands.
Shaban, A., Darwich, T., & El Hage, M. (2013). Studying Snowpack-Related Characteristics on
Lebanon Mountains. International Journal of Water Sciences, 2. p.1-10.
Smith, B. D. and Nesbitt, M. 1995. The Emergence of Agriculture. Scientific American Library.
New York. pp. 232.

Page 148 of 166
Sowers, J., Vengosh, A., & Weinthal, E. (2011). Climate change, water resources, and the
politics of adaptation in the Middle East and North Africa. Climatic Change, 104(3), 599-627.
Souissi, I., Boisson, J. M., Mekki, I., Therond, O., Flichman, G., Wery, J., & Belhouchette, H.
(2017). Impact assessment of climate change on farming systems in the South Mediterranean
area: a Tunisian case study. Regional Environmental Change, 1-14.
Springer, N. P., & Duchin, F. (2014). Feeding nine billion people sustainably: conserving land
and water through shifting diets and changes in technologies. Environmental science &
technology, 48(8), 4444-4451.
Tayebi, Z. (2014). Agricultural Productivity in the Greater Middle East. (Unpublished master's
thesis) University of Nebraska, Lincoln, Nebraska.
United Nations. (2014). Open Working Group of the General Assembly on Sustainable
Development Goals. Issued as document A/68/970. (Available at http://undocs. org/A/68/970).
(Accessed on May 2nd 2015).
Verner, D. (Ed.). (2012). Adaptation to a changing climate in the Arab countries: a case for
adaptation governance and leadership in building climate resilience. World Bank Publications.
Ward, F. A., & Pulido-Velazquez, M. (2012). Economic costs of sustaining water supplies:
findings from the Rio Grande. Water resources management, 26(10), 2883-2909.
Womach, J., 1995. Tobacco price support: an overview of the program. Congressional Research
Service, Library of Congress.
World Bank. (2003). Republic of Lebanon: Policy Note on Irrigation Sector Sustainability.
Report No. 28766 – LE. Washington DC. pp. 89.
World Bank. (2010a). Lebanon Agriculture Sector Note: Aligning Public Expenditures with
Comparative Advantage. Report No. 68792 Washington DC.pp.27
World Bank. (2010b). Republic of Lebanon Water Sector: Public Expenditure Review. Report
No. 52024-LB. Washington DC. pp. 86.
World Bank. (2014). Turn down the heat: confronting the new climate normal. World Bank
Publications.
World Bank. (2017). Lebanon: GNI per capita. Retrieved August 26, 2017 from:
http://data.worldbank.org/country/lebanon
Yau, S. K., & Ryan, J. (2013). Differential impacts of climate variability on yields of rainfed
barley and legumes in semi-arid Mediterranean conditions. Archives of Agronomy and Soil
Science, 59(12), 1659-1674.

Page 149 of 166

Page 150 of 166
Annex 1
Indicators selection for multi-criteria evaluation
FTtab-y-h Rain-fed
Unit Tobacco Wheat Barley
Area Dn 5.17 1.54 0.05
Price LL/kg 12256 1130 706
Yield Kg 115 113 50
Cost of Production LL/dn 211869 60735 18650
FTtab-y-h Irrigated
Unit Tobacco Wheat Barley
Area Dn 5.17 1.54 0.05
Price LL/kg 12256 1130 706
Yield Kg 115 126 52
Cost of Production LL/dn 211869 60735 18650
Volume of Irrigation
Water m3 248 187
Cost of Irrigation LL/dn 37255 28054
Total Cost LL/dn 97990 46704

Page 151 of 166
Cost of Irrigation
scheme LL/dn 562500 562500
FTtab-o-h Rain-fed
Unité Tabac Blé Orge Pois chiche Oignon Olivier
Area dn 9.01 7 0.15 0.27 0.23 0.27
Price LL/kg 12256 1130 1000 2500 1000 2813
Yield kg 115 108 100 85 110 400
Cost of Production LL/dn 212133 58318 37301 109893 42743 459107
FTtab-o-h Irrigated
Unit Tobacco Wheat Barley Chickpeas Onion Olives
Area dn 9.01 7 0.15 0.27 0.23 0.27
Price LL/kg 12256 1130 1000 2500 1000 2813
Yield kg 115 121 103 114 111 491
Cost of Production LL/dn 212133 58318 37301 109893 42743 459107
Volume of Irrigation
Water m3 248 187 334 30 327
Cost of Irrigation LL/dn 37255 28054 50139 4443 48979
Total Cost LL/dn 95572 65355 160031 47186 508086

Page 152 of 166
Cost of Irrigation scheme LL/dn
56250
0
56250
0 562500 562500 562500
FTmix-y-l Rain-fed
Unit Tobacco Wheat Barley Chickpeas Potato Apples Cherries
Area Dn 5.6 1.33 0.93 0.53 0.27 2.53 0.93
Price LL/kg 1130 600 2500 800 1000 1000 1800
Yield Kg 296 317 75 600 500 300 2250
Cost of Production LL/dn 159475 118119 96964 233143 107262 116621 2246129
FTmix_y_l Irrigated
Unit Tobacco Wheat Barley Chickpeas Potato Apples Cherries
Area dn 5.6 1.33 0.93 0.53 0.27 2.53 0.93
Price LL/kg 1130 600 2500 800 1000 1000 1800
Yield kg 330 327 101 607 714 1015 2835
Cost of Production LL/dn 159475 118119 96964 233143 107262 116621 2246129
Volume of Irrigation Water m3 248 187 334 30 458 642 122
Cost of Irrigation LL/dn 37255 28054 50139 4443 68647 96308 18276
Total Cost LL/dn 196730 146173 147103 237586 175909 212929 2264404
Cost of Irrigation scheme LL/dn 562500 562500 562500 562500 750000 300000 450000

Page 153 of 166
FTmix-o-l Rain-fed
Unit Wheat Barley Chickpeas Potato Apples Cherries Peach
Area Dn 13.24 0.36 2.41 3.13 3.61 0.36 0.12
Price LL/kg 1130 5000 2500 1000 1000 1800 2000
Yield Kg 153 138 50 1000 515 2250 1000
Cost of Production LL/dn 82358 51289 64643 214524 200199 2246129 518314
FTmix_o_l Irrigated
Unit Wheat Barley Chickpeas Potato Apples Cherries Peach
Area Dn 13.24 0.36 2.41 3.13 3.61 0.36 0.12
Price LL/kg 1130 5000 2500 1000 1000 1800 2000
Yield Kg 170 142 67 1429 1742 2835 2036
Cost of Production LL/dn 82358 51289 64643 214524 200199 2246129 518314
Volume of Irrigation
Water m3 248 187 334 458 642 122 392
Cost of Irrigation LL/dn 37255 28054 50139 68647 96308 18276 58755
Total Cost LL/dn 119613 79343 114781 283171 296507 2264404 577070
Cost of Irrigation scheme LL/dn 562500 562500 562500 750000 300000 450000 675000
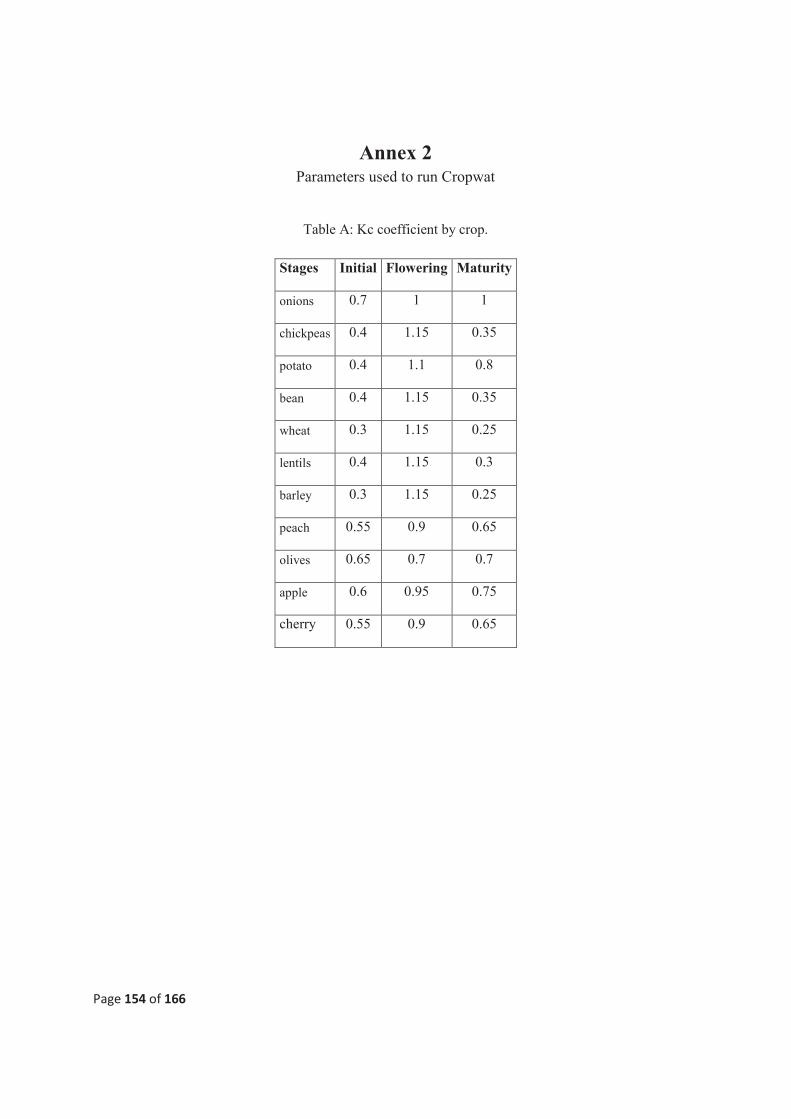
Page 154 of 166
Annex 2
Parameters used to run Cropwat
Table A: Kc coefficient by crop.
Stages Initial Flowering Maturity
onions 0.7 1 1
chickpeas 0.4 1.15 0.35
potato 0.4 1.1 0.8
bean 0.4 1.15 0.35
wheat 0.3 1.15 0.25
lentils 0.4 1.15 0.3
barley 0.3 1.15 0.25
peach 0.55 0.9 0.65
olives 0.65 0.7 0.7
apple 0.6 0.95 0.75
cherry 0.55 0.9 0.65

Page 155 of 166
Table B: Crop phonological stages
Crops
Phenological stages (day) sowing date
Stages Initial Growth flowering Maturity
onions 25 30 10 5 70 15-oct
chickpeas 15 40 30 35 120 01-march
potato 25 30 35 30 120 15-march
bean 15 25 35 20 95 15-Jun
wheat 30 140 40 30 240 15-nov
lentils 20 85 15 20 140 01-jan
barley 10 120 45 30 205 20-nov
peach 239 60 46 20 365 21-jun
olives 91 91 137 46 365 01-nov
apple 202 61 82 20 365 11-aug
cherry 239 60 46 20 365 21-jun

Page 156 of 166
Table C- rooting depth, soil water depletion and crop height in mid-season for the main crops in the study
villages.
Crops Rooting depth (m) soil water depletion Crop height in mid-season (m)
onions 0.45 0.3 0.3
chickpeas 0.8 0.5 0.4
potato 0.5 0.35 0.6
bean 0.75 0.45 0.4
wheat 1.65 0.55 1
lentils 0.7 0.5 0.5
barley 1.25 0.55 1
peach 1 0.5 3
olives 1.5 0.65 3
apple 1 0.5 4
cherry 1 0.5 3

Page 157 of 166
Table D: Ky coefficient
Crops Stages flowering grain filling maturity Total
onions 0.45 0 0.8 0.3 1.1
chickpeas 0.2 0.9 0.7 0.2 1.15
potato 0.8 0 0.7 0.2 1.1
bean 0.2 1.1 0.75 0.2 1.15
wheat 0.2 0.6 0.5 0 1
lentils 0.9 0.9 0.9 0.9 0.9
barley 0.047 0.05 1.17 0.24 1.5
peach 0 0.52 0.7 0.7 1.92
olives 0 0.48 0.3 0.3 1.08
apple 0 0.52 0.53 0.19 1.24
Cherry 0 0.52 0.7 0.7 1.92

Page 158 of 166
Annex 3
Figure A: CAP analysis

Page 159 of 166
Figure B: correlation circle.
Figure C: Correlation histogram

Page 160 of 166
Annex 4
Model code for one farm type as an example.
$Ontext
Nom Modèle d'exploitation type FTtab_y_h
location Quenanine (Liban)
Description modèle de programmation linéaire
Type LP
Notes
Baseline (disponibilité en eau =0)
Scénario irrigation avec l'introduction d'activités aleternatives
en irrigué + une disponibilité en eau annuelle = 250 m3/an
Auteur SOUISSI imen
Date Mars 20012
Include une loop pour varier le niveau des prix de l'eau
$Offtext
*~~~~~~~~~~~~~~~Donnees~~~~~~~~~~~~~~~~~~~~~~~~~~~~~~~~~~~~~~~~~~~~~~~~~~~~~~~~~
sets
C cultures presentes sur l'exploitation
/Tobacco, Wheat, Barley,Eggplan,Garlic,Caulifl
Cucumbe,Fababea,Waterme, Lupine, Vech, Carrot, Zuchini, Melon, Radish,Tomato/
Ca(c) cultures annuelles
/Tobacco, Wheat, Barley,Eggplan,Garlic,Caulifl,Cucumbe,Waterme
Carrot,Zuchini,Melon,Radish,Tomato/
cc(c) cultures cerealières
/Wheat, Barley/

Page 161 of 166
Cm(c) cultures marichères
/Eggplan,Garlic,Caulifl,Cucumbe,Waterme,Carrot,Zuchini,Melon,Radish,Tomato,Vech/
LG(c) légumineuses
/Fababea,Lupine/
ITK dose d irrigation/T1 rainfed,T2 irrigated/
IT iterations
/IT1*IT10/
scalar
ED volume d'eau disponible par exploitation m3 /0/
PEau prix de l'eau par m3 livres libanaises /150/
WD travail disponible en h /10000/
TD terre disponible en dunums /7/
parameter
PE (It) introduite une variabilité sur le prix de l'eau
/it1 0.8
IT2 0.9
IT3 1
IT4 1.1
IT5 1.2
IT6 1.3
IT7 1.4
IT8 1.5
IT9 1.6
IT10 1.7/
;
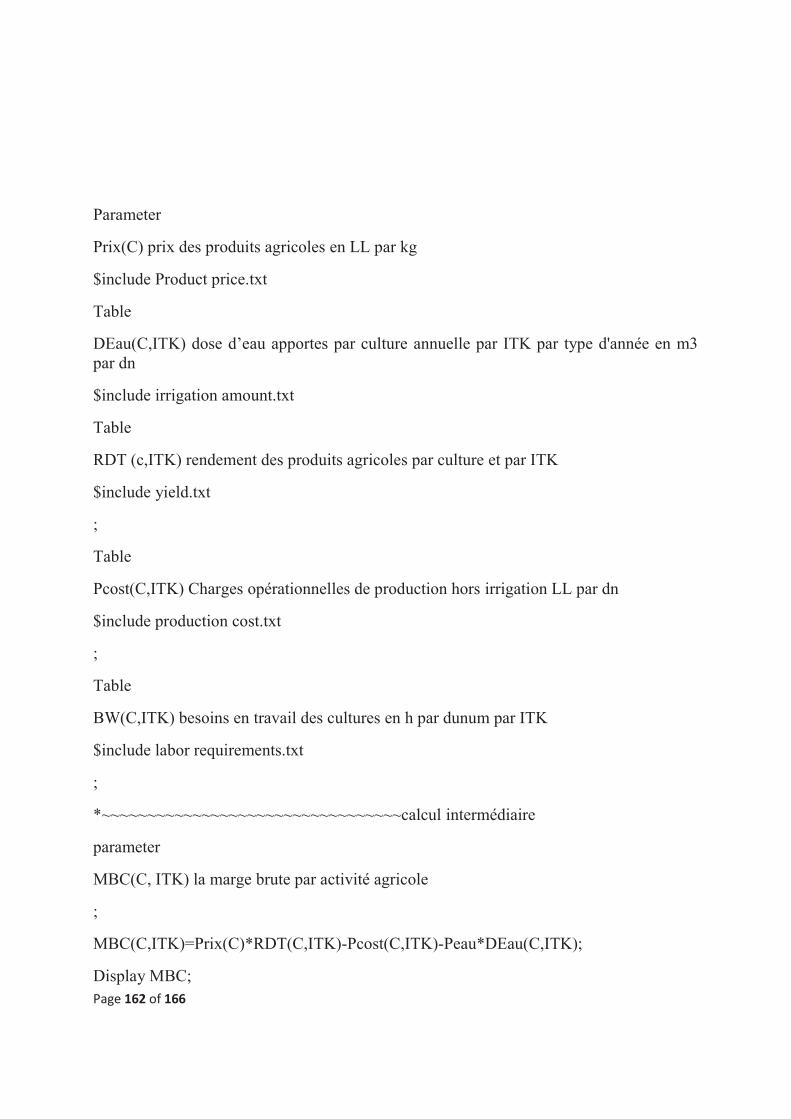
Page 162 of 166
Parameter
Prix(C) prix des produits agricoles en LL par kg
$include Product price.txt
Table
DEau(C,ITK) dose d’eau apportes par culture annuelle par ITK par type d'année en m3 par dn
$include irrigation amount.txt
Table
RDT (c,ITK) rendement des produits agricoles par culture et par ITK
$include yield.txt
;
Table
Pcost(C,ITK) Charges opérationnelles de production hors irrigation LL par dn
$include production cost.txt
;
Table
BW(C,ITK) besoins en travail des cultures en h par dunum par ITK
$include labor requirements.txt
;
*~~~~~~~~~~~~~~~~~~~~~~~~~~~~~~~~~calcul intermédiaire
parameter
MBC(C, ITK) la marge brute par activité agricole
;
MBC(C,ITK)=Prix(C)*RDT(C,ITK)-Pcost(C,ITK)-Peau*DEau(C,ITK);
Display MBC;

Page 163 of 166
*~~~~~~~~~~~~~~~~~~~~~~~~modele~~~~~~~~~~~~~~~~~~~~~~~~~~~~~~~~~~~~
variables
Z revenu total en LL
;
positive variables
X superficie par culture par technique et par type d'année en dn
*~~~~~~~~~~~~~~~~~~~~~~~~equation~~~~~~~~~~~~~~~~~~~~~~~~~~~~~~~~~~~
equation
Objectif fonction objectif
Terre contrainte terre
Travail contrainte travail
Eau contrainte eau
rotcereales
rotlegumes
Rotmaraichage
;
Objectif..sum((c,itk),Prix(C)*RDT(C,ITK)*X(C,ITK)-Pcost(C,ITK)*X(C,ITK)-Peau*DEau(C,ITK)*X(C,ITK)) =E=Z;
Terre..sum((C,ITK),X(C,ITK))=l=TD;
Travail..sum((C,ITK),BW(C,ITK)*X(C,ITK))=l=WD;
Eau..sum((C,ITK),DEau(C,ITK)*X(C,ITK))=l=ED;
rotcereales..sum((cc,itk),x(cc,ITK))=g= sum((Ca,itk),X(Ca,ITK))*0.42;
rotlegumes..sum((LG,itk),x(LG,ITK))+sum((CM,itk),x(CM,ITK))=g= sum((Ca,itk),X(Ca,ITK))*0.025;
Rotmaraichage..sum((CM,itk),x(CM,ITK))=l= sum((Ca,itk),X(Ca,ITK))*0.013;

Page 164 of 166
*~~~~~~~~~~~Solution~~~~~~~~~~~~~~~~~~~~~~~~~~~~~~~~~~~~~~~~~~~~~~~~
model FTtab_y_h modele de programmation linéaire /all/;
Parameter result1 (*,*);
Parameter result2 (*,*);
Parameter result3 (*,*);
Parameter result4 (*,*);
Parameter result5 (*,*);
Parameter result6 (*,*);
Parameter result7 (*,*);
Parameter result8 (*,*);
$libinclude xldump
solve FTtab_y_h using LP maximizing Z;
Result1('marge','Totat')= Z.l;
Result2('assol','Totat')= sum((c,itk),x.l(c,itk));
Result3(c,itk)= x.l(c,itk);
Result4('assol','T1')= sum((c),x.l(c,'T1'));
Result5('assol','T2')= sum((c),x.l(c,'T2'));
Result6('SAU','irrigué')= sum((c),x.l(c,'T2'))*100/sum((c,itk),x.l(c,itk));
Result7('eau','total')= Eau.L;
Result8('valorisation','eau')$(Result7('eau','total')ne 0)= Z.l/Result7('eau','total');
Display result1, result2, result3, result4, result5, result6, result7, result8;
$libinclude xldump result1 FTtab_y_h_baseline Marge_total
$libinclude xldump result2 FTtab_y_h_baseline Sup_total
$libinclude xldump result3 FTtab_y_h_baseline Sup_culture_itk
$libinclude xldump result4 FTtab_y_h_baseline Sup_rainfed

Page 165 of 166
$libinclude xldump result5 FTtab_y_h_baseline Sup_irrigated
$libinclude xldump result6 FTtab_y_h_baseline Pourcentage_irrigated
$libinclude xldump result7 FTtab_y_h_baseline Eau_total
$libinclude xldump result8 FTtab_y_h_baseline valo_eau