Embed Size (px)
Citation preview

Finding Rigorous Thermodynamic Model parameters for
the Simulation of a Reactive Distillation Column: Case of
ETBE Production
Gisela N. Durruty, M. Soledad Diaz, Patricia M. Hoch*
Universidad Nacional del Sur, Chemical Engineering Department, Planta Piloto de Ingeniería
Química, 8000 Bahía Blanca, ARGENTINA
{gdurruty, sdiaz, p.hoch}@plapiqui.edu.ar
Abstract.
A model for a reactive distillation column for ETBE production was devel-
oped using both a rigorous thermodynamic model (UNIFAC) and hydraulic
constrains. The thermodynamic model included an activity coefficient approach
for the liquid phase, UNIFAC, and ideal gas approximation for the vapor phase.
The binary interaction parameters of UNIFAC were improved to better predict
the equilibrium in the column. The binary interaction parameters were estimat-
ed using experimental data taken from literature.
Keywords: Reactive distillation, ETBE, thermodynamics.
1 Introduction
Reactive distillation (RD) is an example of process intensification. Instead of per-
forming the reaction step in a reactor and the separation in a distillation column, the
proposed RD-device consists basically of a section where the reaction takes place and
a rectifying and/or a stripping section above/below the reactive section. There are a
number of benefits related to this scheme, for example that products are constantly
removed from the reaction section, increasing the conversion of reactants because the
products are constantly extracted, and also because products are constantly withdrew,
avoids reaching azeotropic concentrations where applicable. Energy integration is
also achieved, especially in cases in which the reaction is exothermic, using the reac-
tion energy to evaporate the liquid phase. Thus, RD reduces capital investment and
operational costs [1, 2].
ETBE has been considered to replace MTBE as a fuel oxygenate because of the for-
mer’s superior qualities as an octane enhancer. Because ETBE is less soluble in water
than MTBE, it use as fuel additive also minimizes groundwater contamination due to
leakage of containing underground fuel vessels. Besides, ETBE can be produced from
renewable sources, such as bio-ethanol, cellulose, biomass or other farm products [3].
ETBE synthesis can be efficiently carried out through reactive distillation to achieve
3º Simposio Argentino de Informatica Industrial, SII 2014
43 JAIIO - SII 2014 - ISSN: 2313-9102 - Página 185

high conversion and low capital and operating costs. The conventional process for
ETBE synthesis basically consists of pre-treatment of the C4 hydrocarbon feed flow,
reaction, purification, and recovery of non-reacted products [4], which renders high
capital and operating costs. The design of RD for ETBE synthesis, requiring good
kinetic models integrated to reliable thermodynamic predictions still requires further
analysis and it was not thoroughly explored in literature yet.
In this paper, the main objective is to devise adequate thermodynamic models for
better predicting the behavior of the mixtures ETBE-ethanol-isobutene-butane, with
the final purpose of optimizing the operation of the reactive distillation column.
2 Model Description
The RD unit is modeled with MESH equations (Mass, Equilibrium, Summation,
Enthalpy) with a rigorous thermodynamic activity model for the liquid phase
(UNIFAC) and an ideal gas approximation for the vapor phase. With data taken from
literature, the binary interaction parameters of UNIFAC, anm, were adjusted to better
predict the equilibrium. The predictions were made within GAMS [5] and results
were compared with data and with results obtained from tabulated parameters [6], as
shown in the Numerical Results section.
3 Thermodynamic Model
3.1 UNIFAC
(1)
– (2)
(3)
– – (4)
(5)
(6)
(7)
(8)
– (9)
3º Simposio Argentino de Informatica Industrial, SII 2014
43 JAIIO - SII 2014 - ISSN: 2313-9102 - Página 186

(10)
(11)
– – – (12)
Where z=10. Rj and Qj are group surface area and volume contributions, respec-
tively, and am,n is a group interaction parameter [6]. υij is the number of occurrences of
group j in molecule i. Eq. (4) is also valid for ln Γine,d,j.
UNIFAC and the ideal gas approximation are related to each other in the equilibri-
um calculations in each stage of the column.
3.1.1 Parameters estimation
The parameter estimation was performed within GAMS.
In the equilibrium, the isofugacity criteria between the two phases must be satis-
fied, then
(13)
Eq. (13) is calculated for each pair of experimental data x-y taken at each PEXP
. The
objective function is then
OF= (14)
After parameters are estimated, bubble point calculations are performed to predict
the equilibrium. These calculations are also made with tabulated parameters. Then,
standard percent relative deviation in pressure P, σP (Eq. (15)), and standard percent
deviation in mole fraction y1, σy (Eq. (16)), are calculated to compare results.
(15)
(16)
3º Simposio Argentino de Informatica Industrial, SII 2014
43 JAIIO - SII 2014 - ISSN: 2313-9102 - Página 187
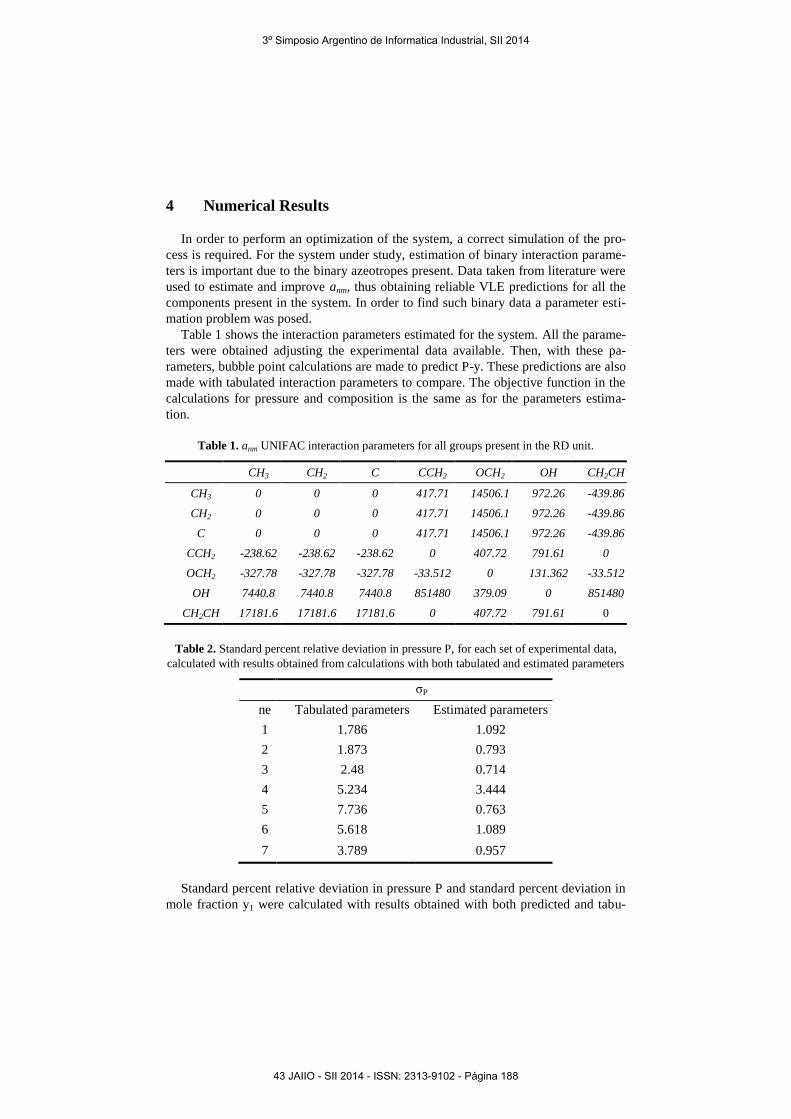
4 Numerical Results
In order to perform an optimization of the system, a correct simulation of the pro-
cess is required. For the system under study, estimation of binary interaction parame-
ters is important due to the binary azeotropes present. Data taken from literature were
used to estimate and improve anm, thus obtaining reliable VLE predictions for all the
components present in the system. In order to find such binary data a parameter esti-
mation problem was posed.
Table 1 shows the interaction parameters estimated for the system. All the parame-
ters were obtained adjusting the experimental data available. Then, with these pa-
rameters, bubble point calculations are made to predict P-y. These predictions are also
made with tabulated interaction parameters to compare. The objective function in the
calculations for pressure and composition is the same as for the parameters estima-
tion.
Table 1. anm UNIFAC interaction parameters for all groups present in the RD unit.
CH3 CH2 C CCH2 OCH2 OH CH2CH
CH3 0 0 0 417.71 14506.1 972.26 -439.86
CH2 0 0 0 417.71 14506.1 972.26 -439.86
C 0 0 0 417.71 14506.1 972.26 -439.86
CCH2 -238.62 -238.62 -238.62 0 407.72 791.61 0
OCH2 -327.78 -327.78 -327.78 -33.512 0 131.362 -33.512
OH 7440.8 7440.8 7440.8 851480 379.09 0 851480
CH2CH 17181.6 17181.6 17181.6 0 407.72 791.61 0
Table 2. Standard percent relative deviation in pressure P, for each set of experimental data,
calculated with results obtained from calculations with both tabulated and estimated parameters
σP
ne Tabulated parameters Estimated parameters
1 1.786 1.092
2 1.873 0.793
3 2.48 0.714
4 5.234 3.444
5 7.736 0.763
6 5.618 1.089
7 3.789 0.957
Standard percent relative deviation in pressure P and standard percent deviation in
mole fraction y1 were calculated with results obtained with both predicted and tabu-
3º Simposio Argentino de Informatica Industrial, SII 2014
43 JAIIO - SII 2014 - ISSN: 2313-9102 - Página 188

lated parameters to compare. Table 2 and 3 show that in each experience but number
6, in σy, deviations are lower (results obtained with estimated parameters).
Table 3. Standard percent deviation in mole fraction y1, for each set of experimental data,
calculated with results obtained from calculations with both tabulated and estimated parameters
σy
ne.i Tabulated parameters Estimated parameters
1.Ethanol 6.474 5.128
2.Ethanol 8.511 4.619
3.Ethanol 11.457 7.269
4.Isobutene 4.889 2.103
5.Isobutene 11.416 8.2
6.n-butene 3.697 4.016
7.Isobutene 3.736 2.955
Figure 1. Ethanol (1) and ETBE (2) equilibrium. ▪ and ● equilibrium data for liquid and vapor
phase, respectively [8]. ─ Prediction with calculated parameters. - - - Prediction with tabulated
parameters.
15
20
25
30
35
0 0,2 0,4 0,6 0,8 1
P [
kPa]
x-y (1)
T=313.15K
3º Simposio Argentino de Informatica Industrial, SII 2014
43 JAIIO - SII 2014 - ISSN: 2313-9102 - Página 189

Figure 2. Ethanol (1) and ETBE (2) equilibrium. ♦ and ▲ equilibrium data for liquid and vapor
phase, respectively [8]. ─ Prediction with calculated parameters. - - - Prediction with tabulated
parameters.
Figure 3. Ethanol (1) and ETBE (2) equilibrium. ▪ and ● equilibrium data for liquid and vapor
phase, respectively [8]. ─ Prediction with calculated parameters. - - - Prediction with tabulated
parameters.
40
45
50
55
60
65
70
75
80
85
0 0,2 0,4 0,6 0,8 1
P [
kPa]
x-y (1)
T=333.15K
105
115
125
135
145
155
165
0 0,2 0,4 0,6 0,8 1
P [
kPa]
x-y (1)
T=353.15K
3º Simposio Argentino de Informatica Industrial, SII 2014
43 JAIIO - SII 2014 - ISSN: 2313-9102 - Página 190

Figure 4. Isobutene (1) and ETBE (2) equilibrium. ▲ and ● equilibrium data for liquid and
vapor phase, respectively [9]. ─ Prediction with calculated parameters. - - - Prediction with
tabulated parameters.
Figure 5. Isobutene (1) and ETBE (2) equilibrium. ▪ and ♦ equilibrium data for liquid and
vapor phase, respectively [10]. ─ Prediction with calculated parameters. - - - Prediction with
tabulated parameters.
0
100
200
300
400
500
600
700
0 0,2 0,4 0,6 0,8 1
P [
kPa]
x-y (1)
T=323.15K
100
300
500
700
900
1100
1300
1500
1700
1900
0 0,2 0,4 0,6 0,8 1
P [
kPa]
x-y (1)
T=373.15K
3º Simposio Argentino de Informatica Industrial, SII 2014
43 JAIIO - SII 2014 - ISSN: 2313-9102 - Página 191

Figure 6. Butene(1) and Ethanol (2) equilibrium. ▪ and ♦ equilibrium data for liquid and vapor
phase, respectively [10]. ─ Prediction with calculated parameters. - - - Prediction with tabulated
parameters.
Figure 7. Isobutene (1) and Ethanol (2) equilibrium. ▲ and ● equilibrium data for liquid and
vapor phase, respectively [11]. ─ Prediction with calculated parameters. - - - Prediction with
tabulated parameters.
Figures 1 to 7 show the good agreement between the proposed thermodynamic
model and experimental data. They also show the comparison between predicted P-y
0
100
200
300
400
500
600
700
0 0,2 0,4 0,6 0,8 1
P [
kPa]
x-y (1)
T=326.15K
0
100
200
300
400
500
600
700
0 0,2 0,4 0,6 0,8 1
P [
kPa]
x-y (1)
T=323.15K
3º Simposio Argentino de Informatica Industrial, SII 2014
43 JAIIO - SII 2014 - ISSN: 2313-9102 - Página 192

with tabulated and estimated parameters and how the new parameters better predict
the phase equilibrium of the binaries present in the reactive column.
Errors were more noticeable for the system isobutene-ETBE (Figures 4 and 5).
Highest error is about 5.6 % which remains well below experimental error.
From Figures 6 and 7 it can be seen that experimental data for lower liquid compo-
sitions in the system isobutene-ethanol are unavailable, although the prediction for
available compositions is very accurate.
The full set of equations representing the reactive distillation system can now be
solved, within a nonlinear programming environment such as GAMS, minimizing the
total costs, in order to obtain a feasible design at the minimum cost.
5 Conclusions
In this work, a full set of interaction parameters for a quaternary system ETBE-
Ethanol-Isobutene-Butane is found by posing a nonlinear programming problem that
minimizes the residuals. The model of the column is then implemented in GAMS,
including rigorous thermodynamic model and hydraulic constraints. The main contri-
bution of this work is the prediction of an important set of parameters required for
simulating this system, which were unavailable in literature.
Reactive distillation poses an important challenge for process control [12], and
ETBE production using these systems still constitutes an application yet not thorough-
ly explored [13]. These aspects will be addressed in future work, within a dynamic
optimization environment.
6 Nomenclature
Subindexis
i,k: molecule
j,m,n: group
ne= 1..7: number of set of experimental data
d: number of experimental data in each set
UNIFAC
γne,d,i: activity coefficient
γC
ne,d,i: combinatorial contribution
γR
ne,d,i: residual contribution
υij: number of group of kind j in molecule i
Гne,d,j: residual activity coefficient of group j in a solution
Гine,d,j: residual activity coefficient of group j in a reference solution containing
only molecules of type i
Φne,d,i: molecular volume fraction
Θne,d,i: molecular surface area fraction
Xne,d,i: mol fraction of molecule i
3º Simposio Argentino de Informatica Industrial, SII 2014
43 JAIIO - SII 2014 - ISSN: 2313-9102 - Página 193

qi: van der Waals surface area
ri: van der Waals volume
Qj: group surface area parameter
Rj: group volume parameter
Θne,d,m: group surface area fraction
Xne,d,m: group fraction
Ψne,d,m,j: parameter
an,m: group interaction parameter
Tne: temperature of set of experimental data ne
Parameters estimation
PCALC
ne,d: calculated pressure for datum d, in set of experimental data ne
PV
ne,i: vapor pressure of molecule i at Tne
PEXP
ne,d: experimental pressure for datum d, in set of experimental data ne
σP: standard percent relative deviation in pressure P
σy: standard percent deviation in mole fraction y1
Nne: number of points in set of experimental data ne
7 Acknowledgments
Authors greatly acknowledge CONICET, ANPCyT and Universidad Nacional del
Sur for supporting their work through grants PIP 2011 11220110101078 (2013-2015),
PICT 2012-2469 and PGI 24/M125 respectively.
8 References
1. Sharifzadeh, M. Implementation of a steady-state inversely controlled process model for
integrated design and control of an ETBE reactive distillation. Chemical Engineering sci-
ence 92 (2013) 21-39
2. Thiel, C., Sundmacher, K., Hoffmann, U. Synthesis of ETBE: Residue curve maps for the
heterogeneously catalyzed reactive distillation process. Chemical Engineering Journal 66
(1997) 181-191.
3. Yee, K.F., Mohamed, A.R., Tan, S.H. A review on the evolution of ethyl tert-butyl ether
(ETBE) and its future prospects. Renewable and Sustainable Energy Reviews 22 (2013)
604-620.
4. L. Domingues, L., Pinheiro, C. I. C., Oliveira, N. M. C., Fernandes, J., & Vilelas, A..
Model Development and Validation of Ethyl tert-Butyl Ether Production Reactors Using
Industrial Plant Data. Industrial and Engineering Chemistry Research, 51 (2012) 15018–
15031.
5. Brooke, Kendrick, Meerhaus, Raman. GAMS 24.0 User Guide. (2013)
6. Pretel, E. The UNIFAC library. (1997)
7. Al-Arfaj, M.A., Luyben, W.L. Control study of ethyl tert-butyl ether reactive distillation.
Ind. Eng. Chem. Res. 41 (16) (2002) 3784–3796.
3º Simposio Argentino de Informatica Industrial, SII 2014
43 JAIIO - SII 2014 - ISSN: 2313-9102 - Página 194

8. K. Kammerer, S. Schnabel, D. Silkenbaumer, R. N. Lichtenthaler. Vapor – liquid equilib-
ria of binary mixtures containing an alcohol and a branched ether. Experimental results
and modeling, Fluid Phase Equilibria, 162 (1999) 289–301.
9. A. Leu, D. B. Robinson, A. Tg, 1999, Vapor-Liquid Equilibrium for Four Binary Systems.
Journal of Chemical Enginnering data, 44, 398–400.
10. M. Laakkonen, J.-P. Pokki, P. Uusi-Kyyny, J. Aittamaa. Vapour–liquid equilibrium for the
1-butene + methanol, + ethanol, + 2-propanol, + 2-butanol and + 2-methyl-2-propanol
systems at 326 K, Fluid Phase Equilibria, 206, 1-2 (2003) 237–252.
11. T. Ouni, P. Uusi-Kyyny, J.-P. Pokki, J. Aittamaa. Isothermal vapour liquid equilibrium for
binary 2-methylpropene+methanol to butanol systems, Fluid Phase Equilibria, 232, 1-2
(2004) 90–99.
12. Nikacevic, N. M., Huesman, A. E. M., Van Den Hof, P. M. J., Stankiewicz, A. I. Opportu-
nities and challenges for process control in process intensification. Chemical Engineering
and Processing - Process Intensification, 52 (2011) 1–15.
13. Tian, Y.-C., Zhao, F., Bisowarno, B. H., Tadé, M. O. Pattern-based predictive control for
ETBE reactive distillation. Journal of Process Control, 13(1) (2003) 57–67.
3º Simposio Argentino de Informatica Industrial, SII 2014
43 JAIIO - SII 2014 - ISSN: 2313-9102 - Página 195