Embed Size (px)
Citation preview

Finding Unexpected Insights & Niches with Micro-
Segmentation Research
Webinar: April 23, 2014

4/23/2014 biz.civicscience.com 2
Welcome! Today’s Speakers…
Jennifer SikoraVP of Marketing
CivicScience
Ross McGowanDirector of Data Science
CivicScience

CivicScience provides timely, deep, and predictive research intelligence that supports the entire consumer marketing journey.
• The leading intelligent polling and real-time consumer insights platform: the InsightStore™– Runs on the largest proprietary, syndicated, and independent
consumer survey database• The best talent and leadership in data science & engineering• A loyal base of Fortune 1000 customers in CPG, retail, technology,
healthcare, insurance, financial services, media, public affairs, and more.
4/23/2014 biz.civicscience.com 3
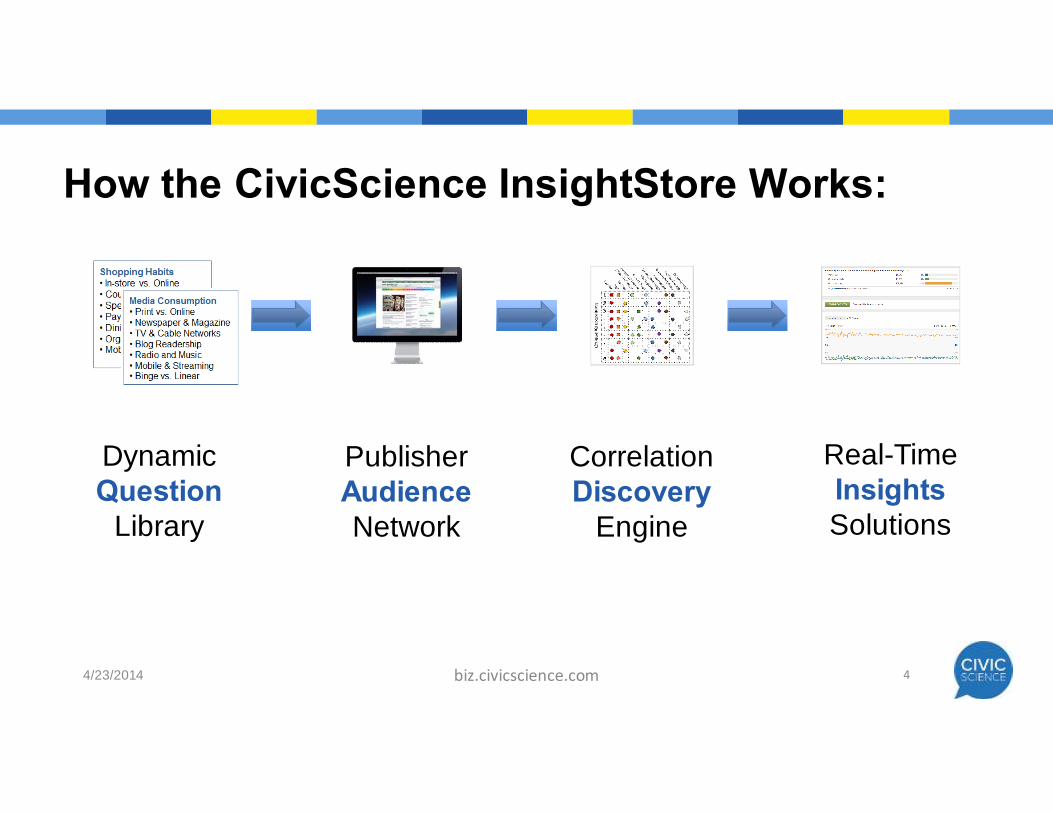
How the CivicScience InsightStore Works:
4/23/2014 4biz.civicscience.com
DynamicQuestion
Library
PublisherAudienceNetwork
CorrelationDiscovery
Engine
Real-TimeInsightsSolutions

We curate and manage an always-on, syndicated survey with up to 5,000 questions at any time. New questions are added every day.
5
Media Consumption• Print vs. Online• Newspaper & Magazine• TV & Cable Networks• Blog Readership• Radio and Music• Mobile & Streaming• Binge vs. Linear
Health and Wellness• Diet and Exercise• Weight and Fitness• Ailments and Treatments• Medical History• Beauty Products• Smoking/Drinking
Shopping Habits• In-store vs. Online• Coupon usage• Spending by category• Payment (credit v. cash)• Dining• Organic / Environmental• Mobile & Tablet
Demographics & Profile• Age, Gender, Race• Education, Income• Parental, Marital Status• Morning / Night Person• Geography • Religion and Family
Entertainment• Movies and TV Shows• Event attendance• Pro & College Sports• Reading genres• Theater and Culture• Cultural Maven Indicators
Personal Finance• Spending/savings• Home ownership• Employment/Type• Insurance and Banking• Economic Outlook• Spending Outlook• Financial Health
Indicators
Technology Usage• Phone and Carrier• Smartphone & OS• Tablets and PCs• Social Media Usage• Search, Web, Text• Gaming & Consoles• Adoption Curve Indicators
Politics & Ideology• Party Affiliation• Issue Positions• Political Behaviors• Civic Engagement• Candidate Preference• Social Cause Affinity• Giving and Volunteering• Environmental Attitudes
4/23/2014 biz.civicscience.com

Hundreds of web and mobile publishers let us poll their users because we help them grow ad sales. Respondents answer just for fun. We aggregate all of that data into one central database of representative, anonymous respondent profiles.
4/23/2014 6biz.civicscience.com

Respondents answer many similar & different questions, appended to a cookie, across multiple sessions. This allows our algorithms to explore millions of cross-tabs.
4/23/2014 7biz.civicscience.com

When we cross everything, we find meaningful and often unexpected stuff…
4/23/2014 biz.civicscience.com 8

Did you know?...
4/23/2014 9biz.civicscience.com

10
Media Consumption: The “Who” and the “How…”
Based on our data, we estimated Netflix’s House of Cards season 2 audience to be between 7.7MM and 8.9MM viewers.
4/23/2014 biz.civicscience.com
The Binge Viewer:• 3X more likely than average to be
age 25 to 34• 2X as likely to be Hispanic• 66% more likely to be a Democrat• 55% more likely to own one or more
cats.
The Episodic Viewer:• 36% more likely than average to be a
Parent• 132% more likely to make over
$125,000 per year in annual income• 220% more likely to regularly
exercise.

About the CivicScience InsightStore
The InsightStore combines our massive “always on” consumer survey database with advanced data science and engineering to give clients access to rapid-turn, meaningful marketing intelligence.ü Demographicsü Psychographicsü Attitudinalü Behavioral
4/23/2014 biz.civicscience.com 11

InsightStoreFast Facts
• 27 million+ anonymous consumer respondent profiles, growing daily.
• Over 600 million responses –hundreds of thousands added daily.
• Over 20,000 different questions asked.
• 70% of respondents have never participated in a paid online panel.
• Over 1,000 leading U.S. brands tracked.
4/23/2014 biz.civicscience.com 12

The InsightStore provides dynamic consumer intelligence for the marketing campaign lifecycle:
4/23/2014 13biz.civicscience.com
Track & Evaluate Identify
Master:“Know”
Plan & Test
ü Market segmentationü Market sizingü Target development
ü Micro-segmentation analysisü Micro-targeting insightsü Media consumption insights
ü Campaign & PR reactionü Brand sentiment trackingü Competitive tracking
ü Message & offer testingü Innovation planningü Partnership evaluationsü Media & distribution planning

4/23/2014 14biz.civicscience.com
Track & Evaluate Identify
Master:“Know”
Plan & Test
ü Market segmentationü Market sizingü Target development
ü Micro-segmentation analysisü Micro-targeting insightsü Media consumption insights
ü Campaign & PR reactionü Brand sentiment trackingü Competitive tracking
ü Message & offer testingü Innovation planningü Partnership evaluationsü Media & distribution planning
CivicScience DeepProfile™

4/23/2014 biz.civicscience.com 15
Using Data Science to Power Micro-Segmentation
Jennifer SikoraVP of Marketing
CivicScience
Ross McGowanDirector of Data Science
CivicScience

Micro-Segmentation Challenges
• Properly defining the segments of interest• Obtaining meaningful & reliable data about each segment• Accounting and adjusting for bias• Identifying statistically meaningful differences• Timing of the insights• Finding actionable insights
4/23/2014 biz.civicscience.com 16

“Rather than create a psychographic battery of questions for segmentation and HOPE that we can target segments, why not flip this around? Why not
analyze the interests, cultural values, and lifestyle characteristics that are available… and create segments on factors that reflect those actionable
characteristics?”
- Joel Rubinson, April 10, 2013 in Four new approaches to consumer segmentation in a digital and social age.
4/23/2014 17biz.civicscience.com
http://blog.joelrubinson.net/2013/04/four-new-approaches-to-consumer-segmentation-in-a-digital-and-social-age/

DeepProfile: Real-World Reporting Examples

4/23/2014 19biz.civicscience.com

Step One: Identify and size various consumer segments
Get a clear picture of different desired audiences for research and comparison, which may include any of:
ü Loyalistsü Current users who might switch to a competitorü Former / lapsed users who might come backü Former / lapsed users who probably won’t come backü Non-users who could be won overü Non-users who aren’t worth your time
4/23/2014 biz.civicscience.com 20

4/23/2014 21biz.civicscience.com
How much do you like to eat at __________?
Taco Bell• I’ve never heard of it• I love it• I like it• I don’t really have a
strong opinion• I don’t like it
Chipotle• I’ve never heard of it• I love it• I like it• I don’t really have a
strong opinion• I don’t like it
McDonald’s• I’ve never heard of it• I love it• I like it• I don’t really have a
strong opinion• I don’t like it
Step One: Identify and size various consumer segments

4/23/2014 22biz.civicscience.com
Who’s more tech savvy: Taco Bell Fans, Chipotle
Fans, or McDonald’s Fans?

4/23/2014 23biz.civicscience.com
25%
40%
22%
32%
Taco Bell Fans
Chipotle Fans
McDonald's Fans
US Adults
How often do you use multiple media devices at the same time?
“Every day or almost every day”

Step Two: Surface statistically meaningful insights
4/23/2014 24biz.civicscience.com
Pearson’s chi-squared test is performed on hundreds of contingency tables
Benjamini-Hochberg false detection rate procedure is applied to screen for statistically significant associations that may be the result of random chance
The remaining tables are ranked by their Tschuprow’s T coefficient, which measures effect size

Step Three: Gain mastery of the selected segments by unearthing deeper knowledge.
The DeepProfile™ consumer insight solution delivers marketing-ready data and C-level reports available in days:ü Demographic insightsü Category indexes of psychographic, attitudinal & behavioral insights:
ü Brand indexesü Presentation deck and raw data file
4/23/2014 biz.civicscience.com 25
DeepProfile Indexes
Charitable Giving Market Maven Social Media Use
Discriminating Shopper Money Manager Sports Fans
Environmental Consciousness Political Engagement Tech Savvy
Health & Wellness Price Sensitivity TV Viewing

26
Market Maven IndexThe Market Maven scale aims to identify the extent to which population segments adopt new products and brands, and share their opinions with others.
Chipotle Fans scored highest by a considerable margin on the Market Maven scale, while Taco Bell Fans scored very similar to US Adults as a whole. McDonald’s Fans had the lowest score.
Taco Bell Fans: 100Chipotle Fans: 121McDonald’s Fans: 88US Adults: 100
Individual AttributesAggregate

Market Maven Index
AttributeTaco Bell
FansChipotle
FansMcDonald’s
Fans US Adults
Fashion leader 11% 17% 9% 12%
Follows fashion trends 36% 51% 34% 37%
Tries new products before others 29% 36% 26% 27%
Tells others about new products 52% 57% 47% 50%
Follows music trends 38% 50% 33% 38%
Writes positive product reviews 50% 53% 42% 50%
Tells others about favorite products 60% 50% 60% 57%
Writes negative product reviews 38% 51% 31% 44%
• Chipotle Fans are much more interested in fashion than Taco Bell Fans or McDonald’s Fans.
• Chipotle Fans are also the most likely to follow music trends and to be early adopters.
• Interestingly, while Chipotle Fans are the most likely to write product reviews online, they’re the least likely to tell others about their favorite products.
27
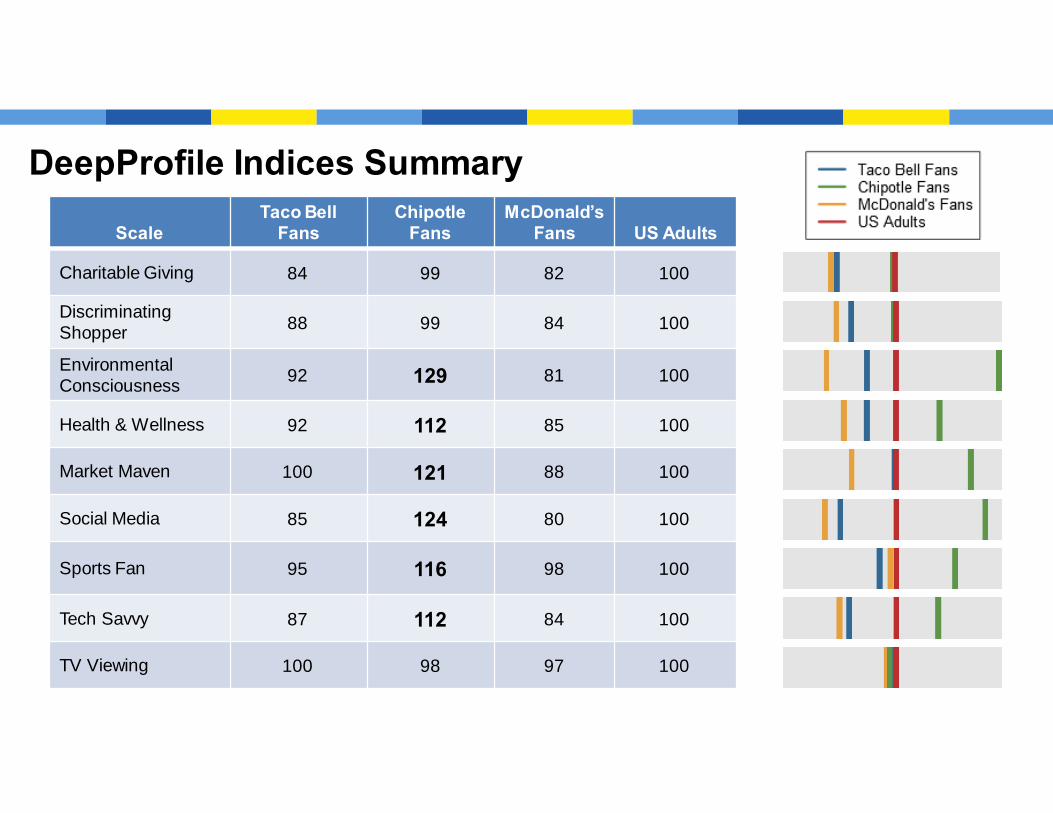
DeepProfile Indices Summary
ScaleTaco Bell
FansChipotle
FansMcDonald’s
Fans US Adults
Charitable Giving 84 99 82 100
Discriminating Shopper 88 99 84 100
Environmental Consciousness 92 129 81 100
Health & Wellness 92 112 85 100
Market Maven 100 121 88 100
Social Media 85 124 80 100
Sports Fan 95 116 98 100
Tech Savvy 87 112 84 100
TV Viewing 100 98 97 100

4/23/2014 biz.civicscience.com 29
Brand Rankings
Taco Bell Fans Chipotle Fans McDonald’s Fans
Panchero’s Cosi Panchero’s
Axe body spray Bench clothing Topman
Journeys Baja Fresh The Finish Line
Aerie Burton clothing Modell’s
The Finish Line Bullhead clothing Deb Shops
AND1 clothing Qdoba Footaction
Jordan clothing Noodles & Company Burger King
Sbarro American Apparel Ecko clothing
PacSun J.Crew Walmart
Little Caesar’s Labatt Blue Ponderosa
Top ten over-indexed brands for each segment:

Customer Case Study…
4/23/2014 30biz.civicscience.com

Case Study: Finding & Understanding the Persuadable Customer• When T-Mobile was seeking to win more AT&T customers, they used the real-time
CivicScience as an important marketing research tool. CivicScience’s data revealed characteristics that defined more likely carrier switchers, as well as measured response to promotional offer test campaigns.
– Our data uncovered 96,206 who had answered both questions “Who is your wireless carrier” and “How likely are you to change mobile phone carriers in the next 90 days.”
– By cross-tabbing these questions, we identified 2,497 AT&T subscribers who recently reported that they were “Somewhat Likely” or “Very Likely” to switch (“Switchers”) and 22,902 who said they were not likely to switch (“Non-Switchers”). We then conducted DeepProfileanalysis comparing these groups.
– We targeted possible promotional concepts to previously-identified Switchers. 6 concepts were tested to gauge the impact of either brand-related or value-related promotions, and a front-runner was selected.
4/23/2014 biz.civicscience.com 31

are 11% more likely than other AT&T subscribers to be over age 45, and15% more likely to be a parent. They are 37% more likely to be Black orHispanic and 194% more likely to speak at least 3 languages. They’re17% more likely to be at least somewhat religious but 61% LESS likely tovote. They’re 37% more likely to watch ABC and 10% more likely to watchFox. They’re 22% LESS likely to go to the movies but when they do,they’re 20% more likely to prefer Dramas. They’re 26% more likely towatch MSNBC, 15% more likely to read a print newspaper, TV, or radio,and 13% more likely to prefer non-fiction books over fiction. They’re 27%more likely to seek online reviews before shopping and 24% more likely tobuy environmentally friendly products. They’re 28% more likely to eatfast food weekly and 3X more likely to drink canned energy drinks.They’re 61% more likely to be a runner and 34% more likely to drinkcoffee every day. They’re 22% more likely to use public transportationand 74% more likely to LOVE Star Trek.
AT&T wireless subscribers who are most likely to change carriers in the next 90 days…
4/23/2014 32biz.civicscience.com

Switcher Non-Switcher p-valueTry new products before friends 38.0% 23.4% <.0001Value BRAND over price (General) 16.9% 10.3% .0013Value BRAND over price (Clothing) 14.8% 7.5% .0007Next car, leasing new 12.0% 5.2% <.0001Value PRICE over brand (Electronics) 32.5% 19.3% .0004Buy organic 46.1% 39.1% .0035
(p-value for null hypothesis: difference in proportions = 0)
We found patterns of “early adoption” that proved to be heavily correlated with being a persuadable AT&T Switcher.
4/23/2014 33biz.civicscience.com

T-Mobile’s Jump campaign wins early adopters and AT&T switchers by allowing them to upgrade their phone at anytime.
4/23/2014 34biz.civicscience.com

Getting Started: Your DeepProfile Project
• Identify your desired target(s)– Persuadables, loyalists, at-risk customers, detractors, etc.
• Any desired competitive comparisons• Is there anything specific you are looking to discover?
– Media consumption; social media usage, etc.• Any custom research questions needed
• We’ll provide: pricing, timeframe, and project lead
4/23/2014 biz.civicscience.com 35