Embed Size (px)
Citation preview

F INDING VALUE IN DEBT AND EQUITY: HOW STRATEGY CAN RESPOND TO CHANGED PR IC ING
C B R E E U R O P E A N D E B T M A P Q 3 2 0 2 0
November 2020

2CBRE Q3 2020 | FINDING VALUE IN DEBT AND EQUITY
S U M M A R Y
Debt terms have changed,
reflecting new lending appetite. Retail has seen
the greatest adverse
movement, logistics the least.
Lenders have a renewed focus on risk, with much greater caution being taken on retail and to a lesser extent
office lending.
More expensive and/or lower LTV debt has reduced
geared real estate forecasts –
but has been compensated for
by upwards forecast revisions.
This is a cyclically advantageous
equity side entry-point. And with
risk/reward often disconnected,
attractive returns can also be found on the debt side.
Mezzanine, whole loan and
development financing have seen parallel
shifts in pricing to senior lending.
Attractive premia are available.

LENDER RETURNS
HOW DO Q3 2020 LENDING TERMS DIFFER TO THOSE REPORTED IN Q4 2019?

4CBRE Q3 2020 | FINDING VALUE IN DEBT AND EQUITY
C H A N G E S I N P R I M E S E N I O R L E N D I N G F R O M Q 4 2 0 1 9 T O Q 3 2 0 2 0
Widespread decline in LTV.
Margins rise almost universally; falls where narrower definition of
prime.
Cost of debt rises in most markets (we assume 0% floor in
interest rate component).
Selected decline in LTV, but resilience or even increase in some (logistics) markets betrays “flight to quality”.
Margins stable in largest markets, rising in Nordics and CEE.
Margins rise in Western Europe. Margins fall in Western Europe.
Cost of debt falls in as many markets as it rises.
More markets see cost of debt rise than fall; UK (capturing benefit of falling rates) a notable exception.

5CBRE Q3 2020 | FINDING VALUE IN DEBT AND EQUITY
S E N I O R L E N D I N G K E Y T E R M S , P R I M E O F F I C E , Q 3 2 0 2 0
Source: CBRE Debt Map Q3 2020.
In the bellwether prime office senior lending market, amidst a general pattern of LTVs falling and margins and cost of debt rising, a definite “flight to quality” was also evident, as lending terms in the largest markets saw less turbulence than elsewhere.
When comparing Q4 2019 and Q3 2020 lending terms for prime senior offices, the largest markets have seen comparatively little point-to-point change (though this of course masks turbulence through the period). LTVs are unchanged in the four G7 member countries, while Milan and London seen slight declines in margins. London has also benefitted from a fall in the five year swap rate.
In contrast, margins and total cost of debt rose (typically by 25-35bps or so) in five and LTVs fell (by 2.5pp to 15pp) in all seven of the Rest of West markets.
In the Nordics excluding Stockholm, we judge LTVs to be stable and margins either flat (Copenhagen) or higher (Helsinki and Oslo). Falling swap rates however have pushed the cost of debt down in Oslo.
Finally, CEE has seen fairly universal falls in LTV and increases in margins and total cost of debt. Across the five markets, the average LTV fell over 6pp while the average margin and cost of debt rose slightly.
LTV Margin Total Cost of Debt LTV Margin Total Cost of Debt
G7 MEMBERS ↔ 58.75 (58.75) ↑ 1.29 (1.28) ↓ 1.46 (1.61) NORDICS ↔ 60.00 (60.00) ↑ 1.55 (1.30) ↓ 1.83 (1.98)
Paris ↔ 60.00 (60.00) ↑ 1.20 (1.00) ↑ 1.30 (1.10) Copenhagen ↔ 60.00 (60.00) ↔ 0.90 (0.90) ↓ 0.96 (0.97)
Frankfurt ↔ 60.00 (60.00) ↔ 1.00 (1.00) ↑ 1.14 (1.10) Helsinki ↔ 55.00 (55.00) ↑ 1.45 (1.25) ↑ 1.55 (1.35)
Milan ↔ 60.00 (60.00) ↓ 1.30 (1.40) ↓ 1.40 (1.50) Oslo ↔ 65.00 (65.00) ↑ 2.30 (1.80) ↓ 2.99 (3.89)
London ↔ 55.00 (55.00) ↓ 1.65 (1.70) ↓ 2.01 (2.72) Stockholm (60.00) (1.25) (1.72)
LTV Margin Total Cost of Debt LTV Margin Total Cost of Debt
REST OF WEST GROUP ↓ 58.75 (65.00) ↑ 1.45 (1.28) ↑ 1.55 (1.37) CEE GROUP ↓ 61.88 (68.13) ↑ 2.33 (2.26) ↑ 2.44 (2.38)
Vienna ↓ 60.00 (75.00) ↓ 1.70 (1.90) ↓ 1.80 (2.00) Prague ↓ 62.50 (70.00) ↑ 2.05 (1.70) ↑ 2.15 (1.80)
Brussels ↓ 60.00 (62.50) ↑ 1.20 (0.95) ↑ 1.27 (1.02) Budapest ↓ 62.50 (70.00) ↑ 2.50 (2.35) ↑ 2.60 (2.45)
Dublin ↓ 55.00 (60.00) ↑ 1.70 (1.40) ↑ 1.86 (1.55) Warsaw ↓ 62.50 (70.00) ↑ 2.25 (2.00) ↑ 2.40 (2.15)
Amsterdam ↓ 60.00 (62.50) ↑ 1.20 (0.85) ↑ 1.27 (0.90) Bucharest ↓ 60.00 (62.50) ↓ 2.50 (3.00) ↓ 2.60 (3.10)
Lisbon ↓ 57.50 (65.00) ↑ 2.13 (1.83) ↑ 2.28 (1.98) Bratislava ↓ 67.50 (70.00) ↑ 2.15 (1.90) ↑ 2.25 (2.00)
Madrid ↓ 55.00 (60.00) ↑ 2.00 (1.75) ↑ 2.15 (1.95) *Note: Q3 2020 figures shown with Q4 2019 in brackets. Arrows indicate direction of movement. Where ranges have been given for LTV or margin, midpoints have been used. We assume a 0% floor in the swap rate when calculating total cost of debt.Zurich ↓ 60.00 (70.00) ↓ 1.00 (1.50) ↓ 1.00 (1.52)

6CBRE Q3 2020 | FINDING VALUE IN DEBT AND EQUITY
S E N I O R L E N D I N G K E Y T E R M S , P R I M E R E T A I L , Q 3 2 0 2 0
Source: CBRE Debt Map Q3 2020.
Turbulence in retail occupational and investment markets has fed through to lending. LTVs have fallen and margins risen – though in some markets a narrowing of the definition of what constitutes prime is responsible for apparently contradictory movements.
As with offices, the largest markets have seen the least point-to-point change in retail lending terms when comparing Q4 2019 and Q3 2020. LTVs are static in three G7 member countries (having already been more modest), while Milan and London record lower margins. This does not indicate renewed confidence in retail lending, rather a narrowing of what each market considers “prime” to the most defensive assets (which thus attract better pricing).
In contrast, margins and total cost of debt rose (typically by 20-50bps or so) in five and LTVs fell (by 2.5pp to 15pp) in all seven of the Rest of West markets.
In the Nordics markets excluding Stockholm, we judge LTVs and margins to be flat in Copenhagen. However both Helsinki and Oslo have seen LTVs fall 5bps and margins rise considerably.
Finally, CEE has seen fairly universal falls in LTV and increases in margins and total cost of debt. Across the five markets, the average LTV fell over 6pp while the average margin and cost of debt rose around 20bps.
LTV Margin Total Cost of Debt LTV Margin Total Cost of Debt
G7 MEMBERS ↓ 53.75 (55.00) ↓ 1.64 (1.89) ↓ 1.85 (2.26) NORDICS ↓ 56.67 (58.75) ↑ 1.97 (1.48) ↑ 2.25 (2.16)
Paris ↓ 55.00 (60.00) ↑ 1.30 (1.25) ↑ 1.40 (1.35) Copenhagen ↔ 60.00 (60.00) ↔ 0.90 (0.90) ↓ 0.96 (0.97)
Frankfurt ↔ 60.00 (60.00) ↔ 1.00 (1.00) ↑ 1.14 (1.10) Helsinki ↓ 50.00 (55.00) ↑ 2.50 (1.30) ↑ 2.60 (1.40)
Milan ↔ 50.00 (50.00) ↓ 2.25 (2.80) ↓ 2.45 (3.00) Oslo ↓ 60.00 (65.00) ↑ 2.50 (2.00) ↓ 3.19 (4.09)
London ↔ 50.00 (50.00) ↓ 2.00 (2.50) ↓ 2.40 (3.58) Stockholm (55.00) (1.70) (2.17)
LTV Margin Total Cost of Debt LTV Margin Total Cost of Debt
REST OF WEST GROUP ↓ 57.50 (65.63) ↑ 1.73 (1.49) ↑ 1.85 (1.59) CEE GROUP ↓ 60.00 (66.25) ↑ 2.63 (2.44) ↑ 2.73 (2.55)
Vienna ↓ 60.00 (75.00) ↓ 1.90 (2.10) ↓ 2.00 (2.20) Prague ↓ 60.00 (70.00) ↑ 2.20 (1.80) ↑ 2.30 (1.90)
Brussels ↓ 60.00 (65.00) ↑ 1.50 (1.10) ↑ 1.60 (1.17) Budapest ↓ 60.00 (70.00) ↑ 2.70 (2.45) ↑ 2.80 (2.55)
Dublin ↓ 50.00 (60.00) ↑ 2.00 (1.50) ↑ 2.20 (1.65) Warsaw (65.00) (2.10) (2.25)
Amsterdam ↓ 60.00 (62.50) ↑ 1.50 (1.25) ↑ 1.60 (1.32) Bucharest ↔ 60.00 (60.00) ↓ 3.00 (3.40) ↓ 3.10 (3.50)
Lisbon ↓ 50.00 (55.00) ↑ 2.25 (2.00) ↑ 2.40 (2.20) Bratislava ↓ 65.00 (70.00) ↑ 2.40 (2.25) ↑ 2.50 (2.35)
Madrid ↓ 50.00 (60.00) ↑ 2.25 (2.00) ↑ 2.40 (2.20) *Note: Q3 2020 figures shown with Q4 2019 in brackets. Arrows indicate direction of movement. Where ranges have been given for LTV or margin, midpoints have been used. We assume a 0% floor in the swap rate when calculating total cost of debt.Zurich ↓ 60.00 (65.00) ↓ 1.50 (1.75) ↓ 1.50 (1.80)
7CBRE Q3 2020 | FINDING VALUE IN DEBT AND EQUITY
S E N I O R L E N D I N G K E Y T E R M S , P R I M E L O G I S T I C S , Q 3 2 0 2 0
Source: CBRE Debt Map Q3 2020.
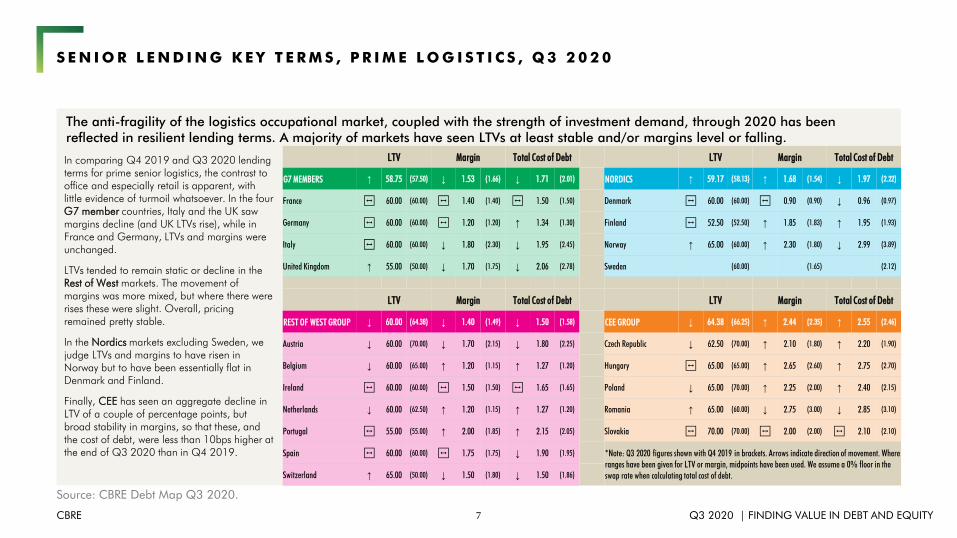
The anti-fragility of the logistics occupational market, coupled with the strength of investment demand, through 2020 has been reflected in resilient lending terms. A majority of markets have seen LTVs at least stable and/or margins level or falling.
In comparing Q4 2019 and Q3 2020 lending terms for prime senior logistics, the contrast to office and especially retail is apparent, with little evidence of turmoil whatsoever. In the four G7 member countries, Italy and the UK saw margins decline (and UK LTVs rise), while in France and Germany, LTVs and margins were unchanged.
LTVs tended to remain static or decline in the Rest of West markets. The movement of margins was more mixed, but where there were rises these were slight. Overall, pricing remained pretty stable.
In the Nordics markets excluding Sweden, we judge LTVs and margins to have risen in Norway but to have been essentially flat in Denmark and Finland.
Finally, CEE has seen an aggregate decline in LTV of a couple of percentage points, but broad stability in margins, so that these, and the cost of debt, were less than 10bps higher at the end of Q3 2020 than in Q4 2019.
LTV Margin Total Cost of Debt LTV Margin Total Cost of Debt
G7 MEMBERS ↑ 58.75 (57.50) ↓ 1.53 (1.66) ↓ 1.71 (2.01) NORDICS ↑ 59.17 (58.13) ↑ 1.68 (1.54) ↓ 1.97 (2.22)
France ↔ 60.00 (60.00) ↔ 1.40 (1.40) ↔ 1.50 (1.50) Denmark ↔ 60.00 (60.00) ↔ 0.90 (0.90) ↓ 0.96 (0.97)
Germany ↔ 60.00 (60.00) ↔ 1.20 (1.20) ↑ 1.34 (1.30) Finland ↔ 52.50 (52.50) ↑ 1.85 (1.83) ↑ 1.95 (1.93)
Italy ↔ 60.00 (60.00) ↓ 1.80 (2.30) ↓ 1.95 (2.45) Norway ↑ 65.00 (60.00) ↑ 2.30 (1.80) ↓ 2.99 (3.89)
United Kingdom ↑ 55.00 (50.00) ↓ 1.70 (1.75) ↓ 2.06 (2.78) Sweden (60.00) (1.65) (2.12)
LTV Margin Total Cost of Debt LTV Margin Total Cost of Debt
REST OF WEST GROUP ↓ 60.00 (64.38) ↓ 1.40 (1.49) ↓ 1.50 (1.58) CEE GROUP ↓ 64.38 (66.25) ↑ 2.44 (2.35) ↑ 2.55 (2.46)
Austria ↓ 60.00 (70.00) ↓ 1.70 (2.15) ↓ 1.80 (2.25) Czech Republic ↓ 62.50 (70.00) ↑ 2.10 (1.80) ↑ 2.20 (1.90)
Belgium ↓ 60.00 (65.00) ↑ 1.20 (1.15) ↑ 1.27 (1.20) Hungary ↔ 65.00 (65.00) ↑ 2.65 (2.60) ↑ 2.75 (2.70)
Ireland ↔ 60.00 (60.00) ↔ 1.50 (1.50) ↔ 1.65 (1.65) Poland ↓ 65.00 (70.00) ↑ 2.25 (2.00) ↑ 2.40 (2.15)
Netherlands ↓ 60.00 (62.50) ↑ 1.20 (1.15) ↑ 1.27 (1.20) Romania ↑ 65.00 (60.00) ↓ 2.75 (3.00) ↓ 2.85 (3.10)
Portugal ↔ 55.00 (55.00) ↑ 2.00 (1.85) ↑ 2.15 (2.05) Slovakia ↔ 70.00 (70.00) ↔ 2.00 (2.00) ↔ 2.10 (2.10)
Spain ↔ 60.00 (60.00) ↔ 1.75 (1.75) ↓ 1.90 (1.95) *Note: Q3 2020 figures shown with Q4 2019 in brackets. Arrows indicate direction of movement. Where ranges have been given for LTV or margin, midpoints have been used. We assume a 0% floor in the swap rate when calculating total cost of debt.Switzerland ↑ 65.00 (50.00) ↓ 1.50 (1.80) ↓ 1.50 (1.86)

8CBRE Q3 2020 | FINDING VALUE IN DEBT AND EQUITY
0.0
0.5
1.0
1.5
2.0
2.5
3.0
3.5
40 50 60 70 80
Mar
gin
LTV
Prime Logistics, primary market, senior lending
Q4 2019 Q3 2020 Q4 2019 average Q3 2020 average0.0
0.5
1.0
1.5
2.0
2.5
3.0
3.5
40 50 60 70 80
Mar
gin
LTV
Prime Retail, primary market, senior lending
Q4 2019 Q3 2020 Q4 2019 average Q3 2020 average0.0
0.5
1.0
1.5
2.0
2.5
3.0
3.5
40 50 60 70 80
Mar
gin
LTV
Prime Office, primary market, senior lending
Q4 2019 Q3 2020 Q4 2019 average Q3 2020 average
C H A N G E I N S E N I O R L E N D I N G K E Y T E R M S , T H R E E S E C T O R S , Q 4 2 0 1 9 V S Q 3 2 0 2 0
Source: CBRE Debt Map Q3 2020.
The shift in lending terms heat maps reveals changes in lender pricing and risk strategy from Q4 2019 to Q3 2020 – in offices and retail there has been notable de-risking in the form of reduction in LTVs, but this has not really been the case in logistics.
Heatmap moves left and contracts in size, indicating lenders’ retreat from higher
LTVs
Average terms see LTVs fall 4% and
margins rise 11bps Average terms see LTVs fall 5% and
margins rise 10bps
Redefinition of prime appears to show margins falling, but
this is not like-for-like
Heatmap clearly retreats left as lenders no longer countenance
high LTV retail exposure Average terms
essentially unchanged
Heatmap contracts a little perhaps reflecting tightening of pricing. If
anything, gradient of new shape is a shade more “risk-on” than
previously.
Each dot represents an individual market Each dot represents an individual market

9CBRE Q3 2020 | FINDING VALUE IN DEBT AND EQUITY
S E N I O R L E N D I N G M A R G I N , R A N K O F G 7 M E M B E R A N D R E S T O F W E S T M A R K E T S
Source: CBRE Debt Map Q3 2020.
Showing the movement in ranking of margins in G7 member and Rest of West markets reveals the flight to quality and the shift from retail and towards logistics that the lending market has taken over the nine months to Q3 2020.
The chart shows the rankings of senior lending margins, from lowest to highest, for the 11 G7 member and Rest of West markets, for office, retail and logistics. This is a simplistic approach but it helps to identify broad relative shifts.
At a high level, it can be seen that more retail markets have become relatively expensive, and more logistics markets relatively cheap. Offices have seen little change. But within and across the sectors the G7 member markets have become relatively cheap, while Rest of West have become relative expensive.
The average office market rank fell by 0.1. Within this, G7 member office market rankings rose by 0.8; Rest of West declined by -0.6.
In retail, the above trend was magnified; an overall fall of -0.7 masked average G7 member improvement of 2.5 and Rest of West decline of -2.6 ranking places. Six of the nine highest margin markets are now retail.
In logistics the average ranking improvement was almost identical, at 3.3 for G7 member and 3.6 for Rest of West.
Amsterdam Office Frankfurt Office
Brussels Office Zurich Office
Paris Office Frankfurt Retail
Frankfurt Office Brussels Office
Frankfurt Retail Paris Office
Brussels Retail Amsterdam Office
Belgium Logistics Belgium Logistics
Netherlands Logistics Germany Logistics
Germany Logistics Netherlands Logistics
Paris Retail Milan Office
Amsterdam Retail Paris Retail
Dublin Office France Logistics
Milan Office Brussels Retail
France Logistics Amsterdam Retail
Zurich Office Zurich Retail
Dublin Retail Ireland Logistics
Ireland Logistics Switzerland Logistics
London Office London Office
Madrid Office Vienna Office
Zurich Retail Dublin Office
Spain Logistics Austria Logistics
United Kingdom Logistics United Kingdom Logistics
Switzerland Logistics Spain Logistics
Lisbon Office Italy Logistics
Portugal Logistics Vienna Retail
Vienna Office Madrid Office
Lisbon Retail Dublin Retail
Madrid Retail London Retail
Vienna Retail Portugal Logistics
Austria Logistics Lisbon Office
Italy Logistics Milan Retail
London Retail Lisbon Retail
Milan Retail Madrid Retail
G7 Members office
Rest of West Group office
G7 Members retail
Rest of West Group retail
G7 Members logistics
Rest of West Group logistics

LENDER RISK
WHAT DO KEY METRICS OF LENDING RISK LOOK LIKE IN Q3 2020, AND HOW HAVE THEY SHIFTED OVER THE COURSE OF THE YEAR?

11CBRE Q3 2020 | FINDING VALUE IN DEBT AND EQUITY
T H E E V O L U T I O N O F L E N D E R R I S K A P P E T I T E O V E R 2 0 2 0 , C H A N G E I N K E Y M E T R I C S
Debt yieldDebt yield premium
vs property yieldInterest
Cover RatioDebt Service Cover Ratio
Nominal lender exposure Overall
Note: Arrow indicates direction of risk appetite, not movement in metric. For example, a high debt yield is (all other things being equal) lower risk, and would be represented on the graphic above by the dial leaning to the left.
Risk appetite Much weaker Weaker No change A little stronger Much stronger

12CBRE Q3 2020 | FINDING VALUE IN DEBT AND EQUITY
0
1
2
3
4
5
6
2 4 6 8 10 12 14
debt
yiel
d pr
emiu
m vs
pro
perty
yiel
d, p
erce
ntag
e po
ints
debt yield, %
Prime Logistics, primary market, senior lending
Q4 2019 Q3 2020 Q4 2019 average Q3 2020 average0
1
2
3
4
5
6
2 4 6 8 10 12 14
debt
yiel
d pr
emiu
m vs
pro
perty
yiel
d, p
erce
ntag
e po
ints
debt yield, %
Prime Retail, primary market, senior lending
Q4 2019 Q3 2020 Q4 2019 average Q3 2020 average0
1
2
3
4
5
6
2 4 6 8 10 12 14
debt
yiel
d pr
emiu
m vs
pro
perty
yiel
d, p
erce
ntag
e po
ints
debt yield, %
Prime Office, primary market, senior lending
Q4 2019 Q3 2020 Q4 2019 average Q3 2020 average
S E N I O R L E N D I N G D E B T Y I E L D , T H R E E S E C T O R S , Q 4 2 0 1 9 V S Q 3 2 0 2 0
Source: CBRE Debt Map Q3 2020.
In retail there has been a marked increase (and in office a slighter one) in the debt yield and debt yield premium versus property yield demanded by lenders – a clear sign of de-risking. Logistics has seen hardly any change in these measures.
Average metrics if anything move up the
risk curve
Heatmap shape barely changes indicating lenders’ comfortable maintaining risk appetite in logistics
Very significant rise in average metrics betrays significant reduction in risk appetite
Heatmap moves up and right: lenders demanding higher debt yields and greater cushion over property yields
Outlier lending terms seen in Q4 2019 are “off the map” in Q3 2020
Easing in average metrics shows some reduction in risk appetite
Heatmap edges upwards, showing a small increase in debt yield and cushion to underlying property pricing
Each dot represents an individual market Each dot represents an individual market
Average risk metrics on retail and logistics about to reach cross-over point

13CBRE Q3 2020 | FINDING VALUE IN DEBT AND EQUITY
0.5
0.7
0.9
1.1
1.3
1.5
1.7
1.9
2.1
2.3
2.5
1 2 3 4 5 6 7
DSC
R
ICR
Prime Logistics, primary market, senior lending
Q4 2019 Q3 2020 Q4 2019 average Q3 2020 average0.5
0.7
0.9
1.1
1.3
1.5
1.7
1.9
2.1
2.3
2.5
1 2 3 4 5 6 7
DSC
R
ICR
Prime Retail, primary market, senior lending
Q4 2019 Q3 2020 Q4 2019 average Q3 2020 average0.5
0.7
0.9
1.1
1.3
1.5
1.7
1.9
2.1
2.3
2.5
1 2 3 4 5 6 7
DSC
R
ICR
Prime Office, primary market, senior lending
Q4 2019 Q3 2020 Q4 2019 average Q3 2020 average
S E N I O R L E N D I N G I C R A N D D S C R , T H R E E S E C T O R S , Q 4 2 0 1 9 V S Q 3 2 0 2 0
Source: CBRE Debt Map Q3 2020.
Falling LTVs and rising property yields have combined to raise ICR and DSCR metrics considerably in retail (on the assumption that underlying property yields reflect passing income). Movement has been less aggressive in office and logistics.
Each dot represents an individual market Each dot represents an individual market
Reduction in LTVs has seen serviceability
improve (assuming income being received): ICR and DSCR have both
risen significantly.
Aside from one outlier, the range of serviceability observations has narrowed, with a slight increase in both average ICR and DSCR.
Lenders have been prepared to relax ICR and DSCR for logistics, likely a result of inward movement in property
yields outstripping any increased caution in lending terms.
14CBRE Q3 2020 | FINDING VALUE IN DEBT AND EQUITY
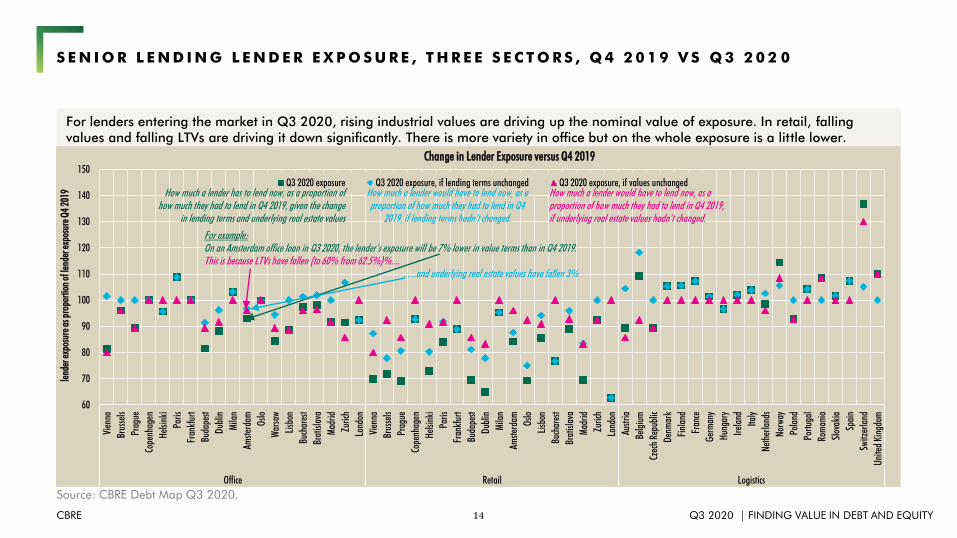
S E N I O R L E N D I N G L E N D E R E X P O S U R E , T H R E E S E C T O R S , Q 4 2 0 1 9 V S Q 3 2 0 2 0
Source: CBRE Debt Map Q3 2020.
For lenders entering the market in Q3 2020, rising industrial values are driving up the nominal value of exposure. In retail, falling values and falling LTVs are driving it down significantly. There is more variety in office but on the whole exposure is a little lower.
60
70
80
90
100
110
120
130
140
150
Vien
na
Brus
sels
Prag
ue
Cope
nhag
en
Helsi
nki
Paris
Fran
kfur
t
Buda
pest
Dubl
in
Mila
n
Amste
rdam Os
lo
War
saw
Lisb
on
Buch
ares
t
Brat
islav
a
Mad
rid
Zuric
h
Lond
on
Vien
na
Brus
sels
Prag
ue
Cope
nhag
en
Helsi
nki
Paris
Fran
kfur
t
Buda
pest
Dubl
in
Mila
n
Amste
rdam Os
lo
Lisb
on
Buch
ares
t
Brat
islav
a
Mad
rid
Zuric
h
Lond
on
Austr
ia
Belg
ium
Czec
h Re
publ
ic
Denm
ark
Finl
and
Fran
ce
Germ
any
Hung
ary
Irela
nd
Italy
Neth
erla
nds
Norw
ay
Pola
nd
Portu
gal
Rom
ania
Slov
akia
Spai
n
Switz
erla
nd
Unite
d Ki
ngdo
m
Office Retail Logistics
lend
er e
xpos
ure
as p
ropo
rtion
of l
ende
r exp
osur
e Q
4 20
19
Change in Lender Exposure versus Q4 2019
Q3 2020 exposure Q3 2020 exposure, if lending terms unchanged Q3 2020 exposure, if values unchangedHow much a lender has to lend now, as a proportion of
how much they had to lend in Q4 2019, given the change in lending terms and underlying real estate values
How much a lender would have to lend now, as a proportion of how much they had to lend in Q4
2019, if lending terms hadn’t changed.
How much a lender would have to lend now, as a proportion of how much they had to lend in Q4 2019, if underlying real estate values hadn’t changed.
For example:On an Amsterdam office loan in Q3 2020, the lender’s exposure will be 7% lower in value terms than in Q4 2019.This is because LTVs have fallen (to 60% from 62.5%)%....
….and underlying real estate values have fallen 3%

(GEARED) INVESTOR RETURNS
FOR AN INVESTOR LOOKING AT THE DEC-20 TO DEC-25 PERIOD, HOW HAVE CHANGED FORECASTS AND DIFFERENCES IN DEBT TERMS CONTRIBUTED AFFECTED THE OUTLOOK FOR UNGEARED AND GEARED RETURNS?

16CBRE Q3 2020 | FINDING VALUE IN DEBT AND EQUITY
T H E C H A N G E D O U T L O O K F O R P R I M E R E A L E S T A T E P E R F O R M A N C E , D E C - 2 0 T O D E C - 2 5
Forecasts for the Dec-20 to Dec-25 period have seen significant improvement.
Retail Now 5.1%Was 4.0%*
Office Now 5.8%Was 4.3%*
Logistics Now 7.9%Was 6.4%*
*Average of selected prime markets
Debt terms have got less borrower-friendly in retail and
office, but stayed about the same in logistics.
LTV & Margin
Margin
LTV
But overall, in spite of more challenging debt conditions,
forecasts of geared performance for Dec-20 to Dec-25 have
improved significantly
Retail Now 10.5%
Was 7.3%*
Office Now 12.3%
Was 8.8%*
Logistics Now 16.7%Was 13.4%*

17CBRE Q3 2020 | FINDING VALUE IN DEBT AND EQUITY
T H E C H A N G E D O U T L O O K F O R P R I M E O F F I C E P E R F O R M A N C E , D E C - 2 0 T O D E C - 2 5
Source: CBRE Debt Map Q3 2020, CBRE EMEA prime office forecasts Q4 2019 and Q3 2020.
The chart on the left shows our forecasts of prime office total returns, for the five year period Dec-20 to Dec-25, made at two points, Q4 2019 and most recently Q3 2020. We have used Debt Map data as at these points to show geared returns for the period also. The chart on the right shows how geared returns forecasts have changed, and attributes the cause of any change to either changes in the forecast or changes in debt terms.
This analysis shows overwhelmingly that the Dec-20 to Dec-25 period appears to be a very favourable investment window for prime offices. Across the 19 markets covered:
• Ungeared total returns have improved from an average of 4.3%pa to 5.8%pa.
• Geared total returns have improved from an average of 8.8%pa to 12.3%pa.
• More adverse debt terms have reduced geared total return expectations in most markets, and by -0.7%pa on average.
• This has been more than offset by rising forecasts; 17 out of 19 markets have seen forecasts improve, by 3.5%pa on average.
On average, we expect geared total returns on prime office to be 3.5% per year better than was the case when making forecasts at the end of 2019, despite generally more expensive and lower leverage debt reducing performance expectations by -0.7% per year.
-5
0
5
10
15
20
25
30
Vien
na
Brus
sels
Prag
ue
Cope
nhag
en
Helsi
nki
Paris
Fran
kfur
t
Buda
pest
Dubl
in
Mila
n
Amste
rdam Os
lo
War
saw
Lisb
on
Buch
ares
t
Brat
islav
a
Mad
rid
Zuric
h
Lond
on
tota
l ret
urn,
Dec
-20
to D
ec-2
5, %
pa
Total return forecasts, Q4 2019 and Q3 2020, prime offices, five year period Dec-20 to Dec-25,
Q4 2019, Ungeared Q3 2020, Ungeared Q4 2019, Geared Q3 2020, Geared
-15
-10
-5
0
5
10
15
20
25
Vien
na
Brus
sels
Prag
ue
Cope
nhag
en
Helsi
nki
Paris
Fran
kfur
t
Buda
pest
Dubl
in
Mila
n
Amste
rdam Os
lo
War
saw
Lisb
on
Buch
ares
t
Brat
islav
a
Mad
rid
Zuric
h
Lond
on
Chan
ge in
tota
l ret
urn,
Dec
-20
to D
ec-2
5, %
pa
Drivers of change in geared prime office forecast
Debt market driven change Forecast driven change Total change
In almost every case, gearing is accretive to performance (hence the triangles are above the bars).
In most instances, the outlook for the Dec-20 to Dec-25 period has improved, so most blue bars are positive.
Most markets have seen debt become more expensive, and/or lower LTV, which has had a small negative impact on forecast
geared performance – hence most pink bars are negative.
Generally, improvement in forecasts has outweighed the negative impact of costlier / lower debt, so most markets
have seen net increase in forecasts – most diamonds
are in positive territory

18CBRE Q3 2020 | FINDING VALUE IN DEBT AND EQUITY
T H E C H A N G E D O U T L O O K F O R P R I M E R E T A I L P E R F O R M A N C E , D E C - 2 0 T O D E C - 2 5
Source: CBRE Debt Map Q3 2020, CBRE EMEA prime office forecasts Q4 2019 and Q3 2020.
On average, we expect geared total returns on prime retail to be 3.2% per year better than was the case when making forecasts at the end of 2019, despite generally more expensive and lower leverage debt reducing performance expectations by -0.8% per year.
-5
0
5
10
15
20
25
30
Vien
na
Brus
sels
Prag
ue
Cope
nhag
en
Helsi
nki
Paris
Fran
kfur
t
Buda
pest
Dubl
in
Mila
n
Amste
rdam Os
lo
Lisb
on
Buch
ares
t
Mad
rid
Zuric
h
Lond
on
tota
l ret
urn,
Dec
-20
to D
ec-2
5, %
pa
Total return forecasts, Q4 2019 and Q3 2020, prime retail, five year period Dec-20 to Dec-25,
Q4 2019, Ungeared Q3 2020, Ungeared Q4 2019, Geared Q3 2020, Geared
-15
-10
-5
0
5
10
15
20
25
Vien
na
Brus
sels
Prag
ue
Cope
nhag
en
Helsi
nki
Paris
Fran
kfur
t
Buda
pest
Dubl
in
Mila
n
Amste
rdam Os
lo
Lisb
on
Buch
ares
t
Mad
rid
Zuric
h
Lond
on
Chan
ge in
tota
l ret
urn,
Dec
-20
to D
ec-2
5, %
pa
Drivers of change in geared prime retail forecast
Debt market driven change Forecast driven change Total change
In most cases, gearing is accretive to performance (hence the triangles are above the bars).
In most instances, the outlook for the Dec-20 to Dec-25 period has improved, so most blue bars are positive.
Most markets have seen debt become more expensive, and/or lower LTV, which has reduced forecast geared performance – hence most pink bars are negative.
Generally, improvement in forecasts has outweighed the
negative impact of costlier / lower debt, so most markets have seen net increase in forecasts – most
diamonds are in positive territory
The chart on the left shows our forecasts of prime retail total returns, for the five year period Dec-20 to Dec-25, made at two points, Q4 2019 and most recently Q3 2020. We have used Debt Map data as at these points to show geared returns for the period also. The chart on the right shows how geared returns forecasts have changed, and attributes the cause of any change to either changes in the forecast or changes in debt terms.
This analysis shows that the Dec-20 to Dec-25 period appears to be a favourable investment window for prime retail. Across the 17 markets covered:
• Ungeared total returns have improved from an average of 4.0%pa to 5.1%pa.
• Geared total returns have improved from an average of 7.3%pa to 10.5%pa.
• More adverse debt terms have reduced geared total return expectations in most markets, and by -0.8%pa on average.
• This has been more than offset by rising forecasts; 12 out of 17 markets have seen forecasts improve, by 3.2%pa on average.

19CBRE Q3 2020 | FINDING VALUE IN DEBT AND EQUITY
T H E C H A N G E D O U T L O O K F O R P R I M E L O G I S T I C S P E R F O R M A N C E , D E C - 2 0 T O D E C - 2 5
Source: CBRE Debt Map Q3 2020, CBRE EMEA prime office forecasts Q4 2019 and Q3 2020.
-5
0
5
10
15
20
25
30
Austr
ia
Belg
ium
Czec
h Re
publ
ic
Denm
ark
Finl
and
Fran
ce
Germ
any
Hung
ary
Irela
nd
Italy
Neth
erla
nds
Norw
ay
Pola
nd
Portu
gal
Rom
ania
Slov
akia
Spai
n
Switz
erla
nd
Unite
d Ki
ngdo
m
tota
l ret
urn,
Dec
-20
to D
ec-2
5, %
pa
Total return forecasts, Q4 2019 and Q3 2020, prime logistics, five year period Dec-20 to Dec-25,
Q4 2019, Ungeared Q3 2020, Ungeared Q4 2019, Geared Q3 2020, Geared
-15
-10
-5
0
5
10
15
20
25
Austr
ia
Belg
ium
Czec
h Re
publ
ic
Denm
ark
Finl
and
Fran
ce
Germ
any
Hung
ary
Irela
nd
Italy
Neth
erla
nds
Norw
ay
Pola
nd
Portu
gal
Rom
ania
Slov
akia
Spai
n
Switz
erla
nd
Unite
d Ki
ngdo
m
Chan
ge in
tota
l ret
urn,
Dec
-20
to D
ec-2
5, %
pa
Drivers of change in geared prime logistics forecast
Debt market driven change Forecast driven change Total change
In all cases, gearing is accretive to performance (hence the triangles are above the bars).
In most instances, the outlook for the Dec-20 to Dec-25 period has improved, so most blue bars are positive.
With debt terms pretty stable, the impact on outlook has generally been minimal.
Generally, improvement in forecasts has outweighed the negative impact of costlier / lower debt, so most markets
have seen net increase in forecasts – more diamonds
are in positive territory
The chart on the left shows our forecasts of prime logistics total returns, for the five year period Dec-20 to Dec-25, made at two points, Q4 2019 and most recently Q3 2020. We have used Debt Map data as at these points to show geared returns for the period also. The chart on the right shows how geared returns forecasts have changed, and attributes the cause of any change to either changes in the forecast or changes in debt terms.
This analysis shows overwhelmingly that the Dec-20 to Dec-25 period appears to be a very favourable investment window for prime logistics. Across the 19 markets covered:
• Ungeared total returns have improved from an average of 6.4%pa to 7.9%pa.
• Geared total returns have improved from an average of 13.4%pa to 16.7%pa.
• The impact from changed debt terms at the average level has been zero, but some markets have seen an impact.
• 15 out of 19 markets have seen forecasts improve, by 3.3%pa on average.
On average, we expect geared total returns on prime logistics to be 3.3% per year better than was the case when making forecasts at the end of 2019. There has been no adverse impact from changing debt terms, as change has been minimal (at the aggregate level).

A BORROWER OR A LENDER BE? OR BOTH? OR NEITHER…?
HOW MIGHT AN AGNOSTIC INVESTOR ASSESS THE RETURNS FROM DEBT AND EQUITY (UNGEARED AND GEARED) FOR THE DEC-20 TO DEC-25 PERIOD?
21CBRE Q3 2020 | FINDING VALUE IN DEBT AND EQUITY
T H E R E T U R N P R O S P E C T S F O R L E N D E R S A N D I N V E S T O R S F O R D E C - 2 0 T O D E C - 2 5
LENDERS INVESTORS
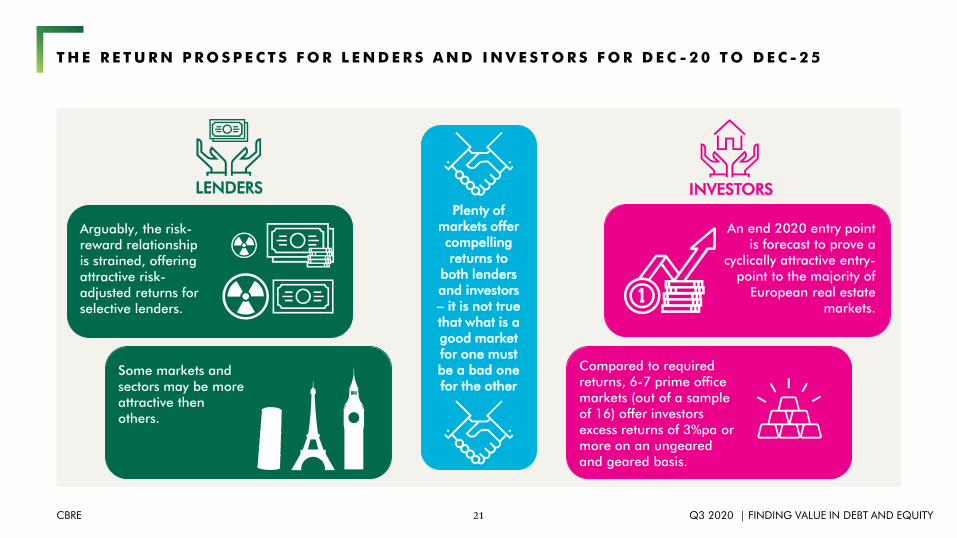
Arguably, the risk-reward relationship is strained, offering attractive risk-adjusted returns for selective lenders.
Some markets and sectors may be more attractive then others.
Plenty of markets offer compelling returns to
both lenders and investors – it is not true that what is a good market for one must be a bad one for the other
Specific markets
An end 2020 entry point is forecast to prove a
cyclically attractive entry-point to the majority of
European real estate markets.
Compared to required returns, 6-7 prime office markets (out of a sample of 16) offer investors excess returns of 3%pa or more on an ungeared and geared basis.

22CBRE Q3 2020 | FINDING VALUE IN DEBT AND EQUITY
S E N I O R L E N D I N G , A B S O L U T E A N D P R O P O R T I O N A L R E T U R N S , T H R E E S E C T O R S , Q 3 2 0 2 0
Source: CBRE Debt Map Q3 2020.
There is not a uniform relationship between the returns from real estate lending (simplified as margin+fee) and exposure (LTV) or the proportion of return earned by real estate above the risk free. This offers opportunities for lenders able to select sectors and markets.
Vienna
BrusselsPrague
Copenhagen
HelsinkiParisFrankfurt
Budapest
Dublin
Milan
Amsterdam
Oslo
Warsaw
Lisbon
Bucharest
Bratislava
Madrid
Zurich
London
-0.3
-0.2
-0.1
0.0
0.1
0.2
0.3
0.4
0.5
0.6
0.7
0.8
0.9
0.8 1.2 1.6 2.0 2.4 2.8 3.2
mar
gin+
fee
as p
ropo
rtion
of p
rope
rty yi
eld
min
us G
over
nmen
t bon
d, %
senior lending margin+fee, %
Prime Office, lending returns, absolute and as proportion of property premium over risk free
Vienna
BrusselsPrague
Copenhagen
Helsinki
Paris
Frankfurt
Budapest
Dublin
Milan
AmsterdamOslo
Lisbon
Bucharest
Bratislava
Madrid
Zurich
London
-0.3
-0.2
-0.1
0.0
0.1
0.2
0.3
0.4
0.5
0.6
0.7
0.8
0.9
0.8 1.2 1.6 2.0 2.4 2.8 3.2
Mar
gin+
fee
as p
ropo
rtion
of p
rope
rty yi
eld
min
us G
over
nmen
t bon
d, %
senior lending margin+fee, %
Prime Retail, lending returns, absolute and as proportion of property premium over risk free
Austria
Belgium Czech Republic
Denmark
FinlandFrance
Germany
Hungary
Ireland
Italy
Netherlands
Norway
PolandPortugal
Romania
Slovakia
Spain
SwitzerlandUnited Kingdom
-0.3
-0.2
-0.1
0.0
0.1
0.2
0.3
0.4
0.5
0.6
0.7
0.8
0.9
0.8 1.2 1.6 2.0 2.4 2.8 3.2
Mar
gin+
fee
as p
ropo
rtion
of p
rope
rty yi
eld
min
us G
over
nmen
t bon
d, %
senior lending margin+fee, %
Prime Logistics, lending returns, absolute and as proportion of property premium over risk free
Some markets offer relatively high absolute and proportional returns at relatively low LTV
In others, LTVs are higher but returns a somewhat lower
A number of markets offer similar proportional returns but are
differentiated on margin & fee (and LTV)
Some markets offer relatively high absolute and proportional returns at relatively low LTV
In others, LTVs are higher but returns a somewhat lower
50% LTV 60% LTV 70% LTV50% LTV 60% LTV 70% LTV50% LTV 60% LTV 70% LTV

23CBRE Q3 2020 | FINDING VALUE IN DEBT AND EQUITY
S E N I O R L E N D I N G , S T A N D A R D S C O R E O F A B S O L U T E A N D P R O P O R T I O N A L R E T U R N S , Q 3 2 0 2 0 , W I T H I N T H R E E S E C T O R S
Source: CBRE Debt Map Q3 2020.
Expressing the return real estate debt receives in absolute terms, in relative terms (compared to that which equity receives) and accounting for the level of exposure in a single metric is not easy. This chart attempts to do so by expressing absolute and proportional return relative to LTV on a standard score basis. The scores themselves are not specially meaningful, but their relativities are.
Initially, we look at scores within each sector –evaluating real estate debt return within but not across office, retail and logistics.
In prime office, London is the only G7 member market with a positive score overall. Smaller markets with strong scores include Dublin, Oslo, Warsaw, Lisbon and Madrid.
For prime retail, the best scores are achieved by Helsinki, Milan, London, Lisbon and Dublin. Paris and Frankfurt area again weak.
In logistics, Finland, Norway, Portugal and the UK score well; Austria, Denmark and Netherlands score poorly.
On a standard score basis, some markets stand out as offering above or below par returns. London and Madrid consistently appear attractive to lenders. The reverse is true for Paris, Frankfurt and Amsterdam.
-4
-3
-2
-1
0
1
2
3
4
Vien
naBr
usse
lsPr
ague
Cope
nhag
enHe
lsink
iPa
risFr
ankf
urt
Buda
pest
Dubl
inM
ilan
Amste
rdam Os
loW
arsa
wLi
sbon
Buch
ares
tBr
atisl
ava
Mad
ridZu
rich
Lond
onVi
enna
Brus
sels
Prag
ueCo
penh
agen
Helsi
nki
Paris
Fran
kfur
tBu
dape
stDu
blin
Mila
nAm
sterd
am Oslo
Lisb
onBu
char
est
Brat
islav
aM
adrid
Zuric
hLo
ndon
Austr
iaBe
lgiu
mCz
ech
Repu
blic
Denm
ark
Finl
and
Fran
ceGe
rman
yHu
ngar
yIre
land
Italy
Neth
erla
nds
Norw
ayPo
land
Portu
gal
Rom
ania
Slov
akia
Spai
nSw
itzer
land
Unite
d Ki
ngdo
m
Office Retail Logistics
stan
dard
scor
e
Standard score of absolute and proportional senior lending return, calculated within sectors
Margin & Fee / LTV Share of Premium over 5yr Gov Bond / LTV Sum
Methodology: (Margin + Fee)/LTV and ((Margin+Fee)/(Property Yield–Risk Free))/LTV calculated for each market. Standard score of each metric then calculated within each sector.

24CBRE Q3 2020 | FINDING VALUE IN DEBT AND EQUITY
S E N I O R L E N D I N G , S T A N D A R D S C O R E O F A B S O L U T E A N D P R O P O R T I O N A L R E T U R N S , Q 3 2 0 2 0 , A C R O S S T H R E E S E C T O R S
Source: CBRE Debt Map Q3 2020.
High returns and low LTVs make retail lending returns appear attractive relative to other sectors – but capital decline risk is of course not equal across sectors.
-4
-3
-2
-1
0
1
2
3
4
Vien
naBr
usse
lsPr
ague
Cope
nhag
enHe
lsink
iPa
risFr
ankf
urt
Buda
pest
Dubl
inM
ilan
Amste
rdam Os
loW
arsa
wLi
sbon
Buch
ares
tBr
atisl
ava
Mad
ridZu
rich
Lond
onVi
enna
Brus
sels
Prag
ueCo
penh
agen
Helsi
nki
Paris
Fran
kfur
tBu
dape
stDu
blin
Mila
nAm
sterd
am Oslo
Lisb
onBu
char
est
Brat
islav
aM
adrid
Zuric
hLo
ndon
Austr
iaBe
lgiu
mCz
ech
Repu
blic
Denm
ark
Finl
and
Fran
ceGe
rman
yHu
ngar
yIre
land
Italy
Neth
erla
nds
Norw
ayPo
land
Portu
gal
Rom
ania
Slov
akia
Spai
nSw
itzer
land
Unite
d Ki
ngdo
m
Office Retail Logistics
stan
dard
scor
e
Standard score of absolute and proportional senior lending return, calculated across all sectors
Margin & Fee / LTV Share of Premium over 5yr Gov Bond / LTV Sum
Methodology: (Margin + Fee)/LTV and ((Margin+Fee)/(Property Yield–Risk Free))/LTV calculated for each market. Standard score of each metric then calculated across all 56 markets.
Expressing the return real estate debt receives in absolute terms, in relative terms (compared to that which equity receives) and accounting for the level of exposure in a single metric is not easy. This chart attempts to do so by expressing absolute and proportional return relative to LTV on a standard score basis. The scores themselves are not specially meaningful, but their relativities are.
Here, we look at scores across each sector –evaluating real estate debt return across office, retail and logistics. With higher margins and lower LTVs, more retail markets (11) have positive scores than any other sector – however for some this may be a false position, given the widespread perception of greater potential for adverse value movement. (The methodology’s implicit assumption that value decline risk is equal is a limitation in this respect).
Eight office and four logistics markets have positive scores. Finland, Norway, Portugal and UK are represented in both sectors, Vienna, Dublin, Warsaw and Madrid additionally so in the office sector.

25CBRE Q3 2020 | FINDING VALUE IN DEBT AND EQUITY
P R I M E O F F I C E S , R E Q U I R E D A N D E X P E C T E D R E T U R N , U N G E A R E D , D E C - 2 0 T O D E C - 2 5
Source: CBRE Debt Map Q3 2020, CBRE EMEA prime office forecasts Q4 2019 and Q3 2020.
For 16 prime office markets for which we have a view on risk premium we show a comparison of required return (risk premium plus the risk free rate) with expected return (our total return forecast) on an ungeared basis. This shows the extent to which market level returns should meet typical investment targets – of course, individual assets within these markets may perform significantly differently to the average.
The analysis shows that expected returns exceed required returns in 13 out of 16 markets, matching them in one (Milan) and under-delivering in two (Budapest and Bucharest). Furthermore, in six cases – Vienna, Brussels, Copenhagen, Frankfurt, Oslo and London – excess return is greater than 3%pa, offering significant comfort.
For so many markets to be delivering excess return shows the cyclically favourable entry-point prevailing across European office markets.
Most prime office markets will deliver ungeared returns above – and in the case of Vienna, Brussels, Copenhagen, Frankfurt, Oslo and London more than 3% per year above – required returns.
-10
-5
0
5
10
15
20
25
30
Requ
ired
Retu
rn
Expe
cted
Retu
rn
Requ
ired
Retu
rn
Expe
cted
Retu
rn
Requ
ired
Retu
rn
Expe
cted
Retu
rn
Requ
ired
Retu
rn
Expe
cted
Retu
rn
Requ
ired
Retu
rn
Expe
cted
Retu
rn
Requ
ired
Retu
rn
Expe
cted
Retu
rn
Requ
ired
Retu
rn
Expe
cted
Retu
rn
Requ
ired
Retu
rn
Expe
cted
Retu
rn
Requ
ired
Retu
rn
Expe
cted
Retu
rn
Requ
ired
Retu
rn
Expe
cted
Retu
rn
Requ
ired
Retu
rn
Expe
cted
Retu
rn
Requ
ired
Retu
rn
Expe
cted
Retu
rn
Requ
ired
Retu
rn
Expe
cted
Retu
rn
Requ
ired
Retu
rn
Expe
cted
Retu
rn
Requ
ired
Retu
rn
Expe
cted
Retu
rn
Requ
ired
Retu
rn
Expe
cted
Retu
rn
Vienna Brussels Prague Copenhagen Helsinki Paris Frankfurt Budapest Dublin Milan Amsterdam Oslo Warsaw Bucharest Madrid London
tota
l ret
urn,
Dec
-20
to D
ec-2
5, %
pa
Required and Expected Return, ungeared, prime offices, Dec-20 to Dec-25
Risk free rate Ungeared risk premium Expected ungeared return Required ungeared return Excess ungeared return
Only two markets have expected returns below required returns.
In six markets, expected returns exceed required returns by at least 3%pa – a considerable margin.

26CBRE Q3 2020 | FINDING VALUE IN DEBT AND EQUITY
P R I M E O F F I C E S , R E Q U I R E D A N D E X P E C T E D R E T U R N , G E A R E D , D E C - 2 0 T O D E C - 2 5
Source: CBRE Debt Map Q3 2020, CBRE EMEA prime office forecasts Q4 2019 and Q3 2020.
-10
-5
0
5
10
15
20
25
30
Requ
ired
Retu
rn
Expe
cted
Retu
rn
Requ
ired
Retu
rn
Expe
cted
Retu
rn
Requ
ired
Retu
rn
Expe
cted
Retu
rn
Requ
ired
Retu
rn
Expe
cted
Retu
rn
Requ
ired
Retu
rn
Expe
cted
Retu
rn
Requ
ired
Retu
rn
Expe
cted
Retu
rn
Requ
ired
Retu
rn
Expe
cted
Retu
rn
Requ
ired
Retu
rn
Expe
cted
Retu
rn
Requ
ired
Retu
rn
Expe
cted
Retu
rn
Requ
ired
Retu
rn
Expe
cted
Retu
rn
Requ
ired
Retu
rn
Expe
cted
Retu
rn
Requ
ired
Retu
rn
Expe
cted
Retu
rn
Requ
ired
Retu
rn
Expe
cted
Retu
rn
Requ
ired
Retu
rn
Expe
cted
Retu
rn
Requ
ired
Retu
rn
Expe
cted
Retu
rn
Requ
ired
Retu
rn
Expe
cted
Retu
rn
Vienna Brussels Prague Copenhagen Helsinki Paris Frankfurt Budapest Dublin Milan Amsterdam Oslo Warsaw Bucharest Madrid London
tota
l ret
urn,
Dec
-20
to D
ec-2
5, %
pa
Required and Expected Return, geared, prime offices, Dec-20 to Dec-25
Risk free rate Geared risk premium Expected geared return Required geared return Excess geared return
For 16 prime office markets for which we have a view on risk premium we show a comparison of required return (risk premium plus the risk free rate) with expected return (our total return forecast) on a geared basis. To account for gearing, we adjust the ungeared risk premium according to the level of additional volatility in capital growth at the LTV prevailing in each market has produced. This shows the extent to which market level returns should meet typical investment targets – of course, individual assets within these markets may perform significantly differently to the average.
The analysis shows that expected returns exceed required returns in 11 out of 16 markets. Brussels, Copenhagen, Frankfurt and Oslo deliver excess geared return of 9-11%pa, London of 5.5%pa and Vienna and Amsterdam of around 4%pa.
This emphasises the extent to which gearing, on historically very affordable terms, can be used to enhance performance in markets where values are expected to increase.
Five markets have expected geared returns below required geared returns.
Four markets have expected geared returns around 10%pa above required geared returns.
Most prime office markets will deliver geared returns above – and in the case of Brussels, Copenhagen, Frankfurt and Oslo more than 10% per year above – required returns.

27CBRE Q3 2020 | FINDING VALUE IN DEBT AND EQUITY
P R I M E O F F I C E S , R E Q U I R E D A N D E X P E C T E D R E T U R N , D E C - 2 0 T O D E C - 2 5
Source: CBRE Debt Map Q3 2020, CBRE EMEA prime office forecasts Q4 2019 and Q3 2020.
To summarise, we plot excess return on an ungeared against a geared basis, with the size of the bubble reflecting transaction volume in the 2017-19 period as a measure of liquidity –after all, performance is once thing but that performance must be accessible. We also rank the markets covered on each basis – this latter shows that there is limited difference in the positioning of the markets.
This layout suggests that investors looking to access large, liquid markets set to deliver high levels of positive excess return may target Frankfurt and London, followed by Paris. Amsterdam – by no means a small market –will also appeal.
Oslo, Brussels, Copenhagen may prove more difficult to access but the high level of excess return should justify persistence. Thereafter, Vienna, Warsaw, Helsinki and Prague deserve attention.
The relative attractiveness of markets is similar on a geared and ungeared basis. Of the largest markets, Frankfurt and London offer most appeal; of the next tier Oslo, Brussels, Vienna and Amsterdam are also compelling.
Vienna
Brussels
Prague
Copenhagen
Helsinki
Paris
Frankfurt
Budapest
Dublin
Milan
Amsterdam
Oslo
Warsaw
Bucharest
Madrid
London
-8
-6
-4
-2
0
2
4
6
8
10
12
-4 -2 0 2 4 6 8
exce
ss e
xpec
ted
retu
rn ve
rsus
requ
ired
retu
rn, g
eare
d, %
pa
excess expected return versus required return, ungeared, %pa
Excess Expected Return, ungeared and geared, prime office, Dec-20 to Dec-25
Rank of excess return, ungeared Rank of excess return, geared
1 Frankfurt Oslo
2 Brussels Brussels
3 Oslo Copenhagen
4 Copenhagen Frankfurt
5 London London
6 Vienna Vienna
7 Amsterdam Amsterdam
8 Helsinki Warsaw
9 Warsaw Prague
10 Prague Helsinki
11 Paris Paris
12 Dublin Dublin
13 Madrid Madrid
14 Milan Budapest
15 Budapest Milan
16 Bucharest Bucharest
G7 Members
Rest of West Group
Nordics
CEE Group
Market does not deliver positive excess return
Market turnover averaged €30bn 2017-19
Market turnover averaged €5bn 2017-19

MEZZANINE, WHOLE LOAN AND DEVELOPMENT FINANCE
WHERE ARE LENDING TERMS FURTHER UP THE RISK CURVE NOW, AND WHICH MARKETS APPEAR ATTRACTIVE?
29CBRE Q3 2020 | FINDING VALUE IN DEBT AND EQUITY
C H A N G E S I N M E Z Z A N I N E , W H O L E L O A N A N D D E V E L O P M E N T L E N D I N G F R O M Q 4 2 0 1 9 T O Q 3 2 0 2 0
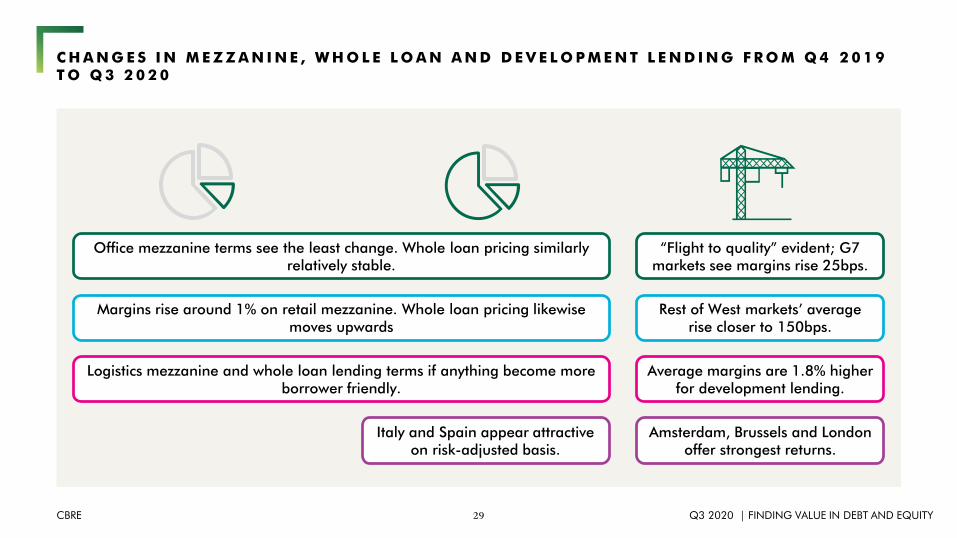
Office mezzanine terms see the least change. Whole loan pricing similarly relatively stable.
Margins rise around 1% on retail mezzanine. Whole loan pricing likewise moves upwards
Logistics mezzanine and whole loan lending terms if anything become more borrower friendly.
Italy and Spain appear attractive on risk-adjusted basis.
“Flight to quality” evident; G7 markets see margins rise 25bps.
Rest of West markets’ average rise closer to 150bps.
Average margins are 1.8% higher for development lending.
Amsterdam, Brussels and London offer strongest returns.

30CBRE Q3 2020 | FINDING VALUE IN DEBT AND EQUITY
M E Z Z A N I N E L E N D I N G K E Y T E R M S , T H R E E S E C T O R S , Q 3 2 0 2 0
Source: CBRE Debt Map Q3 2020.
Reflecting the pattern seen in senior lending, mezzanine lending terms have become significantly more expensive in the retail sector, slightly more onerous in the office market, but more borrower friendly in the logistics sector.
OFFICE RETAIL LOGISTICS
LTV Margin Total Cost of Debt LTV Margin Total Cost of Debt LTV Margin Total Cost of Debt
SAMPLE AVERAGE
↓ 75.56 (76.25) ↑ 7.22 (7.13) ↑ 7.52 (7.40)SAMPLE AVERAGE
↔ 75.00 (75.00) ↑ 8.94 (7.88) ↑ 9.24 (8.20)SAMPLE AVERAGE
↓ 76.67 (76.88) ↓ 7.44 (7.75) ↓ 7.77 (8.05)
Frankfurt ↔ 75.00 (75.00) ↔ 7.00 (7.00) ↑ 7.30 (7.25) Frankfurt ↔ 75.00 (75.00) ↔ 7.00 (7.00) ↑ 7.30 (7.25) Germany ↔ 75.00 (75.00) ↔ 7.00 (7.00) ↑ 7.30 (7.25)
Milan ↔ 70.00 (70.00) ↔ 7.50 (7.50) ↔ 7.80 (7.80) Milan ↔ 65.00 (65.00) ↔ 8.50 (8.50) ↔ 8.80 (8.80) Italy ↔ 70.00 (70.00) ↔ 8.00 (8.00) ↔ 8.30 (8.30)
London ↔ 70.00 (70.00) ↓ 5.00 (6.00) ↓ 5.30 (6.20) UK ↓ 70.00 (75.00) ↓ 5.00 (9.00) ↓ 5.30 (9.20)
Brussels ↓ 75.00 (80.00) ↑ 8.00 (7.50) ↑ 8.30 (7.80) Brussels ↓ 75.00 (80.00) ↑ 12.00 (8.50) ↑ 12.30 (8.80) Belgium ↓ 75.00 (80.00) ↔ 8.00 (8.00) ↔ 8.30 (8.30)
Dublin ↔ 75.00 (75.00) ↔ 7.00 (7.00) ↑ 7.30 (7.25) Dublin ↔ 75.00 (75.00) ↔ 7.00 (7.00) ↑ 7.30 (7.25) Ireland ↑ 80.00 (75.00) ↔ 7.00 (7.00) ↑ 7.30 (7.25)
Amsterdam ↓ 75.00 (80.00) ↑ 8.00 (7.00) ↑ 8.30 (7.30) Amsterdam ↓ 75.00 (80.00) ↑ 12.00 (9.00) ↑ 12.30 (9.50) Netherlands ↓ 75.00 (80.00) ↑ 8.00 (7.00) ↑ 8.30 (7.30)
Madrid 80.00 7.50 7.80 Madrid 75.00 10.00 10.30 Spain 85.00 8.00 8.30
Copenhagen ↔ 80.00 (80.00) ↔ 9.00 (9.00) ↔ 9.30 (9.30) Copenhagen ↔ 80.00 (80.00) ↔ 9.00 (9.00) ↔ 9.30 (9.30) Denmark ↔ 80.00 (80.00) ↔ 10.00 (10.00) ↔ 10.50 (10.50)
Oslo ↔ 80.00 (80.00) ↔ 6.00 (6.00) ↔ 6.30 (6.30) Oslo ↔ 80.00 (80.00) ↔ 6.00 (6.00) ↔ 6.30 (6.30) Norway ↔ 80.00 (80.00) ↔ 6.00 (6.00) ↔ 6.30 (6.30)
*Note: Q3 2020 figures shown with Q4 2019 in brackets. Arrows indicate direction of movement. Where ranges have been given for LTV or margin, midpoints have been used. We assume a 0% floor in the swap rate when calculating total cost of debt.*Note: The absence of markets from the above does not necessarily indicate that debt is not available in those markets, just that we have chosen not to provide figures for those markets.

31CBRE Q3 2020 | FINDING VALUE IN DEBT AND EQUITY
W H O L E L O A N L E N D I N G K E Y T E R M S , T H R E E S E C T O R S , Q 3 2 0 2 0
Source: CBRE Debt Map Q3 2020.
Combining senior and mezzanine lending terms gives whole loan lending terms. On average, the cost of office debt has risen slightly (7bps), while that of retail has risen by around the same than that of logistics has fallen (roughly 30bps).
OFFICE RETAIL LOGISTICS
LTV Margin Total Cost of Debt LTV Margin Total Cost of Debt LTV Margin Total Cost of Debt
SAMPLE AVERAGE
↓ 75.56 (76.25) ↑ 2.72 (2.39) ↑ 2.96 (2.89)SAMPLE AVERAGE
↔ 75.00 (75.00) ↑ 3.47 (2.90) ↑ 3.71 (3.42)SAMPLE AVERAGE
↓ 76.67 (76.88) ↓ 2.78 (2.79) ↓ 3.03 (3.30)
Frankfurt ↔ 75.00 (75.00) ↔ 2.20 (2.20) ↑ 2.37 (2.33) Frankfurt ↔ 75.00 (75.00) ↔ 2.20 (2.20) ↑ 2.37 (2.33) Germany ↔ 75.00 (75.00) ↔ 2.36 (2.36) ↑ 2.53 (2.49)
Milan ↔ 70.00 (70.00) ↓ 2.19 (2.27) ↓ 2.31 (2.40) Milan ↔ 65.00 (65.00) ↓ 3.69 (4.12) ↓ 3.92 (4.34) Italy ↔ 70.00 (70.00) ↓ 2.69 (3.11) ↓ 2.86 (3.29)
London ↔ 70.00 (70.00) ↓ 2.33 (2.43) ↓ 2.71 (3.47) LondonUnited Kingdom
↓ 70.00 (75.00) ↓ 2.36 (3.87) ↓ 2.75 (4.92)
Brussels ↓ 75.00 (80.00) ↑ 2.56 (2.38) ↑ 2.68 (2.50) Brussels ↓ 75.00 (80.00) ↑ 3.60 (2.49) ↑ 3.74 (2.60) Belgium ↓ 75.00 (80.00) ↑ 2.56 (2.43) ↑ 2.68 (2.53)
Dublin ↔ 75.00 (75.00) ↑ 3.11 (2.52) ↑ 3.31 (2.69) Dublin ↔ 75.00 (75.00) ↑ 3.67 (2.60) ↑ 3.90 (2.77) Ireland ↑ 80.00 (75.00) ↑ 2.88 (2.60) ↑ 3.06 (2.77)
Amsterdam ↓ 75.00 (80.00) ↑ 2.56 (2.20) ↑ 2.68 (2.30) Amsterdam ↓ 75.00 (80.00) ↑ 3.60 (2.95) ↑ 3.74 (3.11) Netherlands ↓ 75.00 (80.00) ↑ 2.56 (2.43) ↑ 2.68 (2.53)
Madrid 80.00 3.72 3.92 Madrid 75.00 4.83 5.03 Spain 85.00 3.59 3.78
Copenhagen ↔ 80.00 (80.00) ↑ 2.93 (2.92) ↓ 3.05 (3.05) Copenhagen ↔ 80.00 (80.00) ↑ 2.93 (2.92) ↓ 3.05 (3.05) Denmark ↔ 80.00 (80.00) ↑ 3.18 (3.17) ↓ 3.35 (3.35)
Oslo ↔ 80.00 (80.00) ↑ 2.88 (2.21) ↓ 3.61 (4.34) Oslo ↔ 80.00 (80.00) ↑ 3.22 (2.37) ↓ 3.96 (4.50) Norway ↔ 80.00 (80.00) ↑ 2.88 (2.35) ↓ 3.61 (4.49)
*Note: Q3 2020 figures shown with Q4 2019 in brackets. Arrows indicate direction of movement. Where ranges have been given for LTV or margin, midpoints have been used. We assume a 0% floor in the swap rate when calculating total cost of debt.*Note: The absence of markets from the above does not necessarily indicate that debt is not available in those markets, just that we have chosen not to provide figures for those markets.

32CBRE Q3 2020 | FINDING VALUE IN DEBT AND EQUITY
1.5
2.0
2.5
3.0
3.5
4.0
4.5
5.0
60 65 70 75 80 85
Mar
gin
LTV
Prime, primary market, whole loan lending
Office, Q4 2019 Office, Q3 2020Retail, Q4 2019 Retail, Q3 2020Logistics, Q4 2019 Logistics, Q3 2020
C H A N G E I N W H O L E L O A N L E N D I N G K E Y T E R M S A N D R I S K M E T R I C S , T H R E E S E C T O R S , Q 4 2 0 1 9 V S Q 3 2 0 2 0
Source: CBRE Debt Map Q3 2020.
Pricing on the highest leverage debt (80% LTV) has generally increased, although logistics has seen margin contraction for debt at lower leverage points. On the risk side, lenders are demonstrably wariest of retail.
Each dot represents an individual market
By plotting (in the left hand chart) LTV and margin and (in the right hand chart) debt yield and ICR for Q4 2019 and Q3 2020, the change in risk and reward across the sectors can be understood.
Generally speaking, it can be seen that higher leverage (80% LTV) debt has got more expensive across the board, where it remains available. For slightly lower leverage debt (75% LTV) offices have also seen an increase in margin, although the reverse has been true for logistics.
On the risk side, the biggest change is discernible in retail, where the drift of the shape to the right betrays a significant de-risking – the average debt yield has risen more than half a percent to 4.9%. By contrast, office has seen hardly any change, while the homogenisation of outlying risk metrics across logistics has seen little change on average.
High leverage debt getting more
expensive
Dotted lines = Q4 2019 Solid lines = Q3 2020
Logistics shape moves down in middle – 75% LTV whole loans
cheaper – but reverse true for offices0.5
1.0
1.5
2.0
2.5
3.0
3 4 5 6 7 8
ICR
Debt yield
Prime, primary market, whole loan lending
Office, Q4 2019 Office, Q3 2020Retail, Q4 2019 Retail, Q3 2020Logistics, Q4 2019 Logistics, Q3 2020
Dotted lines = Q4 2019 Solid lines = Q3 2020

33CBRE Q3 2020 | FINDING VALUE IN DEBT AND EQUITY
Milan
Madrid
Milan
Madrid
Italy
Spain
70
80
90
100
110
120
130
2.0 2.5 3.0 3.5 4.0 4.5 5.0 5.5
mar
gin+
fee
as p
ropo
rtion
of p
rope
rty yi
eld
min
us G
over
nmen
t bon
d, %
senior lending margin+fee, %
Whole loan returns, absolute and as proportion of property premium over risk free
Office Retail Logistics
C H A N G E I N W H O L E L O A N L E N D I N G K E Y T E R M S A N D R I S K M E T R I C S , T H R E E S E C T O R S , Q 4 2 0 1 9 V S Q 3 2 0 2 0
Source: CBRE Debt Map Q3 2020.
Italy and Spain may offer relatively attractive risk/reward combination for whole loan lenders. But other markets will also appeal to lenders if they are deemed more defensive against potential value decline.
Expressing the return real estate debt receives in absolute terms, in relative terms (compared to that which equity receives) and accounting for the level of exposure in a single metric is not easy. The chart on the left shows these metrics, while the chart on the right expresses absolute and proportional return relative to LTV on a standard score basis across the here sectors. The scores themselves are not specially meaningful, but their relativities are – a high (positive) score should mean a relatively attractive risk/return, a low (negative) one a poor risk/return.
Thanks to high returns relative to the risk free rate, Milan / Italy is an attractive outlier, while the same is also true of Madrid/Spain, though this is more driven by higher nominal returns.
Frankfurt / Germany appears, although the drawback of this analysis is the implicit assumption that LTV covers all downside risk, whereas, if the risk of value decline is not equal across all markets, this does not capture everything. Therefore, defensiveness may explain some apparently poorer prospects.
70% LTV 75% LTV 80% LTV
-3
-2
-1
0
1
2
3
4
Brus
sels
Cope
nhag
enFr
ankf
urt
Dubl
inM
ilan
Amste
rdam Os
loM
adrid
Lond
onBr
usse
lsCo
penh
agen
Fran
kfur
tDu
blin
Mila
nAm
sterd
am Oslo
Mad
ridBe
lgiu
mDe
nmar
kGe
rman
yIre
land
Italy
Neth
erla
nds
Norw
aySp
ain
Unite
d Ki
ngdo
m
Office Retail Logistics
stan
dard
scor
e
Standard score of absolute and proportional whole loan return, calculated across all sectors
Margin & Fee / LTV Share of Premium over 5yr Gov Bond / LTV Sum

34CBRE Q3 2020 | FINDING VALUE IN DEBT AND EQUITY
D E V E L O P M E N T L E N D I N G K E Y T E R M S , P R I M E O F F I C E , Q 3 2 0 2 0
Source: CBRE Debt Map Q3 2020.
As with lending to mature investments, when comparing Q4 2019 and Q3 2020 lending terms for prime senior office development, the largest markets have seen comparatively more stability. LTCs and margins are unchanged two of the G7 member markets (Frankfurt and Milan), while Paris and London have seen margins rise 50bps – albeit that LTCs have moved in different directions, with London also benefiting from a fall in the five year swap rate.
In contrast, other markets for which we have comparison figures available have generally seen margins and total cost of debt rise quite significantly (on average by 1.5% or so) and LTCs fall (on average by 7.5pp).
This is consistent of course with a lender community wishing to understand the more medium term impact on office demand of Covid-19, and the structural shifts it has potentially accelerated, before committing to speculative projects.
LTC Margin Total Cost of Debt LTC Margin Total Cost of Debt
G7 MEMBERS ↔ 62.50 (62.50) ↑ 3.41 (3.16) ↑ 3.67 (3.58) NORDICS ↓ 60.00 (62.50) ↑ 2.75 (2.25) ↑ 2.85 (2.35)
Paris ↓ 60.00 (70.00) ↑ 2.50 (2.00) ↑ 2.70 (2.20) Copenhagen
Frankfurt ↔ 70.00 (70.00) ↔ 2.25 (2.25) ↑ 2.39 (2.35) Helsinki ↓ 60.00 (65.00) ↑ 2.75 (2.25) ↑ 2.85 (2.35)
Milan ↔ 60.00 (60.00) ↔ 3.90 (3.90) ↔ 4.10 (4.10) Oslo
London ↑ 60.00 (50.00) ↑ 5.00 (4.50) ↓ 5.50 (5.68) Stockholm
LTC Margin Total Cost of Debt LTC Margin Total Cost of Debt
REST OF WEST GROUP ↓ 62.50 (70.00) ↑ 4.75 (3.33) ↑ 4.99 (3.52) CEE GROUP 64.17 2.95 3.05
Vienna 65.00 2.50 2.60 Prague 67.50 2.35 2.45
Brussels ↓ 60.00 (75.00) ↑ 6.00 (2.25) ↑ 6.30 (2.40) Budapest 62.50 2.80 2.90
Dublin ↑ 65.00 (60.00) ↓ 4.50 (5.50) ↓ 4.75 (5.75) Warsaw
Amsterdam ↓ 60.00 (75.00) ↑ 6.00 (2.25) ↑ 6.30 (2.40) Bucharest 62.50 3.70 3.80
Lisbon ↔ 70.00 (70.00) ↔ 3.50 (3.50) ↔ 3.70 (3.70) Bratislava 67.50 2.50 2.60
Madrid 50.00 3.25 3.55 *Note: Q3 2020 figures shown with Q4 2019 in brackets. Arrows indicate direction of movement. Where ranges have been given for LTV or margin, midpoints have been used. We assume a 0% floor in the swap rate when calculating total cost of debt.Zurich ↓ 60.00 (70.00) ↓ 2.25 (2.50) ↓ 2.25 (2.57)
The “flight to quality” evident in the lending market for prime office investment was all the more evident in that for prime office development, as lending terms in the largest markets saw less turbulence than elsewhere.

35CBRE Q3 2020 | FINDING VALUE IN DEBT AND EQUITY
C H A N G E I N W H O L E L O A N L E N D I N G K E Y T E R M S A N D R I S K M E T R I C S , T H R E E S E C T O R S , Q 4 2 0 1 9 V S Q 3 2 0 2 0
On average, lenders receive a premium of 1.8% for development (rather than investment) lending at only slightly higher LTC. In Amsterdam, Brussels and London the relative risk/return is particularly attractive, especially given the solid outlook for capital growth.
Each dot represents an individual market
The chart to the left plots LTC against margin for senior prime office development lending, and confirms the broad shift of rising margins and falling LTCs. The chart to the right examines the premium that lenders receive from development lending versus investment lending, plotting the additional margin received against the LTV versus LTC differential. In addition, as a measure of risk, the size of each dot reflects forecast capital growth (larger dots are higher growth and therefore likely lower risk).
On average, lenders receive 1.81% higher margins for development lending, at the cost of an average LTC 2pp higher than the investment LTV. There is huge variation around this figure however, and the markets of Amsterdam, Brussels, London, Dublin and Milan stand out as offering above average returns. While Milan and Dublin are higher risk because of weaker growth forecasts (and Dublin LTCs are on the high side), the other three markets have above average growth forecasts and a margin premium of 3.35% (London) and 5% (Amsterdam and Brussels).
1.5
2.0
2.5
3.0
3.5
4.0
4.5
5.0
5.5
6.0
6.5
45 50 55 60 65 70 75 80
Mar
gin
LTC
Prime Office, primary market, development, senior lending
Q4 2019 Q3 2020 Q4 2019 average Q3 2020 average
Vienna
Brussels
Prague
Helsinki
Paris
Frankfurt
Budapest
DublinMilan
Amsterdam
LisbonBucharest
Bratislava
Madrid Zurich
London
-1
0
1
2
3
4
5
6
-10 -5 0 5 10 15
Dev
elop
men
t mar
gin
prem
ium
vers
us In
vestm
ent,
pp
Development LTC minus Investment LTV, pp
Comparison of lending terms, Prime Office, primary market, investment versus development
Office, Q3 2020
Average
-2%pa 0%pa +2%pa
Each dot represents an individual market
Size of dot represents forecast Dec-20 to Dec-25 capital growth
Source: CBRE Debt Map Q3 2020, CBRE EMEA prime office forecasts Q3 2020.
Similar return premium but huge range in LTC:LTV differential
High return premium at little additional LTC

36CBRE Q3 2020 | FINDING VALUE IN DEBT AND EQUITY
This presentation has been prepared in good faith based on CBRE’s current views of the commercial real-estate market. Although CBRE believes its views reflect market conditions on the date of this presentation, they are subject to significant uncertainties and contingencies, many of which are beyond CBRE’s control. In addition, many of CBRE’s views are opinion and/or projections based on CBRE’s subjective analyses of current market circumstances. Other firms may have different opinions, projections and analyses, and actual market conditions in the future may cause CBRE’s current views to later be incorrect. CBRE has no obligation to update its views herein if its opinions, projections, analyses or market circumstances later change.
Nothing in this presentation should be construed as an indicator of the future performance of CBRE’s securities or of the performance of any other company’s securities. You should not purchase or sell securities – of CBRE or any other company – based on the views herein. CBRE disclaims all liability for securities purchased or sold based on information herein, and by viewing this presentation, you waive all claims against CBRE and the presenter as well as against CBRE’s affiliates, officers, directors, employees, agents, advisers and representatives arising out of the accuracy, completeness, adequacy or your use of the information herein.
DISCLAIMERS AND WAIVERS
36

LO
ND
ON
EM
EA
DEBT & STRUCTURED FINANCEUK & EMEA
PAUL COATESHead of Debt and Structured Finance UK & EMEA
STEVE WILLIAMSONChairman of Debt and Structured Finance
EXECUTIVE & SENIOR DIRECTORS
ANDREA PITTALUGASENIOR DIRECTOREUROPE
CHIARA ZUCCONSENIOR DIRECTOR
DIRECTORS
MICHELLE QUINNDIRECTOR
CHRIS MARCHANTDIRECTOR
IRELAND
ANDY TALLONEXECUTIVE DIRECTOR
THE NETHERLANDS
ROBERT-JANPETERSEXECUTIVE DIRECTOR
PHILIP ZWARTSENIOR DIRECTOR
AARTVISSERDIRECTOR
REMKE MORAALDIRECTOR
GREGOIRECHALLESENIORDIRECTOR
FRANCE
MARTINAMUEHLHOFERHEAD OF CAPITALADVISORS ITALY
ITALY
JURAJBIELIKASSOCIATE DIRECTOR
SLOVAKIA
SWITZERLAND
AMINEHAMDANIEXECUTIVE DIRECTOR
FINLAND
ANNE LAUKIASENIOR DIRECTOR
PIOTR PIKIEWICZASSOCIATEDIRECTOR
POLAND
IGORBORREGOASSOCIATEDIRECTOR
PORTUGAL
DIRK RICHOLTMANAGING DIRECTOR
GERMANY
SPAIN
IÑIGOLASPIURNATIONAL DIRECTOR
ADAM LUCIUKHEAD OF DSF
POLAND
JOHN HARDIEDIRECTOR
STEPHEN BARRDIRECTOR
CHRISGOWEXECUTIVE DIRECTOR
CZECH REPUBLIC
JAKUBSTANISLAVDIRECTOR
SPAIN
IGNACIOMATIACCIDIRECTOR
DOMINIC SMITHSENIOR DIRECTOR
RESEARCH