Embed Size (px)
Citation preview
24 Oilfield Review
Finding Value in Formation Water
Operators usually consider formation water an undesirable byproduct of hydrocarbon
production. However, samples and analysis of that same water can provide vital
information for the field development plan, including optimization of completion
design, materials selection and hydrocarbon recovery.
Medhat AbdouAbu Dhabi Company for Onshore OperationsAbu Dhabi, UAE
Andrew CarnegieWoodside PetroleumPerth, Western Australia, Australia
S. George MathewsKevin McCarthyHouston, Texas, USA
Michael O’KeefeLondon, England
Bhavani RaghuramanPrinceton, New Jersey, USA
Wei WeiChevronHouston, Texas
ChengGang XianShenzhen, China
Oilfield Review Spring 2011: 23, no. 1. Copyright © 2011 Schlumberger.For help in preparation of this article, thanks to Sherif Abdel-Shakour and Greg Bowen, Abu Dhabi, UAE; Ahmed Berrim, Abu Dhabi Marine Operating Company, Abu Dhabi, UAE; Hadrien Dumont, Balikpapan, Indonesia; Will Haug, Cuong Jackson and Oliver Mullins, Houston; Chee Kin Khong, Luanda, Angola; Cholid Mas, Jakarta; and Artur Stankiewicz, Clamart, France.InSitu Density, InSitu Fluid Analyzer, InSitu pH, MDT, Oilphase-DBR, PS Platform and Quicksilver Probe are marks of Schlumberger.
At the mention of unexpected formation water in their wells, many oil and gas producers react with alarm. Unanticipated water production, particu-larly if it contains unwanted impurities, can significantly reduce the value of a hydrocarbon asset. It can accelerate equipment damage and
increase water handling and disposal costs. But capturing a certain amount of formation water is also valuable; water properties contain a wealth of information that can be used to significantly impact field economics.
1. Ali SA, Clark WJ, Moore WR and Dribus JR: “Diagenesis and Reservoir Quality,” Oilfield Review 22, no. 2 (Summer 2010): 14–27.
2. Interstitial water is the water between grains. For more on evaporites: Warren JK: Evaporites: Sediments, Resources and Hydrocarbons. Berlin, Germany: Springer, 2006.
Spring 2011 25
Formation water analysis plays a role in dynamic modeling of reservoirs, quantifying reserves and calculating completion costs, includ-ing how much will be spent on casing and surface equipment—capital expenditures (capex). Water analysis also helps operators estimate operating expenditures (opex), such as the cost of chemical injection. Quantifying water chemistry aids in the understanding of reservoir connectivity and in characterizing transition zones in carbonates, thereby impacting estimates of reservoir extent. It helps development planners determine whether new discoveries can be tied into existing infra-structure and is crucial for designing water injec-tion projects.
Formation water properties vary from one reservoir to another as well as within reservoirs. Water composition depends on a number of parameters, including depositional environment, mineralogy of the formation, its pressure and temperature history and the influx or migration of fluids. Consequently, water properties can change over time as the water and rock interact, and as reservoir fluids are produced and replaced with water from other formations, injected water or other injected fluids.
This article examines the causes of variation in water composition and describes the value of formation water analysis throughout reservoir life, from exploration to development and pro-duction. Examples from Norway, the Middle East, the Gulf of Mexico and China illustrate methods for collecting high-quality water samples and show how formation water analysis both down-hole and at surface conditions contributes to res-ervoir understanding and development.
Water CompositionMost reservoir rocks are formed in water, by the deposition of rock grains or biological detritus. The water that remains trapped in pores as the sediments compact and bind together is called connate water; the water in the reservoir at the time it is penetrated by a drill bit is called forma-tion water. Connate water reacts with the rock to an extent that depends on temperature, pres-sure, the composition of the water and the miner-alogy of the formation. Chemical and biological reactions may begin as soon as sediments are deposited. The reactions can continue and accel-erate as the formation is subjected to greater pressure and temperature during burial. The combined effects of these chemical, physical and biological processes are known as diagenesis.1 Although a great deal of effort has gone into studying the impact of diagenesis on rock forma-tions, relatively little has been made to under-
stand how it affects the original fluid within the rock—the water.
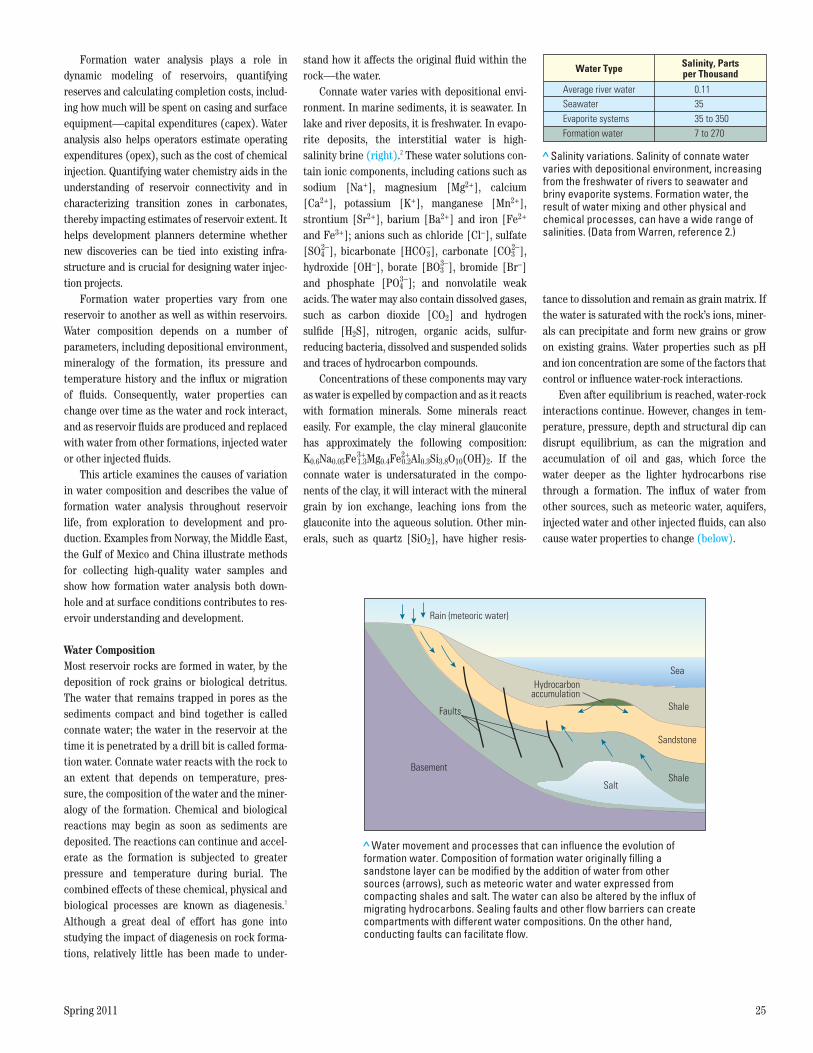
Connate water varies with depositional envi-ronment. In marine sediments, it is seawater. In lake and river deposits, it is freshwater. In evapo-rite deposits, the interstitial water is high- salinity brine (right).2 These water solutions con-tain ionic components, including cations such as sodium [Na+], magnesium [Mg2+], calcium [Ca2+], potassium [K+], manganese [Mn2+], strontium [Sr2+], barium [Ba2+] and iron [Fe2+ and Fe3+]; anions such as chloride [Cl–], sulfate [SO4
2–], bicarbonate [HCO3–], carbonate [CO3
2–], hydroxide [OH–], borate [BO3
3–], bromide [Br–] and phosphate [PO4
3–]; and nonvolatile weak acids. The water may also contain dissolved gases, such as carbon dioxide [CO2] and hydrogen sulfide [H2S], nitrogen, organic acids, sulfur-reducing bacteria, dissolved and suspended solids and traces of hydrocarbon compounds.
Concentrations of these components may vary as water is expelled by compaction and as it reacts with formation minerals. Some minerals react easily. For example, the clay mineral glauconite has approximately the following composition: K0.6Na0.05Fe3+
1.3Mg0.4Fe2+0.2Al0.3Si3.8O10(OH)2. If the
connate water is undersaturated in the compo-nents of the clay, it will interact with the mineral grain by ion exchange, leaching ions from the glauconite into the aqueous solution. Other min-erals, such as quartz [SiO2], have higher resis-
tance to dissolution and remain as grain matrix. If the water is saturated with the rock’s ions, miner-als can precipitate and form new grains or grow on existing grains. Water properties such as pH and ion concentration are some of the factors that control or influence water-rock interactions.
Even after equilibrium is reached, water-rock interactions continue. However, changes in tem-perature, pressure, depth and structural dip can disrupt equilibrium, as can the migration and accumulation of oil and gas, which force the water deeper as the lighter hydrocarbons rise through a formation. The influx of water from other sources, such as meteoric water, aquifers, injected water and other injected fluids, can also cause water properties to change (below).
> Salinity variations. Salinity of connate water varies with depositional environment, increasing from the freshwater of rivers to seawater and briny evaporite systems. Formation water, the result of water mixing and other physical and chemical processes, can have a wide range of salinities. (Data from Warren, reference 2.)
Average river water
Water Type Salinity, Partsper Thousand
0.11
Formation water 7 to 270
Seawater 35Evaporite systems 35 to 350
>Water movement and processes that can influence the evolution of formation water. Composition of formation water originally filling a sandstone layer can be modified by the addition of water from other sources (arrows), such as meteoric water and water expressed from compacting shales and salt. The water can also be altered by the influx of migrating hydrocarbons. Sealing faults and other flow barriers can create compartments with different water compositions. On the other hand, conducting faults can facilitate flow.
Basement
Faults
Rain (meteoric water)
Sea
Shale
Hydrocarbonaccumulation
ShaleSalt
Sandstone
26 Oilfield Review
Production of formation water is another cause of disequilibrium; dissolved minerals and gases may come out of solution as the fluid is brought to the surface—especially in reaction to sulfates introduced into the formation through drilling fluid invasion or injection of seawater. These losses of the dissolved components alter the composition of the produced or sampled water, so water recovered at the surface may not represent the actual formation water in place. For this reason it is important to collect and analyze formation water under in situ conditions, and to continue to do so as reservoir conditions change.
Applications of Water AnalysisFormation water is rich with information about the rock in which it resides, and it can provide crucial input to analyses during every stage in the life of a reservoir. Early in field life, analysis of for-mation water establishes the salinity and resistiv-ity of the water for petrophysical evaluation.3 Archie’s water saturation equation, from which oil saturation and reserves are most frequently com-puted from logs, requires formation water resistiv-ity as an input. That value is often computed from resistivity and porosity logging measurements made in a water zone, where the water may not have the same composition as the reservoir forma-tion water in other zones. Analysis of formation water samples from the oil leg is considered one of the most reliable ways to obtain water salinity and resistivity for saturation calculations.
Before the material for casing or production tubing is selected, it is vital to evaluate the cor-rosivity of the gas, oil and water to be produced. Free gas in the formation may contain corrosive constituents—such as H2S and CO2—and these same constituents may be dissolved in the forma-tion water. Wells producing such fluids at concen-trations exceeding certain limits require casing with special metallurgical formulations that will resist corrosion, or treatment with corrosion-inhibiting chemicals.4 Furthermore, pipelines and surface facilities must be capable of handling the produced water with its accompanying gases (see “Pipeline to Market,” page 4). To design pro-duction tubing, flowlines and surface facilities, engineers must know the chemical composition of the formation water. The water pH and salinity values used in metallurgical calculations for selection of tubulars must include values for downhole conditions of reservoir pressure and temperature and water composition.5
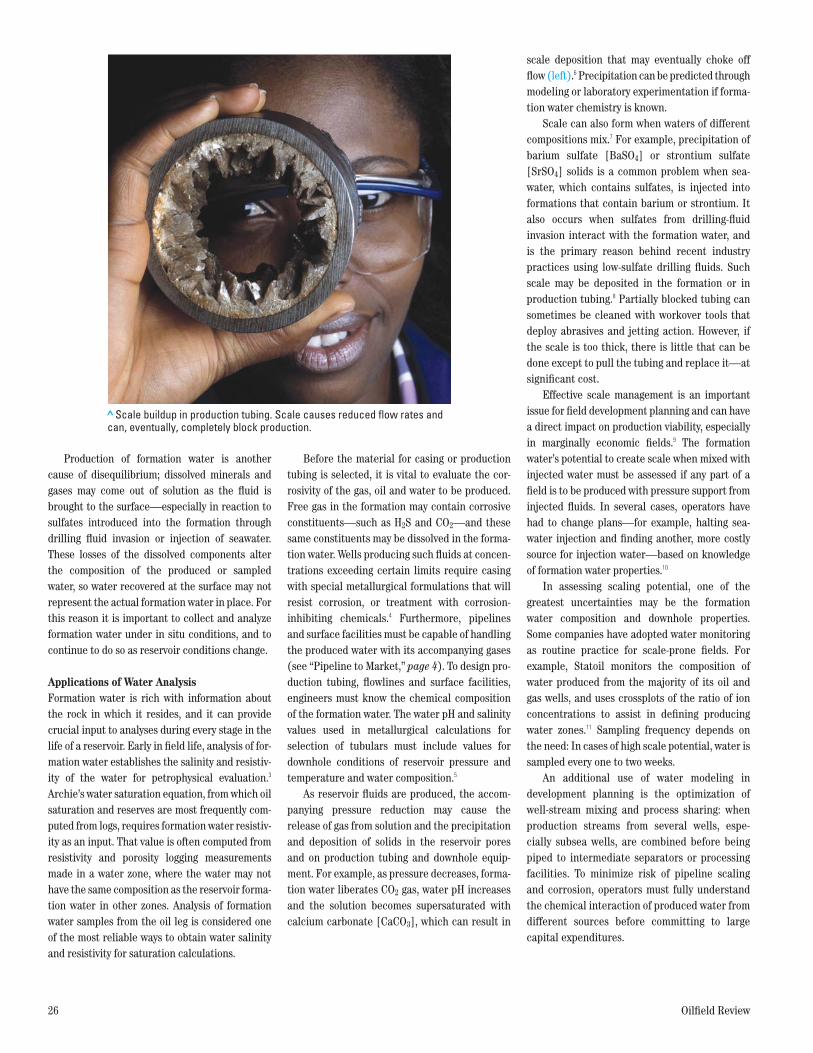
As reservoir fluids are produced, the accom-panying pressure reduction may cause the release of gas from solution and the precipitation and deposition of solids in the reservoir pores and on production tubing and downhole equip-ment. For example, as pressure decreases, forma-tion water liberates CO2 gas, water pH increases and the solution becomes supersaturated with calcium carbonate [CaCO3], which can result in
scale deposition that may eventually choke off flow (left).6 Precipitation can be predicted through modeling or laboratory experimentation if forma-tion water chemistry is known.
Scale can also form when waters of different compositions mix.7 For example, precipitation of barium sulfate [BaSO4] or strontium sulfate [SrSO4] solids is a common problem when sea-water, which contains sulfates, is injected into formations that contain barium or strontium. It also occurs when sulfates from drilling-fluid invasion interact with the formation water, and is the primary reason behind recent industry practices using low-sulfate drilling fluids. Such scale may be deposited in the formation or in production tubing.8 Partially blocked tubing can sometimes be cleaned with workover tools that deploy abrasives and jetting action. However, if the scale is too thick, there is little that can be done except to pull the tubing and replace it—at significant cost.
Effective scale management is an important issue for field development planning and can have a direct impact on production viability, especially in marginally economic fields.9 The formation water’s potential to create scale when mixed with injected water must be assessed if any part of a field is to be produced with pressure support from injected fluids. In several cases, operators have had to change plans—for example, halting sea-water injection and finding another, more costly source for injection water—based on knowledge of formation water properties.10
In assessing scaling potential, one of the greatest uncertainties may be the formation water composition and downhole properties. Some companies have adopted water monitoring as routine practice for scale-prone fields. For example, Statoil monitors the composition of water produced from the majority of its oil and gas wells, and uses crossplots of the ratio of ion concentrations to assist in defining producing water zones.11 Sampling frequency depends on the need: In cases of high scale potential, water is sampled every one to two weeks.
An additional use of water modeling in development planning is the optimization of well-stream mixing and process sharing: when production streams from several wells, espe-cially subsea wells, are combined before being piped to intermediate separators or processing facilities. To minimize risk of pipeline scaling and corrosion, operators must fully understand the chemical interaction of produced water from different sources before committing to large capital expenditures.
> Scale buildup in production tubing. Scale causes reduced flow rates and can, eventually, completely block production.
Spring 2011 27
Formation water composition plays a role in “souring,” a process in which H2S concentration increases in the reservoir.12 In many cases, souring is attributed to microbial activity; injected seawa-ter provides a source of sulfate-reducing bacteria (SRB) and the formation water supplies nutrients in the form of low–molecular weight organic acids known as volatile fatty acids (VFAs). The conse-quences of reservoir souring are potentially costly. Increased levels of H2S increase safety risks for oilfield personnel, decrease the sales value of pro-duced hydrocarbons and increase corrosion rates in downhole equipment and surface facilities. An estimated 70% of waterflooded reservoirs world-wide have soured.13 Understanding water proper-ties and modeling their changes throughout reservoir life help chemical engineers predict H2S generation and make informed decisions regard-ing materials selection and facility design. Low-contamination water samples, therefore, are essential to establish the level of VFAs in the for-mation water.14
Variations in formation water composition can also reveal compartmentalization—or lack of hydraulic communication between adjacent reservoir volumes—if the reservoirs have been isolated long enough for their formation waters to have reached different equilibrium states. Understanding reservoir connectivity is impor-tant for estimating the extent of aquifer sup-port—the natural water drive present in many reservoirs—and for planning development well locations, formulating injection-related recovery
programs and detecting injection-water break-through. Analysis of formation water, and in par-ticular, comparison of its natural isotopic composition with that of injection water, has been used for monitoring waterfloods.15 Isotopes act as tracers in the water to help reservoir engi-neers identify high-permeability layers, fractures and other causes of interwell communication.
Sampling WaterWater samples can be collected by several meth-ods. Samples of produced water can be obtained at the wellhead or from surface separators, but these may not be representative of formation water if gases have evolved or compounds have precipitated. However, these samples are useful and are typically collected for production surveil-lance. Surface samples are used to monitor changes in water properties over time, to identify breakthrough of injection water and to compare with samples from other producing wells to understand reservoir connectivity. Acquiring such samples is less expensive than downhole sampling and can be done more routinely. Water samples can also be retrieved from preserved core.16 However, samples recovered by this tech-nique have undergone pressure and temperature decrease, and therefore may not be representa-tive of actual formation water.
During the exploration and appraisal stages, when an operator builds an understanding of the reservoir fluids and uses the data for modeling, it is vital to have representative water samples.
Representative samples can be collected by a wireline formation tester equipped with a probe or dual packer, a pumpout module, downhole fluid-analysis capabilities and sample chambers. The downhole water-sampling process begins with a cleanup stage, in which fluid—initially a mixture of mud filtrate and formation water—is drawn from the formation through the probe into the tool.17 As pumping time increases, the propor-tion of mud filtrate, or contamination, decreases, and the proportion of pure formation water in the flowline increases.
If the optical or resistivity properties of the filtrate are significantly different from those of the formation water, optical fluid analyzers or resistivity sensors located in the tool flowline can measure the difference and thereby monitor con-tamination in real time. In the early stages of cleanup, the water is not pure enough to collect, and it is returned to the borehole. When the con-tamination is below a designated level, the fluid is directed into pressurized sample chambers, which are brought to the surface and transported to a laboratory for analysis.18
The quality of samples acquired downhole depends on the method of sampling and the type of drilling mud used in the sampled zones. In zones drilled with oil-base muds (OBMs), high-quality water samples can usually be obtained because the mud filtrate is not miscible with the formation water. Formation water and OBM typi-cally have different optical and resistivity proper-ties, allowing them to be distinguished by optical
3. Warren EA and Smalley PC (eds): North Sea Formation Waters Atlas. London: The Geological Society, Geological Society of London Memoir 15 (1994).
4. For more on corrosion, see Acuña IA, Monsegue A, Brill TM, Graven H, Mulders F, Le Calvez J-L, Nichols EA, Zapata Bermudez F, Notoadinegoro DM and Sofronov I: “Scanning for Downhole Corrosion,” Oilfield Review 22, no. 1 (Spring 2010): 42–50.
5. Williford J, Rice P and Ray T: “Selection of Metallurgy and Elastomers Used in Completion Products to Achieve Predicted Product Integrity for the HP/HT Oil and Gas Fields of Indonesia,” paper SPE 54291, presented at the SPE Asia Pacific Oil and Gas Conference and Exhibition, Jakarta, April 20–22, 1999.
6. Ramstad K, Tydal T, Askvik KM and Fotland P: “Predicting Carbonate Scale in Oil Producers from High Temperature Reservoirs,” paper SPE 87430, presented at the Sixth International Symposium on Oilfield Scale, Aberdeen, May 26–27, 2004.
7. Mackay DJ and Sorbie KS: “Brine Mixing in Water-flooded Reservoir and the Implications for Scale Prevention,” paper SPE 60193, presented at the Second International Symposium on Oilfield Scale, Aberdeen, January 26–27, 2000.
8. Bezerra MCM, Rosario FF, Rocha AA and Sombra CL: “Assessment of Scaling Tendency of Campos Basin Fields Based on the Characterization of Formation Waters,” paper SPE 87452, presented at the Sixth International Symposium on Oilfield Scale, Aberdeen, May 26–27, 2004.
For an overview of scaling causes and mitigation: Crabtree M, Eslinger D, Fletcher P, Miller M, Johnson A and King G: “Fighting Scale—Removal and Prevention,” Oilfield Review 11, no. 3 (Autumn 1999): 30–45.
9. Graham GM and Collins IR: “Assessing Scale Risks and Uncertainties for Subsea Marginal Field Developments,” paper SPE 87460, presented at the Sixth International Symposium on Oilfield Scale, Aberdeen, May 26–27, 2004.
10. Graham and Collins, reference 9. Andersen KI, Halvorsen E, Sælensminde T and
Østbye NO: “Water Management in a Closed Loop—Problems and Solutions at Brage Field,” paper SPE 65162, presented at the SPE European Petroleum Conference, Paris, October 24–25, 2000.
11. Ramstad K, Rohde HC, Tydal T and Christensen D: “Scale Squeeze Evaluation Through Improved Sample Preservation, Inhibitor Detection and Minimum Inhibitor Concentration Monitoring,” paper SPE 114085, presented at the SPE International Oilfield Scale Conference, Aberdeen, May 28–29, 2008.
12. Farquhar GB: “A Review and Update of the Role of Volatile Fatty Acids (VFA’s) in Seawater Injection Systems,” paper NACE 98005, presented at the 53rd NACE Annual Conference, San Diego, California, USA, March 22–27, 1998.
Mueller RF and Nielsen PH: “Characterization of Thermophilic Consortia from Two Souring Oil Reservoirs,” Applied and Environmental Microbiology 62, no. 9 (September 1996): 3083–3807.
13. Elshahawi H and Hashem M: “Accurate Measurement of the Hydrogen Sulfide Content in Formation Water Samples—Case Studies,” paper SPE 94707, presented at the Annual Technical Conference and Exhibition, Dallas, October 9–12, 2005.
14. Elshahawi and Hashem, reference 13.15. Carrigan WJ, Nasr-El-Din HA, Al-Sharidi SH and
Clark ID: “Geochemical Characterization of Injected and Produced Water from Paleozoic Oil Reservoirs in Central Saudi Arabia,” paper SPE 37270, presented at the International Symposium on Oilfield Chemistry, Houston, February 18–21, 1997.
Danquigny J, Matthews J, Noman R and Mohsen AJ: “Assessment of Interwell Communication in the Carbonate Al Khalij Oilfield Using Isotope Ratio Water Sample Analysis,” paper IPTC 10628, presented at the International Petroleum Technology Conference, Doha, Qatar, November 21–23, 2005.
Smalley PC and England WA: “Reservoir Compartmen-talization Assessed with Fluid Compositional Data,” SPE Reservoir Engineering (August 1994): 175–180.
Ramstad et al, reference 11.16. Smalley and England, reference 15.17. Mud filtrate is the portion of the drilling fluid that invades
the formation during the creation of mudcake on the borehole wall. The filtrate is driven into the formation by the pressure difference between the drilling mud and the formation fluid.
18. Creek J, Cribbs M, Dong C, Mullins OC, Elshahawi H, Hegeman P, O’Keefe M, Peters K and Zuo JY: “Downhole Fluids Laboratory,” Oilfield Review 21, no. 4 (Winter 2009/2010): 38–54.
28 Oilfield Review
fluid analyzers and resistivity sensors. Water-base mud (WBM) filtrate, on the other hand, has opti-cal properties similar to those of the formation water, so the two are difficult to distinguish by color. Also, WBM is miscible with formation water and can mix and react with it, leading to contami-nated and unrepresentative water samples unless special care is taken to pump for a long time to collect uncontaminated samples.
The Quicksilver Probe focused extraction technology can collect virtually contamination-free formation fluids, which is especially impor-tant when sampling formation water in the presence of WBM filtrate.19 The tool’s articulated probe, which contacts the formation at the bore-hole wall, draws filtrate-contaminated fluid to the perimeter of the contact area, where it is pumped into a discharge flowline. This diversion preferentially allows pure reservoir fluid to flow into the sampling flowline. The probe can be run as a module combined with the InSitu Fluid Analyzer tool in the MDT modular formation dynamics tester.
Ideal sampling consists of collecting a single-phase sample and keeping it in single phase as it is brought to the surface and transported to the
laboratory. The Oilphase-DBR single-phase multi-sample chamber (SPMC) uses a nitrogen charge to maintain downhole pressure on the reservoir fluid sample between the downhole collection point and the laboratory. This practice ensures that gases and salts remain in solution during the trip from downhole to the laboratory, which may not be possible with standard sample chambers.
Single-phase samples can also be obtained from drillstem tests (DSTs). Usually, water is not intentionally sampled during a DST, but some operators make special efforts to study water composition and will collect DST water samples for laboratory analysis.20
Formation water samples can be obtained later in field life during production logging opera-tions. However, obtaining formation samples prior to production is crucial for recording the baseline composition. The Compact Production Sampler captures conventional bottomhole sam-ples in producing wells. It can be run in any sec-tion of the PS Platform production logging string, conveyed by either slickline or electric line.
Once the samples have been retrieved, they are transported to a laboratory and recondi-tioned to downhole conditions before analysis,
described in a later section. The results are entered in a multiphase equilibrium model—various models are available commercially—to predict downhole pH and the potential for corro-sion, scale and hydrate formation.
Because of the lack of a pH measurement on reconditioned samples, chemical engineers use equilibrium modeling to predict pH under reser-voir conditions. However, uncertainties in the thermodynamic models for formation waters at high temperatures and pressures, as well as uncertainties associated with the possible pre-cipitation of salts, can propagate errors into scale and corrosion models. Furthermore, unless tools such as the SPMC are used, changes in pres-sure and temperature as the water sample is transported uphole may induce phase changes that are not always fully reversible during the reconditioning process.21
Since pH is a key parameter in understanding water chemistry and plays a major role in predict-ing corrosion and scale deposition, obtaining reli-able pH measurements on formation water at downhole conditions has been a priority for oil-field fluid specialists.
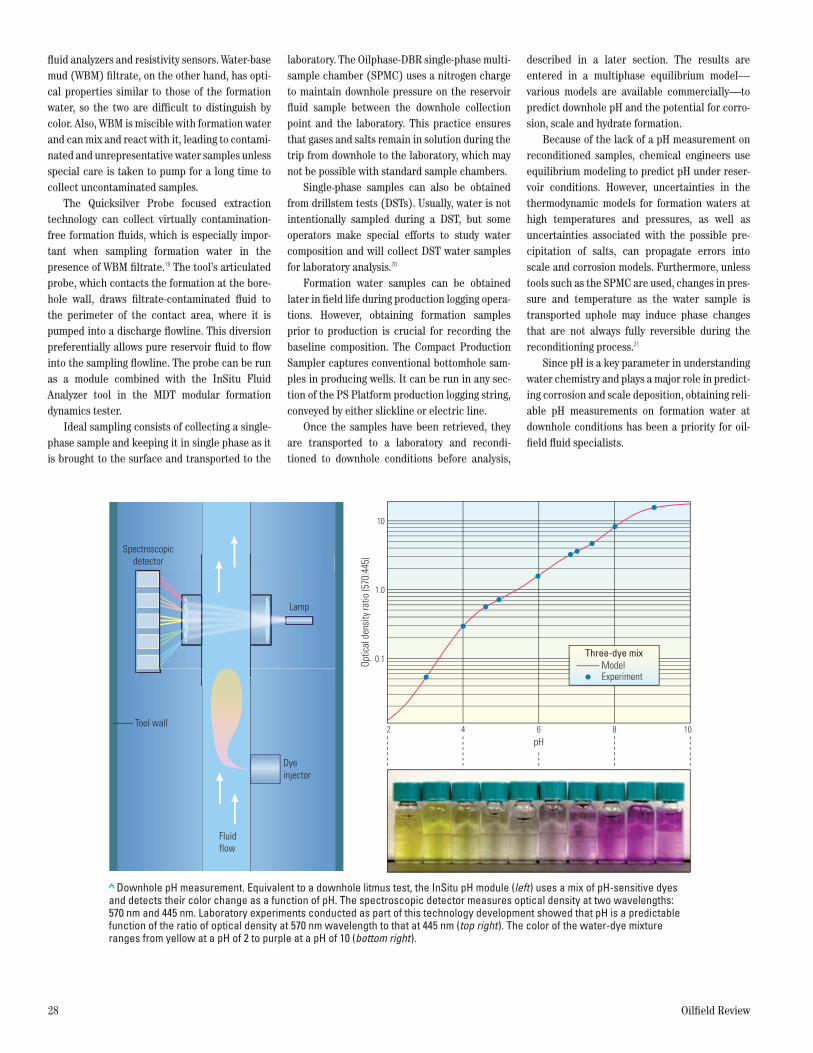
> Downhole pH measurement. Equivalent to a downhole litmus test, the InSitu pH module (left) uses a mix of pH-sensitive dyes and detects their color change as a function of pH. The spectroscopic detector measures optical density at two wavelengths: 570 nm and 445 nm. Laboratory experiments conducted as part of this technology development showed that pH is a predictable function of the ratio of optical density at 570 nm wavelength to that at 445 nm (top right). The color of the water-dye mixture ranges from yellow at a pH of 2 to purple at a pH of 10 (bottom right).
pH
Optic
al d
ensi
ty ra
tio (5
70:4
45)
2
0.1
1.0
10
4 6 8 10
ModelThree-dye mix
Experiment
Tool wall
Fluid flow
Dye injector
Spectroscopicdetector
Lamp
Spring 2011 29
Measuring pH In SituSchlumberger researchers developed a method for measuring pH downhole using pH-sensitive dyes.22 The InSitu pH reservoir fluid sensor works on the same proven principles as other downhole optical fluid analyzers designed for hydrocarbon analysis.23 One difference, though, is that the InSitu pH module injects pH-sensitive dye into the tool flowline, where it mixes with the fluid being pumped from the formation (previous page). The fluid mixture changes color according to the water pH, and optical sensors quantify the color change by detecting optical density at mul-tiple wavelengths. The wavelengths of the optical channels in the InSitu pH device have been selected to detect the colors expected when waters of pH from about 3 to 9 react with a dye mixture selected for this range. The measure-ment is similar to the well-known litmus test for indicating pH, but the science and applications were adapted to the high-pressure, high-temper-ature conditions encountered downhole.
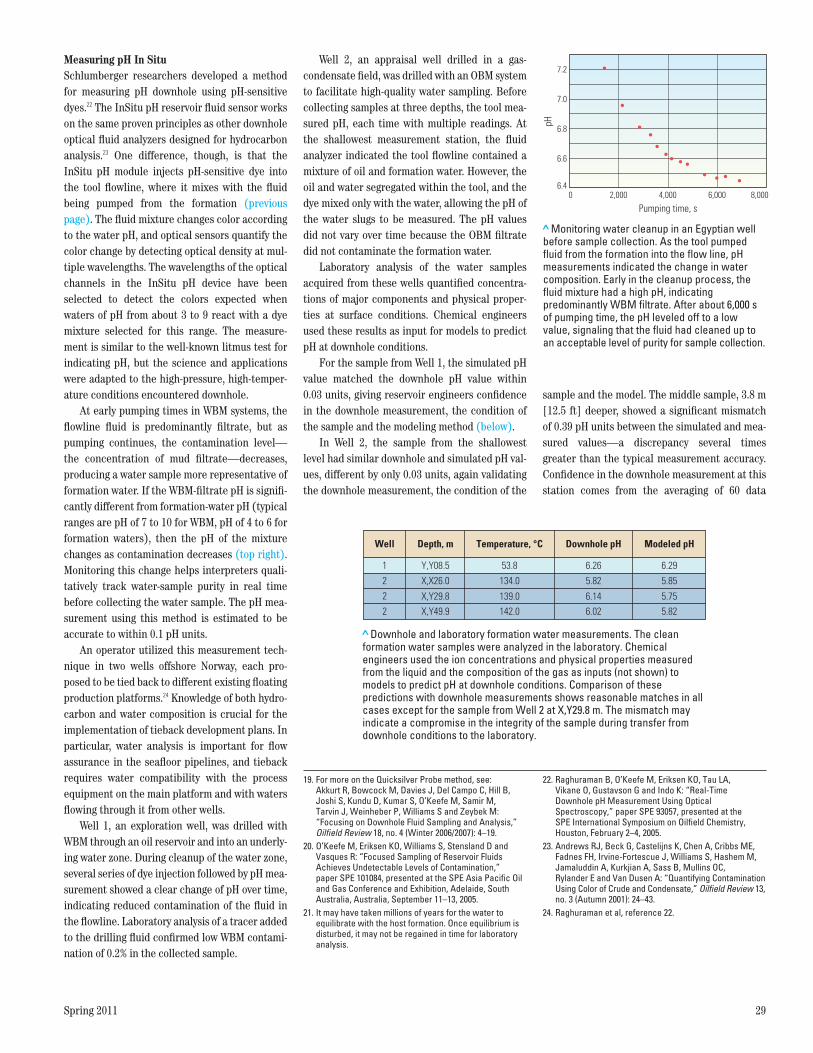
At early pumping times in WBM systems, the flowline fluid is predominantly filtrate, but as pumping continues, the contamination level—the concentration of mud filtrate—decreases, producing a water sample more representative of formation water. If the WBM-filtrate pH is signifi-cantly different from formation-water pH (typical ranges are pH of 7 to 10 for WBM, pH of 4 to 6 for formation waters), then the pH of the mixture changes as contamination decreases (top right). Monitoring this change helps interpreters quali-tatively track water-sample purity in real time before collecting the water sample. The pH mea-surement using this method is estimated to be accurate to within 0.1 pH units.
An operator utilized this measurement tech-nique in two wells offshore Norway, each pro-posed to be tied back to different existing floating production platforms.24 Knowledge of both hydro-carbon and water composition is crucial for the implementation of tieback development plans. In particular, water analysis is important for flow assurance in the seafloor pipelines, and tieback requires water compatibility with the process equipment on the main platform and with waters flowing through it from other wells.
Well 1, an exploration well, was drilled with WBM through an oil reservoir and into an underly-ing water zone. During cleanup of the water zone, several series of dye injection followed by pH mea-surement showed a clear change of pH over time, indicating reduced contamination of the fluid in the flowline. Laboratory analysis of a tracer added to the drilling fluid confirmed low WBM contami-nation of 0.2% in the collected sample.
Well 2, an appraisal well drilled in a gas- condensate field, was drilled with an OBM system to facilitate high-quality water sampling. Before collecting samples at three depths, the tool mea-sured pH, each time with multiple readings. At the shallowest measurement station, the fluid analyzer indicated the tool flowline contained a mixture of oil and formation water. However, the oil and water segregated within the tool, and the dye mixed only with the water, allowing the pH of the water slugs to be measured. The pH values did not vary over time because the OBM filtrate did not contaminate the formation water.
Laboratory analysis of the water samples acquired from these wells quantified concentra-tions of major components and physical proper-ties at surface conditions. Chemical engineers used these results as input for models to predict pH at downhole conditions.
For the sample from Well 1, the simulated pH value matched the downhole pH value within 0.03 units, giving reservoir engineers confidence in the downhole measurement, the condition of the sample and the modeling method (below).
In Well 2, the sample from the shallowest level had similar downhole and simulated pH val-ues, different by only 0.03 units, again validating the downhole measurement, the condition of the
sample and the model. The middle sample, 3.8 m [12.5 ft] deeper, showed a significant mismatch of 0.39 pH units between the simulated and mea-sured values—a discrepancy several times greater than the typical measurement accuracy. Confidence in the downhole measurement at this station comes from the averaging of 60 data
>Monitoring water cleanup in an Egyptian well before sample collection. As the tool pumped fluid from the formation into the flow line, pH measurements indicated the change in water composition. Early in the cleanup process, the fluid mixture had a high pH, indicating predominantly WBM filtrate. After about 6,000 s of pumping time, the pH leveled off to a low value, signaling that the fluid had cleaned up to an acceptable level of purity for sample collection.
pH
Pumping time, s0 2,000 4,000 6,000 8,000
7.2
7.0
6.8
6.6
6.4
> Downhole and laboratory formation water measurements. The clean formation water samples were analyzed in the laboratory. Chemical engineers used the ion concentrations and physical properties measured from the liquid and the composition of the gas as inputs (not shown) to models to predict pH at downhole conditions. Comparison of these predictions with downhole measurements shows reasonable matches in all cases except for the sample from Well 2 at X,Y29.8 m. The mismatch may indicate a compromise in the integrity of the sample during transfer from downhole conditions to the laboratory.
1 Y,Y08.5 53.8 6.26 6.29
5.756.14139.0X,Y29.8
5.855.82134.0X,X26.02
2
5.826.02142.0X,Y49.92
Well Depth, m Temperature, °C Downhole pH Modeled pH
19. For more on the Quicksilver Probe method, see: Akkurt R, Bowcock M, Davies J, Del Campo C, Hill B, Joshi S, Kundu D, Kumar S, O’Keefe M, Samir M, Tarvin J, Weinheber P, Williams S and Zeybek M: “Focusing on Downhole Fluid Sampling and Analysis,” Oilfield Review 18, no. 4 (Winter 2006/2007): 4–19.
20. O’Keefe M, Eriksen KO, Williams S, Stensland D and Vasques R: “Focused Sampling of Reservoir Fluids Achieves Undetectable Levels of Contamination,” paper SPE 101084, presented at the SPE Asia Pacific Oil and Gas Conference and Exhibition, Adelaide, South Australia, Australia, September 11–13, 2005.
21. It may have taken millions of years for the water to equilibrate with the host formation. Once equilibrium is disturbed, it may not be regained in time for laboratory analysis.
22. Raghuraman B, O’Keefe M, Eriksen KO, Tau LA, Vikane O, Gustavson G and Indo K: “Real-Time Downhole pH Measurement Using Optical Spectroscopy,” paper SPE 93057, presented at the SPE International Symposium on Oilfield Chemistry, Houston, February 2–4, 2005.
23. Andrews RJ, Beck G, Castelijns K, Chen A, Cribbs ME, Fadnes FH, Irvine-Fortescue J, Williams S, Hashem M, Jamaluddin A, Kurkjian A, Sass B, Mullins OC, Rylander E and Van Dusen A: “Quantifying Contamination Using Color of Crude and Condensate,” Oilfield Review 13, no. 3 (Autumn 2001): 24–43.
24. Raghuraman et al, reference 22.
30 Oilfield Review
points with a standard deviation of 0.02 pH units—well within the expected measurement accuracy. The discrepancy between the in situ measurement and the value obtained by model-ing based on laboratory results may indicate a compromise in the integrity of the sample during transfer from downhole conditions to the labora-tory, emphasizing the benefit of the real-time measurement. The pH of the third sample from Well 2 is within 0.2 units of the simulated value, which is a more acceptable match.
These tests demonstrated the capability and accuracy of the real-time downhole pH measure-ment. The tool is able to take multiple measure-ments at each station to verify water purity before sample collection. In addition, it can ana-lyze pH at any number of depths without acquir-ing samples.
Water AssumptionsDownhole water pH measurements have also been used to resolve formation evaluation chal-lenges in a Middle East carbonate field.25 In a giant offshore field, Abu Dhabi Marine Operating Company (ADMA-OPCO) hoped to identify unde-pleted thin pay zones and track movement of the oil/water contact (OWC) in the main reservoir. The main reservoir has undergone decades of production with water injection, but some thin zones have not been tapped yet, and they are appraisal targets.
Most wells in the field, including the four wells in this study, were drilled with WBM using seawater as the base. The WBM and formation water cannot be distinguished using resistivity, but the formation water has low pH, from 5.0 to 5.6, compared with that of the WBM (greater than 7.0). The WBM and formation water also
have markedly different strontium concentra-tions, allowing them to be differentiated through laboratory analysis, which was the standard prac-tice before the availability of real-time pH mea-surements. In Well A, a water sample was collected by traditional methods and sent for laboratory analysis; that sample provided a basis for comparison with the results from the three other wells.
Well C penetrated the main reservoir and sev-eral thin zones believed to be untapped. At one station, a pH measurement was performed after just a few liters of fluid had been pumped from the formation. The fluid was expected to be rich in WBM filtrate, and indeed, it exhibited a down-hole pH of 7.3. Samples of the WBM were col-lected for laboratory analysis at the surface.
Resistivity log analysis suggested this thin, 20-ft [6-m] layer had high mobile oil saturation and could be a potential pay zone. Pressure tests at three stations in the interval indicated low mobility but were inconclusive on fluid density.
Downhole fluid analysis at the location with the highest mobility detected tiny amounts of oil flowing with water in the flowline. After about 280 L [74 galUS] of formation fluid had been pumped through the tool, dye injection followed by pH measurement yielded a pH of 5.1. From previous experience with downhole measure-ments in the field, interpreters concluded the water was formation water, and samples were col-lected. Subsequent laboratory analysis of the strontium concentration confirmed the interpre-tation that this sampling depth was in the oil-water transition zone.
Furthermore, the small fractional flow of oil detected in the downhole fluid analysis implies that the oil saturation is only slightly higher than the residual oil saturation, and that the sampling depth is close to the OWC. This example demon-strates the benefits of downhole fluid analysis in characterization of complex limestone transi-tion zones, especially in thin intervals where pressure and resistivity log interpretations can have uncertainties.
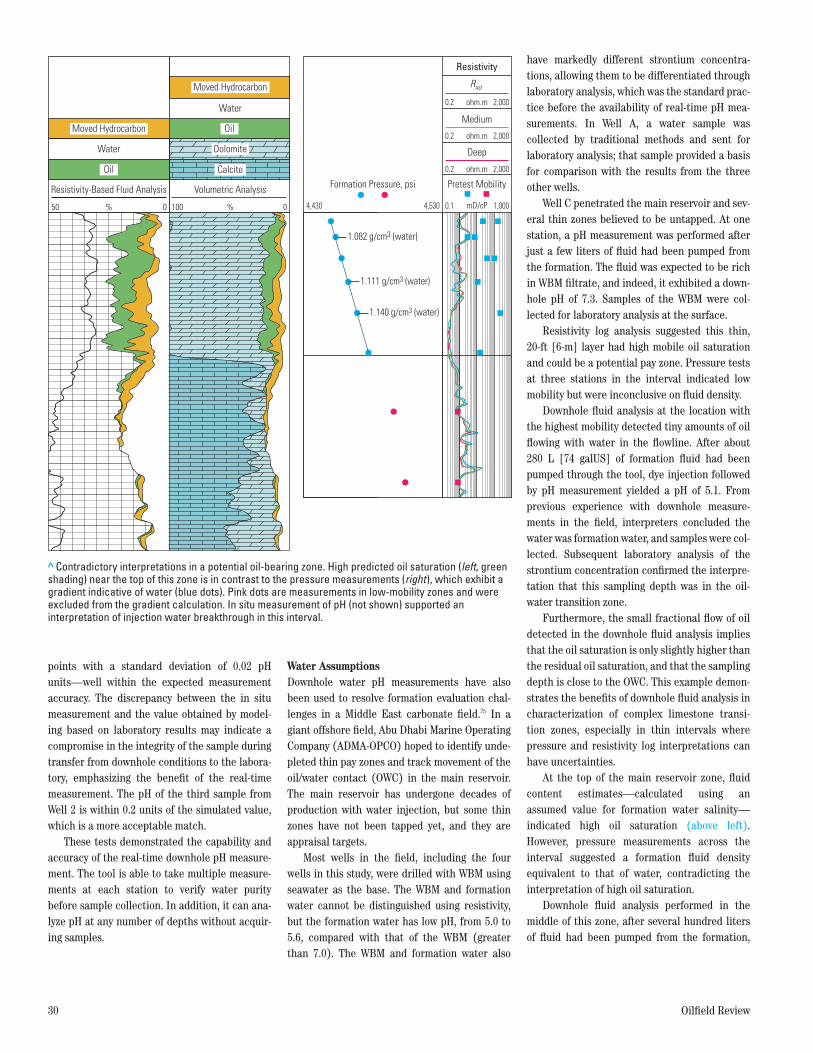
At the top of the main reservoir zone, fluid content estimates—calculated using an assumed value for formation water salinity—indicated high oil saturation (above left). However, pressure measurements across the interval suggested a formation fluid density equivalent to that of water, contradicting the interpretation of high oil saturation.
Downhole fluid analysis performed in the middle of this zone, after several hundred liters of fluid had been pumped from the formation,
Oil
Moved Hydrocarbon
Moved Hydrocarbon
Calcite
DolomiteWater
Water
Resistivity-Based Fluid Analysis Volumetric Analysis
50 100% %0 0
Oil
Formation Pressure, psi
0.2 2,000ohm.m
0.14,430 4,530 1,000
1.082 g/cm3 (water)
1.111 g/cm3 (water)
1.140 g/cm3 (water)
Deep
0.2 2,000ohm.m
Rxo
0.2 ohm.m 2,000
Medium
Resistivity
mD/cP
Pretest Mobility
> Contradictory interpretations in a potential oil-bearing zone. High predicted oil saturation (left, green shading) near the top of this zone is in contrast to the pressure measurements (right), which exhibit a gradient indicative of water (blue dots). Pink dots are measurements in low-mobility zones and were excluded from the gradient calculation. In situ measurement of pH (not shown) supported an interpretation of injection water breakthrough in this interval.
Spring 2011 31
indicated only water in the tool flowline. Real-time measurements of pH returned a value of 6.2—lower than that expected of WBM, but higher than that of the anticipated formation water. Because so much fluid had been pumped from the formation before taking the pH mea-surement, WBM contamination of the water was expected to be low. Fluid analysts suspected that the fluid was not formation water, but water from a nearby injection well. This interpretation was corroborated by laboratory analysis of three water samples collected at this depth.
The injection-water breakthrough had gone undetected during initial openhole logging because the water had not been analyzed, and default values of formation water salinity caused the log interpretation to wrongly predict that the zone contained high volumes of mobile oil. The true salinity of the water in this zone is about one-sixth that of the default formation water, dra-matically changing the interpretation. Correctly identifying water origin by measuring its pH in situ can have significant implications in terms of completion and production planning to minimize water production.
Whence the Water?Abu Dhabi Company for Onshore Operations (ADCO) used the downhole pH measurement in a production well to delineate the oil/water con-tact, characterize the oil-water transition zone and identify the sources of water in various lay-ers.26 The low resistivity contrast between the WBM and the formation fluid precluded using resistivity to track filtrate contamination. Instead, ADCO selected two other methods for monitoring contamination: in situ pH and a colored tracer in the WBM that allows quantitative estimates of contamination before sample collection.
The first sampling station was at X,X51 ft, near the bottom of the suspected oil-water transi-tion zone. This was confirmed by the optical ana-lyzer, which showed only water and no oil flowing at this depth. Monitoring the pH and optical responses of the colored tracer during the cleanup phase showed a reduction in WBM con-tamination with pumping time. The decrease in contamination manifested as downward trends
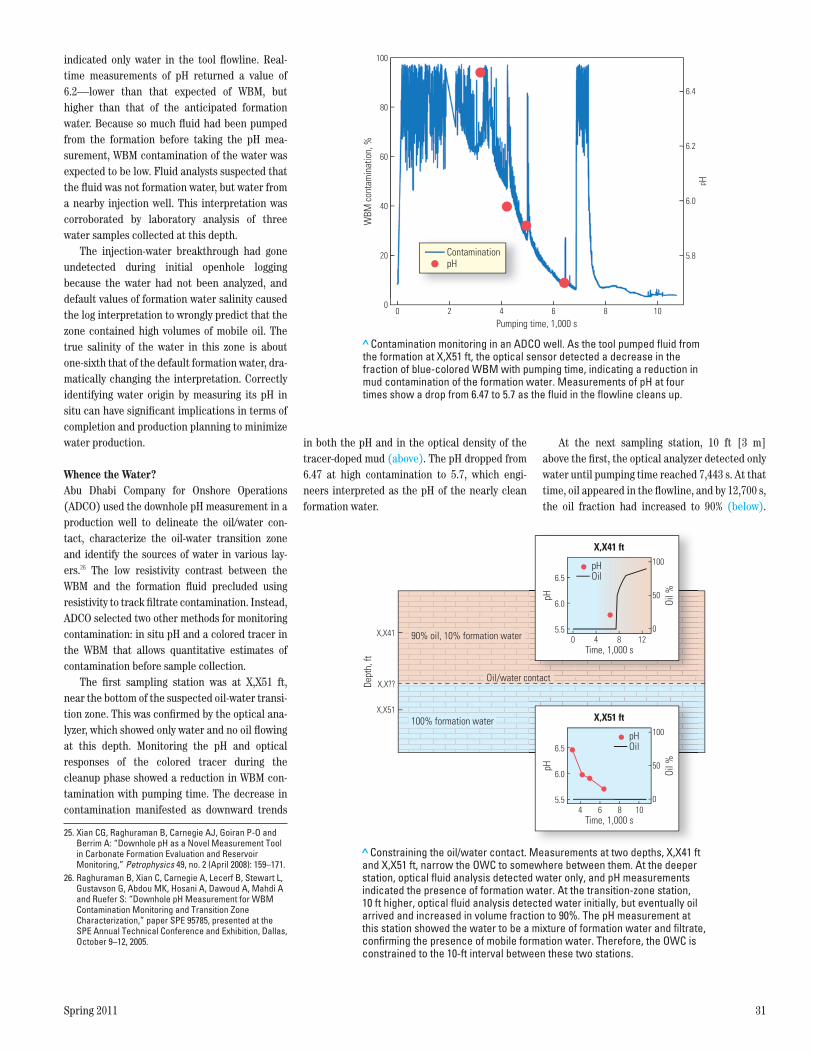
in both the pH and in the optical density of the tracer-doped mud (above). The pH dropped from 6.47 at high contamination to 5.7, which engi-neers interpreted as the pH of the nearly clean formation water.
At the next sampling station, 10 ft [3 m] above the first, the optical analyzer detected only water until pumping time reached 7,443 s. At that time, oil appeared in the flowline, and by 12,700 s, the oil fraction had increased to 90% (below).
25. Xian CG, Raghuraman B, Carnegie AJ, Goiran P-O and Berrim A: “Downhole pH as a Novel Measurement Tool in Carbonate Formation Evaluation and Reservoir Monitoring,” Petrophysics 49, no. 2 (April 2008): 159–171.
26. Raghuraman B, Xian C, Carnegie A, Lecerf B, Stewart L, Gustavson G, Abdou MK, Hosani A, Dawoud A, Mahdi A and Ruefer S: “Downhole pH Measurement for WBM Contamination Monitoring and Transition Zone Characterization,” paper SPE 95785, presented at the SPE Annual Technical Conference and Exhibition, Dallas, October 9–12, 2005.
> Contamination monitoring in an ADCO well. As the tool pumped fluid from the formation at X,X51 ft, the optical sensor detected a decrease in the fraction of blue-colored WBM with pumping time, indicating a reduction in mud contamination of the formation water. Measurements of pH at four times show a drop from 6.47 to 5.7 as the fluid in the flowline cleans up.
WBM
con
tam
inat
ion,
%
Pumping time, 1,000 s
100
80
60
40
20
Hd
5.8
6.0
6.2
6.4
00 2 4 6 8 10
ContaminationpH
Oil/water contact
90% oil, 10% formation water
100% formation water X,X51 ft
Time, 1,000 s
pHOil
pH Oil %
5.5
6.5
100
50
0
6.0
4 86 10
Dept
h, ft
X,X41
X,X51
X,X??ontact
X,X41 ft
Time, 1,000 s
pHOil
pH Oil %
05.5
6.5
100
50
0
6.0
4 8 12
> Constraining the oil/water contact. Measurements at two depths, X,X41 ft and X,X51 ft, narrow the OWC to somewhere between them. At the deeper station, optical fluid analysis detected water only, and pH measurements indicated the presence of formation water. At the transition-zone station, 10 ft higher, optical fluid analysis detected water initially, but eventually oil arrived and increased in volume fraction to 90%. The pH measurement at this station showed the water to be a mixture of formation water and filtrate, confirming the presence of mobile formation water. Therefore, the OWC is constrained to the 10-ft interval between these two stations.
32 Oilfield Review
Without a pH measurement to characterize the type of water, there is no way to know if the water is WBM filtrate or formation water. The presence of pure WBM filtrate implies the formation water is immobile, while the presence of any formation water implies that formation water is mobile at this depth.
A pH measurement taken at 6,452 s, slightly before the arrival of the oil, gave a value of 5.77, indicative of a WBM–formation water mix. Optical measurement of the colored tracer con-firmed this interpretation. This implies that oil and water are both mobile at this depth. Therefore, the oil/water contact must be between the two measurement stations, narrowing it to between X,X41 and X,X51 ft.
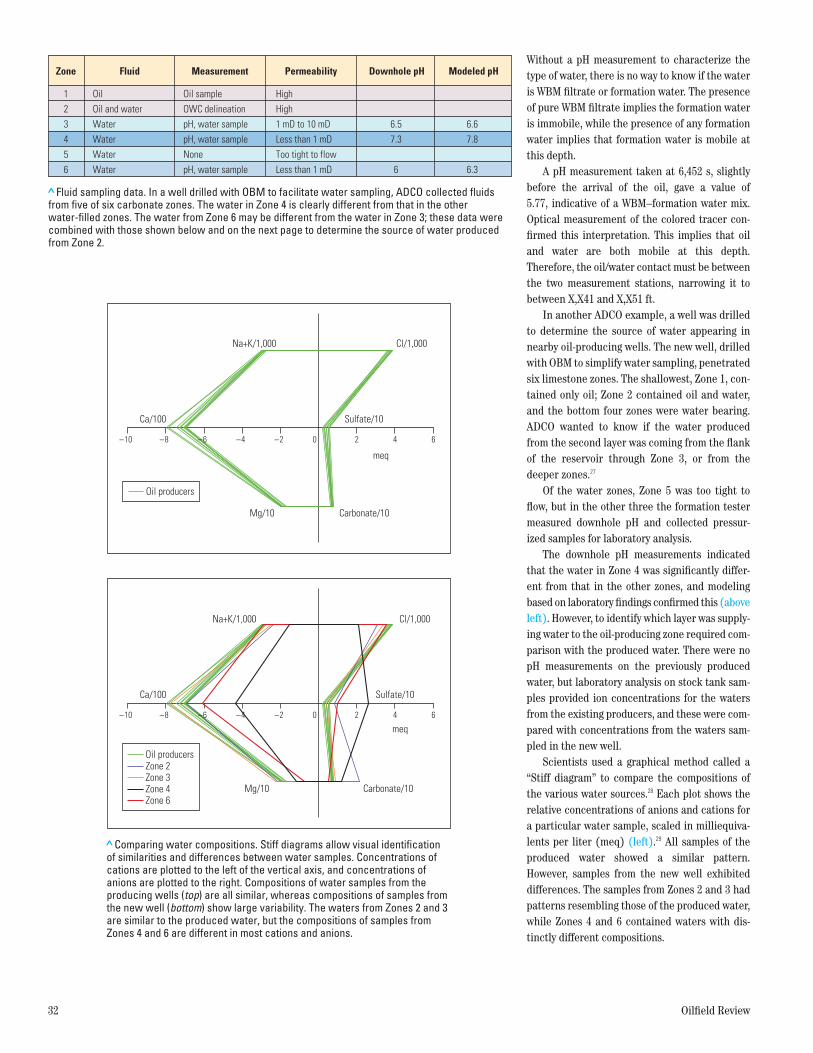
In another ADCO example, a well was drilled to determine the source of water appearing in nearby oil-producing wells. The new well, drilled with OBM to simplify water sampling, penetrated six limestone zones. The shallowest, Zone 1, con-tained only oil; Zone 2 contained oil and water, and the bottom four zones were water bearing. ADCO wanted to know if the water produced from the second layer was coming from the flank of the reservoir through Zone 3, or from the deeper zones.27
Of the water zones, Zone 5 was too tight to flow, but in the other three the formation tester measured downhole pH and collected pressur-ized samples for laboratory analysis.
The downhole pH measurements indicated that the water in Zone 4 was significantly differ-ent from that in the other zones, and modeling based on laboratory findings confirmed this (above left). However, to identify which layer was supply-ing water to the oil-producing zone required com-parison with the produced water. There were no pH measurements on the previously produced water, but laboratory analysis on stock tank sam-ples provided ion concentrations for the waters from the existing producers, and these were com-pared with concentrations from the waters sam-pled in the new well.
Scientists used a graphical method called a “Stiff diagram” to compare the compositions of the various water sources.28 Each plot shows the relative concentrations of anions and cations for a particular water sample, scaled in milliequiva-lents per liter (meq) (left).29 All samples of the produced water showed a similar pattern. However, samples from the new well exhibited differences. The samples from Zones 2 and 3 had patterns resembling those of the produced water, while Zones 4 and 6 contained waters with dis-tinctly different compositions.
> Fluid sampling data. In a well drilled with OBM to facilitate water sampling, ADCO collected fluids from five of six carbonate zones. The water in Zone 4 is clearly different from that in the other water-filled zones. The water from Zone 6 may be different from the water in Zone 3; these data were combined with those shown below and on the next page to determine the source of water produced from Zone 2.
1 Oil Oil sample HighHighOWC delineationOil and water2
Water 6.5 6.61 mD to 10 mDpH, water sample3Water Less than 1 mD 7.3 7.8pH, water sample4Water Too tight to flowNone5Water 6 6.3Less than 1 mDpH, water sample6
Zone Fluid Measurement Permeability Downhole pH Modeled pH
> Comparing water compositions. Stiff diagrams allow visual identification of similarities and differences between water samples. Concentrations of cations are plotted to the left of the vertical axis, and concentrations of anions are plotted to the right. Compositions of water samples from the producing wells (top) are all similar, whereas compositions of samples from the new well (bottom) show large variability. The waters from Zones 2 and 3 are similar to the produced water, but the compositions of samples from Zones 4 and 6 are different in most cations and anions.
Na+K/1,000 Cl/1,000
Sulfate/10Ca/100
–10 –8 –6 –4 –2 2 4 60
Carbonate/10
meq
Mg/10
Na+K/1,000 Cl/1,000
Sulfate/10Ca/100
–10 –8 –6 –4 –2 2 4 60
Carbonate/10
meq
Mg/10
Oil producers Zone 2Zone 3Zone 4Zone 6
Oil producers
Spring 2011 33
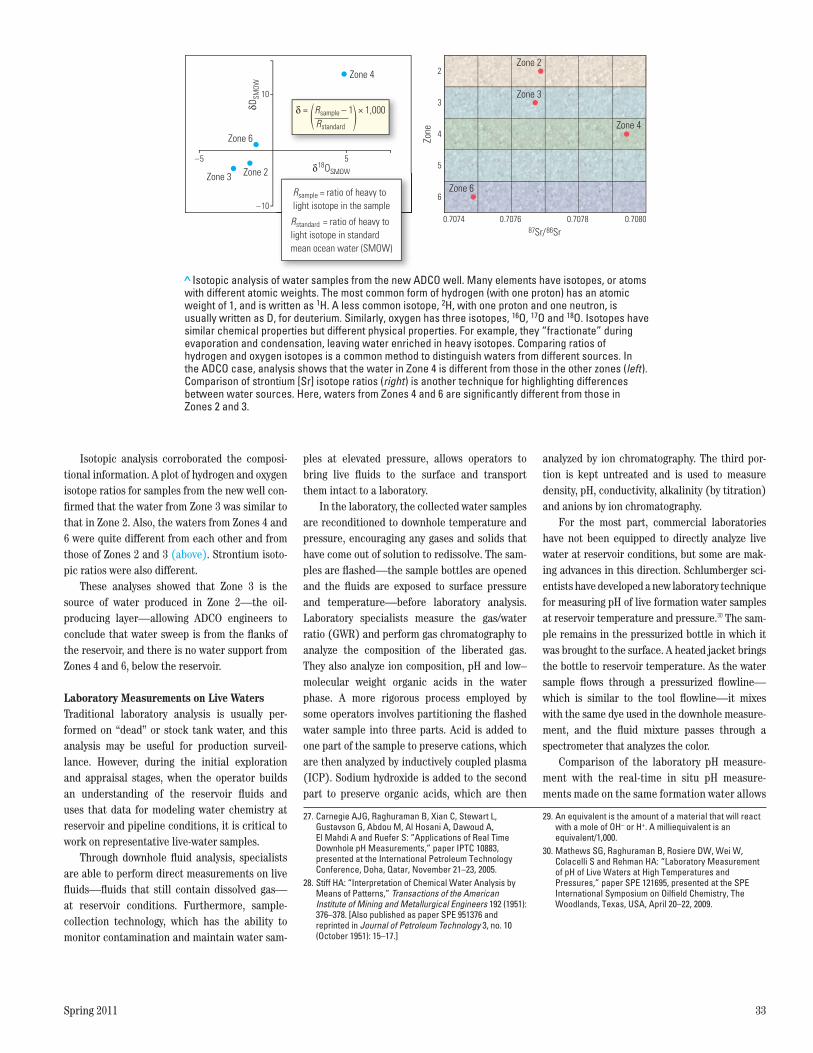
Isotopic analysis corroborated the composi-tional information. A plot of hydrogen and oxygen isotope ratios for samples from the new well con-firmed that the water from Zone 3 was similar to that in Zone 2. Also, the waters from Zones 4 and 6 were quite different from each other and from those of Zones 2 and 3 (above). Strontium isoto-pic ratios were also different.
These analyses showed that Zone 3 is the source of water produced in Zone 2—the oil- producing layer—allowing ADCO engineers to conclude that water sweep is from the flanks of the reservoir, and there is no water support from Zones 4 and 6, below the reservoir.
Laboratory Measurements on Live WatersTraditional laboratory analysis is usually per-formed on “dead” or stock tank water, and this analysis may be useful for production surveil-lance. However, during the initial exploration and appraisal stages, when the operator builds an understanding of the reservoir fluids and uses that data for modeling water chemistry at reservoir and pipeline conditions, it is critical to work on representative live-water samples.
Through downhole fluid analysis, specialists are able to perform direct measurements on live fluids—fluids that still contain dissolved gas— at reservoir conditions. Furthermore, sample- collection technology, which has the ability to monitor contamination and maintain water sam-
ples at elevated pressure, allows operators to bring live fluids to the surface and transport them intact to a laboratory.
In the laboratory, the collected water samples are reconditioned to downhole temperature and pressure, encouraging any gases and solids that have come out of solution to redissolve. The sam-ples are flashed—the sample bottles are opened and the fluids are exposed to surface pressure and temperature—before laboratory analysis. Laboratory specialists measure the gas/water ratio (GWR) and perform gas chromatography to analyze the composition of the liberated gas. They also analyze ion composition, pH and low–molecular weight organic acids in the water phase. A more rigorous process employed by some operators involves partitioning the flashed water sample into three parts. Acid is added to one part of the sample to preserve cations, which are then analyzed by inductively coupled plasma (ICP). Sodium hydroxide is added to the second part to preserve organic acids, which are then
analyzed by ion chromatography. The third por-tion is kept untreated and is used to measure density, pH, conductivity, alkalinity (by titration) and anions by ion chromatography.
For the most part, commercial laboratories have not been equipped to directly analyze live water at reservoir conditions, but some are mak-ing advances in this direction. Schlumberger sci-entists have developed a new laboratory technique for measuring pH of live formation water samples at reservoir temperature and pressure.30 The sam-ple remains in the pressurized bottle in which it was brought to the surface. A heated jacket brings the bottle to reservoir temperature. As the water sample flows through a pressurized flowline—which is similar to the tool flowline—it mixes with the same dye used in the downhole measure-ment, and the fluid mixture passes through a spectrometer that analyzes the color.
Comparison of the laboratory pH measure-ment with the real-time in situ pH measure-ments made on the same formation water allows
27. Carnegie AJG, Raghuraman B, Xian C, Stewart L, Gustavson G, Abdou M, Al Hosani A, Dawoud A, El Mahdi A and Ruefer S: “Applications of Real Time Downhole pH Measurements,” paper IPTC 10883, presented at the International Petroleum Technology Conference, Doha, Qatar, November 21–23, 2005.
28. Stiff HA: “Interpretation of Chemical Water Analysis by Means of Patterns,” Transactions of the American Institute of Mining and Metallurgical Engineers 192 (1951): 376–378. [Also published as paper SPE 951376 and reprinted in Journal of Petroleum Technology 3, no. 10 (October 1951): 15–17.]
Zone
Zone 3 Zone 2
Zone 6
Zone 4Zone 2
87Sr/86Sr
Zone 3
Zone 4
Zone 6
2
3
4
5
6
0.7074 0.7076 0.7078 0.7080
–10
10
–5 5δ18OSMOW
δDSM
OW
δ = Rsample × 1,000Rstandard
– 1
SMOW
Rsample = ratio of heavy to light isotope in the sample
Rstandard = ratio of heavy to light isotope in standard mean ocean water (SMOW)
> Isotopic analysis of water samples from the new ADCO well. Many elements have isotopes, or atoms with different atomic weights. The most common form of hydrogen (with one proton) has an atomic weight of 1, and is written as 1H. A less common isotope, 2H, with one proton and one neutron, is usually written as D, for deuterium. Similarly, oxygen has three isotopes, 16O, 17O and 18O. Isotopes have similar chemical properties but different physical properties. For example, they “fractionate” during evaporation and condensation, leaving water enriched in heavy isotopes. Comparing ratios of hydrogen and oxygen isotopes is a common method to distinguish waters from different sources. In the ADCO case, analysis shows that the water in Zone 4 is different from those in the other zones (left). Comparison of strontium [Sr] isotope ratios (right) is another technique for highlighting differences between water sources. Here, waters from Zones 4 and 6 are significantly different from those in Zones 2 and 3.
29. An equivalent is the amount of a material that will react with a mole of OH– or H+. A milliequivalent is an equivalent/1,000.
30. Mathews SG, Raghuraman B, Rosiere DW, Wei W, Colacelli S and Rehman HA: “Laboratory Measurement of pH of Live Waters at High Temperatures and Pressures,” paper SPE 121695, presented at the SPE International Symposium on Oilfield Chemistry, The Woodlands, Texas, USA, April 20–22, 2009.
34 Oilfield Review
fluid analysts to validate the integrity of the sample. A good match indicates the sample is still representative of the formation water. Sample validation in this manner is an imple-mentation of the “chain of custody” concept.31 The laboratory setup also allows chemists to measure the live-water pH as a function of tem-perature and pressure and flag the onset of scale precipitation. These additional measure-ments can be used to better constrain and tune water-chemistry models.
Chevron tested this technique on formation water samples from two Gulf of Mexico wells.32 In Well A, the zone of interest is a thick, permeable water zone—a potential supply for injection water—thousands of feet above the reservoir. The company wanted to assess the corrosion potential of the water and evaluate its compatibility with the reservoir formation water. Downhole mea-
surements of pH were made and samples were collected at two depths. Laboratory measure-ments matched the downhole measurements to within 0.08 pH units, giving Chevron chemists confidence that the reconditioned live samples were representative of formation water.
Comparison with predictions from two differ-ent simulators indicated a good match (within 0.15 units) for one sample. For the second sam-ple, the discrepancies were larger, not just between predicted and measured values, but also between the two commercial models used for the simulation (0.24 to 0.65 units). The reasons for the differences in predicted values from the two simulators are due to the different thermody-namic databases upon which they are based, as well as the different approaches to using the inputs in modeling. The differences highlight the
uncertainties that can arise when flashed water analysis is used as input to simulators and under-score the importance of direct measurements on live waters to constrain and tune the models.
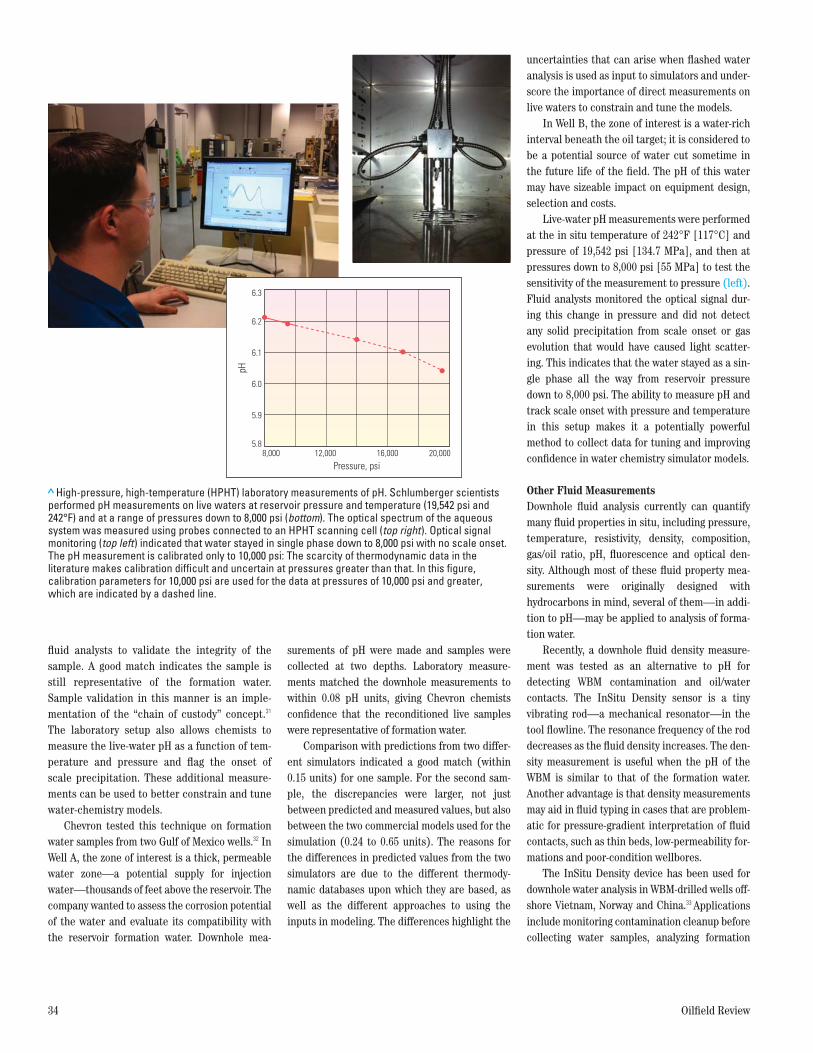
In Well B, the zone of interest is a water-rich interval beneath the oil target; it is considered to be a potential source of water cut sometime in the future life of the field. The pH of this water may have sizeable impact on equipment design, selection and costs.
Live-water pH measurements were performed at the in situ temperature of 242°F [117°C] and pressure of 19,542 psi [134.7 MPa], and then at pressures down to 8,000 psi [55 MPa] to test the sensitivity of the measurement to pressure (left). Fluid analysts monitored the optical signal dur-ing this change in pressure and did not detect any solid precipitation from scale onset or gas evolution that would have caused light scatter-ing. This indicates that the water stayed as a sin-gle phase all the way from reservoir pressure down to 8,000 psi. The ability to measure pH and track scale onset with pressure and temperature in this setup makes it a potentially powerful method to collect data for tuning and improving confidence in water chemistry simulator models.
Other Fluid MeasurementsDownhole fluid analysis currently can quantify many fluid properties in situ, including pressure, temperature, resistivity, density, composition, gas/oil ratio, pH, fluorescence and optical den-sity. Although most of these fluid property mea-surements were originally designed with hydrocarbons in mind, several of them—in addi-tion to pH—may be applied to analysis of forma-tion water.
Recently, a downhole fluid density measure-ment was tested as an alternative to pH for detecting WBM contamination and oil/water contacts. The InSitu Density sensor is a tiny vibrating rod—a mechanical resonator—in the tool flowline. The resonance frequency of the rod decreases as the fluid density increases. The den-sity measurement is useful when the pH of the WBM is similar to that of the formation water. Another advantage is that density measurements may aid in fluid typing in cases that are problem-atic for pressure-gradient interpretation of fluid contacts, such as thin beds, low-permeability for-mations and poor-condition wellbores.
The InSitu Density device has been used for downhole water analysis in WBM-drilled wells off-shore Vietnam, Norway and China.33 Appli cations include monitoring contamination cleanup before collecting water samples, analyzing formation
> High-pressure, high-temperature (HPHT) laboratory measurements of pH. Schlumberger scientists performed pH measurements on live waters at reservoir pressure and temperature (19,542 psi and 242°F) and at a range of pressures down to 8,000 psi (bottom). The optical spectrum of the aqueous system was measured using probes connected to an HPHT scanning cell (top right). Optical signal monitoring (top left) indicated that water stayed in single phase down to 8,000 psi with no scale onset. The pH measurement is calibrated only to 10,000 psi: The scarcity of thermodynamic data in the literature makes calibration difficult and uncertain at pressures greater than that. In this figure, calibration parameters for 10,000 psi are used for the data at pressures of 10,000 psi and greater, which are indicated by a dashed line.
pH
Pressure, psi8,000 12,000 16,000 20,000
6.3
6.2
6.1
6.0
5.9
5.8
Spring 2011 35
water for future reinjection with seawater, evalu-ating of reservoir vertical connectivity and assess-ing flow assurance in pipelines and flow streams to be tied back to processing equipment on a main platform.
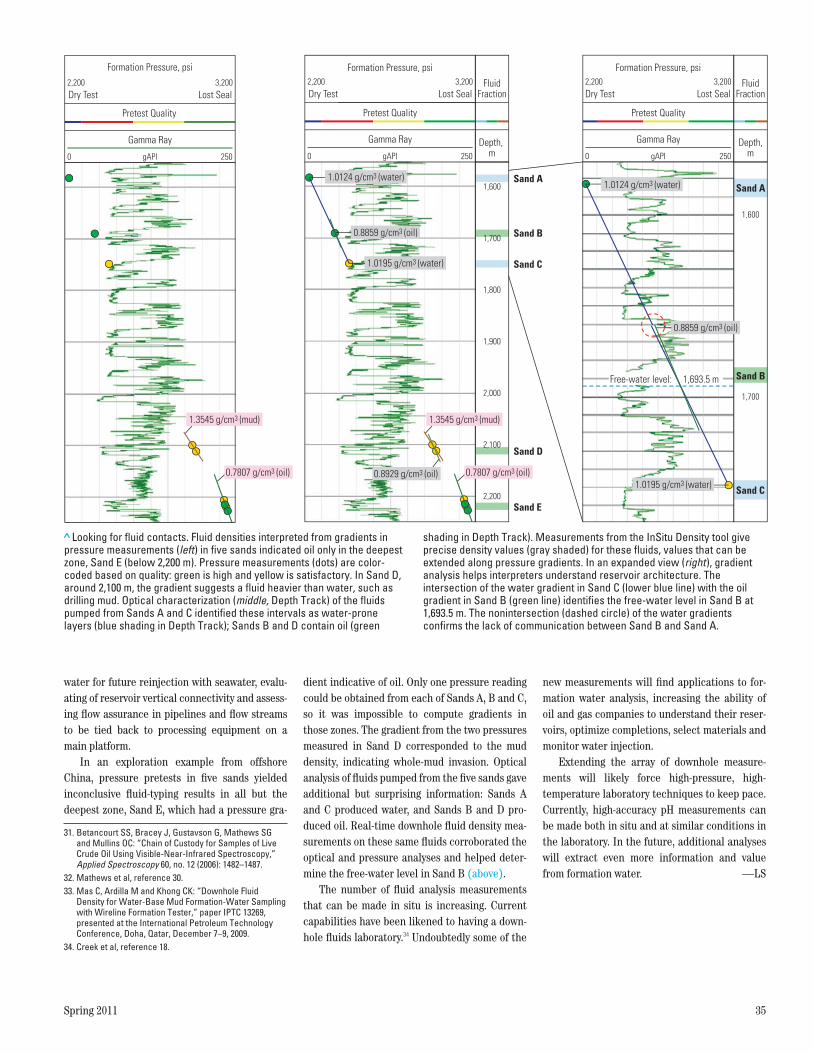
In an exploration example from offshore China, pressure pretests in five sands yielded inconclusive fluid-typing results in all but the deepest zone, Sand E, which had a pressure gra-
dient indicative of oil. Only one pressure reading could be obtained from each of Sands A, B and C, so it was impossible to compute gradients in those zones. The gradient from the two pressures measured in Sand D corresponded to the mud density, indicating whole-mud invasion. Optical analysis of fluids pumped from the five sands gave additional but surprising information: Sands A and C produced water, and Sands B and D pro-duced oil. Real-time downhole fluid density mea-surements on these same fluids corroborated the optical and pressure analyses and helped deter-mine the free-water level in Sand B (above).
The number of fluid analysis measurements that can be made in situ is increasing. Current capabilities have been likened to having a down-hole fluids laboratory.34 Undoubtedly some of the
new measurements will find applications to for-mation water analysis, increasing the ability of oil and gas companies to understand their reser-voirs, optimize completions, select materials and monitor water injection.
Extending the array of downhole measure-ments will likely force high-pressure, high- temperature laboratory techniques to keep pace. Currently, high-accuracy pH measurements can be made both in situ and at similar conditions in the laboratory. In the future, additional analyses will extract even more information and value from formation water. —LS
> Looking for fluid contacts. Fluid densities interpreted from gradients in pressure measurements (left) in five sands indicated oil only in the deepest zone, Sand E (below 2,200 m). Pressure measurements (dots) are color-coded based on quality: green is high and yellow is satisfactory. In Sand D, around 2,100 m, the gradient suggests a fluid heavier than water, such as drilling mud. Optical characterization (middle, Depth Track) of the fluids pumped from Sands A and C identified these intervals as water-prone layers (blue shading in Depth Track); Sands B and D contain oil (green
shading in Depth Track). Measurements from the InSitu Density tool give precise density values (gray shaded) for these fluids, values that can be extended along pressure gradients. In an expanded view (right), gradient analysis helps interpreters understand reservoir architecture. The intersection of the water gradient in Sand C (lower blue line) with the oil gradient in Sand B (green line) identifies the free-water level in Sand B at 1,693.5 m. The nonintersection (dashed circle) of the water gradients confirms the lack of communication between Sand B and Sand A.
Formation Pressure, psi
Pretest Quality Pretest Quality
Gamma Ray
Sand ASand A
Sand B
Sand C
Sand B
Sand C
Sand D
Sand E
Dry Test
0
2,200 3,200
gAPI 250
1,600
1,600
1,700
1,700
1,800
1,900
2,000
2,100
2,200
Lost Seal
Depth, m
FluidFraction
Formation Pressure, psi
Gamma Ray
Dry Test
0
2,200 3,200
gAPI 250
Lost Seal
Depth,m
FluidFraction
1.3545 g/cm3 (mud)
1.0124 g/cm3 (water)
1.0195 g/cm3 (water)
0.8859 g/cm3 (oil)
0.7807 g/cm3 (oil)0.8929 g/cm3 (oil)
0.8859 g/cm3 (oil)
1.0124 g/cm3 (water)
Free-water level: 1,693.5 m
1.0195 g/cm3 (water)
Pretest Quality
Formation Pressure, psi
Gamma Ray
Dry Test
0
2,200 3,200
gAPI 250
Lost Seal
1.3545 g/cm3 (mud)
0.7807 g/cm3 (oil)
31. Betancourt SS, Bracey J, Gustavson G, Mathews SG and Mullins OC: “Chain of Custody for Samples of Live Crude Oil Using Visible-Near-Infrared Spectroscopy,” Applied Spectroscopy 60, no. 12 (2006): 1482–1487.
32. Mathews et al, reference 30.33. Mas C, Ardilla M and Khong CK: “Downhole Fluid
Density for Water-Base Mud Formation-Water Sampling with Wireline Formation Tester,” paper IPTC 13269, presented at the International Petroleum Technology Conference, Doha, Qatar, December 7–9, 2009.
34. Creek et al, reference 18.