Embed Size (px)
Citation preview
Finding Growth in Challenging Times:Seven Indicators to Evaluate Population Growth
October 2008
growth

Executive Summary
During the past several years, the U.S. retail
industry has been reeling from a slow-growing
population and a protracted economic
downturn. Despite these challenging
conditions, there are areas of the country
that are experiencing population growth and
can offer opportunities for retail businesses.
To find these communities, analysts at
Nielsen Claritas developed a statistical
approach to score the growth potential of
all U.S. markets and suggest strategies for
expansion. By determining the key indicators
of growth in markets of all sizes, this approach
offers a significant advance for retailers
even in tough economic times.
Known collectively as Population Growth
Indicators, seven factors strongly
correlate with fast-growing markets:
1) large land areas, 2) booming suburban
rings, 3) widespread affluence, 4) an
increasing Hispanic population, 5) diversified
employment, 6) long commutes and 7) the
presence of lifestyle shopping centers.
When the Population Growth Indicators are
combined with demographic projections,
retailers have a robust tool to identify
locations with significant potential for
market expansion—markets that may even
lead the way to an economic recovery in
the coming years. Now more than ever,
retail success depends on the ability to
identify growing markets, whether the
task is retail expansion, current market
optimization, or street-level site planning.
Introduction
Across the nation and around the world,
the recent crisis in the U.S. financial sector
has thrown an already declining economy
into a tailspin. Home values have dropped,
foreclosures have skyrocketed, venerable
Wall Street firms have failed and lending
for even the creditworthy has dried up.
And, as if these woes are not enough,
another trend is compounding this down-
turn, particularly for companies with siz-
able retail operations—over the last
eight years the U.S. population has
experienced little growth, averaging only
0.9 percent annually.
Slow population growth is particularly
troubling to retailers, which rely on an
expanding consumer base to increase
earnings, extend into new trade territories
and satisfy shareholders—not to mention
Wall Street analysts expecting to see
comparable store sales rise each year.
Starbucks, Linens ’n Things and The Sharper
Image are just a few of the many retailers
recently forced to shutter stores and scale back
expansion plans as a result of disappointing
sales and flawed growth forecasts. And this
gloomy scenario shows no sign of abating
over the coming years, given the stagnating
economy and current social trends marked
by later marriages, smaller families and an
aging population.
Despite this troubling news, there are markets
and population segments within the U.S.
that are experiencing healthy population
growth, offering expansion opportunities
for retail businesses even in a weak national
economy. But finding these locations requires
a different approach to identifying growth
opportunities that goes beyond calculating
new housing starts—a typical metric
employed by site planners. Using a statistical
technique that evaluates population growth
along with historic trends, Nielsen Claritas
analysts have isolated seven demographic
and economic indicators that strongly correlate
to growing markets in both metropolitan
and micropolitan communities. (Metropolitan
areas have a population of at least 50,000;
micropolitan areas have a population
between 10,000 and 50,000.) These drivers
of growth are based on a variety of Nielsen
Claritas data products—including
Pop-Facts®, the Shopping Center Database
and Business-Facts®—in addition to the
PRIZM® segmentation system, which clas-
sifies Americans according to 66 lifestyle
types and 14 social groups.
By combining the seven indicators with real
world experience, this approach offers
retailers a new way of identifying areas for
market expansion in a challenging economic
environment. Businesses hoping to thrive in
this current recessionary period, or wanting
© 2008 The Nielsen Company. All rights reservedPage 1
By Terry Muñoz, Vice President & Industry Practice Leader, Retail, Restaurantand Real Estate Group, and Mike Mancini, Vice President of Data ProductManagement, Nielsen Claritas
Finding Growth in Challenging Times:Seven Indicators to Evaluate Population Growth
to position themselves for the future,
should look to these Population Growth
Indicators to identify prime markets for new
store openings, existing store renovations
and high-return marketing programs.
Challenging Market Conditions
During the last few years, retail expansion
opportunities have suffered greatly. The
high cost of capital required to develop
new locations, low consumer confidence
and growing unemployment have all caused
retailers to scale back their expansion plans
and shopping center developers to delay
new projects indefinitely. In the commercial
real estate industry, retail vacancies have
soared to the highest level since 1996. In
the first quarter of 2008, the vacancy rate
of neighborhood and community shopping
centers reached 7.7 percent—the highest level
in 12 years. This past May, the International
Council of Shopping Centers forecast 5,770
store closings in 2008—an increase of 25
percent from only a year ago. In addition,
discretionary consumer spending has
declined as the cost of fuel and food has
risen and home values have slumped.
But not all areas of the country are feeling
the pinch. Population growth is a local
phenomenon: one community can fare far
better than the country as a whole. To
evaluate the landscape, analysts examined
the nation’s 936 CBSAs (Core Based Statistical
Areas), which include both metropolitan
and micropolitan areas accounting for 93
percent of the U.S. population. Between
2000 and 2008, 316 CBSAs experienced
high population growth, defined by analysts
as a growth rate at least 10 percent above
the national average of 8.5 percent over
the eight-year period. Meanwhile, 371
CBSAs recorded average growth and 249
CBSAs experienced declining populations.
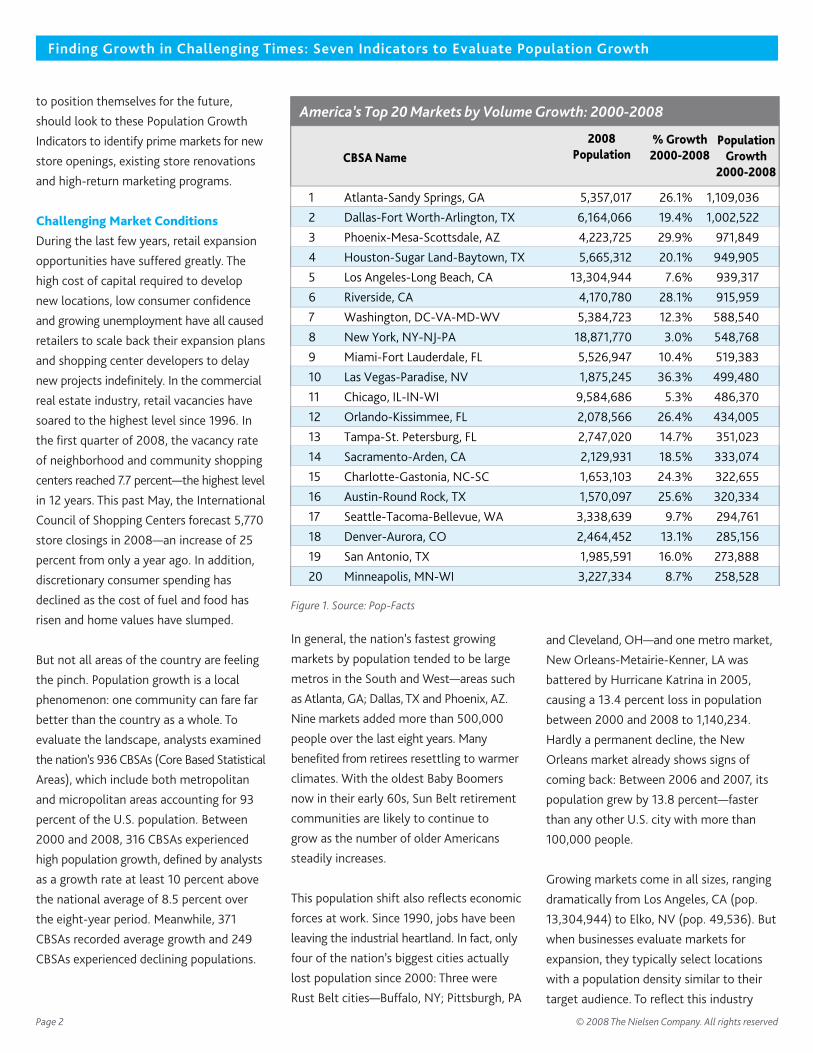
In general, the nation’s fastest growing
markets by population tended to be large
metros in the South and West—areas such
as Atlanta, GA; Dallas, TX and Phoenix, AZ.
Nine markets added more than 500,000
people over the last eight years. Many
benefited from retirees resettling to warmer
climates. With the oldest Baby Boomers
now in their early 60s, Sun Belt retirement
communities are likely to continue to
grow as the number of older Americans
steadily increases.
This population shift also reflects economic
forces at work. Since 1990, jobs have been
leaving the industrial heartland. In fact, only
four of the nation’s biggest cities actually
lost population since 2000: Three were
Rust Belt cities—Buffalo, NY; Pittsburgh, PA
and Cleveland, OH—and one metro market,
New Orleans-Metairie-Kenner, LA was
battered by Hurricane Katrina in 2005,
causing a 13.4 percent loss in population
between 2000 and 2008 to 1,140,234.
Hardly a permanent decline, the New
Orleans market already shows signs of
coming back: Between 2006 and 2007, its
population grew by 13.8 percent—faster
than any other U.S. city with more than
100,000 people.
Growing markets come in all sizes, ranging
dramatically from Los Angeles, CA (pop.
13,304,944) to Elko, NV (pop. 49,536). But
when businesses evaluate markets for
expansion, they typically select locations
with a population density similar to their
target audience. To reflect this industry
Finding Growth in Challenging Times: Seven Indicators to Evaluate Population Growth
© 2008 The Nielsen Company. All rights reservedPage 2
America’s Top 20 Markets by Volume Growth: 2000-2008
1 Atlanta-Sandy Springs, GA 5,357,017 26.1% 1,109,036
2 Dallas-Fort Worth-Arlington, TX 6,164,066 19.4% 1,002,522
3 Phoenix-Mesa-Scottsdale, AZ 4,223,725 29.9% 971,849
4 Houston-Sugar Land-Baytown, TX 5,665,312 20.1% 949,905
5 Los Angeles-Long Beach, CA 13,304,944 7.6% 939,317
6 Riverside, CA 4,170,780 28.1% 915,959
7 Washington, DC-VA-MD-WV 5,384,723 12.3% 588,540
8 New York, NY-NJ-PA 18,871,770 3.0% 548,768
9 Miami-Fort Lauderdale, FL 5,526,947 10.4% 519,383
10 Las Vegas-Paradise, NV 1,875,245 36.3% 499,480
11 Chicago, IL-IN-WI 9,584,686 5.3% 486,370
12 Orlando-Kissimmee, FL 2,078,566 26.4% 434,005
13 Tampa-St. Petersburg, FL 2,747,020 14.7% 351,023
14 Sacramento-Arden, CA 2,129,931 18.5% 333,074
15 Charlotte-Gastonia, NC-SC 1,653,103 24.3% 322,655
16 Austin-Round Rock, TX 1,570,097 25.6% 320,334
17 Seattle-Tacoma-Bellevue, WA 3,338,639 9.7% 294,761
18 Denver-Aurora, CO 2,464,452 13.1% 285,156
19 San Antonio, TX 1,985,591 16.0% 273,888
20 Minneapolis, MN-WI 3,227,334 8.7% 258,528
CBSA NamePopulation
Growth2000-2008
% Growth2000-2008
2008Population
Figure 1. Source: Pop-Facts
Finding Growth in Challenging Times: Seven Indicators to Evaluate Population Growth
rate of population growth reveals a number
of Metro Towns and Micro Towns with
populations under 100,000 people. The
top three—Palm Coast, FL; Fernley, NV
and St. George, UT—all grew by more than
50 percent since 2000. Located beyond
congested metros, they’ve attracted jobs,
retailers and residents thanks to low crime
rates and fewer traffic jams. Some of the
smaller markets, like St. George, are close
to national parks and wilderness areas that
appeal to young families and retirees.
Many, like Palm Coast and Fernley, are
within commuting distance of a metropolitan
city center (Jacksonville, FL and Las Vegas,
NV respectively), attracting young families
to nearby jobs.
Population Growth Indicators
versus Traditional Measures
Traditionally, corporate real estate professionals
have assessed growth opportunities by
working with local planning boards to gather
data on new housing starts or planned
shopping centers. This approach, however,
Page 3 © 2008 The Nielsen Company. All rights reserved
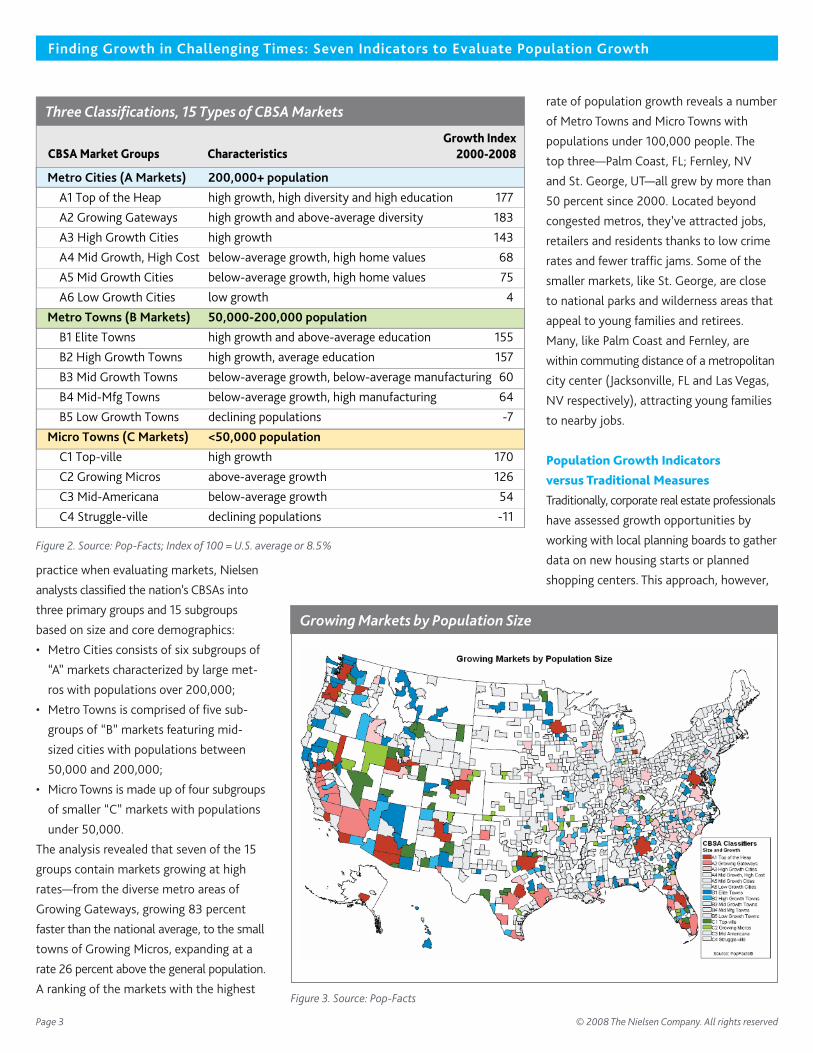
practice when evaluating markets, Nielsen
analysts classified the nation’s CBSAs into
three primary groups and 15 subgroups
based on size and core demographics:
• Metro Cities consists of six subgroups of
“A” markets characterized by large met-
ros with populations over 200,000;
• Metro Towns is comprised of five sub-
groups of “B” markets featuring mid-
sized cities with populations between
50,000 and 200,000;
• Micro Towns is made up of four subgroups
of smaller “C” markets with populations
under 50,000.
The analysis revealed that seven of the 15
groups contain markets growing at high
rates—from the diverse metro areas of
Growing Gateways, growing 83 percent
faster than the national average, to the small
towns of Growing Micros, expanding at a
rate 26 percent above the general population.
A ranking of the markets with the highest
Three Classifications, 15 Types of CBSA Markets
Metro Cities (A Markets) 200,000+ population
A1 Top of the Heap high growth, high diversity and high education 177
A2 Growing Gateways high growth and above-average diversity 183
A3 High Growth Cities high growth 143
A4 Mid Growth, High Cost below-average growth, high home values 68
A5 Mid Growth Cities below-average growth, high home values 75
A6 Low Growth Cities low growth 4
Metro Towns (B Markets) 50,000-200,000 population
B1 Elite Towns high growth and above-average education 155
B2 High Growth Towns high growth, average education 157
B3 Mid Growth Towns below-average growth, below-average manufacturing 60
B4 Mid-Mfg Towns below-average growth, high manufacturing 64
B5 Low Growth Towns declining populations -7
Micro Towns (C Markets) <50,000 population
C1 Top-ville high growth 170
C2 Growing Micros above-average growth 126
C3 Mid-Americana below-average growth 54
C4 Struggle-ville declining populations -11
CBSA Market GroupsGrowth Index
2000-2008Characteristics
Figure 2. Source: Pop-Facts; Index of 100 = U.S. average or 8.5%
Growing Markets by Population Size
Figure 3. Source: Pop-Facts
is far from foolproof: In Phoenix, AZ many
houses built in recent years were bought by
investors rather than residents. When the
housing market collapsed, speculators
couldn’t find buyers and lenders foreclosed
on their properties, resulting in more than
23,000 foreclosures this past May—the
seventh worst in the nation, according to
RealtyTrac, an online marketplace for
foreclosure properties. In a fast-changing
economy, relying on outmoded approaches to
assess opportunities means a developer may
have to wait years for consumers to appear.
The new method for identifying growth
areas allows marketers to extend their
knowledge by combining standard five-year
growth projections with new measures of
demographic data, employment variables
and lifestyle types. To uncover the most
useful metrics, analysts investigated which
factors strongly correlated with high-growth
communities. The research revealed the
seven key indicators, including demographic
drivers such as high incomes, educational
attainment and diversity. These Population
Growth Indicators also featured specific
Finding Growth in Challenging Times: Seven Indicators to Evaluate Population Growth
© 2008 The Nielsen Company. All rights reservedPage 4
economic traits such as a high concentration
of residents employed in construction,
business services and recreation. And
there were even some surprising criteria
among the indicators, such as the
presence of lifestyle-themed shopping
centers—those open-air malls built to
resemble a pedestrian-friendly urban village.
The most powerful indicators of growing
markets are described in the sections that
follow, accompanied by lists of the top
markets for each indicator.
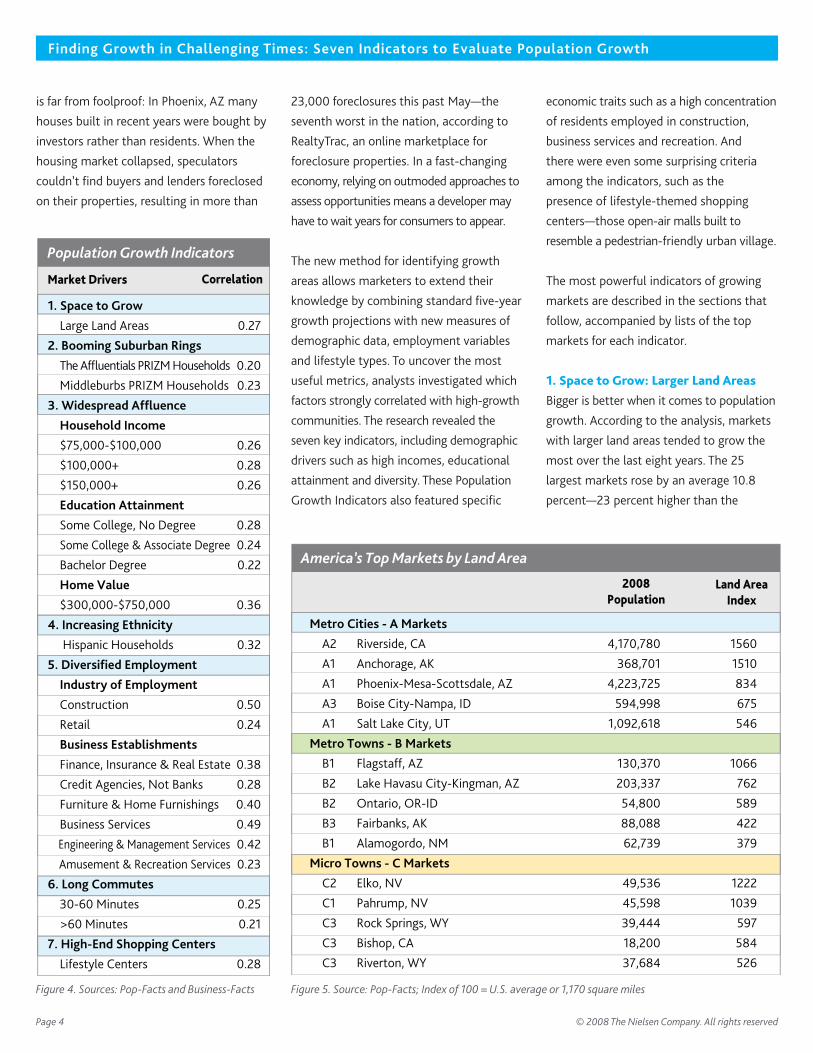
1. Space to Grow: Larger Land Areas
Bigger is better when it comes to population
growth. According to the analysis, markets
with larger land areas tended to grow the
most over the last eight years. The 25
largest markets rose by an average 10.8
percent—23 percent higher than the
Population Growth Indicators
Correlation
1. Space to Grow
Large Land Areas 0.27
2. Booming Suburban Rings
The Affluentials PRIZM Households 0.20
Middleburbs PRIZM Households 0.23
3. Widespread Affluence
Household Income
$75,000-$100,000 0.26
$100,000+ 0.28
$150,000+ 0.26
Education Attainment
Some College, No Degree 0.28
Some College & Associate Degree 0.24
Bachelor Degree 0.22
Home Value
$300,000-$750,000 0.36
4. Increasing Ethnicity
Hispanic Households 0.32
5. Diversified Employment
Industry of Employment
Construction 0.50
Retail 0.24
Business Establishments
Finance, Insurance & Real Estate 0.38
Credit Agencies, Not Banks 0.28
Furniture & Home Furnishings 0.40
Business Services 0.49
Engineering & Management Services 0.42
Amusement & Recreation Services 0.23
6. Long Commutes
30-60 Minutes 0.25
>60 Minutes 0.21
7. High-End Shopping Centers
Lifestyle Centers 0.28
Market Drivers
Figure 4. Sources: Pop-Facts and Business-Facts
America’s Top Markets by Land Area
Metro Cities - A Markets
A2 Riverside, CA 4,170,780 1560
A1 Anchorage, AK 368,701 1510
A1 Phoenix-Mesa-Scottsdale, AZ 4,223,725 834
A3 Boise City-Nampa, ID 594,998 675
A1 Salt Lake City, UT 1,092,618 546
Metro Towns - B Markets
B1 Flagstaff, AZ 130,370 1066
B2 Lake Havasu City-Kingman, AZ 203,337 762
B2 Ontario, OR-ID 54,800 589
B3 Fairbanks, AK 88,088 422
B1 Alamogordo, NM 62,739 379
Micro Towns - C Markets
C2 Elko, NV 49,536 1222
C1 Pahrump, NV 45,598 1039
C3 Rock Springs, WY 39,444 597
C3 Bishop, CA 18,200 584
C3 Riverton, WY 37,684 526
Land AreaIndex
2008Population
Figure 5. Source: Pop-Facts; Index of 100 = U.S. average or 1,170 square miles
national average. Retailers should not
underestimate the importance of large
markets. Businesses that serve the nation’s
10 largest markets reach more than 80
million Americans—28 percent of the
nation’s total population.
Markets with larger land areas can absorb
growth more easily, leading to even faster
growth. While the average size of a CBSA is
1,710 square miles, analysts found a strong
correlation between growth and markets
like Riverside, CA, (15 times larger than
average); Elko, NV (12 times larger) and
Flagstaff, AZ (10 times larger). Many of
these markets are found in the Mountain
and Pacific states where relatively new
cities have had more room to spread out
before encroaching on the borders of other
CBSAs. (Geographical boundaries in the
desert and mountain areas may limit
expansion opportunities.)There are also plenty
of sparsely populated, but geographically
large communities that are growing thanks
to the allure of small-town charm. Tiny
Elko (pop. 49,536) grew by 34 percent in
the 1990s and another six percent since
2000, in part by offering an array of outdoor
activities like ice fishing, hunting, snowmobiling
and skiing. Accommodating zoning laws
also have helped some Western markets
grow by supporting sprawling development
without the burdensome regulation found
in older cities in the Northeast.
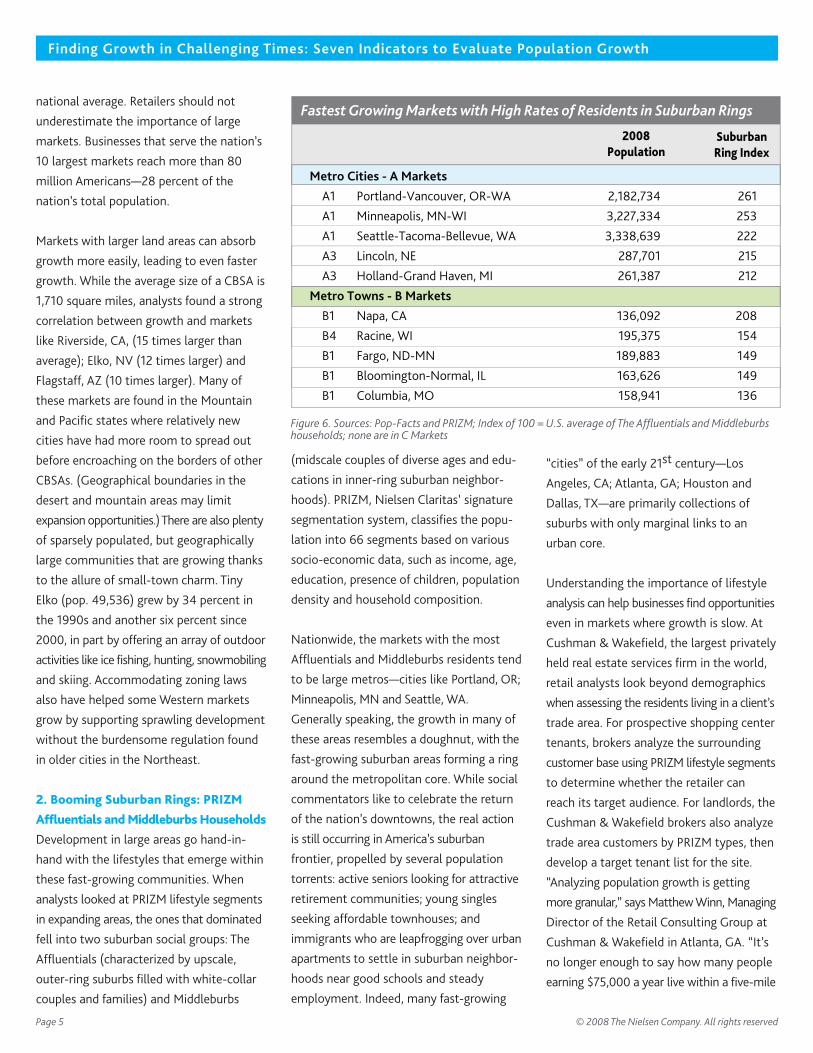
2. Booming Suburban Rings: PRIZM
Affluentials andMiddleburbsHouseholds
Development in large areas go hand-in-
hand with the lifestyles that emerge within
these fast-growing communities. When
analysts looked at PRIZM lifestyle segments
in expanding areas, the ones that dominated
fell into two suburban social groups: The
Affluentials (characterized by upscale,
outer-ring suburbs filled with white-collar
couples and families) and Middleburbs
(midscale couples of diverse ages and edu-
cations in inner-ring suburban neighbor-
hoods). PRIZM, Nielsen Claritas’ signature
segmentation system, classifies the popu-
lation into 66 segments based on various
socio-economic data, such as income, age,
education, presence of children, population
density and household composition.
Nationwide, the markets with the most
Affluentials and Middleburbs residents tend
to be large metros—cities like Portland, OR;
Minneapolis, MN and Seattle, WA.
Generally speaking, the growth in many of
these areas resembles a doughnut, with the
fast-growing suburban areas forming a ring
around the metropolitan core. While social
commentators like to celebrate the return
of the nation’s downtowns, the real action
is still occurring in America’s suburban
frontier, propelled by several population
torrents: active seniors looking for attractive
retirement communities; young singles
seeking affordable townhouses; and
immigrants who are leapfrogging over urban
apartments to settle in suburban neighbor-
hoods near good schools and steady
employment. Indeed, many fast-growing
“cities” of the early 21st century—Los
Angeles, CA; Atlanta, GA; Houston and
Dallas, TX—are primarily collections of
suburbs with only marginal links to an
urban core.
Understanding the importance of lifestyle
analysis can help businesses find opportunities
even in markets where growth is slow. At
Cushman & Wakefield, the largest privately
held real estate services firm in the world,
retail analysts look beyond demographics
when assessing the residents living in a client’s
trade area. For prospective shopping center
tenants, brokers analyze the surrounding
customer base using PRIZM lifestyle segments
to determine whether the retailer can
reach its target audience. For landlords, the
Cushman & Wakefield brokers also analyze
trade area customers by PRIZM types, then
develop a target tenant list for the site.
“Analyzing population growth is getting
more granular,” says MatthewWinn, Managing
Director of the Retail Consulting Group at
Cushman & Wakefield in Atlanta, GA. “It’s
no longer enough to say how many people
earning $75,000 a year live within a five-mile
Finding Growth in Challenging Times: Seven Indicators to Evaluate Population Growth
© 2008 The Nielsen Company. All rights reservedPage 5
Fastest Growing Markets with High Rates of Residents in Suburban Rings
Metro Cities - A Markets
A1 Portland-Vancouver, OR-WA 2,182,734 261
A1 Minneapolis, MN-WI 3,227,334 253
A1 Seattle-Tacoma-Bellevue, WA 3,338,639 222
A3 Lincoln, NE 287,701 215
A3 Holland-Grand Haven, MI 261,387 212
Metro Towns - B Markets
B1 Napa, CA 136,092 208
B4 Racine, WI 195,375 154
B1 Fargo, ND-MN 189,883 149
B1 Bloomington-Normal, IL 163,626 149
B1 Columbia, MO 158,941 136
SuburbanRing Index
2008Population
Figure 6. Sources: Pop-Facts and PRIZM; Index of 100 = U.S. average of The Affluentials and Middleburbshouseholds; none are in C Markets
radius of a shopping center. Now we want
to know their lifestyle and psychographics,
and whether the daytime population and
evening shoppers are a good match for tenants.
The goal is to give prospective tenants a
reason to choose your site rather than the
one two miles down the road.”
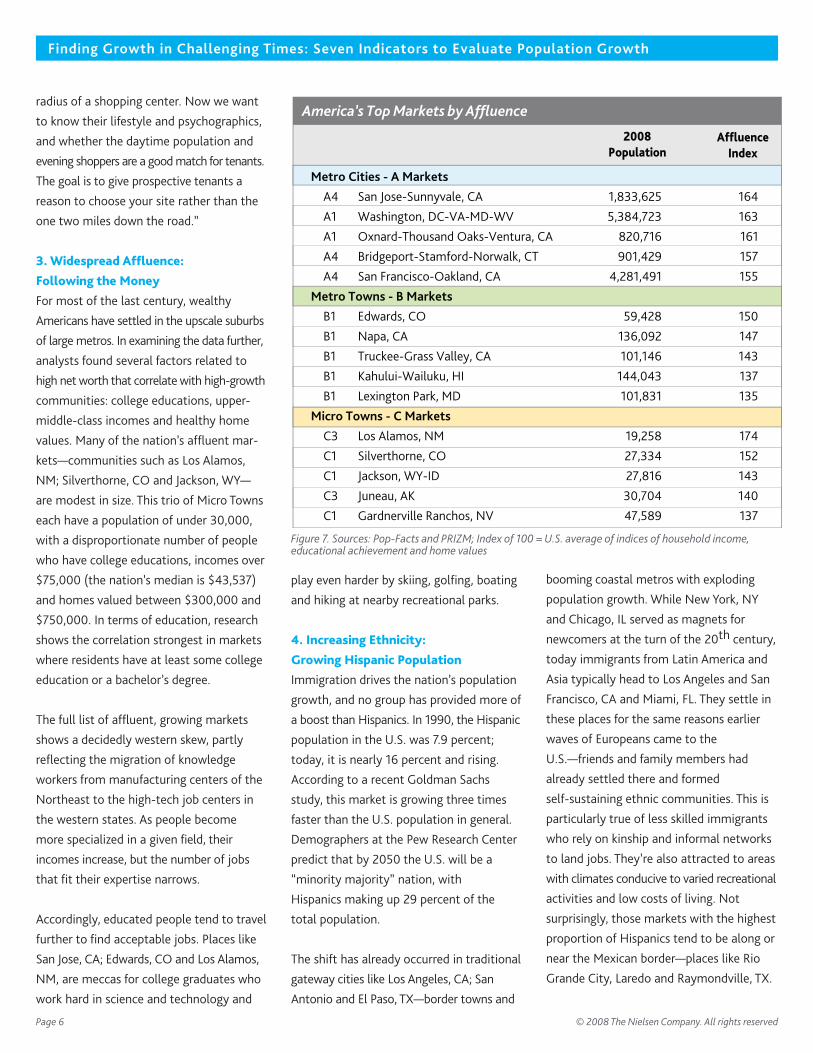
3.Widespread Affluence:
Following the Money
For most of the last century, wealthy
Americans have settled in the upscale suburbs
of large metros. In examining the data further,
analysts found several factors related to
high net worth that correlate with high-growth
communities: college educations, upper-
middle-class incomes and healthy home
values. Many of the nation’s affluent mar-
kets—communities such as Los Alamos,
NM; Silverthorne, CO and Jackson, WY—
are modest in size. This trio of Micro Towns
each have a population of under 30,000,
with a disproportionate number of people
who have college educations, incomes over
$75,000 (the nation’s median is $43,537)
and homes valued between $300,000 and
$750,000. In terms of education, research
shows the correlation strongest in markets
where residents have at least some college
education or a bachelor’s degree.
The full list of affluent, growing markets
shows a decidedly western skew, partly
reflecting the migration of knowledge
workers from manufacturing centers of the
Northeast to the high-tech job centers in
the western states. As people become
more specialized in a given field, their
incomes increase, but the number of jobs
that fit their expertise narrows.
Accordingly, educated people tend to travel
further to find acceptable jobs. Places like
San Jose, CA; Edwards, CO and Los Alamos,
NM, are meccas for college graduates who
work hard in science and technology and
play even harder by skiing, golfing, boating
and hiking at nearby recreational parks.
4. Increasing Ethnicity:
Growing Hispanic Population
Immigration drives the nation’s population
growth, and no group has provided more of
a boost than Hispanics. In 1990, the Hispanic
population in the U.S. was 7.9 percent;
today, it is nearly 16 percent and rising.
According to a recent Goldman Sachs
study, this market is growing three times
faster than the U.S. population in general.
Demographers at the Pew Research Center
predict that by 2050 the U.S. will be a
“minority majority” nation, with
Hispanics making up 29 percent of the
total population.
The shift has already occurred in traditional
gateway cities like Los Angeles, CA; San
Antonio and El Paso, TX—border towns and
booming coastal metros with exploding
population growth. While New York, NY
and Chicago, IL served as magnets for
newcomers at the turn of the 20th century,
today immigrants from Latin America and
Asia typically head to Los Angeles and San
Francisco, CA and Miami, FL. They settle in
these places for the same reasons earlier
waves of Europeans came to the
U.S.—friends and family members had
already settled there and formed
self-sustaining ethnic communities. This is
particularly true of less skilled immigrants
who rely on kinship and informal networks
to land jobs. They’re also attracted to areas
with climates conducive to varied recreational
activities and low costs of living. Not
surprisingly, those markets with the highest
proportion of Hispanics tend to be along or
near the Mexican border—places like Rio
Grande City, Laredo and Raymondville, TX.
Finding Growth in Challenging Times: Seven Indicators to Evaluate Population Growth
© 2008 The Nielsen Company. All rights reservedPage 6
America’s Top Markets by Affluence
Metro Cities - A Markets
A4 San Jose-Sunnyvale, CA 1,833,625 164
A1 Washington, DC-VA-MD-WV 5,384,723 163
A1 Oxnard-Thousand Oaks-Ventura, CA 820,716 161
A4 Bridgeport-Stamford-Norwalk, CT 901,429 157
A4 San Francisco-Oakland, CA 4,281,491 155
Metro Towns - B Markets
B1 Edwards, CO 59,428 150
B1 Napa, CA 136,092 147
B1 Truckee-Grass Valley, CA 101,146 143
B1 Kahului-Wailuku, HI 144,043 137
B1 Lexington Park, MD 101,831 135
Micro Towns - C Markets
C3 Los Alamos, NM 19,258 174
C1 Silverthorne, CO 27,334 152
C1 Jackson, WY-ID 27,816 143
C3 Juneau, AK 30,704 140
C1 Gardnerville Ranchos, NV 47,589 137
AffluenceIndex
2008Population
Figure 7. Sources: Pop-Facts and PRIZM; Index of 100 = U.S. average of indices of household income,educational achievement and home values
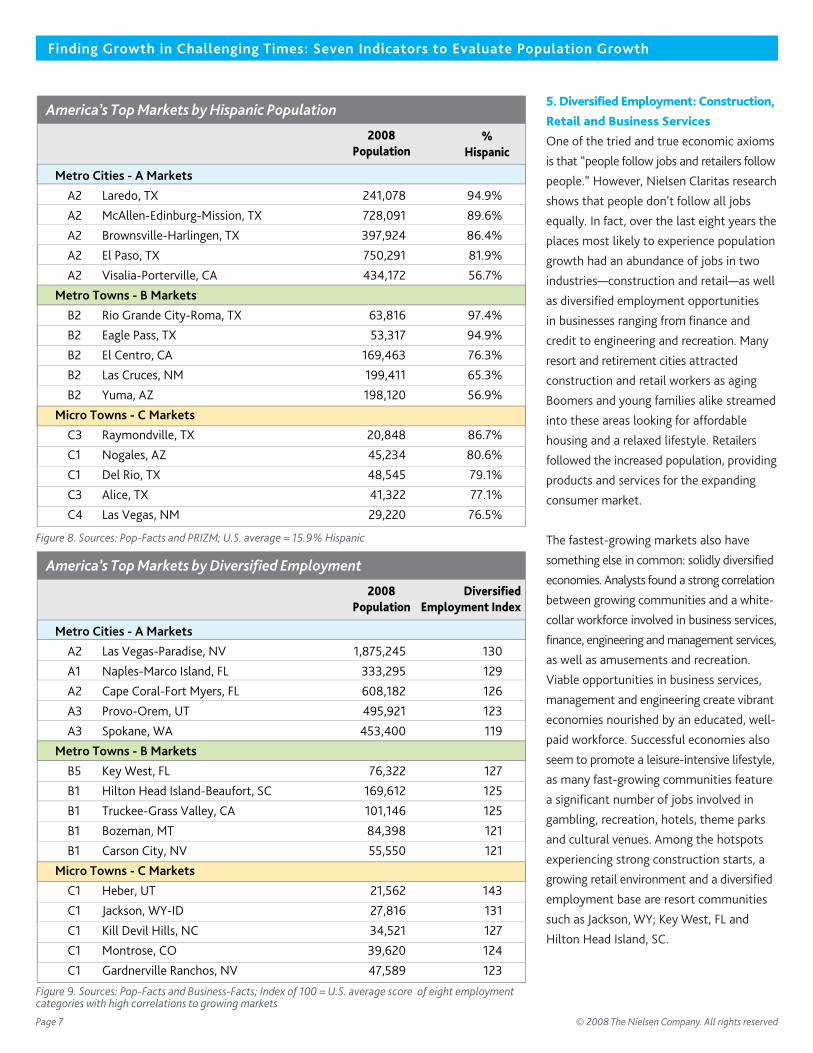
5.Diversified Employment:Construction,
Retail and Business Services
One of the tried and true economic axioms
is that “people follow jobs and retailers follow
people.” However, Nielsen Claritas research
shows that people don’t follow all jobs
equally. In fact, over the last eight years the
places most likely to experience population
growth had an abundance of jobs in two
industries—construction and retail—as well
as diversified employment opportunities
in businesses ranging from finance and
credit to engineering and recreation. Many
resort and retirement cities attracted
construction and retail workers as aging
Boomers and young families alike streamed
into these areas looking for affordable
housing and a relaxed lifestyle. Retailers
followed the increased population, providing
products and services for the expanding
consumer market.
The fastest-growing markets also have
something else in common: solidly diversified
economies. Analysts found a strong correlation
between growing communities and a white-
collar workforce involved in business services,
finance, engineering and management services,
as well as amusements and recreation.
Viable opportunities in business services,
management and engineering create vibrant
economies nourished by an educated, well-
paid workforce. Successful economies also
seem to promote a leisure-intensive lifestyle,
as many fast-growing communities feature
a significant number of jobs involved in
gambling, recreation, hotels, theme parks
and cultural venues. Among the hotspots
experiencing strong construction starts, a
growing retail environment and a diversified
employment base are resort communities
such as Jackson, WY; Key West, FL and
Hilton Head Island, SC.
Finding Growth in Challenging Times: Seven Indicators to Evaluate Population Growth
© 2008 The Nielsen Company. All rights reservedPage 7
America’s Top Markets by Hispanic Population
Metro Cities - A Markets
A2 Laredo, TX 241,078 94.9%
A2 McAllen-Edinburg-Mission, TX 728,091 89.6%
A2 Brownsville-Harlingen, TX 397,924 86.4%
A2 El Paso, TX 750,291 81.9%
A2 Visalia-Porterville, CA 434,172 56.7%
Metro Towns - B Markets
B2 Rio Grande City-Roma, TX 63,816 97.4%
B2 Eagle Pass, TX 53,317 94.9%
B2 El Centro, CA 169,463 76.3%
B2 Las Cruces, NM 199,411 65.3%
B2 Yuma, AZ 198,120 56.9%
Micro Towns - C Markets
C3 Raymondville, TX 20,848 86.7%
C1 Nogales, AZ 45,234 80.6%
C1 Del Rio, TX 48,545 79.1%
C3 Alice, TX 41,322 77.1%
C4 Las Vegas, NM 29,220 76.5%
%Hispanic
2008Population
Figure 8. Sources: Pop-Facts and PRIZM; U.S. average = 15.9% Hispanic
America’s Top Markets by Diversified Employment
Metro Cities - A Markets
A2 Las Vegas-Paradise, NV 1,875,245 130
A1 Naples-Marco Island, FL 333,295 129
A2 Cape Coral-Fort Myers, FL 608,182 126
A3 Provo-Orem, UT 495,921 123
A3 Spokane, WA 453,400 119
Metro Towns - B Markets
B5 Key West, FL 76,322 127
B1 Hilton Head Island-Beaufort, SC 169,612 125
B1 Truckee-Grass Valley, CA 101,146 125
B1 Bozeman, MT 84,398 121
B1 Carson City, NV 55,550 121
Micro Towns - C Markets
C1 Heber, UT 21,562 143
C1 Jackson, WY-ID 27,816 131
C1 Kill Devil Hills, NC 34,521 127
C1 Montrose, CO 39,620 124
C1 Gardnerville Ranchos, NV 47,589 123
DiversifiedEmployment Index
2008Population
Figure 9. Sources: Pop-Facts and Business-Facts; Index of 100 = U.S. average score of eight employmentcategories with high correlations to growing markets
But an over-reliance on construction and
finance jobs can have a downside risk. Both
industries have been hurt by the housing
crisis and credit crunch. As construction jobs
grow scarce during a protracted downturn
in the housing industry, workers leave
town. In markets that relied too heavily on
construction—such as Las Vegas, NV;
Phoenix, AZ and Naples, FL—analysts
expect to see a marked slowdown in popu-
lation growth and a rise in housing foreclo-
sures. Las Vegas, whose population grew
36 percent over the last eight years, is pro-
jected to expand by less than half, 17 per-
cent, between now and 2013—still a
respectable growth rate, but not likely
enough to fill the city’s inventory of empty
homes. In Naples, a glut of vacation proper-
ties has forced builders to lay off workers as
the pace of population growth is expected
to decline from 52 percent during the last
eight years to 16 percent for the next five.
As one Naples real estate broker put it,
“We’ve gone from an extraordinary real
estate market to a merely normal one.”
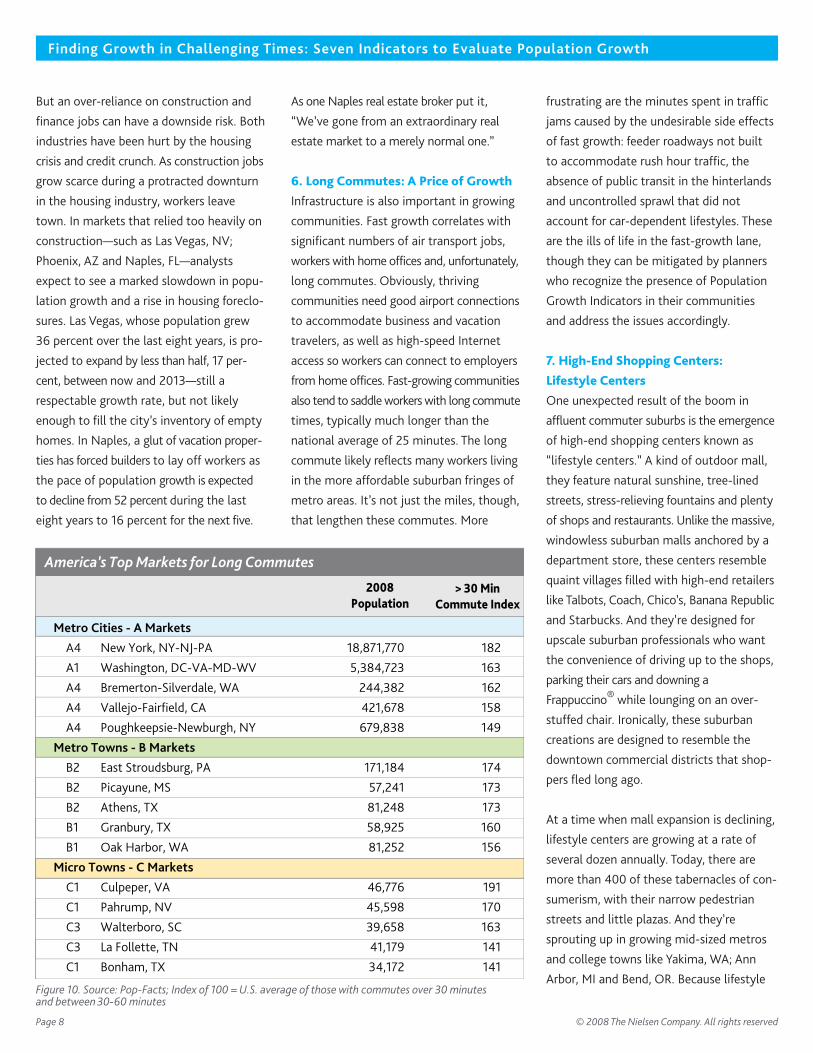
6. Long Commutes: A Price of Growth
Infrastructure is also important in growing
communities. Fast growth correlates with
significant numbers of air transport jobs,
workers with home offices and, unfortunately,
long commutes. Obviously, thriving
communities need good airport connections
to accommodate business and vacation
travelers, as well as high-speed Internet
access so workers can connect to employers
from home offices. Fast-growing communities
also tend to saddle workers with long commute
times, typically much longer than the
national average of 25 minutes. The long
commute likely reflects many workers living
in the more affordable suburban fringes of
metro areas. It’s not just the miles, though,
that lengthen these commutes. More
frustrating are the minutes spent in traffic
jams caused by the undesirable side effects
of fast growth: feeder roadways not built
to accommodate rush hour traffic, the
absence of public transit in the hinterlands
and uncontrolled sprawl that did not
account for car-dependent lifestyles. These
are the ills of life in the fast-growth lane,
though they can be mitigated by planners
who recognize the presence of Population
Growth Indicators in their communities
and address the issues accordingly.
7. High-End Shopping Centers:
Lifestyle Centers
One unexpected result of the boom in
affluent commuter suburbs is the emergence
of high-end shopping centers known as
“lifestyle centers.” A kind of outdoor mall,
they feature natural sunshine, tree-lined
streets, stress-relieving fountains and plenty
of shops and restaurants. Unlike the massive,
windowless suburban malls anchored by a
department store, these centers resemble
quaint villages filled with high-end retailers
like Talbots, Coach, Chico’s, Banana Republic
and Starbucks. And they’re designed for
upscale suburban professionals who want
the convenience of driving up to the shops,
parking their cars and downing a
Frappuccino® while lounging on an over-
stuffed chair. Ironically, these suburban
creations are designed to resemble the
downtown commercial districts that shop-
pers fled long ago.
At a time when mall expansion is declining,
lifestyle centers are growing at a rate of
several dozen annually. Today, there are
more than 400 of these tabernacles of con-
sumerism, with their narrow pedestrian
streets and little plazas. And they’re
sprouting up in growing mid-sized metros
and college towns like Yakima, WA; Ann
Arbor, MI and Bend, OR. Because lifestyle
Finding Growth in Challenging Times: Seven Indicators to Evaluate Population Growth
Page 8 © 2008 The Nielsen Company. All rights reserved
America’s Top Markets for Long Commutes
Metro Cities - A Markets
A4 New York, NY-NJ-PA 18,871,770 182
A1 Washington, DC-VA-MD-WV 5,384,723 163
A4 Bremerton-Silverdale, WA 244,382 162
A4 Vallejo-Fairfield, CA 421,678 158
A4 Poughkeepsie-Newburgh, NY 679,838 149
Metro Towns - B Markets
B2 East Stroudsburg, PA 171,184 174
B2 Picayune, MS 57,241 173
B2 Athens, TX 81,248 173
B1 Granbury, TX 58,925 160
B1 Oak Harbor, WA 81,252 156
Micro Towns - C Markets
C1 Culpeper, VA 46,776 191
C1 Pahrump, NV 45,598 170
C3 Walterboro, SC 39,658 163
C3 La Follette, TN 41,179 141
C1 Bonham, TX 34,172 141
> 30 MinCommute Index
2008Population
Figure 10. Source: Pop-Facts; Index of 100 = U.S. average of those with commutes over 30 minutesand between30-60 minutes
centers require a relatively large population
base to thrive, developers have yet to build
any in Micro Towns (“C” Markets). However,
their presence in larger markets reflects the
need to create new shopping experiences
for consumers bored with traditional malls.
Growing markets provide residents with
new retail experiences at places like
lifestyle shopping centers.
Conclusion: Predicting the Future
Populations do not necessarily grow in a
linear fashion, and current growth patterns
won’t necessarily continue. Every year,
Nielsen Claritas analysts generate five-year
projections for all CBSAs (in addition to
cities, counties and states) by combining
public U.S. Census Bureau estimates and
demographic data at small levels of geogra-
phy. Between 2008 and 2013, they estimate
that CBSAs will grow an average of 5.2 per-
cent nationwide, though in some smaller
markets in the South and West the pace
may rise above 25 percent as Boomers head
to Sun Belt retirement communities and
smaller towns to wind down their working
years. According to their analysis, Palm
Coast, FL should experience the greatest
percentage of growth among all the
nation’s cities, thanks to its location as a
bedroom community halfway between
Daytona and St. Augustine, FL. Others, like
Greeley, CO and Heber, UT, are resort com-
munities that cater to active retirees and
families who appreciate hiking, skiing and a
contemporary western lifestyle. These mar-
kets are pegged to lead the nation’s econom-
ic recovery over the next five years.
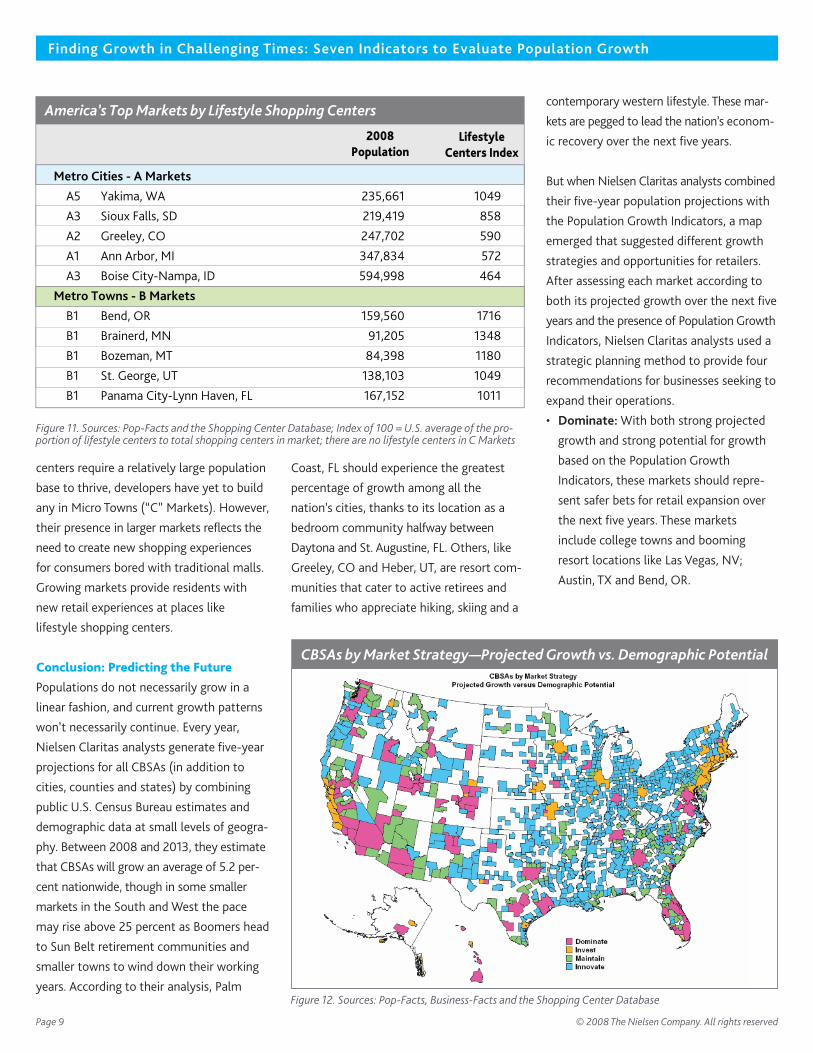
But when Nielsen Claritas analysts combined
their five-year population projections with
the Population Growth Indicators, a map
emerged that suggested different growth
strategies and opportunities for retailers.
After assessing each market according to
both its projected growth over the next five
years and the presence of Population Growth
Indicators, Nielsen Claritas analysts used a
strategic planning method to provide four
recommendations for businesses seeking to
expand their operations.
• Dominate: With both strong projected
growth and strong potential for growth
based on the Population Growth
Indicators, these markets should repre-
sent safer bets for retail expansion over
the next five years. These markets
include college towns and booming
resort locations like Las Vegas, NV;
Austin, TX and Bend, OR.
Finding Growth in Challenging Times: Seven Indicators to Evaluate Population Growth
© 2008 The Nielsen Company. All rights reservedPage 9
America’s Top Markets by Lifestyle Shopping Centers
Metro Cities - A Markets
A5 Yakima, WA 235,661 1049
A3 Sioux Falls, SD 219,419 858
A2 Greeley, CO 247,702 590
A1 Ann Arbor, MI 347,834 572
A3 Boise City-Nampa, ID 594,998 464
Metro Towns - B Markets
B1 Bend, OR 159,560 1716
B1 Brainerd, MN 91,205 1348
B1 Bozeman, MT 84,398 1180
B1 St. George, UT 138,103 1049
B1 Panama City-Lynn Haven, FL 167,152 1011
LifestyleCenters Index
2008Population
Figure 11. Sources: Pop-Facts and the Shopping Center Database; Index of 100 = U.S. average of the pro-portion of lifestyle centers to total shopping centers in market; there are no lifestyle centers in C Markets
CBSAs by Market Strategy—Projected Growth vs. Demographic Potential
Figure 12. Sources: Pop-Facts, Business-Facts and the Shopping Center Database

• Invest:With moderate projected growth,
but strong potential based on their
Population Growth Indicators, these
markets may grow faster than expected,
indicating possible opportunities for
retailers. Among these markets are such
knowledge worker havens as Los Alamos,
NM; San Jose, CA; Boulder, CO and
Minneapolis, MN.
• Maintain: Markets in this category may
be riskier for retailers because, though
their projected growth is above average,
their potential according to the Population
Growth Indicators is below average. In
markets like New Orleans, LA; Coeur
d’Alene, ID and Brownsville, TX, retailers
may want to more thoroughly research any
expansions plans.
• Innovate: With weak scores for both
projected and potential growth, the many
small markets in this group would need
extra money and attention—perhaps a
new retail concept or a different product
mix—to become a promising retail oppor-
tunity. Among the communities in this
category are college towns like
Columbia, MO; Corvallis, OR and
Greensboro, NC.
Admittedly, any strategic plan that combines
historical indicators with future estimates
has inherent limitations. The hallmarks of
growth can evolve over time. And as the
Population Growth Indicators show, growth
can manifest itself in unexpected ways.
In addition, the importance of specific
indicators can vary depending on a retailer’s
target audience.
Nevertheless, retailers can use this analysis
to quickly assess a market’s potential and
determine where it fits into their overall
development strategy. Even in a sluggish
economy with slow population growth, this
innovative modeling approach can suggest
expansion opportunities in overlooked markets.
With this new approach to analysis based on
the Population Growth Indicators, retailers
now have a tool to help them identify these
rising stars and stake out the best locations
to attract their target customers. For those
retailers willing to embrace this paradigm shift
in understanding growth, many may be in a
position to reap the rewards for their expansion
efforts—or at least avoid costly mistakes.
Behind the Numbers
For the methodology, Nielsen Claritas
analysts examined hundreds of variables
before determining several dozen that were
correlated to percent growth from 2000 to
2008. Variables with strong positive and
negative correlations were grouped by vari-
able type and selected to reflect collineari-
ty (e.g., variables like income and educa-
tion that tend to track together). This
process reduced the set of Population
Growth Indicators to the core seven that
were then used to score and classify CBSA
markets. And the maps and tables reflect
markets that are outperforming others,
according to a proprietary population growth
analytical approach that utilizes Pop-Facts
demographic estimates and projections
data.
Inverse or negative correlations (such as high
school education) were not used because
analysts did not want to “double-count”
against low growth markets; by definition,
markets with fewer college graduates will
have a higher percentage of residents with
only a high school education or less.
While correlations provide valuable insight,
a strict cause and effect relationship should
not be inferred. For example, a high percentage
of construction workers in a market may be
highly correlated to growth, but it’s doubtful
that simply having an abundance of
construction workers will create high
growth. More likely, construction workers
are attracted to markets that are already
growing and need new homes, roads and
shopping centers—as well as the workers
to build them.
For other variables, like income, education
and business services employment, the
cause versus effect is less clear. While high
growth markets are more likely to attract
educated professionals in search of opportunity,
an abundance of well-educated professionals
may also lead to high growth in a market
as potential employers are drawn by the
talent pool. In this case, the presence of
educated residents is a cause, rather than
an effect, of growth. Diversity is another fac-
tor that could be a cause—diverse markets
are more dynamic and grow faster—or an
effect, because growing markets tend to
attract more immigrants.
Ultimately, markets with an educated and
diverse work force likely will attract busi-
ness services and technology innovators
and, because people tend to follow jobs—
growth will follow. These assumptions were
made when scoring, classifying and organ-
izing CBSA markets along the Dominate-
Invest-Maintain-Innovate dimensions cited
in the conclusion.
Finding Growth in Challenging Times: Seven Indicators to Evaluate Population Growth
© 2008 The Nielsen Company. All rights reservedPage 10
Finding Growth in Challenging Times: Seven Indicators to Evaluate Population Growth
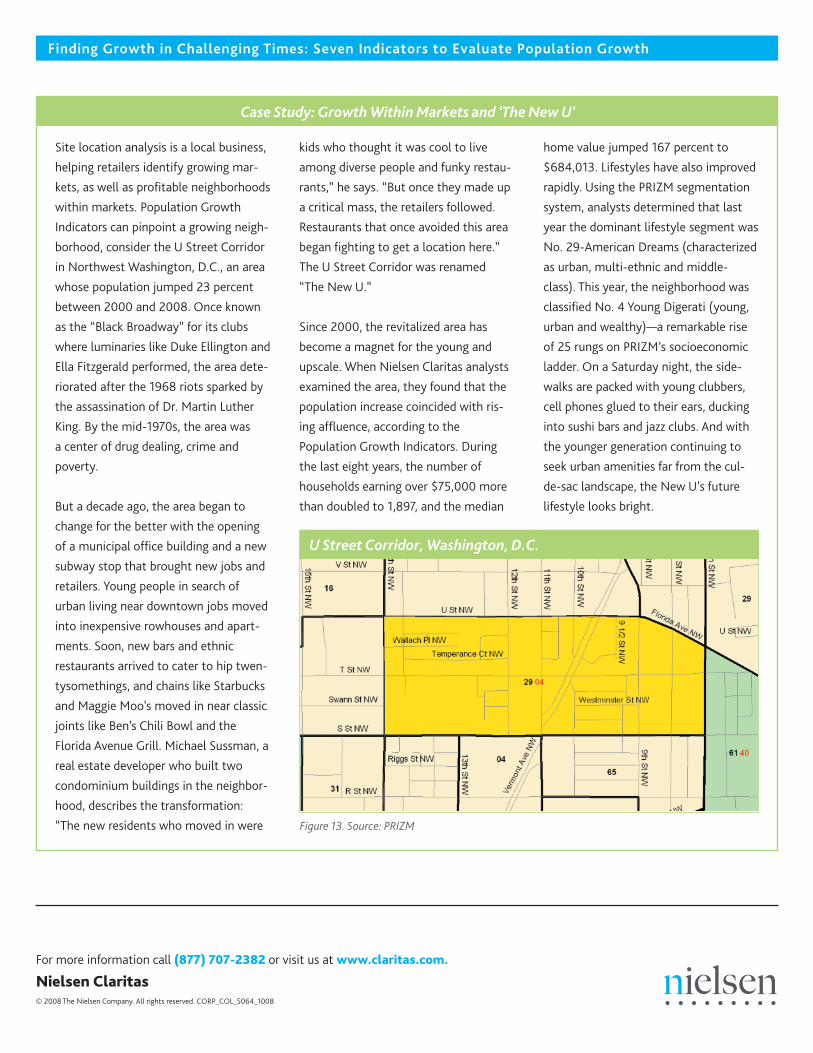
U Street Corridor, Washington, D.C.
Figure 13. Source: PRIZM
Site location analysis is a local business,
helping retailers identify growing mar-
kets, as well as profitable neighborhoods
within markets. Population Growth
Indicators can pinpoint a growing neigh-
borhood, consider the U Street Corridor
in Northwest Washington, D.C., an area
whose population jumped 23 percent
between 2000 and 2008. Once known
as the “Black Broadway” for its clubs
where luminaries like Duke Ellington and
Ella Fitzgerald performed, the area dete-
riorated after the 1968 riots sparked by
the assassination of Dr. Martin Luther
King. By the mid-1970s, the area was
a center of drug dealing, crime and
poverty.
But a decade ago, the area began to
change for the better with the opening
of a municipal office building and a new
subway stop that brought new jobs and
retailers. Young people in search of
urban living near downtown jobs moved
into inexpensive rowhouses and apart-
ments. Soon, new bars and ethnic
restaurants arrived to cater to hip twen-
tysomethings, and chains like Starbucks
and Maggie Moo’s moved in near classic
joints like Ben’s Chili Bowl and the
Florida Avenue Grill. Michael Sussman, a
real estate developer who built two
condominium buildings in the neighbor-
hood, describes the transformation:
“The new residents who moved in were
kids who thought it was cool to live
among diverse people and funky restau-
rants,” he says. “But once they made up
a critical mass, the retailers followed.
Restaurants that once avoided this area
began fighting to get a location here.”
The U Street Corridor was renamed
“The New U.”
Since 2000, the revitalized area has
become a magnet for the young and
upscale. When Nielsen Claritas analysts
examined the area, they found that the
population increase coincided with ris-
ing affluence, according to the
Population Growth Indicators. During
the last eight years, the number of
households earning over $75,000 more
than doubled to 1,897, and the median
home value jumped 167 percent to
$684,013. Lifestyles have also improved
rapidly. Using the PRIZM segmentation
system, analysts determined that last
year the dominant lifestyle segment was
No. 29-American Dreams (characterized
as urban, multi-ethnic and middle-
class). This year, the neighborhood was
classified No. 4 Young Digerati (young,
urban and wealthy)—a remarkable rise
of 25 rungs on PRIZM’s socioeconomic
ladder. On a Saturday night, the side-
walks are packed with young clubbers,
cell phones glued to their ears, ducking
into sushi bars and jazz clubs. And with
the younger generation continuing to
seek urban amenities far from the cul-
de-sac landscape, the New U’s future
lifestyle looks bright.
For more information call (877) 707-2382 or visit us at www.claritas.com.
Nielsen Claritas© 2008 The Nielsen Company. All rights reserved. CORP_COL_5064_1008
Case Study: Growth Within Markets and ‘The New U’