Embed Size (px)
Citation preview

Atmos. Chem. Phys., 7, 3231–3247, 2007www.atmos-chem-phys.net/7/3231/2007/© Author(s) 2007. This work is licensedunder a Creative Commons License.
AtmosphericChemistry
and Physics
Fine aerosol bulk composition measured on WP-3D research aircraftin vicinity of the Northeastern United States – results from NEAQS
R. E. Peltier1, A. P. Sullivan1,*, R. J. Weber1, C. A. Brock2, A. G. Wollny2,3, J. S. Holloway2,3, J. A. de Gouw2,3, andC. Warneke2,3
1School of Earth and Atmospheric Science, Georgia Institute of Technology, Atlanta, GA, USA2National Oceanic and Atmospheric Administration, Earth Systems Research Laboratory, Boulder, CO, USA3Cooperative Institute for Research in Environmental Research, University of Colorado, Boulder, CO, USA* now at: Department of Atmospheric Science, Colorado State University, Fort Collins, CO, USA
Received: 25 January 2007 – Published in Atmos. Chem. Phys. Discuss.: 27 February 2007Revised: 5 June 2007 – Accepted: 11 June 2007 – Published: 25 June 2007
Abstract. During the New England Air Quality Study(NEAQS) in the summer of 2004, airborne measurementswere made of the major inorganic ions and the water-solubleorganic carbon (WSOC) of the submicron (PM1.0) aerosol.These and ancillary data are used to describe the over-all aerosol chemical characteristics encountered during thestudy. Fine particle mass was estimated from particle volumeand a calculated density based on measured particle compo-sition. Fine particle organic matter (OM) was estimated fromWSOC and a mass balance analysis. The aerosol over thenortheastern United States (U.S.) and Canada was predomi-nantly sulfate and associated ammonium, and organic com-ponents, although in unique plumes additional ionic com-ponents were also periodically above detection limits. Inpower generation regions, and especially in the Ohio RiverValley region, the aerosol tended to be predominantly sul-fate (∼60%µgµg−1) and apparently acidic, based on an ex-cess of measured anions compared to cations. In all other re-gions where sulfate concentrations were lower and a smallerfraction of overall mass, the cations and anions were bal-anced suggesting a more neutral aerosol. In contrast, theWSOC and estimated OM were more spatially uniform andthe fraction of OM relative to PM mass was largely influ-enced by sources of sulfate. The study median OM massfraction was 40%. Throughout the study region, sulfate andorganic aerosol mass were highest near the surface and de-creased rapidly with increasing altitude. The relative frac-tion of organic mass to sulfate was similar throughout all al-titudes within the boundary layer (altitude less than 2.5 km),but was significantly higher at altitude layers in the free tro-posphere (above 2.5 km). A number of distinct biomass burn-
Correspondence to:R. E. Peltier([email protected])
ing plumes from fires in Alaska and the Yukon were period-ically intercepted, mostly at altitudes between 3 and 4 km.These plumes were associated with highest aerosol concen-trations of the study and were largely comprised of organicaerosol components (∼60%).
1 Introduction
Atmospheric aerosols are known to be detrimental to humanhealth (Dockery et al., 1993) and play a role in climate forc-ing through both a direct and indirect influence on the plan-etary radiation balance (IPCC, 2007). On average, sulfateis currently one of the most abundant aerosol species (bymass) observed in the atmosphere (Heintzenberg, 1989), andits thermodynamic and physical properties have been widelydocumented. Ammonium and nitrate are also common in-organic components of ambient particles. Inorganic com-pounds, such as sodium, chloride, potassium, calcium, andmagnesium can also significantly contribute to particle massin regions impacted by sea-spray and mineral dust. Carbona-ceous material is another abundant aerosol component, how-ever it is not well characterized due to its complex chemicalnature (Eatough et al., 1993; Rogge et al., 1993; Zappoli etal., 1999). New insights into the sources and processing ofatmospheric aerosols can be gained by large intensive fieldcampaigns in which multiple gas-phase and aerosol measure-ments, together with meteorological analysis tools and emis-sion inventories, can be used to identify specific character-istics, sources, and processes involving the aerosol and theirchemical precursors.
It has long been established that the northeastern US andCanada are often affected by anthropogenic emissions from
Published by Copernicus Publications on behalf of the European Geosciences Union.
3232 R. E. Peltier et al.: Aerosol bulk composition in the Northeastern US – NEAQS
the midwestern U.S. (Kelleher and Feder, 1978), and that thistransport can extend from the continent for 500 km or more(Beattie and Whelpdale, 1989). Previous research programs,such as NARE (Fehsenfeld et al., 1996), TARFOX (Russellet al., 1999), and NEAQS2002 (Bates et al., 2005), have in-vestigated the characteristics and sources of aerosol particlesand gases in this region of the U.S.
The International Consortium for Atmospheric Researchon Transport and Transformation (ICARTT), a multinationaland multiplatform research initiative, recently studied thetransport of pollutants and atmospheric chemistry of theNortheastern United States and Canada (Fehsenfeld et al.,2006). The National Oceanic and Atmospheric Adminis-tration’s (NOAA) WP-3D research aircraft participated inthese experiments. Based in Portsmouth, NH (43.08 N,−70.82 W), research flights were conducted over regions thatincluded the Canadian Maritime provinces, northern Quebec,New England, the Ohio River Valley, and western edge of theNorth Atlantic. Measurements were made during the periodof 5 July to 15 August, 2004.
This paper identifies the main chemical components, theirsources and the resulting spatial distribution of the bulkPM1.0 aerosol (aerodynamic diameters less than 1.0µm) thatwere sampled throughout the summer field campaign. Otherpapers focus on specific plumes to investigate the evolutionof fine particles from anthropogenic emissions along the ur-ban corridor from Washington D.C. to Boston MA (Sullivanet al., 2006; Brock et al., 20071).
2 Experimental methods
Fine particle bulk chemical composition was measuredonline from the NOAA WP-3D aircraft with two auto-mated systems, each involving a Particle-Into-Liquid Sam-pler (PILS). One PILS was coupled to two Metrohm® ionchromatographs (Model 761, Houston, TX), while the sec-ond was coupled to a Sievers total organic carbon analyzer(GE Water Systems, Model 800T, Boulder, CO). The first in-strument package is referred to as PILS-IC (ion chromatogra-phy), and the second as PILS-WSOC (water soluble organiccarbon). PILS-IC has been described in previous research(Ma et al., 2003; Orsini et al., 2003; Weber et al., 2001). ThePILS-WSOC instrument is described in detail by Sullivan etal. (2006). Both instruments sampled ambient aerosol from ashared low-turbulence inlet (LTI) (Wilson et al., 2004), eachsampling at 15.0 l/min. Upstream of the instruments, a non-rotating micro-orifice impactor (Marple et al., 1991) with1.0µm cut size (at 1 atmosphere) removed particles withaerodynamic diameters greater than 1.0µm aerodynamic di-
1Brock, C. A., Wollny, A. G., de Gouw, J. A., Warneke, C.,Fehsenfeld, F. C., Peltier, R. E. Sullivan, A. P, and Weber, R. J.: Sec-ondary Aerosol Formation in Pollution Plumes Transported fromthe East Coast of the United States, in preparation, 2007.
ameter at relative humidity that may have been significantlylower than ambient due to sample heating within the aircraft.
2.1 PILS-IC
The PILS-IC was operated using a chromatographic separa-tion of 2.45 min for both the cations (ammonium, sodium,calcium, potassium, magnesium) and anions (chloride, sul-fate, and nitrate). A “Cation 1–2” column and “AnionA Supp 5 (100 mm)” column (Metrohm-Peak, Houston,TX) was operated at an eluent flow rate of 1.5 ml min−1,and 1.05 ml min−1, respectively. Eluents used duringthis campaign were 11 mM Na2CO3 (sodium carbonate),6 mM NaHCO3 (sodium bicarbonate) for anion exchange,and 8.5 mM L-tartaric acid, 4.1 mM dipicolinic acid forcation exchange. With the liquid flow rates used in this cam-paign, limit of detection ranged from 0.2µg m−3 for cationspecies (except potassium ion, which was 0.5µg m−3) to0.02–0.04µg m−3 for anions. The PILS impactor was con-tinuously washed with a transport flow of 0.19 ml min−1 ofultrapure deionized water spiked with lithium fluoride as aninternal standard. Liquid sample from the PILS was split be-tween the anion and cation ICs. Each flow was continuouslydrawn via syringe pumps into a 150µl sample loop at a rateof 100µl min−1, resulting in a 90 s sample integration time.The resulting measurement interval was 2.45 min, with eachsample representing a 90-s collection time.
To eliminate interferences from gases, sample air passedthrough a carbon monolith denuder and a set of etched glasshoneycomb denuders prior to entering the PILS-IC. Oneetched glass denuder was coated with citric acid (for removalof gases such as NH3 (ammonia)), and the second was coatedwith sodium carbonate (for removal of gases such as HNO3(nitric acid), SO2 (sulfur dioxide), and HCl (hydrochloricacid)). Before each flight, a valve diverted the sampledaerosol through a HEPA filter for an assessment of denuderfunction, as well as a quantification of backgrounds. Sul-fate was the only ionic compound measured with detectablebackground interference, which was generally constant at0.015µg l−1 (equivalent to ambient aerosol concentration of10 ng m−3). The sulfate background was subtracted from thedataset.
The ion chromatographs were calibrated using known di-lutions of NIST-traceable liquid anion and cation stock stan-dards. Linear calibration curves forced through zero weredetermined from five different concentrations of anions andcations that spanned the range of ionic concentrations typi-cal for aerosol liquid samples collected from the PILS. Thecation IC was calibrated before the mission began, and wasre-calibrated near the middle and at the end of the mission.Sensitivity changed by less than 5% over the 6-week project.The anion column was calibrated before the mission; how-ever, the column was replaced and calibrated on 29 July 2004and the system was re-calibrated at the end of the mission(again, with no significant change in calibration constants).
Atmos. Chem. Phys., 7, 3231–3247, 2007 www.atmos-chem-phys.net/7/3231/2007/

R. E. Peltier et al.: Aerosol bulk composition in the Northeastern US – NEAQS 3233
2.2 PILS-WSOC
A Particle-Into-Liquid Sampler coupled to a total organiccarbon (TOC) analyzer (GE Water Systems, 800T, Boulder,CO) was used to measure the water-soluble organic carbon(WSOC) component of fine particles. WSOC was measuredwith a PILS-WSOC that functions similar to a PILS-IC, how-ever, in this case the PILS liquid sample is quantified for car-bon mass. The PILS was operated so that the collected par-ticles were mixed with a transport flow of ultrapure deion-ized water to produce a total liquid flow rate of 1.3 ml min−1.This sample liquid was pumped through a 0.5µm PEEK fil-ter via two 2.5 ml glass syringe pumps (Versa 3, Kloehn Inc.)operating in an alternating tandem mode to provide a smoothcontinuous flow. The TOC analyzed most of this flow by run-ning at a sample flow rate of 1.2 ml min−1. The instrumentquantifies the carbon mass by converting carbon in the liq-uid sample to CO2 (carbon dioxide) through a combinationof chemical and UV oxidation. The CO2 is then detected byconductivity. This instrument operated at a 3-s measurementrate with a detection limit of approximately 0.1µgC m−3 andestimated measurement uncertainty of±8%+0.3µgC m−3
(Sullivan et al., 2006). Liquid concentrations (in parts perbillion carbon, or ppbC) of WSOC ranged from 10 ppbC toapproximately 300 ppbC for the flow rates employed and re-gions investigated during the airborne experiment.
Upstream to the PILS-WSOC, sample air is passedthrough an activated carbon parallel-plate denuder (Eatoughet al., 1993) to remove organic vapors. Throughout allflights, a computer-activated valve was triggered every 3 hto direct the sample through a Teflon filter for quantifyingthe backgrounds by assessing any positive artifacts due to gaspenetration through the denuders and absorption in PILS, andorganic artifacts in the sample water. This background wasassumed constant between consecutive background measure-ments and subtracted from the dataset. Although the TOCanalyzer is factory calibrated, a series of oxalic acid stan-dards were used to verify calibration stability. Calibrationswere typically within 5% of the factory calibration.
Data were recorded continuously at 3-s integrals. In thefollowing analysis, the data have been averaged to 1 min,where the average would only be computed if at least 75% ofpossible data points were valid within the one-minute win-dow. For a more detailed discussion on the PILS-WSOC, seeSullivan et al. (2006).
2.3 Other instrumentation
Additional supporting measurements were used throughoutthe analysis and include 1 s observations of sulfur dioxide(SO2) and carbon monoxide (CO) (Holloway et al., 2000)and gaseous organic compounds measured by a proton trans-fer reaction-mass spectroscopy (PTR-MS) with an approx-imate sampling frequency of 18 s (de Gouw et al., 2003).PM1.0 volume, which is used extensively in the following
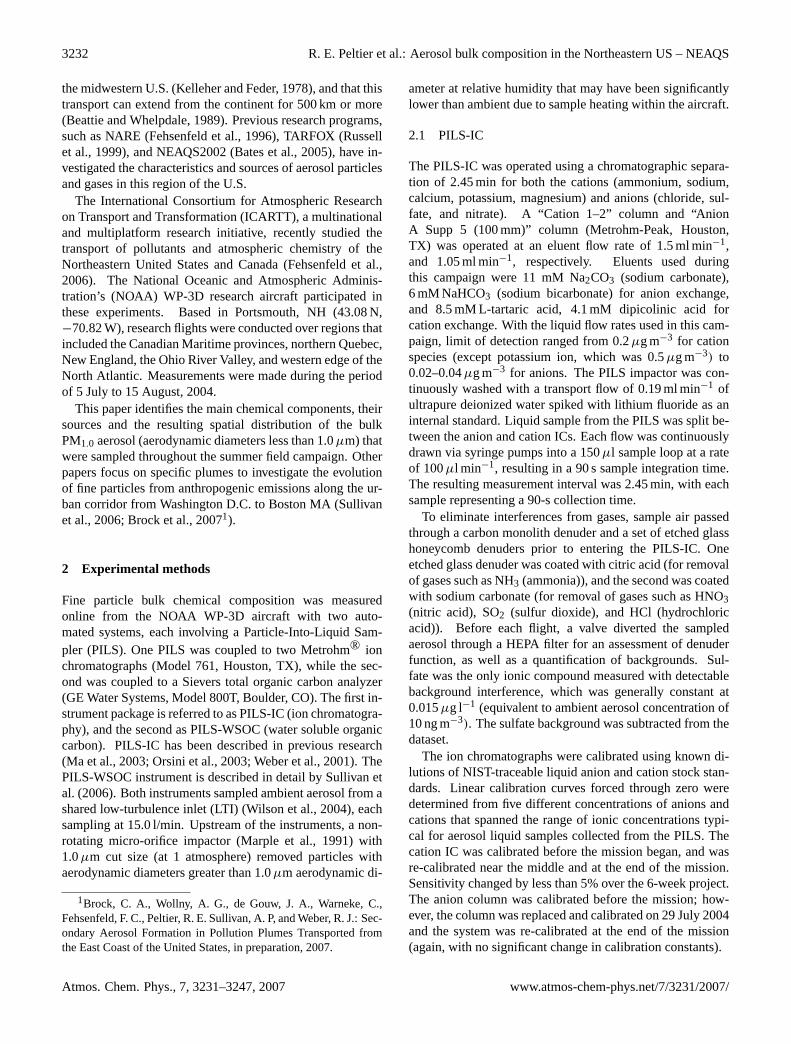
Fig. 1. Overview of all WP-3D flight tracks flown during theNEAQS experiment. The aircraft was based at Pease Airfield inPortsmouth, NH. 17 research flights were conducted and were typ-ically 8-9 hours in duration.
analysis, was measured at 1s resolution using a combina-tion of three instruments: a battery of 5 condensation par-ticle counters (CPC), a modified Lasair 1001 optical parti-cle counter (OPC), and a white light optical particle counter(WLOPC) (Brock et al., 2004; Brock et al., 2003). Locatedin a pod under an aircraft wing, the CPC measured total con-centrations in five cumulative particle size ranges (0.004µmto 0.055µm). The OPC measured concentrations in 64 sizebins spanning the size range from 0.15µm to 0.95µm di-ameter. Sampled air was heated to 35◦C for the CPC, andwas not heated in the case of the OPC. However, relative hu-midity was measured in the inlet of the OPC, and the datawere corrected to RH of 40% using a fitted curve of hygro-scopic diameter growth for mixed sulfate/organic particlesas described by Santarpia et al. (2004). Lastly, the WLOPCwas located inside the aircraft and measured size bins from0.7µm to 8.0µm. The data are processed by an inversiontechnique which determines a smooth and continuous sizedistribution that is consistent with the data and experimentalresponse of the instruments, as well as with the instrumentuncertainty. A more detailed description of volume mea-surement methodology, calibration, and uncertainty can beseen in Brock et al. (2007)1, Brock et al. (2000, 2002), andWollny et al. (2007)2. Ambient pressure and temperaturewere recorded while in flight and used to adjust all aerosolparticle concentration data reported here to standard condi-tions (20◦C and 1 atmosphere).
2Wollny, A. G., Brock, C. A. de Gouw, J. A., Warneke, C.,Fehsenfeld, F. C., Peltier, R. E. Sullivan, A. P, and Weber, R. J.:Microphysical and chemical properties of particles in aged biomassburning plumes from forest fires in Alaska and Western Canada, inpreparation, 2007.
www.atmos-chem-phys.net/7/3231/2007/ Atmos. Chem. Phys., 7, 3231–3247, 2007
3234 R. E. Peltier et al.: Aerosol bulk composition in the Northeastern US – NEAQS
3 Results
Airborne measurements provide the opportunity to samplewith a single set of instruments large geographic regions anda range of altitudes. A map, including aircraft flight pathsduring the deployment based out of Portsmouth, New Hamp-shire is shown in Fig. 1. During this experiment, a majority(∼69%) of observations took place at altitudes less than 2000meters above sea level.
3.1 Aerosol composition – main chemical components ofPM1.0
Table 1 summarizes the bulk aerosol composition mea-surements that were made from the NOAA WP-3D dur-ing the NEAQS field campaign. For the species measured,both below and above 2 km altitude, the two main com-ponents by mass were sulfate and WSOC. Sulfate was ob-served throughout the field campaign with a mean concen-tration of 3.86µg m−3, although the range of observationspanned from the limit of detection (LOD, see Table 1)to 30.96µg m−3. Ammonium ion was also commonly ob-served, with a mean concentration of 1.1µg m−3 (range:LOD to 6.5µg m−3) and was well correlated with sulfate(r2=0.74). Water-soluble organic carbon (WSOC) averaged2.2µg C m−3, and ranged from the LOD to 25.6µg C m−3,with highest concentrations measured within biomass burn-ing plumes.
The other measured ions were nearly always below thelimit of detection, with the exception of periodic encounterswith unique plumes. For example, at the detection limit of0.04µg m−3, nitrate ion was almost exclusively observed inbiomass burning plumes and was often correlated with theammonium ion. This finding was expected since nitrate is aknown component of biomass burning smoke (Chow et al.,1994) and is unlikely to be observed at significant concen-trations in fine particles during the summertime in the north-eastern U.S. (Tolocka et al., 2001).
Compounds associated mainly with mineral dust, calcium(Ca2+) and magnesium (Mg2+), and sea-salt particle compo-nents, sodium (Na+) and chloride (Cl−), were usually nearor below the detection limits for the PM1.0 particles sampledin this mission. Potassium (K+) ion was typically below theLOD, even during biomass burning plume sampling. This issignificant because these plumes contained the highest con-centrations of aerosol mass measured during the experimentand other studies have shown that K+ is prevalent in fineparticle biomass burning smoke, (Lee et al., 2003; Ma et al.,2003). Assuming1K+ concentration equals 0.25µg m−3,(one-half the instrument LOD for K+, and background K+
concentrations were 0),1K+/1CO ranged from 1.2 to3.9 pptv ppbv−1 (mean=2.07 pptv ppbv−1). These ratios aregenerally consistent, although somewhat lower than those re-ported in other studies (Andreae and Crutzen, 1997; Ma etal., 2003; Reiner et al., 2001), where ratios were in the range
of 1.3 to 4.9 pptv ppbv−1. Minor differences in K+ relative toCO compared to other studies could be due to differences inemissions (material and method of burning), and the fact thatin some cases the plumes had undergone long-range trans-port with evidence for precipitation scavenging (Wollny etal., 20072), a process that may have depleted the particulateK+ relative to CO (Brock et al., 20071; de Gouw et al., 2006;Warneke et al., 2006). Thus, we conclude the lack of K+ inthe observed biomass burning plumes was due to expectedconcentrations near or below the LOD, rather than a com-plete absence of K+.
3.2 Air mass classification
Sulfate, ammonium, WSOC, and aerosol volume varied sig-nificantly from their means and medians reflecting high spa-tial variability over the region sampled (Table 1). To investi-gate the physico-chemical properties of PM1.0 from differentsources, in the following analysis the data are divided into airmasses with and without a clear indication of a biomass burn-ing influence. Biomass burning emissions were identified us-ing acetonitrile as a unique tracer (de Gouw et al., 2003),with acetonitrile concentrations below 250 pptv indicatingminimal biomass burning influence. In a few cases, biomass-burning emissions from long range transport appeared tohave mixed with more regionally polluted air masses. Theseair masses were encountered near the surface and containedfine particles with high inorganic ion concentrations (e.g. am-monium and sulfate), and both high acetonitrile and WSOCconcentrations.
3.2.1 Segregation of data into three air masses types
In the following analysis, the data are binned into threegroups: 1) relatively pure biomass burning air masses –acetonitrile concentrations greater than 250 pptv and sulfateless than 4µg m−3; 2) sulfate-enhanced biomass burning airmasses – acetonitrile greater than 250 pptv, and sulfate con-centrations greater than 4µg m−3; and 3) non-biomass burn-ing influenced air masses – acetonitrile concentrations lessthan 250 pptv. (Note that 250 pptv level of acetonitrile waschosen to select for plumes which were strongly influencedby biomass burning; while plumes with lower concentrations(e.g. 0–250 pptv) may have been influenced by biomass burn-ing, this analysis focuses on biomass burning air masses thatwere relatively pure and contain high concentrations of ace-tonitrile. Also, 4µg/m3 of sulfate is chosen as the cutoffsince it is the approximate average sulfate concentration ob-served throughout all altitudes in this study. The identifi-cation of the pure and sulfate-enhanced biomass burning airmasses is not sensitive to this number). These three gener-alized air masses were observed multiple times in differentlocations throughout the experiment.
Atmos. Chem. Phys., 7, 3231–3247, 2007 www.atmos-chem-phys.net/7/3231/2007/

R. E. Peltier et al.: Aerosol bulk composition in the Northeastern US – NEAQS 3235
Table 1. Statistical overview of observed species throughout all flights during NEAQS separated into three bins: All altitudes (top), samplesbelow 2000 m (middle), and samples above 2000 m (bottom). For statistical purposes, 1/2 the LOD value is substituted when observationwas below LOD. Inorganic ions are sampled over a 90-s averaging time. Fine Volume is averaged to PILS-IC integration time (90s) withestimated water content (see text) subtracted, and WSOC is averaged over 60 s. (For Min column, most data is 1/2 LOD). For fine particlemass, calculated density, calculated OM, OM/PM mass, and Sulfate/PM mass, all data was averaged to PILS-IC integration time (90 s).WSOC was converted to OM using CWSOC=3.1; see mass closure section for additional methodology. All statistics include biomass burningdata except numbers in parentheses (biomass data is excluded for these calculations/estimations).
All Altitudes
LODa,b % above LOD Mean Median Std Dev Min Max
Chloridea 0.02 1.7% 0.02 0.01 0.12 0.01 3.77Sulfatea 0.03 97.0% 3.98 2.07 4.69 0.04 30.96Nitratea 0.04 15.0% 0.06 0.02 0.24 0.02 4.66Sodiuma 0.2 1.3% 0.1 0.1 0.1 0.1 2.7Ammoniuma 0.2 79.2% 1.1 0.6 1.1 0.1 6.5Calciuma 0.2 0.5% 0.1 0.1 0.0 0.1 0.7Potassiuma 0.5 0.1% 0.3 0.3 0.0 0.3 0.6Magnesiuma 0.2 0.1% 0.1 0.1 0.0 0.1 0.4WSOCb 0.1 100% 2.2 1.6 2.2 0.1 25.6Fine Volumec n/a n/a 9.30 6.80 8.65 0.18 90.89Fine Particle Massa n/a 16.23 (15.48) 11.27 (11.09) 14.23 (11.82) 0.06 (0.06) 123.1 (85.7)Calculated Densityd n/a 1.47 (1.48) 1.48 (1.48) 0.10 (0.10) 1.22 (1.23) 1.71 (1.71)Calculated OMa n/a 6.2 (5.8) 4.7 (4.5) 6.2 (3.9) 0.6 (0.6) 71.9 (31.6)OM/PM Mass n/a 0.43 (0.43) 0.40 (0.40) 0.20 (0.20) 0.05 (0.05) 0.99 (0.99)Sulfate/PM Mass n/a 0.29 (0.30) 0.26 (0.26) 0.17 (0.17) 0.00 (0.01) 0.99 (0.99)
Altitudes less than 2000 m
LODa,b % above LOD Mean Median Std Dev Min Max
Chloridea 0.02 1.2% 0.01 0.01 0.05 0.01 1.60Sulfatea 0.03 98.5% 4.97 3.18 4.92 0.04 30.96Nitratea 0.04 14.8% 0.05 0.02 0.13 0.02 2.41Sodiuma 0.2 0.1% 0.1 0.1 0.0 0.1 0.6Ammoniuma 0.2 97.9% 1.5 1.0 1.2 0.2 6.5Calciuma 0.2 0.3% 0.1 0.1 0.0 0.1 0.7Potassiuma 0.5 0% 0.3 0.3 0.0 0.3 0.3Magnesiuma 0.2 0% 0.1 0.1 0.0 0.1 0.1WSOCb 0.1 100% 2.0 0.8 4.0 0.1 25.6Fine Volumec n/a n/a 9.62 7.63 6.53 0.64 37.31Fine Particle Massa n/a 16.35 (16.29) 12.13 (11.87) 11.87 (11.87) 0.06 (0.06) 85.70 (85.70)Calculated Densityd n/a 1.48 (1.48) 1.48 (1.48) 0.10 (0.10) 1.24 (1.24) 1.71 (1.71)Calculated OMa n/a 6.1 (6.0) 5.0 (5.0) 4.0 (4.0) 0.6 (0.6) 31.6 (31.6)OM/PM Mass n/a 0.43 (0.43) 0.40 (0.40) 0.20 (0.20) 0.05 (0.05) 0.98 (0.98)Sulfate/PM Mass n/a 0.29 (0.29) 0.26 (0.26) 0.17 (0.17) 0.01 (0.01) 0.97 (0.97)
Altitudes greater than 2000 m
LODa,b % above LOD Mean Median Std Dev Min Max
Chloridea 0.02 2.8% 0.03 0.01 0.20 0.01 3.77Sulfatea 0.03 94.6% 1.03 0.35 1.96 0.04 16.33Nitratea 0.04 15.6% 0.11 0.02 0.40 0.02 4.66Sodiuma 0.2 2.5% 0.1 0.1 0.1 0.1 2.7Ammoniuma 0.2 38.2% 0.7 0.5 0.7 0.2 4.3Calciuma 0.2 0.6% 0.1 0.1 0.0 0.1 0.7Potassiuma 0.5 0.2% 0.3 0.3 0.0 0.3 0.6Magnesiuma 0.2 0.1% 0.1 0.1 0.0 0.1 0.4WSOCb 0.1 100% 2.2 1.8 1.6 0.2 10.7Fine Volumec n/a n/a 7.13 1.52 17.07 0.18 90.89Fine Particle Massa n/a 15.07 (6.85) 4.88 (4.08) 28.13 (6.78) 0.08 (0.08) 123.10 (26.89)Calculated Densityd n/a 1.44 (1.45) 1.42 (1.45) 0.13 (0.12) 1.22(1.23) 1.69 (1.69)Calculated OMa n/a 7.8 (3.2) 3.3 (2.9) 15.8 (1.8) 0.6 (0.6) 71.9 (10.7)OM/PM Mass n/a 0.46 (0.39) 0.42 (0.34) 0.23 (0.24) 0.06 (0.06) 0.99 (0.99)Sulfate/PM Mass n/a 0.30 (0.34) 0.28 (0.31) 0.23 (0.21) 0.00 (0.02) 0.99 (0.99)
a In µg m−3 for ions;b in µg Carbon m−3; c in µm3 cm−3; d g cm−3.
www.atmos-chem-phys.net/7/3231/2007/ Atmos. Chem. Phys., 7, 3231–3247, 2007

3236 R. E. Peltier et al.: Aerosol bulk composition in the Northeastern US – NEAQS
30
25
20
15
10
5
0
WS
OC
(µg
C m
-3)
600500400300200100
CO (ppbv)
Biomass Burning ( )Slope: 0.06 ± 0.01Int: -7.59 ± 0.65
R2 = 0.64
Non-Biomass Burning Influenced ( )Slope: 0.03 ± 0.00Int: -2.18 ± 0.06
R2 = 0.54
Sulfate-Enhanced BB ( )Slope: 0.05 ± 0.01Int: -4.16 ± 0.83
R2 = 0.67
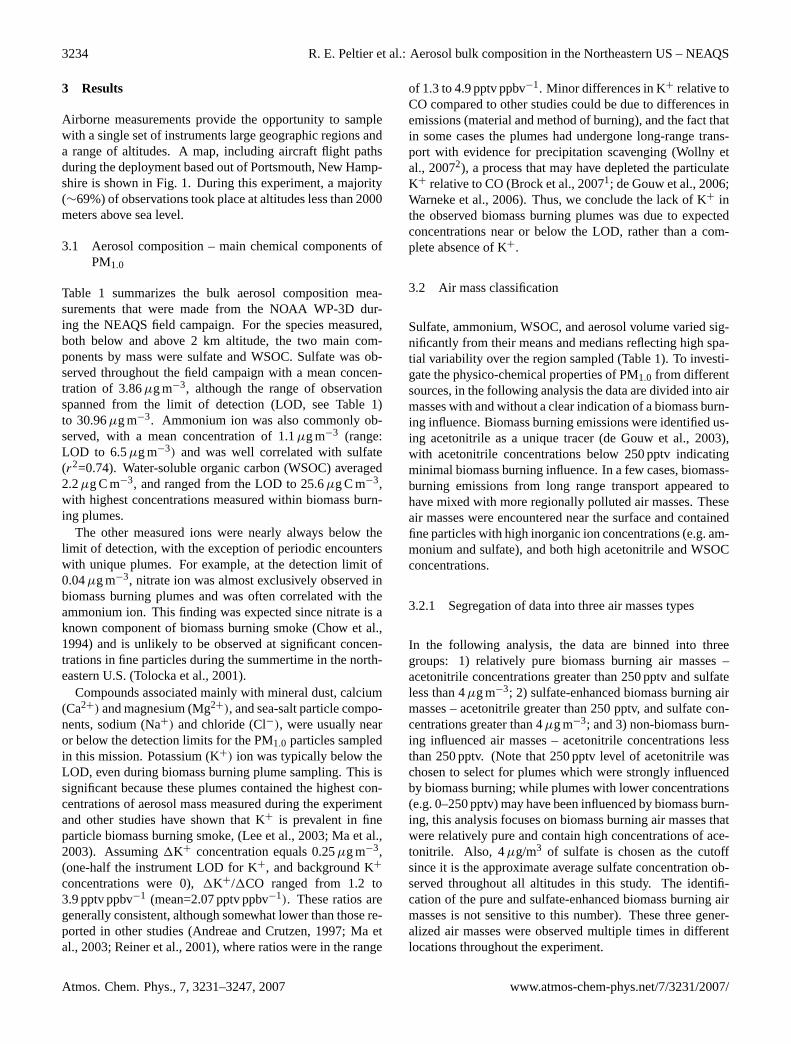
Fig. 2. WSOC plotted as a function of CO, classified by air massregime. Lines are univariate least-squares linear regression fits.Slope andr2 for all plotted data were 0.038 and 0.61, respectively.Individual regime slope, intercept, andr2 values are described inlegend. CO data were averaged to 60 seconds to match WSOC in-tegration time.
3.2.2 Sources of WSOC
The sources of anthropogenic WSOC are investigated ingreater detail by Sullivan et al. (2006), Peltier et al. (2007),and Brock et al. (2007)1 and are discussed only briefly here.FLEXPART (Stohl et al., 1998) transport model shows thatthe larger biomass burning plumes encountered originatedfrom fires in the Alaska/Yukon region (de Gouw et al., 2006;Pfister et al., 2005; Warneke et al., 2006). The highestPM1.0 volumes in this study were observed in these distinctbiomass burning plume layers. WSOC and acetonitrile werewell correlated in these plumes (r2=0.73), but were not cor-related (r2=0.06) when acetonitrile was below 250 pptv inair masses with minimal biomass burning influence. Cor-relations between WSOC and carbon monoxide (CO) wereobserved throughout this study and suggest a WSOC sourcelinked in some manner to combustion emissions. Other stud-ies (de Gouw et al., 2005; Sullivan et al., 2006; Weberet al., 2007) identify a significant source of WSOC fromsecondary organic aerosol production. Incomplete combus-tion is a significant source for CO and can occur in burn-ing of biomass materials (Chow et al., 1994) or fossil fuelscombustion (Mayol-Bracero et al., 2002). The CO-WSOCcorrelation was observed in all the types of air masses in-vestigated withr2=0.64 in relatively pure biomass burningplumes,r2=0.67 in biomass burning emissions mixed withsulfate, andr2=0.54 in air masses with no biomass burninginfluence (Fig. 2).
30
25
20
15
10
5
0
Sul
fate
(µg
m-3
)
604020WSOC (µgC m
-3)
Biomass Burning ( )
r2 = 0.06
Sulfate-Enhanced Biomass Burning ( )
r2 = 0.37
Non-Biomass Burning Influenced ( )
r2 = 0.29
Fig. 3. Sulfate plotted as a function of WSOC for all flights, classi-fied by air mass regime. WSOC data were averaged to 90 s to matchsampling time of sulfate.
3.2.3 Sulfate sources
As expected, high sulfate concentrations detected in thisstudy were linked to power plant plume emissions. The ur-ban plumes also often contained sulfate, mainly from sourcesof SO2 near the urban centers (Brock et al, manuscript inpreparation, 2007). Very distinct power plant plumes ofhigh sulfate and SO2 were also encountered away from ur-ban sources. For example, high sulfate mass was observed inthe Ohio River Valley region of the U.S. at altitudes less than∼2000 m. This region has many power generation facilitiesthat emit SO2 and were the apparent sources for the observedsulfate. Sulfate and WSOC measured in the regions of west-ern Pennsylvania are discussed in more detail (Sect. 4) whereresults from a specific flight are presented.
3.2.4 WSOC-sulfate correlations
WSOC and sulfate were not highly correlated in the regionssampled. The highest correlation of sulfate-WSOC was ob-served in the sulfate-enhanced biomass burning air mass(r2=0.37) where biomass plumes from long range trans-port had mixed with regionally polluted air masses (Fig. 3).WSOC-sulfater2 within the biomass burning plumes waslow (r2=0.06), while WSOC-sulfater2=0.29 in non-biomassburning regimes. This suggests that WSOC and sulfate didnot have co-located sources, or are subjected to highly differ-ent removal efficiencies.
3.3 Sulfate, WSOC, versus fine particle volume
Although species-specific aerosol chemical mass fractionsare of most interest, we first compare speciated mass to par-ticle volume since this only involves directly measured quan-tities. In the next section, the particle mass is estimated from
Atmos. Chem. Phys., 7, 3231–3247, 2007 www.atmos-chem-phys.net/7/3231/2007/

R. E. Peltier et al.: Aerosol bulk composition in the Northeastern US – NEAQS 3237
30
25
20
15
10
5
0
Sul
fate
(µg
m-3
)
100806040200Fine Volume (µm
3 cm
-3)
Sulfate-Enhanced BB ( )Slope: 0.47 ± 0.03Int: -5.68 ± 0.80R2 = 0.87
Non-Biomass BurningInfluenced ( )Slope: 0.54 ± 0.01Int: -0.77 ± 0.07R2 = 0.75
Biomass Burning ( )
R2 = 0.01
25
20
15
10
5
0
WS
OC
(µ
gC m
-3)
100806040200Fine Particle Mass (µg m
-3)
Biomass Burning ( )Slope: 0.22 ± 0.01Int: 0.32 ± 0.56R
2 = 0.95
Non-Biomass Burning Influenced ( )Slope: 0.13 ± 0.002Int: 0.57 ± 0.003R
2 = 0.57
30
25
20
15
10
5
0
WS
OC
(µg
C m
-3)
160140120100806040200Fine Volume (µm
3 cm
-3)
Biomass Burning ( )Slope: 0.20 ± 0.01Int: 0.74 ± 0.20R2 = 0.89
Sulfate-Enhanced BB ( )Slope: 0.12 ± 0.01Int: 3.73 ± 0.35
R2 = 0.57
Non-Biomass BurningInfluenced ( )Slope: 0.12 ± 0.03Int: 0.62 ± 0.03
R2 = 0.48
30
25
20
15
10
5
0
Sul
fate
(µ
g m
-3)
100806040200Fine Particle Mass (µg m
-3)
Biomass Burning ( )
R2 = 0.01
Non-Biomass BurningInfluenced ( ) Slope: 0.37 ± 0.15Int: 0.37 ± 0.01
R2 = 0.66
(a) (b)
(c) (d)
Fig. 4. Sulfate(a) and WSOC(b) plotted as a function of submicron particle volume. Sulfate(c) and WSOC(d) plotted as function ofestimated fine particle mass (see text). Symbols indicated data assigned to non-biomass burning, sulfate-enhanced biomass burning, andbiomass burning classifications. Lines and legends give univariate linear least-squares regression fits and statistics for each regime. Fineparticle volume averaged to 90 s in (a), and 60 s in (b) to match integration time of respective measurements. Fine particle volume averagedto 90 s in (c) and (d) to match integration time of ion measurement. In (c) and (d), cation data were unavailable for sulfate-enhanced biomassburning case; these data are not plotted.
the particle volume, and sulfate and carbonaceous mass frac-tions are then estimated.
The mean ratio of sulfate to fine particle volume, was0.54µg m−3/µm3 cm−3 and these two parameters werehighly correlated (r2=0.75) in samples without a biomassburning influence. For the sulfate-influenced biomass burn-ing plume, the ratio of sulfate to fine particle volumewas 0.47µg m−3/µm3 cm−3, and was also highly correlated(r2=0.87). The biomass burning plumes that had not mixedto the surface had a different aerosol profile; sulfate was nota significant fraction of fine particle volume and thus was notcorrelated (r2=0.01, Fig. 4) with fine particle volume.
In contrast, WSOC was highly correlated (r2=0.89) withfine particle volume within biomass burning plumes, witha WSOC to fine volume ratio of 0.20µgC m−3/µm3 cm−3.This may not represent typical emission ratios since it mayhave been altered during transport due to precipitation scav-enging (de Gouw et al., 2006). The ratio of WSOC tofine particle volume was lower (0.12µgC m−3/µm3 cm−3)
in non-biomass burning plumes and in sulfate enhancedbiomass burning plumes (Fig. 4).
The majority of measurements made during this campaignwere non-biomass burning influenced and were likely repre-sentative of typical conditions observed in the northeasternUnited States during the summer of 2004. For all data, andbased on regression analysis, sulfate was highly correlatedwith PM1.0 volume in the regions sampled (r2=0.75), whileWSOC was less well correlated (r2=0.57). An example ofthe relative importance of sulfate and WSOC in controllingtotal submicron particle mass is discussed in a case study inSect. 4.
3.4 Calculation of fine particle mass and organic mass fromvolume and WSOC measurements
In this section, the WSOC to OM (organic matter) ratio,CWSOC, is estimated and then used in subsequent analysis toconvert WSOC to OM. For this purpose, fine particle volume
www.atmos-chem-phys.net/7/3231/2007/ Atmos. Chem. Phys., 7, 3231–3247, 2007

3238 R. E. Peltier et al.: Aerosol bulk composition in the Northeastern US – NEAQS
120
100
80
60
40
20
0
Mas
s fr
om V
olum
e (µ
g m
-3)
120100806040200Mass from PILS (µg m
-3)
Slope: 1.11 ± 0.02Int: 0.29 ± 0.3
r2 = 0.77
1:1 Line
Fig. 5. Particle mass estimated from submicron volume measure-ments plotted as a function of mass from directly measured compo-sition (see text). Error bars are instrument uncertainties propagatedin quadrature.
and PILS-WSOC data were averaged to 90 s, the time inte-gral of PILS-IC measurements. All data (including biomassburning interceptions) from this field campaign are includedin this calculation. Assuming a constant density for organicaerosol mass and a constant WSOC to OM ratio (CWSOC),sulfate and OM fractions of PM1.0 mass are calculated andsummarized (Table 1).
To calculate mass from submicron particle volume, no cor-rection is made for the effect of composition on the opticalmeasurements (e.g. influence on particle refractive index).We assume a particle density of 1.78 g cm−3 for inorganicionic aerosol mass (e.g., ammonium sulfate and ammoniumbisulfate), and a density of 1.2 g cm−3 for the organic aerosolcomponent (Turpin and Lim, 2001). The overall density wasdetermined by a volume-weighted average based on concen-trations of the measured inorganic ions and OM. Fine parti-cle volume was reported at∼40% relative humidity, and thusincluded condensed water vapor in the particle volume mea-surement. This was quantified by assuming all condensedwater was associated with the measured NH+
4 and SO2−
4 andusing the model ISORROPIA (Nenes et al., 1998). The pre-dicted water volume associated with the particle at the mea-surement relative humidity of 40% was subtracted from theparticle volume measurement.
Conversion of WSOC to organic matter (OM) can be ac-complished by calculating a ratio of OM to WSOC (units:µgµgC−1). This conversion factor has two components:one accounts for the insoluble portion of carbon mass as-sociated with the organic carbon (OC) that was unmeasured(OC/WSOC, units:µgCµgC−1); the second factor convertsorganic carbon (OC) to organic matter (OM) (OM/OC, units:µgµgC−1), which accounts for the elemental groups (e.g.,
oxygen, nitrogen, hydrogen, etc.) that are associated withthe carbon. The ratio of summertime WSOC/OC from a va-riety of studies has been reported by Jaffrezo et al. (2005,references therein) to range from 31%–77%, with lower ra-tios generally found in fresh plumes and higher ratios inmore aged plumes. In addition, as reported by Turpin andLim (2001), OM/OC ratios range from 1.6 (urban) to 2.1(non-urban, more aged). The relationship between particleage and OM/WSOC ratio is complicated in that as a particleages, the WSOC/OC component increases (i.e. OC/WSOCdecreases) while the OM/OC component increases. Thiscreates conditions where the calculation of the OM/WSOCratio, defined as OM/WSOC=(OM/OC)×(OC/WSOC), issomewhat self-compensating resulting in a smaller variabil-ity of OM/WSOC than otherwise might be expected.
The mass calculated from fine particle volume (PMvol) canbe compared to that observed by PILS (PMPILS) by Eq. (1):
Vfine ×
(CWSOC × WSOC) +∑
ion(CWSOC×WSOC
ρom
)+
∑ion
ρion
=
(∑ion +
(CWSOC × WSOC
)+ Munmeasured
)(1)
This equation includes terms that describe fine particle vol-ume (Vfine), weighted density of organic matter and ions(ρom andρion), sum of measured ions (6ion), organic mat-ter, which is defined as WSOC multiplied by CWSOC, andan estimate of the unmeasured fraction that may includespecies such as elemental carbon, metals, and crustal ma-terial (Munmeasured). Rearranging the mass balance equationand using an iterative equation solver, the balance equationcan be solved for CWSOC. Occasionally (<4% of calcula-tions), CWSOC was less than 1 (OM less than WSOC); thesedata, which are likely associated with instrumental uncertain-ties, are excluded from this analysis. The median CWSOC ra-tio (±1σ ) for all data was 3.1 (±1.6)µgCµg−1. The sum ofsquares of the uncertainty associated with each measurement(particle volume, anion, cation, WSOC) results in an over-all uncertainty of∼50% in this value. Using CWSOC=3.1,PMvol and PMPILS are highly correlated (r2=0.77, Fig. 5) forall data recorded during this mission. There were no dis-cernable patterns for the WSOC-to-OM ratio across sampledlongitude, latitude, or altitudes.
The derived value CWSOC=3.1 is similar to what isexpected based on reasonable values of WSOC/OC andOM/OC previously discussed. For example, a value ofCWSOC=3.1 can be derived if OM/OC is presumed to be 1.9and WSOC is 61% of OC. This is consistent with what hasbeen found in other studies. For example, in St. Louis,MO, a summer time WSOC/OC ratio of∼61 to 64% is re-ported by Sullivan et al. (Sullivan et al., 2004) and OM/OCof 1.95±0.17 (Bae et al., 2006).
Recall that the calculated ratio from mass balance assumesan unmeasured aerosol volume as 8%. Using data from EPAsInteragency Monitoring of Protected Visual Environments
Atmos. Chem. Phys., 7, 3231–3247, 2007 www.atmos-chem-phys.net/7/3231/2007/

R. E. Peltier et al.: Aerosol bulk composition in the Northeastern US – NEAQS 3239
6000
5000
4000
3000
2000
1000
0
Alti
tude
(m
)604020
Organic Matter (µg m-3
)
2520151050WSOC (µgC m
-3)
Biomass Burning 6000
5000
4000
3000
2000
1000
0
Alti
tude
(m
)
302520151050Sulfate (µg m
-3)
6000
5000
4000
3000
2000
1000
0
Alti
tude
(m
)
6543210Ammonium (µg m
-3)
Biomass Burning
6000
5000
4000
3000
2000
1000
0
Alti
tude
(m
)
43210Nitrate (µg m
-3)
Biomass Burning
Non-Biomass Burning Influenced Biomass Burning Sulfate-Enhanced Biomass Burning
A(a) (b)
(c) (d)
Fig. 6. Altitude profiles for WSOC (and estimated OM), sulfate, ammonium, and nitrate ion. Specific biomass plumes are indicated.
(IMPROVE) sites located within the sampling region, ele-mental carbon was, on average, observed to be less than∼5% of PM2.5 mass at the IMPROVE ground sites; met-als and crustal materials at the IMPROVE sites account foran additional 2–3% of PM2.5 mass. None of these com-pounds were measured aboard the WP-3D aircraft. The IM-PROVE data are only used as an estimate of the unmeasuredaerosol in order to complete the mass closure and may not befully representative of the conditions sampled by the WP-3D;IMPROVE sites tend to measure background concentrationsof aerosol whereas the WP-3D focused mainly on specificpower plant and urban plumes. If the fraction of unmeasuredaerosol was larger than 8%, CWSOC would be slightly lower.
The influence of particle chemical composition on thismass comparison was investigated by segregating the datainto periods when the constructed chemical mass was dom-inated by either sulfate mass or WSOC (and thus OM). Fordata in which sulfate was less than 25% of the mass inferredfrom the chemically speciated measurements (for these cases
WSOC was, on average, approximately three times the massof sulfate) CWSOC is 3.3±1.9. In contrast, for data wheresulfate was greater than 80% of the mass, CWSOC is 2.8±1.4.
Surprisingly, the derived value of CWSOC was similarfor biomass burning plumes and non-biomass burning. Inbiomass burning plumes (acetonitrile concentration above250 pptv), the CWSOC was 3.3±1.3 and 3.0±1.7 for outsideof biomass burning plumes (acetonitrile concentration below250 pptv). Higher values of CWSOC within biomass burningplumes are consistent with additional insoluble organics notincluded in the WSOC measurement.
Using the results of this analysis, Table 1 describes aerosolstatistics after converting WSOC to OM and calculatingmass from fine particle volume. Estimated condensed wa-ter was subtracted from the fine particle volume measure-ment. Across all altitudes, the calculated median con-centration of submicron particle mass was 11.27µg m−3.Median fine particle mass concentration was higher atlower altitudes (12.13µg m−3) and lower at higher altitudes
www.atmos-chem-phys.net/7/3231/2007/ Atmos. Chem. Phys., 7, 3231–3247, 2007

3240 R. E. Peltier et al.: Aerosol bulk composition in the Northeastern US – NEAQS
5000
4000
3000
2000
1000
0.500.450.400.350.30OM / fine particle mass
12x10
03 4 5 6 7
OM / Sulfate
OM / Fine Particle Mass OM / Sulfate
0.500.450.400.350.300.250.200.150.10 (µg m
-3 / µg m
-3)
5000
4000
3000
2000
1000
0.80.60.40.20.0SO2 fraction of total Sulfur
87
474
366
355
198
118
99
53
74
73
67
40
67
67
49
SO2 fraction of total Sulfur
Sulfate / Fine Particle Mass
Alti
tude
(m
eter
s, b
in c
entr
oid)
(a) (b)
Fig. 7. (a)Altitude profile of ratio of sulfate to fine particle mass (grey line, top axis), and SO2 fraction of total observed sulfur (box andwhisker plot, bottom axis). Markers represent median data point of 250 m binned data at altitudes less than 2000 m, and 500 m binned dataat altitudes greater than 2000 m. Box and whisker plot gives, 10th and 90th percentiles (ends of whiskers), 25th and 75th percentile (ends ofboxes), median value (dark line), and number of observations within each bin (to immediate right of median line).(b) Altitude profiles ofratio of organic matter (OM) to fine particle mass. Organic matter/sulfate is also plotted (dashed line). Biomass burning samples have beenexcluded from this analysis.
(4.88µg m−3, though with a significant standard deviationdue to biomass burning plumes). Average particle den-sity, which was weighted by particle composition deter-mined by PILS, was 1.47 g cm−3. Median density wasslightly lower at higher altitudes, consistent with increas-ing ratios of organic material to fine particle volume (dis-cussed in next section and in Fig. 7) and an assumed organicaerosol density of 1.2 g cm−3. On average, organic matterwas 6.2µg m−3, although OM ranged from 0.6µg m−3 to71.9µg m−3. The median ratio of calculated OM to fine par-ticle mass was 0.40µg m−3/µg m−3for the entire dataset and0.46µg m−3/µg m−3 above 2000 m altitude.
Mass fractions of sulfate and WSOC can also be com-puted. Sulfate (Fig. 4c) represents∼37% of fine parti-cle mass in non-biomass burning influenced samples (de-termined by regression slope), providing further evidencethat sulfate is a significant fraction of fine particle masswithin the sampling domain. WSOC accounts for 22%(µgC m−3/µg m−3 ) of fine particle mass in biomass burningsampling, and 13% in non-biomass burning air masses withinthe sampling domain (Fig. 4d). Thus, using the WSOC-to-OM conversion technique previously discussed, we esti-mate the organic matter mass fraction of fine particle mass tobe∼68% (µg m−3/µg m−3) in biomass burning plumes and42% in non biomass burning air masses.
3.5 Variation in concentration with altitude
The NOAA WP-3D aircraft operated in an altitude rangeof approximately 250 m to 6100 m (above sea level). Alti-tude profiles of sulfate, ammonium, nitrate, and WSOC forall data collected during ICARTT in the northeastern UnitedStates are shown in Fig. 6. The sampling region was fo-cused heavily on urban outflow from New York City, NYand Boston, MA, but also included several transects of theOhio River Valley, US region (approximately 37◦ to 41◦ Nlatitude, −82◦ to −87◦ longitude). Additional samplingwas conducted in northern Quebec to sample biomass burn-ing plumes, as well as over the Gulf of Maine and west-ern regions of Canadian Maritimes to sample aged urban airmasses. Aircraft interceptions of distinct biomass burningplumes between 3 and 4 km altitude can be observed in theWSOC (OM), nitrate, and ammonium plots (Fig. 6). Addi-tional discussion of altitude profiles can be found in Sullivanet al. (2006) and Warneke et al. (2006).
In air not significantly influenced by biomass burning,measurement throughout the sampled column showed thatsulfate and ammonium concentrations were generally high-est at altitudes below 2000 m (i.e. within the boundary layer).WSOC and estimated OM had a similar profile with highestconcentrations near the surface. Aerosol nitrate concentra-tions did not vary systematically with altitude. Since con-centrations of these species, with the exception of nitrate,were highest at lower altitudes, it appears that the major
Atmos. Chem. Phys., 7, 3231–3247, 2007 www.atmos-chem-phys.net/7/3231/2007/

R. E. Peltier et al.: Aerosol bulk composition in the Northeastern US – NEAQS 3241
sources of sulfate, ammonium, and WSOC are from the sur-face and that that these compounds are not efficiently dis-persed above∼2000 m, a finding supported by a modelinganalysis of these data (Heald et al., 2006).
The altitude profile of SO2 (not shown) was similar to thatof sulfate, with higher concentrations occurring at lower al-titudes. The highest concentrations of SO2 were observednear 1000 m (∼40 ppbv). The profile of CO (not shown)was similar to WSOC (recall that CO and WSOC are corre-lated, Fig. 2), and decrease with increasing altitude, CO ap-proached a background free troposphere concentration of ap-proximately 75 ppbv. WSOC was also measured throughoutthe sampled altitude range. Excluding measurements below2000 m and biomass burning interceptions above 2000 m,WSOC measurements were higher than the instrument LOD35% of the time (535 samples). Substituting one-half LODvalue (0.05µgC m−3) in cases where the measurement wasless than LOD (note, in Table 1, the calculated OM does notsubstitute one-half LOD value, and averages are thereforehigher), mean WSOC concentration (±1σ ) above the plan-etary boundary layer was 0.3µgC m−3 (±0.5µgC m−3).Since large sources of WSOC (e.g. biomass burning plumes)are excluded from this calculation, this finding suggests afree troposphere background concentration of WSOC of ap-proximately 0.3µgC m−3. Converting this to organic mat-ter, we estimated the free troposphere concentration of or-ganic matter is approximately 1.0µg m−3. This estimate isconsistent with the findings of Heald et al. (2005), Maria etal. (2003), Park et al. (2003) and Jaffe et al. (2005) wherebackground concentrations of organic matter ranged from0.43 to∼3µg m−3.
Although absolute concentrations of WSOC (and hence,OM) and sulfate dropped sharply with increasing altitude,the ratio of sulfate to OM, ratio of sulfate to fine particlemass, and ratio of OM to fine particle mass did not fol-low this profile. To improve signal, the OM, sulfate, andparticle mass data were binned into 250 m intervals for alti-tudes less than 2 km and 500 m intervals for altitudes greaterthan 2 km. The median of the ratio was calculated for eachbin. The median values for the highest and lowest altitudebins are more uncertain since these bins include fewer datapoints. In air masses not significantly affected by biomassburning (acetonitrile<250 pptv), the median ratio of SO2 tototal sulfur (SO2/(SO2+sulfate)) and of SO2−
4 to fine parti-cle mass (µg m−3/µg m−3) in each altitude bin was calcu-lated (Fig. 7a). Between the altitudes of∼1000–3000 m,SO2/(SO2+sulfate) was lowest and sulfate/fine particle masswas highest, suggesting that in this altitude range, oxidationof SO2 to particulate sulfate had occurred at a rate faster thanthat of particle removal processes. Below this altitude, suffi-cient time may not have occurred since emission to allow forsubstantial oxidation and sulfate formation. Between 3000and 4000 m, particle removal processes (such as precipitationscavenging) may have efficiently removed sulfate particles at
a rate faster than production of sulfate by SO2 oxidation. Fi-nally, at altitudes>4000 m, slower removal processes mayhave resulted in a higher ratio of sulfate to total sulfur.
While absolute concentrations of sulfate and OM weremuch higher below 3 km altitude than above this alti-tude (Fig. 6), the ratio of OM to fine particle mass(µgC m−3/µg m−3) substantially increased with altitude inthe non-biomass burning influenced air masses, with thehighest ratios occurring above 3000 m in the free troposphere(Fig. 7b). The variation in the ratio of OM to sulfate ion withaltitude is also plotted and has a similar profile as the ratio ofOM to PM1.0 mass. This result is consistent with Novakovet al. (1997) , who reported an increase of total organic car-bon mass fraction as altitude increased from 0–3.5 km fromaircraft measurements near Virginia, US in 1996. Similarly,Murphy et al. (1998) reported that in upper tropospheric (5–19 km) measurements near Texas, internally-mixed aerosolwith higher fractions of organics relative to sulfate were ob-served.
The vertical profile of ratios in composition (Fig. 7b) sug-gests that relative to sulfate, OM is either more efficientlylofted, is removed less efficiently, and/or produced in situ atfaster rates at altitudes between 3 and 5 km. Compared to sul-fate particles, those containing significant mass fractions ofOM may be less efficiently activated to form cloud conden-sation nuclei and thus may not be as likely to undergo wetdeposition when lofted. However, Heald et al. (2005) per-formed a covariance analysis of this data set and suggest thatan unknown, possibly heterogeneous, pathway for secondaryorganic aerosol formation is a likely contributor to free tro-posphere aerosol mass. Biomass burning, which likely con-tributes to the observed background concentrations of ace-tonitrile (∼200–250 pptv), may also be responsible for someof the additional free troposphere OM concentrations that arenot fully explained in modeling studies.
3.6 Charge balance between measured ions
The spatially heterogeneous and strong emissions of some ofthe aerosol sources encountered in this study led to wide vari-ability in other aerosol properties, such as balance betweenmeasured anions and cations. Comparing concentrations ofmeasured anions to cations can provide insight into the pres-ence of unmeasured ions. In the following analysis, an ionbalance is calculated from the sum of measured cations mi-nus the sum of measured anions, in equivalence concentra-tions. Large positive or negative deviations from zero suggestunmeasured ionic constituents in the sampled aerosol parti-cles. In the following analysis, if a specific ion was at theLOD, the ion was not considered in the ion balance calcula-tion. This is to reduce a bias that would have been caused bydifferences in cation and anion LODs. Often, a balance be-tween measured anions and cations was observed; however,in many cases the net charge was negative, suggesting an un-measured cation, most likely H+, suggesting a more acidic
www.atmos-chem-phys.net/7/3231/2007/ Atmos. Chem. Phys., 7, 3231–3247, 2007
3242 R. E. Peltier et al.: Aerosol bulk composition in the Northeastern US – NEAQS
6000
5000
4000
3000
2000
1000
0
Alti
tude
(m
)
-0.3 -0.2 -0.1 0.0 0.1Net Charge (µeq m
-3)
Non BB Influenced
Biomass Burning
Sulfate-Enhanced BB
Biomass Burning
0.6
0.4
0.2
0.0
Sulfate / V
olume
0.001
0.01
0.1
1
Nor
mal
ized
Fre
quen
cy
-0.3 -0.2 -0.1 0.0 0.1Net Charge (µeq)
Above 3.5km Between
2km-3.5km Below 2km Biomass
Burning
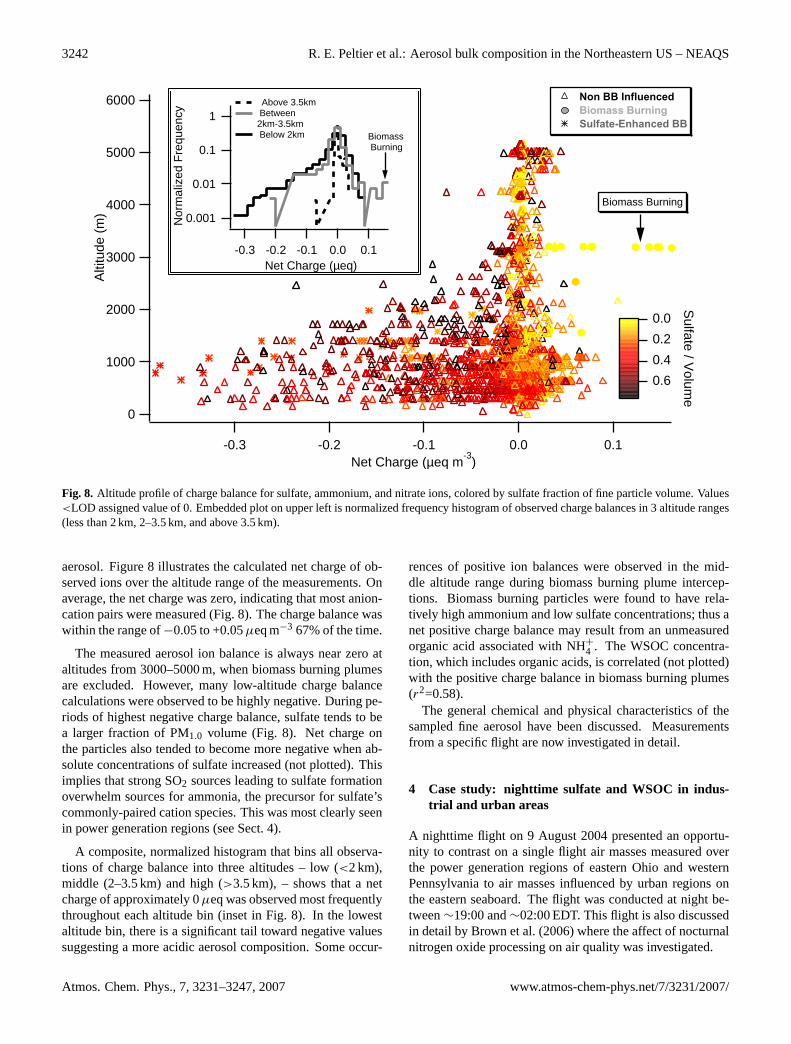
Fig. 8. Altitude profile of charge balance for sulfate, ammonium, and nitrate ions, colored by sulfate fraction of fine particle volume. Values<LOD assigned value of 0. Embedded plot on upper left is normalized frequency histogram of observed charge balances in 3 altitude ranges(less than 2 km, 2–3.5 km, and above 3.5 km).
aerosol. Figure 8 illustrates the calculated net charge of ob-served ions over the altitude range of the measurements. Onaverage, the net charge was zero, indicating that most anion-cation pairs were measured (Fig. 8). The charge balance waswithin the range of−0.05 to +0.05µeq m−3 67% of the time.
The measured aerosol ion balance is always near zero ataltitudes from 3000–5000 m, when biomass burning plumesare excluded. However, many low-altitude charge balancecalculations were observed to be highly negative. During pe-riods of highest negative charge balance, sulfate tends to bea larger fraction of PM1.0 volume (Fig. 8). Net charge onthe particles also tended to become more negative when ab-solute concentrations of sulfate increased (not plotted). Thisimplies that strong SO2 sources leading to sulfate formationoverwhelm sources for ammonia, the precursor for sulfate’scommonly-paired cation species. This was most clearly seenin power generation regions (see Sect. 4).
A composite, normalized histogram that bins all observa-tions of charge balance into three altitudes – low (<2 km),middle (2–3.5 km) and high (>3.5 km), – shows that a netcharge of approximately 0µeq was observed most frequentlythroughout each altitude bin (inset in Fig. 8). In the lowestaltitude bin, there is a significant tail toward negative valuessuggesting a more acidic aerosol composition. Some occur-
rences of positive ion balances were observed in the mid-dle altitude range during biomass burning plume intercep-tions. Biomass burning particles were found to have rela-tively high ammonium and low sulfate concentrations; thus anet positive charge balance may result from an unmeasuredorganic acid associated with NH+
4 . The WSOC concentra-tion, which includes organic acids, is correlated (not plotted)with the positive charge balance in biomass burning plumes(r2=0.58).
The general chemical and physical characteristics of thesampled fine aerosol have been discussed. Measurementsfrom a specific flight are now investigated in detail.
4 Case study: nighttime sulfate and WSOC in indus-trial and urban areas
A nighttime flight on 9 August 2004 presented an opportu-nity to contrast on a single flight air masses measured overthe power generation regions of eastern Ohio and westernPennsylvania to air masses influenced by urban regions onthe eastern seaboard. The flight was conducted at night be-tween∼19:00 and∼02:00 EDT. This flight is also discussedin detail by Brown et al. (2006) where the affect of nocturnalnitrogen oxide processing on air quality was investigated.
Atmos. Chem. Phys., 7, 3231–3247, 2007 www.atmos-chem-phys.net/7/3231/2007/

R. E. Peltier et al.: Aerosol bulk composition in the Northeastern US – NEAQS 3243
44
43
42
41
40
39
Latit
ude
-82 -80 -78 -76 -74 -72Longitude
3.0
2.5
2.0
1.5
1.0
0.5
Mol
ar R
atio
3
2
1
0
20
15
10
5
0
Sul
fate
(µg
m-3
)
1.0
0.8
0.6
0.4
0.2
Sul
fate
/ M
ass
403020100
SO2 (ppbv)
(m
ole
NH
4/m
ole
SO
4=)
Altitude (km
)
50
40
30
20
10
0
Fin
e P
artic
le V
olum
e
-82 -80 -78 -76 -74 -72Longitude
6
4
2WS
OC
(µg
C m
-3)
44
43
42
41
40
39
Latit
ude
0.4
0.3
0.2
0.1
0.0
WS
OC
/ M
ass
20
15
10
5
1.0
0.8
0.6
0.4
0.2
OM
/ Mass
300250200150100
CO (ppbv)
(µm
3 cm
-3)
(µgC
m-3
/µg
m-3
)
OM
(µg m
-3)
(a) (b)
Fig. 9. (a)Track of WP-3D aircraft on 2004/08/09 colored by SO2, and molar ratio, altitude, sulfate fraction of fine particle mass, and sulfatemass as a function of longitude.(b) As in (a), but colored by CO and fine particle volume, WSOC fraction of fine particle mass, and WSOCas a function of longitude.
Figure 9 shows the flight path colored by SO2 and CO, theaircraft altitude, and the observed spatial distribution of fineparticle volume, sulfate, WSOC, and ammonium to sulfate(NH+
4 /SO2−
4 ) molar ratios. The Pennsylvania and easternOhio portion of the flight was sampled from approximately00:00–04:00 UTC (20:00–00:00 EDT). The wind directionwas generally from the southwest at∼8 m s−1, although di-rection was more south-southwesterly during the western-most portions of the flight. Based on the combined trans-port and emission inventory model FLEXPART (Stohl et al.,1998) SO2 was largely derived from power plants locatedalong the Ohio River and in western Pennsylvania, whereasCO was generally from the Columbus and Cincinnati Ohio,Detroit, Michigan, and Pittsburgh, Pennsylvania areas. TheFLEXPART simulation indicates that both SO2 and CO wereaged approximately 1–4 days since the time of emission.
The eastern seaboard leg included a flight pattern designedto characterize the outflow of New York City from approxi-mately 04:05–07:00 UTC (00:05–03:00 EDT) as the WP-3Dreturned to Portsmouth, New Hampshire. A FLEXPARTanalysis for this region shows that the majority of CO and
SO2 that was observed originated from the New York Citymetropolitan region. These pollutants were aged generallyless than one day. Wind direction was westerly, with av-erage wind speeds around 6 m s−1. These nighttime mea-surements had somewhat low CO concentrations, typicallyranging from 150–200 ppbv in the NYC outflow, versus day-time flights where CO concentrations typically ranged from230 to 240 ppbv. The Ohio River Valley region had similarCO concentrations, apart from the 200–225 ppbv of CO ob-served in the westernmost region of the flight in the vicinityof Columbus and Cleveland, Ohio.
As expected, based on the spatial distribution of coal-firedpower plants, sulfate concentrations were factors of four tofive times higher over the power generation regions on thewestern leg of the flight compared to the eastern regions.Fine particle mass was estimated from measured volumeas discussed in a previous section. Sulfate was∼60% andWSOC ∼10% (OM ∼33%, assuming OM/WSOC is con-stant at 3.1, see Sect. 3.4) of total submicron mass in thepower generation regions of western Pennsylvania. For allof this flight, the spatial variability in PM1.0 was driven by
www.atmos-chem-phys.net/7/3231/2007/ Atmos. Chem. Phys., 7, 3231–3247, 2007

3244 R. E. Peltier et al.: Aerosol bulk composition in the Northeastern US – NEAQS
sulfate. WSOC concentrations were more spatially uniform,although slightly higher WSOC, and hence OM, in the ex-treme western portion of the flight was correlated with higherCO from Columbus and Cincinnati, Ohio.
High sulfate concentrations in the power production re-gions of western Pennsylvania (−80 to −78◦ longitude)produced an apparently acidic aerosol. In these regionsNH+
4 /SO2−
4 molar ratios were one or less compared to theeastern portion of the flight were the ratio was 2 or higher(Fig. 9). No general enhancements in WSOC concentrationsare seen in the region of lower NH+
4 /SO2−
4 molar ratios, con-sistent with (Zhang et al., 2004), who found no evidence foracid-catalyzed enhancements in organic aerosol during an-other study conducted in this region.
On the eastern leg of the flight an influence from urbanemissions can be detected. For example, the slight oscillat-ing pattern in WSOC concentration from about−74 to about−77 degrees longitude (Fig. 9) is due to entering and leavingthe NYC plume. WSOC mass was about 20% to 30% higherin the area of NYC outflow compared to the surroundingregions. However, substantially larger increases in WSOC(200 to 500%) relative to background were observed duringthe daytime downwind from NYC on other flights (Sullivanet al., 2006) compared to these nighttime data. Over thewide longitudinal range of this flight, the WSOC (and thuslikely OM) concentration was fairly uniform (standard devi-ation=0.8µgC m−3). Due to a decrease in sulfate concentra-tion as sampling moved eastward, the WSOC fraction of fineparticle mass increased from about 10% to∼30% (Fig. 9)(OM mass fraction increased from∼40% to∼80%). Over-all, the distinct longitudinal distribution of higher sulfate andPM1.0 volume (mass) to the west, in contrast to more uni-form WSOC and OM concentrations, clearly demonstratesthe dominating influence of large SO2 sources on air qualityover wide spatial regions (e.g. the western longitudes of thisflight). WSOC and OM, on the other hand, appears to havefewer well-defined point sources during this flight, suggest-ing a more regional background from distant sources.
5 Conclusions
Airborne measurements in July and August 2004 of fine par-ticle (PM1.0) bulk chemical composition were made fromthe surface to∼6 km altitude over northeastern United Statesand Canada, but with a focus on regions along the easternseaboard. This paper summarizes the overall particle chem-ical climatology. The online measurements included ionicspecies chloride, nitrate, sulfate, sodium, ammonium, potas-sium, calcium and magnesium, and the water-soluble organiccarbon (WSOC) fraction of the organic aerosol. In addition,measurements were made of particle volume and a suite oftrace gases.
The bulk aerosol chemistry data were combined with fineparticle volume data through a mass closure analysis to in-
fer particle density and the ratio of organic matter (OM) toWSOC. The measured PM1.0 particle volume concentrationsand inferred density were then used to estimate PM1.0 parti-cle mass concentrations. Although the particle density variedwith composition, the analysis predicted a fairly constant ra-tio of OM to WSOC of 3.1±1.6µgµgC−1.
In this study, sulfate aerosol was ubiquitous with highestmasses downwind of power generating regions (e.g., OhioRiver Valley). Sulfate was also frequently observed in urbanplumes. Sulfate concentrations were typically on the order of2 to 4µg m−3. Ammonium was often present and apparentlyassociated with sulfate, with an ammonium to sulfate molarratio near 2. However, in regions of high sulfate concentra-tion, the calculated molar ratio was significantly less than 2,typically near 1. Nitrate was rarely present above the limitof detection (0.04µg m−3), and was found to be mainly as-sociated with biomass burning plumes originating from theYukon/Alaska region of North America. Significant concen-trations of ammonium were also observed in these biomassburning plumes. All other measured aerosol ionic specieswere generally below detection limits (typically<0.2µg m−3
for cation species; 0.04µg m−3 for anion species). Sulfateand ammonium concentrations tended to be highest at loweraltitudes, while the vertical distribution of nitrate had no dis-cernable pattern.
WSOC, and hence inferred OM, was detected through-out the measurement domain, and was observed inhighest concentrations (WSOC>25µgC m−3, inferredOM>75µg m−3) within the Yukon/Alaskan biomassburning plumes. Apart from biomass burning plumes,WSOC was more spatially uniform than sulfate and highestconcentrations appeared to be mainly associated with urbanemissions and WSOC concentrations generally ranged inbetween 2 and 4µgC m−3. Although, like sulfate, WSOCconcentrations decreased rapidly with increasing altitude,the ratio of WSOC to sulfate increased sharply at about2.5 km altitude, in the region of transition from the bound-ary layer to the free troposphere. Overall, in this study,sulfate comprised roughly 35% of the PM1.0 mass and OMroughly 55%, however, the fractions varied depending onaltitude, and the proximity to various sources, such as powergenerating facilities and urban regions.
Edited by: J. G. Murphy
References
Andreae, M. O. and Crutzen, P. J.: Atmospheric aerosols: bio-geochemical sources and role in atmospheric chemistry, Science,276(5315), 1052–1058, 1997.
Bae, M. S., Schauer, J. J., and Turner, J. R.: Estimation of theMonthly Average Ratios of Organic Mass to Organic Carbon forFine Particulate Matter at an Urban Site, Aerosol Sci. Tech., 40,1123–1139, 2006.
Atmos. Chem. Phys., 7, 3231–3247, 2007 www.atmos-chem-phys.net/7/3231/2007/

R. E. Peltier et al.: Aerosol bulk composition in the Northeastern US – NEAQS 3245
Bates, T. S., Quinn, P. K., Coffman, D. J., Johnson, J. E., and Mid-dlebrook, A. M.: Dominance of organic aerosols in the marineboundary layer over the Gulf of Maine during NEAQS 2002 andtheir role in aerosol light scattering, J. Geophys. Res., 110(D18),1–14, doi:10.1029/2004JD004755, 2005.
Beattie, B. L. and Whelpdale, D. M.: Meteorological characteris-tics of large acidic deposition events at Kejimkujik, Nova Scotia,Water Air Soil Poll., 46(1–4), 45–59, 1989.
Brock, C. A., Hudson, P. K., Lovejoy, E. R., Sullivan, A., Nowak,J. B., Huey, L. G., Cooper, O. R., Cziczo, D. J., de Gouw, J.,Fehsenfeld, F. C., Holloway, J. S., Hubler, G., Lafleur, B. G.,Murphy, D. M., Neuman, J. A., Nicks, D. K., Orsini, D. A.,Parrish, D. D., Ryerson, T. B., Tanner, D. J., Warneke, C., We-ber, R. J., and Wilson, J. C.: Particle characteristics followingcloud-modified transport from Asia to North America, J. Geo-phys. Res., 109(D23), 1–18, doi:10.1029/2003JD004198, 2004.
Brock, C. A., Schroder, F., Karcher, B., Petzold, A., Busen, R.,and Fiebig, M.: Ultrafine particle size distributions measuredin aircraft exhaust plumes, J. Geophys. Res., 105(D21), 26 555–26 567, 2000.
Brock, C. A., Trainer, M., Ryerson, T. B., Neuman, J. A., Parrish,D. D., Holloway, J. S., Nicks, D. K., Jr., Frost, G. J., Hubler,G., Fehsenfeld, F. C., Wilson, J. C., Reeves, J. M., Lafleur, B.G., Hilbert, H., Atlas, E. L., Donnelly, S. G., Schauffler, S. M.,Stroud, V. R., and Wiedinmyer, C.: Particle growth in urban andindustrial plumes in Texas, J. Geophys. Res., 108(D3), 11–11,2003.
Brock, C. A., Washenfelder, R. A., Trainer, M., Ryerson, T. B.,Wilson, J. C., Reeves, J. M., Huey, L. G., Holloway, J. S., Parrish,D. D., Hubler, G., and Fehsenfeld, F. C.: Particle growth in theplumes of coal-fired power plants, J. Geophys. Res., 107(D12),9–1, 2002.
Brown, S. S., Ryerson, T. B., Wollny, A. G., Brock, C. A., Peltier,R., Sullivan, A. P., Weber, R. J., Dube, W. P., Trainer, M.,Meagher, J. F., Fehsenfeld, F. C., and Ravishankara, A. R.: Vari-ability in nocturnal nitrogen oxide processing and its role in re-gional air quality, Science, 311(5757), 67–70, 2006.
Chow, J. C., Watson, J. G., Fujita, E. M., Lu, Z., Lawson, D. R.,and Ashbaugh, L. L.: Temporal and spatial variations of PM2.5and PM10 aerosol in the Southern California Air Quality Study,Atmos. Environ.t, 28(12), 2061–2080, 1994.
de Gouw, J. A., Middlebrook, A. M., Warneke, C., Goldan, P.D., Kuster, W. C., Roberts, J. M., Fehsenfeld, F. C., Worsnop,D. R., Canagaratna, M. R., Pszenny, A. A. P., Keene, W. C.,Marchewka, M., Bertman, S. B., and Bates, T. S.: Budget oforganic carbon in a polluted atmosphere: Results from the NewEngland Air Quality Study in 2002, J. Geophys. Res., 110(D16),D16305, doi:10.1029/2004JD005623, 2005.
de Gouw, J. A., Trainer, M., Fehsenfeld, F. C., Warneke, C., Parrish,D. D., and Holloway, J. S.: Emission sources and ocean uptakeof acetonitrile (CH3CN) in the atmosphere, J. Geophys. Res.-Atmos., 108(11), ACH 2-1–ACH 2-8, 2003.
de Gouw, J. A., Warneke, C., Stohl, A., Wollny, A. G., Brock,C. A., Cooper, O. R., Holloway, J. S., Trainer, M., Fehsenfeld,F. C., Atlas, E. L., Donnelly, S. G., Stroud, V.. and Lueb, A.:Volatile organic compounds composition of merged and agedforest fire plumes from Alaska and western Canada, J. Geophys.Res., 111(D10), D10303, doi:10.1029/2005JD006175, 2006.
Dockery, D. W., Pope III, C. A., Xu, X., Spengler, J. D., Ware, J. H.,
Fay, M. E., Ferris Jr., B. G., and Fe, S.: An association betweenair pollution and mortality in six U.S. cities, The New EnglandJournal of Medicine, 329(24), 1753–1759, 1993.
Eatough, D. J., Wadsworth, A., Eatough, D. A., Crawford, J.W., Hansen, L. D., and Lewis, E. A.: Multiple-system, multi-channel diffusion denuder sampler for the determination of fine-particulate organic material in the atmosphere, Atmos. Environ.,Part A: General Topics, 27A(8), 1213–1219, 1993.
Fehsenfeld, F. C., Ancellet, G., Bates, T. S., Goldstein, A. H., Hard-esty, R. M., Honrath, R., Law, K. S., Lewis, A. C., Leaitch, R.,McKeen, S., Meagher, J., Parrish, D. D., Pszenny, A. P., Rus-sell, P. B., Schlager, H., Seinfeld, J., Talbot, R., and Zbinden, R.:International Consortium for Atmospheric Research on Trans-port and Transformation (ICARTT): North America to Europe–Overview of the 2004 summer field study, J. Geophys. Res.,111(D23), D23S01, doi:10.1029/2006JD007829, 2006.
Fehsenfeld, F. C., Trainer, M., Parrish, D. D., Volz-Thomas, A., andPenkett, S.: North Atlantic Regional Experiment 1993 summerintensive, J. Geophys. Res., 101(D22), 28 869–28 875, 1996.
Heald, C. L., Jacob, D. J., Park, R. J., Alexander, B., Fairlie, T.D., Yantosca, R. M., and Chu, D. A.: Transpacific transport ofAsian anthropogenic aerosols and its impact on surface air qual-ity in the United States, J. Geophys. Res., 111(D14), D14310,doi:10.1029/2005JD006847, 2006.
Heald, C. L., Jacob, D. J., Park, R. J., Russell, L. M., Hue-bert, B. J., Seinfeld, J. H., Liao, H., and Weber, R. J.: Alarge organic aerosol source in the free troposphere missingfrom current models, Geophys. Res. Lett., 32(18), L18809,doi:10.1029/2005GL023831, 2005.
Heintzenberg, J.: Fine particles in global troposphere. A review,Tellus, Ser. B, 41B(2), 149–160, 1989.
Holloway, J. S., Jakoubek, R. O., Parrish, D. D., Gerbig, C., Volz-Thomas, A., Schmitgen, S., Fried, A., Wert, B., Henry, B.,and Drummond, J. R.: Airborne intercomparison of vacuum ul-traviolet fluorescence and tunable diode laser absorption mea-surements of tropospheric carbon monoxide, Jo. Geophys. Res.,105(D19), 24 251–24 261, 2000.
IPCC: Climate change 2007: The Physical Science Basis, Summaryfor Policymakers, IPCC Secretariat, Geneva, Switzerland, 2007.
Jaffe, D., Tamura, S., and Harris, J.: Seasonal cycle and composi-tion of background fine particles along the west coast of the US,Atmos. Environ., 39(2), 297–306, 2005.
Jaffrezo, J. L., Aymoz, G., Delaval, C., and Cozic, J.: Seasonalvariations of the water soluble organic carbon mass fraction ofaerosol in two valleys of the French Alps, Atmos. Chem. Phys.,5, 2809–2821, 2005,http://www.atmos-chem-phys.net/5/2809/2005/.
Kelleher, T. J. and Feder, W. A.: Phytotoxic Concentrations OfOzone On Nantucket Island: Long Range Transport From TheMiddle Atlantic States Over The Open Ocean Confirmed ByBioassay With Ozone-Sensitive Tobacco Plants, Environ. Poll.,17(3), 187–194, 1978.
Lee, Y. N., Weber, R., Ma, Y., Orsini, D., Maxwell-Meier, K.,Blake, D., Meinardi, S., Sachse, G., Harward, C., Chen, T. Y.,Thornton, D., Tu, F. H., and Bandy, A.: Airborne measurementof inorganic ionic components of fine aerosol particles usingthe particle-into-liquid sampler coupled to ion chromatographytechnique during ACE-Asia and TRACE-P, J. Geophys. Res.,108(D23), 14–11, 2003.
www.atmos-chem-phys.net/7/3231/2007/ Atmos. Chem. Phys., 7, 3231–3247, 2007

3246 R. E. Peltier et al.: Aerosol bulk composition in the Northeastern US – NEAQS
Ma, Y., Weber, R. J., Lee, Y.-N., Orsini, D. A., Maxwell-Meier,K., Thornton, D. C., Bandy, A. R., Clarke, A. D., Blake, D.R., Sachse, G. W., Fuelberg, H. E., Kiley, C. M., Woo, J.-H.,Streets, D. G., and Carmichael, G. R.: Characteristics and in-fluence of biosmoke on the fine-particle ionic composition mea-sured in Asian outflow during the Transport and Chemical Evolu-tion Over the Pacific (TRACE-P) experiment, J. Geophys. Res.,108(D21), GTE 37-31–GTE 37-16, doi:10.1029/2002JD003128,2003.
Maria, S. F., Russell, L. M., Turpin, B. J., Porcja, R. J., Campos,T. L., Weber, R. J., and Huebert, B. J.: Source signatures of car-bon monoxide and organic functional groups in Asian Pacific Re-gional Aerosol Characterization Experiment (ACE-Asia) submi-cron aerosol types, J. Geophys. Res., 108(D23), ACE 5-1–ACE5-14, doi:10.1029/2003JD003703, 2003.
Marple, V. A., Rubow, K. I., and Behm, S. M.: Microorifice uni-form deposit impactor (MOUDI): description, calibration, anduse, Aerosol Sci. Technol., 14(4), 434–446, 1991.
Mayol-Bracero, O. L., Gabriel, R., Andreae, M. O., Kirchstetter,T. W., Novakov, T., Ogren, J., Sheridan, P., and Streets, D. G.:Carbonaceous aerosols over the Indian Ocean during the IndianOcean Experiment (INDOEX): chemical characterization, opti-cal properties, and probable sources, J. Geophys. Res., 107(D19),2–29, 2002.
Murphy, D. M., Thomson, D. S.. and Mahoney, M. J.: In situ mea-surements of organics, meteoritic material, mercury, and otherelements in aerosols at 5 to 19 kilometers. Science, 282(5394),1664–1669, 1998.
Nenes, A., Pandis, S. N., and Pilinis, C.: ISORROPIA: A new ther-modynamic equilibrium model for multiphase multicomponentinorganic aerosols, Aquatic Geochem., 4(1), 123–152, 1998.
Novakov, T., Hegg, D. A., and Hobbs, P. V.: Airborne measure-ments of carbonaceous aerosols on the East Coast of the UnitedStates, J. Geophys. Res., 102(D25), 30 023–30 030, 1997.
Orsini, D. A., Ma, Y., Sullivan, A., Sierau, B., Baumann, K., andWeber, R. J.: Refinements to the particle-into-liquid sampler(PILS) for ground and airborne measurements of water solu-ble aerosol composition, Atmos. Environ., 37(9–10), 1243–1259,2003.
Park, R. J., Jacob, D. J., Chin, M., and Martin, R. V.: Sources of car-bonaceous aerosols over the United States and implications fornatural visibility, J. Geophys. Res., 108(D12), AAC 5-1–AAC5-14, doi:10.1029/2002JD003190, 2003.
Peltier, R. E., Sullivan, A. P., Weber, R. J., Wollny, A. G., Holloway,J. S., Brock, C. A., de Gouw, J. A., and Atlas, E. L.: No Evi-dence for Acid-Catalyzed Secondary Organic Aerosol Formationin Power-Plant Plumes over Metropolitan Atlanta, Georgia, Geo-phys. Res. Lett., 34(6), L06801, doi:10.1029/2006GL028780,2007.
Pfister, G., Hess, P. G., Emmons, L. K., Lamarque, J. F., Wiedin-myer, C., Edwards, D. P., Petron, G., Gille, J. C., and Sachse, G.W.: Quantifying CO emissions from the 2004 Alaskan wildfiresusing MOPITT CO data, Geophys. Res. Lett., 32(11), L11809,doi:10.1029/2005GL022995, 2005.
Reiner, T., Sprung, D., Jost, C., Gabriel, R., Mayol-Bracero, L.O., Andreae, M. O., Campos, T. L., and Shetter, R. E.: Chem-ical characterization of pollution layers over the tropical IndianOcean: Signatures of emissions from biomass and fossil fuelburning, J. Geophys. Res., 106(D22), 28 497–28 510, 2001.
Rogge, W. F., Mazurek, M. A., Hildemann, L. M., Cass, G. R., andSimoneit, B. R. T.: Quantification of urban organic aerosols ata molecular level: Identification, abundance and seasonal vari-ation, Atmos. Environ., Part A: General Topics, 27A(8), 1309–1330, 1993.
Russell, P. B., Hobbs, P. V., and Stowe, L. L.: Aerosol propertiesand radiative effects in the United States east coast haze plume:an overview of the Tropospheric Aerosol Radiative Forcing Ob-servational Experiment (TARFOX), J. Geophys. Res., 104(D2),2213–2222, 1999.
Santarpia, J. L., Runjun, L., and Collins, D. R.: Direct measurementof the hydration state of ambient aerosol populations, J. Geophys.Res., 109(D18), 1–16, doi:10.1029/2004JD004653, 2004.
Stohl, A., Hittenberger, M., and Wotawa, G.: Validation of the La-grangian particle dispersion model FLEXPART against large-scale tracer experiment data, Atmos. Environ., 32(24), 4245–4264, 1998.
Sullivan, A. P., Peltier, R. E., Brock, C. A., de Gouw, J. A., Hol-loway, J. S., Warneke, C., Wollny, A. G., and Weber, R. J.: Air-borne measurements of carbonaceous aerosol soluble in waterover northeastern United States: Method development and aninvestigation into water-soluble organic carbon sources, J. Geo-phys. Res., 111(D23), 1–14, doi:10.1029/2005JD006485, 2006.
Sullivan, A. P., Weber, R. J., Clements, A. L., Turner, J. R., Bae,M. S., and Schauer, J. J.: A method for on-line measurement ofwater-soluble organic carbon in ambient aerosol particles: re-sults from an urban site, Geophys. Res. Lett., 31(13), 4 pp.,doi:10.1029/2004GL019681, 2004.
Tolocka, M. P., Solomon, P. A., Mitchell, W., Norris, G. A., Gem-mill, D. B., Wiener, R. W., Vanderpool, R. W., Homolya, J. B.,and Rice, J.: East versus West in the US: Chemical Characteris-tics of PM2.5 during the Winter of 1999, Aerosol Sci. Technol.,34(1), 88–96, 2001.
Turpin, B. J. and Lim, H. J.: Species contributions to PM2.5 massconcentrations: Revisiting common assumptions for estimatingorganic mass, Aerosol Sci. Technol., 35(1), 602–610, 2001.
Warneke, C., de Gouw, J. A., Stohl, A., Cooper, O. R., Goldan,P. D., Kuster, W. C., Holloway, J. S., Williams, E. J., Lerner,B. M., McKeen, S. A., Trainer, M., Fehsenfeld, F. C., Atlas,E. L., Donnelly, S. G., Stroud, V., Lueb, A., and Kato, S.:Biomass burning and anthropogenic sources of CO over NewEngland in the summer 2004, J. Geophys. Res., 111(D23), 13,doi:10.1029/2005JD006878, 2006.
Weber, R. J., Orsini, D., Daun, Y., Lee, Y. N., Klotz, P. J., andBrechtel, F.: A particle-into-liquid collector for rapid measure-ment of aerosol bulk chemical composition, Aerosol Sci. Tech-nol., 35(3), 718–727, 2001.
Weber, R. J., Sullivan, A. P., Peltier, R. E., Russell, A. G.,Yan, B., Chen, Y., Zheng, M., De Gouw, J. A., Warneke, C.,Brock, C. A., Holloway, J. S., Atlas, E. L., and Edgerton,E.: A Study of Secondary Organic Aerosol Formation in theAnthropogenic-Influenced Southeastern USA, J. Geophys. Res.,doi:10.1029/2007JD008408, in press, 2007.
Wilson, J. C., Lafleur, B. G., Hilbert, H., Seebaugh, W. R., Fox,J., Gesler, D. W., Brock, C. A., Huebert, B. J., and Mullen, J.:Function and performance of a low turbulence inlet for samplingsupermicron particles from aircraft platforms, Aerosol Sci. Tech-nol., 38(8), 790–802, 2004.
Zappoli, S., Andracchio, A., Fuzzi, S., Facchini, M. C., Gelencser,
Atmos. Chem. Phys., 7, 3231–3247, 2007 www.atmos-chem-phys.net/7/3231/2007/

R. E. Peltier et al.: Aerosol bulk composition in the Northeastern US – NEAQS 3247
A., Kiss, G., Krivacsy, Z., Molnar, A., Meszaros, E., Hansson, H.C., Rosman, K., and Zebuhr, Y.: Inorganic, organic and macro-molecular components of fine aerosol in different areas of Eu-rope in relation to their water solubility, Atmos. Environ., 33(17),2733–2743, 1999.
Zhang, Q., Stanier, C. O., Canagaratna, M. R., Jayne, J. T.,Worsnop, D. R., Pandis, S. N., and Jimenez, J. L.: Insightsinto the chemistry of new particle formation and growth eventsin Pittsburgh based on aerosol mass spectrometry, Environ. Sci.Technol., 38(18), 4797–4809, 2004.
www.atmos-chem-phys.net/7/3231/2007/ Atmos. Chem. Phys., 7, 3231–3247, 2007