Embed Size (px)
Citation preview

Fine Tuning Coriolis Flow Meter Calibrations Utilizing Piece-
Wise Linearization
Tonya Wyatt Global Chemical Industry Manager
Emerson Process Management – Micro Motion, Inc.
AGA Operations Conference and Biennial Exhibition 2015

New Developments to Improve Natural Gas Custody Transfer Applications with Coriolis Meters Including Application of Piecewise Linear Interpolation (PWL)
Marc Buttler
Midstream O&G Marketing Manager, Micro Motion Emerson
Ron Gibson
Senior Engineer, ONEOK, Inc.
Gary McCargar
Senior Engineer, ONEOK, Inc.
Karl Stappert
Americas Flow Solutions Advisor, Emerson Process Management
Tonya Wyatt
Process Gas and Chemical Marketing Manager, Micro Motion Emerson

Agenda Calibration Adjustment Methods for Gas Meters
Coriolis Meter Calibration Options
– Principle of Operation Review
– Calibration Fluid Flexibility
– Pressure Effect Compensation
– Multi-Point Piecewise Linear Interpolation (PWL)
Implementation of PWL
– PWL and Pressure Effect Compensation Together
– Results
In-situ Secondary Verification of Calibration
Impact of Zero
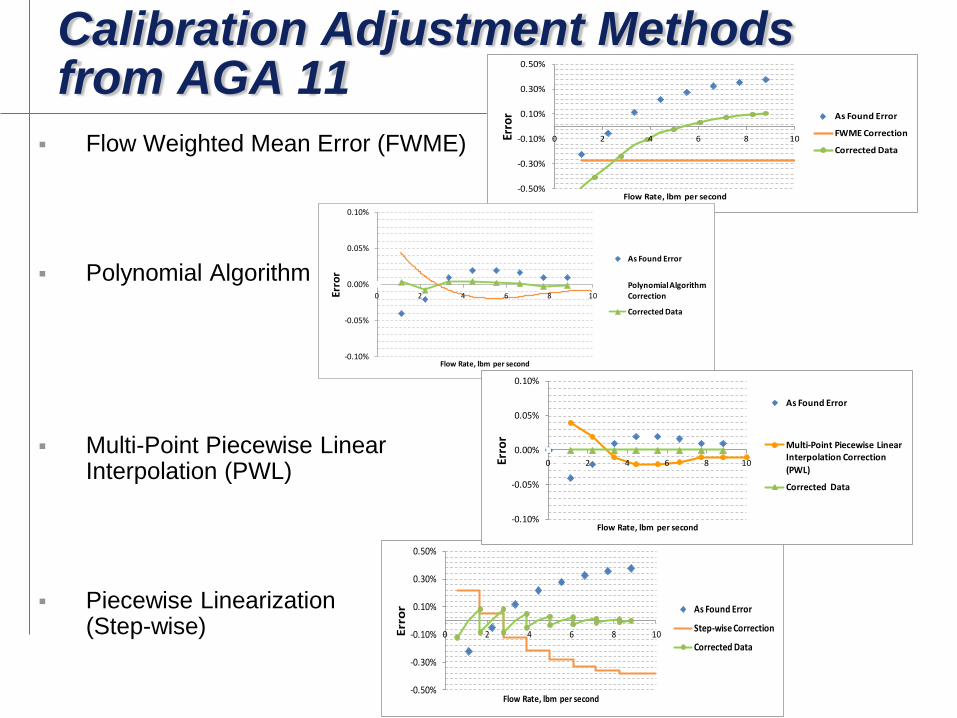
Calibration Adjustment Methods from AGA 11
Flow Weighted Mean Error (FWME)
Polynomial Algorithm
Multi-Point Piecewise Linear Interpolation (PWL)
Piecewise Linearization (Step-wise)
-0.50%
-0.30%
-0.10%
0.10%
0.30%
0.50%
0 2 4 6 8 10Err
or
Flow Rate, lbm per second
As Found Error
Step-wise Correction
Corrected Data
-0.50%
-0.30%
-0.10%
0.10%
0.30%
0.50%
0 2 4 6 8 10Erro
r
Flow Rate, lbm per second
As Found Error
FWME Correction
Corrected Data
-0.10%
-0.05%
0.00%
0.05%
0.10%
0 2 4 6 8 10Erro
r
Flow Rate, lbm per second
As Found Error
Polynomial Algorithm Correction
Corrected Data
-0.10%
-0.05%
0.00%
0.05%
0.10%
0 2 4 6 8 10Erro
r
Flow Rate, lbm per second
As Found Error
Multi-Point Piecewise Linear Interpolation Correction
(PWL)
Corrected Data

Coriolis Meter Principle of Operation
The principle of operation dictates a Coriolis meter’s performance characteristics
• Sensitive to bulk inertial forces of the fluid
• Insensitive to change in fluid properties and velocity profile
As a particle inside a rotating body moves toward or away
from the center of rotation, the particle generates inertial
forces that act on the body.

Theory of Operation
Process fluid enters the sensor and flow is split with half the flow through each tube
Drive coil vibrates tubes at natural frequency
Pick-off coils on inlet and outlet sides generate raw measurement signals

Isometric View
At No Flow
No Flow
Flow
Causes
Twist
Direct Mass Flow Measurement

Coriolis Meter Raw Sensitivity Varies with Design
Raw Sensitivity Depends on Design of Tube Geometry
Signal to Noise Ratio Depends on Raw Sensitivity and Stability
Calibration Flexibility, Immunity to Secondary Effects, and Diagnostic Capabilities Depend on Signal to Noise Ratio
0
1
2
3
4
5
6
Flow Sensitivity
Examples
Large TubeGeometry
Medium TubeGeometry
Short TubeGeometry
nse
c of
signal
per
g/s
ec o
f fl
ow
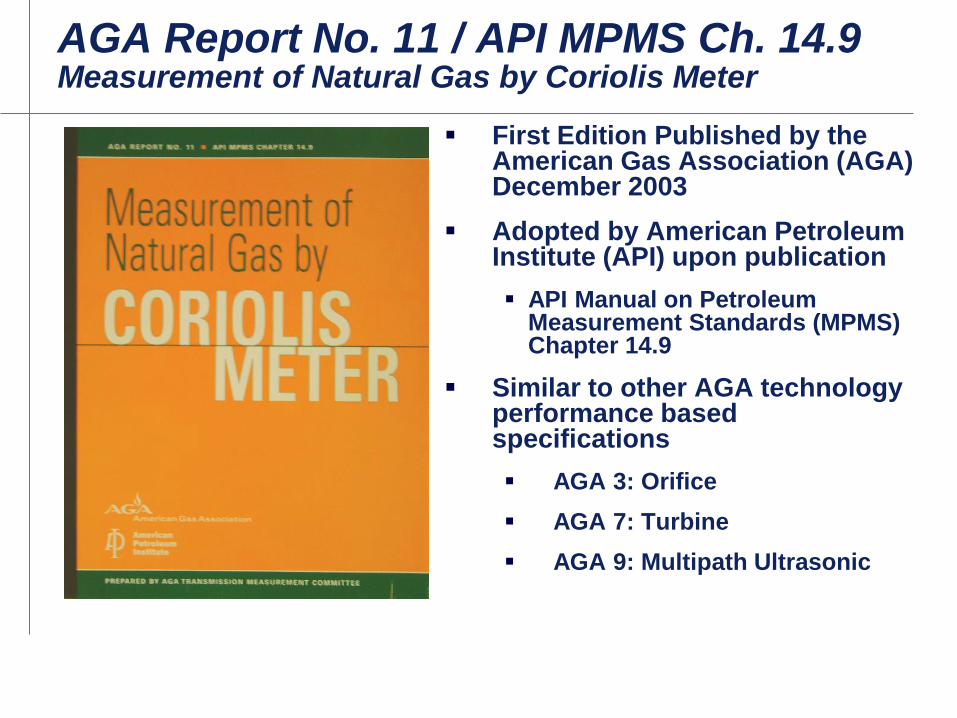
AGA Report No. 11 / API MPMS Ch. 14.9 Measurement of Natural Gas by Coriolis Meter
First Edition Published by the American Gas Association (AGA) December 2003
Adopted by American Petroleum Institute (API) upon publication
API Manual on Petroleum Measurement Standards (MPMS) Chapter 14.9
Similar to other AGA technology performance based specifications
AGA 3: Orifice
AGA 7: Turbine
AGA 9: Multipath Ultrasonic

AGA Report No. 11 / API MPMS Ch. 14.9 Measurement of Natural Gas by Coriolis Meter
2nd Edition Published February 2013
Covers all single phase natural gases as pure or a mixture of hydrocarbons and diluents
API Standard API MPMS Chapter 14.9
Recommended Practice Specification, calibration,
installation, operation, maintenance, and verification

(Air)(Gas) x Gr
x x
(Gas) x
MassSCF
TbRZb
MrPb
MassSCF
b
MassSCF
Conversion of Mass to Volume at Standard Conditions
AGA8 Detail
AGA8 Gross 1 or 2
Non-ideal gas law:
Pb, Tb, R are constants
lbs/day ÷ lbs/ft3 = ft3/day
Molar weight, Base Compressibility, and Specific Gravity
Are All Determined by Gas Composition
Note: Zb does not vary more
than 0.02% at base conditions.
AGA11 Eqn. D.2
No pressure or Temperature Measurement Required
to Convert from Mass to Standard Volume

Calibration Fluid Flexibility Purpose and Benefits
“Calibration fluid flexibility” is a capability that allows a traceable liquid calibration to be used for traceable gas
measurements
Liquid medium meter calibration system benefits
– Easier to control liquid (e.g., water) system uncertainties
– Lower cost
– Greater safety
Recognized in AGA Report No. 11 / API MPMS Ch. 14.9
– Must demonstrate acceptable provenance for each Coriolis meter design

NMi Declaration of Water-to-Gas Calibration Transferability for Micro Motion Coriolis Meters
Testing
Included ½ to 12 inch Coriolis meters
Conducted on following mediums
Natural gas
Nitrogen
Ethylene
Results
CMF Model Coriolis meters calibrated on water at manufacturer may be applied to the following applications without requiring a field calibration or gas calibration
Every gaseous medium with density greater than 4 kg/m3
Super-critical ethylene with density up to 450 kg/m3
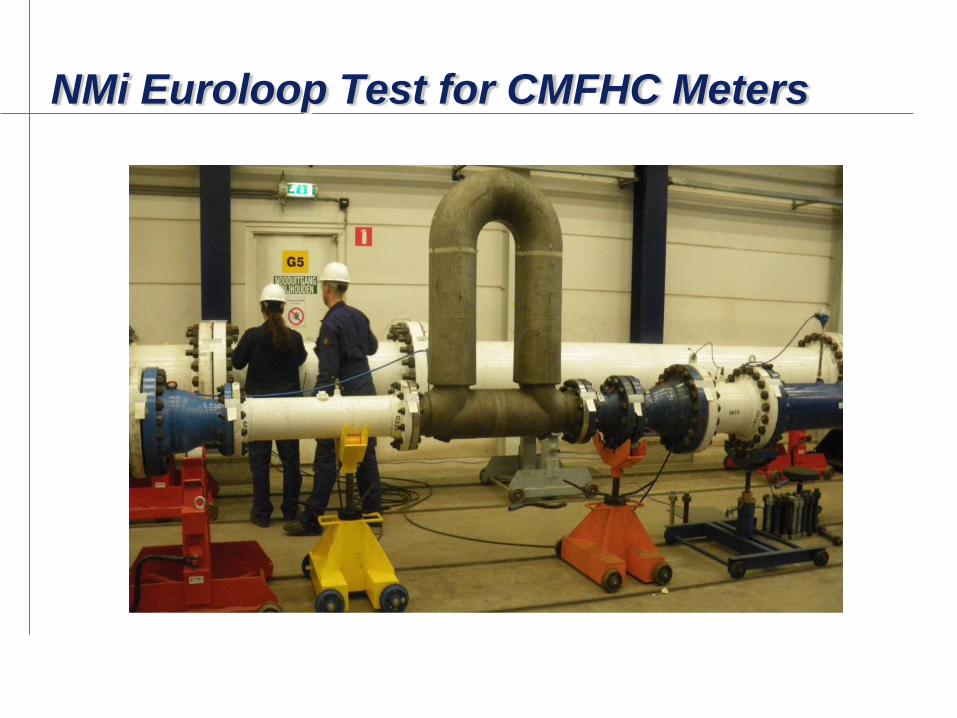
NMi Euroloop Test for CMFHC Meters

Effect of Pressure on Coriolis Meters
• Internal pressure changes the shape of the flow tube • Tube ovality becomes round • Tube bends straighten
• Changes in flow tube shape increases stiffness of flow tube • Changes in tube stiffness directly affects sensor calibration • Magnitude of effect varies by meter size and design
stiffness tube
delay time*
FCF
FCFm

P
P
P
FMass
SCF
F
TbRZb
MrPb
MassSCF
F
b
MassSCF
(Air)(Gas) x Gr
x x
(Gas) x
Application of Compensation for the Effect of Pressure on the Meter
FP compensation is
only required for
some of the larger
meter sizes
•FP factor can be employed to compensate for the
effect of pressure on the meter.
• FP factor is not a correction for behavior
of the gas.

Flow Pressure Effect Correction and Potential Error
Potential Error w/o Pressure Correction (Natural Gas)

Example Application of Pressure Effect Compensation - CMFHC2 Gas Test Results
• All data collected on natural gas using meter factory calibration on water
• Data shown with and without standard FP pressure compensation
• Max deviation of all compensated data < 0.25%

-0.10%
-0.05%
0.00%
0.05%
0.10%
0 2 4 6 8 10Err
or
Flow Rate, lbm per second
As Found Error
Multi-Point Piecewise Linear Interpolation Correction
(PWL)
Corrected Data
Multi-Point Piecewise Linear Interpolation (PWL)
Correction applied at selected linearization points is equal and opposite to the average of the as-found values at the same flow rate
Correction values applied between neighboring points are determined by linear interpolation between the two points
Correction above the highest flow rate point are held constant
Correction below the lowest point is based on linear interpolation to zero error at zero flow to allow meter zero adjustment to control accuracy below Qt
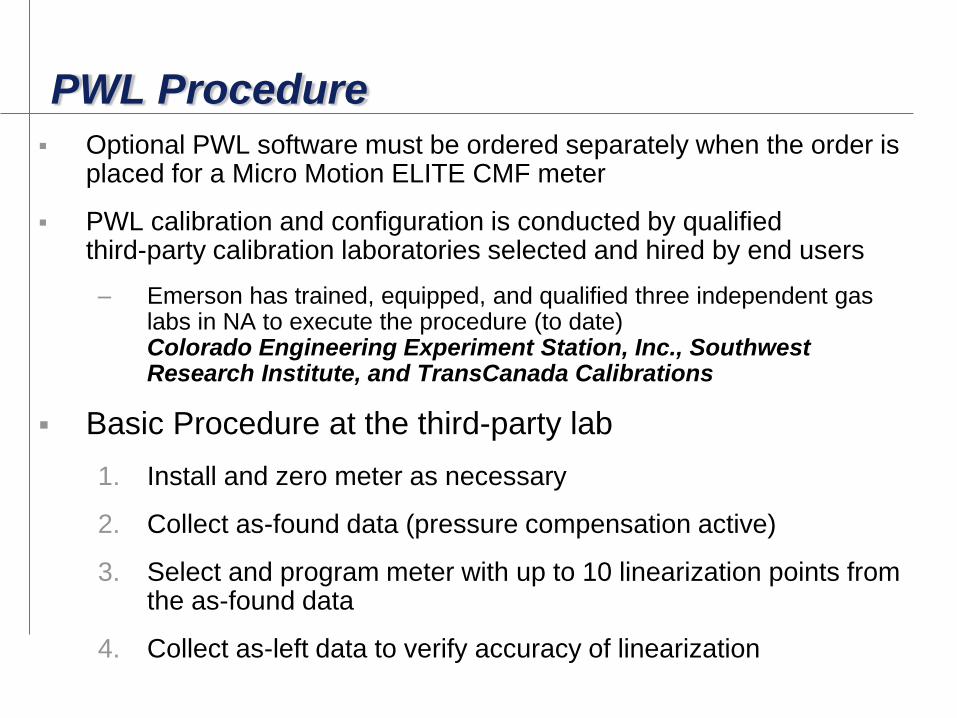
PWL Procedure
Optional PWL software must be ordered separately when the order is placed for a Micro Motion ELITE CMF meter
PWL calibration and configuration is conducted by qualified third-party calibration laboratories selected and hired by end users
– Emerson has trained, equipped, and qualified three independent gas labs in NA to execute the procedure (to date) Colorado Engineering Experiment Station, Inc., Southwest Research Institute, and TransCanada Calibrations
Basic Procedure at the third-party lab
1. Install and zero meter as necessary
2. Collect as-found data (pressure compensation active)
3. Select and program meter with up to 10 linearization points from the as-found data
4. Collect as-left data to verify accuracy of linearization

PWL and Pressure Comp. Together PWL As-Found Data Collected with Pressure Compensation Active
– PCal remains the original factory water calibration pressure
– This method keeps pressure compensation and linearization independent from each other
Alternative Method: PWL As-Found Data Collected with Pressure Compensation Inactive
– PCal becomes the gas lab As-Found pressure for future pressure compensation
– This method resets the pressure compensation baseline pressure to the gas test pressure
-0.60%
-0.40%
-0.20%
0.00%
0.20%
0.40%
0.60%
0 2 4 6 8 10Erro
r
Flow Rate, lbm per second
As Found Error(PRESS. COMP ENABLED)
Multi-Point Piecewise Linear Interpolation Correction
(PWL)
Corrected Data
-0.60%
-0.40%
-0.20%
0.00%
0.20%
0.40%
0.60%
0 2 4 6 8 10Erro
r
Flow Rate, lbm per second
As Found Error(NO PRESS. COMP -
CMFHC2 at 230 psig)
Multi-Point Piecewise Linear Interpolation Correction
(PWL)
Corrected Data

Results with PWL – 1-inch Meter CMF100
-0.5
-0.4
-0.3
-0.2
-0.1
0
0.1
0.2
0.3
0.4
0.5
0 0.5 1 1.5 2 2.5 3 3.5 4 4.5 5% E
rror
lbm per second
As Found Data
Verification Data
Observations
Test turndown ≈ 58 : 1
All verification averages better than ± 0.08%
Verification averages above 0.13 lbm/sec better than ± 0.027%
All verification data better than ± 0.11%
-0.5
-0.4
-0.3
-0.2
-0.1
0
0.1
0.2
0.3
0.4
0.5
0 0.5 1 1.5 2 2.5 3 3.5 4 4.5 5% E
rro
r
lbm per second
As Found Averages by Flow Rate
Verification Averages by Flow Rate
Averages at Each Flow Rate
All Data

-0.5
-0.4
-0.3
-0.2
-0.1
0.0
0.1
0.2
0.3
0.4
0.5
0 2 4 6 8 10 12% E
rror
lbm per second
As Found Data
Verification Data
Results with PWL – 2-inch Meter CMF200
Observations
Test turndown ≈ 45 : 1
All verification averages better than ± 0.09%
All verification data better than ± 0.29%
Averages at Each Flow Rate
All Data -0.5
-0.4
-0.3
-0.2
-0.1
0.0
0.1
0.2
0.3
0.4
0.5
0 2 4 6 8 10 12% E
rro
r
lbm per second
As Found Averages by Flow Rate
Verification Averages by Flow Rate

-0.5
-0.4
-0.3
-0.2
-0.1
0.0
0.1
0.2
0.3
0.4
0.5
0 5 10 15 20 25% E
rro
r
lbm per second
As Found Averages by Flow Rate
Verification Averages by Flow Rate
Results with PWL – 3-inch Meter CMF300
Observations
Test turndown ≈ 10 : 1
All verification averages better than ±0.08%
All verification data better than ± 0.22%
Averages at Each Flow Rate
All Data
-0.5
-0.4
-0.3
-0.2
-0.1
0.0
0.1
0.2
0.3
0.4
0.5
0 5 10 15 20 25% E
rror
lbm per second
As Found Data
Verification Data

Secondary Verification Purpose and Benefits
“Secondary Verification” is a capability that allows a measuring device to use an alternative method to confirm
flow measurement accuracy without the need for a calibration to a traceable flow reference standard
Reduce lost and unaccounted for (LAUF) product and reconciliations with the capability to perform more frequent checking without adding cost
Work practices may use statistical data and secondary verification results to extend primary calibration intervals
Recognized in AGA Report No. 11 / API MPMS Ch. 14.9
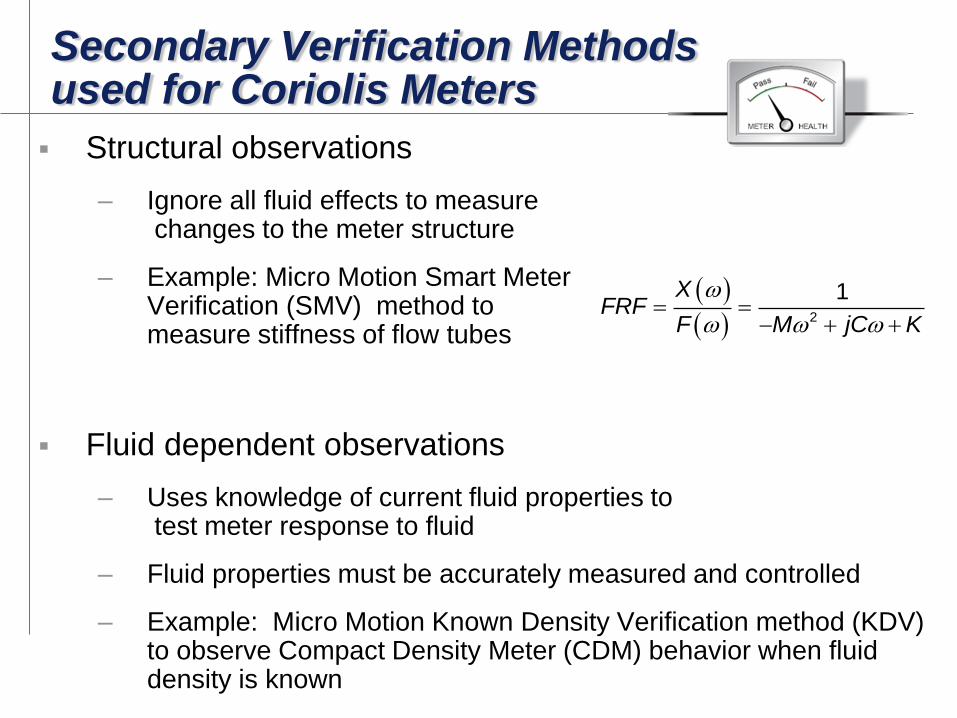
Secondary Verification Methods used for Coriolis Meters
Structural observations
– Ignore all fluid effects to measure changes to the meter structure
– Example: Micro Motion Smart Meter Verification (SMV) method to measure stiffness of flow tubes
Fluid dependent observations
– Uses knowledge of current fluid properties to test meter response to fluid
– Fluid properties must be accurately measured and controlled
– Example: Micro Motion Known Density Verification method (KDV) to observe Compact Density Meter (CDM) behavior when fluid density is known
2
1XFRF
F M jC K

Coriolis Meters are like Simple Springs – Stiffness Influences Measurement
Density proportional to
• Tube Stiffness
• Tube Mass
• Fluid Mass
Mass Flow proportional to • Tube Stiffness
• Mass Inertial Forces
Spring Natural Frequency proportional to
• Spring Stiffness
• Spring Mass
• Weight

Using Resonant Modal Analysis to determine Coriolis Flow Tube Stiffness
• Quick, reliable indication of complete sensor health – from tube structure to electronics
• Proactive maintenance to eliminate calibrations and improve process uptime
Easily verify meter performance - in line and on demand
Test tones
Response
Okay
Not Okay

Span vs. Zero
bmxy
Meter
Zero
FCF

Zeroing Best Practices
Most applications – Use factory zero
Insure no flow condition
Insure meter is full
Insure process conditions are stable
Example: Micro Motion Zero Verification monitors 8 parameters to check stability of process and check current zero value

Conclusions
Some Coriolis meters have demonstrated the capability to be calibrated on liquid in order to measure gas
Some Coriolis meters can be adjusted with PWL in gas calibration labs to improve gas flow measurement
PWL must be implemented together correctly with pressure compensation
Secondary verification methods exist to confirm Coriolis meter accuracy after primary flow calibrations including span and zero