Embed Size (px)
Citation preview

Finite Element Analysis on Reinforced Concrete Beams Subject to Impact
by
Ng Seh Hui
14850
Dissertation submitted in partial fulfilment of
the requirements for the
Bachelor of Engineering (Hons)
(Civil)
JANUARY 2015
Universiti Teknologi PETRONAS
Bandar Seri Iskandar
32610 Tronoh
Perak Darul Ridzuan

i
CERTIFICATION OF APPROVAL
Finite Element Analysis on Reinforced Concrete Beams Subject to Impact
by
Ng Seh Hui
14850
A project dissertation submitted to the
Civil Engineering Programme
Universiti Teknologi PETRONAS
in partial fulfilment of the requirement for the
BACHELOR OF ENGINEERING (Hons)
(CIVIL)
Approved by,
_____________________
(Dr. Teo Wee)
UNIVERSITI TEKNOLOGI PETRONAS
TRONOH, PERAK
January 2015

ii
CERTIFICATION OF ORIGINALITY
This is to certify that I am responsible for the work submitted in this project, that the
original work is my own except as specified in the references and acknowledgements,
and that the original work contained herein have not been undertaken or done by
unspecified sources or persons.
_______________________
(NG SEH HUI)
iii
ABSTRACT
The study of reinforced concrete beams under impact load has been conducted by
many researchers previously with different methods. It is important to understand the
behaviour of reinforced concrete beams during impact so that it can be used as a
reference in designing the structures. Failure under this accidental load can be
catastrophic if structures are under-designed due to lack of knowledge in the response
of reinforced concrete under impact load. Finite element analysis is the common
method used in solving explicit dynamic problems. LS-DYNA is utilised to conduct
the numerical simulation using finite element analysis. This research aims to determine
the failure mode of reinforced concrete beams as well as their responses after impact.
Generally, two beams are being studied by varying the transverse reinforcement ratio.
It was found that reinforced concrete beams subject to impact tend to fail in shear
rather than flexure. The beam with stirrups is stiffer and becomes more ductile,
exhibiting a more elastic behaviour and resists the shear force through larger
displacement of beam. Dynamic increase factors are introduced to the material model
as high strain rate causes strength enhancement in the concrete and steel reinforcement.
High impact force from the impactor causes residual displacements of the beams and
residual strains in the reinforcement because the materials have exceeded the yield
point and enters plastic region where some elements have permanently deformed.

iv
ACKNOWLEDGEMENT
Every project big or small is successful largely due to the effort of a number of
wonderful people who have always given their valuable advice or lent a helping hand.
I sincerely appreciate the inspiration, support and guidance of all those people who
have been instrumental in making this project a success.
I take this opportunity to express my deep appreciation and great regards to my
supervisor, Dr. Teo Wee for his exemplary guidance, monitoring and constant
encouragement throughout this project. The blessing, help and guidance given by him
time to time shall carry me a long way in the journey of life on which I am about to
undertake.
I also take this opportunity to express a deep sense of gratitude to my co-supervisors,
Kilian and Atik for their cordial supports, valuable information and guidance, which
helped me in completing this task through various stages. I am grateful for their
cooperation during the final year studies in completing this project.
Furthermore, I would like to thank the Civil Engineering Department as well as the
University for providing an opportunity for the final year students to gain experience
and knowledge from doing research. Apart from that, I appreciate that the university
provides the facilities and equipment needed for the project.
Lastly, I thank my family members and friends for their constant encouragement
without which this assignment would not be possible.

v
TABLE OF CONTENTS
CERTIFICATION OF APPROVAL ........................................................................ i
CERTIFICATION OF ORIGINALITY .................................................................. ii
ABSTRACT ............................................................................................................... iii
ACKNOWLEDGEMENT ........................................................................................ iv
TABLE OF CONTENTS ........................................................................................... v
LIST OF FIGURES ................................................................................................. vii
LIST OF TABLES ................................................................................................... vii
CHAPTER 1: INTRODUCTION ............................................................................. 1
1. BACKGROUND .............................................................................................. 1
2. PROBLEM STATEMENT ............................................................................... 2
3. OBJECTIVES ................................................................................................... 3
4. SCOPE OF STUDY .......................................................................................... 3
CHAPTER 2: LITERATURE REVIEW ................................................................. 4
1. LS-DYNA AND LS-PREPOST SOFTWARE ................................................. 4
2. BEAM MODELLING ...................................................................................... 5
3. CONCRETE MATERIAL MODEL ................................................................. 6
4. ENERGY AND IMPACT FORCE MEASURES ............................................ 9
5. SHEAR FORCE DEMAND AND CAPACITY OF BEAM .......................... 12
6. CRITICAL REVIEW OF LITERATURE ...................................................... 14
CHAPTER 3: METHODOLOGY .......................................................................... 15
1. VALIDATION OF RESULTS ....................................................................... 15
2. REVIEW OF EXPERIMENTAL TEST ......................................................... 16
3. MODELLING PROCEDURES ...................................................................... 17
4. PROJECT ACTIVITIES AND KEY MILESTONE ...................................... 22
5. PROJECT TIMELINE .................................................................................... 25

vi
CHAPTER 4: RESULTS AND DISCUSSIONS ................................................... 27
CHAPTER 5: CONCLUSION AND RECOMMENDATION ............................ 41
REFERENCES ......................................................................................................... 43
APPENDICES .......................................................................................................... 46
APPENDIX 1: DYNAMIC INCREASE FACTOR FOR CONCRETE ................... 46

vii
LIST OF FIGURES
FIGURE 2.1 Finite Element Model of RC Deep Beam .......................................... 5
FIGURE 2.2 Lateral Deflection Histories at Central Mid-Height on Back Face. ... 7
FIGURE 2.3 Evolution of Various Energy Quantities .......................................... 10
FIGURE 2.4 Time Histories of Impact Forces ...................................................... 11
FIGURE 2.5 a) Force-Time Curve. b) Force-Displacement Curve. ...................... 12
FIGURE 2.6 Ratio of Maximum Dynamic to Static Reaction Force. ................... 13
FIGURE 3.1 Specimen Dimension ........................................................................ 16
FIGURE 3.2 Cross-sectional of the Test Setup. .................................................... 17
FIGURE 3.3 Beam Cross-section. ......................................................................... 18
FIGURE 3.4 Beam SS0a-1 (top). Beam SS1a-1 (middle). FE Model (bottom) .... 18
FIGURE 3.5 Mesh Size of Beam Cross-Section. .................................................. 19
FIGURE 4.1 Stress Distribution of Concrete Beam. ............................................. 27
FIGURE 4.2 Plastic Strain of Concrete. ................................................................ 29
FIGURE 4.3 Energies Plot for SS0a-1 Beam. ....................................................... 30
FIGURE 4.4 Energies Plot for SS1a-1 Beam. ....................................................... 31
FIGURE 4.5 Displacement-Time Graph for SS0a-1 Beam. .................................. 33
FIGURE 4.6 Displacement-Time Graph for SS1a-1 Beam. .................................. 34
FIGURE 4.7 Rebar Strain-Time Graph for SS0a-1 Beam. .................................... 36
FIGURE 4.8 Rebar Strain-Time Graph for SS1a-1 Beam. .................................... 37
FIGURE 4.9 Stirrup Strain-Time Graph for SS1a-1 Beam. .................................. 39
FIGURE A.1 Enhancement Curve for Concrete – SS0a-1. .................................... 47
FIGURE A.2 Enhancement Curve for Concrete – SS1a-1. .................................... 49
LIST OF TABLES
TABLE 3.1 Set of Consistent Units Used in LS-DYNA Model. ......................... 20
TABLE 3.2 Properties of Concrete. ..................................................................... 20
TABLE 3.3 Properties of Reinforcement. ............................................................ 20
TABLE A.1 Enhancement Factors for SS0a-1 Beam. .......................................... 46
TABLE A.2 Enhancement Factors for SS1a-1 Beam. .......................................... 48

1
CHAPTER 1
INTRODUCTION
Reinforced concrete is the most common construction material used in the industry
due to its properties, availability of material as well as its functional cost. It can be
easily cast into different structural elements such as beams and columns to provide
stability to a structure. In normal case, the structural elements are designed in such a
way that the structure remains rigid under normal working condition. In other words,
only dead load and live load are considered in the design. However, there is still a
possibility that accident will happen which may cause the structural elements to fail.
For example, bridge piers in the middle of highway and columns in car parks are
vulnerable to impact loads from vehicles. The consequences can be catastrophic if the
columns fail. To prevent severe consequences to happen, accidental loads are taken
into consideration in the design of the structure. Prior to that, the behaviour of concrete
subjected to impact load need to be understood. In fact, impact load is different from
the usual dead and live actions as it involves dynamic which the results vary over time
after impact.
1. BACKGROUND
The effects of dynamic loadings such as earthquake and impact load on reinforced
concrete have become a discussion topic for many researchers throughout these years.
Several researches include experiments and numerical simulations have been
conducted to determine the reinforced concrete behaviour on dynamic loadings. For
example, the effects of blast loadings on reinforced concrete column is assessed to
determine the possibility of progressive collapse (Wu, Li, & Tsai, 2011). In addition,
Saatci and Vecchio (2009b) evaluate the behaviour of reinforced concrete structure
under impact loads using nonlinear finite element modelling. Nevertheless, only
impact loading on reinforced concrete beam will be discussed in this paper.
Examples of impact loadings are such as vehicle collision on column, weight drop on
slab or beam and transverse impact on wall. Previous researches have shown the
significance of the research. For illustration, accidents of vehicles collide with bridge

2
pier have occurred in the past which involved casualties as well as destruction of the
impacted bridge. In fact, these accidental collisions have happened in other countries
but there are not much similar cases in Malaysia. On May 23, 2003, an overpass
collapsed followed by an impact of a semitrailer at the median support of a bridge
crossing I-80 near Big Springs, Neb. The traffic on the Memorial Day was seriously
affected and a person was killed in that accident ("Nebraska Overpass Will Be Rebuilt
With Fewer Piers," 2003). Also, Dallas-News (2002) reported another news of a
collapse bridge due to impact from a trailer on September 9, 2002.
In short, the two accidents illustrated before give some background of the study and
researches that have been conducted previously to assess the dynamic responses of
reinforced concrete. The behaviour of reinforced concrete under impact loading need
to be understood so that it can be used as a reference to the design of any structures
where dynamic loadings are the governing factor.
2. PROBLEM STATEMENT
The effects of impact loadings on reinforced concrete beam are closely related to the
properties of materials, namely the strength of concrete and steel reinforcement. Based
on previous researches, it was found that reinforced concrete beams failed in flexure
under static load and by shear when subjected to dynamic loading (Miyamoto, King,
& Bulson, 1994). According to Adhikary, Li, and Fujikake (2013), the information on
the dynamic shear strength of reinforced concrete beam is limited. There is a need to
investigate the effects of longitudinal and transverse reinforcement ratio on concrete
behaviour.
Besides that, strain rate effect under impact condition may also affect the behaviour of
concrete. Under blast effects, the response of concrete is different from a static loading
condition. Hence, it can be noticed that dynamic loading can give high implication to
the concrete structure. In summary, lack of understanding on the dynamic responses
of reinforced concrete beam due to impact loadings can pose a major problem to the
design of a structure. Next, the failure mode of the beam is not fully understood and
finally the design of the structural members such as beams and columns.

3
3. OBJECTIVES
This research is initiated to assess the dynamic response of reinforced concrete beams
under impact loadings. It is vital to understand the concept and can be used as a
reference in the design of reinforced concrete beam subjected to impact loadings.in the
future. Thus, the objectives of this research are:
To simulate the impact on reinforced concrete beams using LS-DYNA and
determine the failure mode of the beams.
To evaluate the impact behaviour of reinforced concrete beams from beam
displacement and reinforcement strain.
4. SCOPE OF STUDY
The research aims to evaluate the behaviour of reinforced concrete beam subjected to
impact loadings. Although beam is used in the study, the same concept can be applied
to other types of structural members such as column. Besides that, a nonlinear finite
element (FE) program called LS-DYNA is used in this study to simulate the impact of
a rigid body on the concrete beam. Experiment is not conducted for the study because
concrete samples preparation requires more time. Casting of reinforced concrete
requires few days for the beam to achieve its strength. However, the results from the
software simulation are validated with a set of experimental data obtained from
previous research. This is to ensure the reliability of the results. The validation
procedures are described in the methodology section. In addition, computer simulation
will be adequate to illustrate the real condition of reinforced concrete beam subjected
to impact which will be explained in detail in the literature review.
The material properties of concrete are analysed as well as its interaction with the steel
reinforcement. Same grade of concrete beams are adopted for easier comparison and
analysis. Also, the beams are of the same sizes and uniform size of steel reinforcement
and strength are defined in the model. Furthermore, the effects of shear reinforcement
in the beam are also studied. The whole system is visualized as a single degree of
freedom for simplicity.

4
CHAPTER 2
LITERATURE REVIEW
1. LS-DYNA AND LS-PREPOST SOFTWARE
LS-DYNA is a common program used to analyse the large deformation static and
dynamic response of structures using finite element (FE) analysis (Hallquist, 2006).
Basically, the program solves a problem based on explicit time integration. However,
the solver has limited capabilities including structural analysis and heat transfer. Thus,
a contact-impact algorithm is introduced that allows difficult contact problems to be
easily treated with heat transfer included across the contact interfaces. With the help
of this algorithm, such interfaces can be connected firmly without the need of mesh
transition regions. Each element type has many element formulations. In fact, LS-
DYNA currently has about one hundred models and ten equations-of-state to illustrate
different material behaviour.
LS-DYNA software was started with another name called DYNA3D in the mid-
seventies. Lawrence Livermore National Laboratory has released the first version of
DYNA3D in 1976. This early applications were introduced mainly for the stress
analysis of structures subjected to a variety of impact loading (Hallquist, 2007). These
applications require a lot of computer resources to run the analysis. In addition, the
basic sliding interface treatment could only treat logically regular interfaces that are
unusual in most finite element discretization of complex three-dimensional geometries.
As a result, manual definition of mesh to contact elements was very difficult. In 1979,
a new version of DYNA3D that was created to offer optimal speed on the CRAY-1
supercomputers was released. It has an improved sliding interface treatment that
allowed triangular segments and the speed was much higher than the previous contact
treatment. By the end of 1988, Livermore Software Technology Corporation was
founded to introduce a commercial version called LS-DYNA3D which was later called
LS-DYNA. Throughout these years, the capabilities of the software have been
improved. For example, it included hourglass energy calculations for solid and shell
elements, keyword input, improved interactive graphics and others.

5
Apart from that, LS-PrePost is a free software that comes with LS-DYNA. As its name
suggests, it is a software used for pre and post-processing after a problem is solved by
the LS-DYNA solver. To be specific, the pre-processing function of the program
allows users to create a three-dimensional model in the form of finite elements. In the
program, users are required to assign parameters such as material properties, load data,
outputs definitions and others using keywords function. Furthermore, it also includes
the ability to import a model from other software such as AutoCAD. After the model
has been solved by LS-DYNA solver, the outputs can be viewed using LS-PrePost
post-processing function. Its main post-processing capabilities include states result
animation, fringe component plotting and time-history plotting.
2. BEAM MODELLING
A nonlinear finite element analysis can be performed by using LS-DYNA software
(Adhikary et al., 2013). It has been used by many researchers to study the impact
behaviour of reinforced concrete structures. The software is capable of determine the
dynamic shear resistance and its failure mechanism. Adhikary et al. evaluated the shear
behaviour of reinforced concrete deep beams under dynamic loading condition. In
terms of the structural model, the concrete beam is modelled using eight node solid
hexahedron elements with single integration point. In addition, steel reinforcements
are represented by two-node Hughes-Liu beam element formulation with 2x2 Gauss
quadrature integration. The author suggested that the mesh size should be in the ratio
smaller than 1.5.
FIGURE 2.1 Finite Element Model of RC Deep Beam
(Adapted from Adhikary et al., 2013)
6
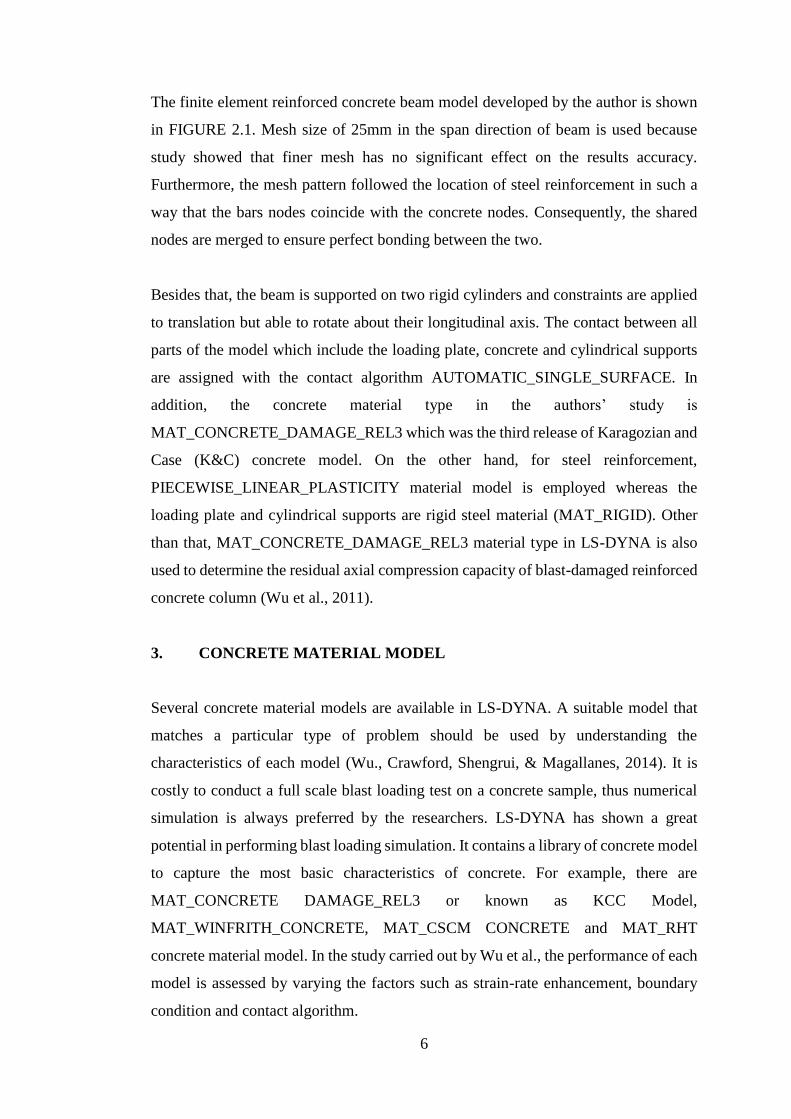
The finite element reinforced concrete beam model developed by the author is shown
in FIGURE 2.1. Mesh size of 25mm in the span direction of beam is used because
study showed that finer mesh has no significant effect on the results accuracy.
Furthermore, the mesh pattern followed the location of steel reinforcement in such a
way that the bars nodes coincide with the concrete nodes. Consequently, the shared
nodes are merged to ensure perfect bonding between the two.
Besides that, the beam is supported on two rigid cylinders and constraints are applied
to translation but able to rotate about their longitudinal axis. The contact between all
parts of the model which include the loading plate, concrete and cylindrical supports
are assigned with the contact algorithm AUTOMATIC_SINGLE_SURFACE. In
addition, the concrete material type in the authors’ study is
MAT_CONCRETE_DAMAGE_REL3 which was the third release of Karagozian and
Case (K&C) concrete model. On the other hand, for steel reinforcement,
PIECEWISE_LINEAR_PLASTICITY material model is employed whereas the
loading plate and cylindrical supports are rigid steel material (MAT_RIGID). Other
than that, MAT_CONCRETE_DAMAGE_REL3 material type in LS-DYNA is also
used to determine the residual axial compression capacity of blast-damaged reinforced
concrete column (Wu et al., 2011).
3. CONCRETE MATERIAL MODEL
Several concrete material models are available in LS-DYNA. A suitable model that
matches a particular type of problem should be used by understanding the
characteristics of each model (Wu., Crawford, Shengrui, & Magallanes, 2014). It is
costly to conduct a full scale blast loading test on a concrete sample, thus numerical
simulation is always preferred by the researchers. LS-DYNA has shown a great
potential in performing blast loading simulation. It contains a library of concrete model
to capture the most basic characteristics of concrete. For example, there are
MAT_CONCRETE DAMAGE_REL3 or known as KCC Model,
MAT_WINFRITH_CONCRETE, MAT_CSCM CONCRETE and MAT_RHT
concrete material model. In the study carried out by Wu et al., the performance of each
model is assessed by varying the factors such as strain-rate enhancement, boundary
condition and contact algorithm.

7
According to Wu et al., the strength of concrete is affected by the strain rate where an
enhancement should be applied when the strain rate is high in the case of blast loading.
A strain rate enhancement is input externally to the KCC model which the input data
will be discussed later. Besides that, CSC and Winfrith models use an internal
enhancement to account for the strain rate effect whereas RHT model depends on the
reference strain rate on the input cards, namely E0C and E0T in LS-DYNA. As a result,
the KCC model matched the experimental data well with strain rate effect but a huge
discrepancies without the strain rate effect. For the CSC model, regardless of the
definition of strain rate effect, both conditions suit well with the experimental data.
However, the Winfrith and RHT model showed a lower displacement than the
experimental data. FIGURE 2.2 shows the results of the simulation.
FIGURE 2.2 Lateral Deflection Histories at Central Mid-Height on Back Face.
(Adapted from Wu et al., 2014)
On the other hand, contact algorithm defines the interaction between each part of the
model. There are many algorithms that have been implemented in LS-DYNA such as
node to surface contact, surface to surface contact, single surface contact and others.
Wu et al. claims that single surface or surface to surface contact is usually preferred
for blast loading simulation.
8
In general, concrete can be characterised by a single parameter which is its uniaxial
unconfined compressive strength, fc’. This is the basic properties of concrete that need
to be known to evaluate the behaviour of concrete under various type of loading
(Schwer & Malvar, 2005). In the LS-DYNA conference paper, the author claims that
the concrete material model *MAT_CONCRETE_DAMAGE_REL3 is the best
material type to simulate the behaviour of concrete when only minimum information
of the concrete are known. For example, if only the compressive strength of the
concrete is known, this material model is suitable to be used for the LS-DYNA
simulation. Also, further information on the characteristics of the concrete can be input
into the material cards.
As mentioned before, strain rate enhancement is an important factor in assessing the
behaviour of concrete subjected to blast loading. Under the condition of rapid loading
which in this case is impact loading, the response of concrete at high strain rate will
be different. In fact, the strength of concrete increases significantly (Malvar &
Crawford, 1998). The factor of enhancement of the concrete strength is called dynamic
increase factor (DIF) which is defined as the ratio of dynamic to static strength. Malvar
et al. reported that the DIF can be higher than two for compression (Bischoff & Perry,
1991) while greater than six for tension response . Besides that, the concrete structures
tend to fail in tension under impact loading. Therefore, strain rate enhancement in
tension provides a more accurate results on the dynamic behaviour of concrete as well
as for compression. DIF is defined as a function of strain rate and the relationship
between the two both in compression and tension are described in CEB Model Code
(Comite Euro-International du Beton, 1990).
According to CEB formulation for compression, the relationship between DIF and
strain rate is given as:
𝑓𝑐
𝑓𝑐𝑠= (
휀̇
휀�̇�)
1.026𝛼𝑠
𝑓𝑜𝑟 휀̇ ≤ 30𝑠−1
= 𝛾𝑠 (휀̇
휀�̇�)
1/3
𝑓𝑜𝑟 휀̇ > 30𝑠−1
where 𝑓𝑐 = dynamic compressive strength
9
𝑓𝑐𝑠 = static compressive strength
휀̇ = strain rate ranges from 30 x 10-6 to 300 s-1
휀�̇� = 30 x 10-6 s-1 (static strain rate)
𝑙𝑜𝑔𝛾 = 6.156𝛼 - 2
𝛼𝑠 = 1/(5+9𝑓𝑐𝑠 𝑓𝑐𝑜⁄ )
𝑓𝑐𝑜 = 10 MPa
(Adapted from Comite Euro-International du Beton, 1990)
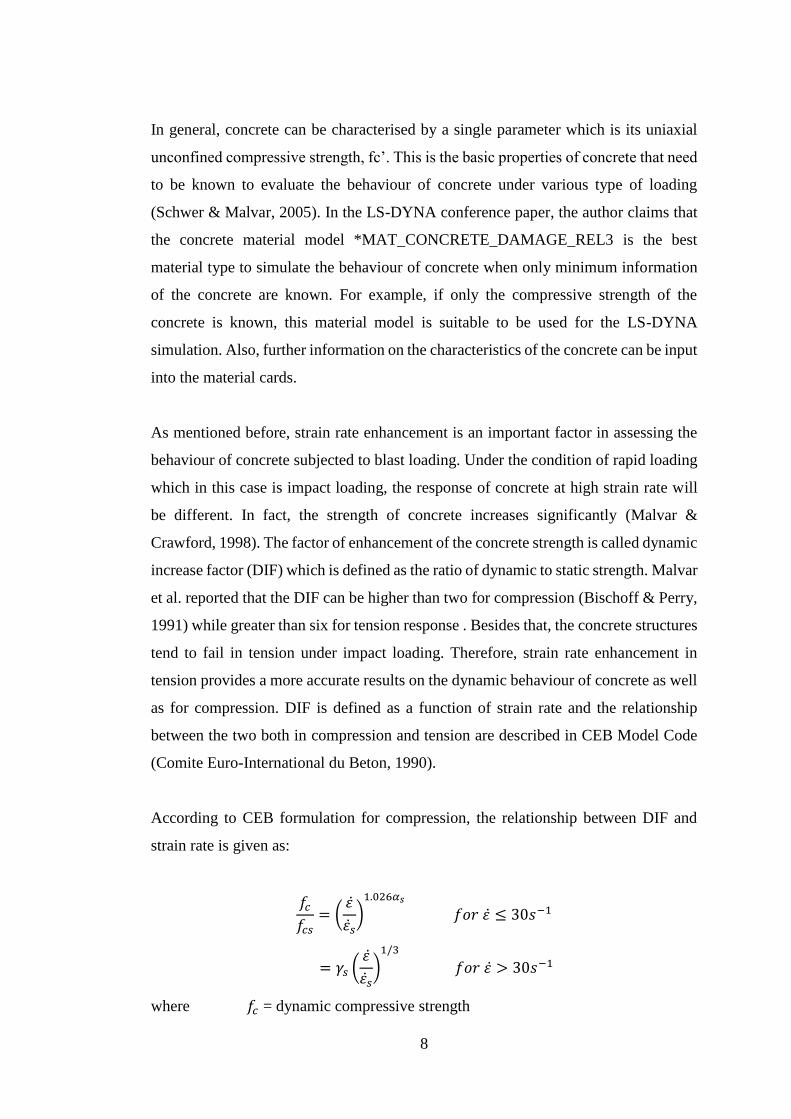
However, for tension, Malvar et al. has modified the CEB formulation based on several
researches. It is believed that the modified relationship best represent the behaviour of
concrete under impact loading. The proposed formulation becomes:
𝑓𝑡
𝑓𝑡𝑠= (
휀̇
휀�̇�)
𝛿
𝑓𝑜𝑟 휀̇ ≤ 1𝑠−1
= 𝛽 (휀̇
휀�̇�)
1/3
𝑓𝑜𝑟 휀̇ > 1𝑠−1
where 𝑓𝑡 = dynamic tensile strength
𝑓𝑡𝑠 = static tensile strength
휀̇ = strain rate ranges from 10-6 to 160 s-1
휀�̇� = 10-6 s-1 (static strain rate)
𝑙𝑜𝑔𝛽 = 6𝛼 - 2
𝛿 = 1/(1+8𝑓𝑐𝑠 𝑓𝑐𝑜⁄ )
𝑓𝑐𝑜 = 10 MPa
(Adapted from Malvar et al., 1998)
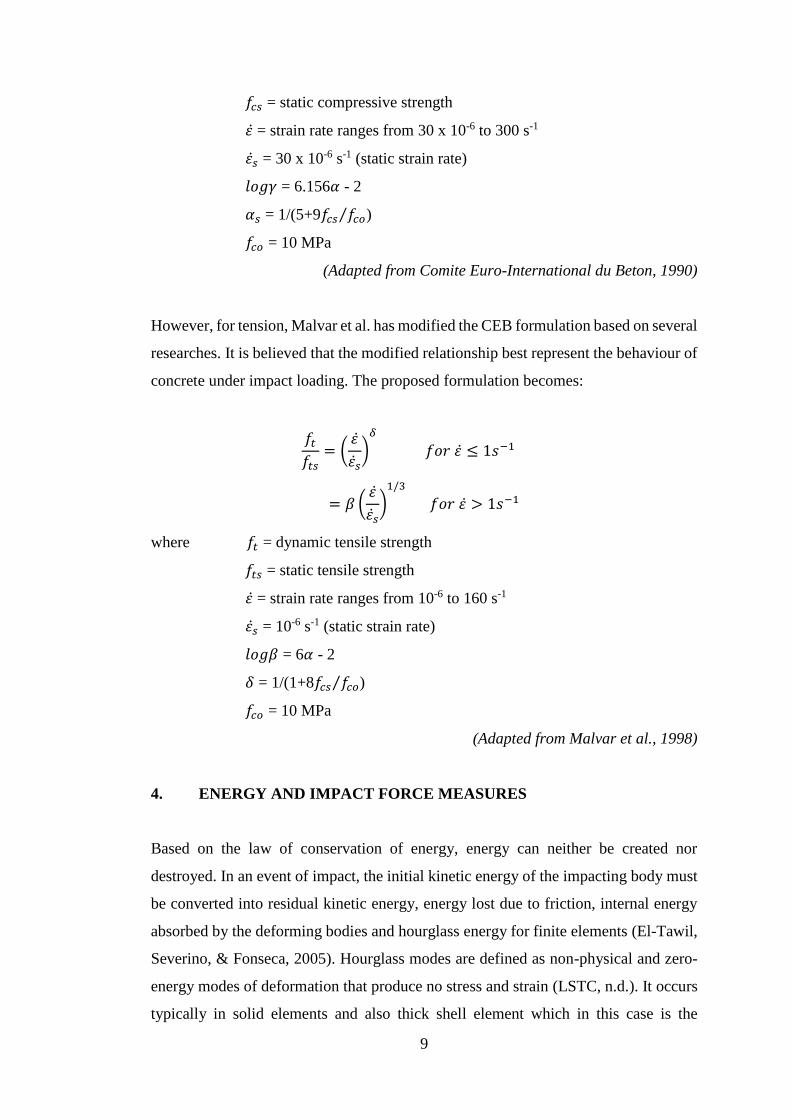
4. ENERGY AND IMPACT FORCE MEASURES
Based on the law of conservation of energy, energy can neither be created nor
destroyed. In an event of impact, the initial kinetic energy of the impacting body must
be converted into residual kinetic energy, energy lost due to friction, internal energy
absorbed by the deforming bodies and hourglass energy for finite elements (El-Tawil,
Severino, & Fonseca, 2005). Hourglass modes are defined as non-physical and zero-
energy modes of deformation that produce no stress and strain (LSTC, n.d.). It occurs
typically in solid elements and also thick shell element which in this case is the
10
concrete model. There are some stabilisation methods that are used in LS-DYNA
modelling to reduce the hourglass effects which will be described in the methodology
section. For example, an hourglass control keyword is defined in the model (Bala &
Day, 2004). In simple words, hourglass effect is the deformation of individual element,
while the overall body remains undeformed. In studying the impact behaviour of
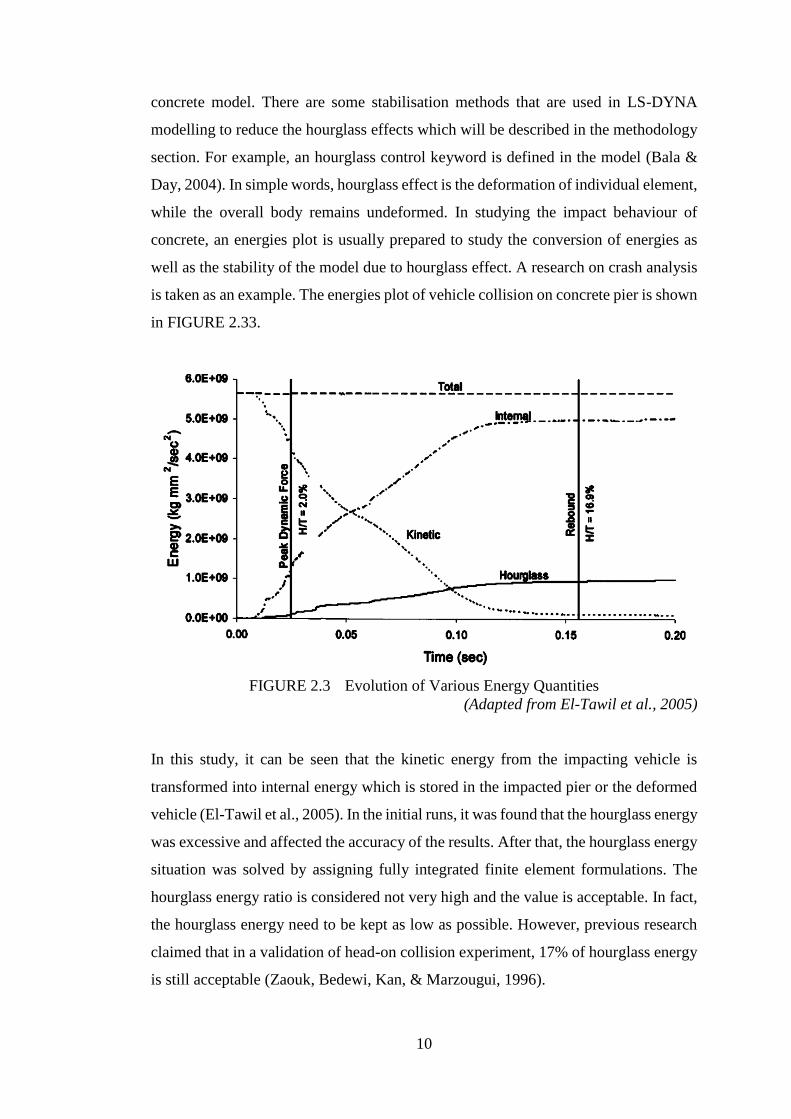
concrete, an energies plot is usually prepared to study the conversion of energies as
well as the stability of the model due to hourglass effect. A research on crash analysis
is taken as an example. The energies plot of vehicle collision on concrete pier is shown
in FIGURE 2.33.
FIGURE 2.3 Evolution of Various Energy Quantities
(Adapted from El-Tawil et al., 2005)
In this study, it can be seen that the kinetic energy from the impacting vehicle is
transformed into internal energy which is stored in the impacted pier or the deformed
vehicle (El-Tawil et al., 2005). In the initial runs, it was found that the hourglass energy
was excessive and affected the accuracy of the results. After that, the hourglass energy
situation was solved by assigning fully integrated finite element formulations. The
hourglass energy ratio is considered not very high and the value is acceptable. In fact,
the hourglass energy need to be kept as low as possible. However, previous research
claimed that in a validation of head-on collision experiment, 17% of hourglass energy
is still acceptable (Zaouk, Bedewi, Kan, & Marzougui, 1996).

11
Additionally, another concern in an impact event is the impact force. In fact, the impact
force is used to design the reinforced concrete beam for a particular condition,
especially the dynamic properties of the concrete. During an impact, there are two
peaks of impact force shown over the duration of experiment as shown in FIGURE 2.4
(Remennikov & Kaewunruen, 2006). The first peak indicates the initial impact from a
rigid body, then the next peak is due to the bouncing of the body after the first impact.
Following that, there is residual force on the concrete. Remennikov et al. conducted
the experiment with three different drop heights. In general, at the first impact, the
higher the drop weight, the larger the impact force due to higher impacting velocity.
FIGURE 2.4 Time Histories of Impact Forces
(Adapted from Remennikov et al., 2006)
Relating to a vehicle crash event, the peak dynamic force which occurs in the early
stage of impact has the highest amplitude of impact force. However, El-Tawil et al.
claimed that this force does not represent the design structural demand as the great
change in loading in very short period of time causes the structure has no time to
respond. Therefore, the equivalent static force provides a more appropriate measure of
the impact force and it is generally used in the design of reinforced concrete member
(Chopra, 2001).

12
Besides that, some characteristic values can be obtained from the impact force graph.
For example, impulse is the area under force-time curve, absorbed energy is the area
under force-displacement curve and mean impact force is impulse over the duration of
impact (Tachibana, Masuya, & Nakamura, 2010). The relationships between impact
force, time of impact and displacement are shown in FIGURE 2.5.
FIGURE 2.5 a) Force-Time Curve. b) Force-Displacement Curve.
(Adapted from Tachibana et al., 2010)
5. SHEAR FORCE DEMAND AND CAPACITY OF BEAM
The main factor for protection of structure is the calculation of dynamic shear force
capacity at various performance levels (Sharma, Hurlebaus, & Gardoni, 2012).
Reinforced concrete pier sustains damage during collision due to the transfer of large
shear force over a short interval of time. This is because during short time interval, the
resisting mechanism of the structure largely based on shear, inertia and local
deformation at the point of impact rather than the global deformation of the entire
structure. Hence, the dynamic shear capacity of the pier as well as its demand is more
important than the static shear force. Also, different type and severity of impact such
as the velocity of impacting body at the instant of impact and its mass also affect the
damage state of the structure. Sharma et al suggests a performance based analysis to
be carried out to minimize the damage to the reinforced concrete member.
Some experiments and simulations have been done in previous research. It showed
that the dynamic shear force capacity during a collision can be higher than the values
13
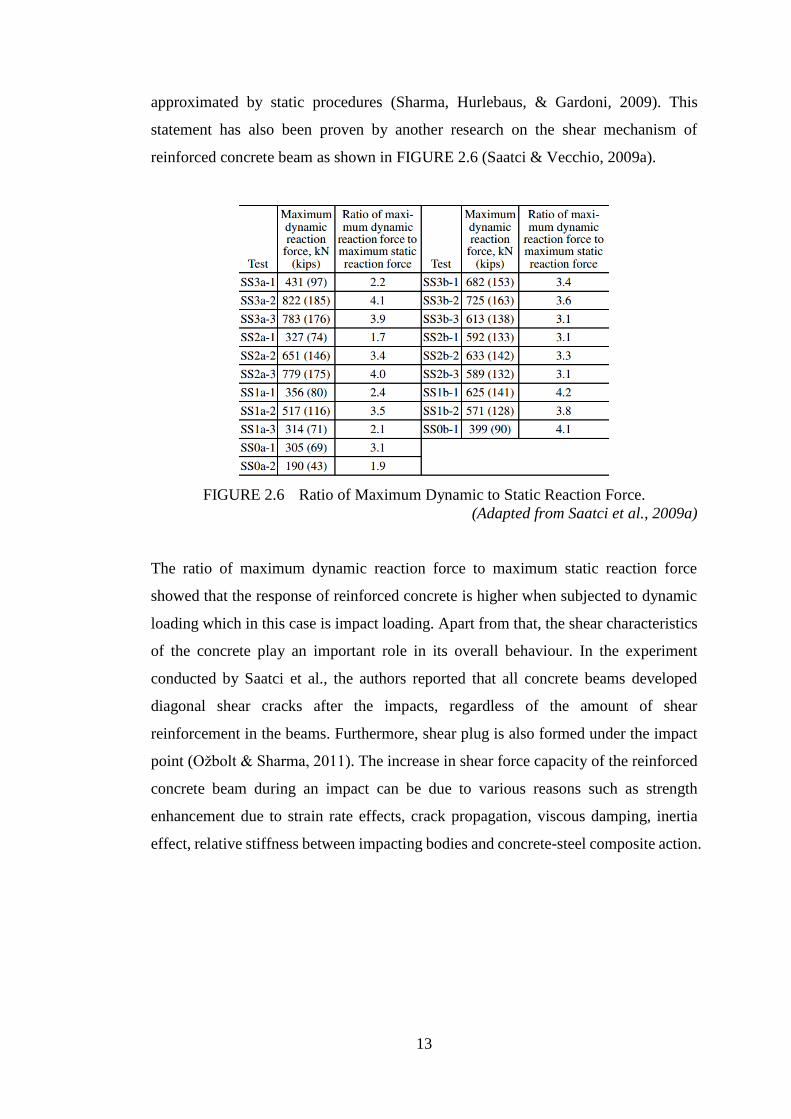
approximated by static procedures (Sharma, Hurlebaus, & Gardoni, 2009). This
statement has also been proven by another research on the shear mechanism of
reinforced concrete beam as shown in FIGURE 2.6 (Saatci & Vecchio, 2009a).
FIGURE 2.6 Ratio of Maximum Dynamic to Static Reaction Force.
(Adapted from Saatci et al., 2009a)
The ratio of maximum dynamic reaction force to maximum static reaction force
showed that the response of reinforced concrete is higher when subjected to dynamic
loading which in this case is impact loading. Apart from that, the shear characteristics
of the concrete play an important role in its overall behaviour. In the experiment
conducted by Saatci et al., the authors reported that all concrete beams developed
diagonal shear cracks after the impacts, regardless of the amount of shear
reinforcement in the beams. Furthermore, shear plug is also formed under the impact
point (Ožbolt & Sharma, 2011). The increase in shear force capacity of the reinforced
concrete beam during an impact can be due to various reasons such as strength
enhancement due to strain rate effects, crack propagation, viscous damping, inertia
effect, relative stiffness between impacting bodies and concrete-steel composite action.

14
6. CRITICAL REVIEW OF LITERATURE
Many researches have been done throughout these years to assess the behaviour of
reinforced concrete under impact loadings. Strain rate enhancement of concrete has
been debated by many researchers. In the finite element modelling by Saatci et al., the
high strain rate due to impact loading has not been considered in the model. The
authors stated that some researchers stressed on the significance of the strain rate
effects in concrete but there are also academics who disagree with the statement. For
example, the apparent dynamic strength enhancement is often interpreted wrongly as
strain rate effect in structural design. In fact, the enhancement is due to the confinement
stress caused by lateral inertia of the test specimens (Li & Meng, 2003). Hence, the
strength of the concrete may be overestimated. Nevertheless, the authors added that
strain rate enhancement is ignored in the model because VecTor2 is able to calculate
the strength increase due to confining stress created by the inertia of the structure. In
contrast, Wu et al. has shown the effects of inclusion of strain rate effects in four
constitutive models in LS-DYNA which concluded that it is an important factor in the
KCC model.
As has been said, the energy quantities of a collision simulation are plotted to
determine the stability of the numerical model. The model is considered stable if the
total energy is conserved and the hourglass energy is low. Basically, the total energy
consists of the kinetic energy from impacting body, internal energy absorbed by the
beam and deforming impacting body but in this case is a rigid body which assumed to
be undeformable, and residual energies such as hourglass energy for finite elements.
Hourglass energy is always monitored during the simulation and is kept as low as
possible. Ideally, the hourglass energy should be less than 10% of the internal energy
(Allemang, de Clerck, Niezrecki, & Wicks, 2013). However, in the research by El-
Tawil et al., it is reported that the hourglass energy at the end of their test is 17% which
is considerably higher than the ideal case.
15
CHAPTER 3
METHODOLOGY
A project schedule has been planned to ensure that the project can run smoothly and
the objectives can be achieved within the time frame. Due to limited budget and time
constraint, a computer simulation is adopted to represent the real condition of an
impact on reinforced concrete beam by a rigid body. A real impact test can be
conducted in the laboratory but the apparatus need to be set up carefully and the
preparation of concrete samples require time for them to achieve the required strength.
Hence, the test is replaced with a computer simulation and the beams, impactor and
supports are modelled as close as possible to an experiment conducted previously by
researchers to determine the behaviour of reinforced concrete subjected to impact
loads (Saatci, 2007). In general, the simulation is conducted using a finite element
program developed by Livermore Software Technology Corporation called LS-DYNA.
In this study, LS-PrePost of version 4.2 (Beta) is used for modelling purpose and
displaying the results whereas LS-DYNA is the solver for the simulation.
1. VALIDATION OF RESULTS
The research is conducted using software simulation to determine the behaviour of
reinforced concrete beam when subject to impact. However, the results from a
computer simulation may differ from the data obtained from a real impact condition.
All the parameters required by the software need to be set correctly so that there will
be no huge variation between both of the results. Therefore, the results from the finite
element model analysis need to be validated before a conclusion is drawn. There are
several ways to verify the simulation results such as experiment or theoretical approach.
In this research, the results from simulation are compared with experimental data
obtained from previous research which will be discussed in details in the following
section.
On the other hand, theoretical approach proposed here is the single degree of freedom
(SDOF). It is widely used in predicting the dynamic response of structures (Fallah &
Louca, 2007). The damage criterion of SDOF approach proposed by Fallah et al. is
16
based on the deflection of a structure. Based on this method, the reinforced concrete
beam is idealised as an equivalent elastic-perfect plastic SDOF model. It can be used
to produce pressure-impulse diagram for reinforced concrete beam. The diagram is
then compared with the impulse diagram generated by LS-DYNA.
2. REVIEW OF EXPERIMENTAL TEST
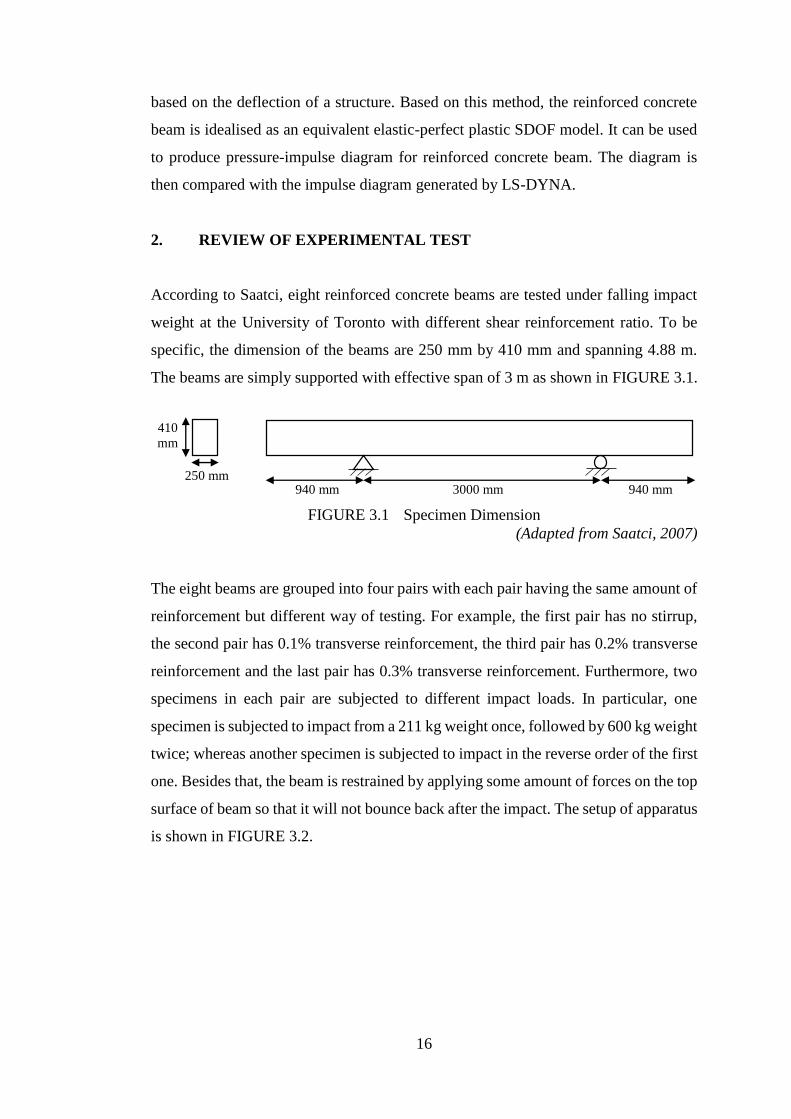
According to Saatci, eight reinforced concrete beams are tested under falling impact
weight at the University of Toronto with different shear reinforcement ratio. To be
specific, the dimension of the beams are 250 mm by 410 mm and spanning 4.88 m.
The beams are simply supported with effective span of 3 m as shown in FIGURE 3.1.
FIGURE 3.1 Specimen Dimension
(Adapted from Saatci, 2007)
The eight beams are grouped into four pairs with each pair having the same amount of
reinforcement but different way of testing. For example, the first pair has no stirrup,
the second pair has 0.1% transverse reinforcement, the third pair has 0.2% transverse
reinforcement and the last pair has 0.3% transverse reinforcement. Furthermore, two
specimens in each pair are subjected to different impact loads. In particular, one
specimen is subjected to impact from a 211 kg weight once, followed by 600 kg weight
twice; whereas another specimen is subjected to impact in the reverse order of the first
one. Besides that, the beam is restrained by applying some amount of forces on the top
surface of beam so that it will not bounce back after the impact. The setup of apparatus
is shown in FIGURE 3.2.
410
mm
250 mm 940 mm 3000 mm 940 mm

17
FIGURE 3.2 Cross-sectional of the Test Setup.
(Adapted from Saatci, 2007)
3. MODELLING PROCEDURES
In this research, two beams similar to the experiment are analysed. To be exact, the
first beam consists of longitudinal reinforcement only and subjected to an impact from
the 211 kg rigid body and it is called SS0a-1 hereafter following the naming of
specimen in the experiment. On the other hand, the second beam has a stirrup ratio of
0.1% at 300 mm spacing subjected to the same impact loading and it is called SS1a-1
hereafter. It should be noted that, the beams are impacted once only which are different
from the experiment that the specimens were impacted thrice. Having the same
dimensions of beams illustrated in the previous section, the beams are modelled in LS-
PrePost. Moreover, the beams are meshed into small elements following the locations
of the steel reinforcement. This is to ensure that the beam elements for reinforcement
and solid elements for concrete are sharing the same nodes and then merged to allow
for perfect bonding. At each side of the supports, the beams are clamped by two thin
plates which only allow rotation in the direction of the axis perpendicular to the span
of the beam. The function of the top plates are to restraint the beam from bouncing
back after the impact. The bottom plates resting on a fixed rigid cylindrical supports
as shown in FIGURE 3.4 whereas FIGURE 3.3 illustrated the reinforcement in the
beams as well as the mesh.

18
FIGURE 3.3 Beam Cross-section.
(Adapted from Saatci, 2007)
FIGURE 3.4 Beam SS0a-1 (top). Beam SS1a-1 (middle). FE Model (bottom)

19
As mentioned earlier, the mesh size of the beam depends on the locations of the
reinforcement. It is ensured that the reinforcement passes through the nodes of the
concrete elements as shown in FIGURE 3.5.
FIGURE 3.5 Mesh Size of Beam Cross-Section.
From the diagram, it can be noticed that each element has a size of approximately
25mm x 25mm and 25mm in the beam span direction, and the whole beam model is
made up of these cuboid elements combined together.
Following that, the parts are assigned with different section and material properties
using keywords function. All the parameters in the keywords are checked against the
software keyword manual to ensure correct values are used. The concrete is modelled
using eight-node hexahedron solid elements with a single integration point. Further,
the material model of the concrete is *MAT_CONCRETE _DAMAGE_REL3 which
is the best material model to be used as suggested by Schwer and Malvar. There are
several parameters that are input to the material model. Prior to that, it should be noted
that all the values inserted into LS-DYNA are unit-less, hence a consistent set of units
is used to avoid confusion. TABLE 3.1 shows the set of units that is used in the model.
Other derived units are derived from the basic units shown. After that, the properties
of concrete beam are assigned according to the information given in the experiment by
Saatci as shown in TABLE 3.2.
53mm 144mm 53mm
Rebar location
53mm
304mm
53mm

20
TABLE 3.1 Set of Consistent Units Used in LS-DYNA Model.
Parameters Units
Length millimetres (mm)
Time millisecond (ms)
Mass kilogram (kg)
Force kiloNewton (kN)
Stress GigaPascal (GPa)
TABLE 3.2 Properties of Concrete.
Beam Properties Values
SS0a-1 Mass density 2437 kg/m3
Unconfined compression strength 50.1 MPa
SS1a-1 Mass density 2473 kg/m3
Unconfined compression strength 44.7 MPa
Furthermore, strain-rate effect is also included in the concrete material model. A load
curve is defined to represent the strain-rate enhancement of the concrete when
subjected to impact. Both the strain-rate effects on compression and tension of
concrete are included. The values of dynamic increase factor with respect to strain rate
and the semi-logarithm graph can be found in APPENDIX 1. It is calculated using
CEB formulation for concrete in compression and a modified formulation by Malvar
for concrete in tension as shown in the previous research.
On the other hand, for the reinforcement bars, it is modelled using two-node beam
element with material model of *MAT_PLASTIC_KINEMATIC. Besides that, the
longitudinal reinforcement is formulated using Hughes-Liu formulation with 2x2
Gauss integration. However, using the same material model, stirrups are formulated
using truss element which bending is assumed to be absent in the transverse
reinforcement. The properties of reinforcement are summarised in TABLE 3.3.
TABLE 3.3 Properties of Reinforcement.
Reinforcement Mass Density Young’s
Modulus
Poisson
Ratio
Yield
Stress Diameter
Longitudinal 7850 kg/m3 195 GPa 0.3 464 MPa 30mm
Transverse 7850 kg/m3 190.25 GPa 0.3 605 MPa 7mm

21
Furthermore, strain rate effects are also considered for the reinforcement. The strain
rate sensitivity parameter is given in the Cowper-Symonds strain rate model which
scales the yield stress with the factor
1 + (휀̇
𝐶)
1𝑝
The coefficients of C and p are determined from test data and depend on the type of
material used. To be specific, the material for reinforcement used in this study is mild
steel, thus the coefficients of C and p are 40.4 and 5 respectively (Paik & Thayamballi,
2003). All the shared nodes between concrete and reinforcement are merged to ensure
perfect bonding and prevent slippage between them. Next, the contact interface
between the beams and impacting body is defined. According to Ferrer, Ivorra,
Segovia, and Irles (2010), the CONTACT_AUTOMATIC_SINGLE_SURFACE
algorithm is the most suitable type of contact in LS-DYNA.
As mentioned previously, the beams are subjected to impact from a rigid body
undergoing free-falling. In the experiment, the drop weight was placed at a height of
3.26m, resulted in a calculated impact velocity of 8 m/s using equations of motion.
There were two weights being used in the experiment, but for the beams SS0a-1 and
SS1a-1, the 211 kg weight is used and impact on the beam once only. With the same
area of contact between drop weight and beam in the experiment, it is modelled in LS-
PrePost as a rigid steel solid section with area of 300 mm by 300 mm. Then, the
required height of the impactor is calculated using a steel density of 7850 kg/m3 which
resulted in a height of approximately 300 mm.
After all the keywords definition, the “.k” file is created. Next, the file is uploaded to
LS-DYNA solver for the analysis and calculation. As a result, the “d3plot” file is
created and the outputs are extracted using LS-PrePost. All the required outputs can
be obtained from the fringe components, time-history plot as well as ASCII binary plot.
It is important that the results from a simulation test need to be validated, therefore the
results are compared against the experiment data and will be discussed in the following
section.

22
4. PROJECT ACTIVITIES AND KEY MILESTONE
This project consists of various stages starting from preliminary studies until the final
reporting stage. Each of the activities is important and need to be carry out so that the
objectives of the study can be achieved. Nevertheless, the tasks to be performed are
within the scope of study and they are specific enough, thus the desired outcomes can
be achieved within the specified time frame. Besides, there are some activities or tasks
which is critical in this project. These tasks need to be completed on time so that the
objectives are achieved and the next tasks can be continued. In essence, these activities
are called the project key milestones as summarised in this section.
A) Preliminary Research Work
After finalising the research topic, the project started with some preliminary research
works. These include some searching of previous researches related to the project.
Besides previous researches, the current design codes and standards are also reviewed.
Based on the previous studies, their methodology and findings are noted for report
references. After that, the problems statement with the objectives and scope of study
are established. This is the first key milestone of the project as the problem statement
states the problem faced nowadays and the objectives set will be able to solve the
problem at the completion of the study. Moreover, the scope of study limits the author
to a specific area so that the study area is not too wide and can be achieved within the
specified period of time. More importantly, it conforms to the guide for setting
objectives which are specific, measurable, attainable, realistic and within the time
frame (S.M.A.R.T.). Next, the research gaps are also identified and included in the
critical review of literatures. This critical review is also another key milestone that
need to be achieved as it shows the differences and improvement of this research from
the previous. Then, learning of software, specifically LS-DYNA is necessary as the
method of this project is generally a numerical simulation of vehicular collision.
B) Preliminary Model
As described in the previous section, a preliminary model is produced using a simple
beam subjected to an impact free falling rigid steel box at the mid span of the concrete

23
section. All the keywords are defined and outputs are obtained. In this preliminary
modelling, one of the key milestones that can be achieved is to know the basic rules of
modelling in LS-DYNA. For example, the choice of the most suitable contact
algorithm needs some trial and error. With a simple model, this can be easily
determined and later can applied directly to the real model. Eventually, it can save a
lot of time doing trial and error in the real model which requires longer time for the
analysis run.
C) Preliminary Results
After the analysis run by the solver, the outputs can be obtained. Basically, the required
outputs are such as the displacement of beam, stresses of concrete and reinforcement,
energies plot and impact force. However, these results need to be validated because it
is a computer simulation which might differ from an actual collision event. This is
another key milestone as it affects the reliability of results. Without a proof to the
results, the project may not be continued. There are several methods of validation such
as experimental testing. Moreover, the results can also be validated using multiple
software such as RCBlast and SeismoStruct. Both software are typically used in
dynamic analysis. Accordingly, the similar model is run in other software the results
are compared. However, in this study, the results from LS-DYNA simulation will be
compared against experimental data obtained from previous research.
D) Review of Experiment Testing
The modelling of reinforced concrete beams are based on an experiment by Saatci. In
the author’s thesis, the apparatus set up and the testing procedures are well illustrated.
Besides that, all the material properties such as concrete properties, reinforcement
properties, weight of impactor and others are clearly defined. The model in LS-DYNA
is created as close as the experiment set up so that the results can be compared and
validated. The thesis is reviewed carefully to avoid any important parameters being
missed out.

24
E) The First Beam Model
As mentioned previously, the beams are modelled according to the experiment
following the naming convention in the experiment. For example, the first beam model
is called SS0a-1 which is a reinforced concrete beam with longitudinal reinforcement
only. The outputs such as beam displacement and reinforcement strain are extracted
from LS-DYNA. It is then superimposed on the experimental data to see any
discrepancies and inaccuracy of the results. The results of the simulation are discussed
in the following section.
F) The Second Beam Model
To have a better understanding on the behaviour of reinforced concrete beam subject
to impact, a second beam is generated which is called SS1a-1. In this model, stirrups
are included with certain amount of shear reinforcement as described before. Likewise,
the outputs such as beam displacement and reinforcement strain are extracted from
LS-DYNA. Again, the graphs are superimposed on the experiment plotted graph to
see any differences and inaccuracy of the results. The results of the simulation are also
discussed in the following section.

25
5. PROJECT TIMELINE
A) GANTT CHART FOR FYP 1
No. Activities / Details Week
1 2 3 4 5 6 7 8 9 10 11 12 13 14
1 Selection of Project Topic
2 Preliminary Research Work
Find sources and understand previous research works.
Identify the problems, objectives and scope of study.
Identify research gap and report in Literature Review.
Learning of software modelling.
3 Submission of Extended Proposal
4 Preliminary Modelling
Create model parts.
Define keywords.
Identify parameters.
Run analysis and solve errors.
5 Preliminary Results
Obtain required outputs.
Output analysis and results validation.
6 Proposal Defence
7 Submission of Interim Draft Report
8 Submission of Interim Report
Project : Finite Element Analysis on Reinforced Concrete Beams Subject to Impact Legends: Key Milestone
As of Date : 5th December 2014 Process

26
B) GANTT CHART FOR FYP 2
No. Activities / Details Week
1 2 3 4 5 6 7 8 9 10 11 12 13 14
1 Refine Scope of Study and Objectives
2 Review Previous Research Experiment
Understand experimental set up.
Note all material properties.
3 Create the First Model based on Experiment
Identify keywords and parameters involved.
Results validation.
4 Submission of Progress Report
5 Create the Second Model Based on Experiment
Identify keywords and parameters involved.
Results validation.
6 Pre-SEDEX
7 Submission of Draft Final Report
8 Submission of Dissertation
9 Submission of Technical Paper
10 Viva
Project : Finite Element Analysis on Reinforced Concrete Beams Subject to Impact Legends: Key Milestone
As of Date : 26th March 2015 Process

27
CHAPTER 4
RESULTS AND DISCUSSIONS
In this section, the results of the simulation by LS-DYNA are shown. Some discussions
on the results are also included as a reference for future works. Also, the results are
compared or validated with the experimental data to access the reliability, accuracy
and representative of the results in the real situation.
There are many outputs that can be extracted from LS-DYNA, depending on the
keywords defined before the analysis. The main focus of the study is the dynamic
response of reinforced concrete beam when subject to impact. Therefore, the results
such as the stress, plastic strain of concrete, displacement of the beam and axial strain
of the reinforcement are needed. Prior to that, energies plot is needed to determine the
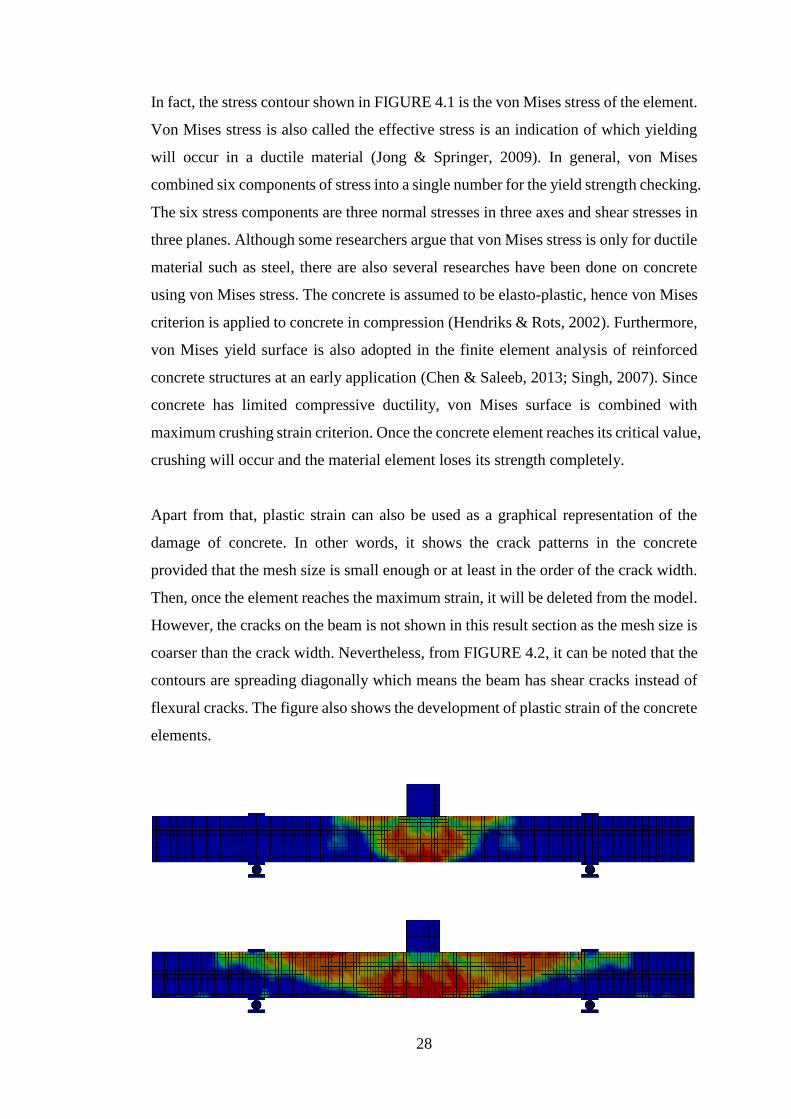
stability of the model. First, FIGURE 4.1 shows the contour of stress distribution in
the concrete beam when impacted by the rigid steel box at different time. It can be seen
that the stress distributed from the impacted point to the two ends of the beam.
FIGURE 4.1 Stress Distribution of Concrete Beam.
28
In fact, the stress contour shown in FIGURE 4.1 is the von Mises stress of the element.
Von Mises stress is also called the effective stress is an indication of which yielding
will occur in a ductile material (Jong & Springer, 2009). In general, von Mises
combined six components of stress into a single number for the yield strength checking.
The six stress components are three normal stresses in three axes and shear stresses in
three planes. Although some researchers argue that von Mises stress is only for ductile
material such as steel, there are also several researches have been done on concrete
using von Mises stress. The concrete is assumed to be elasto-plastic, hence von Mises
criterion is applied to concrete in compression (Hendriks & Rots, 2002). Furthermore,
von Mises yield surface is also adopted in the finite element analysis of reinforced
concrete structures at an early application (Chen & Saleeb, 2013; Singh, 2007). Since
concrete has limited compressive ductility, von Mises surface is combined with
maximum crushing strain criterion. Once the concrete element reaches its critical value,
crushing will occur and the material element loses its strength completely.
Apart from that, plastic strain can also be used as a graphical representation of the
damage of concrete. In other words, it shows the crack patterns in the concrete
provided that the mesh size is small enough or at least in the order of the crack width.
Then, once the element reaches the maximum strain, it will be deleted from the model.
However, the cracks on the beam is not shown in this result section as the mesh size is
coarser than the crack width. Nevertheless, from FIGURE 4.2, it can be noted that the
contours are spreading diagonally which means the beam has shear cracks instead of
flexural cracks. The figure also shows the development of plastic strain of the concrete
elements.

29
FIGURE 4.2 Plastic Strain of Concrete.
Other than that, it is important to determine the stability of model in finite element
modelling. Energies plot usually gives an indication on the stability of the model. In
essence, the hourglass energy is kept as low as possible or under 10% of the internal
energy as suggested by Allemang et al. Other energies such as total energy, kinetic
energy and internal energy are also plotted. These energies show the conversion or
transformation of one type to another as shown in FIGURE 4.3 and FIGURE 4.4. The
energies in both beam can be said to have the same pattern and magnitude. The total
energy is constant and it is conserved. Initially, the kinetic energy has the same
magnitude as the total energy which is 6560 Joules. This value can also be checked
using the equation
𝐸 =1
2𝑚𝑣2
=1
2× 211𝑘𝑔 × (8𝑚/𝑠)2
= 6752 𝐽𝑜𝑢𝑙𝑒𝑠
The calculated value is relatively close to the kinetic energy calculated by LS-DYNA.
When the beam is impacted, the kinetic energy is absorbed by the beam as internal
energy. Therefore, the kinetic energy drops whereas the internal energy rises. In
addition, the hourglass energy or the zero-energy is always the main concern in finite
element analysis. In this case, the hourglass energy (144 J) is considerably low which
accounts for 2.3% of the internal energy (6170 J), hence this value is accepted and the
model is stable.

30
FIGURE 4.3 Energies Plot for SS0a-1 Beam.

31
FIGURE 4.4 Energies Plot for SS1a-1 Beam.

32
At the most fundamental level, LS-DYNA finite element code solves the
displacements for each nodes in an element, followed by strains and stresses. To
understand the behaviour of reinforced concrete beams subject to impact, it is
important to know the displacement of the beam after the impact. In the case of a beam,
the mid-span displacement is the most critical. Therefore, only the mid-span
displacement of the beam will be discussed in this section. In fact, there are two types
of displacements that the designers usually concern. One is the maximum or peak
displacement which occur at the instance when the beam is impacted while the other
is the residual displacement. Since the concrete has certain elasticity, the displacement-
time graph displays a wave type graph and damped to the residual displacement.
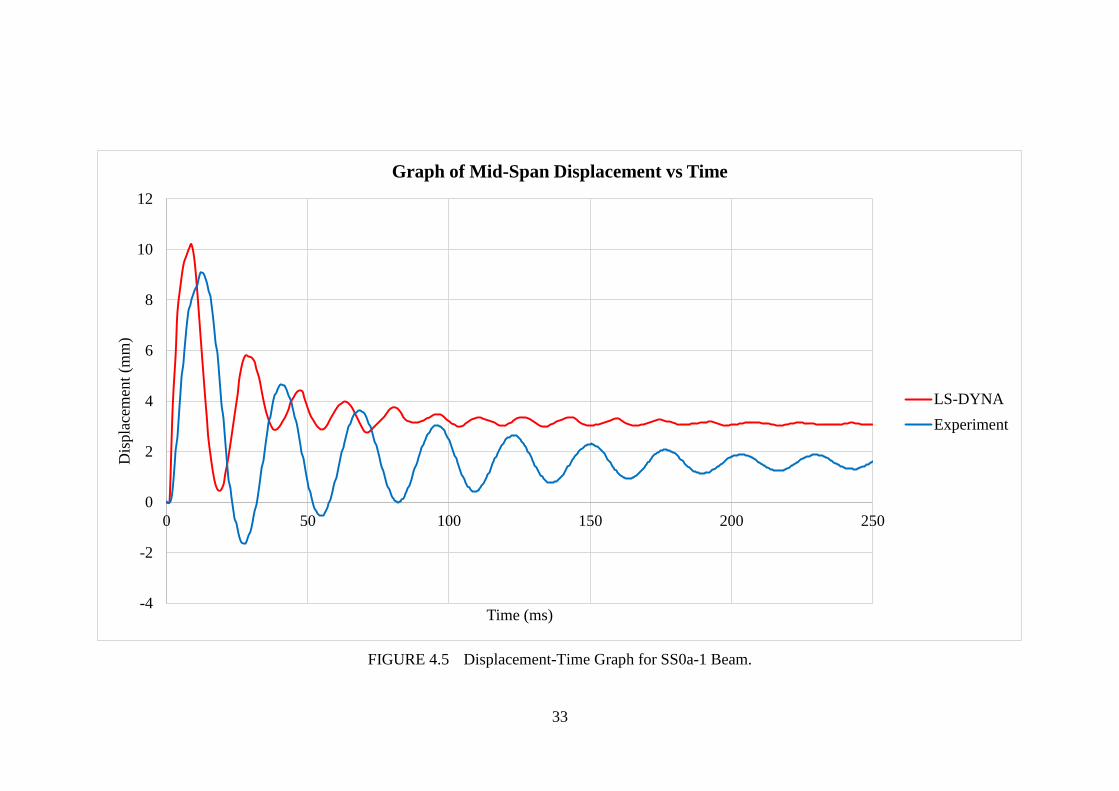
For the SS0a-1 beam as shown in FIGURE 4.5, the maximum displacement calculated
by LS-DYNA is 10.19 mm compared to the experimental value of 9.1 mm with only
a small difference. Hence, it can be said that both results are relatively close to each
other. After that, the displacement is getting smaller over time due to damping force
in the beam. The displacement calculated by LS-DYNA has larger damping force as
compared to experimental data as the displacement graph becomes almost a straight
line after 200 ms of the simulation. However, a wave graph can still be clearly seen in
the experimental graph after 200 ms. Besides that, LS-DYNA predicted a higher
residual displacement of beam which is 3.07 mm whereas the experiment data shows
a beam residual displacement of around 1.6 mm.
For the SS1a-1 beam, the maximum displacement obtained from LS-DYNA is 8.84
mm which is lower than the experimental value of 12.18 mm as shown in FIGURE
4.6. This difference might due to simulation errors which will be discussed at the end
of this section. However, when the displacement damped over time, LS-DYNA
calculated displacement starts to capture the peaks of the experimental graph. It can
also be noted that the amplitude of displacement for this beam is higher and the wave-
shape graph lasts longer as the stirrups in the beam makes it stiffer and becomes more
ductile, exhibiting a more elastic behaviour and resists the shear force through larger
displacement of beam. Experimental data shows a residual displacement of 1.05 mm
but the simulation in LS-DYNA is not long enough to predict the residual displacement.
33
FIGURE 4.5 Displacement-Time Graph for SS0a-1 Beam.
-4
-2
0
2
4
6
8
10
12
0 50 100 150 200 250
Dis
pla
cem
ent
(mm
)
Time (ms)
Graph of Mid-Span Displacement vs Time
LS-DYNA
Experiment

34
FIGURE 4.6 Displacement-Time Graph for SS1a-1 Beam.
-8
-6
-4
-2
0
2
4
6
8
10
12
14
0 50 100 150 200 250
Dis
pla
cem
ent
(mm
)
Time (ms)
Graph of Mid-Span Displacement vs Time
LS-DYNA
Experiment

35
FIGURE 4.7 and FIGURE 4.8 show the graph of longitudinal reinforcement strain
over time. These results were taken from the one of the bottom reinforcement of the
beams at their mid-span (Bar #3 Gauge #1 from the experiment) because the strain of
reinforcement at mid-span is the largest due to largest displacement. As mentioned
previously, LS-DYNA finite element code uses displacement to calculate strain and
eventually the stress of an element. In general, the reinforcement shows positive strains
which mean the rebar are in tension. For SS0a-1 beam, the maximum reinforcement
strain obtained from LS-DYNA is 2462 mm/m whereas result from experiment was
2527 mm/m which is close to each other. In fact, these values have exceeded the elastic
strain of the high yield steel bar. The maximum strain of the steel bar before it enters
plastic region is
휀𝑦 =𝑓𝑦
𝐸𝑠
=464
195000= 0.002379
Therefore, this causes some residual plastic strain in the steel bar as shown in the graph.
However, LS-DYNA computed a higher residual plastic strain (≈ 545 mm/m)
compared to experimental results (≈ 400 mm/m).
Whereas in the case of SS1a-1 beam, the maximum reinforcement strain obtained from
simulation is 2683 mm/m whereas experiment gave a peak reinforcement strain of 2305
mm/m. The high strain output from simulation may be due to some errors in finite
element analysis which will be discussed later. After that, the graph produced from
simulation matches considerably well with the experimental graph. Also, it can be
noted that the amplitude of strain of the reinforcement in this beam is higher than the
beam without stirrups. The same explanation as for the displacement of beam can be
applied. The beam is stiffer with the stirrups, making it resists the shear by bending.
Consequently, larger displacement causes higher strain in the reinforcement. Again, it
is hard to predict the residual plastic strain of the reinforcement because the wave-like
graph will still continue. However, from the experiment, the residual plastic strain is
290 mm/m, thus it is can be hypothesised that the residual plastic strain of
reinforcement in this beam is lower than the first beam due to the presence of stirrups.

36
FIGURE 4.7 Rebar Strain-Time Graph for SS0a-1 Beam.
-500
0
500
1000
1500
2000
2500
3000
0 50 100 150 200 250
Str
ain (m
m/m
)
Time (ms)
Graph of Main Reinforcement Strain vs Time
LS-DYNA
Experiment

37
FIGURE 4.8 Rebar Strain-Time Graph for SS1a-1 Beam.
-500
0
500
1000
1500
2000
2500
3000
0 50 100 150 200 250
Str
ain (m
m/m
)
Time (ms)
Graph of Main Reinforcement Strain vs Time
LS-DYNA
Experiment

38
SS1a-1 beam contains 0.1% of shear reinforcement with the intention to compare the
results with the beam without stirrups. As shown previously, the displacement and
longitudinal reinforcement in this beam is lower due to extra stiffness from stirrups.
The beam with stirrups is able to sustain plastic deformations or increased ductility
(Said & Elrakib, 2013). According to Sharma et al., reinforced concrete under impact
load sustains large shear force and tends to fail in shear rather than flexure. Hence,
shear reinforcement in beam aids in resisting shear stresses in the beam. From FIGURE
4.9, the maximum stirrup strains calculated or measured by LS-DYNA and experiment
are 1956 mm/m and 2153 mm/m respectively. These values are close to the yield strain
of stirrups which implies that the stirrups are successful in resisting shear stress in the
beam. After the first impact, the stirrups strains decrease and left with residual plastic
strain in the stirrups. Moreover, it is important to note that the effect of high strain rate
in concrete and reinforcement. Due to the high strain rate caused by impact load, the
strength of concrete and steel reinforcement increase significantly. This strength
enhancement allows the materials to sustain higher stress beyond their ultimate
strength. All in all, the simulation results fits quite well with the experimental data.
On top of all the results discussed previously, it is necessary to understand the accuracy
or reliability of finite element analysis. In every software simulations using finite
element code, validation of results is important in order to know whether the results
are representative enough of the real situation. Hence, the outputs from LS-DYNA in
this study are validated with the experimental data. Although there might have some
errors or uncertainties in the experiment which will affect the results, the accuracy in
finite element modelling cannot be ignored too. With all these factors, it causes
differences between simulation and experimental results. The common sources of
errors in finite element simulation can be due to modelling errors, numerical errors and
others (Tekkaya & Martins, 2009).
In terms of modelling errors, it is important for a researcher to select a suitable material
model for analysis. For example, in LS-DYNA there are several material model for
concrete. Some models are not suitable because certain parameters are ignored. As
mentioned in the literature, concrete material model in LS-DYNA such as Winfrith
model ignores the strain rate effects, thus it cannot be used as strain rate enhancement
is an important parameter in an impact analysis for concrete structures.

39
FIGURE 4.9 Stirrup Strain-Time Graph for SS1a-1 Beam.
-500
0
500
1000
1500
2000
2500
0 50 100 150 200 250
Str
ain (m
m/m
)
Time (ms)
Graph of Stirrup Strain vs Time
LS-DYNA
Experiment
40
Second, the common issue in numerical errors is mesh size and shape. Irregular pattern
of mesh shape or elements with acute and obtuse angle generally affect the accuracy
of the results due to their unconformities. In fact, a finer mesh produces a more
accurate results but increases the computation time substantially. According to
Tekkaya et al., a mesh convergence study needs to be carried out to obtain the optimum
mesh size for analysis. However, in this study, a typical mesh size of 25 mm is used
as suggested by Adhikary et al. that any finer mesh has no significant effect on the
accuracy of the results. Besides that, time step is another issue which contributes to
numerical errors. Time steps in explicit dynamic formulations are usually smaller than
quasi-static implicit formulations. For example in an impact analysis, smaller time step
provides advantage in showing the development and distribution of stresses in concrete
as the event happens in the order of milliseconds. However, this also increases the
computation time. Other errors in finite element analysis are due to wrong
interpretation of finite element results. Inexperience users might extract the wrong
information from the post-processing software.

41
CHAPTER 5
CONCLUSION AND RECOMMENDATION
Reinforced concrete is the most common construction material used in the industry
due to its properties, availability of material as well as its functional cost. In normal
case, the structural elements are designed in such a way that the structure remains rigid
under normal working condition. To prevent severe consequences to happen,
accidental loads are taken into consideration in the design of the structure. In this study,
the behaviour of reinforced concrete beams under impact load is analysed. Several
researches have been done previously on the behaviour of reinforced concrete beams
subject to impact. It was found that the beams failed in shear rather than flexure when
subjected to high dynamic loadings. LS-DYNA and LS-PrePost are used in this study
to simulate the condition in an event of impact on reinforced concrete beams. The
results are validated by experimental data.
The experiment was conducted by Saatci to analyse the dynamic response of
reinforced concrete beams subject to impact and their shear mechanisms by varying
shear reinforcement ratio and impact load sequence. Two beams namely SS0a-1 and
SS1a-1 are selected for the simulations in LS-DYNA. From the results, the simulation
outputs match considerably well with the experimental data, although there are slight
differences between the results which might be due to the errors in the experiment or
errors in finite element analysis as explained previously. The first objective of the
study is to simulate the impact on reinforced concrete beam and determine its failure
mode. From the contour of plastic strain shown in the result section, the contours
spreading out diagonally from the point of impact. This indicates diagonal shear cracks
are likely to be formed on the concrete beam. In other words, reinforced concrete
beams subject to impact tends to fail in shear due to high dynamic loading.
Besides that, the study also aims to evaluate the behaviour of reinforced concrete
beams under impact loading. This is explained in terms of the beam displacement as
well as the reinforcement strain. In general, the peak displacement and reinforcement
strain occur at the instance when impactor hits the beam. Then, the displacement and
reinforcement strain reduce over time due to damping force of the beam and eventually

42
leave some residual displacement and strain as the beam and reinforcement have
exceeded the plastic region of material. High strain rate due to impact loading causes
strength enhancement in the concrete and steel reinforcement. This enhancement
allows the structural members to sustain higher stress beyond their ultimate resistance
under static loading.
This study focuses on two reinforced concrete beams from the experiment which one
contains longitudinal reinforcement only while the other contains certain ratio of
additional reinforcement in the transverse direction or stirrups. The behaviour of
reinforced concrete beams are also analysed from their displacement and
reinforcement strain. To have a deeper understanding on the beam behaviour, other
aspects of the beam can be assessed such as the acceleration and support reactions on
the beam. Also, the failure mode of this study was determined by looking at the contour
of plastic strain of concrete. This might not give a clear indication on the crack pattern.
Therefore, it is recommended to include an erosion function to the concrete model in
LS-DYNA. This allows the elements which have exceeded the failure criteria to be
deleted from the model and the cracks can be seen in the post-processing software. To
do that, a finer mesh in the order of crack width will be needed. On the other hand, the
study of reinforced concrete structures under impact loading is useful in the design of
reinforced concrete members subject to accidental load. For example, vehicles collide
with car park columns or bridge piers. As a continuation of this research, a vehicle
model can replace the rigid steel impactor to analyse the response of reinforced
concrete column collided by vehicles. This makes a great contribution to the society
as the failure of these members may lead to severe consequences. In conclusion, the
simulation is successful and the objectives are achieved.

43
REFERENCES
Adhikary, S. D., Li, B., & Fujikake, K. (2013). Strength and behavior in shear of
reinforced concrete deep beams under dynamic loading conditions. Nuclear
Engineering and Design, 259, 14-28. doi: 10.1016/j.nucengdes.2013.02.016
Allemang, R., de Clerck, J., Niezrecki, C., & Wicks, A. (2013). Special Topics in
Structural Dynamics. Paper presented at the 31st IMAC, A Conference and
Exposition on Structural Dynamics.
Bala, S., & Day, J. (2004). General Guidelines for Crash Analysis in LS-DYNA. from
Livermore Software Technology Corporation
Bischoff, P. H., & Perry, S. H. (1991). Compressive Behaviour of Concrete at High
Strain Rates. Materials and Structures, 24(6), 425-450. doi:
10.1007/BF02472016
Chen, W. F., & Saleeb, A. F. (2013). Constitutive Equations for Engineering Materials:
Elasticity and Modeling: Elsevier Science.
Chopra, A. K. (2001). Dynamics of Structures: Theory and Applications to Earthquake
Engineering: Tsinghua University Press.
Comite Euro-International du Beton. (1990). CEB-FIP Model Code Material
Properties. UK: Thomas Telford Services Ltd.
Dallas-News. (2002). Retrieved October, 17, 2014, from
http://www.dallasnews.com/latestnews/stories/090802dnmetrichland.1368b8
4.html
El-Tawil, S., Severino, E., & Fonseca, P. (2005). Vehicle collision with bridge piers.
Journal of Bridge Engineering, 10(3), 345-353.
Fallah, A. S., & Louca, L. A. (2007). Pressure–impulse diagrams for elastic-plastic-
hardening and softening single-degree-of-freedom models subjected to blast
loading. International Journal of Impact Engineering, 34(4), 823-842. doi:
10.1016/j.ijimpeng.2006.01.007
Ferrer, B., Ivorra, S., Segovia, E., & Irles, R. (2010). Tridimensional modelization of
the impact of a vehicle against a metallic parking column at a low speed.
Engineering Structures, 32(8), 1986-1992. doi:
10.1016/j.engstruct.2010.02.032
Hallquist, J. O. (2006). LS-DYNA theory manual. Livermore Software Technology
Corporation, 3.
Hallquist, J. O. (2007). LS-DYNA keyword user’s manual. Livermore Software
Technology Corporation, 970.

44
Hendriks, M. A. N., & Rots, J. A. (2002). Finite Elements in Civil Engineering
Applications. Paper presented at the the Third Diana World Conference, Tokyo,
Japan.
Jong, I. C., & Springer, W. T. (2009). Teaching von Mises Stress: From Principal Axes
to Non-Principal Axes. American Society for Engineering Education.
Li, Q. M., & Meng, H. (2003). About the dynamic strength enhancement of concrete-
like materials in a split Hopkinson pressure bar test. International Journal of
Solids and Structures, 40(2), 343-360. doi: http://dx.doi.org/10.1016/S0020-
7683(02)00526-7
LSTC. (n.d.). Hourglass. LS-DYNA Support, from LSTC Inc.
http://www.dynasupport.com/howtos/element/hourglass
Malvar, L. J., & Crawford, J. E. (1998). Dynamic Increase Factors for Concrete: Naval
Facilities Engineering Service Center.
Miyamoto, A., King, M. W., & Bulson, P. S. (1994). Modelling of impact load
characteristics for dynamic response analysis of concrete structures. Structures
under shock and impact II, 71-88.
Nebraska Overpass Will Be Rebuilt With Fewer Piers. (2003). Engineering News-
Record, 250.
Ožbolt, J., & Sharma, A. (2011). Numerical simulation of reinforced concrete beams
with different shear reinforcements under dynamic impact loads. International
Journal of Impact Engineering, 38(12), 940-950. doi:
10.1016/j.ijimpeng.2011.08.003
Paik, J. K., & Thayamballi, A. K. (2003). Dynamic Yield Strength - the Cowper-
Symonds Equations Ultimate Limit State Design of Steel-Plated Structures (pp.
356). UK: John Wiley & Sons.
Remennikov, A., & Kaewunruen, S. (2006). Impact Resistance of RC Columns -
Experimental Studies and Design Considerations. Paper presented at the 19th
Australasian Conference on the Mechanics of Structures and Materials, New
Zealand.
Saatci, S. (2007). Behaviour and Modelling of Reinforced Concrete Structures
Subjected to Impact Loads. (Doctor of Philosophy), University of Toronto.
Saatci, S., & Vecchio, F. J. (2009a). Effects of Shear Mechanisms on Impact
Behaviour of Reinforced Concrete Beams. ACI Structral Journal, 106(1), 78-
86.
Saatci, S., & Vecchio, F. J. (2009b). Nonlinear Finite Element Modeling of RC
Structures under Impact Loads. ACI Structral Journal, 105(5), 717-725.
Said, M., & Elrakib, T. M. (2013). Enhancement of shear strength and ductility for
reinforced concrete wide beams due to web reinforcement. HBRC Journal, 9(3),
235-242. doi: 10.1016/j.hbrcj.2013.05.011

45
Schwer, L. E., & Malvar, L. J. (2005). Simplified Concrete Modelling with
MAT_CONCRETE_DAMAGE_REL3. Paper presented at the LS-DYNA
Anwenderforum, Bamberg.
Sharma, H., Hurlebaus, S., & Gardoni, P. (2009). A Probabilistic Model for the
Estimation of Shear Capacity of Bridge Piers Subjected to Dynamic Loading.
Paper presented at the Structures Congress 2009, Austin, Texas, United States.
Sharma, H., Hurlebaus, S., & Gardoni, P. (2012). Performance-based response
evaluation of reinforced concrete columns subject to vehicle impact.
International Journal of Impact Engineering, 43(0), 52-62. doi:
10.1016/j.ijimpeng.2011.11.007
Singh, A. K. (2007). Mechanics of Solids: PHI Learning.
Tachibana, S., Masuya, H., & Nakamura, S. (2010). Performance based design of
reinforced concrete beams under impact. Natural Hazards and Earth System
Science, 10(6), 1069-1078. doi: 10.5194/nhess-10-1069-2010
Tekkaya, A. E., & Martins, P. A. F. (2009). Accuracy, reliability and validity of finite
element analysis in metal forming: a user's perspective. Engineering
Computations, 26(8), 1026-1055. doi: 10.1108/02644400910996880,
10.1108/02644400410554371
Wu, K.-C., Li, B., & Tsai, K.-C. (2011). Residual axial compression capacity of
localized blast-damaged RC columns. International Journal of Impact
Engineering, 38(1), 29-40. doi: 10.1016/j.ijimpeng.2010.09.002
Wu., Y., Crawford, J. E., Shengrui, L., & Magallanes, J. M. (2014). Validation Studies
for Concrete Constitutive Models with Blast Test Data. Paper presented at the
13th International LS-DYNA Users Conference, Dearborn, Michigan.
Zaouk, A. K., Bedewi, N. E., Kan, C.-D., & Marzougui, D. (1996). Validation of a
non-linear finite element vehicle model using multiple impact data. ASME
APPLIED MECHANICS DIVISION-PUBLICATIONS-AMD, 218, 91-106.

46
APPENDICES
APPENDIX 1: DYNAMIC INCREASE FACTOR FOR CONCRETE
TABLE A.1 Enhancement Factors for SS0a-1 Beam.
Strain Rate (1/ms) Enhancement
-3.00E-01 9.370517155
-1.00E-01 6.497153716
-3.00E-02 4.349408779
-1.00E-02 3.015711614
-3.00E-03 2.018816722
-1.00E-03 1.399769335
-1.00E-04 1.323468866
-1.00E-05 1.251327484
-1.00E-06 1.183118479
-1.00E-07 1.1186275
-1.00E-08 1.05765188
0.0E+00 1
3.00E-08 1
1.00E-07 1.024967733
1.00E-06 1.074467599
1.00E-05 1.126358016
1.00E-04 1.180754433
1.00E-03 1.237777873
3.00E-03 1.265947373
1.00E-02 1.297555209
3.00E-02 1.327085128
1.00E-01 1.982401864
3.00E-01 2.859118236

47
a) Tension
b) Compression
FIGURE A.1 Enhancement Curve for Concrete – SS0a-1.
0
1
2
3
4
5
6
7
8
9
10
1E-08 0.0000001 0.000001 0.00001 0.0001 0.001 0.01 0.1 1
DIF
Strain Rate (1/ms)
Graph of DIF vs Strain Rate
0
0.5
1
1.5
2
2.5
3
3.5
1.00E-08 1.00E-07 1.00E-06 1.00E-05 1.00E-04 1.00E-03 1.00E-02 1.00E-01 1.00E+00
DIF
Strain Rate (1/ms)
Graph of DIF vs Strain Rate

48
TABLE A.2 Enhancement Factors for SS1a-1 Beam.
Strain Rate (1/ms) Enhancement
-3.00E-01 9.748279601
-1.00E-01 6.759079567
-3.00E-02 4.524750574
-1.00E-02 3.137286824
-3.00E-03 2.100203174
-1.00E-03 1.456199549
-1.00E-04 1.367783657
-1.00E-05 1.284736102
-1.00E-06 1.206730935
-1.00E-07 1.133461998
-1.00E-08 1.064641723
0.0E+00 1
3.00E-08 1
1.00E-07 1.027687354
1.00E-06 1.082792083
1.00E-05 1.140851535
1.00E-04 1.202024142
1.00E-03 1.266476832
3.00E-03 1.298435247
1.00E-02 1.334385483
3.00E-02 1.368057513
1.00E-01 2.043606478
3.00E-01 2.947390564

49
a) Tension
b) Compression
FIGURE A.2 Enhancement Curve for Concrete – SS1a-1.
0
2
4
6
8
10
12
1E-08 0.0000001 0.000001 0.00001 0.0001 0.001 0.01 0.1 1
DIF
Strain Rate (1/ms)
Graph of DIF vs Strain Rate
0
0.5
1
1.5
2
2.5
3
3.5
1.00E-08 1.00E-07 1.00E-06 1.00E-05 1.00E-04 1.00E-03 1.00E-02 1.00E-01 1.00E+00
DIF
Strain Rate (1/ms)
Graph of DIF vs Strain Rate