Embed Size (px)
Citation preview
Computational Materials Science 79 (2013) 143–158
Contents lists available at SciVerse ScienceDirect
Computational Materials Science
journal homepage: www.elsevier .com/locate /commatsci
Finite element modelling of fibrous networks: Analysis of straindistribution in fibres under tensile load
0927-0256/$ - see front matter Crown Copyright � 2013 Published by Elsevier B.V. All rights reserved.http://dx.doi.org/10.1016/j.commatsci.2013.04.063
⇑ Corresponding author. Present address: Department of Metallurgy and MaterialEngineering (MTM), KU Leuven, Kasteelpark Arenberg 44 bus 2450, B-3001Heverlee (Leuven), Belgium. Tel.: +32 488197336.
E-mail address: [email protected] (B. Sabuncuoglu).
Baris Sabuncuoglu ⇑, Memis Acar, Vadim V. SilberschmidtWolfson School of Mechanical and Manufacturing Engineering, Loughborough University, LE11 3TU Leicestershire, UK
a r t i c l e i n f o
Article history:Received 3 January 2013Received in revised form 7 April 2013Accepted 29 April 2013Available online 5 July 2013
Keywords:Finite-element methodTrue strainFibrous networkOrientation distributionNonwovens
a b s t r a c t
Deformation behaviour of networks formed by bonded fibres presents significant challenges to specialistsin mechanics of materials. In this paper, distribution of fibre strains in a fibrous network was evaluatedfor various strain levels using an example of a thermally bonded nonwoven material under a tensile load.The study started with the analysis of a reference model of a network with bond points, which is free ofthe effect of complex material behaviour and orientation distribution of fibres. At the subsequent stage,changes in various parameters such as material properties of fibres and fibre length were added sepa-rately into a parametric finite-element model to study their effect on the distribution of strains. Theobtained results elucidate the reasons for non-uniformity of fibre-strain distribution under uniform load-ing conditions. In addition, it was shown that the type of arrangement of bond points, the length andmaterial behaviour of fibres play a crucial role in the character of distribution of strains. At the end ofthe study, some suggestions are given on the way to obtain a homogeneous distribution of strainsthroughout the nonwoven structure.
Crown Copyright � 2013 Published by Elsevier B.V. All rights reserved.
1. Introduction
Fibrous networks are widely encountered in various areas, engi-neering and biological systems being obvious examples. Typicalengineering materials formed by such networks are rubber, cellu-lose, paper and nonwoven products. In biological systems, varioustissues of animals and humans are made of fibrous networks at dif-ferent length scales. Tendons, cartilage and eye cornea are typicalexamples of these [1].
The mechanical response of such materials to external loads atmacroscopic scale is governed by the behaviour of fibres in the net-work, which is distinguished at a smaller spatial scale. Due to theirrandom structure and discontinuous character, analysing themechanical behaviour of these networks has been a very challeng-ing task for specialists in mechanics of solids. Demirci et al. [2] sug-gested a methodology to determine the anisotropic parameters of afibrous network, which governs the mechanical response of theglobal structure. They later used these properties to simulate thetensile behaviour of nonwoven materials with a very good accu-racy compared to tests for different material directions [3]. Barbieret al. [4] studied the mechanics of entangled semi-flexible fibres bydiscretizing each fibre by a small number of segments. It was
claimed that the friction plays a minor role in the mechanical re-sponse of fibrous networks. Lee et al. [5] developed a computa-tional model to simulate the damage evolution in random fibrecomposites. The crack-growth phase of the model provided accu-rate predictions whereas its crack-nucleation phase resulted insome differences with the real behaviour.
Thermally calendar-bonded nonwovens are a type of fibrousnetwork encountered as various types of consumer and industrialproducts; their purposes are mainly for hygiene and filtration [6].These materials are manufactured by means of feeding the formedweb of fibres to the calendar, where it is condensed in the rollergap between two driven and heated rollers and melted at the con-tact points within a very short period of time [7]. In order to sim-ulate the mechanical behaviour of low-density nonwovenmaterials that are characterised by a high effect of discontinuitiesand randomness in distribution of fibres, a computational proce-dure was developed in [8]. Using this procedure, finite elementmodels of thermally bonded nonwovens can be generated accord-ing to various manufacturing parameters. Parametric studies withthe model showed its efficiency to simulate the tensile behaviourof nonwovens and analyse the effect of manufacturing parameterson it [9].
One of general requirements for fibrous networks is a homoge-neous distribution of strains and stresses over individual fibres inorder to improve structural integrity of the global network.However, one of the conclusions resulting from the previous stud-ies is a wide range of strain distributions observed in fibres even
144 B. Sabuncuoglu et al. / Computational Materials Science 79 (2013) 143–158
under macroscopically uniform external loading conditions. Whilesome fibres were exposed to low strains, others had a strain valueeven higher than the global strain applied to the entire fabric. Thiscan lead to early fracture of fibres, and progressive fracture cancause the failure of the entire fibrous network much earlier thanexpected.
In this study, the mechanisms affecting strain distributions in fi-brous networks under tensile load were discussed by using the dis-continuous nonwoven model developed in [8]. The study startswith the analysis of a reference model, employing a simplifiedmaterial behaviour, constant orientation of fibres and rigid bondpoints. This reference model was introduced to understand thecontribution of each individual parameter to the distribution ofstrains avoiding coupling effects. At the next stage, changes inparameters such as material properties, length of fibres and dimen-sions of bond point were introduced individually into the referencemodel in order to analyse the effect of each on the strain distribu-tion of fibres. Finally, a nonwoven material with a random fibrousnetwork was analysed, and its mechanical behaviour was com-pared with that of the reference model.
In most of the deformational scenarios presented here, fibresand/or bond points of a real material would be damaged beforethe maximum level of stretching analysed in simulations wouldbe reached. Obviously, that would change the strain distributionthroughout the structure; in addition, the structure itself wouldchange. However, it would be very difficult to elucidate these com-plex cases of damage-affected strain distributions without under-standing the main deformation mechanisms; hence, thenumerical analysis of fibrous networks without account for dam-age was the main focus of analysis at this stage. Therefore, in thisstudy, fibres and bond points were assumed free of damage in or-der to exclude the complex material behaviour.
2. Methodology
2.1. Reference model
The starting point of the analysis is a reference model that dif-fers from the real nonwoven materials, as discussed above. Such afinite-element model is used to understand the behaviour of or-dered fibrous bonded networks with simple mechanical propertiesof its constituents to serve as a reference point for more adequatemodels of materials with random distribution of fibres. The refer-ence model has the following features:
� All the fibres were modelled oriented along the so calledmachine direction (MD) of the nonwoven.� Linear elastic properties were assigned to fibres.
Fig. 1. The finite element implementation of reference nonwoven model.
� Bond points were arranged as in the real sample of nonwovenpresented in [10].� Bond points were modelled as rigid bodies in order to avoid
their deformation to interact with fibre investigated strains. Inorder to do this, a very high value of Young’s modulus wasassigned to the bond-point elements. The effect of bond-pointstiffness was also analysed in this study.� Fibres were modelled as continuous (with infinite length).
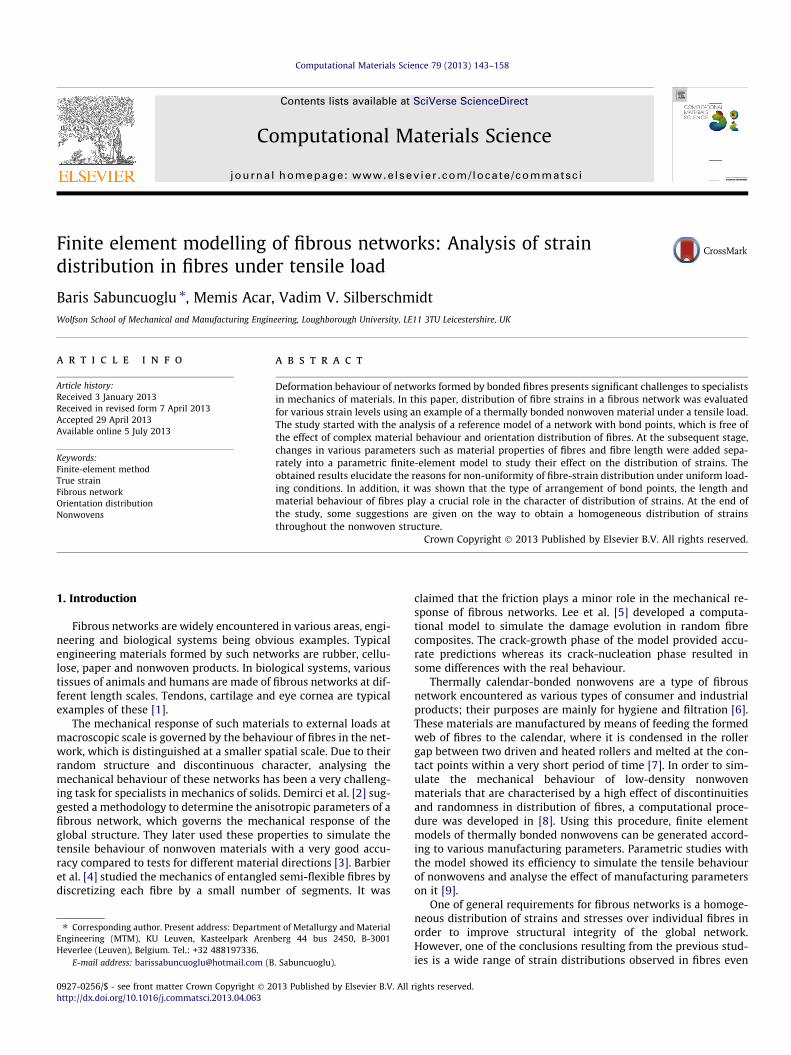
The finite-element implementation of the reference model isshown in Fig. 1. The model consists of 1759 truss elements repre-senting fibres and 6672 shell elements representing continuousbond-point structures. The other details related the modelling pro-cedure were presented in [8].
2.2. Tensile loading
The distribution of strains in fibres was analysed with respect tointervals of fabric strain. As the true stain and engineering straindiffers significantly for large-deformation cases that can be ob-served in the studied networks, it was aimed to obtain the resultsfor specific intervals of fabric’s true strain in order to be able tocompare them with fibre strains. Acquiring results in numericalsimulations would be convenient if the level of true strain of thefabric was increased with a constant rate. This was achieved byincreasing the deformation rate gradually according to relationsthat take into account the well-known equation that links truestrain with engineering one:
eeng ¼ expðetrueÞ � 1; ð1Þ
u ¼ eenggl; ð2Þ
Fig. 2. Evolution of fabric strain with constant true-strain rate.
Table 1Fibre strain groups for various intervals of true strain.
Strain group Interval
�1 etrue < 00 0 6 etrue < 0:0251 0:025 6 etrue < 0:0502 0:050 6 etrue < 0:0753 0:075 6 etrue < 0:1
. . . . . .
48 1:200 6 etrue < 1:47549 1:225 6 etrue
Fig. 3. Distribution of strains for fibres for various values of fabric strain (reference model): (a) 0–0.4; and (b) 0.4–0.8.
Fig. 4. Strain distribution of fibres in fabric at fabric strain of 0.1.
B. Sabuncuoglu et al. / Computational Materials Science 79 (2013) 143–158 145
where eeng and etrue are the engineering and true strains, respec-tively; gl is the gage length of fabric and u is the displacement ap-plied to the model. The deformation of fabric with this
methodology is shown in Fig. 2 in which the true-strain rate washeld constant. The results were obtained for true-strain incrementsof 0.1 (marked as X in Fig 2.)
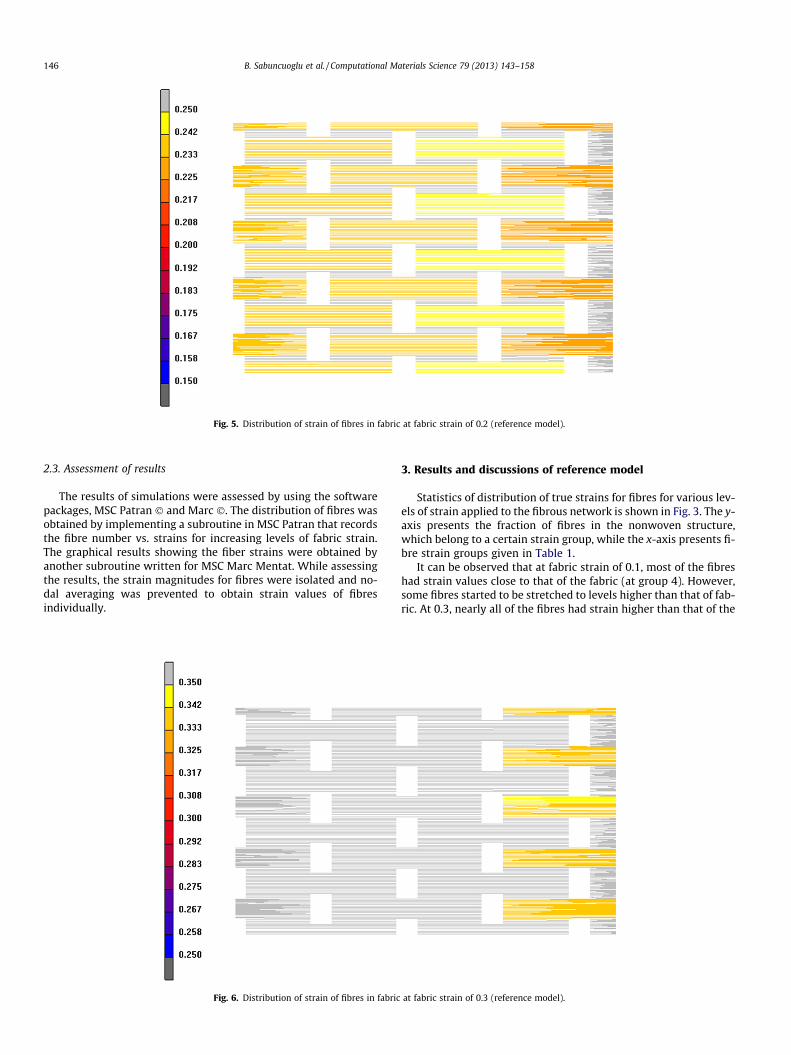
Fig. 5. Distribution of strain of fibres in fabric at fabric strain of 0.2 (reference model).
146 B. Sabuncuoglu et al. / Computational Materials Science 79 (2013) 143–158
2.3. Assessment of results
The results of simulations were assessed by using the softwarepackages, MSC Patran � and Marc �. The distribution of fibres wasobtained by implementing a subroutine in MSC Patran that recordsthe fibre number vs. strains for increasing levels of fabric strain.The graphical results showing the fiber strains were obtained byanother subroutine written for MSC Marc Mentat. While assessingthe results, the strain magnitudes for fibres were isolated and no-dal averaging was prevented to obtain strain values of fibresindividually.
Fig. 6. Distribution of strain of fibres in fabric
3. Results and discussions of reference model
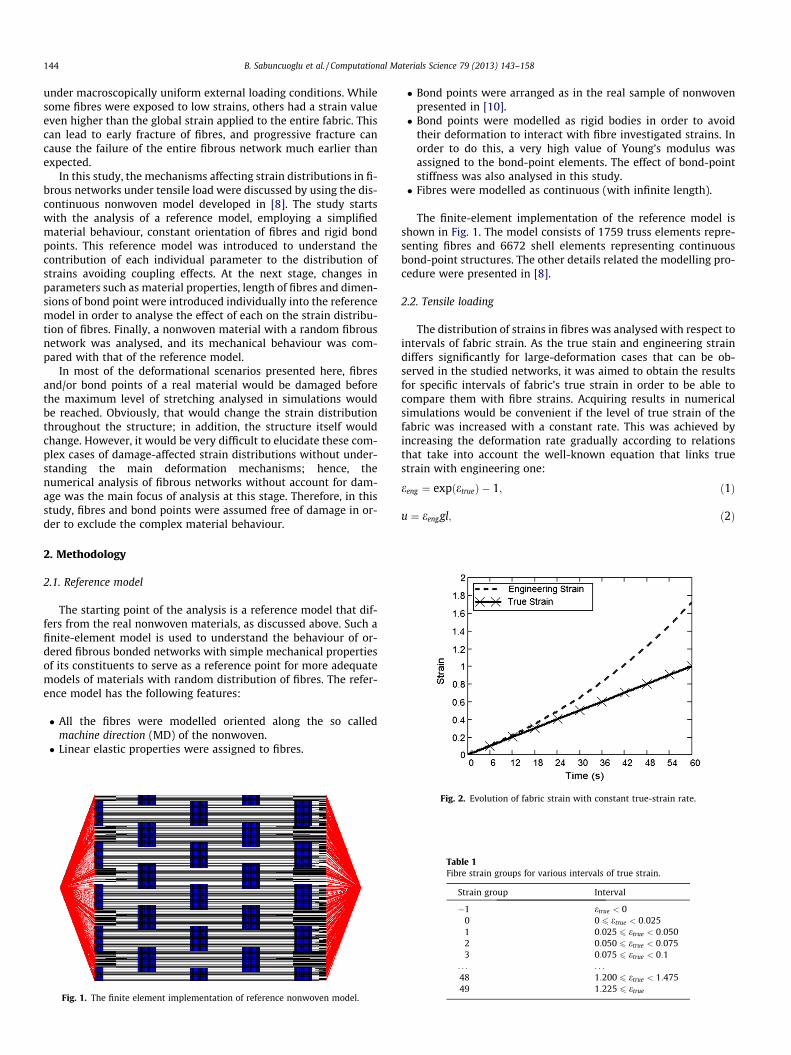
Statistics of distribution of true strains for fibres for various lev-els of strain applied to the fibrous network is shown in Fig. 3. The y-axis presents the fraction of fibres in the nonwoven structure,which belong to a certain strain group, while the x-axis presents fi-bre strain groups given in Table 1.
It can be observed that at fabric strain of 0.1, most of the fibreshad strain values close to that of the fabric (at group 4). However,some fibres started to be stretched to levels higher than that of fab-ric. At 0.3, nearly all of the fibres had strain higher than that of the
at fabric strain of 0.3 (reference model).
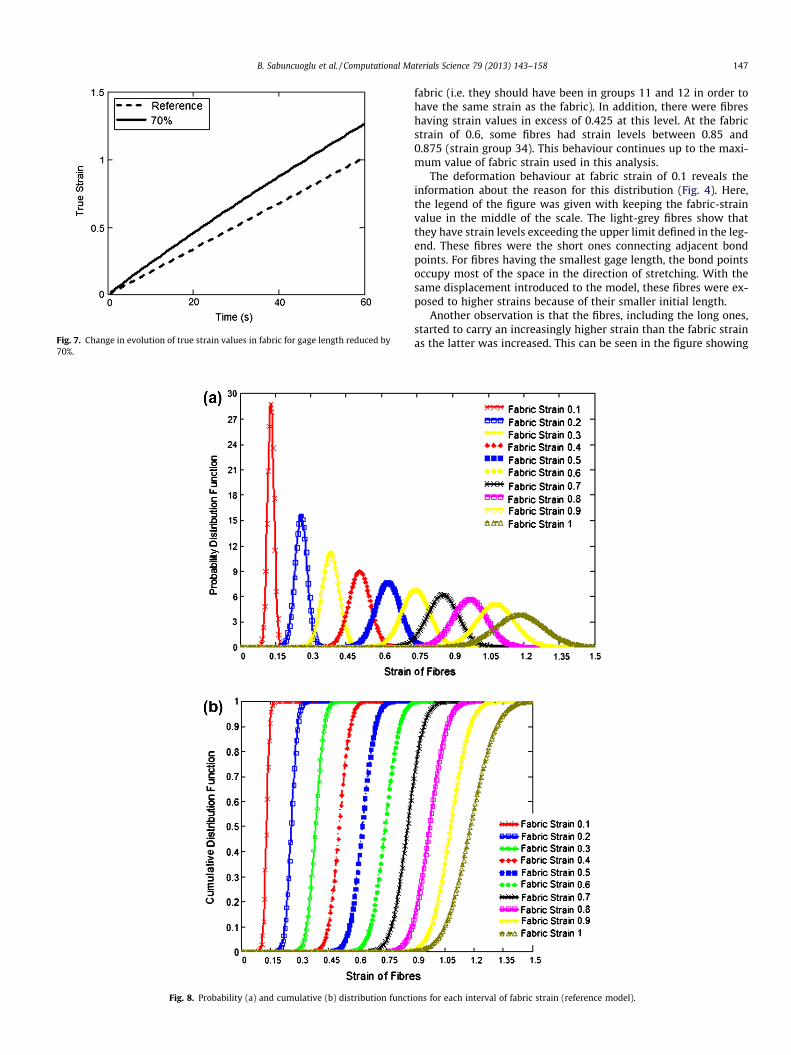
Fig. 7. Change in evolution of true strain values in fabric for gage length reduced by70%.
Fig. 8. Probability (a) and cumulative (b) distribution functi
B. Sabuncuoglu et al. / Computational Materials Science 79 (2013) 143–158 147
fabric (i.e. they should have been in groups 11 and 12 in order tohave the same strain as the fabric). In addition, there were fibreshaving strain values in excess of 0.425 at this level. At the fabricstrain of 0.6, some fibres had strain levels between 0.85 and0.875 (strain group 34). This behaviour continues up to the maxi-mum value of fabric strain used in this analysis.
The deformation behaviour at fabric strain of 0.1 reveals theinformation about the reason for this distribution (Fig. 4). Here,the legend of the figure was given with keeping the fabric-strainvalue in the middle of the scale. The light-grey fibres show thatthey have strain levels exceeding the upper limit defined in the leg-end. These fibres were the short ones connecting adjacent bondpoints. For fibres having the smallest gage length, the bond pointsoccupy most of the space in the direction of stretching. With thesame displacement introduced to the model, these fibres were ex-posed to higher strains because of their smaller initial length.
Another observation is that the fibres, including the long ones,started to carry an increasingly higher strain than the fabric strainas the latter was increased. This can be seen in the figure showing
ons for each interval of fabric strain (reference model).
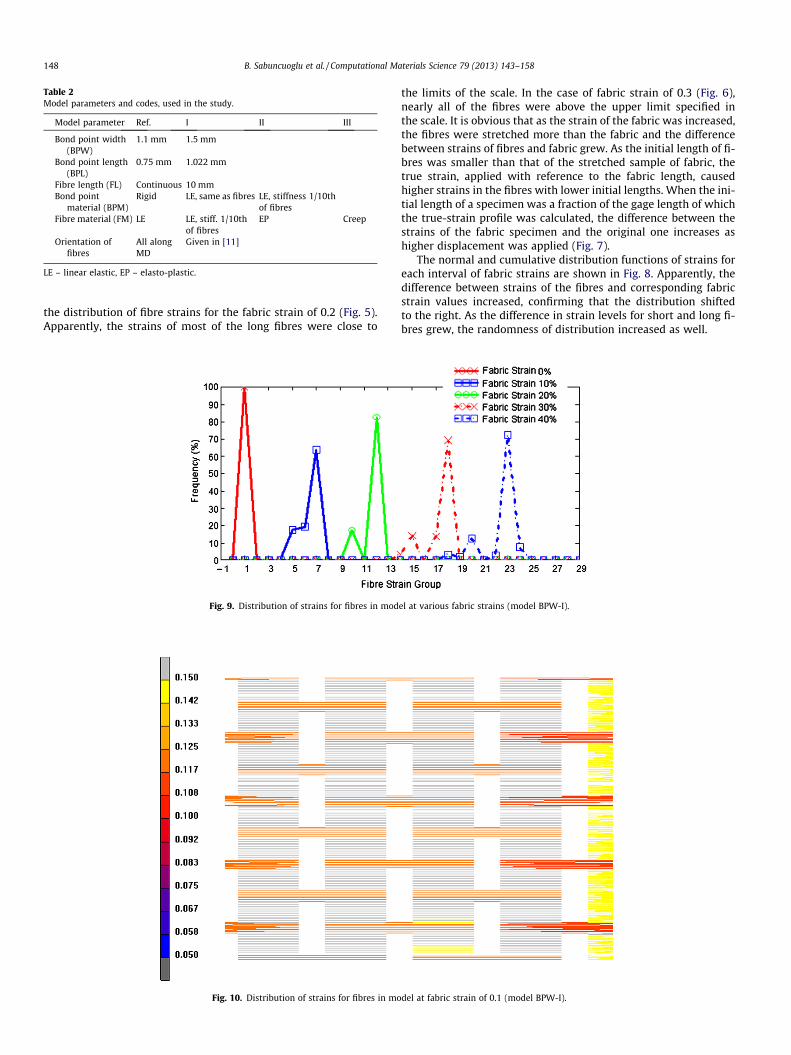
Table 2Model parameters and codes, used in the study.
Model parameter Ref. I II III
Bond point width(BPW)
1.1 mm 1.5 mm
Bond point length(BPL)
0.75 mm 1.022 mm
Fibre length (FL) Continuous 10 mmBond point
material (BPM)Rigid LE, same as fibres LE, stiffness 1/10th
of fibresFibre material (FM) LE LE, stiff. 1/10th
of fibresEP Creep
Orientation offibres
All alongMD
Given in [11]
LE – linear elastic, EP – elasto-plastic.
148 B. Sabuncuoglu et al. / Computational Materials Science 79 (2013) 143–158
the distribution of fibre strains for the fabric strain of 0.2 (Fig. 5).Apparently, the strains of most of the long fibres were close to
Fig. 9. Distribution of strains for fibres in mod
Fig. 10. Distribution of strains for fibres in mo
the limits of the scale. In the case of fabric strain of 0.3 (Fig. 6),nearly all of the fibres were above the upper limit specified inthe scale. It is obvious that as the strain of the fabric was increased,the fibres were stretched more than the fabric and the differencebetween strains of fibres and fabric grew. As the initial length of fi-bres was smaller than that of the stretched sample of fabric, thetrue strain, applied with reference to the fabric length, causedhigher strains in the fibres with lower initial lengths. When the ini-tial length of a specimen was a fraction of the gage length of whichthe true-strain profile was calculated, the difference between thestrains of the fabric specimen and the original one increases ashigher displacement was applied (Fig. 7).
The normal and cumulative distribution functions of strains foreach interval of fabric strains are shown in Fig. 8. Apparently, thedifference between strains of the fibres and corresponding fabricstrain values increased, confirming that the distribution shiftedto the right. As the difference in strain levels for short and long fi-bres grew, the randomness of distribution increased as well.
el at various fabric strains (model BPW-I).
del at fabric strain of 0.1 (model BPW-I).
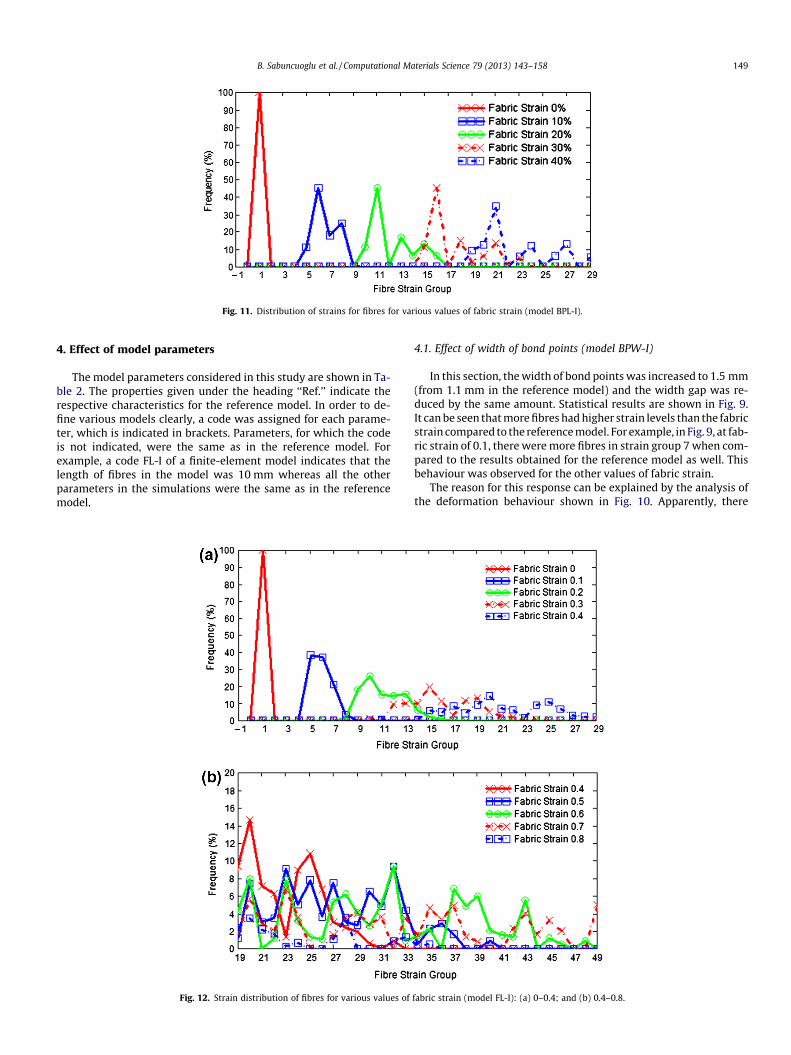
Fig. 11. Distribution of strains for fibres for various values of fabric strain (model BPL-I).
B. Sabuncuoglu et al. / Computational Materials Science 79 (2013) 143–158 149
4. Effect of model parameters
The model parameters considered in this study are shown in Ta-ble 2. The properties given under the heading ‘‘Ref.’’ indicate therespective characteristics for the reference model. In order to de-fine various models clearly, a code was assigned for each parame-ter, which is indicated in brackets. Parameters, for which the codeis not indicated, were the same as in the reference model. Forexample, a code FL-I of a finite-element model indicates that thelength of fibres in the model was 10 mm whereas all the otherparameters in the simulations were the same as in the referencemodel.
Fig. 12. Strain distribution of fibres for various values of
4.1. Effect of width of bond points (model BPW-I)
In this section, the width of bond points was increased to 1.5 mm(from 1.1 mm in the reference model) and the width gap was re-duced by the same amount. Statistical results are shown in Fig. 9.It can be seen that more fibres had higher strain levels than the fabricstrain compared to the reference model. For example, in Fig. 9, at fab-ric strain of 0.1, there were more fibres in strain group 7 when com-pared to the results obtained for the reference model as well. Thisbehaviour was observed for the other values of fabric strain.
The reason for this response can be explained by the analysis ofthe deformation behaviour shown in Fig. 10. Apparently, there
fabric strain (model FL-I): (a) 0–0.4; and (b) 0.4–0.8.
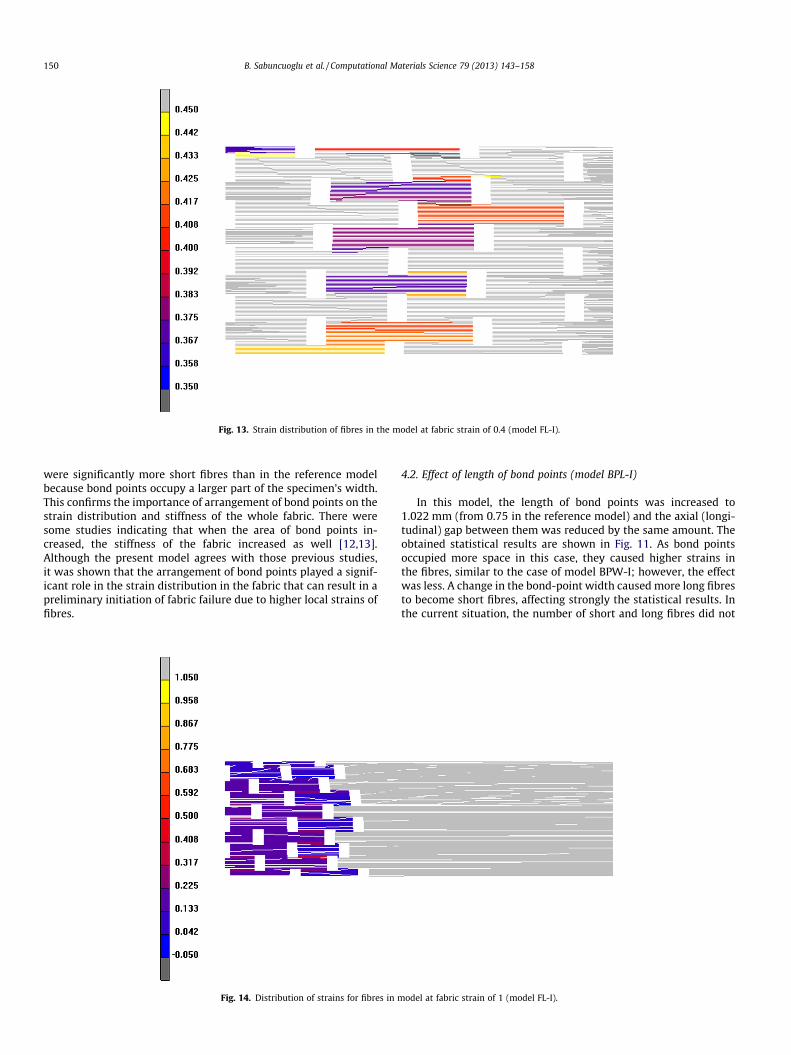
Fig. 13. Strain distribution of fibres in the model at fabric strain of 0.4 (model FL-I).
150 B. Sabuncuoglu et al. / Computational Materials Science 79 (2013) 143–158
were significantly more short fibres than in the reference modelbecause bond points occupy a larger part of the specimen’s width.This confirms the importance of arrangement of bond points on thestrain distribution and stiffness of the whole fabric. There weresome studies indicating that when the area of bond points in-creased, the stiffness of the fabric increased as well [12,13].Although the present model agrees with those previous studies,it was shown that the arrangement of bond points played a signif-icant role in the strain distribution in the fabric that can result in apreliminary initiation of fabric failure due to higher local strains offibres.
Fig. 14. Distribution of strains for fibres in m
4.2. Effect of length of bond points (model BPL-I)
In this model, the length of bond points was increased to1.022 mm (from 0.75 in the reference model) and the axial (longi-tudinal) gap between them was reduced by the same amount. Theobtained statistical results are shown in Fig. 11. As bond pointsoccupied more space in this case, they caused higher strains inthe fibres, similar to the case of model BPW-I; however, the effectwas less. A change in the bond-point width caused more long fibresto become short fibres, affecting strongly the statistical results. Inthe current situation, the number of short and long fibres did not
odel at fabric strain of 1 (model FL-I).
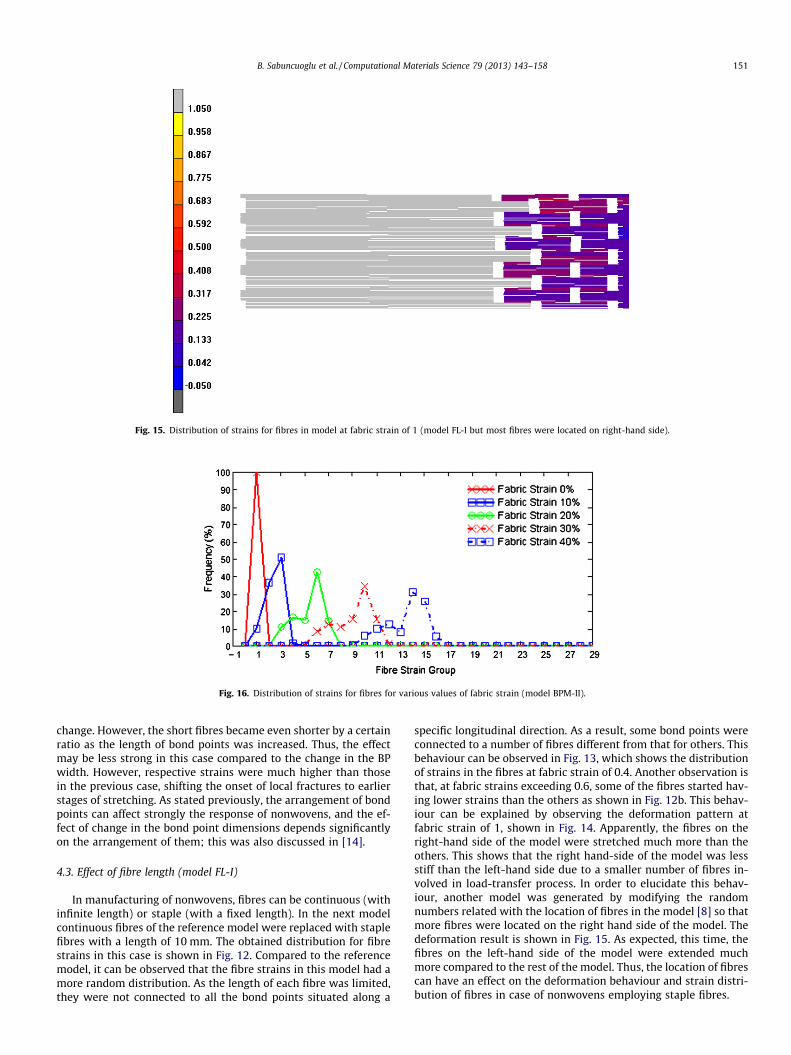
Fig. 15. Distribution of strains for fibres in model at fabric strain of 1 (model FL-I but most fibres were located on right-hand side).
Fig. 16. Distribution of strains for fibres for various values of fabric strain (model BPM-II).
B. Sabuncuoglu et al. / Computational Materials Science 79 (2013) 143–158 151
change. However, the short fibres became even shorter by a certainratio as the length of bond points was increased. Thus, the effectmay be less strong in this case compared to the change in the BPwidth. However, respective strains were much higher than thosein the previous case, shifting the onset of local fractures to earlierstages of stretching. As stated previously, the arrangement of bondpoints can affect strongly the response of nonwovens, and the ef-fect of change in the bond point dimensions depends significantlyon the arrangement of them; this was also discussed in [14].
4.3. Effect of fibre length (model FL-I)
In manufacturing of nonwovens, fibres can be continuous (withinfinite length) or staple (with a fixed length). In the next modelcontinuous fibres of the reference model were replaced with staplefibres with a length of 10 mm. The obtained distribution for fibrestrains in this case is shown in Fig. 12. Compared to the referencemodel, it can be observed that the fibre strains in this model had amore random distribution. As the length of each fibre was limited,they were not connected to all the bond points situated along a
specific longitudinal direction. As a result, some bond points wereconnected to a number of fibres different from that for others. Thisbehaviour can be observed in Fig. 13, which shows the distributionof strains in the fibres at fabric strain of 0.4. Another observation isthat, at fabric strains exceeding 0.6, some of the fibres started hav-ing lower strains than the others as shown in Fig. 12b. This behav-iour can be explained by observing the deformation pattern atfabric strain of 1, shown in Fig. 14. Apparently, the fibres on theright-hand side of the model were stretched much more than theothers. This shows that the right hand-side of the model was lessstiff than the left-hand side due to a smaller number of fibres in-volved in load-transfer process. In order to elucidate this behav-iour, another model was generated by modifying the randomnumbers related with the location of fibres in the model [8] so thatmore fibres were located on the right hand side of the model. Thedeformation result is shown in Fig. 15. As expected, this time, thefibres on the left-hand side of the model were extended muchmore compared to the rest of the model. Thus, the location of fibrescan have an effect on the deformation behaviour and strain distri-bution of fibres in case of nonwovens employing staple fibres.
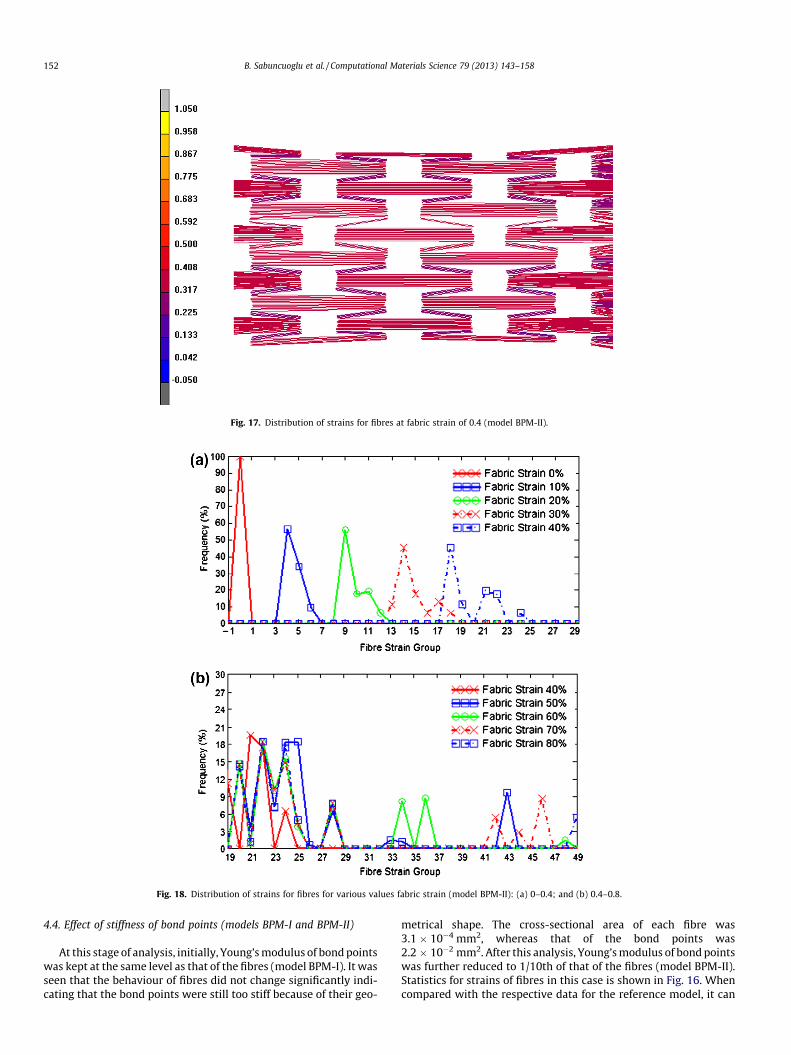
Fig. 17. Distribution of strains for fibres at fabric strain of 0.4 (model BPM-II).
Fig. 18. Distribution of strains for fibres for various values fabric strain (model BPM-II): (a) 0–0.4; and (b) 0.4–0.8.
152 B. Sabuncuoglu et al. / Computational Materials Science 79 (2013) 143–158
4.4. Effect of stiffness of bond points (models BPM-I and BPM-II)
At this stage of analysis, initially, Young’s modulus of bond pointswas kept at the same level as that of the fibres (model BPM-I). It wasseen that the behaviour of fibres did not change significantly indi-cating that the bond points were still too stiff because of their geo-
metrical shape. The cross-sectional area of each fibre was3.1 � 10�4 mm2, whereas that of the bond points was2.2 � 10�2 mm2. After this analysis, Young’s modulus of bond pointswas further reduced to 1/10th of that of the fibres (model BPM-II).Statistics for strains of fibres in this case is shown in Fig. 16. Whencompared with the respective data for the reference model, it can
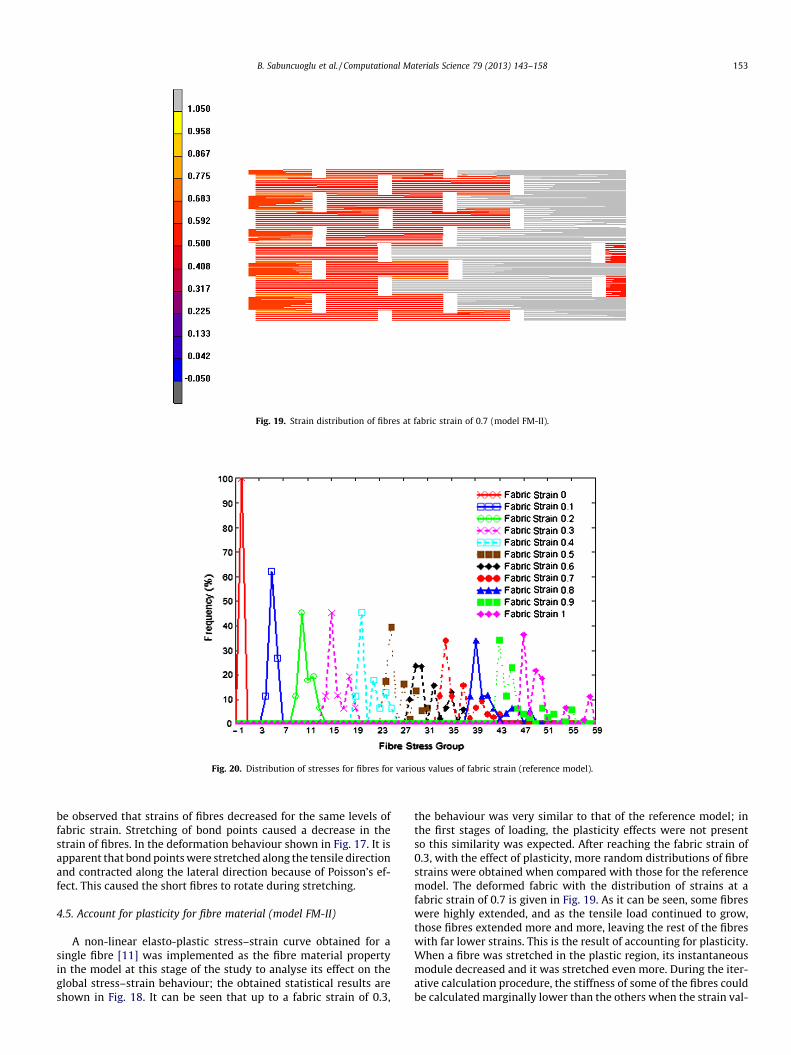
Fig. 19. Strain distribution of fibres at fabric strain of 0.7 (model FM-II).
Fig. 20. Distribution of stresses for fibres for various values of fabric strain (reference model).
B. Sabuncuoglu et al. / Computational Materials Science 79 (2013) 143–158 153
be observed that strains of fibres decreased for the same levels offabric strain. Stretching of bond points caused a decrease in thestrain of fibres. In the deformation behaviour shown in Fig. 17. It isapparent that bond points were stretched along the tensile directionand contracted along the lateral direction because of Poisson’s ef-fect. This caused the short fibres to rotate during stretching.
4.5. Account for plasticity for fibre material (model FM-II)
A non-linear elasto-plastic stress–strain curve obtained for asingle fibre [11] was implemented as the fibre material propertyin the model at this stage of the study to analyse its effect on theglobal stress–strain behaviour; the obtained statistical results areshown in Fig. 18. It can be seen that up to a fabric strain of 0.3,
the behaviour was very similar to that of the reference model; inthe first stages of loading, the plasticity effects were not presentso this similarity was expected. After reaching the fabric strain of0.3, with the effect of plasticity, more random distributions of fibrestrains were obtained when compared with those for the referencemodel. The deformed fabric with the distribution of strains at afabric strain of 0.7 is given in Fig. 19. As it can be seen, some fibreswere highly extended, and as the tensile load continued to grow,those fibres extended more and more, leaving the rest of the fibreswith far lower strains. This is the result of accounting for plasticity.When a fibre was stretched in the plastic region, its instantaneousmodule decreased and it was stretched even more. During the iter-ative calculation procedure, the stiffness of some of the fibres couldbe calculated marginally lower than the others when the strain val-
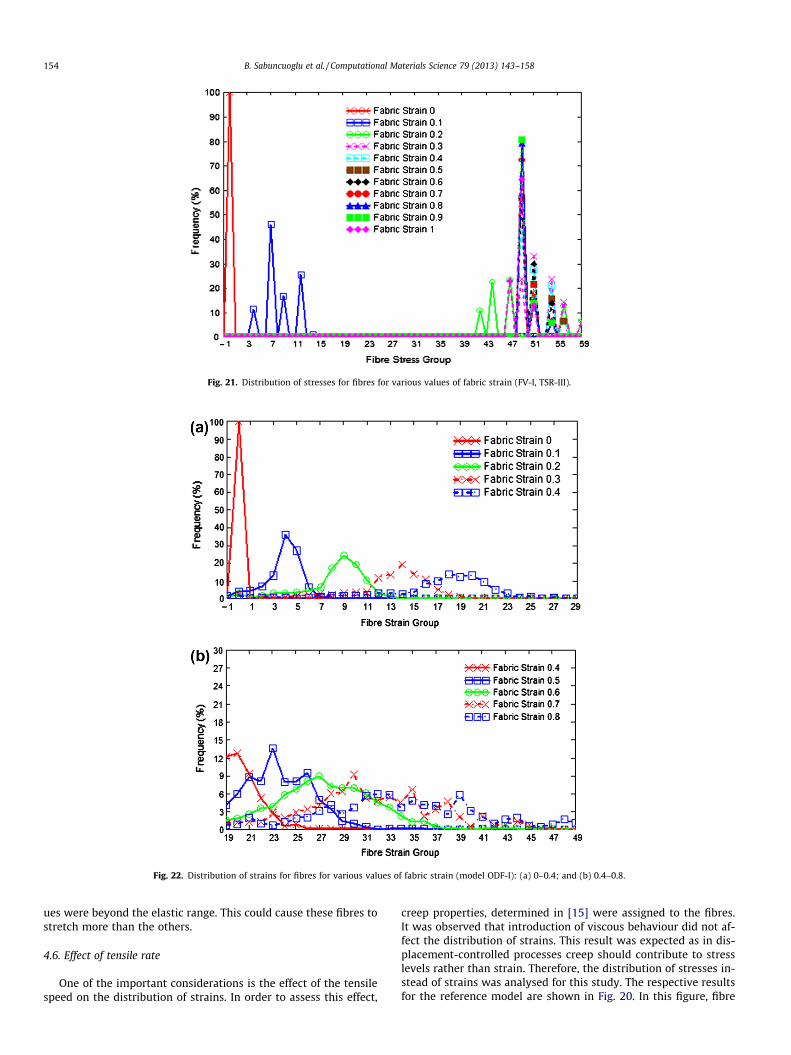
Fig. 21. Distribution of stresses for fibres for various values of fabric strain (FV-I, TSR-III).
Fig. 22. Distribution of strains for fibres for various values of fabric strain (model ODF-I): (a) 0–0.4; and (b) 0.4–0.8.
154 B. Sabuncuoglu et al. / Computational Materials Science 79 (2013) 143–158
ues were beyond the elastic range. This could cause these fibres tostretch more than the others.
4.6. Effect of tensile rate
One of the important considerations is the effect of the tensilespeed on the distribution of strains. In order to assess this effect,
creep properties, determined in [15] were assigned to the fibres.It was observed that introduction of viscous behaviour did not af-fect the distribution of strains. This result was expected as in dis-placement-controlled processes creep should contribute to stresslevels rather than strain. Therefore, the distribution of stresses in-stead of strains was analysed for this study. The respective resultsfor the reference model are shown in Fig. 20. In this figure, fibre
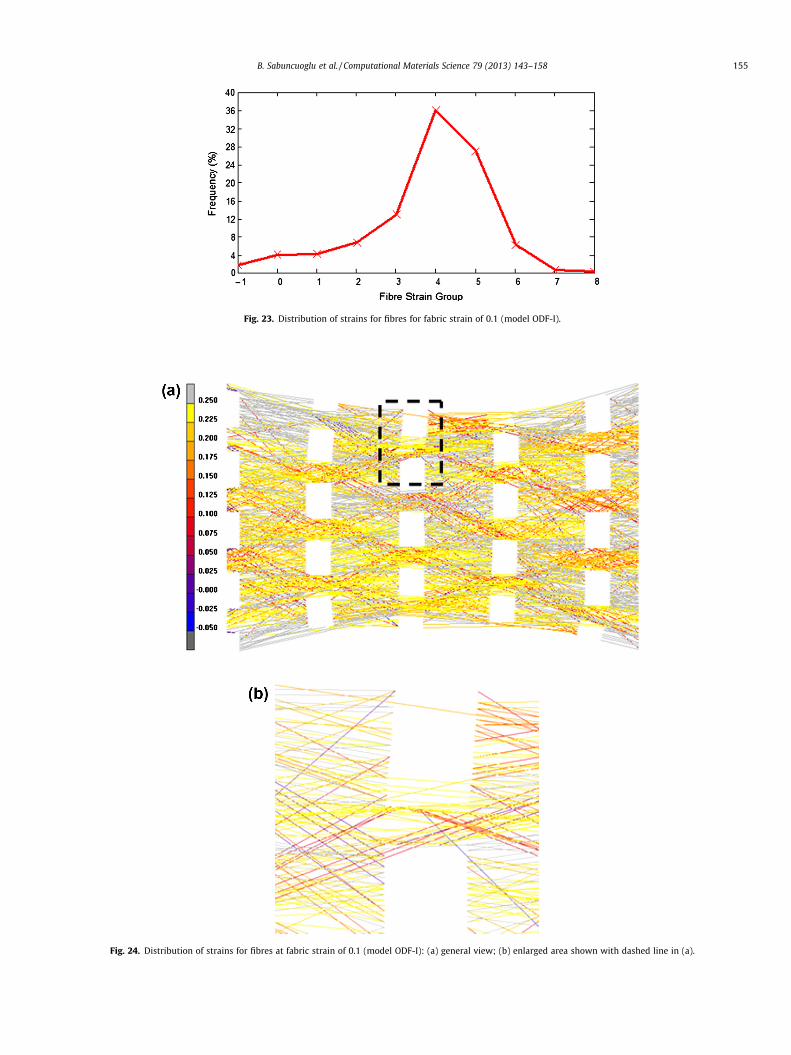
Fig. 23. Distribution of strains for fibres for fabric strain of 0.1 (model ODF-I).
Fig. 24. Distribution of strains for fibres at fabric strain of 0.1 (model ODF-I): (a) general view; (b) enlarged area shown with dashed line in (a).
B. Sabuncuoglu et al. / Computational Materials Science 79 (2013) 143–158 155
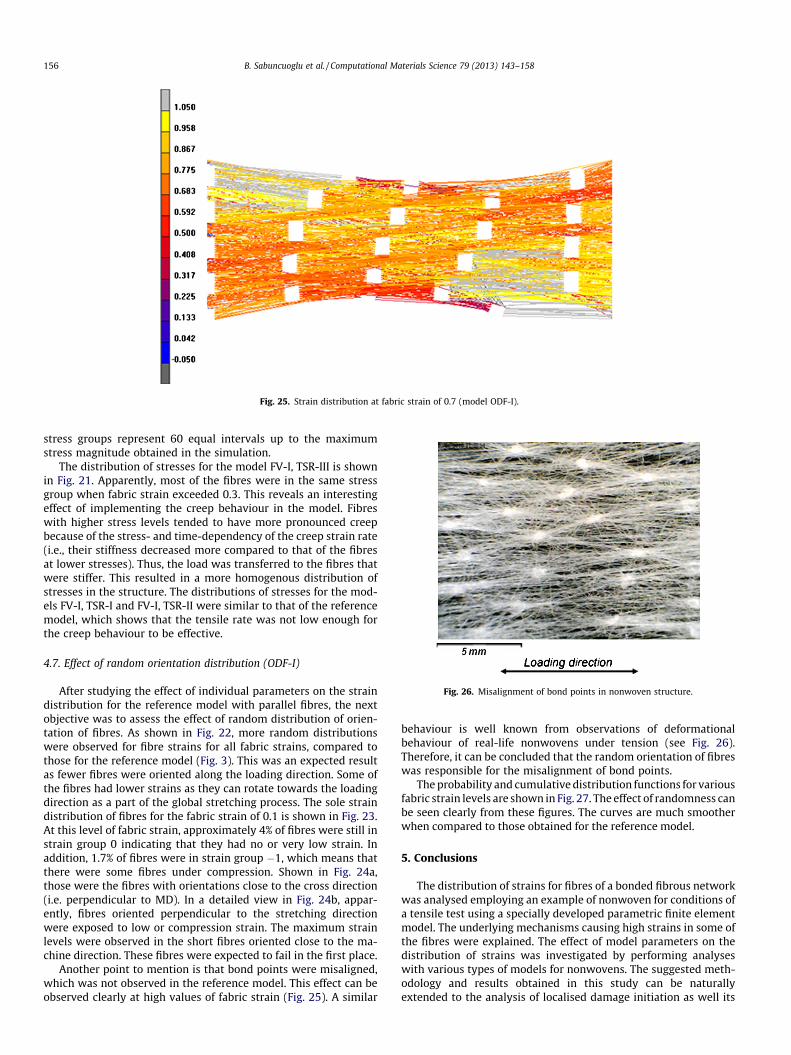
Fig. 25. Strain distribution at fabric strain of 0.7 (model ODF-I).
Fig. 26. Misalignment of bond points in nonwoven structure.
156 B. Sabuncuoglu et al. / Computational Materials Science 79 (2013) 143–158
stress groups represent 60 equal intervals up to the maximumstress magnitude obtained in the simulation.
The distribution of stresses for the model FV-I, TSR-III is shownin Fig. 21. Apparently, most of the fibres were in the same stressgroup when fabric strain exceeded 0.3. This reveals an interestingeffect of implementing the creep behaviour in the model. Fibreswith higher stress levels tended to have more pronounced creepbecause of the stress- and time-dependency of the creep strain rate(i.e., their stiffness decreased more compared to that of the fibresat lower stresses). Thus, the load was transferred to the fibres thatwere stiffer. This resulted in a more homogenous distribution ofstresses in the structure. The distributions of stresses for the mod-els FV-I, TSR-I and FV-I, TSR-II were similar to that of the referencemodel, which shows that the tensile rate was not low enough forthe creep behaviour to be effective.
4.7. Effect of random orientation distribution (ODF-I)
After studying the effect of individual parameters on the straindistribution for the reference model with parallel fibres, the nextobjective was to assess the effect of random distribution of orien-tation of fibres. As shown in Fig. 22, more random distributionswere observed for fibre strains for all fabric strains, compared tothose for the reference model (Fig. 3). This was an expected resultas fewer fibres were oriented along the loading direction. Some ofthe fibres had lower strains as they can rotate towards the loadingdirection as a part of the global stretching process. The sole straindistribution of fibres for the fabric strain of 0.1 is shown in Fig. 23.At this level of fabric strain, approximately 4% of fibres were still instrain group 0 indicating that they had no or very low strain. Inaddition, 1.7% of fibres were in strain group �1, which means thatthere were some fibres under compression. Shown in Fig. 24a,those were the fibres with orientations close to the cross direction(i.e. perpendicular to MD). In a detailed view in Fig. 24b, appar-ently, fibres oriented perpendicular to the stretching directionwere exposed to low or compression strain. The maximum strainlevels were observed in the short fibres oriented close to the ma-chine direction. These fibres were expected to fail in the first place.
Another point to mention is that bond points were misaligned,which was not observed in the reference model. This effect can beobserved clearly at high values of fabric strain (Fig. 25). A similar
behaviour is well known from observations of deformationalbehaviour of real-life nonwovens under tension (see Fig. 26).Therefore, it can be concluded that the random orientation of fibreswas responsible for the misalignment of bond points.
The probability and cumulative distribution functions for variousfabric strain levels are shown in Fig. 27. The effect of randomness canbe seen clearly from these figures. The curves are much smootherwhen compared to those obtained for the reference model.
5. Conclusions
The distribution of strains for fibres of a bonded fibrous networkwas analysed employing an example of nonwoven for conditions ofa tensile test using a specially developed parametric finite elementmodel. The underlying mechanisms causing high strains in some ofthe fibres were explained. The effect of model parameters on thedistribution of strains was investigated by performing analyseswith various types of models for nonwovens. The suggested meth-odology and results obtained in this study can be naturallyextended to the analysis of localised damage initiation as well its
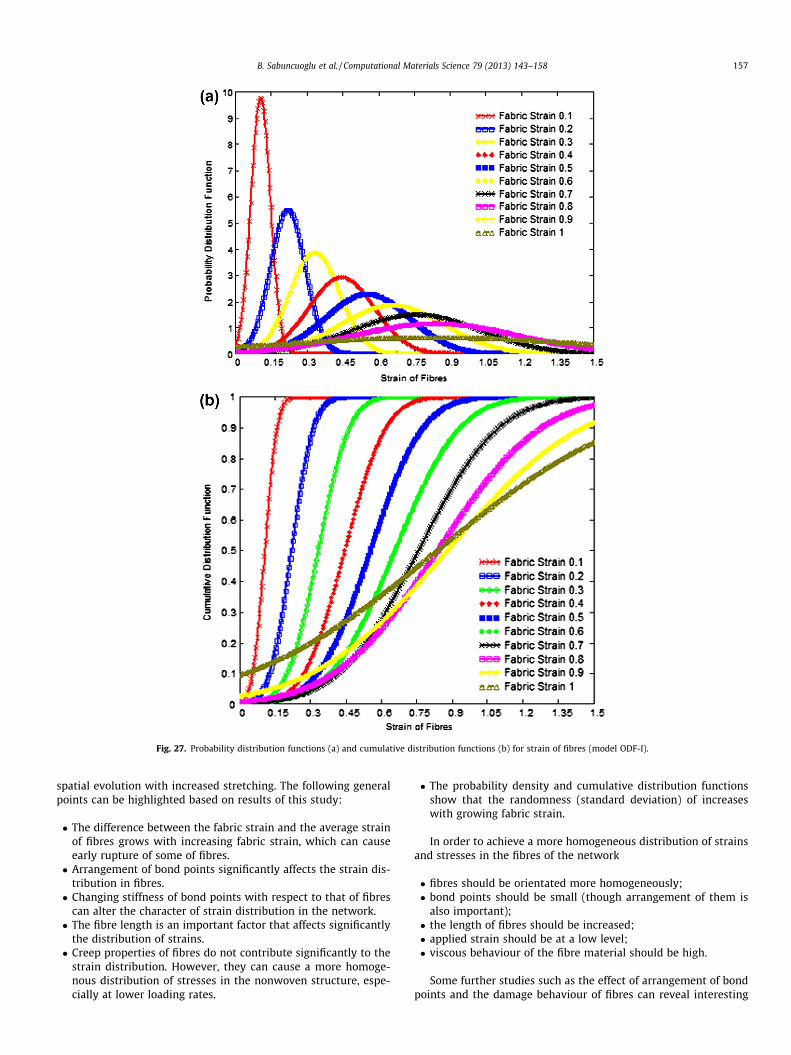
Fig. 27. Probability distribution functions (a) and cumulative distribution functions (b) for strain of fibres (model ODF-I).
B. Sabuncuoglu et al. / Computational Materials Science 79 (2013) 143–158 157
spatial evolution with increased stretching. The following generalpoints can be highlighted based on results of this study:
� The difference between the fabric strain and the average strainof fibres grows with increasing fabric strain, which can causeearly rupture of some of fibres.� Arrangement of bond points significantly affects the strain dis-
tribution in fibres.� Changing stiffness of bond points with respect to that of fibres
can alter the character of strain distribution in the network.� The fibre length is an important factor that affects significantly
the distribution of strains.� Creep properties of fibres do not contribute significantly to the
strain distribution. However, they can cause a more homoge-nous distribution of stresses in the nonwoven structure, espe-cially at lower loading rates.
� The probability density and cumulative distribution functionsshow that the randomness (standard deviation) of increaseswith growing fabric strain.
In order to achieve a more homogeneous distribution of strainsand stresses in the fibres of the network
� fibres should be orientated more homogeneously;� bond points should be small (though arrangement of them is
also important);� the length of fibres should be increased;� applied strain should be at a low level;� viscous behaviour of the fibre material should be high.
Some further studies such as the effect of arrangement of bondpoints and the damage behaviour of fibres can reveal interesting
158 B. Sabuncuoglu et al. / Computational Materials Science 79 (2013) 143–158
conclusions regarding the distribution of strains and stresses in fi-brous networks.
References
[1] R.C. Picu, Proceedings of IUTAM 3 (2012) 91–99.[2] E. Demirci, M. Acar, B. Pourdeyhimi, V.V. Silberschmidt, Computational
Materials Science 52 (2012) 157–163.[3] E. Demirci, M. Acar, B. Pourdeyhimi, V.V. Silberschmidt, Computational
Materials Science 50 (2011) 1286–1291.[4] C. Barbier, R. Dendievel, D. Rodney, Computational Materials Science 45 (2009)
593–596.[5] H.K. Lee, S. Simunovic, D.K. Shin, Computational Materials Science 29 (2004)
459–474.[6] W. Albrecht, H. Fuchs, W. Kittelmann, Nonwoven Fabrics, Raw Materials,
Manufacture, Applications, Characteristics, Testing Processes, Wiley-VCH,Weinheim, 2003.
[7] S.J. Russel, Handbook of Nonwovens, Woodhead Publishing Ltd., Cambridge,2007.
[8] B. Sabuncuoglu, M. Acar, V.V. Silberschmidt, International Journal of NumericalMethods in Engineering 94 (2013) 441–553.
[9] B. Sabuncuoglu, M. Acar, V.V. Silberschmidt, Computational Materials Science64 (2012) 192–197.
[10] X. Hou, M. Acar, V.V. Silberschmidt, Computational Materials Science 46(2009) 700–707.
[11] B. Sabuncuoglu, M. Acar, V.V. Silberschmidt, Computational Materials Science52 (2012) 164–170.
[12] G.S. Bhat, P.K. Jangala, J.E. Spruiell, Journal of Applied Polymer Science 92(2004) 3593–3600.
[13] Z.X. Mi, S.K. Batra, Computational model for the mechanical behavior ofthermally point-bonded nonwovens: Part I: Theoretical background(unpublished data).
[14] X. Hou, M. Acar, V.V. Silberschmidt, Computational Materials Science 50(2011) 1292–1298.
[15] B. Sabuncuoglu, M. Acar, V.V. Silberschmidt, Applied Mechanics and Materials70 (2011) 410–415.


![Chopped basalt fibres: A new perspective in reinforcing ... · [28] demonstrated that basalt fibres with the ade-quate sizing can improve tensile, flexural and impact strength of](https://img.pdfslide.net/doc/110x75/5e8a2a6c2b9fa965d04e5b44/chopped-basalt-fibres-a-new-perspective-in-reinforcing-28-demonstrated-that.jpg)