Embed Size (px)
Citation preview

1
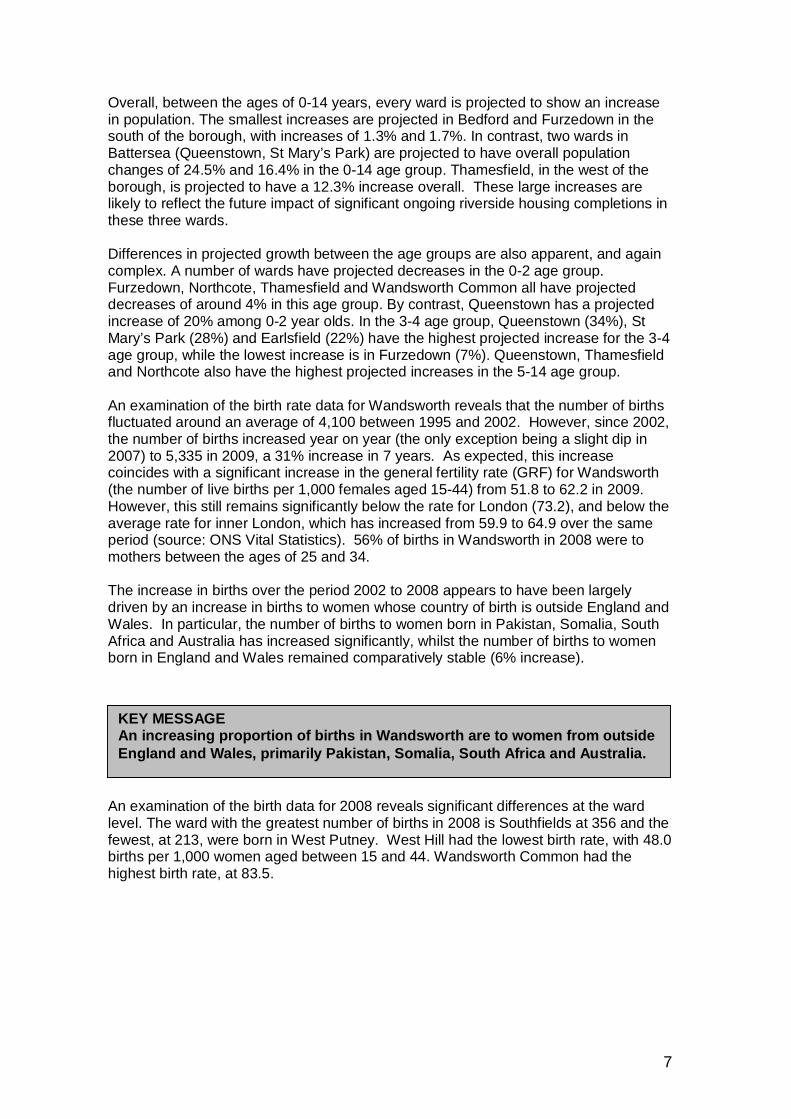
APPENDIX 2. DEMOGRAPHIC AND SOCIO-ECONOMIC PROFILE OF WANDSWORTH KEY MESSAGES 1. In the 0-4 age group, the highest numbers live in the ‘central’ wards of Wandsworth
Common, Northcote, Southfields and Nightingale, with 26% of all 0-4 year olds living in these wards.
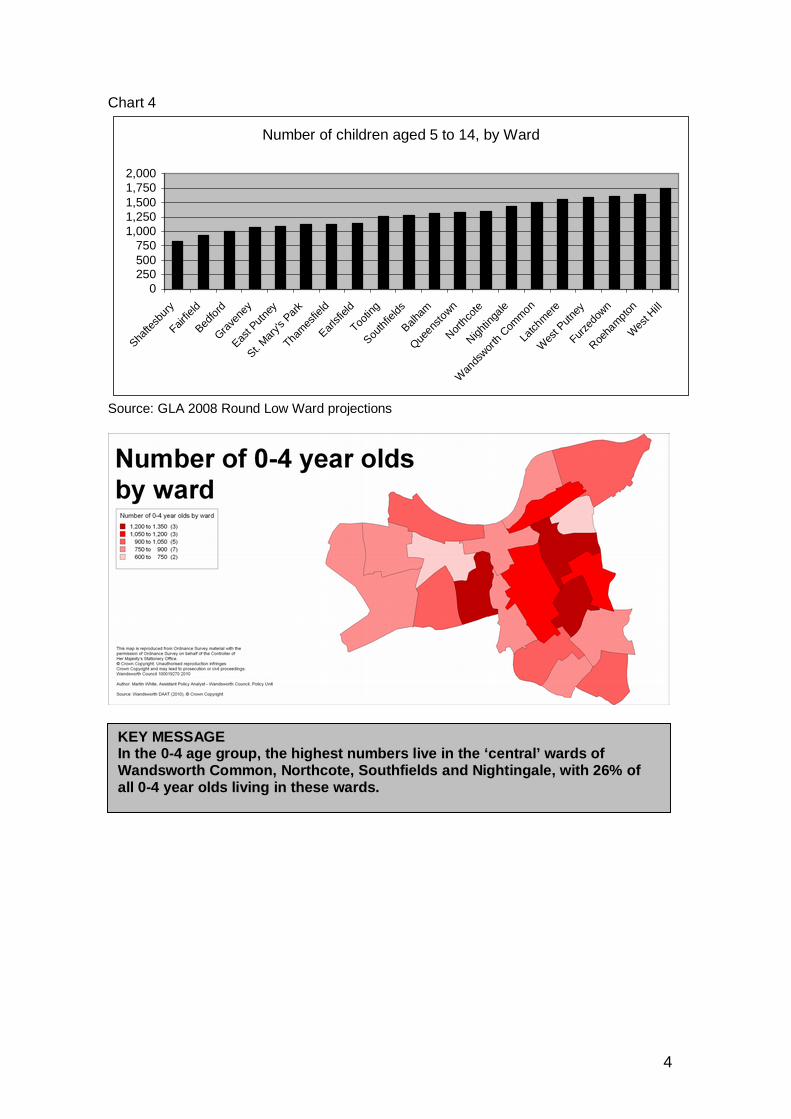
2. In the 5-14 age group, the highest numbers live in the west of the borough, in Roehampton, West Hill and West Putney, and Furzedown in the South.
3. Population projections suggest that the largest proportional change will occur in the 3-4 age band (15%).
4. An increasing proportion of births in Wandsworth are to women from outside England and Wales, primarily Pakistan, Somalia, South Africa and Australia.
5. The less deprived wards have a much higher birth rate than the more deprived wards.
6. Some wards with the highest projected population increases have well below average birth rates. This is particularly evident in areas which have experienced substantial amounts of new housing development.
7. A high birth rate does not necessarily follow through to overall growth in the 0-14 population. This is particularly evident in less deprived wards which are subject to out-migration of young families.
8. The 0-14 population is more diverse than the adult population. 35% of 0-14 year olds are non-white compared with 19% of the general population from age 14 up.
9. There is a large unknown population of young carers in the borough: 24% of households with children have at least one adult with a reported long term limiting illness.
10. There are 1,195 children under the age of 17 with Special Needs statements, or 68 in each age group cohort 0 to 17 years. Estimates based on the 2001 Census suggest the numbers of children with disabilities in the borough could be even higher: approximately 3,636 under the age of 17. This may indicate a need for specialist childcare provision in this population.
11. The median household income in Wandsworth is well above the London median. However, there are wards in the borough where 1 in 4 households earn under £15,000.
12. Wandsworth has one of the highest levels of female economic activity in London. There are also much higher levels of full-time working among females in Wandsworth than elsewhere.
13. The number of families dependent on Jobseekers Allowance (JSA) is rising. This is partly due to the current economic climate but is also partly due to changing rules on Income support which will result in some Lone Parent families moving on to JSA.
14. Much of the deprivation in Wandsworth is concentrated in corners of the borough, in Battersea, Roehampton and Tooting. However, there are also pockets of deprivation throughout the borough in otherwise affluent wards.

2
15. Around 50% of all households with children in Wandsworth are in receipt of Child Tax Credits. Take-up of child-tax credits is strongly correlated with deprivation.
16. Unlike take-up of Child Tax Credits, there are no clear patterns in the uptake of the childcare element and no clear link between uptake and levels of deprivation.
POPULATION AND BIRTH RATE Wandsworth has a population of 284,0001. Of this, 15.96% (45,341) are children and young people aged 0-14 years. This is lower than the proportion of 0-14 year olds in London as a whole (18.9%). The 0-14 age group for Wandsworth is broken down in the table below. Table 1 Age Group No. of persons % of total population Under 2 years 9,025 3.18% 2-4 years 10,426 3.67% 5-10 years 16,347 5.76% 11-14 years 9,544 3.36% Total 45,341 15.96%
At ward level2 there are significant variations in the proportion of the population aged 0-14, ranging from 19% in Nightingale, West Hill, Wandsworth Common and Northcote, to 11% in Shaftesbury and 12% in Fairfield and East Putney (see Chart 1 below). Chart 1
% Ward population by age group
0%
4%
8%
12%
16%
20%
Shafte
sbury
East P
utney
Fairfie
ld
Bedfo
rd
Grave
ney
St. Mary'
s Par
k
Earlsf
ield
Tham
esfie
ld
Tootin
g
Balham
Queen
stown
Wes
t Put
ney
Roeham
pton
South
fields
Furze
down
Latch
mer
e
Northco
te
Wand
swor
th C
ommon
West
Hill
Nighti
ngale
11-14yrs
5-10yrs
2-4 yrs
Under 2
Source: GLA 2008 Round Low Ward projections 1 ONS Mid Year Estimate for 2008, released Aug 2009. 2 GLA 2008 Round Low Ward projections

3
The pattern varies slightly for the under 2 year old age group where the highest proportion (and overall numbers) live in the ‘central’ wards of Wandsworth, including Northcote, Southfields, Nightingale and Wandsworth Common, with 26% of all 2 year olds living in these four wards. In contrast, there are some of the smallest proportions in several western wards (East Putney, West Putney and Roehampton). The pattern for 3-4 year olds is very similar and overall for the 0-4 age group. Chart 2
Number of children aged 0 to 2, by Ward
0200400600800
1,000
East P
utne
y
Wes
t Put
ney
Shafte
sbur
y
Fairfie
ld
Grave
ney
Bedford
Roeham
pton
St. Mar
y's P
ark
Tootin
g
Wes
t Hill
Earlsf
ield
Furze
down
Balham
Latch
mer
e
Queens
town
Thames
field
Wan
dsworth
Com
mon
Nightin
gale
South
fields
North
cote
Chart 3
Number of children aged 3 to 4, by Ward
050
100150200250300350400450
Shafte
sbur
y
Fairfield
East P
utne
y
Earlsf
ield
Bedfor
d
Grave
ney
St. M
ary's
Par
k
Tootin
g
Roeha
mpt
on
Thames
field
Wes
t Putn
ey
West
Hill
Queens
town
Furze
down
Balham
Latch
mere
Southf
ields
Wand
swor
th C
omm
on
North
cote
Nighting
ale
4
Chart 4
Number of children aged 5 to 14, by Ward
0250500750
1,0001,2501,5001,7502,000
Shafte
sbury
Fairfie
ld
Bedfo
rd
Grave
ney
East P
utney
St. M
ary's
Par
k
Thames
field
Earlsf
ield
Tooting
South
fields
Balham
Queens
town
North
cote
Nightin
gale
Wan
dswor
th C
omm
on
Latch
mer
e
Wes
t Put
ney
Furze
down
Roeha
mpt
on
Wes
t Hill
Source: GLA 2008 Round Low Ward projections
KEY MESSAGE In the 0-4 age group, the highest numbers live in the ‘central’ wards of Wandsworth Common, Northcote, Southfields and Nightingale, with 26% of all 0-4 year olds living in these wards.

5
POPULATION PROJECTION Data on births and population trends are a useful tool in helping to predict population trends and therefore possible changes in demand for local childcare services. These data reveal a complex pattern for Wandsworth, particularly at the ward level, and this is discussed in more detail below. The GLA 2008 Round RLP-Low population projections, which make full use of local development data and DCLG household projections, indicate that the population aged 0-14 in Wandsworth will increase by almost 4,000 children (8%) by 2014 (from 2008), and over 5,000 (11%) by 2018.
There is a 9% projected increase in the 5-14 age group and a 2% increase among 0-2 year olds. The same projections are also able to indicate expected population changes at ward level (see table below). The pattern of population change is complex, both at the ward level, and when broken down further by age.
KEY MESSAGE Population projections suggest that the largest proportional change will occur in the 3-4 age band (15%). This is consistent with the rise in birth rate projected in earlier years of the Childcare Sufficiency Assessment.
KEY MESSAGE In the 5-14 age group, the highest numbers live in the west of the borough, in Roehampton, West Hill and West Putney, and Furzedown in the South.

6
Table 2 Aged 0-2 years Age 3-4 years Aged 5-14 years Overall changes for 0-14 years
WARD 2008 2014 change %
change 2008 2014 change %
change 2008 2014 change %
change 2008 2014 change %
change Balham 688 675 -13 -1.9% 373 402 29 7.9% 1,302 1,427 126 9.7% 2,362 2,505 142 6.0%
Bedford 555 539 -16 -2.8% 267 301 34 12.8% 1,002 1,014 13 1.3% 1,824 1,855 31 1.7%
Earlsfield 621 694 73 11.8% 264 322 58 21.9% 1,145 1,260 115 10.1% 2,030 2,276 246 12.1%
East Putney 360 379 18 5.1% 246 280 34 14.0% 1,095 1,170 76 6.9% 1,701 1,830 129 7.6%
Fairfield 554 547 -7 -1.2% 243 270 28 11.5% 925 1,015 90 9.7% 1,721 1,832 111 6.4%
Furzedown 662 636 -27 -4.1% 360 385 25 6.8% 1,604 1,641 37 2.3% 2,626 2,661 35 1.3%
Graveney 555 573 18 3.2% 269 313 44 16.4% 1,071 1,125 54 5.0% 1,895 2,011 116 6.1%
Latchmere 691 708 16 2.4% 384 446 62 16.2% 1,558 1,723 164 10.5% 2,634 2,877 243 9.2%
Nightingale 836 823 -13 -1.5% 427 462 35 8.2% 1,436 1,572 136 9.5% 2,699 2,857 158 5.9%
Northcote 913 879 -35 -3.8% 427 467 40 9.3% 1,338 1,568 230 17.2% 2,678 2,914 235 8.8%
Queenstown 701 841 140 20.0% 340 457 117 34.3% 1,321 1,642 321 24.3% 2,363 2,941 578 24.5%
Roehampton 559 582 23 4.2% 320 372 51 16.0% 1,641 1,657 16 1.0% 2,520 2,611 91 3.6% St. Mary's Park 605 667 62 10.2% 282 360 78 27.6% 1,122 1,312 190 16.9% 2,009 2,339 329 16.4%
Shaftesbury 530 533 3 0.6% 220 251 30 13.8% 829 878 49 5.9% 1,579 1,662 83 5.2%
Southfields 847 876 29 3.4% 403 471 68 16.8% 1,276 1,442 166 13.0% 2,526 2,789 263 10.4%
Thamesfield 709 682 -28 -3.9% 329 383 54 16.5% 1,129 1,369 240 21.3% 2,167 2,433 267 12.3%
Tooting 612 629 17 2.7% 319 363 43 13.6% 1,256 1,381 125 10.0% 2,187 2,373 185 8.5% Wandsworth Common 777 746 -31 -3.9% 413 452 39 9.5% 1,498 1,583 85 5.7% 2,688 2,782 94 3.5%
West Hill 616 622 6 0.9% 336 387 51 15.1% 1,745 1,807 62 3.6% 2,697 2,816 119 4.4%
West Putney 504 557 53 10.6% 331 395 64 19.3% 1,599 1,761 162 10.1% 2,434 2,713 279 11.5%
Grand Total 12,895 13,186 291 2.3% 6556 7541 985 15.0% 25,891 28,348 2,457 9.5% 45,341 49,075 3,733 8.2% Population change analysis for age groups 0-14years based on ward level population projections produced by the GLA (2008 Round RLP-Low Ward Projections, published Aug 2009).
7
Overall, between the ages of 0-14 years, every ward is projected to show an increase in population. The smallest increases are projected in Bedford and Furzedown in the south of the borough, with increases of 1.3% and 1.7%. In contrast, two wards in Battersea (Queenstown, St Mary’s Park) are projected to have overall population changes of 24.5% and 16.4% in the 0-14 age group. Thamesfield, in the west of the borough, is projected to have a 12.3% increase overall. These large increases are likely to reflect the future impact of significant ongoing riverside housing completions in these three wards. Differences in projected growth between the age groups are also apparent, and again complex. A number of wards have projected decreases in the 0-2 age group. Furzedown, Northcote, Thamesfield and Wandsworth Common all have projected decreases of around 4% in this age group. By contrast, Queenstown has a projected increase of 20% among 0-2 year olds. In the 3-4 age group, Queenstown (34%), St Mary’s Park (28%) and Earlsfield (22%) have the highest projected increase for the 3-4 age group, while the lowest increase is in Furzedown (7%). Queenstown, Thamesfield and Northcote also have the highest projected increases in the 5-14 age group. An examination of the birth rate data for Wandsworth reveals that the number of births fluctuated around an average of 4,100 between 1995 and 2002. However, since 2002, the number of births increased year on year (the only exception being a slight dip in 2007) to 5,335 in 2009, a 31% increase in 7 years. As expected, this increase coincides with a significant increase in the general fertility rate (GRF) for Wandsworth (the number of live births per 1,000 females aged 15-44) from 51.8 to 62.2 in 2009. However, this still remains significantly below the rate for London (73.2), and below the average rate for inner London, which has increased from 59.9 to 64.9 over the same period (source: ONS Vital Statistics). 56% of births in Wandsworth in 2008 were to mothers between the ages of 25 and 34. The increase in births over the period 2002 to 2008 appears to have been largely driven by an increase in births to women whose country of birth is outside England and Wales. In particular, the number of births to women born in Pakistan, Somalia, South Africa and Australia has increased significantly, whilst the number of births to women born in England and Wales remained comparatively stable (6% increase).
An examination of the birth data for 2008 reveals significant differences at the ward level. The ward with the greatest number of births in 2008 is Southfields at 356 and the fewest, at 213, were born in West Putney. West Hill had the lowest birth rate, with 48.0 births per 1,000 women aged between 15 and 44. Wandsworth Common had the highest birth rate, at 83.5.
KEY MESSAGE An increasing proportion of births in Wandsworth are to women from outside England and Wales, primarily Pakistan, Somalia, South Africa and Australia.

8
Ward Number of births
Birth rate per 1,000 females aged 15-44
West Hill 234 48.0 Queenstown 242 49.7 Bedford 239 52.0 Tooting 237 53.9 Shaftesbury 234 54.1 St Mary's Park 236 54.1 Fairfield 248 55.9 East Putney 238 56.0 Roehampton 231 60.0 West Putney 213 63.2 Thamesfield 266 64.1 Nightingale 275 65.7 Balham 267 66.7 Graveney 301 68.8 Furzedown 255 69.4 Earlsfield 303 69.7 Latchmere 269 70.8 Northcote 305 73.6 Southfields 356 77.6 Wandsworth Common 297 83.5 Source: ONS Vital Statistics 2008. Population figures used taken from GLA 2008 Round Ward Projections. Sorted in order of increasing birth rate.
SUMMARY At the ward level, the overall relationship between birth rate and the projected increase in population for ages 0-17 is complex. It appears likely that several factors could be influencing the trends, which clearly have implications for future demand on formal childcare. This is illustrated further by the examples given below. There is a strong inverse relationship between the scale of deprivation (as measured against the proportion of children in benefit claiming households) exhibited by a ward and its birth rate, with the 6 least deprived wards having a birth rate 23% more than the 6 most deprived wards.
Several wards with the greatest population increase, for example, Queenstown, exhibit well below average birth rates. Housing development, as a key component of the population projections, is clearly contributing 0-17 population growth in several of these wards, even where the underlying birth rate on the extant population remains low. Where these areas correspond with areas of high local deprivation (e.g. Queenstown) the growth in 0-14 population due to the new housing-led ‘migrant’ population may place less (or differing) demand on affordable childcare than would be expected if population growth results from within the existing deprived population.
KEY MESSAGE The less deprived wards have a much higher birth rate than the more deprived wards.
KEY MESSAGE Some wards with the highest projected population increases have well below average birth rates. This is particularly evident in areas which have experienced substantial amounts of new housing development.

9
There are wards (e.g. Wandsworth Common) which have birth rates over 10% more than the borough average, but where the overall percentage population change is predicted to be below the borough average. This would suggest that these less deprived wards are subject to out-migration of young families, thereby maintaining relatively unchanging demand for childcare. This is particularly apparent in the 0-4 age group, where there is a relatively strong inverse relationship between birth rate and population growth, i.e., a high birth rate does not follow through to a rising overall 0-14 population. ETHNICITY PROFILE AND PROJECTIONS Wandsworth’s overall population is ethnically diverse. In 2001, Wandsworth had the 23rd largest non-white population of the 33 London boroughs at 22%. This is lower than the London average at 29%, and significantly lower than the proportion of non-white population in Inner London at 34%. The proportion of Asian (including Asian British) inhabitants is 6.9% in Wandsworth compared to 12.1% London-wide. However, the proportions of mixed ethnicity, Black (including Black British), and Chinese and other ethnic groups, in Wandsworth are very close or equal to the London-wide figures. Looking specifically at the child population aged 0-14 in Wandsworth, around 35% of 0-14 year olds are non-White (source: 2001 Census and GLA 2008 Round RLP projections), a significantly lower proportion than with the inner London population (56%). The age structure of the population varies considerably between ethnic groups in the borough. As a whole, non-white ethnic groups made up a higher proportion of the 0-4 (34%), 5-9 (34%), 10-14 (38%) age groups than in the population of the borough as a whole (22%).
KEY MESSAGE A high birth rate does not necessarily follow through to overall growth in the 0-14 population. This is particularly evident in less deprived wards which are subject to out-migration of young families.
KEY MESSAGE The 0-14 population is more diverse than the adult population. 35% of 0-14 year olds are non-white compared with 19% of the general population from age 14 up.

10
Source: GLA 2008 Round RLP projections
At ward level, the breakdown of 0-15 year olds by ethnic group is only possible using the 2001 census, and highlights several areas with high concentrations of particular ethnic groups. White British is the most common group across all wards, with Thamesfield ward the least diverse having the highest proportion of White, Irish and Other White (88% combined). Latchmere ward, on the other hand, has a large proportion of Black African (18%) and Black Caribbean (12%), closely matched by Queenstown ward with 15% Black African and 12% Black Caribbean. St. Mary’s Park ward also has high proportion of these 2 groups with 11% of 0-15 year olds in each category. Tooting ward has high proportions of 0-15 year olds of Indian and Pakistani ethnicity (12% and 10% respectively), while perhaps the most ethnically diverse ward in the Borough is Graveney with 32% of 0-19 year olds being either Indian, Pakistani, Other Asian or Black Caribbean, each with an equal proportion (8%) of the total 0-19 year olds.
2001 census: Ethnicity of 0-14 population by ward
0
500
1,000
1,500
2,000
2,500
3,000
Balha
m
Bedfor
d
Earlsf
ield
East P
utney
Fairfie
ld
Furze
down
Gra
vene
y
Latc
hmer
e
Night
ingale
North
cote
Que
enst
own
Roeha
mpt
on
Shafte
sbury
South
field
s
St Mar
y's P
ark
Thames
field
Tootin
g
Wand
swor
th C
omm
on
West
Hill
West
Putney
Other
Black
Asian
Mixed
White

11
Ethnicity of 0-14 population by ward
0%
25%
50%
75%
100%
Balham
Bedfor
d
Earlsf
ield
East P
u tney
Fairfie
ld
Furze
down
Graven
ey
Latc
hmer
e
Nighti
ngale
North
cote
Queen
stown
Roeha
mpto
n
Shafte
sbury
Southf
ields
St Mary
's Par
k
Thames
field
Tootin
g
Wand
swor
th Com
mon
West
Hill
West
Pu tney
Other
Black
Asian
Mixed
White
Source: 2001 Census Recent projections (source: GLA 2008 Round Ethnic Group Projections - RLP Low) indicate that the proportion of non-White residents aged 0-14, (and across all ages), is not expected to change over the next 5-10 years, consistent with the picture for Inner London. HOUSEHOLD SRUCTURE AND LONE PARENTS The proportion of households in Wandsworth with dependent children is significantly lower than the London and national figures and, since 1991, has reduced from 37% of all households to 22% in 2001. The percentage of households with dependent children aged 0-15 represents 22.4% of all households in Wandsworth, over 6% lower than London average. 6% of all households in Wandsworth are lone parent households with dependent children, which is slightly less than the London average. This represents a slight increase from 5% since 1991.

12
WARD
Total number of
households
% households with dependent
children
% households that are lone
parent households with
dependent children
% households with at least
one child aged 0-4
% households with one child
aged 5-15
% households
with one child
% of households
with 2 children
% of households
with 3 children
% of children in lone parent
families
Balham 5,671 21% 4% 11% 8% 10% 8% 4% 20%
Bedford 6,041 19% 4% 8% 8% 8% 7% 4% 22%
Earlsfield 5,762 21% 6% 10% 9% 10% 8% 4% 33%
East Putney 6,450 16% 3% 7% 7% 7% 5% 3% 21%
Fairfield 5,787 18% 5% 9% 7% 9% 6% 3% 27%
Furzedown 5,513 28% 7% 12% 14% 12% 10% 6% 28%
Graveney 5,478 24% 7% 11% 11% 12% 9% 4% 33%
Latchmere 5,838 26% 13% 11% 12% 13% 9% 5% 50%
Nightingale 5,964 23% 4% 12% 8% 9% 9% 5% 21%
Northcote 5,669 22% 4% 12% 8% 10% 9% 4% 19%
Queenstown 6,129 21% 9% 9% 10% 10% 7% 4% 48%
Roehampton 5,314 29% 13% 11% 14% 14% 9% 6% 46%
St. Mary’s Park 5,952 19% 7% 8% 7% 8% 6% 3% 41%
Shaftesbury 5,841 17% 4% 13% 10% 12% 9% 4% 29%
Southfields 6,301 23% 5% 8% 8% 9% 6% 3% 24%
Thamesfield 5,672 20% 3% 9% 8% 8% 8% 3% 14%
Tooting 5,436 23% 7% 10% 11% 10% 8% 5% 33%
Wandsworth Common 5,359 29% 5% 13% 12% 11% 11% 6% 16%
West Hill 5,888 26% 8% 11% 12% 11% 9% 5% 34%
West Putney 5,591 25% 6% 10% 12% 10% 9% 5% 27%
Wandsworth 115,656 22% 6% 10% 10% 10% 8% 4% 30%Household structure and dependent children. Source: Census 2001

13
The variation of lone parent households at the borough level disguises some significant variation at the ward level, ranging from around 13% (twice the borough average) in Roehampton and Latchmere to less than 3% in Thamesfield. LIMITING LONG TERM ILLNESS Parents and carers who reported having a long term illness as at census 2001 may have different childcare requirements and household incomes. Children in these households may have caring responsibilities which may affect the demand for and ability to pay for childcare, including the demand for childcare as respite for young carers. 24% of households with dependent children in Wandsworth have at least one adult with a reported long term limiting illness, which is below the London average of 30%.
CHILDREN IN NEED AND CHILDREN WITH DISABILITIES There were 2,100 children in need in Wandsworth as at 31 March 2009. This represents a rate of 423 per 10,000 children in Wandsworth aged 0 to 19 years, compared with 276 for England and 355 for London, and 420 for Wandsworth’s DCSF statistical neighbours (as at end of 2008/9). As at 31st March 2009, 230 of the total children in need were looked after by the Council (CLA), the remainder being supported to live independently or within families. The number of children looked after by the Council continues to fall and, at 47 per 10,000 children in the population, is now well below the rate of comparator boroughs in Wandsworth’s DCSF statistical neighbour group (63 per 10,000) and the lowest in inner London, reflecting the success of the Council’s permanency and family support strategies. The Council’s success in reducing the number of children looked after has resulted in the smaller cohort that remain in care having a high level of need relative to the looked after cohorts in other authorities. The number of children subject to a Child Protection Plan (CPP) at 31st March 2009 was 180, 53% of which were aged 0-4 years. 160 children ceased to be subject to a CPP during the year ending 31st March 2009, and of these 13% had been on the register for longer than 2 years at the time they ceased to be subject to the plan. The number of children on the CPR has increased slightly from the 2005/06 position (125 children registered). Comparatively, the rate of children subject to a plan (37 per 10,000 children) is the same as the DCSF statistical neighbour average. Despite improvements in data collection, monitoring and sharing it is still difficult to identify accurately the number of children in the Borough who have a disability. The Census 2001 estimates that nationally 7% of children are disabled. If this percentage were applied to the most recent population estimates for Wandsworth this would mean approximately 3,636 under the age of 17 in Wandsworth has a disability. We know that 2.3% of all children in Wandsworth have a Special Educational Needs Statement. This would translate to 1,195 under the age of 17 or 68 in each age group
KEY MESSAGE There is a large unknown population of young carers in the borough: 24% of households with children have at least one adult with a reported long term limiting illness.

14
cohort 0 to 17 years. However, not all children with statements are disabled. A number of older children with behavioural, emotional and social difficulties will have statements but would not necessarily be considered disabled. Equally there may be children with disabilities who would not meet the criteria for statutory assessment. Almost a third of Special Educational Needs Statements relate to Behaviour, Emotional & Social difficulties, while over 20% relate to Speech, Language and Communication Needs.
SEN statements by need type
0.0%
10.0%
20.0%
30.0%
40.0%
Beh
avio
ur,
Em
otio
nal &
Soc
ial
Diff
icul
tyS
peec
h,La
ngua
ge a
ndC
omm
unic
atio
n
Mod
erat
e Le
arni
ngD
iffic
ulty
Spe
cific
Lea
rnin
gD
iffic
ulty
Aut
istic
Spe
ctru
mD
isor
der
Oth
erD
iffic
ulty
/Dis
abilit
y
Hea
ring
Impa
irmen
t
Phy
sica
l Dis
abilit
y
Vis
ual I
mpa
irmen
t
Sev
ere
Lear
ning
Diff
icul
ty
Pro
foun
d &
Mul
tiple
Lea
rnin
gD
iffic
ulty
Mul
ti-S
enso
ryIm
pairm
ent
ECONOMIC PROFILE Average Household Income PayCheck data for 2009 are produced by CACI Information Solutions, a market analysis consultancy, and provide modelled estimates of gross household income that includes income from investments and social security benefits. The reliability of any modelled estimate is difficult to assess but the overall picture seems to correlate well with other indicators at ward level presented elsewhere in this audit. These data can also be presented as 'equivalised' household incomes which are calculated by taking account of household size and composition. Equivalising reflects the notion that a household of five, for example, will need a higher income than a single person living alone to enjoy a comparable standard of living. CACI have calculated an 'equivalence value' for each household, based on the number and age of the household members. Equivalised income is then calculated by dividing the actual income by this equivalence value.
KEY MESSAGE There are 1,195 children under the age of 17 with Special Needs statements, or 68 in each age group cohort 0 to 17 years. Estimates based on the census suggest the numbers of children with disabilities in the borough could be even higher: approximately 3,636 under the age of 17. This may indicate a need for specialist childcare provision in this population.

15
Median (unequivalised) household income in Wandsworth is £38,330, the 4th highest in London behind the City of London, Richmond, and Kensington and Chelsea. It is considerably higher than the London median income of £33,430. The effect of equivalising these data for Wandsworth is relatively small, with an equivalised median income reduction of £2,574, and falling slightly to 5th highest in London. The table below shows significant variation in median household income by ward, with Roehampton and Latchmere having around 1 in 4 households earning under £15k, compared with just 5% in Northcote and Thamesfield. Significant differences are apparent when the ward-level data are equivalised. The largest reductions in income after equivalisation are in Furzedown, Tooting, Balham and Wandsworth Common. KEY MESSAGE
The median household income in Wandsworth is well above the London median. However, there are wards in the borough where 1 in 4 households earn under £15,000.

16
% Households earning (equivalised):
Median Household income
(Unequivalised)
Median household income (equivalised) Difference
Under 15k
Under 30k
Under 45k
Under 60k
Over 60k
Over 100k
Roehampton £24,862 £23,068 -£1,794 27% 65% 84% 92% 8% 1% Latchmere £28,122 £25,499 -£2,624 23% 60% 80% 90% 10% 2%
Graveney £32,969 £29,955 -£3,014 16% 51% 74% 87% 13% 2%
Tooting £33,188 £29,635 -£3,552 16% 50% 73% 86% 14% 3% West Hill £34,079 £31,986 -£2,093 14% 48% 72% 86% 14% 3%
Furzedown £35,226 £31,281 -£3,945 13% 46% 70% 84% 16% 3%
West Putney £35,453 £33,485 -£1,968 13% 44% 67% 81% 19% 4% Queenstown £35,763 £34,400 -£1,363 14% 43% 64% 78% 22% 7%
Earlsfield £37,098 £34,501 -£2,597 12% 42% 65% 80% 20% 5%
Shaftesbury £38,988 £37,837 -£1,151 10% 38% 62% 78% 22% 6% Southfields £39,697 £36,978 -£2,719 10% 37% 60% 75% 25% 7%
St Mary's Park £40,782 £38,113 -£2,669 8% 36% 61% 77% 23% 5%
Bedford £42,151 £39,865 -£2,286 9% 36% 60% 76% 24% 6% Wandsworth Common £42,827 £37,905 -£4,922 8% 34% 57% 73% 27% 8%
East Putney £42,935 £42,364 -£571 7% 32% 57% 74% 26% 7%
Fairfield £43,012 £40,807 -£2,205 7% 32% 56% 73% 27% 8% Nightingale £43,441 £40,616 -£2,825 7% 31% 55% 73% 27% 7%
Balham £44,943 £41,361 -£3,582 7% 30% 54% 71% 29% 8%
Northcote £46,405 £43,397 -£3,008 5% 28% 52% 70% 30% 8% Thamesfield £47,953 £45,051 -£2,902 5% 26% 50% 68% 32% 9%
WANDSWORTH £38,330 £35,756 -£2,573 11% 40% 63% 78% 22% 6%
17
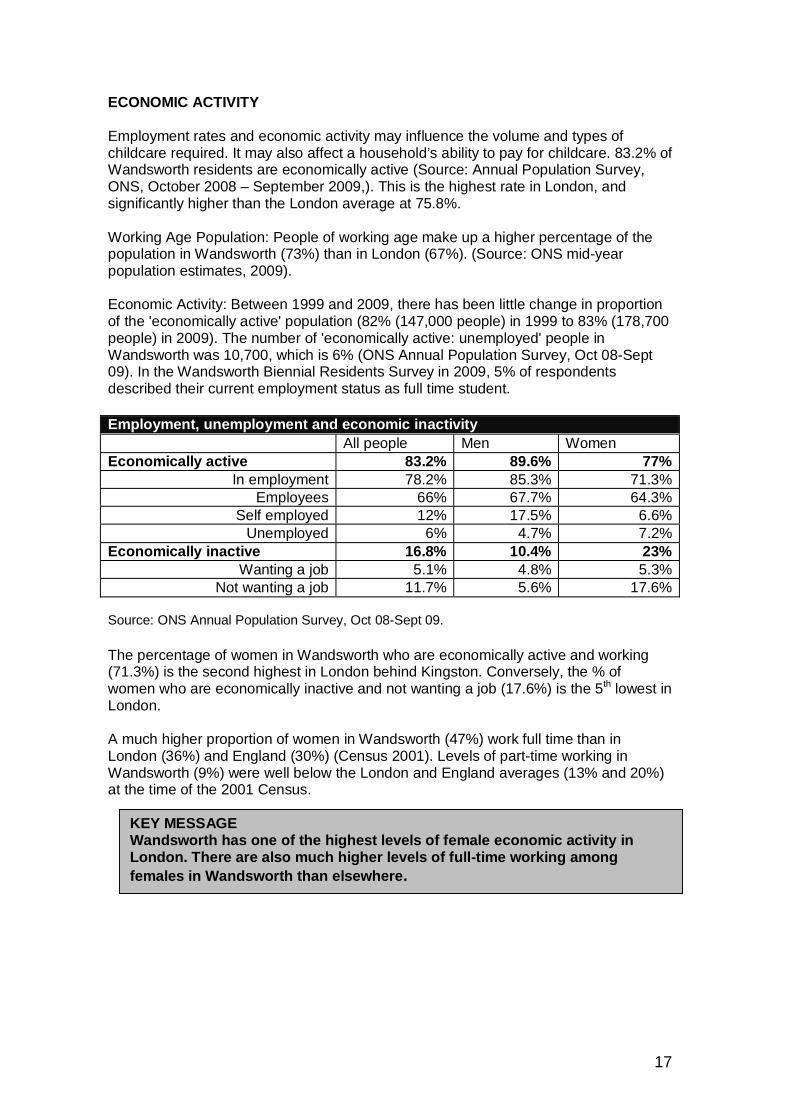
ECONOMIC ACTIVITY Employment rates and economic activity may influence the volume and types of childcare required. It may also affect a household’s ability to pay for childcare. 83.2% of Wandsworth residents are economically active (Source: Annual Population Survey, ONS, October 2008 – September 2009,). This is the highest rate in London, and significantly higher than the London average at 75.8%. Working Age Population: People of working age make up a higher percentage of the population in Wandsworth (73%) than in London (67%). (Source: ONS mid-year population estimates, 2009). Economic Activity: Between 1999 and 2009, there has been little change in proportion of the 'economically active' population (82% (147,000 people) in 1999 to 83% (178,700 people) in 2009). The number of 'economically active: unemployed' people in Wandsworth was 10,700, which is 6% (ONS Annual Population Survey, Oct 08-Sept 09). In the Wandsworth Biennial Residents Survey in 2009, 5% of respondents described their current employment status as full time student. Employment, unemployment and economic inactivity
All people Men Women Economically active 83.2% 89.6% 77%
In employment 78.2% 85.3% 71.3% Employees 66% 67.7% 64.3%
Self employed 12% 17.5% 6.6% Unemployed 6% 4.7% 7.2%
Economically inactive 16.8% 10.4% 23% Wanting a job 5.1% 4.8% 5.3%
Not wanting a job 11.7% 5.6% 17.6% Source: ONS Annual Population Survey, Oct 08-Sept 09. The percentage of women in Wandsworth who are economically active and working (71.3%) is the second highest in London behind Kingston. Conversely, the % of women who are economically inactive and not wanting a job (17.6%) is the 5th lowest in London. A much higher proportion of women in Wandsworth (47%) work full time than in London (36%) and England (30%) (Census 2001). Levels of part-time working in Wandsworth (9%) were well below the London and England averages (13% and 20%) at the time of the 2001 Census.
KEY MESSAGE Wandsworth has one of the highest levels of female economic activity in London. There are also much higher levels of full-time working among females in Wandsworth than elsewhere.

18
Employment by occupation
Wandsworth (numbers)
Wandsworth (%)
London (%)
Great Britain
(%) Soc 2000 major group 1-3 108,000 64.4 54.1 44 1 Managers and senior officials 35,300 21 17.8 15.7 2 Professional occupations 40,300 24 17.1 13.4 3 Associate professional & technical 32,500 19.3 18.8 14.8 Soc 2000 major group 4-5 25,500 15.2 18.8 21.8 4 Administrative & secretarial 17,700 10.6 11.1 11.2 5 Skilled trades occupations 7,800 4.6 7.6 10.4 Soc 2000 major group 6-7 17,100 10.2 13.2 16 6 Personal service occupations 10,000 5.9 7.1 8.5 7 Sales and customer service occs 7,100 4.2 6.1 7.5 Soc 2000 major group 8-9 17,000 10.2 13.9 18.2 8 Process plant & machine operatives 6,000 3.6 4.6 6.8 9 Elementary occupations 11,000 6.6 9.2 11.3 Source: ONS Annual Population Survey (Jul 2007-Jun 2008). Percentages are based on all persons in employment. According to the 2001 Census, 28% of Wandsworth residents work within 5km of home. UNEMPLOYMENT AND WORKING AGE BENEFITS As at November 2009, 23,370 Wandsworth residents of working age claimed some sort of benefit. This represents around 11% of the working aged population for Wandsworth, considerably lower than the inner London average at 15.4%. Of the total benefits claimants, around 17% (3,890) were claiming income support as Lone Parents. It is important to note the recent changes which have been made to the eligibility conditions for Lone Parents claiming Income Support. From the 24th of November 2008, Lone parents with a youngest child age 12 or over are no longer entitled to Income support solely on the grounds of being a Lone Parent. These changes have been introduced in three phases: - a youngest child aged 12 from 24th November 2008 - a youngest child aged 10 from 26th October 2009; and - a youngest child aged 7 from 25th October 2010. Existing Lone Parents entitlement to income support will cease when their child reaches the relevant age point. Instead, they may be eligible to claim Jobseeker’s Allowance (JSA), which has different rules, including the requirement to actively seek and be available for work. This is likely to mean that the numbers of families dependent on JSA will rise. As at November 2009, 3.1% of Wandsworth residents of working age were seeking work and claiming Job Seekers Allowance (6,470 claimants). This represented an increase of 2,250 claimants over the previous year, however it is the third lowest rate in inner London where the average is 4.2%. Unsurprisingly, the age of children seems to have an impact on take up of out of work benefits; 46% of working age claimants with dependent children have a child under the

19
age of 5 (Source: DWP Information Directorate, Work and Pensions Longitudinal Study, Aug 2009).
Working age residents claiming benefits
0
500
1,000
1,500
2,000
2,500
Balham
Bedfor
d
Earlsfie
ld
East Putn
ey
Fairf
ield
Furz
edown
Grave
ney
Latch
mere
Nightin
gale
North
cote
Queensto
wn
Roeham
pton
St Mar
y's P
ark
Shafte
sbur
y
Southf
ields
Thames
field
Tooting
Wan
dsworth
Com
mon
West
Hill
West
Putne
y
LoneParent
All otherbenefits
Source: DWP Claimant Counts, August 2009. CHILDREN DEPENENT ON BENEFITS As at Aug 2007, there were approximately 12,400 children in Wandsworth living in a household where an adult of working age claimed at least one key benefit. This represents around 22.7% of all children aged 0-15 in Wandsworth significantly below the average for Greater London (24.9%). The key benefits are: Job Seekers Allowance; Incapacity Benefit; Severe Disablement Allowance; Disability Living Allowance; and Income Support. Significant geographic variation exists in the proportion of children dependent on workless benefits. Latchmere and Roehampton wards have the highest proportion of children at 44 and 42%, almost double the Wandsworth average of 22%. In stark contrast, Northcote (which neighbours Latchmere), Thamesfield, Balham and Wandsworth Common wards all have less than 10% of children dependent on benefits.
KEY MESSAGE The number of families dependent on JSA is rising. This is partly due to the current economic climate but is also partly due to changing rules on Income support which will result in some Lone Parent families moving on to JSA.

20
Ward Name No. dependent Children aged 0-
4 living in a benefit claiming
household
Rate per population
aged 0-4 (%)
No. dependent Children aged 0-15 living in a
benefit claiming household
Rate per population aged 0-15
(%)
Balham 70 7% 215 9% Bedford 140 17% 380 20% Earlsfield 160 18% 530 24% East Putney 105 17% 290 16% Fairfield 125 15% 365 20% Furzedown 295 29% 805 29% Graveney 255 30% 745 37% Latchmere 420 38% 1,275 45% Nightingale 115 9% 270 10% Northcote 65 5% 190 7% Queenstown 315 29% 870 34% Roehampton 435 48% 1,125 42% St Mary's Park 180 20% 580 27% Shaftesbury 105 14% 325 19% Southfields 160 12% 430 16% Thamesfield 35 3% 120 5% Tooting 260 27% 735 32% Wandsworth Common
85 7% 240 9%
West Hill 265 27% 760 26% West Putney 170 20% 595 22% WANDSWORTH TOTAL
3,760 19% 10,845 22%
Source: Source: DWP Work and Pensions Longitudinal Study, HMRC Child Benefit administrative data, May 2008. Population figures from GLA 2009 Round Ward Projections
DEPRIVATION AFFECTING CHILDREN The Government’s recent ‘Index of Deprivation Affecting Children’ (IDACI) combines different indicators of deprivation, largely those relating to household income, to identify the scale and location of deprivation nationally within small sub-ward areas known as super-output areas (SOAs). The IDACI reveals significant pockets of deprivation affecting children in the Battersea, Tooting and Roehampton areas. These areas include most of the borough’s 25 SOAs that are amongst the worst 10% of areas nationally, including 14 within the worst 5% nationally, and frequently correlate with areas of social housing.

21
CHILD TAX CREDIT Child Tax Credit (CTC) is a means tested allowance that provides support for families (including lone parents and ‘couples’) with children and “qualifying” young people who are still in full time education and is paid whether or not the family is in or out of work. CTC is paid in addition to Child Benefit and Working Tax Credit, which is payable to lower income families where an adult who is employment,. CTC is made up of two elements:
- The family element. This is paid to any family responsible for at least one child. The family element can be increased if a child is aged under one.
- The child element. This is paid for each child or young person in the family. The child element may be higher if a child has a disability.
When calculating CTC, HMRC take into account the family’s income, the number of children in the household, their ages, and whether they have any disabilities. If the parent is working, HMRC will also take into account how many hours they work and their childcare costs. All families with an income of up to £58,000 a year (or up to £66,000 a year if there is a child under one year old), can claim the credit in the same way. The following analyses can be split between those families which are receiving an award above the family element (i.e., have more than one child, or a child under 1 year old, or a disabled child, or a combination of these factors) and those receiving the family element or less. In 2008/09, there were around 16,240 families (equating to 29,780 children) in receipt of Child Tax Credits, which equates to 50% of all households with children in Wandsworth. Of these:-
� 9,270 were in-work families, of which 70% received CTC above the Family Element level.
KEY MESSAGE Much of the deprivation in Wandsworth is concentrated in corners of the borough, in Battersea, Roehampton and Tooting. However, there are also pockets of deprivation throughout the borough in otherwise affluent wards.

22
� 6,970 families were out of work (this figure includes families with children who receive the same level of support as provided by CTC, but where it is paid as child allowances in Income Support or income-based Jobseeker’s Allowance).
(Source – HMRC Child and Working Tax Credit Statistics, 2008/09). HM Revenue and Customs (HMRC) have recently released a new dataset detailing the number of Child Tax Credit families at the small area level (SOA). These data offer a very useful way to help determine the economic profile of families with children in small geographical areas. The graph below shows that there is significant geographical variation in the proportion of families in receipt of CTC. Over 80% of families in Latchmere, Roehampton and Queenstown, areas characterised by significant proportions of council properties, claim CTC, compared with a borough average of 56%. There are also well above average proportions of claimants in the south of the borough (Tooting, Furzedown and Graveney), with wards in central Wandsworth having lower than average proportions of claimants.
% of households with children in receipt of tax credits
0%
10%
20%
30%
40%
50%
60%
70%
80%
90%
Balham
Bedfo
rd
Earlsf
ield
East P
utney
Fairfie
ld
Furze
down
Gra
vene
y
Latc
hmer
e
Night
ingale
North
cote
Queen
stow
n
Roeha
mpt
on
St Mary's
Par
k
Shafte
sbury
South
field
s
Tham
esfie
ld
Tootin
g
Wand
swor
th C
ommon
West
Hill
West
Putney
HMRC LSOA Tax credit statistics, August 2007.
CHILDCARE ELEMENT OF WORKING TAX CREDIT Take-up of the childcare element in Working Tax Credits (WTC) is the best available indicator of the take-up of formal childcare by lower income families. WTC are payable to those who work 16 or more hours a week in order to top-up their income, and can also provide support for qualifying childcare (up to 80% of eligible childcare costs). In practice, the majority of those claiming working tax credits are families with children. The data discussed below relate to families benefiting from the childcare element if they reported eligible costs, and their finalised awards are above the family element, at 31 August 2007. Families on the family element or below, with awards that were no higher as a result of incurring these costs, are excluded.
KEY MESSAGE Around 50% of all households with children in Wandsworth are in receipt of Child Tax Credits. Take-up of child-tax credits is strongly correlated with deprivation.

23
In 2007, 1,155 eligible families benefited from the child care element which represents around 19% (Source: HMRC August 2007) of the eligible population (number receiving WTC and CTC more than the family element). This compares favourably with the London position at 18%, although the rates vary considerably from borough to borough. Several inner London boroughs, e.g. Lewisham and Southwark, have a take-up rate of around 28% and Lambeth 27%, with Kensington and Chelsea at 29 and Camden at 17%, and Tower Hamlets at 7%. Childcare Element data are also available at the ward level (see chart below), which illustrates significant variations in take-up across the borough. The highest take-up is in the Shaftesbury ward at 31%, with the next highest being Bedford at 29% and Northcote and Nightingale, both at 25%. The lowest take-up can be found in East Putney at 9.7% and West Putney at 11.3% respectively. The chart below also shows the number of families who receive child care element. The comparison of take up rates with Ward level IDACI scores reveals that there is no clear correlation between levels of deprivation and take-up rates. For example, while Latchmere has the highest number of families receiving the childcare element, take-up in Latchmere is lower than in Northcote and Nightingale, which are much less deprived wards.
Take up of childcare element of tax credits
0%
10%
20%
30%
40%
50%
60%
East P
utney
West
Putney
West
Hill
Tham
esfie
ld
Wand
swor
th C
omm
on
Earlsf
ield
Tootin
g
Roeha
mpt
on
Grav
eney
South
field
Furze
down
Balha
m
Fairfie
ld
St Mary's
Par
k
Latc
hmer
e
Que
enst
own
Night
ingale
Northc
ote
Bedfo
rd
Shafts
bury
2007
ID
AC
I sc
ore
0%
5%
10%
15%
20%
25%
30%
35%
2007
Tak
e u
p
IDACIscore
2007 takeup
Take up of childcare element among those eligible 2007 take up 2006 take up East Putney 10% 14% West Putney 11% 13% West Hill 13% 14% Thamesfield 13% 18% Wandsworth Common 15% 13% Earlsfield 15% 22% Tooting 15% 12% Roehampton 16% 16% Graveney 18% 20% Southfields 19% 20% Furzedown 20% 23% Balham 20% 21%

24
Fairfield 21% 18% St Mary's Park 22% 21% Latchmere 23% 21% Queenstown 23% 22% Northcote 25% 27% Nightingale 25% 28% Bedford 29% 24% Shaftesbury 31% 28%
Although there is a clear link between CTC take-up and income deprivation, there is no such link between the Childcare element and deprivation. For example, Childcare Element take-up is particularly low in several wards which exhibit significant income deprivation, for example, West Hill, Tooting and Roehampton. Analyses fail to provide any single factor to explain these trends. It is also important to note that the most recent data available on CTC and the Childcare element is from 2007, and that year’s data indicated significant changes from 2006 (as shown in the table above). It is possible that the picture has changed again since 2007.
There are likely to be changes to Child Tax Credits and the Childcare Element in the forthcoming budget.
KEY MESSAGE Unlike take-up of Child Tax Credits, there are no clear patterns in the uptake of the childcare element of Working Tax Credit and no clear link between uptake and levels of deprivation.