Embed Size (px)
Citation preview
Directorate General NDRF & Civil Defence (Fire)
Ministry of Home Affairs East Block 7, Level 7, NEW DELHI, 110066,
Fire Hazard and Risk Analysis in the Country for Revamping the Fire Services in the Country
Final Report – National Report on Fire Hazard and Risk Analysis, Infrastructure and Institutional Assessment, and Key
Recommendations
November 2012
Submitted by
RMSI A-8, Sector 16
Noida 201301, INDIA Tel: +91-120-251-1102, 2101 Fax: +91-120-251-1109, 0963
www.rmsi.com
Contact: Sushil Gupta General Manager, Risk Modeling and Insurance
Email:[email protected]
Fire-Risk and Hazard Analysis in the Country
(National Report) Confidential Page 2 of 338
Table of Contents Table of Contents .................................................................................................................. 2
List of Figures ....................................................................................................................... 5
List of Tables ........................................................................................................................ 7
Acknowledgements ............................................................................................................. 13
Executive Summary ............................................................................................................ 15
1 Introduction .................................................................................................................. 24
1.1 Background........................................................................................................... 24
1.2 Role of Fire Services ............................................................................................. 25
1.3 Objective of the study ........................................................................................... 26
1.4 Scope of the study ................................................................................................ 26
2 Technical Details on Methodology and Data Development .......................................... 27
2.1 Understanding of the Scope of Work .................................................................... 27
2.2 Study Area ............................................................................................................ 28
2.3 Phased Approach ................................................................................................. 29
3 GIS based Fire Hazard and Risk Analysis.................................................................... 31
3.1 GIS Data Compilations ......................................................................................... 31
3.2 GIS - Overlay Analysis .......................................................................................... 35
3.3 Fire Hazard and Risk Analysis .............................................................................. 37
3.4 Hazard Ranking .................................................................................................... 38
3.5 Exposure Vulnerability Ranking ............................................................................ 59
4 Field Surveys of Fire Stations for Data Collection ...................................................... 100
4.1 Field-Survey of individual Fire Station and collection of Headquarter Data ......... 100
4.2 Stakeholder Analysis .......................................................................................... 101
5 Development of Fire Decision Support System (FDSS) ............................................. 102
5.1 Salient Features .................................................................................................. 102
5.2 High Level Design ............................................................................................... 102
5.2.1 Data Warehouse .......................................................................................... 104
5.3 Platform Components ......................................................................................... 105
5.4 System Administration Interface .......................................................................... 107
5.5 Application Interface ........................................................................................... 107
5.5.1 Technology .................................................................................................. 108
5.6 Advantages of Open Source Platform ................................................................. 110
5.7 Identification of Gaps in Infrastructure, Up-gradation and Modernization Requirement .................................................................................................................. 111
5.7.1 Infrastructure gaps ....................................................................................... 111
5.7.2 Equipment Gaps .......................................................................................... 111
Fire-Risk and Hazard Analysis in the Country
(National Report) Confidential Page 3 of 338
5.7.3 Capacity gaps .............................................................................................. 111
5.8 Preparation of detail cost estimates with Capital and O&M Investment Plan ....... 111
5.9 Institutional Assessment and Capacity Building Plan .......................................... 112
6 International and National Norms ............................................................................... 114
6.1 Literature Survey ................................................................................................ 114
6.2 Response Time ................................................................................................... 114
6.2.1 Germany ...................................................................................................... 114
6.2.2 Japan ........................................................................................................... 115
6.2.3 USA ............................................................................................................. 116
6.2.4 UK ............................................................................................................... 117
6.2.5 India ............................................................................................................. 117
Annex-1: Fire Headquarter Data Collection Form .............................................................. 120
Annex-2: Fire Station Survey Form ................................................................................... 137
7 Delhi State ................................................................................................................. 153
8 Rajasthan State ......................................................................................................... 156
9 Maharashtra State ..................................................................................................... 159
10 Jammu and Kashmir State ..................................................................................... 162
11 Puducherry UT ....................................................................................................... 166
12 Andaman & Nicobar Islands UT ............................................................................. 169
13 Chandigarh UT ....................................................................................................... 172
14 Haryana State ........................................................................................................ 175
15 Himachal Pradesh State ......................................................................................... 178
16 Punjab State ........................................................................................................... 181
17 Uttarakhand State .................................................................................................. 184
18 Uttar Pradesh State ................................................................................................ 187
19 Dadra and Nagar Haveli UT ................................................................................... 190
20 Daman and Diu UT ................................................................................................. 193
21 Goa State ............................................................................................................... 197
22 Gujarat State .......................................................................................................... 200
23 Karnataka State ...................................................................................................... 203
24 Madhya Pradesh State ........................................................................................... 206
25 Andhra Pradesh State ............................................................................................ 209
26 Bihar State ............................................................................................................. 212
27 Kerala State ........................................................................................................... 215
28 Lakshadweep UT ................................................................................................... 218
29 Tamil Nadu State .................................................................................................... 221
30 Arunachal Pradesh State ........................................................................................ 224
Fire-Risk and Hazard Analysis in the Country
(National Report) Confidential Page 4 of 338
31 Assam State ........................................................................................................... 227
32 Chhattisgarh State .................................................................................................. 230
33 Jharkhand State ..................................................................................................... 233
34 Manipur State ......................................................................................................... 236
35 Meghalaya State .................................................................................................... 239
36 Mizoram State ........................................................................................................ 242
37 Nagaland State ....................................................................................................... 245
38 Orissa State ........................................................................................................... 248
39 Sikkim State ........................................................................................................... 251
40 Tripura State .......................................................................................................... 254
41 West Bengal State .................................................................................................. 257
42 Fire Services in India .............................................................................................. 261
42.1 Introduction ......................................................................................................... 261
42.2 Field Surveys of Fire Stations for Data Collection ............................................... 265
42.3 Infrastructure Gap Analysis ................................................................................. 265
42.3.1 Fire Station Location Gap Analysis .............................................................. 265
42.3.2 Fire fighting and rescue Vehicles and Specialized Equipment Gap .............. 267
42.3.3 Fire Manpower Gap ..................................................................................... 294
42.3.4 Fire Station Building Infrastructure Gap ....................................................... 304
42.4 Investment and Financial Analysis ...................................................................... 306
42.4.1 Capital Cost ................................................................................................. 306
42.4.2 Recurring Cost ............................................................................................. 321
42.5 Detailed Financial Investment plan ..................................................................... 329
42.6 Prioritization of New Fire Stations/Fire Posts ...................................................... 330
42.7 Avenues of Fund Generation .............................................................................. 330
42.8 Capacity Building and Training Facilities ............................................................. 330
42.8.1 Basic Training for Fireman ........................................................................... 331
42.8.2 Training Course for Leading Fireman ........................................................... 331
42.8.3 Other Specialized Training Courses ............................................................. 331
42.8.4 Junior Officer Training Course ..................................................................... 333
42.8.5 Divisional Fire Officer Training Course ......................................................... 333
42.8.6 Awareness Generation Programs ................................................................ 333
42.9 Limitations of the Study ....................................................................................... 334
42.10 Recommendations for Fire Services in India ................................................... 335
Fire-Risk and Hazard Analysis in the Country
(National Report) Confidential Page 5 of 338
List of Figures
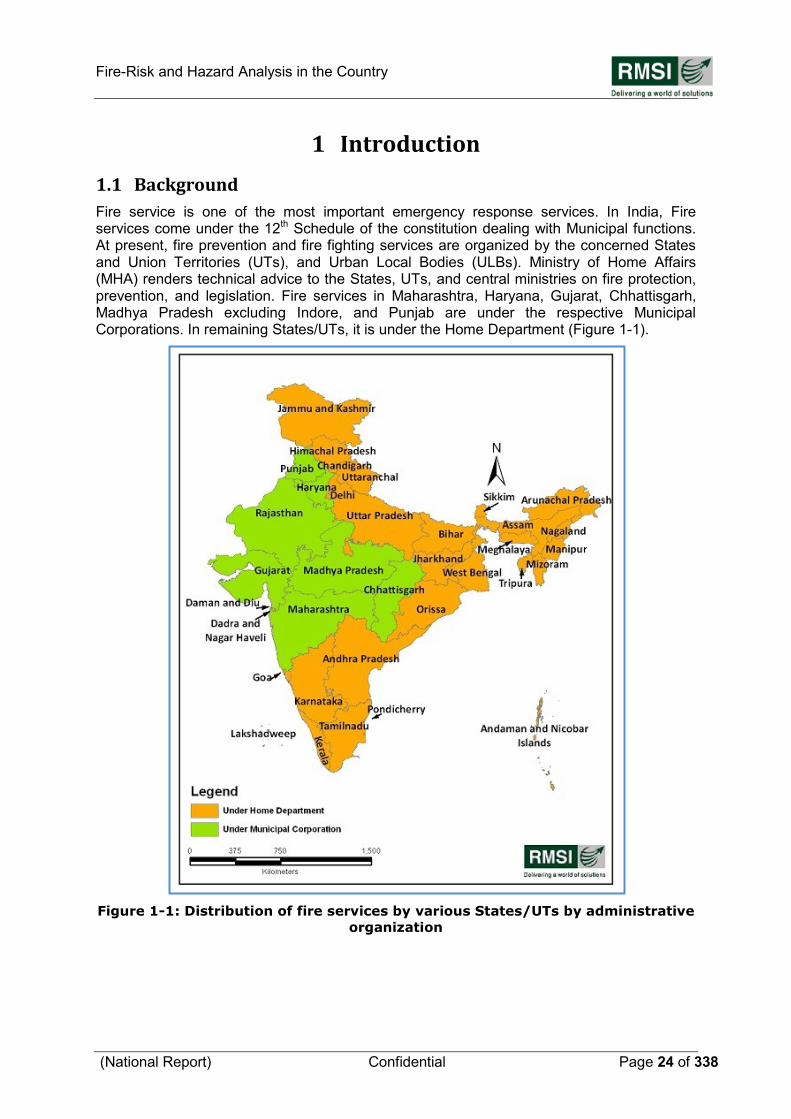
Figure 1-1: Distribution of fire services by various States/UTs by administrative organization ................................................................................................................................ 24
Figure 2-1 : State/UT wise distribution of fire service stations in India ................................. 28
Figure 3-1 : An example of a Land use classification at 25m pixel. The example shows parts of Western Maharashtra (districts – Mumbai, Mumbai sub-urban, Thane, Pune, and Raigarh) .................................................................................................................. 34
Figure 3-2 : Example of an enlarged view of classified. The example shows urban agglomeration classification in Pune city areas ........................................................ 35
Figure 3-3 : An example of a detailed classified urban agglomerate area. The example shows parts of Delhi with overlay of GPS locations of Fire Stations ......................... 36
Figure 3-4 : Overlay analysis for Fire Risk Assessment ...................................................... 37
Figure 3-5 : Seismic zones of India ..................................................................................... 38
Figure 3-6 : Wind zone map of India (BMTPC, 2006) .......................................................... 40
Figure 3-7 : Climatic Zones of India ..................................................................................... 42
Figure 3-8 : Example of comparison of district level rankings for residential built-up area percentages and absolute areas (in sq km). The example shows a comparison for all 35 districts of Maharashtra State ............................................................................. 78
Figure 3-9 : Example of comparison of district level rankings for residential built-up areas and industrial areas (in sq km). The example shows a comparison for all 35 districts of Maharashtra State ............................................................................................... 79
Figure 5-1 : Three-tier architecture .................................................................................... 103
Figure 5-2 : High-level design of FDSS ............................................................................. 104
Figure 5-3 : User Interface for Base Analysis in FDSS. The example shows the States/UTs covered in the Pilot Phase of the study .................................................................. 106
Figure 5-4 : System administration interface ..................................................................... 107
Figure 5-5 : FDSS - Systems Architecture ......................................................................... 109
Figure 7-1 : Fire Stations locations operated by DFS with their current jurisdictional areas 153
Figure 8-1 : Location of operational Fire Stations in Rajasthan State with road and rail networks ................................................................................................................ 156
Figure 9-1 : Location of operational Fire Stations in Maharashtra State with road and rail networks ................................................................................................................ 159
Figure 10-1 : Location of operational Fire Stations in Jammu & Kashmir with road and rail networks ................................................................................................................ 162
Figure 11-1 : Location of operational Fire Stations in Puducherry district .......................... 166
Figure 12-1 : Location of operational Fire Stations in Andaman and Nicobar Islands ........ 169
Figure 13-1 : Locations of operational Fire Stations in Chandigarh UT .............................. 172
Figure 14-1 : Location of operational Fire Stations in Haryana State with road and rail networks ................................................................................................................ 175
Figure 15-1 : Locations of operational Fire Stations in Himachal Pradesh ......................... 178
Fire-Risk and Hazard Analysis in the Country
(National Report) Confidential Page 6 of 338
Figure 16-1 : Location of operational Fire Stations in Punjab State with road and rail networks ................................................................................................................ 181
Figure 17-1 : Location of operational Fire Stations in Uttarakhand State ........................... 184
Figure 18-1 : Locations of operational Fire Stations in Uttar Pradesh State ....................... 187
Figure 19-1 : Locations of operational and proposed Fire Stations in Dadra and Nagar Haveli UT ......................................................................................................................... 190
Figure 20-1 : Locations of operational and proposed Fire Stations in Daman UT .............. 193
Figure 20-2 : Locations of operational and proposed Fire Stations in Diu UT .................... 194
Figure 21-1 : Locations of operational and proposed Fire Stations in Goa ........................ 197
Figure 22-1 : Location of operational Fire Stations in Gujarat ............................................ 200
Figure 23-1 : Location of operational Fire Stations in Karnataka ....................................... 203
Figure 24-1 : Location of operational Fire Stations in Madhya Pradesh ............................. 206
Figure 25-1 : Location of operational Fire Stations in Andhra Pradesh .............................. 209
Figure 26-1 : Location of operational Fire Stations in Bihar ............................................... 212
Figure 27-1 : Location of operational Fire Stations in Kerala ............................................. 215
Figure 28-1 : Location of operational Fire Stations in Lakshadweep .................................. 218
Figure 29-1 : Location of operational Fire Stations in Tamil Nadu ..................................... 221
Figure 30-1 : Location of operational Fire Stations in Arunachal Pradesh ......................... 224
Figure 31-1 : Location of operational Fire Stations in Assam ............................................. 227
Figure 32-1 : Location of operational Fire Stations in Chhattisgarh ................................... 230
Figure 33-1 : Location of operational Fire Stations in Jharkhand ....................................... 233
Figure 34-1 : Location of operational Fire Stations in Manipur ........................................... 236
Figure 35-1 : Location of operational Fire Stations in Meghalaya ...................................... 239
Figure 36-1 : Location of operational Fire Stations in Mizoram .......................................... 242
Figure 37-1 : Location of operational Fire Stations in Nagaland State ............................... 245
Figure 38-1 : Location of operational Fire Stations in Orissa State .................................... 248
Figure 39-1 : Location of operational Fire Stations in Sikkim State .................................... 251
Figure 40-1 : Location of operational Fire Stations in Tripura State ................................... 254
Figure 41-1 : Location of operational Fire Stations in West Bengal ................................... 257
Figure 42-1: Locations of operational Fire Stations in India ............................................... 263
Figure 42-2: Locations of proposed urban and rural Fire Stations in India ......................... 264
Fire-Risk and Hazard Analysis in the Country
(National Report) Confidential Page 7 of 338
List of Tables
Table 2-1: Phase wise distribution of various States/UTs in the Country ............................. 29
Table 3-1: Cluster class morphology in land use maps ....................................................... 32
Table 3-2: Risk ranking schema for earthquake, wind and climatic zones ........................... 39
Table 3-3: District level ranking for individual (earthquake, wind and climatic) hazard and integrated hazards for all States/UTs of India .......................................................... 43
Table 3-4: District level geographical area, population, population density, residential built-up area, residential built-up area, and industrial area for all States/UTs of India ........... 60
Table 3-5: Grouping schema for ranking of exposure and vulnerability layers ..................... 77
Table 3-6: Weightage assigned in risk scoring schema for integration of hazard and exposure vulnerability into fire risk categories .......................................................... 80
Table 3-7: District risk rankings for all Phase States/UTs ................................................... 81
Table 5-1: Advantages of Open Source Platform .............................................................. 110
Table 6-1: Number of operational and additional Fire Stations and Fire Posts required in Delhi ...................................................................................................................... 118
Table 6-2: Revised number of operational and additional Fire Stations and Fire ............... 119
Table 7-1: Gap Analysis for the Delhi Fire Services .......................................................... 154
Table 7-2: State level Investment plan (in Crores Rupees) for Delhi Fire Services only considering gap in operational, new urban and new rural Fire Stations ................. 155
Table 8-1: Gap Analysis for the Rajasthan Fire Services .................................................. 157
Table 8-2: State level Investment plan (in Crores Rupees) for Rajasthan Fire Services only considering gap in operational, new urban and new rural Fire Stations ................. 158
Table 9-1: Gap Analysis for the Maharashtra Fire Services .............................................. 160
Table 9-2: State level Investment plan (in Crores Rupees) for Maharashtra State Fire Services only considering gap in operational and new urban Fire Stations ............ 161
Table 10-1: Gap Analysis for the Jammu and Kashmir Fire & Emergency Services .......... 163
Table 10-2: State level Investment plan (in Crores Rupees) for J&K Fire and Emergency Services only considering gap in operational, new urban and new rural Fire Stations .............................................................................................................................. 164
Table 11-1: Gap Analysis for the Puducherry Fire Services .............................................. 167
Table 11-2: State level Investment plan (in Crores Rupees) for Puducherry Fire Service Department only considering gap in operational and new urban Fire Stations ....... 168
Table 12-1: Gap Analysis for the Andaman and Nicobar Fire Services ............................. 170
Table 12-2: State level Investment plan (in Crores Rupees) for Andaman & Nicobar Police Fire Service Gaps for filling gap in operational and new Fire Stations (in Crores Rupees) ................................................................................................................. 171
Table 13-1: Gap Analysis for the Chandigarh Fire & Emergency Services ........................ 173
Table 13-2: State level Investment plan (in Crores Rupees) for Chandigarh Fire & Emergency Services Gaps for filling gap in operational and new Fire Stations (in Crores Rupees) ..................................................................................................... 174
Fire-Risk and Hazard Analysis in the Country
(National Report) Confidential Page 8 of 338
Table 14-1: Gap Analysis for the Haryana State Fire Services .......................................... 176
Table 14-2: State level Investment plan (in Crores Rupees) for Haryana Fire Services Gaps for filling gap in operational, new urban and new rural Fire Stations (in Crores Rupees) ................................................................................................................. 177
Table 15-1: Gap Analysis for the Himachal Pradesh Fire Services .................................... 179
Table 15-2: State level Investment plan (in Crores Rupees) for Himachal Pradesh Fire Services Gaps for filling gap in operational, new urban and new rural Fire Stations (in Crores Rupees) ..................................................................................................... 180
Table 16-1: Gap Analysis for the Punjab State Fire Services ............................................ 182
Table 16-2: State level Investment plan (in Crores Rupees) for Punjab Fire Services Gaps for filling gap in operational, new urban and new rural Fire Stations (in Crores Rupees) ................................................................................................................. 183
Table 17-1: Gap Analysis for the Uttarakhand Fire & Emergency Services ....................... 185
Table 17-2: State level Investment plan (in Crores Rupees) for Uttarakhand Fire & Emergency Services Gaps for filling gap in operational, new urban and new rural Fire Stations (in Crores Rupees) .................................................................................. 186
Table 18-1: Gap Analysis for the Uttar Pradesh Fire Services ........................................... 188
Table 18-2: State level Investment plan (in Crores Rupees) for Uttar Pradesh Fire Services Gaps for filling gap in operational, new urban and new rural Fire Ftations (in Crores Rupees) ................................................................................................................. 189
Table 19-1: Gap Analysis for the Dadra and Nagar Haveli Fire & Emergency Services .... 191
Table 19-2: State level Investment plan (in Crores Rupees) for Dadra & Nagar Haveli UT Fire and Emergency Services Gaps for filling gap in operational, new urban and new rural Fire Stations (in Crores Rupees) ................................................................... 192
Table 20-1: Gap Analysis for the Daman and Diu Fire & Emergency Services .................. 195
Table 20-2: State level Investment plan (in Crores Rupees) for Daman & Diu UT Fire and Emergency Services Gaps for filling gap in operational, new urban and new rural Fire Stations (in Crores Rupees) .................................................................................. 196
Table 21-1: Gap Analysis for the Goa Fire & Emergency Services .................................... 198
Table 21-2: State level Investment plan (in Crores Rupees) for Goa Fire and Emergency Services Gaps for filling gap in operational, new urban and new rural Fire Stations (in Crores Rupees) ..................................................................................................... 199
Table 22-1: Gap Analysis for the Gujarat Fire & Emergency Services ............................... 201
Table 22-2: State level Investment plan (in Crores Rupees) for Gujarat Fire and Emergency Services Gaps for filling gap in operational, new urban and new rural Fire Stations (in Crores Rupees) ..................................................................................................... 202
Table 23-1: Gap Analysis for the Karnataka Fire & Emergency Services .......................... 204
Table 23-2: State level Investment plan (in Crores Rupees) for Karnataka Fire and Emergency Services Gaps for filling gap in operational, new urban and new rural Fire Stations (in Crores Rupees) .................................................................................. 205
Table 24-1: Gap Analysis for the Madhya Pradesh Fire Services ...................................... 207
Table 24-2: State level Investment plan (in Crores Rupees) for Madhya Pradesh Fire Services Gaps for filling gap in operational, new urban and new rural Fire Stations (in Crores Rupees) ..................................................................................................... 208
Fire-Risk and Hazard Analysis in the Country
(National Report) Confidential Page 9 of 338
Table 25-1: Gap Analysis for the Andhra Pradesh Fire Services ....................................... 210
Table 25-2: State level Investment plan (in Crores Rupees) for Andhra Pradesh Disaster Response and Fire Services Gaps for filling gap in operational, new urban and new rural Fire Stations (in Crores Rupees) ................................................................... 211
Table 26-1: Gap Analysis for the Bihar State Fire Services ............................................... 213
Table 26-2: State level Investment plan (in Crores Rupees) for Bihar Fire Services Gaps for filling gap in operational, new urban and new rural Fire Stations (in Crores Rupees) .............................................................................................................................. 214
Table 27-1: Gap Analysis for the Kerala Fire & Rescue Services ...................................... 216
Table 27-2: State level Investment plan (in Crores Rupees) for Kerala Fire and Rescue Services Gaps for filling gap in operational, new urban and new rural Fire Stations (in Crores Rupees) ..................................................................................................... 217
Table 28-1: Gap Analysis for the Lakshadweep UT Fire Services ..................................... 219
Table 28-2: State level Investment plan (in Crores Rupees) for Lakshadweep UT Fire Services Gaps for filling gap in operational, new urban and new rural Fire Stations (in Crores Rupees) ..................................................................................................... 220
Table 29-1: Gap Analysis for the Tamil Nadu Fire & Rescue Services .............................. 222
Table 29-2: State level Investment plan (in Crores Rupees) for Tamil Nadu Fire and Rescue Services Gaps for filling gap in operational, new urban and new rural Fire Stations (in Crores Rupees) ..................................................................................................... 223
Table 30-1: Gap Analysis for the Arunachal Pradesh Fire Force ....................................... 225
Table 30-2: State level Investment plan (in Crores Rupees) for Arunachal Pradesh Fire Force Gaps for filling gap in operational, new urban and new rural Fire Stations (in Crores Rupees) ..................................................................................................... 226
Table 31-1: Gap Analysis for the Assam Fire Service Organization .................................. 228
Table 31-2: State level Investment plan (in Crores Rupees) for Assam Fire Service Organization Gaps for filling gap in operational, new urban and new rural Fire Stations (in Crores Rupees) .................................................................................. 229
Table 32-1: Gap Analysis for the Chhattisgarh Fire Services ............................................ 231
Table 32-2: State level Investment plan (in Crores Rupees) for Chhattisgarh Fire Services Gaps for filling gap in operational, new urban and new rural Fire Stations (in Crores Rupees) ................................................................................................................. 232
Table 33-1: Gap Analysis for the Jharkhand Fire Services ................................................ 234
Table 33-2: State level Investment plan (in Crores Rupees) for Jharkhand Fire Services Gaps for filling gap in operational, new urban and new rural Fire Stations (in Crores Rupees) ................................................................................................................. 235
Table 34-1: Gap Analysis for the Manipur Fire Services .................................................... 237
Table 34-2: State level Investment plan (in Crores Rupees) for Manipur Fire Services Gaps for filling gap in operational, new urban and new rural Fire Stations (in Crores Rupees) ................................................................................................................. 238
Table 35-1: Gap Analysis for the Meghalaya Fire & Emergency Services ......................... 240
Table 35-2: State level Investment plan (in Crores Rupees) for Meghalaya Fire and Emergency Services Gaps for filling gap in operational, new urban and new rural Fire Stations (in Crores Rupees) .................................................................................. 241
Fire-Risk and Hazard Analysis in the Country
(National Report) Confidential Page 10 of 338
Table 36-1: Gap Analysis for the Mizoram Fire Services ................................................... 243
Table 36-2: State level Investment plan (in Crores Rupees) for Mizoram Fire Services Gaps for filling gap in operational, new urban and new rural Fire Stations (in Crores Rupees) ................................................................................................................. 244
Table 37-1: Gap Analysis for the Nagaland Fire & Emergency Services ........................... 246
Table 37-2: State level Investment plan (in Crores Rupees) for Nagaland Fire & Emergency Services Gaps for filling gap in operational, new urban and new rural Fire Stations (in Crores Rupees) ..................................................................................................... 247
Table 38-1: Gap Analysis for the Orissa Fire Services ...................................................... 249
Table 38-2: State level Investment plan (in Crores Rupees) for Orissa Fire Services Gaps for filling gap in operational, new urban and new rural Fire Stations (in Crores Rupees) .............................................................................................................................. 250
Table 39-1: Gap Analysis for the Sikkim Fire & Emergency Services ................................ 252
Table 39-2: State level Investment plan (in Crores Rupees) for Sikkim Fire and Emergency Services Gaps for filling gap in operational, new urban and new rural Fire Stations (in Crores Rupees) ..................................................................................................... 253
Table 40-1: Gap Analysis for the Tripura Fire Services ..................................................... 255
Table 40-2: State level Investment plan (in Crores Rupees) for Tripura Fire Services Gaps for filling gap in operational, new urban and new rural Fire Stations (in Crores Rupees) ................................................................................................................. 256
Table 41-1: Gap Analysis for the West Bengal Fire & Emergency Services ...................... 258
Table 41-2: State level Investment plan (in Crores Rupees) for West Bengal Fire and Emergency Services Gaps for filling gap in operational, new urban and new rural Fire Stations (in Crores Rupees) .................................................................................. 259
Table 42-1: Demography of India as per Census 2011 ..................................................... 262
Table 42-2: State/UT level number of operational and new Fire Stations in entire India .... 266
Table 42-3: List of operational fire fighting vehicles available with Fire Services of All States/UTs (As on Nov, 2012) ............................................................................... 271
Table 42-4: Vehicle gap in operational Fire Stations of all States/UTs for their ideal jurisdiction area ..................................................................................................... 272
Table 42-5: Total gap in operational and new urban Fire Stations under their ideal jurisdiction areas ..................................................................................................................... 274
Table 42-6: Additional vehicle required for new rural Fire Stations under their ideal jurisdiction areas ................................................................................................... 276
Table 42-7: List of specialized equipment available with Fire Services of all States/UTs (As on Nov. 2012) ........................................................................................................ 278
Table 42-8: List of specialized equipment available with Fire Services of all States of India (As on Nov. 2012) (continued..) ............................................................................. 280
Table 42-9: Specialized equipment gap in operational Fire Station for ideal jurisdiction area .............................................................................................................................. 282
Table 42-10: Specialized equipment gap in operational Fire Station for ideal jurisdiction area (continued..) .......................................................................................................... 284
Fire-Risk and Hazard Analysis in the Country
(National Report) Confidential Page 11 of 338
Table 42-11: Total gap in specialized equipments for operational and new urban Fire Stations ................................................................................................................. 286
Table 42-12: Total gap in specialized equipments for operational and new urban Fire Station (Continued….) ....................................................................................................... 288
Table 42-13: Additional specialized equipment required for new rural Fire Stations .......... 290
Table 42-14: Additional specialized equipment required for new rural Fire Station (continued…) ......................................................................................................... 292
Table 42-15: Manpower requirement for Station officer and lower staff as per SFAC norm (2- shifts)..................................................................................................................... 294
Table 42-16: Manpower requirement for Station officer and lower staffs as per ARD, Delhi (2-shifts) ................................................................................................................ 294
Table 42-17: List of firefighting manpower available for operational Fire Stations in Fire Services of all States/UTs of India (As on Nov. 2012) ............................................ 296
Table 42-18: Firefighting manpower gap in operational Fire Stations for ideal jurisdiction area .............................................................................................................................. 297
Table 42-19: Total firefighting manpower gap for operational and new urban Fire Stations299
Table 42-20: Additional firefighting manpower required for new rural Fire Stations ........... 301
Table 42-21: Fire station building required for gap in operational, new urban and new rural Fire Stations (no. of bays)...................................................................................... 304
Table 42-22: Cost (Lakhs) of Fire Station building (no. of bays) required for gap in operational, new urban and new rural Fire Stations ............................................... 306
Table 42-23: Cost estimates (in Lakhs Rupees) for gap in fire fighting vehicles for operational and new urban Fire Stations ............................................................... 309
Table 42-24: Cost estimates (in Lakhs Rupees) for gap in fire vehicles for new rural Fire Stations ................................................................................................................. 311
Table 42-25: Cost estimate (in Lakhs Rupees) for gap in fire fighting specialized equipment for operational and new urban Fire Stations .......................................................... 314
Table 42-26: Cost estimate (in Lakhs Rupees) for gap in fire fighting specialized equipment for operational and new urban Fire Stations (contd…) ........................................... 316
Table 42-27: Cost estimate (in Lakhs Rupees) for gap in specialized fire equipment for new rural Fire Stations .................................................................................................. 318
Table 42-28: Cost estimate (in Lakhs Rupees) for gap in specialized fire equipment for new rural Fire Stations (continued…) ............................................................................ 320
Table 42-29: Annual cost estimates (in Lakhs Rupees) for manpower for entire India after filling up the gap in operational and new urban Fire Stations ................................. 322
Table 42-30: Cost estimate (In Lakhs Rupees) manpower in entire India for new rural Fire Stations ................................................................................................................. 324
Table 42-31: Annual recurring cost estimates (in Lakhs Rupees) for petrol, diesel, and lubricants after filling the gap in operational and new urban Fire Stations .............. 326
Table 42-32: Country level summary of Capital Expenditure required for filling the gap (in Crores Rupees) ..................................................................................................... 327
Table 42-33: Country level summary of Recurring Expenditure required for filling the gap (in Crores Rupees) ..................................................................................................... 328
Fire-Risk and Hazard Analysis in the Country
(National Report) Confidential Page 12 of 338
Table 42-34: Country level 10 year investment plan for Fire Services in entire India for filling gap in operational and new urban Fire Stations (in Crores Rupees) ...................... 329
Table 42-35: Country level 10 year investment plan for Fire Services of entire India for filling gap in operational, new urban and new rural Fire Stations (in Crores Rupees) ...... 329
Table 42-36: Estimated training requirements for fire personnel in Fire Services in entire India ...................................................................................................................... 332
Fire-Risk and Hazard Analysis in the Country
(National Report) Confidential Page 13 of 338
Acknowledgements
The assistance of Dr. P. M. Nair, Director General (DG), NDRF & CD, Shri Sandeep Rai Rathore, IG, NDRF & CD, Shri D. K. Shami, Dy. Fire Adviser, Shri Chandrashekhar, Director (Fire Project Cell), Shri Nakul Kumar Tarun, Dy. Director (Fire Project Cell), Shri Santosh Gupta, Assistant Director (Fire Project Cell), Shri Santosh J. Thomas, Assistant Director, (Fire Project Cell), NDRF & CD and other staff members of the Directorate of NDRF & CD is gratefully appreciated for giving this opportunity.
Our special thanks are due to Shri R. K. Srivastava, Joint-Secretary (DM), MHA, Shri Sanjay Agrawal, Director (DM), MHA and the project reviewing and monitoring committee consisting of Dr. P. M. Nair, DG, NDRF & CD, (Chairman), Dr G. A. Bhat (member), Lt. Col (retd.) P.K. Pathak, Consultant, NIDM (member), Shri D. K. Shami (member), and Shri Chandrashekhar (member – secretary), for sparing their valuable time in review of this report.
In addition, the support and valuable assistance of all the fire officials and staff from different State/UT Fire Services, in particular:
Pilot States/UTs: Dr. G. A. Bhat, DG, Fire and Emergency Services, J&K, Shri R. S. Sodhi, Director, Fire and Emergency Services, J&K; Shri M. V. Deshmukh, Director, Maharashtra Fire Service; Shri A. K. Sharma, Director, Delhi Fire Service, Shri G.C. Mishra, CFO, Delhi Fire Service; Shri S.B. Deol, DGP, Andaman & Nicobar Islands, Shri Surendra Sharma, Dy. S.P. and Shri Anyesh Roy, CFO Andaman & Nicobar Islands; Shri Balla Kristaya, Divisional Fire Officer, Puducherry; Shri Sudhakar, ADG, Civil Defence & Home Guard, Rajasthan, Jaipur, Shri Tarachand Meena, Director and Shri Manish Goel, Additional Director, Local Body Directorate, Rajasthan, Shri Ishwar Jat, CFO, Jaipur, Rajasthan;
Phase-I States/UTs: Shri M.L. Sharma, Fire Officer, Incharge, HQ, Fire and Emergency Services Chandigarh; Shri I. S. Chauhan, State Fire Officer, Haryana Fire Service; Shri B. Kamal Kumar, Director and Shri M.S. Sonkhla, CFO, Himachal Fire Service; Shri S.L. Kamboj, State Fire Officer, Punjab; Shri C.S. Jeena, CFO, Uttrakhand Fire Service; Shri P.K. Rao and Shri Arvind Kumar, Dy. Director, U.P. Fire Service;
Phase-II States/UTs: Shri R. Bannerjee, CEO; Shri V. Thiruppugazh, Additional CEO, and Shri Nisarg Dave, Sector Manager, Gujarat State Disaster Management Authority (GSDMA), Shri M.F. Dastoor, CFO, Ahmedabad, Gujarat; Shri Sanjay Kumar Shukla, Commissioner-cum-Director, Urban Administration and Development Department, Madhya Pradesh; Shri A. R. Infant, DGP/DG, Fire and Emergency Service, Karnataka; Shri Ashok Menon, Director, Fire and Emergency Services, Goa; Shri Rajesh Khurana, IGP-cum-Director, UTs of Dadra & Nagar Haveli, and Daman & Diu;
Phase-III States/UTs: Director General, State Disaster Response & Fire Services, Shri P. Venkateshwar, Director, State Disaster Response & Fire Services, Andhra Pradesh; Shri Abhyanand, DG-cum-Commandant General and Shri Alok Raj, IG-cum-Add. Commandant General, Home Guard & Fire Services; and Shri Ramesh Chandra, State Fire Officer, Bihar; DGP-cum-Commandant General, Shri K. S. Sivanandan, Director (Technical), Kerala Fire and Rescue Services; Shri Bholanath, Director General Police/Director, Shri Thiru. V. Ganesan, APA & Dy. Director (Admin), Shri Thiru. S. Vijyasekar, Dy. Director (Northern Region), Tamil Nadu Fire and Rescue Services; Shri Ajay Kumar, SP-cum-Chief Fire Officer, Lakshadweep Fire Services;
Phase-IV States/UTs: Shri D. P. Tarenia, DG, Shri G. K. Bhattacharya, ADG, Shri D. P. Biswas, OSD (retired ADG), West Bengal Fire and Emergency Services; Shri D. K. Bora, ADG-cum-Director, State Fire Service Organization, Assam; Shri Binoy Kumar Behera, ADG-cum-Director, Shri Pranabindu Acharaya, IG, Shri Sukanta Sethi, Chief Fire Officer, Orissa Fire Services; Shri J.K. Sharma, IGP, Shri H.S. Dhaliwal, Director, Shri Kim Aya, SP Fire Service Force, Shri Apang Tawang (the then SP Fire Service Force), Arunachal Pradesh; Shri L. Singsit, IGP-cum-Director, Shri Neilasa Sopfii, S. P.,Nagaland Fire and Emergency Services; Shri N. Noren Singh, Director, Manipur Fire Service; Shri C. Laldina, Sr. SP-cum-Director, Shri Zorammawia, previous DIG-cum-Director, Shri P.C. Lal Chunglura, Add. SP, Shri L. Varte, Station Officer, Mizoram Fire & Emergency Services; Shri Kuldeep Kumar, ADGP-cum-Director, Shri A.K. Das, Joint Director, Shri Tapan Roy, Maintenance Superintendent, Tripura Fire Service; Shri Suresh Prasad, State Fire Officer, Shri R. K. Thaur, Fire
Fire-Risk and Hazard Analysis in the Country
(National Report) Confidential Page 14 of 338
Station Officer, Shri Sudhir Kumar Verma, Fire Station Officer, Jharkhand Fire Service; Dr. Rohit Yadav, Commissioner UA&D & CEO, State Urban Development Agency; Shri B. L. Agrawal, Secretary, Department of Revenue & Disaster Management; Shri R.C. Patel, IG, Home Guard; Shri Lokeshwar Sahu, OSD; Shri B. L. Chandrakar, Executive Engineer & nodal Fire Officer, Municipal
Corporation of Raipur, Chattisgarh Fire Service; is gratefully acknowledged.
Fire-Risk and Hazard Analysis in the Country
(National Report) Confidential Page 15 of 338
Executive Summary
Fire service is one of the most important emergency response services in the country, which comes under the 12th schedule of the constitution dealing with Municipal functions. At present, fire prevention and fire fighting services are organized by the concerned States and Union Territories (UTs), and Urban Local Bodies (ULBs). Directorate of National Disaster Response Force and Civil Defence (NDRF&CD, Fire Cell), Ministry of Home Affairs (MHA) renders technical advice to the States, UTs, and central ministries on fire protection, prevention, and legislation. Fire services in Maharashtra, Haryana, Gujarat, Chhattisgarh, Madhya Pradesh (excluding Indore), and Punjab are under the respective Municipal Corporations. In the remaining States, it is under the respective Home Department.
The growth of fire-services in the country has been on an ad-hoc basis, without much scientific analysis of existing risks in different parts of the country. Varying risk scenarios need different types of equipment. The risk varies with geographical location such as hilly-area, coastal-area, desert–area, and with residential (high-rise, medium, and low rise-buildings), industrial, commercial area or a combination of these. Moreover, lack of knowledge management for future planning and institutional capacity and funds are also seen as one of the major challenges in addressing improvements in Fire and Emergency Services in the country. As per a recent analysis by the Standing Fire and Advisory Council (SFAC), the overall deficiency in the country in terms of number of Fire Stations is 97.54%, in terms of fire fighting and rescue vehicles is 80.04% and in terms of fire personnel is 96.28%, respectively, which is quite alarming (NDMA Guideline, 2012; CR SFAC, 2011). In consideration of this and the increasing fire risks from various hazards, the Directorate of NDRF&CD, Fire Cell, MHA planned a study called “Fire Hazard and Risk Analysis in the Country for Revamping the Fire Services in the Country”, to identify existing gaps in terms of availability and requirement of Fire Stations, capacity-building, trained man-power and fire-fighting, rescue, and other specialized equipments.
The broad objectives of the study are:
To carry out GIS thematic map based Fire Hazard and Risk analysis though overlaying hazards and quantified risk, and classify the districts as base units into appropriate risk categories such as very high, high, medium, or low.
To prepare a detailed Investment and Financing Plan for next 10 years for up-gradation, expansion and modernization of Fire Services, based on existing situation analysis and risk based actual requirements.
To develop an open-source GIS based software called as a Fire Decision Support System (FDSS) containing administrative boundaries, quantified risk GIS layers and with capability of estimation of financial implications for desired capacity development.
To prepare an Institutional Assessment and Capacity Building Plan, based on field-data collection, enquiry, spatial analysis and understanding of the availability and gaps in the fire service infrastructure.
Role of Fire Services
The primary role of fire services has been to attend to fire incidents. Besides firefighting, fire department also attends to other emergencies such as building collapse, road traffic accidents, human and animal rescue etc., and other special service calls. Some fire services also attend medical emergencies for transportation of casualties through ambulances maintained by them. Similarly, some States, like Delhi, have separate flood department with
Fire-Risk and Hazard Analysis in the Country
(National Report) Confidential Page 16 of 338
rescue boats and trained divers. The Fire Services maintain skeletal facilities to act as „first responders‟ and wait until assistance from the flood department arrives. It is therefore, considered appropriate that the specialized facilities for such jobs is maintained and operated by the concerned department.
As indicated in the National Disaster Management Authority (NDMA) guidelines, Fire Service is one of the Emergency Support Functions (ESF). Based on DM Act 2005, various States/UTs have also formulated State Disaster Management Authorities (SDMA‟s) and District Disaster Management Authorities (DDMA‟s) both of which consider Fire Service as an ESF. It is, therefore, evident that the role of Fire Services has become multi-dimensional that includes not only attending fire incident calls but also various other emergencies. Accordingly, fire services in the jurisdiction of the respective Fire Station are required to be prepared with suitable types of equipment to deal with various emergencies.
The role of fire services also includes effective fire prevention, creating awareness on fire safety, and enforcing the inbuilt fire protection arrangements for various types of occupancies in line with National Building Code (NBC) part – IV. However, majority of the States/Municipal Fire Services are unable to enforce the fire safety provisions due to a lack of appropriate directives from the authorities controlling the function of fire services. Some of the Fire Services do not adhere to NBC and have created their own fire-safety building bye-laws, e.g., Mumbai Fire Brigade. It may be noted that in-built fire safety arrangements and escape facilities are much more important than having a fire service within the premises without the above facilities. It is, therefore, necessary to enforce the fire-safety provisions through appropriate directives to all the States/UTs by the Ministry of Home Affairs (MHA) directly or through DG, NDRF & CD office.
In addition to the regular fire services, various other organizations/ industries, such as Ports, Airports, Defence, Power, Oil and Gas, Steel, Heavy Engineering, Fertilizers, Chemicals etc. have their own fire service set-ups (including their own captive resources), in order to provide fire protection to their facilities and some of them at times provide support to local fire services on request. All of them have their rules and regulations concerning fire safety. For example, Oil India Safety Directorate (OISD) norms for Oil and Gas Industries, International Civil Aviation Organization (ICAO) norms for Airports, Tariff Advisory Committee (TAC) regulations- now discontinued, for industries etc. and Electricity Rules for power sector.
Safety of highly hazardous processing and storage industries requires 100 percent round the clock built-in and functional fire protection arrangements with trained fire fighters as well as onsite and off-site disaster management plans. Fire services are not expected to create the infrastructure to independently tackle such emergencies within the industry, as it may be not be possible to do so. However, they are expected to support any on-site and off-site fire fighting to protect surrounding populations and handle such incidents during transportation through the civil areas. Moreover, local fire services should have mutual-aid schemes with all the industries in their jurisdiction and must be aware of the various arrangements available with them in order to provide efficient support, in case of an emergency.
Approach for Fire Hazard and Risk Analysis
In order to conduct this study for India, a vast country covering all the States and Union Territories (UTs), the study has been conducted in a phased manner. In the initial phase, the pilot study comprises of 6 States and UTs (Jammu & Kashmir, Rajasthan, Maharashtra, Delhi, Andaman & Nicobar Island, and Puducherry), and in subsequent phases (Phase-I to Phase-IV) rest of States/UTs have been taken up as detailed in Section 2.3.
Fire-Risk and Hazard Analysis in the Country
(National Report) Confidential Page 17 of 338
Field Surveys for Fire Infrastructure Data
To collect and collate the information on Fire Infrastructure of all the States/ UTs, RMSI team developed two detailed forms “Headquarter Data Collection Form” and individual “Fire Station Field-Survey Form”. RMSI team field-surveyed all the Fire Stations in all States/UTs for collecting detailed fire Infrastructure information. The detailed information collected includes address of Fire Station, name of Fire Station In-Charge, emergency contact numbers, communication between Fire Station control room, public and headquarter control room; Fire Station building including staff accommodation and barracks; fire fighting vehicles and specialized equipment; fire personnel, their duty pattern and pay-scales; water availability and water sources for fire vehicles, fire-risk in the jurisdiction of Fire Station and its geographical coordinates (latitude, longitude -by using a Global Positioning System, GPS) etc. All this information for each and every Fire Station has been digitally converted and is available through Fire Decision Support System (FDSS), which can generate a Fire Station report at the click of a button.
GIS based Fire Hazard and Risk Analysis
In general, fire risk is defined as the combination of hazard potential, exposure, and vulnerability:
Risk = F (Hazard potential x Exposure x Vulnerability)
The occurrence of fire incidents that constitute a threat for the population and exposed infrastructure of a certain region is associated with economic and human losses, always as a function of the exposure conditions and the vulnerability of the exposed assets in that particular region. Different natural hazards such as seismic (earthquake), climatic, and wind are considered in risk analysis. Additionally hill zone are also considered in risk analysis due to increased fire risk from wooden houses and heating provisions in cold areas.
For estimating exposure and its vulnerability, detailed urban agglomerate classification maps generated from high-resolution satellite images have been used. With the help of remote sensing techniques applied on high-resolution satellite imageries, various types of urban agglomeration areas have been demarcated. These include urban, semi-urban, building blocks, and industrial and rural villages‟ built-up areas of different densities (high medium, low). For exposure vulnerability, 4 different layers such as population density, residential built-up areas, high-rise building block density, and industrial areas have been developed individually at the district level. For assessing fire risk, both absolute built-up areas in sq km as well as built-up areas percent (ratio of built-up areas to the total area) are considered as important parameters. It is obvious that industrial areas in districts have much lower percentages than residential built-up areas. However, presence of industrial areas in a district has a significant influence in assessing fire risk. Hence, industrial areas in absolute terms (sq km) have been considered in risk ranking.
In order to assess the impact of each exposure vulnerability type, a vulnerability score/ ranking has been assigned to each layer at their base unit. The vulnerability score represents the level of vulnerability (very high to negligible) of a specific type of exposure in response to the occurrences of small and medium fire incidents. The natural break in value distribution has been considered for defining the ranking class.
After developing ranking of individual units of hazard and exposure vulnerability, GIS layers have been overlaid on top of each other and a spatial analysis has been performed for integration in GIS environment. For combining hazard and risk, Weighted Factor Analysis (WFA) in GIS environment has been performed. Weighted ranking scores have been used in the integration analysis and quantified risk distribution for each district. Values of weighted factor depend upon the importance of a particular hazard/ vulnerability class in risk analysis. For integration of hazards, equal weights have been assigned to wind, seismic and climatic hazards, while double weights have been given to hill zoning. This is because, in hilly terrain,
Fire-Risk and Hazard Analysis in the Country
(National Report) Confidential Page 18 of 338
wooden houses and heating provisions in buildings increase the chances of fire-incidences, and thus have been given higher weightage.
After obtaining integrated individual weighted score for hazard and exposure vulnerability, fire risk categories have been obtained in quantitative terms by further integration of hazard and exposure vulnerability. It is obvious that in the occurrence of the number of fire incidents in a given district, exposure vulnerability has more importance than the prevailing hazard. Hence, in quantified integration, double weights have been assigned to exposure vulnerability. The quantified numeric values of district risk scores are again grouped into four descriptive categories of district level risk ranking (very high, high, medium, and low).
As per project scope of work, countrywide district level fire hazard and risk analysis has been carried out. However, it is obvious that the fire risk is not uniformly distributed throughout the districts in both urban and rural areas. Considering the above fact, RMSI has performed GIS based risk analysis, based on distribution of population agglomeration by defining built-up areas into different risk categories, such as high-density urban, low-density urban, sub-urban, and village. Moreover, distinct demarcated industrial areas have also been considered in the analysis.
Review of International and National Norms
To estimate the gaps from the existing position in terms of number of Fire Stations and their appropriate location, the RMSI team followed scientific and innovative GIS based response time network analysis approach involving various norms and regulations. Various international and national norms on response time have been reviewed. Response time is defined as “en route time (in minutes) taken by the fire fighting vehicle from the Fire Station to the fire emergency scene.” Different counties follow different norms on response time such as:
Germany: response time in urban areas varies from 8 to 15 minutes
Japan: response time varies from 5 to 10 minutes, depending upon the location of the building
USA: response time varies from (3-4) to 8 minutes
United Kingdom: response time varies from 5 to 8 minutes
India: SFAC norms recommended response time for first fire tender is 3, 5, and 7 minutes respectively depending on risk category A, B, and C in urban area and 20 minutes in rural area. The norms also defined one Fire Station in an area of 10 sq km in urban area; and 50 sq km in rural area.
To investigate the practicability of SFAC norms, RMSI team carried out a number of simulations using GIS based network analysis. With these simulations, RMSI demonstrated that two SFAC norms (response time and area-based) are not in synchronization with each other, and recommended revised response time based norms for positioning a Fire Station, as response area will vary from place to place depending upon the road network.
Depending upon the risk category, the recommended response time for first
fire tender is 5 to 7 minutes in urban areas and 20 minutes in rural areas
Fire-Risk and Hazard Analysis in the Country
(National Report) Confidential Page 19 of 338
Summary of Findings for Fire Hazard and Risk Analysis for India
As a whole, presently in India, there are 2,987* operational Fire Stations spread over 35
States/UTs.
Based on detailed demarcated built-up areas and GIS based network analysis (response time analysis), ideal jurisdiction boundaries have been demarcated for all operational Fire Stations excluding areas served by other agencies, such as ports, airports, military cantonments, thermal/nuclear power plants, refineries etc. The remaining areas, not covered under ideal jurisdiction of operational Fire Stations, are also divided for ideal jurisdictions of new proposed Fire Stations. The requirements for fire fighting and rescue vehicles and specialized equipments are based on ideal served population, population density, and built-up areas within ideal jurisdiction boundary.
Fire Station Gap Analysis
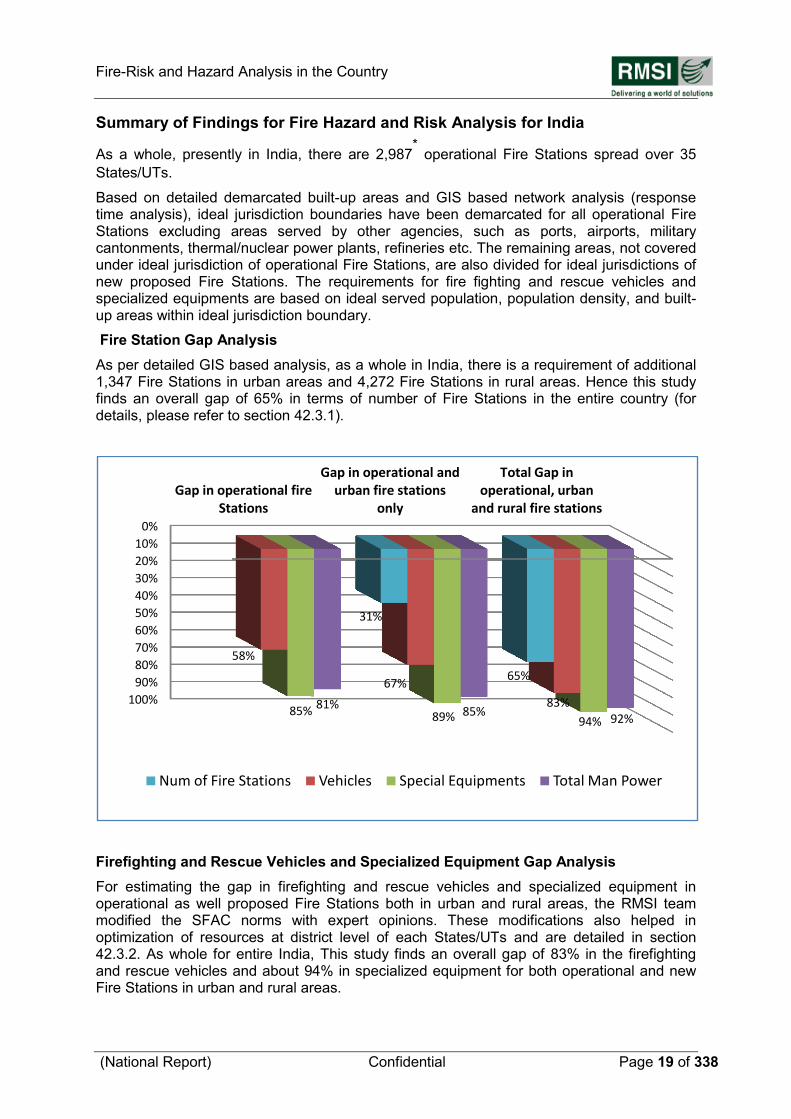
As per detailed GIS based analysis, as a whole in India, there is a requirement of additional 1,347 Fire Stations in urban areas and 4,272 Fire Stations in rural areas. Hence this study finds an overall gap of 65% in terms of number of Fire Stations in the entire country (for details, please refer to section 42.3.1).
Firefighting and Rescue Vehicles and Specialized Equipment Gap Analysis
For estimating the gap in firefighting and rescue vehicles and specialized equipment in operational as well proposed Fire Stations both in urban and rural areas, the RMSI team modified the SFAC norms with expert opinions. These modifications also helped in optimization of resources at district level of each States/UTs and are detailed in section 42.3.2. As whole for entire India, This study finds an overall gap of 83% in the firefighting and rescue vehicles and about 94% in specialized equipment for both operational and new Fire Stations in urban and rural areas.
0%
10%
20%
30%
40%
50%
60%
70%
80%
90%
100%
Gap in operational fire Stations
Gap in operational and urban fire stations
only
Total Gap in operational, urban
and rural fire stations
31%
65%
58%
67%
83% 85% 89% 94%
81% 85%
92%
Num of Fire Stations Vehicles Special Equipments Total Man Power
Fire-Risk and Hazard Analysis in the Country
(National Report) Confidential Page 20 of 338
Fire Personnel Gap Analysis
For estimating the gap in fire personnel in operational as well new proposed Fire Stations both in urban and rural areas, the RMSI team used Administrative Reform Department (ARD, Delhi) norms based on duty pattern (double-shift) prevalent in Delhi as ARD has already optimized the fire manpower requirement in comparison to what has been suggested in SFAC norms. The current duty pattern of fire personnel varies from State to State. Some States have 8 hours (e.g., West Bengal, Tripura), 12 hours (e.g., Delhi), and 24 hours (e.g., Orissa, Jharkhand, Madhya Pradesh) duty patterns, and RMSI team estimated for manpower requirement for double shift duty pattern (12 hours) (for details, please refer to section 42.3.3). Thus, as a whole in entire India, this study finds an overall gap of 92% in fire personnel considering double shift duty pattern.
Fire Prevention Wing
In addition to fire fighting staff in State Fire Services, there is an urgent need for a dedicated and well-coordinated State/UT Fire Prevention Wing for inspection, awareness generation, and training in schools, colleges, hospitals, shopping malls, cinema halls, high-rise buildings, industries, govt. offices, public buildings etc., need further strengthening so that recurrence of the fire incidences similar to that at the Advance Medical Research Institute (AMRI), Kolkata, in terms of their magnitude and frequency can be reduced. Some of States (e.g., Tamil Nadu, Goa, Delhi, and Andhra Pradesh) having a full-fledged dedicated Fire Prevention Wing and conducting awareness generation program on frequently. As a whole, most of the States fire services lack in awareness generation. Hence there is need to develop a dedicated Fire Prevention Wing to make people familiar with common fire safety measures and its implementation.
Accordingly, to support the Heads of Fire Services in different States/UTs, additional officers at the levels of Director (Technical), Joint Director (Technical), Deputy Director (Technical), Chief Fire Officer (CFO), Dy Chief Fire Officer (Dy-CFO), Divisional Fire Officer (DFO), and Assistant Divisional Fire Officer (ADFO) have been suggested (for details, please refer to section 42.3.3). It should be kept in mind that the number of officers suggested for above designations would vary from State to State or UT to UT depending upon various factors such as presence of urban agglomerations, industrial set ups including hazardous units, State‟s/ UT‟s current administration pattern etc.
Fire Station, District, State, and Country Level Report Generation
The detailed report of Operational Fire Stations, District and State/UT level report for fire infrastructure and gap analysis is also available through the Fire Decision Support System (FDSS), which can generate reports for each Operational Fire Station, district, and State level at the click of a button.
Roadmap for Investment and Financial Plan for Next 10 Years
The other tasks include the development of Investment and Financial Plan, Institutional Assessment & Capacity Building Plan along with a dynamic web-based Fire Decision Support System (FDSS). As detailed in section 42.5, the detailed investment and financial plan at State/ UT level includes estimation of capital cost for infrastructure, fire fighting and rescue vehicles, and specialized fire and communication equipment. The recurring expenditure cost includes fire personnel cost depending upon pay-scales at various levels; staff uniform cost, and Personal Protective Equipment (PPE); annual vehicle and specialized equipment maintenance cost, petrol, diesel, and lubricant (PDL); building maintenance; office and training expenses etc. The detailed roadmap and investment plan (Section 42.5) for the next 10-years includes both capital and recurring expenditures. RMSI analysis estimates a total investment of about Rs 382,112 Crores (Table 42-35) spread over a
Fire-Risk and Hazard Analysis in the Country
(National Report) Confidential Page 21 of 338
period of 10 years for revamping the fire services in the country including inflationary factors and after filling the gaps for both operational and proposed urban and rural Fire Stations.
Prioritization of New Fire Stations
The prioritization of new Fire Stations in each State/UT for both rural and urban areas has been detailed in section 42.6. Accordingly, separate priority ranking for both urban and rural areas are given in State/UTs report
Avenues for Fund Generation
The Fire & Emergency Services in the country can generate new avenues for funds from the following:
Introduction of Fire Tax (1% of existing property tax)
Introduction of Fire Cess, which can be collected for auditing and inspecting various
residential, commercial, and industrial occupancies for adoption of Fire Safety
Measures besides training public manpower for use of first aid firefighting equipment
Training programs at different levels and durations to private sector employees on
chargeable basis
Sale of condemned fire appliances, equipments, uniform articles and general store
items
Capitation fee for scrutiny of building plans.
Capacity Building and Training Facilities
The study finds that there are substantially gaps in Capacity Building and Training among the fire personnel in various States/ UTs of India. The detailed Capacity Building and Training need assessment for various levels have been discussed in section 42.8. Additionally, RMSI team is making a separate report of Capacity Building and Training Infrastructure for all States/UTs in the country
Limitations of the Study
Limitations of the study are given in section 42.9.
Key Recommendations
The State-specific recommendations have been made in the detailed report of each State/UT and this report concludes with the key recommendations and is detailed in section 42.10. As discussed in previous sections on gap analysis, there are significant gaps in the Operational Fire Stations in terms of firefighting and rescue vehicles, specialized equipment, and firefighting manpower. Also, there are significant gaps in the required number of new Fire Stations both in urban and rural areas. In short, Fire and Emergency Services in the country can be revamped in the next 10 years to desired level provided sufficient funds and trained firefighting manpower are made available.
Report Structure
This National Report for the entire country is divided in three parts:
Part A: This part comprises of chapters 1-6, which are common for all the 35 States/UTs Fire Service for which this study is conducted.
Chapter 1 provides brief details of project background, role of fire services, objective
and scope of study
Chapter 2 outlines the methodology adopted and data development
Chapter 3 provides details on GIS based fire hazard and risk analysis
Fire-Risk and Hazard Analysis in the Country
(National Report) Confidential Page 22 of 338
Chapter 4 provides a brief overview of field-survey of individual Fire Station and
headquarter data collection and approach for stakeholder analysis
Chapter 5 briefly explains the Development of Fire Decision Support System (FDSS)
Chapter 6 examines international and national norms
Part B: This part comprises of Chapters 7-41, which are specific to the State/UT Fire Service being discussed.
Chapter 7 provides summary of analysis for the Delhi State
Chapter 8 provides summary of analysis for the Rajasthan State
Chapter 9 provides summary of analysis for the Maharashtra State
Chapter 10 provides summary of analysis for the Jammu & Kashmir State
Chapter 11 provides summary of analysis for the Puducherry UT
Chapter 12 provides summary of analysis for the A&N Islands UT
Chapter 13 provides summary of analysis for the Chandigarh UT
Chapter 14 provides summary of analysis for the Haryana State
Chapter 15 provides summary of analysis for the Himachal Pradesh State
Chapter 16 provides summary of analysis for the Punjab State
Chapter 17 provides summary of analysis for the Uttarakhand State
Chapter 18 provides summary of analysis for the Uttar Pradesh State
Chapter 19 provides summary of analysis for the Dadra and Nagar Haveli UT
Chapter 20 provides summary of analysis for the Daman and Diu UT
Chapter 21 provides summary of analysis for the Goa State
Chapter 22 provides summary of analysis for the Gujarat State
Chapter 23 provides summary of analysis for the Karnataka State
Chapter 24 provides summary of analysis for the Madhya Pradesh State
Chapter 25 provides summary of analysis for the Andhra Pradesh State
Chapter 26 provides summary of analysis for the Bihar State
Chapter 27 provides summary of analysis for the Kerala State
Chapter 28 provides summary of analysis for the Lakshadweep UT
Chapter 29 provides summary of analysis for the Tamil Nadu State
Chapter 30 provides summary of analysis for the Arunachal Pradesh State
Chapter 31 provides summary of analysis for the Assam State
Chapter 32 provides summary of analysis for the Chhattisgarh State
Chapter 33 provides summary of analysis for the Jharkhand State
Chapter 34 provides summary of analysis for the Manipur State
Chapter 35 provides summary of analysis for the Meghalaya State
Chapter 36 provides summary of analysis for the Mizoram State
Chapter 37 provides summary of analysis for the Nagaland State
Chapter 38 provides summary of analysis for the Orissa State
Chapter 39 provides summary of analysis for the Sikkim State
Chapter 40 provides summary of analysis for the Tripura State
Chapter 41 provides summary of analysis for the West Bengal State
Part C: This part comprises of detailed analysis at country level.

Fire-Risk and Hazard Analysis in the Country
(National Report) Confidential Page 23 of 338
PART -A
Fire-Risk and Hazard Analysis in the Country
(National Report) Confidential Page 24 of 338
1 Introduction
1.1 Background
Fire service is one of the most important emergency response services. In India, Fire services come under the 12th Schedule of the constitution dealing with Municipal functions. At present, fire prevention and fire fighting services are organized by the concerned States and Union Territories (UTs), and Urban Local Bodies (ULBs). Ministry of Home Affairs (MHA) renders technical advice to the States, UTs, and central ministries on fire protection, prevention, and legislation. Fire services in Maharashtra, Haryana, Gujarat, Chhattisgarh, Madhya Pradesh excluding Indore, and Punjab are under the respective Municipal Corporations. In remaining States/UTs, it is under the Home Department (Figure 1-1).
Figure 1-1: Distribution of fire services by various States/UTs by administrative
organization
Fire-Risk and Hazard Analysis in the Country
(National Report) Confidential Page 25 of 338
1.2 Role of Fire Services
As far as the role of fire services is concerned, the primary job of fire services has been to attend to fire incidents. However, they also attend to other emergencies like rescue from building collapse, road traffic accidents, human and animal rescue etc., and other special service calls. Some fire services also attend medical emergencies for transportation of casualties through ambulances maintained by them. Similarly, some States have separate flood department with rescue boats and trained divers, like Delhi. The Fire Services maintain skeleton facility to act as „first responder‟ and wait until assistance from flood department is reached. It is therefore, considered appropriate that the specialized facilities for such job is maintained and operated by the concerned department.
As indicated in the National Disaster Management Authority (NDMA) guidelines, Fire Services is one of the Emergency Support Functions (ESF). Based on DM Act 2005, various States have also formulated State Disaster Management Authorities (SDMA‟s) and District Disaster Management Authorities (DDMA‟s) both of which consider Fire Service as an ESF. It is therefore evident that the role of Fire Service is multi-dimensional that includes attending various emergencies. Accordingly, fire services are required to be prepared with suitable types of equipment to deal with various emergencies arising in the jurisdiction of the respective Fire Station.
The role of fire services also includes effective fire prevention, creating awareness on fire safety, and enforcing the inbuilt fire protection arrangements for various types of occupancies in line with National Building Code (NBC) part – IV. However, some of the States/Municipal Fire Services are unable to enforce the fire safety provisions due to a lack of appropriate directives from the authorities controlling the function of fire services. Some of the Fire Services do not adhere to NBC and have created their own fire-safety building bye - laws, e.g., Mumbai Fire Brigade. It may be noted that in-built fire safety arrangements and escape facilities are much more important than having a fire service within the premises without the above facilities. It is, therefore, necessary to enforce the fire-safety provisions through appropriate directives to all the States/UTs by the Ministry of Home Affairs (MHA) directly or through DG, NDRF & CD office.
In addition to the regular fire services, various other organizations/ industries, such as Ports, Airports, Defence, Power, Oil and Gas, Steel, Heavy Engineering, Fertilizers, Chemicals etc. have their own fire service set-ups (including their own captive resources), in order to provide fire protection to their facilities and some of them at times provide support to local fire services on request. All of them have their rules and regulations concerning fire safety. For example, Oil India Safety Directorate (OISD) norms for Oil and Gas Industries, International Civil Aviation Organization (ICAO) norms for Airports, Tariff Advisory Committee (TAC) regulations- now discontinued, for industries etc. and Electricity Rules for power sector.
Safety of highly hazardous processing and storage industries requires 100 percent round the clock built-in and functional fire protection arrangements with trained fire fighter as well as onsite and off-site disaster management plans. Fire services are not expected to create the infrastructure to independently tackle such emergencies within the industry, as it may be not be possible to do so. However, they are expected to support any on-site and off-site fire fighting to protect surrounding populations and handle such incidents during transportation through the civil areas. Moreover, local fire services should have mutual-aid schemes with all the industries in their jurisdiction and must be aware of the various arrangements available with them in order to provide efficient support, in case of an emergency.
The growth of fire-services in the country has been on an ad-hoc basis, without much scientific analysis of existing risks in different parts of the country. Varying risk scenarios need different types of equipments depending upon the risk and geographical location such
Fire-Risk and Hazard Analysis in the Country
(National Report) Confidential Page 26 of 338
as hilly-area, coastal-area, desert–area, and residential (high-rise, medium, and low rise-buildings), industrial, commercial area or a combination of these. Moreover, lack of knowledge management for future planning and institutional capacity and funds are also seen as major challenges in addressing improvements in fire and emergency services in the country. As per a recent analysis by the Standing Fire and Advisory Council (SFAC), the overall deficiency in the country in number of Fire Stations is 97.54%, in fire fighting & rescue vehicles 80.04% and in fire personnel is 96.28%, respectively, which is quite alarming (NDMA Guideline, 2012, CR SFAC, 2011).
In consideration of this and the increasing risks from various hazards, such as Fire Following an Earthquake (FFEQ), and the rapid pace of urbanization and industrialization in the country, the Directorate of National Disaster Response Force and Civil Defence (NDRF&CD, Fire Cell), MHA felt the need for a comprehensive study to identify existing gaps in terms of availability and requirement of Fire Stations, capacity-building, in terms of trained man-power and fire-fighting, rescue, and other specialized equipments. This comprehensive study aims at preparing a perspective plan for the next 10 years for revamping the fire services in the country.
1.3 Objective of the study
The broader objective of this study is to prepare a Capital Investment and Institutional Strengthening plan for accelerated development of fire services in the country.
1.4 Scope of the study
The study area for this assignment is the entire country under the Directorate of NDRF & Civil Defence (Fire). The scope of the assignment will include, inter alia, the following activities:
1. Fire Hazard & Risk Analysis: Carry out a GIS (Open Source) based fire hazard and risk analysis and identify the gaps in fire services in terms of fire fighting vehicles, specialized equipment, and trained fire personnel.
2. Investment and Financing Plan: Assess the status, availability and distribution of the fire service infrastructure under the Directorate of NDRF & Civil Defence (Fire Cell) by conducting field investigations and interviews. It is expected to conduct an investigation to assess the gaps and needs for future planning and upgradation/ modernization of the fire service infrastructure in the country in a quantified approach. As part of the Investment and Financing Plan, it is also expected to estimate the Capital and O&M Investment plan for the next 10 years and the investment priorities.
3. Institutional assessment and capacity building plan: Based on field-data collection, enquiry, spatial analysis and understanding on the availability and gaps in the fire service infrastructure, and prepare an institutional assessment and capacity-building plan for the department. Institutional Assessment and Capacity Building Plan will include but will not be limited to understanding the policies, regulations, strategies and programs of the department; existing legal and institutional mechanisms, issues and constraints of effective management; and training needs and capacity of the department‟s resources. Based on a comprehensive understanding of the mentioned variables, it is expected to prepare a consolidated national report and key recommendations for the Directorate of NDRF & CD (Fire Cell). It is also expected to explore the possibility of funding sources and provide recommendations for improvements to ensure appropriate financing mechanisms for capital expenditure, and for operation and maintenance.
Fire-Risk and Hazard Analysis in the Country
(National Report) Confidential Page 27 of 338
2 Technical Details on Methodology and Data Development
2.1 Understanding of the Scope of Work
The primary objective of this comprehensive study on “Fire Hazard and Risk Analysis in the Country” is to prepare a capital investment and institutional strengthening plan for accelerated Development of Fire Services in the country. To achieve this objective of the study, the Directorate of NDRF & CD has defined the broad scope of the work as:
1. Risk and Hazard Analysis
Identifications of gaps in the existing fire services 2. Investment and Financial Plan 3. Institutional Assessment and Capacity Building Plan
Including survey of NFSC Nagpur and regional fire training Centers
As part of the Risk and Hazard Analysis, it is expected to carry out a GIS based hazard, risk analysis at base unit (district) level, and identify the gaps in the existing fire services. Risk assessment of forest fire is not included under the present scope of work. The infrastructures of forest department, privately owned fire safety infrastructure, infrastructures in restricted areas like military cantonments and airbases, and ammunition depots; nuclear facilities such as nuclear power plants, nuclear research reactors, heavy water plants; and mines, ports, airports, and oil exploration and oil refineries are excluded from the study. While assessing the infrastructure for the Investment and Financing Plan, RMSI has focused specifically for States/UTs Fire & Emergency Services. However, it may please be noted that RMSI team has also made efforts to get details of areas served by other agencies as well, so that requirement of establishing Fire Stations in these areas does not become part of the Gap analyses.
As part of the „Investment and Financing Plan‟, it is expected to assess the status, availability and distribution of the fire service infrastructure under the jurisdiction of Director General (NDRF & Civil Defence) through conducting field investigations and interviews. It is also expected to conduct an investigation to assess the gaps and needs for future planning, up gradation/ modernization of the fire service infrastructure in the country through a quantified approach. As part of the Investment and Financing Plan, it is also expected to estimate the Capital and O&M Investment plan for the next 10 years and the investment priorities. Based on the field data collection, enquiry, spatial analysis and understanding on the availability and gaps in the fire service infrastructure, it is expected to prepare an institutional assessment and capacity-building plan for the department. Institutional Assessment and Capacity Building Plan will include but not limited be to understanding the polices, regulations, strategies and programs of the department; existing legal and institutional mechanisms, issues and constrains of effective management; training needs and capacity of the department‟s resources. Based on a comprehensive understanding of the mentioned variables, it is expected to prepare a consolidated National Report and key recommendations for the Director General (NDRF & Civil Defence) for all the Fire Stations under jurisdiction of the Directorate of NDRF & CD. Moreover, the possibility of funding sources will also be explored, and recommendations will be made for improvements to ensure good financing mechanisms for capital expenditure and operation and maintenance.
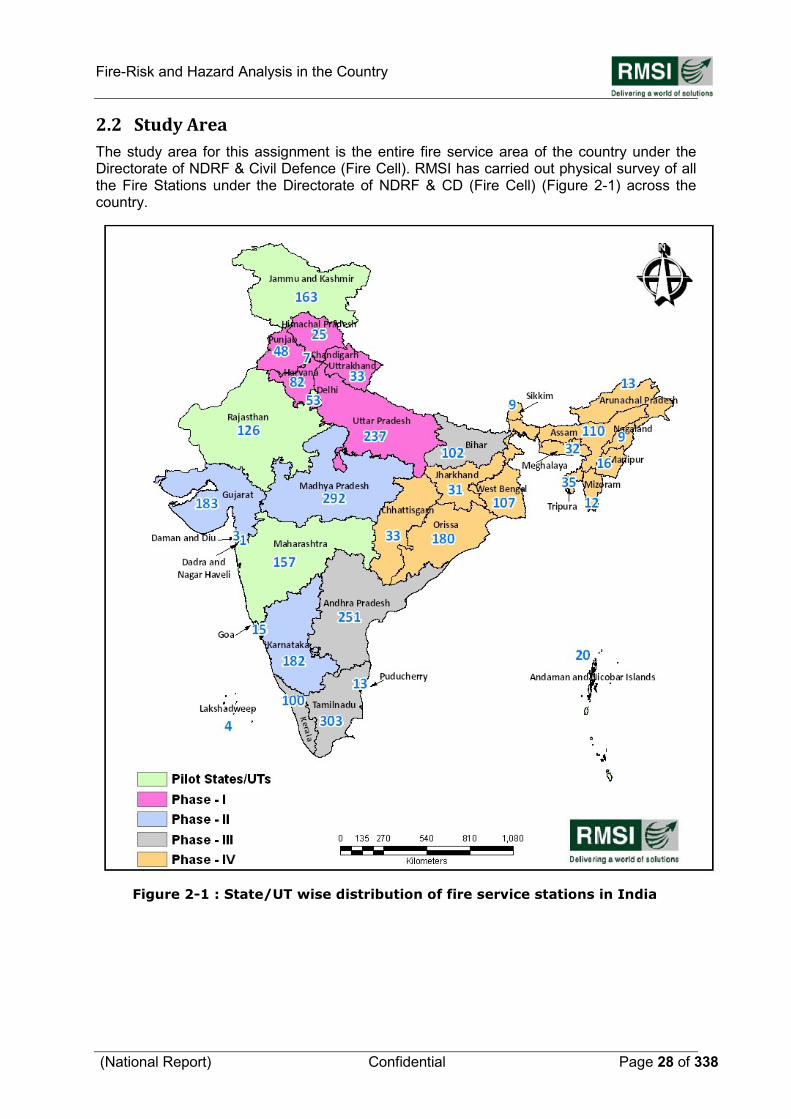
Fire-Risk and Hazard Analysis in the Country
(National Report) Confidential Page 28 of 338
2.2 Study Area
The study area for this assignment is the entire fire service area of the country under the Directorate of NDRF & Civil Defence (Fire Cell). RMSI has carried out physical survey of all the Fire Stations under the Directorate of NDRF & CD (Fire Cell) (Figure 2-1) across the country.
Figure 2-1 : State/UT wise distribution of fire service stations in India
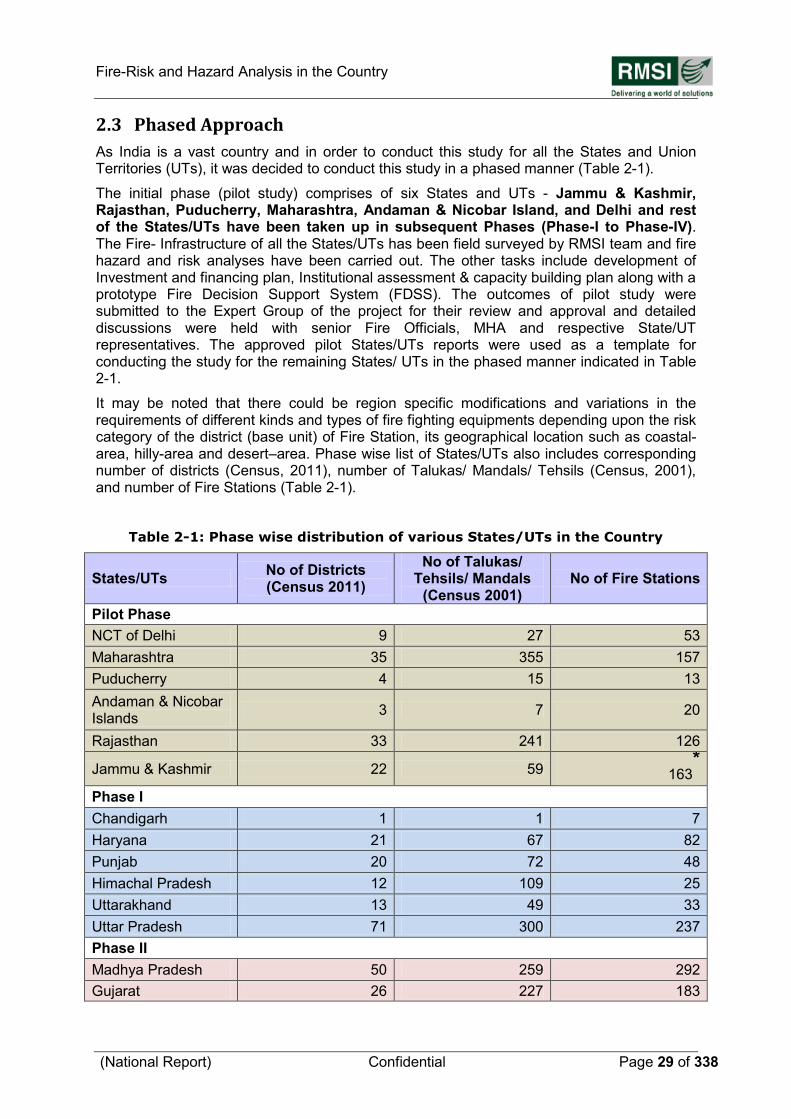
Fire-Risk and Hazard Analysis in the Country
(National Report) Confidential Page 29 of 338
2.3 Phased Approach
As India is a vast country and in order to conduct this study for all the States and Union Territories (UTs), it was decided to conduct this study in a phased manner (Table 2-1).
The initial phase (pilot study) comprises of six States and UTs - Jammu & Kashmir, Rajasthan, Puducherry, Maharashtra, Andaman & Nicobar Island, and Delhi and rest of the States/UTs have been taken up in subsequent Phases (Phase-I to Phase-IV). The Fire- Infrastructure of all the States/UTs has been field surveyed by RMSI team and fire hazard and risk analyses have been carried out. The other tasks include development of Investment and financing plan, Institutional assessment & capacity building plan along with a prototype Fire Decision Support System (FDSS). The outcomes of pilot study were submitted to the Expert Group of the project for their review and approval and detailed discussions were held with senior Fire Officials, MHA and respective State/UT representatives. The approved pilot States/UTs reports were used as a template for conducting the study for the remaining States/ UTs in the phased manner indicated in Table 2-1.
It may be noted that there could be region specific modifications and variations in the requirements of different kinds and types of fire fighting equipments depending upon the risk category of the district (base unit) of Fire Station, its geographical location such as coastal-area, hilly-area and desert–area. Phase wise list of States/UTs also includes corresponding number of districts (Census, 2011), number of Talukas/ Mandals/ Tehsils (Census, 2001), and number of Fire Stations (Table 2-1).
Table 2-1: Phase wise distribution of various States/UTs in the Country
States/UTs No of Districts (Census 2011)
No of Talukas/ Tehsils/ Mandals
(Census 2001) No of Fire Stations
Pilot Phase
NCT of Delhi 9 27 53
Maharashtra 35 355 157
Puducherry 4 15 13
Andaman & Nicobar Islands
3 7 20
Rajasthan 33 241 126
Jammu & Kashmir 22 59 163*
Phase I
Chandigarh 1 1 7
Haryana 21 67 82
Punjab 20 72 48
Himachal Pradesh 12 109 25
Uttarakhand 13 49 33
Uttar Pradesh 71 300 237
Phase II
Madhya Pradesh 50 259 292
Gujarat 26 227 183
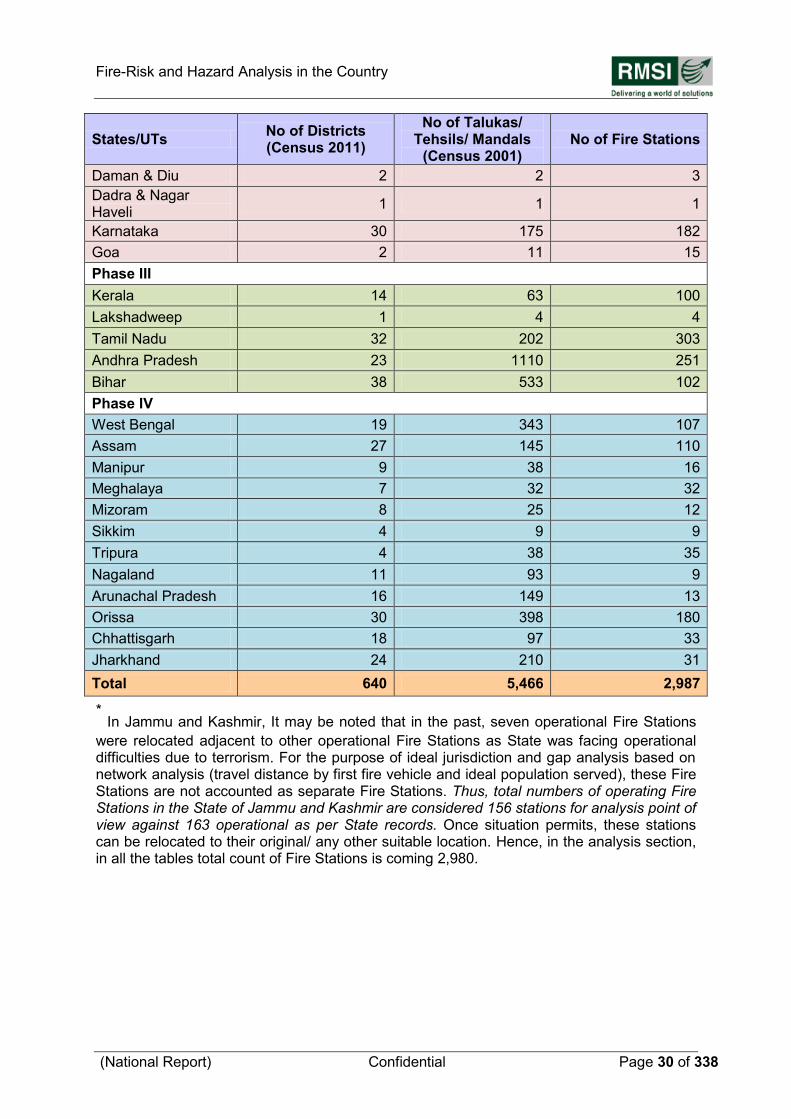
Fire-Risk and Hazard Analysis in the Country
(National Report) Confidential Page 30 of 338
States/UTs No of Districts (Census 2011)
No of Talukas/ Tehsils/ Mandals
(Census 2001) No of Fire Stations
Daman & Diu 2 2 3
Dadra & Nagar Haveli
1 1 1
Karnataka 30 175 182
Goa 2 11 15
Phase III
Kerala 14 63 100
Lakshadweep 1 4 4
Tamil Nadu 32 202 303
Andhra Pradesh 23 1110 251
Bihar 38 533 102
Phase IV
West Bengal 19 343 107
Assam 27 145 110
Manipur 9 38 16
Meghalaya 7 32 32
Mizoram 8 25 12
Sikkim 4 9 9
Tripura 4 38 35
Nagaland 11 93 9
Arunachal Pradesh 16 149 13
Orissa 30 398 180
Chhattisgarh 18 97 33
Jharkhand 24 210 31
Total 640 5,466 2,987
* In Jammu and Kashmir, It may be noted that in the past, seven operational Fire Stations
were relocated adjacent to other operational Fire Stations as State was facing operational difficulties due to terrorism. For the purpose of ideal jurisdiction and gap analysis based on network analysis (travel distance by first fire vehicle and ideal population served), these Fire Stations are not accounted as separate Fire Stations. Thus, total numbers of operating Fire Stations in the State of Jammu and Kashmir are considered 156 stations for analysis point of view against 163 operational as per State records. Once situation permits, these stations can be relocated to their original/ any other suitable location. Hence, in the analysis section, in all the tables total count of Fire Stations is coming 2,980.
Fire-Risk and Hazard Analysis in the Country
(National Report) Confidential Page 31 of 338
3 GIS based Fire Hazard and Risk Analysis
Based on RMSI‟s vast experience of executing large projects at State and Country levels, RMSI team has adopted the following approach (detailed below) to carry out this assignment. This approach has also been presented and discussed in a series of meetings with the officials of the Directorate of NDRF & CD, MHA, Government of India.
The risk of fire in urban areas has increased over the years and the rising cost of fire losses would seem to indicate that they are increasing at a greater rate than the measures devised to control them. Cities are growing in size and complexity day by day; therefore, they need to be managed more efficiently.
Geographic Information System (GIS) is an important and efficient tool that can be used by local administrations to minimize natural disasters (Recep Nisanci, 2010). Although there are many formal definitions of GIS, for practical purposes GIS can be defined as a computer-based system to aid in the collection, maintenance, storage, analysis, output and distribution of spatial data information (Bolstad, 2005). Thus, GIS technologies have been used in fire analysis related to the optimum location of Fire Stations. For example, Habibi et al. (2008), has made spatial analysis of urban Fire Stations in Tehran, using an analytical hierarchy process and GIS. Yang et al. (2004) also carried out studies concerning the selection of Fire Station locations using GIS.
Unlike a flat paper map, a GIS-generated map can represent many layers of different information. This representation provides a unique way of thinking about geographic space. By linking map databases, GIS enables users to visualize, manipulate, analyze and display spatial data. GIS technology based approach is cost-effective and provides accurate solutions in an expanding range of applications. RMSI team has adopted following approach for fire risk analysis of Indian States/UTs.
3.1 GIS Data Compilations
GIS Map based fire hazard and risk analysis is one of the main tasks of this assignment. In order to undertake hazard and risk analysis, various GIS layers and other associated thematic maps have been created for each of the Pilot States/UTs that form the basis for risk ranking of base units (districts). The following is a list of selected GIS layers as base administrative layers and other dependant layers that have been used in GIS based fire risk analyses.
1. State administrative boundary layers
2. District administrative boundary layers
3. Rail network
4. Major (highways) and main road networks
5. Minor roads/ street road networks
6. Locations of cities, and major towns with their names
7. State level Land use land cover maps
8. Demarcation of residential, commercial and industrial built-up areas
9. Census population data (2011)
10. Geographical locations (latitude, longitude) of operational Fire Stations
11. Other collateral data such as information from city development plans (if available), and demarcation of fire-station jurisdictional areas.
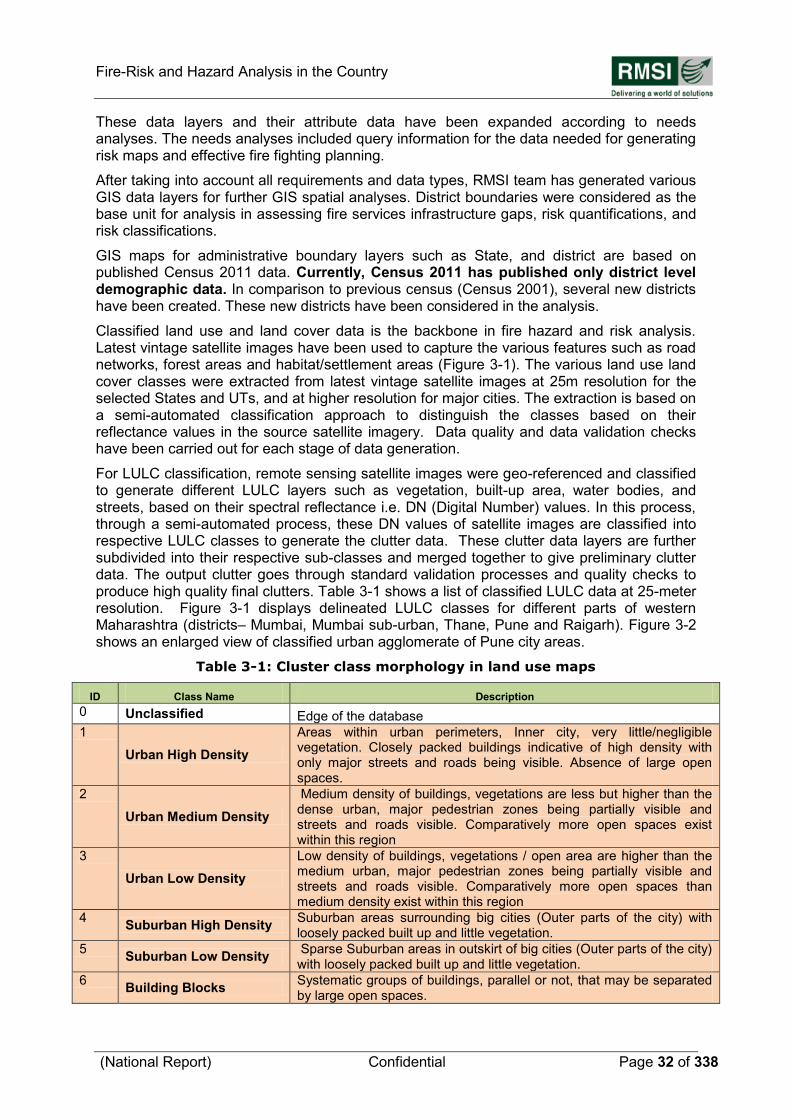
Fire-Risk and Hazard Analysis in the Country
(National Report) Confidential Page 32 of 338
These data layers and their attribute data have been expanded according to needs analyses. The needs analyses included query information for the data needed for generating risk maps and effective fire fighting planning.
After taking into account all requirements and data types, RMSI team has generated various GIS data layers for further GIS spatial analyses. District boundaries were considered as the base unit for analysis in assessing fire services infrastructure gaps, risk quantifications, and risk classifications.
GIS maps for administrative boundary layers such as State, and district are based on published Census 2011 data. Currently, Census 2011 has published only district level demographic data. In comparison to previous census (Census 2001), several new districts have been created. These new districts have been considered in the analysis.
Classified land use and land cover data is the backbone in fire hazard and risk analysis. Latest vintage satellite images have been used to capture the various features such as road networks, forest areas and habitat/settlement areas (Figure 3-1). The various land use land cover classes were extracted from latest vintage satellite images at 25m resolution for the selected States and UTs, and at higher resolution for major cities. The extraction is based on a semi-automated classification approach to distinguish the classes based on their reflectance values in the source satellite imagery. Data quality and data validation checks have been carried out for each stage of data generation.
For LULC classification, remote sensing satellite images were geo-referenced and classified to generate different LULC layers such as vegetation, built-up area, water bodies, and streets, based on their spectral reflectance i.e. DN (Digital Number) values. In this process, through a semi-automated process, these DN values of satellite images are classified into respective LULC classes to generate the clutter data. These clutter data layers are further subdivided into their respective sub-classes and merged together to give preliminary clutter data. The output clutter goes through standard validation processes and quality checks to produce high quality final clutters. Table 3-1 shows a list of classified LULC data at 25-meter resolution. Figure 3-1 displays delineated LULC classes for different parts of western Maharashtra (districts– Mumbai, Mumbai sub-urban, Thane, Pune and Raigarh). Figure 3-2 shows an enlarged view of classified urban agglomerate of Pune city areas.
Table 3-1: Cluster class morphology in land use maps
ID Class Name Description
0 Unclassified Edge of the database
1
Urban High Density
Areas within urban perimeters, Inner city, very little/negligible vegetation. Closely packed buildings indicative of high density with only major streets and roads being visible. Absence of large open spaces.
2
Urban Medium Density
Medium density of buildings, vegetations are less but higher than the dense urban, major pedestrian zones being partially visible and streets and roads visible. Comparatively more open spaces exist within this region
3
Urban Low Density
Low density of buildings, vegetations / open area are higher than the medium urban, major pedestrian zones being partially visible and streets and roads visible. Comparatively more open spaces than medium density exist within this region
4 Suburban High Density
Suburban areas surrounding big cities (Outer parts of the city) with loosely packed built up and little vegetation.
5 Suburban Low Density
Sparse Suburban areas in outskirt of big cities (Outer parts of the city) with loosely packed built up and little vegetation.
6 Building Blocks
Systematic groups of buildings, parallel or not, that may be separated by large open spaces.
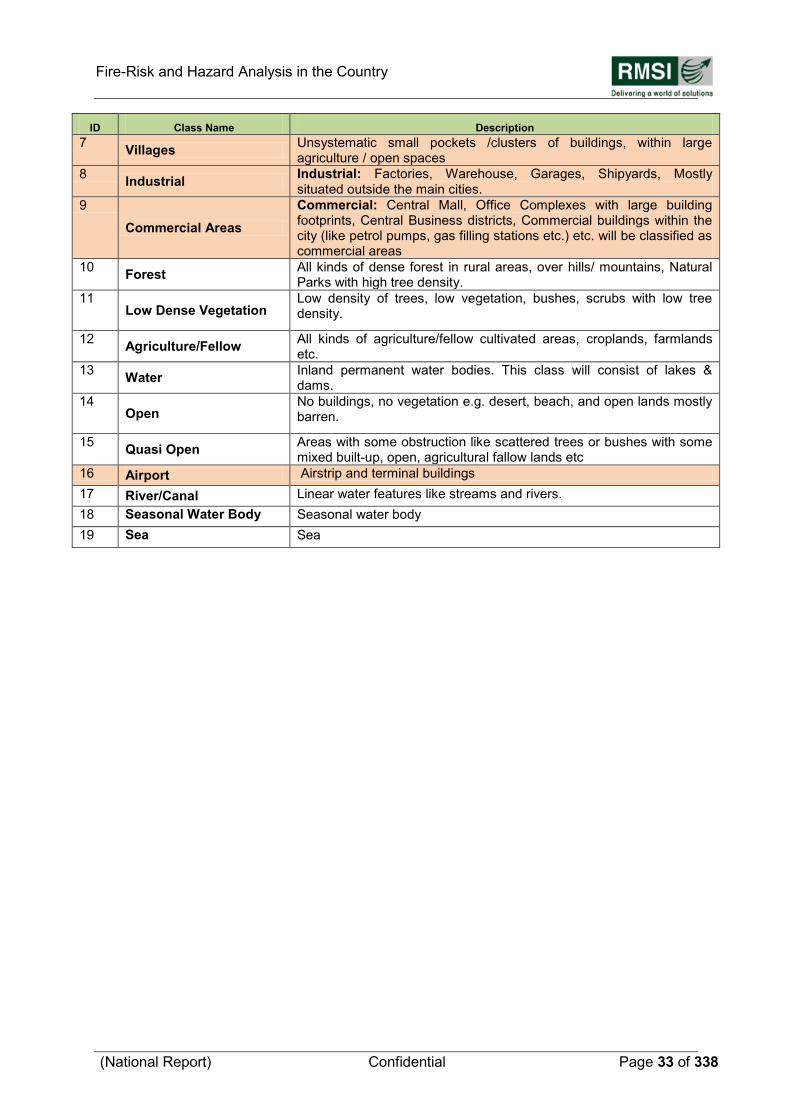
Fire-Risk and Hazard Analysis in the Country
(National Report) Confidential Page 33 of 338
ID Class Name Description
7 Villages
Unsystematic small pockets /clusters of buildings, within large agriculture / open spaces
8 Industrial
Industrial: Factories, Warehouse, Garages, Shipyards, Mostly situated outside the main cities.
9
Commercial Areas
Commercial: Central Mall, Office Complexes with large building footprints, Central Business districts, Commercial buildings within the city (like petrol pumps, gas filling stations etc.) etc. will be classified as commercial areas
10 Forest
All kinds of dense forest in rural areas, over hills/ mountains, Natural Parks with high tree density.
11 Low Dense Vegetation
Low density of trees, low vegetation, bushes, scrubs with low tree density.
12 Agriculture/Fellow
All kinds of agriculture/fellow cultivated areas, croplands, farmlands etc.
13 Water
Inland permanent water bodies. This class will consist of lakes & dams.
14 Open
No buildings, no vegetation e.g. desert, beach, and open lands mostly barren.
15 Quasi Open
Areas with some obstruction like scattered trees or bushes with some mixed built-up, open, agricultural fallow lands etc
16 Airport Airstrip and terminal buildings
17 River/Canal Linear water features like streams and rivers.
18 Seasonal Water Body Seasonal water body
19 Sea Sea
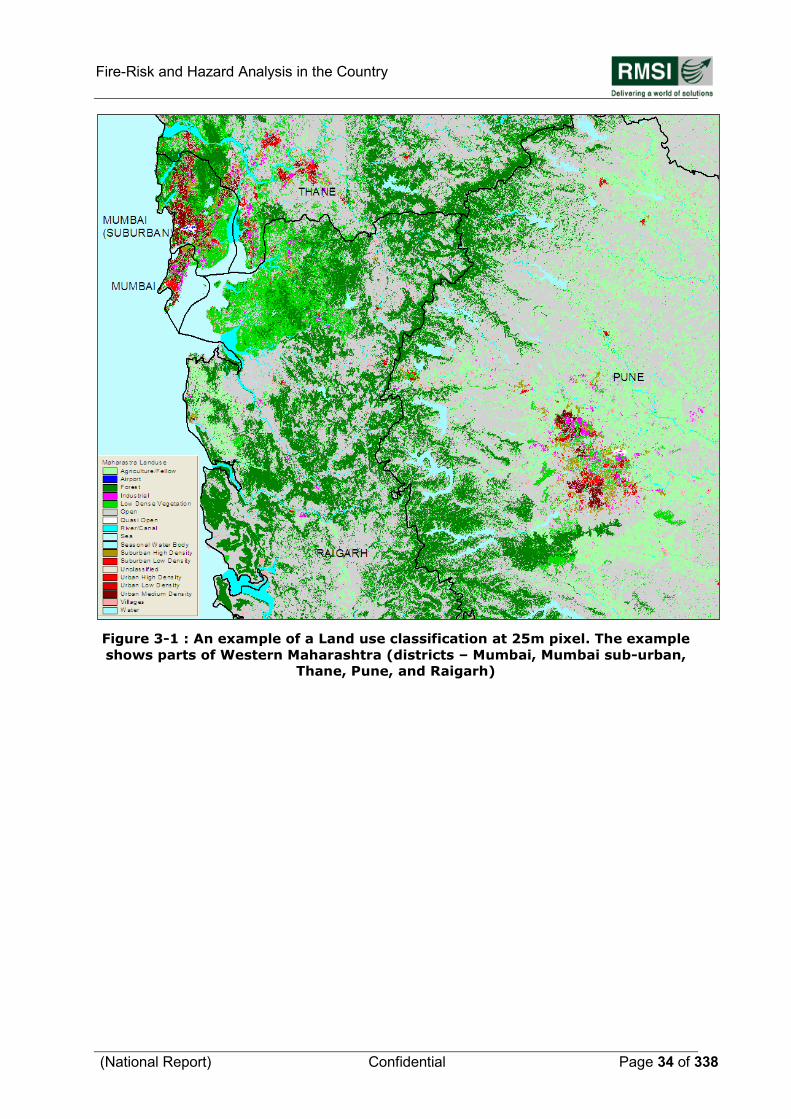
Fire-Risk and Hazard Analysis in the Country
(National Report) Confidential Page 34 of 338
Figure 3-1 : An example of a Land use classification at 25m pixel. The example
shows parts of Western Maharashtra (districts – Mumbai, Mumbai sub-urban,
Thane, Pune, and Raigarh)
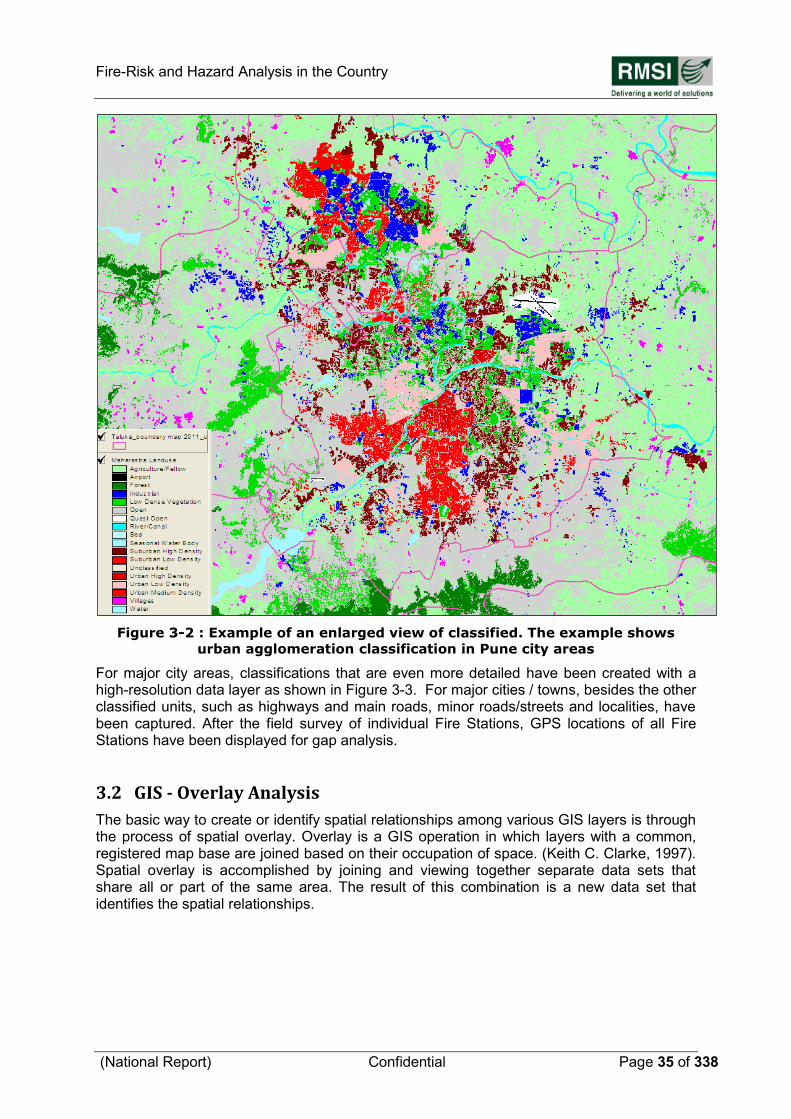
Fire-Risk and Hazard Analysis in the Country
(National Report) Confidential Page 35 of 338
Figure 3-2 : Example of an enlarged view of classified. The example shows
urban agglomeration classification in Pune city areas
For major city areas, classifications that are even more detailed have been created with a high-resolution data layer as shown in Figure 3-3. For major cities / towns, besides the other classified units, such as highways and main roads, minor roads/streets and localities, have been captured. After the field survey of individual Fire Stations, GPS locations of all Fire Stations have been displayed for gap analysis.
3.2 GIS - Overlay Analysis
The basic way to create or identify spatial relationships among various GIS layers is through the process of spatial overlay. Overlay is a GIS operation in which layers with a common, registered map base are joined based on their occupation of space. (Keith C. Clarke, 1997). Spatial overlay is accomplished by joining and viewing together separate data sets that share all or part of the same area. The result of this combination is a new data set that identifies the spatial relationships.
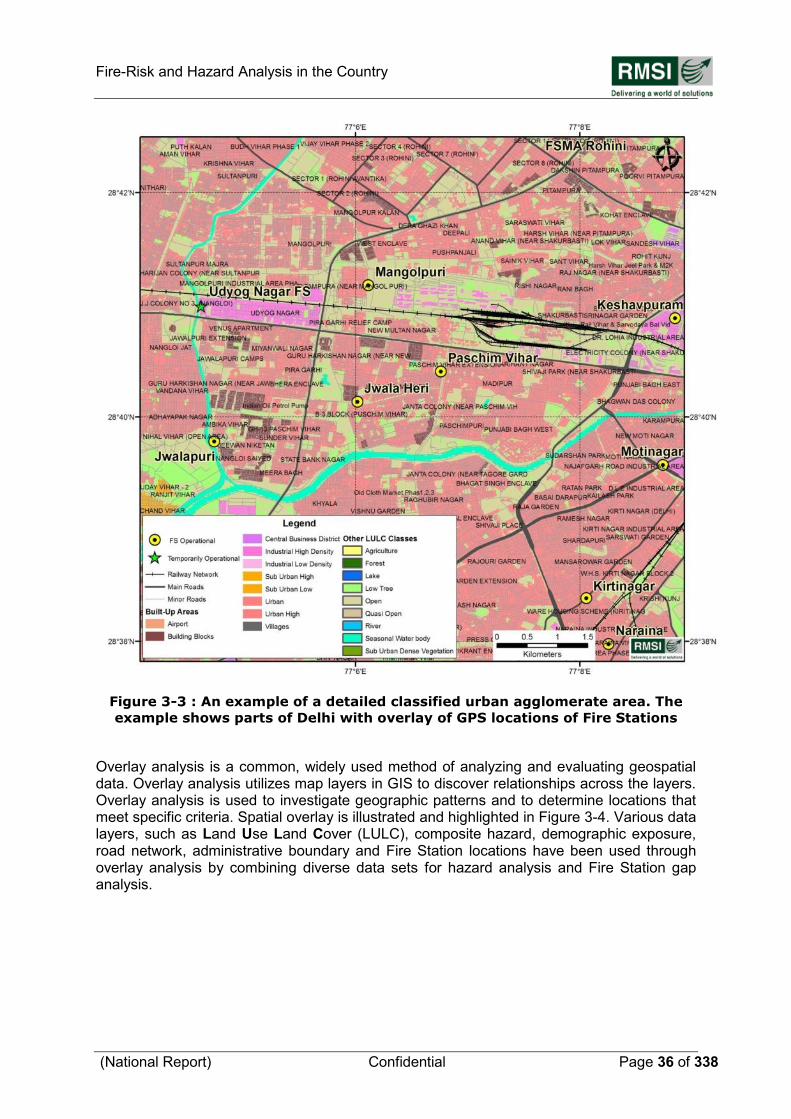
Fire-Risk and Hazard Analysis in the Country
(National Report) Confidential Page 36 of 338
Figure 3-3 : An example of a detailed classified urban agglomerate area. The
example shows parts of Delhi with overlay of GPS locations of Fire Stations
Overlay analysis is a common, widely used method of analyzing and evaluating geospatial data. Overlay analysis utilizes map layers in GIS to discover relationships across the layers. Overlay analysis is used to investigate geographic patterns and to determine locations that meet specific criteria. Spatial overlay is illustrated and highlighted in Figure 3-4. Various data layers, such as Land Use Land Cover (LULC), composite hazard, demographic exposure, road network, administrative boundary and Fire Station locations have been used through overlay analysis by combining diverse data sets for hazard analysis and Fire Station gap analysis.
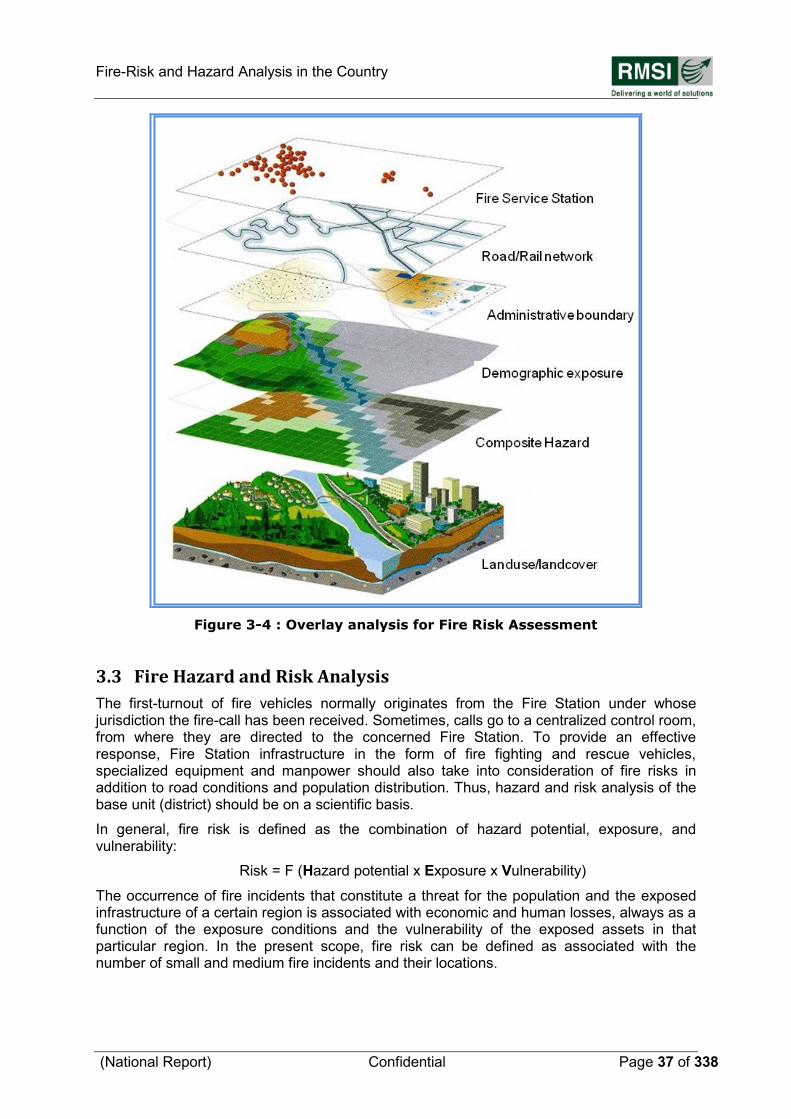
Fire-Risk and Hazard Analysis in the Country
(National Report) Confidential Page 37 of 338
Figure 3-4 : Overlay analysis for Fire Risk Assessment
3.3 Fire Hazard and Risk Analysis
The first-turnout of fire vehicles normally originates from the Fire Station under whose jurisdiction the fire-call has been received. Sometimes, calls go to a centralized control room, from where they are directed to the concerned Fire Station. To provide an effective response, Fire Station infrastructure in the form of fire fighting and rescue vehicles, specialized equipment and manpower should also take into consideration of fire risks in addition to road conditions and population distribution. Thus, hazard and risk analysis of the base unit (district) should be on a scientific basis.
In general, fire risk is defined as the combination of hazard potential, exposure, and vulnerability:
Risk = F (Hazard potential x Exposure x Vulnerability)
The occurrence of fire incidents that constitute a threat for the population and the exposed infrastructure of a certain region is associated with economic and human losses, always as a function of the exposure conditions and the vulnerability of the exposed assets in that particular region. In the present scope, fire risk can be defined as associated with the number of small and medium fire incidents and their locations.
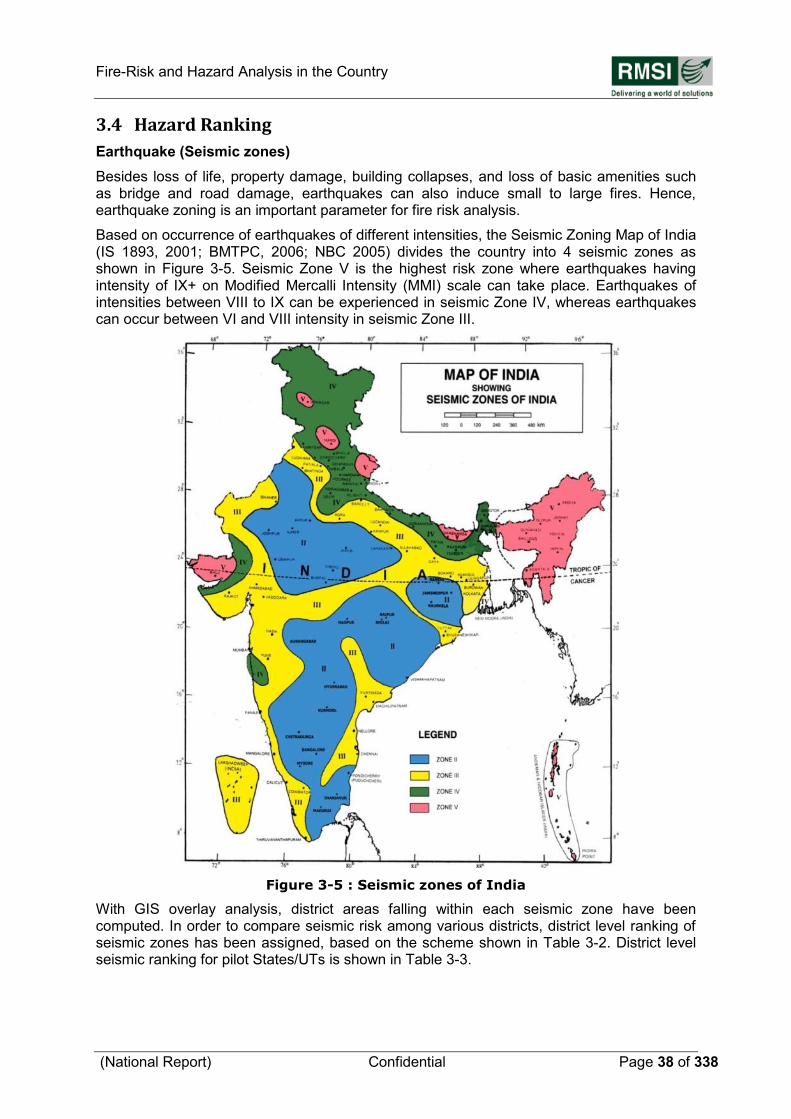
Fire-Risk and Hazard Analysis in the Country
(National Report) Confidential Page 38 of 338
3.4 Hazard Ranking
Earthquake (Seismic zones)
Besides loss of life, property damage, building collapses, and loss of basic amenities such as bridge and road damage, earthquakes can also induce small to large fires. Hence, earthquake zoning is an important parameter for fire risk analysis.
Based on occurrence of earthquakes of different intensities, the Seismic Zoning Map of India (IS 1893, 2001; BMTPC, 2006; NBC 2005) divides the country into 4 seismic zones as shown in Figure 3-5. Seismic Zone V is the highest risk zone where earthquakes having intensity of IX+ on Modified Mercalli Intensity (MMI) scale can take place. Earthquakes of intensities between VIII to IX can be experienced in seismic Zone IV, whereas earthquakes can occur between VI and VIII intensity in seismic Zone III.
Figure 3-5 : Seismic zones of India
With GIS overlay analysis, district areas falling within each seismic zone have been computed. In order to compare seismic risk among various districts, district level ranking of seismic zones has been assigned, based on the scheme shown in Table 3-2. District level seismic ranking for pilot States/UTs is shown in Table 3-3.
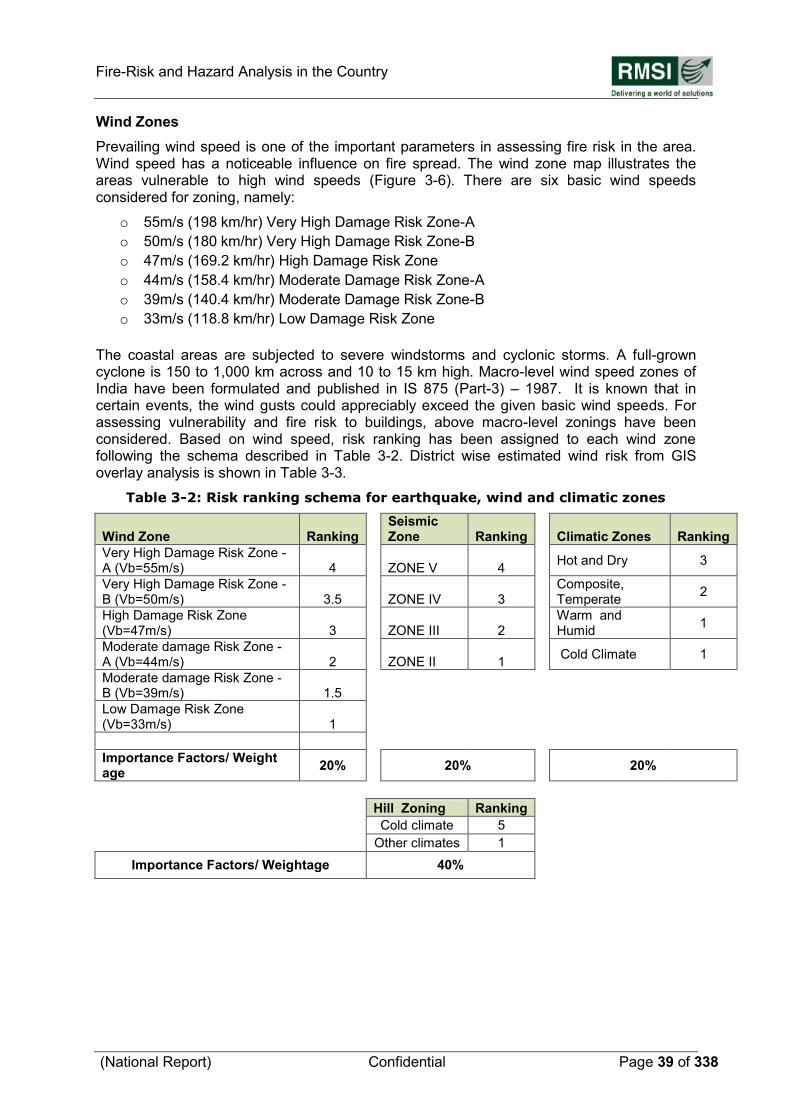
Fire-Risk and Hazard Analysis in the Country
(National Report) Confidential Page 39 of 338
Wind Zones
Prevailing wind speed is one of the important parameters in assessing fire risk in the area. Wind speed has a noticeable influence on fire spread. The wind zone map illustrates the areas vulnerable to high wind speeds (Figure 3-6). There are six basic wind speeds considered for zoning, namely:
o 55m/s (198 km/hr) Very High Damage Risk Zone-A
o 50m/s (180 km/hr) Very High Damage Risk Zone-B
o 47m/s (169.2 km/hr) High Damage Risk Zone
o 44m/s (158.4 km/hr) Moderate Damage Risk Zone-A
o 39m/s (140.4 km/hr) Moderate Damage Risk Zone-B
o 33m/s (118.8 km/hr) Low Damage Risk Zone
The coastal areas are subjected to severe windstorms and cyclonic storms. A full-grown cyclone is 150 to 1,000 km across and 10 to 15 km high. Macro-level wind speed zones of India have been formulated and published in IS 875 (Part-3) – 1987. It is known that in certain events, the wind gusts could appreciably exceed the given basic wind speeds. For assessing vulnerability and fire risk to buildings, above macro-level zonings have been considered. Based on wind speed, risk ranking has been assigned to each wind zone following the schema described in Table 3-2. District wise estimated wind risk from GIS overlay analysis is shown in Table 3-3.
Table 3-2: Risk ranking schema for earthquake, wind and climatic zones
Wind Zone Ranking Seismic
Zone Ranking
Climatic Zones Ranking
Very High Damage Risk Zone - A (Vb=55m/s) 4
ZONE V 4
Hot and Dry 3
Very High Damage Risk Zone - B (Vb=50m/s) 3.5
ZONE IV 3
Composite, Temperate
2
High Damage Risk Zone (Vb=47m/s) 3
ZONE III 2
Warm and Humid
1
Moderate damage Risk Zone - A (Vb=44m/s) 2
ZONE II 1
Cold Climate 1
Moderate damage Risk Zone - B (Vb=39m/s) 1.5
Low Damage Risk Zone (Vb=33m/s) 1
Importance Factors/ Weight age
20% 20% 20%
Hill Zoning Ranking
Cold climate 5
Other climates 1
Importance Factors/ Weightage 40%
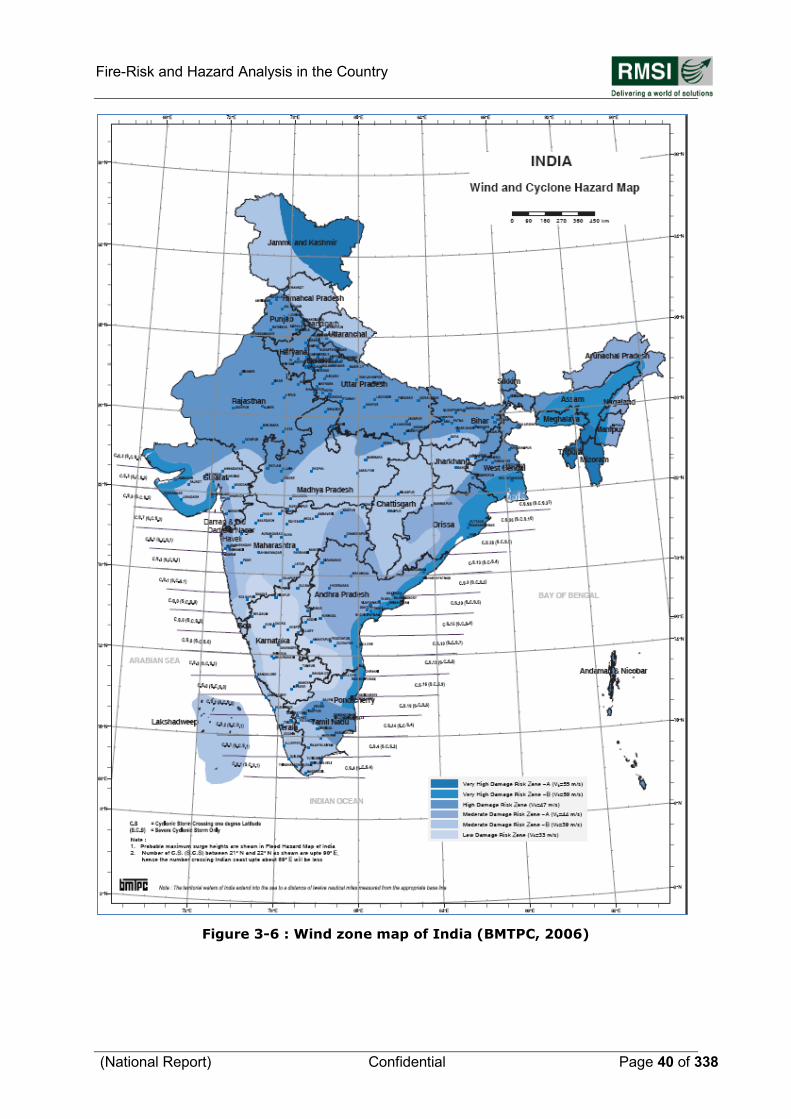
Fire-Risk and Hazard Analysis in the Country
(National Report) Confidential Page 40 of 338
Figure 3-6 : Wind zone map of India (BMTPC, 2006)
Fire-Risk and Hazard Analysis in the Country
(National Report) Confidential Page 41 of 338
Climatic Zones
Regions having similar characteristic features of climate are grouped under one climatic zone. According to a recent code of the Bureau of Indian Standards, the country has been divided into the following five major climatic zones:
o Hot & Dry (mean monthly temperature >30 and relative humidity <55%);
o Warm & Humid (mean monthly temperature >25-30 and relative humidity >55-75%);
o Temperate (mean monthly temperature 25-30 and relative humidity <75%);
o Cold (mean monthly temperature <25 and relative humidity – can be any values);
o Composite (This applies when six months or more do not fall within any of the other
categories meaning sharing characteristics of two or more of the above categories in
a year).
Map of climatic zones is shown in Figure 3-7. The hot and dry zone lies in the western and the central parts of India; Jaisalmer, Jodhpur and Sholapur are some of the towns that experience this type of climate. In this zone, solar radiation and movement of hot winds are higher. The warm and humid zone covers the coastal parts of the country, such as Mumbai, Chennai and Kolkata. Pune and Bangalore are examples of non-coastal cities that fall the under moderate climatic zone. Generally, the Himalayan region experiences cold type of climate. The composite zone covers the northern Indo-Gangetic plains, such as New Delhi, Kanpur, and Allahabad.
With GIS overlay analysis, district overlap areas falling within each climatic zone have been computed. In order to compare impact of being a district in a climatic zone, district level ranking has been assigned based on the scheme shown in Table 3-2. District level climatic zone ranking for Pilot States/ UT is shown in Table 3-3.
Hilly Areas and Building Class Zones
Extreme cold climate, rugged topography and use of flammable material in building construction (such as wood) and the use of heating provisions in houses during cold weather is an important factor for causing fire incidents in that region. To capture such elements in fire risk hazard, Hilly Areas and Building Class Zones have been created. This class is directly linked to the cold climate zone. All hilly districts, (such as all districts of Jammu & Kashmir in the Pilot study) fall under this category. In such districts, a ranking of five has been assigned. Importance of this zone in terms of occurrence of number of fire incidents is quite high. Hence, while integrating, a double weightage of 40% has been assigned to this layer.
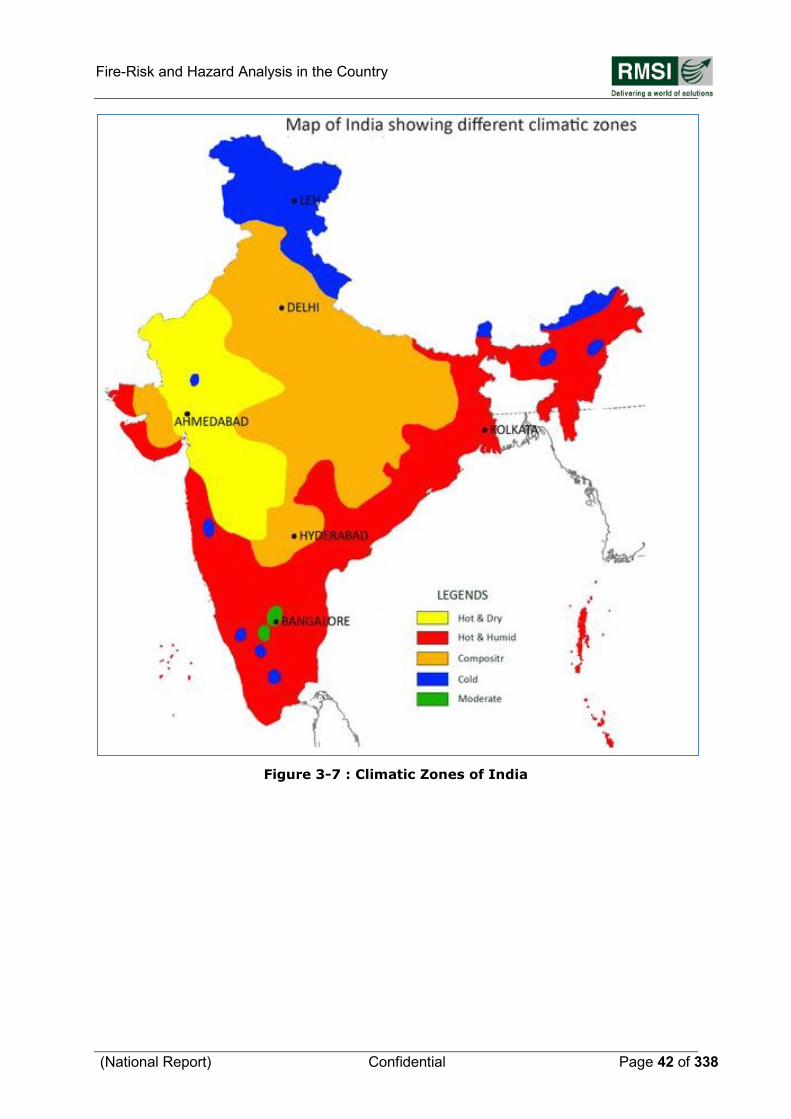
Fire-Risk and Hazard Analysis in the Country
(National Report) Confidential Page 42 of 338
Figure 3-7 : Climatic Zones of India
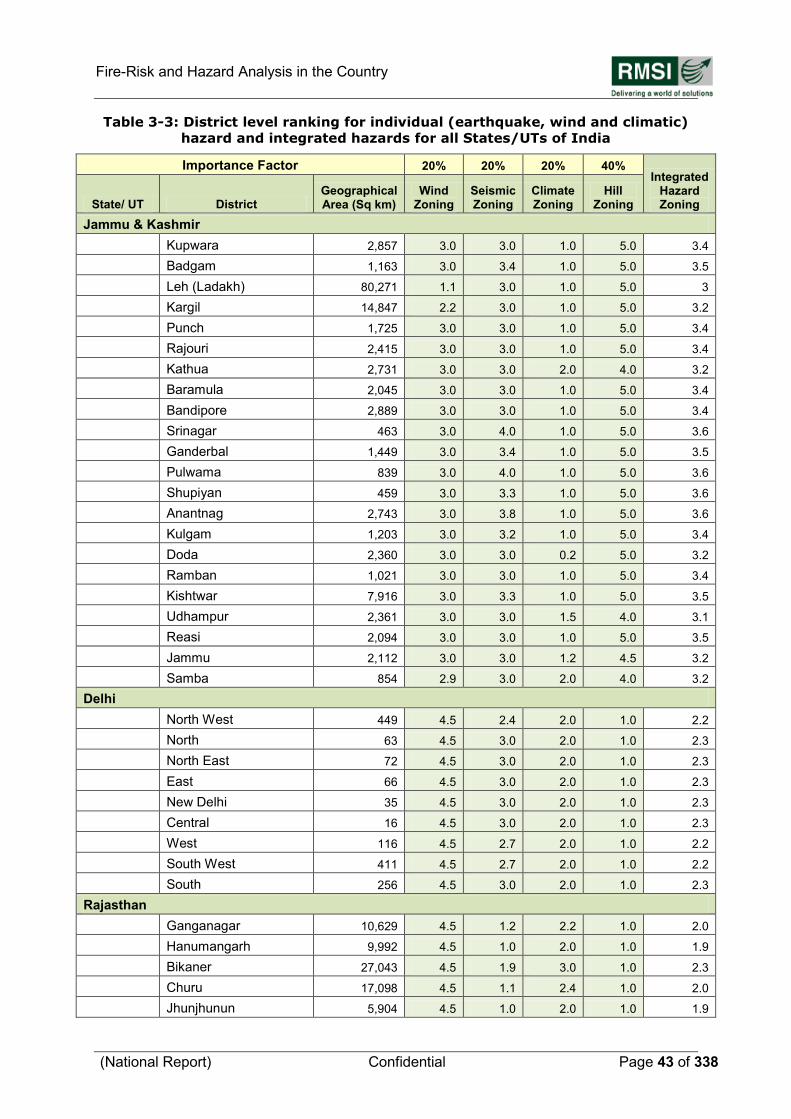
Fire-Risk and Hazard Analysis in the Country
(National Report) Confidential Page 43 of 338
Table 3-3: District level ranking for individual (earthquake, wind and climatic)
hazard and integrated hazards for all States/UTs of India
Importance Factor 20% 20% 20% 40% Integrated
Hazard Zoning State/ UT District
Geographical Area (Sq km)
Wind Zoning
Seismic Zoning
Climate Zoning
Hill Zoning
Jammu & Kashmir
Kupwara 2,857 3.0 3.0 1.0 5.0 3.4
Badgam 1,163 3.0 3.4 1.0 5.0 3.5
Leh (Ladakh) 80,271 1.1 3.0 1.0 5.0 3
Kargil 14,847 2.2 3.0 1.0 5.0 3.2
Punch 1,725 3.0 3.0 1.0 5.0 3.4
Rajouri 2,415 3.0 3.0 1.0 5.0 3.4
Kathua 2,731 3.0 3.0 2.0 4.0 3.2
Baramula 2,045 3.0 3.0 1.0 5.0 3.4
Bandipore 2,889 3.0 3.0 1.0 5.0 3.4
Srinagar 463 3.0 4.0 1.0 5.0 3.6
Ganderbal 1,449 3.0 3.4 1.0 5.0 3.5
Pulwama 839 3.0 4.0 1.0 5.0 3.6
Shupiyan 459 3.0 3.3 1.0 5.0 3.6
Anantnag 2,743 3.0 3.8 1.0 5.0 3.6
Kulgam 1,203 3.0 3.2 1.0 5.0 3.4
Doda 2,360 3.0 3.0 0.2 5.0 3.2
Ramban 1,021 3.0 3.0 1.0 5.0 3.4
Kishtwar 7,916 3.0 3.3 1.0 5.0 3.5
Udhampur 2,361 3.0 3.0 1.5 4.0 3.1
Reasi 2,094 3.0 3.0 1.0 5.0 3.5
Jammu 2,112 3.0 3.0 1.2 4.5 3.2
Samba 854 2.9 3.0 2.0 4.0 3.2
Delhi
North West 449 4.5 2.4 2.0 1.0 2.2
North 63 4.5 3.0 2.0 1.0 2.3
North East 72 4.5 3.0 2.0 1.0 2.3
East 66 4.5 3.0 2.0 1.0 2.3
New Delhi 35 4.5 3.0 2.0 1.0 2.3
Central 16 4.5 3.0 2.0 1.0 2.3
West 116 4.5 2.7 2.0 1.0 2.2
South West 411 4.5 2.7 2.0 1.0 2.2
South 256 4.5 3.0 2.0 1.0 2.3
Rajasthan
Ganganagar 10,629 4.5 1.2 2.2 1.0 2.0
Hanumangarh 9,992 4.5 1.0 2.0 1.0 1.9
Bikaner 27,043 4.5 1.9 3.0 1.0 2.3
Churu 17,098 4.5 1.1 2.4 1.0 2.0
Jhunjhunun 5,904 4.5 1.0 2.0 1.0 1.9
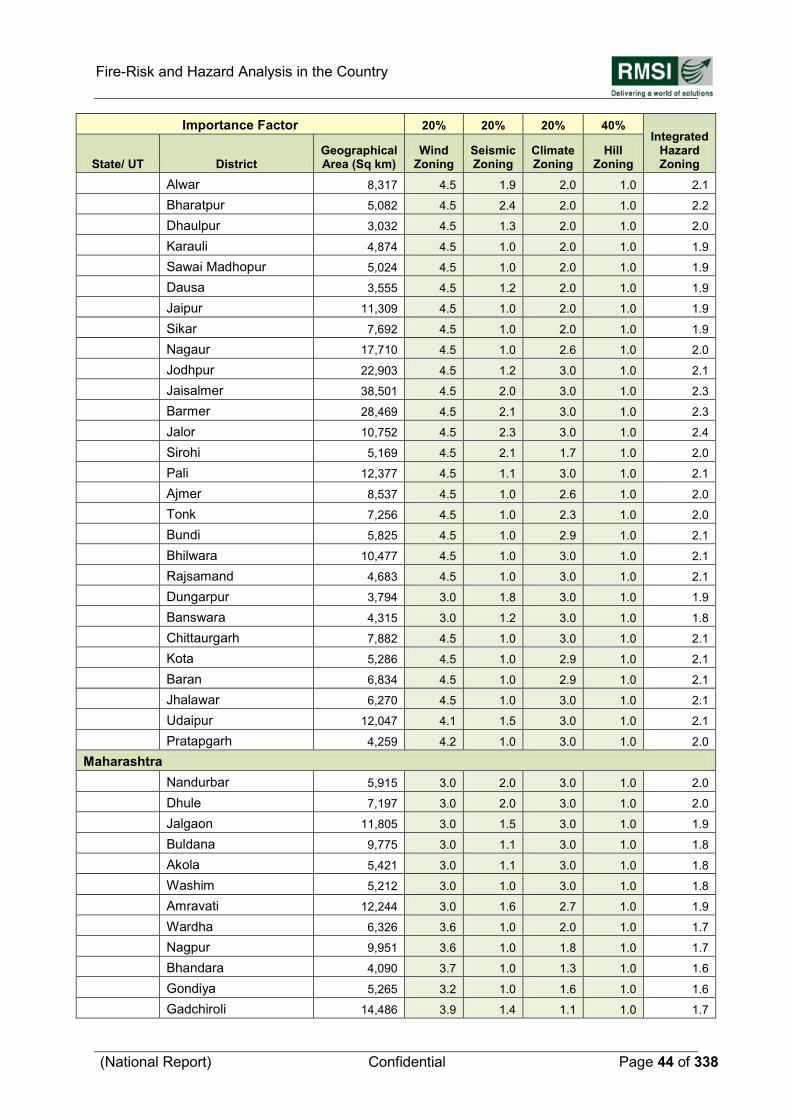
Fire-Risk and Hazard Analysis in the Country
(National Report) Confidential Page 44 of 338
Importance Factor 20% 20% 20% 40% Integrated
Hazard Zoning State/ UT District
Geographical Area (Sq km)
Wind Zoning
Seismic Zoning
Climate Zoning
Hill Zoning
Alwar 8,317 4.5 1.9 2.0 1.0 2.1
Bharatpur 5,082 4.5 2.4 2.0 1.0 2.2
Dhaulpur 3,032 4.5 1.3 2.0 1.0 2.0
Karauli 4,874 4.5 1.0 2.0 1.0 1.9
Sawai Madhopur 5,024 4.5 1.0 2.0 1.0 1.9
Dausa 3,555 4.5 1.2 2.0 1.0 1.9
Jaipur 11,309 4.5 1.0 2.0 1.0 1.9
Sikar 7,692 4.5 1.0 2.0 1.0 1.9
Nagaur 17,710 4.5 1.0 2.6 1.0 2.0
Jodhpur 22,903 4.5 1.2 3.0 1.0 2.1
Jaisalmer 38,501 4.5 2.0 3.0 1.0 2.3
Barmer 28,469 4.5 2.1 3.0 1.0 2.3
Jalor 10,752 4.5 2.3 3.0 1.0 2.4
Sirohi 5,169 4.5 2.1 1.7 1.0 2.0
Pali 12,377 4.5 1.1 3.0 1.0 2.1
Ajmer 8,537 4.5 1.0 2.6 1.0 2.0
Tonk 7,256 4.5 1.0 2.3 1.0 2.0
Bundi 5,825 4.5 1.0 2.9 1.0 2.1
Bhilwara 10,477 4.5 1.0 3.0 1.0 2.1
Rajsamand 4,683 4.5 1.0 3.0 1.0 2.1
Dungarpur 3,794 3.0 1.8 3.0 1.0 1.9
Banswara 4,315 3.0 1.2 3.0 1.0 1.8
Chittaurgarh 7,882 4.5 1.0 3.0 1.0 2.1
Kota 5,286 4.5 1.0 2.9 1.0 2.1
Baran 6,834 4.5 1.0 2.9 1.0 2.1
Jhalawar 6,270 4.5 1.0 3.0 1.0 2.1
Udaipur 12,047 4.1 1.5 3.0 1.0 2.1
Pratapgarh 4,259 4.2 1.0 3.0 1.0 2.0
Maharashtra
Nandurbar 5,915 3.0 2.0 3.0 1.0 2.0
Dhule 7,197 3.0 2.0 3.0 1.0 2.0
Jalgaon 11,805 3.0 1.5 3.0 1.0 1.9
Buldana 9,775 3.0 1.1 3.0 1.0 1.8
Akola 5,421 3.0 1.1 3.0 1.0 1.8
Washim 5,212 3.0 1.0 3.0 1.0 1.8
Amravati 12,244 3.0 1.6 2.7 1.0 1.9
Wardha 6,326 3.6 1.0 2.0 1.0 1.7
Nagpur 9,951 3.6 1.0 1.8 1.0 1.7
Bhandara 4,090 3.7 1.0 1.3 1.0 1.6
Gondiya 5,265 3.2 1.0 1.6 1.0 1.6
Gadchiroli 14,486 3.9 1.4 1.1 1.0 1.7
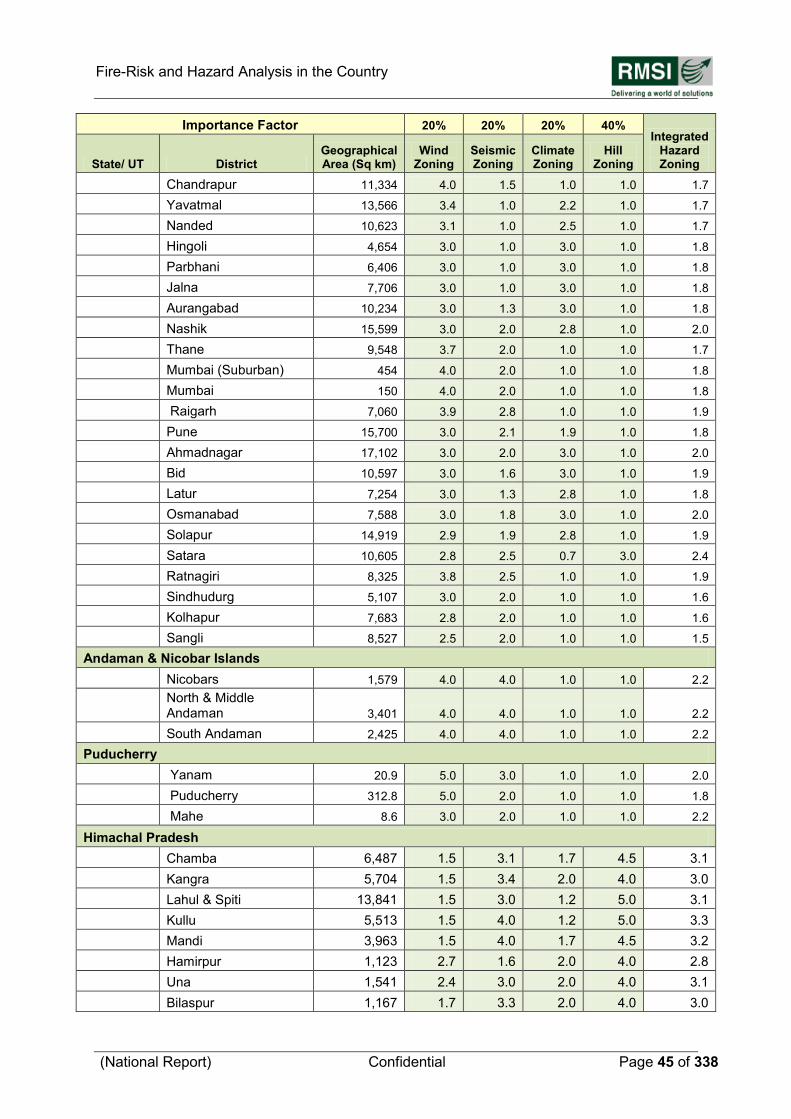
Fire-Risk and Hazard Analysis in the Country
(National Report) Confidential Page 45 of 338
Importance Factor 20% 20% 20% 40% Integrated
Hazard Zoning State/ UT District
Geographical Area (Sq km)
Wind Zoning
Seismic Zoning
Climate Zoning
Hill Zoning
Chandrapur 11,334 4.0 1.5 1.0 1.0 1.7
Yavatmal 13,566 3.4 1.0 2.2 1.0 1.7
Nanded 10,623 3.1 1.0 2.5 1.0 1.7
Hingoli 4,654 3.0 1.0 3.0 1.0 1.8
Parbhani 6,406 3.0 1.0 3.0 1.0 1.8
Jalna 7,706 3.0 1.0 3.0 1.0 1.8
Aurangabad 10,234 3.0 1.3 3.0 1.0 1.8
Nashik 15,599 3.0 2.0 2.8 1.0 2.0
Thane 9,548 3.7 2.0 1.0 1.0 1.7
Mumbai (Suburban) 454 4.0 2.0 1.0 1.0 1.8
Mumbai 150 4.0 2.0 1.0 1.0 1.8
Raigarh 7,060 3.9 2.8 1.0 1.0 1.9
Pune 15,700 3.0 2.1 1.9 1.0 1.8
Ahmadnagar 17,102 3.0 2.0 3.0 1.0 2.0
Bid 10,597 3.0 1.6 3.0 1.0 1.9
Latur 7,254 3.0 1.3 2.8 1.0 1.8
Osmanabad 7,588 3.0 1.8 3.0 1.0 2.0
Solapur 14,919 2.9 1.9 2.8 1.0 1.9
Satara 10,605 2.8 2.5 0.7 3.0 2.4
Ratnagiri 8,325 3.8 2.5 1.0 1.0 1.9
Sindhudurg 5,107 3.0 2.0 1.0 1.0 1.6
Kolhapur 7,683 2.8 2.0 1.0 1.0 1.6
Sangli 8,527 2.5 2.0 1.0 1.0 1.5
Andaman & Nicobar Islands
Nicobars 1,579 4.0 4.0 1.0 1.0 2.2
North & Middle Andaman 3,401 4.0 4.0 1.0 1.0 2.2
South Andaman 2,425 4.0 4.0 1.0 1.0 2.2
Puducherry
Yanam 20.9 5.0 3.0 1.0 1.0 2.0
Puducherry 312.8 5.0 2.0 1.0 1.0 1.8
Mahe 8.6 3.0 2.0 1.0 1.0 2.2
Himachal Pradesh
Chamba 6,487 1.5 3.1 1.7 4.5 3.1
Kangra 5,704 1.5 3.4 2.0 4.0 3.0
Lahul & Spiti 13,841 1.5 3.0 1.2 5.0 3.1
Kullu 5,513 1.5 4.0 1.2 5.0 3.3
Mandi 3,963 1.5 4.0 1.7 4.5 3.2
Hamirpur 1,123 2.7 1.6 2.0 4.0 2.8
Una 1,541 2.4 3.0 2.0 4.0 3.1
Bilaspur 1,167 1.7 3.3 2.0 4.0 3.0
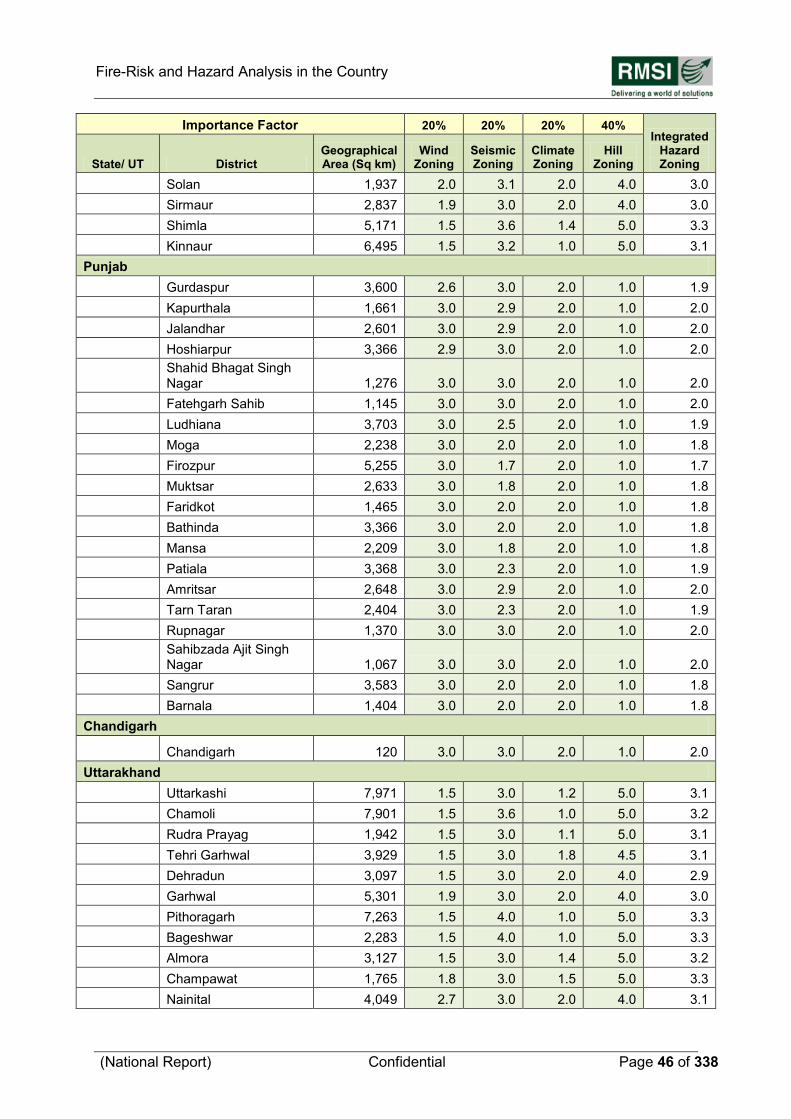
Fire-Risk and Hazard Analysis in the Country
(National Report) Confidential Page 46 of 338
Importance Factor 20% 20% 20% 40% Integrated
Hazard Zoning State/ UT District
Geographical Area (Sq km)
Wind Zoning
Seismic Zoning
Climate Zoning
Hill Zoning
Solan 1,937 2.0 3.1 2.0 4.0 3.0
Sirmaur 2,837 1.9 3.0 2.0 4.0 3.0
Shimla 5,171 1.5 3.6 1.4 5.0 3.3
Kinnaur 6,495 1.5 3.2 1.0 5.0 3.1
Punjab
Gurdaspur 3,600 2.6 3.0 2.0 1.0 1.9
Kapurthala 1,661 3.0 2.9 2.0 1.0 2.0
Jalandhar 2,601 3.0 2.9 2.0 1.0 2.0
Hoshiarpur 3,366 2.9 3.0 2.0 1.0 2.0
Shahid Bhagat Singh Nagar 1,276 3.0 3.0 2.0 1.0 2.0
Fatehgarh Sahib 1,145 3.0 3.0 2.0 1.0 2.0
Ludhiana 3,703 3.0 2.5 2.0 1.0 1.9
Moga 2,238 3.0 2.0 2.0 1.0 1.8
Firozpur 5,255 3.0 1.7 2.0 1.0 1.7
Muktsar 2,633 3.0 1.8 2.0 1.0 1.8
Faridkot 1,465 3.0 2.0 2.0 1.0 1.8
Bathinda 3,366 3.0 2.0 2.0 1.0 1.8
Mansa 2,209 3.0 1.8 2.0 1.0 1.8
Patiala 3,368 3.0 2.3 2.0 1.0 1.9
Amritsar 2,648 3.0 2.9 2.0 1.0 2.0
Tarn Taran 2,404 3.0 2.3 2.0 1.0 1.9
Rupnagar 1,370 3.0 3.0 2.0 1.0 2.0
Sahibzada Ajit Singh Nagar 1,067 3.0 3.0 2.0 1.0 2.0
Sangrur 3,583 3.0 2.0 2.0 1.0 1.8
Barnala 1,404 3.0 2.0 2.0 1.0 1.8
Chandigarh
Chandigarh 120 3.0 3.0 2.0 1.0 2.0
Uttarakhand
Uttarkashi 7,971 1.5 3.0 1.2 5.0 3.1
Chamoli 7,901 1.5 3.6 1.0 5.0 3.2
Rudra Prayag 1,942 1.5 3.0 1.1 5.0 3.1
Tehri Garhwal 3,929 1.5 3.0 1.8 4.5 3.1
Dehradun 3,097 1.5 3.0 2.0 4.0 2.9
Garhwal 5,301 1.9 3.0 2.0 4.0 3.0
Pithoragarh 7,263 1.5 4.0 1.0 5.0 3.3
Bageshwar 2,283 1.5 4.0 1.0 5.0 3.3
Almora 3,127 1.5 3.0 1.4 5.0 3.2
Champawat 1,765 1.8 3.0 1.5 5.0 3.3
Nainital 4,049 2.7 3.0 2.0 4.0 3.1
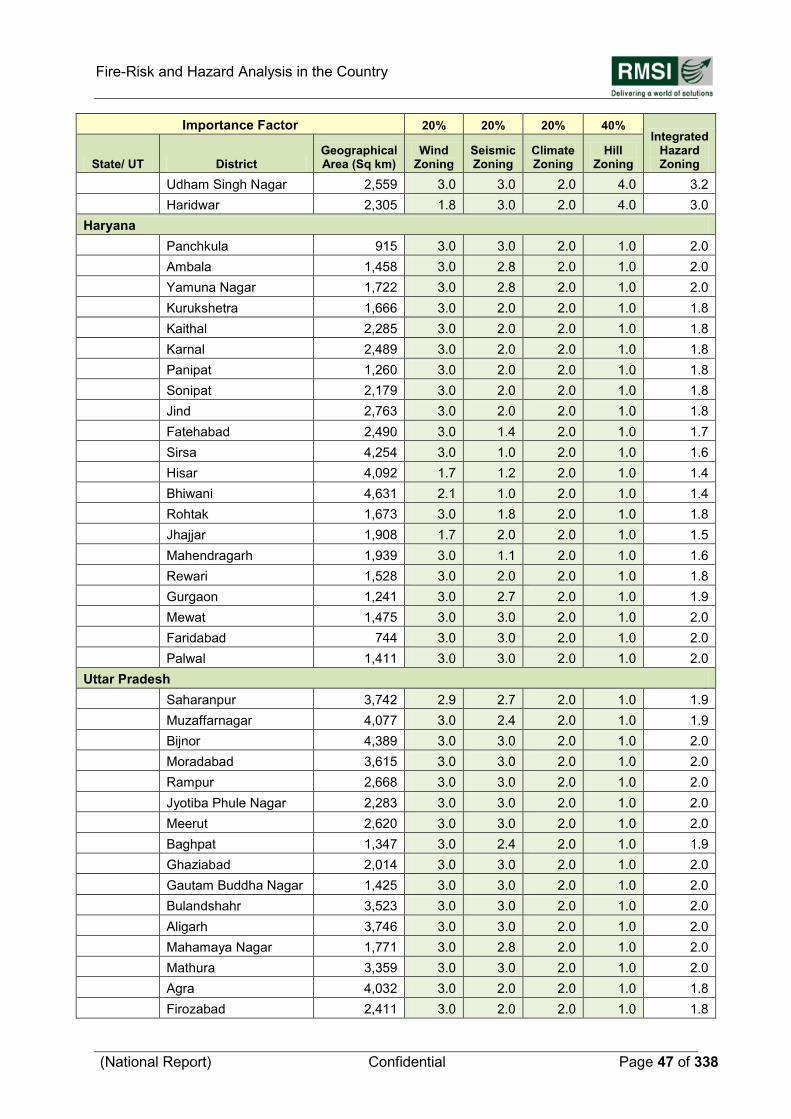
Fire-Risk and Hazard Analysis in the Country
(National Report) Confidential Page 47 of 338
Importance Factor 20% 20% 20% 40% Integrated
Hazard Zoning State/ UT District
Geographical Area (Sq km)
Wind Zoning
Seismic Zoning
Climate Zoning
Hill Zoning
Udham Singh Nagar 2,559 3.0 3.0 2.0 4.0 3.2
Haridwar 2,305 1.8 3.0 2.0 4.0 3.0
Haryana
Panchkula 915 3.0 3.0 2.0 1.0 2.0
Ambala 1,458 3.0 2.8 2.0 1.0 2.0
Yamuna Nagar 1,722 3.0 2.8 2.0 1.0 2.0
Kurukshetra 1,666 3.0 2.0 2.0 1.0 1.8
Kaithal 2,285 3.0 2.0 2.0 1.0 1.8
Karnal 2,489 3.0 2.0 2.0 1.0 1.8
Panipat 1,260 3.0 2.0 2.0 1.0 1.8
Sonipat 2,179 3.0 2.0 2.0 1.0 1.8
Jind 2,763 3.0 2.0 2.0 1.0 1.8
Fatehabad 2,490 3.0 1.4 2.0 1.0 1.7
Sirsa 4,254 3.0 1.0 2.0 1.0 1.6
Hisar 4,092 1.7 1.2 2.0 1.0 1.4
Bhiwani 4,631 2.1 1.0 2.0 1.0 1.4
Rohtak 1,673 3.0 1.8 2.0 1.0 1.8
Jhajjar 1,908 1.7 2.0 2.0 1.0 1.5
Mahendragarh 1,939 3.0 1.1 2.0 1.0 1.6
Rewari 1,528 3.0 2.0 2.0 1.0 1.8
Gurgaon 1,241 3.0 2.7 2.0 1.0 1.9
Mewat 1,475 3.0 3.0 2.0 1.0 2.0
Faridabad 744 3.0 3.0 2.0 1.0 2.0
Palwal 1,411 3.0 3.0 2.0 1.0 2.0
Uttar Pradesh
Saharanpur 3,742 2.9 2.7 2.0 1.0 1.9
Muzaffarnagar 4,077 3.0 2.4 2.0 1.0 1.9
Bijnor 4,389 3.0 3.0 2.0 1.0 2.0
Moradabad 3,615 3.0 3.0 2.0 1.0 2.0
Rampur 2,668 3.0 3.0 2.0 1.0 2.0
Jyotiba Phule Nagar 2,283 3.0 3.0 2.0 1.0 2.0
Meerut 2,620 3.0 3.0 2.0 1.0 2.0
Baghpat 1,347 3.0 2.4 2.0 1.0 1.9
Ghaziabad 2,014 3.0 3.0 2.0 1.0 2.0
Gautam Buddha Nagar 1,425 3.0 3.0 2.0 1.0 2.0
Bulandshahr 3,523 3.0 3.0 2.0 1.0 2.0
Aligarh 3,746 3.0 3.0 2.0 1.0 2.0
Mahamaya Nagar 1,771 3.0 2.8 2.0 1.0 2.0
Mathura 3,359 3.0 3.0 2.0 1.0 2.0
Agra 4,032 3.0 2.0 2.0 1.0 1.8
Firozabad 2,411 3.0 2.0 2.0 1.0 1.8
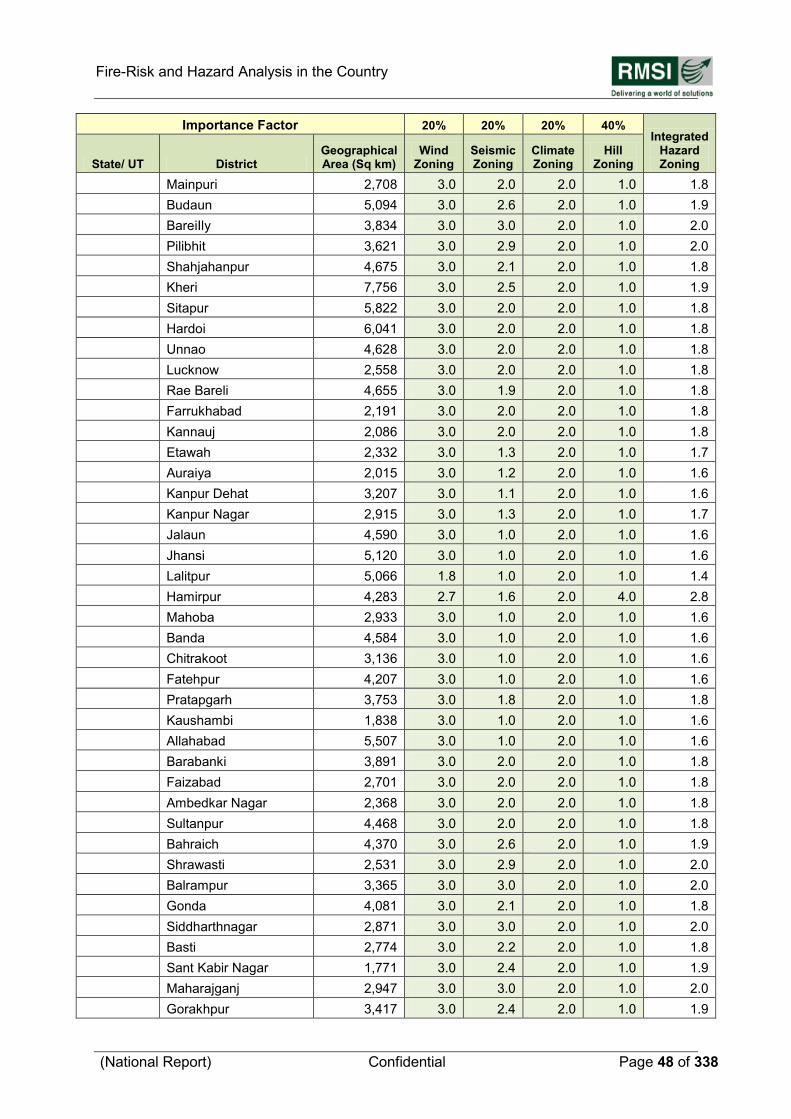
Fire-Risk and Hazard Analysis in the Country
(National Report) Confidential Page 48 of 338
Importance Factor 20% 20% 20% 40% Integrated
Hazard Zoning State/ UT District
Geographical Area (Sq km)
Wind Zoning
Seismic Zoning
Climate Zoning
Hill Zoning
Mainpuri 2,708 3.0 2.0 2.0 1.0 1.8
Budaun 5,094 3.0 2.6 2.0 1.0 1.9
BareiIly 3,834 3.0 3.0 2.0 1.0 2.0
Pilibhit 3,621 3.0 2.9 2.0 1.0 2.0
Shahjahanpur 4,675 3.0 2.1 2.0 1.0 1.8
Kheri 7,756 3.0 2.5 2.0 1.0 1.9
Sitapur 5,822 3.0 2.0 2.0 1.0 1.8
Hardoi 6,041 3.0 2.0 2.0 1.0 1.8
Unnao 4,628 3.0 2.0 2.0 1.0 1.8
Lucknow 2,558 3.0 2.0 2.0 1.0 1.8
Rae Bareli 4,655 3.0 1.9 2.0 1.0 1.8
Farrukhabad 2,191 3.0 2.0 2.0 1.0 1.8
Kannauj 2,086 3.0 2.0 2.0 1.0 1.8
Etawah 2,332 3.0 1.3 2.0 1.0 1.7
Auraiya 2,015 3.0 1.2 2.0 1.0 1.6
Kanpur Dehat 3,207 3.0 1.1 2.0 1.0 1.6
Kanpur Nagar 2,915 3.0 1.3 2.0 1.0 1.7
Jalaun 4,590 3.0 1.0 2.0 1.0 1.6
Jhansi 5,120 3.0 1.0 2.0 1.0 1.6
Lalitpur 5,066 1.8 1.0 2.0 1.0 1.4
Hamirpur 4,283 2.7 1.6 2.0 4.0 2.8
Mahoba 2,933 3.0 1.0 2.0 1.0 1.6
Banda 4,584 3.0 1.0 2.0 1.0 1.6
Chitrakoot 3,136 3.0 1.0 2.0 1.0 1.6
Fatehpur 4,207 3.0 1.0 2.0 1.0 1.6
Pratapgarh 3,753 3.0 1.8 2.0 1.0 1.8
Kaushambi 1,838 3.0 1.0 2.0 1.0 1.6
Allahabad 5,507 3.0 1.0 2.0 1.0 1.6
Barabanki 3,891 3.0 2.0 2.0 1.0 1.8
Faizabad 2,701 3.0 2.0 2.0 1.0 1.8
Ambedkar Nagar 2,368 3.0 2.0 2.0 1.0 1.8
Sultanpur 4,468 3.0 2.0 2.0 1.0 1.8
Bahraich 4,370 3.0 2.6 2.0 1.0 1.9
Shrawasti 2,531 3.0 2.9 2.0 1.0 2.0
Balrampur 3,365 3.0 3.0 2.0 1.0 2.0
Gonda 4,081 3.0 2.1 2.0 1.0 1.8
Siddharthnagar 2,871 3.0 3.0 2.0 1.0 2.0
Basti 2,774 3.0 2.2 2.0 1.0 1.8
Sant Kabir Nagar 1,771 3.0 2.4 2.0 1.0 1.9
Maharajganj 2,947 3.0 3.0 2.0 1.0 2.0
Gorakhpur 3,417 3.0 2.4 2.0 1.0 1.9
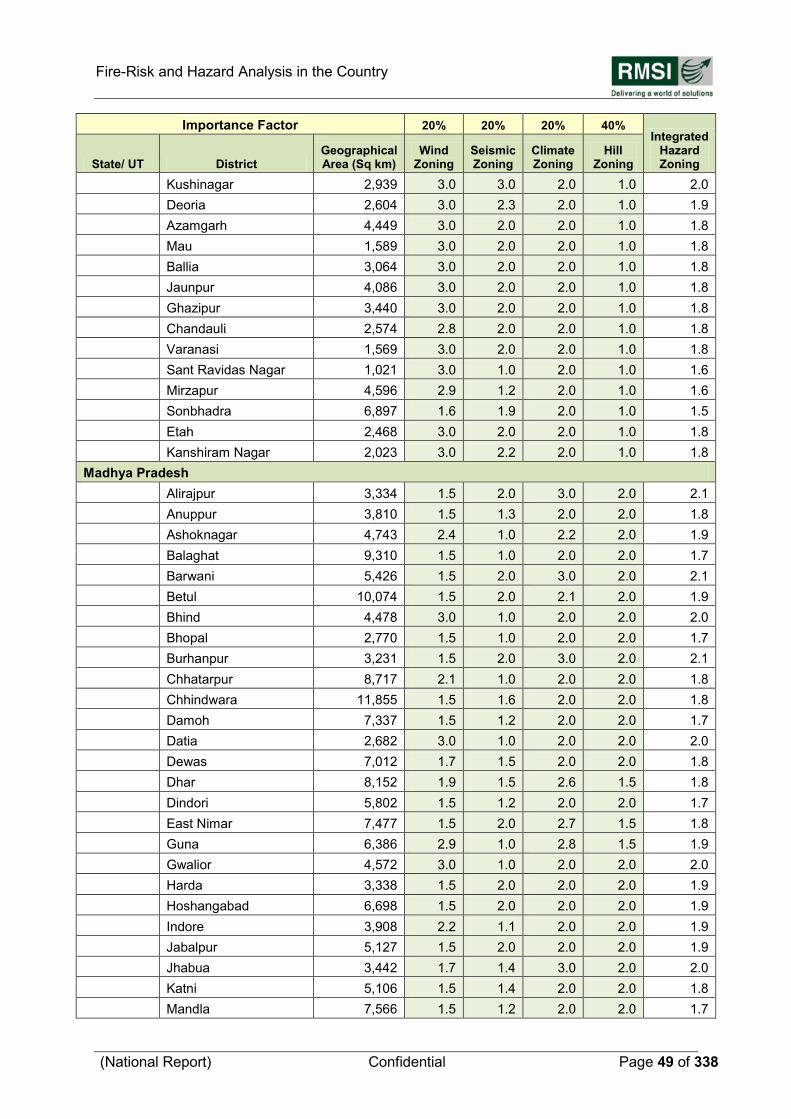
Fire-Risk and Hazard Analysis in the Country
(National Report) Confidential Page 49 of 338
Importance Factor 20% 20% 20% 40% Integrated
Hazard Zoning State/ UT District
Geographical Area (Sq km)
Wind Zoning
Seismic Zoning
Climate Zoning
Hill Zoning
Kushinagar 2,939 3.0 3.0 2.0 1.0 2.0
Deoria 2,604 3.0 2.3 2.0 1.0 1.9
Azamgarh 4,449 3.0 2.0 2.0 1.0 1.8
Mau 1,589 3.0 2.0 2.0 1.0 1.8
Ballia 3,064 3.0 2.0 2.0 1.0 1.8
Jaunpur 4,086 3.0 2.0 2.0 1.0 1.8
Ghazipur 3,440 3.0 2.0 2.0 1.0 1.8
Chandauli 2,574 2.8 2.0 2.0 1.0 1.8
Varanasi 1,569 3.0 2.0 2.0 1.0 1.8
Sant Ravidas Nagar 1,021 3.0 1.0 2.0 1.0 1.6
Mirzapur 4,596 2.9 1.2 2.0 1.0 1.6
Sonbhadra 6,897 1.6 1.9 2.0 1.0 1.5
Etah 2,468 3.0 2.0 2.0 1.0 1.8
Kanshiram Nagar 2,023 3.0 2.2 2.0 1.0 1.8
Madhya Pradesh
Alirajpur 3,334 1.5 2.0 3.0 2.0 2.1
Anuppur 3,810 1.5 1.3 2.0 2.0 1.8
Ashoknagar 4,743 2.4 1.0 2.2 2.0 1.9
Balaghat 9,310 1.5 1.0 2.0 2.0 1.7
Barwani 5,426 1.5 2.0 3.0 2.0 2.1
Betul 10,074 1.5 2.0 2.1 2.0 1.9
Bhind 4,478 3.0 1.0 2.0 2.0 2.0
Bhopal 2,770 1.5 1.0 2.0 2.0 1.7
Burhanpur 3,231 1.5 2.0 3.0 2.0 2.1
Chhatarpur 8,717 2.1 1.0 2.0 2.0 1.8
Chhindwara 11,855 1.5 1.6 2.0 2.0 1.8
Damoh 7,337 1.5 1.2 2.0 2.0 1.7
Datia 2,682 3.0 1.0 2.0 2.0 2.0
Dewas 7,012 1.7 1.5 2.0 2.0 1.8
Dhar 8,152 1.9 1.5 2.6 1.5 1.8
Dindori 5,802 1.5 1.2 2.0 2.0 1.7
East Nimar 7,477 1.5 2.0 2.7 1.5 1.8
Guna 6,386 2.9 1.0 2.8 1.5 1.9
Gwalior 4,572 3.0 1.0 2.0 2.0 2.0
Harda 3,338 1.5 2.0 2.0 2.0 1.9
Hoshangabad 6,698 1.5 2.0 2.0 2.0 1.9
Indore 3,908 2.2 1.1 2.0 2.0 1.9
Jabalpur 5,127 1.5 2.0 2.0 2.0 1.9
Jhabua 3,442 1.7 1.4 3.0 2.0 2.0
Katni 5,106 1.5 1.4 2.0 2.0 1.8
Mandla 7,566 1.5 1.2 2.0 2.0 1.7
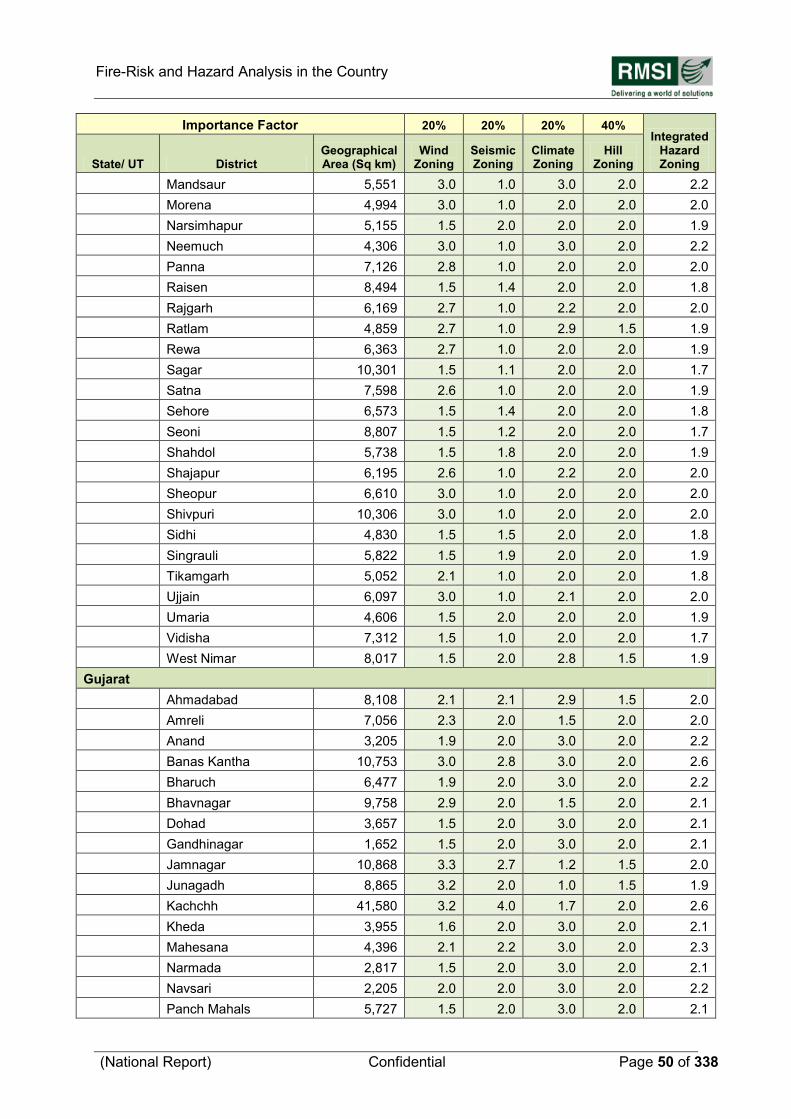
Fire-Risk and Hazard Analysis in the Country
(National Report) Confidential Page 50 of 338
Importance Factor 20% 20% 20% 40% Integrated
Hazard Zoning State/ UT District
Geographical Area (Sq km)
Wind Zoning
Seismic Zoning
Climate Zoning
Hill Zoning
Mandsaur 5,551 3.0 1.0 3.0 2.0 2.2
Morena 4,994 3.0 1.0 2.0 2.0 2.0
Narsimhapur 5,155 1.5 2.0 2.0 2.0 1.9
Neemuch 4,306 3.0 1.0 3.0 2.0 2.2
Panna 7,126 2.8 1.0 2.0 2.0 2.0
Raisen 8,494 1.5 1.4 2.0 2.0 1.8
Rajgarh 6,169 2.7 1.0 2.2 2.0 2.0
Ratlam 4,859 2.7 1.0 2.9 1.5 1.9
Rewa 6,363 2.7 1.0 2.0 2.0 1.9
Sagar 10,301 1.5 1.1 2.0 2.0 1.7
Satna 7,598 2.6 1.0 2.0 2.0 1.9
Sehore 6,573 1.5 1.4 2.0 2.0 1.8
Seoni 8,807 1.5 1.2 2.0 2.0 1.7
Shahdol 5,738 1.5 1.8 2.0 2.0 1.9
Shajapur 6,195 2.6 1.0 2.2 2.0 2.0
Sheopur 6,610 3.0 1.0 2.0 2.0 2.0
Shivpuri 10,306 3.0 1.0 2.0 2.0 2.0
Sidhi 4,830 1.5 1.5 2.0 2.0 1.8
Singrauli 5,822 1.5 1.9 2.0 2.0 1.9
Tikamgarh 5,052 2.1 1.0 2.0 2.0 1.8
Ujjain 6,097 3.0 1.0 2.1 2.0 2.0
Umaria 4,606 1.5 2.0 2.0 2.0 1.9
Vidisha 7,312 1.5 1.0 2.0 2.0 1.7
West Nimar 8,017 1.5 2.0 2.8 1.5 1.9
Gujarat
Ahmadabad 8,108 2.1 2.1 2.9 1.5 2.0
Amreli 7,056 2.3 2.0 1.5 2.0 2.0
Anand 3,205 1.9 2.0 3.0 2.0 2.2
Banas Kantha 10,753 3.0 2.8 3.0 2.0 2.6
Bharuch 6,477 1.9 2.0 3.0 2.0 2.2
Bhavnagar 9,758 2.9 2.0 1.5 2.0 2.1
Dohad 3,657 1.5 2.0 3.0 2.0 2.1
Gandhinagar 1,652 1.5 2.0 3.0 2.0 2.1
Jamnagar 10,868 3.3 2.7 1.2 1.5 2.0
Junagadh 8,865 3.2 2.0 1.0 1.5 1.9
Kachchh 41,580 3.2 4.0 1.7 2.0 2.6
Kheda 3,955 1.6 2.0 3.0 2.0 2.1
Mahesana 4,396 2.1 2.2 3.0 2.0 2.3
Narmada 2,817 1.5 2.0 3.0 2.0 2.1
Navsari 2,205 2.0 2.0 3.0 2.0 2.2
Panch Mahals 5,727 1.5 2.0 3.0 2.0 2.1
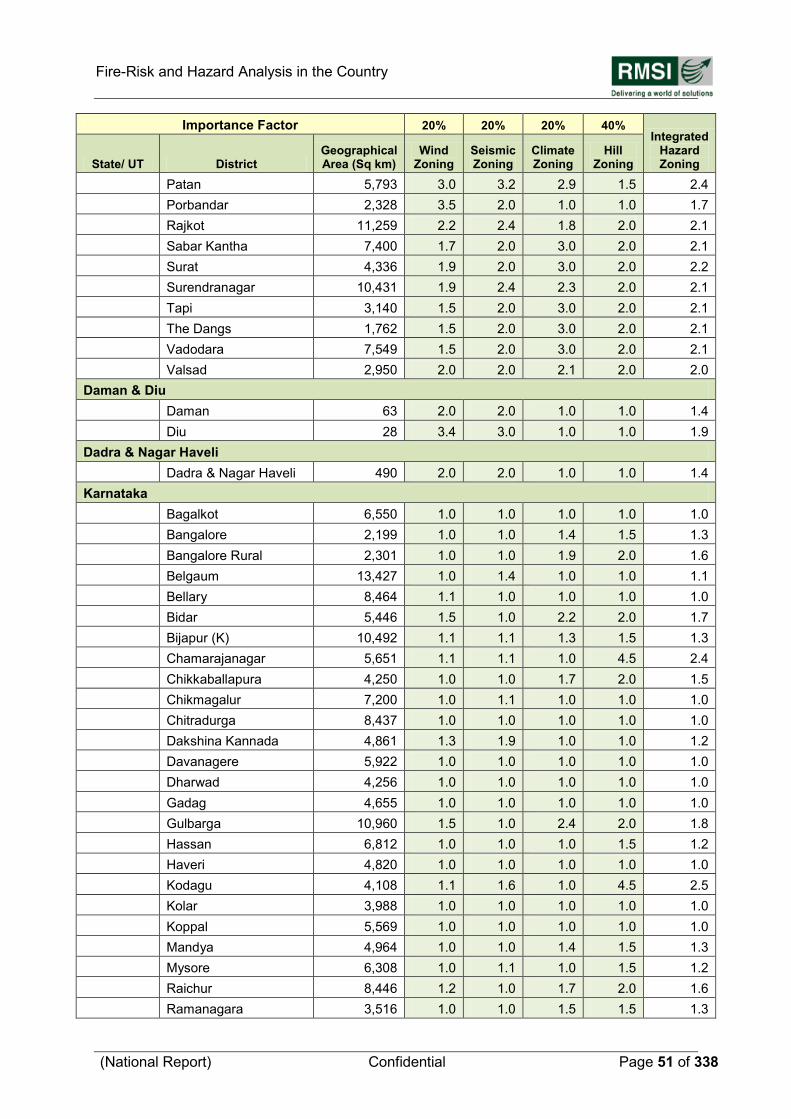
Fire-Risk and Hazard Analysis in the Country
(National Report) Confidential Page 51 of 338
Importance Factor 20% 20% 20% 40% Integrated
Hazard Zoning State/ UT District
Geographical Area (Sq km)
Wind Zoning
Seismic Zoning
Climate Zoning
Hill Zoning
Patan 5,793 3.0 3.2 2.9 1.5 2.4
Porbandar 2,328 3.5 2.0 1.0 1.0 1.7
Rajkot 11,259 2.2 2.4 1.8 2.0 2.1
Sabar Kantha 7,400 1.7 2.0 3.0 2.0 2.1
Surat 4,336 1.9 2.0 3.0 2.0 2.2
Surendranagar 10,431 1.9 2.4 2.3 2.0 2.1
Tapi 3,140 1.5 2.0 3.0 2.0 2.1
The Dangs 1,762 1.5 2.0 3.0 2.0 2.1
Vadodara 7,549 1.5 2.0 3.0 2.0 2.1
Valsad 2,950 2.0 2.0 2.1 2.0 2.0
Daman & Diu
Daman 63 2.0 2.0 1.0 1.0 1.4
Diu 28 3.4 3.0 1.0 1.0 1.9
Dadra & Nagar Haveli
Dadra & Nagar Haveli 490 2.0 2.0 1.0 1.0 1.4
Karnataka
Bagalkot 6,550 1.0 1.0 1.0 1.0 1.0
Bangalore 2,199 1.0 1.0 1.4 1.5 1.3
Bangalore Rural 2,301 1.0 1.0 1.9 2.0 1.6
Belgaum 13,427 1.0 1.4 1.0 1.0 1.1
Bellary 8,464 1.1 1.0 1.0 1.0 1.0
Bidar 5,446 1.5 1.0 2.2 2.0 1.7
Bijapur (K) 10,492 1.1 1.1 1.3 1.5 1.3
Chamarajanagar 5,651 1.1 1.1 1.0 4.5 2.4
Chikkaballapura 4,250 1.0 1.0 1.7 2.0 1.5
Chikmagalur 7,200 1.0 1.1 1.0 1.0 1.0
Chitradurga 8,437 1.0 1.0 1.0 1.0 1.0
Dakshina Kannada 4,861 1.3 1.9 1.0 1.0 1.2
Davanagere 5,922 1.0 1.0 1.0 1.0 1.0
Dharwad 4,256 1.0 1.0 1.0 1.0 1.0
Gadag 4,655 1.0 1.0 1.0 1.0 1.0
Gulbarga 10,960 1.5 1.0 2.4 2.0 1.8
Hassan 6,812 1.0 1.0 1.0 1.5 1.2
Haveri 4,820 1.0 1.0 1.0 1.0 1.0
Kodagu 4,108 1.1 1.6 1.0 4.5 2.5
Kolar 3,988 1.0 1.0 1.0 1.0 1.0
Koppal 5,569 1.0 1.0 1.0 1.0 1.0
Mandya 4,964 1.0 1.0 1.4 1.5 1.3
Mysore 6,308 1.0 1.1 1.0 1.5 1.2
Raichur 8,446 1.2 1.0 1.7 2.0 1.6
Ramanagara 3,516 1.0 1.0 1.5 1.5 1.3
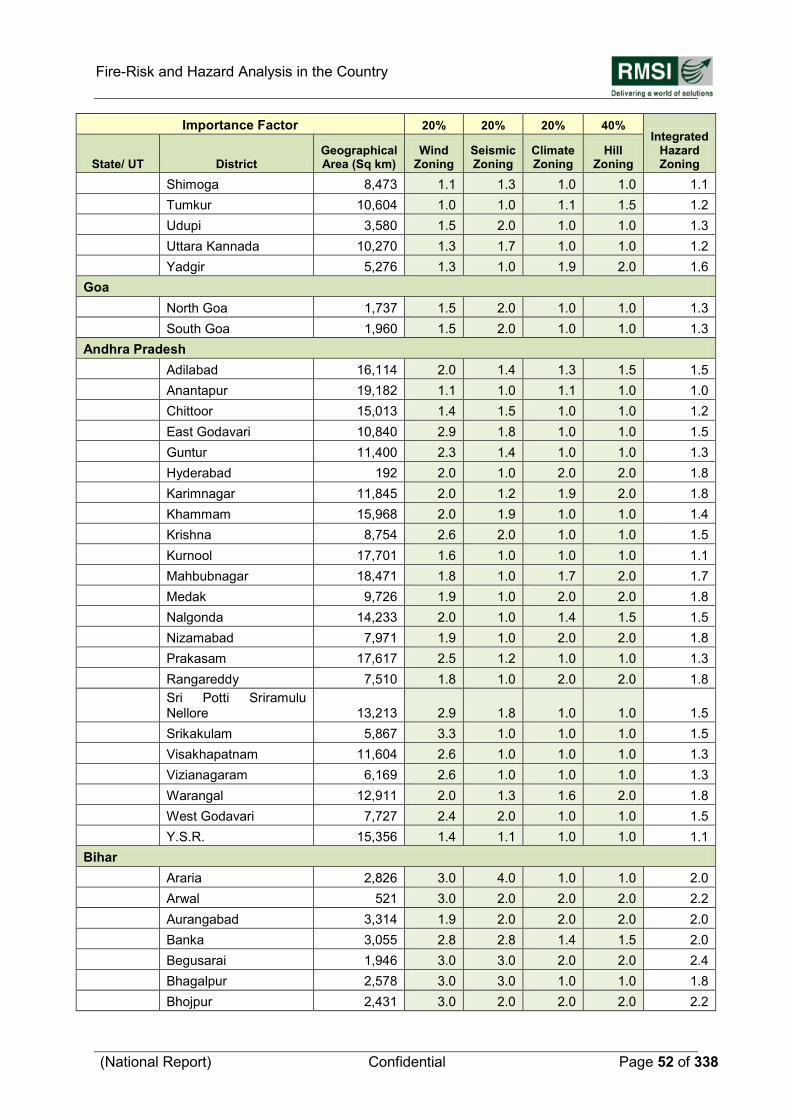
Fire-Risk and Hazard Analysis in the Country
(National Report) Confidential Page 52 of 338
Importance Factor 20% 20% 20% 40% Integrated
Hazard Zoning State/ UT District
Geographical Area (Sq km)
Wind Zoning
Seismic Zoning
Climate Zoning
Hill Zoning
Shimoga 8,473 1.1 1.3 1.0 1.0 1.1
Tumkur 10,604 1.0 1.0 1.1 1.5 1.2
Udupi 3,580 1.5 2.0 1.0 1.0 1.3
Uttara Kannada 10,270 1.3 1.7 1.0 1.0 1.2
Yadgir 5,276 1.3 1.0 1.9 2.0 1.6
Goa
North Goa 1,737 1.5 2.0 1.0 1.0 1.3
South Goa 1,960 1.5 2.0 1.0 1.0 1.3
Andhra Pradesh
Adilabad 16,114 2.0 1.4 1.3 1.5 1.5
Anantapur 19,182 1.1 1.0 1.1 1.0 1.0
Chittoor 15,013 1.4 1.5 1.0 1.0 1.2
East Godavari 10,840 2.9 1.8 1.0 1.0 1.5
Guntur 11,400 2.3 1.4 1.0 1.0 1.3
Hyderabad 192 2.0 1.0 2.0 2.0 1.8
Karimnagar 11,845 2.0 1.2 1.9 2.0 1.8
Khammam 15,968 2.0 1.9 1.0 1.0 1.4
Krishna 8,754 2.6 2.0 1.0 1.0 1.5
Kurnool 17,701 1.6 1.0 1.0 1.0 1.1
Mahbubnagar 18,471 1.8 1.0 1.7 2.0 1.7
Medak 9,726 1.9 1.0 2.0 2.0 1.8
Nalgonda 14,233 2.0 1.0 1.4 1.5 1.5
Nizamabad 7,971 1.9 1.0 2.0 2.0 1.8
Prakasam 17,617 2.5 1.2 1.0 1.0 1.3
Rangareddy 7,510 1.8 1.0 2.0 2.0 1.8
Sri Potti Sriramulu Nellore 13,213 2.9 1.8 1.0 1.0 1.5
Srikakulam 5,867 3.3 1.0 1.0 1.0 1.5
Visakhapatnam 11,604 2.6 1.0 1.0 1.0 1.3
Vizianagaram 6,169 2.6 1.0 1.0 1.0 1.3
Warangal 12,911 2.0 1.3 1.6 2.0 1.8
West Godavari 7,727 2.4 2.0 1.0 1.0 1.5
Y.S.R. 15,356 1.4 1.1 1.0 1.0 1.1
Bihar
Araria 2,826 3.0 4.0 1.0 1.0 2.0
Arwal 521 3.0 2.0 2.0 2.0 2.2
Aurangabad 3,314 1.9 2.0 2.0 2.0 2.0
Banka 3,055 2.8 2.8 1.4 1.5 2.0
Begusarai 1,946 3.0 3.0 2.0 2.0 2.4
Bhagalpur 2,578 3.0 3.0 1.0 1.0 1.8
Bhojpur 2,431 3.0 2.0 2.0 2.0 2.2
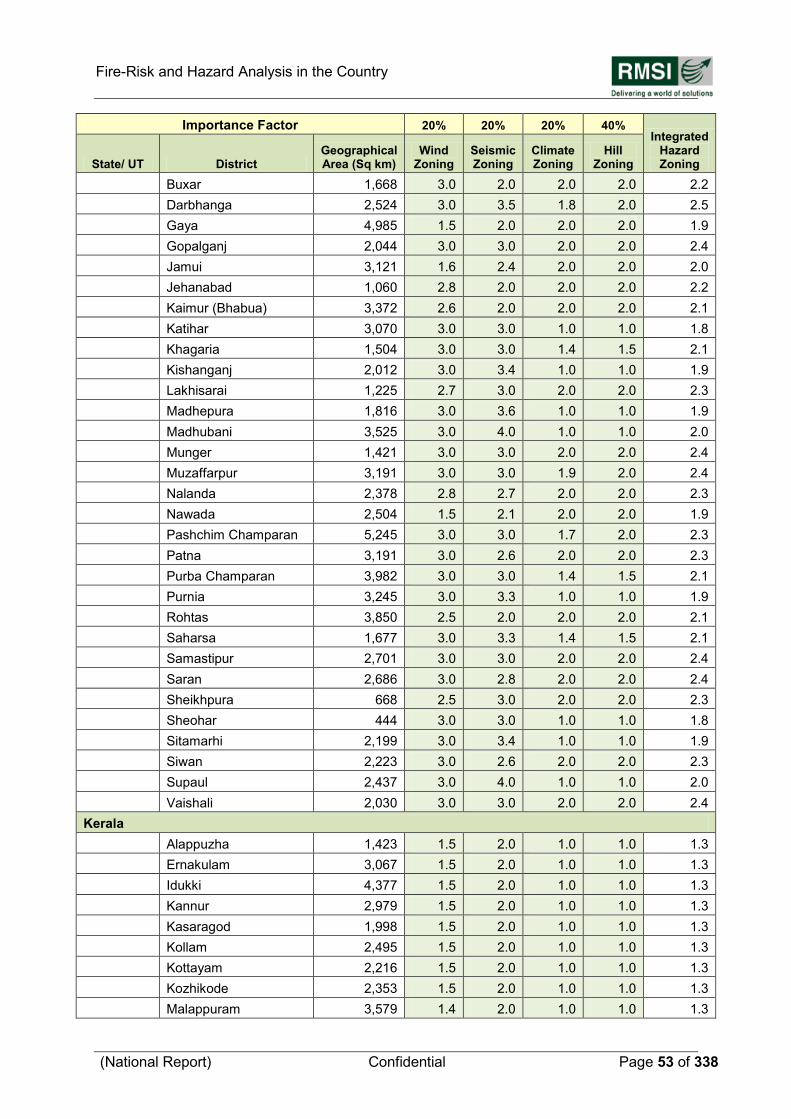
Fire-Risk and Hazard Analysis in the Country
(National Report) Confidential Page 53 of 338
Importance Factor 20% 20% 20% 40% Integrated
Hazard Zoning State/ UT District
Geographical Area (Sq km)
Wind Zoning
Seismic Zoning
Climate Zoning
Hill Zoning
Buxar 1,668 3.0 2.0 2.0 2.0 2.2
Darbhanga 2,524 3.0 3.5 1.8 2.0 2.5
Gaya 4,985 1.5 2.0 2.0 2.0 1.9
Gopalganj 2,044 3.0 3.0 2.0 2.0 2.4
Jamui 3,121 1.6 2.4 2.0 2.0 2.0
Jehanabad 1,060 2.8 2.0 2.0 2.0 2.2
Kaimur (Bhabua) 3,372 2.6 2.0 2.0 2.0 2.1
Katihar 3,070 3.0 3.0 1.0 1.0 1.8
Khagaria 1,504 3.0 3.0 1.4 1.5 2.1
Kishanganj 2,012 3.0 3.4 1.0 1.0 1.9
Lakhisarai 1,225 2.7 3.0 2.0 2.0 2.3
Madhepura 1,816 3.0 3.6 1.0 1.0 1.9
Madhubani 3,525 3.0 4.0 1.0 1.0 2.0
Munger 1,421 3.0 3.0 2.0 2.0 2.4
Muzaffarpur 3,191 3.0 3.0 1.9 2.0 2.4
Nalanda 2,378 2.8 2.7 2.0 2.0 2.3
Nawada 2,504 1.5 2.1 2.0 2.0 1.9
Pashchim Champaran 5,245 3.0 3.0 1.7 2.0 2.3
Patna 3,191 3.0 2.6 2.0 2.0 2.3
Purba Champaran 3,982 3.0 3.0 1.4 1.5 2.1
Purnia 3,245 3.0 3.3 1.0 1.0 1.9
Rohtas 3,850 2.5 2.0 2.0 2.0 2.1
Saharsa 1,677 3.0 3.3 1.4 1.5 2.1
Samastipur 2,701 3.0 3.0 2.0 2.0 2.4
Saran 2,686 3.0 2.8 2.0 2.0 2.4
Sheikhpura 668 2.5 3.0 2.0 2.0 2.3
Sheohar 444 3.0 3.0 1.0 1.0 1.8
Sitamarhi 2,199 3.0 3.4 1.0 1.0 1.9
Siwan 2,223 3.0 2.6 2.0 2.0 2.3
Supaul 2,437 3.0 4.0 1.0 1.0 2.0
Vaishali 2,030 3.0 3.0 2.0 2.0 2.4
Kerala
Alappuzha 1,423 1.5 2.0 1.0 1.0 1.3
Ernakulam 3,067 1.5 2.0 1.0 1.0 1.3
Idukki 4,377 1.5 2.0 1.0 1.0 1.3
Kannur 2,979 1.5 2.0 1.0 1.0 1.3
Kasaragod 1,998 1.5 2.0 1.0 1.0 1.3
Kollam 2,495 1.5 2.0 1.0 1.0 1.3
Kottayam 2,216 1.5 2.0 1.0 1.0 1.3
Kozhikode 2,353 1.5 2.0 1.0 1.0 1.3
Malappuram 3,579 1.4 2.0 1.0 1.0 1.3
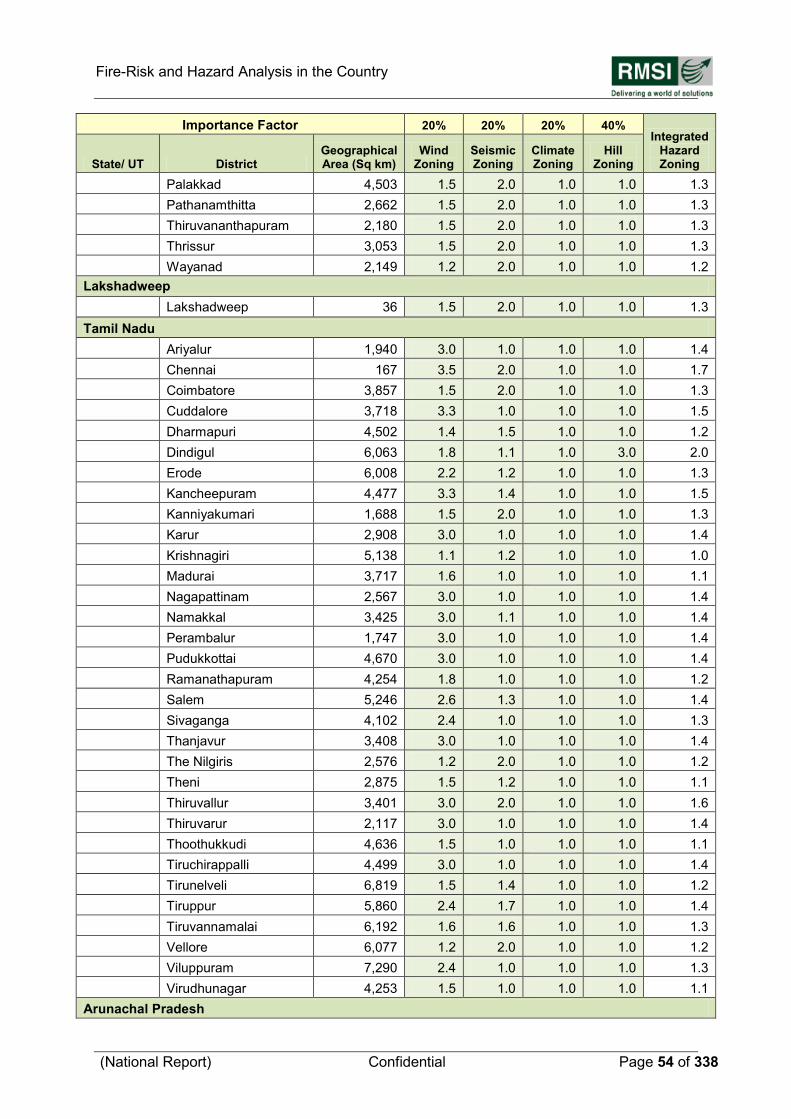
Fire-Risk and Hazard Analysis in the Country
(National Report) Confidential Page 54 of 338
Importance Factor 20% 20% 20% 40% Integrated
Hazard Zoning State/ UT District
Geographical Area (Sq km)
Wind Zoning
Seismic Zoning
Climate Zoning
Hill Zoning
Palakkad 4,503 1.5 2.0 1.0 1.0 1.3
Pathanamthitta 2,662 1.5 2.0 1.0 1.0 1.3
Thiruvananthapuram 2,180 1.5 2.0 1.0 1.0 1.3
Thrissur 3,053 1.5 2.0 1.0 1.0 1.3
Wayanad 2,149 1.2 2.0 1.0 1.0 1.2
Lakshadweep
Lakshadweep 36 1.5 2.0 1.0 1.0 1.3
Tamil Nadu
Ariyalur 1,940 3.0 1.0 1.0 1.0 1.4
Chennai 167 3.5 2.0 1.0 1.0 1.7
Coimbatore 3,857 1.5 2.0 1.0 1.0 1.3
Cuddalore 3,718 3.3 1.0 1.0 1.0 1.5
Dharmapuri 4,502 1.4 1.5 1.0 1.0 1.2
Dindigul 6,063 1.8 1.1 1.0 3.0 2.0
Erode 6,008 2.2 1.2 1.0 1.0 1.3
Kancheepuram 4,477 3.3 1.4 1.0 1.0 1.5
Kanniyakumari 1,688 1.5 2.0 1.0 1.0 1.3
Karur 2,908 3.0 1.0 1.0 1.0 1.4
Krishnagiri 5,138 1.1 1.2 1.0 1.0 1.0
Madurai 3,717 1.6 1.0 1.0 1.0 1.1
Nagapattinam 2,567 3.0 1.0 1.0 1.0 1.4
Namakkal 3,425 3.0 1.1 1.0 1.0 1.4
Perambalur 1,747 3.0 1.0 1.0 1.0 1.4
Pudukkottai 4,670 3.0 1.0 1.0 1.0 1.4
Ramanathapuram 4,254 1.8 1.0 1.0 1.0 1.2
Salem 5,246 2.6 1.3 1.0 1.0 1.4
Sivaganga 4,102 2.4 1.0 1.0 1.0 1.3
Thanjavur 3,408 3.0 1.0 1.0 1.0 1.4
The Nilgiris 2,576 1.2 2.0 1.0 1.0 1.2
Theni 2,875 1.5 1.2 1.0 1.0 1.1
Thiruvallur 3,401 3.0 2.0 1.0 1.0 1.6
Thiruvarur 2,117 3.0 1.0 1.0 1.0 1.4
Thoothukkudi 4,636 1.5 1.0 1.0 1.0 1.1
Tiruchirappalli 4,499 3.0 1.0 1.0 1.0 1.4
Tirunelveli 6,819 1.5 1.4 1.0 1.0 1.2
Tiruppur 5,860 2.4 1.7 1.0 1.0 1.4
Tiruvannamalai 6,192 1.6 1.6 1.0 1.0 1.3
Vellore 6,077 1.2 2.0 1.0 1.0 1.2
Viluppuram 7,290 2.4 1.0 1.0 1.0 1.3
Virudhunagar 4,253 1.5 1.0 1.0 1.0 1.1
Arunachal Pradesh
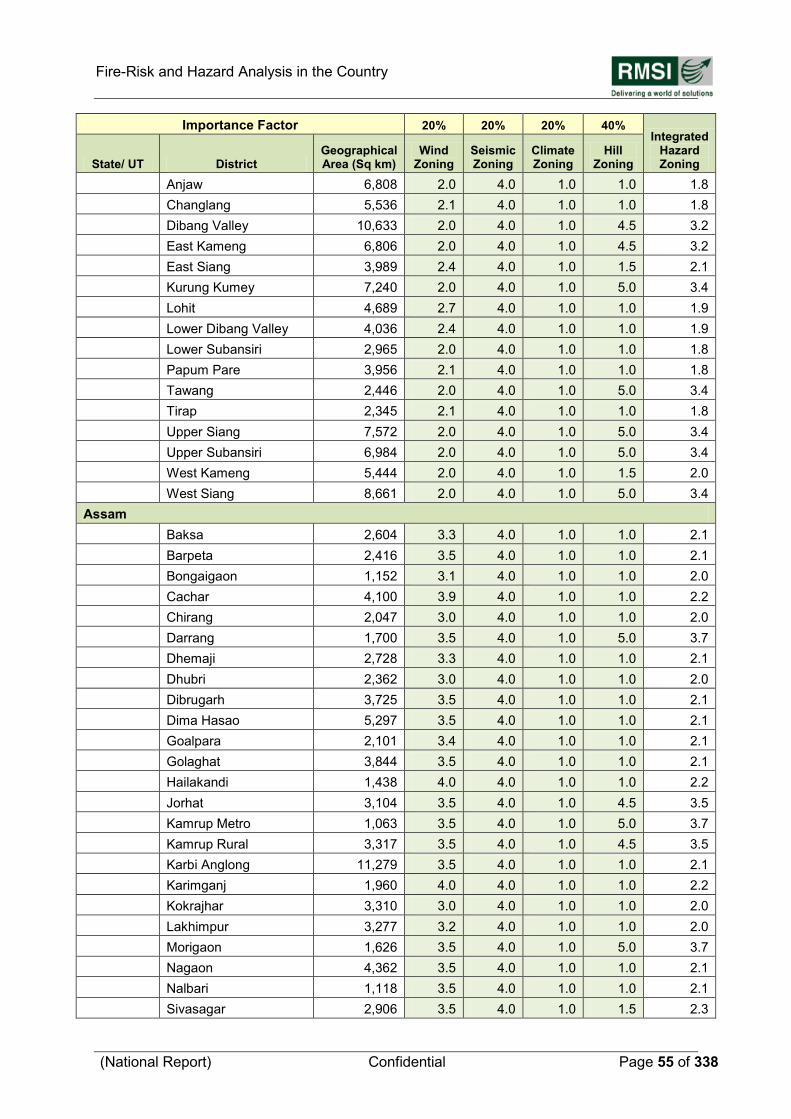
Fire-Risk and Hazard Analysis in the Country
(National Report) Confidential Page 55 of 338
Importance Factor 20% 20% 20% 40% Integrated
Hazard Zoning State/ UT District
Geographical Area (Sq km)
Wind Zoning
Seismic Zoning
Climate Zoning
Hill Zoning
Anjaw 6,808 2.0 4.0 1.0 1.0 1.8
Changlang 5,536 2.1 4.0 1.0 1.0 1.8
Dibang Valley 10,633 2.0 4.0 1.0 4.5 3.2
East Kameng 6,806 2.0 4.0 1.0 4.5 3.2
East Siang 3,989 2.4 4.0 1.0 1.5 2.1
Kurung Kumey 7,240 2.0 4.0 1.0 5.0 3.4
Lohit 4,689 2.7 4.0 1.0 1.0 1.9
Lower Dibang Valley 4,036 2.4 4.0 1.0 1.0 1.9
Lower Subansiri 2,965 2.0 4.0 1.0 1.0 1.8
Papum Pare 3,956 2.1 4.0 1.0 1.0 1.8
Tawang 2,446 2.0 4.0 1.0 5.0 3.4
Tirap 2,345 2.1 4.0 1.0 1.0 1.8
Upper Siang 7,572 2.0 4.0 1.0 5.0 3.4
Upper Subansiri 6,984 2.0 4.0 1.0 5.0 3.4
West Kameng 5,444 2.0 4.0 1.0 1.5 2.0
West Siang 8,661 2.0 4.0 1.0 5.0 3.4
Assam
Baksa 2,604 3.3 4.0 1.0 1.0 2.1
Barpeta 2,416 3.5 4.0 1.0 1.0 2.1
Bongaigaon 1,152 3.1 4.0 1.0 1.0 2.0
Cachar 4,100 3.9 4.0 1.0 1.0 2.2
Chirang 2,047 3.0 4.0 1.0 1.0 2.0
Darrang 1,700 3.5 4.0 1.0 5.0 3.7
Dhemaji 2,728 3.3 4.0 1.0 1.0 2.1
Dhubri 2,362 3.0 4.0 1.0 1.0 2.0
Dibrugarh 3,725 3.5 4.0 1.0 1.0 2.1
Dima Hasao 5,297 3.5 4.0 1.0 1.0 2.1
Goalpara 2,101 3.4 4.0 1.0 1.0 2.1
Golaghat 3,844 3.5 4.0 1.0 1.0 2.1
Hailakandi 1,438 4.0 4.0 1.0 1.0 2.2
Jorhat 3,104 3.5 4.0 1.0 4.5 3.5
Kamrup Metro 1,063 3.5 4.0 1.0 5.0 3.7
Kamrup Rural 3,317 3.5 4.0 1.0 4.5 3.5
Karbi Anglong 11,279 3.5 4.0 1.0 1.0 2.1
Karimganj 1,960 4.0 4.0 1.0 1.0 2.2
Kokrajhar 3,310 3.0 4.0 1.0 1.0 2.0
Lakhimpur 3,277 3.2 4.0 1.0 1.0 2.0
Morigaon 1,626 3.5 4.0 1.0 5.0 3.7
Nagaon 4,362 3.5 4.0 1.0 1.0 2.1
Nalbari 1,118 3.5 4.0 1.0 1.0 2.1
Sivasagar 2,906 3.5 4.0 1.0 1.5 2.3
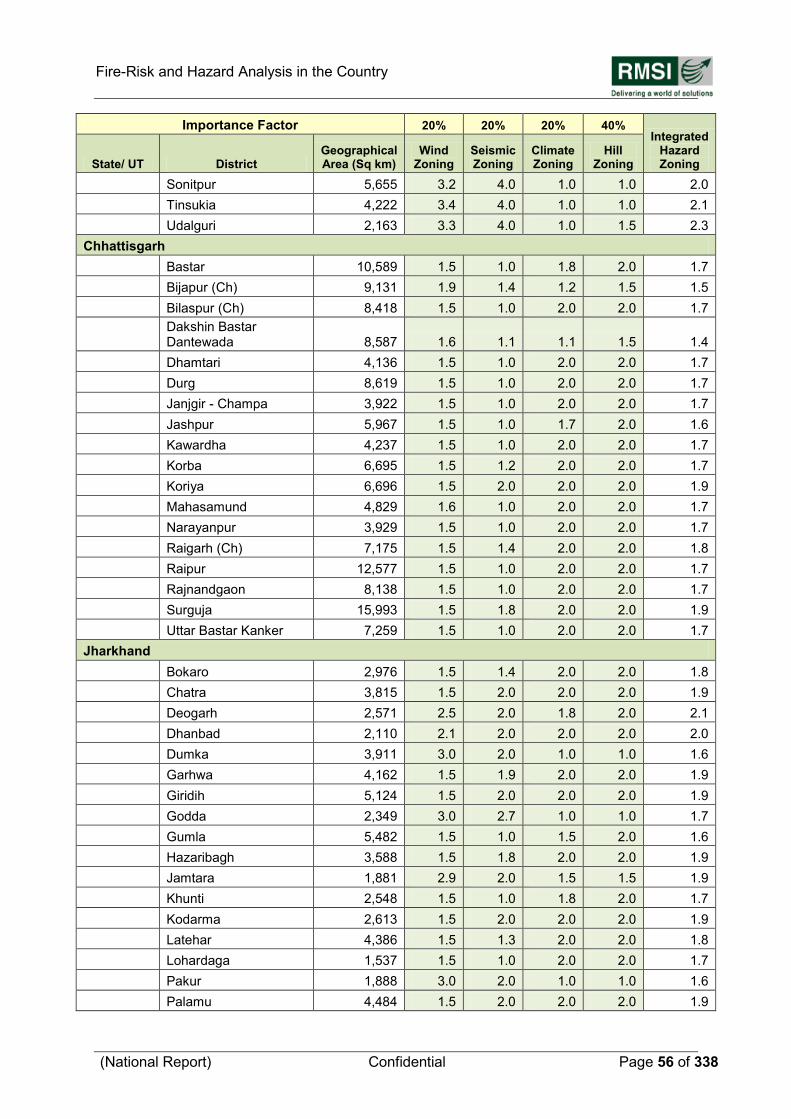
Fire-Risk and Hazard Analysis in the Country
(National Report) Confidential Page 56 of 338
Importance Factor 20% 20% 20% 40% Integrated
Hazard Zoning State/ UT District
Geographical Area (Sq km)
Wind Zoning
Seismic Zoning
Climate Zoning
Hill Zoning
Sonitpur 5,655 3.2 4.0 1.0 1.0 2.0
Tinsukia 4,222 3.4 4.0 1.0 1.0 2.1
Udalguri 2,163 3.3 4.0 1.0 1.5 2.3
Chhattisgarh
Bastar 10,589 1.5 1.0 1.8 2.0 1.7
Bijapur (Ch) 9,131 1.9 1.4 1.2 1.5 1.5
Bilaspur (Ch) 8,418 1.5 1.0 2.0 2.0 1.7
Dakshin Bastar Dantewada 8,587 1.6 1.1 1.1 1.5 1.4
Dhamtari 4,136 1.5 1.0 2.0 2.0 1.7
Durg 8,619 1.5 1.0 2.0 2.0 1.7
Janjgir - Champa 3,922 1.5 1.0 2.0 2.0 1.7
Jashpur 5,967 1.5 1.0 1.7 2.0 1.6
Kawardha 4,237 1.5 1.0 2.0 2.0 1.7
Korba 6,695 1.5 1.2 2.0 2.0 1.7
Koriya 6,696 1.5 2.0 2.0 2.0 1.9
Mahasamund 4,829 1.6 1.0 2.0 2.0 1.7
Narayanpur 3,929 1.5 1.0 2.0 2.0 1.7
Raigarh (Ch) 7,175 1.5 1.4 2.0 2.0 1.8
Raipur 12,577 1.5 1.0 2.0 2.0 1.7
Rajnandgaon 8,138 1.5 1.0 2.0 2.0 1.7
Surguja 15,993 1.5 1.8 2.0 2.0 1.9
Uttar Bastar Kanker 7,259 1.5 1.0 2.0 2.0 1.7
Jharkhand
Bokaro 2,976 1.5 1.4 2.0 2.0 1.8
Chatra 3,815 1.5 2.0 2.0 2.0 1.9
Deogarh 2,571 2.5 2.0 1.8 2.0 2.1
Dhanbad 2,110 2.1 2.0 2.0 2.0 2.0
Dumka 3,911 3.0 2.0 1.0 1.0 1.6
Garhwa 4,162 1.5 1.9 2.0 2.0 1.9
Giridih 5,124 1.5 2.0 2.0 2.0 1.9
Godda 2,349 3.0 2.7 1.0 1.0 1.7
Gumla 5,482 1.5 1.0 1.5 2.0 1.6
Hazaribagh 3,588 1.5 1.8 2.0 2.0 1.9
Jamtara 1,881 2.9 2.0 1.5 1.5 1.9
Khunti 2,548 1.5 1.0 1.8 2.0 1.7
Kodarma 2,613 1.5 2.0 2.0 2.0 1.9
Latehar 4,386 1.5 1.3 2.0 2.0 1.8
Lohardaga 1,537 1.5 1.0 2.0 2.0 1.7
Pakur 1,888 3.0 2.0 1.0 1.0 1.6
Palamu 4,484 1.5 2.0 2.0 2.0 1.9
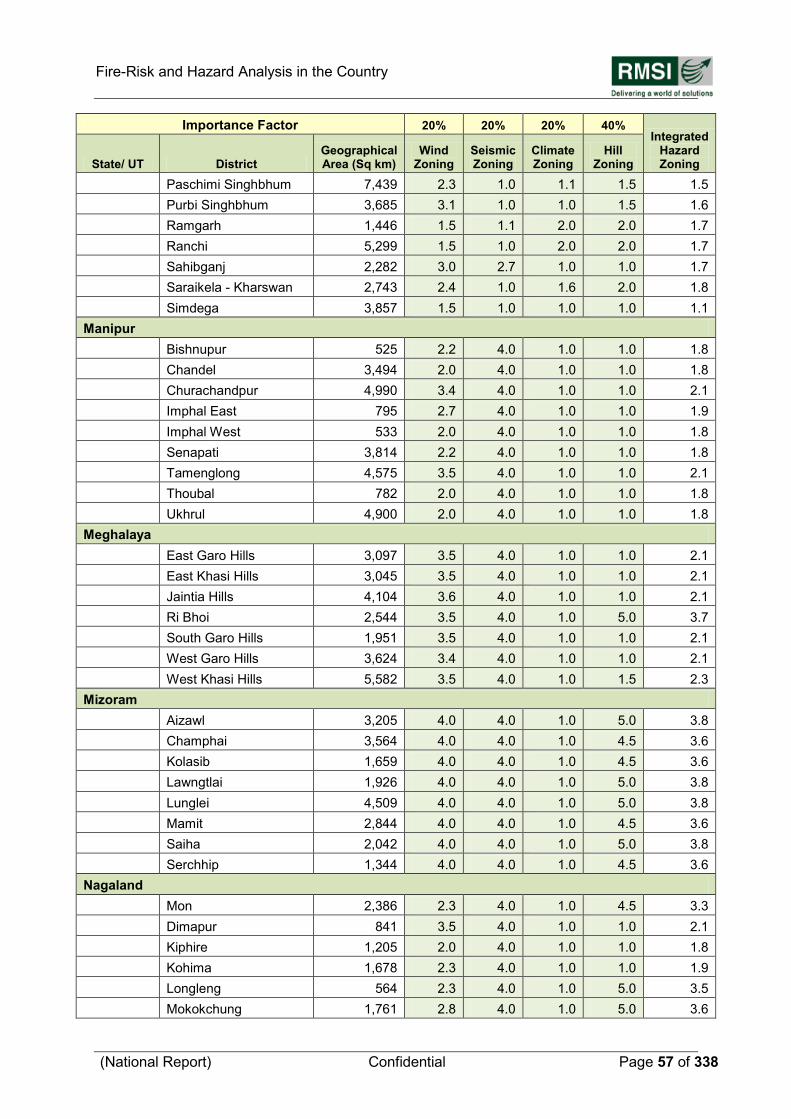
Fire-Risk and Hazard Analysis in the Country
(National Report) Confidential Page 57 of 338
Importance Factor 20% 20% 20% 40% Integrated
Hazard Zoning State/ UT District
Geographical Area (Sq km)
Wind Zoning
Seismic Zoning
Climate Zoning
Hill Zoning
Paschimi Singhbhum 7,439 2.3 1.0 1.1 1.5 1.5
Purbi Singhbhum 3,685 3.1 1.0 1.0 1.5 1.6
Ramgarh 1,446 1.5 1.1 2.0 2.0 1.7
Ranchi 5,299 1.5 1.0 2.0 2.0 1.7
Sahibganj 2,282 3.0 2.7 1.0 1.0 1.7
Saraikela - Kharswan 2,743 2.4 1.0 1.6 2.0 1.8
Simdega 3,857 1.5 1.0 1.0 1.0 1.1
Manipur
Bishnupur 525 2.2 4.0 1.0 1.0 1.8
Chandel 3,494 2.0 4.0 1.0 1.0 1.8
Churachandpur 4,990 3.4 4.0 1.0 1.0 2.1
Imphal East 795 2.7 4.0 1.0 1.0 1.9
Imphal West 533 2.0 4.0 1.0 1.0 1.8
Senapati 3,814 2.2 4.0 1.0 1.0 1.8
Tamenglong 4,575 3.5 4.0 1.0 1.0 2.1
Thoubal 782 2.0 4.0 1.0 1.0 1.8
Ukhrul 4,900 2.0 4.0 1.0 1.0 1.8
Meghalaya
East Garo Hills 3,097 3.5 4.0 1.0 1.0 2.1
East Khasi Hills 3,045 3.5 4.0 1.0 1.0 2.1
Jaintia Hills 4,104 3.6 4.0 1.0 1.0 2.1
Ri Bhoi 2,544 3.5 4.0 1.0 5.0 3.7
South Garo Hills 1,951 3.5 4.0 1.0 1.0 2.1
West Garo Hills 3,624 3.4 4.0 1.0 1.0 2.1
West Khasi Hills 5,582 3.5 4.0 1.0 1.5 2.3
Mizoram
Aizawl 3,205 4.0 4.0 1.0 5.0 3.8
Champhai 3,564 4.0 4.0 1.0 4.5 3.6
Kolasib 1,659 4.0 4.0 1.0 4.5 3.6
Lawngtlai 1,926 4.0 4.0 1.0 5.0 3.8
Lunglei 4,509 4.0 4.0 1.0 5.0 3.8
Mamit 2,844 4.0 4.0 1.0 4.5 3.6
Saiha 2,042 4.0 4.0 1.0 5.0 3.8
Serchhip 1,344 4.0 4.0 1.0 4.5 3.6
Nagaland
Mon 2,386 2.3 4.0 1.0 4.5 3.3
Dimapur 841 3.5 4.0 1.0 1.0 2.1
Kiphire 1,205 2.0 4.0 1.0 1.0 1.8
Kohima 1,678 2.3 4.0 1.0 1.0 1.9
Longleng 564 2.3 4.0 1.0 5.0 3.5
Mokokchung 1,761 2.8 4.0 1.0 5.0 3.6
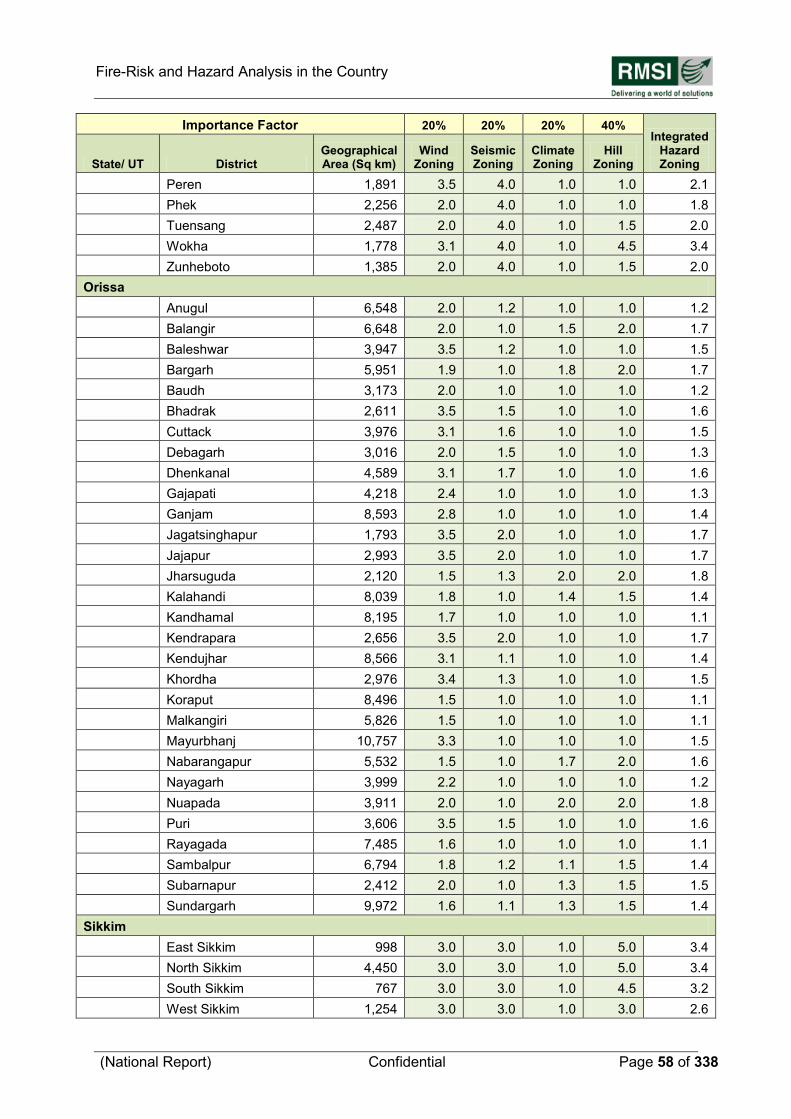
Fire-Risk and Hazard Analysis in the Country
(National Report) Confidential Page 58 of 338
Importance Factor 20% 20% 20% 40% Integrated
Hazard Zoning State/ UT District
Geographical Area (Sq km)
Wind Zoning
Seismic Zoning
Climate Zoning
Hill Zoning
Peren 1,891 3.5 4.0 1.0 1.0 2.1
Phek 2,256 2.0 4.0 1.0 1.0 1.8
Tuensang 2,487 2.0 4.0 1.0 1.5 2.0
Wokha 1,778 3.1 4.0 1.0 4.5 3.4
Zunheboto 1,385 2.0 4.0 1.0 1.5 2.0
Orissa
Anugul 6,548 2.0 1.2 1.0 1.0 1.2
Balangir 6,648 2.0 1.0 1.5 2.0 1.7
Baleshwar 3,947 3.5 1.2 1.0 1.0 1.5
Bargarh 5,951 1.9 1.0 1.8 2.0 1.7
Baudh 3,173 2.0 1.0 1.0 1.0 1.2
Bhadrak 2,611 3.5 1.5 1.0 1.0 1.6
Cuttack 3,976 3.1 1.6 1.0 1.0 1.5
Debagarh 3,016 2.0 1.5 1.0 1.0 1.3
Dhenkanal 4,589 3.1 1.7 1.0 1.0 1.6
Gajapati 4,218 2.4 1.0 1.0 1.0 1.3
Ganjam 8,593 2.8 1.0 1.0 1.0 1.4
Jagatsinghapur 1,793 3.5 2.0 1.0 1.0 1.7
Jajapur 2,993 3.5 2.0 1.0 1.0 1.7
Jharsuguda 2,120 1.5 1.3 2.0 2.0 1.8
Kalahandi 8,039 1.8 1.0 1.4 1.5 1.4
Kandhamal 8,195 1.7 1.0 1.0 1.0 1.1
Kendrapara 2,656 3.5 2.0 1.0 1.0 1.7
Kendujhar 8,566 3.1 1.1 1.0 1.0 1.4
Khordha 2,976 3.4 1.3 1.0 1.0 1.5
Koraput 8,496 1.5 1.0 1.0 1.0 1.1
Malkangiri 5,826 1.5 1.0 1.0 1.0 1.1
Mayurbhanj 10,757 3.3 1.0 1.0 1.0 1.5
Nabarangapur 5,532 1.5 1.0 1.7 2.0 1.6
Nayagarh 3,999 2.2 1.0 1.0 1.0 1.2
Nuapada 3,911 2.0 1.0 2.0 2.0 1.8
Puri 3,606 3.5 1.5 1.0 1.0 1.6
Rayagada 7,485 1.6 1.0 1.0 1.0 1.1
Sambalpur 6,794 1.8 1.2 1.1 1.5 1.4
Subarnapur 2,412 2.0 1.0 1.3 1.5 1.5
Sundargarh 9,972 1.6 1.1 1.3 1.5 1.4
Sikkim
East Sikkim 998 3.0 3.0 1.0 5.0 3.4
North Sikkim 4,450 3.0 3.0 1.0 5.0 3.4
South Sikkim 767 3.0 3.0 1.0 4.5 3.2
West Sikkim 1,254 3.0 3.0 1.0 3.0 2.6
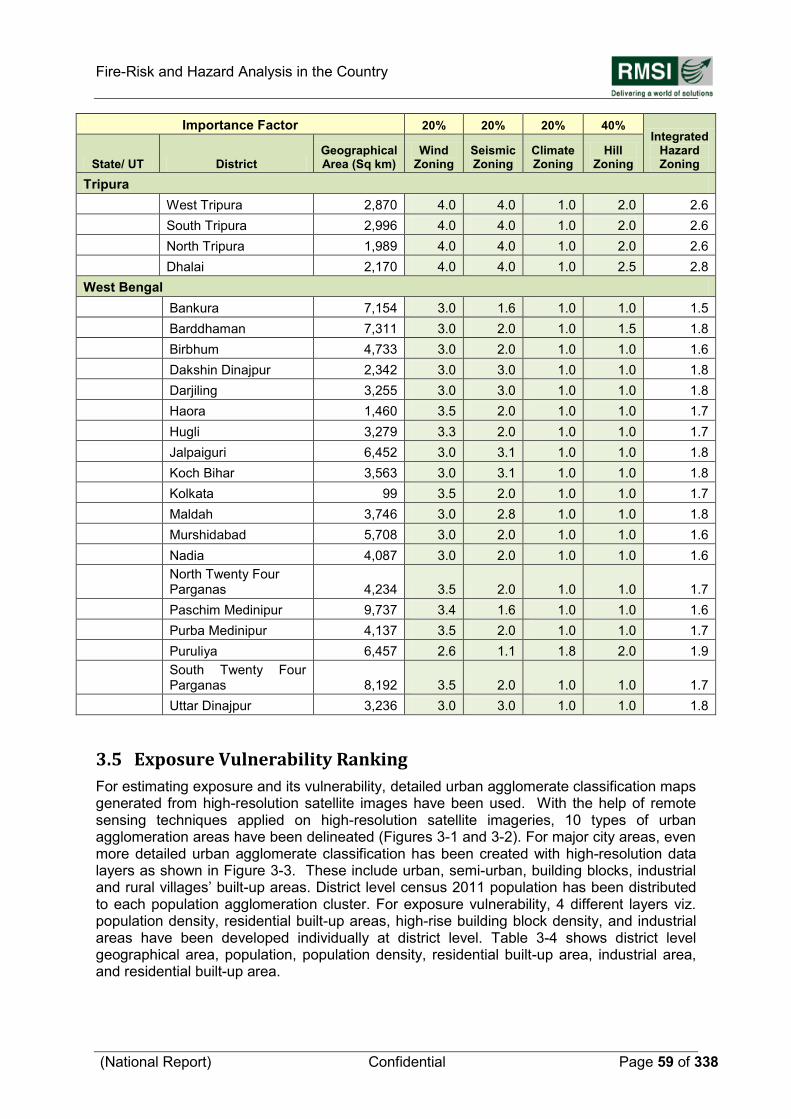
Fire-Risk and Hazard Analysis in the Country
(National Report) Confidential Page 59 of 338
Importance Factor 20% 20% 20% 40% Integrated
Hazard Zoning State/ UT District
Geographical Area (Sq km)
Wind Zoning
Seismic Zoning
Climate Zoning
Hill Zoning
Tripura
West Tripura 2,870 4.0 4.0 1.0 2.0 2.6
South Tripura 2,996 4.0 4.0 1.0 2.0 2.6
North Tripura 1,989 4.0 4.0 1.0 2.0 2.6
Dhalai 2,170 4.0 4.0 1.0 2.5 2.8
West Bengal
Bankura 7,154 3.0 1.6 1.0 1.0 1.5
Barddhaman 7,311 3.0 2.0 1.0 1.5 1.8
Birbhum 4,733 3.0 2.0 1.0 1.0 1.6
Dakshin Dinajpur 2,342 3.0 3.0 1.0 1.0 1.8
Darjiling 3,255 3.0 3.0 1.0 1.0 1.8
Haora 1,460 3.5 2.0 1.0 1.0 1.7
Hugli 3,279 3.3 2.0 1.0 1.0 1.7
Jalpaiguri 6,452 3.0 3.1 1.0 1.0 1.8
Koch Bihar 3,563 3.0 3.1 1.0 1.0 1.8
Kolkata 99 3.5 2.0 1.0 1.0 1.7
Maldah 3,746 3.0 2.8 1.0 1.0 1.8
Murshidabad 5,708 3.0 2.0 1.0 1.0 1.6
Nadia 4,087 3.0 2.0 1.0 1.0 1.6
North Twenty Four Parganas 4,234 3.5 2.0 1.0 1.0 1.7
Paschim Medinipur 9,737 3.4 1.6 1.0 1.0 1.6
Purba Medinipur 4,137 3.5 2.0 1.0 1.0 1.7
Puruliya 6,457 2.6 1.1 1.8 2.0 1.9
South Twenty Four Parganas 8,192 3.5 2.0 1.0 1.0 1.7
Uttar Dinajpur 3,236 3.0 3.0 1.0 1.0 1.8
3.5 Exposure Vulnerability Ranking
For estimating exposure and its vulnerability, detailed urban agglomerate classification maps generated from high-resolution satellite images have been used. With the help of remote sensing techniques applied on high-resolution satellite imageries, 10 types of urban agglomeration areas have been delineated (Figures 3-1 and 3-2). For major city areas, even more detailed urban agglomerate classification has been created with high-resolution data layers as shown in Figure 3-3. These include urban, semi-urban, building blocks, industrial and rural villages‟ built-up areas. District level census 2011 population has been distributed to each population agglomeration cluster. For exposure vulnerability, 4 different layers viz. population density, residential built-up areas, high-rise building block density, and industrial areas have been developed individually at district level. Table 3-4 shows district level geographical area, population, population density, residential built-up area, industrial area, and residential built-up area.
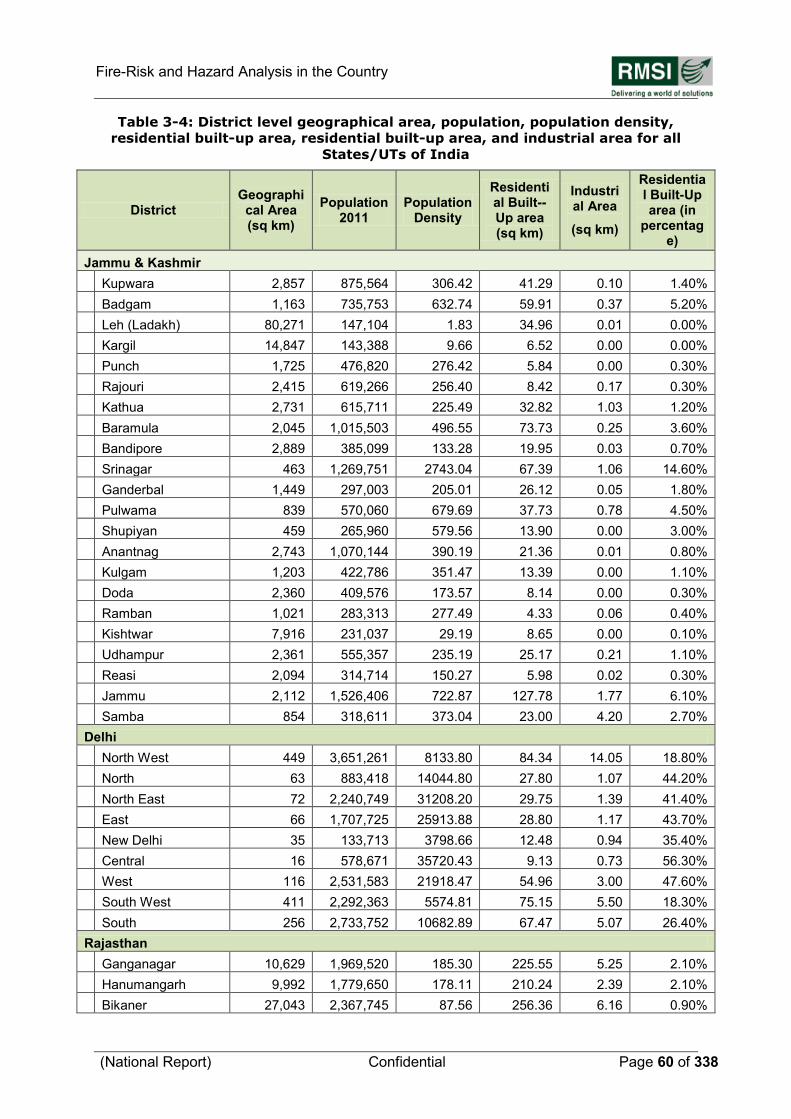
Fire-Risk and Hazard Analysis in the Country
(National Report) Confidential Page 60 of 338
Table 3-4: District level geographical area, population, population density,
residential built-up area, residential built-up area, and industrial area for all
States/UTs of India
District Geographi
cal Area (sq km)
Population 2011
Population Density
Residential Built--Up area (sq km)
Industrial Area
(sq km)
Residential Built-Up area (in
percentage)
Jammu & Kashmir
Kupwara 2,857 875,564 306.42 41.29 0.10 1.40%
Badgam 1,163 735,753 632.74 59.91 0.37 5.20%
Leh (Ladakh) 80,271 147,104 1.83 34.96 0.01 0.00%
Kargil 14,847 143,388 9.66 6.52 0.00 0.00%
Punch 1,725 476,820 276.42 5.84 0.00 0.30%
Rajouri 2,415 619,266 256.40 8.42 0.17 0.30%
Kathua 2,731 615,711 225.49 32.82 1.03 1.20%
Baramula 2,045 1,015,503 496.55 73.73 0.25 3.60%
Bandipore 2,889 385,099 133.28 19.95 0.03 0.70%
Srinagar 463 1,269,751 2743.04 67.39 1.06 14.60%
Ganderbal 1,449 297,003 205.01 26.12 0.05 1.80%
Pulwama 839 570,060 679.69 37.73 0.78 4.50%
Shupiyan 459 265,960 579.56 13.90 0.00 3.00%
Anantnag 2,743 1,070,144 390.19 21.36 0.01 0.80%
Kulgam 1,203 422,786 351.47 13.39 0.00 1.10%
Doda 2,360 409,576 173.57 8.14 0.00 0.30%
Ramban 1,021 283,313 277.49 4.33 0.06 0.40%
Kishtwar 7,916 231,037 29.19 8.65 0.00 0.10%
Udhampur 2,361 555,357 235.19 25.17 0.21 1.10%
Reasi 2,094 314,714 150.27 5.98 0.02 0.30%
Jammu 2,112 1,526,406 722.87 127.78 1.77 6.10%
Samba 854 318,611 373.04 23.00 4.20 2.70%
Delhi
North West 449 3,651,261 8133.80 84.34 14.05 18.80%
North 63 883,418 14044.80 27.80 1.07 44.20%
North East 72 2,240,749 31208.20 29.75 1.39 41.40%
East 66 1,707,725 25913.88 28.80 1.17 43.70%
New Delhi 35 133,713 3798.66 12.48 0.94 35.40%
Central 16 578,671 35720.43 9.13 0.73 56.30%
West 116 2,531,583 21918.47 54.96 3.00 47.60%
South West 411 2,292,363 5574.81 75.15 5.50 18.30%
South 256 2,733,752 10682.89 67.47 5.07 26.40%
Rajasthan
Ganganagar 10,629 1,969,520 185.30 225.55 5.25 2.10%
Hanumangarh 9,992 1,779,650 178.11 210.24 2.39 2.10%
Bikaner 27,043 2,367,745 87.56 256.36 6.16 0.90%
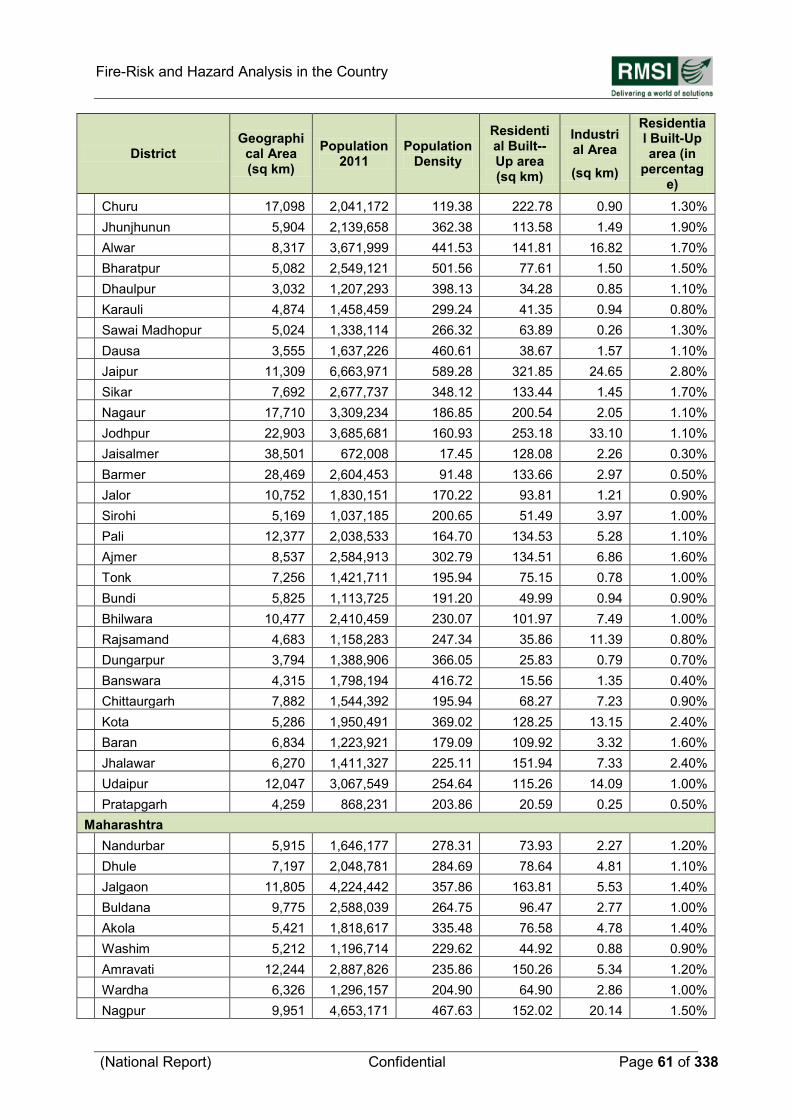
Fire-Risk and Hazard Analysis in the Country
(National Report) Confidential Page 61 of 338
District Geographi
cal Area (sq km)
Population 2011
Population Density
Residential Built--Up area (sq km)
Industrial Area
(sq km)
Residential Built-Up area (in
percentage)
Churu 17,098 2,041,172 119.38 222.78 0.90 1.30%
Jhunjhunun 5,904 2,139,658 362.38 113.58 1.49 1.90%
Alwar 8,317 3,671,999 441.53 141.81 16.82 1.70%
Bharatpur 5,082 2,549,121 501.56 77.61 1.50 1.50%
Dhaulpur 3,032 1,207,293 398.13 34.28 0.85 1.10%
Karauli 4,874 1,458,459 299.24 41.35 0.94 0.80%
Sawai Madhopur 5,024 1,338,114 266.32 63.89 0.26 1.30%
Dausa 3,555 1,637,226 460.61 38.67 1.57 1.10%
Jaipur 11,309 6,663,971 589.28 321.85 24.65 2.80%
Sikar 7,692 2,677,737 348.12 133.44 1.45 1.70%
Nagaur 17,710 3,309,234 186.85 200.54 2.05 1.10%
Jodhpur 22,903 3,685,681 160.93 253.18 33.10 1.10%
Jaisalmer 38,501 672,008 17.45 128.08 2.26 0.30%
Barmer 28,469 2,604,453 91.48 133.66 2.97 0.50%
Jalor 10,752 1,830,151 170.22 93.81 1.21 0.90%
Sirohi 5,169 1,037,185 200.65 51.49 3.97 1.00%
Pali 12,377 2,038,533 164.70 134.53 5.28 1.10%
Ajmer 8,537 2,584,913 302.79 134.51 6.86 1.60%
Tonk 7,256 1,421,711 195.94 75.15 0.78 1.00%
Bundi 5,825 1,113,725 191.20 49.99 0.94 0.90%
Bhilwara 10,477 2,410,459 230.07 101.97 7.49 1.00%
Rajsamand 4,683 1,158,283 247.34 35.86 11.39 0.80%
Dungarpur 3,794 1,388,906 366.05 25.83 0.79 0.70%
Banswara 4,315 1,798,194 416.72 15.56 1.35 0.40%
Chittaurgarh 7,882 1,544,392 195.94 68.27 7.23 0.90%
Kota 5,286 1,950,491 369.02 128.25 13.15 2.40%
Baran 6,834 1,223,921 179.09 109.92 3.32 1.60%
Jhalawar 6,270 1,411,327 225.11 151.94 7.33 2.40%
Udaipur 12,047 3,067,549 254.64 115.26 14.09 1.00%
Pratapgarh 4,259 868,231 203.86 20.59 0.25 0.50%
Maharashtra
Nandurbar 5,915 1,646,177 278.31 73.93 2.27 1.20%
Dhule 7,197 2,048,781 284.69 78.64 4.81 1.10%
Jalgaon 11,805 4,224,442 357.86 163.81 5.53 1.40%
Buldana 9,775 2,588,039 264.75 96.47 2.77 1.00%
Akola 5,421 1,818,617 335.48 76.58 4.78 1.40%
Washim 5,212 1,196,714 229.62 44.92 0.88 0.90%
Amravati 12,244 2,887,826 235.86 150.26 5.34 1.20%
Wardha 6,326 1,296,157 204.90 64.90 2.86 1.00%
Nagpur 9,951 4,653,171 467.63 152.02 20.14 1.50%
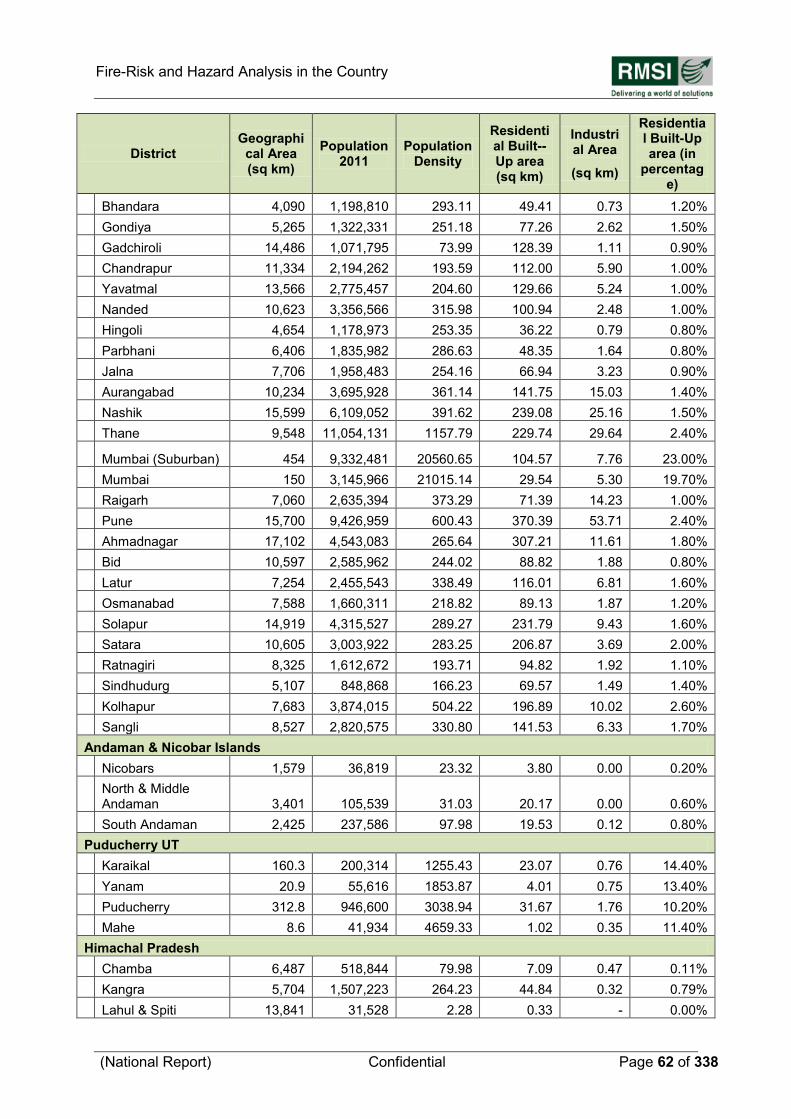
Fire-Risk and Hazard Analysis in the Country
(National Report) Confidential Page 62 of 338
District Geographi
cal Area (sq km)
Population 2011
Population Density
Residential Built--Up area (sq km)
Industrial Area
(sq km)
Residential Built-Up area (in
percentage)
Bhandara 4,090 1,198,810 293.11 49.41 0.73 1.20%
Gondiya 5,265 1,322,331 251.18 77.26 2.62 1.50%
Gadchiroli 14,486 1,071,795 73.99 128.39 1.11 0.90%
Chandrapur 11,334 2,194,262 193.59 112.00 5.90 1.00%
Yavatmal 13,566 2,775,457 204.60 129.66 5.24 1.00%
Nanded 10,623 3,356,566 315.98 100.94 2.48 1.00%
Hingoli 4,654 1,178,973 253.35 36.22 0.79 0.80%
Parbhani 6,406 1,835,982 286.63 48.35 1.64 0.80%
Jalna 7,706 1,958,483 254.16 66.94 3.23 0.90%
Aurangabad 10,234 3,695,928 361.14 141.75 15.03 1.40%
Nashik 15,599 6,109,052 391.62 239.08 25.16 1.50%
Thane 9,548 11,054,131 1157.79 229.74 29.64 2.40%
Mumbai (Suburban) 454 9,332,481 20560.65 104.57 7.76 23.00%
Mumbai 150 3,145,966 21015.14 29.54 5.30 19.70%
Raigarh 7,060 2,635,394 373.29 71.39 14.23 1.00%
Pune 15,700 9,426,959 600.43 370.39 53.71 2.40%
Ahmadnagar 17,102 4,543,083 265.64 307.21 11.61 1.80%
Bid 10,597 2,585,962 244.02 88.82 1.88 0.80%
Latur 7,254 2,455,543 338.49 116.01 6.81 1.60%
Osmanabad 7,588 1,660,311 218.82 89.13 1.87 1.20%
Solapur 14,919 4,315,527 289.27 231.79 9.43 1.60%
Satara 10,605 3,003,922 283.25 206.87 3.69 2.00%
Ratnagiri 8,325 1,612,672 193.71 94.82 1.92 1.10%
Sindhudurg 5,107 848,868 166.23 69.57 1.49 1.40%
Kolhapur 7,683 3,874,015 504.22 196.89 10.02 2.60%
Sangli 8,527 2,820,575 330.80 141.53 6.33 1.70%
Andaman & Nicobar Islands
Nicobars 1,579 36,819 23.32 3.80 0.00 0.20%
North & Middle Andaman 3,401 105,539 31.03 20.17 0.00 0.60%
South Andaman 2,425 237,586 97.98 19.53 0.12 0.80%
Puducherry UT
Karaikal 160.3 200,314 1255.43 23.07 0.76 14.40%
Yanam 20.9 55,616 1853.87 4.01 0.75 13.40%
Puducherry 312.8 946,600 3038.94 31.67 1.76 10.20%
Mahe 8.6 41,934 4659.33 1.02 0.35 11.40%
Himachal Pradesh
Chamba 6,487 518,844 79.98 7.09 0.47 0.11%
Kangra 5,704 1,507,223 264.23 44.84 0.32 0.79%
Lahul & Spiti 13,841 31,528 2.28 0.33 - 0.00%
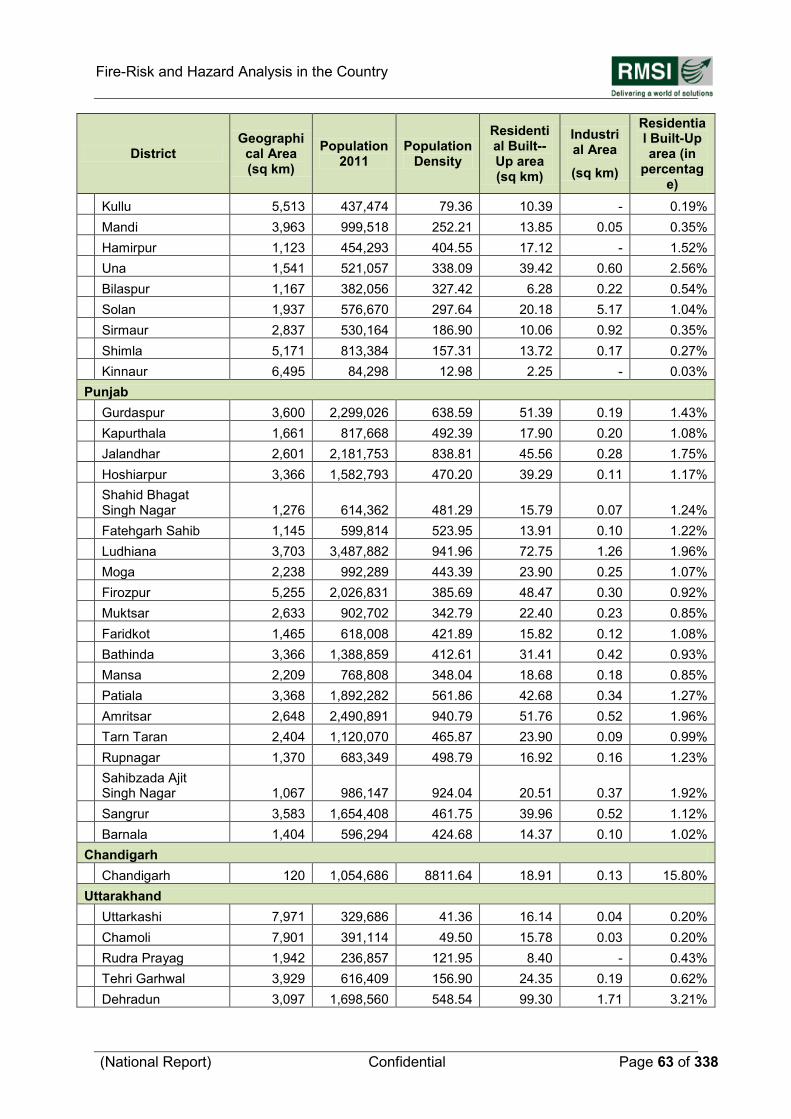
Fire-Risk and Hazard Analysis in the Country
(National Report) Confidential Page 63 of 338
District Geographi
cal Area (sq km)
Population 2011
Population Density
Residential Built--Up area (sq km)
Industrial Area
(sq km)
Residential Built-Up area (in
percentage)
Kullu 5,513 437,474 79.36 10.39 - 0.19%
Mandi 3,963 999,518 252.21 13.85 0.05 0.35%
Hamirpur 1,123 454,293 404.55 17.12 - 1.52%
Una 1,541 521,057 338.09 39.42 0.60 2.56%
Bilaspur 1,167 382,056 327.42 6.28 0.22 0.54%
Solan 1,937 576,670 297.64 20.18 5.17 1.04%
Sirmaur 2,837 530,164 186.90 10.06 0.92 0.35%
Shimla 5,171 813,384 157.31 13.72 0.17 0.27%
Kinnaur 6,495 84,298 12.98 2.25 - 0.03%
Punjab
Gurdaspur 3,600 2,299,026 638.59 51.39 0.19 1.43%
Kapurthala 1,661 817,668 492.39 17.90 0.20 1.08%
Jalandhar 2,601 2,181,753 838.81 45.56 0.28 1.75%
Hoshiarpur 3,366 1,582,793 470.20 39.29 0.11 1.17%
Shahid Bhagat Singh Nagar 1,276 614,362 481.29 15.79 0.07 1.24%
Fatehgarh Sahib 1,145 599,814 523.95 13.91 0.10 1.22%
Ludhiana 3,703 3,487,882 941.96 72.75 1.26 1.96%
Moga 2,238 992,289 443.39 23.90 0.25 1.07%
Firozpur 5,255 2,026,831 385.69 48.47 0.30 0.92%
Muktsar 2,633 902,702 342.79 22.40 0.23 0.85%
Faridkot 1,465 618,008 421.89 15.82 0.12 1.08%
Bathinda 3,366 1,388,859 412.61 31.41 0.42 0.93%
Mansa 2,209 768,808 348.04 18.68 0.18 0.85%
Patiala 3,368 1,892,282 561.86 42.68 0.34 1.27%
Amritsar 2,648 2,490,891 940.79 51.76 0.52 1.96%
Tarn Taran 2,404 1,120,070 465.87 23.90 0.09 0.99%
Rupnagar 1,370 683,349 498.79 16.92 0.16 1.23%
Sahibzada Ajit Singh Nagar 1,067 986,147 924.04 20.51 0.37 1.92%
Sangrur 3,583 1,654,408 461.75 39.96 0.52 1.12%
Barnala 1,404 596,294 424.68 14.37 0.10 1.02%
Chandigarh
Chandigarh 120 1,054,686 8811.64 18.91 0.13 15.80%
Uttarakhand
Uttarkashi 7,971 329,686 41.36 16.14 0.04 0.20%
Chamoli 7,901 391,114 49.50 15.78 0.03 0.20%
Rudra Prayag 1,942 236,857 121.95 8.40 - 0.43%
Tehri Garhwal 3,929 616,409 156.90 24.35 0.19 0.62%
Dehradun 3,097 1,698,560 548.54 99.30 1.71 3.21%
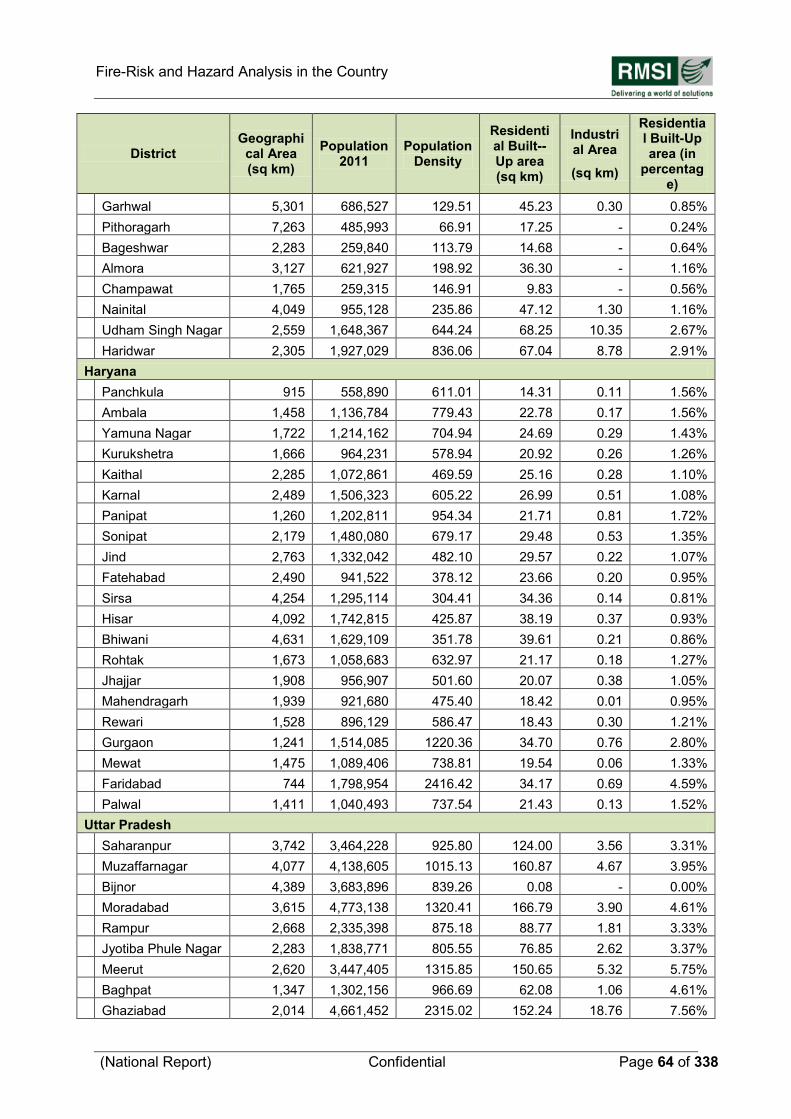
Fire-Risk and Hazard Analysis in the Country
(National Report) Confidential Page 64 of 338
District Geographi
cal Area (sq km)
Population 2011
Population Density
Residential Built--Up area (sq km)
Industrial Area
(sq km)
Residential Built-Up area (in
percentage)
Garhwal 5,301 686,527 129.51 45.23 0.30 0.85%
Pithoragarh 7,263 485,993 66.91 17.25 - 0.24%
Bageshwar 2,283 259,840 113.79 14.68 - 0.64%
Almora 3,127 621,927 198.92 36.30 - 1.16%
Champawat 1,765 259,315 146.91 9.83 - 0.56%
Nainital 4,049 955,128 235.86 47.12 1.30 1.16%
Udham Singh Nagar 2,559 1,648,367 644.24 68.25 10.35 2.67%
Haridwar 2,305 1,927,029 836.06 67.04 8.78 2.91%
Haryana
Panchkula 915 558,890 611.01 14.31 0.11 1.56%
Ambala 1,458 1,136,784 779.43 22.78 0.17 1.56%
Yamuna Nagar 1,722 1,214,162 704.94 24.69 0.29 1.43%
Kurukshetra 1,666 964,231 578.94 20.92 0.26 1.26%
Kaithal 2,285 1,072,861 469.59 25.16 0.28 1.10%
Karnal 2,489 1,506,323 605.22 26.99 0.51 1.08%
Panipat 1,260 1,202,811 954.34 21.71 0.81 1.72%
Sonipat 2,179 1,480,080 679.17 29.48 0.53 1.35%
Jind 2,763 1,332,042 482.10 29.57 0.22 1.07%
Fatehabad 2,490 941,522 378.12 23.66 0.20 0.95%
Sirsa 4,254 1,295,114 304.41 34.36 0.14 0.81%
Hisar 4,092 1,742,815 425.87 38.19 0.37 0.93%
Bhiwani 4,631 1,629,109 351.78 39.61 0.21 0.86%
Rohtak 1,673 1,058,683 632.97 21.17 0.18 1.27%
Jhajjar 1,908 956,907 501.60 20.07 0.38 1.05%
Mahendragarh 1,939 921,680 475.40 18.42 0.01 0.95%
Rewari 1,528 896,129 586.47 18.43 0.30 1.21%
Gurgaon 1,241 1,514,085 1220.36 34.70 0.76 2.80%
Mewat 1,475 1,089,406 738.81 19.54 0.06 1.33%
Faridabad 744 1,798,954 2416.42 34.17 0.69 4.59%
Palwal 1,411 1,040,493 737.54 21.43 0.13 1.52%
Uttar Pradesh
Saharanpur 3,742 3,464,228 925.80 124.00 3.56 3.31%
Muzaffarnagar 4,077 4,138,605 1015.13 160.87 4.67 3.95%
Bijnor 4,389 3,683,896 839.26 0.08 - 0.00%
Moradabad 3,615 4,773,138 1320.41 166.79 3.90 4.61%
Rampur 2,668 2,335,398 875.18 88.77 1.81 3.33%
Jyotiba Phule Nagar 2,283 1,838,771 805.55 76.85 2.62 3.37%
Meerut 2,620 3,447,405 1315.85 150.65 5.32 5.75%
Baghpat 1,347 1,302,156 966.69 62.08 1.06 4.61%
Ghaziabad 2,014 4,661,452 2315.02 152.24 18.76 7.56%
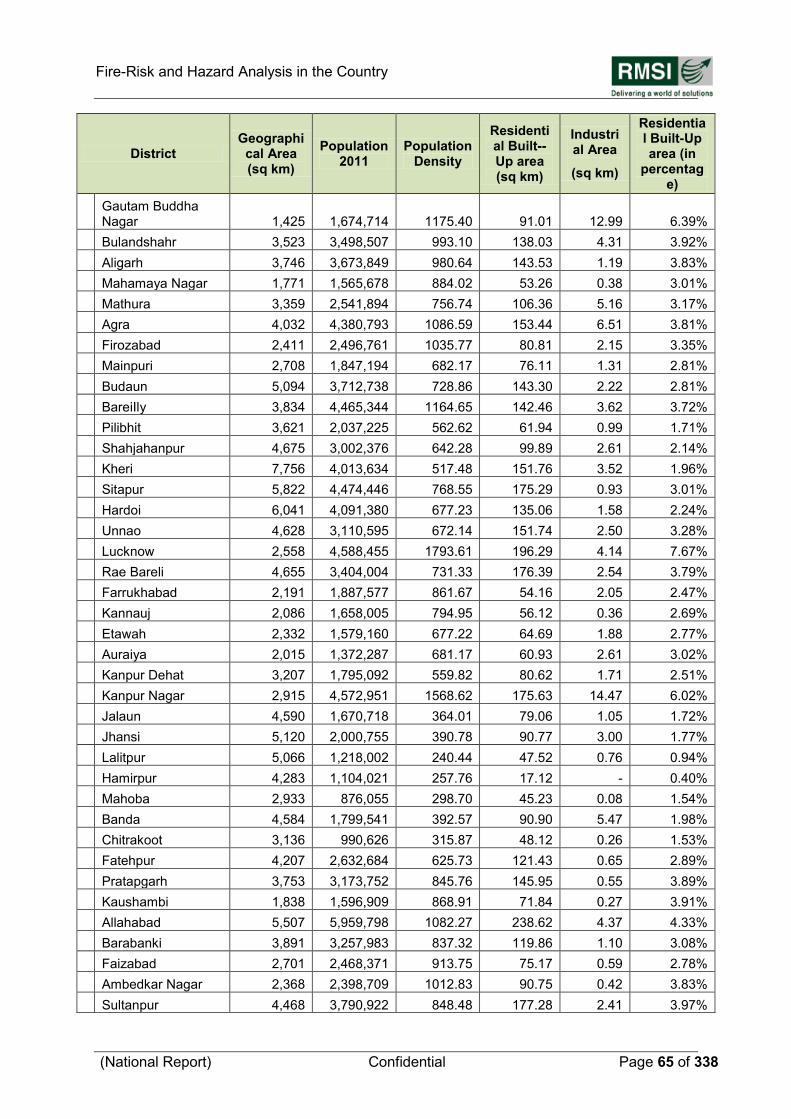
Fire-Risk and Hazard Analysis in the Country
(National Report) Confidential Page 65 of 338
District Geographi
cal Area (sq km)
Population 2011
Population Density
Residential Built--Up area (sq km)
Industrial Area
(sq km)
Residential Built-Up area (in
percentage)
Gautam Buddha Nagar 1,425 1,674,714 1175.40 91.01 12.99 6.39%
Bulandshahr 3,523 3,498,507 993.10 138.03 4.31 3.92%
Aligarh 3,746 3,673,849 980.64 143.53 1.19 3.83%
Mahamaya Nagar 1,771 1,565,678 884.02 53.26 0.38 3.01%
Mathura 3,359 2,541,894 756.74 106.36 5.16 3.17%
Agra 4,032 4,380,793 1086.59 153.44 6.51 3.81%
Firozabad 2,411 2,496,761 1035.77 80.81 2.15 3.35%
Mainpuri 2,708 1,847,194 682.17 76.11 1.31 2.81%
Budaun 5,094 3,712,738 728.86 143.30 2.22 2.81%
BareiIly 3,834 4,465,344 1164.65 142.46 3.62 3.72%
Pilibhit 3,621 2,037,225 562.62 61.94 0.99 1.71%
Shahjahanpur 4,675 3,002,376 642.28 99.89 2.61 2.14%
Kheri 7,756 4,013,634 517.48 151.76 3.52 1.96%
Sitapur 5,822 4,474,446 768.55 175.29 0.93 3.01%
Hardoi 6,041 4,091,380 677.23 135.06 1.58 2.24%
Unnao 4,628 3,110,595 672.14 151.74 2.50 3.28%
Lucknow 2,558 4,588,455 1793.61 196.29 4.14 7.67%
Rae Bareli 4,655 3,404,004 731.33 176.39 2.54 3.79%
Farrukhabad 2,191 1,887,577 861.67 54.16 2.05 2.47%
Kannauj 2,086 1,658,005 794.95 56.12 0.36 2.69%
Etawah 2,332 1,579,160 677.22 64.69 1.88 2.77%
Auraiya 2,015 1,372,287 681.17 60.93 2.61 3.02%
Kanpur Dehat 3,207 1,795,092 559.82 80.62 1.71 2.51%
Kanpur Nagar 2,915 4,572,951 1568.62 175.63 14.47 6.02%
Jalaun 4,590 1,670,718 364.01 79.06 1.05 1.72%
Jhansi 5,120 2,000,755 390.78 90.77 3.00 1.77%
Lalitpur 5,066 1,218,002 240.44 47.52 0.76 0.94%
Hamirpur 4,283 1,104,021 257.76 17.12 - 0.40%
Mahoba 2,933 876,055 298.70 45.23 0.08 1.54%
Banda 4,584 1,799,541 392.57 90.90 5.47 1.98%
Chitrakoot 3,136 990,626 315.87 48.12 0.26 1.53%
Fatehpur 4,207 2,632,684 625.73 121.43 0.65 2.89%
Pratapgarh 3,753 3,173,752 845.76 145.95 0.55 3.89%
Kaushambi 1,838 1,596,909 868.91 71.84 0.27 3.91%
Allahabad 5,507 5,959,798 1082.27 238.62 4.37 4.33%
Barabanki 3,891 3,257,983 837.32 119.86 1.10 3.08%
Faizabad 2,701 2,468,371 913.75 75.17 0.59 2.78%
Ambedkar Nagar 2,368 2,398,709 1012.83 90.75 0.42 3.83%
Sultanpur 4,468 3,790,922 848.48 177.28 2.41 3.97%
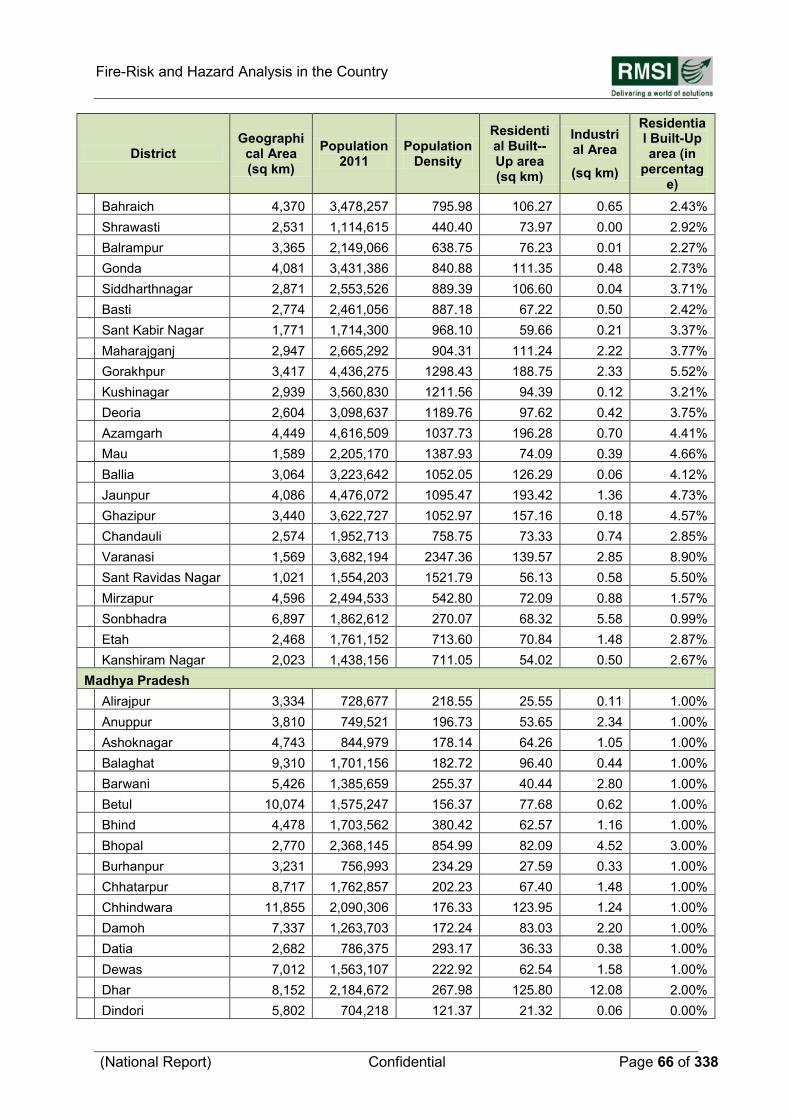
Fire-Risk and Hazard Analysis in the Country
(National Report) Confidential Page 66 of 338
District Geographi
cal Area (sq km)
Population 2011
Population Density
Residential Built--Up area (sq km)
Industrial Area
(sq km)
Residential Built-Up area (in
percentage)
Bahraich 4,370 3,478,257 795.98 106.27 0.65 2.43%
Shrawasti 2,531 1,114,615 440.40 73.97 0.00 2.92%
Balrampur 3,365 2,149,066 638.75 76.23 0.01 2.27%
Gonda 4,081 3,431,386 840.88 111.35 0.48 2.73%
Siddharthnagar 2,871 2,553,526 889.39 106.60 0.04 3.71%
Basti 2,774 2,461,056 887.18 67.22 0.50 2.42%
Sant Kabir Nagar 1,771 1,714,300 968.10 59.66 0.21 3.37%
Maharajganj 2,947 2,665,292 904.31 111.24 2.22 3.77%
Gorakhpur 3,417 4,436,275 1298.43 188.75 2.33 5.52%
Kushinagar 2,939 3,560,830 1211.56 94.39 0.12 3.21%
Deoria 2,604 3,098,637 1189.76 97.62 0.42 3.75%
Azamgarh 4,449 4,616,509 1037.73 196.28 0.70 4.41%
Mau 1,589 2,205,170 1387.93 74.09 0.39 4.66%
Ballia 3,064 3,223,642 1052.05 126.29 0.06 4.12%
Jaunpur 4,086 4,476,072 1095.47 193.42 1.36 4.73%
Ghazipur 3,440 3,622,727 1052.97 157.16 0.18 4.57%
Chandauli 2,574 1,952,713 758.75 73.33 0.74 2.85%
Varanasi 1,569 3,682,194 2347.36 139.57 2.85 8.90%
Sant Ravidas Nagar 1,021 1,554,203 1521.79 56.13 0.58 5.50%
Mirzapur 4,596 2,494,533 542.80 72.09 0.88 1.57%
Sonbhadra 6,897 1,862,612 270.07 68.32 5.58 0.99%
Etah 2,468 1,761,152 713.60 70.84 1.48 2.87%
Kanshiram Nagar 2,023 1,438,156 711.05 54.02 0.50 2.67%
Madhya Pradesh
Alirajpur 3,334 728,677 218.55 25.55 0.11 1.00%
Anuppur 3,810 749,521 196.73 53.65 2.34 1.00%
Ashoknagar 4,743 844,979 178.14 64.26 1.05 1.00%
Balaghat 9,310 1,701,156 182.72 96.40 0.44 1.00%
Barwani 5,426 1,385,659 255.37 40.44 2.80 1.00%
Betul 10,074 1,575,247 156.37 77.68 0.62 1.00%
Bhind 4,478 1,703,562 380.42 62.57 1.16 1.00%
Bhopal 2,770 2,368,145 854.99 82.09 4.52 3.00%
Burhanpur 3,231 756,993 234.29 27.59 0.33 1.00%
Chhatarpur 8,717 1,762,857 202.23 67.40 1.48 1.00%
Chhindwara 11,855 2,090,306 176.33 123.95 1.24 1.00%
Damoh 7,337 1,263,703 172.24 83.03 2.20 1.00%
Datia 2,682 786,375 293.17 36.33 0.38 1.00%
Dewas 7,012 1,563,107 222.92 62.54 1.58 1.00%
Dhar 8,152 2,184,672 267.98 125.80 12.08 2.00%
Dindori 5,802 704,218 121.37 21.32 0.06 0.00%
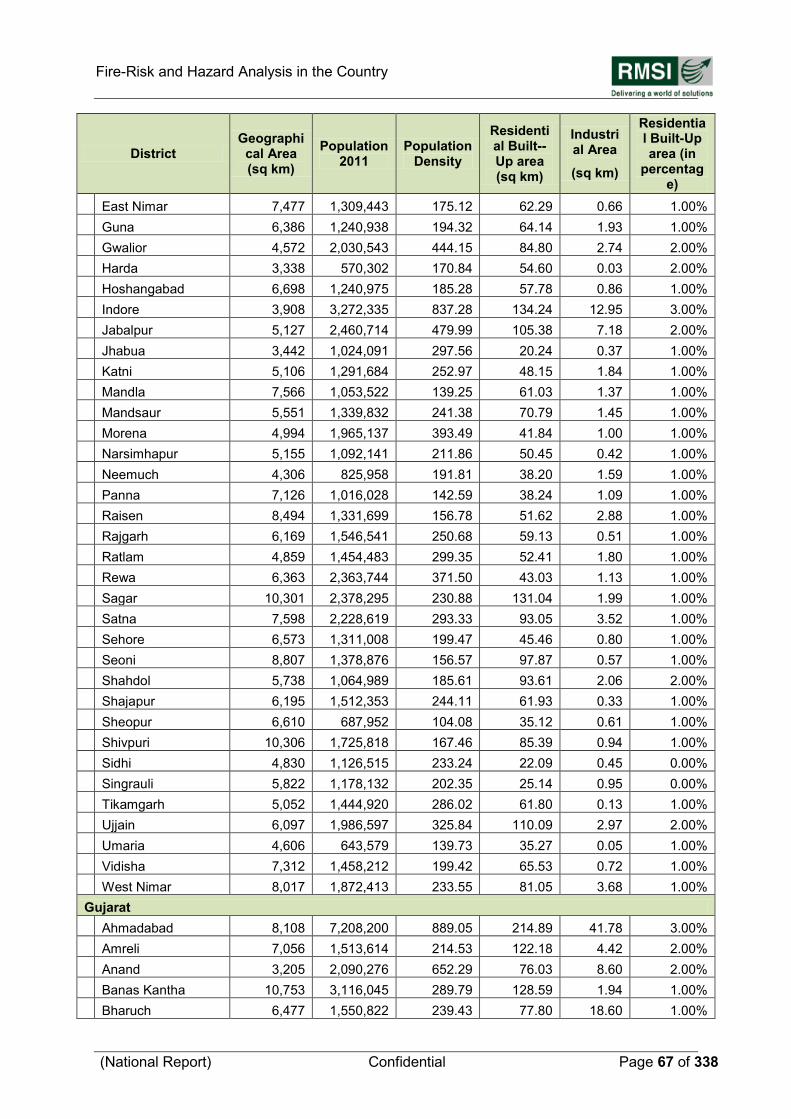
Fire-Risk and Hazard Analysis in the Country
(National Report) Confidential Page 67 of 338
District Geographi
cal Area (sq km)
Population 2011
Population Density
Residential Built--Up area (sq km)
Industrial Area
(sq km)
Residential Built-Up area (in
percentage)
East Nimar 7,477 1,309,443 175.12 62.29 0.66 1.00%
Guna 6,386 1,240,938 194.32 64.14 1.93 1.00%
Gwalior 4,572 2,030,543 444.15 84.80 2.74 2.00%
Harda 3,338 570,302 170.84 54.60 0.03 2.00%
Hoshangabad 6,698 1,240,975 185.28 57.78 0.86 1.00%
Indore 3,908 3,272,335 837.28 134.24 12.95 3.00%
Jabalpur 5,127 2,460,714 479.99 105.38 7.18 2.00%
Jhabua 3,442 1,024,091 297.56 20.24 0.37 1.00%
Katni 5,106 1,291,684 252.97 48.15 1.84 1.00%
Mandla 7,566 1,053,522 139.25 61.03 1.37 1.00%
Mandsaur 5,551 1,339,832 241.38 70.79 1.45 1.00%
Morena 4,994 1,965,137 393.49 41.84 1.00 1.00%
Narsimhapur 5,155 1,092,141 211.86 50.45 0.42 1.00%
Neemuch 4,306 825,958 191.81 38.20 1.59 1.00%
Panna 7,126 1,016,028 142.59 38.24 1.09 1.00%
Raisen 8,494 1,331,699 156.78 51.62 2.88 1.00%
Rajgarh 6,169 1,546,541 250.68 59.13 0.51 1.00%
Ratlam 4,859 1,454,483 299.35 52.41 1.80 1.00%
Rewa 6,363 2,363,744 371.50 43.03 1.13 1.00%
Sagar 10,301 2,378,295 230.88 131.04 1.99 1.00%
Satna 7,598 2,228,619 293.33 93.05 3.52 1.00%
Sehore 6,573 1,311,008 199.47 45.46 0.80 1.00%
Seoni 8,807 1,378,876 156.57 97.87 0.57 1.00%
Shahdol 5,738 1,064,989 185.61 93.61 2.06 2.00%
Shajapur 6,195 1,512,353 244.11 61.93 0.33 1.00%
Sheopur 6,610 687,952 104.08 35.12 0.61 1.00%
Shivpuri 10,306 1,725,818 167.46 85.39 0.94 1.00%
Sidhi 4,830 1,126,515 233.24 22.09 0.45 0.00%
Singrauli 5,822 1,178,132 202.35 25.14 0.95 0.00%
Tikamgarh 5,052 1,444,920 286.02 61.80 0.13 1.00%
Ujjain 6,097 1,986,597 325.84 110.09 2.97 2.00%
Umaria 4,606 643,579 139.73 35.27 0.05 1.00%
Vidisha 7,312 1,458,212 199.42 65.53 0.72 1.00%
West Nimar 8,017 1,872,413 233.55 81.05 3.68 1.00%
Gujarat
Ahmadabad 8,108 7,208,200 889.05 214.89 41.78 3.00%
Amreli 7,056 1,513,614 214.53 122.18 4.42 2.00%
Anand 3,205 2,090,276 652.29 76.03 8.60 2.00%
Banas Kantha 10,753 3,116,045 289.79 128.59 1.94 1.00%
Bharuch 6,477 1,550,822 239.43 77.80 18.60 1.00%
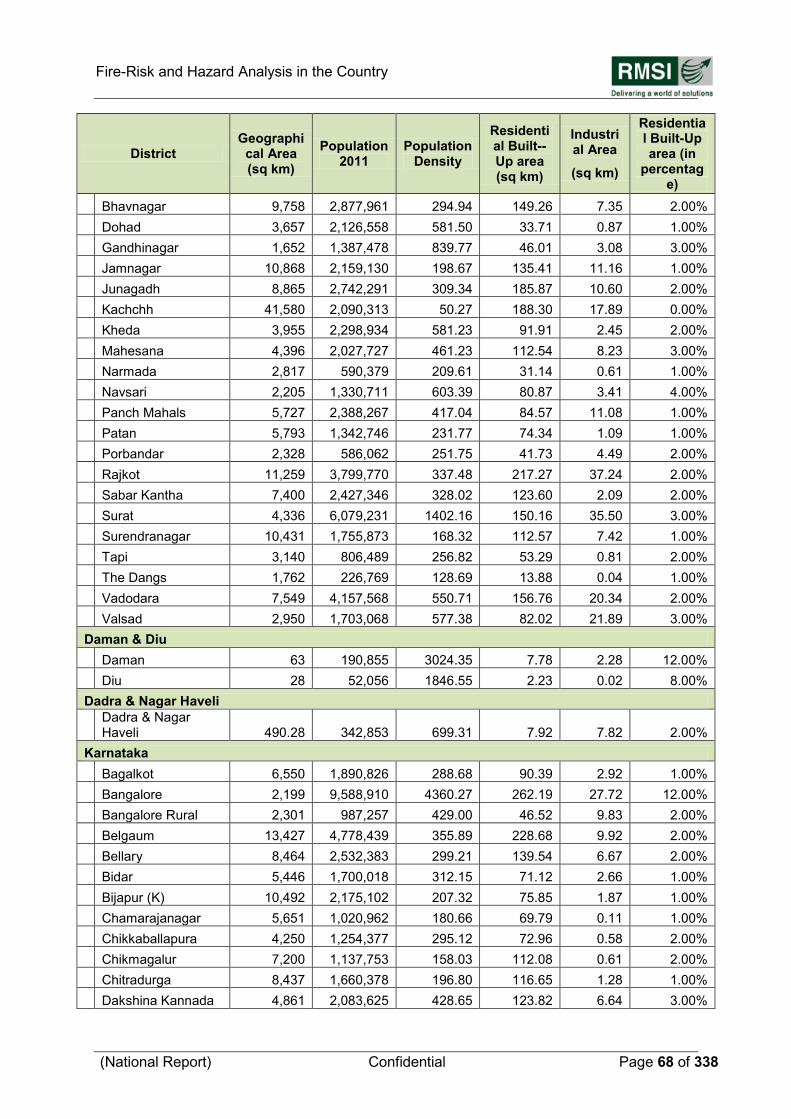
Fire-Risk and Hazard Analysis in the Country
(National Report) Confidential Page 68 of 338
District Geographi
cal Area (sq km)
Population 2011
Population Density
Residential Built--Up area (sq km)
Industrial Area
(sq km)
Residential Built-Up area (in
percentage)
Bhavnagar 9,758 2,877,961 294.94 149.26 7.35 2.00%
Dohad 3,657 2,126,558 581.50 33.71 0.87 1.00%
Gandhinagar 1,652 1,387,478 839.77 46.01 3.08 3.00%
Jamnagar 10,868 2,159,130 198.67 135.41 11.16 1.00%
Junagadh 8,865 2,742,291 309.34 185.87 10.60 2.00%
Kachchh 41,580 2,090,313 50.27 188.30 17.89 0.00%
Kheda 3,955 2,298,934 581.23 91.91 2.45 2.00%
Mahesana 4,396 2,027,727 461.23 112.54 8.23 3.00%
Narmada 2,817 590,379 209.61 31.14 0.61 1.00%
Navsari 2,205 1,330,711 603.39 80.87 3.41 4.00%
Panch Mahals 5,727 2,388,267 417.04 84.57 11.08 1.00%
Patan 5,793 1,342,746 231.77 74.34 1.09 1.00%
Porbandar 2,328 586,062 251.75 41.73 4.49 2.00%
Rajkot 11,259 3,799,770 337.48 217.27 37.24 2.00%
Sabar Kantha 7,400 2,427,346 328.02 123.60 2.09 2.00%
Surat 4,336 6,079,231 1402.16 150.16 35.50 3.00%
Surendranagar 10,431 1,755,873 168.32 112.57 7.42 1.00%
Tapi 3,140 806,489 256.82 53.29 0.81 2.00%
The Dangs 1,762 226,769 128.69 13.88 0.04 1.00%
Vadodara 7,549 4,157,568 550.71 156.76 20.34 2.00%
Valsad 2,950 1,703,068 577.38 82.02 21.89 3.00%
Daman & Diu
Daman 63 190,855 3024.35 7.78 2.28 12.00%
Diu 28 52,056 1846.55 2.23 0.02 8.00%
Dadra & Nagar Haveli
Dadra & Nagar Haveli 490.28 342,853 699.31 7.92 7.82 2.00%
Karnataka
Bagalkot 6,550 1,890,826 288.68 90.39 2.92 1.00%
Bangalore 2,199 9,588,910 4360.27 262.19 27.72 12.00%
Bangalore Rural 2,301 987,257 429.00 46.52 9.83 2.00%
Belgaum 13,427 4,778,439 355.89 228.68 9.92 2.00%
Bellary 8,464 2,532,383 299.21 139.54 6.67 2.00%
Bidar 5,446 1,700,018 312.15 71.12 2.66 1.00%
Bijapur (K) 10,492 2,175,102 207.32 75.85 1.87 1.00%
Chamarajanagar 5,651 1,020,962 180.66 69.79 0.11 1.00%
Chikkaballapura 4,250 1,254,377 295.12 72.96 0.58 2.00%
Chikmagalur 7,200 1,137,753 158.03 112.08 0.61 2.00%
Chitradurga 8,437 1,660,378 196.80 116.65 1.28 1.00%
Dakshina Kannada 4,861 2,083,625 428.65 123.82 6.64 3.00%
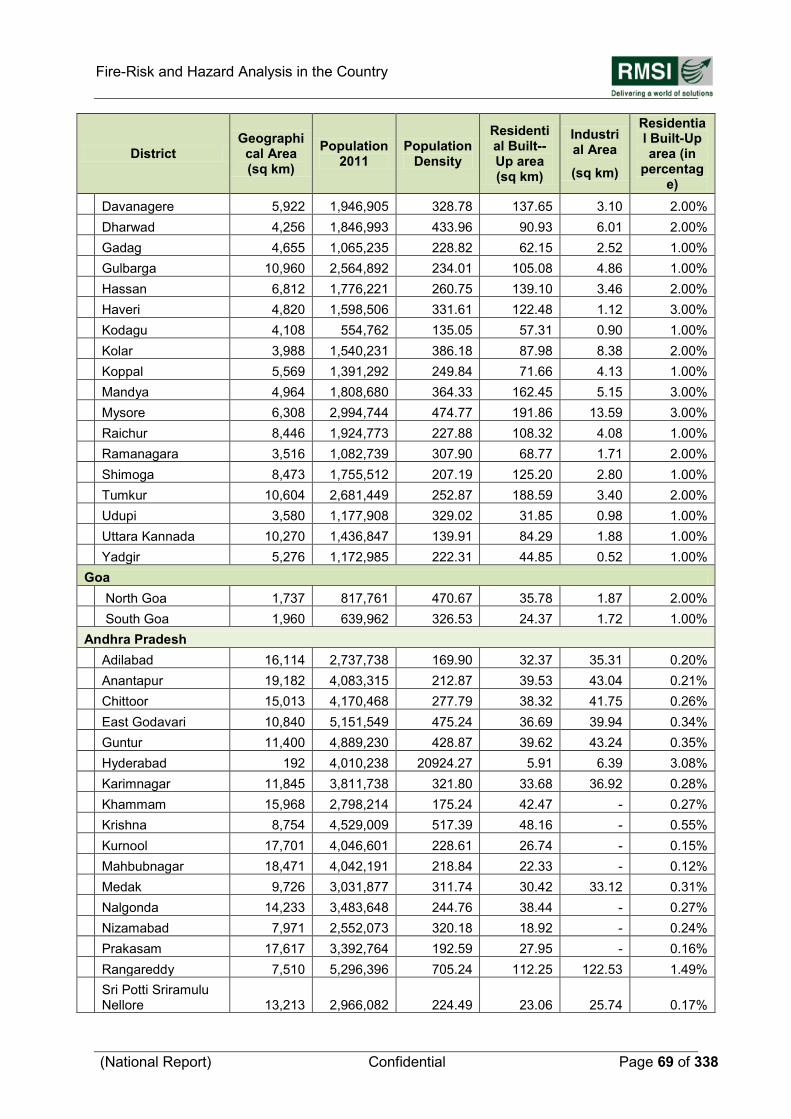
Fire-Risk and Hazard Analysis in the Country
(National Report) Confidential Page 69 of 338
District Geographi
cal Area (sq km)
Population 2011
Population Density
Residential Built--Up area (sq km)
Industrial Area
(sq km)
Residential Built-Up area (in
percentage)
Davanagere 5,922 1,946,905 328.78 137.65 3.10 2.00%
Dharwad 4,256 1,846,993 433.96 90.93 6.01 2.00%
Gadag 4,655 1,065,235 228.82 62.15 2.52 1.00%
Gulbarga 10,960 2,564,892 234.01 105.08 4.86 1.00%
Hassan 6,812 1,776,221 260.75 139.10 3.46 2.00%
Haveri 4,820 1,598,506 331.61 122.48 1.12 3.00%
Kodagu 4,108 554,762 135.05 57.31 0.90 1.00%
Kolar 3,988 1,540,231 386.18 87.98 8.38 2.00%
Koppal 5,569 1,391,292 249.84 71.66 4.13 1.00%
Mandya 4,964 1,808,680 364.33 162.45 5.15 3.00%
Mysore 6,308 2,994,744 474.77 191.86 13.59 3.00%
Raichur 8,446 1,924,773 227.88 108.32 4.08 1.00%
Ramanagara 3,516 1,082,739 307.90 68.77 1.71 2.00%
Shimoga 8,473 1,755,512 207.19 125.20 2.80 1.00%
Tumkur 10,604 2,681,449 252.87 188.59 3.40 2.00%
Udupi 3,580 1,177,908 329.02 31.85 0.98 1.00%
Uttara Kannada 10,270 1,436,847 139.91 84.29 1.88 1.00%
Yadgir 5,276 1,172,985 222.31 44.85 0.52 1.00%
Goa
North Goa 1,737 817,761 470.67 35.78 1.87 2.00%
South Goa 1,960 639,962 326.53 24.37 1.72 1.00%
Andhra Pradesh
Adilabad 16,114 2,737,738 169.90 32.37 35.31 0.20%
Anantapur 19,182 4,083,315 212.87 39.53 43.04 0.21%
Chittoor 15,013 4,170,468 277.79 38.32 41.75 0.26%
East Godavari 10,840 5,151,549 475.24 36.69 39.94 0.34%
Guntur 11,400 4,889,230 428.87 39.62 43.24 0.35%
Hyderabad 192 4,010,238 20924.27 5.91 6.39 3.08%
Karimnagar 11,845 3,811,738 321.80 33.68 36.92 0.28%
Khammam 15,968 2,798,214 175.24 42.47 - 0.27%
Krishna 8,754 4,529,009 517.39 48.16 - 0.55%
Kurnool 17,701 4,046,601 228.61 26.74 - 0.15%
Mahbubnagar 18,471 4,042,191 218.84 22.33 - 0.12%
Medak 9,726 3,031,877 311.74 30.42 33.12 0.31%
Nalgonda 14,233 3,483,648 244.76 38.44 - 0.27%
Nizamabad 7,971 2,552,073 320.18 18.92 - 0.24%
Prakasam 17,617 3,392,764 192.59 27.95 - 0.16%
Rangareddy 7,510 5,296,396 705.24 112.25 122.53 1.49%
Sri Potti Sriramulu Nellore 13,213 2,966,082 224.49 23.06 25.74 0.17%
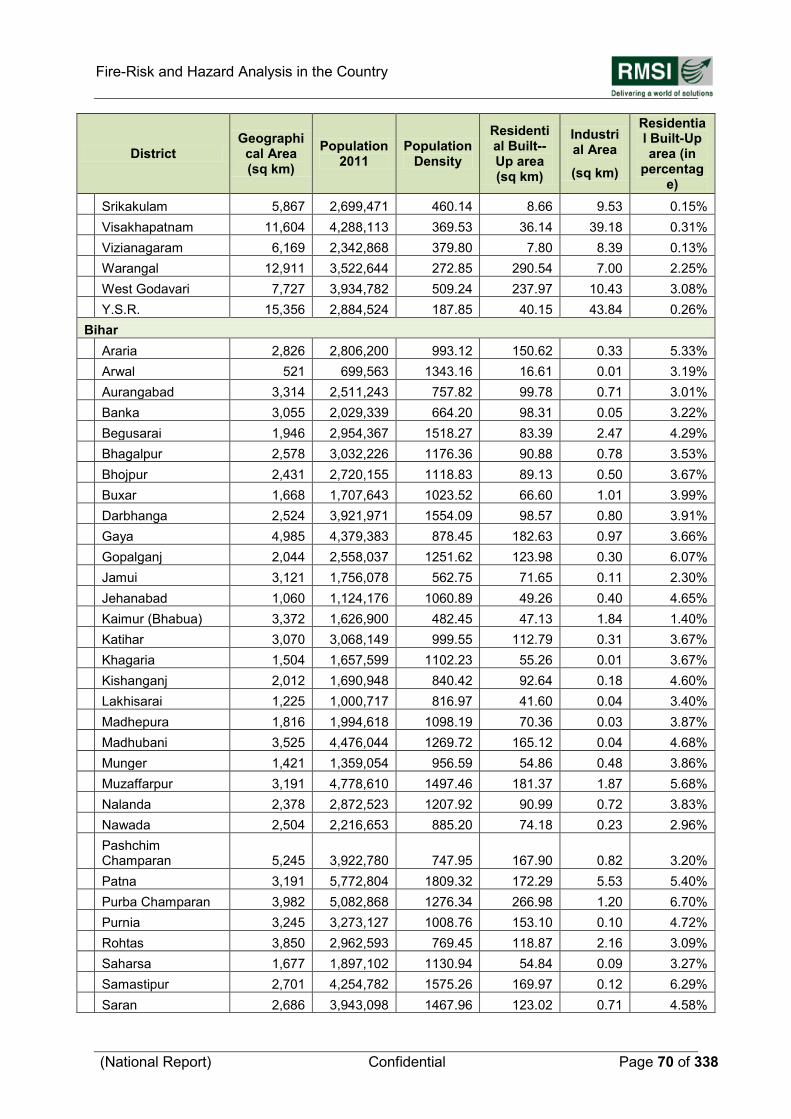
Fire-Risk and Hazard Analysis in the Country
(National Report) Confidential Page 70 of 338
District Geographi
cal Area (sq km)
Population 2011
Population Density
Residential Built--Up area (sq km)
Industrial Area
(sq km)
Residential Built-Up area (in
percentage)
Srikakulam 5,867 2,699,471 460.14 8.66 9.53 0.15%
Visakhapatnam 11,604 4,288,113 369.53 36.14 39.18 0.31%
Vizianagaram 6,169 2,342,868 379.80 7.80 8.39 0.13%
Warangal 12,911 3,522,644 272.85 290.54 7.00 2.25%
West Godavari 7,727 3,934,782 509.24 237.97 10.43 3.08%
Y.S.R. 15,356 2,884,524 187.85 40.15 43.84 0.26%
Bihar
Araria 2,826 2,806,200 993.12 150.62 0.33 5.33%
Arwal 521 699,563 1343.16 16.61 0.01 3.19%
Aurangabad 3,314 2,511,243 757.82 99.78 0.71 3.01%
Banka 3,055 2,029,339 664.20 98.31 0.05 3.22%
Begusarai 1,946 2,954,367 1518.27 83.39 2.47 4.29%
Bhagalpur 2,578 3,032,226 1176.36 90.88 0.78 3.53%
Bhojpur 2,431 2,720,155 1118.83 89.13 0.50 3.67%
Buxar 1,668 1,707,643 1023.52 66.60 1.01 3.99%
Darbhanga 2,524 3,921,971 1554.09 98.57 0.80 3.91%
Gaya 4,985 4,379,383 878.45 182.63 0.97 3.66%
Gopalganj 2,044 2,558,037 1251.62 123.98 0.30 6.07%
Jamui 3,121 1,756,078 562.75 71.65 0.11 2.30%
Jehanabad 1,060 1,124,176 1060.89 49.26 0.40 4.65%
Kaimur (Bhabua) 3,372 1,626,900 482.45 47.13 1.84 1.40%
Katihar 3,070 3,068,149 999.55 112.79 0.31 3.67%
Khagaria 1,504 1,657,599 1102.23 55.26 0.01 3.67%
Kishanganj 2,012 1,690,948 840.42 92.64 0.18 4.60%
Lakhisarai 1,225 1,000,717 816.97 41.60 0.04 3.40%
Madhepura 1,816 1,994,618 1098.19 70.36 0.03 3.87%
Madhubani 3,525 4,476,044 1269.72 165.12 0.04 4.68%
Munger 1,421 1,359,054 956.59 54.86 0.48 3.86%
Muzaffarpur 3,191 4,778,610 1497.46 181.37 1.87 5.68%
Nalanda 2,378 2,872,523 1207.92 90.99 0.72 3.83%
Nawada 2,504 2,216,653 885.20 74.18 0.23 2.96%
Pashchim Champaran 5,245 3,922,780 747.95 167.90 0.82 3.20%
Patna 3,191 5,772,804 1809.32 172.29 5.53 5.40%
Purba Champaran 3,982 5,082,868 1276.34 266.98 1.20 6.70%
Purnia 3,245 3,273,127 1008.76 153.10 0.10 4.72%
Rohtas 3,850 2,962,593 769.45 118.87 2.16 3.09%
Saharsa 1,677 1,897,102 1130.94 54.84 0.09 3.27%
Samastipur 2,701 4,254,782 1575.26 169.97 0.12 6.29%
Saran 2,686 3,943,098 1467.96 123.02 0.71 4.58%
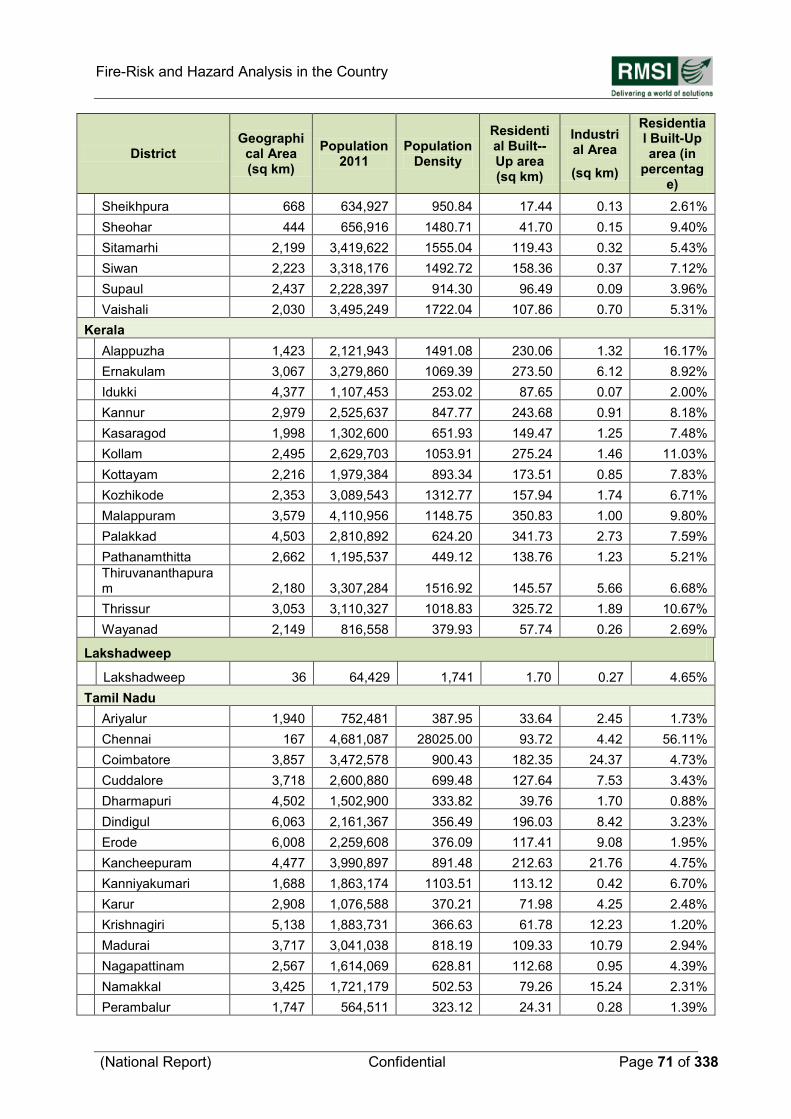
Fire-Risk and Hazard Analysis in the Country
(National Report) Confidential Page 71 of 338
District Geographi
cal Area (sq km)
Population 2011
Population Density
Residential Built--Up area (sq km)
Industrial Area
(sq km)
Residential Built-Up area (in
percentage)
Sheikhpura 668 634,927 950.84 17.44 0.13 2.61%
Sheohar 444 656,916 1480.71 41.70 0.15 9.40%
Sitamarhi 2,199 3,419,622 1555.04 119.43 0.32 5.43%
Siwan 2,223 3,318,176 1492.72 158.36 0.37 7.12%
Supaul 2,437 2,228,397 914.30 96.49 0.09 3.96%
Vaishali 2,030 3,495,249 1722.04 107.86 0.70 5.31%
Kerala
Alappuzha 1,423 2,121,943 1491.08 230.06 1.32 16.17%
Ernakulam 3,067 3,279,860 1069.39 273.50 6.12 8.92%
Idukki 4,377 1,107,453 253.02 87.65 0.07 2.00%
Kannur 2,979 2,525,637 847.77 243.68 0.91 8.18%
Kasaragod 1,998 1,302,600 651.93 149.47 1.25 7.48%
Kollam 2,495 2,629,703 1053.91 275.24 1.46 11.03%
Kottayam 2,216 1,979,384 893.34 173.51 0.85 7.83%
Kozhikode 2,353 3,089,543 1312.77 157.94 1.74 6.71%
Malappuram 3,579 4,110,956 1148.75 350.83 1.00 9.80%
Palakkad 4,503 2,810,892 624.20 341.73 2.73 7.59%
Pathanamthitta 2,662 1,195,537 449.12 138.76 1.23 5.21%
Thiruvananthapuram 2,180 3,307,284 1516.92 145.57 5.66 6.68%
Thrissur 3,053 3,110,327 1018.83 325.72 1.89 10.67%
Wayanad 2,149 816,558 379.93 57.74 0.26 2.69%
Lakshadweep
Lakshadweep 36 64,429 1,741 1.70 0.27 4.65%
Tamil Nadu
Ariyalur 1,940 752,481 387.95 33.64 2.45 1.73%
Chennai 167 4,681,087 28025.00 93.72 4.42 56.11%
Coimbatore 3,857 3,472,578 900.43 182.35 24.37 4.73%
Cuddalore 3,718 2,600,880 699.48 127.64 7.53 3.43%
Dharmapuri 4,502 1,502,900 333.82 39.76 1.70 0.88%
Dindigul 6,063 2,161,367 356.49 196.03 8.42 3.23%
Erode 6,008 2,259,608 376.09 117.41 9.08 1.95%
Kancheepuram 4,477 3,990,897 891.48 212.63 21.76 4.75%
Kanniyakumari 1,688 1,863,174 1103.51 113.12 0.42 6.70%
Karur 2,908 1,076,588 370.21 71.98 4.25 2.48%
Krishnagiri 5,138 1,883,731 366.63 61.78 12.23 1.20%
Madurai 3,717 3,041,038 818.19 109.33 10.79 2.94%
Nagapattinam 2,567 1,614,069 628.81 112.68 0.95 4.39%
Namakkal 3,425 1,721,179 502.53 79.26 15.24 2.31%
Perambalur 1,747 564,511 323.12 24.31 0.28 1.39%
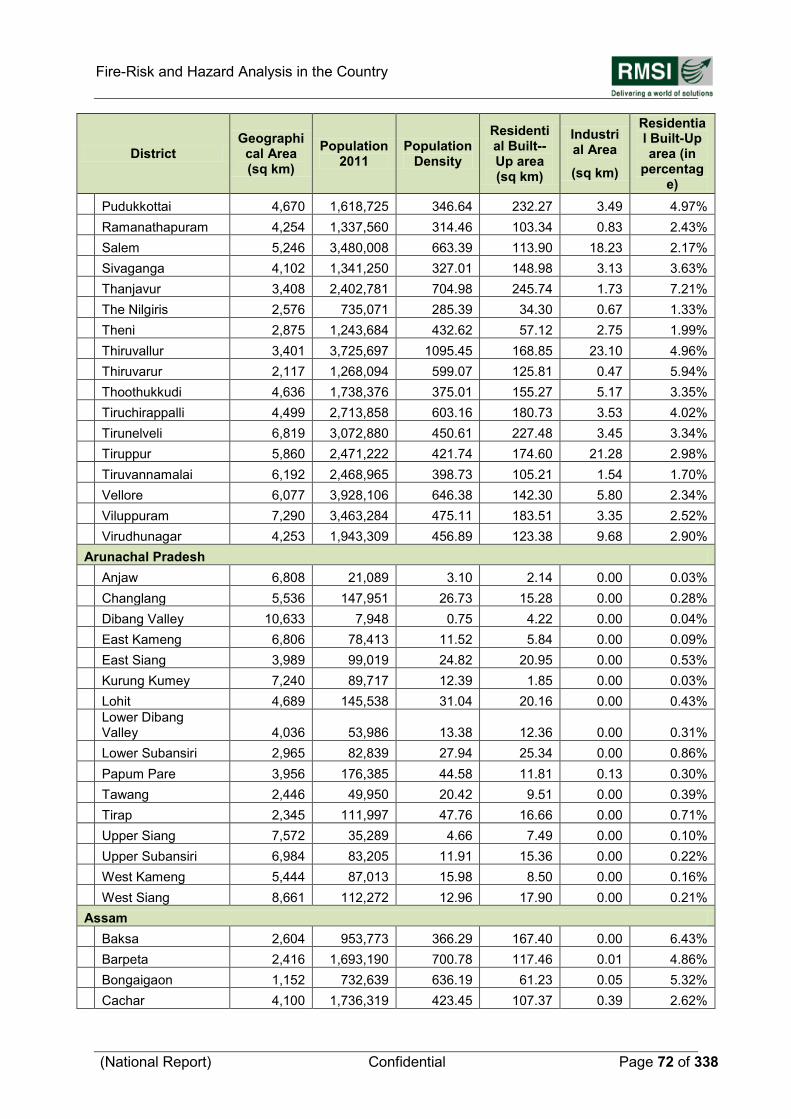
Fire-Risk and Hazard Analysis in the Country
(National Report) Confidential Page 72 of 338
District Geographi
cal Area (sq km)
Population 2011
Population Density
Residential Built--Up area (sq km)
Industrial Area
(sq km)
Residential Built-Up area (in
percentage)
Pudukkottai 4,670 1,618,725 346.64 232.27 3.49 4.97%
Ramanathapuram 4,254 1,337,560 314.46 103.34 0.83 2.43%
Salem 5,246 3,480,008 663.39 113.90 18.23 2.17%
Sivaganga 4,102 1,341,250 327.01 148.98 3.13 3.63%
Thanjavur 3,408 2,402,781 704.98 245.74 1.73 7.21%
The Nilgiris 2,576 735,071 285.39 34.30 0.67 1.33%
Theni 2,875 1,243,684 432.62 57.12 2.75 1.99%
Thiruvallur 3,401 3,725,697 1095.45 168.85 23.10 4.96%
Thiruvarur 2,117 1,268,094 599.07 125.81 0.47 5.94%
Thoothukkudi 4,636 1,738,376 375.01 155.27 5.17 3.35%
Tiruchirappalli 4,499 2,713,858 603.16 180.73 3.53 4.02%
Tirunelveli 6,819 3,072,880 450.61 227.48 3.45 3.34%
Tiruppur 5,860 2,471,222 421.74 174.60 21.28 2.98%
Tiruvannamalai 6,192 2,468,965 398.73 105.21 1.54 1.70%
Vellore 6,077 3,928,106 646.38 142.30 5.80 2.34%
Viluppuram 7,290 3,463,284 475.11 183.51 3.35 2.52%
Virudhunagar 4,253 1,943,309 456.89 123.38 9.68 2.90%
Arunachal Pradesh
Anjaw 6,808 21,089 3.10 2.14 0.00 0.03%
Changlang 5,536 147,951 26.73 15.28 0.00 0.28%
Dibang Valley 10,633 7,948 0.75 4.22 0.00 0.04%
East Kameng 6,806 78,413 11.52 5.84 0.00 0.09%
East Siang 3,989 99,019 24.82 20.95 0.00 0.53%
Kurung Kumey 7,240 89,717 12.39 1.85 0.00 0.03%
Lohit 4,689 145,538 31.04 20.16 0.00 0.43%
Lower Dibang Valley 4,036 53,986 13.38 12.36 0.00 0.31%
Lower Subansiri 2,965 82,839 27.94 25.34 0.00 0.86%
Papum Pare 3,956 176,385 44.58 11.81 0.13 0.30%
Tawang 2,446 49,950 20.42 9.51 0.00 0.39%
Tirap 2,345 111,997 47.76 16.66 0.00 0.71%
Upper Siang 7,572 35,289 4.66 7.49 0.00 0.10%
Upper Subansiri 6,984 83,205 11.91 15.36 0.00 0.22%
West Kameng 5,444 87,013 15.98 8.50 0.00 0.16%
West Siang 8,661 112,272 12.96 17.90 0.00 0.21%
Assam
Baksa 2,604 953,773 366.29 167.40 0.00 6.43%
Barpeta 2,416 1,693,190 700.78 117.46 0.01 4.86%
Bongaigaon 1,152 732,639 636.19 61.23 0.05 5.32%
Cachar 4,100 1,736,319 423.45 107.37 0.39 2.62%
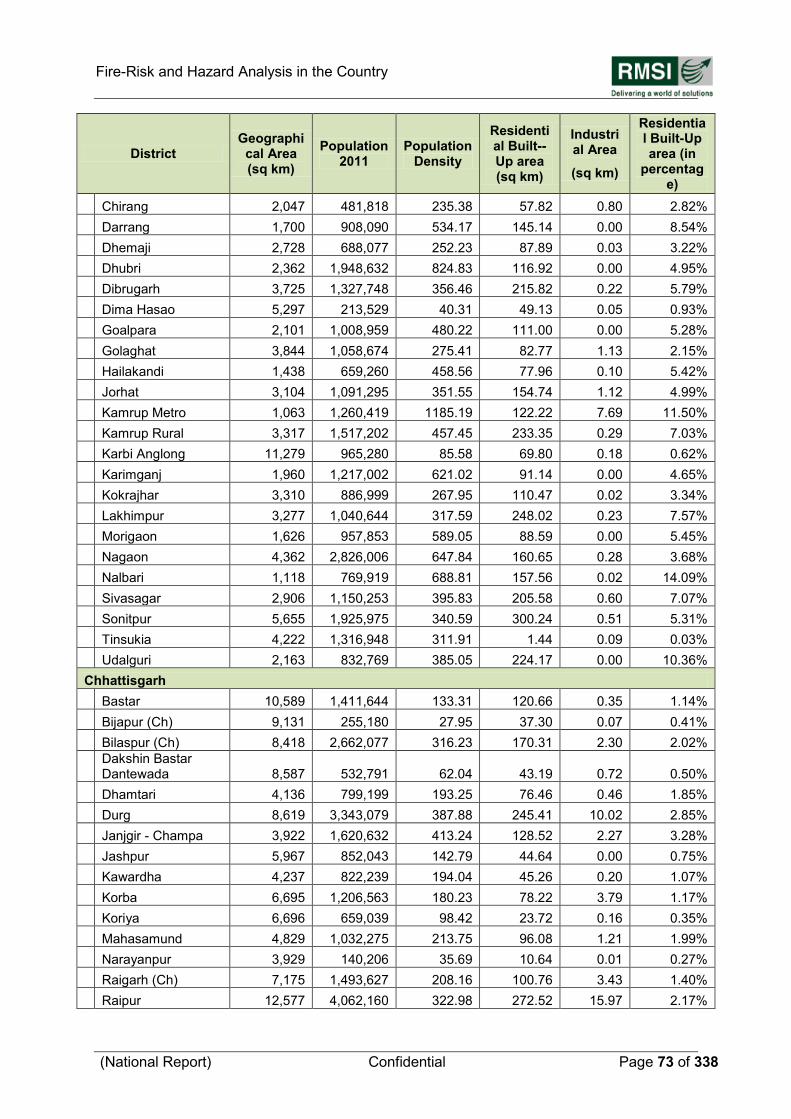
Fire-Risk and Hazard Analysis in the Country
(National Report) Confidential Page 73 of 338
District Geographi
cal Area (sq km)
Population 2011
Population Density
Residential Built--Up area (sq km)
Industrial Area
(sq km)
Residential Built-Up area (in
percentage)
Chirang 2,047 481,818 235.38 57.82 0.80 2.82%
Darrang 1,700 908,090 534.17 145.14 0.00 8.54%
Dhemaji 2,728 688,077 252.23 87.89 0.03 3.22%
Dhubri 2,362 1,948,632 824.83 116.92 0.00 4.95%
Dibrugarh 3,725 1,327,748 356.46 215.82 0.22 5.79%
Dima Hasao 5,297 213,529 40.31 49.13 0.05 0.93%
Goalpara 2,101 1,008,959 480.22 111.00 0.00 5.28%
Golaghat 3,844 1,058,674 275.41 82.77 1.13 2.15%
Hailakandi 1,438 659,260 458.56 77.96 0.10 5.42%
Jorhat 3,104 1,091,295 351.55 154.74 1.12 4.99%
Kamrup Metro 1,063 1,260,419 1185.19 122.22 7.69 11.50%
Kamrup Rural 3,317 1,517,202 457.45 233.35 0.29 7.03%
Karbi Anglong 11,279 965,280 85.58 69.80 0.18 0.62%
Karimganj 1,960 1,217,002 621.02 91.14 0.00 4.65%
Kokrajhar 3,310 886,999 267.95 110.47 0.02 3.34%
Lakhimpur 3,277 1,040,644 317.59 248.02 0.23 7.57%
Morigaon 1,626 957,853 589.05 88.59 0.00 5.45%
Nagaon 4,362 2,826,006 647.84 160.65 0.28 3.68%
Nalbari 1,118 769,919 688.81 157.56 0.02 14.09%
Sivasagar 2,906 1,150,253 395.83 205.58 0.60 7.07%
Sonitpur 5,655 1,925,975 340.59 300.24 0.51 5.31%
Tinsukia 4,222 1,316,948 311.91 1.44 0.09 0.03%
Udalguri 2,163 832,769 385.05 224.17 0.00 10.36%
Chhattisgarh
Bastar 10,589 1,411,644 133.31 120.66 0.35 1.14%
Bijapur (Ch) 9,131 255,180 27.95 37.30 0.07 0.41%
Bilaspur (Ch) 8,418 2,662,077 316.23 170.31 2.30 2.02%
Dakshin Bastar Dantewada 8,587 532,791 62.04 43.19 0.72 0.50%
Dhamtari 4,136 799,199 193.25 76.46 0.46 1.85%
Durg 8,619 3,343,079 387.88 245.41 10.02 2.85%
Janjgir - Champa 3,922 1,620,632 413.24 128.52 2.27 3.28%
Jashpur 5,967 852,043 142.79 44.64 0.00 0.75%
Kawardha 4,237 822,239 194.04 45.26 0.20 1.07%
Korba 6,695 1,206,563 180.23 78.22 3.79 1.17%
Koriya 6,696 659,039 98.42 23.72 0.16 0.35%
Mahasamund 4,829 1,032,275 213.75 96.08 1.21 1.99%
Narayanpur 3,929 140,206 35.69 10.64 0.01 0.27%
Raigarh (Ch) 7,175 1,493,627 208.16 100.76 3.43 1.40%
Raipur 12,577 4,062,160 322.98 272.52 15.97 2.17%
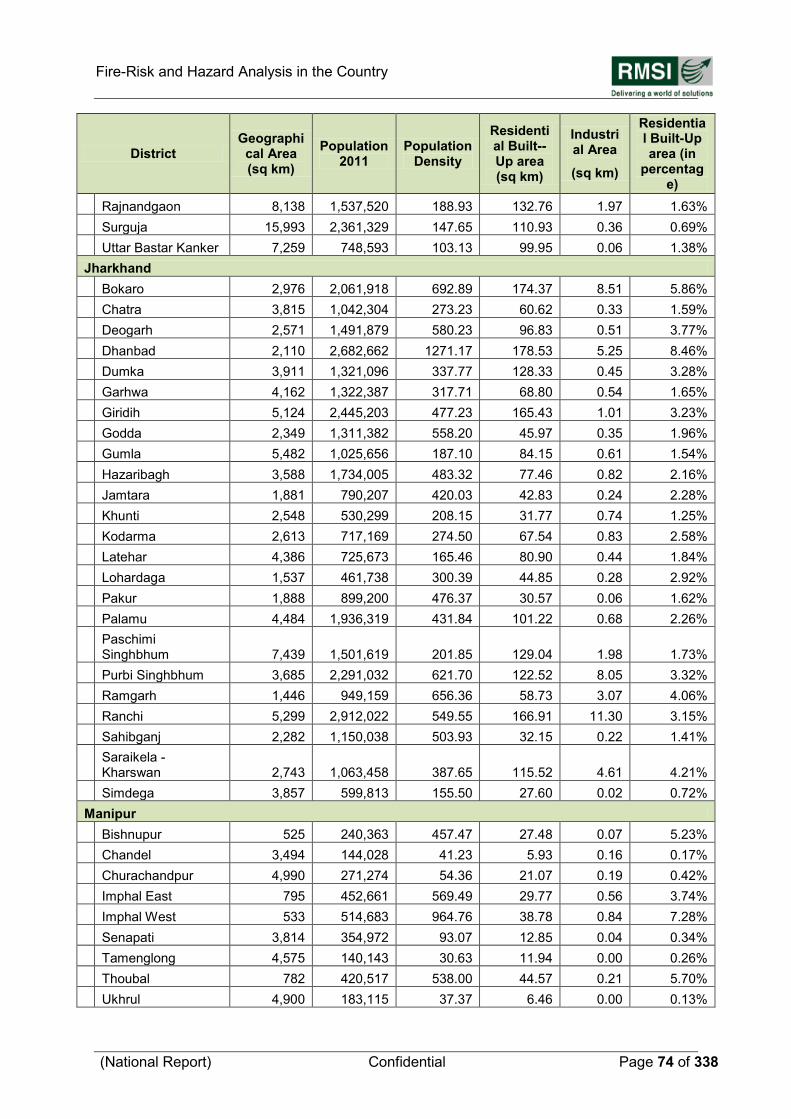
Fire-Risk and Hazard Analysis in the Country
(National Report) Confidential Page 74 of 338
District Geographi
cal Area (sq km)
Population 2011
Population Density
Residential Built--Up area (sq km)
Industrial Area
(sq km)
Residential Built-Up area (in
percentage)
Rajnandgaon 8,138 1,537,520 188.93 132.76 1.97 1.63%
Surguja 15,993 2,361,329 147.65 110.93 0.36 0.69%
Uttar Bastar Kanker 7,259 748,593 103.13 99.95 0.06 1.38%
Jharkhand
Bokaro 2,976 2,061,918 692.89 174.37 8.51 5.86%
Chatra 3,815 1,042,304 273.23 60.62 0.33 1.59%
Deogarh 2,571 1,491,879 580.23 96.83 0.51 3.77%
Dhanbad 2,110 2,682,662 1271.17 178.53 5.25 8.46%
Dumka 3,911 1,321,096 337.77 128.33 0.45 3.28%
Garhwa 4,162 1,322,387 317.71 68.80 0.54 1.65%
Giridih 5,124 2,445,203 477.23 165.43 1.01 3.23%
Godda 2,349 1,311,382 558.20 45.97 0.35 1.96%
Gumla 5,482 1,025,656 187.10 84.15 0.61 1.54%
Hazaribagh 3,588 1,734,005 483.32 77.46 0.82 2.16%
Jamtara 1,881 790,207 420.03 42.83 0.24 2.28%
Khunti 2,548 530,299 208.15 31.77 0.74 1.25%
Kodarma 2,613 717,169 274.50 67.54 0.83 2.58%
Latehar 4,386 725,673 165.46 80.90 0.44 1.84%
Lohardaga 1,537 461,738 300.39 44.85 0.28 2.92%
Pakur 1,888 899,200 476.37 30.57 0.06 1.62%
Palamu 4,484 1,936,319 431.84 101.22 0.68 2.26%
Paschimi Singhbhum 7,439 1,501,619 201.85 129.04 1.98 1.73%
Purbi Singhbhum 3,685 2,291,032 621.70 122.52 8.05 3.32%
Ramgarh 1,446 949,159 656.36 58.73 3.07 4.06%
Ranchi 5,299 2,912,022 549.55 166.91 11.30 3.15%
Sahibganj 2,282 1,150,038 503.93 32.15 0.22 1.41%
Saraikela - Kharswan 2,743 1,063,458 387.65 115.52 4.61 4.21%
Simdega 3,857 599,813 155.50 27.60 0.02 0.72%
Manipur
Bishnupur 525 240,363 457.47 27.48 0.07 5.23%
Chandel 3,494 144,028 41.23 5.93 0.16 0.17%
Churachandpur 4,990 271,274 54.36 21.07 0.19 0.42%
Imphal East 795 452,661 569.49 29.77 0.56 3.74%
Imphal West 533 514,683 964.76 38.78 0.84 7.28%
Senapati 3,814 354,972 93.07 12.85 0.04 0.34%
Tamenglong 4,575 140,143 30.63 11.94 0.00 0.26%
Thoubal 782 420,517 538.00 44.57 0.21 5.70%
Ukhrul 4,900 183,115 37.37 6.46 0.00 0.13%
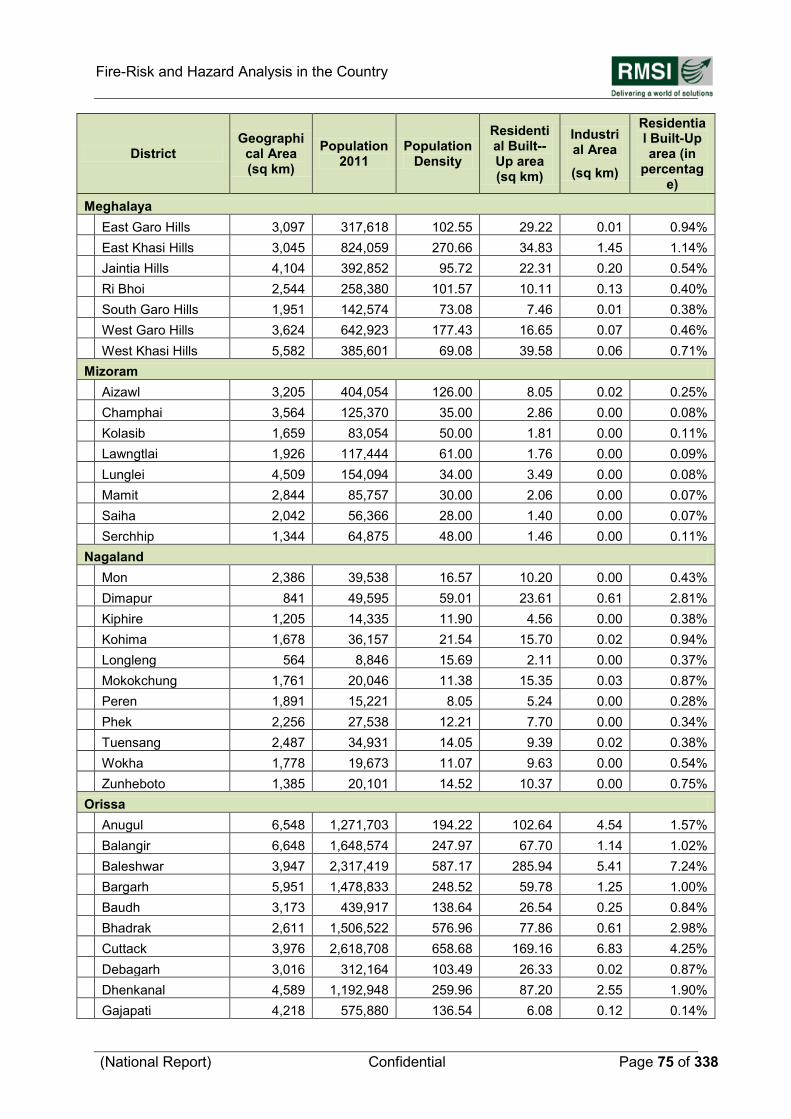
Fire-Risk and Hazard Analysis in the Country
(National Report) Confidential Page 75 of 338
District Geographi
cal Area (sq km)
Population 2011
Population Density
Residential Built--Up area (sq km)
Industrial Area
(sq km)
Residential Built-Up area (in
percentage)
Meghalaya
East Garo Hills 3,097 317,618 102.55 29.22 0.01 0.94%
East Khasi Hills 3,045 824,059 270.66 34.83 1.45 1.14%
Jaintia Hills 4,104 392,852 95.72 22.31 0.20 0.54%
Ri Bhoi 2,544 258,380 101.57 10.11 0.13 0.40%
South Garo Hills 1,951 142,574 73.08 7.46 0.01 0.38%
West Garo Hills 3,624 642,923 177.43 16.65 0.07 0.46%
West Khasi Hills 5,582 385,601 69.08 39.58 0.06 0.71%
Mizoram
Aizawl 3,205 404,054 126.00 8.05 0.02 0.25%
Champhai 3,564 125,370 35.00 2.86 0.00 0.08%
Kolasib 1,659 83,054 50.00 1.81 0.00 0.11%
Lawngtlai 1,926 117,444 61.00 1.76 0.00 0.09%
Lunglei 4,509 154,094 34.00 3.49 0.00 0.08%
Mamit 2,844 85,757 30.00 2.06 0.00 0.07%
Saiha 2,042 56,366 28.00 1.40 0.00 0.07%
Serchhip 1,344 64,875 48.00 1.46 0.00 0.11%
Nagaland
Mon 2,386 39,538 16.57 10.20 0.00 0.43%
Dimapur 841 49,595 59.01 23.61 0.61 2.81%
Kiphire 1,205 14,335 11.90 4.56 0.00 0.38%
Kohima 1,678 36,157 21.54 15.70 0.02 0.94%
Longleng 564 8,846 15.69 2.11 0.00 0.37%
Mokokchung 1,761 20,046 11.38 15.35 0.03 0.87%
Peren 1,891 15,221 8.05 5.24 0.00 0.28%
Phek 2,256 27,538 12.21 7.70 0.00 0.34%
Tuensang 2,487 34,931 14.05 9.39 0.02 0.38%
Wokha 1,778 19,673 11.07 9.63 0.00 0.54%
Zunheboto 1,385 20,101 14.52 10.37 0.00 0.75%
Orissa
Anugul 6,548 1,271,703 194.22 102.64 4.54 1.57%
Balangir 6,648 1,648,574 247.97 67.70 1.14 1.02%
Baleshwar 3,947 2,317,419 587.17 285.94 5.41 7.24%
Bargarh 5,951 1,478,833 248.52 59.78 1.25 1.00%
Baudh 3,173 439,917 138.64 26.54 0.25 0.84%
Bhadrak 2,611 1,506,522 576.96 77.86 0.61 2.98%
Cuttack 3,976 2,618,708 658.68 169.16 6.83 4.25%
Debagarh 3,016 312,164 103.49 26.33 0.02 0.87%
Dhenkanal 4,589 1,192,948 259.96 87.20 2.55 1.90%
Gajapati 4,218 575,880 136.54 6.08 0.12 0.14%
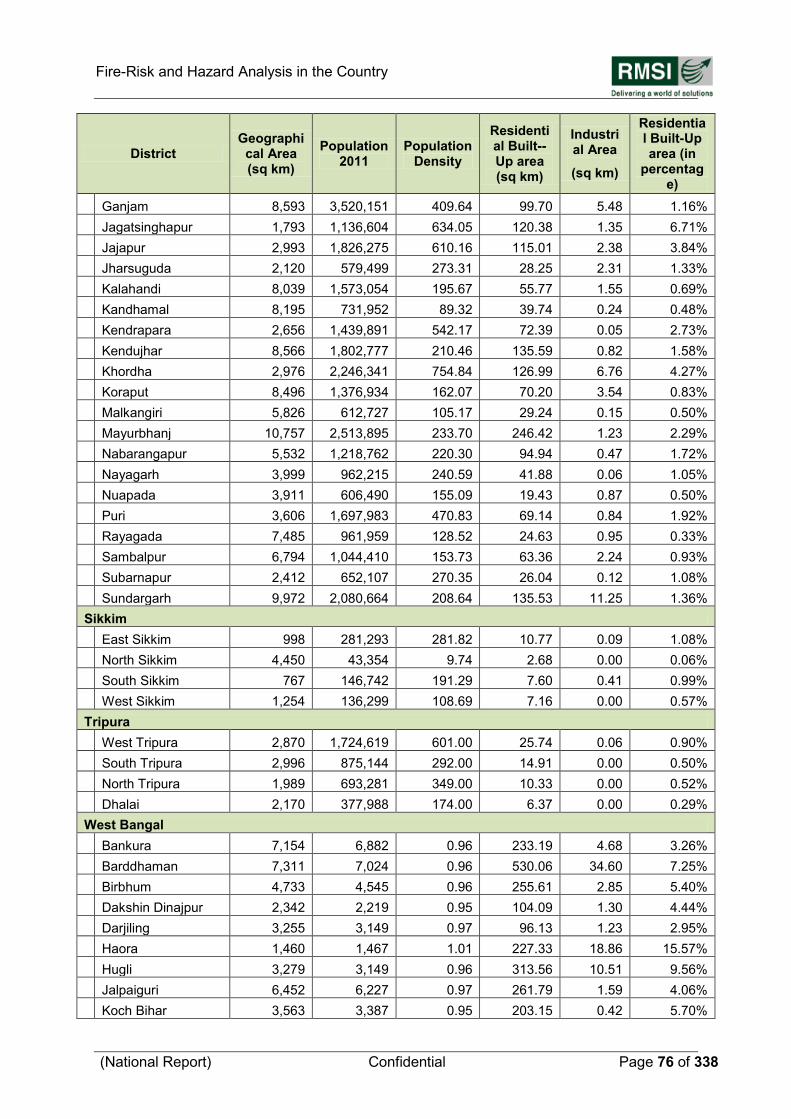
Fire-Risk and Hazard Analysis in the Country
(National Report) Confidential Page 76 of 338
District Geographi
cal Area (sq km)
Population 2011
Population Density
Residential Built--Up area (sq km)
Industrial Area
(sq km)
Residential Built-Up area (in
percentage)
Ganjam 8,593 3,520,151 409.64 99.70 5.48 1.16%
Jagatsinghapur 1,793 1,136,604 634.05 120.38 1.35 6.71%
Jajapur 2,993 1,826,275 610.16 115.01 2.38 3.84%
Jharsuguda 2,120 579,499 273.31 28.25 2.31 1.33%
Kalahandi 8,039 1,573,054 195.67 55.77 1.55 0.69%
Kandhamal 8,195 731,952 89.32 39.74 0.24 0.48%
Kendrapara 2,656 1,439,891 542.17 72.39 0.05 2.73%
Kendujhar 8,566 1,802,777 210.46 135.59 0.82 1.58%
Khordha 2,976 2,246,341 754.84 126.99 6.76 4.27%
Koraput 8,496 1,376,934 162.07 70.20 3.54 0.83%
Malkangiri 5,826 612,727 105.17 29.24 0.15 0.50%
Mayurbhanj 10,757 2,513,895 233.70 246.42 1.23 2.29%
Nabarangapur 5,532 1,218,762 220.30 94.94 0.47 1.72%
Nayagarh 3,999 962,215 240.59 41.88 0.06 1.05%
Nuapada 3,911 606,490 155.09 19.43 0.87 0.50%
Puri 3,606 1,697,983 470.83 69.14 0.84 1.92%
Rayagada 7,485 961,959 128.52 24.63 0.95 0.33%
Sambalpur 6,794 1,044,410 153.73 63.36 2.24 0.93%
Subarnapur 2,412 652,107 270.35 26.04 0.12 1.08%
Sundargarh 9,972 2,080,664 208.64 135.53 11.25 1.36%
Sikkim
East Sikkim 998 281,293 281.82 10.77 0.09 1.08%
North Sikkim 4,450 43,354 9.74 2.68 0.00 0.06%
South Sikkim 767 146,742 191.29 7.60 0.41 0.99%
West Sikkim 1,254 136,299 108.69 7.16 0.00 0.57%
Tripura
West Tripura 2,870 1,724,619 601.00 25.74 0.06 0.90%
South Tripura 2,996 875,144 292.00 14.91 0.00 0.50%
North Tripura 1,989 693,281 349.00 10.33 0.00 0.52%
Dhalai 2,170 377,988 174.00 6.37 0.00 0.29%
West Bangal
Bankura 7,154 6,882 0.96 233.19 4.68 3.26%
Barddhaman 7,311 7,024 0.96 530.06 34.60 7.25%
Birbhum 4,733 4,545 0.96 255.61 2.85 5.40%
Dakshin Dinajpur 2,342 2,219 0.95 104.09 1.30 4.44%
Darjiling 3,255 3,149 0.97 96.13 1.23 2.95%
Haora 1,460 1,467 1.01 227.33 18.86 15.57%
Hugli 3,279 3,149 0.96 313.56 10.51 9.56%
Jalpaiguri 6,452 6,227 0.97 261.79 1.59 4.06%
Koch Bihar 3,563 3,387 0.95 203.15 0.42 5.70%
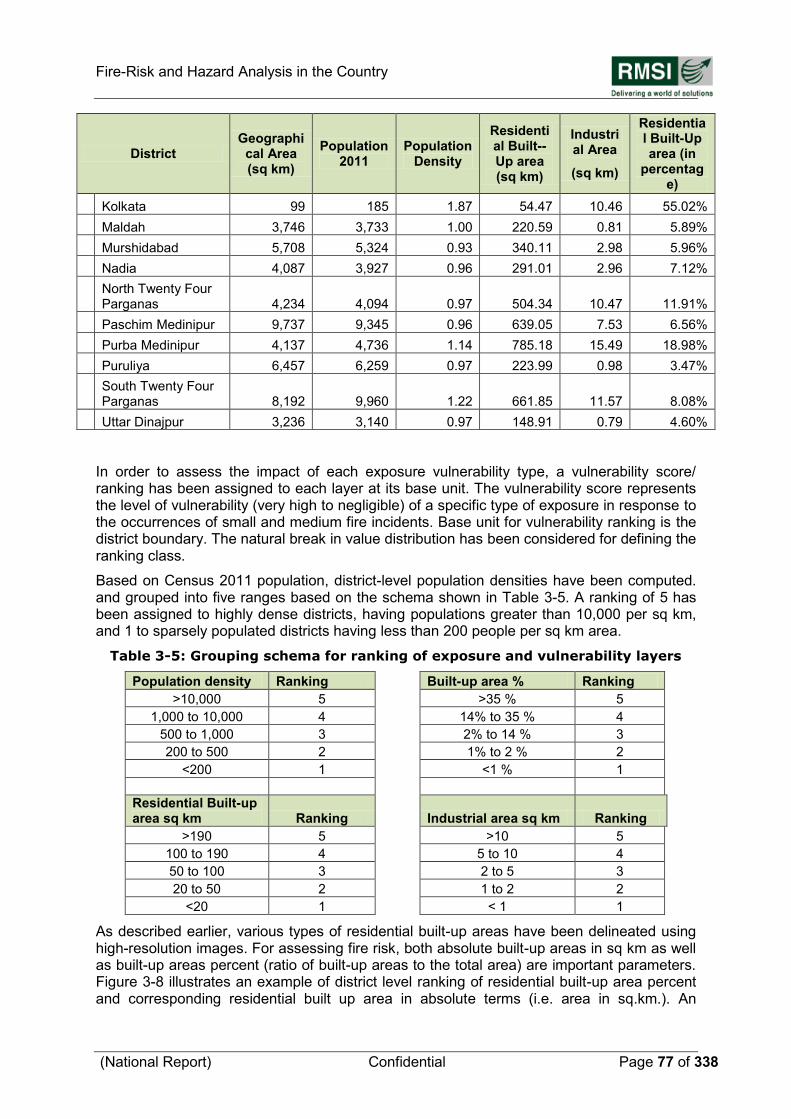
Fire-Risk and Hazard Analysis in the Country
(National Report) Confidential Page 77 of 338
District Geographi
cal Area (sq km)
Population 2011
Population Density
Residential Built--Up area (sq km)
Industrial Area
(sq km)
Residential Built-Up area (in
percentage)
Kolkata 99 185 1.87 54.47 10.46 55.02%
Maldah 3,746 3,733 1.00 220.59 0.81 5.89%
Murshidabad 5,708 5,324 0.93 340.11 2.98 5.96%
Nadia 4,087 3,927 0.96 291.01 2.96 7.12%
North Twenty Four Parganas 4,234 4,094 0.97 504.34 10.47 11.91%
Paschim Medinipur 9,737 9,345 0.96 639.05 7.53 6.56%
Purba Medinipur 4,137 4,736 1.14 785.18 15.49 18.98%
Puruliya 6,457 6,259 0.97 223.99 0.98 3.47%
South Twenty Four Parganas 8,192 9,960 1.22 661.85 11.57 8.08%
Uttar Dinajpur 3,236 3,140 0.97 148.91 0.79 4.60%
In order to assess the impact of each exposure vulnerability type, a vulnerability score/ ranking has been assigned to each layer at its base unit. The vulnerability score represents the level of vulnerability (very high to negligible) of a specific type of exposure in response to the occurrences of small and medium fire incidents. Base unit for vulnerability ranking is the district boundary. The natural break in value distribution has been considered for defining the ranking class.
Based on Census 2011 population, district-level population densities have been computed. and grouped into five ranges based on the schema shown in Table 3-5. A ranking of 5 has been assigned to highly dense districts, having populations greater than 10,000 per sq km, and 1 to sparsely populated districts having less than 200 people per sq km area.
Table 3-5: Grouping schema for ranking of exposure and vulnerability layers
Population density Ranking
Built-up area % Ranking
>10,000 5
>35 % 5
1,000 to 10,000 4
14% to 35 % 4
500 to 1,000 3
2% to 14 % 3
200 to 500 2
1% to 2 % 2
<200 1
<1 % 1
Residential Built-up area sq km Ranking
Industrial area sq km Ranking
>190 5
>10 5
100 to 190 4
5 to 10 4
50 to 100 3
2 to 5 3
20 to 50 2
1 to 2 2
<20 1
< 1 1
As described earlier, various types of residential built-up areas have been delineated using high-resolution images. For assessing fire risk, both absolute built-up areas in sq km as well as built-up areas percent (ratio of built-up areas to the total area) are important parameters. Figure 3-8 illustrates an example of district level ranking of residential built-up area percent and corresponding residential built up area in absolute terms (i.e. area in sq.km.). An
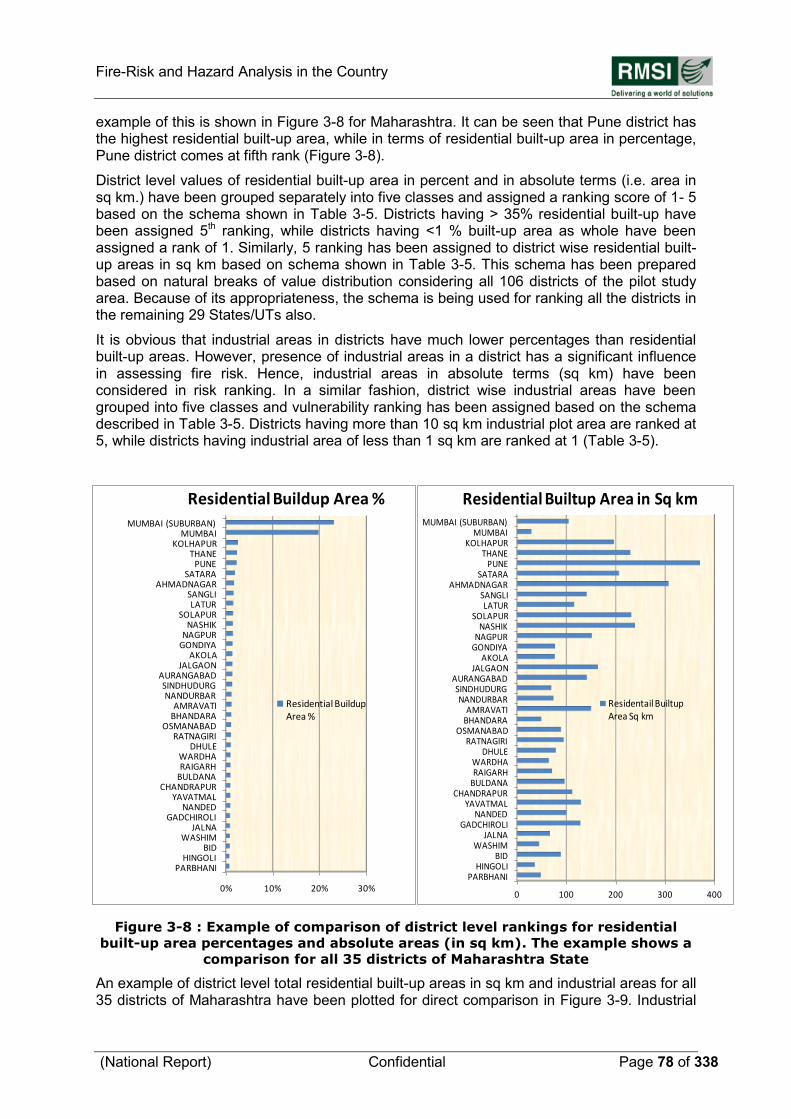
Fire-Risk and Hazard Analysis in the Country
(National Report) Confidential Page 78 of 338
0% 10% 20% 30%
MUMBAI (SUBURBAN)MUMBAI
KOLHAPURTHANE
PUNESATARA
AHMADNAGARSANGLILATUR
SOLAPURNASHIK
NAGPURGONDIYA
AKOLAJALGAON
AURANGABADSINDHUDURGNANDURBAR
AMRAVATIBHANDARA
OSMANABADRATNAGIRI
DHULEWARDHARAIGARH
BULDANACHANDRAPUR
YAVATMALNANDED
GADCHIROLIJALNA
WASHIMBID
HINGOLIPARBHANI
Residential Buildup Area %
Residential Buildup Area %
0 100 200 300 400
MUMBAI (SUBURBAN)MUMBAI
KOLHAPURTHANE
PUNESATARA
AHMADNAGARSANGLILATUR
SOLAPURNASHIK
NAGPURGONDIYA
AKOLAJALGAON
AURANGABADSINDHUDURGNANDURBAR
AMRAVATIBHANDARA
OSMANABADRATNAGIRI
DHULEWARDHARAIGARH
BULDANACHANDRAPUR
YAVATMALNANDED
GADCHIROLIJALNA
WASHIMBID
HINGOLIPARBHANI
Residential Builtup Area in Sq km
Residentail Builtup Area Sq km
example of this is shown in Figure 3-8 for Maharashtra. It can be seen that Pune district has the highest residential built-up area, while in terms of residential built-up area in percentage, Pune district comes at fifth rank (Figure 3-8).
District level values of residential built-up area in percent and in absolute terms (i.e. area in sq km.) have been grouped separately into five classes and assigned a ranking score of 1- 5 based on the schema shown in Table 3-5. Districts having > 35% residential built-up have been assigned 5th ranking, while districts having <1 % built-up area as whole have been assigned a rank of 1. Similarly, 5 ranking has been assigned to district wise residential built-up areas in sq km based on schema shown in Table 3-5. This schema has been prepared based on natural breaks of value distribution considering all 106 districts of the pilot study area. Because of its appropriateness, the schema is being used for ranking all the districts in the remaining 29 States/UTs also.
It is obvious that industrial areas in districts have much lower percentages than residential built-up areas. However, presence of industrial areas in a district has a significant influence in assessing fire risk. Hence, industrial areas in absolute terms (sq km) have been considered in risk ranking. In a similar fashion, district wise industrial areas have been grouped into five classes and vulnerability ranking has been assigned based on the schema described in Table 3-5. Districts having more than 10 sq km industrial plot area are ranked at 5, while districts having industrial area of less than 1 sq km are ranked at 1 (Table 3-5).
Figure 3-8 : Example of comparison of district level rankings for residential
built-up area percentages and absolute areas (in sq km). The example shows a
comparison for all 35 districts of Maharashtra State
An example of district level total residential built-up areas in sq km and industrial areas for all 35 districts of Maharashtra have been plotted for direct comparison in Figure 3-9. Industrial
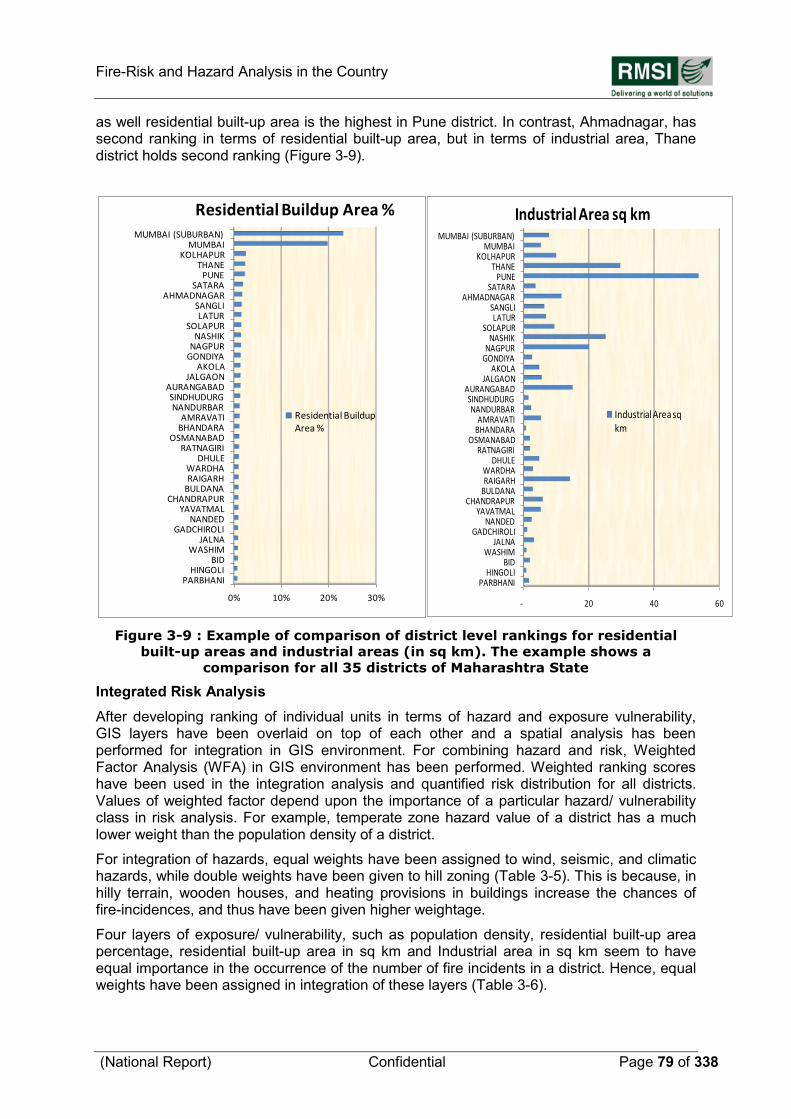
Fire-Risk and Hazard Analysis in the Country
(National Report) Confidential Page 79 of 338
as well residential built-up area is the highest in Pune district. In contrast, Ahmadnagar, has second ranking in terms of residential built-up area, but in terms of industrial area, Thane district holds second ranking (Figure 3-9).
Figure 3-9 : Example of comparison of district level rankings for residential
built-up areas and industrial areas (in sq km). The example shows a
comparison for all 35 districts of Maharashtra State
Integrated Risk Analysis
After developing ranking of individual units in terms of hazard and exposure vulnerability, GIS layers have been overlaid on top of each other and a spatial analysis has been performed for integration in GIS environment. For combining hazard and risk, Weighted Factor Analysis (WFA) in GIS environment has been performed. Weighted ranking scores have been used in the integration analysis and quantified risk distribution for all districts. Values of weighted factor depend upon the importance of a particular hazard/ vulnerability class in risk analysis. For example, temperate zone hazard value of a district has a much lower weight than the population density of a district.
For integration of hazards, equal weights have been assigned to wind, seismic, and climatic hazards, while double weights have been given to hill zoning (Table 3-5). This is because, in hilly terrain, wooden houses, and heating provisions in buildings increase the chances of fire-incidences, and thus have been given higher weightage.
Four layers of exposure/ vulnerability, such as population density, residential built-up area percentage, residential built-up area in sq km and Industrial area in sq km seem to have equal importance in the occurrence of the number of fire incidents in a district. Hence, equal weights have been assigned in integration of these layers (Table 3-6).
0% 10% 20% 30%
MUMBAI (SUBURBAN)MUMBAI
KOLHAPURTHANE
PUNESATARA
AHMADNAGARSANGLILATUR
SOLAPURNASHIK
NAGPURGONDIYA
AKOLAJALGAON
AURANGABADSINDHUDURGNANDURBAR
AMRAVATIBHANDARA
OSMANABADRATNAGIRI
DHULEWARDHARAIGARH
BULDANACHANDRAPUR
YAVATMALNANDED
GADCHIROLIJALNA
WASHIMBID
HINGOLIPARBHANI
Residential Buildup Area %
Residential Buildup Area %
- 20 40 60
MUMBAI (SUBURBAN)MUMBAI
KOLHAPURTHANE
PUNESATARA
AHMADNAGARSANGLILATUR
SOLAPURNASHIK
NAGPURGONDIYA
AKOLAJALGAON
AURANGABADSINDHUDURGNANDURBAR
AMRAVATIBHANDARA
OSMANABADRATNAGIRI
DHULEWARDHARAIGARH
BULDANACHANDRAPUR
YAVATMALNANDED
GADCHIROLIJALNA
WASHIMBID
HINGOLIPARBHANI
Industrial Area sq km
Industrial Area sq km
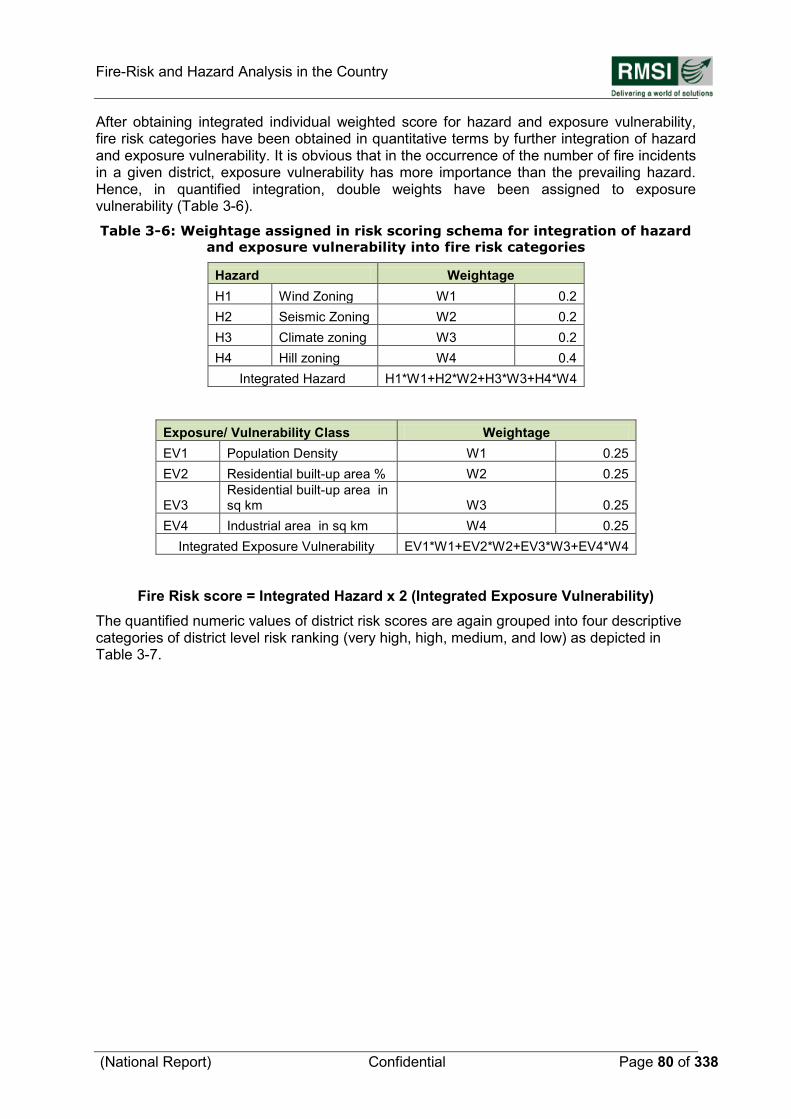
Fire-Risk and Hazard Analysis in the Country
(National Report) Confidential Page 80 of 338
After obtaining integrated individual weighted score for hazard and exposure vulnerability, fire risk categories have been obtained in quantitative terms by further integration of hazard and exposure vulnerability. It is obvious that in the occurrence of the number of fire incidents in a given district, exposure vulnerability has more importance than the prevailing hazard. Hence, in quantified integration, double weights have been assigned to exposure vulnerability (Table 3-6).
Table 3-6: Weightage assigned in risk scoring schema for integration of hazard
and exposure vulnerability into fire risk categories
Hazard Weightage
H1 Wind Zoning W1 0.2
H2 Seismic Zoning W2 0.2
H3 Climate zoning W3 0.2
H4 Hill zoning W4 0.4
Integrated Hazard H1*W1+H2*W2+H3*W3+H4*W4
Exposure/ Vulnerability Class Weightage
EV1 Population Density W1 0.25
EV2 Residential built-up area % W2 0.25
EV3 Residential built-up area in sq km W3 0.25
EV4 Industrial area in sq km W4 0.25
Integrated Exposure Vulnerability EV1*W1+EV2*W2+EV3*W3+EV4*W4
Fire Risk score = Integrated Hazard x 2 (Integrated Exposure Vulnerability)
The quantified numeric values of district risk scores are again grouped into four descriptive categories of district level risk ranking (very high, high, medium, and low) as depicted in Table 3-7.
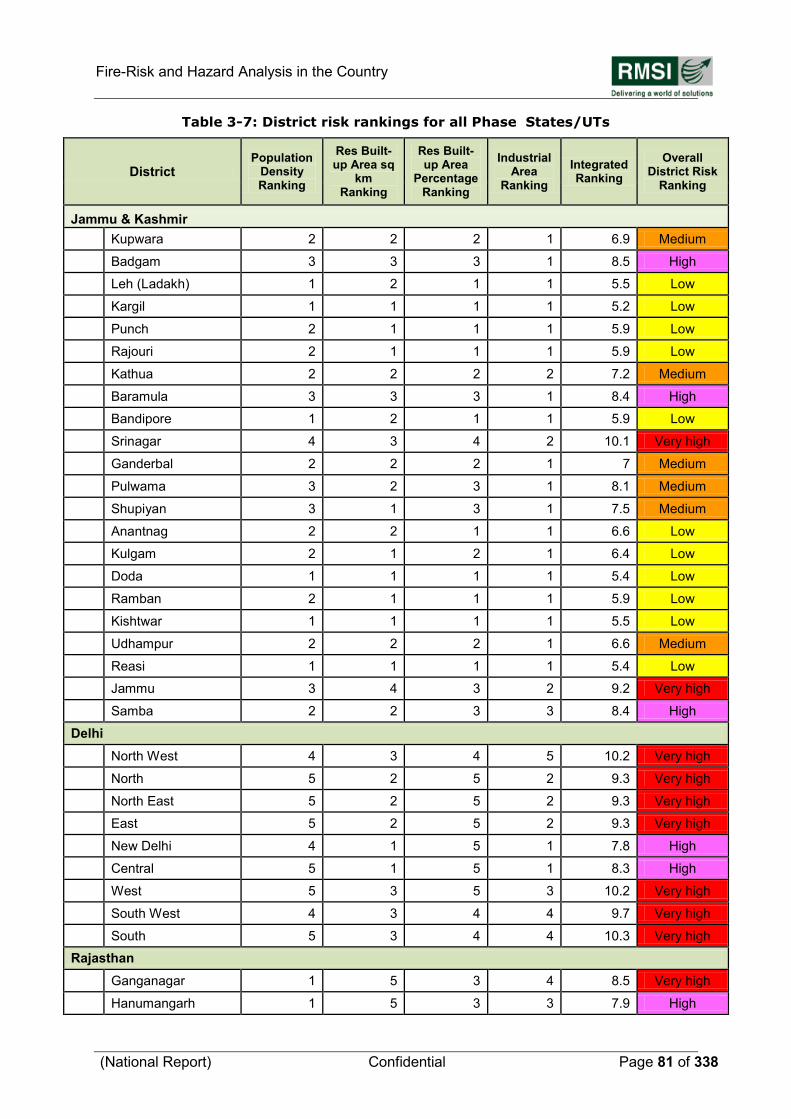
Fire-Risk and Hazard Analysis in the Country
(National Report) Confidential Page 81 of 338
Table 3-7: District risk rankings for all Phase States/UTs
District Population
Density Ranking
Res Built-up Area sq
km Ranking
Res Built-up Area
Percentage Ranking
Industrial Area
Ranking
Integrated Ranking
Overall District Risk
Ranking
Jammu & Kashmir
Kupwara 2 2 2 1 6.9 Medium
Badgam 3 3 3 1 8.5 High
Leh (Ladakh) 1 2 1 1 5.5 Low
Kargil 1 1 1 1 5.2 Low
Punch 2 1 1 1 5.9 Low
Rajouri 2 1 1 1 5.9 Low
Kathua 2 2 2 2 7.2 Medium
Baramula 3 3 3 1 8.4 High
Bandipore 1 2 1 1 5.9 Low
Srinagar 4 3 4 2 10.1 Very high
Ganderbal 2 2 2 1 7 Medium
Pulwama 3 2 3 1 8.1 Medium
Shupiyan 3 1 3 1 7.5 Medium
Anantnag 2 2 1 1 6.6 Low
Kulgam 2 1 2 1 6.4 Low
Doda 1 1 1 1 5.4 Low
Ramban 2 1 1 1 5.9 Low
Kishtwar 1 1 1 1 5.5 Low
Udhampur 2 2 2 1 6.6 Medium
Reasi 1 1 1 1 5.4 Low
Jammu 3 4 3 2 9.2 Very high
Samba 2 2 3 3 8.4 High
Delhi
North West 4 3 4 5 10.2 Very high
North 5 2 5 2 9.3 Very high
North East 5 2 5 2 9.3 Very high
East 5 2 5 2 9.3 Very high
New Delhi 4 1 5 1 7.8 High
Central 5 1 5 1 8.3 High
West 5 3 5 3 10.2 Very high
South West 4 3 4 4 9.7 Very high
South 5 3 4 4 10.3 Very high
Rajasthan
Ganganagar 1 5 3 4 8.5 Very high
Hanumangarh 1 5 3 3 7.9 High
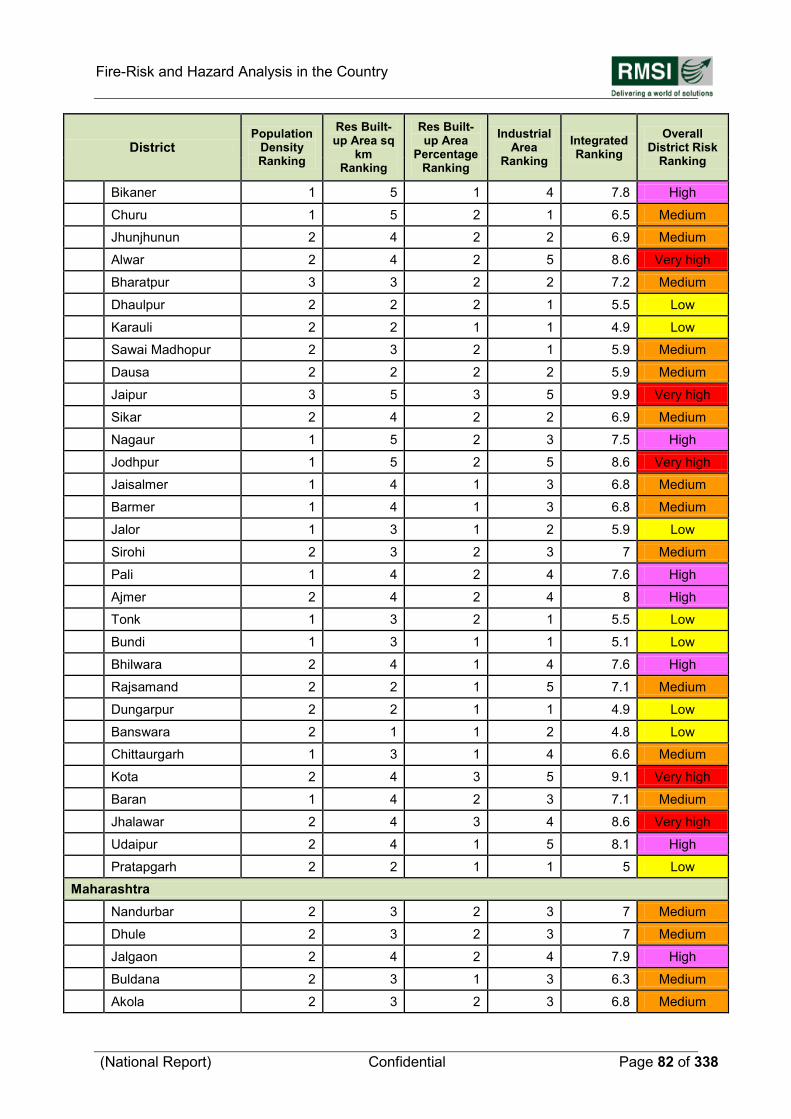
Fire-Risk and Hazard Analysis in the Country
(National Report) Confidential Page 82 of 338
District Population
Density Ranking
Res Built-up Area sq
km Ranking
Res Built-up Area
Percentage Ranking
Industrial Area
Ranking
Integrated Ranking
Overall District Risk
Ranking
Bikaner 1 5 1 4 7.8 High
Churu 1 5 2 1 6.5 Medium
Jhunjhunun 2 4 2 2 6.9 Medium
Alwar 2 4 2 5 8.6 Very high
Bharatpur 3 3 2 2 7.2 Medium
Dhaulpur 2 2 2 1 5.5 Low
Karauli 2 2 1 1 4.9 Low
Sawai Madhopur 2 3 2 1 5.9 Medium
Dausa 2 2 2 2 5.9 Medium
Jaipur 3 5 3 5 9.9 Very high
Sikar 2 4 2 2 6.9 Medium
Nagaur 1 5 2 3 7.5 High
Jodhpur 1 5 2 5 8.6 Very high
Jaisalmer 1 4 1 3 6.8 Medium
Barmer 1 4 1 3 6.8 Medium
Jalor 1 3 1 2 5.9 Low
Sirohi 2 3 2 3 7 Medium
Pali 1 4 2 4 7.6 High
Ajmer 2 4 2 4 8 High
Tonk 1 3 2 1 5.5 Low
Bundi 1 3 1 1 5.1 Low
Bhilwara 2 4 1 4 7.6 High
Rajsamand 2 2 1 5 7.1 Medium
Dungarpur 2 2 1 1 4.9 Low
Banswara 2 1 1 2 4.8 Low
Chittaurgarh 1 3 1 4 6.6 Medium
Kota 2 4 3 5 9.1 Very high
Baran 1 4 2 3 7.1 Medium
Jhalawar 2 4 3 4 8.6 Very high
Udaipur 2 4 1 5 8.1 High
Pratapgarh 2 2 1 1 5 Low
Maharashtra
Nandurbar 2 3 2 3 7 Medium
Dhule 2 3 2 3 7 Medium
Jalgaon 2 4 2 4 7.9 High
Buldana 2 3 1 3 6.3 Medium
Akola 2 3 2 3 6.8 Medium
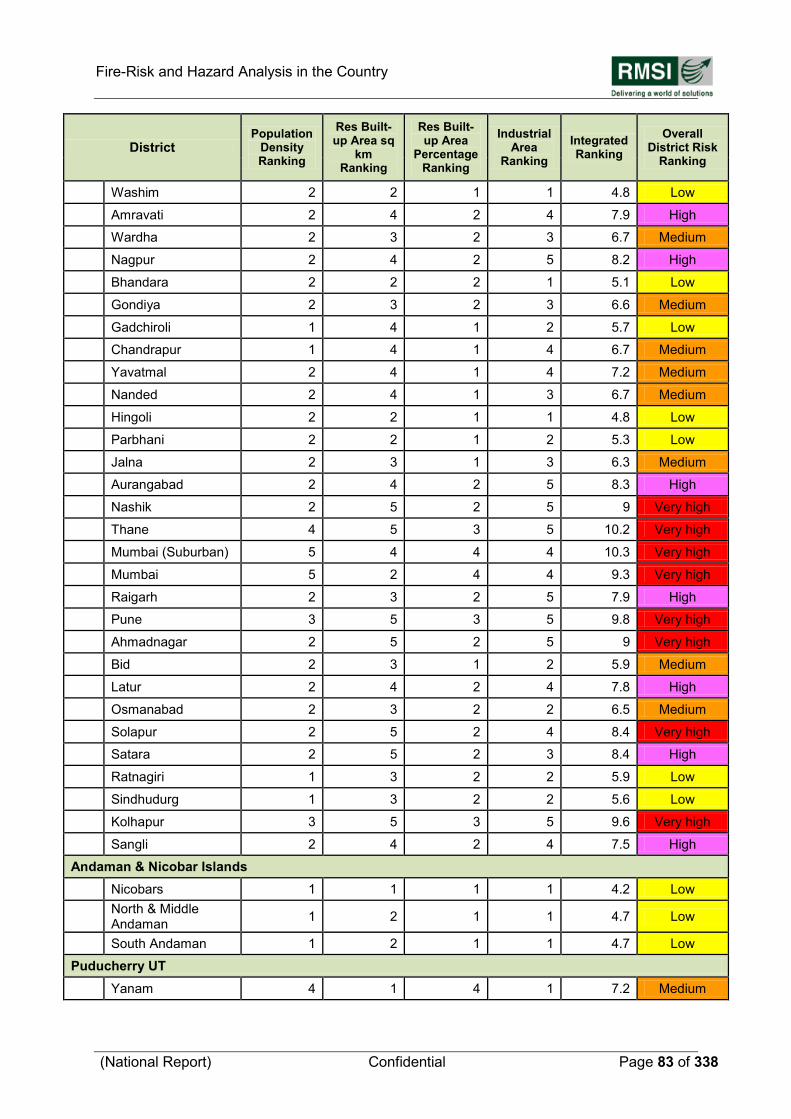
Fire-Risk and Hazard Analysis in the Country
(National Report) Confidential Page 83 of 338
District Population
Density Ranking
Res Built-up Area sq
km Ranking
Res Built-up Area
Percentage Ranking
Industrial Area
Ranking
Integrated Ranking
Overall District Risk
Ranking
Washim 2 2 1 1 4.8 Low
Amravati 2 4 2 4 7.9 High
Wardha 2 3 2 3 6.7 Medium
Nagpur 2 4 2 5 8.2 High
Bhandara 2 2 2 1 5.1 Low
Gondiya 2 3 2 3 6.6 Medium
Gadchiroli 1 4 1 2 5.7 Low
Chandrapur 1 4 1 4 6.7 Medium
Yavatmal 2 4 1 4 7.2 Medium
Nanded 2 4 1 3 6.7 Medium
Hingoli 2 2 1 1 4.8 Low
Parbhani 2 2 1 2 5.3 Low
Jalna 2 3 1 3 6.3 Medium
Aurangabad 2 4 2 5 8.3 High
Nashik 2 5 2 5 9 Very high
Thane 4 5 3 5 10.2 Very high
Mumbai (Suburban) 5 4 4 4 10.3 Very high
Mumbai 5 2 4 4 9.3 Very high
Raigarh 2 3 2 5 7.9 High
Pune 3 5 3 5 9.8 Very high
Ahmadnagar 2 5 2 5 9 Very high
Bid 2 3 1 2 5.9 Medium
Latur 2 4 2 4 7.8 High
Osmanabad 2 3 2 2 6.5 Medium
Solapur 2 5 2 4 8.4 Very high
Satara 2 5 2 3 8.4 High
Ratnagiri 1 3 2 2 5.9 Low
Sindhudurg 1 3 2 2 5.6 Low
Kolhapur 3 5 3 5 9.6 Very high
Sangli 2 4 2 4 7.5 High
Andaman & Nicobar Islands
Nicobars 1 1 1 1 4.2 Low
North & Middle Andaman
1 2 1 1 4.7 Low
South Andaman 1 2 1 1 4.7 Low
Puducherry UT
Yanam 4 1 4 1 7.2 Medium
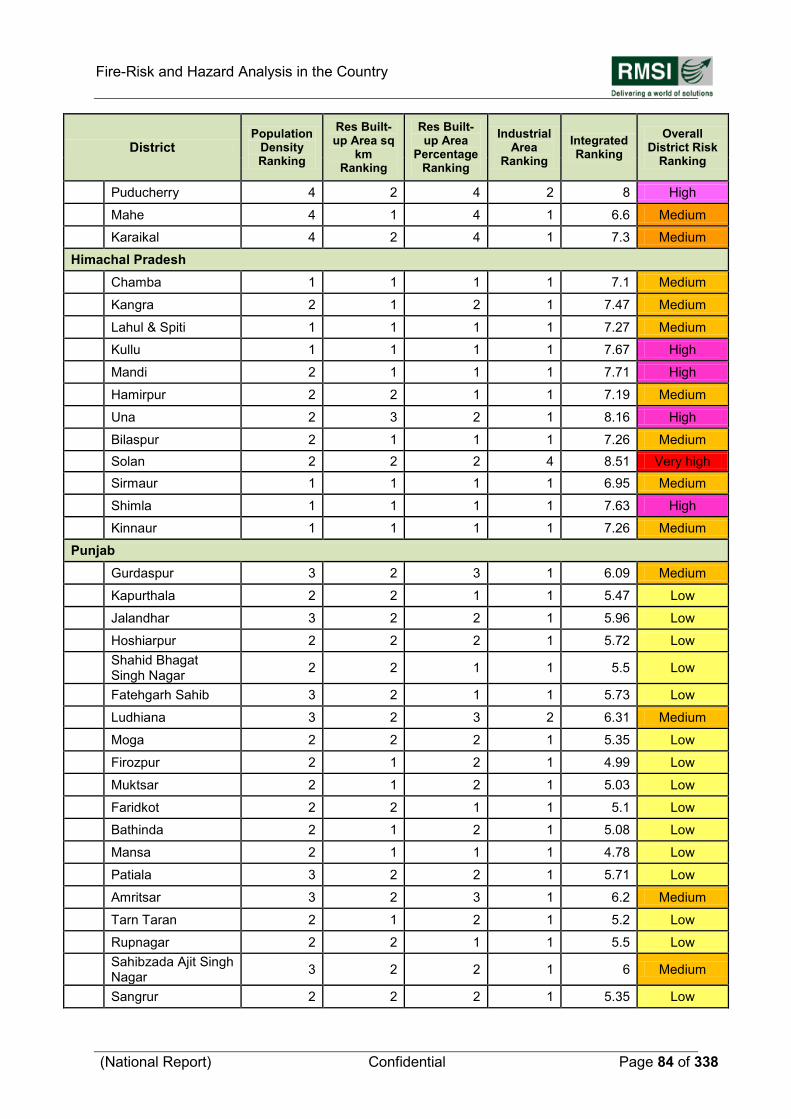
Fire-Risk and Hazard Analysis in the Country
(National Report) Confidential Page 84 of 338
District Population
Density Ranking
Res Built-up Area sq
km Ranking
Res Built-up Area
Percentage Ranking
Industrial Area
Ranking
Integrated Ranking
Overall District Risk
Ranking
Puducherry 4 2 4 2 8 High
Mahe 4 1 4 1 6.6 Medium
Karaikal 4 2 4 1 7.3 Medium
Himachal Pradesh
Chamba 1 1 1 1 7.1 Medium
Kangra 2 1 2 1 7.47 Medium
Lahul & Spiti 1 1 1 1 7.27 Medium
Kullu 1 1 1 1 7.67 High
Mandi 2 1 1 1 7.71 High
Hamirpur 2 2 1 1 7.19 Medium
Una 2 3 2 1 8.16 High
Bilaspur 2 1 1 1 7.26 Medium
Solan 2 2 2 4 8.51 Very high
Sirmaur 1 1 1 1 6.95 Medium
Shimla 1 1 1 1 7.63 High
Kinnaur 1 1 1 1 7.26 Medium
Punjab
Gurdaspur 3 2 3 1 6.09 Medium
Kapurthala 2 2 1 1 5.47 Low
Jalandhar 3 2 2 1 5.96 Low
Hoshiarpur 2 2 2 1 5.72 Low
Shahid Bhagat Singh Nagar
2 2 1 1 5.5 Low
Fatehgarh Sahib 3 2 1 1 5.73 Low
Ludhiana 3 2 3 2 6.31 Medium
Moga 2 2 2 1 5.35 Low
Firozpur 2 1 2 1 4.99 Low
Muktsar 2 1 2 1 5.03 Low
Faridkot 2 2 1 1 5.1 Low
Bathinda 2 1 2 1 5.08 Low
Mansa 2 1 1 1 4.78 Low
Patiala 3 2 2 1 5.71 Low
Amritsar 3 2 3 1 6.2 Medium
Tarn Taran 2 1 2 1 5.2 Low
Rupnagar 2 2 1 1 5.5 Low
Sahibzada Ajit Singh Nagar
3 2 2 1 6 Medium
Sangrur 2 2 2 1 5.35 Low
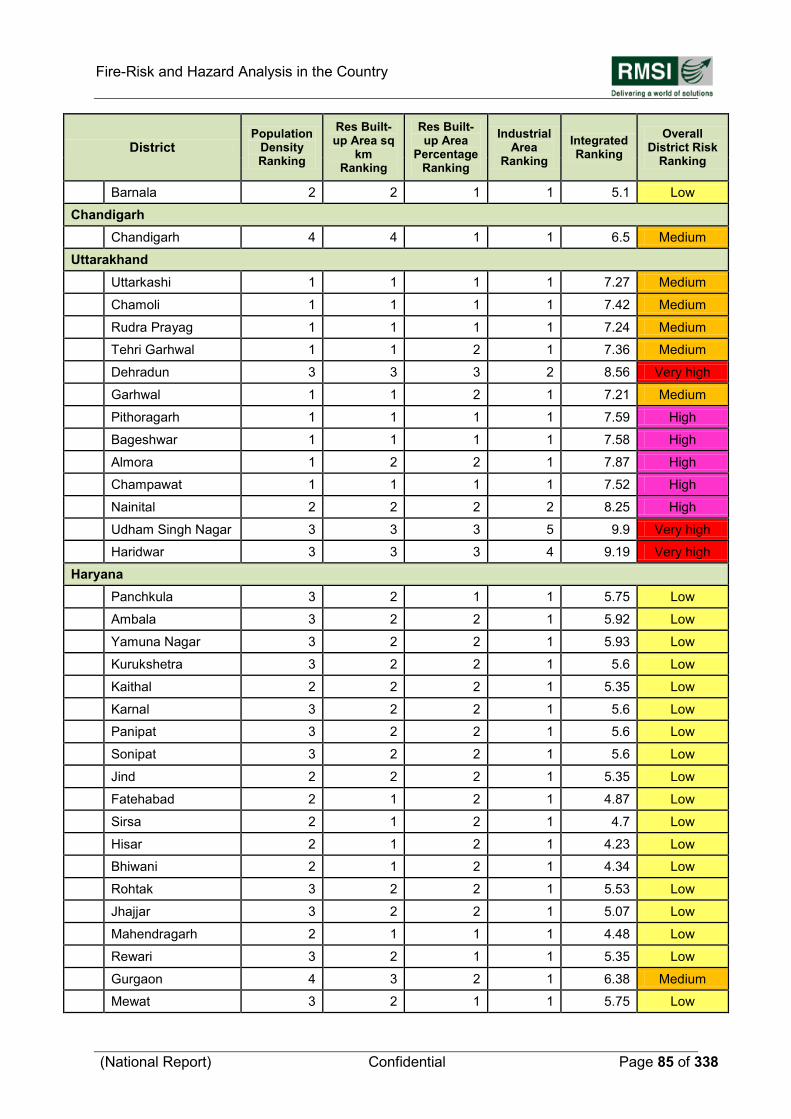
Fire-Risk and Hazard Analysis in the Country
(National Report) Confidential Page 85 of 338
District Population
Density Ranking
Res Built-up Area sq
km Ranking
Res Built-up Area
Percentage Ranking
Industrial Area
Ranking
Integrated Ranking
Overall District Risk
Ranking
Barnala 2 2 1 1 5.1 Low
Chandigarh
Chandigarh 4 4 1 1 6.5 Medium
Uttarakhand
Uttarkashi 1 1 1 1 7.27 Medium
Chamoli 1 1 1 1 7.42 Medium
Rudra Prayag 1 1 1 1 7.24 Medium
Tehri Garhwal 1 1 2 1 7.36 Medium
Dehradun 3 3 3 2 8.56 Very high
Garhwal 1 1 2 1 7.21 Medium
Pithoragarh 1 1 1 1 7.59 High
Bageshwar 1 1 1 1 7.58 High
Almora 1 2 2 1 7.87 High
Champawat 1 1 1 1 7.52 High
Nainital 2 2 2 2 8.25 High
Udham Singh Nagar 3 3 3 5 9.9 Very high
Haridwar 3 3 3 4 9.19 Very high
Haryana
Panchkula 3 2 1 1 5.75 Low
Ambala 3 2 2 1 5.92 Low
Yamuna Nagar 3 2 2 1 5.93 Low
Kurukshetra 3 2 2 1 5.6 Low
Kaithal 2 2 2 1 5.35 Low
Karnal 3 2 2 1 5.6 Low
Panipat 3 2 2 1 5.6 Low
Sonipat 3 2 2 1 5.6 Low
Jind 2 2 2 1 5.35 Low
Fatehabad 2 1 2 1 4.87 Low
Sirsa 2 1 2 1 4.7 Low
Hisar 2 1 2 1 4.23 Low
Bhiwani 2 1 2 1 4.34 Low
Rohtak 3 2 2 1 5.53 Low
Jhajjar 3 2 2 1 5.07 Low
Mahendragarh 2 1 1 1 4.48 Low
Rewari 3 2 1 1 5.35 Low
Gurgaon 4 3 2 1 6.38 Medium
Mewat 3 2 1 1 5.75 Low
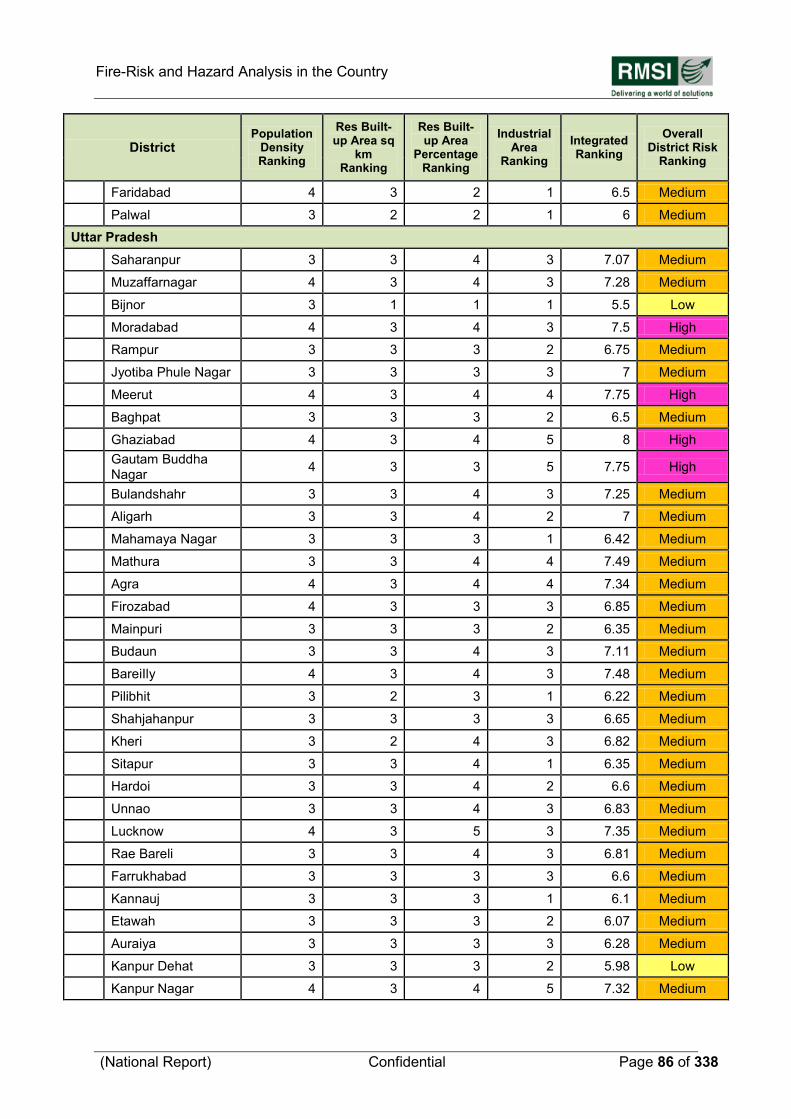
Fire-Risk and Hazard Analysis in the Country
(National Report) Confidential Page 86 of 338
District Population
Density Ranking
Res Built-up Area sq
km Ranking
Res Built-up Area
Percentage Ranking
Industrial Area
Ranking
Integrated Ranking
Overall District Risk
Ranking
Faridabad 4 3 2 1 6.5 Medium
Palwal 3 2 2 1 6 Medium
Uttar Pradesh
Saharanpur 3 3 4 3 7.07 Medium
Muzaffarnagar 4 3 4 3 7.28 Medium
Bijnor 3 1 1 1 5.5 Low
Moradabad 4 3 4 3 7.5 High
Rampur 3 3 3 2 6.75 Medium
Jyotiba Phule Nagar 3 3 3 3 7 Medium
Meerut 4 3 4 4 7.75 High
Baghpat 3 3 3 2 6.5 Medium
Ghaziabad 4 3 4 5 8 High
Gautam Buddha Nagar
4 3 3 5 7.75 High
Bulandshahr 3 3 4 3 7.25 Medium
Aligarh 3 3 4 2 7 Medium
Mahamaya Nagar 3 3 3 1 6.42 Medium
Mathura 3 3 4 4 7.49 Medium
Agra 4 3 4 4 7.34 Medium
Firozabad 4 3 3 3 6.85 Medium
Mainpuri 3 3 3 2 6.35 Medium
Budaun 3 3 4 3 7.11 Medium
BareiIly 4 3 4 3 7.48 Medium
Pilibhit 3 2 3 1 6.22 Medium
Shahjahanpur 3 3 3 3 6.65 Medium
Kheri 3 2 4 3 6.82 Medium
Sitapur 3 3 4 1 6.35 Medium
Hardoi 3 3 4 2 6.6 Medium
Unnao 3 3 4 3 6.83 Medium
Lucknow 4 3 5 3 7.35 Medium
Rae Bareli 3 3 4 3 6.81 Medium
Farrukhabad 3 3 3 3 6.6 Medium
Kannauj 3 3 3 1 6.1 Medium
Etawah 3 3 3 2 6.07 Medium
Auraiya 3 3 3 3 6.28 Medium
Kanpur Dehat 3 3 3 2 5.98 Low
Kanpur Nagar 4 3 4 5 7.32 Medium
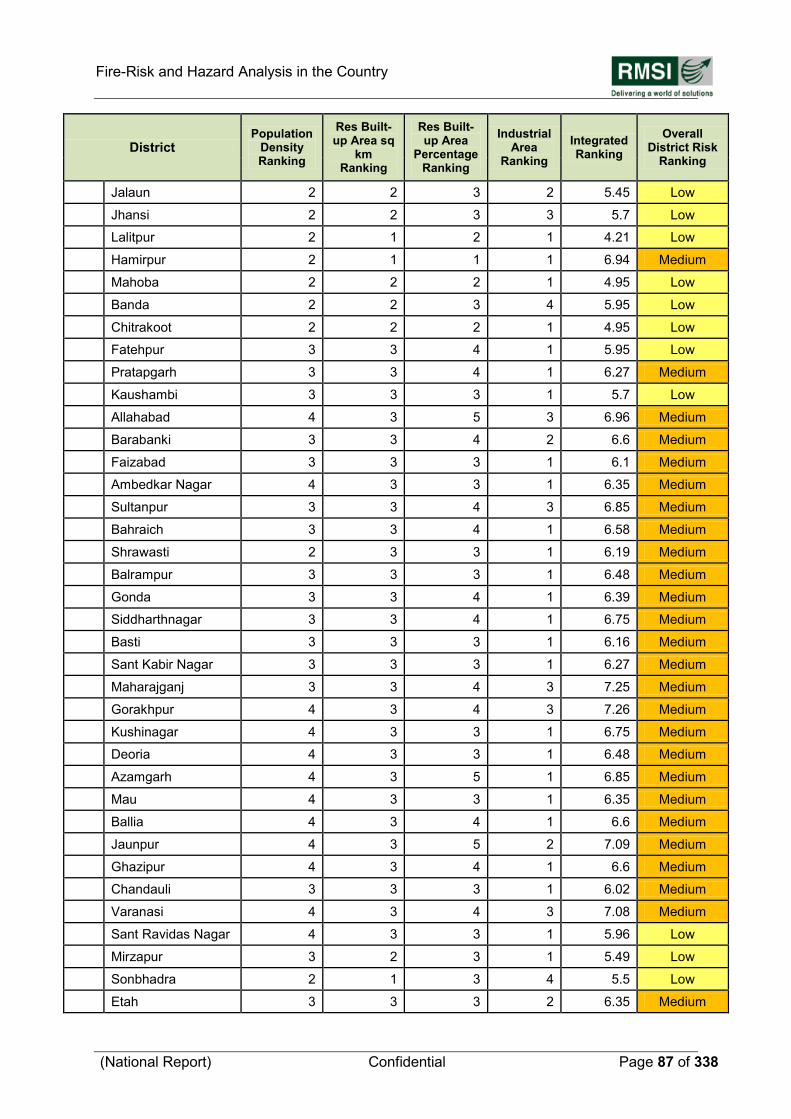
Fire-Risk and Hazard Analysis in the Country
(National Report) Confidential Page 87 of 338
District Population
Density Ranking
Res Built-up Area sq
km Ranking
Res Built-up Area
Percentage Ranking
Industrial Area
Ranking
Integrated Ranking
Overall District Risk
Ranking
Jalaun 2 2 3 2 5.45 Low
Jhansi 2 2 3 3 5.7 Low
Lalitpur 2 1 2 1 4.21 Low
Hamirpur 2 1 1 1 6.94 Medium
Mahoba 2 2 2 1 4.95 Low
Banda 2 2 3 4 5.95 Low
Chitrakoot 2 2 2 1 4.95 Low
Fatehpur 3 3 4 1 5.95 Low
Pratapgarh 3 3 4 1 6.27 Medium
Kaushambi 3 3 3 1 5.7 Low
Allahabad 4 3 5 3 6.96 Medium
Barabanki 3 3 4 2 6.6 Medium
Faizabad 3 3 3 1 6.1 Medium
Ambedkar Nagar 4 3 3 1 6.35 Medium
Sultanpur 3 3 4 3 6.85 Medium
Bahraich 3 3 4 1 6.58 Medium
Shrawasti 2 3 3 1 6.19 Medium
Balrampur 3 3 3 1 6.48 Medium
Gonda 3 3 4 1 6.39 Medium
Siddharthnagar 3 3 4 1 6.75 Medium
Basti 3 3 3 1 6.16 Medium
Sant Kabir Nagar 3 3 3 1 6.27 Medium
Maharajganj 3 3 4 3 7.25 Medium
Gorakhpur 4 3 4 3 7.26 Medium
Kushinagar 4 3 3 1 6.75 Medium
Deoria 4 3 3 1 6.48 Medium
Azamgarh 4 3 5 1 6.85 Medium
Mau 4 3 3 1 6.35 Medium
Ballia 4 3 4 1 6.6 Medium
Jaunpur 4 3 5 2 7.09 Medium
Ghazipur 4 3 4 1 6.6 Medium
Chandauli 3 3 3 1 6.02 Medium
Varanasi 4 3 4 3 7.08 Medium
Sant Ravidas Nagar 4 3 3 1 5.96 Low
Mirzapur 3 2 3 1 5.49 Low
Sonbhadra 2 1 3 4 5.5 Low
Etah 3 3 3 2 6.35 Medium
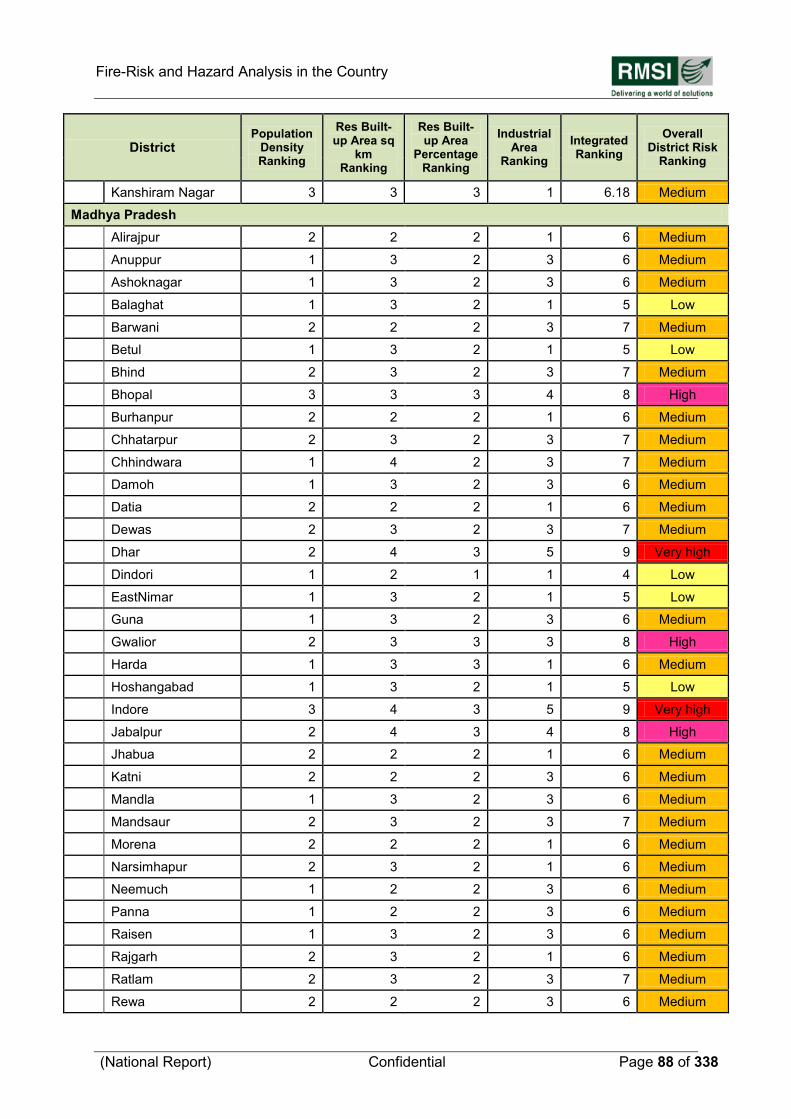
Fire-Risk and Hazard Analysis in the Country
(National Report) Confidential Page 88 of 338
District Population
Density Ranking
Res Built-up Area sq
km Ranking
Res Built-up Area
Percentage Ranking
Industrial Area
Ranking
Integrated Ranking
Overall District Risk
Ranking
Kanshiram Nagar 3 3 3 1 6.18 Medium
Madhya Pradesh
Alirajpur 2 2 2 1 6 Medium
Anuppur 1 3 2 3 6 Medium
Ashoknagar 1 3 2 3 6 Medium
Balaghat 1 3 2 1 5 Low
Barwani 2 2 2 3 7 Medium
Betul 1 3 2 1 5 Low
Bhind 2 3 2 3 7 Medium
Bhopal 3 3 3 4 8 High
Burhanpur 2 2 2 1 6 Medium
Chhatarpur 2 3 2 3 7 Medium
Chhindwara 1 4 2 3 7 Medium
Damoh 1 3 2 3 6 Medium
Datia 2 2 2 1 6 Medium
Dewas 2 3 2 3 7 Medium
Dhar 2 4 3 5 9 Very high
Dindori 1 2 1 1 4 Low
EastNimar 1 3 2 1 5 Low
Guna 1 3 2 3 6 Medium
Gwalior 2 3 3 3 8 High
Harda 1 3 3 1 6 Medium
Hoshangabad 1 3 2 1 5 Low
Indore 3 4 3 5 9 Very high
Jabalpur 2 4 3 4 8 High
Jhabua 2 2 2 1 6 Medium
Katni 2 2 2 3 6 Medium
Mandla 1 3 2 3 6 Medium
Mandsaur 2 3 2 3 7 Medium
Morena 2 2 2 1 6 Medium
Narsimhapur 2 3 2 1 6 Medium
Neemuch 1 2 2 3 6 Medium
Panna 1 2 2 3 6 Medium
Raisen 1 3 2 3 6 Medium
Rajgarh 2 3 2 1 6 Medium
Ratlam 2 3 2 3 7 Medium
Rewa 2 2 2 3 6 Medium
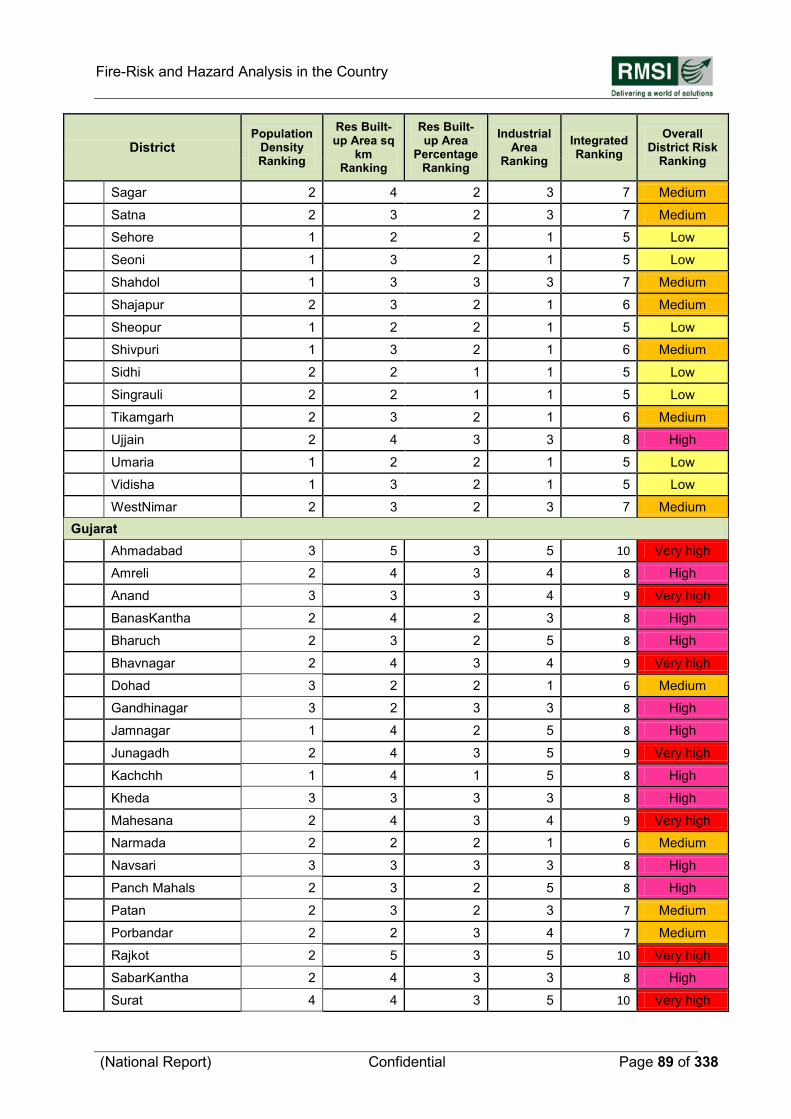
Fire-Risk and Hazard Analysis in the Country
(National Report) Confidential Page 89 of 338
District Population
Density Ranking
Res Built-up Area sq
km Ranking
Res Built-up Area
Percentage Ranking
Industrial Area
Ranking
Integrated Ranking
Overall District Risk
Ranking
Sagar 2 4 2 3 7 Medium
Satna 2 3 2 3 7 Medium
Sehore 1 2 2 1 5 Low
Seoni 1 3 2 1 5 Low
Shahdol 1 3 3 3 7 Medium
Shajapur 2 3 2 1 6 Medium
Sheopur 1 2 2 1 5 Low
Shivpuri 1 3 2 1 6 Medium
Sidhi 2 2 1 1 5 Low
Singrauli 2 2 1 1 5 Low
Tikamgarh 2 3 2 1 6 Medium
Ujjain 2 4 3 3 8 High
Umaria 1 2 2 1 5 Low
Vidisha 1 3 2 1 5 Low
WestNimar 2 3 2 3 7 Medium
Gujarat
Ahmadabad 3 5 3 5 10 Very high
Amreli 2 4 3 4 8 High
Anand 3 3 3 4 9 Very high
BanasKantha 2 4 2 3 8 High
Bharuch 2 3 2 5 8 High
Bhavnagar 2 4 3 4 9 Very high
Dohad 3 2 2 1 6 Medium
Gandhinagar 3 2 3 3 8 High
Jamnagar 1 4 2 5 8 High
Junagadh 2 4 3 5 9 Very high
Kachchh 1 4 1 5 8 High
Kheda 3 3 3 3 8 High
Mahesana 2 4 3 4 9 Very high
Narmada 2 2 2 1 6 Medium
Navsari 3 3 3 3 8 High
Panch Mahals 2 3 2 5 8 High
Patan 2 3 2 3 7 Medium
Porbandar 2 2 3 4 7 Medium
Rajkot 2 5 3 5 10 Very high
SabarKantha 2 4 3 3 8 High
Surat 4 4 3 5 10 Very high
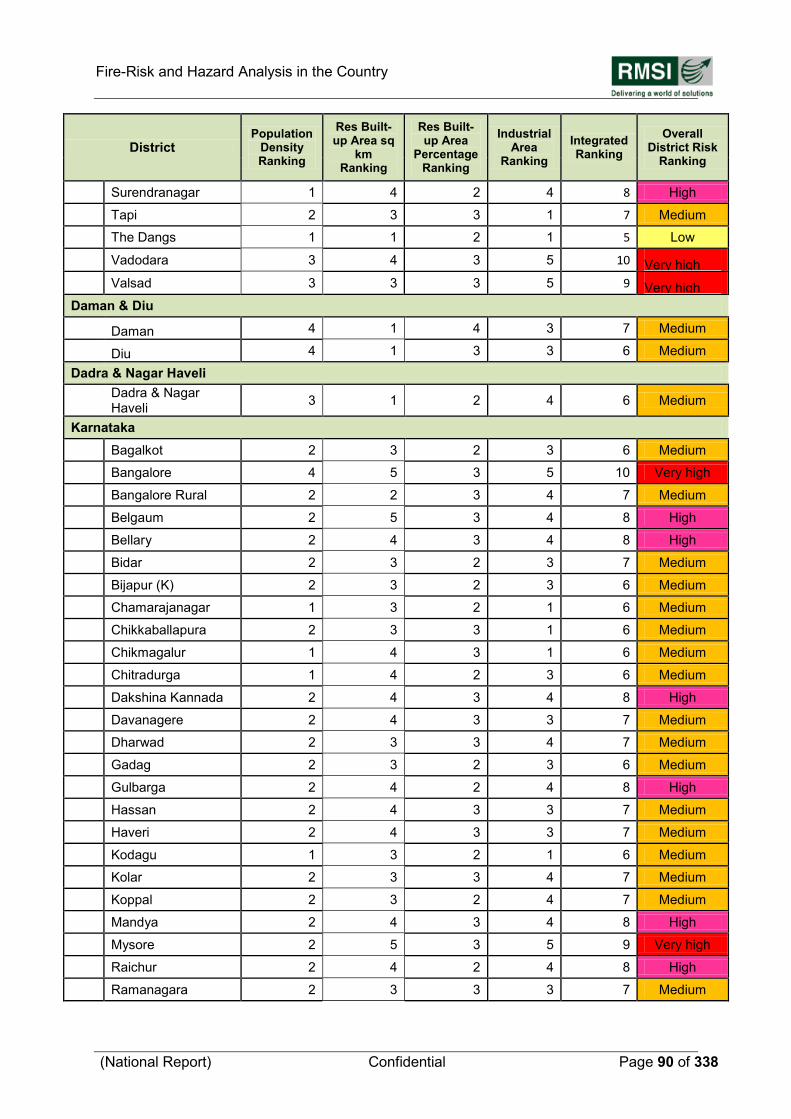
Fire-Risk and Hazard Analysis in the Country
(National Report) Confidential Page 90 of 338
District Population
Density Ranking
Res Built-up Area sq
km Ranking
Res Built-up Area
Percentage Ranking
Industrial Area
Ranking
Integrated Ranking
Overall District Risk
Ranking
Surendranagar 1 4 2 4 8 High
Tapi 2 3 3 1 7 Medium
The Dangs 1 1 2 1 5 Low
Vadodara 3 4 3 5 10 Very high
Valsad 3 3 3 5 9 Very high
Daman & Diu
Daman 4 1 4 3 7 Medium
Diu 4 1 3 3 6 Medium
Dadra & Nagar Haveli
Dadra & Nagar Haveli
3 1 2 4 6 Medium
Karnataka
Bagalkot 2 3 2 3 6 Medium
Bangalore 4 5 3 5 10 Very high
Bangalore Rural 2 2 3 4 7 Medium
Belgaum 2 5 3 4 8 High
Bellary 2 4 3 4 8 High
Bidar 2 3 2 3 7 Medium
Bijapur (K) 2 3 2 3 6 Medium
Chamarajanagar 1 3 2 1 6 Medium
Chikkaballapura 2 3 3 1 6 Medium
Chikmagalur 1 4 3 1 6 Medium
Chitradurga 1 4 2 3 6 Medium
Dakshina Kannada 2 4 3 4 8 High
Davanagere 2 4 3 3 7 Medium
Dharwad 2 3 3 4 7 Medium
Gadag 2 3 2 3 6 Medium
Gulbarga 2 4 2 4 8 High
Hassan 2 4 3 3 7 Medium
Haveri 2 4 3 3 7 Medium
Kodagu 1 3 2 1 6 Medium
Kolar 2 3 3 4 7 Medium
Koppal 2 3 2 4 7 Medium
Mandya 2 4 3 4 8 High
Mysore 2 5 3 5 9 Very high
Raichur 2 4 2 4 8 High
Ramanagara 2 3 3 3 7 Medium
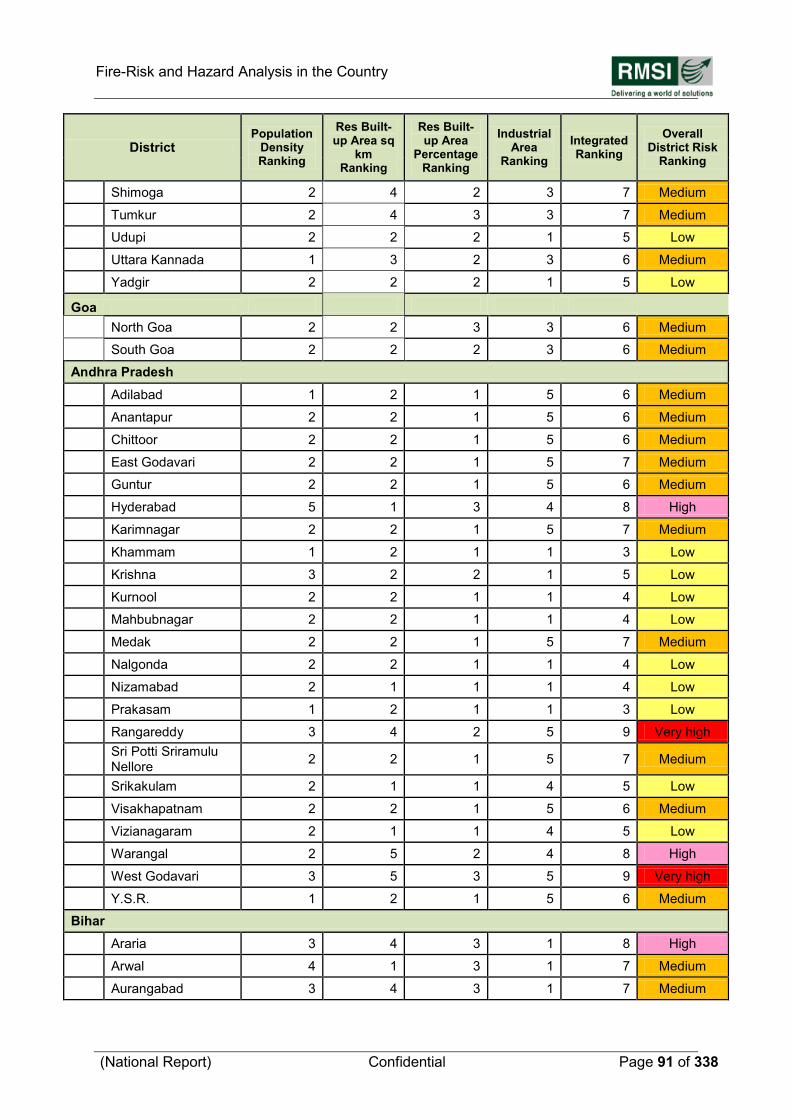
Fire-Risk and Hazard Analysis in the Country
(National Report) Confidential Page 91 of 338
District Population
Density Ranking
Res Built-up Area sq
km Ranking
Res Built-up Area
Percentage Ranking
Industrial Area
Ranking
Integrated Ranking
Overall District Risk
Ranking
Shimoga 2 4 2 3 7 Medium
Tumkur 2 4 3 3 7 Medium
Udupi 2 2 2 1 5 Low
Uttara Kannada 1 3 2 3 6 Medium
Yadgir 2 2 2 1 5 Low
Goa
North Goa 2 2 3 3 6 Medium
South Goa 2 2 2 3 6 Medium
Andhra Pradesh
Adilabad 1 2 1 5 6 Medium
Anantapur 2 2 1 5 6 Medium
Chittoor 2 2 1 5 6 Medium
East Godavari 2 2 1 5 7 Medium
Guntur 2 2 1 5 6 Medium
Hyderabad 5 1 3 4 8 High
Karimnagar 2 2 1 5 7 Medium
Khammam 1 2 1 1 3 Low
Krishna 3 2 2 1 5 Low
Kurnool 2 2 1 1 4 Low
Mahbubnagar 2 2 1 1 4 Low
Medak 2 2 1 5 7 Medium
Nalgonda 2 2 1 1 4 Low
Nizamabad 2 1 1 1 4 Low
Prakasam 1 2 1 1 3 Low
Rangareddy 3 4 2 5 9 Very high
Sri Potti Sriramulu Nellore
2 2 1 5 7 Medium
Srikakulam 2 1 1 4 5 Low
Visakhapatnam 2 2 1 5 6 Medium
Vizianagaram 2 1 1 4 5 Low
Warangal 2 5 2 4 8 High
West Godavari 3 5 3 5 9 Very high
Y.S.R. 1 2 1 5 6 Medium
Bihar
Araria 3 4 3 1 8 High
Arwal 4 1 3 1 7 Medium
Aurangabad 3 4 3 1 7 Medium
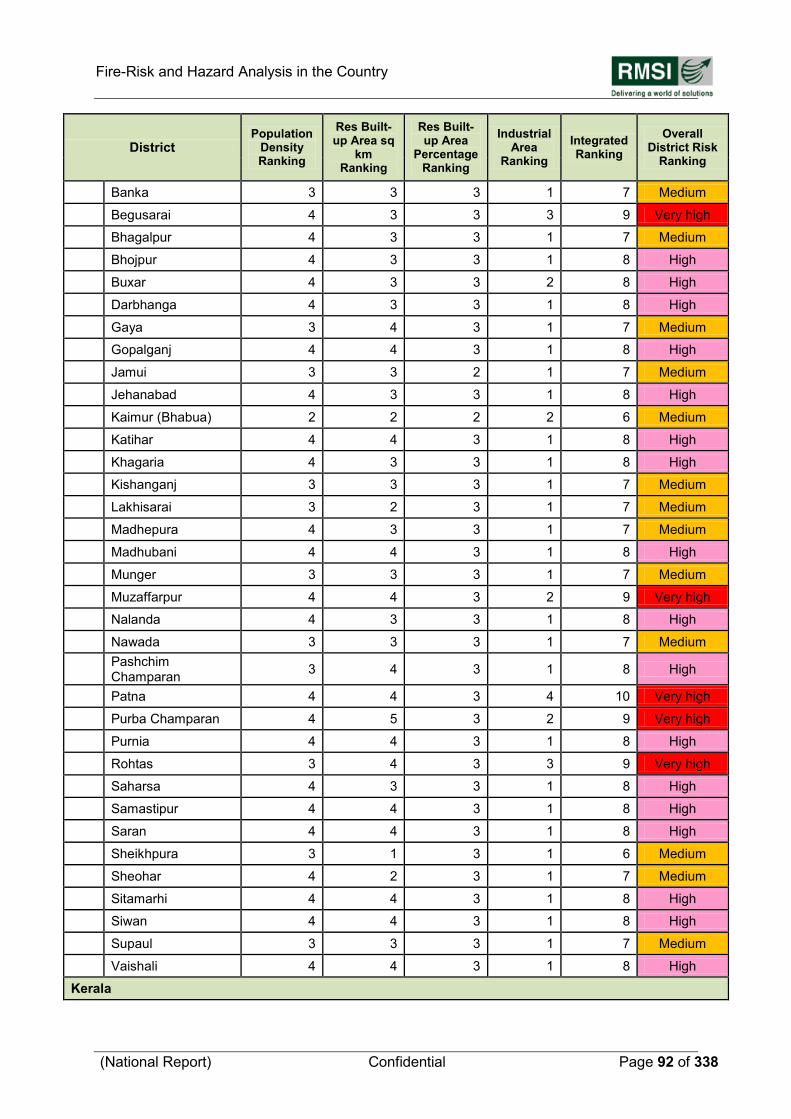
Fire-Risk and Hazard Analysis in the Country
(National Report) Confidential Page 92 of 338
District Population
Density Ranking
Res Built-up Area sq
km Ranking
Res Built-up Area
Percentage Ranking
Industrial Area
Ranking
Integrated Ranking
Overall District Risk
Ranking
Banka 3 3 3 1 7 Medium
Begusarai 4 3 3 3 9 Very high
Bhagalpur 4 3 3 1 7 Medium
Bhojpur 4 3 3 1 8 High
Buxar 4 3 3 2 8 High
Darbhanga 4 3 3 1 8 High
Gaya 3 4 3 1 7 Medium
Gopalganj 4 4 3 1 8 High
Jamui 3 3 2 1 7 Medium
Jehanabad 4 3 3 1 8 High
Kaimur (Bhabua) 2 2 2 2 6 Medium
Katihar 4 4 3 1 8 High
Khagaria 4 3 3 1 8 High
Kishanganj 3 3 3 1 7 Medium
Lakhisarai 3 2 3 1 7 Medium
Madhepura 4 3 3 1 7 Medium
Madhubani 4 4 3 1 8 High
Munger 3 3 3 1 7 Medium
Muzaffarpur 4 4 3 2 9 Very high
Nalanda 4 3 3 1 8 High
Nawada 3 3 3 1 7 Medium
Pashchim Champaran
3 4 3 1 8 High
Patna 4 4 3 4 10 Very high
Purba Champaran 4 5 3 2 9 Very high
Purnia 4 4 3 1 8 High
Rohtas 3 4 3 3 9 Very high
Saharsa 4 3 3 1 8 High
Samastipur 4 4 3 1 8 High
Saran 4 4 3 1 8 High
Sheikhpura 3 1 3 1 6 Medium
Sheohar 4 2 3 1 7 Medium
Sitamarhi 4 4 3 1 8 High
Siwan 4 4 3 1 8 High
Supaul 3 3 3 1 7 Medium
Vaishali 4 4 3 1 8 High
Kerala
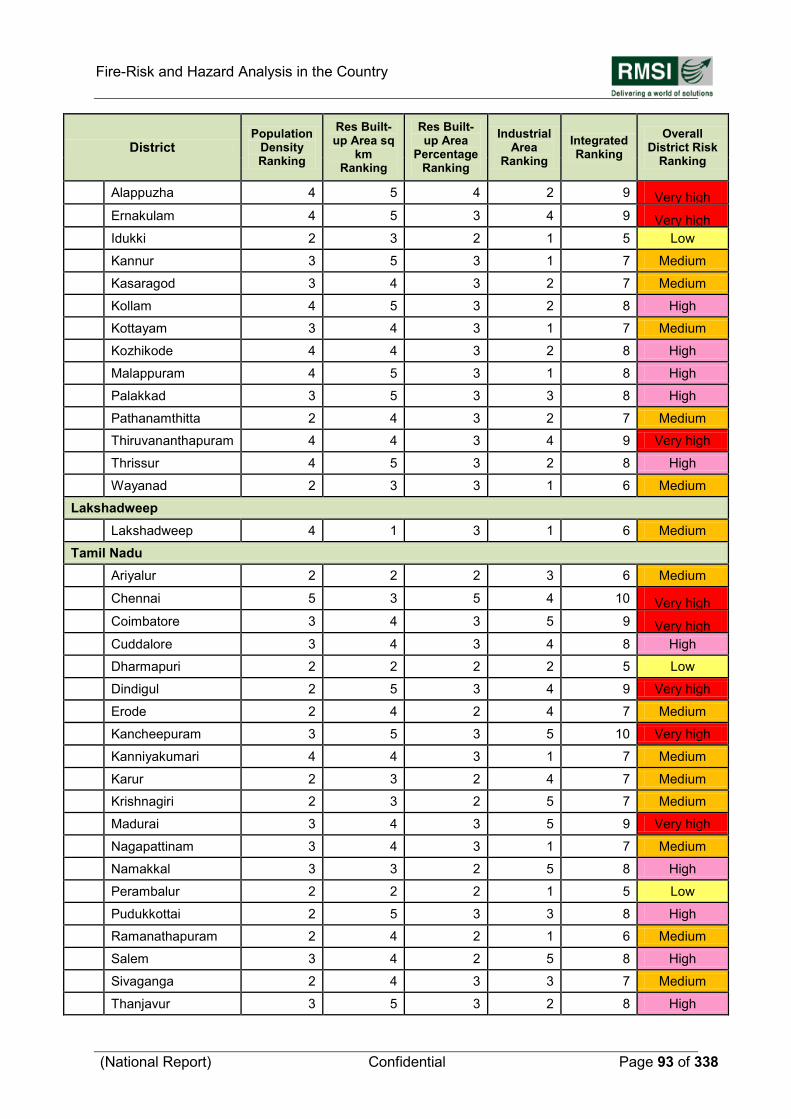
Fire-Risk and Hazard Analysis in the Country
(National Report) Confidential Page 93 of 338
District Population
Density Ranking
Res Built-up Area sq
km Ranking
Res Built-up Area
Percentage Ranking
Industrial Area
Ranking
Integrated Ranking
Overall District Risk
Ranking
Alappuzha 4 5 4 2 9 Very high
Ernakulam 4 5 3 4 9 Very high
Idukki 2 3 2 1 5 Low
Kannur 3 5 3 1 7 Medium
Kasaragod 3 4 3 2 7 Medium
Kollam 4 5 3 2 8 High
Kottayam 3 4 3 1 7 Medium
Kozhikode 4 4 3 2 8 High
Malappuram 4 5 3 1 8 High
Palakkad 3 5 3 3 8 High
Pathanamthitta 2 4 3 2 7 Medium
Thiruvananthapuram 4 4 3 4 9 Very high
Thrissur 4 5 3 2 8 High
Wayanad 2 3 3 1 6 Medium
Lakshadweep
Lakshadweep 4 1 3 1 6 Medium
Tamil Nadu
Ariyalur 2 2 2 3 6 Medium
Chennai 5 3 5 4 10 Very high
Coimbatore 3 4 3 5 9 Very high
Cuddalore 3 4 3 4 8 High
Dharmapuri 2 2 2 2 5 Low
Dindigul 2 5 3 4 9 Very high
Erode 2 4 2 4 7 Medium
Kancheepuram 3 5 3 5 10 Very high
Kanniyakumari 4 4 3 1 7 Medium
Karur 2 3 2 4 7 Medium
Krishnagiri 2 3 2 5 7 Medium
Madurai 3 4 3 5 9 Very high
Nagapattinam 3 4 3 1 7 Medium
Namakkal 3 3 2 5 8 High
Perambalur 2 2 2 1 5 Low
Pudukkottai 2 5 3 3 8 High
Ramanathapuram 2 4 2 1 6 Medium
Salem 3 4 2 5 8 High
Sivaganga 2 4 3 3 7 Medium
Thanjavur 3 5 3 2 8 High
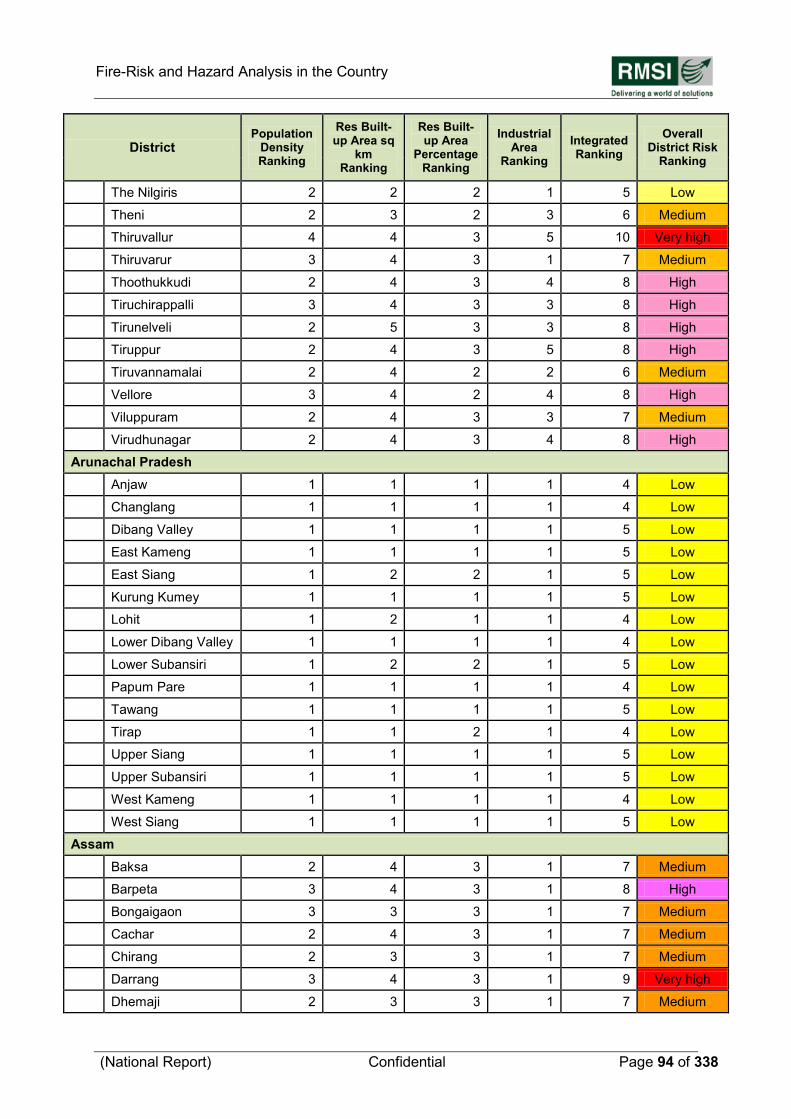
Fire-Risk and Hazard Analysis in the Country
(National Report) Confidential Page 94 of 338
District Population
Density Ranking
Res Built-up Area sq
km Ranking
Res Built-up Area
Percentage Ranking
Industrial Area
Ranking
Integrated Ranking
Overall District Risk
Ranking
The Nilgiris 2 2 2 1 5 Low
Theni 2 3 2 3 6 Medium
Thiruvallur 4 4 3 5 10 Very high
Thiruvarur 3 4 3 1 7 Medium
Thoothukkudi 2 4 3 4 8 High
Tiruchirappalli 3 4 3 3 8 High
Tirunelveli 2 5 3 3 8 High
Tiruppur 2 4 3 5 8 High
Tiruvannamalai 2 4 2 2 6 Medium
Vellore 3 4 2 4 8 High
Viluppuram 2 4 3 3 7 Medium
Virudhunagar 2 4 3 4 8 High
Arunachal Pradesh
Anjaw 1 1 1 1 4 Low
Changlang 1 1 1 1 4 Low
Dibang Valley 1 1 1 1 5 Low
East Kameng 1 1 1 1 5 Low
East Siang 1 2 2 1 5 Low
Kurung Kumey 1 1 1 1 5 Low
Lohit 1 2 1 1 4 Low
Lower Dibang Valley 1 1 1 1 4 Low
Lower Subansiri 1 2 2 1 5 Low
Papum Pare 1 1 1 1 4 Low
Tawang 1 1 1 1 5 Low
Tirap 1 1 2 1 4 Low
Upper Siang 1 1 1 1 5 Low
Upper Subansiri 1 1 1 1 5 Low
West Kameng 1 1 1 1 4 Low
West Siang 1 1 1 1 5 Low
Assam
Baksa 2 4 3 1 7 Medium
Barpeta 3 4 3 1 8 High
Bongaigaon 3 3 3 1 7 Medium
Cachar 2 4 3 1 7 Medium
Chirang 2 3 3 1 7 Medium
Darrang 3 4 3 1 9 Very high
Dhemaji 2 3 3 1 7 Medium
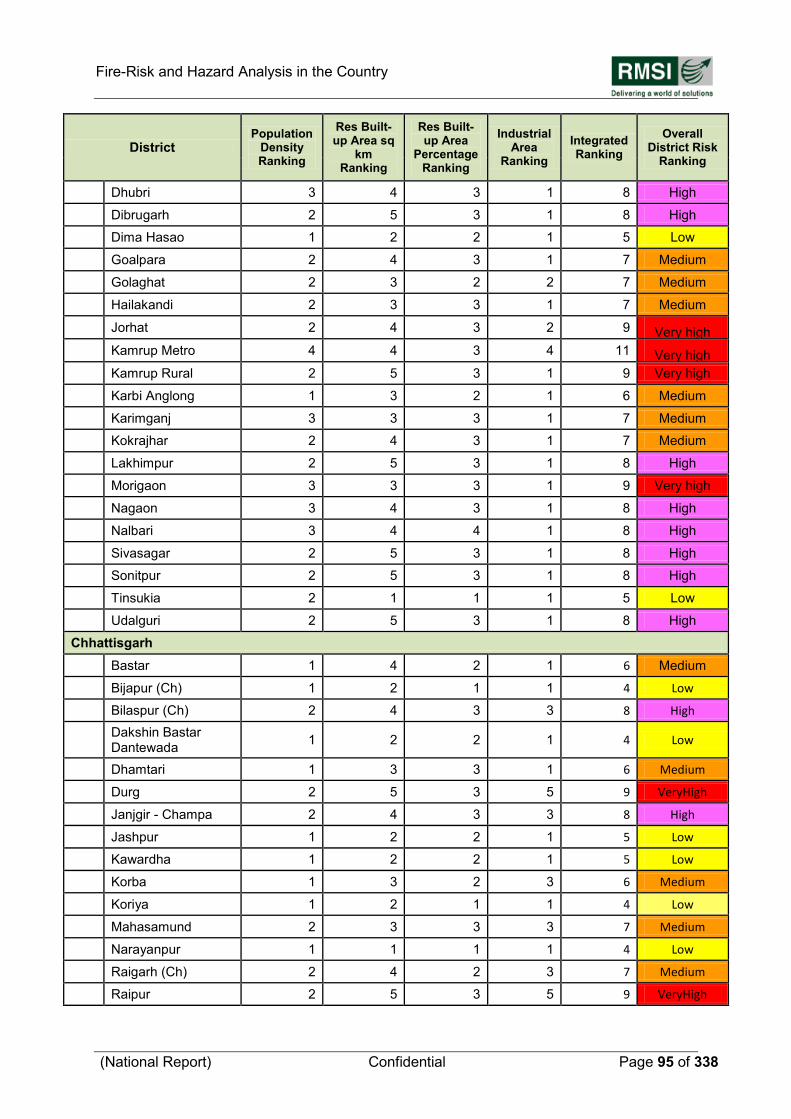
Fire-Risk and Hazard Analysis in the Country
(National Report) Confidential Page 95 of 338
District Population
Density Ranking
Res Built-up Area sq
km Ranking
Res Built-up Area
Percentage Ranking
Industrial Area
Ranking
Integrated Ranking
Overall District Risk
Ranking
Dhubri 3 4 3 1 8 High
Dibrugarh 2 5 3 1 8 High
Dima Hasao 1 2 2 1 5 Low
Goalpara 2 4 3 1 7 Medium
Golaghat 2 3 2 2 7 Medium
Hailakandi 2 3 3 1 7 Medium
Jorhat 2 4 3 2 9 Very high Kamrup Metro 4 4 3 4 11 Very high Kamrup Rural 2 5 3 1 9 Very high
Karbi Anglong 1 3 2 1 6 Medium
Karimganj 3 3 3 1 7 Medium
Kokrajhar 2 4 3 1 7 Medium
Lakhimpur 2 5 3 1 8 High
Morigaon 3 3 3 1 9 Very high
Nagaon 3 4 3 1 8 High
Nalbari 3 4 4 1 8 High
Sivasagar 2 5 3 1 8 High
Sonitpur 2 5 3 1 8 High
Tinsukia 2 1 1 1 5 Low
Udalguri 2 5 3 1 8 High
Chhattisgarh
Bastar 1 4 2 1 6 Medium
Bijapur (Ch) 1 2 1 1 4 Low
Bilaspur (Ch) 2 4 3 3 8 High
Dakshin Bastar Dantewada
1 2 2 1 4 Low
Dhamtari 1 3 3 1 6 Medium
Durg 2 5 3 5 9 VeryHigh
Janjgir - Champa 2 4 3 3 8 High
Jashpur 1 2 2 1 5 Low
Kawardha 1 2 2 1 5 Low
Korba 1 3 2 3 6 Medium
Koriya 1 2 1 1 4 Low
Mahasamund 2 3 3 3 7 Medium
Narayanpur 1 1 1 1 4 Low
Raigarh (Ch) 2 4 2 3 7 Medium
Raipur 2 5 3 5 9 VeryHigh
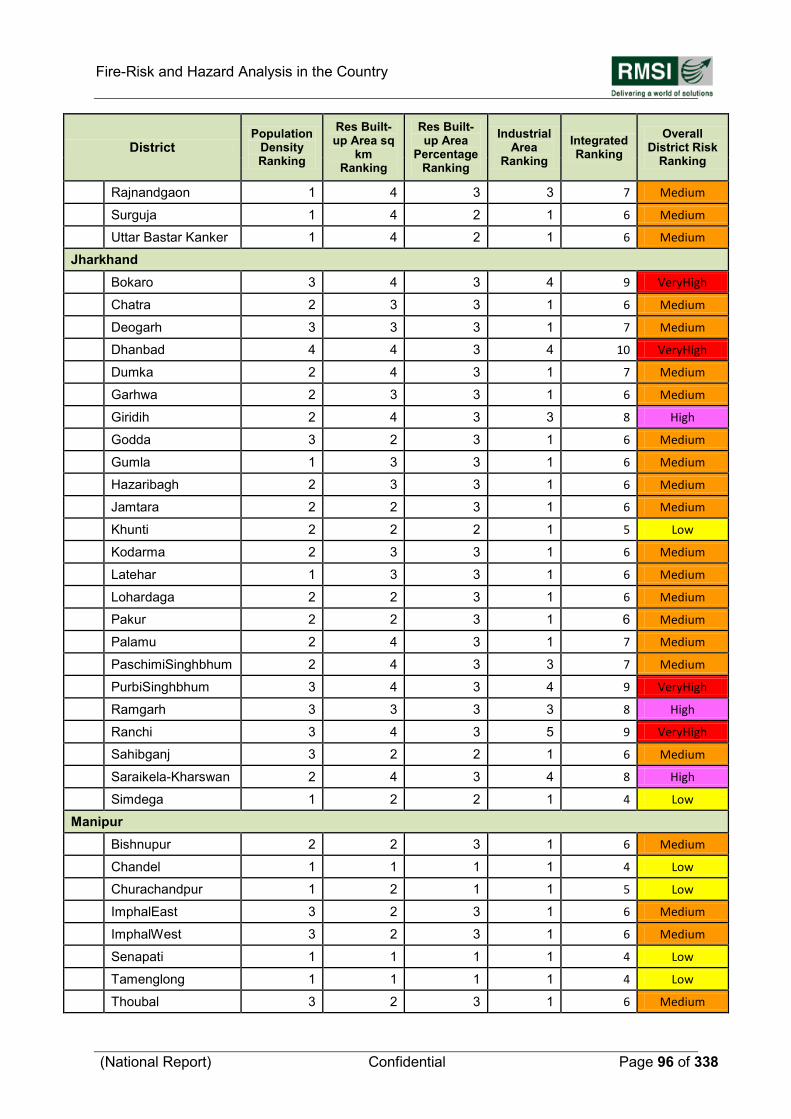
Fire-Risk and Hazard Analysis in the Country
(National Report) Confidential Page 96 of 338
District Population
Density Ranking
Res Built-up Area sq
km Ranking
Res Built-up Area
Percentage Ranking
Industrial Area
Ranking
Integrated Ranking
Overall District Risk
Ranking
Rajnandgaon 1 4 3 3 7 Medium
Surguja 1 4 2 1 6 Medium
Uttar Bastar Kanker 1 4 2 1 6 Medium
Jharkhand
Bokaro 3 4 3 4 9 VeryHigh
Chatra 2 3 3 1 6 Medium
Deogarh 3 3 3 1 7 Medium
Dhanbad 4 4 3 4 10 VeryHigh
Dumka 2 4 3 1 7 Medium
Garhwa 2 3 3 1 6 Medium
Giridih 2 4 3 3 8 High
Godda 3 2 3 1 6 Medium
Gumla 1 3 3 1 6 Medium
Hazaribagh 2 3 3 1 6 Medium
Jamtara 2 2 3 1 6 Medium
Khunti 2 2 2 1 5 Low
Kodarma 2 3 3 1 6 Medium
Latehar 1 3 3 1 6 Medium
Lohardaga 2 2 3 1 6 Medium
Pakur 2 2 3 1 6 Medium
Palamu 2 4 3 1 7 Medium
PaschimiSinghbhum 2 4 3 3 7 Medium
PurbiSinghbhum 3 4 3 4 9 VeryHigh
Ramgarh 3 3 3 3 8 High
Ranchi 3 4 3 5 9 VeryHigh
Sahibganj 3 2 2 1 6 Medium
Saraikela-Kharswan 2 4 3 4 8 High
Simdega 1 2 2 1 4 Low
Manipur
Bishnupur 2 2 3 1 6 Medium
Chandel 1 1 1 1 4 Low
Churachandpur 1 2 1 1 5 Low
ImphalEast 3 2 3 1 6 Medium
ImphalWest 3 2 3 1 6 Medium
Senapati 1 1 1 1 4 Low
Tamenglong 1 1 1 1 4 Low
Thoubal 3 2 3 1 6 Medium
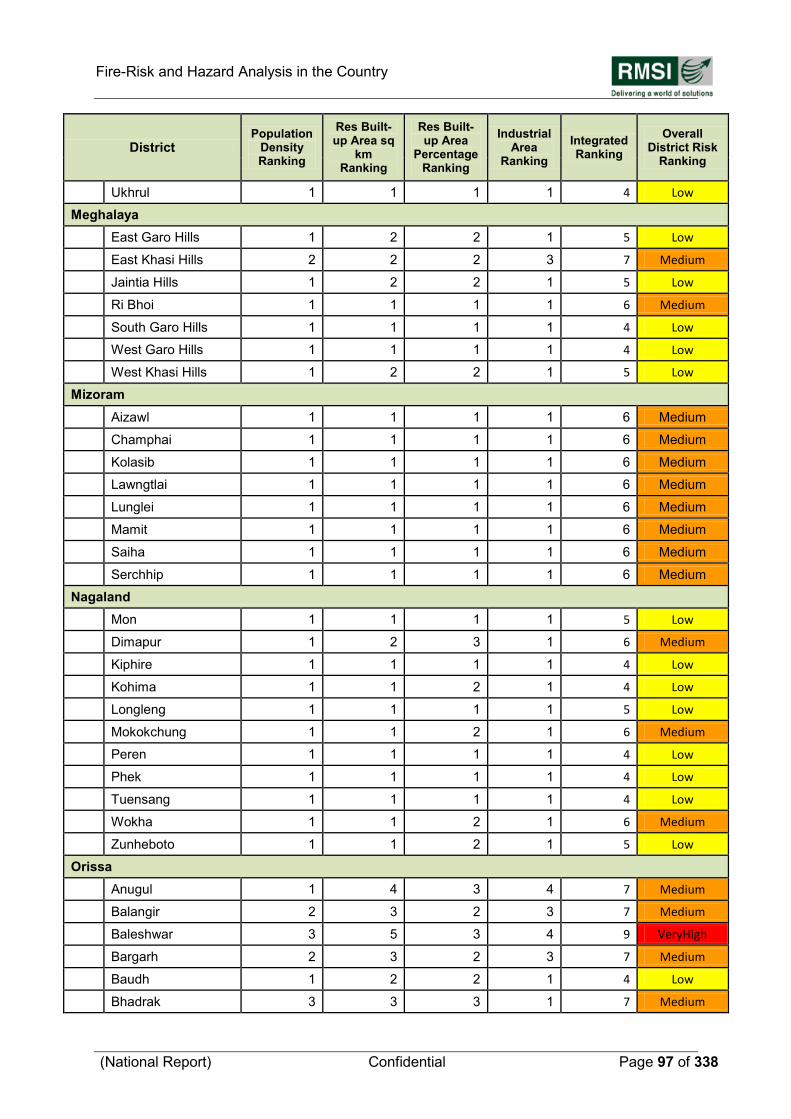
Fire-Risk and Hazard Analysis in the Country
(National Report) Confidential Page 97 of 338
District Population
Density Ranking
Res Built-up Area sq
km Ranking
Res Built-up Area
Percentage Ranking
Industrial Area
Ranking
Integrated Ranking
Overall District Risk
Ranking
Ukhrul 1 1 1 1 4 Low
Meghalaya
East Garo Hills 1 2 2 1 5 Low
East Khasi Hills 2 2 2 3 7 Medium
Jaintia Hills 1 2 2 1 5 Low
Ri Bhoi 1 1 1 1 6 Medium
South Garo Hills 1 1 1 1 4 Low
West Garo Hills 1 1 1 1 4 Low
West Khasi Hills 1 2 2 1 5 Low
Mizoram
Aizawl 1 1 1 1 6 Medium
Champhai 1 1 1 1 6 Medium
Kolasib 1 1 1 1 6 Medium
Lawngtlai 1 1 1 1 6 Medium
Lunglei 1 1 1 1 6 Medium
Mamit 1 1 1 1 6 Medium
Saiha 1 1 1 1 6 Medium
Serchhip 1 1 1 1 6 Medium
Nagaland
Mon 1 1 1 1 5 Low
Dimapur 1 2 3 1 6 Medium
Kiphire 1 1 1 1 4 Low
Kohima 1 1 2 1 4 Low
Longleng 1 1 1 1 5 Low
Mokokchung 1 1 2 1 6 Medium
Peren 1 1 1 1 4 Low
Phek 1 1 1 1 4 Low
Tuensang 1 1 1 1 4 Low
Wokha 1 1 2 1 6 Medium
Zunheboto 1 1 2 1 5 Low
Orissa
Anugul 1 4 3 4 7 Medium
Balangir 2 3 2 3 7 Medium
Baleshwar 3 5 3 4 9 VeryHigh
Bargarh 2 3 2 3 7 Medium
Baudh 1 2 2 1 4 Low
Bhadrak 3 3 3 1 7 Medium
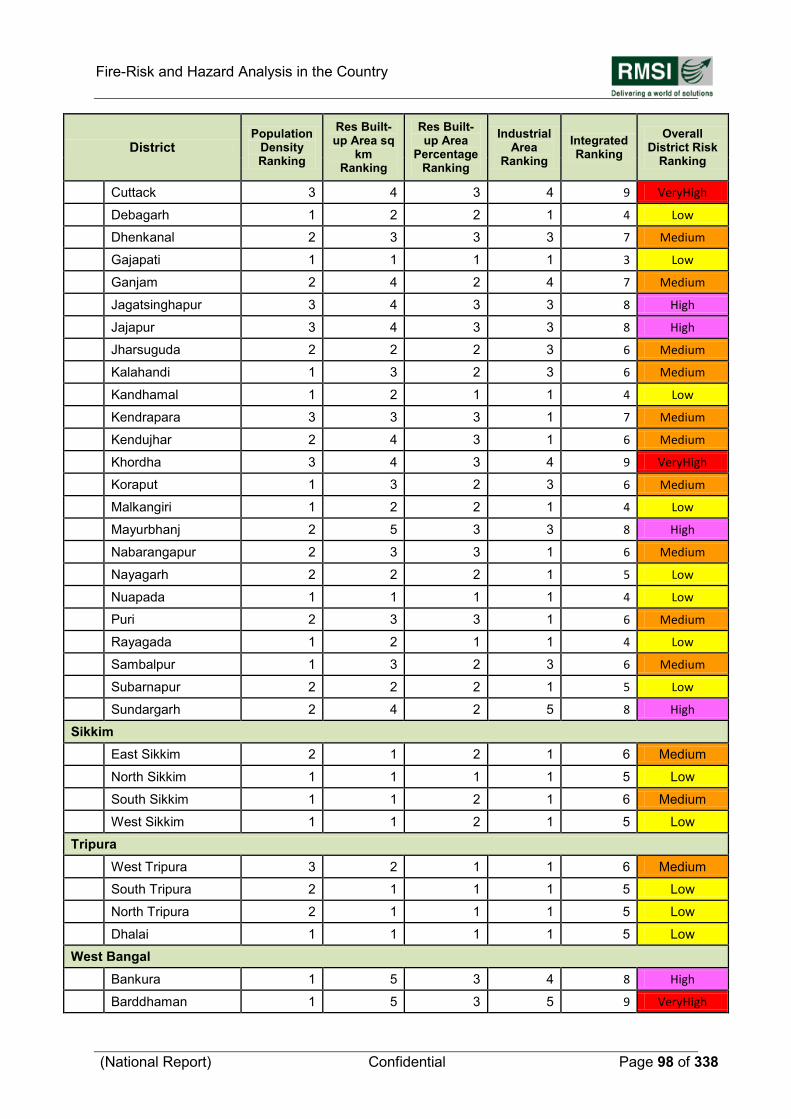
Fire-Risk and Hazard Analysis in the Country
(National Report) Confidential Page 98 of 338
District Population
Density Ranking
Res Built-up Area sq
km Ranking
Res Built-up Area
Percentage Ranking
Industrial Area
Ranking
Integrated Ranking
Overall District Risk
Ranking
Cuttack 3 4 3 4 9 VeryHigh
Debagarh 1 2 2 1 4 Low
Dhenkanal 2 3 3 3 7 Medium
Gajapati 1 1 1 1 3 Low
Ganjam 2 4 2 4 7 Medium
Jagatsinghapur 3 4 3 3 8 High
Jajapur 3 4 3 3 8 High
Jharsuguda 2 2 2 3 6 Medium
Kalahandi 1 3 2 3 6 Medium
Kandhamal 1 2 1 1 4 Low
Kendrapara 3 3 3 1 7 Medium
Kendujhar 2 4 3 1 6 Medium
Khordha 3 4 3 4 9 VeryHigh
Koraput 1 3 2 3 6 Medium
Malkangiri 1 2 2 1 4 Low
Mayurbhanj 2 5 3 3 8 High
Nabarangapur 2 3 3 1 6 Medium
Nayagarh 2 2 2 1 5 Low
Nuapada 1 1 1 1 4 Low
Puri 2 3 3 1 6 Medium
Rayagada 1 2 1 1 4 Low
Sambalpur 1 3 2 3 6 Medium
Subarnapur 2 2 2 1 5 Low
Sundargarh 2 4 2 5 8 High
Sikkim
East Sikkim 2 1 2 1 6 Medium
North Sikkim 1 1 1 1 5 Low
South Sikkim 1 1 2 1 6 Medium
West Sikkim 1 1 2 1 5 Low
Tripura
West Tripura 3 2 1 1 6 Medium
South Tripura 2 1 1 1 5 Low
North Tripura 2 1 1 1 5 Low
Dhalai 1 1 1 1 5 Low
West Bangal
Bankura 1 5 3 4 8 High
Barddhaman 1 5 3 5 9 VeryHigh
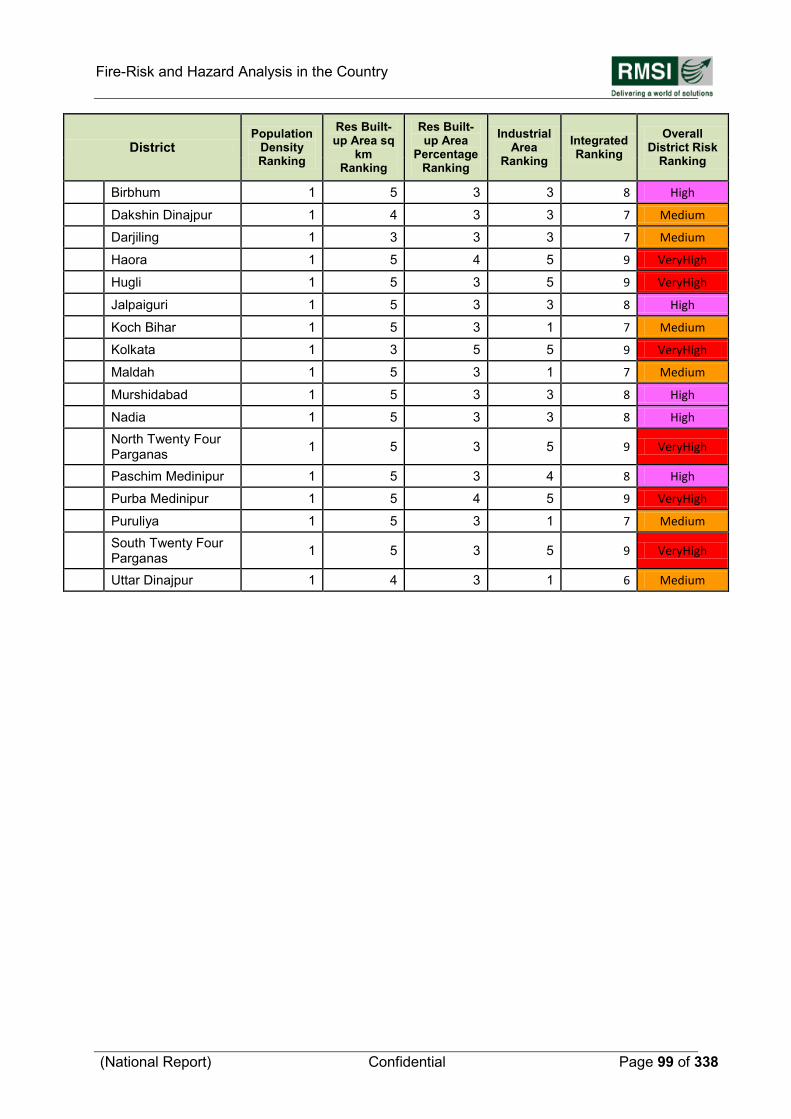
Fire-Risk and Hazard Analysis in the Country
(National Report) Confidential Page 99 of 338
District Population
Density Ranking
Res Built-up Area sq
km Ranking
Res Built-up Area
Percentage Ranking
Industrial Area
Ranking
Integrated Ranking
Overall District Risk
Ranking
Birbhum 1 5 3 3 8 High
Dakshin Dinajpur 1 4 3 3 7 Medium
Darjiling 1 3 3 3 7 Medium
Haora 1 5 4 5 9 VeryHigh
Hugli 1 5 3 5 9 VeryHigh
Jalpaiguri 1 5 3 3 8 High
Koch Bihar 1 5 3 1 7 Medium
Kolkata 1 3 5 5 9 VeryHigh
Maldah 1 5 3 1 7 Medium
Murshidabad 1 5 3 3 8 High
Nadia 1 5 3 3 8 High
North Twenty Four Parganas
1 5 3 5 9 VeryHigh
Paschim Medinipur 1 5 3 4 8 High
Purba Medinipur 1 5 4 5 9 VeryHigh
Puruliya 1 5 3 1 7 Medium
South Twenty Four Parganas
1 5 3 5 9 VeryHigh
Uttar Dinajpur 1 4 3 1 6 Medium
Fire-Risk and Hazard Analysis in the Country
(National Report) Confidential Page 100 of 338
4 Field Surveys of Fire Stations for Data Collection
At present, there is a lack of a comprehensive centralized database on the distribution of fire service infrastructure, and the stock of existing fire fighting vehicles, manpower and specialized equipments, their types, and their quantities. Most of the information is either disaggregated or not updated. This information is required for undertaking the gap analysis, future planning, and improvement of institutional capacity, financial planning, and creating a roadmap for the next 10 years for revamping the fire services in the country. To have first-hand information on the distribution of the fire service stations across the country, trained human resources, infrastructure availability and their status, RMSI project team has carried out surveys of Fire Stations and collected data from Headquarters of all the States under the jurisdiction of DG, NDRF & CD (Fire) in the country. In addition to the survey of Fire Stations, the team has also collected the location (latitude, longitude) of Fire Stations using GPS. The geographical coordinate information is used for plotting all the Fire Station locations on the map to perform GIS based spatial analysis. This is required for the analysis of distribution of Fire Stations and gap analysis on fire-infrastructure, based on risk-category, response time, and population.
4.1 Field-Survey of individual Fire Station and collection of Headquarter Data
RMSI project team has designed a comprehensive “Fire Headquarter Data Collection Form” (Annexure-1) and individual “Fire Station Survey Form” (Annexure-2) to collect all the required information for each State/UT in the country.
The information includes but is not limited to:
i. Location (latitude, longitude) and location description of the Fire Station
ii. Name of fire-station in-charge and his contact details
iii. Fire Vehicles type, numbers, their model, year of manufacture/induction at the Fire Station, and general condition of fire vehicles
iv. Specialized firefighting equipment, their type, and quantity
v. Road access and connectivity to vulnerable areas
vi. Infrastructure facilities (accommodation) of fire-personnel and their distance from Fire Stations
vii. Duty patterns
viii. Staff details at different levels
ix. Water availability etc.
The Fire Headquarter Data Collection Form and individual Fire Station Survey Form have been designed in such a way as to extract most of the common information including communication, human resources, specialized equipments, fire-statistics etc. applicable for the entire State, in a quantitative way, which might help the analysis at a later stage. In addition to infrastructure information, RMSI also attempted to collect information/indicators related to vulnerability and risk through indirect questions like:
i. Year wise information on the number of events each unit had attended during the last 5 years and losses caused by fire events both in terms of assets and life.
Fire-Risk and Hazard Analysis in the Country
(National Report) Confidential Page 101 of 338
ii. Few questions on the general perception of the fire officer and in charge of the unit on various types of risks in the Fire Station jurisdiction.
Analysis on the information of events over time and the loss can provide an understanding of the vulnerability and risk as well as the susceptibility trend over the year. The fire officer would be the key person who faces actual needs on the ground as well as in using the infrastructure for the service.
During the field survey in the pilot study, the RMSI team members have interacted with Fire Station In-charges to gather the required information. In addition to discussions with the Fire Station in charge, other key department officials have been contacted to know their perception about the fire risks and the difficulties that fire department is facing. The project team is ensuring that the Headquarter Data Collection Forms and Individual Fire Station Survey Forms are comprehensive and contain all information required for this assignment.
The field data collected by the survey team have undergone through quality checks and the project team has created a database with all collected information. The database has been designed in such a way that the data can be used for spatial and non-spatial analysis. All the Fire Stations have a unique code as identifier.
4.2 Stakeholder Analysis
Apart from the quantitative data collection on the distribution of fire service infrastructure, stock of the existing equipments and their quality, the RMSI team also interacted with some of the key fire officials and senior members in DGCD, MHA and NDRF. The focus of such discussions was more on institutional aspects (issues in the service delivery and suggestions), capacity, and future requirements. As these interactions are mostly with senior personnel of fire department, the focus has been to derive a broader picture in terms of requirements, investment, and institutional capacity building. This information is being compiled and summarized under various heads, for instance, requirement, investment, institutional capacity building, etc. RMSI key experts have been analyzing the diverse opinion of various fire officials and are providing their recommendations.
Any significant issue that was observed during this process, in terms of issues in the process of the delivery/ bottlenecks in smooth operation were highlighted along with RMSI‟s suggested solution.
Finally, RMSI team held discussions with officials of the DG NDRF & CD and members of project review to present the summary of observations for discussions in several meetings.
Fire-Risk and Hazard Analysis in the Country
(National Report) Confidential Page 102 of 338
5 Development of Fire Decision Support System (FDSS)
This chapter discusses the modeling software solution named FDSS (Fire Decision Support System), developed by RMSI as part of the deliverables. FDSS is a dynamic web based application, aimed at supporting decision makers take optimal decisions on complex tasks, such as resource prepositioning, gap analysis, prioritization, and resource optimization along with the day-to-day tasks. The most important aspect of FDSS is that it enables the apex fire management authority to access the information of all the Fire Services in the entire country on a single platform.
5.1 Salient Features
Following is a brief description of FDSS platform. The platform is built on a framework that is State of the art and is the most suitable solution for users‟ needs.
The salient features of the FDSS platform include:
Web based application built using .NET Framework 3.5 utilizing the GIS capabilities of an open source GIS Platform.
Multi-tier system architecture that follows the Object Oriented Programming model with the following objectives:
- Loose coupling between the various tiers – presentation, business and data
- Ease of development and deployment
Ability to navigate, query and render the spatial data
Exposure view, query and update capabilities that will help the user to keep the information in the system up-to-date
Ability to view and query the outputs in a tabular format
A powerful reporting engine that enables a set of pre-formatted reports that provide various views of the outputs from the model
A thematic map generator that uses the underlying GIS platform to depict the outputs from the model as pre-designed thematic maps.
5.2 High Level Design
FDSS has a multi-tier architecture to allow for modularity and scalability. The architecture follows the Object Oriented Programming model. The various tiers of the system are as shown in Figure 5-1.
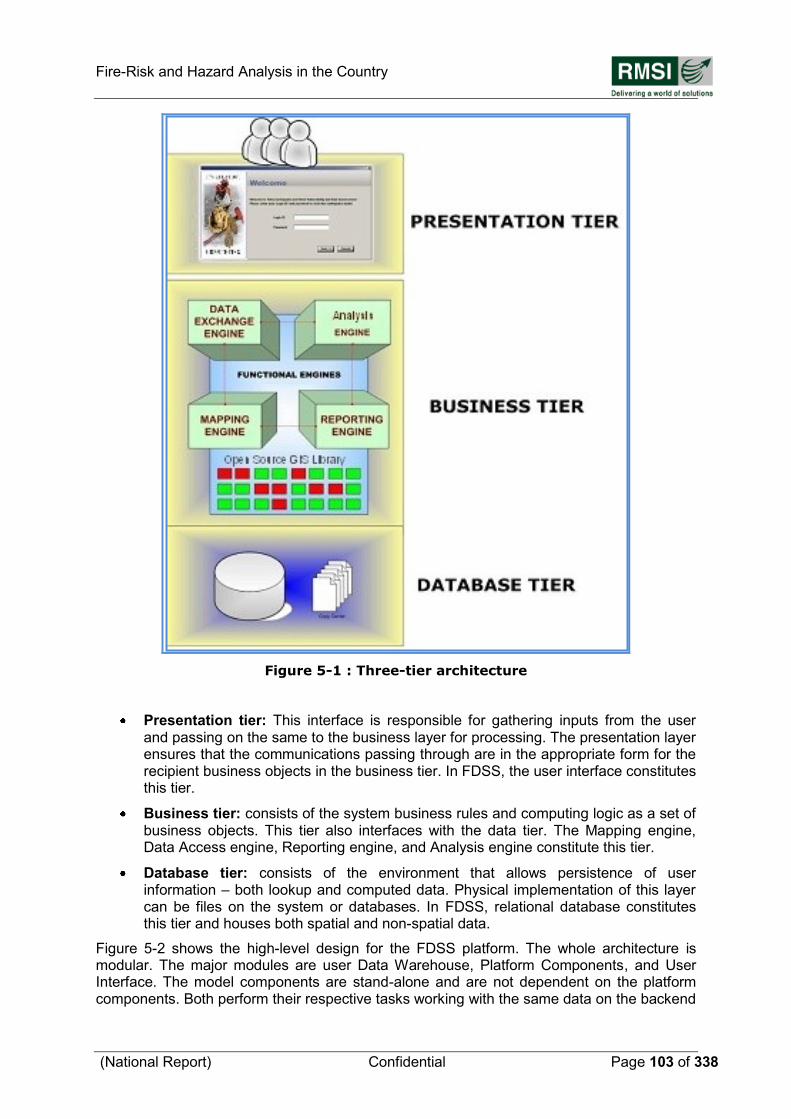
Fire-Risk and Hazard Analysis in the Country
(National Report) Confidential Page 103 of 338
Figure 5-1 : Three-tier architecture
Presentation tier: This interface is responsible for gathering inputs from the user and passing on the same to the business layer for processing. The presentation layer ensures that the communications passing through are in the appropriate form for the recipient business objects in the business tier. In FDSS, the user interface constitutes this tier.
Business tier: consists of the system business rules and computing logic as a set of business objects. This tier also interfaces with the data tier. The Mapping engine, Data Access engine, Reporting engine, and Analysis engine constitute this tier.
Database tier: consists of the environment that allows persistence of user information – both lookup and computed data. Physical implementation of this layer can be files on the system or databases. In FDSS, relational database constitutes this tier and houses both spatial and non-spatial data.
Figure 5-2 shows the high-level design for the FDSS platform. The whole architecture is modular. The major modules are user Data Warehouse, Platform Components, and User Interface. The model components are stand-alone and are not dependent on the platform components. Both perform their respective tasks working with the same data on the backend
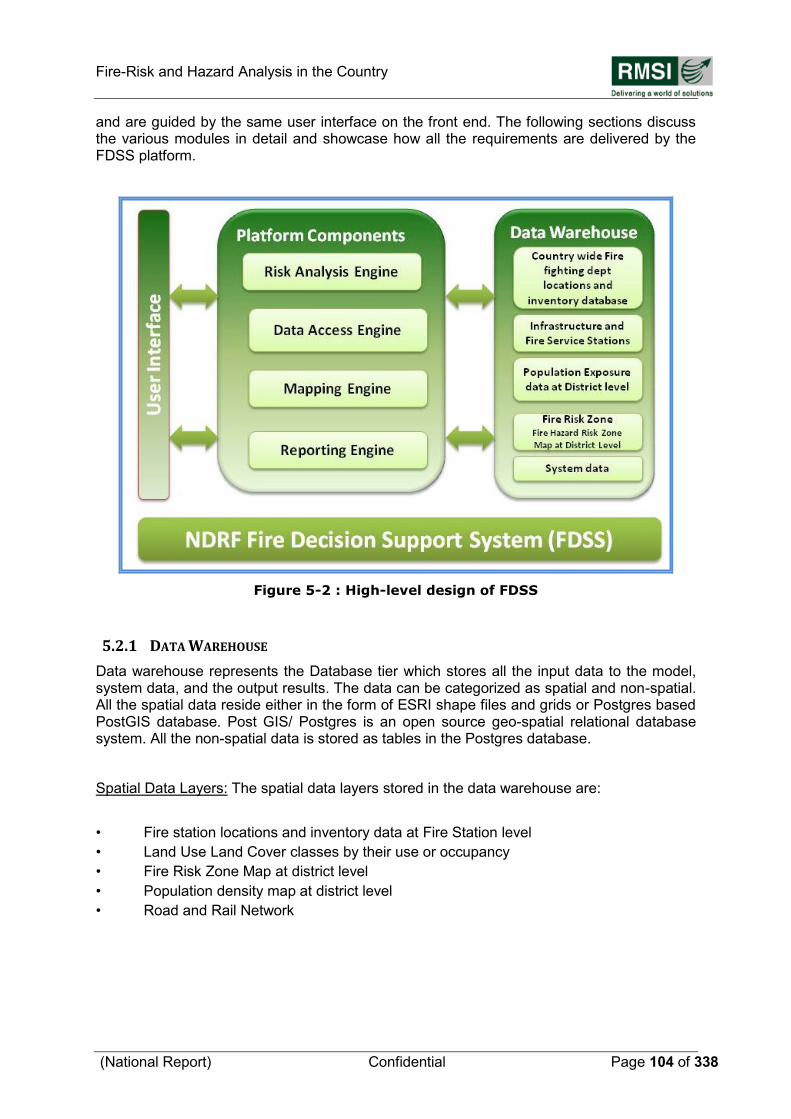
Fire-Risk and Hazard Analysis in the Country
(National Report) Confidential Page 104 of 338
and are guided by the same user interface on the front end. The following sections discuss the various modules in detail and showcase how all the requirements are delivered by the FDSS platform.
Figure 5-2 : High-level design of FDSS
5.2.1 DATA WAREHOUSE
Data warehouse represents the Database tier which stores all the input data to the model, system data, and the output results. The data can be categorized as spatial and non-spatial. All the spatial data reside either in the form of ESRI shape files and grids or Postgres based PostGIS database. Post GIS/ Postgres is an open source geo-spatial relational database system. All the non-spatial data is stored as tables in the Postgres database.
Spatial Data Layers: The spatial data layers stored in the data warehouse are:
• Fire station locations and inventory data at Fire Station level
• Land Use Land Cover classes by their use or occupancy
• Fire Risk Zone Map at district level
• Population density map at district level
• Road and Rail Network
Fire-Risk and Hazard Analysis in the Country
(National Report) Confidential Page 105 of 338
5.3 Platform Components
Platform components represent the Application Tier. These components focus on the application logic for all data access, mapping and reporting. These are generic components that operate directly on the data warehouse and present the data in different views to the user.
Data Access Engine: Data Access Engine provides access to all non-spatial data that are stored in the Data Warehouse. This includes data viewing and editing capabilities. This allows for bulk building inventory updates and extraction of results so the outcome of the analysis can be reused for other applications.
Mapping Engine: Mapping engine provides all mapping capabilities to the application. The major component in mapping engine is the Map Viewer that loads the spatial data and displays the map and provides all basic map navigation functions like Zoom, Pan, Identify tool and calculate distance. This engine also provides spatial querying capabilities like buffer query and point in polygon query. In addition to this, the mapping engine also provides capabilities for defining symbology for various map layers including themes based on a range of values and unique values. All the layers are loaded with a predefined symbology. The mapping engine provides the ability to view the hazard, damage and loss on maps using predefined themes based on a range of values.
Reporting Engine: Reporting engine generates all the reports. FDSS provides a set of preformatted predefined reports that can be printed or exported into Excel format. This provides the ability to format the data into tables, generate summations, and create graphs. The following reports are generated at district and State levels by the reporting engine:
- Infrastructure Report
- Gap Analysis Report
- Status report for individual Fire Stations, district and State levels for and other reports required for decision making
The FDSS provides functionality to run GAP Analysis at two levels:
- State
- District
This system provides the option for running gap analysis for firefighting and rescue vehicles, equipment, manpower and building infrastructure. User can also opt to get output based on all the analysis parameters available.
User Interface: User Interface (Figure 5-3) comprises of the Presentation tier. This is the part of the FDSS platform that the user interacts with. User Interface for FDSS can be categorized into two types:
1) System Administration Interface
2) Application Interface
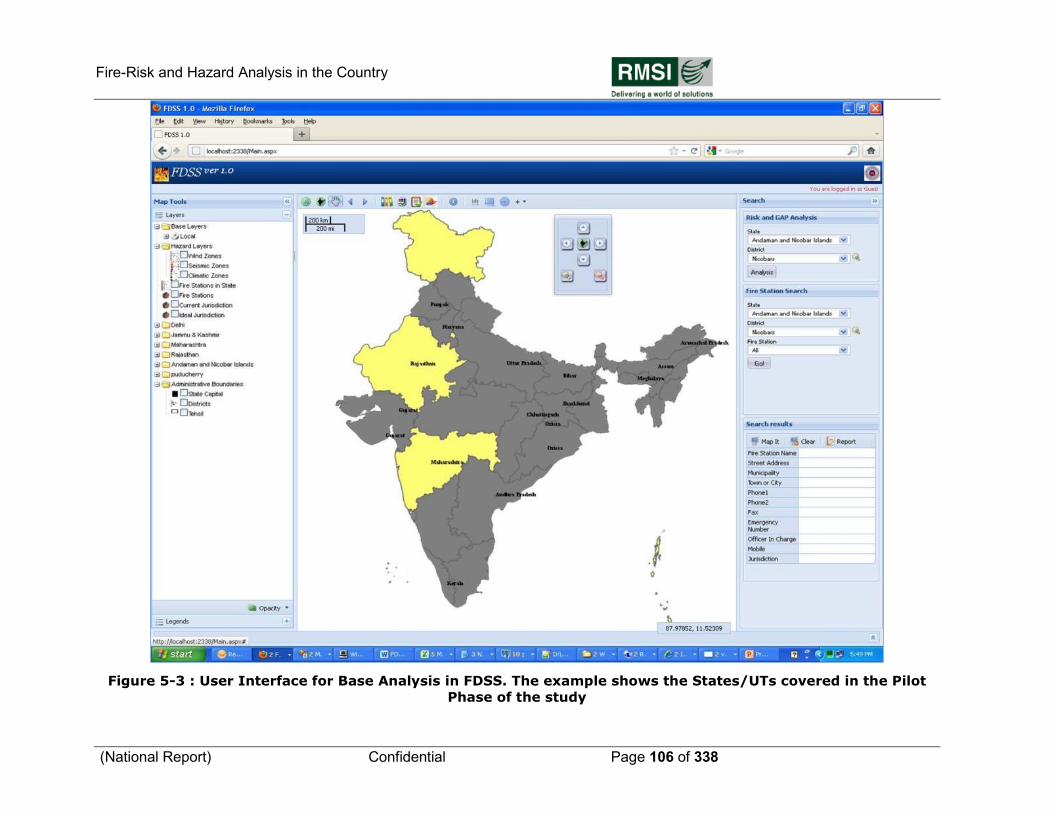
Fire-Risk and Hazard Analysis in the Country
(National Report) Confidential Page 106 of 338
Figure 5-3 : User Interface for Base Analysis in FDSS. The example shows the States/UTs covered in the Pilot
Phase of the study
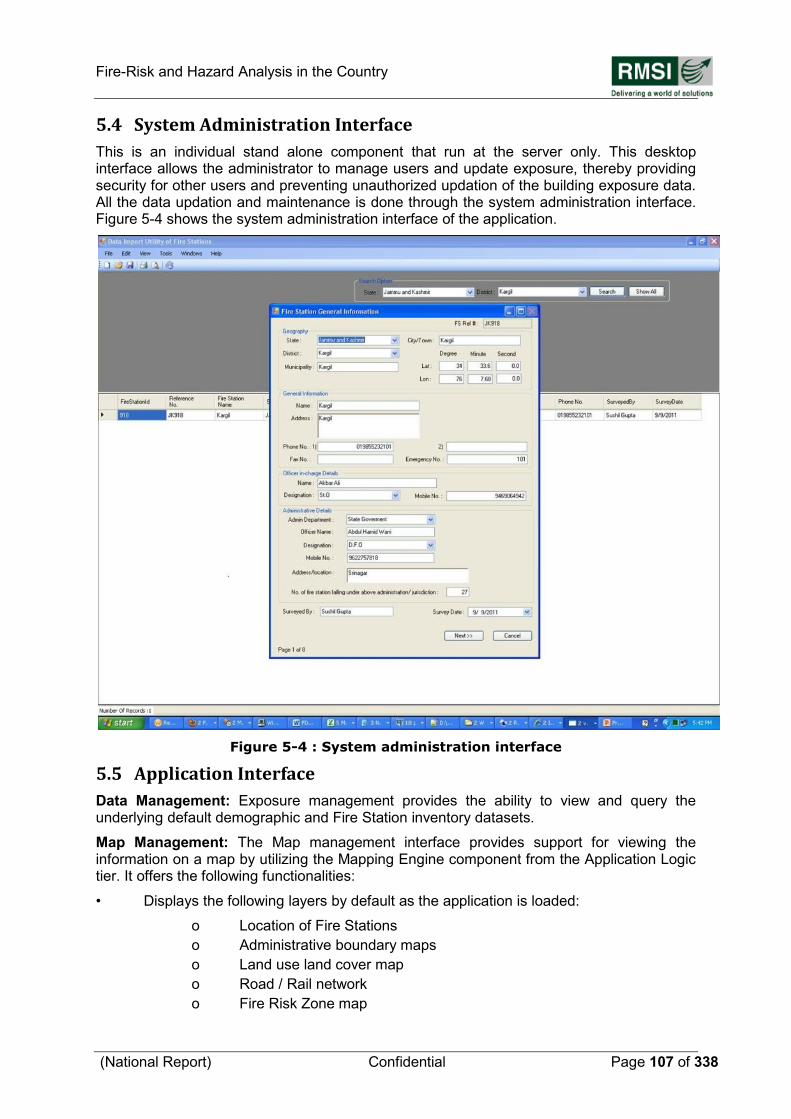
Fire-Risk and Hazard Analysis in the Country
(National Report) Confidential Page 107 of 338
5.4 System Administration Interface
This is an individual stand alone component that run at the server only. This desktop interface allows the administrator to manage users and update exposure, thereby providing security for other users and preventing unauthorized updation of the building exposure data. All the data updation and maintenance is done through the system administration interface. Figure 5-4 shows the system administration interface of the application.
Figure 5-4 : System administration interface
5.5 Application Interface
Data Management: Exposure management provides the ability to view and query the underlying default demographic and Fire Station inventory datasets.
Map Management: The Map management interface provides support for viewing the information on a map by utilizing the Mapping Engine component from the Application Logic tier. It offers the following functionalities:
• Displays the following layers by default as the application is loaded:
o Location of Fire Stations
o Administrative boundary maps
o Land use land cover map
o Road / Rail network
o Fire Risk Zone map
Fire-Risk and Hazard Analysis in the Country
(National Report) Confidential Page 108 of 338
• Basic GIS tools like zoom, pan, zoom to selection, zoom to entire layer, location attribute information etc.
• Creates following maps based on analysis results:
o Gap Analysis Map – showing gaps in existing resource, equipments and fire tenders (Figure 5-4)
• Adds custom layers to the layer manager and performs visual overlays
• Views attributes information, queries and analyzes the spatial data layers
• Enables users to view thematic maps based on defined attribute values.
Analysis Management: The analysis management interface provides the ability to execute the analysis. It allows the user the following options:
• View the fire risk analysis for any district
• Gap analysis at State and district levels
Results Management: This entails generating displays of results in pre-defined formats based on user selection. Following are the various types of result views that will be available in FDSS.
• Reports providing predefined content in predefined format. This utilizes the Reporting Engine Component to display various reports. Following is a list of various reports:
- Fire Station Profile report
- Gap Analysis report
5.5.1 TECHNOLOGY
The physical servers also represent the logical needs elaboration servers and the physical clients also represent the logical clients.
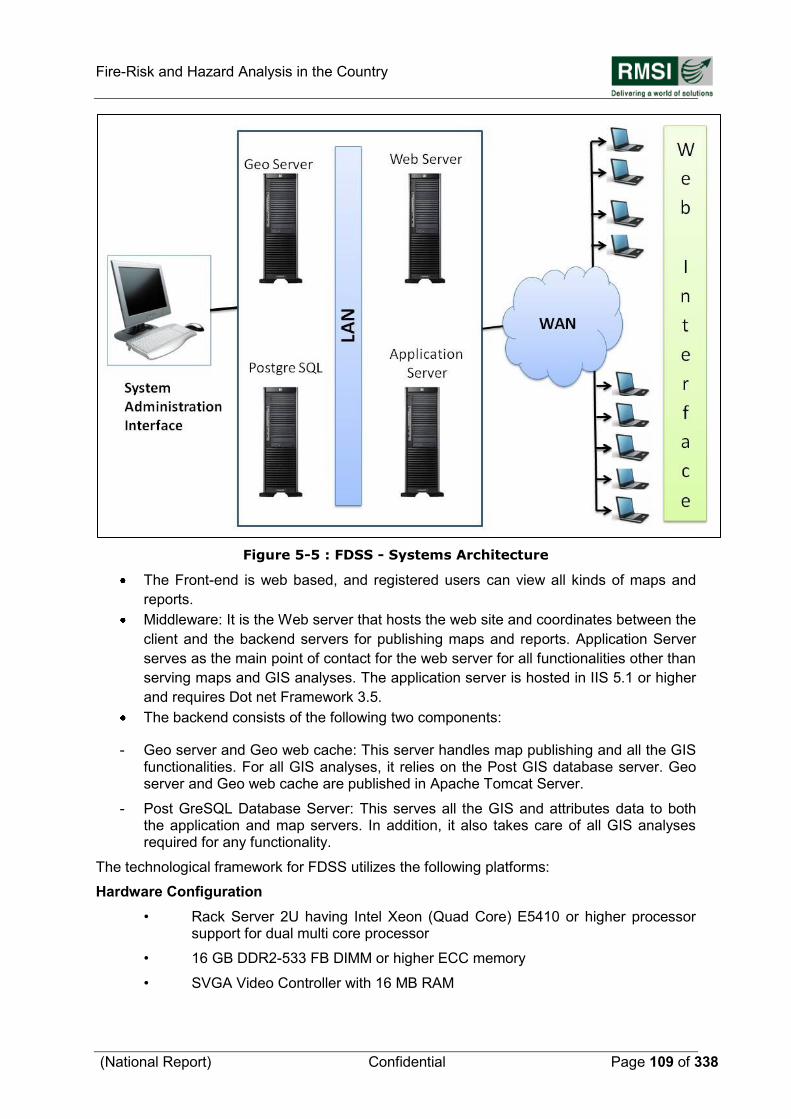
Fire-Risk and Hazard Analysis in the Country
(National Report) Confidential Page 109 of 338
Figure 5-5 : FDSS - Systems Architecture
The Front-end is web based, and registered users can view all kinds of maps and
reports.
Middleware: It is the Web server that hosts the web site and coordinates between the
client and the backend servers for publishing maps and reports. Application Server
serves as the main point of contact for the web server for all functionalities other than
serving maps and GIS analyses. The application server is hosted in IIS 5.1 or higher
and requires Dot net Framework 3.5.
The backend consists of the following two components:
Geo server and Geo web cache: This server handles map publishing and all the GIS functionalities. For all GIS analyses, it relies on the Post GIS database server. Geo server and Geo web cache are published in Apache Tomcat Server.
Post GreSQL Database Server: This serves all the GIS and attributes data to both the application and map servers. In addition, it also takes care of all GIS analyses required for any functionality.
The technological framework for FDSS utilizes the following platforms:
Hardware Configuration
• Rack Server 2U having Intel Xeon (Quad Core) E5410 or higher processor support for dual multi core processor
• 16 GB DDR2-533 FB DIMM or higher ECC memory
• SVGA Video Controller with 16 MB RAM
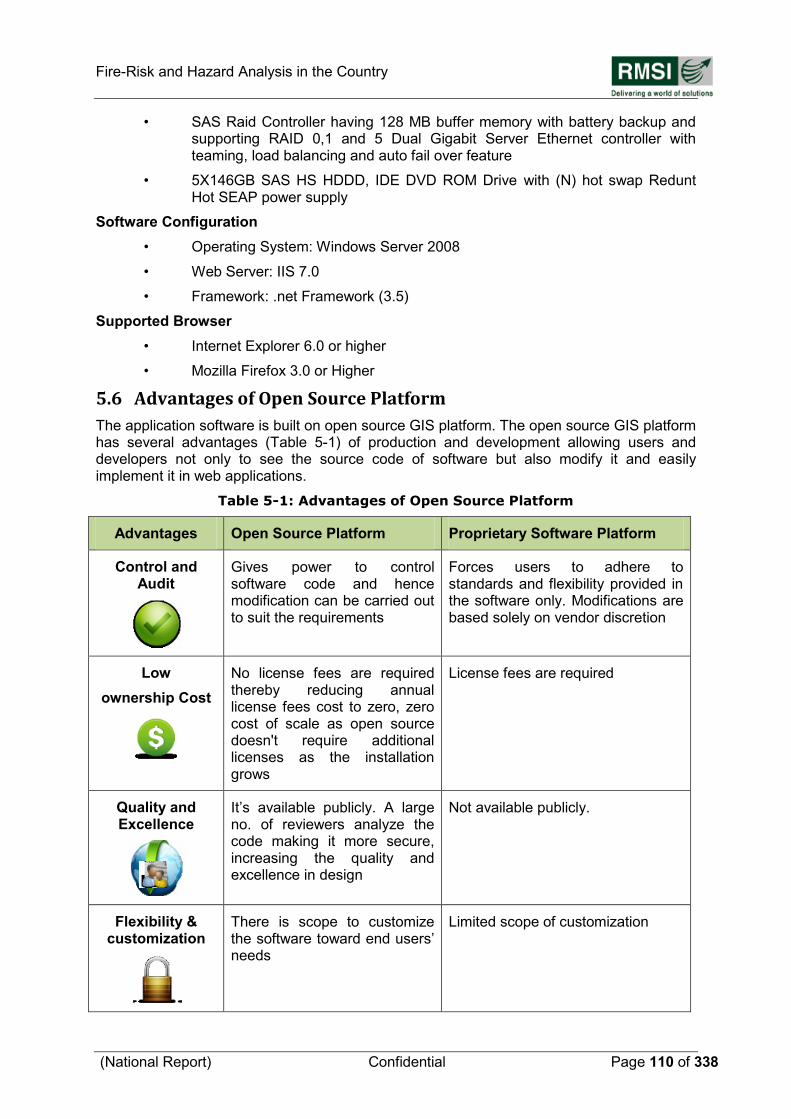
Fire-Risk and Hazard Analysis in the Country
(National Report) Confidential Page 110 of 338
• SAS Raid Controller having 128 MB buffer memory with battery backup and supporting RAID 0,1 and 5 Dual Gigabit Server Ethernet controller with teaming, load balancing and auto fail over feature
• 5X146GB SAS HS HDDD, IDE DVD ROM Drive with (N) hot swap Redunt Hot SEAP power supply
Software Configuration
• Operating System: Windows Server 2008
• Web Server: IIS 7.0
• Framework: .net Framework (3.5)
Supported Browser
• Internet Explorer 6.0 or higher
• Mozilla Firefox 3.0 or Higher
5.6 Advantages of Open Source Platform
The application software is built on open source GIS platform. The open source GIS platform has several advantages (Table 5-1) of production and development allowing users and developers not only to see the source code of software but also modify it and easily implement it in web applications.
Table 5-1: Advantages of Open Source Platform
Advantages Open Source Platform Proprietary Software Platform
Control and Audit
Gives power to control software code and hence modification can be carried out to suit the requirements
Forces users to adhere to standards and flexibility provided in the software only. Modifications are based solely on vendor discretion
Low
ownership Cost
No license fees are required thereby reducing annual license fees cost to zero, zero cost of scale as open source doesn't require additional licenses as the installation grows
License fees are required
Quality and Excellence
It‟s available publicly. A large no. of reviewers analyze the code making it more secure, increasing the quality and excellence in design
Not available publicly.
Flexibility & customization
There is scope to customize the software toward end users‟ needs
Limited scope of customization
Fire-Risk and Hazard Analysis in the Country
(National Report) Confidential Page 111 of 338
5.7 Identification of Gaps in Infrastructure, Up-gradation and Modernization Requirement
Gap identification has been carried out using the information collected as part of the field surveys and stakeholder interviews, distribution of Fire Stations and risk analysis. The gaps in infrastructure can be in terms of number of Fire Stations in both served and un-served areas, availability of fire vehicles, fire-personnel and building infrastructure in the existing Fire Stations. Through the input of field survey work, risk categorization, and infrastructure requirement norms, gap analysis is performed in FDSS at the district and State level.
Gaps will primarily address the following three areas:
5.7.1 INFRASTRUCTURE GAPS
This covers served/ un-served areas, unsuitable locations of Fire Stations, etc. This gap analysis is being conducted by using suitably modified SFAC Norms, population density, existing Fire Station distribution and other infrastructural information obtained as part of the field surveys. In addition, the risk information has been used to reflect certain aspects of risk that affect the infrastructure. The outcomes of this analysis are information and maps that show the infrastructure deficiency at district and State levels.
5.7.2 EQUIPMENT GAPS
The objective of this analysis is to identify gaps in equipments existing at various Fire Stations against the population they serve, the hazards that the jurisdiction they serve is exposed to, trained map-power available, average response time to a fire call, etc. This will result in the identification of new types of equipments required, phasing out of old equipment and their replacement, and equipment effectiveness analysis.
5.7.3 CAPACITY GAPS
This would cover the shortage of fire fighting personnel and additional training requirements for existing teams, etc. This analysis is conducted using infrastructure analysis information, equipment analysis information, population density, SFAC norms and risk information as the primary datasets, and average response time. The primary outcomes would include the gap in capacity in terms of number of additional fire fighting personnel required, and the additional requirement of trainings on equipments, tools, technologies and emergency management approaches.
Similarly, district/State/ country level reports on up gradation and modernization requirements of existing Fire Stations including MIS, GIS, and communication systems will be generated by comparison of availability of existing resources and up gradation and modernization requirements through gap analysis.
The outcomes of the above analyses has been integrated to the Fire Decision Support System (FDSS), so similar analyses at a later stage may also be performed by changing the underlying datasets as things change on the ground.
5.8 Preparation of detail cost estimates with Capital and O&M Investment Plan
Once gaps in terms of number of Fire Stations, fire-personnel, infrastructure (building, vehicles and equipments), up gradation and modernization requirements of existing Fire Stations including MIS, GIS, and communication systems are finalized, the investment and financial analysis is performed in FDSS. This involves reviewing the outcomes of the gap analysis, prioritizing them by district and estimating the cost of investment.
Fire-Risk and Hazard Analysis in the Country
(National Report) Confidential Page 112 of 338
The investment costs are estimated separately for infrastructure development and improvements, capacity building, and equipment procurement and modernization. This is where the extensive experience of RMSI team in fire department operations, equipment procurement, and training needs assessment and planning has been applied. For more detailed information regarding the specification of firefighting and rescue vehicles and equipment, please refer to the Vehicle and Equipment Specification report submitted by RMSI.
The outcomes of this process are a detailed investment plan that shows year-by-year investments prioritized by district, gaps and associated benefits. The financial plan addresses investment for next 10-years in a year-by-year phased manner approach. The financial tool has been integrated to the FDSS, which helps in generating various reports related to detailed cost estimates with Capital and O&M Investment Plan for next 10 years, and to prioritize investments. This is based on the current cost estimate and technological enhancement. However, the tool have flexibility to change/modify the cost of various infrastructural elements and re-regenerate reports for prioritization of the investment plan.
Few assumptions has been made while preparing the detailed roadmap for investment plan for the next 10 years. For example,
Existing gaps in terms of manpower, fire fighting and rescue vehicles, and equipments will be filled up in first two years
40% gaps in Fire Station buildings will be filled up in first two year, and subsequently 10% gap in each year
The average annual rate on expenses on fire vehicle maintenance, petrol, diesel & lubricants, and office expenses, training, uniform will remain the same as that in F.Y. 2011-12, however, on top of that an annual inflation factor of 8% (fire vehicle maintenance, petrol, diesel & lubricants), 5% (office expenses, training, uniform) has been added
Building infrastructure cost will increase on an average by about 11% per year and building maintenance cost by about 1% of total building construction cost as in 2010-11
The salary costs at each level have been estimated from the present pay scales for each level and an annual growth of 12% has been added for subsequent years
5.9 Institutional Assessment and Capacity Building Plan
The National Fire Service College (NFSC), Nagpur and other State Fire Training Centres across the country are key institutions involved in improving the level of fire personnel knowledge and their overall capabilities to face the challenges of fire fighting. The RMSI team surveyed NFSC Nagpur and Pilot State/UTs fire training centres across the country and studied their programs to delineate their role and relationship for improvement in training facilities for fire personnel in the country.
Human resource bottlenecks at various levels of training fire officials (such as refresher‟s training, breathing training in smoke, industrial training, specialized training to handle high-rise fires, etc.) to different cadre of officials, issue of language in training; physical fitness; duty patterns (8 hours and 12 hours versus 24 hours); availability of accommodation in fire-stations; pay-scale structures, and promotion progression etc. are studied in detail and recommendations were made for their implementation.
There are many ways of discovering funding avenues, such as introduction of Fire Tax, training programs to private sectors, tapping MP Local Area Development (MPLAD) funds
Fire-Risk and Hazard Analysis in the Country
(National Report) Confidential Page 113 of 338
etc. These issues are important since fire personnel need to be dedicated and motivated all times. For similar reasons, improvements in governance structure are imperative. Lack of fire-personnel is another challenge. For this, revamping training facilities in the country is another important aspect in any capacity building plan.
Computerization of fire and emergency services and strict audit by a central authority can be one mechanism to ensure a good finance mechanism for capital expenditures and operation and maintenance. Training of fire personnel in the use of computers is another aspect, which is very important from the implementation perspective.
It may be noted that RMSI team is aware of past studies on the subject such as the Recommendations by the SFAC and has kept these studies in mind while making recommendations for the Capacity Building Plan.
RMSI team has also prepared a detailed Roadmap for the Capacity Building Plan at country level for its implementation in next 10 years. For more detailed information, please refer to the National Level Training report as well as individual State/ UT report submitted by RMSI.
Fire-Risk and Hazard Analysis in the Country
(National Report) Confidential Page 114 of 338
6 International and National Norms
6.1 Literature Survey
Under this task, standards and practices that are being followed in various developed countries for fire safety norms, such as in USA -NFPA (1211, 1710, 1720), Japan, UK, and Germany, are being studied and compared.
As per literature survey and personnel communications with fire officials in different countries, international norms regarding response time (defined as en route time taken by the fire fighting vehicle from the Fire Station to fire emergency scene, and turnout time is not included in it) differs from country to country.
6.2 Response Time
The practices regarding response time of fire tenders/ambulances in different countries are as follows:
6.2.1 GERMANY
The response from Germany (27.10.2011) is as follows:
“1. Concerning the response time in Berlin. On the basis of an agreement between CFO and the Ministry of Interior the options are:
Calls in Risk Areas class A (higher risks) - 15 fire-fighters must arrive in max.15 minutes at 90% of all calls and
Calls in Risk Areas class B (lower risks) - 15 fire-fighters must arrive in max.15 minutes at 50% of all calls.
The standard turn out time of a fire truck is 60 seconds for professionals, as for volunteers the turn out time should not be higher 4 minutes, otherwise the Control Centre will automatically send a professional fire truck.
Ambulance cars must be at the scene within 8 minutes in 75% of all calls.”
2. Temperature problem - heating devices in the garage (close the doors) and additional a electrical wire is going to the motor section of the vehicle for saving working temperature of the trucks.”
From the above, it may be inferred that in Germany, areas have been divided only into two Risk Categories (higher, lower) and response time in urban areas varies from 8 - 15 minutes. As far as turnout time is concerned, it varies from 1 to 4 minutes.
Fire-Risk and Hazard Analysis in the Country
(National Report) Confidential Page 115 of 338
6.2.2 JAPAN
Fire Service laws of Japan and its background: 1. The Japanese system of laws and regulations regarding fire service law (Hierarchy
structure) A .Law: Fire Service Act B. Cabinet order: Order for Enforcement of the Fire Service Act
・Specify the type of building fire protection
・Technical standards for installation and maintenance of fire prevention equipment
C Ministerial ordinance: Rule for Enforcement of the Fire Service Act
・Details of technical standards for installation and maintenance of fire prevention
equipment" D. Municipal ordinances: Fire prevention ordinance"
2. Requirements for Fire prevention equipments All Fire prevention equipments are necessary to have national certification in Japan (regulation not standard). 3. Background of Japanese fire service
・Fire service in Japan consists of one unit per municipality.
・Under the laws, fire prevention regulations are enacted by each of the
municipalities.
・Fire prevention regulations are slightly different for each individual municipality.
Japanese Regulation, the response time has not been determined.
According to the Fire Service Law Enforcement Order (not regulation), the fire panel shall be installed where there are always people in Japan. In large buildings, the fire panel has been installed in Guard Room. Security people are always monitoring the fire panel. At the same time the alarm is sounded, Fire tenders will rush to the site for extinguishing the fire. Time to reach the site, which varies depending on the building, assumed at 5 to 10 minutes. (not determined by law). 2. Since, there are several Islands in Japan, is there any different Regulations for Islands? Almost the same. As you know, Japan is made up of three islands and many small islands. There has prefectures, among which are divided into municipalities regardless of islands.” From the above, it may be inferred that in Japan, each municipality has at least one Fire Station and response time varies from 5 to 10 minutes, depending upon the location of building.
Fire-Risk and Hazard Analysis in the Country
(National Report) Confidential Page 116 of 338
6.2.3 USA
“There are three National Fire Protection Association (NFPA) standards that contain time requirements that influence the delivery of fire and emergency medical services. These are:
1. NFPA 1221, Standard for the Installation, Maintenance, and Use of Emergency
Services Communications Systems;
2. NFPA 1710, Standard for the Organization and Deployment of Fire Suppression
Operations, Emergency Medical Operations, and Special Operations to the Public by
Career Fire Departments; and
3. NFPA 1720, Standard for the Organization and Deployment of Fire Suppression
Operations, Emergency Medical Operations, and Special Operations to the Public by
Volunteer Fire Departments.
NFPA 1710 contains time objectives that shall be established by career fire departments as follows:
Turnout time: One minute (60 seconds) for turnout time
Fire response time: Four minutes (240 seconds) or less for the arrival of the first
arriving engine company at a fire suppression incident and/or eight minutes (480
seconds) or less for the deployment of a full first alarm assignment at a fire
suppression incident
First responder or higher emergency medical response time: Four minutes (240
seconds) or less for the arrival of a unit with first responder or higher-level capability
at an emergency medical incident
Advanced life support response time: Eight minutes (480 seconds) or less for the
arrival of an advanced life support unit at an emergency medical incident, where the
service is provided by the fire department
The standard States that the fire department shall establish a performance objective of not less than 90 percent for the achievement of each response time objective. NFPA 1710 does contain a time objective for dispatch time by requiring that "All communications facilities, equipment, staffing, and operating procedures shall comply with NFPA 1221." For the purposes of NFPA 1710, the following definitions apply:
Dispatch time: The point of receipt of the emergency alarm at the public safety
answering point to the point where sufficient information is known to the dispatcher
and applicable units are notified of the emergency
Turnout time: The time that begins when units acknowledge notification of the
emergency to the beginning point of response time
Response time: The time that begins when units are en route to the emergency
incident and ends when units arrive at the scene
NFPA 1720 contains a time objective for dispatch time by requiring that "All communications facilities, equipment, staffing, and operating procedures shall comply with NFPA 1221, Standard for the Installation, Maintenance, and Use of Emergency Services Communications Systems." NFPA 1720 contains no time requirements for turnout and response times.
NFPA 1221 requires that 95 percent of alarms shall be answered within 15 seconds, 99 percent of alarms shall be answered in 40 seconds, and the dispatch of the emergency
Fire-Risk and Hazard Analysis in the Country
(National Report) Confidential Page 117 of 338
response agency shall be completed within 60 seconds 95 percent of the time. The time lines for dispatching are taken from NFPA 1221:
After the receipt of a call for assistance, the fire department will respond with the first
unit to that location within three minutes.
After receipt of a call for assistance, the fire department will respond with a unit to
that location, within four minutes, to 90 percent of area served.
After receipt of a call for a medical emergency, the fire department will respond with an engine company to that location within four minutes and an ambulance within six minutes.”
From the above, it may be inferred that in USA, response time varies from (3 - 4 minutes) to 8 minutes.
6.2.4 UK
The London Fire Brigade (LFB) is run by the London Fire and Emergency Planning Authority as part of a group of organizations operating under the „umbrella‟ of the Greater London Authority. It is the third largest firefighting organization in the world, with 111 Fire Stations (plus 1 River Thames-based station) from which it operates across the 1,587 sq km of Greater London, with its resident population of some 7.4 million. This increases by a further 500,000 each day during working hours.
In the year 2005/06 the London Fire Brigade answered some 268,000 emergency calls and attended nearly 156,000 incidents. On an average, the first fire engine arrived at an incident within 8 minutes on 92 per cent of occasions, meeting the Brigade‟s target, and within 5 minutes on nearly 65 per cent of occasions. When required, a second fire engine was on scene within ten minutes on 93 per cent of occasions, exceeding the target. (Hooper, Nov-Dec, 2006; http://www.cadcorp.com/pdf/PA-firebrigade_ukv4i5.pdf).
Another recent review of “Fire and Rescue Service response times” (Fire Research Series 1/2009) concludes that response times have increased due to traffic conditions, which was similar to the finding of the London Fire and Emergency Planning Authority thematic report, which concluded that it now takes 50 seconds longer for a 1st appliance to arrive on average and one minute longer for a second appliance.
From the above, it may be inferred that in UK, response time varies from 5 to 8 minutes.
6.2.5 INDIA
“Standing Fire and Advisory Council (SFAC) reviewed the norms in various countries, and as given in the RFP, has laid down norms for the Fire and Emergency Services throughout the country based on:-
• Response time, fire risk, and population
• Depending on risk category A, B, and C the recommended response time for first fire tender is 3, 5, and 7 minutes, respectively
• One Fire Station per 10 sq. km in urban areas and one Fire Station per 50 sq. km in rural areas
• One Rescue Tender per 3 – 10 lakhs population
• In rural areas, the recommended response time is 20 minutes
From the above, it can be inferred that SFAC norms are based on the idealized conditions of the western world and would be too demanding, thus requiring some modifications.
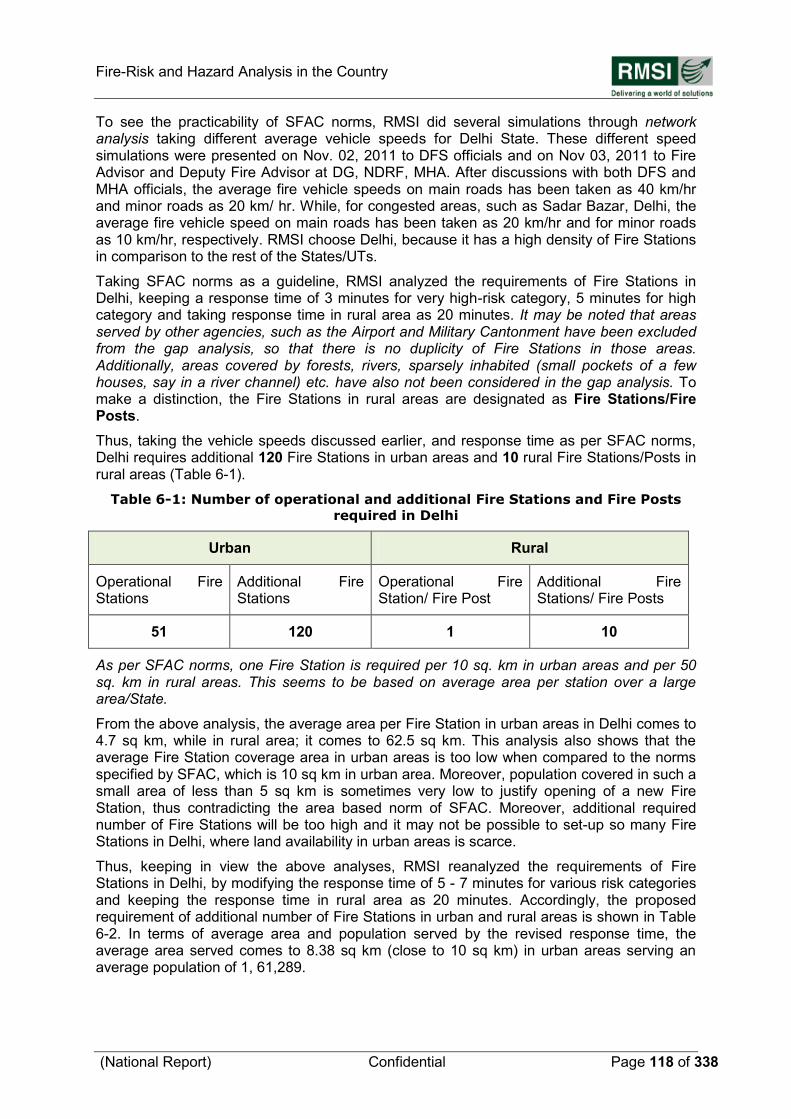
Fire-Risk and Hazard Analysis in the Country
(National Report) Confidential Page 118 of 338
To see the practicability of SFAC norms, RMSI did several simulations through network analysis taking different average vehicle speeds for Delhi State. These different speed simulations were presented on Nov. 02, 2011 to DFS officials and on Nov 03, 2011 to Fire Advisor and Deputy Fire Advisor at DG, NDRF, MHA. After discussions with both DFS and MHA officials, the average fire vehicle speeds on main roads has been taken as 40 km/hr and minor roads as 20 km/ hr. While, for congested areas, such as Sadar Bazar, Delhi, the average fire vehicle speed on main roads has been taken as 20 km/hr and for minor roads as 10 km/hr, respectively. RMSI choose Delhi, because it has a high density of Fire Stations in comparison to the rest of the States/UTs.
Taking SFAC norms as a guideline, RMSI analyzed the requirements of Fire Stations in Delhi, keeping a response time of 3 minutes for very high-risk category, 5 minutes for high category and taking response time in rural area as 20 minutes. It may be noted that areas served by other agencies, such as the Airport and Military Cantonment have been excluded from the gap analysis, so that there is no duplicity of Fire Stations in those areas. Additionally, areas covered by forests, rivers, sparsely inhabited (small pockets of a few houses, say in a river channel) etc. have also not been considered in the gap analysis. To make a distinction, the Fire Stations in rural areas are designated as Fire Stations/Fire Posts.
Thus, taking the vehicle speeds discussed earlier, and response time as per SFAC norms, Delhi requires additional 120 Fire Stations in urban areas and 10 rural Fire Stations/Posts in rural areas (Table 6-1).
Table 6-1: Number of operational and additional Fire Stations and Fire Posts
required in Delhi
Urban Rural
Operational Fire Stations
Additional Fire Stations
Operational Fire Station/ Fire Post
Additional Fire Stations/ Fire Posts
51 120 1 10
As per SFAC norms, one Fire Station is required per 10 sq. km in urban areas and per 50 sq. km in rural areas. This seems to be based on average area per station over a large area/State.
From the above analysis, the average area per Fire Station in urban areas in Delhi comes to 4.7 sq km, while in rural area; it comes to 62.5 sq km. This analysis also shows that the average Fire Station coverage area in urban areas is too low when compared to the norms specified by SFAC, which is 10 sq km in urban area. Moreover, population covered in such a small area of less than 5 sq km is sometimes very low to justify opening of a new Fire Station, thus contradicting the area based norm of SFAC. Moreover, additional required number of Fire Stations will be too high and it may not be possible to set-up so many Fire Stations in Delhi, where land availability in urban areas is scarce.
Thus, keeping in view the above analyses, RMSI reanalyzed the requirements of Fire Stations in Delhi, by modifying the response time of 5 - 7 minutes for various risk categories and keeping the response time in rural area as 20 minutes. Accordingly, the proposed requirement of additional number of Fire Stations in urban and rural areas is shown in Table 6-2. In terms of average area and population served by the revised response time, the average area served comes to 8.38 sq km (close to 10 sq km) in urban areas serving an average population of 1, 61,289.
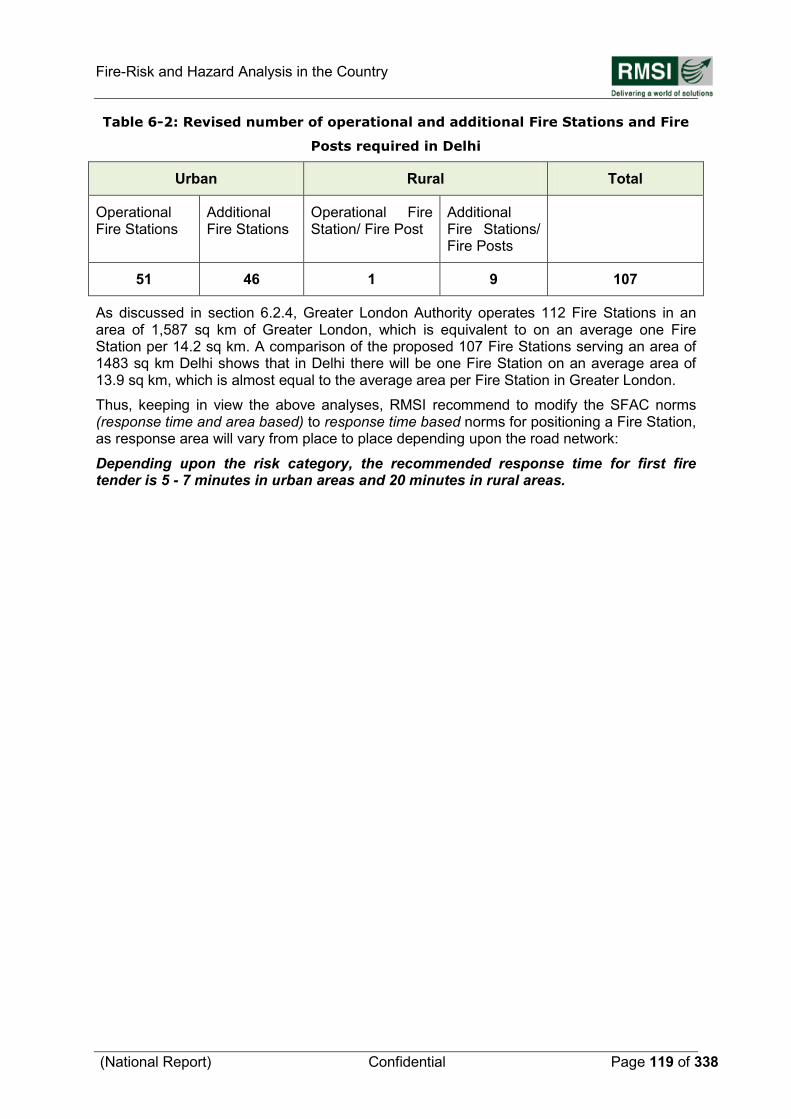
Fire-Risk and Hazard Analysis in the Country
(National Report) Confidential Page 119 of 338
Table 6-2: Revised number of operational and additional Fire Stations and Fire
Posts required in Delhi
Urban Rural Total
Operational Fire Stations
Additional Fire Stations
Operational Fire Station/ Fire Post
Additional Fire Stations/ Fire Posts
51 46 1 9 107
As discussed in section 6.2.4, Greater London Authority operates 112 Fire Stations in an area of 1,587 sq km of Greater London, which is equivalent to on an average one Fire Station per 14.2 sq km. A comparison of the proposed 107 Fire Stations serving an area of 1483 sq km Delhi shows that in Delhi there will be one Fire Station on an average area of 13.9 sq km, which is almost equal to the average area per Fire Station in Greater London.
Thus, keeping in view the above analyses, RMSI recommend to modify the SFAC norms (response time and area based) to response time based norms for positioning a Fire Station, as response area will vary from place to place depending upon the road network:
Depending upon the risk category, the recommended response time for first fire tender is 5 - 7 minutes in urban areas and 20 minutes in rural areas.
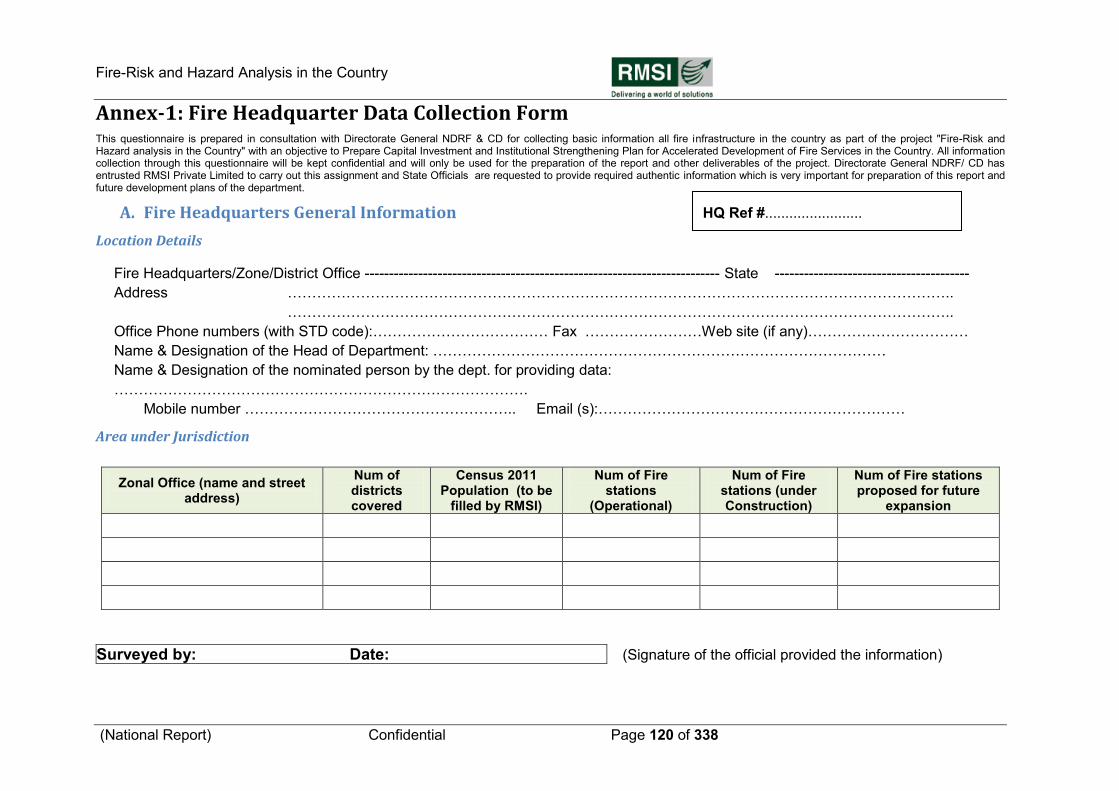
Fire-Risk and Hazard Analysis in the Country
(National Report) Confidential Page 120 of 338
Annex-1: Fire Headquarter Data Collection Form This questionnaire is prepared in consultation with Directorate General NDRF & CD for collecting basic information all fire infrastructure in the country as part of the project "Fire-Risk and Hazard analysis in the Country" with an objective to Prepare Capital Investment and Institutional Strengthening Plan for Accelerated Development of Fire Services in the Country. All information collection through this questionnaire will be kept confidential and will only be used for the preparation of the report and other deliverables of the project. Directorate General NDRF/ CD has entrusted RMSI Private Limited to carry out this assignment and State Officials are requested to provide required authentic information which is very important for preparation of this report and future development plans of the department.
A. Fire Headquarters General Information
Location Details
Fire Headquarters/Zone/District Office ------------------------------------------------------------------------- State ----------------------------------------
Address ………………………………………………………………………………………………………………………..
………………………………………………………………………………………………………………………..
Office Phone numbers (with STD code):……………………………… Fax ……………………Web site (if any)……………………………
Name & Designation of the Head of Department: …………………………………………………………………………………
Name & Designation of the nominated person by the dept. for providing data:
………………………………………………………………………….
Mobile number ……………………………………………….. Email (s):………………………………………………………
Area under Jurisdiction
Zonal Office (name and street address)
Num of districts covered
Census 2011 Population (to be
filled by RMSI)
Num of Fire stations
(Operational)
Num of Fire stations (under Construction)
Num of Fire stations proposed for future
expansion
Surveyed by: Date: (Signature of the official provided the information)
HQ Ref #........................
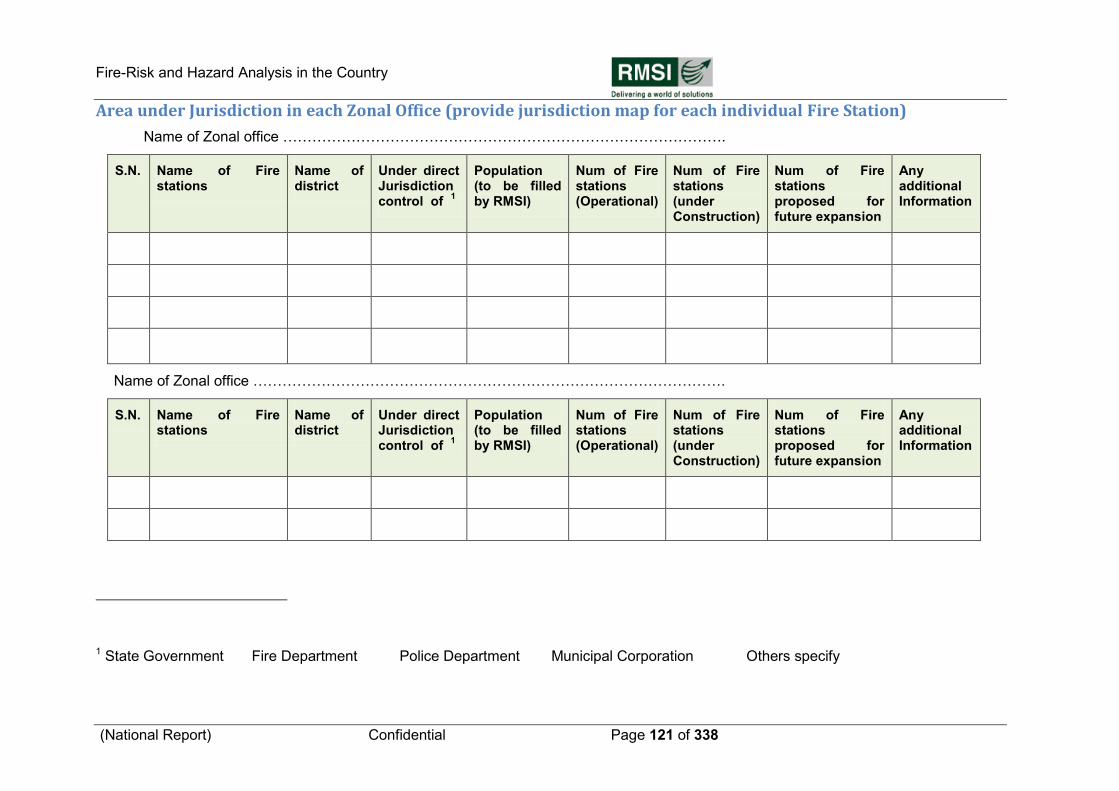
Fire-Risk and Hazard Analysis in the Country
(National Report) Confidential Page 121 of 338
Area under Jurisdiction in each Zonal Office (provide jurisdiction map for each individual Fire Station)
Name of Zonal office ……………………………………………………………………………….
S.N. Name of Fire stations
Name of district
Under direct Jurisdiction control of
1
Population (to be filled by RMSI)
Num of Fire stations (Operational)
Num of Fire stations (under Construction)
Num of Fire stations proposed for future expansion
Any additional Information
Name of Zonal office …………………………………………………………………………………….
S.N. Name of Fire stations
Name of district
Under direct Jurisdiction control of
1
Population (to be filled by RMSI)
Num of Fire stations (Operational)
Num of Fire stations (under Construction)
Num of Fire stations proposed for future expansion
Any additional Information
1 State Government Fire Department Police Department Municipal Corporation Others specify
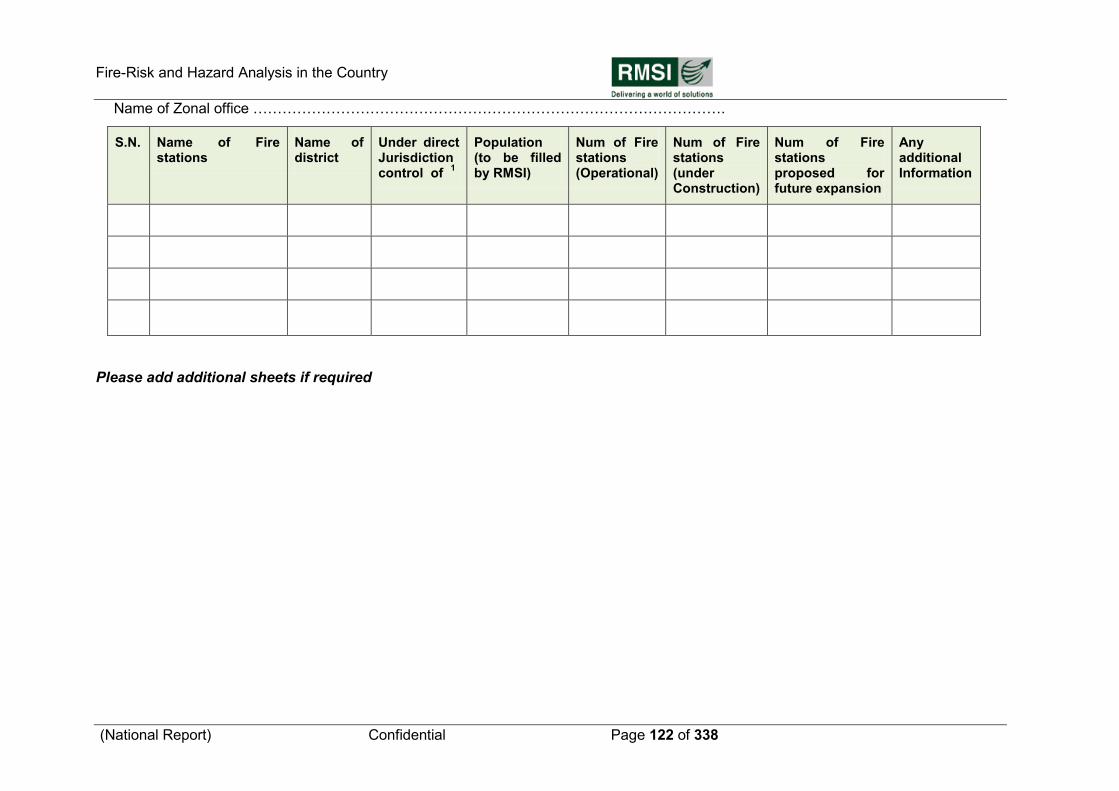
Fire-Risk and Hazard Analysis in the Country
(National Report) Confidential Page 122 of 338
Name of Zonal office …………………………………………………………………………………….
S.N. Name of Fire stations
Name of district
Under direct Jurisdiction control of
1
Population (to be filled by RMSI)
Num of Fire stations (Operational)
Num of Fire stations (under Construction)
Num of Fire stations proposed for future expansion
Any additional Information
Please add additional sheets if required
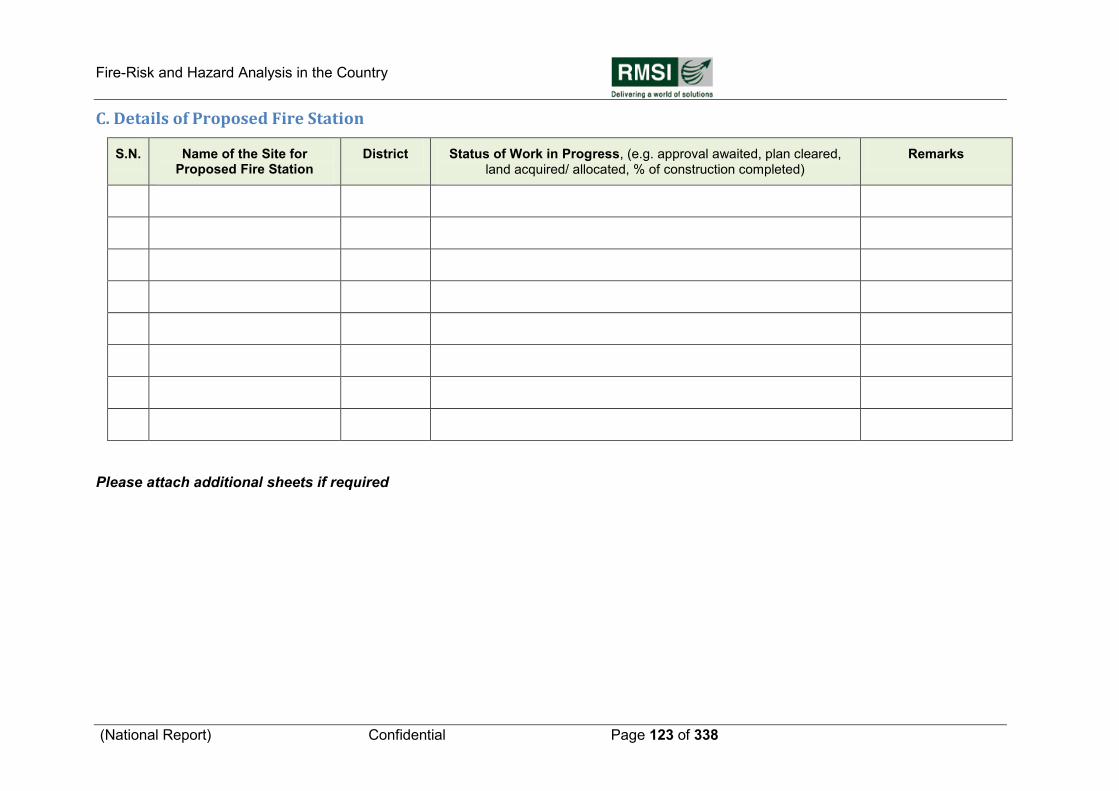
Fire-Risk and Hazard Analysis in the Country
(National Report) Confidential Page 123 of 338
C. Details of Proposed Fire Station
S.N. Name of the Site for Proposed Fire Station
District Status of Work in Progress, (e.g. approval awaited, plan cleared, land acquired/ allocated, % of construction completed)
Remarks
Please attach additional sheets if required
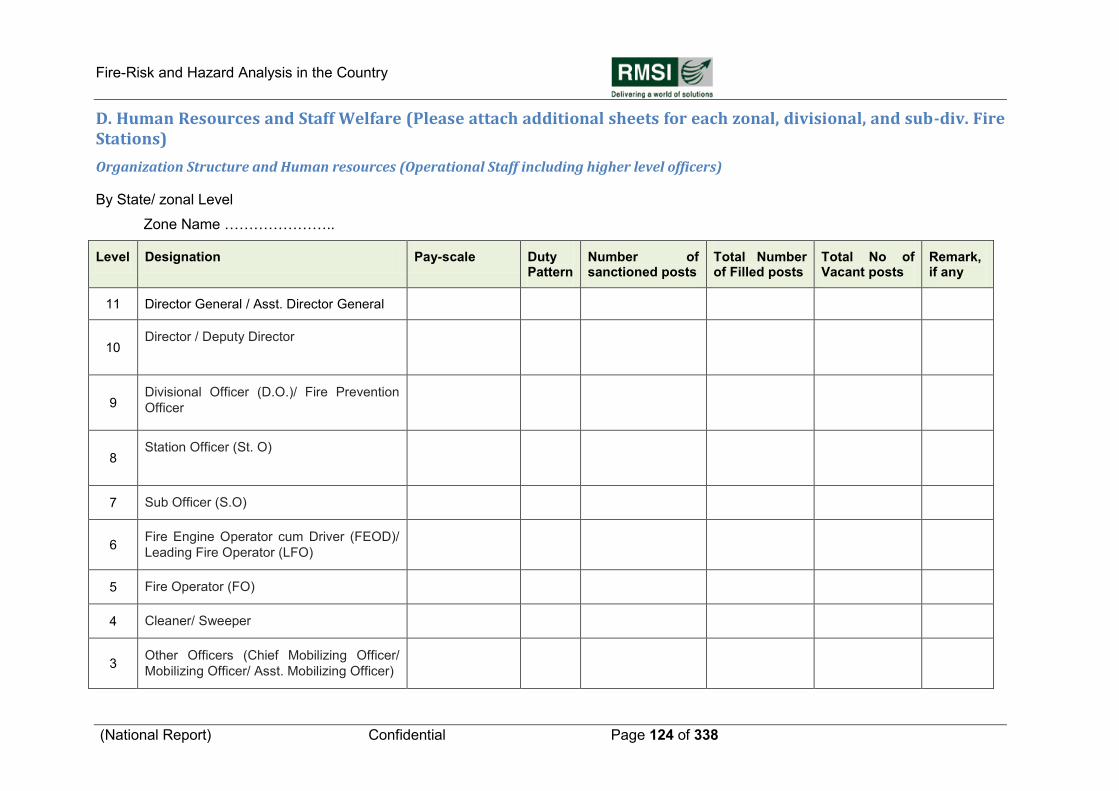
Fire-Risk and Hazard Analysis in the Country
(National Report) Confidential Page 124 of 338
D. Human Resources and Staff Welfare (Please attach additional sheets for each zonal, divisional, and sub-div. Fire Stations)
Organization Structure and Human resources (Operational Staff including higher level officers)
By State/ zonal Level
Zone Name …………………..
Level Designation Pay-scale Duty Pattern
Number of sanctioned posts
Total Number of Filled posts
Total No of Vacant posts
Remark, if any
11 Director General / Asst. Director General
10 Director / Deputy Director
9 Divisional Officer (D.O.)/ Fire Prevention
Officer
8 Station Officer (St. O)
7 Sub Officer (S.O)
6 Fire Engine Operator cum Driver (FEOD)/
Leading Fire Operator (LFO)
5 Fire Operator (FO)
4 Cleaner/ Sweeper
3 Other Officers (Chief Mobilizing Officer/
Mobilizing Officer/ Asst. Mobilizing Officer)
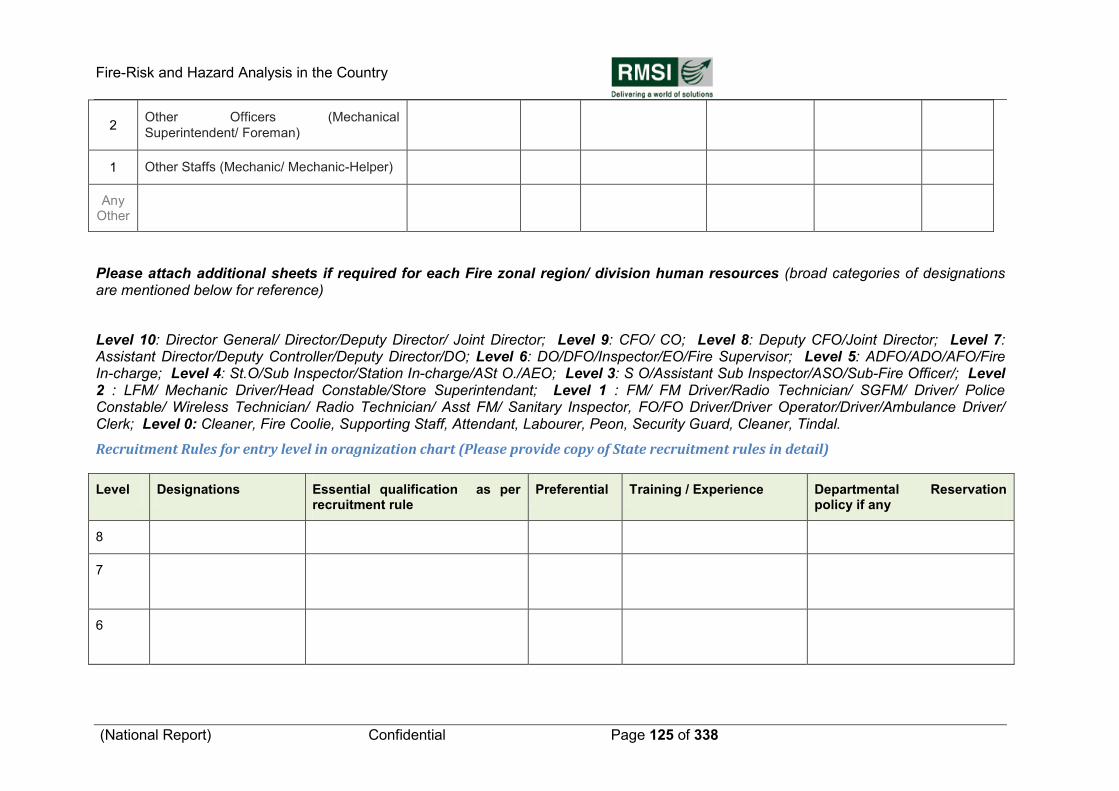
Fire-Risk and Hazard Analysis in the Country
(National Report) Confidential Page 125 of 338
2 Other Officers (Mechanical
Superintendent/ Foreman)
1 Other Staffs (Mechanic/ Mechanic-Helper)
Any Other
Please attach additional sheets if required for each Fire zonal region/ division human resources (broad categories of designations are mentioned below for reference)
Level 10: Director General/ Director/Deputy Director/ Joint Director; Level 9: CFO/ CO; Level 8: Deputy CFO/Joint Director; Level 7: Assistant Director/Deputy Controller/Deputy Director/DO; Level 6: DO/DFO/Inspector/EO/Fire Supervisor; Level 5: ADFO/ADO/AFO/Fire In-charge; Level 4: St.O/Sub Inspector/Station In-charge/ASt O./AEO; Level 3: S O/Assistant Sub Inspector/ASO/Sub-Fire Officer/; Level 2 : LFM/ Mechanic Driver/Head Constable/Store Superintendant; Level 1 : FM/ FM Driver/Radio Technician/ SGFM/ Driver/ Police Constable/ Wireless Technician/ Radio Technician/ Asst FM/ Sanitary Inspector, FO/FO Driver/Driver Operator/Driver/Ambulance Driver/ Clerk; Level 0: Cleaner, Fire Coolie, Supporting Staff, Attendant, Labourer, Peon, Security Guard, Cleaner, Tindal.
Recruitment Rules for entry level in oragnization chart (Please provide copy of State recruitment rules in detail)
Level Designations Essential qualification as per recruitment rule
Preferential Training / Experience Departmental Reservation policy if any
8
7
6
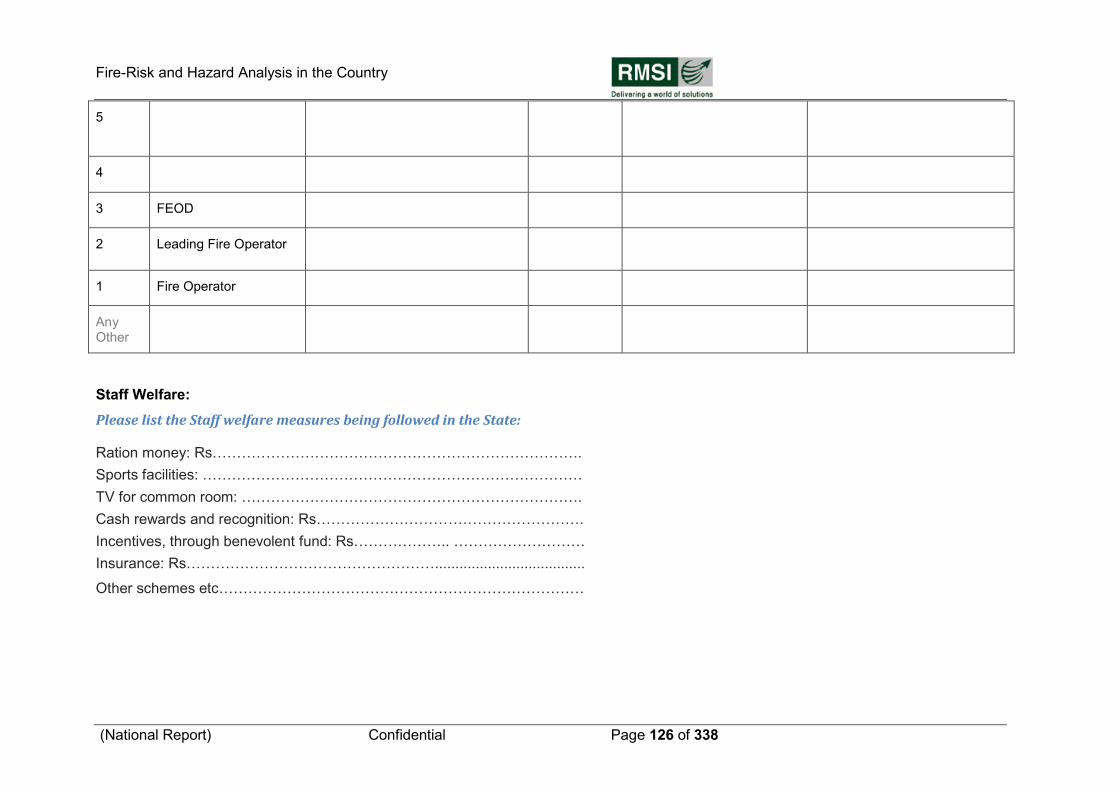
Fire-Risk and Hazard Analysis in the Country
(National Report) Confidential Page 126 of 338
5
4
3 FEOD
2 Leading Fire Operator
1 Fire Operator
Any Other
Staff Welfare:
Please list the Staff welfare measures being followed in the State:
Ration money: Rs………………………………………………………………….
Sports facilities: ……………………………………………………………………
TV for common room: …………………………………………………………….
Cash rewards and recognition: Rs……………………………………………….
Incentives, through benevolent fund: Rs……………….. ………………………
Insurance: Rs…………………………………………….....................................
Other schemes etc…………………………………………………………………
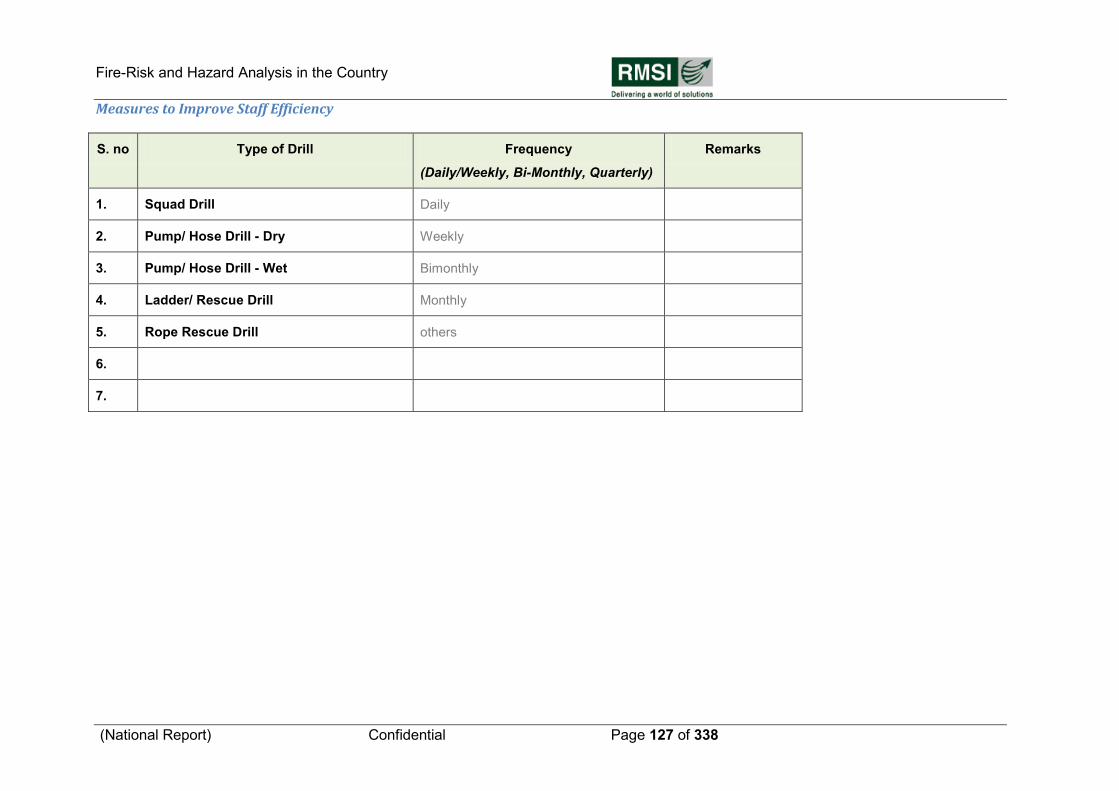
Fire-Risk and Hazard Analysis in the Country
(National Report) Confidential Page 127 of 338
Measures to Improve Staff Efficiency
S. no Type of Drill Frequency
(Daily/Weekly, Bi-Monthly, Quarterly)
Remarks
1. Squad Drill Daily
2. Pump/ Hose Drill - Dry Weekly
3. Pump/ Hose Drill - Wet Bimonthly
4. Ladder/ Rescue Drill Monthly
5. Rope Rescue Drill others
6.
7.
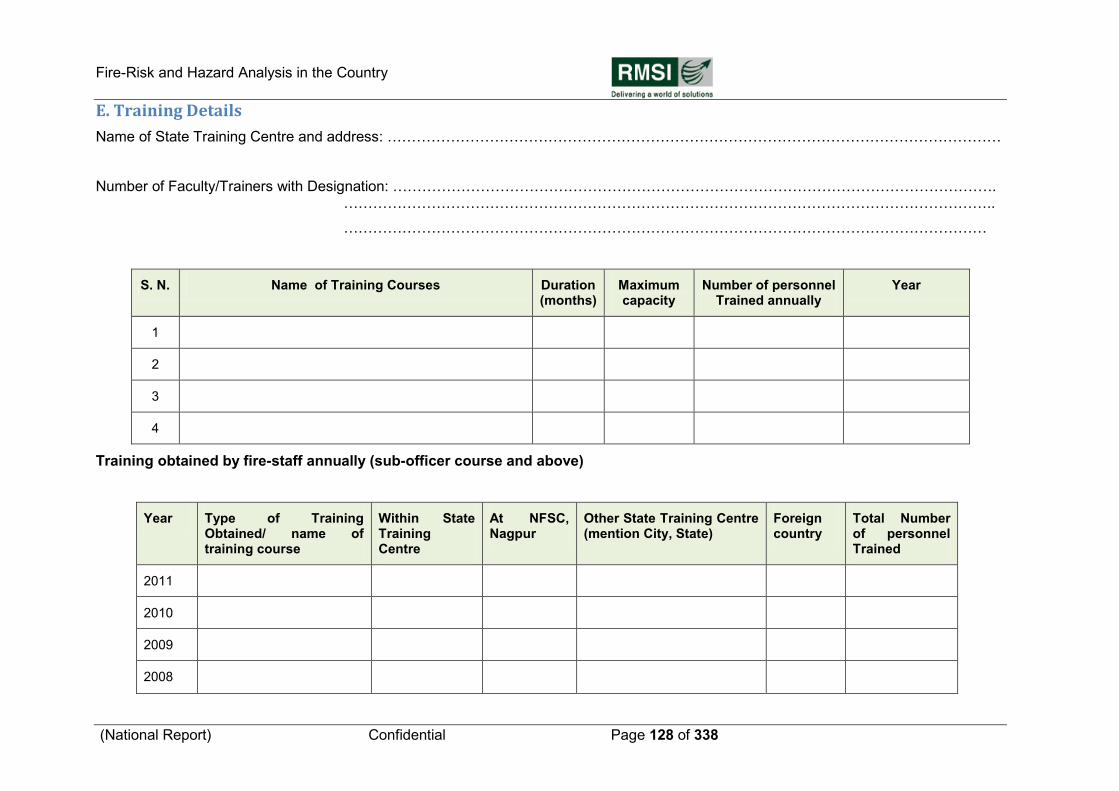
Fire-Risk and Hazard Analysis in the Country
(National Report) Confidential Page 128 of 338
E. Training Details
Name of State Training Centre and address: ………………………………………………………………………………………………………………
Number of Faculty/Trainers with Designation: ……………………………………………………………………………………………………………. ……………………………………………………………………………………………………………………..
……………………………………………………………………………………………………………………
S. N. Name of Training Courses Duration (months)
Maximum capacity
Number of personnel Trained annually
Year
1
2
3
4
Training obtained by fire-staff annually (sub-officer course and above)
Year Type of Training Obtained/ name of training course
Within State Training Centre
At NFSC, Nagpur
Other State Training Centre (mention City, State)
Foreign country
Total Number of personnel Trained
2011
2010
2009
2008
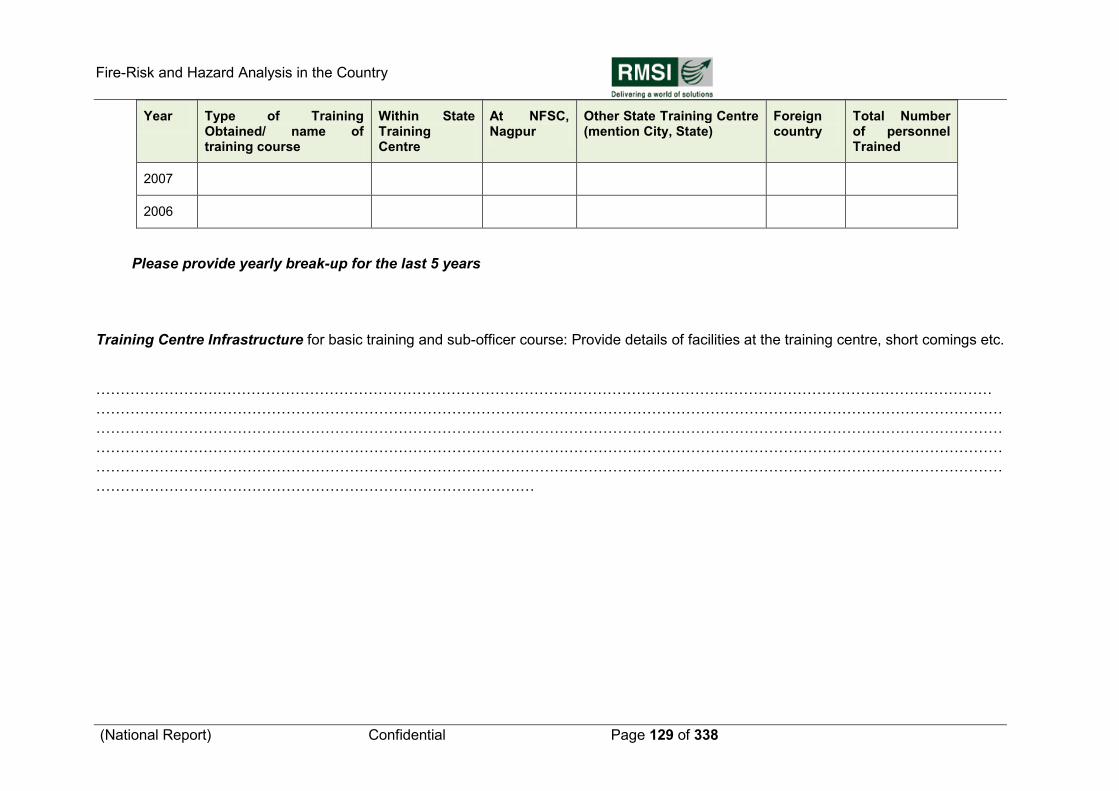
Fire-Risk and Hazard Analysis in the Country
(National Report) Confidential Page 129 of 338
Year Type of Training Obtained/ name of training course
Within State Training Centre
At NFSC, Nagpur
Other State Training Centre (mention City, State)
Foreign country
Total Number of personnel Trained
2007
2006
Please provide yearly break-up for the last 5 years
Training Centre Infrastructure for basic training and sub-officer course: Provide details of facilities at the training centre, short comings etc.
…………………….……………………………………………………………………………………………………………………………………………
……………………………………………………………………………………………………………………………………………………………………
……………………………………………………………………………………………………………………………………………………………………
……………………………………………………………………………………………………………………………………………………………………
……………………………………………………………………………………………………………………………………………………………………
………………………………………………………………………………
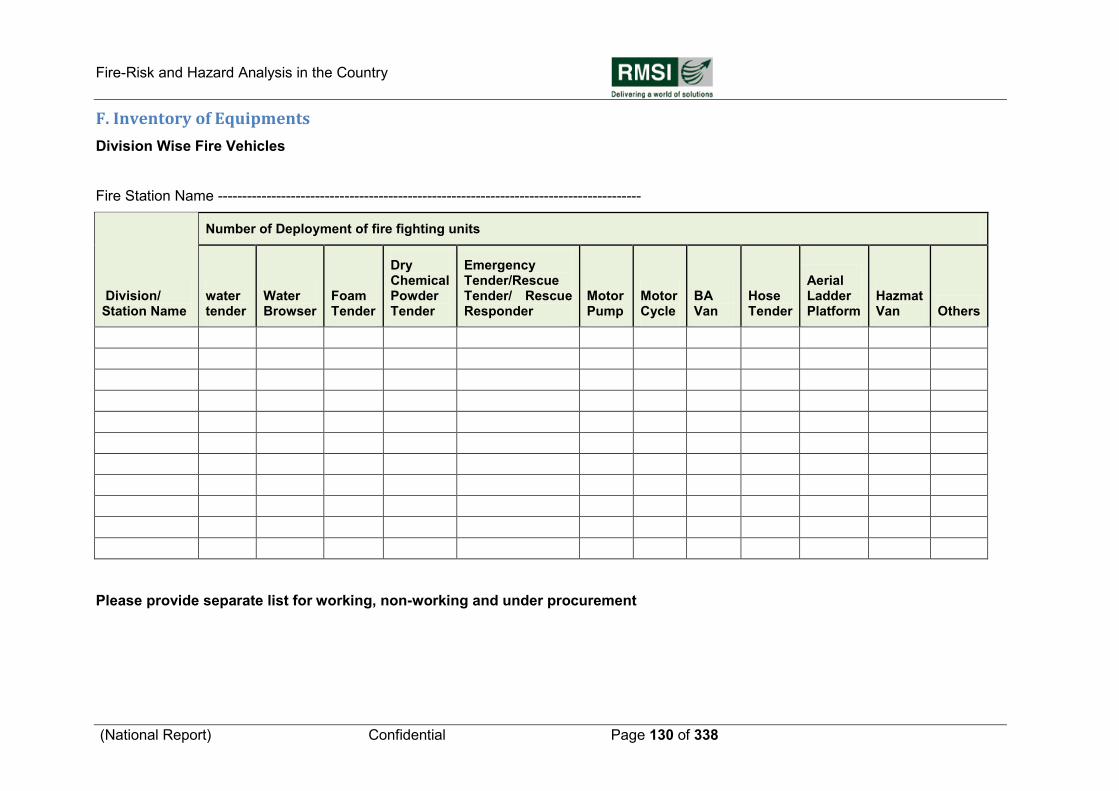
Fire-Risk and Hazard Analysis in the Country
(National Report) Confidential Page 130 of 338
F. Inventory of Equipments
Division Wise Fire Vehicles
Fire Station Name ---------------------------------------------------------------------------------------
Division/ Station Name
Number of Deployment of fire fighting units
water tender
Water Browser
Foam Tender
Dry Chemical Powder Tender
Emergency Tender/Rescue Tender/ Rescue Responder
Motor Pump
Motor Cycle
BA Van
Hose Tender
Aerial Ladder Platform
Hazmat Van Others
Please provide separate list for working, non-working and under procurement
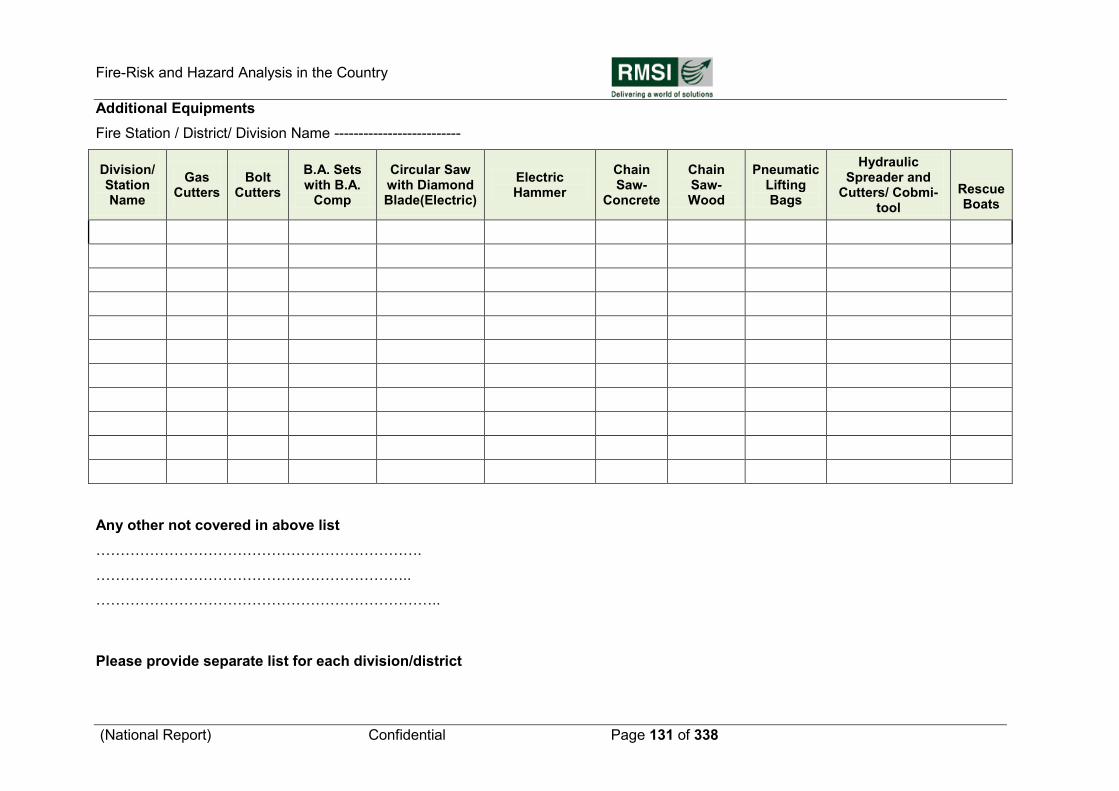
Fire-Risk and Hazard Analysis in the Country
(National Report) Confidential Page 131 of 338
Additional Equipments
Fire Station / District/ Division Name --------------------------
Division/ Station Name
Gas Cutters
Bolt Cutters
B.A. Sets with B.A.
Comp
Circular Saw with Diamond Blade(Electric)
Electric Hammer
Chain Saw-
Concrete
Chain Saw-Wood
Pneumatic Lifting Bags
Hydraulic Spreader and
Cutters/ Cobmi-tool
Rescue Boats
Any other not covered in above list
………………………………………………………….
………………………………………………………..
……………………………………………………………..
Please provide separate list for each division/district
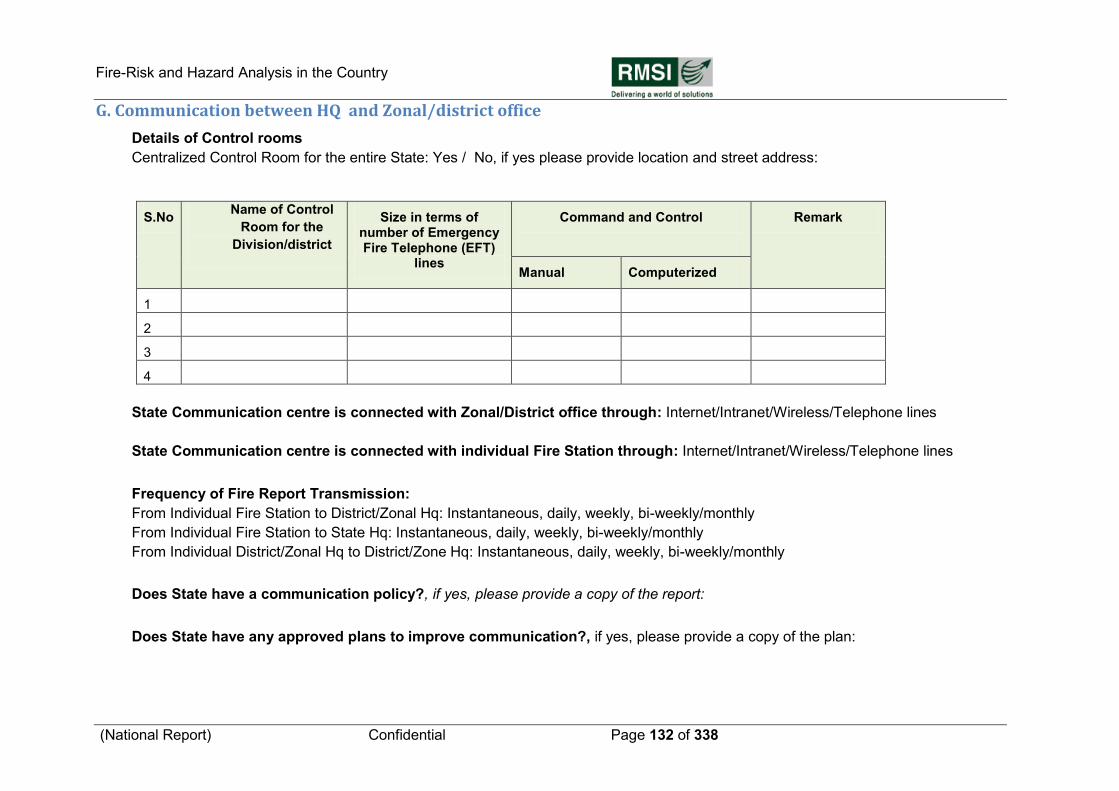
Fire-Risk and Hazard Analysis in the Country
(National Report) Confidential Page 132 of 338
G. Communication between HQ and Zonal/district office
Details of Control rooms
Centralized Control Room for the entire State: Yes / No, if yes please provide location and street address:
S.No Name of Control
Room for the
Division/district
Size in terms of number of Emergency Fire Telephone (EFT)
lines
Command and Control
Remark
Manual Computerized
1
2
3
4
State Communication centre is connected with Zonal/District office through: Internet/Intranet/Wireless/Telephone lines
State Communication centre is connected with individual Fire Station through: Internet/Intranet/Wireless/Telephone lines
Frequency of Fire Report Transmission:
From Individual Fire Station to District/Zonal Hq: Instantaneous, daily, weekly, bi-weekly/monthly
From Individual Fire Station to State Hq: Instantaneous, daily, weekly, bi-weekly/monthly
From Individual District/Zonal Hq to District/Zone Hq: Instantaneous, daily, weekly, bi-weekly/monthly
Does State have a communication policy?, if yes, please provide a copy of the report:
Does State have any approved plans to improve communication?, if yes, please provide a copy of the plan:
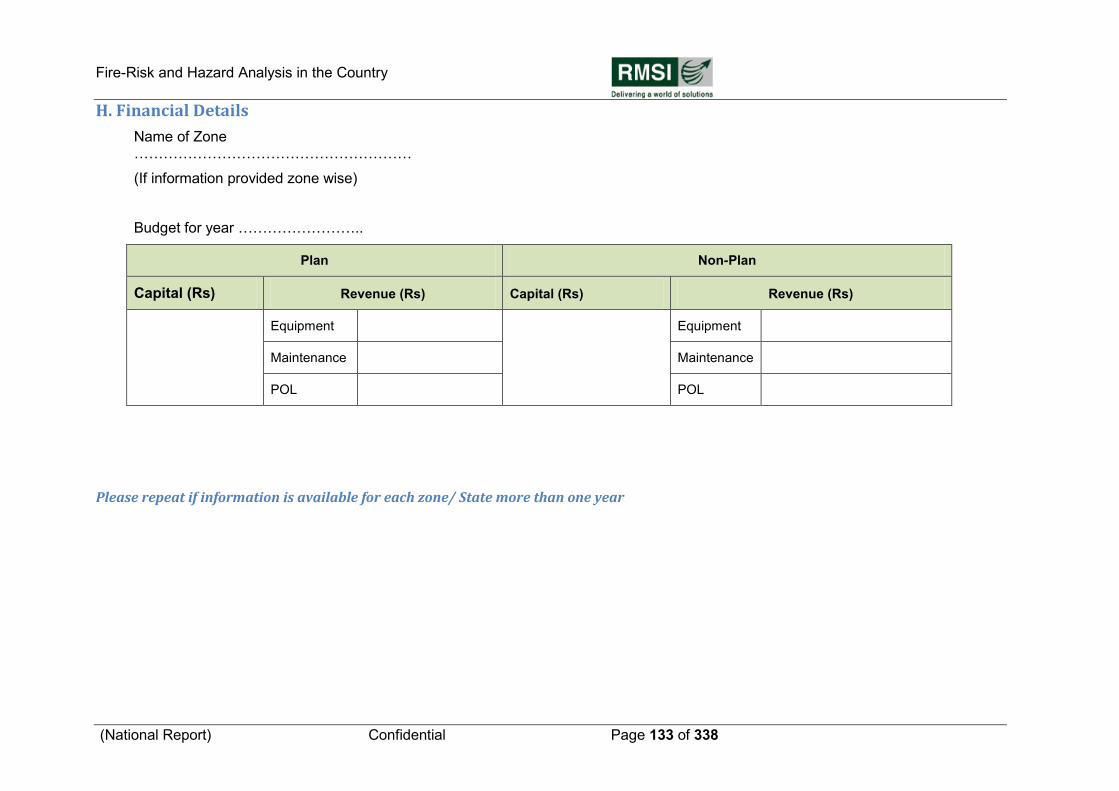
Fire-Risk and Hazard Analysis in the Country
(National Report) Confidential Page 133 of 338
H. Financial Details
Name of Zone …………………………………………………
(If information provided zone wise)
Budget for year ……………………..
Plan Non-Plan
Capital (Rs) Revenue (Rs) Capital (Rs) Revenue (Rs)
Equipment
Equipment
Maintenance Maintenance
POL POL
Please repeat if information is available for each zone/ State more than one year
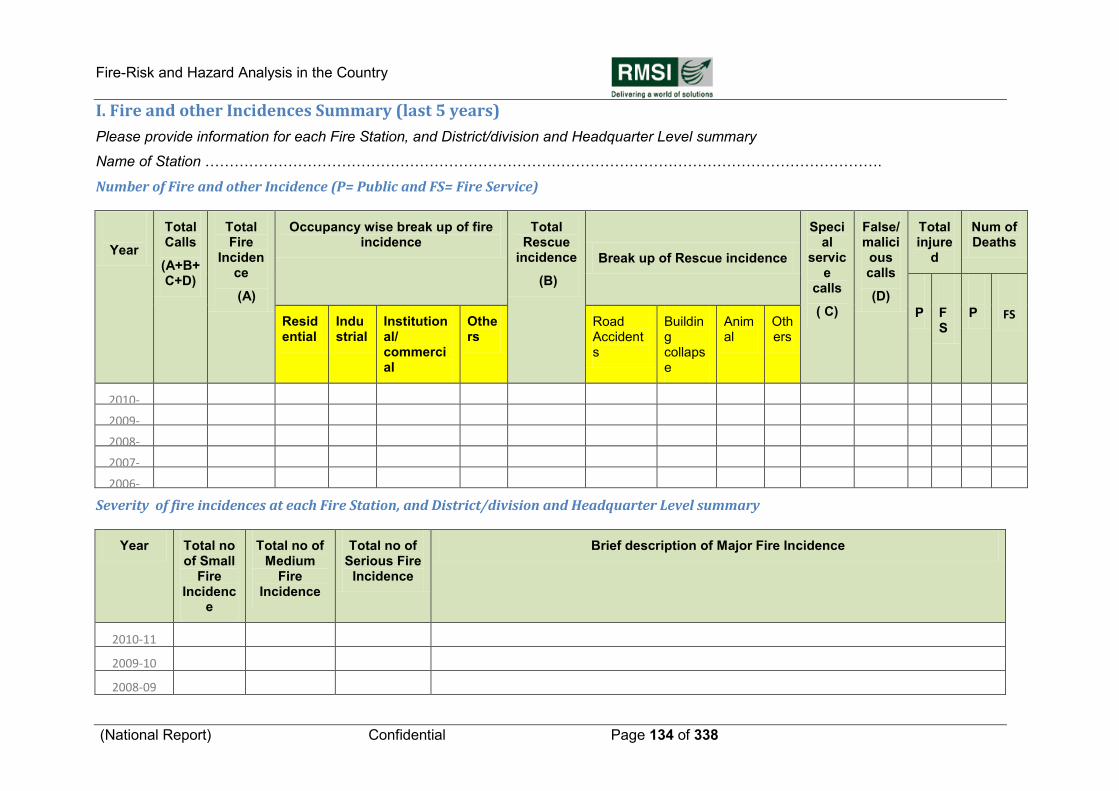
Fire-Risk and Hazard Analysis in the Country
(National Report) Confidential Page 134 of 338
I. Fire and other Incidences Summary (last 5 years)
Please provide information for each Fire Station, and District/division and Headquarter Level summary
Name of Station ………………………………………………………………………………………………………………………….
Number of Fire and other Incidence (P= Public and FS= Fire Service)
Year
Total Calls
(A+B+C+D)
Total Fire
Incidence
(A)
Occupancy wise break up of fire incidence
Total Rescue
incidence
(B)
Break up of Rescue incidence
Special
service
calls
( C)
False/ malicious calls
(D)
Total injure
d
Num of Deaths
P
FS
P
FS Residential
Industrial
Institutional/ commercial
Others
Road Accidents
Building collapse
Animal
Others
2010-11
2009-10
2008-09
2007-06
2006-07
Severity of fire incidences at each Fire Station, and District/division and Headquarter Level summary
Year Total no of Small
Fire Incidenc
e
Total no of Medium
Fire Incidence
Total no of Serious Fire
Incidence
Brief description of Major Fire Incidence
2010-11
2009-10
2008-09
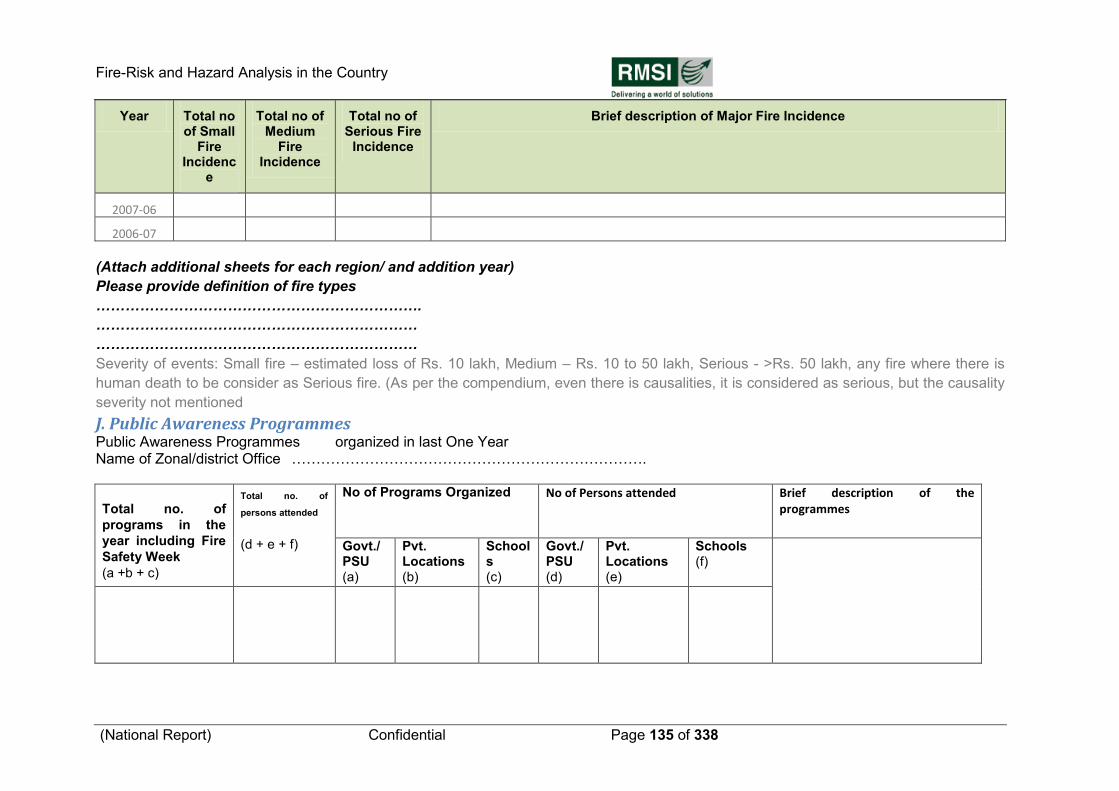
Fire-Risk and Hazard Analysis in the Country
(National Report) Confidential Page 135 of 338
Year Total no of Small
Fire Incidenc
e
Total no of Medium
Fire Incidence
Total no of Serious Fire
Incidence
Brief description of Major Fire Incidence
2007-06
2006-07
(Attach additional sheets for each region/ and addition year)
Please provide definition of fire types
………………………………………………………….
…………………………………………………………
…………………………………………………………
Severity of events: Small fire – estimated loss of Rs. 10 lakh, Medium – Rs. 10 to 50 lakh, Serious - >Rs. 50 lakh, any fire where there is
human death to be consider as Serious fire. (As per the compendium, even there is causalities, it is considered as serious, but the causality
severity not mentioned
J. Public Awareness Programmes Public Awareness Programmes organized in last One Year Name of Zonal/district Office ……………………………………………………………….
Total no. of
programs in the
year including Fire
Safety Week
(a +b + c)
Total no. of
persons attended
(d + e + f)
No of Programs Organized No of Persons attended Brief description of the programmes
Govt./ PSU (a)
Pvt. Locations (b)
Schools (c)
Govt./ PSU (d)
Pvt. Locations (e)
Schools (f)
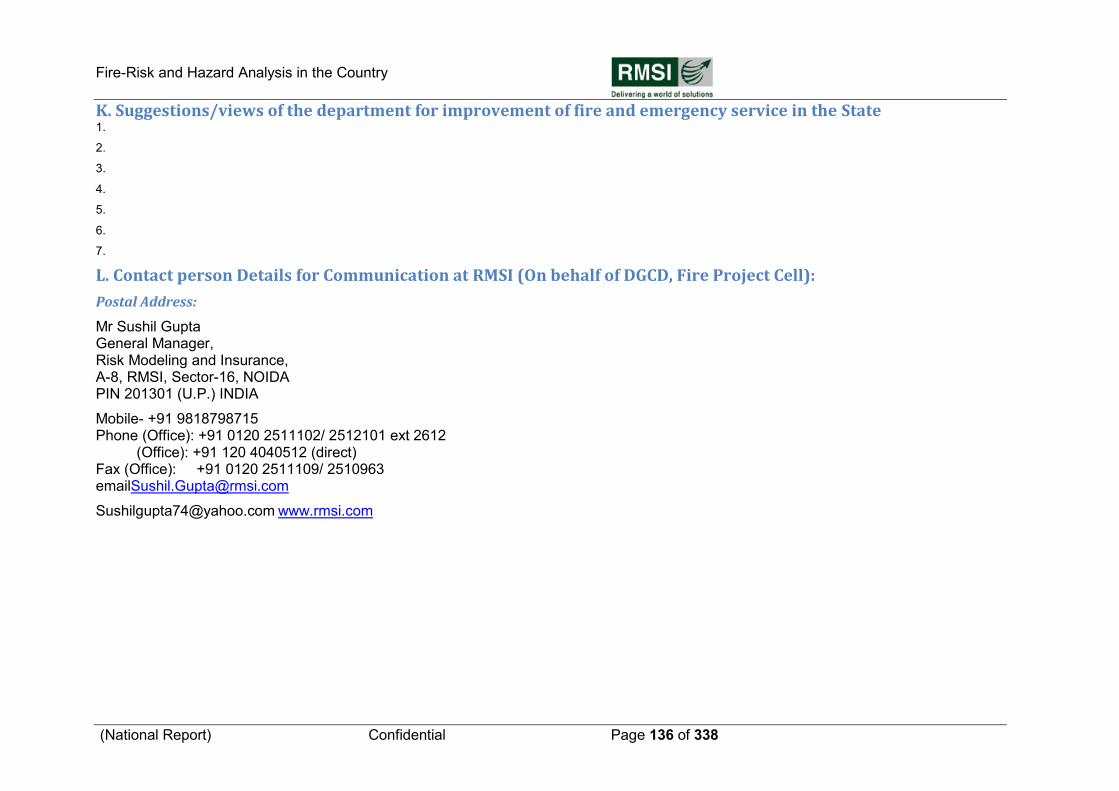
Fire-Risk and Hazard Analysis in the Country
(National Report) Confidential Page 136 of 338
K. Suggestions/views of the department for improvement of fire and emergency service in the State 1.
2.
3.
4.
5.
6.
7.
L. Contact person Details for Communication at RMSI (On behalf of DGCD, Fire Project Cell):
Postal Address:
Mr Sushil Gupta General Manager, Risk Modeling and Insurance, A-8, RMSI, Sector-16, NOIDA PIN 201301 (U.P.) INDIA
Mobile- +91 9818798715 Phone (Office): +91 0120 2511102/ 2512101 ext 2612 (Office): +91 120 4040512 (direct) Fax (Office): +91 0120 2511109/ 2510963 [email protected]
[email protected] www.rmsi.com
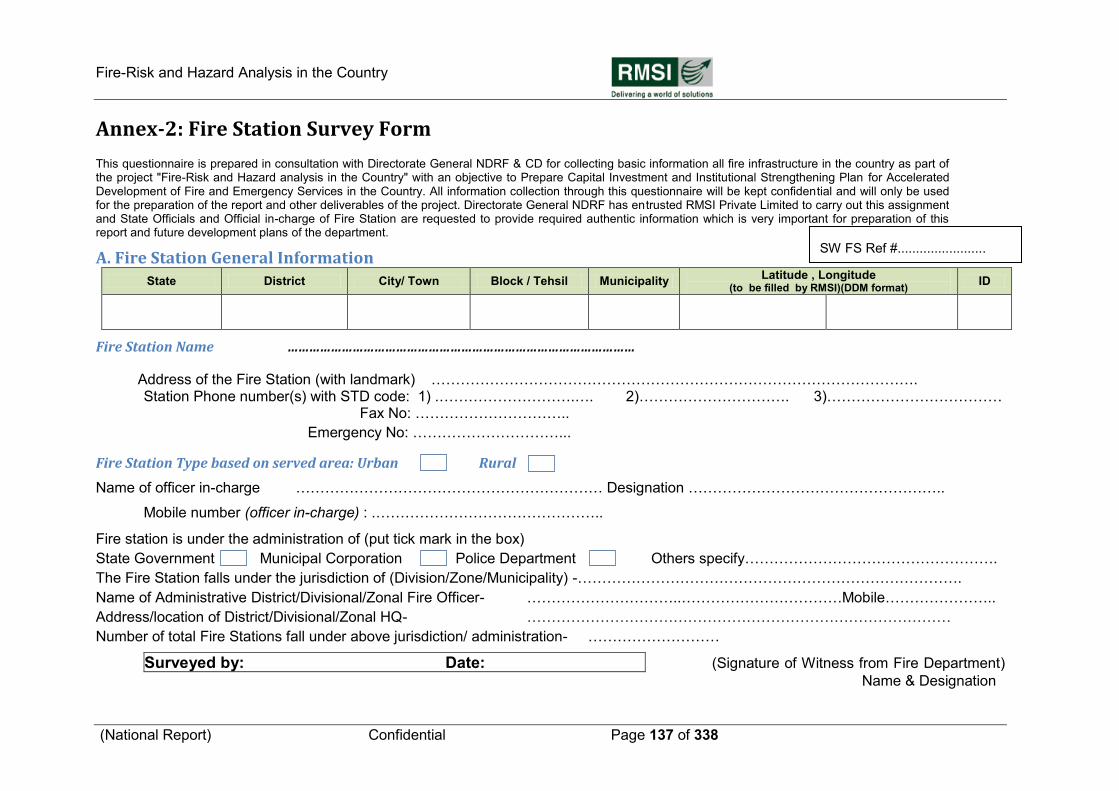
Fire-Risk and Hazard Analysis in the Country
(National Report) Confidential Page 137 of 338
Annex-2: Fire Station Survey Form
This questionnaire is prepared in consultation with Directorate General NDRF & CD for collecting basic information all fire infrastructure in the country as part of the project "Fire-Risk and Hazard analysis in the Country" with an objective to Prepare Capital Investment and Institutional Strengthening Plan for Accelerated Development of Fire and Emergency Services in the Country. All information collection through this questionnaire will be kept confidential and will only be used for the preparation of the report and other deliverables of the project. Directorate General NDRF has entrusted RMSI Private Limited to carry out this assignment and State Officials and Official in-charge of Fire Station are requested to provide required authentic information which is very important for preparation of this report and future development plans of the department.
A. Fire Station General Information
State District City/ Town Block / Tehsil Municipality Latitude , Longitude
(to be filled by RMSI)(DDM format) ID
Fire Station Name ……………………………………………………………………………………
Address of the Fire Station (with landmark) ………………………………………………………………………………………. Station Phone number(s) with STD code: 1) .……………………….…. 2)…………………………. 3)………………………………
Fax No: …………………………..
Emergency No: …………………………...
Fire Station Type based on served area: Urban Rural
Name of officer in-charge ……………………………………………………… Designation ……………………………………………..
Mobile number (officer in-charge) : .………………………………………..
Fire station is under the administration of (put tick mark in the box)
State Government Municipal Corporation Police Department Others specify…………………………………………….
The Fire Station falls under the jurisdiction of (Division/Zone/Municipality) -…………………………………………………………………….
Name of Administrative District/Divisional/Zonal Fire Officer- …………………………..……………………………Mobile…………………..
Address/location of District/Divisional/Zonal HQ- ……………………………………………………………………………
Number of total Fire Stations fall under above jurisdiction/ administration- ………………………
Surveyed by: Date: (Signature of Witness from Fire Department)
Name & Designation
SW FS Ref #........................
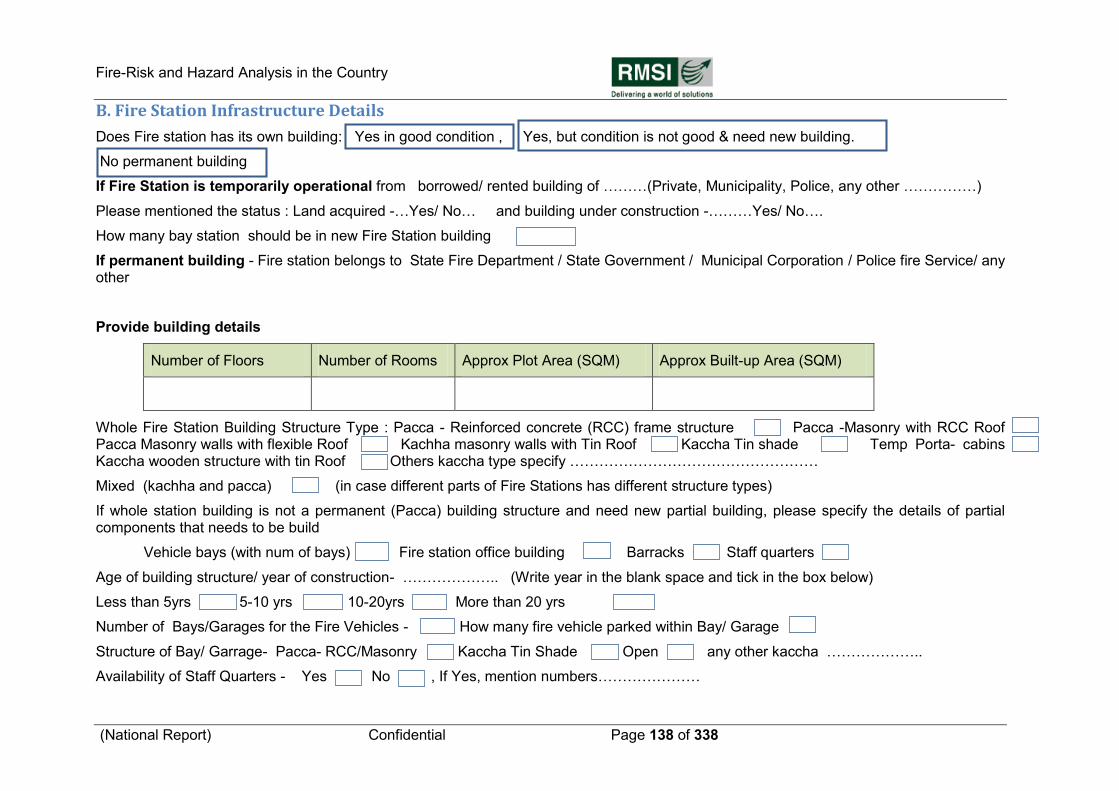
Fire-Risk and Hazard Analysis in the Country
(National Report) Confidential Page 138 of 338
B. Fire Station Infrastructure Details
Does Fire station has its own building: Yes in good condition , Yes, but condition is not good & need new building.
No permanent building
If Fire Station is temporarily operational from borrowed/ rented building of ………(Private, Municipality, Police, any other ……………)
Please mentioned the status : Land acquired -…Yes/ No… and building under construction -………Yes/ No….
How many bay station should be in new Fire Station building
If permanent building - Fire station belongs to State Fire Department / State Government / Municipal Corporation / Police fire Service/ any other
Provide building details
Number of Floors Number of Rooms Approx Plot Area (SQM) Approx Built-up Area (SQM)
Whole Fire Station Building Structure Type : Pacca - Reinforced concrete (RCC) frame structure Pacca -Masonry with RCC Roof Pacca Masonry walls with flexible Roof Kachha masonry walls with Tin Roof Kaccha Tin shade Temp Porta- cabins Kaccha wooden structure with tin Roof Others kaccha type specify ……………………………………………
Mixed (kachha and pacca) (in case different parts of Fire Stations has different structure types)
If whole station building is not a permanent (Pacca) building structure and need new partial building, please specify the details of partial components that needs to be build
Vehicle bays (with num of bays) Fire station office building Barracks Staff quarters
Age of building structure/ year of construction- ……………….. (Write year in the blank space and tick in the box below)
Less than 5yrs 5-10 yrs 10-20yrs More than 20 yrs
Number of Bays/Garages for the Fire Vehicles - , How many fire vehicle parked within Bay/ Garage
Structure of Bay/ Garrage- Pacca- RCC/Masonry Kaccha Tin Shade Open any other kaccha ………………..
Availability of Staff Quarters - Yes No , If Yes, mention numbers…………………
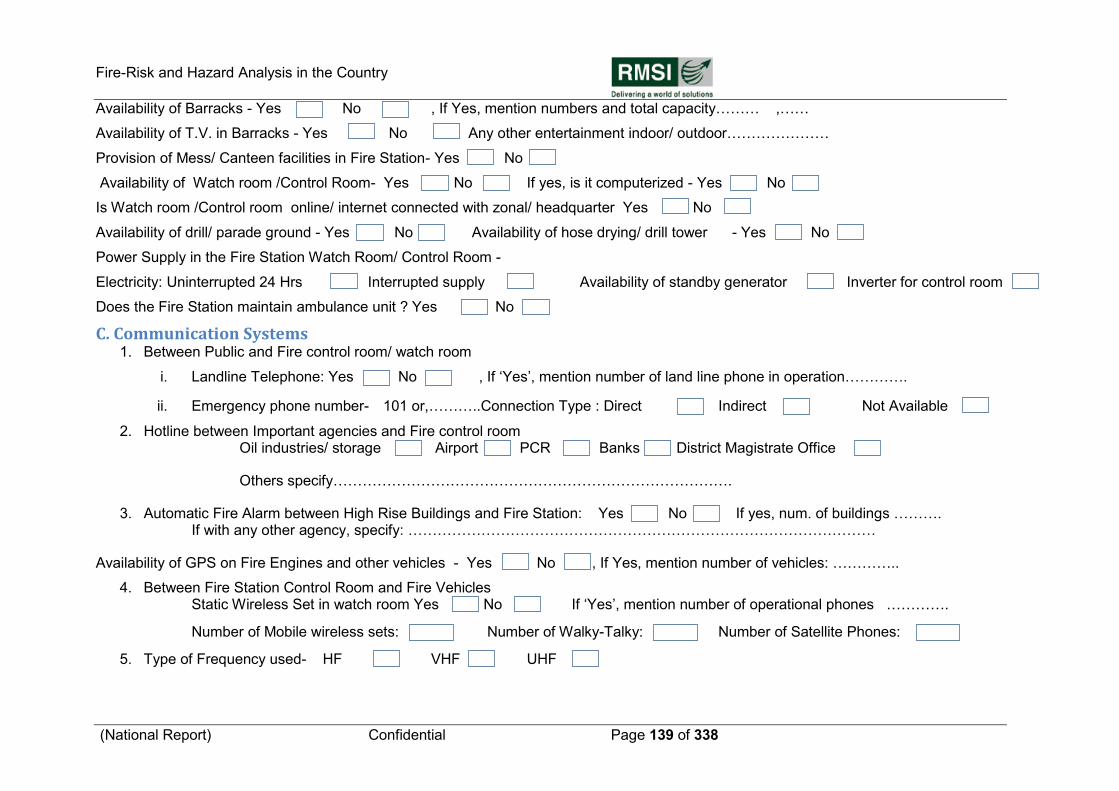
Fire-Risk and Hazard Analysis in the Country
(National Report) Confidential Page 139 of 338
Availability of Barracks - Yes No , If Yes, mention numbers and total capacity……… ,……
Availability of T.V. in Barracks - Yes No Any other entertainment indoor/ outdoor…………………
Provision of Mess/ Canteen facilities in Fire Station- Yes No
Availability of Watch room /Control Room- Yes No If yes, is it computerized - Yes No
Is Watch room /Control room online/ internet connected with zonal/ headquarter Yes No
Availability of drill/ parade ground - Yes No Availability of hose drying/ drill tower - Yes No
Power Supply in the Fire Station Watch Room/ Control Room -
Electricity: Uninterrupted 24 Hrs Interrupted supply Availability of standby generator Inverter for control room
Does the Fire Station maintain ambulance unit ? Yes No
C. Communication Systems 1. Between Public and Fire control room/ watch room
i. Landline Telephone: Yes No , If „Yes‟, mention number of land line phone in operation………….
ii. Emergency phone number- 101 or,………..Connection Type : Direct Indirect Not Available
2. Hotline between Important agencies and Fire control room Oil industries/ storage Airport . PCR Banks District Magistrate Office
Others specify……………………………………………………………………….
3. Automatic Fire Alarm between High Rise Buildings and Fire Station: Yes No If yes, num. of buildings ………. If with any other agency, specify: ……………………………………………………………………………………
Availability of GPS on Fire Engines and other vehicles - Yes No , If Yes, mention number of vehicles: …………..
4. Between Fire Station Control Room and Fire Vehicles Static Wireless Set in watch room Yes No If „Yes‟, mention number of operational phones ………….
Number of Mobile wireless sets: Number of Walky-Talky: Number of Satellite Phones:
5. Type of Frequency used- HF VHF UHF
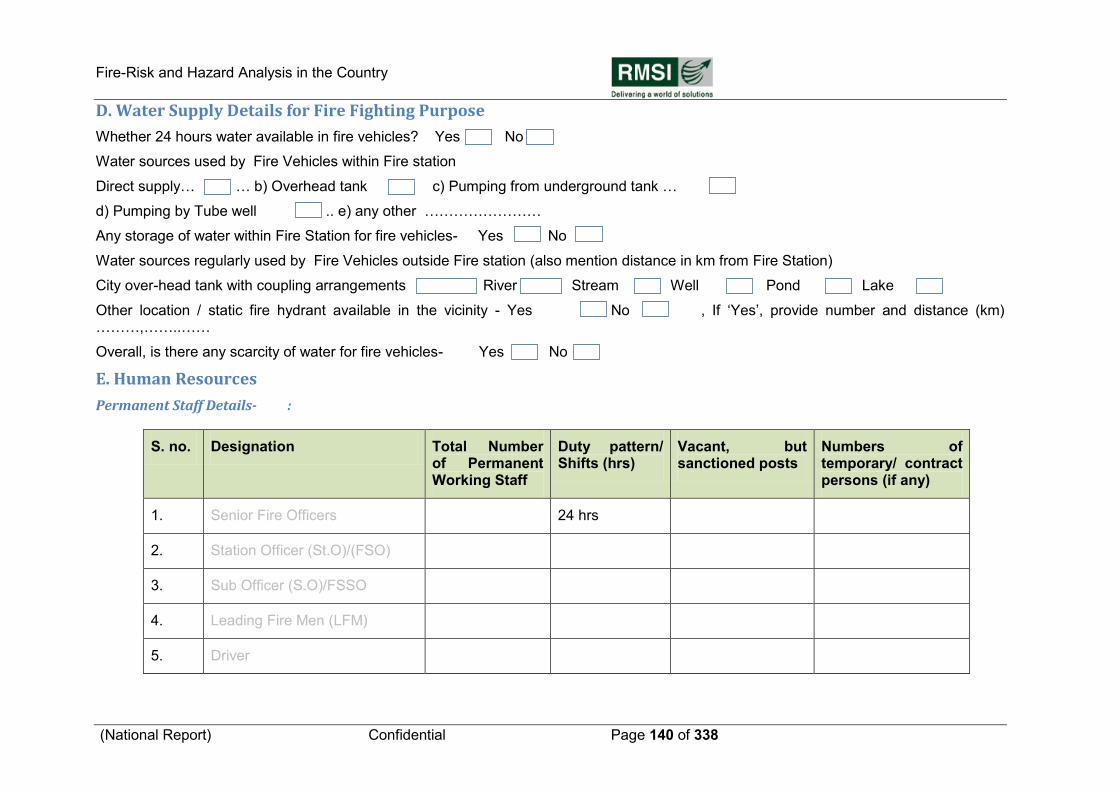
Fire-Risk and Hazard Analysis in the Country
(National Report) Confidential Page 140 of 338
D. Water Supply Details for Fire Fighting Purpose
Whether 24 hours water available in fire vehicles? Yes No
Water sources used by Fire Vehicles within Fire station
Direct supply… … b) Overhead tank c) Pumping from underground tank …
d) Pumping by Tube well .. e) any other ……………………
Any storage of water within Fire Station for fire vehicles- Yes No
Water sources regularly used by Fire Vehicles outside Fire station (also mention distance in km from Fire Station)
City over-head tank with coupling arrangements River Stream Well Pond Lake
Other location / static fire hydrant available in the vicinity - Yes No , If „Yes‟, provide number and distance (km) ………,……..……
Overall, is there any scarcity of water for fire vehicles- Yes No
E. Human Resources
Permanent Staff Details- :
S. no. Designation Total Number of Permanent Working Staff
Duty pattern/ Shifts (hrs)
Vacant, but sanctioned posts
Numbers of temporary/ contract persons (if any)
1. Senior Fire Officers 24 hrs
2. Station Officer (St.O)/(FSO)
3. Sub Officer (S.O)/FSSO
4. Leading Fire Men (LFM)
5. Driver
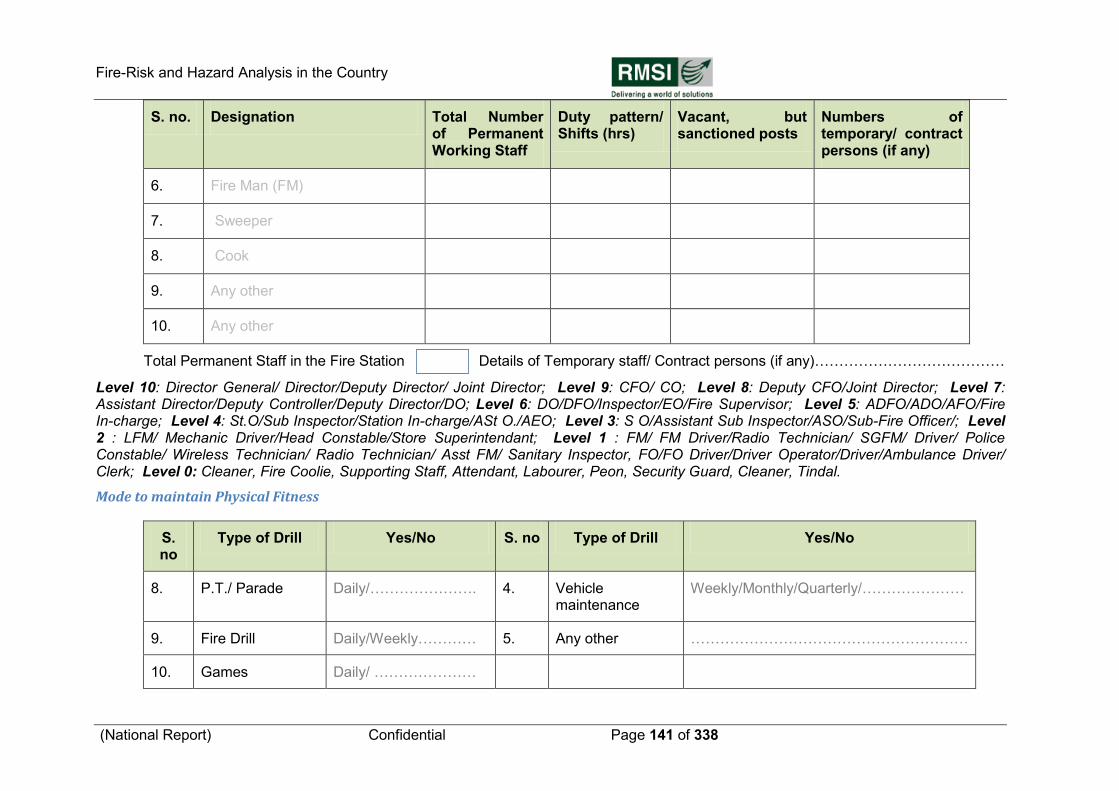
Fire-Risk and Hazard Analysis in the Country
(National Report) Confidential Page 141 of 338
S. no. Designation Total Number of Permanent Working Staff
Duty pattern/ Shifts (hrs)
Vacant, but sanctioned posts
Numbers of temporary/ contract persons (if any)
6. Fire Man (FM)
7. Sweeper
8. Cook
9. Any other
10. Any other
Total Permanent Staff in the Fire Station Details of Temporary staff/ Contract persons (if any)…………………………………
Level 10: Director General/ Director/Deputy Director/ Joint Director; Level 9: CFO/ CO; Level 8: Deputy CFO/Joint Director; Level 7: Assistant Director/Deputy Controller/Deputy Director/DO; Level 6: DO/DFO/Inspector/EO/Fire Supervisor; Level 5: ADFO/ADO/AFO/Fire In-charge; Level 4: St.O/Sub Inspector/Station In-charge/ASt O./AEO; Level 3: S O/Assistant Sub Inspector/ASO/Sub-Fire Officer/; Level 2 : LFM/ Mechanic Driver/Head Constable/Store Superintendant; Level 1 : FM/ FM Driver/Radio Technician/ SGFM/ Driver/ Police Constable/ Wireless Technician/ Radio Technician/ Asst FM/ Sanitary Inspector, FO/FO Driver/Driver Operator/Driver/Ambulance Driver/ Clerk; Level 0: Cleaner, Fire Coolie, Supporting Staff, Attendant, Labourer, Peon, Security Guard, Cleaner, Tindal.
Mode to maintain Physical Fitness
S. no
Type of Drill Yes/No S. no Type of Drill Yes/No
8. P.T./ Parade Daily/…………………. 4. Vehicle maintenance
Weekly/Monthly/Quarterly/…………………
9. Fire Drill Daily/Weekly………… 5. Any other …………………………………………………
10. Games Daily/ …………………
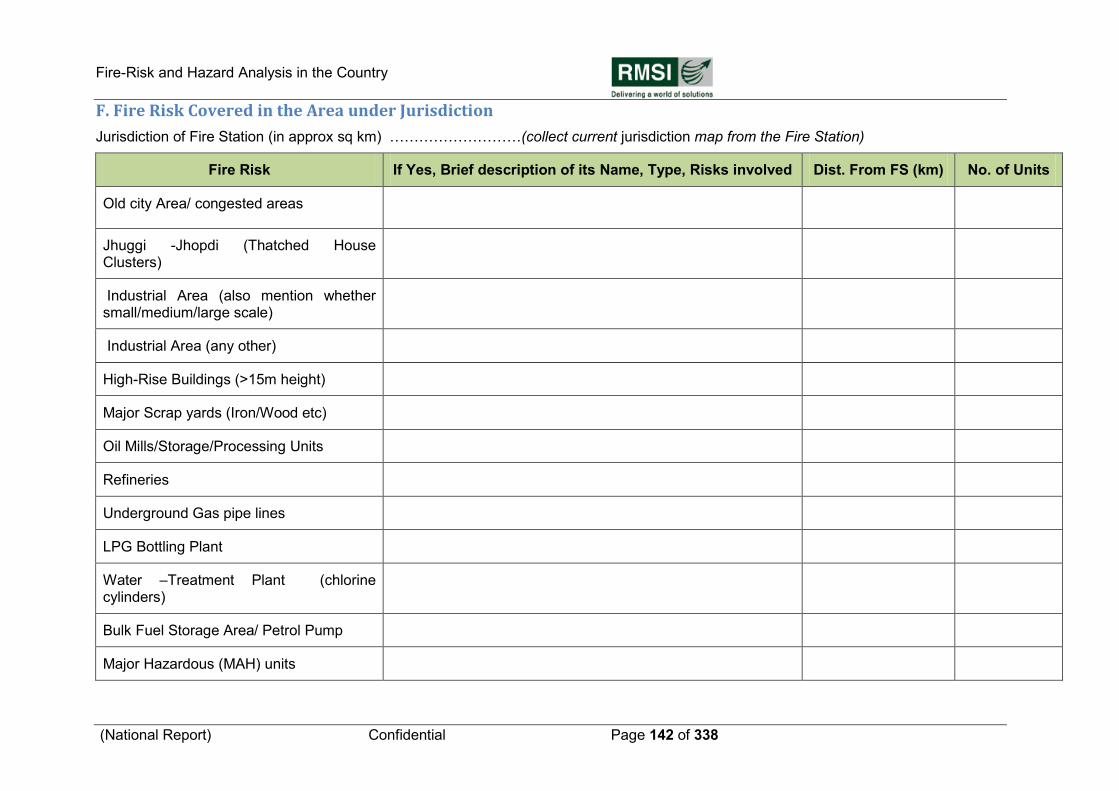
Fire-Risk and Hazard Analysis in the Country
(National Report) Confidential Page 142 of 338
F. Fire Risk Covered in the Area under Jurisdiction
Jurisdiction of Fire Station (in approx sq km) ………………………(collect current jurisdiction map from the Fire Station)
Fire Risk If Yes, Brief description of its Name, Type, Risks involved Dist. From FS (km) No. of Units
Old city Area/ congested areas
Jhuggi -Jhopdi (Thatched House Clusters)
Industrial Area (also mention whether small/medium/large scale)
Industrial Area (any other)
High-Rise Buildings (>15m height)
Major Scrap yards (Iron/Wood etc)
Oil Mills/Storage/Processing Units
Refineries
Underground Gas pipe lines
LPG Bottling Plant
Water –Treatment Plant (chlorine cylinders)
Bulk Fuel Storage Area/ Petrol Pump
Major Hazardous (MAH) units
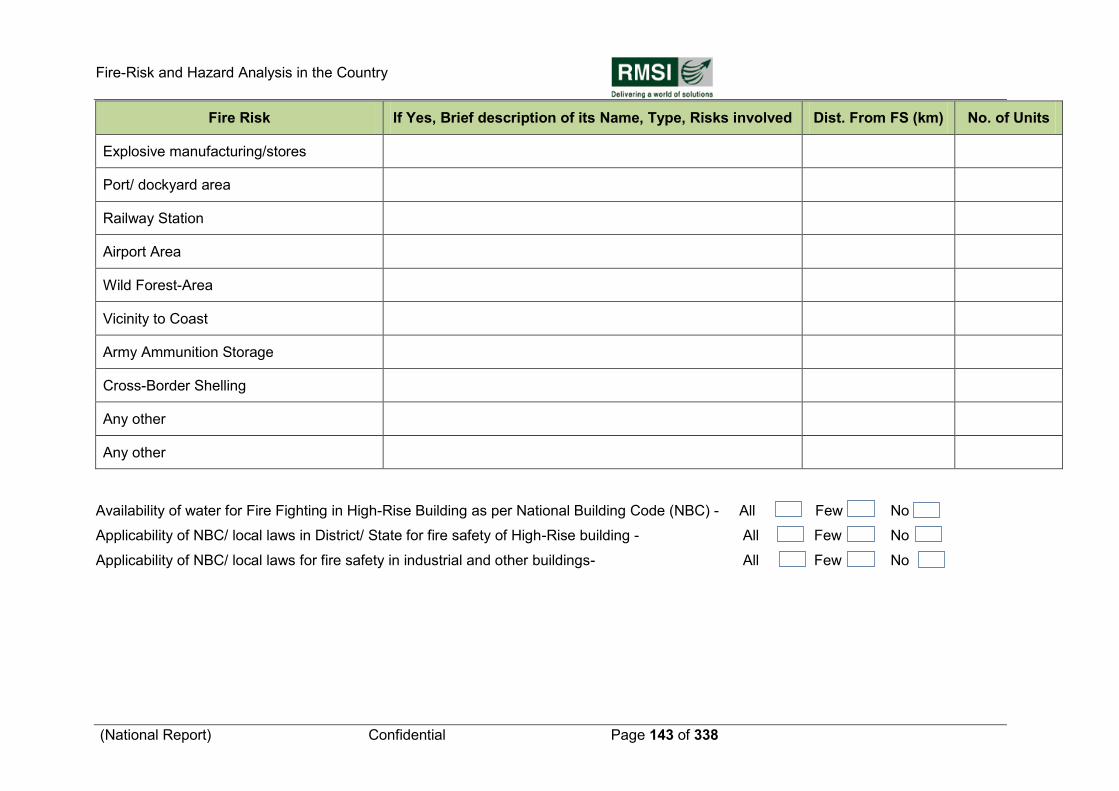
Fire-Risk and Hazard Analysis in the Country
(National Report) Confidential Page 143 of 338
Fire Risk If Yes, Brief description of its Name, Type, Risks involved Dist. From FS (km) No. of Units
Explosive manufacturing/stores
Port/ dockyard area
Railway Station
Airport Area
Wild Forest-Area
Vicinity to Coast
Army Ammunition Storage
Cross-Border Shelling
Any other
Any other
Availability of water for Fire Fighting in High-Rise Building as per National Building Code (NBC) - All Few No
Applicability of NBC/ local laws in District/ State for fire safety of High-Rise building - All Few No
Applicability of NBC/ local laws for fire safety in industrial and other buildings- All Few No
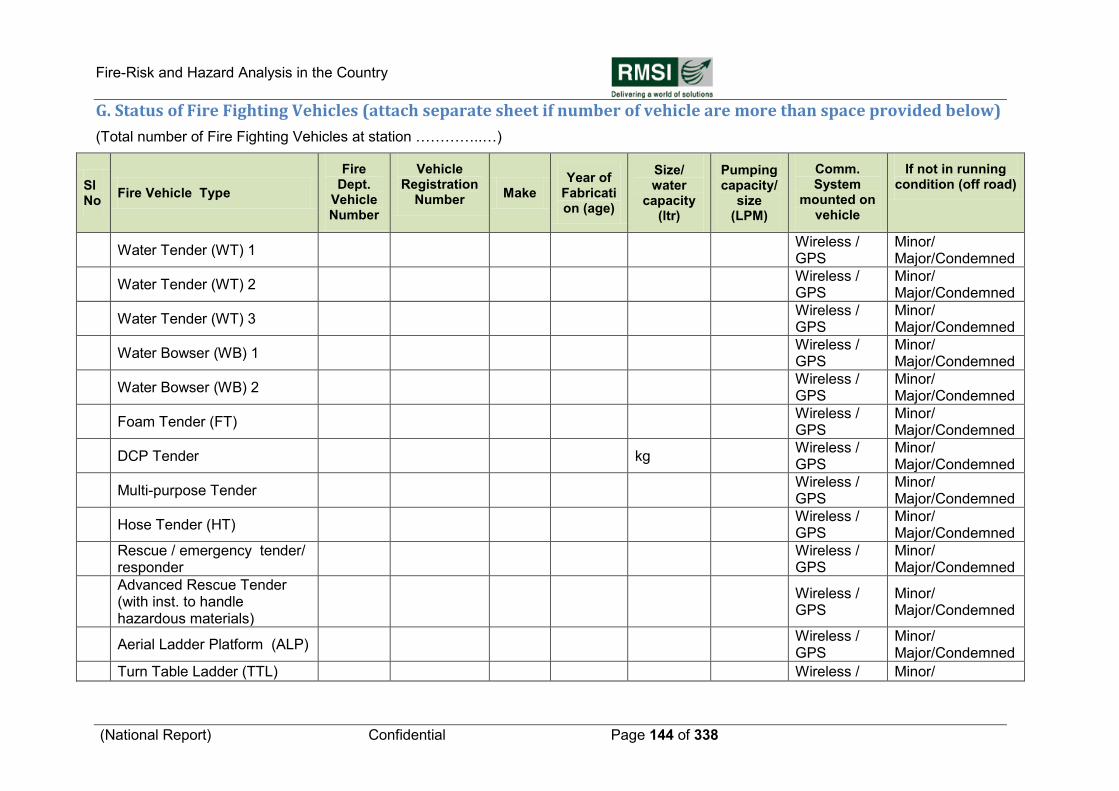
Fire-Risk and Hazard Analysis in the Country
(National Report) Confidential Page 144 of 338
G. Status of Fire Fighting Vehicles (attach separate sheet if number of vehicle are more than space provided below)
(Total number of Fire Fighting Vehicles at station …………..…)
Sl No
Fire Vehicle Type
Fire Dept.
Vehicle Number
Vehicle Registration
Number Make
Year of Fabrication (age)
Size/ water
capacity (ltr)
Pumping capacity/
size (LPM)
Comm. System
mounted on vehicle
If not in running condition (off road)
Water Tender (WT) 1 Wireless / GPS
Minor/ Major/Condemned
Water Tender (WT) 2 Wireless / GPS
Minor/ Major/Condemned
Water Tender (WT) 3 Wireless / GPS
Minor/ Major/Condemned
Water Bowser (WB) 1 Wireless / GPS
Minor/ Major/Condemned
Water Bowser (WB) 2 Wireless / GPS
Minor/ Major/Condemned
Foam Tender (FT) Wireless / GPS
Minor/ Major/Condemned
DCP Tender kg Wireless / GPS
Minor/ Major/Condemned
Multi-purpose Tender Wireless / GPS
Minor/ Major/Condemned
Hose Tender (HT) Wireless / GPS
Minor/ Major/Condemned
Rescue / emergency tender/ responder
Wireless / GPS
Minor/ Major/Condemned
Advanced Rescue Tender (with inst. to handle hazardous materials)
Wireless / GPS
Minor/ Major/Condemned
Aerial Ladder Platform (ALP) Wireless / GPS
Minor/ Major/Condemned
Turn Table Ladder (TTL) Wireless / Minor/
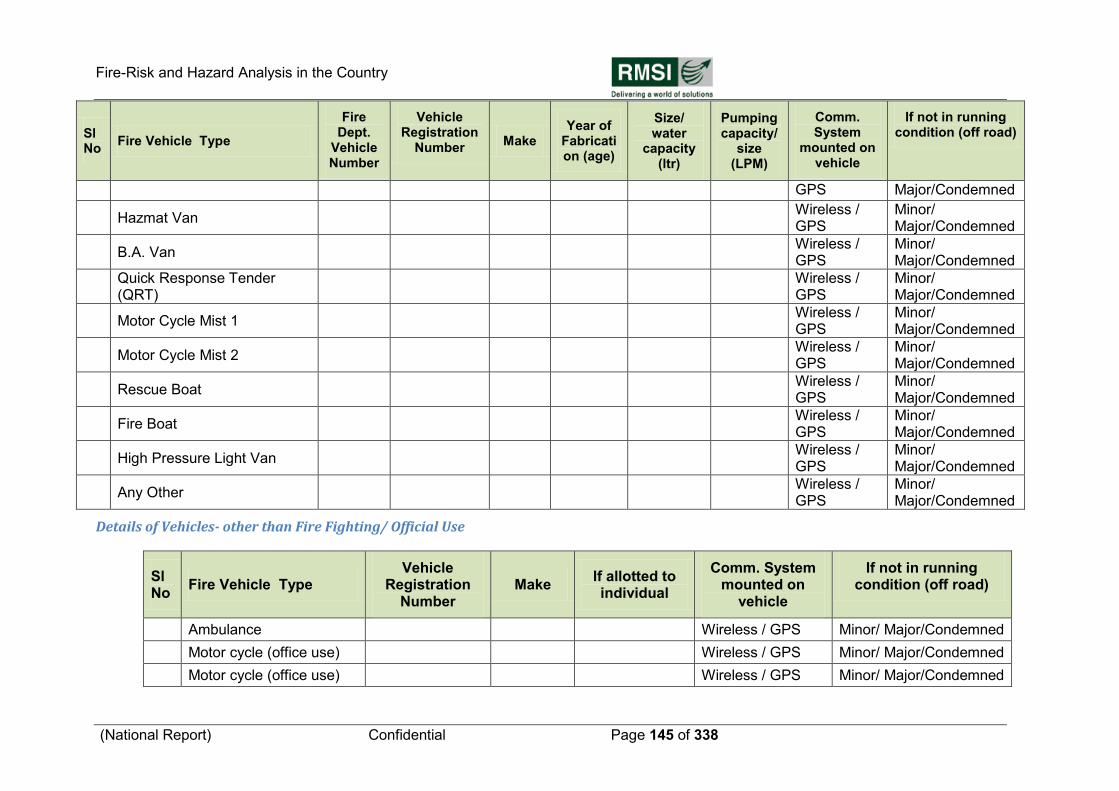
Fire-Risk and Hazard Analysis in the Country
(National Report) Confidential Page 145 of 338
Sl No
Fire Vehicle Type
Fire Dept.
Vehicle Number
Vehicle Registration
Number Make
Year of Fabrication (age)
Size/ water
capacity (ltr)
Pumping capacity/
size (LPM)
Comm. System
mounted on vehicle
If not in running condition (off road)
GPS Major/Condemned
Hazmat Van Wireless / GPS
Minor/ Major/Condemned
B.A. Van Wireless / GPS
Minor/ Major/Condemned
Quick Response Tender (QRT)
Wireless / GPS
Minor/ Major/Condemned
Motor Cycle Mist 1 Wireless / GPS
Minor/ Major/Condemned
Motor Cycle Mist 2 Wireless / GPS
Minor/ Major/Condemned
Rescue Boat Wireless / GPS
Minor/ Major/Condemned
Fire Boat Wireless / GPS
Minor/ Major/Condemned
High Pressure Light Van Wireless / GPS
Minor/ Major/Condemned
Any Other Wireless / GPS
Minor/ Major/Condemned
Details of Vehicles- other than Fire Fighting/ Official Use
Sl No
Fire Vehicle Type Vehicle
Registration Number
Make If allotted to individual
Comm. System mounted on
vehicle
If not in running condition (off road)
Ambulance Wireless / GPS Minor/ Major/Condemned
Motor cycle (office use) Wireless / GPS Minor/ Major/Condemned
Motor cycle (office use) Wireless / GPS Minor/ Major/Condemned
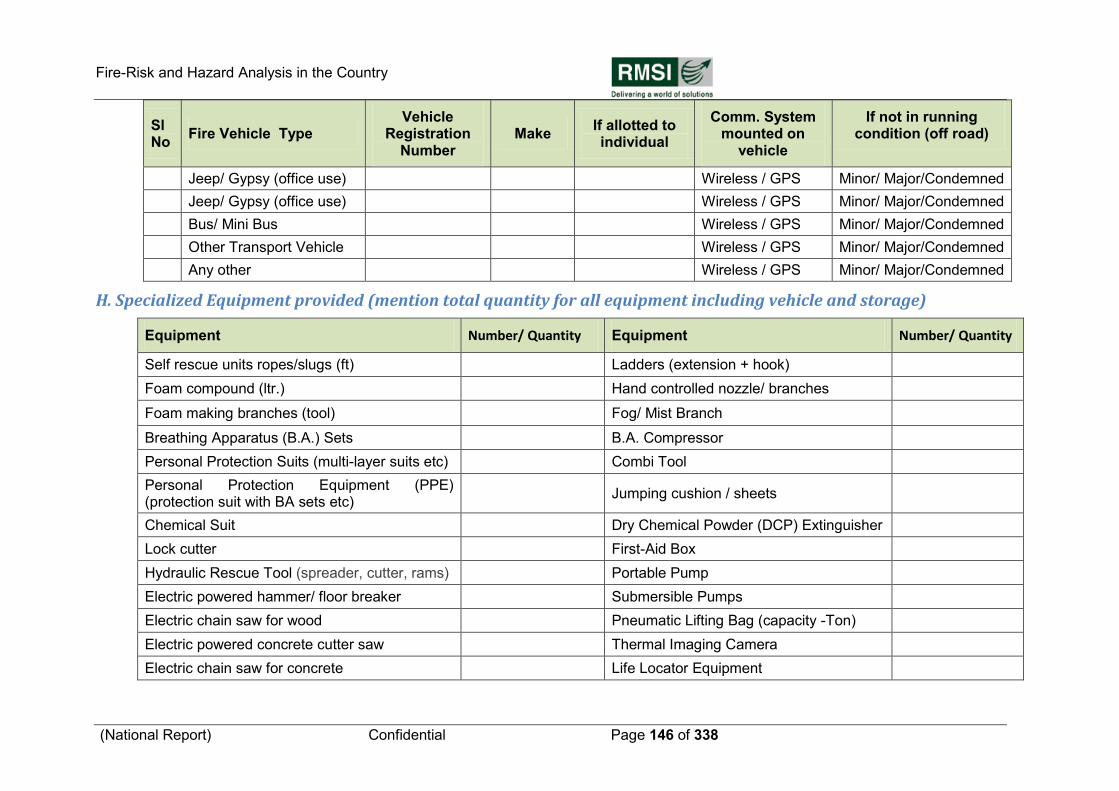
Fire-Risk and Hazard Analysis in the Country
(National Report) Confidential Page 146 of 338
Sl No
Fire Vehicle Type Vehicle
Registration Number
Make If allotted to individual
Comm. System mounted on
vehicle
If not in running condition (off road)
Jeep/ Gypsy (office use) Wireless / GPS Minor/ Major/Condemned
Jeep/ Gypsy (office use) Wireless / GPS Minor/ Major/Condemned
Bus/ Mini Bus Wireless / GPS Minor/ Major/Condemned
Other Transport Vehicle Wireless / GPS Minor/ Major/Condemned
Any other Wireless / GPS Minor/ Major/Condemned
H. Specialized Equipment provided (mention total quantity for all equipment including vehicle and storage)
Equipment Number/ Quantity Equipment Number/ Quantity
Self rescue units ropes/slugs (ft) Ladders (extension + hook)
Foam compound (ltr.) Hand controlled nozzle/ branches
Foam making branches (tool) Fog/ Mist Branch
Breathing Apparatus (B.A.) Sets B.A. Compressor
Personal Protection Suits (multi-layer suits etc) Combi Tool
Personal Protection Equipment (PPE) (protection suit with BA sets etc)
Jumping cushion / sheets
Chemical Suit Dry Chemical Powder (DCP) Extinguisher
Lock cutter First-Aid Box
Hydraulic Rescue Tool (spreader, cutter, rams) Portable Pump
Electric powered hammer/ floor breaker Submersible Pumps
Electric chain saw for wood Pneumatic Lifting Bag (capacity -Ton)
Electric powered concrete cutter saw Thermal Imaging Camera
Electric chain saw for concrete Life Locator Equipment
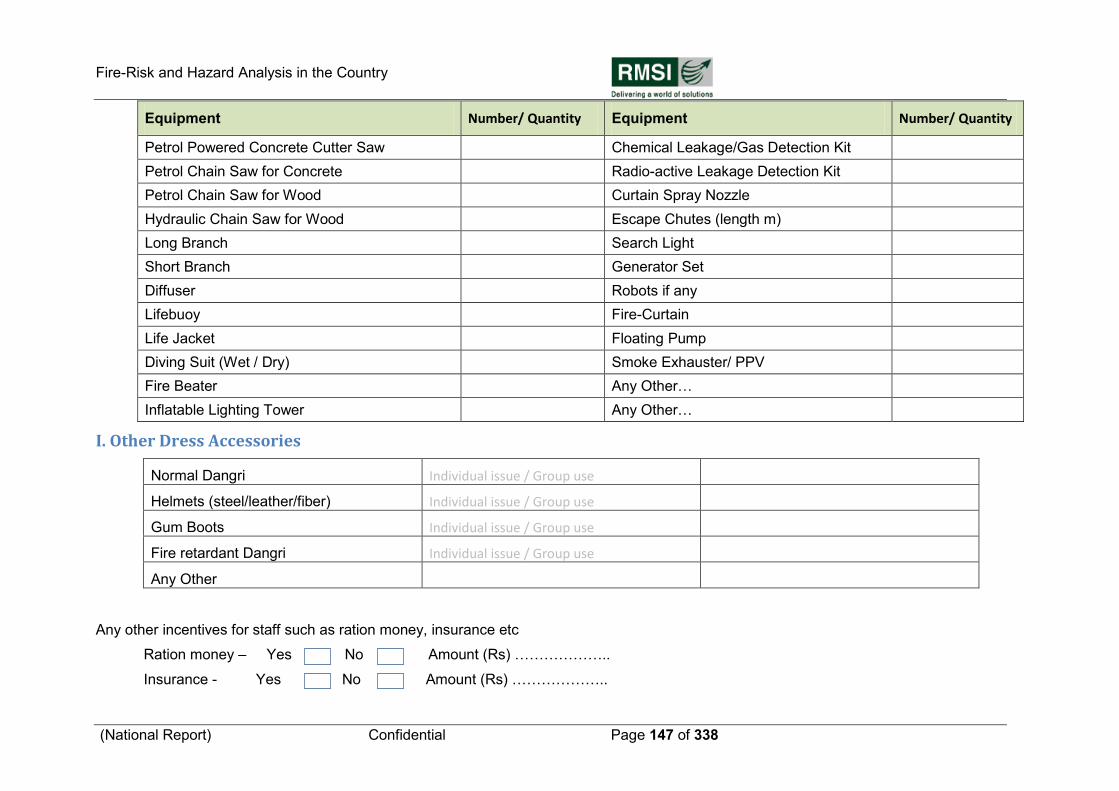
Fire-Risk and Hazard Analysis in the Country
(National Report) Confidential Page 147 of 338
Equipment Number/ Quantity Equipment Number/ Quantity
Petrol Powered Concrete Cutter Saw Chemical Leakage/Gas Detection Kit
Petrol Chain Saw for Concrete Radio-active Leakage Detection Kit
Petrol Chain Saw for Wood Curtain Spray Nozzle
Hydraulic Chain Saw for Wood Escape Chutes (length m)
Long Branch Search Light
Short Branch Generator Set
Diffuser Robots if any
Lifebuoy Fire-Curtain
Life Jacket Floating Pump
Diving Suit (Wet / Dry) Smoke Exhauster/ PPV
Fire Beater Any Other…
Inflatable Lighting Tower Any Other…
I. Other Dress Accessories
Normal Dangri Individual issue / Group use
Helmets (steel/leather/fiber) Individual issue / Group use
Gum Boots Individual issue / Group use
Fire retardant Dangri Individual issue / Group use
Any Other
Any other incentives for staff such as ration money, insurance etc
Ration money – Yes No Amount (Rs) ………………..
Insurance - Yes No Amount (Rs) ………………..
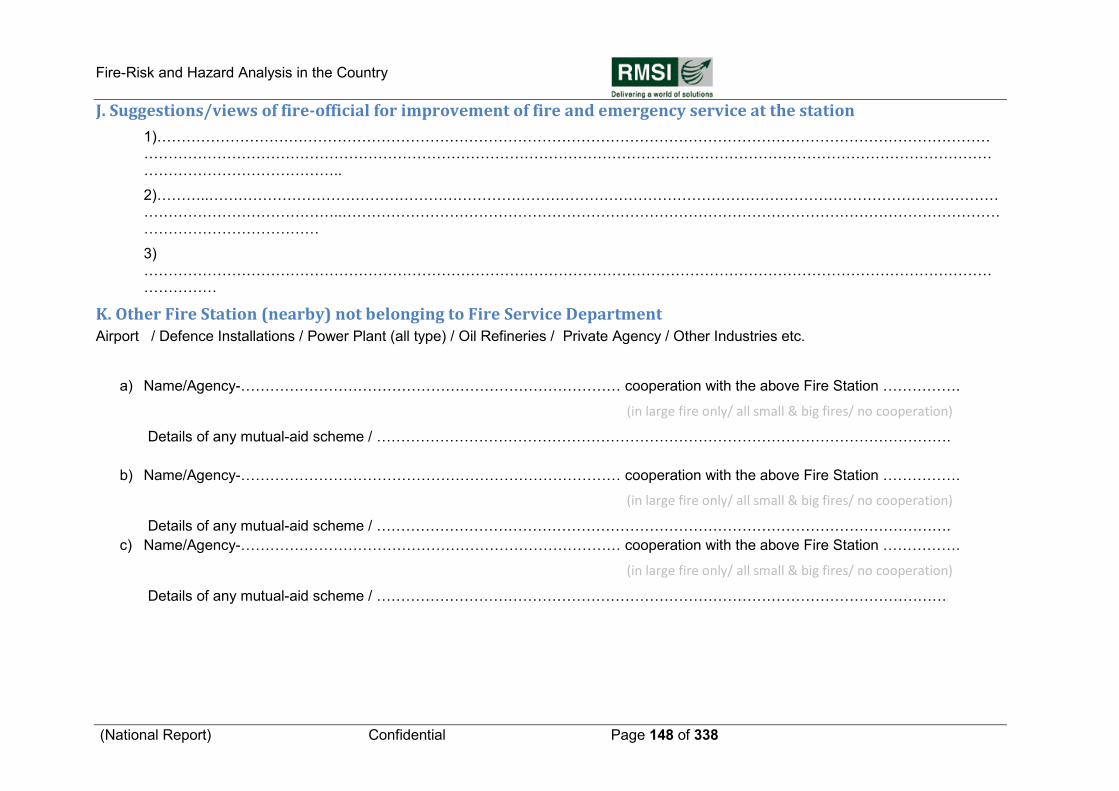
Fire-Risk and Hazard Analysis in the Country
(National Report) Confidential Page 148 of 338
J. Suggestions/views of fire-official for improvement of fire and emergency service at the station
1)……………………………………………………………………………………………………………………………………………………………………………………………………………………………………………………………………………………………………………………………………………………..
2)………..…………………………………………………………………………………………………………………………………………………………………………………..………………………………………………………………………………………………………………………………………………………
3) ………………………………………………………………………………………………………………………………………………………………………
K. Other Fire Station (nearby) not belonging to Fire Service Department Airport / Defence Installations / Power Plant (all type) / Oil Refineries / Private Agency / Other Industries etc.
a) Name/Agency-…………………………………………………………………… cooperation with the above Fire Station …………….
(in large fire only/ all small & big fires/ no cooperation)
Details of any mutual-aid scheme / ……………………………………………………………………………………………………….
b) Name/Agency-…………………………………………………………………… cooperation with the above Fire Station …………….
(in large fire only/ all small & big fires/ no cooperation)
Details of any mutual-aid scheme / ……………………………………………………………………………………………………….
c) Name/Agency-…………………………………………………………………… cooperation with the above Fire Station …………….
(in large fire only/ all small & big fires/ no cooperation)
Details of any mutual-aid scheme / ………………………………………………………………………………………………………
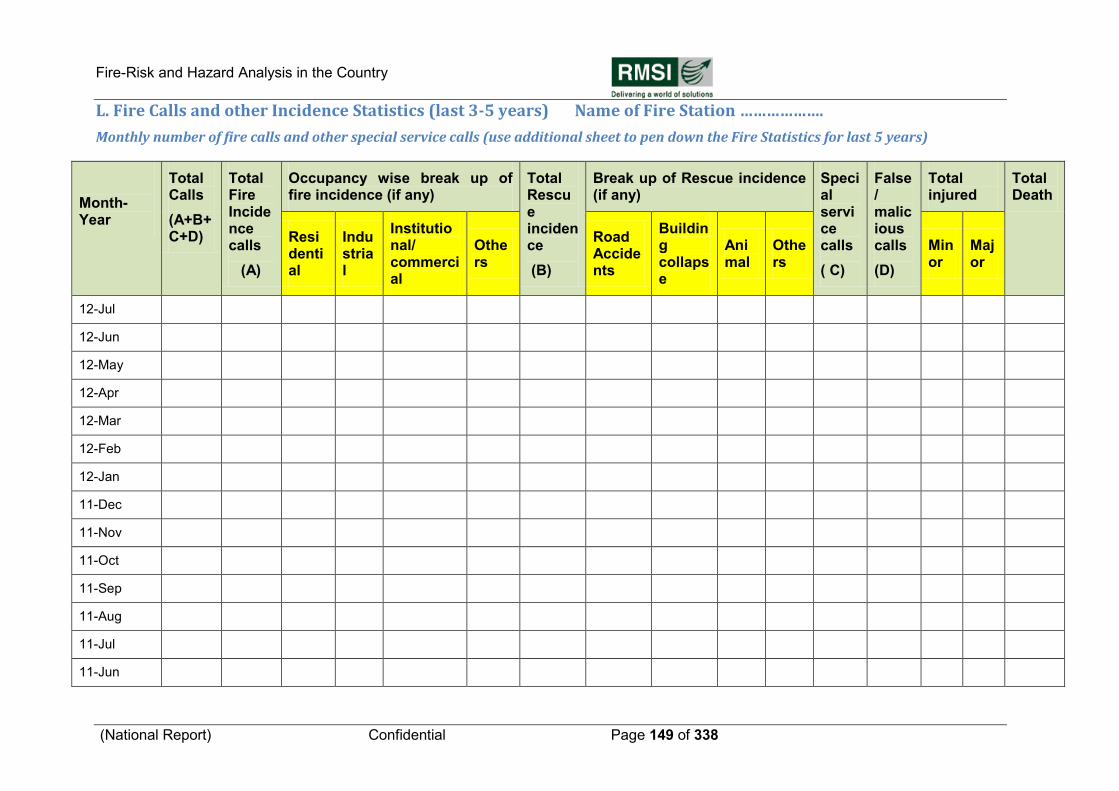
Fire-Risk and Hazard Analysis in the Country
(National Report) Confidential Page 149 of 338
L. Fire Calls and other Incidence Statistics (last 3-5 years) Name of Fire Station ……………….
Monthly number of fire calls and other special service calls (use additional sheet to pen down the Fire Statistics for last 5 years)
Month-Year
Total Calls
(A+B+C+D)
Total Fire Incidence calls
(A)
Occupancy wise break up of fire incidence (if any)
Total Rescue incidence
(B)
Break up of Rescue incidence (if any)
Special service calls
( C)
False/ malicious calls
(D)
Total injured
Total Death
Residential
Industrial
Institutional/ commercial
Others
Road Accidents
Building collapse
Animal
Others
Minor
Major
12-Jul
12-Jun
12-May
12-Apr
12-Mar
12-Feb
12-Jan
11-Dec
11-Nov
11-Oct
11-Sep
11-Aug
11-Jul
11-Jun
Fire-Risk and Hazard Analysis in the Country
(National Report) Confidential Page 150 of 338
11-May
11-Apr
11-Mar
11-Feb
11-Jan
10-Dec
10-Nov
10-Oct
10-Sep
10-Aug
10-Jul
10-Jun
10-May
10-Apr
10-Mar
10-Feb
10-Jan
9-Dec
9-Nov
9-Oct
9-Sep
Fire-Risk and Hazard Analysis in the Country
(National Report) Confidential Page 151 of 338
9-Aug
9-Jul
9-Jun
9-May
9-Apr
9-Mar
9-Feb
9-Jan
8-Dec
8-Nov
8-Oct
8-Sep
8-Aug
Please send Fire call statistics to : Mr. Sushil Gupta (General Manager), Risk Modeling & Insurance,
A-7, RMSI, Sector 16, Noida 201301, Fax: 0120 2511109
Mobile: 08826100332, phone: 0120 4040512(direct)

Fire-Risk and Hazard Analysis in the Country
(National Report) Confidential Page 152 of 338
PART B
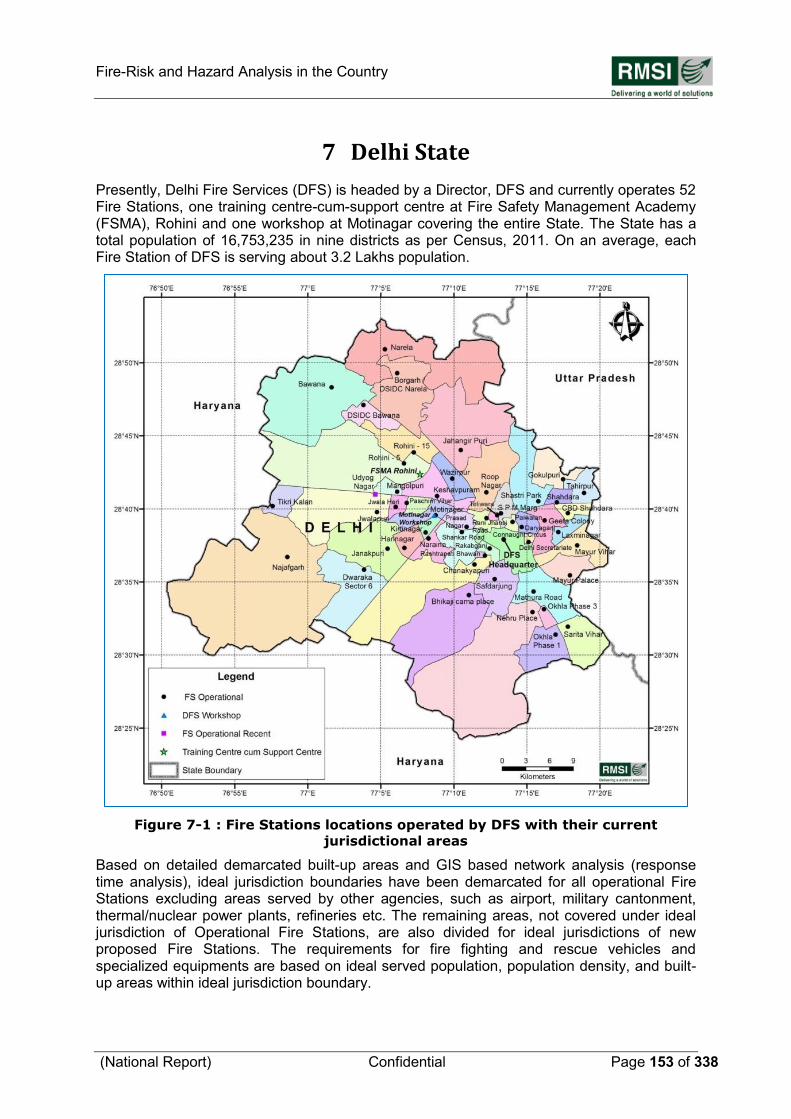
Fire-Risk and Hazard Analysis in the Country
(National Report) Confidential Page 153 of 338
7 Delhi State
Presently, Delhi Fire Services (DFS) is headed by a Director, DFS and currently operates 52 Fire Stations, one training centre-cum-support centre at Fire Safety Management Academy (FSMA), Rohini and one workshop at Motinagar covering the entire State. The State has a total population of 16,753,235 in nine districts as per Census, 2011. On an average, each Fire Station of DFS is serving about 3.2 Lakhs population.
Figure 7-1 : Fire Stations locations operated by DFS with their current
jurisdictional areas
Based on detailed demarcated built-up areas and GIS based network analysis (response time analysis), ideal jurisdiction boundaries have been demarcated for all operational Fire Stations excluding areas served by other agencies, such as airport, military cantonment, thermal/nuclear power plants, refineries etc. The remaining areas, not covered under ideal jurisdiction of Operational Fire Stations, are also divided for ideal jurisdictions of new proposed Fire Stations. The requirements for fire fighting and rescue vehicles and specialized equipments are based on ideal served population, population density, and built-up areas within ideal jurisdiction boundary.
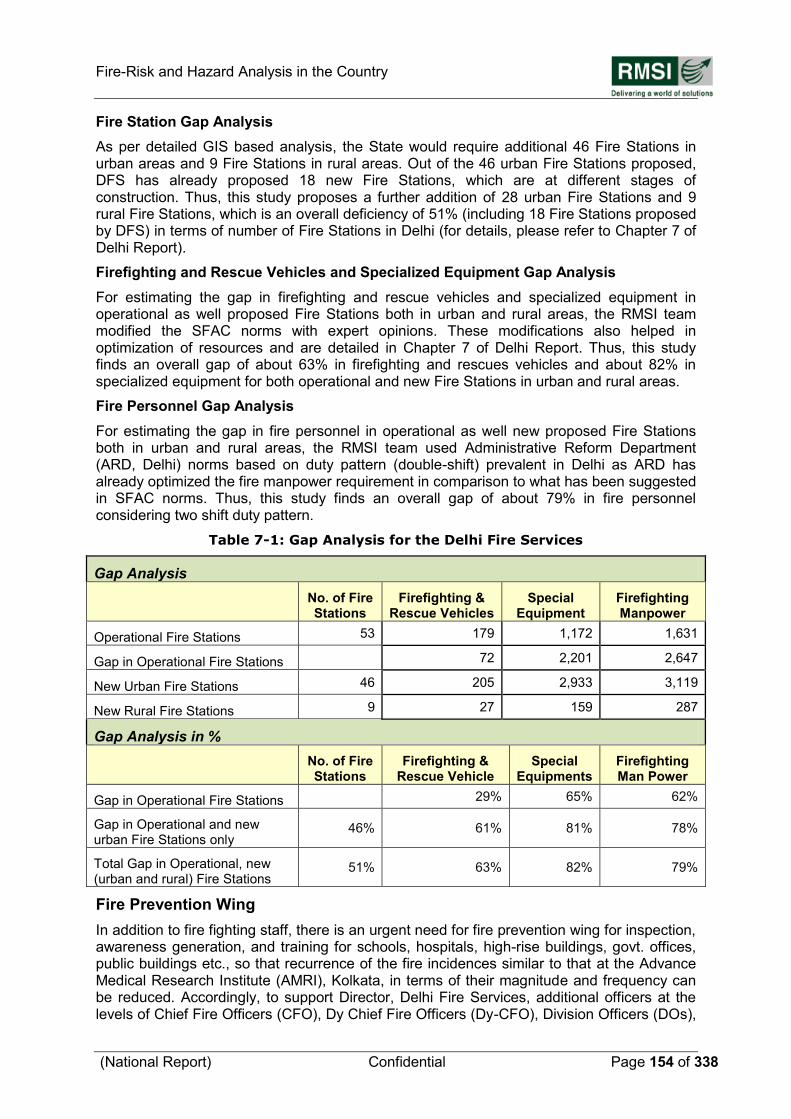
Fire-Risk and Hazard Analysis in the Country
(National Report) Confidential Page 154 of 338
Fire Station Gap Analysis
As per detailed GIS based analysis, the State would require additional 46 Fire Stations in urban areas and 9 Fire Stations in rural areas. Out of the 46 urban Fire Stations proposed, DFS has already proposed 18 new Fire Stations, which are at different stages of construction. Thus, this study proposes a further addition of 28 urban Fire Stations and 9 rural Fire Stations, which is an overall deficiency of 51% (including 18 Fire Stations proposed by DFS) in terms of number of Fire Stations in Delhi (for details, please refer to Chapter 7 of Delhi Report).
Firefighting and Rescue Vehicles and Specialized Equipment Gap Analysis
For estimating the gap in firefighting and rescue vehicles and specialized equipment in operational as well proposed Fire Stations both in urban and rural areas, the RMSI team modified the SFAC norms with expert opinions. These modifications also helped in optimization of resources and are detailed in Chapter 7 of Delhi Report. Thus, this study finds an overall gap of about 63% in firefighting and rescues vehicles and about 82% in specialized equipment for both operational and new Fire Stations in urban and rural areas.
Fire Personnel Gap Analysis
For estimating the gap in fire personnel in operational as well new proposed Fire Stations both in urban and rural areas, the RMSI team used Administrative Reform Department (ARD, Delhi) norms based on duty pattern (double-shift) prevalent in Delhi as ARD has already optimized the fire manpower requirement in comparison to what has been suggested in SFAC norms. Thus, this study finds an overall gap of about 79% in fire personnel considering two shift duty pattern.
Table 7-1: Gap Analysis for the Delhi Fire Services
Gap Analysis
No. of Fire Stations
Firefighting & Rescue Vehicles
Special Equipment
Firefighting Manpower
Operational Fire Stations 53 179 1,172 1,631
Gap in Operational Fire Stations 72 2,201 2,647
New Urban Fire Stations 46 205 2,933 3,119
New Rural Fire Stations 9 27 159 287
Gap Analysis in %
No. of Fire Stations
Firefighting & Rescue Vehicle
Special Equipments
Firefighting Man Power
Gap in Operational Fire Stations 29% 65% 62%
Gap in Operational and new urban Fire Stations only
46% 61% 81% 78%
Total Gap in Operational, new (urban and rural) Fire Stations
51% 63% 82% 79%
Fire Prevention Wing
In addition to fire fighting staff, there is an urgent need for fire prevention wing for inspection, awareness generation, and training for schools, hospitals, high-rise buildings, govt. offices, public buildings etc., so that recurrence of the fire incidences similar to that at the Advance Medical Research Institute (AMRI), Kolkata, in terms of their magnitude and frequency can be reduced. Accordingly, to support Director, Delhi Fire Services, additional officers at the levels of Chief Fire Officers (CFO), Dy Chief Fire Officers (Dy-CFO), Division Officers (DOs),
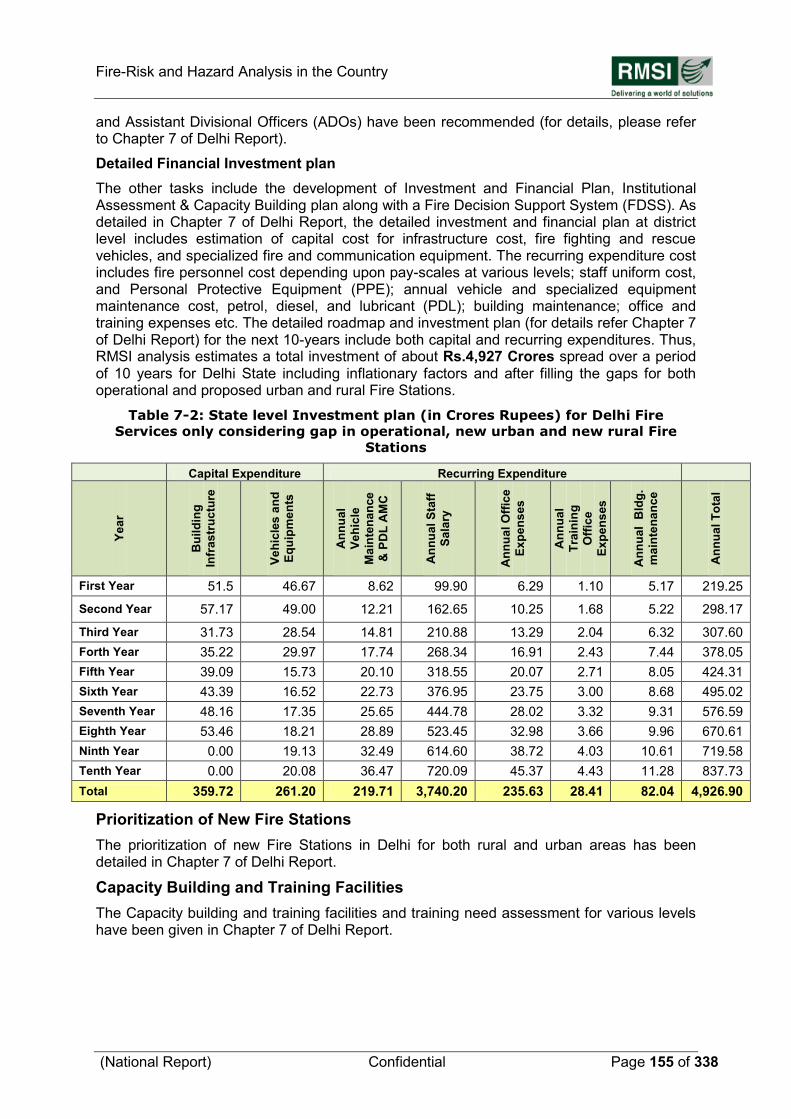
Fire-Risk and Hazard Analysis in the Country
(National Report) Confidential Page 155 of 338
and Assistant Divisional Officers (ADOs) have been recommended (for details, please refer to Chapter 7 of Delhi Report).
Detailed Financial Investment plan
The other tasks include the development of Investment and Financial Plan, Institutional Assessment & Capacity Building plan along with a Fire Decision Support System (FDSS). As detailed in Chapter 7 of Delhi Report, the detailed investment and financial plan at district level includes estimation of capital cost for infrastructure cost, fire fighting and rescue vehicles, and specialized fire and communication equipment. The recurring expenditure cost includes fire personnel cost depending upon pay-scales at various levels; staff uniform cost, and Personal Protective Equipment (PPE); annual vehicle and specialized equipment maintenance cost, petrol, diesel, and lubricant (PDL); building maintenance; office and training expenses etc. The detailed roadmap and investment plan (for details refer Chapter 7 of Delhi Report) for the next 10-years include both capital and recurring expenditures. Thus, RMSI analysis estimates a total investment of about Rs.4,927 Crores spread over a period of 10 years for Delhi State including inflationary factors and after filling the gaps for both operational and proposed urban and rural Fire Stations.
Table 7-2: State level Investment plan (in Crores Rupees) for Delhi Fire
Services only considering gap in operational, new urban and new rural Fire
Stations
Capital Expenditure Recurring Expenditure
Ye
ar
Bu
ild
ing
Infr
as
tru
ctu
re
Ve
hic
les
an
d
Eq
uip
me
nts
An
nu
al
Ve
hic
le
Ma
inte
na
nce
& P
DL
AM
C
An
nu
al
Sta
ff
Sa
lary
An
nu
al
Off
ice
Ex
pe
ns
es
An
nu
al
Tra
inin
g
Off
ice
Ex
pe
ns
es
An
nu
al
Bld
g.
ma
inte
na
nc
e
An
nu
al
To
tal
First Year 51.5 46.67 8.62 99.90 6.29 1.10 5.17 219.25
Second Year 57.17 49.00 12.21 162.65 10.25 1.68 5.22 298.17
Third Year 31.73 28.54 14.81 210.88 13.29 2.04 6.32 307.60
Forth Year 35.22 29.97 17.74 268.34 16.91 2.43 7.44 378.05
Fifth Year 39.09 15.73 20.10 318.55 20.07 2.71 8.05 424.31
Sixth Year 43.39 16.52 22.73 376.95 23.75 3.00 8.68 495.02
Seventh Year 48.16 17.35 25.65 444.78 28.02 3.32 9.31 576.59
Eighth Year 53.46 18.21 28.89 523.45 32.98 3.66 9.96 670.61
Ninth Year 0.00 19.13 32.49 614.60 38.72 4.03 10.61 719.58
Tenth Year 0.00 20.08 36.47 720.09 45.37 4.43 11.28 837.73
Total 359.72 261.20 219.71 3,740.20 235.63 28.41 82.04 4,926.90
Prioritization of New Fire Stations
The prioritization of new Fire Stations in Delhi for both rural and urban areas has been detailed in Chapter 7 of Delhi Report.
Capacity Building and Training Facilities
The Capacity building and training facilities and training need assessment for various levels have been given in Chapter 7 of Delhi Report.
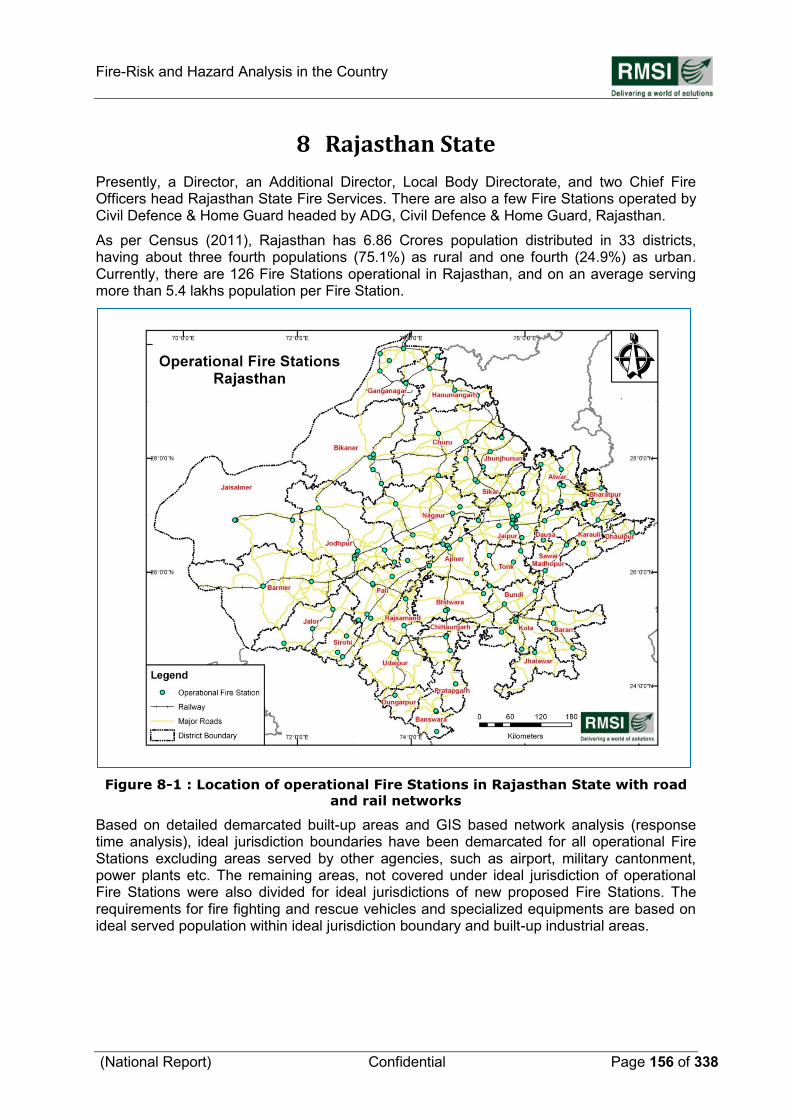
Fire-Risk and Hazard Analysis in the Country
(National Report) Confidential Page 156 of 338
8 Rajasthan State
Presently, a Director, an Additional Director, Local Body Directorate, and two Chief Fire Officers head Rajasthan State Fire Services. There are also a few Fire Stations operated by Civil Defence & Home Guard headed by ADG, Civil Defence & Home Guard, Rajasthan.
As per Census (2011), Rajasthan has 6.86 Crores population distributed in 33 districts, having about three fourth populations (75.1%) as rural and one fourth (24.9%) as urban. Currently, there are 126 Fire Stations operational in Rajasthan, and on an average serving more than 5.4 lakhs population per Fire Station.
Figure 8-1 : Location of operational Fire Stations in Rajasthan State with road
and rail networks
Based on detailed demarcated built-up areas and GIS based network analysis (response time analysis), ideal jurisdiction boundaries have been demarcated for all operational Fire Stations excluding areas served by other agencies, such as airport, military cantonment, power plants etc. The remaining areas, not covered under ideal jurisdiction of operational Fire Stations were also divided for ideal jurisdictions of new proposed Fire Stations. The requirements for fire fighting and rescue vehicles and specialized equipments are based on ideal served population within ideal jurisdiction boundary and built-up industrial areas.
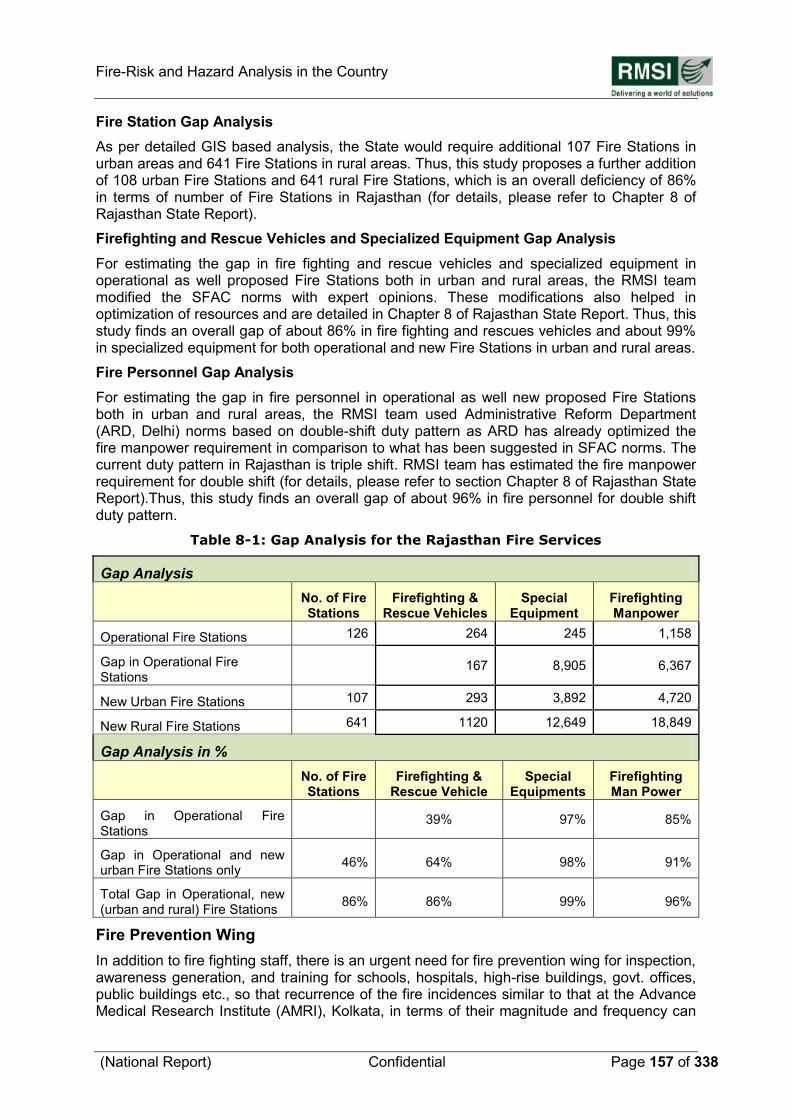
Fire-Risk and Hazard Analysis in the Country
(National Report) Confidential Page 157 of 338
Fire Station Gap Analysis
As per detailed GIS based analysis, the State would require additional 107 Fire Stations in urban areas and 641 Fire Stations in rural areas. Thus, this study proposes a further addition of 108 urban Fire Stations and 641 rural Fire Stations, which is an overall deficiency of 86% in terms of number of Fire Stations in Rajasthan (for details, please refer to Chapter 8 of Rajasthan State Report).
Firefighting and Rescue Vehicles and Specialized Equipment Gap Analysis
For estimating the gap in fire fighting and rescue vehicles and specialized equipment in operational as well proposed Fire Stations both in urban and rural areas, the RMSI team modified the SFAC norms with expert opinions. These modifications also helped in optimization of resources and are detailed in Chapter 8 of Rajasthan State Report. Thus, this study finds an overall gap of about 86% in fire fighting and rescues vehicles and about 99% in specialized equipment for both operational and new Fire Stations in urban and rural areas.
Fire Personnel Gap Analysis
For estimating the gap in fire personnel in operational as well new proposed Fire Stations both in urban and rural areas, the RMSI team used Administrative Reform Department (ARD, Delhi) norms based on double-shift duty pattern as ARD has already optimized the fire manpower requirement in comparison to what has been suggested in SFAC norms. The current duty pattern in Rajasthan is triple shift. RMSI team has estimated the fire manpower requirement for double shift (for details, please refer to section Chapter 8 of Rajasthan State Report).Thus, this study finds an overall gap of about 96% in fire personnel for double shift duty pattern.
Table 8-1: Gap Analysis for the Rajasthan Fire Services
Gap Analysis
No. of Fire Stations
Firefighting & Rescue Vehicles
Special Equipment
Firefighting Manpower
Operational Fire Stations 126 264 245 1,158
Gap in Operational Fire Stations
167 8,905 6,367
New Urban Fire Stations 107 293 3,892 4,720
New Rural Fire Stations 641 1120 12,649 18,849
Gap Analysis in %
No. of Fire Stations
Firefighting & Rescue Vehicle
Special Equipments
Firefighting Man Power
Gap in Operational Fire Stations
39% 97% 85%
Gap in Operational and new urban Fire Stations only
46% 64% 98% 91%
Total Gap in Operational, new (urban and rural) Fire Stations
86% 86% 99% 96%
Fire Prevention Wing
In addition to fire fighting staff, there is an urgent need for fire prevention wing for inspection, awareness generation, and training for schools, hospitals, high-rise buildings, govt. offices, public buildings etc., so that recurrence of the fire incidences similar to that at the Advance Medical Research Institute (AMRI), Kolkata, in terms of their magnitude and frequency can
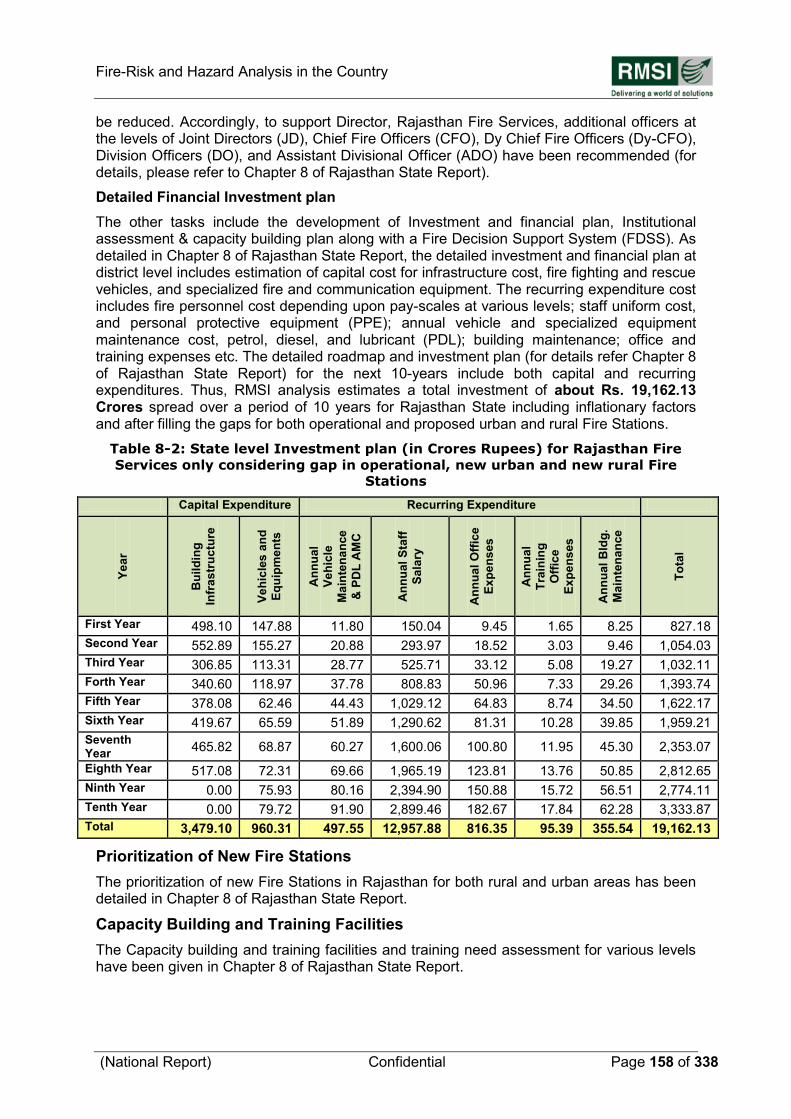
Fire-Risk and Hazard Analysis in the Country
(National Report) Confidential Page 158 of 338
be reduced. Accordingly, to support Director, Rajasthan Fire Services, additional officers at the levels of Joint Directors (JD), Chief Fire Officers (CFO), Dy Chief Fire Officers (Dy-CFO), Division Officers (DO), and Assistant Divisional Officer (ADO) have been recommended (for details, please refer to Chapter 8 of Rajasthan State Report).
Detailed Financial Investment plan
The other tasks include the development of Investment and financial plan, Institutional assessment & capacity building plan along with a Fire Decision Support System (FDSS). As detailed in Chapter 8 of Rajasthan State Report, the detailed investment and financial plan at district level includes estimation of capital cost for infrastructure cost, fire fighting and rescue vehicles, and specialized fire and communication equipment. The recurring expenditure cost includes fire personnel cost depending upon pay-scales at various levels; staff uniform cost, and personal protective equipment (PPE); annual vehicle and specialized equipment maintenance cost, petrol, diesel, and lubricant (PDL); building maintenance; office and training expenses etc. The detailed roadmap and investment plan (for details refer Chapter 8 of Rajasthan State Report) for the next 10-years include both capital and recurring expenditures. Thus, RMSI analysis estimates a total investment of about Rs. 19,162.13 Crores spread over a period of 10 years for Rajasthan State including inflationary factors and after filling the gaps for both operational and proposed urban and rural Fire Stations.
Table 8-2: State level Investment plan (in Crores Rupees) for Rajasthan Fire
Services only considering gap in operational, new urban and new rural Fire
Stations
Capital Expenditure Recurring Expenditure
Ye
ar
Bu
ild
ing
Infr
as
tru
ctu
re
Ve
hic
les
an
d
Eq
uip
me
nts
An
nu
al
Ve
hic
le
Ma
inte
na
nce
& P
DL
AM
C
An
nu
al
Sta
ff
Sa
lary
An
nu
al
Off
ice
Ex
pe
ns
es
An
nu
al
Tra
inin
g
Off
ice
Ex
pe
ns
es
An
nu
al
Bld
g.
Ma
inte
na
nce
To
tal
First Year 498.10 147.88 11.80 150.04 9.45 1.65 8.25 827.18
Second Year 552.89 155.27 20.88 293.97 18.52 3.03 9.46 1,054.03
Third Year 306.85 113.31 28.77 525.71 33.12 5.08 19.27 1,032.11
Forth Year 340.60 118.97 37.78 808.83 50.96 7.33 29.26 1,393.74
Fifth Year 378.08 62.46 44.43 1,029.12 64.83 8.74 34.50 1,622.17
Sixth Year 419.67 65.59 51.89 1,290.62 81.31 10.28 39.85 1,959.21
Seventh Year
465.82 68.87 60.27 1,600.06 100.80 11.95 45.30 2,353.07
Eighth Year 517.08 72.31 69.66 1,965.19 123.81 13.76 50.85 2,812.65
Ninth Year 0.00 75.93 80.16 2,394.90 150.88 15.72 56.51 2,774.11
Tenth Year 0.00 79.72 91.90 2,899.46 182.67 17.84 62.28 3,333.87
Total 3,479.10 960.31 497.55 12,957.88 816.35 95.39 355.54 19,162.13
Prioritization of New Fire Stations
The prioritization of new Fire Stations in Rajasthan for both rural and urban areas has been detailed in Chapter 8 of Rajasthan State Report.
Capacity Building and Training Facilities
The Capacity building and training facilities and training need assessment for various levels have been given in Chapter 8 of Rajasthan State Report.
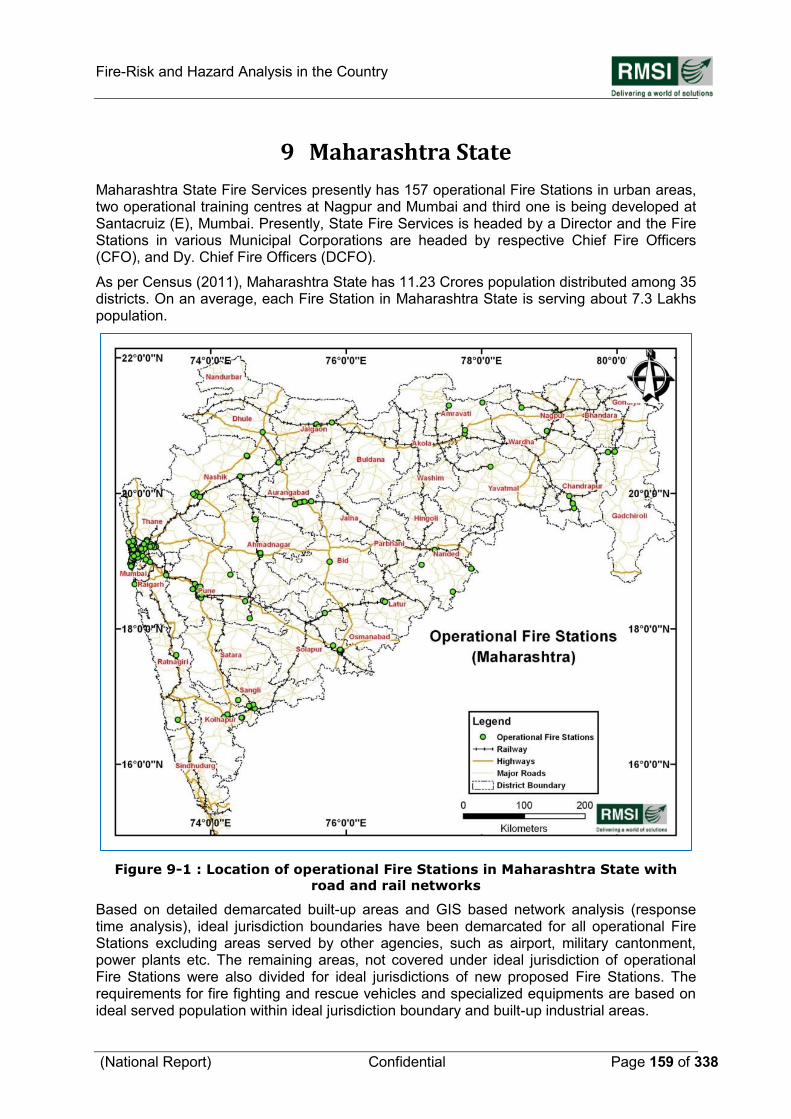
Fire-Risk and Hazard Analysis in the Country
(National Report) Confidential Page 159 of 338
9 Maharashtra State
Maharashtra State Fire Services presently has 157 operational Fire Stations in urban areas, two operational training centres at Nagpur and Mumbai and third one is being developed at Santacruiz (E), Mumbai. Presently, State Fire Services is headed by a Director and the Fire Stations in various Municipal Corporations are headed by respective Chief Fire Officers (CFO), and Dy. Chief Fire Officers (DCFO).
As per Census (2011), Maharashtra State has 11.23 Crores population distributed among 35 districts. On an average, each Fire Station in Maharashtra State is serving about 7.3 Lakhs population.
Figure 9-1 : Location of operational Fire Stations in Maharashtra State with
road and rail networks
Based on detailed demarcated built-up areas and GIS based network analysis (response time analysis), ideal jurisdiction boundaries have been demarcated for all operational Fire Stations excluding areas served by other agencies, such as airport, military cantonment, power plants etc. The remaining areas, not covered under ideal jurisdiction of operational Fire Stations were also divided for ideal jurisdictions of new proposed Fire Stations. The requirements for fire fighting and rescue vehicles and specialized equipments are based on ideal served population within ideal jurisdiction boundary and built-up industrial areas.
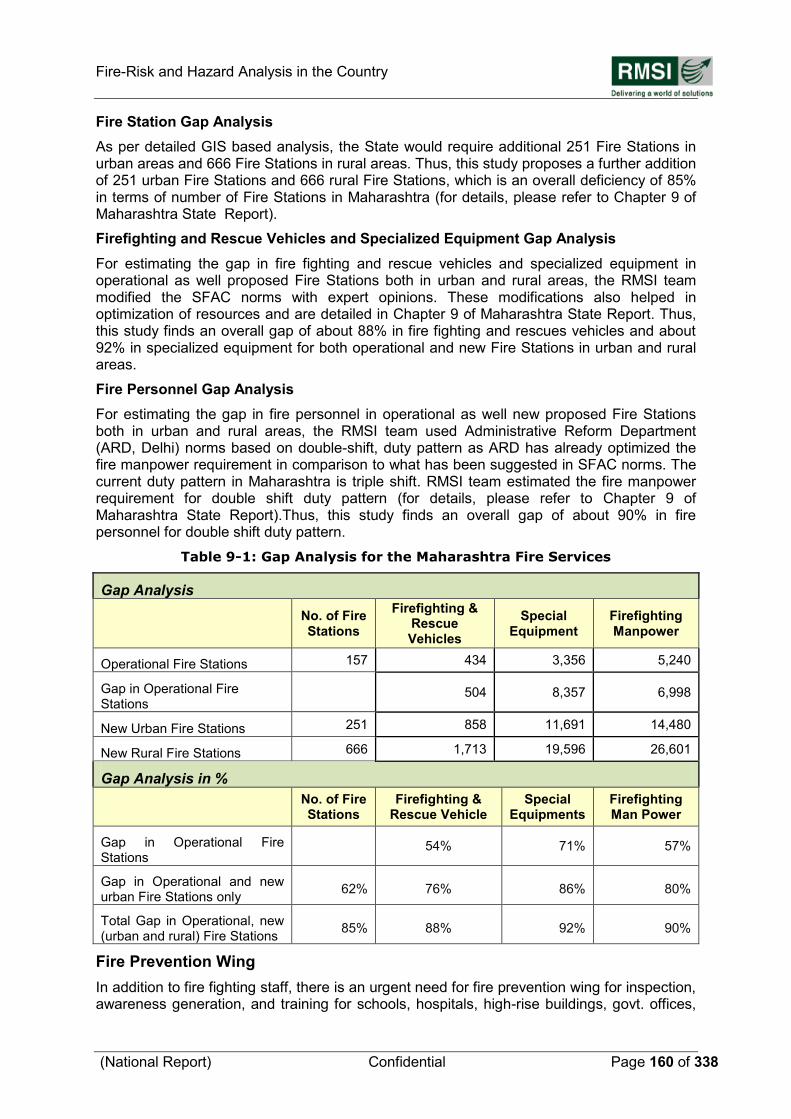
Fire-Risk and Hazard Analysis in the Country
(National Report) Confidential Page 160 of 338
Fire Station Gap Analysis
As per detailed GIS based analysis, the State would require additional 251 Fire Stations in urban areas and 666 Fire Stations in rural areas. Thus, this study proposes a further addition of 251 urban Fire Stations and 666 rural Fire Stations, which is an overall deficiency of 85% in terms of number of Fire Stations in Maharashtra (for details, please refer to Chapter 9 of Maharashtra State Report).
Firefighting and Rescue Vehicles and Specialized Equipment Gap Analysis
For estimating the gap in fire fighting and rescue vehicles and specialized equipment in operational as well proposed Fire Stations both in urban and rural areas, the RMSI team modified the SFAC norms with expert opinions. These modifications also helped in optimization of resources and are detailed in Chapter 9 of Maharashtra State Report. Thus, this study finds an overall gap of about 88% in fire fighting and rescues vehicles and about 92% in specialized equipment for both operational and new Fire Stations in urban and rural areas.
Fire Personnel Gap Analysis
For estimating the gap in fire personnel in operational as well new proposed Fire Stations both in urban and rural areas, the RMSI team used Administrative Reform Department (ARD, Delhi) norms based on double-shift, duty pattern as ARD has already optimized the fire manpower requirement in comparison to what has been suggested in SFAC norms. The current duty pattern in Maharashtra is triple shift. RMSI team estimated the fire manpower requirement for double shift duty pattern (for details, please refer to Chapter 9 of Maharashtra State Report).Thus, this study finds an overall gap of about 90% in fire personnel for double shift duty pattern.
Table 9-1: Gap Analysis for the Maharashtra Fire Services
Gap Analysis
No. of Fire Stations
Firefighting & Rescue Vehicles
Special Equipment
Firefighting Manpower
Operational Fire Stations 157 434 3,356 5,240
Gap in Operational Fire Stations
504 8,357 6,998
New Urban Fire Stations 251 858 11,691 14,480
New Rural Fire Stations 666 1,713 19,596 26,601
Gap Analysis in %
No. of Fire Stations
Firefighting & Rescue Vehicle
Special Equipments
Firefighting Man Power
Gap in Operational Fire Stations
54% 71% 57%
Gap in Operational and new urban Fire Stations only
62% 76% 86% 80%
Total Gap in Operational, new (urban and rural) Fire Stations
85% 88% 92% 90%
Fire Prevention Wing
In addition to fire fighting staff, there is an urgent need for fire prevention wing for inspection, awareness generation, and training for schools, hospitals, high-rise buildings, govt. offices,
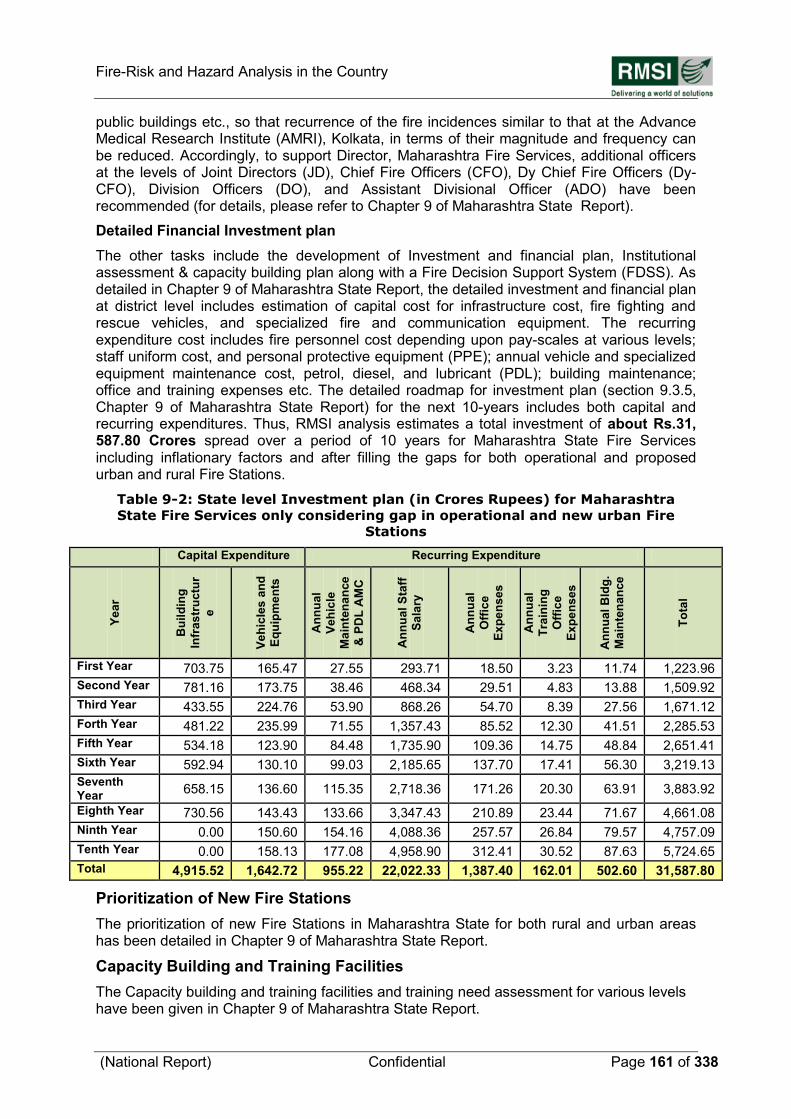
Fire-Risk and Hazard Analysis in the Country
(National Report) Confidential Page 161 of 338
public buildings etc., so that recurrence of the fire incidences similar to that at the Advance Medical Research Institute (AMRI), Kolkata, in terms of their magnitude and frequency can be reduced. Accordingly, to support Director, Maharashtra Fire Services, additional officers at the levels of Joint Directors (JD), Chief Fire Officers (CFO), Dy Chief Fire Officers (Dy-CFO), Division Officers (DO), and Assistant Divisional Officer (ADO) have been recommended (for details, please refer to Chapter 9 of Maharashtra State Report).
Detailed Financial Investment plan
The other tasks include the development of Investment and financial plan, Institutional assessment & capacity building plan along with a Fire Decision Support System (FDSS). As detailed in Chapter 9 of Maharashtra State Report, the detailed investment and financial plan at district level includes estimation of capital cost for infrastructure cost, fire fighting and rescue vehicles, and specialized fire and communication equipment. The recurring expenditure cost includes fire personnel cost depending upon pay-scales at various levels; staff uniform cost, and personal protective equipment (PPE); annual vehicle and specialized equipment maintenance cost, petrol, diesel, and lubricant (PDL); building maintenance; office and training expenses etc. The detailed roadmap for investment plan (section 9.3.5, Chapter 9 of Maharashtra State Report) for the next 10-years includes both capital and recurring expenditures. Thus, RMSI analysis estimates a total investment of about Rs.31, 587.80 Crores spread over a period of 10 years for Maharashtra State Fire Services including inflationary factors and after filling the gaps for both operational and proposed urban and rural Fire Stations.
Table 9-2: State level Investment plan (in Crores Rupees) for Maharashtra
State Fire Services only considering gap in operational and new urban Fire
Stations
Capital Expenditure Recurring Expenditure
Ye
ar
Bu
ild
ing
Infr
as
tru
ctu
r
e
Ve
hic
les
an
d
Eq
uip
me
nts
An
nu
al
Ve
hic
le
Ma
inte
na
nce
& P
DL
AM
C
An
nu
al
Sta
ff
Sa
lary
An
nu
al
Off
ice
Ex
pe
ns
es
An
nu
al
Tra
inin
g
Off
ice
Ex
pe
ns
es
An
nu
al
Bld
g.
Ma
inte
na
nce
To
tal
First Year 703.75 165.47 27.55 293.71 18.50 3.23 11.74 1,223.96
Second Year 781.16 173.75 38.46 468.34 29.51 4.83 13.88 1,509.92
Third Year 433.55 224.76 53.90 868.26 54.70 8.39 27.56 1,671.12
Forth Year 481.22 235.99 71.55 1,357.43 85.52 12.30 41.51 2,285.53
Fifth Year 534.18 123.90 84.48 1,735.90 109.36 14.75 48.84 2,651.41
Sixth Year 592.94 130.10 99.03 2,185.65 137.70 17.41 56.30 3,219.13
Seventh Year
658.15 136.60 115.35 2,718.36 171.26 20.30 63.91 3,883.92
Eighth Year 730.56 143.43 133.66 3,347.43 210.89 23.44 71.67 4,661.08
Ninth Year 0.00 150.60 154.16 4,088.36 257.57 26.84 79.57 4,757.09
Tenth Year 0.00 158.13 177.08 4,958.90 312.41 30.52 87.63 5,724.65
Total 4,915.52 1,642.72 955.22 22,022.33 1,387.40 162.01 502.60 31,587.80
Prioritization of New Fire Stations
The prioritization of new Fire Stations in Maharashtra State for both rural and urban areas has been detailed in Chapter 9 of Maharashtra State Report.
Capacity Building and Training Facilities
The Capacity building and training facilities and training need assessment for various levels have been given in Chapter 9 of Maharashtra State Report.
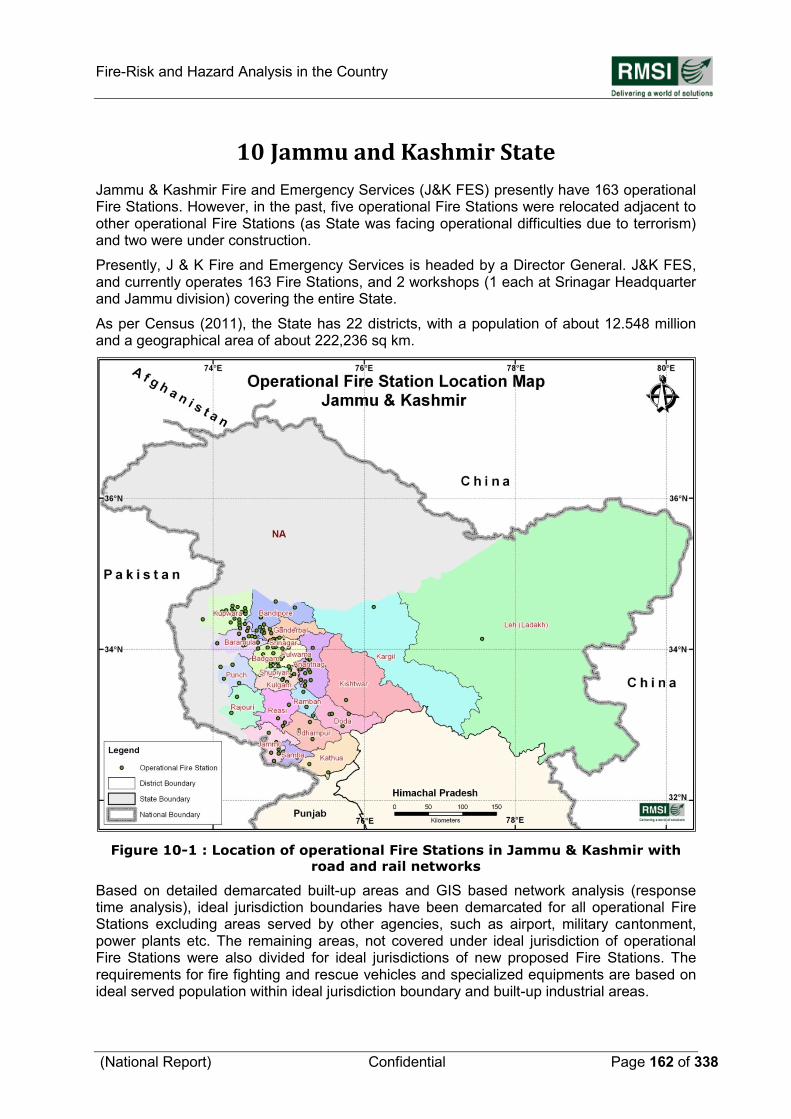
Fire-Risk and Hazard Analysis in the Country
(National Report) Confidential Page 162 of 338
10 Jammu and Kashmir State
Jammu & Kashmir Fire and Emergency Services (J&K FES) presently have 163 operational Fire Stations. However, in the past, five operational Fire Stations were relocated adjacent to other operational Fire Stations (as State was facing operational difficulties due to terrorism) and two were under construction.
Presently, J & K Fire and Emergency Services is headed by a Director General. J&K FES, and currently operates 163 Fire Stations, and 2 workshops (1 each at Srinagar Headquarter and Jammu division) covering the entire State.
As per Census (2011), the State has 22 districts, with a population of about 12.548 million and a geographical area of about 222,236 sq km.
Figure 10-1 : Location of operational Fire Stations in Jammu & Kashmir with
road and rail networks
Based on detailed demarcated built-up areas and GIS based network analysis (response time analysis), ideal jurisdiction boundaries have been demarcated for all operational Fire Stations excluding areas served by other agencies, such as airport, military cantonment, power plants etc. The remaining areas, not covered under ideal jurisdiction of operational Fire Stations were also divided for ideal jurisdictions of new proposed Fire Stations. The requirements for fire fighting and rescue vehicles and specialized equipments are based on ideal served population within ideal jurisdiction boundary and built-up industrial areas.
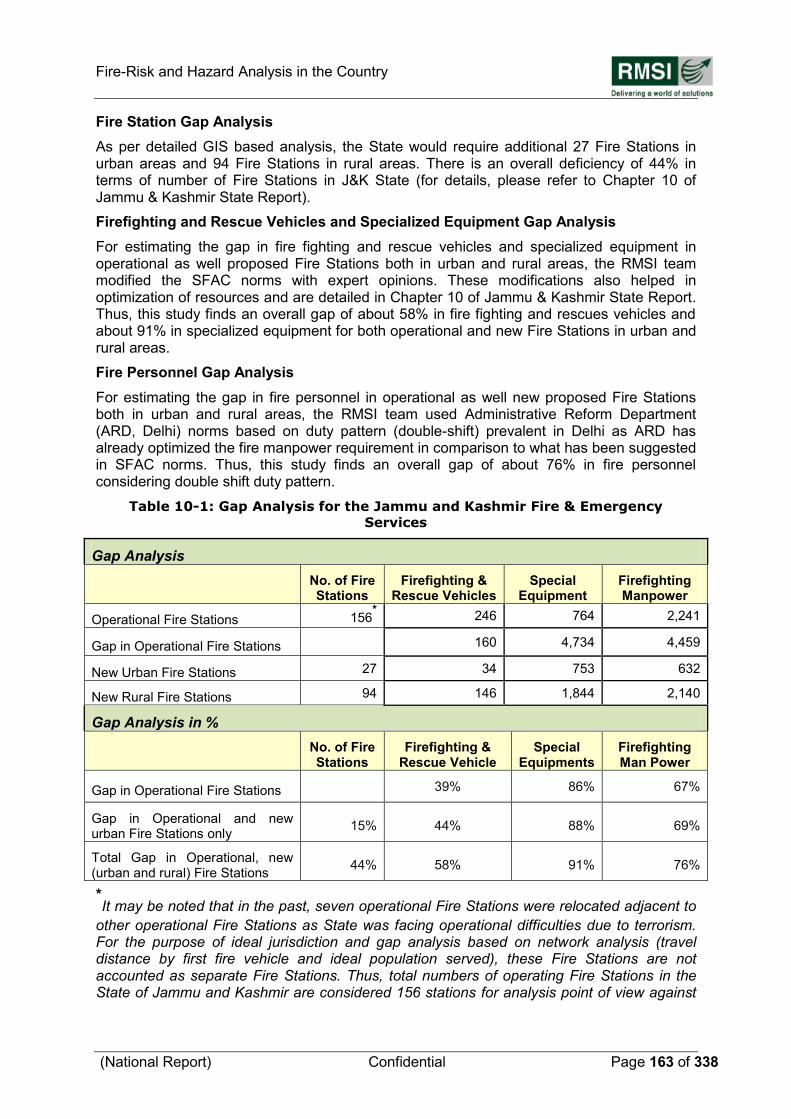
Fire-Risk and Hazard Analysis in the Country
(National Report) Confidential Page 163 of 338
Fire Station Gap Analysis
As per detailed GIS based analysis, the State would require additional 27 Fire Stations in urban areas and 94 Fire Stations in rural areas. There is an overall deficiency of 44% in terms of number of Fire Stations in J&K State (for details, please refer to Chapter 10 of Jammu & Kashmir State Report).
Firefighting and Rescue Vehicles and Specialized Equipment Gap Analysis
For estimating the gap in fire fighting and rescue vehicles and specialized equipment in operational as well proposed Fire Stations both in urban and rural areas, the RMSI team modified the SFAC norms with expert opinions. These modifications also helped in optimization of resources and are detailed in Chapter 10 of Jammu & Kashmir State Report. Thus, this study finds an overall gap of about 58% in fire fighting and rescues vehicles and about 91% in specialized equipment for both operational and new Fire Stations in urban and rural areas.
Fire Personnel Gap Analysis
For estimating the gap in fire personnel in operational as well new proposed Fire Stations both in urban and rural areas, the RMSI team used Administrative Reform Department (ARD, Delhi) norms based on duty pattern (double-shift) prevalent in Delhi as ARD has already optimized the fire manpower requirement in comparison to what has been suggested in SFAC norms. Thus, this study finds an overall gap of about 76% in fire personnel considering double shift duty pattern.
Table 10-1: Gap Analysis for the Jammu and Kashmir Fire & Emergency
Services
Gap Analysis
No. of Fire Stations
Firefighting & Rescue Vehicles
Special Equipment
Firefighting Manpower
Operational Fire Stations 156* 246 764 2,241
Gap in Operational Fire Stations 160 4,734 4,459
New Urban Fire Stations 27 34 753 632
New Rural Fire Stations 94 146 1,844 2,140
Gap Analysis in %
No. of Fire Stations
Firefighting & Rescue Vehicle
Special Equipments
Firefighting Man Power
Gap in Operational Fire Stations
39% 86% 67%
Gap in Operational and new urban Fire Stations only
15% 44% 88% 69%
Total Gap in Operational, new (urban and rural) Fire Stations
44% 58% 91% 76%
*It may be noted that in the past, seven operational Fire Stations were relocated adjacent to
other operational Fire Stations as State was facing operational difficulties due to terrorism. For the purpose of ideal jurisdiction and gap analysis based on network analysis (travel distance by first fire vehicle and ideal population served), these Fire Stations are not accounted as separate Fire Stations. Thus, total numbers of operating Fire Stations in the State of Jammu and Kashmir are considered 156 stations for analysis point of view against
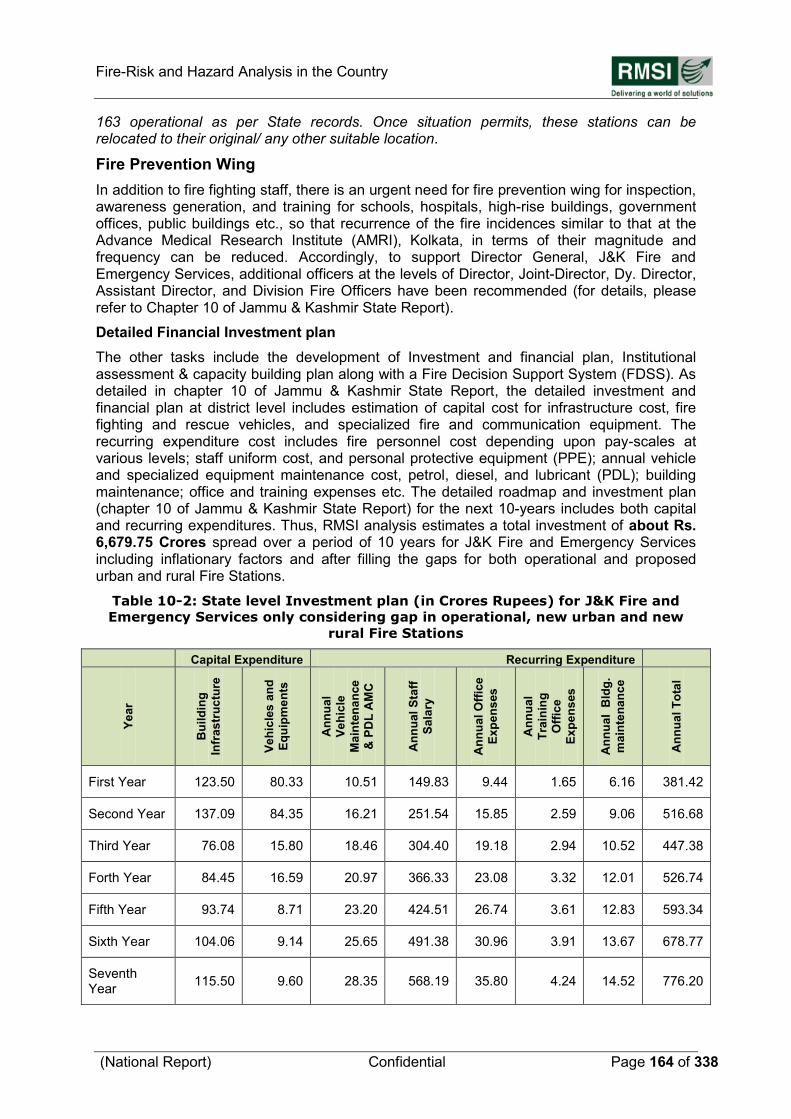
Fire-Risk and Hazard Analysis in the Country
(National Report) Confidential Page 164 of 338
163 operational as per State records. Once situation permits, these stations can be relocated to their original/ any other suitable location.
Fire Prevention Wing
In addition to fire fighting staff, there is an urgent need for fire prevention wing for inspection, awareness generation, and training for schools, hospitals, high-rise buildings, government offices, public buildings etc., so that recurrence of the fire incidences similar to that at the Advance Medical Research Institute (AMRI), Kolkata, in terms of their magnitude and frequency can be reduced. Accordingly, to support Director General, J&K Fire and Emergency Services, additional officers at the levels of Director, Joint-Director, Dy. Director, Assistant Director, and Division Fire Officers have been recommended (for details, please refer to Chapter 10 of Jammu & Kashmir State Report).
Detailed Financial Investment plan
The other tasks include the development of Investment and financial plan, Institutional assessment & capacity building plan along with a Fire Decision Support System (FDSS). As detailed in chapter 10 of Jammu & Kashmir State Report, the detailed investment and financial plan at district level includes estimation of capital cost for infrastructure cost, fire fighting and rescue vehicles, and specialized fire and communication equipment. The recurring expenditure cost includes fire personnel cost depending upon pay-scales at various levels; staff uniform cost, and personal protective equipment (PPE); annual vehicle and specialized equipment maintenance cost, petrol, diesel, and lubricant (PDL); building maintenance; office and training expenses etc. The detailed roadmap and investment plan (chapter 10 of Jammu & Kashmir State Report) for the next 10-years includes both capital and recurring expenditures. Thus, RMSI analysis estimates a total investment of about Rs. 6,679.75 Crores spread over a period of 10 years for J&K Fire and Emergency Services including inflationary factors and after filling the gaps for both operational and proposed urban and rural Fire Stations.
Table 10-2: State level Investment plan (in Crores Rupees) for J&K Fire and
Emergency Services only considering gap in operational, new urban and new
rural Fire Stations
Capital Expenditure Recurring Expenditure
Ye
ar
Bu
ild
ing
Infr
as
tru
ctu
re
Ve
hic
les
an
d
Eq
uip
me
nts
An
nu
al
Ve
hic
le
Ma
inte
na
nce
& P
DL
AM
C
An
nu
al
Sta
ff
Sa
lary
An
nu
al
Off
ice
Ex
pe
ns
es
An
nu
al
Tra
inin
g
Off
ice
Ex
pe
ns
es
An
nu
al
Bld
g.
ma
inte
na
nc
e
An
nu
al
To
tal
First Year 123.50 80.33 10.51 149.83 9.44 1.65 6.16 381.42
Second Year 137.09 84.35 16.21 251.54 15.85 2.59 9.06 516.68
Third Year 76.08 15.80 18.46 304.40 19.18 2.94 10.52 447.38
Forth Year 84.45 16.59 20.97 366.33 23.08 3.32 12.01 526.74
Fifth Year 93.74 8.71 23.20 424.51 26.74 3.61 12.83 593.34
Sixth Year 104.06 9.14 25.65 491.38 30.96 3.91 13.67 678.77
Seventh Year
115.50 9.60 28.35 568.19 35.80 4.24 14.52 776.20
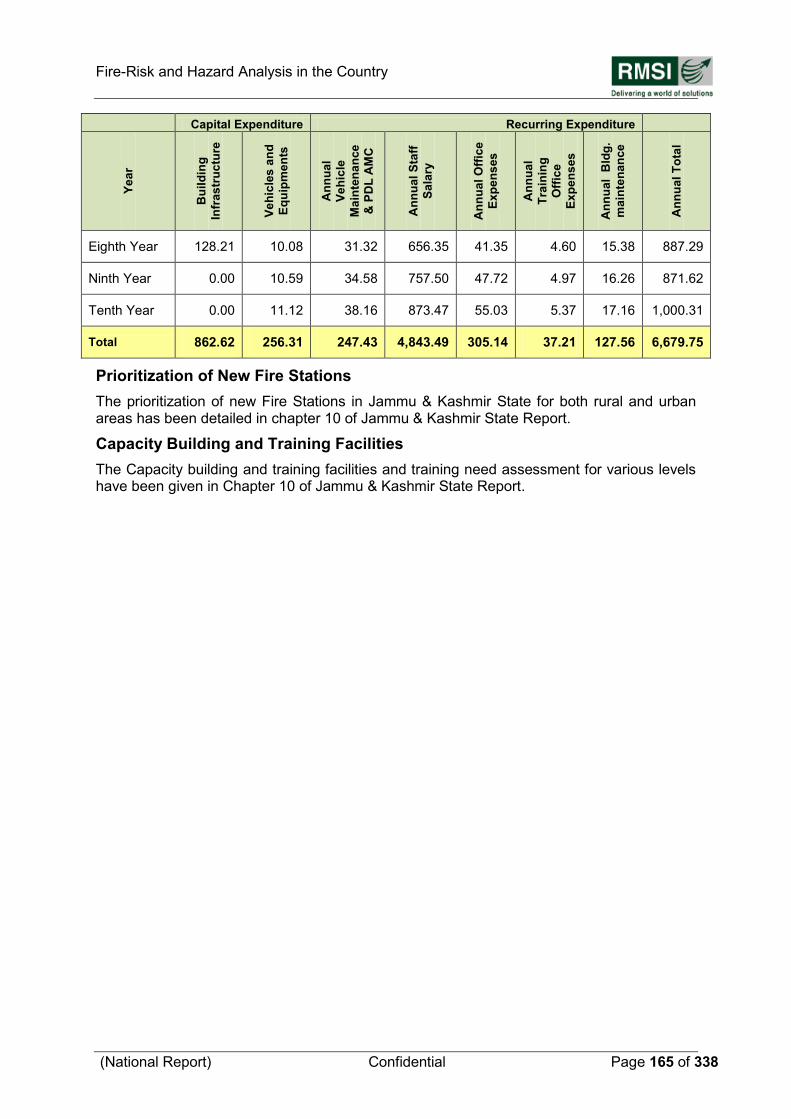
Fire-Risk and Hazard Analysis in the Country
(National Report) Confidential Page 165 of 338
Capital Expenditure Recurring Expenditure
Y
ea
r
Bu
ild
ing
Infr
as
tru
ctu
re
Ve
hic
les
an
d
Eq
uip
me
nts
An
nu
al
Ve
hic
le
Ma
inte
na
nce
& P
DL
AM
C
An
nu
al
Sta
ff
Sa
lary
An
nu
al
Off
ice
Ex
pe
ns
es
An
nu
al
Tra
inin
g
Off
ice
Ex
pe
ns
es
An
nu
al
Bld
g.
ma
inte
na
nc
e
An
nu
al
To
tal
Eighth Year 128.21 10.08 31.32 656.35 41.35 4.60 15.38 887.29
Ninth Year 0.00 10.59 34.58 757.50 47.72 4.97 16.26 871.62
Tenth Year 0.00 11.12 38.16 873.47 55.03 5.37 17.16 1,000.31
Total 862.62 256.31 247.43 4,843.49 305.14 37.21 127.56 6,679.75
Prioritization of New Fire Stations
The prioritization of new Fire Stations in Jammu & Kashmir State for both rural and urban areas has been detailed in chapter 10 of Jammu & Kashmir State Report.
Capacity Building and Training Facilities
The Capacity building and training facilities and training need assessment for various levels have been given in Chapter 10 of Jammu & Kashmir State Report.
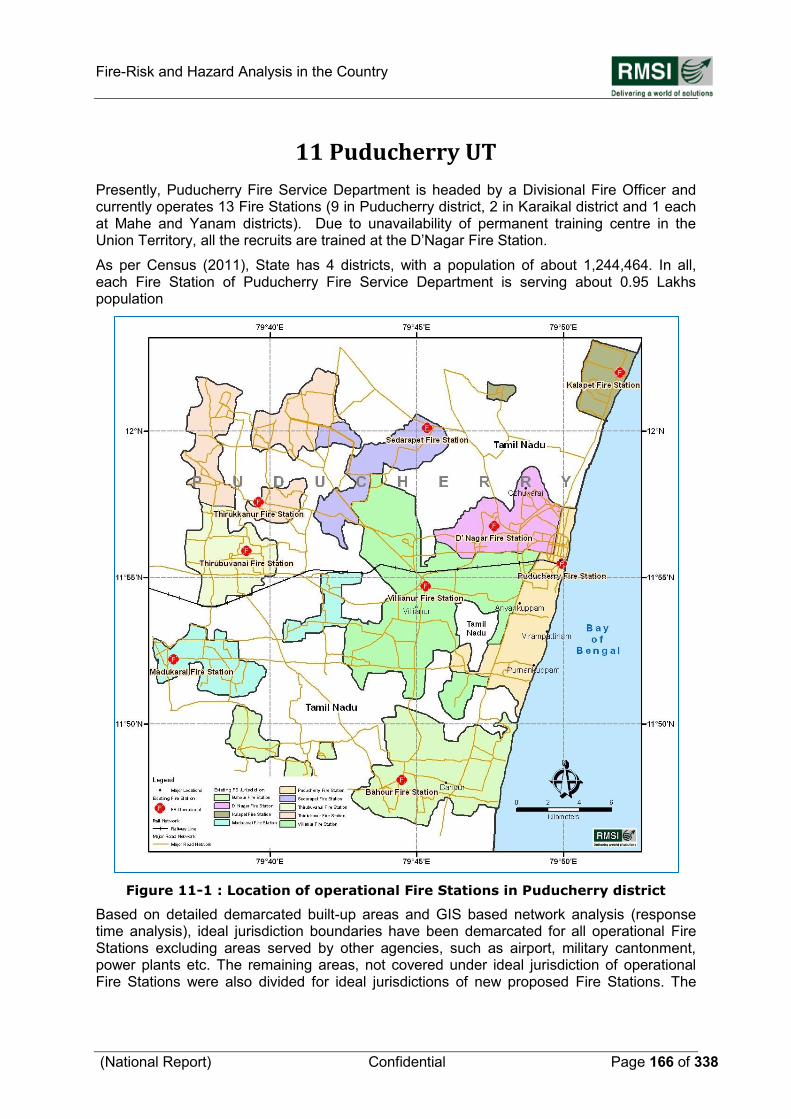
Fire-Risk and Hazard Analysis in the Country
(National Report) Confidential Page 166 of 338
11 Puducherry UT
Presently, Puducherry Fire Service Department is headed by a Divisional Fire Officer and currently operates 13 Fire Stations (9 in Puducherry district, 2 in Karaikal district and 1 each at Mahe and Yanam districts). Due to unavailability of permanent training centre in the Union Territory, all the recruits are trained at the D‟Nagar Fire Station.
As per Census (2011), State has 4 districts, with a population of about 1,244,464. In all, each Fire Station of Puducherry Fire Service Department is serving about 0.95 Lakhs population
Figure 11-1 : Location of operational Fire Stations in Puducherry district
Based on detailed demarcated built-up areas and GIS based network analysis (response time analysis), ideal jurisdiction boundaries have been demarcated for all operational Fire Stations excluding areas served by other agencies, such as airport, military cantonment, power plants etc. The remaining areas, not covered under ideal jurisdiction of operational Fire Stations were also divided for ideal jurisdictions of new proposed Fire Stations. The
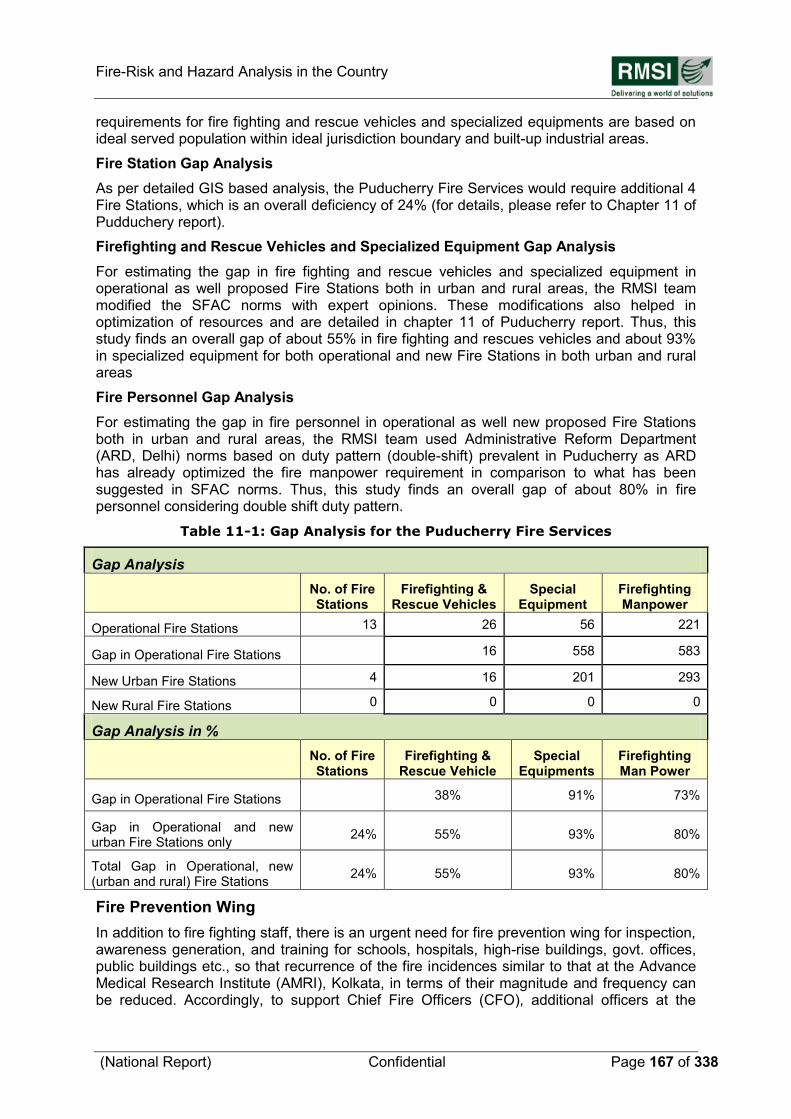
Fire-Risk and Hazard Analysis in the Country
(National Report) Confidential Page 167 of 338
requirements for fire fighting and rescue vehicles and specialized equipments are based on ideal served population within ideal jurisdiction boundary and built-up industrial areas.
Fire Station Gap Analysis
As per detailed GIS based analysis, the Puducherry Fire Services would require additional 4 Fire Stations, which is an overall deficiency of 24% (for details, please refer to Chapter 11 of Pudduchery report).
Firefighting and Rescue Vehicles and Specialized Equipment Gap Analysis
For estimating the gap in fire fighting and rescue vehicles and specialized equipment in operational as well proposed Fire Stations both in urban and rural areas, the RMSI team modified the SFAC norms with expert opinions. These modifications also helped in optimization of resources and are detailed in chapter 11 of Puducherry report. Thus, this study finds an overall gap of about 55% in fire fighting and rescues vehicles and about 93% in specialized equipment for both operational and new Fire Stations in both urban and rural areas
Fire Personnel Gap Analysis
For estimating the gap in fire personnel in operational as well new proposed Fire Stations both in urban and rural areas, the RMSI team used Administrative Reform Department (ARD, Delhi) norms based on duty pattern (double-shift) prevalent in Puducherry as ARD has already optimized the fire manpower requirement in comparison to what has been suggested in SFAC norms. Thus, this study finds an overall gap of about 80% in fire personnel considering double shift duty pattern.
Table 11-1: Gap Analysis for the Puducherry Fire Services
Gap Analysis
No. of Fire Stations
Firefighting & Rescue Vehicles
Special Equipment
Firefighting Manpower
Operational Fire Stations 13 26 56 221
Gap in Operational Fire Stations 16 558 583
New Urban Fire Stations 4 16 201 293
New Rural Fire Stations 0 0 0 0
Gap Analysis in %
No. of Fire Stations
Firefighting & Rescue Vehicle
Special Equipments
Firefighting Man Power
Gap in Operational Fire Stations
38% 91% 73%
Gap in Operational and new urban Fire Stations only
24% 55% 93% 80%
Total Gap in Operational, new (urban and rural) Fire Stations
24% 55% 93% 80%
Fire Prevention Wing
In addition to fire fighting staff, there is an urgent need for fire prevention wing for inspection, awareness generation, and training for schools, hospitals, high-rise buildings, govt. offices, public buildings etc., so that recurrence of the fire incidences similar to that at the Advance Medical Research Institute (AMRI), Kolkata, in terms of their magnitude and frequency can be reduced. Accordingly, to support Chief Fire Officers (CFO), additional officers at the
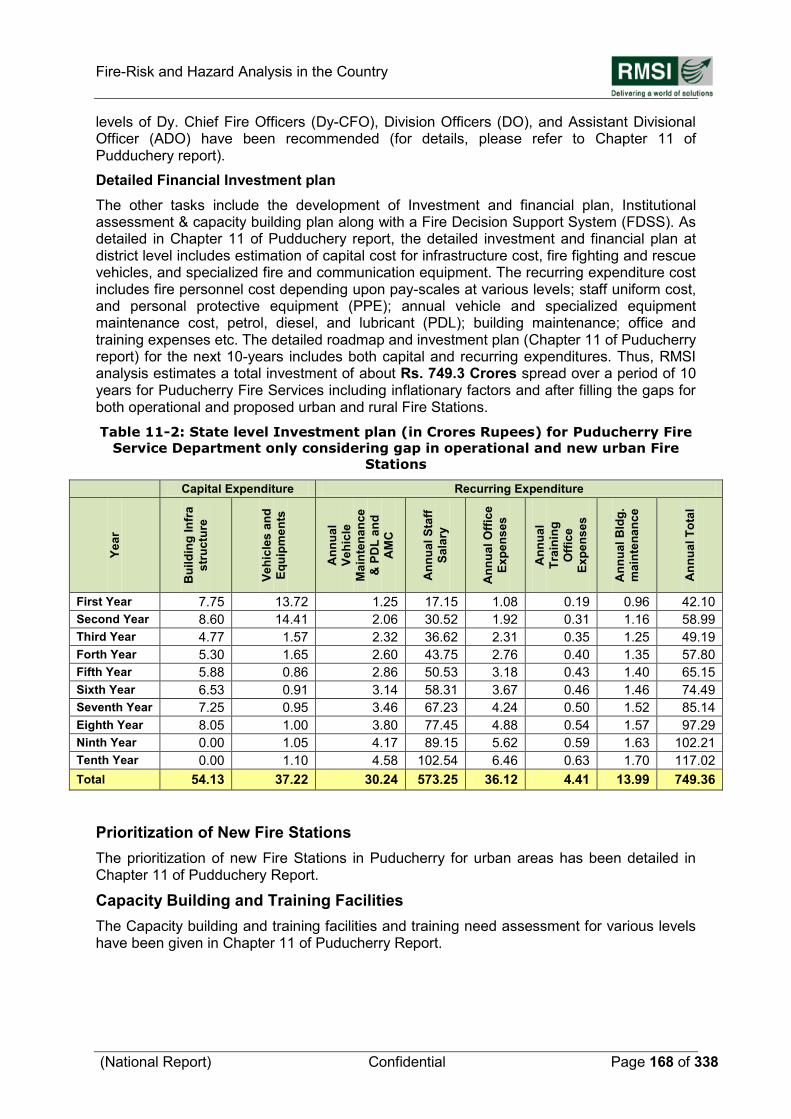
Fire-Risk and Hazard Analysis in the Country
(National Report) Confidential Page 168 of 338
levels of Dy. Chief Fire Officers (Dy-CFO), Division Officers (DO), and Assistant Divisional Officer (ADO) have been recommended (for details, please refer to Chapter 11 of Pudduchery report).
Detailed Financial Investment plan
The other tasks include the development of Investment and financial plan, Institutional assessment & capacity building plan along with a Fire Decision Support System (FDSS). As detailed in Chapter 11 of Pudduchery report, the detailed investment and financial plan at district level includes estimation of capital cost for infrastructure cost, fire fighting and rescue vehicles, and specialized fire and communication equipment. The recurring expenditure cost includes fire personnel cost depending upon pay-scales at various levels; staff uniform cost, and personal protective equipment (PPE); annual vehicle and specialized equipment maintenance cost, petrol, diesel, and lubricant (PDL); building maintenance; office and training expenses etc. The detailed roadmap and investment plan (Chapter 11 of Puducherry report) for the next 10-years includes both capital and recurring expenditures. Thus, RMSI analysis estimates a total investment of about Rs. 749.3 Crores spread over a period of 10 years for Puducherry Fire Services including inflationary factors and after filling the gaps for both operational and proposed urban and rural Fire Stations.
Table 11-2: State level Investment plan (in Crores Rupees) for Puducherry Fire
Service Department only considering gap in operational and new urban Fire
Stations
Capital Expenditure Recurring Expenditure
Ye
ar
Bu
ild
ing
In
fra
str
uc
ture
Ve
hic
les
an
d
Eq
uip
me
nts
An
nu
al
Ve
hic
le
Ma
inte
na
nce
& P
DL
an
d
AM
C
An
nu
al
Sta
ff
Sa
lary
An
nu
al
Off
ice
Ex
pe
ns
es
An
nu
al
Tra
inin
g
Off
ice
Ex
pe
ns
es
An
nu
al
Bld
g.
ma
inte
na
nc
e
An
nu
al
To
tal
First Year 7.75 13.72 1.25 17.15 1.08 0.19 0.96 42.10
Second Year 8.60 14.41 2.06 30.52 1.92 0.31 1.16 58.99
Third Year 4.77 1.57 2.32 36.62 2.31 0.35 1.25 49.19
Forth Year 5.30 1.65 2.60 43.75 2.76 0.40 1.35 57.80
Fifth Year 5.88 0.86 2.86 50.53 3.18 0.43 1.40 65.15
Sixth Year 6.53 0.91 3.14 58.31 3.67 0.46 1.46 74.49
Seventh Year 7.25 0.95 3.46 67.23 4.24 0.50 1.52 85.14
Eighth Year 8.05 1.00 3.80 77.45 4.88 0.54 1.57 97.29
Ninth Year 0.00 1.05 4.17 89.15 5.62 0.59 1.63 102.21
Tenth Year 0.00 1.10 4.58 102.54 6.46 0.63 1.70 117.02
Total 54.13 37.22 30.24 573.25 36.12 4.41 13.99 749.36
Prioritization of New Fire Stations
The prioritization of new Fire Stations in Puducherry for urban areas has been detailed in Chapter 11 of Pudduchery Report.
Capacity Building and Training Facilities
The Capacity building and training facilities and training need assessment for various levels have been given in Chapter 11 of Puducherry Report.
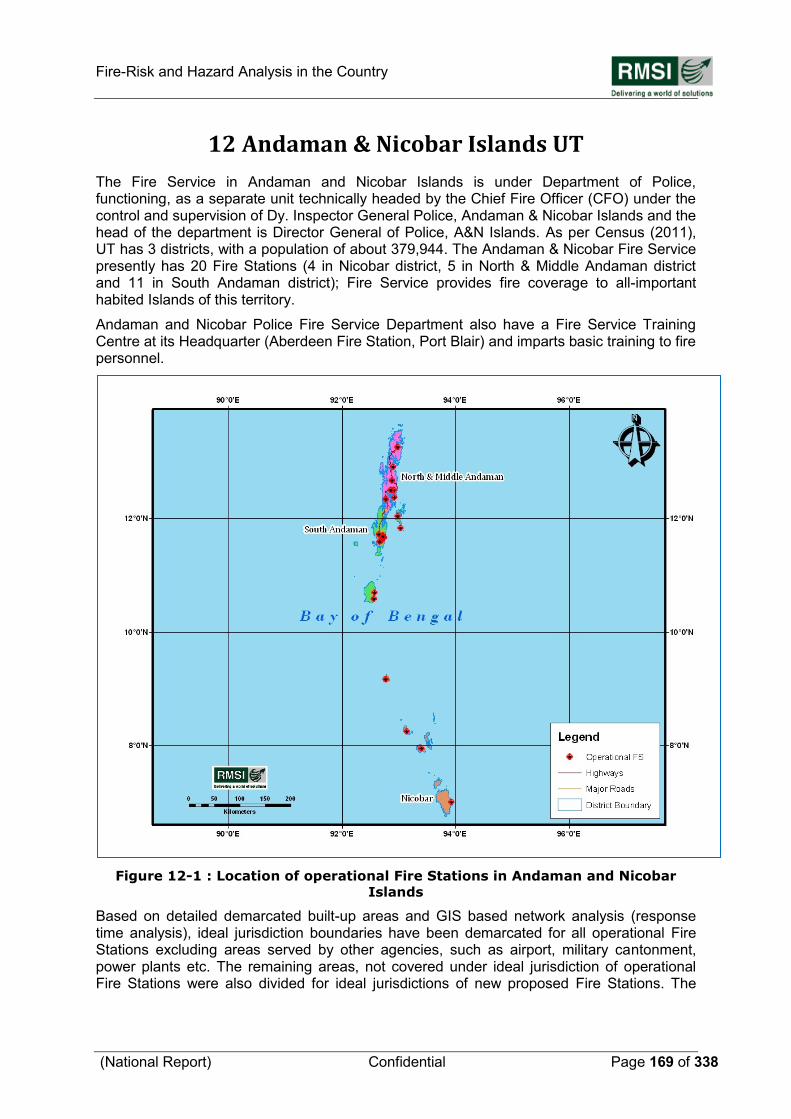
Fire-Risk and Hazard Analysis in the Country
(National Report) Confidential Page 169 of 338
12 Andaman & Nicobar Islands UT
The Fire Service in Andaman and Nicobar Islands is under Department of Police, functioning, as a separate unit technically headed by the Chief Fire Officer (CFO) under the control and supervision of Dy. Inspector General Police, Andaman & Nicobar Islands and the head of the department is Director General of Police, A&N Islands. As per Census (2011), UT has 3 districts, with a population of about 379,944. The Andaman & Nicobar Fire Service presently has 20 Fire Stations (4 in Nicobar district, 5 in North & Middle Andaman district and 11 in South Andaman district); Fire Service provides fire coverage to all-important habited Islands of this territory.
Andaman and Nicobar Police Fire Service Department also have a Fire Service Training Centre at its Headquarter (Aberdeen Fire Station, Port Blair) and imparts basic training to fire personnel.
Figure 12-1 : Location of operational Fire Stations in Andaman and Nicobar
Islands
Based on detailed demarcated built-up areas and GIS based network analysis (response time analysis), ideal jurisdiction boundaries have been demarcated for all operational Fire Stations excluding areas served by other agencies, such as airport, military cantonment, power plants etc. The remaining areas, not covered under ideal jurisdiction of operational Fire Stations were also divided for ideal jurisdictions of new proposed Fire Stations. The
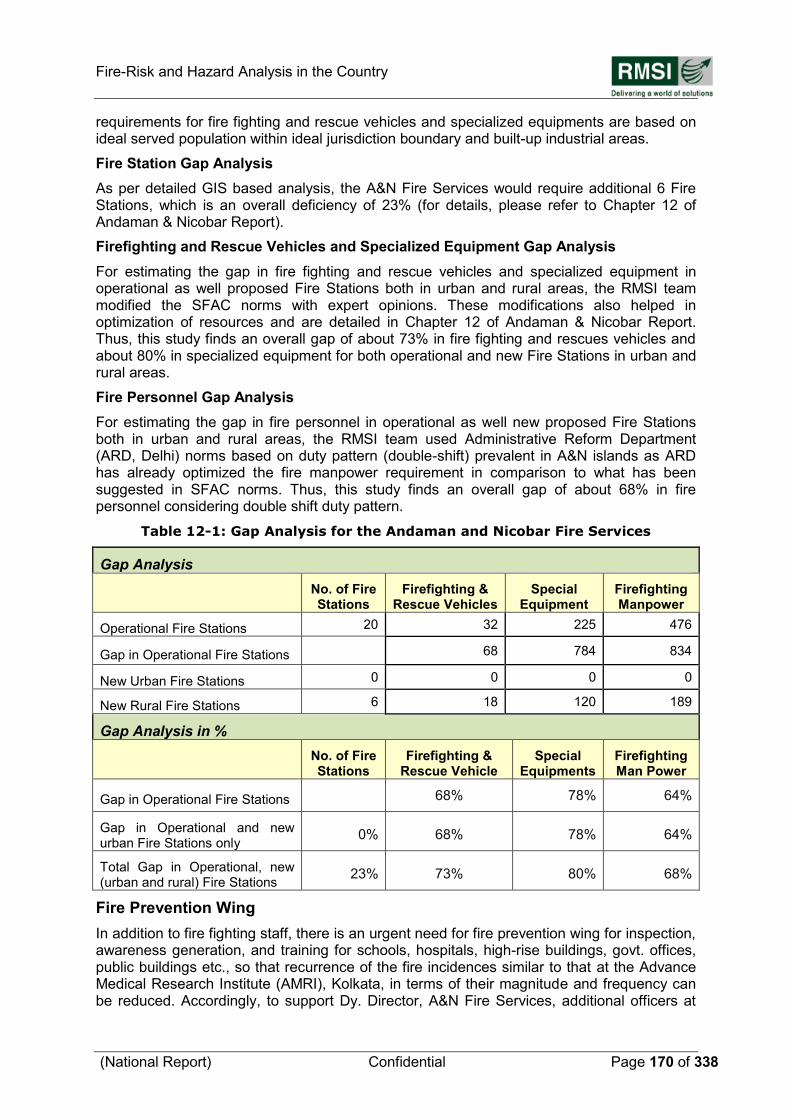
Fire-Risk and Hazard Analysis in the Country
(National Report) Confidential Page 170 of 338
requirements for fire fighting and rescue vehicles and specialized equipments are based on ideal served population within ideal jurisdiction boundary and built-up industrial areas.
Fire Station Gap Analysis
As per detailed GIS based analysis, the A&N Fire Services would require additional 6 Fire Stations, which is an overall deficiency of 23% (for details, please refer to Chapter 12 of Andaman & Nicobar Report).
Firefighting and Rescue Vehicles and Specialized Equipment Gap Analysis
For estimating the gap in fire fighting and rescue vehicles and specialized equipment in operational as well proposed Fire Stations both in urban and rural areas, the RMSI team modified the SFAC norms with expert opinions. These modifications also helped in optimization of resources and are detailed in Chapter 12 of Andaman & Nicobar Report. Thus, this study finds an overall gap of about 73% in fire fighting and rescues vehicles and about 80% in specialized equipment for both operational and new Fire Stations in urban and rural areas.
Fire Personnel Gap Analysis
For estimating the gap in fire personnel in operational as well new proposed Fire Stations both in urban and rural areas, the RMSI team used Administrative Reform Department (ARD, Delhi) norms based on duty pattern (double-shift) prevalent in A&N islands as ARD has already optimized the fire manpower requirement in comparison to what has been suggested in SFAC norms. Thus, this study finds an overall gap of about 68% in fire personnel considering double shift duty pattern.
Table 12-1: Gap Analysis for the Andaman and Nicobar Fire Services
Gap Analysis
No. of Fire Stations
Firefighting & Rescue Vehicles
Special Equipment
Firefighting Manpower
Operational Fire Stations 20 32 225 476
Gap in Operational Fire Stations 68 784 834
New Urban Fire Stations 0 0 0 0
New Rural Fire Stations 6 18 120 189
Gap Analysis in %
No. of Fire Stations
Firefighting & Rescue Vehicle
Special Equipments
Firefighting Man Power
Gap in Operational Fire Stations
68% 78% 64%
Gap in Operational and new urban Fire Stations only
0% 68% 78% 64%
Total Gap in Operational, new (urban and rural) Fire Stations
23% 73% 80% 68%
Fire Prevention Wing
In addition to fire fighting staff, there is an urgent need for fire prevention wing for inspection, awareness generation, and training for schools, hospitals, high-rise buildings, govt. offices, public buildings etc., so that recurrence of the fire incidences similar to that at the Advance Medical Research Institute (AMRI), Kolkata, in terms of their magnitude and frequency can be reduced. Accordingly, to support Dy. Director, A&N Fire Services, additional officers at
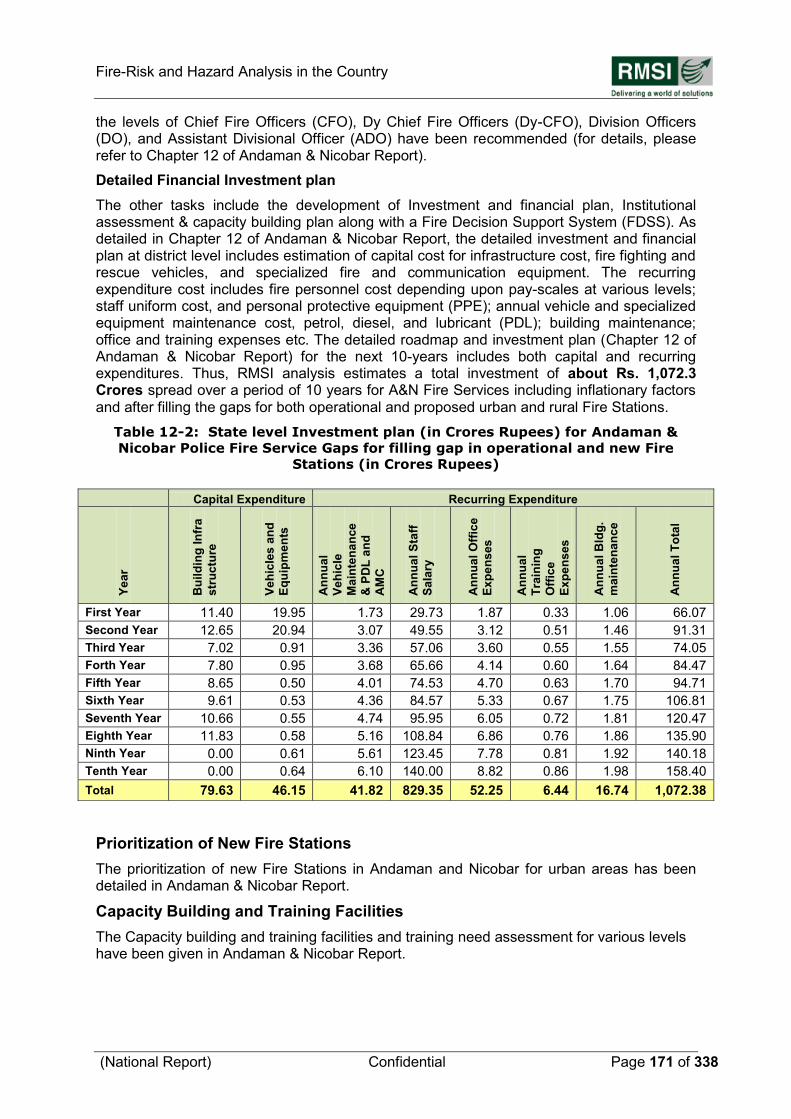
Fire-Risk and Hazard Analysis in the Country
(National Report) Confidential Page 171 of 338
the levels of Chief Fire Officers (CFO), Dy Chief Fire Officers (Dy-CFO), Division Officers (DO), and Assistant Divisional Officer (ADO) have been recommended (for details, please refer to Chapter 12 of Andaman & Nicobar Report).
Detailed Financial Investment plan
The other tasks include the development of Investment and financial plan, Institutional assessment & capacity building plan along with a Fire Decision Support System (FDSS). As detailed in Chapter 12 of Andaman & Nicobar Report, the detailed investment and financial plan at district level includes estimation of capital cost for infrastructure cost, fire fighting and rescue vehicles, and specialized fire and communication equipment. The recurring expenditure cost includes fire personnel cost depending upon pay-scales at various levels; staff uniform cost, and personal protective equipment (PPE); annual vehicle and specialized equipment maintenance cost, petrol, diesel, and lubricant (PDL); building maintenance; office and training expenses etc. The detailed roadmap and investment plan (Chapter 12 of Andaman & Nicobar Report) for the next 10-years includes both capital and recurring expenditures. Thus, RMSI analysis estimates a total investment of about Rs. 1,072.3 Crores spread over a period of 10 years for A&N Fire Services including inflationary factors and after filling the gaps for both operational and proposed urban and rural Fire Stations.
Table 12-2: State level Investment plan (in Crores Rupees) for Andaman &
Nicobar Police Fire Service Gaps for filling gap in operational and new Fire
Stations (in Crores Rupees)
Prioritization of New Fire Stations
The prioritization of new Fire Stations in Andaman and Nicobar for urban areas has been detailed in Andaman & Nicobar Report.
Capacity Building and Training Facilities
The Capacity building and training facilities and training need assessment for various levels have been given in Andaman & Nicobar Report.
Capital Expenditure Recurring Expenditure
Ye
ar
Bu
ild
ing
In
fra
str
uc
ture
Ve
hic
les
an
d
Eq
uip
me
nts
An
nu
al
Ve
hic
le
Ma
inte
na
nce
& P
DL
an
d
AM
C
An
nu
al
Sta
ff
Sa
lary
An
nu
al
Off
ice
Ex
pe
ns
es
An
nu
al
Tra
inin
g
Off
ice
Ex
pe
ns
es
An
nu
al
Bld
g.
ma
inte
na
nc
e
An
nu
al
To
tal
First Year 11.40 19.95 1.73 29.73 1.87 0.33 1.06 66.07
Second Year 12.65 20.94 3.07 49.55 3.12 0.51 1.46 91.31
Third Year 7.02 0.91 3.36 57.06 3.60 0.55 1.55 74.05
Forth Year 7.80 0.95 3.68 65.66 4.14 0.60 1.64 84.47
Fifth Year 8.65 0.50 4.01 74.53 4.70 0.63 1.70 94.71
Sixth Year 9.61 0.53 4.36 84.57 5.33 0.67 1.75 106.81
Seventh Year 10.66 0.55 4.74 95.95 6.05 0.72 1.81 120.47
Eighth Year 11.83 0.58 5.16 108.84 6.86 0.76 1.86 135.90
Ninth Year 0.00 0.61 5.61 123.45 7.78 0.81 1.92 140.18
Tenth Year 0.00 0.64 6.10 140.00 8.82 0.86 1.98 158.40
Total 79.63 46.15 41.82 829.35 52.25 6.44 16.74 1,072.38
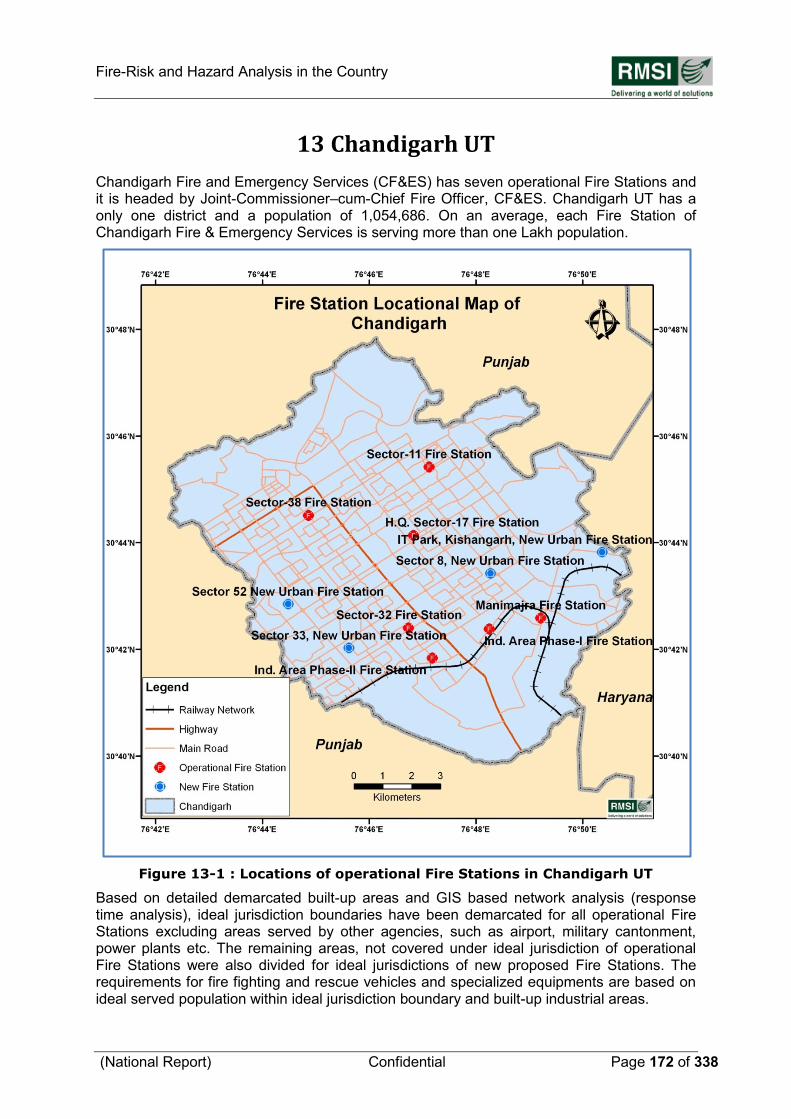
Fire-Risk and Hazard Analysis in the Country
(National Report) Confidential Page 172 of 338
13 Chandigarh UT
Chandigarh Fire and Emergency Services (CF&ES) has seven operational Fire Stations and it is headed by Joint-Commissioner–cum-Chief Fire Officer, CF&ES. Chandigarh UT has a only one district and a population of 1,054,686. On an average, each Fire Station of Chandigarh Fire & Emergency Services is serving more than one Lakh population.
Figure 13-1 : Locations of operational Fire Stations in Chandigarh UT
Based on detailed demarcated built-up areas and GIS based network analysis (response time analysis), ideal jurisdiction boundaries have been demarcated for all operational Fire Stations excluding areas served by other agencies, such as airport, military cantonment, power plants etc. The remaining areas, not covered under ideal jurisdiction of operational Fire Stations were also divided for ideal jurisdictions of new proposed Fire Stations. The requirements for fire fighting and rescue vehicles and specialized equipments are based on ideal served population within ideal jurisdiction boundary and built-up industrial areas.
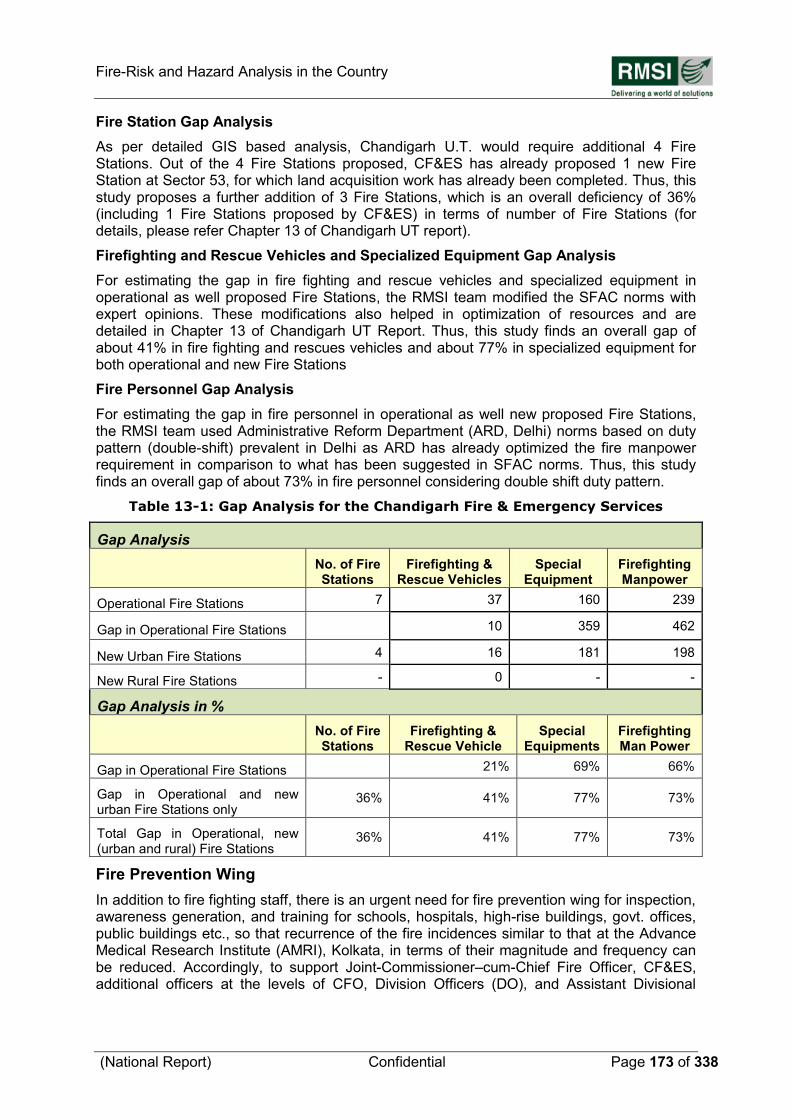
Fire-Risk and Hazard Analysis in the Country
(National Report) Confidential Page 173 of 338
Fire Station Gap Analysis
As per detailed GIS based analysis, Chandigarh U.T. would require additional 4 Fire Stations. Out of the 4 Fire Stations proposed, CF&ES has already proposed 1 new Fire Station at Sector 53, for which land acquisition work has already been completed. Thus, this study proposes a further addition of 3 Fire Stations, which is an overall deficiency of 36% (including 1 Fire Stations proposed by CF&ES) in terms of number of Fire Stations (for details, please refer Chapter 13 of Chandigarh UT report).
Firefighting and Rescue Vehicles and Specialized Equipment Gap Analysis
For estimating the gap in fire fighting and rescue vehicles and specialized equipment in operational as well proposed Fire Stations, the RMSI team modified the SFAC norms with expert opinions. These modifications also helped in optimization of resources and are detailed in Chapter 13 of Chandigarh UT Report. Thus, this study finds an overall gap of about 41% in fire fighting and rescues vehicles and about 77% in specialized equipment for both operational and new Fire Stations
Fire Personnel Gap Analysis
For estimating the gap in fire personnel in operational as well new proposed Fire Stations, the RMSI team used Administrative Reform Department (ARD, Delhi) norms based on duty pattern (double-shift) prevalent in Delhi as ARD has already optimized the fire manpower requirement in comparison to what has been suggested in SFAC norms. Thus, this study finds an overall gap of about 73% in fire personnel considering double shift duty pattern.
Table 13-1: Gap Analysis for the Chandigarh Fire & Emergency Services
Gap Analysis
No. of Fire Stations
Firefighting & Rescue Vehicles
Special Equipment
Firefighting Manpower
Operational Fire Stations 7 37 160 239
Gap in Operational Fire Stations 10 359 462
New Urban Fire Stations 4 16 181 198
New Rural Fire Stations - 0 - -
Gap Analysis in %
No. of Fire Stations
Firefighting & Rescue Vehicle
Special Equipments
Firefighting Man Power
Gap in Operational Fire Stations 21% 69% 66%
Gap in Operational and new urban Fire Stations only
36% 41% 77% 73%
Total Gap in Operational, new (urban and rural) Fire Stations
36% 41% 77% 73%
Fire Prevention Wing
In addition to fire fighting staff, there is an urgent need for fire prevention wing for inspection, awareness generation, and training for schools, hospitals, high-rise buildings, govt. offices, public buildings etc., so that recurrence of the fire incidences similar to that at the Advance Medical Research Institute (AMRI), Kolkata, in terms of their magnitude and frequency can be reduced. Accordingly, to support Joint-Commissioner–cum-Chief Fire Officer, CF&ES, additional officers at the levels of CFO, Division Officers (DO), and Assistant Divisional
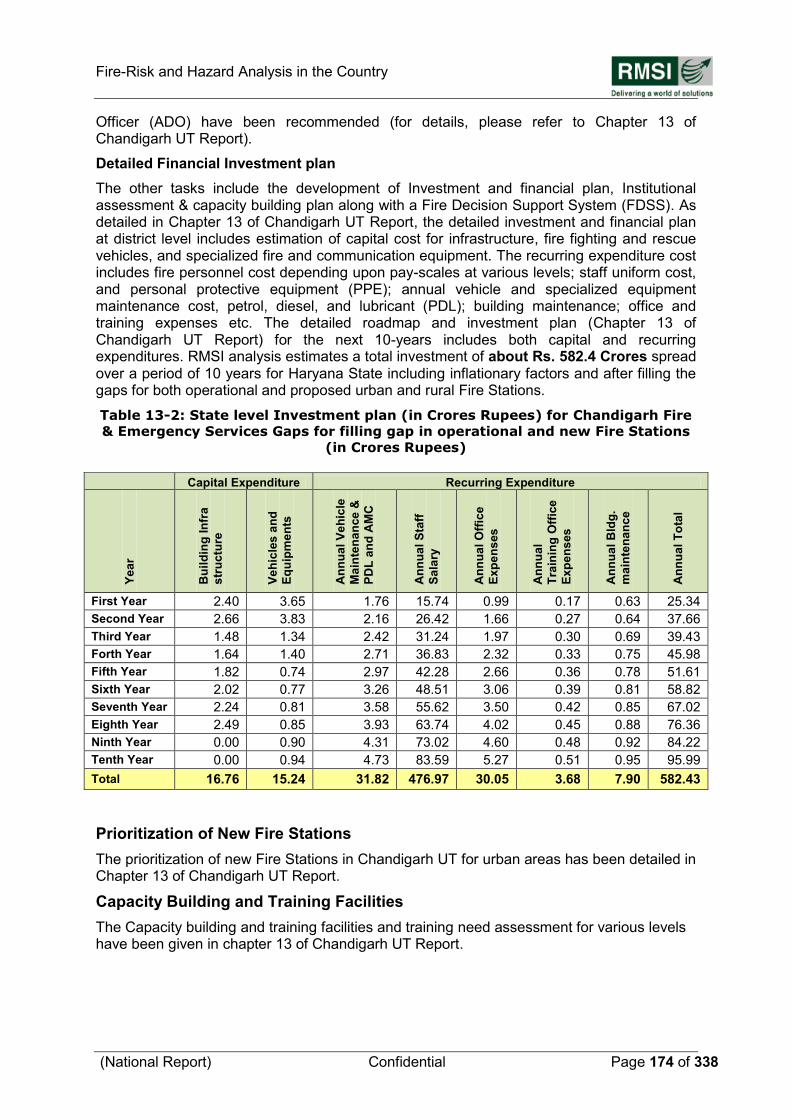
Fire-Risk and Hazard Analysis in the Country
(National Report) Confidential Page 174 of 338
Officer (ADO) have been recommended (for details, please refer to Chapter 13 of Chandigarh UT Report).
Detailed Financial Investment plan
The other tasks include the development of Investment and financial plan, Institutional assessment & capacity building plan along with a Fire Decision Support System (FDSS). As detailed in Chapter 13 of Chandigarh UT Report, the detailed investment and financial plan at district level includes estimation of capital cost for infrastructure, fire fighting and rescue vehicles, and specialized fire and communication equipment. The recurring expenditure cost includes fire personnel cost depending upon pay-scales at various levels; staff uniform cost, and personal protective equipment (PPE); annual vehicle and specialized equipment maintenance cost, petrol, diesel, and lubricant (PDL); building maintenance; office and training expenses etc. The detailed roadmap and investment plan (Chapter 13 of Chandigarh UT Report) for the next 10-years includes both capital and recurring expenditures. RMSI analysis estimates a total investment of about Rs. 582.4 Crores spread over a period of 10 years for Haryana State including inflationary factors and after filling the gaps for both operational and proposed urban and rural Fire Stations.
Table 13-2: State level Investment plan (in Crores Rupees) for Chandigarh Fire
& Emergency Services Gaps for filling gap in operational and new Fire Stations
(in Crores Rupees)
Prioritization of New Fire Stations
The prioritization of new Fire Stations in Chandigarh UT for urban areas has been detailed in Chapter 13 of Chandigarh UT Report.
Capacity Building and Training Facilities
The Capacity building and training facilities and training need assessment for various levels have been given in chapter 13 of Chandigarh UT Report.
Capital Expenditure Recurring Expenditure
Ye
ar
Bu
ild
ing
In
fra
str
uc
ture
Ve
hic
les
an
d
Eq
uip
me
nts
An
nu
al
Ve
hic
le
Ma
inte
na
nce
&
PD
L a
nd
AM
C
An
nu
al
Sta
ff
Sa
lary
An
nu
al
Off
ice
Ex
pe
ns
es
An
nu
al
Tra
inin
g O
ffic
e
Ex
pe
ns
es
An
nu
al
Bld
g.
ma
inte
na
nc
e
An
nu
al
To
tal
First Year 2.40 3.65 1.76 15.74 0.99 0.17 0.63 25.34
Second Year 2.66 3.83 2.16 26.42 1.66 0.27 0.64 37.66
Third Year 1.48 1.34 2.42 31.24 1.97 0.30 0.69 39.43
Forth Year 1.64 1.40 2.71 36.83 2.32 0.33 0.75 45.98
Fifth Year 1.82 0.74 2.97 42.28 2.66 0.36 0.78 51.61
Sixth Year 2.02 0.77 3.26 48.51 3.06 0.39 0.81 58.82
Seventh Year 2.24 0.81 3.58 55.62 3.50 0.42 0.85 67.02
Eighth Year 2.49 0.85 3.93 63.74 4.02 0.45 0.88 76.36
Ninth Year 0.00 0.90 4.31 73.02 4.60 0.48 0.92 84.22
Tenth Year 0.00 0.94 4.73 83.59 5.27 0.51 0.95 95.99
Total 16.76 15.24 31.82 476.97 30.05 3.68 7.90 582.43
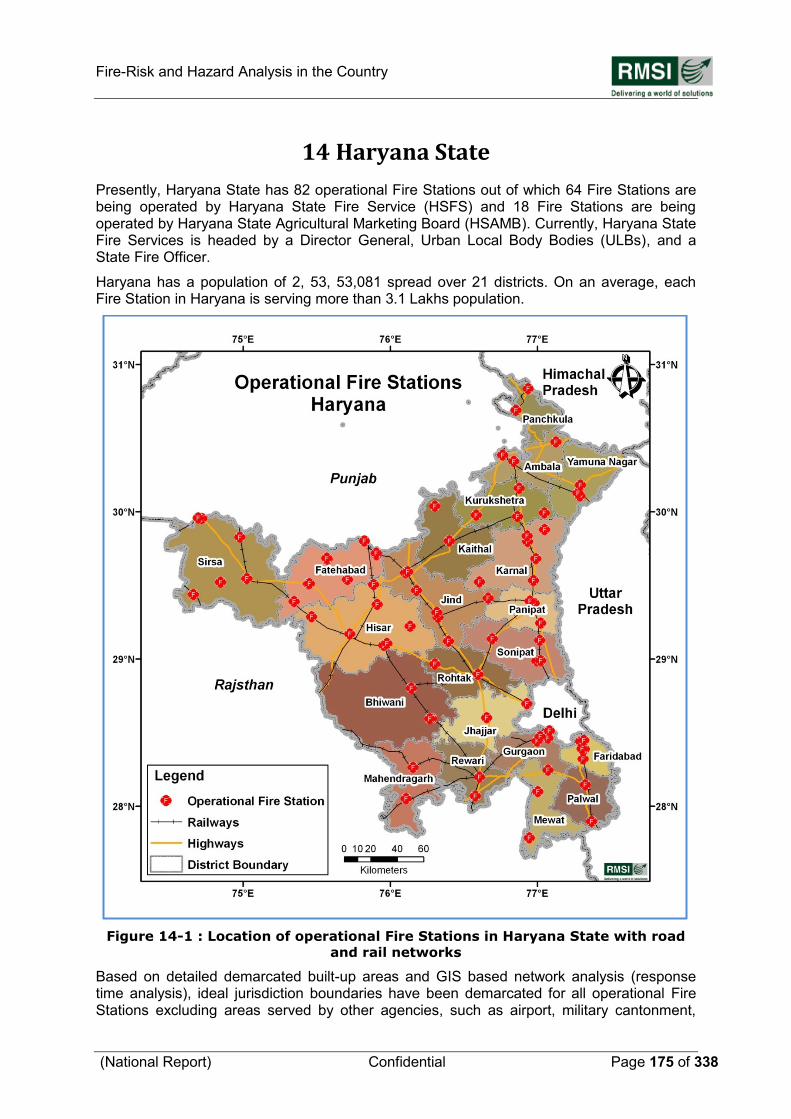
Fire-Risk and Hazard Analysis in the Country
(National Report) Confidential Page 175 of 338
14 Haryana State
Presently, Haryana State has 82 operational Fire Stations out of which 64 Fire Stations are being operated by Haryana State Fire Service (HSFS) and 18 Fire Stations are being operated by Haryana State Agricultural Marketing Board (HSAMB). Currently, Haryana State Fire Services is headed by a Director General, Urban Local Body Bodies (ULBs), and a State Fire Officer.
Haryana has a population of 2, 53, 53,081 spread over 21 districts. On an average, each Fire Station in Haryana is serving more than 3.1 Lakhs population.
Figure 14-1 : Location of operational Fire Stations in Haryana State with road
and rail networks
Based on detailed demarcated built-up areas and GIS based network analysis (response time analysis), ideal jurisdiction boundaries have been demarcated for all operational Fire Stations excluding areas served by other agencies, such as airport, military cantonment,
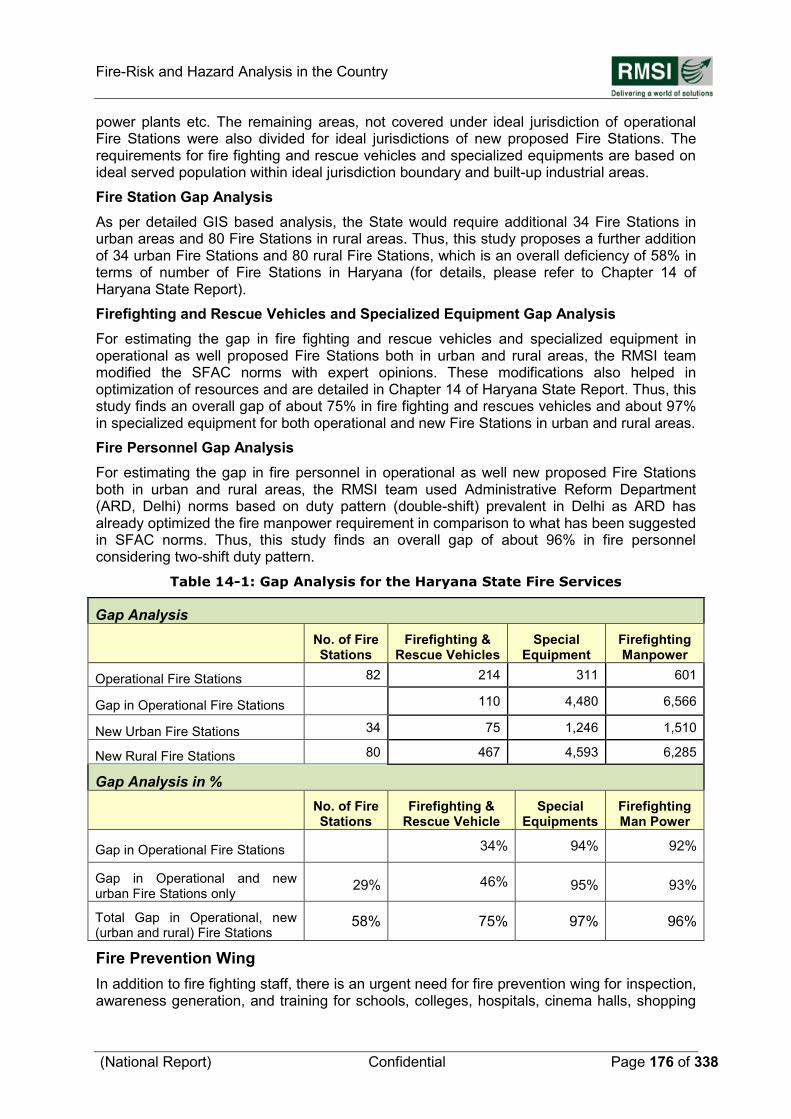
Fire-Risk and Hazard Analysis in the Country
(National Report) Confidential Page 176 of 338
power plants etc. The remaining areas, not covered under ideal jurisdiction of operational Fire Stations were also divided for ideal jurisdictions of new proposed Fire Stations. The requirements for fire fighting and rescue vehicles and specialized equipments are based on ideal served population within ideal jurisdiction boundary and built-up industrial areas.
Fire Station Gap Analysis
As per detailed GIS based analysis, the State would require additional 34 Fire Stations in urban areas and 80 Fire Stations in rural areas. Thus, this study proposes a further addition of 34 urban Fire Stations and 80 rural Fire Stations, which is an overall deficiency of 58% in terms of number of Fire Stations in Haryana (for details, please refer to Chapter 14 of Haryana State Report).
Firefighting and Rescue Vehicles and Specialized Equipment Gap Analysis
For estimating the gap in fire fighting and rescue vehicles and specialized equipment in operational as well proposed Fire Stations both in urban and rural areas, the RMSI team modified the SFAC norms with expert opinions. These modifications also helped in optimization of resources and are detailed in Chapter 14 of Haryana State Report. Thus, this study finds an overall gap of about 75% in fire fighting and rescues vehicles and about 97% in specialized equipment for both operational and new Fire Stations in urban and rural areas.
Fire Personnel Gap Analysis
For estimating the gap in fire personnel in operational as well new proposed Fire Stations both in urban and rural areas, the RMSI team used Administrative Reform Department (ARD, Delhi) norms based on duty pattern (double-shift) prevalent in Delhi as ARD has already optimized the fire manpower requirement in comparison to what has been suggested in SFAC norms. Thus, this study finds an overall gap of about 96% in fire personnel considering two-shift duty pattern.
Table 14-1: Gap Analysis for the Haryana State Fire Services
Gap Analysis
No. of Fire Stations
Firefighting & Rescue Vehicles
Special Equipment
Firefighting Manpower
Operational Fire Stations 82 214 311 601
Gap in Operational Fire Stations 110 4,480 6,566
New Urban Fire Stations 34 75 1,246 1,510
New Rural Fire Stations 80 467 4,593 6,285
Gap Analysis in %
No. of Fire Stations
Firefighting & Rescue Vehicle
Special Equipments
Firefighting Man Power
Gap in Operational Fire Stations 34% 94% 92%
Gap in Operational and new urban Fire Stations only
29% 46% 95% 93%
Total Gap in Operational, new (urban and rural) Fire Stations
58% 75% 97% 96%
Fire Prevention Wing
In addition to fire fighting staff, there is an urgent need for fire prevention wing for inspection, awareness generation, and training for schools, colleges, hospitals, cinema halls, shopping
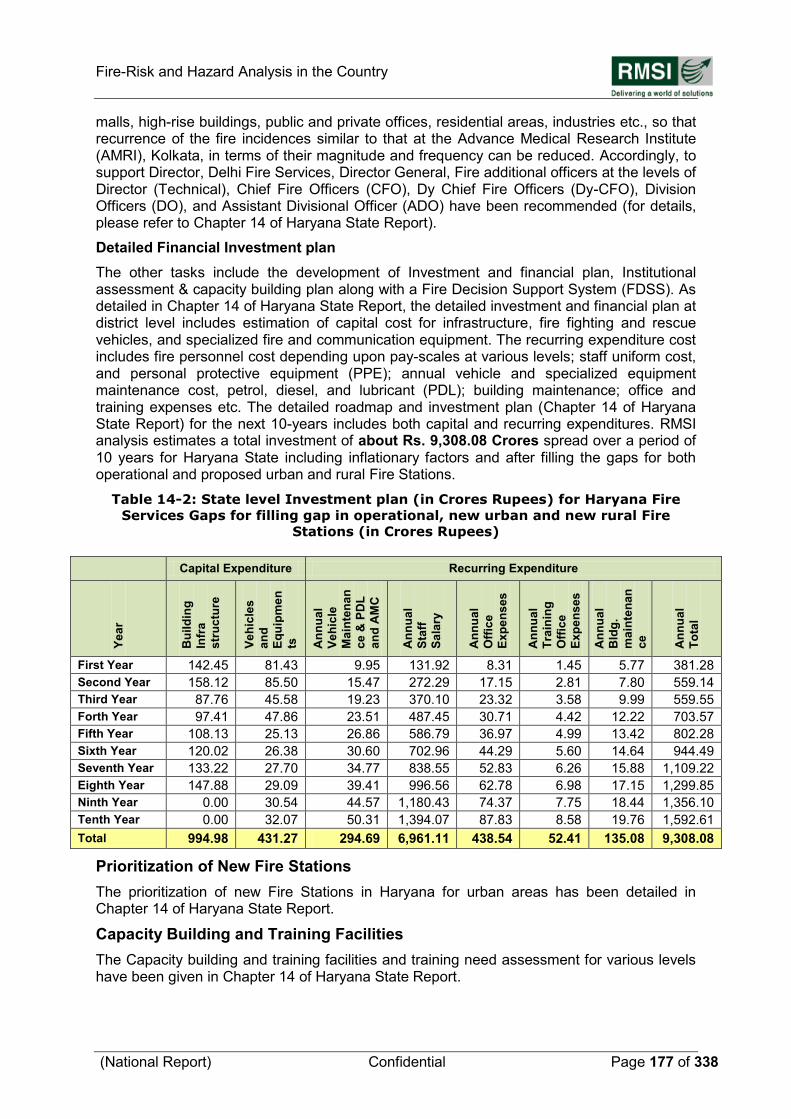
Fire-Risk and Hazard Analysis in the Country
(National Report) Confidential Page 177 of 338
malls, high-rise buildings, public and private offices, residential areas, industries etc., so that recurrence of the fire incidences similar to that at the Advance Medical Research Institute (AMRI), Kolkata, in terms of their magnitude and frequency can be reduced. Accordingly, to support Director, Delhi Fire Services, Director General, Fire additional officers at the levels of Director (Technical), Chief Fire Officers (CFO), Dy Chief Fire Officers (Dy-CFO), Division Officers (DO), and Assistant Divisional Officer (ADO) have been recommended (for details, please refer to Chapter 14 of Haryana State Report).
Detailed Financial Investment plan
The other tasks include the development of Investment and financial plan, Institutional assessment & capacity building plan along with a Fire Decision Support System (FDSS). As detailed in Chapter 14 of Haryana State Report, the detailed investment and financial plan at district level includes estimation of capital cost for infrastructure, fire fighting and rescue vehicles, and specialized fire and communication equipment. The recurring expenditure cost includes fire personnel cost depending upon pay-scales at various levels; staff uniform cost, and personal protective equipment (PPE); annual vehicle and specialized equipment maintenance cost, petrol, diesel, and lubricant (PDL); building maintenance; office and training expenses etc. The detailed roadmap and investment plan (Chapter 14 of Haryana State Report) for the next 10-years includes both capital and recurring expenditures. RMSI analysis estimates a total investment of about Rs. 9,308.08 Crores spread over a period of 10 years for Haryana State including inflationary factors and after filling the gaps for both operational and proposed urban and rural Fire Stations.
Table 14-2: State level Investment plan (in Crores Rupees) for Haryana Fire
Services Gaps for filling gap in operational, new urban and new rural Fire
Stations (in Crores Rupees)
Prioritization of New Fire Stations
The prioritization of new Fire Stations in Haryana for urban areas has been detailed in Chapter 14 of Haryana State Report.
Capacity Building and Training Facilities
The Capacity building and training facilities and training need assessment for various levels have been given in Chapter 14 of Haryana State Report.
Capital Expenditure Recurring Expenditure
Ye
ar
Bu
ild
ing
Infr
a
str
uc
ture
Ve
hic
les
an
d
Eq
uip
me
n
ts
An
nu
al
Ve
hic
le
Ma
inte
na
n
ce
& P
DL
an
d A
MC
An
nu
al
Sta
ff
Sa
lary
An
nu
al
Off
ice
Ex
pe
ns
es
An
nu
al
Tra
inin
g
Off
ice
Ex
pe
ns
es
An
nu
al
Bld
g.
ma
inte
na
n
ce
An
nu
al
To
tal
First Year 142.45 81.43 9.95 131.92 8.31 1.45 5.77 381.28
Second Year 158.12 85.50 15.47 272.29 17.15 2.81 7.80 559.14
Third Year 87.76 45.58 19.23 370.10 23.32 3.58 9.99 559.55
Forth Year 97.41 47.86 23.51 487.45 30.71 4.42 12.22 703.57
Fifth Year 108.13 25.13 26.86 586.79 36.97 4.99 13.42 802.28
Sixth Year 120.02 26.38 30.60 702.96 44.29 5.60 14.64 944.49
Seventh Year 133.22 27.70 34.77 838.55 52.83 6.26 15.88 1,109.22
Eighth Year 147.88 29.09 39.41 996.56 62.78 6.98 17.15 1,299.85
Ninth Year 0.00 30.54 44.57 1,180.43 74.37 7.75 18.44 1,356.10
Tenth Year 0.00 32.07 50.31 1,394.07 87.83 8.58 19.76 1,592.61
Total 994.98 431.27 294.69 6,961.11 438.54 52.41 135.08 9,308.08
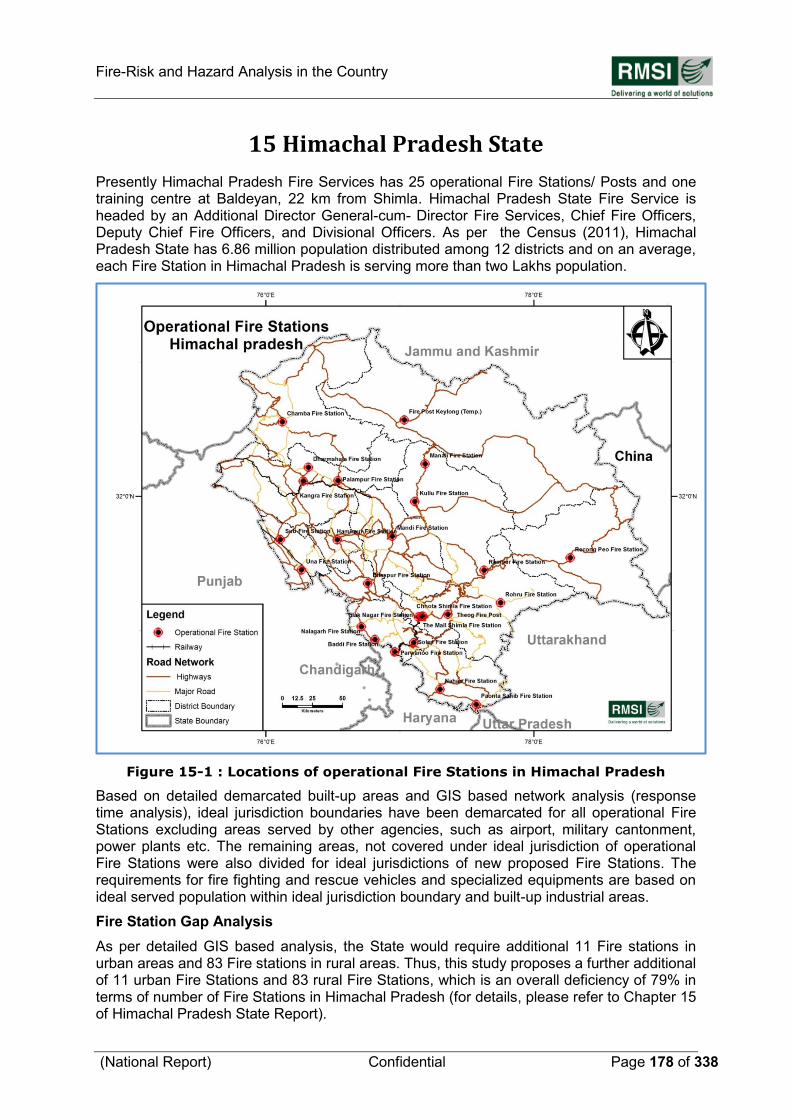
Fire-Risk and Hazard Analysis in the Country
(National Report) Confidential Page 178 of 338
15 Himachal Pradesh State
Presently Himachal Pradesh Fire Services has 25 operational Fire Stations/ Posts and one training centre at Baldeyan, 22 km from Shimla. Himachal Pradesh State Fire Service is headed by an Additional Director General-cum- Director Fire Services, Chief Fire Officers, Deputy Chief Fire Officers, and Divisional Officers. As per the Census (2011), Himachal Pradesh State has 6.86 million population distributed among 12 districts and on an average, each Fire Station in Himachal Pradesh is serving more than two Lakhs population.
Figure 15-1 : Locations of operational Fire Stations in Himachal Pradesh
Based on detailed demarcated built-up areas and GIS based network analysis (response time analysis), ideal jurisdiction boundaries have been demarcated for all operational Fire Stations excluding areas served by other agencies, such as airport, military cantonment, power plants etc. The remaining areas, not covered under ideal jurisdiction of operational Fire Stations were also divided for ideal jurisdictions of new proposed Fire Stations. The requirements for fire fighting and rescue vehicles and specialized equipments are based on ideal served population within ideal jurisdiction boundary and built-up industrial areas.
Fire Station Gap Analysis
As per detailed GIS based analysis, the State would require additional 11 Fire stations in urban areas and 83 Fire stations in rural areas. Thus, this study proposes a further additional of 11 urban Fire Stations and 83 rural Fire Stations, which is an overall deficiency of 79% in terms of number of Fire Stations in Himachal Pradesh (for details, please refer to Chapter 15 of Himachal Pradesh State Report).
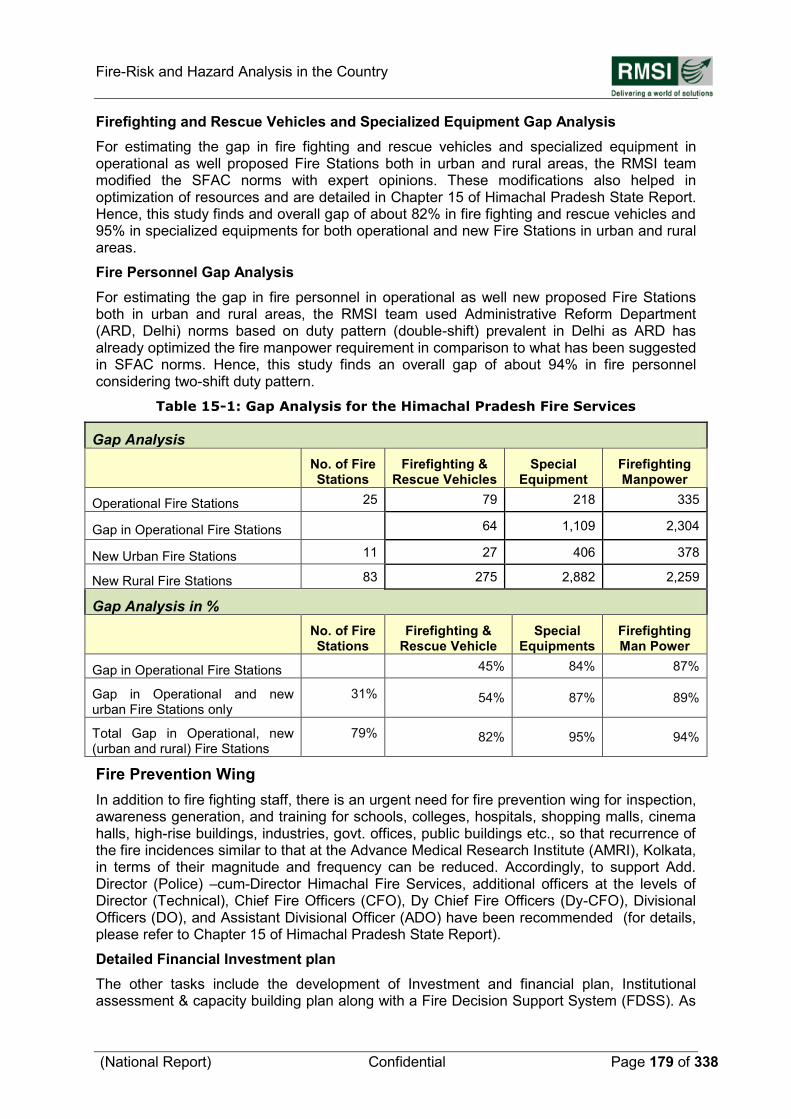
Fire-Risk and Hazard Analysis in the Country
(National Report) Confidential Page 179 of 338
Firefighting and Rescue Vehicles and Specialized Equipment Gap Analysis
For estimating the gap in fire fighting and rescue vehicles and specialized equipment in operational as well proposed Fire Stations both in urban and rural areas, the RMSI team modified the SFAC norms with expert opinions. These modifications also helped in optimization of resources and are detailed in Chapter 15 of Himachal Pradesh State Report. Hence, this study finds and overall gap of about 82% in fire fighting and rescue vehicles and 95% in specialized equipments for both operational and new Fire Stations in urban and rural areas.
Fire Personnel Gap Analysis
For estimating the gap in fire personnel in operational as well new proposed Fire Stations both in urban and rural areas, the RMSI team used Administrative Reform Department (ARD, Delhi) norms based on duty pattern (double-shift) prevalent in Delhi as ARD has already optimized the fire manpower requirement in comparison to what has been suggested in SFAC norms. Hence, this study finds an overall gap of about 94% in fire personnel considering two-shift duty pattern.
Table 15-1: Gap Analysis for the Himachal Pradesh Fire Services
Gap Analysis
No. of Fire Stations
Firefighting & Rescue Vehicles
Special Equipment
Firefighting Manpower
Operational Fire Stations 25 79 218 335
Gap in Operational Fire Stations 64 1,109 2,304
New Urban Fire Stations 11 27 406 378
New Rural Fire Stations 83 275 2,882 2,259
Gap Analysis in %
No. of Fire Stations
Firefighting & Rescue Vehicle
Special Equipments
Firefighting Man Power
Gap in Operational Fire Stations 45% 84% 87%
Gap in Operational and new urban Fire Stations only
31% 54% 87% 89%
Total Gap in Operational, new (urban and rural) Fire Stations
79% 82% 95% 94%
Fire Prevention Wing
In addition to fire fighting staff, there is an urgent need for fire prevention wing for inspection, awareness generation, and training for schools, colleges, hospitals, shopping malls, cinema halls, high-rise buildings, industries, govt. offices, public buildings etc., so that recurrence of the fire incidences similar to that at the Advance Medical Research Institute (AMRI), Kolkata, in terms of their magnitude and frequency can be reduced. Accordingly, to support Add. Director (Police) –cum-Director Himachal Fire Services, additional officers at the levels of Director (Technical), Chief Fire Officers (CFO), Dy Chief Fire Officers (Dy-CFO), Divisional Officers (DO), and Assistant Divisional Officer (ADO) have been recommended (for details, please refer to Chapter 15 of Himachal Pradesh State Report).
Detailed Financial Investment plan
The other tasks include the development of Investment and financial plan, Institutional assessment & capacity building plan along with a Fire Decision Support System (FDSS). As
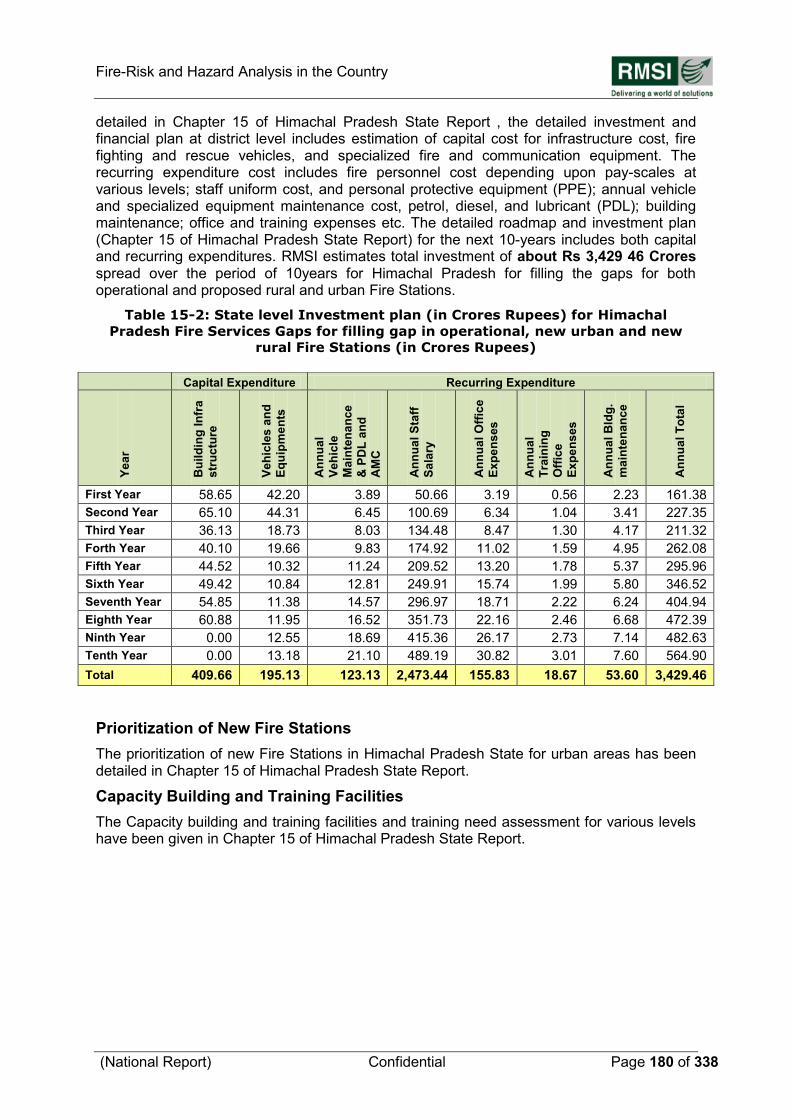
Fire-Risk and Hazard Analysis in the Country
(National Report) Confidential Page 180 of 338
detailed in Chapter 15 of Himachal Pradesh State Report , the detailed investment and financial plan at district level includes estimation of capital cost for infrastructure cost, fire fighting and rescue vehicles, and specialized fire and communication equipment. The recurring expenditure cost includes fire personnel cost depending upon pay-scales at various levels; staff uniform cost, and personal protective equipment (PPE); annual vehicle and specialized equipment maintenance cost, petrol, diesel, and lubricant (PDL); building maintenance; office and training expenses etc. The detailed roadmap and investment plan (Chapter 15 of Himachal Pradesh State Report) for the next 10-years includes both capital and recurring expenditures. RMSI estimates total investment of about Rs 3,429 46 Crores spread over the period of 10years for Himachal Pradesh for filling the gaps for both operational and proposed rural and urban Fire Stations.
Table 15-2: State level Investment plan (in Crores Rupees) for Himachal
Pradesh Fire Services Gaps for filling gap in operational, new urban and new
rural Fire Stations (in Crores Rupees)
Prioritization of New Fire Stations
The prioritization of new Fire Stations in Himachal Pradesh State for urban areas has been detailed in Chapter 15 of Himachal Pradesh State Report.
Capacity Building and Training Facilities
The Capacity building and training facilities and training need assessment for various levels have been given in Chapter 15 of Himachal Pradesh State Report.
Capital Expenditure Recurring Expenditure
Ye
ar
Bu
ild
ing
In
fra
str
uc
ture
Ve
hic
les
an
d
Eq
uip
me
nts
An
nu
al
Ve
hic
le
Ma
inte
na
nce
& P
DL
an
d
AM
C
An
nu
al
Sta
ff
Sa
lary
An
nu
al
Off
ice
Ex
pe
ns
es
An
nu
al
Tra
inin
g
Off
ice
Ex
pe
ns
es
An
nu
al
Bld
g.
ma
inte
na
nc
e
An
nu
al
To
tal
First Year 58.65 42.20 3.89 50.66 3.19 0.56 2.23 161.38
Second Year 65.10 44.31 6.45 100.69 6.34 1.04 3.41 227.35
Third Year 36.13 18.73 8.03 134.48 8.47 1.30 4.17 211.32
Forth Year 40.10 19.66 9.83 174.92 11.02 1.59 4.95 262.08
Fifth Year 44.52 10.32 11.24 209.52 13.20 1.78 5.37 295.96
Sixth Year 49.42 10.84 12.81 249.91 15.74 1.99 5.80 346.52
Seventh Year 54.85 11.38 14.57 296.97 18.71 2.22 6.24 404.94
Eighth Year 60.88 11.95 16.52 351.73 22.16 2.46 6.68 472.39
Ninth Year 0.00 12.55 18.69 415.36 26.17 2.73 7.14 482.63
Tenth Year 0.00 13.18 21.10 489.19 30.82 3.01 7.60 564.90
Total 409.66 195.13 123.13 2,473.44 155.83 18.67 53.60 3,429.46
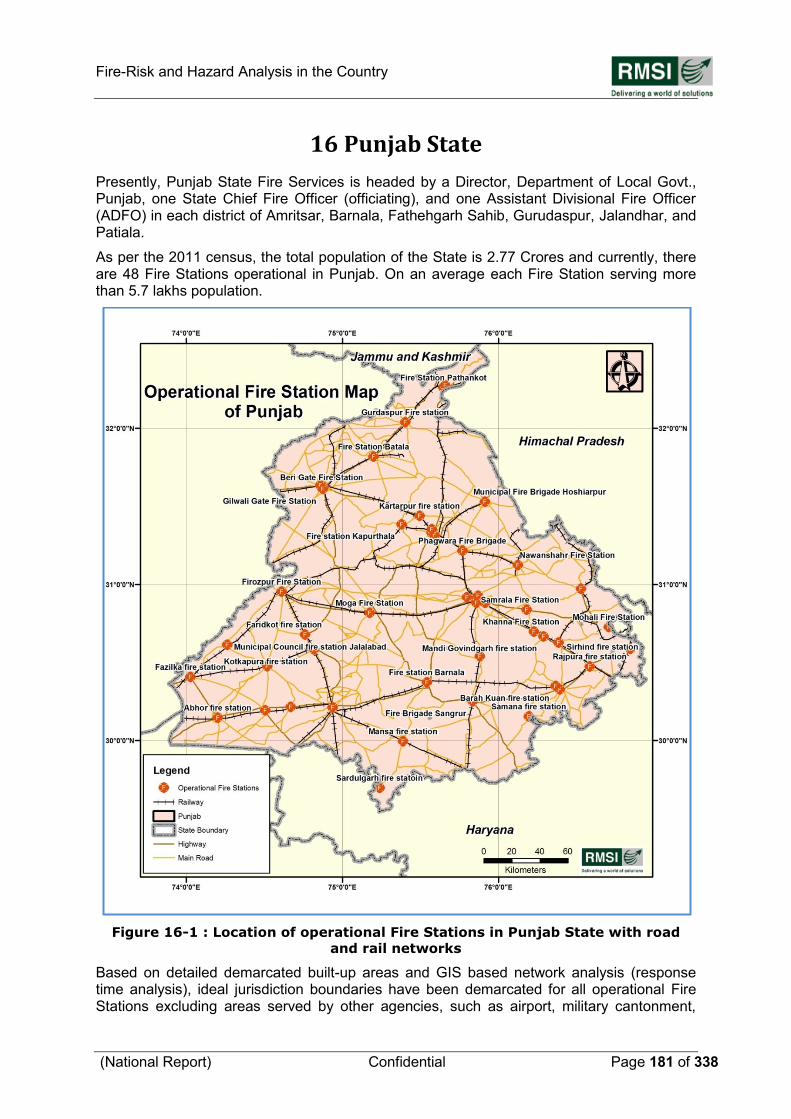
Fire-Risk and Hazard Analysis in the Country
(National Report) Confidential Page 181 of 338
16 Punjab State
Presently, Punjab State Fire Services is headed by a Director, Department of Local Govt., Punjab, one State Chief Fire Officer (officiating), and one Assistant Divisional Fire Officer (ADFO) in each district of Amritsar, Barnala, Fathehgarh Sahib, Gurudaspur, Jalandhar, and Patiala.
As per the 2011 census, the total population of the State is 2.77 Crores and currently, there are 48 Fire Stations operational in Punjab. On an average each Fire Station serving more than 5.7 lakhs population.
Figure 16-1 : Location of operational Fire Stations in Punjab State with road
and rail networks
Based on detailed demarcated built-up areas and GIS based network analysis (response time analysis), ideal jurisdiction boundaries have been demarcated for all operational Fire Stations excluding areas served by other agencies, such as airport, military cantonment,
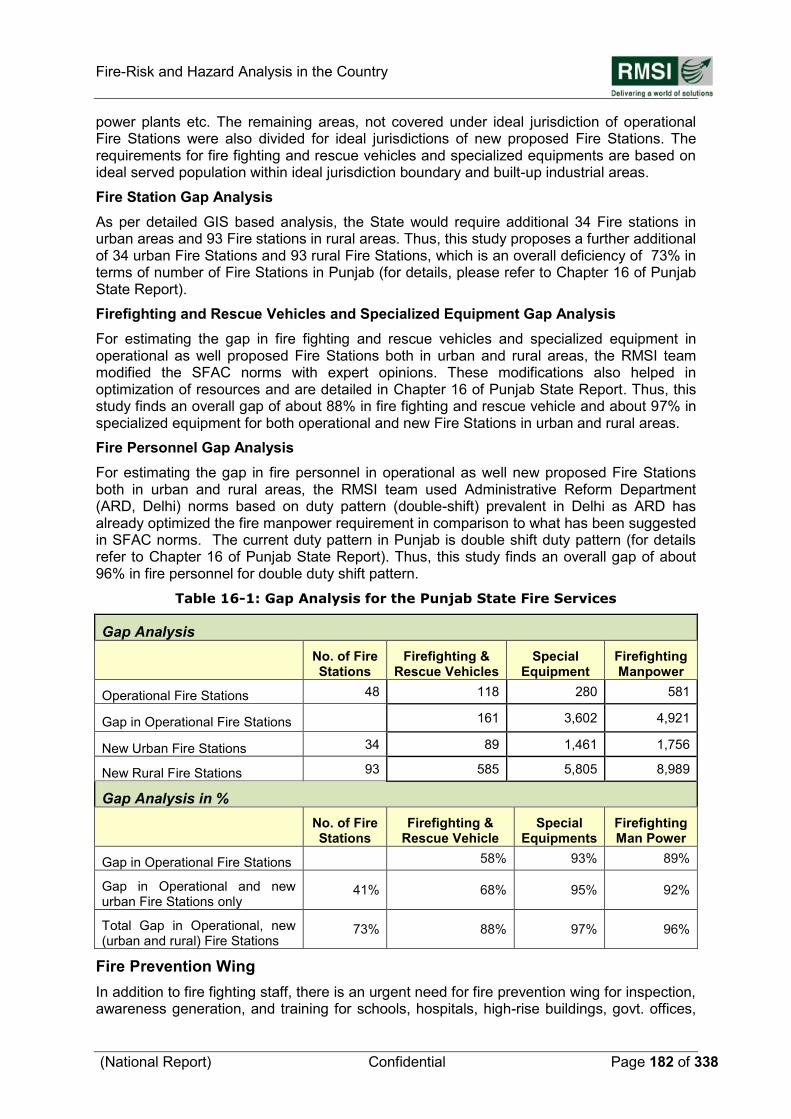
Fire-Risk and Hazard Analysis in the Country
(National Report) Confidential Page 182 of 338
power plants etc. The remaining areas, not covered under ideal jurisdiction of operational Fire Stations were also divided for ideal jurisdictions of new proposed Fire Stations. The requirements for fire fighting and rescue vehicles and specialized equipments are based on ideal served population within ideal jurisdiction boundary and built-up industrial areas.
Fire Station Gap Analysis
As per detailed GIS based analysis, the State would require additional 34 Fire stations in urban areas and 93 Fire stations in rural areas. Thus, this study proposes a further additional of 34 urban Fire Stations and 93 rural Fire Stations, which is an overall deficiency of 73% in terms of number of Fire Stations in Punjab (for details, please refer to Chapter 16 of Punjab State Report).
Firefighting and Rescue Vehicles and Specialized Equipment Gap Analysis
For estimating the gap in fire fighting and rescue vehicles and specialized equipment in operational as well proposed Fire Stations both in urban and rural areas, the RMSI team modified the SFAC norms with expert opinions. These modifications also helped in optimization of resources and are detailed in Chapter 16 of Punjab State Report. Thus, this study finds an overall gap of about 88% in fire fighting and rescue vehicle and about 97% in specialized equipment for both operational and new Fire Stations in urban and rural areas.
Fire Personnel Gap Analysis
For estimating the gap in fire personnel in operational as well new proposed Fire Stations both in urban and rural areas, the RMSI team used Administrative Reform Department (ARD, Delhi) norms based on duty pattern (double-shift) prevalent in Delhi as ARD has already optimized the fire manpower requirement in comparison to what has been suggested in SFAC norms. The current duty pattern in Punjab is double shift duty pattern (for details refer to Chapter 16 of Punjab State Report). Thus, this study finds an overall gap of about 96% in fire personnel for double duty shift pattern.
Table 16-1: Gap Analysis for the Punjab State Fire Services
Gap Analysis
No. of Fire Stations
Firefighting & Rescue Vehicles
Special Equipment
Firefighting Manpower
Operational Fire Stations 48 118 280 581
Gap in Operational Fire Stations 161 3,602 4,921
New Urban Fire Stations 34 89 1,461 1,756
New Rural Fire Stations 93 585 5,805 8,989
Gap Analysis in %
No. of Fire Stations
Firefighting & Rescue Vehicle
Special Equipments
Firefighting Man Power
Gap in Operational Fire Stations 58% 93% 89%
Gap in Operational and new urban Fire Stations only
41% 68% 95% 92%
Total Gap in Operational, new (urban and rural) Fire Stations
73% 88% 97% 96%
Fire Prevention Wing
In addition to fire fighting staff, there is an urgent need for fire prevention wing for inspection, awareness generation, and training for schools, hospitals, high-rise buildings, govt. offices,
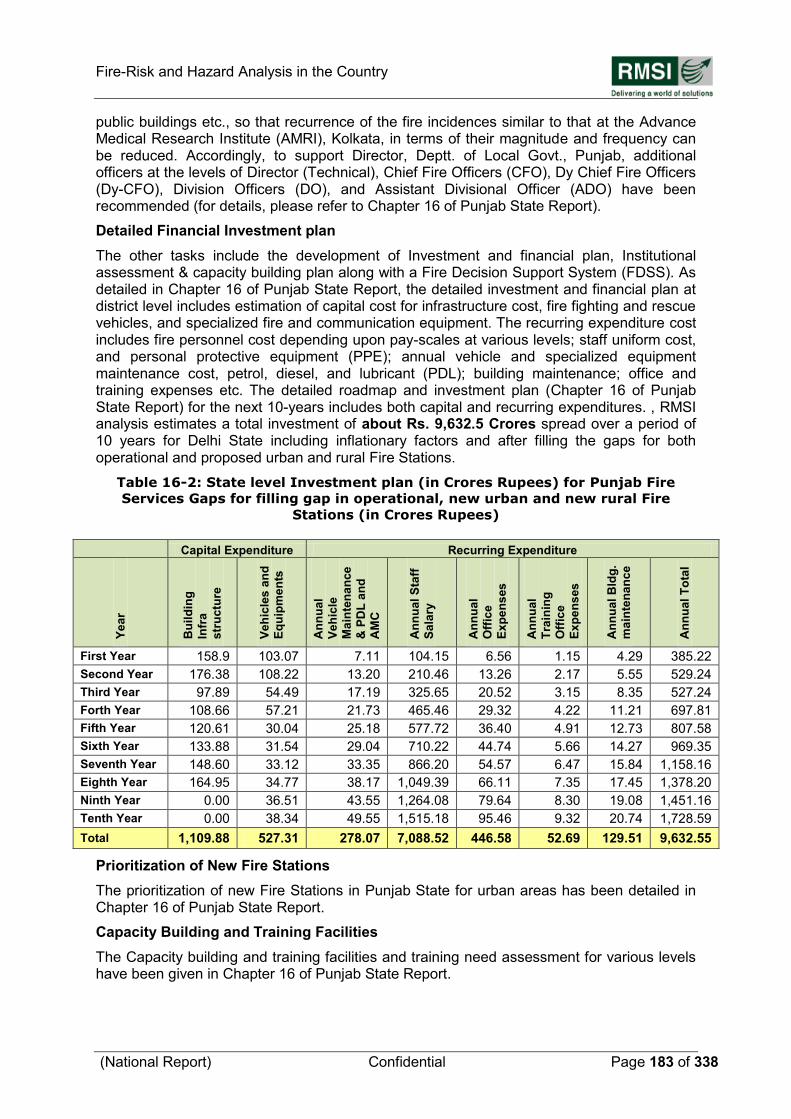
Fire-Risk and Hazard Analysis in the Country
(National Report) Confidential Page 183 of 338
public buildings etc., so that recurrence of the fire incidences similar to that at the Advance Medical Research Institute (AMRI), Kolkata, in terms of their magnitude and frequency can be reduced. Accordingly, to support Director, Deptt. of Local Govt., Punjab, additional officers at the levels of Director (Technical), Chief Fire Officers (CFO), Dy Chief Fire Officers (Dy-CFO), Division Officers (DO), and Assistant Divisional Officer (ADO) have been recommended (for details, please refer to Chapter 16 of Punjab State Report).
Detailed Financial Investment plan
The other tasks include the development of Investment and financial plan, Institutional assessment & capacity building plan along with a Fire Decision Support System (FDSS). As detailed in Chapter 16 of Punjab State Report, the detailed investment and financial plan at district level includes estimation of capital cost for infrastructure cost, fire fighting and rescue vehicles, and specialized fire and communication equipment. The recurring expenditure cost includes fire personnel cost depending upon pay-scales at various levels; staff uniform cost, and personal protective equipment (PPE); annual vehicle and specialized equipment maintenance cost, petrol, diesel, and lubricant (PDL); building maintenance; office and training expenses etc. The detailed roadmap and investment plan (Chapter 16 of Punjab State Report) for the next 10-years includes both capital and recurring expenditures. , RMSI analysis estimates a total investment of about Rs. 9,632.5 Crores spread over a period of 10 years for Delhi State including inflationary factors and after filling the gaps for both operational and proposed urban and rural Fire Stations.
Table 16-2: State level Investment plan (in Crores Rupees) for Punjab Fire
Services Gaps for filling gap in operational, new urban and new rural Fire
Stations (in Crores Rupees)
Prioritization of New Fire Stations
The prioritization of new Fire Stations in Punjab State for urban areas has been detailed in Chapter 16 of Punjab State Report.
Capacity Building and Training Facilities
The Capacity building and training facilities and training need assessment for various levels have been given in Chapter 16 of Punjab State Report.
Capital Expenditure Recurring Expenditure
Ye
ar
Bu
ild
ing
Infr
a
str
uc
ture
Ve
hic
les
an
d
Eq
uip
me
nts
An
nu
al
Ve
hic
le
Ma
inte
na
nce
& P
DL
an
d
AM
C
An
nu
al
Sta
ff
Sa
lary
An
nu
al
Off
ice
Ex
pe
ns
es
An
nu
al
Tra
inin
g
Off
ice
Ex
pe
ns
es
An
nu
al
Bld
g.
ma
inte
na
nc
e
An
nu
al
To
tal
First Year 158.9 103.07 7.11 104.15 6.56 1.15 4.29 385.22
Second Year 176.38 108.22 13.20 210.46 13.26 2.17 5.55 529.24
Third Year 97.89 54.49 17.19 325.65 20.52 3.15 8.35 527.24
Forth Year 108.66 57.21 21.73 465.46 29.32 4.22 11.21 697.81
Fifth Year 120.61 30.04 25.18 577.72 36.40 4.91 12.73 807.58
Sixth Year 133.88 31.54 29.04 710.22 44.74 5.66 14.27 969.35
Seventh Year 148.60 33.12 33.35 866.20 54.57 6.47 15.84 1,158.16
Eighth Year 164.95 34.77 38.17 1,049.39 66.11 7.35 17.45 1,378.20
Ninth Year 0.00 36.51 43.55 1,264.08 79.64 8.30 19.08 1,451.16
Tenth Year 0.00 38.34 49.55 1,515.18 95.46 9.32 20.74 1,728.59
Total 1,109.88 527.31 278.07 7,088.52 446.58 52.69 129.51 9,632.55
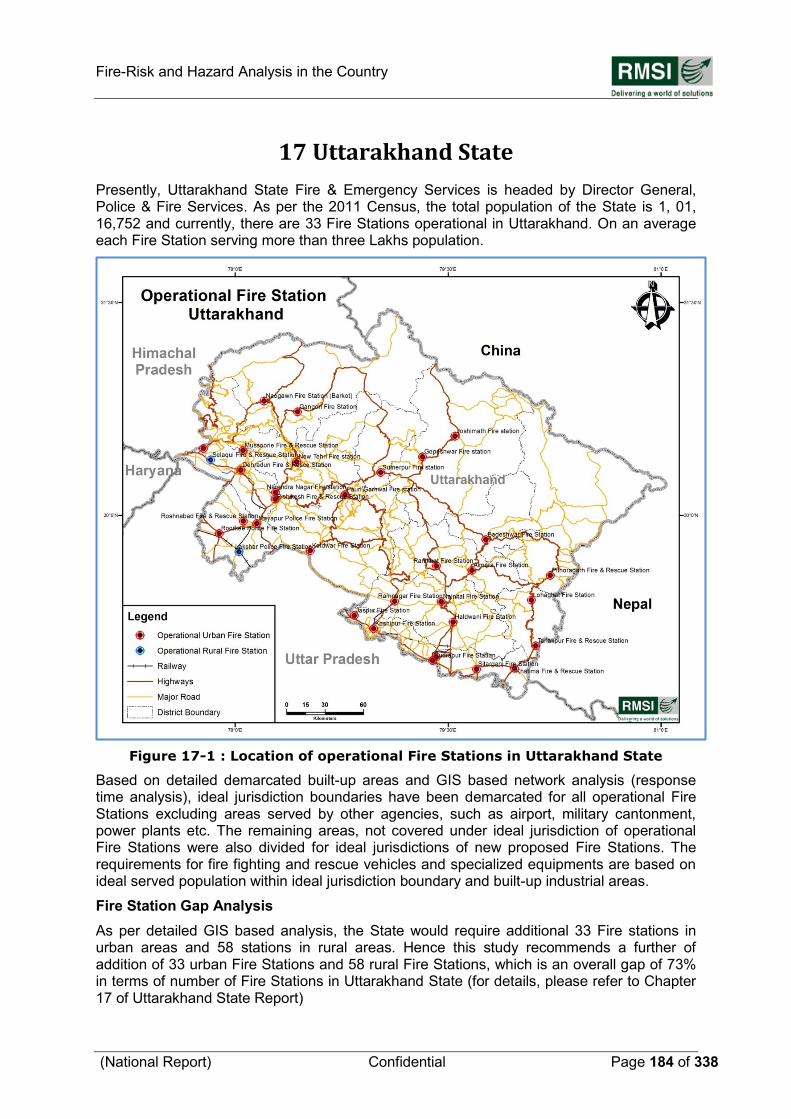
Fire-Risk and Hazard Analysis in the Country
(National Report) Confidential Page 184 of 338
17 Uttarakhand State
Presently, Uttarakhand State Fire & Emergency Services is headed by Director General, Police & Fire Services. As per the 2011 Census, the total population of the State is 1, 01, 16,752 and currently, there are 33 Fire Stations operational in Uttarakhand. On an average each Fire Station serving more than three Lakhs population.
Figure 17-1 : Location of operational Fire Stations in Uttarakhand State
Based on detailed demarcated built-up areas and GIS based network analysis (response time analysis), ideal jurisdiction boundaries have been demarcated for all operational Fire Stations excluding areas served by other agencies, such as airport, military cantonment, power plants etc. The remaining areas, not covered under ideal jurisdiction of operational Fire Stations were also divided for ideal jurisdictions of new proposed Fire Stations. The requirements for fire fighting and rescue vehicles and specialized equipments are based on ideal served population within ideal jurisdiction boundary and built-up industrial areas.
Fire Station Gap Analysis
As per detailed GIS based analysis, the State would require additional 33 Fire stations in urban areas and 58 stations in rural areas. Hence this study recommends a further of addition of 33 urban Fire Stations and 58 rural Fire Stations, which is an overall gap of 73% in terms of number of Fire Stations in Uttarakhand State (for details, please refer to Chapter 17 of Uttarakhand State Report)
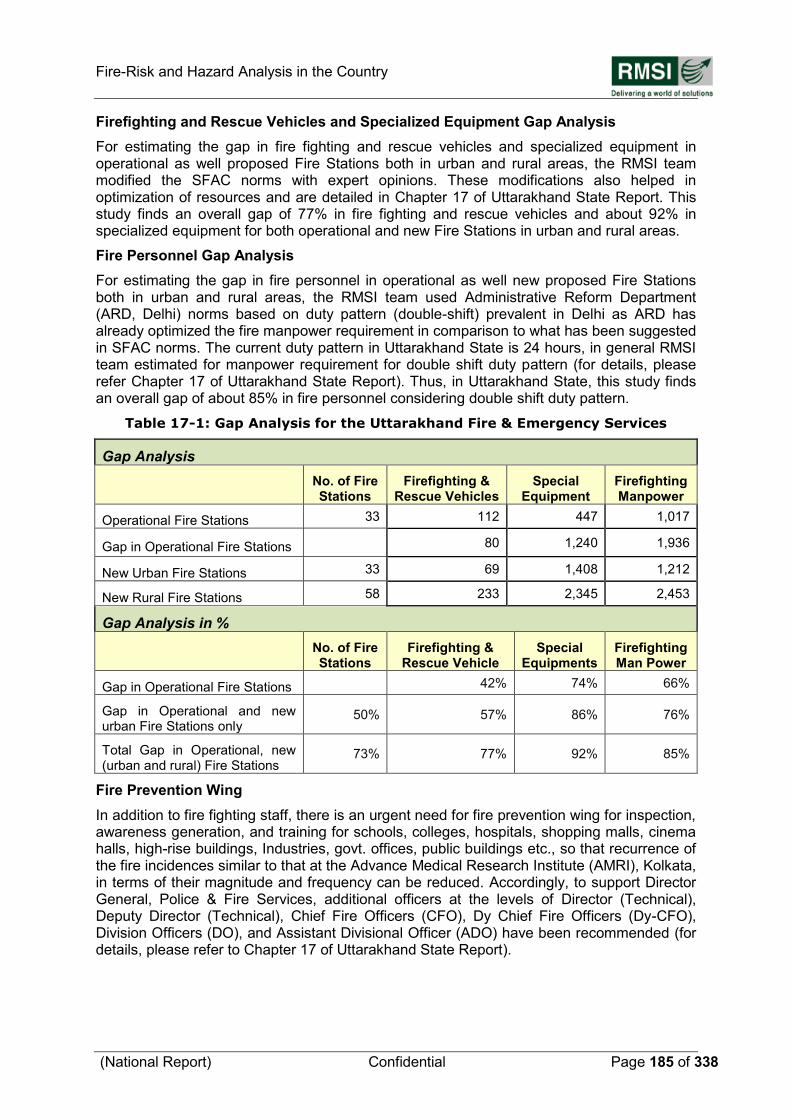
Fire-Risk and Hazard Analysis in the Country
(National Report) Confidential Page 185 of 338
Firefighting and Rescue Vehicles and Specialized Equipment Gap Analysis
For estimating the gap in fire fighting and rescue vehicles and specialized equipment in operational as well proposed Fire Stations both in urban and rural areas, the RMSI team modified the SFAC norms with expert opinions. These modifications also helped in optimization of resources and are detailed in Chapter 17 of Uttarakhand State Report. This study finds an overall gap of 77% in fire fighting and rescue vehicles and about 92% in specialized equipment for both operational and new Fire Stations in urban and rural areas.
Fire Personnel Gap Analysis
For estimating the gap in fire personnel in operational as well new proposed Fire Stations both in urban and rural areas, the RMSI team used Administrative Reform Department (ARD, Delhi) norms based on duty pattern (double-shift) prevalent in Delhi as ARD has already optimized the fire manpower requirement in comparison to what has been suggested in SFAC norms. The current duty pattern in Uttarakhand State is 24 hours, in general RMSI team estimated for manpower requirement for double shift duty pattern (for details, please refer Chapter 17 of Uttarakhand State Report). Thus, in Uttarakhand State, this study finds an overall gap of about 85% in fire personnel considering double shift duty pattern.
Table 17-1: Gap Analysis for the Uttarakhand Fire & Emergency Services
Gap Analysis
No. of Fire Stations
Firefighting & Rescue Vehicles
Special Equipment
Firefighting Manpower
Operational Fire Stations 33 112 447 1,017
Gap in Operational Fire Stations 80 1,240 1,936
New Urban Fire Stations 33 69 1,408 1,212
New Rural Fire Stations 58 233 2,345 2,453
Gap Analysis in %
No. of Fire Stations
Firefighting & Rescue Vehicle
Special Equipments
Firefighting Man Power
Gap in Operational Fire Stations 42% 74% 66%
Gap in Operational and new urban Fire Stations only
50% 57% 86% 76%
Total Gap in Operational, new (urban and rural) Fire Stations
73% 77% 92% 85%
Fire Prevention Wing
In addition to fire fighting staff, there is an urgent need for fire prevention wing for inspection, awareness generation, and training for schools, colleges, hospitals, shopping malls, cinema halls, high-rise buildings, Industries, govt. offices, public buildings etc., so that recurrence of the fire incidences similar to that at the Advance Medical Research Institute (AMRI), Kolkata, in terms of their magnitude and frequency can be reduced. Accordingly, to support Director General, Police & Fire Services, additional officers at the levels of Director (Technical), Deputy Director (Technical), Chief Fire Officers (CFO), Dy Chief Fire Officers (Dy-CFO), Division Officers (DO), and Assistant Divisional Officer (ADO) have been recommended (for details, please refer to Chapter 17 of Uttarakhand State Report).
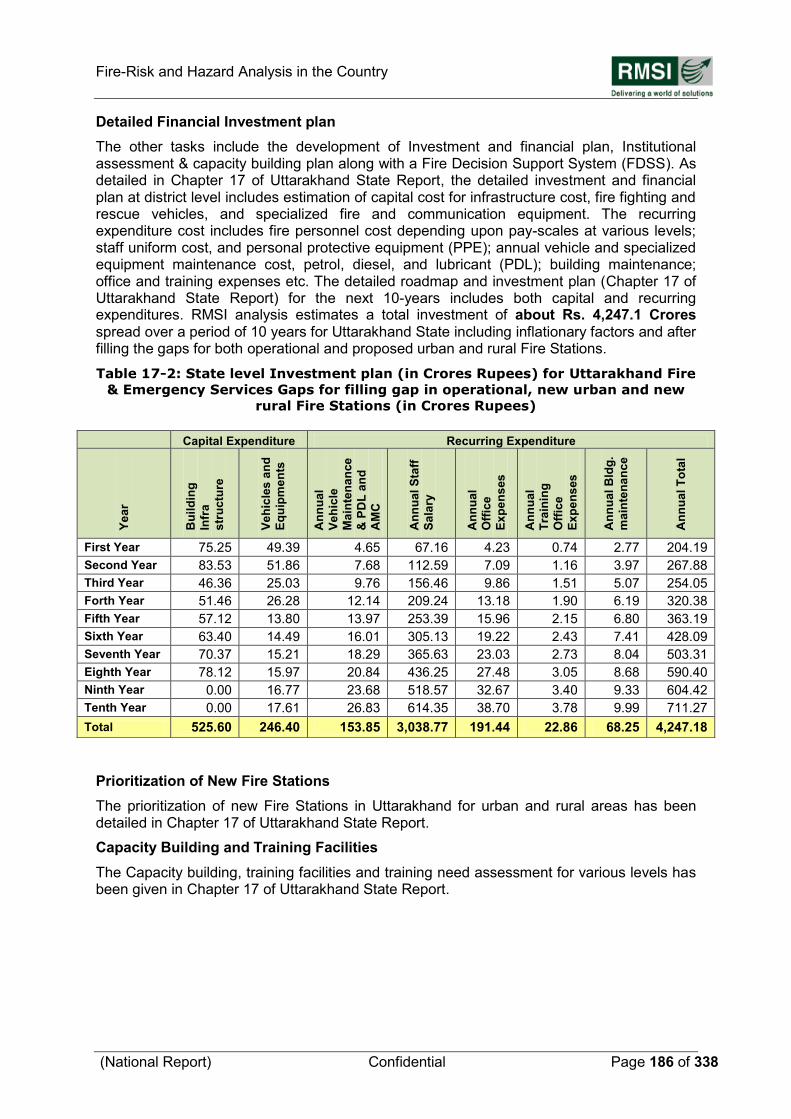
Fire-Risk and Hazard Analysis in the Country
(National Report) Confidential Page 186 of 338
Detailed Financial Investment plan
The other tasks include the development of Investment and financial plan, Institutional assessment & capacity building plan along with a Fire Decision Support System (FDSS). As detailed in Chapter 17 of Uttarakhand State Report, the detailed investment and financial plan at district level includes estimation of capital cost for infrastructure cost, fire fighting and rescue vehicles, and specialized fire and communication equipment. The recurring expenditure cost includes fire personnel cost depending upon pay-scales at various levels; staff uniform cost, and personal protective equipment (PPE); annual vehicle and specialized equipment maintenance cost, petrol, diesel, and lubricant (PDL); building maintenance; office and training expenses etc. The detailed roadmap and investment plan (Chapter 17 of Uttarakhand State Report) for the next 10-years includes both capital and recurring expenditures. RMSI analysis estimates a total investment of about Rs. 4,247.1 Crores spread over a period of 10 years for Uttarakhand State including inflationary factors and after filling the gaps for both operational and proposed urban and rural Fire Stations.
Table 17-2: State level Investment plan (in Crores Rupees) for Uttarakhand Fire
& Emergency Services Gaps for filling gap in operational, new urban and new
rural Fire Stations (in Crores Rupees)
Prioritization of New Fire Stations
The prioritization of new Fire Stations in Uttarakhand for urban and rural areas has been detailed in Chapter 17 of Uttarakhand State Report.
Capacity Building and Training Facilities
The Capacity building, training facilities and training need assessment for various levels has been given in Chapter 17 of Uttarakhand State Report.
Capital Expenditure Recurring Expenditure
Ye
ar
Bu
ild
ing
Infr
a
str
uc
ture
Ve
hic
les
an
d
Eq
uip
me
nts
An
nu
al
Ve
hic
le
Ma
inte
na
nce
& P
DL
an
d
AM
C
An
nu
al
Sta
ff
Sa
lary
An
nu
al
Off
ice
Ex
pe
ns
es
An
nu
al
Tra
inin
g
Off
ice
Ex
pe
ns
es
An
nu
al
Bld
g.
ma
inte
na
nc
e
An
nu
al
To
tal
First Year 75.25 49.39 4.65 67.16 4.23 0.74 2.77 204.19
Second Year 83.53 51.86 7.68 112.59 7.09 1.16 3.97 267.88
Third Year 46.36 25.03 9.76 156.46 9.86 1.51 5.07 254.05
Forth Year 51.46 26.28 12.14 209.24 13.18 1.90 6.19 320.38
Fifth Year 57.12 13.80 13.97 253.39 15.96 2.15 6.80 363.19
Sixth Year 63.40 14.49 16.01 305.13 19.22 2.43 7.41 428.09
Seventh Year 70.37 15.21 18.29 365.63 23.03 2.73 8.04 503.31
Eighth Year 78.12 15.97 20.84 436.25 27.48 3.05 8.68 590.40
Ninth Year 0.00 16.77 23.68 518.57 32.67 3.40 9.33 604.42
Tenth Year 0.00 17.61 26.83 614.35 38.70 3.78 9.99 711.27
Total 525.60 246.40 153.85 3,038.77 191.44 22.86 68.25 4,247.18
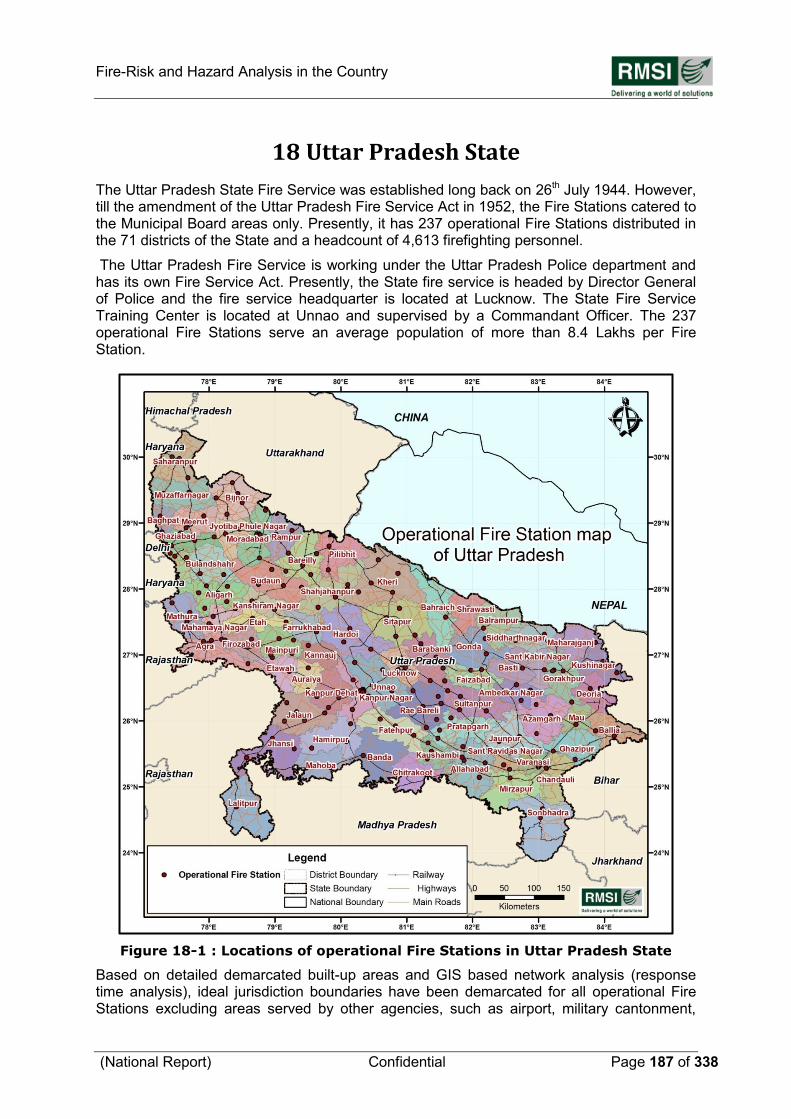
Fire-Risk and Hazard Analysis in the Country
(National Report) Confidential Page 187 of 338
18 Uttar Pradesh State
The Uttar Pradesh State Fire Service was established long back on 26th July 1944. However, till the amendment of the Uttar Pradesh Fire Service Act in 1952, the Fire Stations catered to the Municipal Board areas only. Presently, it has 237 operational Fire Stations distributed in the 71 districts of the State and a headcount of 4,613 firefighting personnel.
The Uttar Pradesh Fire Service is working under the Uttar Pradesh Police department and has its own Fire Service Act. Presently, the State fire service is headed by Director General of Police and the fire service headquarter is located at Lucknow. The State Fire Service Training Center is located at Unnao and supervised by a Commandant Officer. The 237 operational Fire Stations serve an average population of more than 8.4 Lakhs per Fire Station.
Figure 18-1 : Locations of operational Fire Stations in Uttar Pradesh State
Based on detailed demarcated built-up areas and GIS based network analysis (response time analysis), ideal jurisdiction boundaries have been demarcated for all operational Fire Stations excluding areas served by other agencies, such as airport, military cantonment,
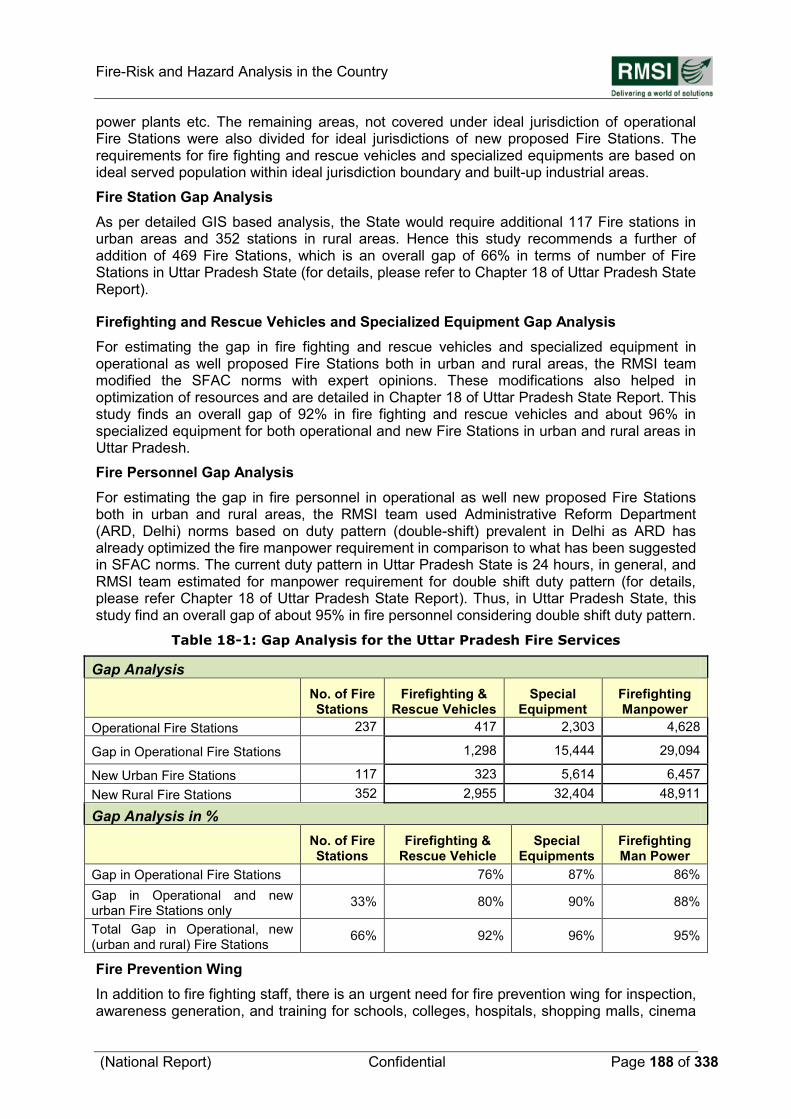
Fire-Risk and Hazard Analysis in the Country
(National Report) Confidential Page 188 of 338
power plants etc. The remaining areas, not covered under ideal jurisdiction of operational Fire Stations were also divided for ideal jurisdictions of new proposed Fire Stations. The requirements for fire fighting and rescue vehicles and specialized equipments are based on ideal served population within ideal jurisdiction boundary and built-up industrial areas.
Fire Station Gap Analysis
As per detailed GIS based analysis, the State would require additional 117 Fire stations in urban areas and 352 stations in rural areas. Hence this study recommends a further of addition of 469 Fire Stations, which is an overall gap of 66% in terms of number of Fire Stations in Uttar Pradesh State (for details, please refer to Chapter 18 of Uttar Pradesh State Report).
Firefighting and Rescue Vehicles and Specialized Equipment Gap Analysis
For estimating the gap in fire fighting and rescue vehicles and specialized equipment in operational as well proposed Fire Stations both in urban and rural areas, the RMSI team modified the SFAC norms with expert opinions. These modifications also helped in optimization of resources and are detailed in Chapter 18 of Uttar Pradesh State Report. This study finds an overall gap of 92% in fire fighting and rescue vehicles and about 96% in specialized equipment for both operational and new Fire Stations in urban and rural areas in Uttar Pradesh.
Fire Personnel Gap Analysis
For estimating the gap in fire personnel in operational as well new proposed Fire Stations both in urban and rural areas, the RMSI team used Administrative Reform Department (ARD, Delhi) norms based on duty pattern (double-shift) prevalent in Delhi as ARD has already optimized the fire manpower requirement in comparison to what has been suggested in SFAC norms. The current duty pattern in Uttar Pradesh State is 24 hours, in general, and RMSI team estimated for manpower requirement for double shift duty pattern (for details, please refer Chapter 18 of Uttar Pradesh State Report). Thus, in Uttar Pradesh State, this study find an overall gap of about 95% in fire personnel considering double shift duty pattern.
Table 18-1: Gap Analysis for the Uttar Pradesh Fire Services
Gap Analysis
No. of Fire Stations
Firefighting & Rescue Vehicles
Special Equipment
Firefighting Manpower
Operational Fire Stations 237 417 2,303 4,628
Gap in Operational Fire Stations
1,298 15,444 29,094
New Urban Fire Stations 117 323 5,614 6,457
New Rural Fire Stations 352 2,955 32,404 48,911
Gap Analysis in %
No. of Fire Stations
Firefighting & Rescue Vehicle
Special Equipments
Firefighting Man Power
Gap in Operational Fire Stations 76% 87% 86%
Gap in Operational and new urban Fire Stations only
33% 80% 90% 88%
Total Gap in Operational, new (urban and rural) Fire Stations
66% 92% 96% 95%
Fire Prevention Wing
In addition to fire fighting staff, there is an urgent need for fire prevention wing for inspection, awareness generation, and training for schools, colleges, hospitals, shopping malls, cinema
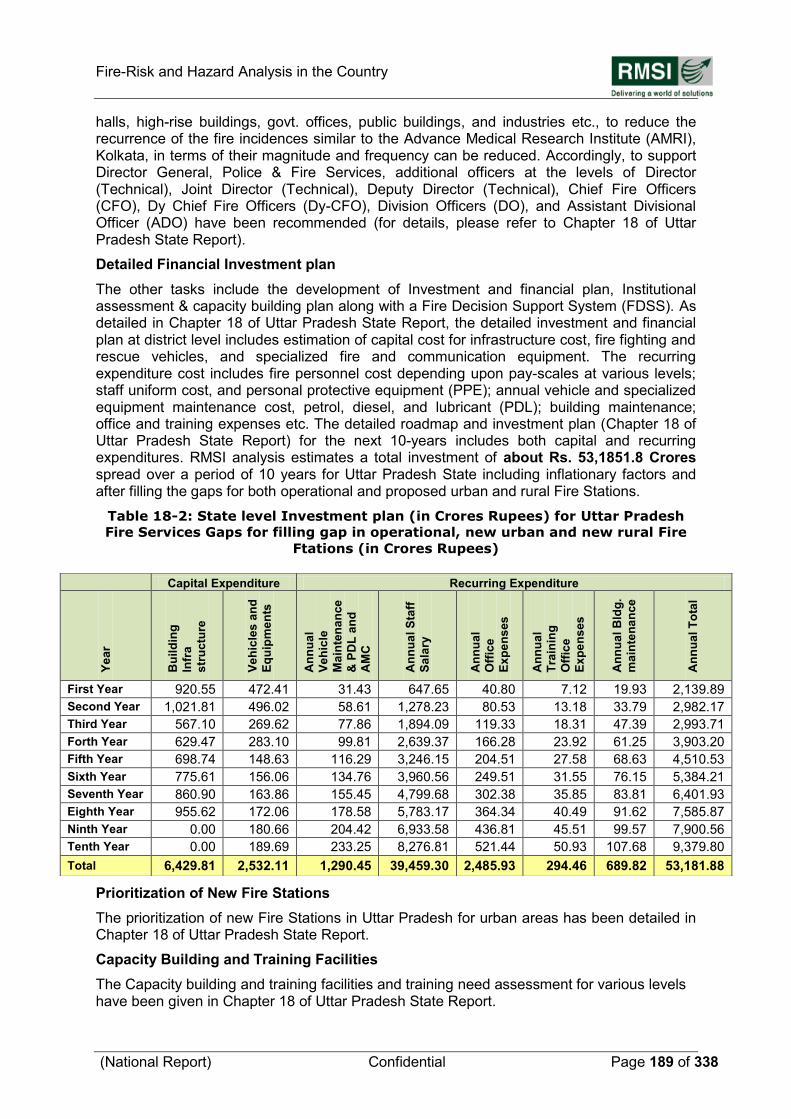
Fire-Risk and Hazard Analysis in the Country
(National Report) Confidential Page 189 of 338
halls, high-rise buildings, govt. offices, public buildings, and industries etc., to reduce the recurrence of the fire incidences similar to the Advance Medical Research Institute (AMRI), Kolkata, in terms of their magnitude and frequency can be reduced. Accordingly, to support Director General, Police & Fire Services, additional officers at the levels of Director (Technical), Joint Director (Technical), Deputy Director (Technical), Chief Fire Officers (CFO), Dy Chief Fire Officers (Dy-CFO), Division Officers (DO), and Assistant Divisional Officer (ADO) have been recommended (for details, please refer to Chapter 18 of Uttar Pradesh State Report).
Detailed Financial Investment plan
The other tasks include the development of Investment and financial plan, Institutional assessment & capacity building plan along with a Fire Decision Support System (FDSS). As detailed in Chapter 18 of Uttar Pradesh State Report, the detailed investment and financial plan at district level includes estimation of capital cost for infrastructure cost, fire fighting and rescue vehicles, and specialized fire and communication equipment. The recurring expenditure cost includes fire personnel cost depending upon pay-scales at various levels; staff uniform cost, and personal protective equipment (PPE); annual vehicle and specialized equipment maintenance cost, petrol, diesel, and lubricant (PDL); building maintenance; office and training expenses etc. The detailed roadmap and investment plan (Chapter 18 of Uttar Pradesh State Report) for the next 10-years includes both capital and recurring expenditures. RMSI analysis estimates a total investment of about Rs. 53,1851.8 Crores spread over a period of 10 years for Uttar Pradesh State including inflationary factors and after filling the gaps for both operational and proposed urban and rural Fire Stations.
Table 18-2: State level Investment plan (in Crores Rupees) for Uttar Pradesh
Fire Services Gaps for filling gap in operational, new urban and new rural Fire
Ftations (in Crores Rupees)
Prioritization of New Fire Stations
The prioritization of new Fire Stations in Uttar Pradesh for urban areas has been detailed in Chapter 18 of Uttar Pradesh State Report.
Capacity Building and Training Facilities
The Capacity building and training facilities and training need assessment for various levels have been given in Chapter 18 of Uttar Pradesh State Report.
Capital Expenditure Recurring Expenditure
Ye
ar
Bu
ild
ing
Infr
a
str
uc
ture
Ve
hic
les
an
d
Eq
uip
me
nts
An
nu
al
Ve
hic
le
Ma
inte
na
nce
& P
DL
an
d
AM
C
An
nu
al
Sta
ff
Sa
lary
An
nu
al
Off
ice
Ex
pe
ns
es
An
nu
al
Tra
inin
g
Off
ice
Ex
pe
ns
es
An
nu
al
Bld
g.
ma
inte
na
nc
e
An
nu
al
To
tal
First Year 920.55 472.41 31.43 647.65 40.80 7.12 19.93 2,139.89
Second Year 1,021.81 496.02 58.61 1,278.23 80.53 13.18 33.79 2,982.17
Third Year 567.10 269.62 77.86 1,894.09 119.33 18.31 47.39 2,993.71
Forth Year 629.47 283.10 99.81 2,639.37 166.28 23.92 61.25 3,903.20
Fifth Year 698.74 148.63 116.29 3,246.15 204.51 27.58 68.63 4,510.53
Sixth Year 775.61 156.06 134.76 3,960.56 249.51 31.55 76.15 5,384.21
Seventh Year 860.90 163.86 155.45 4,799.68 302.38 35.85 83.81 6,401.93
Eighth Year 955.62 172.06 178.58 5,783.17 364.34 40.49 91.62 7,585.87
Ninth Year 0.00 180.66 204.42 6,933.58 436.81 45.51 99.57 7,900.56
Tenth Year 0.00 189.69 233.25 8,276.81 521.44 50.93 107.68 9,379.80
Total 6,429.81 2,532.11 1,290.45 39,459.30 2,485.93 294.46 689.82 53,181.88
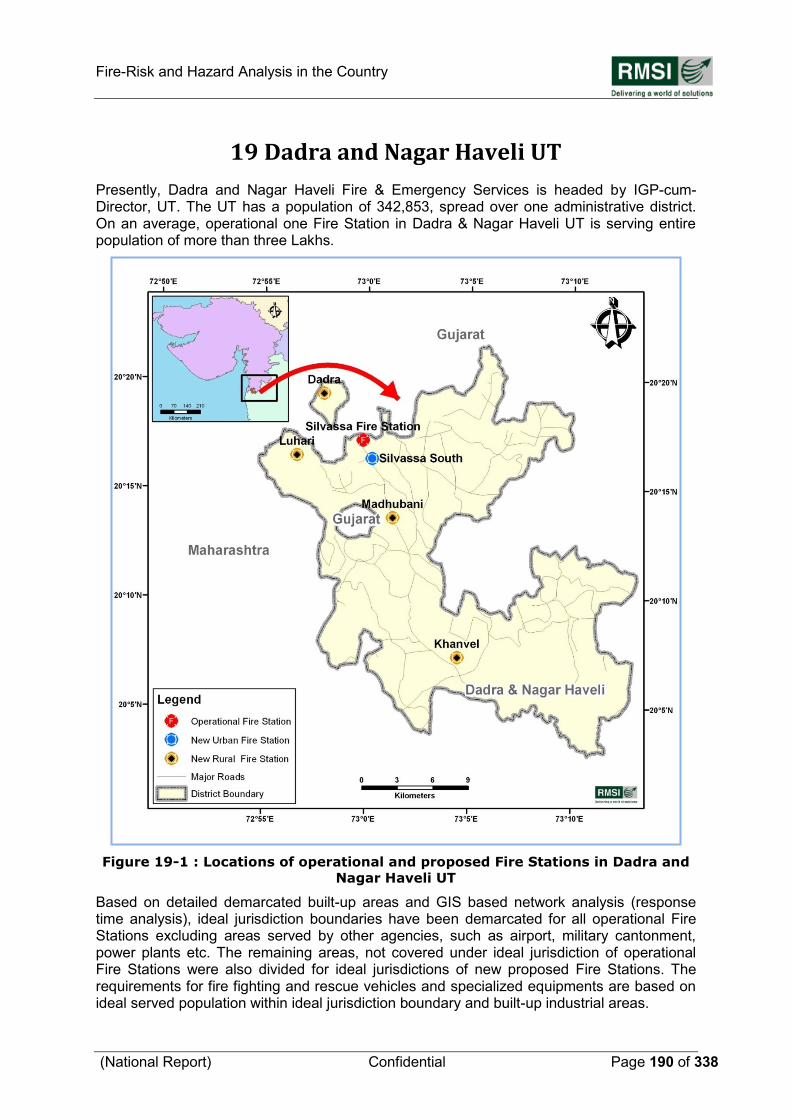
Fire-Risk and Hazard Analysis in the Country
(National Report) Confidential Page 190 of 338
19 Dadra and Nagar Haveli UT
Presently, Dadra and Nagar Haveli Fire & Emergency Services is headed by IGP-cum-Director, UT. The UT has a population of 342,853, spread over one administrative district. On an average, operational one Fire Station in Dadra & Nagar Haveli UT is serving entire population of more than three Lakhs.
Figure 19-1 : Locations of operational and proposed Fire Stations in Dadra and
Nagar Haveli UT
Based on detailed demarcated built-up areas and GIS based network analysis (response time analysis), ideal jurisdiction boundaries have been demarcated for all operational Fire Stations excluding areas served by other agencies, such as airport, military cantonment, power plants etc. The remaining areas, not covered under ideal jurisdiction of operational Fire Stations were also divided for ideal jurisdictions of new proposed Fire Stations. The requirements for fire fighting and rescue vehicles and specialized equipments are based on ideal served population within ideal jurisdiction boundary and built-up industrial areas.
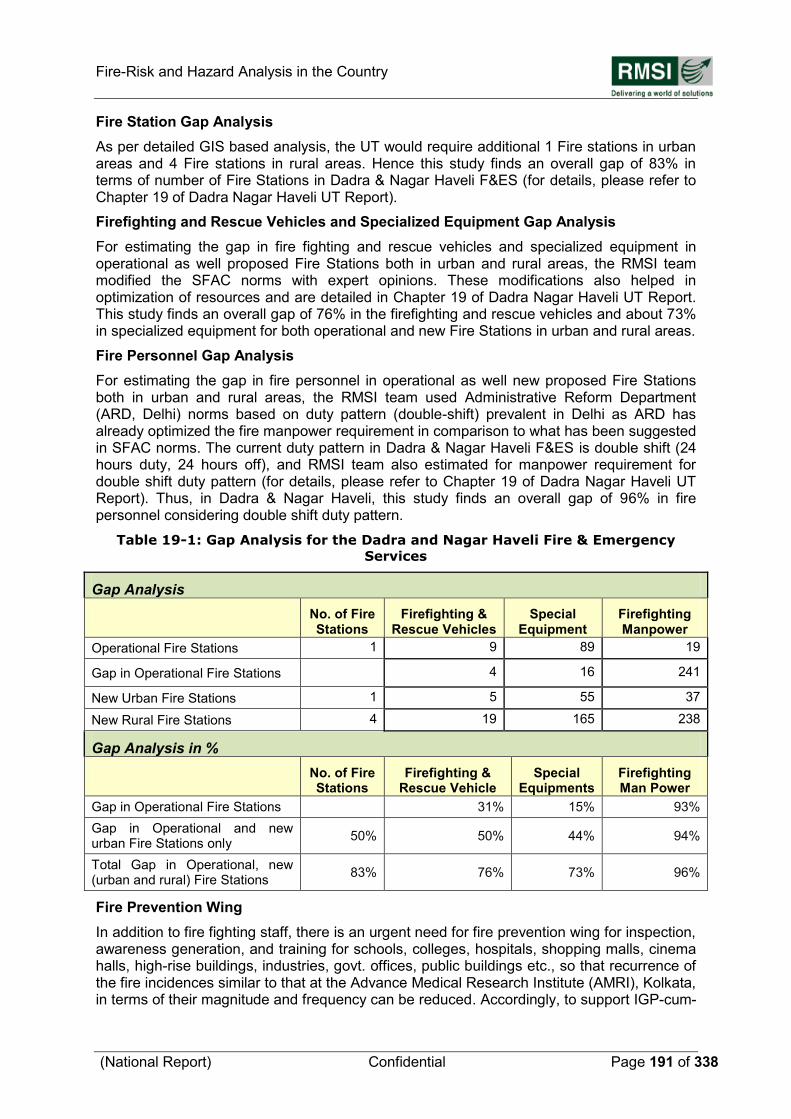
Fire-Risk and Hazard Analysis in the Country
(National Report) Confidential Page 191 of 338
Fire Station Gap Analysis
As per detailed GIS based analysis, the UT would require additional 1 Fire stations in urban areas and 4 Fire stations in rural areas. Hence this study finds an overall gap of 83% in terms of number of Fire Stations in Dadra & Nagar Haveli F&ES (for details, please refer to Chapter 19 of Dadra Nagar Haveli UT Report).
Firefighting and Rescue Vehicles and Specialized Equipment Gap Analysis
For estimating the gap in fire fighting and rescue vehicles and specialized equipment in operational as well proposed Fire Stations both in urban and rural areas, the RMSI team modified the SFAC norms with expert opinions. These modifications also helped in optimization of resources and are detailed in Chapter 19 of Dadra Nagar Haveli UT Report. This study finds an overall gap of 76% in the firefighting and rescue vehicles and about 73% in specialized equipment for both operational and new Fire Stations in urban and rural areas.
Fire Personnel Gap Analysis
For estimating the gap in fire personnel in operational as well new proposed Fire Stations both in urban and rural areas, the RMSI team used Administrative Reform Department (ARD, Delhi) norms based on duty pattern (double-shift) prevalent in Delhi as ARD has already optimized the fire manpower requirement in comparison to what has been suggested in SFAC norms. The current duty pattern in Dadra & Nagar Haveli F&ES is double shift (24 hours duty, 24 hours off), and RMSI team also estimated for manpower requirement for double shift duty pattern (for details, please refer to Chapter 19 of Dadra Nagar Haveli UT Report). Thus, in Dadra & Nagar Haveli, this study finds an overall gap of 96% in fire personnel considering double shift duty pattern.
Table 19-1: Gap Analysis for the Dadra and Nagar Haveli Fire & Emergency
Services
Gap Analysis
No. of Fire Stations
Firefighting & Rescue Vehicles
Special Equipment
Firefighting Manpower
Operational Fire Stations 1 9 89 19
Gap in Operational Fire Stations
4 16 241
New Urban Fire Stations 1 5 55 37
New Rural Fire Stations 4 19 165 238
Gap Analysis in %
No. of Fire Stations
Firefighting & Rescue Vehicle
Special Equipments
Firefighting Man Power
Gap in Operational Fire Stations 31% 15% 93%
Gap in Operational and new urban Fire Stations only
50% 50% 44% 94%
Total Gap in Operational, new (urban and rural) Fire Stations
83% 76% 73% 96%
Fire Prevention Wing
In addition to fire fighting staff, there is an urgent need for fire prevention wing for inspection, awareness generation, and training for schools, colleges, hospitals, shopping malls, cinema halls, high-rise buildings, industries, govt. offices, public buildings etc., so that recurrence of the fire incidences similar to that at the Advance Medical Research Institute (AMRI), Kolkata, in terms of their magnitude and frequency can be reduced. Accordingly, to support IGP-cum-
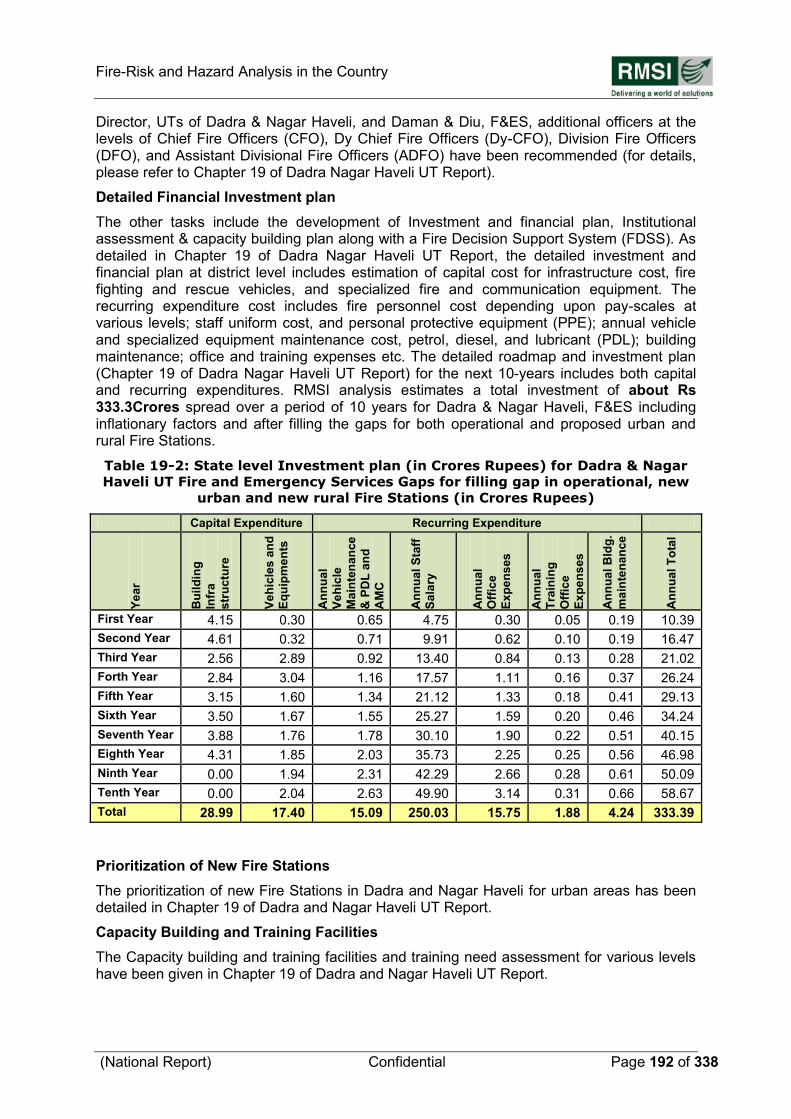
Fire-Risk and Hazard Analysis in the Country
(National Report) Confidential Page 192 of 338
Director, UTs of Dadra & Nagar Haveli, and Daman & Diu, F&ES, additional officers at the levels of Chief Fire Officers (CFO), Dy Chief Fire Officers (Dy-CFO), Division Fire Officers (DFO), and Assistant Divisional Fire Officers (ADFO) have been recommended (for details, please refer to Chapter 19 of Dadra Nagar Haveli UT Report).
Detailed Financial Investment plan
The other tasks include the development of Investment and financial plan, Institutional assessment & capacity building plan along with a Fire Decision Support System (FDSS). As detailed in Chapter 19 of Dadra Nagar Haveli UT Report, the detailed investment and financial plan at district level includes estimation of capital cost for infrastructure cost, fire fighting and rescue vehicles, and specialized fire and communication equipment. The recurring expenditure cost includes fire personnel cost depending upon pay-scales at various levels; staff uniform cost, and personal protective equipment (PPE); annual vehicle and specialized equipment maintenance cost, petrol, diesel, and lubricant (PDL); building maintenance; office and training expenses etc. The detailed roadmap and investment plan (Chapter 19 of Dadra Nagar Haveli UT Report) for the next 10-years includes both capital and recurring expenditures. RMSI analysis estimates a total investment of about Rs 333.3Crores spread over a period of 10 years for Dadra & Nagar Haveli, F&ES including inflationary factors and after filling the gaps for both operational and proposed urban and rural Fire Stations.
Table 19-2: State level Investment plan (in Crores Rupees) for Dadra & Nagar
Haveli UT Fire and Emergency Services Gaps for filling gap in operational, new
urban and new rural Fire Stations (in Crores Rupees)
Capital Expenditure Recurring Expenditure
Ye
ar
Bu
ild
ing
Infr
a
str
uc
ture
Ve
hic
les
an
d
Eq
uip
me
nts
An
nu
al
Ve
hic
le
Ma
inte
na
nce
& P
DL
an
d
AM
C
An
nu
al
Sta
ff
Sa
lary
An
nu
al
Off
ice
Ex
pe
ns
es
An
nu
al
Tra
inin
g
Off
ice
Ex
pe
ns
es
An
nu
al
Bld
g.
ma
inte
na
nc
e
An
nu
al
To
tal
First Year 4.15 0.30 0.65 4.75 0.30 0.05 0.19 10.39
Second Year 4.61 0.32 0.71 9.91 0.62 0.10 0.19 16.47
Third Year 2.56 2.89 0.92 13.40 0.84 0.13 0.28 21.02
Forth Year 2.84 3.04 1.16 17.57 1.11 0.16 0.37 26.24
Fifth Year 3.15 1.60 1.34 21.12 1.33 0.18 0.41 29.13
Sixth Year 3.50 1.67 1.55 25.27 1.59 0.20 0.46 34.24
Seventh Year 3.88 1.76 1.78 30.10 1.90 0.22 0.51 40.15
Eighth Year 4.31 1.85 2.03 35.73 2.25 0.25 0.56 46.98
Ninth Year 0.00 1.94 2.31 42.29 2.66 0.28 0.61 50.09
Tenth Year 0.00 2.04 2.63 49.90 3.14 0.31 0.66 58.67
Total 28.99 17.40 15.09 250.03 15.75 1.88 4.24 333.39
Prioritization of New Fire Stations
The prioritization of new Fire Stations in Dadra and Nagar Haveli for urban areas has been detailed in Chapter 19 of Dadra and Nagar Haveli UT Report.
Capacity Building and Training Facilities
The Capacity building and training facilities and training need assessment for various levels have been given in Chapter 19 of Dadra and Nagar Haveli UT Report.
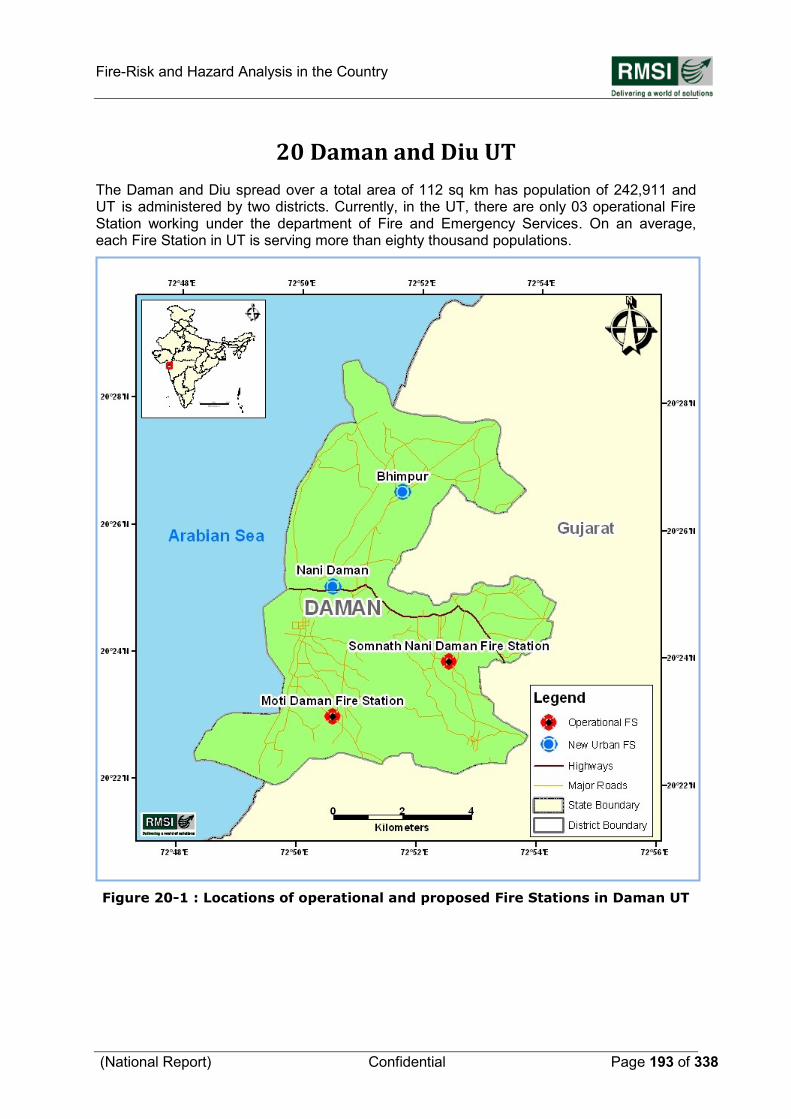
Fire-Risk and Hazard Analysis in the Country
(National Report) Confidential Page 193 of 338
20 Daman and Diu UT
The Daman and Diu spread over a total area of 112 sq km has population of 242,911 and UT is administered by two districts. Currently, in the UT, there are only 03 operational Fire Station working under the department of Fire and Emergency Services. On an average, each Fire Station in UT is serving more than eighty thousand populations.
Figure 20-1 : Locations of operational and proposed Fire Stations in Daman UT
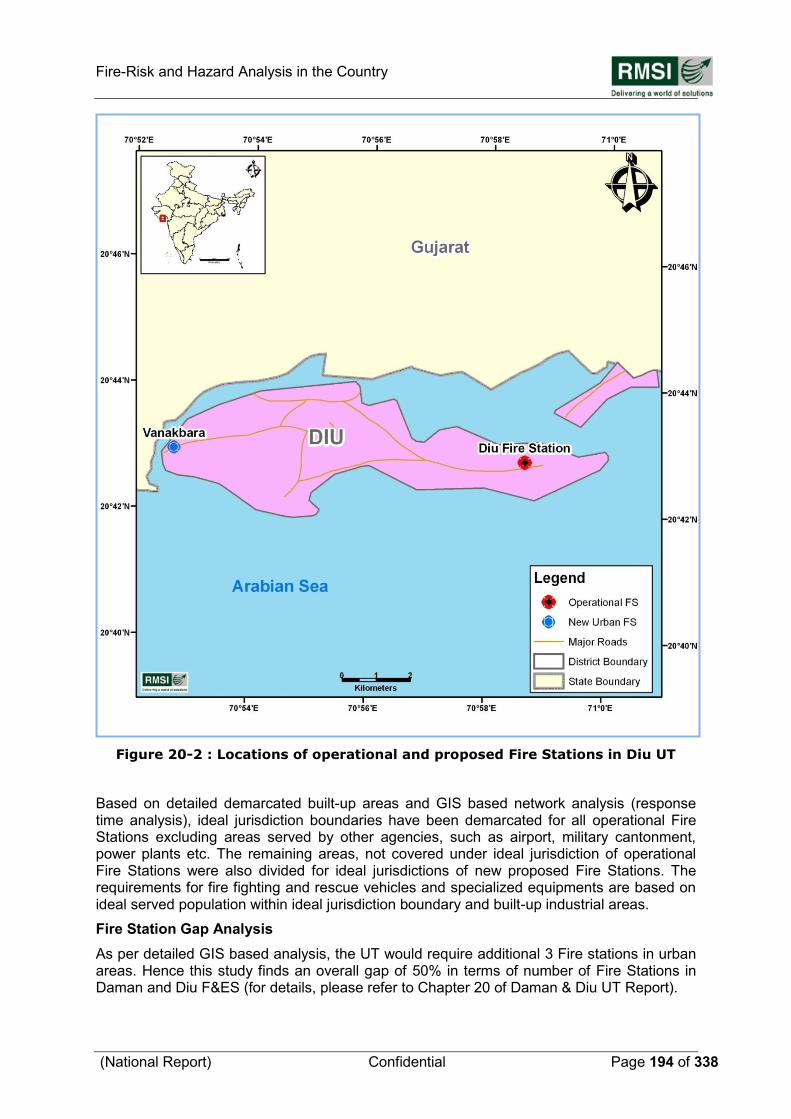
Fire-Risk and Hazard Analysis in the Country
(National Report) Confidential Page 194 of 338
Figure 20-2 : Locations of operational and proposed Fire Stations in Diu UT
Based on detailed demarcated built-up areas and GIS based network analysis (response time analysis), ideal jurisdiction boundaries have been demarcated for all operational Fire Stations excluding areas served by other agencies, such as airport, military cantonment, power plants etc. The remaining areas, not covered under ideal jurisdiction of operational Fire Stations were also divided for ideal jurisdictions of new proposed Fire Stations. The requirements for fire fighting and rescue vehicles and specialized equipments are based on ideal served population within ideal jurisdiction boundary and built-up industrial areas.
Fire Station Gap Analysis
As per detailed GIS based analysis, the UT would require additional 3 Fire stations in urban areas. Hence this study finds an overall gap of 50% in terms of number of Fire Stations in Daman and Diu F&ES (for details, please refer to Chapter 20 of Daman & Diu UT Report).
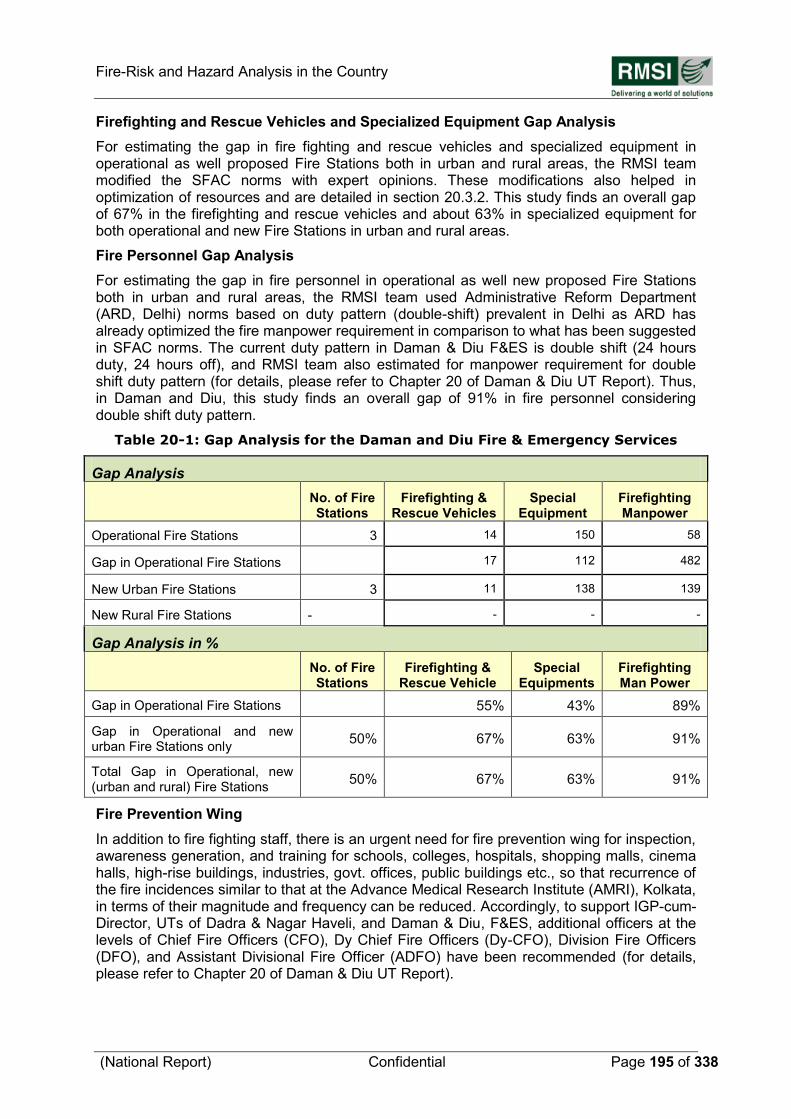
Fire-Risk and Hazard Analysis in the Country
(National Report) Confidential Page 195 of 338
Firefighting and Rescue Vehicles and Specialized Equipment Gap Analysis
For estimating the gap in fire fighting and rescue vehicles and specialized equipment in operational as well proposed Fire Stations both in urban and rural areas, the RMSI team modified the SFAC norms with expert opinions. These modifications also helped in optimization of resources and are detailed in section 20.3.2. This study finds an overall gap of 67% in the firefighting and rescue vehicles and about 63% in specialized equipment for both operational and new Fire Stations in urban and rural areas.
Fire Personnel Gap Analysis
For estimating the gap in fire personnel in operational as well new proposed Fire Stations both in urban and rural areas, the RMSI team used Administrative Reform Department (ARD, Delhi) norms based on duty pattern (double-shift) prevalent in Delhi as ARD has already optimized the fire manpower requirement in comparison to what has been suggested in SFAC norms. The current duty pattern in Daman & Diu F&ES is double shift (24 hours duty, 24 hours off), and RMSI team also estimated for manpower requirement for double shift duty pattern (for details, please refer to Chapter 20 of Daman & Diu UT Report). Thus, in Daman and Diu, this study finds an overall gap of 91% in fire personnel considering double shift duty pattern.
Table 20-1: Gap Analysis for the Daman and Diu Fire & Emergency Services
Gap Analysis
No. of Fire Stations
Firefighting & Rescue Vehicles
Special Equipment
Firefighting Manpower
Operational Fire Stations 3 14 150 58
Gap in Operational Fire Stations
17 112 482
New Urban Fire Stations 3 11 138 139
New Rural Fire Stations - - - -
Gap Analysis in %
No. of Fire Stations
Firefighting & Rescue Vehicle
Special Equipments
Firefighting Man Power
Gap in Operational Fire Stations 55% 43% 89%
Gap in Operational and new urban Fire Stations only
50% 67% 63% 91%
Total Gap in Operational, new (urban and rural) Fire Stations
50% 67% 63% 91%
Fire Prevention Wing
In addition to fire fighting staff, there is an urgent need for fire prevention wing for inspection, awareness generation, and training for schools, colleges, hospitals, shopping malls, cinema halls, high-rise buildings, industries, govt. offices, public buildings etc., so that recurrence of the fire incidences similar to that at the Advance Medical Research Institute (AMRI), Kolkata, in terms of their magnitude and frequency can be reduced. Accordingly, to support IGP-cum-Director, UTs of Dadra & Nagar Haveli, and Daman & Diu, F&ES, additional officers at the levels of Chief Fire Officers (CFO), Dy Chief Fire Officers (Dy-CFO), Division Fire Officers (DFO), and Assistant Divisional Fire Officer (ADFO) have been recommended (for details, please refer to Chapter 20 of Daman & Diu UT Report).
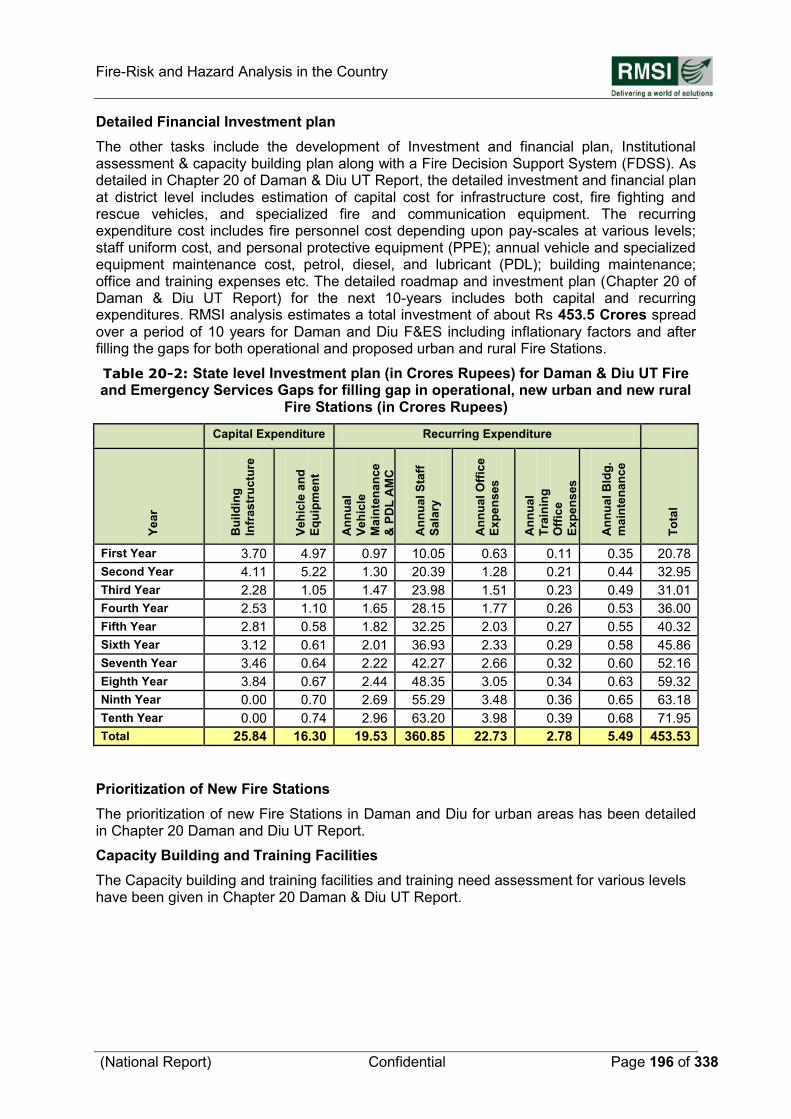
Fire-Risk and Hazard Analysis in the Country
(National Report) Confidential Page 196 of 338
Detailed Financial Investment plan
The other tasks include the development of Investment and financial plan, Institutional assessment & capacity building plan along with a Fire Decision Support System (FDSS). As detailed in Chapter 20 of Daman & Diu UT Report, the detailed investment and financial plan at district level includes estimation of capital cost for infrastructure cost, fire fighting and rescue vehicles, and specialized fire and communication equipment. The recurring expenditure cost includes fire personnel cost depending upon pay-scales at various levels; staff uniform cost, and personal protective equipment (PPE); annual vehicle and specialized equipment maintenance cost, petrol, diesel, and lubricant (PDL); building maintenance; office and training expenses etc. The detailed roadmap and investment plan (Chapter 20 of Daman & Diu UT Report) for the next 10-years includes both capital and recurring expenditures. RMSI analysis estimates a total investment of about Rs 453.5 Crores spread over a period of 10 years for Daman and Diu F&ES including inflationary factors and after filling the gaps for both operational and proposed urban and rural Fire Stations.
Table 20-2: State level Investment plan (in Crores Rupees) for Daman & Diu UT Fire and Emergency Services Gaps for filling gap in operational, new urban and new rural
Fire Stations (in Crores Rupees)
Capital Expenditure Recurring Expenditure
Ye
ar
Bu
ild
ing
Infr
as
tru
ctu
re
Ve
hic
le a
nd
Eq
uip
me
nt
An
nu
al
Ve
hic
le
Ma
inte
na
nce
& P
DL
AM
C
An
nu
al
Sta
ff
Sa
lary
An
nu
al
Off
ice
Ex
pe
ns
es
An
nu
al
Tra
inin
g
Off
ice
Ex
pe
ns
es
An
nu
al
Bld
g.
ma
inte
na
nc
e
To
tal
First Year 3.70 4.97 0.97 10.05 0.63 0.11 0.35 20.78
Second Year 4.11 5.22 1.30 20.39 1.28 0.21 0.44 32.95
Third Year 2.28 1.05 1.47 23.98 1.51 0.23 0.49 31.01
Fourth Year 2.53 1.10 1.65 28.15 1.77 0.26 0.53 36.00
Fifth Year 2.81 0.58 1.82 32.25 2.03 0.27 0.55 40.32
Sixth Year 3.12 0.61 2.01 36.93 2.33 0.29 0.58 45.86
Seventh Year 3.46 0.64 2.22 42.27 2.66 0.32 0.60 52.16
Eighth Year 3.84 0.67 2.44 48.35 3.05 0.34 0.63 59.32
Ninth Year 0.00 0.70 2.69 55.29 3.48 0.36 0.65 63.18
Tenth Year 0.00 0.74 2.96 63.20 3.98 0.39 0.68 71.95
Total 25.84 16.30 19.53 360.85 22.73 2.78 5.49 453.53
Prioritization of New Fire Stations
The prioritization of new Fire Stations in Daman and Diu for urban areas has been detailed in Chapter 20 Daman and Diu UT Report.
Capacity Building and Training Facilities
The Capacity building and training facilities and training need assessment for various levels have been given in Chapter 20 Daman & Diu UT Report.
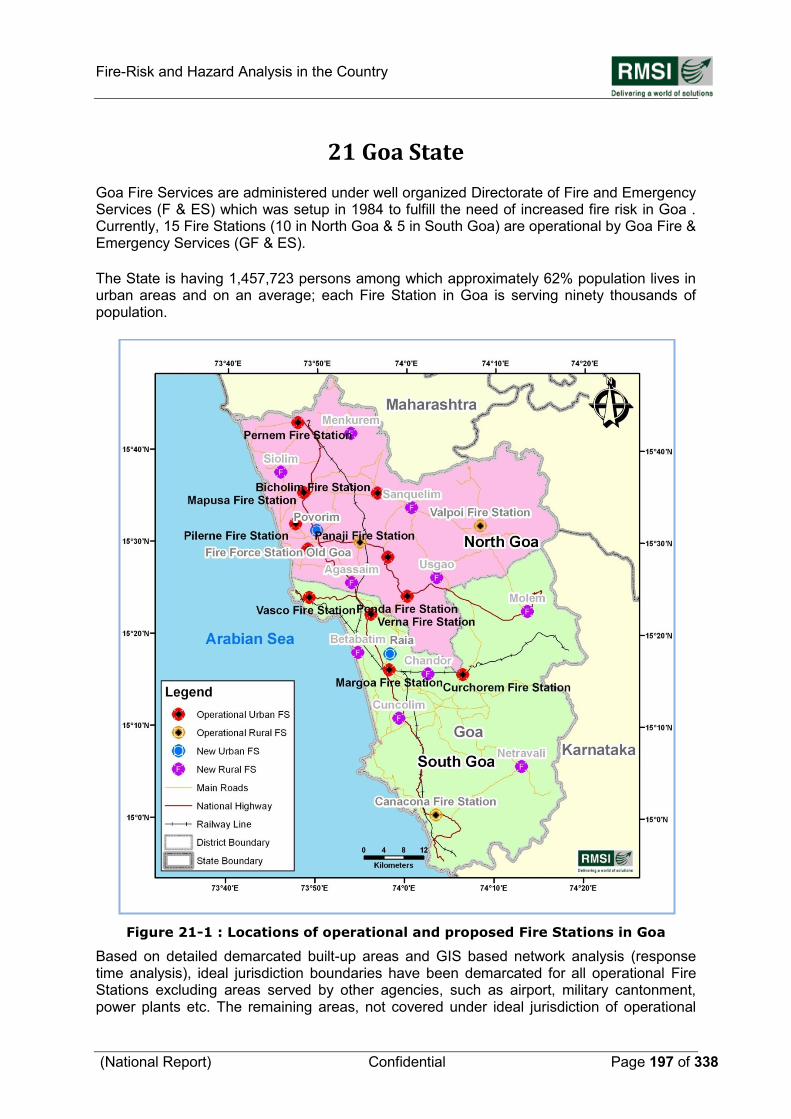
Fire-Risk and Hazard Analysis in the Country
(National Report) Confidential Page 197 of 338
21 Goa State
Goa Fire Services are administered under well organized Directorate of Fire and Emergency Services (F & ES) which was setup in 1984 to fulfill the need of increased fire risk in Goa . Currently, 15 Fire Stations (10 in North Goa & 5 in South Goa) are operational by Goa Fire & Emergency Services (GF & ES).
The State is having 1,457,723 persons among which approximately 62% population lives in urban areas and on an average; each Fire Station in Goa is serving ninety thousands of population.
Figure 21-1 : Locations of operational and proposed Fire Stations in Goa
Based on detailed demarcated built-up areas and GIS based network analysis (response time analysis), ideal jurisdiction boundaries have been demarcated for all operational Fire Stations excluding areas served by other agencies, such as airport, military cantonment, power plants etc. The remaining areas, not covered under ideal jurisdiction of operational
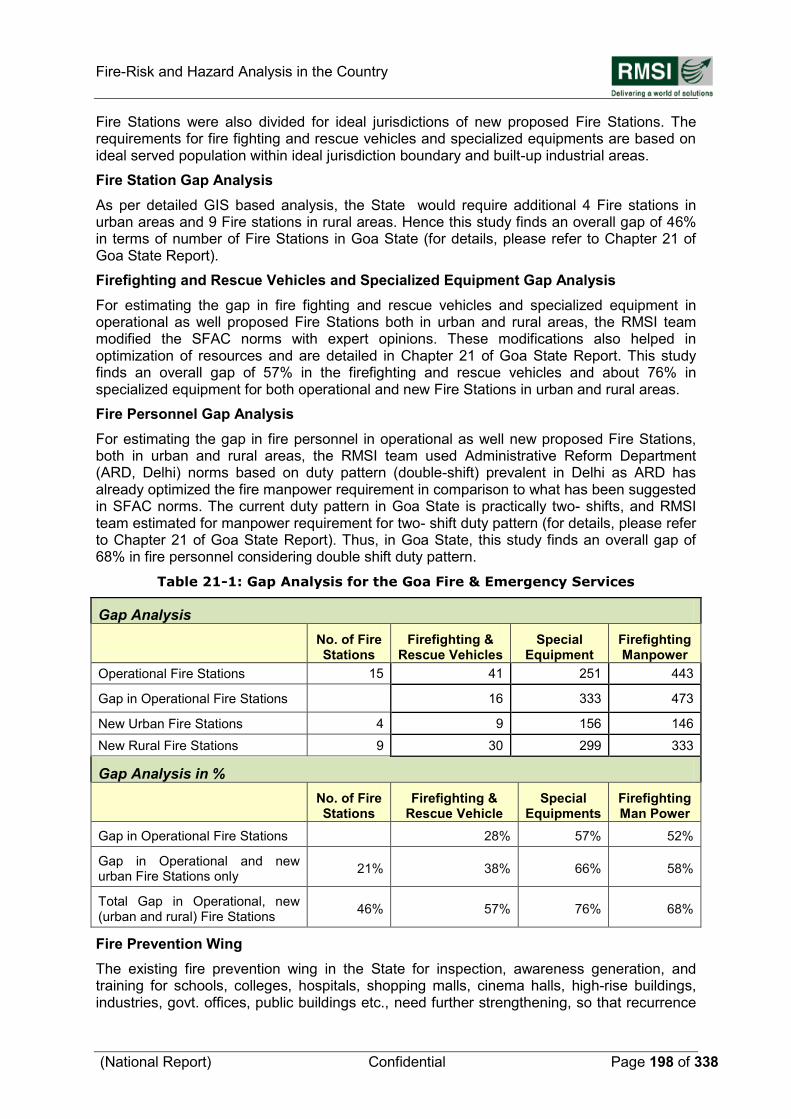
Fire-Risk and Hazard Analysis in the Country
(National Report) Confidential Page 198 of 338
Fire Stations were also divided for ideal jurisdictions of new proposed Fire Stations. The requirements for fire fighting and rescue vehicles and specialized equipments are based on ideal served population within ideal jurisdiction boundary and built-up industrial areas.
Fire Station Gap Analysis
As per detailed GIS based analysis, the State would require additional 4 Fire stations in urban areas and 9 Fire stations in rural areas. Hence this study finds an overall gap of 46% in terms of number of Fire Stations in Goa State (for details, please refer to Chapter 21 of Goa State Report).
Firefighting and Rescue Vehicles and Specialized Equipment Gap Analysis
For estimating the gap in fire fighting and rescue vehicles and specialized equipment in operational as well proposed Fire Stations both in urban and rural areas, the RMSI team modified the SFAC norms with expert opinions. These modifications also helped in optimization of resources and are detailed in Chapter 21 of Goa State Report. This study finds an overall gap of 57% in the firefighting and rescue vehicles and about 76% in specialized equipment for both operational and new Fire Stations in urban and rural areas.
Fire Personnel Gap Analysis
For estimating the gap in fire personnel in operational as well new proposed Fire Stations, both in urban and rural areas, the RMSI team used Administrative Reform Department (ARD, Delhi) norms based on duty pattern (double-shift) prevalent in Delhi as ARD has already optimized the fire manpower requirement in comparison to what has been suggested in SFAC norms. The current duty pattern in Goa State is practically two- shifts, and RMSI team estimated for manpower requirement for two- shift duty pattern (for details, please refer to Chapter 21 of Goa State Report). Thus, in Goa State, this study finds an overall gap of 68% in fire personnel considering double shift duty pattern.
Table 21-1: Gap Analysis for the Goa Fire & Emergency Services
Gap Analysis
No. of Fire Stations
Firefighting & Rescue Vehicles
Special Equipment
Firefighting Manpower
Operational Fire Stations 15 41 251 443
Gap in Operational Fire Stations
16 333 473
New Urban Fire Stations 4 9 156 146
New Rural Fire Stations 9 30 299 333
Gap Analysis in %
No. of Fire Stations
Firefighting & Rescue Vehicle
Special Equipments
Firefighting Man Power
Gap in Operational Fire Stations 28% 57% 52%
Gap in Operational and new urban Fire Stations only
21% 38% 66% 58%
Total Gap in Operational, new (urban and rural) Fire Stations
46% 57% 76% 68%
Fire Prevention Wing
The existing fire prevention wing in the State for inspection, awareness generation, and training for schools, colleges, hospitals, shopping malls, cinema halls, high-rise buildings, industries, govt. offices, public buildings etc., need further strengthening, so that recurrence
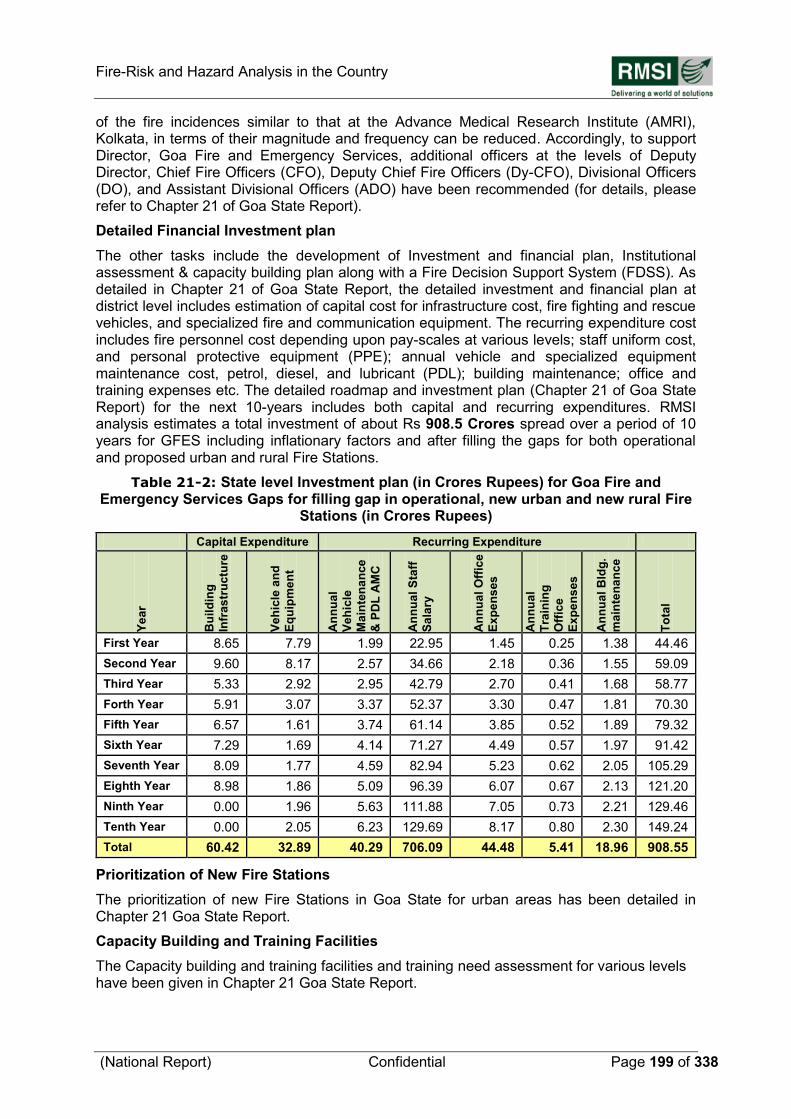
Fire-Risk and Hazard Analysis in the Country
(National Report) Confidential Page 199 of 338
of the fire incidences similar to that at the Advance Medical Research Institute (AMRI), Kolkata, in terms of their magnitude and frequency can be reduced. Accordingly, to support Director, Goa Fire and Emergency Services, additional officers at the levels of Deputy Director, Chief Fire Officers (CFO), Deputy Chief Fire Officers (Dy-CFO), Divisional Officers (DO), and Assistant Divisional Officers (ADO) have been recommended (for details, please refer to Chapter 21 of Goa State Report).
Detailed Financial Investment plan
The other tasks include the development of Investment and financial plan, Institutional assessment & capacity building plan along with a Fire Decision Support System (FDSS). As detailed in Chapter 21 of Goa State Report, the detailed investment and financial plan at district level includes estimation of capital cost for infrastructure cost, fire fighting and rescue vehicles, and specialized fire and communication equipment. The recurring expenditure cost includes fire personnel cost depending upon pay-scales at various levels; staff uniform cost, and personal protective equipment (PPE); annual vehicle and specialized equipment maintenance cost, petrol, diesel, and lubricant (PDL); building maintenance; office and training expenses etc. The detailed roadmap and investment plan (Chapter 21 of Goa State Report) for the next 10-years includes both capital and recurring expenditures. RMSI analysis estimates a total investment of about Rs 908.5 Crores spread over a period of 10 years for GFES including inflationary factors and after filling the gaps for both operational and proposed urban and rural Fire Stations.
Table 21-2: State level Investment plan (in Crores Rupees) for Goa Fire and Emergency Services Gaps for filling gap in operational, new urban and new rural Fire
Stations (in Crores Rupees)
Capital Expenditure Recurring Expenditure
Ye
ar
Bu
ild
ing
Infr
as
tru
ctu
re
Ve
hic
le a
nd
Eq
uip
me
nt
An
nu
al
Ve
hic
le
Ma
inte
na
nce
& P
DL
AM
C
An
nu
al
Sta
ff
Sa
lary
An
nu
al
Off
ice
Ex
pe
ns
es
An
nu
al
Tra
inin
g
Off
ice
Ex
pe
ns
es
An
nu
al
Bld
g.
ma
inte
na
nc
e
To
tal
First Year 8.65 7.79 1.99 22.95 1.45 0.25 1.38 44.46
Second Year 9.60 8.17 2.57 34.66 2.18 0.36 1.55 59.09
Third Year 5.33 2.92 2.95 42.79 2.70 0.41 1.68 58.77
Forth Year 5.91 3.07 3.37 52.37 3.30 0.47 1.81 70.30
Fifth Year 6.57 1.61 3.74 61.14 3.85 0.52 1.89 79.32
Sixth Year 7.29 1.69 4.14 71.27 4.49 0.57 1.97 91.42
Seventh Year 8.09 1.77 4.59 82.94 5.23 0.62 2.05 105.29
Eighth Year 8.98 1.86 5.09 96.39 6.07 0.67 2.13 121.20
Ninth Year 0.00 1.96 5.63 111.88 7.05 0.73 2.21 129.46
Tenth Year 0.00 2.05 6.23 129.69 8.17 0.80 2.30 149.24
Total 60.42 32.89 40.29 706.09 44.48 5.41 18.96 908.55
Prioritization of New Fire Stations
The prioritization of new Fire Stations in Goa State for urban areas has been detailed in Chapter 21 Goa State Report.
Capacity Building and Training Facilities
The Capacity building and training facilities and training need assessment for various levels have been given in Chapter 21 Goa State Report.
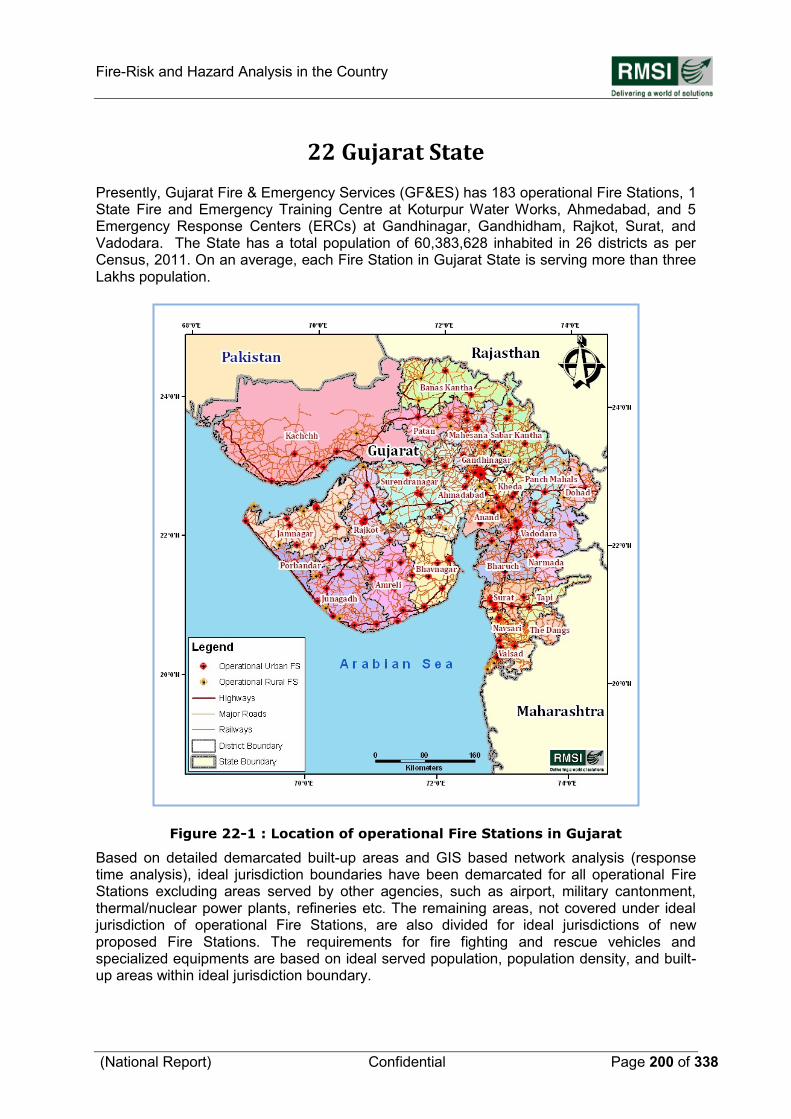
Fire-Risk and Hazard Analysis in the Country
(National Report) Confidential Page 200 of 338
22 Gujarat State
Presently, Gujarat Fire & Emergency Services (GF&ES) has 183 operational Fire Stations, 1 State Fire and Emergency Training Centre at Koturpur Water Works, Ahmedabad, and 5 Emergency Response Centers (ERCs) at Gandhinagar, Gandhidham, Rajkot, Surat, and Vadodara. The State has a total population of 60,383,628 inhabited in 26 districts as per Census, 2011. On an average, each Fire Station in Gujarat State is serving more than three Lakhs population.
Figure 22-1 : Location of operational Fire Stations in Gujarat Based on detailed demarcated built-up areas and GIS based network analysis (response time analysis), ideal jurisdiction boundaries have been demarcated for all operational Fire Stations excluding areas served by other agencies, such as airport, military cantonment, thermal/nuclear power plants, refineries etc. The remaining areas, not covered under ideal jurisdiction of operational Fire Stations, are also divided for ideal jurisdictions of new proposed Fire Stations. The requirements for fire fighting and rescue vehicles and specialized equipments are based on ideal served population, population density, and built-up areas within ideal jurisdiction boundary.
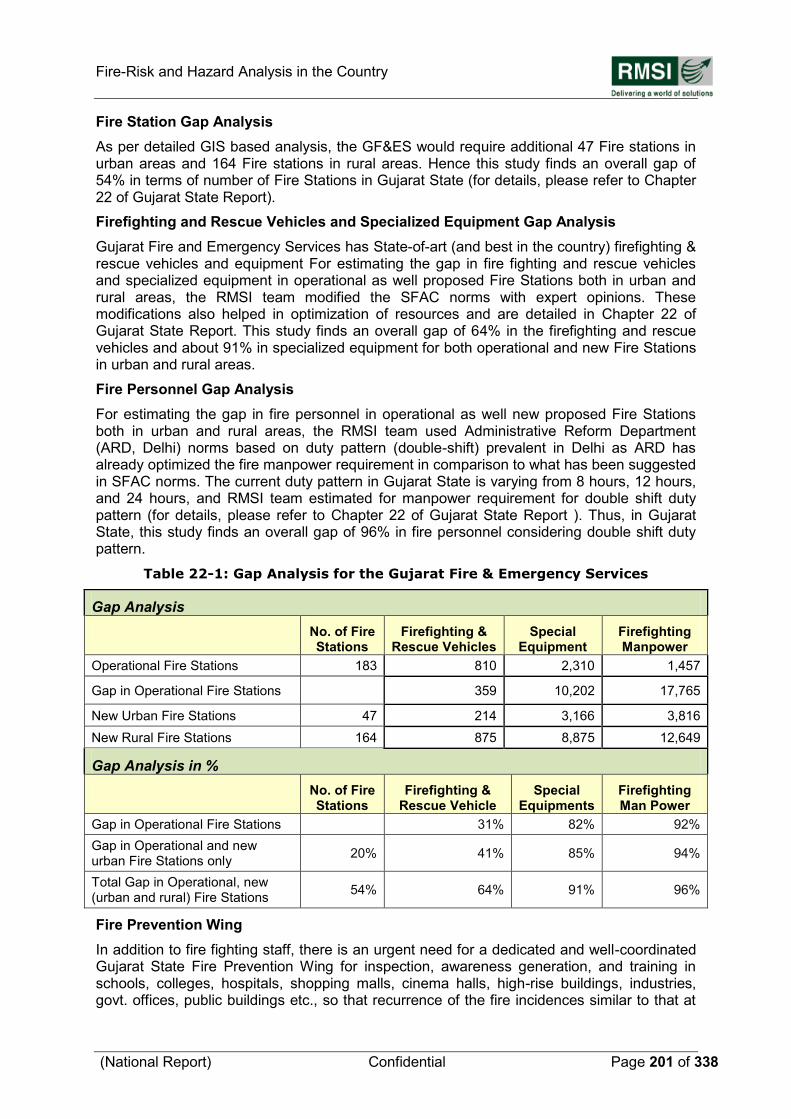
Fire-Risk and Hazard Analysis in the Country
(National Report) Confidential Page 201 of 338
Fire Station Gap Analysis
As per detailed GIS based analysis, the GF&ES would require additional 47 Fire stations in urban areas and 164 Fire stations in rural areas. Hence this study finds an overall gap of 54% in terms of number of Fire Stations in Gujarat State (for details, please refer to Chapter 22 of Gujarat State Report).
Firefighting and Rescue Vehicles and Specialized Equipment Gap Analysis
Gujarat Fire and Emergency Services has State-of-art (and best in the country) firefighting & rescue vehicles and equipment For estimating the gap in fire fighting and rescue vehicles and specialized equipment in operational as well proposed Fire Stations both in urban and rural areas, the RMSI team modified the SFAC norms with expert opinions. These modifications also helped in optimization of resources and are detailed in Chapter 22 of Gujarat State Report. This study finds an overall gap of 64% in the firefighting and rescue vehicles and about 91% in specialized equipment for both operational and new Fire Stations in urban and rural areas.
Fire Personnel Gap Analysis
For estimating the gap in fire personnel in operational as well new proposed Fire Stations both in urban and rural areas, the RMSI team used Administrative Reform Department (ARD, Delhi) norms based on duty pattern (double-shift) prevalent in Delhi as ARD has already optimized the fire manpower requirement in comparison to what has been suggested in SFAC norms. The current duty pattern in Gujarat State is varying from 8 hours, 12 hours, and 24 hours, and RMSI team estimated for manpower requirement for double shift duty pattern (for details, please refer to Chapter 22 of Gujarat State Report ). Thus, in Gujarat State, this study finds an overall gap of 96% in fire personnel considering double shift duty pattern.
Table 22-1: Gap Analysis for the Gujarat Fire & Emergency Services
Gap Analysis
No. of Fire Stations
Firefighting & Rescue Vehicles
Special Equipment
Firefighting Manpower
Operational Fire Stations 183 810 2,310 1,457
Gap in Operational Fire Stations 359 10,202 17,765
New Urban Fire Stations 47 214 3,166 3,816
New Rural Fire Stations 164 875 8,875 12,649
Gap Analysis in %
No. of Fire Stations
Firefighting & Rescue Vehicle
Special Equipments
Firefighting Man Power
Gap in Operational Fire Stations 31% 82% 92%
Gap in Operational and new urban Fire Stations only
20% 41% 85% 94%
Total Gap in Operational, new (urban and rural) Fire Stations
54% 64% 91% 96%
Fire Prevention Wing
In addition to fire fighting staff, there is an urgent need for a dedicated and well-coordinated Gujarat State Fire Prevention Wing for inspection, awareness generation, and training in schools, colleges, hospitals, shopping malls, cinema halls, high-rise buildings, industries, govt. offices, public buildings etc., so that recurrence of the fire incidences similar to that at
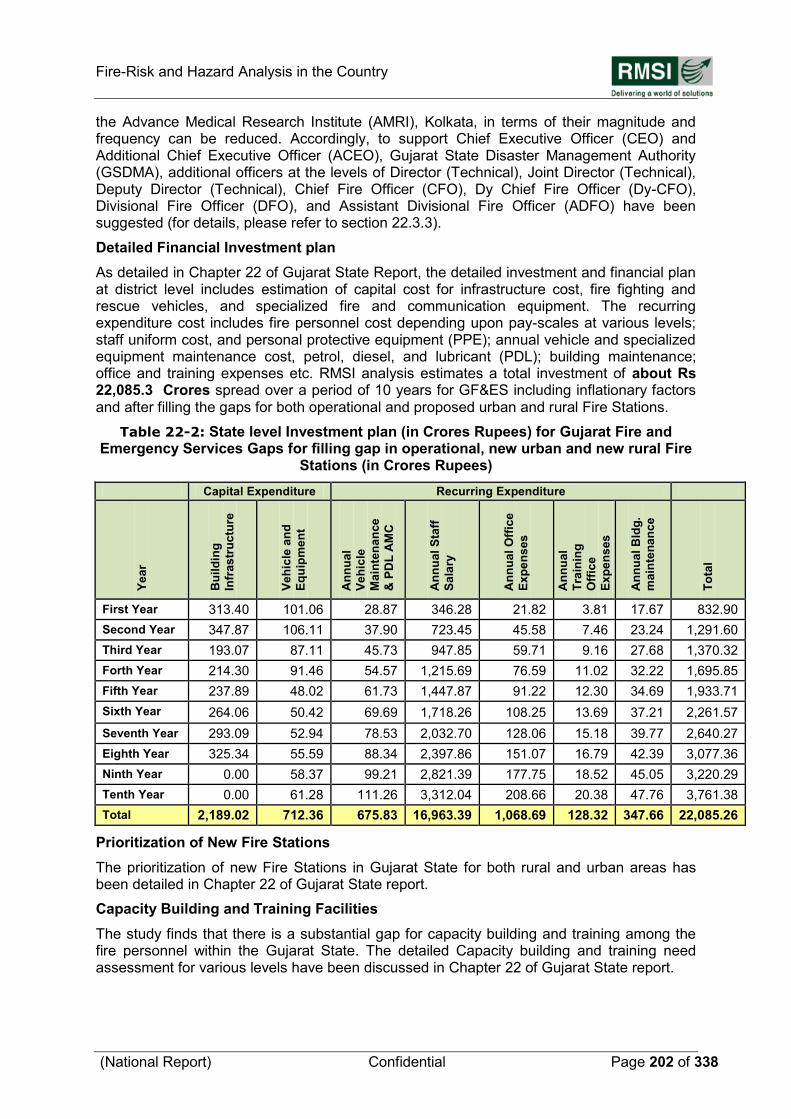
Fire-Risk and Hazard Analysis in the Country
(National Report) Confidential Page 202 of 338
the Advance Medical Research Institute (AMRI), Kolkata, in terms of their magnitude and frequency can be reduced. Accordingly, to support Chief Executive Officer (CEO) and Additional Chief Executive Officer (ACEO), Gujarat State Disaster Management Authority (GSDMA), additional officers at the levels of Director (Technical), Joint Director (Technical), Deputy Director (Technical), Chief Fire Officer (CFO), Dy Chief Fire Officer (Dy-CFO), Divisional Fire Officer (DFO), and Assistant Divisional Fire Officer (ADFO) have been suggested (for details, please refer to section 22.3.3).
Detailed Financial Investment plan
As detailed in Chapter 22 of Gujarat State Report, the detailed investment and financial plan at district level includes estimation of capital cost for infrastructure cost, fire fighting and rescue vehicles, and specialized fire and communication equipment. The recurring expenditure cost includes fire personnel cost depending upon pay-scales at various levels; staff uniform cost, and personal protective equipment (PPE); annual vehicle and specialized equipment maintenance cost, petrol, diesel, and lubricant (PDL); building maintenance; office and training expenses etc. RMSI analysis estimates a total investment of about Rs 22,085.3 Crores spread over a period of 10 years for GF&ES including inflationary factors and after filling the gaps for both operational and proposed urban and rural Fire Stations.
Table 22-2: State level Investment plan (in Crores Rupees) for Gujarat Fire and Emergency Services Gaps for filling gap in operational, new urban and new rural Fire
Stations (in Crores Rupees)
Capital Expenditure Recurring Expenditure
Ye
ar
Bu
ild
ing
Infr
as
tru
ctu
re
Ve
hic
le a
nd
Eq
uip
me
nt
An
nu
al
Ve
hic
le
Ma
inte
na
nce
& P
DL
AM
C
An
nu
al
Sta
ff
Sa
lary
An
nu
al
Off
ice
Ex
pe
ns
es
An
nu
al
Tra
inin
g
Off
ice
Ex
pe
ns
es
An
nu
al
Bld
g.
ma
inte
na
nc
e
To
tal
First Year 313.40 101.06 28.87 346.28 21.82 3.81 17.67 832.90
Second Year 347.87 106.11 37.90 723.45 45.58 7.46 23.24 1,291.60
Third Year 193.07 87.11 45.73 947.85 59.71 9.16 27.68 1,370.32
Forth Year 214.30 91.46 54.57 1,215.69 76.59 11.02 32.22 1,695.85
Fifth Year 237.89 48.02 61.73 1,447.87 91.22 12.30 34.69 1,933.71
Sixth Year 264.06 50.42 69.69 1,718.26 108.25 13.69 37.21 2,261.57
Seventh Year 293.09 52.94 78.53 2,032.70 128.06 15.18 39.77 2,640.27
Eighth Year 325.34 55.59 88.34 2,397.86 151.07 16.79 42.39 3,077.36
Ninth Year 0.00 58.37 99.21 2,821.39 177.75 18.52 45.05 3,220.29
Tenth Year 0.00 61.28 111.26 3,312.04 208.66 20.38 47.76 3,761.38
Total 2,189.02 712.36 675.83 16,963.39 1,068.69 128.32 347.66 22,085.26
Prioritization of New Fire Stations
The prioritization of new Fire Stations in Gujarat State for both rural and urban areas has been detailed in Chapter 22 of Gujarat State report.
Capacity Building and Training Facilities
The study finds that there is a substantial gap for capacity building and training among the fire personnel within the Gujarat State. The detailed Capacity building and training need assessment for various levels have been discussed in Chapter 22 of Gujarat State report.
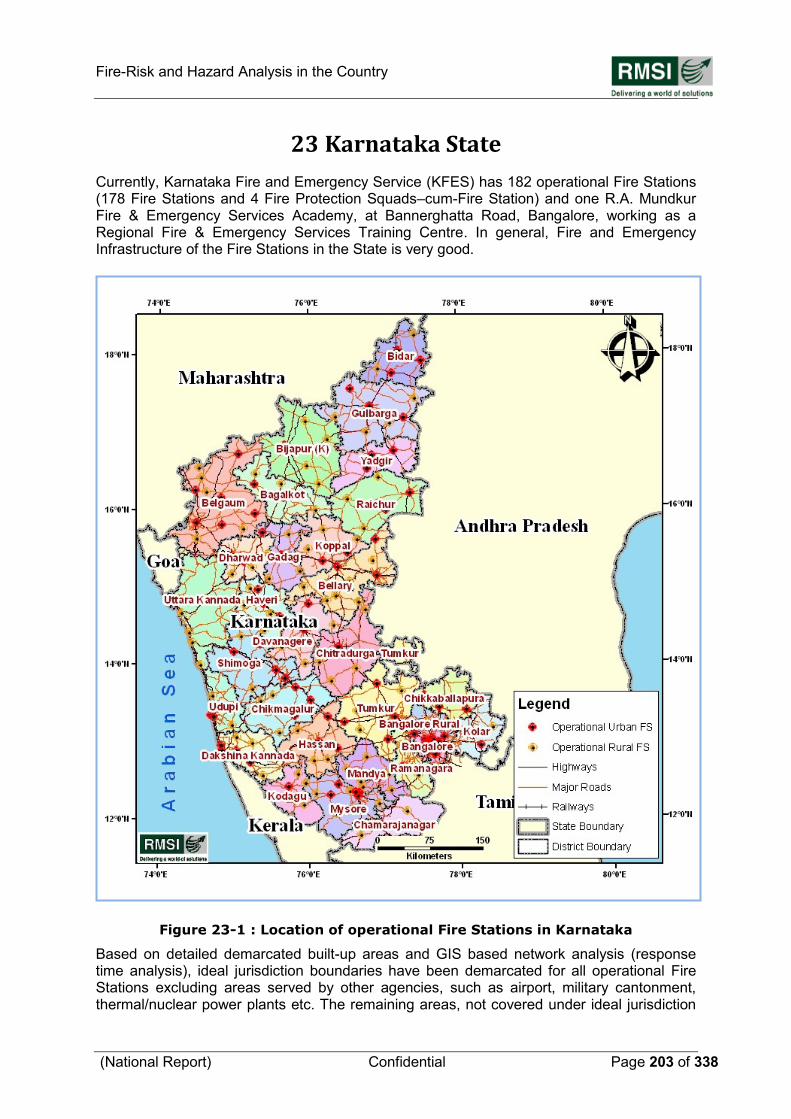
Fire-Risk and Hazard Analysis in the Country
(National Report) Confidential Page 203 of 338
23 Karnataka State
Currently, Karnataka Fire and Emergency Service (KFES) has 182 operational Fire Stations (178 Fire Stations and 4 Fire Protection Squads–cum-Fire Station) and one R.A. Mundkur Fire & Emergency Services Academy, at Bannerghatta Road, Bangalore, working as a Regional Fire & Emergency Services Training Centre. In general, Fire and Emergency Infrastructure of the Fire Stations in the State is very good.
Figure 23-1 : Location of operational Fire Stations in Karnataka Based on detailed demarcated built-up areas and GIS based network analysis (response time analysis), ideal jurisdiction boundaries have been demarcated for all operational Fire Stations excluding areas served by other agencies, such as airport, military cantonment, thermal/nuclear power plants etc. The remaining areas, not covered under ideal jurisdiction
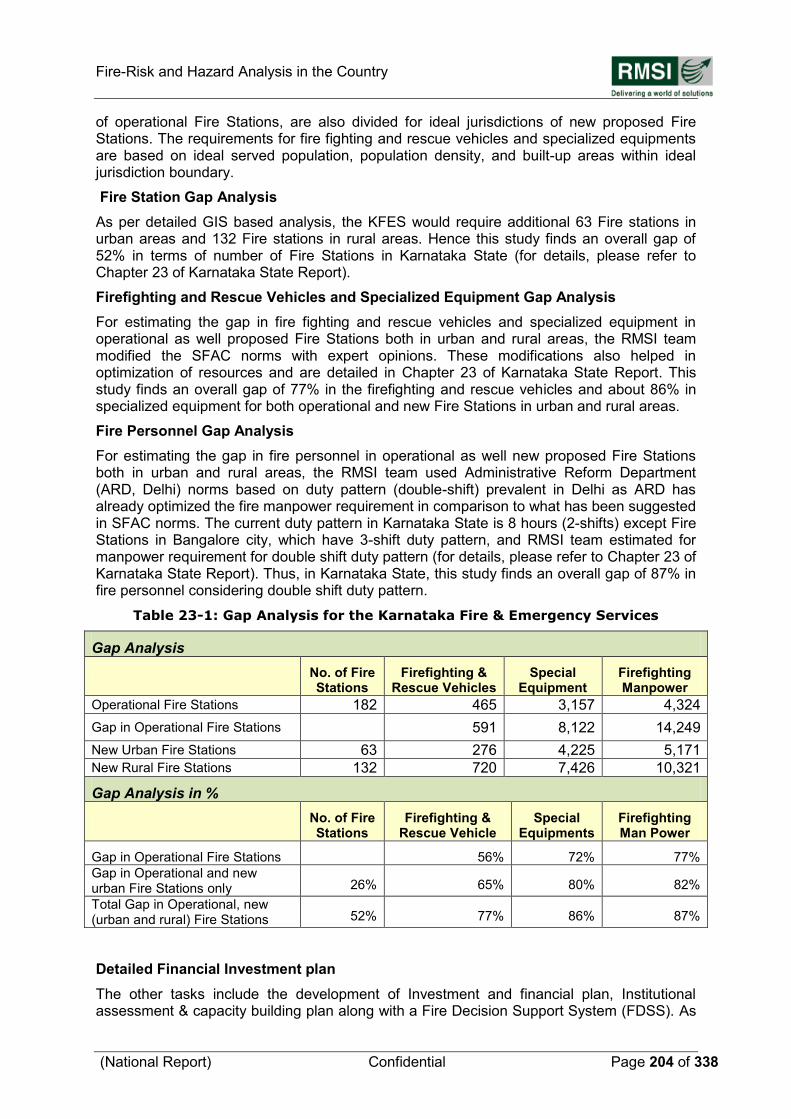
Fire-Risk and Hazard Analysis in the Country
(National Report) Confidential Page 204 of 338
of operational Fire Stations, are also divided for ideal jurisdictions of new proposed Fire Stations. The requirements for fire fighting and rescue vehicles and specialized equipments are based on ideal served population, population density, and built-up areas within ideal jurisdiction boundary.
Fire Station Gap Analysis
As per detailed GIS based analysis, the KFES would require additional 63 Fire stations in urban areas and 132 Fire stations in rural areas. Hence this study finds an overall gap of 52% in terms of number of Fire Stations in Karnataka State (for details, please refer to Chapter 23 of Karnataka State Report).
Firefighting and Rescue Vehicles and Specialized Equipment Gap Analysis
For estimating the gap in fire fighting and rescue vehicles and specialized equipment in operational as well proposed Fire Stations both in urban and rural areas, the RMSI team modified the SFAC norms with expert opinions. These modifications also helped in optimization of resources and are detailed in Chapter 23 of Karnataka State Report. This study finds an overall gap of 77% in the firefighting and rescue vehicles and about 86% in specialized equipment for both operational and new Fire Stations in urban and rural areas.
Fire Personnel Gap Analysis
For estimating the gap in fire personnel in operational as well new proposed Fire Stations both in urban and rural areas, the RMSI team used Administrative Reform Department (ARD, Delhi) norms based on duty pattern (double-shift) prevalent in Delhi as ARD has already optimized the fire manpower requirement in comparison to what has been suggested in SFAC norms. The current duty pattern in Karnataka State is 8 hours (2-shifts) except Fire Stations in Bangalore city, which have 3-shift duty pattern, and RMSI team estimated for manpower requirement for double shift duty pattern (for details, please refer to Chapter 23 of Karnataka State Report). Thus, in Karnataka State, this study finds an overall gap of 87% in fire personnel considering double shift duty pattern.
Table 23-1: Gap Analysis for the Karnataka Fire & Emergency Services
Gap Analysis
No. of Fire Stations
Firefighting & Rescue Vehicles
Special Equipment
Firefighting Manpower
Operational Fire Stations 182 465 3,157 4,324
Gap in Operational Fire Stations
591 8,122 14,249
New Urban Fire Stations 63 276 4,225 5,171
New Rural Fire Stations 132 720 7,426 10,321
Gap Analysis in %
No. of Fire Stations
Firefighting & Rescue Vehicle
Special Equipments
Firefighting Man Power
Gap in Operational Fire Stations
56% 72% 77%
Gap in Operational and new urban Fire Stations only 26% 65% 80% 82%
Total Gap in Operational, new (urban and rural) Fire Stations 52% 77% 86% 87%
Detailed Financial Investment plan
The other tasks include the development of Investment and financial plan, Institutional assessment & capacity building plan along with a Fire Decision Support System (FDSS). As
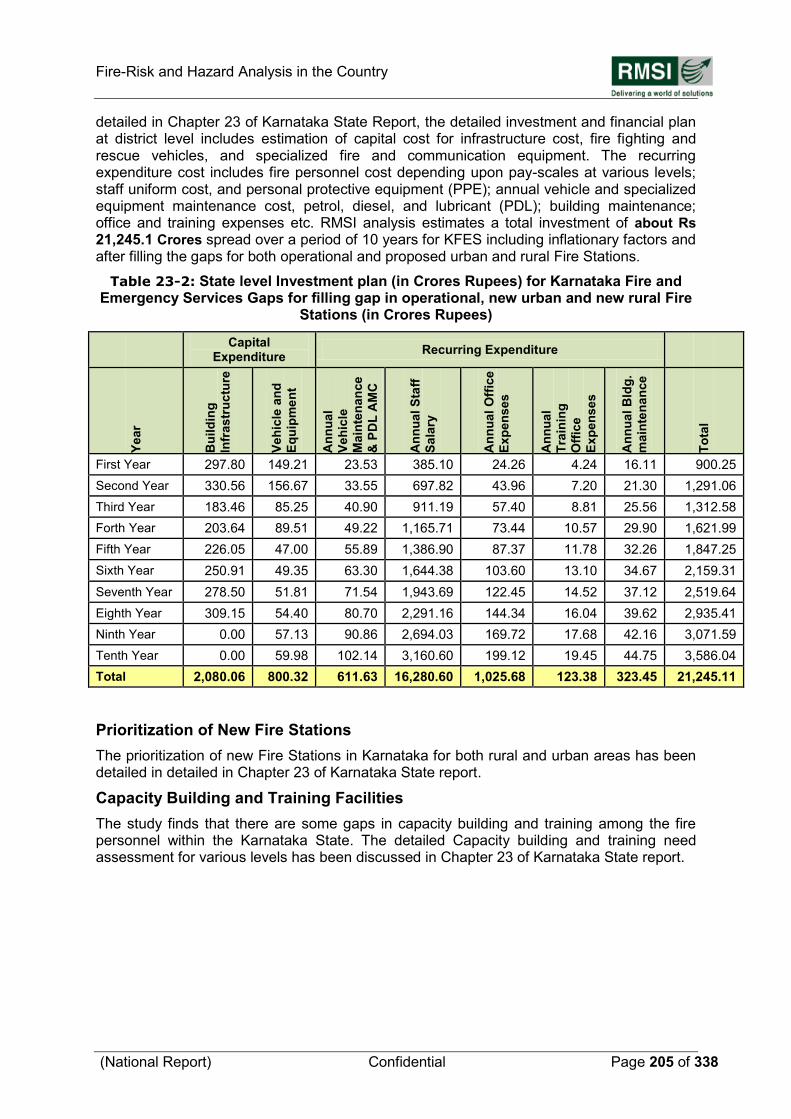
Fire-Risk and Hazard Analysis in the Country
(National Report) Confidential Page 205 of 338
detailed in Chapter 23 of Karnataka State Report, the detailed investment and financial plan at district level includes estimation of capital cost for infrastructure cost, fire fighting and rescue vehicles, and specialized fire and communication equipment. The recurring expenditure cost includes fire personnel cost depending upon pay-scales at various levels; staff uniform cost, and personal protective equipment (PPE); annual vehicle and specialized equipment maintenance cost, petrol, diesel, and lubricant (PDL); building maintenance; office and training expenses etc. RMSI analysis estimates a total investment of about Rs
21,245.1 Crores spread over a period of 10 years for KFES including inflationary factors and after filling the gaps for both operational and proposed urban and rural Fire Stations.
Table 23-2: State level Investment plan (in Crores Rupees) for Karnataka Fire and Emergency Services Gaps for filling gap in operational, new urban and new rural Fire
Stations (in Crores Rupees)
Capital Expenditure
Recurring Expenditure
Year
Bu
ild
ing
Infr
astr
uc
ture
Veh
icle
an
d
Eq
uip
me
nt
An
nu
al
Veh
icle
Ma
inte
nan
ce
& P
DL
AM
C
An
nu
al S
taff
Sala
ry
An
nu
al
Off
ice
Exp
en
ses
An
nu
al
Tra
inin
g
Off
ice
Exp
en
ses
An
nu
al B
ldg
.
main
ten
an
ce
To
tal
First Year 297.80 149.21 23.53 385.10 24.26 4.24 16.11 900.25
Second Year 330.56 156.67 33.55 697.82 43.96 7.20 21.30 1,291.06
Third Year 183.46 85.25 40.90 911.19 57.40 8.81 25.56 1,312.58
Forth Year 203.64 89.51 49.22 1,165.71 73.44 10.57 29.90 1,621.99
Fifth Year 226.05 47.00 55.89 1,386.90 87.37 11.78 32.26 1,847.25
Sixth Year 250.91 49.35 63.30 1,644.38 103.60 13.10 34.67 2,159.31
Seventh Year 278.50 51.81 71.54 1,943.69 122.45 14.52 37.12 2,519.64
Eighth Year 309.15 54.40 80.70 2,291.16 144.34 16.04 39.62 2,935.41
Ninth Year 0.00 57.13 90.86 2,694.03 169.72 17.68 42.16 3,071.59
Tenth Year 0.00 59.98 102.14 3,160.60 199.12 19.45 44.75 3,586.04
Total 2,080.06 800.32 611.63 16,280.60 1,025.68 123.38 323.45 21,245.11
Prioritization of New Fire Stations
The prioritization of new Fire Stations in Karnataka for both rural and urban areas has been detailed in detailed in Chapter 23 of Karnataka State report.
Capacity Building and Training Facilities
The study finds that there are some gaps in capacity building and training among the fire personnel within the Karnataka State. The detailed Capacity building and training need assessment for various levels has been discussed in Chapter 23 of Karnataka State report.
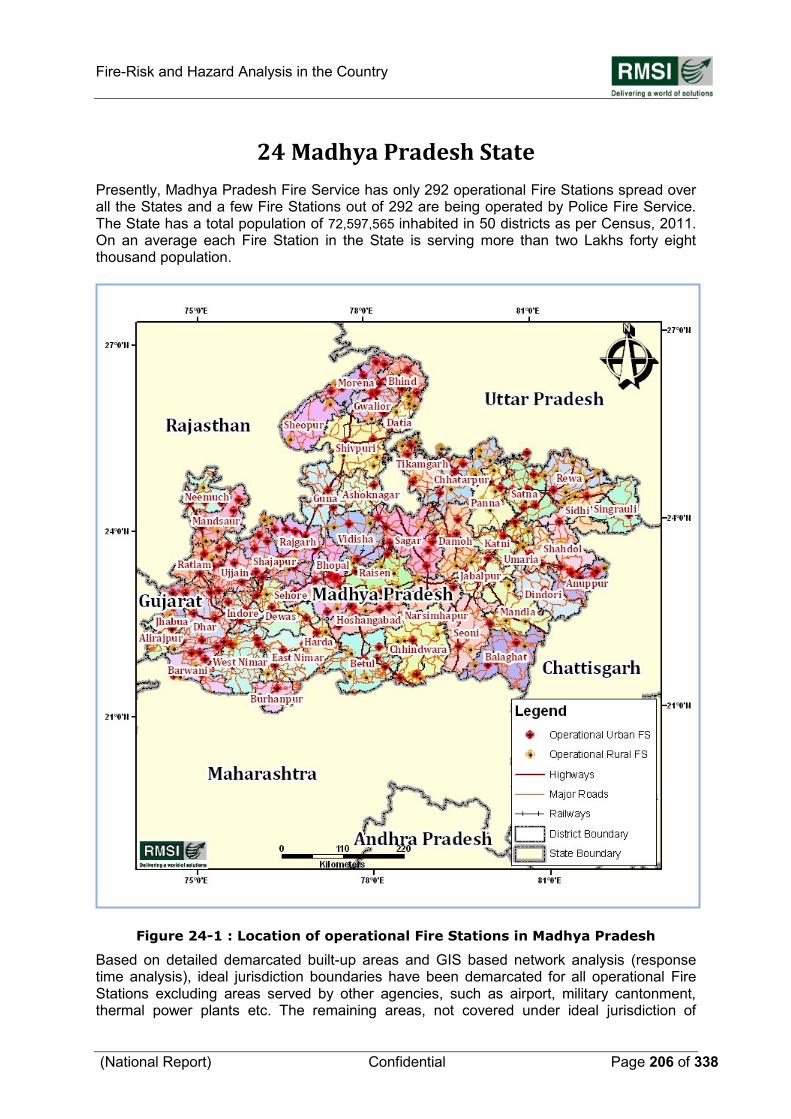
Fire-Risk and Hazard Analysis in the Country
(National Report) Confidential Page 206 of 338
24 Madhya Pradesh State
Presently, Madhya Pradesh Fire Service has only 292 operational Fire Stations spread over all the States and a few Fire Stations out of 292 are being operated by Police Fire Service. The State has a total population of 72,597,565 inhabited in 50 districts as per Census, 2011. On an average each Fire Station in the State is serving more than two Lakhs forty eight thousand population.
Figure 24-1 : Location of operational Fire Stations in Madhya Pradesh Based on detailed demarcated built-up areas and GIS based network analysis (response time analysis), ideal jurisdiction boundaries have been demarcated for all operational Fire Stations excluding areas served by other agencies, such as airport, military cantonment, thermal power plants etc. The remaining areas, not covered under ideal jurisdiction of
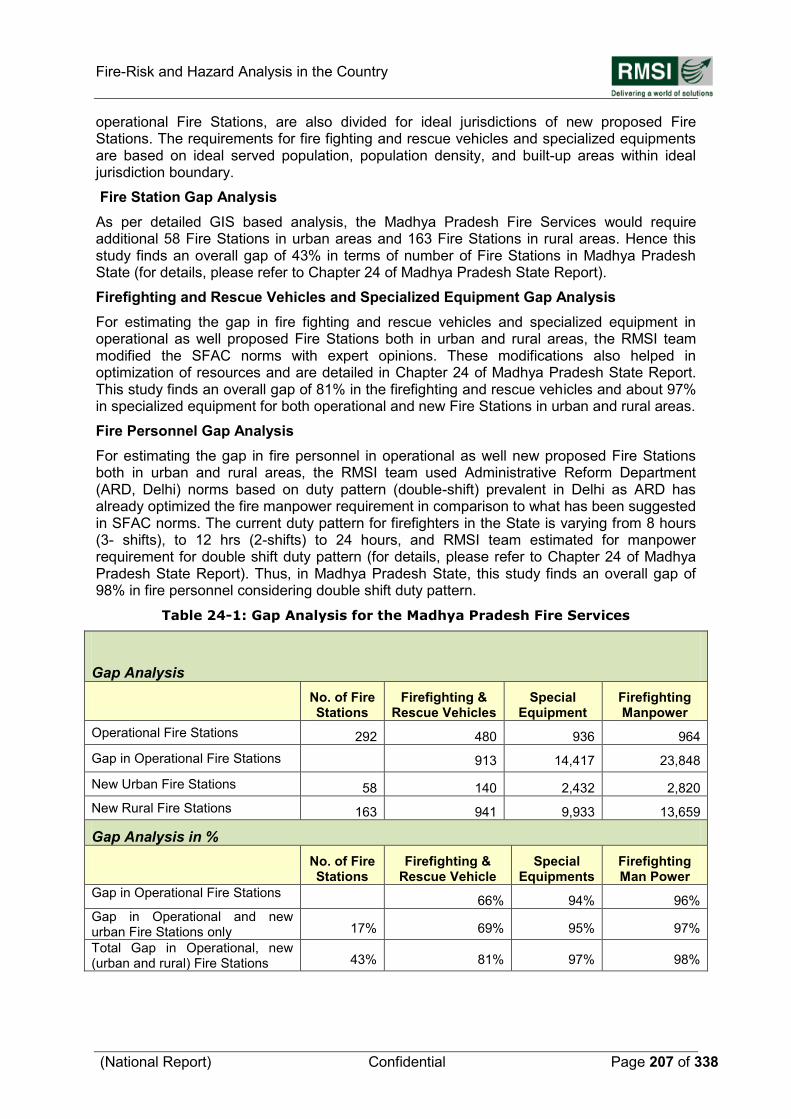
Fire-Risk and Hazard Analysis in the Country
(National Report) Confidential Page 207 of 338
operational Fire Stations, are also divided for ideal jurisdictions of new proposed Fire Stations. The requirements for fire fighting and rescue vehicles and specialized equipments are based on ideal served population, population density, and built-up areas within ideal jurisdiction boundary.
Fire Station Gap Analysis
As per detailed GIS based analysis, the Madhya Pradesh Fire Services would require additional 58 Fire Stations in urban areas and 163 Fire Stations in rural areas. Hence this study finds an overall gap of 43% in terms of number of Fire Stations in Madhya Pradesh State (for details, please refer to Chapter 24 of Madhya Pradesh State Report).
Firefighting and Rescue Vehicles and Specialized Equipment Gap Analysis
For estimating the gap in fire fighting and rescue vehicles and specialized equipment in operational as well proposed Fire Stations both in urban and rural areas, the RMSI team modified the SFAC norms with expert opinions. These modifications also helped in optimization of resources and are detailed in Chapter 24 of Madhya Pradesh State Report. This study finds an overall gap of 81% in the firefighting and rescue vehicles and about 97% in specialized equipment for both operational and new Fire Stations in urban and rural areas.
Fire Personnel Gap Analysis
For estimating the gap in fire personnel in operational as well new proposed Fire Stations both in urban and rural areas, the RMSI team used Administrative Reform Department (ARD, Delhi) norms based on duty pattern (double-shift) prevalent in Delhi as ARD has already optimized the fire manpower requirement in comparison to what has been suggested in SFAC norms. The current duty pattern for firefighters in the State is varying from 8 hours (3- shifts), to 12 hrs (2-shifts) to 24 hours, and RMSI team estimated for manpower requirement for double shift duty pattern (for details, please refer to Chapter 24 of Madhya Pradesh State Report). Thus, in Madhya Pradesh State, this study finds an overall gap of 98% in fire personnel considering double shift duty pattern.
Table 24-1: Gap Analysis for the Madhya Pradesh Fire Services
Gap Analysis
No. of Fire Stations
Firefighting & Rescue Vehicles
Special Equipment
Firefighting Manpower
Operational Fire Stations 292 480 936 964
Gap in Operational Fire Stations 913 14,417 23,848
New Urban Fire Stations 58 140 2,432 2,820
New Rural Fire Stations 163 941 9,933 13,659
Gap Analysis in %
No. of Fire Stations
Firefighting & Rescue Vehicle
Special Equipments
Firefighting Man Power
Gap in Operational Fire Stations 66% 94% 96%
Gap in Operational and new urban Fire Stations only 17% 69% 95% 97%
Total Gap in Operational, new (urban and rural) Fire Stations 43% 81% 97% 98%
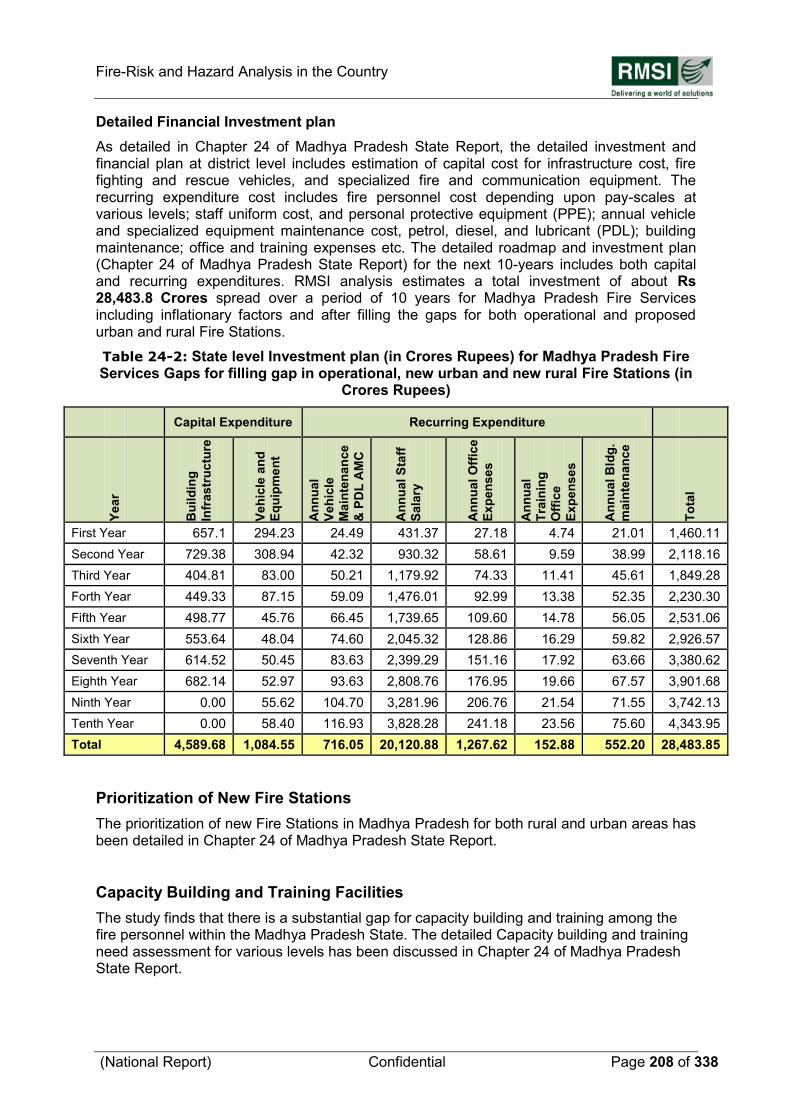
Fire-Risk and Hazard Analysis in the Country
(National Report) Confidential Page 208 of 338
Detailed Financial Investment plan
As detailed in Chapter 24 of Madhya Pradesh State Report, the detailed investment and financial plan at district level includes estimation of capital cost for infrastructure cost, fire fighting and rescue vehicles, and specialized fire and communication equipment. The recurring expenditure cost includes fire personnel cost depending upon pay-scales at various levels; staff uniform cost, and personal protective equipment (PPE); annual vehicle and specialized equipment maintenance cost, petrol, diesel, and lubricant (PDL); building maintenance; office and training expenses etc. The detailed roadmap and investment plan (Chapter 24 of Madhya Pradesh State Report) for the next 10-years includes both capital and recurring expenditures. RMSI analysis estimates a total investment of about Rs 28,483.8 Crores spread over a period of 10 years for Madhya Pradesh Fire Services including inflationary factors and after filling the gaps for both operational and proposed urban and rural Fire Stations.
Table 24-2: State level Investment plan (in Crores Rupees) for Madhya Pradesh Fire Services Gaps for filling gap in operational, new urban and new rural Fire Stations (in
Crores Rupees)
Capital Expenditure Recurring Expenditure
Year
Bu
ild
ing
Infr
astr
uc
ture
Veh
icle
an
d
Eq
uip
me
nt
An
nu
al
Veh
icle
Ma
inte
nan
ce
& P
DL
AM
C
An
nu
al S
taff
Sala
ry
An
nu
al
Off
ice
Exp
en
ses
An
nu
al
Tra
inin
g
Off
ice
Exp
en
ses
An
nu
al B
ldg
.
main
ten
an
ce
To
tal
First Year 657.1 294.23 24.49 431.37 27.18 4.74 21.01 1,460.11
Second Year 729.38 308.94 42.32 930.32 58.61 9.59 38.99 2,118.16
Third Year 404.81 83.00 50.21 1,179.92 74.33 11.41 45.61 1,849.28
Forth Year 449.33 87.15 59.09 1,476.01 92.99 13.38 52.35 2,230.30
Fifth Year 498.77 45.76 66.45 1,739.65 109.60 14.78 56.05 2,531.06
Sixth Year 553.64 48.04 74.60 2,045.32 128.86 16.29 59.82 2,926.57
Seventh Year 614.52 50.45 83.63 2,399.29 151.16 17.92 63.66 3,380.62
Eighth Year 682.14 52.97 93.63 2,808.76 176.95 19.66 67.57 3,901.68
Ninth Year 0.00 55.62 104.70 3,281.96 206.76 21.54 71.55 3,742.13
Tenth Year 0.00 58.40 116.93 3,828.28 241.18 23.56 75.60 4,343.95
Total 4,589.68 1,084.55 716.05 20,120.88 1,267.62 152.88 552.20 28,483.85
Prioritization of New Fire Stations
The prioritization of new Fire Stations in Madhya Pradesh for both rural and urban areas has been detailed in Chapter 24 of Madhya Pradesh State Report.
Capacity Building and Training Facilities
The study finds that there is a substantial gap for capacity building and training among the fire personnel within the Madhya Pradesh State. The detailed Capacity building and training need assessment for various levels has been discussed in Chapter 24 of Madhya Pradesh State Report.
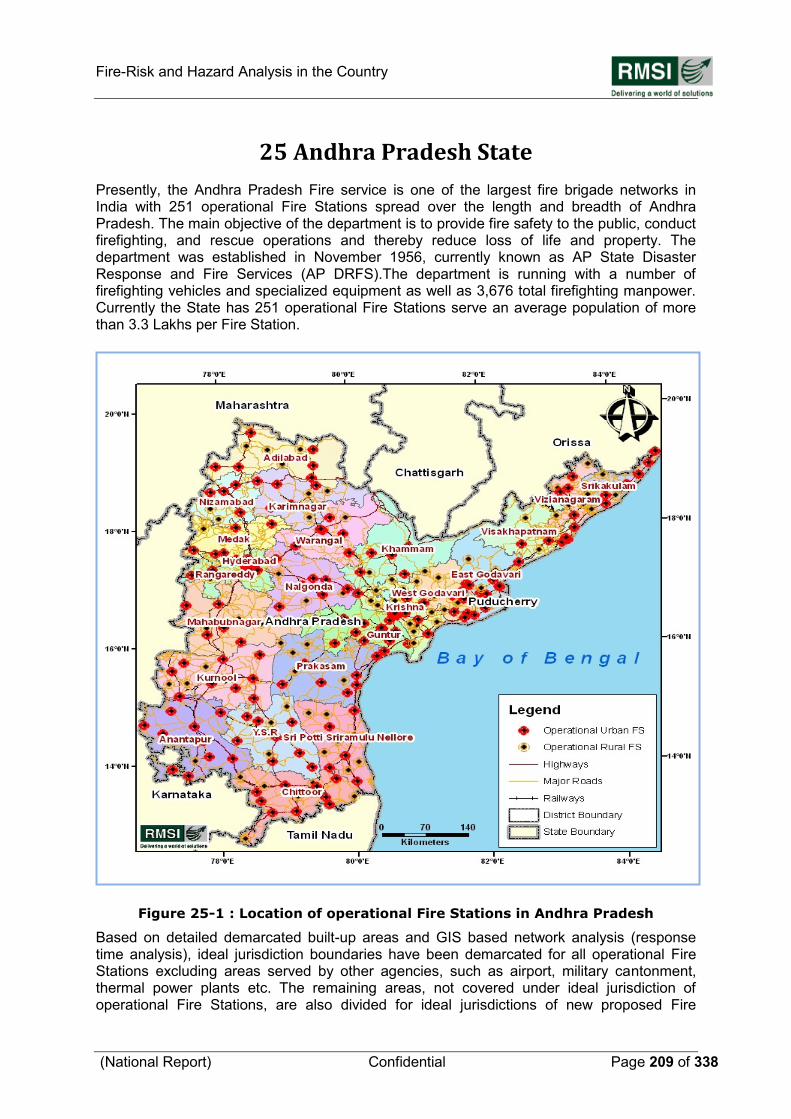
Fire-Risk and Hazard Analysis in the Country
(National Report) Confidential Page 209 of 338
25 Andhra Pradesh State
Presently, the Andhra Pradesh Fire service is one of the largest fire brigade networks in India with 251 operational Fire Stations spread over the length and breadth of Andhra Pradesh. The main objective of the department is to provide fire safety to the public, conduct firefighting, and rescue operations and thereby reduce loss of life and property. The department was established in November 1956, currently known as AP State Disaster Response and Fire Services (AP DRFS).The department is running with a number of firefighting vehicles and specialized equipment as well as 3,676 total firefighting manpower. Currently the State has 251 operational Fire Stations serve an average population of more than 3.3 Lakhs per Fire Station.
Figure 25-1 : Location of operational Fire Stations in Andhra Pradesh Based on detailed demarcated built-up areas and GIS based network analysis (response time analysis), ideal jurisdiction boundaries have been demarcated for all operational Fire Stations excluding areas served by other agencies, such as airport, military cantonment, thermal power plants etc. The remaining areas, not covered under ideal jurisdiction of operational Fire Stations, are also divided for ideal jurisdictions of new proposed Fire

Fire-Risk and Hazard Analysis in the Country
(National Report) Confidential Page 210 of 338
Stations. The requirements for firefighting and rescue vehicles and specialized equipments are based on ideal served population, population density, and built-up areas within ideal jurisdiction boundary.
Fire Station Gap Analysis
As per detailed GIS based analysis, the State would require additional 130 Fire stations in urban areas and 228 stations in rural areas. Hence this study finds a overall gap of 59% in terms of number of Fire Stations in the State (for details, please refer to Chapter 25 of Andhra Pradesh State Report).
Firefighting and Rescue Vehicles and Specialized Equipment Gap Analysis
For estimating the gap in firefighting and rescue vehicles and specialized equipment in operational as well proposed Fire Stations both in urban and rural areas, the RMSI team modified the SFAC norms with expert opinions. These modifications also helped in optimization of resources and are detailed in Chapter 25 of Andhra Pradesh State Report. This finds an overall gap of 90% in the firefighting and rescue vehicle and about 90% in specialized equipment for both operational and new Fire Stations in urban and rural areas.
Fire Personnel Gap Analysis
For estimating the gap in fire personnel in operational as well as proposed Fire Stations both in urban and rural areas, the RMSI team used Administrative Reform Department (ARD, Delhi) norms based on duty pattern (double-shift) prevalent in Delhi as ARD has already optimized the fire manpower requirement in comparison to what has been suggested in SFAC norms. The current duty pattern in Andhra Pradesh State is 24 hours, in general, and RMSI team estimated for manpower requirement for double shift duty pattern (for details, please refer to Chapter 25 of Andhra Pradesh State Report). Thus, in Andhra Pradesh State, this study finds an overall gap of about 91% in fire personnel considering double shift duty pattern.
Table 25-1: Gap Analysis for the Andhra Pradesh Fire Services
Gap Analysis
No. of Fire Stations
Firefighting & Rescue Vehicles
Special Equipment
Firefighting Manpower
Operational Fire Stations 251 278 3,194 3,676
Gap in Operational Fire Stations 892 11,190 16,669
New Urban Fire Stations 130 362 6,157 7,089
New Rural Fire Stations 228 1,225 12,535 14,948
Gap Analysis in %
No. of Fire Stations
Firefighting & Rescue Vehicle
Special Equipments
Firefighting Man Power
Gap in Operational Fire Stations 76% 78% 82%
Gap in Operational and new urban Fire Stations only
34% 82% 84% 87%
Total Gap in Operational, new (urban and rural) Fire Stations
59% 90% 90% 91%
Detailed Financial Investment plan
As detailed in Chapter 25 of Andhra Pradesh State Report, the detailed investment and financial plan at district level includes estimation of capital cost for infrastructure cost, firefighting and rescue vehicles, and specialized fire and communication equipment. The
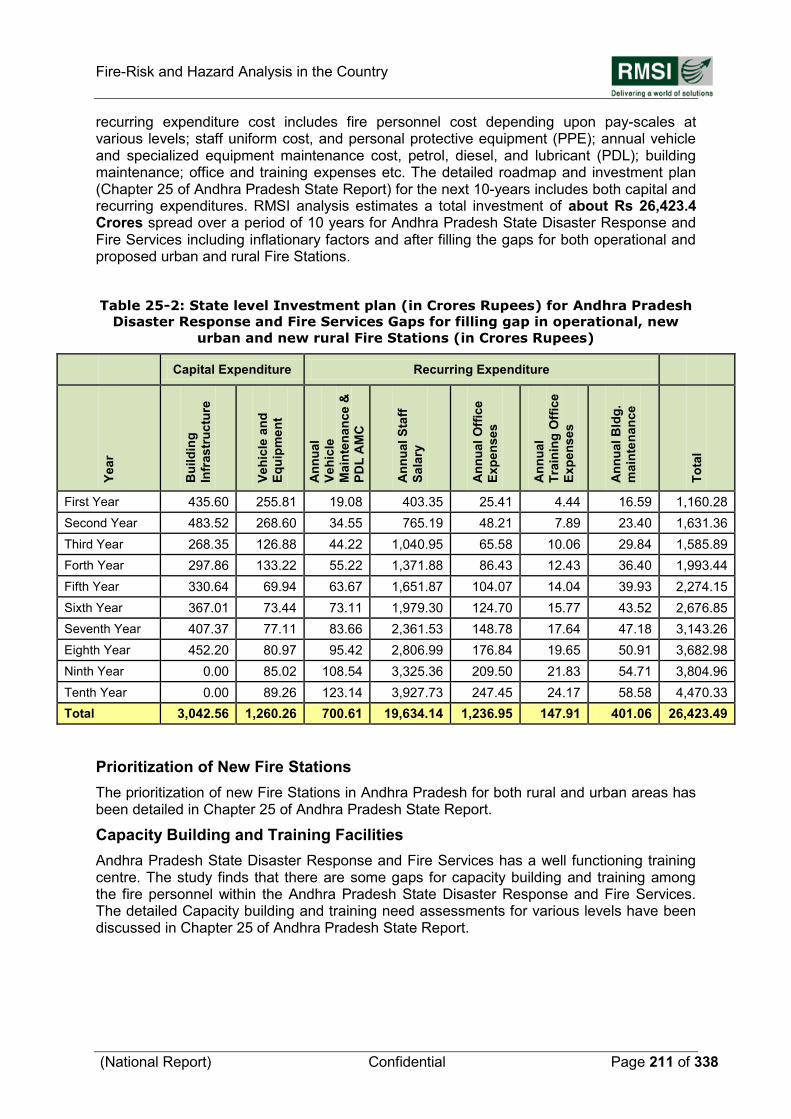
Fire-Risk and Hazard Analysis in the Country
(National Report) Confidential Page 211 of 338
recurring expenditure cost includes fire personnel cost depending upon pay-scales at various levels; staff uniform cost, and personal protective equipment (PPE); annual vehicle and specialized equipment maintenance cost, petrol, diesel, and lubricant (PDL); building maintenance; office and training expenses etc. The detailed roadmap and investment plan (Chapter 25 of Andhra Pradesh State Report) for the next 10-years includes both capital and recurring expenditures. RMSI analysis estimates a total investment of about Rs 26,423.4 Crores spread over a period of 10 years for Andhra Pradesh State Disaster Response and Fire Services including inflationary factors and after filling the gaps for both operational and proposed urban and rural Fire Stations.
Table 25-2: State level Investment plan (in Crores Rupees) for Andhra Pradesh
Disaster Response and Fire Services Gaps for filling gap in operational, new
urban and new rural Fire Stations (in Crores Rupees)
Capital Expenditure Recurring Expenditure
Year
Bu
ild
ing
Infr
astr
uc
ture
Veh
icle
an
d
Eq
uip
me
nt
An
nu
al
Veh
icle
Ma
inte
nan
ce &
PD
L A
MC
An
nu
al S
taff
Sala
ry
An
nu
al
Off
ice
Exp
en
ses
An
nu
al
Tra
inin
g O
ffic
e
Exp
en
ses
An
nu
al B
ldg
.
main
ten
an
ce
To
tal
First Year 435.60 255.81 19.08 403.35 25.41 4.44 16.59 1,160.28
Second Year 483.52 268.60 34.55 765.19 48.21 7.89 23.40 1,631.36
Third Year 268.35 126.88 44.22 1,040.95 65.58 10.06 29.84 1,585.89
Forth Year 297.86 133.22 55.22 1,371.88 86.43 12.43 36.40 1,993.44
Fifth Year 330.64 69.94 63.67 1,651.87 104.07 14.04 39.93 2,274.15
Sixth Year 367.01 73.44 73.11 1,979.30 124.70 15.77 43.52 2,676.85
Seventh Year 407.37 77.11 83.66 2,361.53 148.78 17.64 47.18 3,143.26
Eighth Year 452.20 80.97 95.42 2,806.99 176.84 19.65 50.91 3,682.98
Ninth Year 0.00 85.02 108.54 3,325.36 209.50 21.83 54.71 3,804.96
Tenth Year 0.00 89.26 123.14 3,927.73 247.45 24.17 58.58 4,470.33
Total 3,042.56 1,260.26 700.61 19,634.14 1,236.95 147.91 401.06 26,423.49
Prioritization of New Fire Stations
The prioritization of new Fire Stations in Andhra Pradesh for both rural and urban areas has been detailed in Chapter 25 of Andhra Pradesh State Report.
Capacity Building and Training Facilities
Andhra Pradesh State Disaster Response and Fire Services has a well functioning training centre. The study finds that there are some gaps for capacity building and training among the fire personnel within the Andhra Pradesh State Disaster Response and Fire Services. The detailed Capacity building and training need assessments for various levels have been discussed in Chapter 25 of Andhra Pradesh State Report.
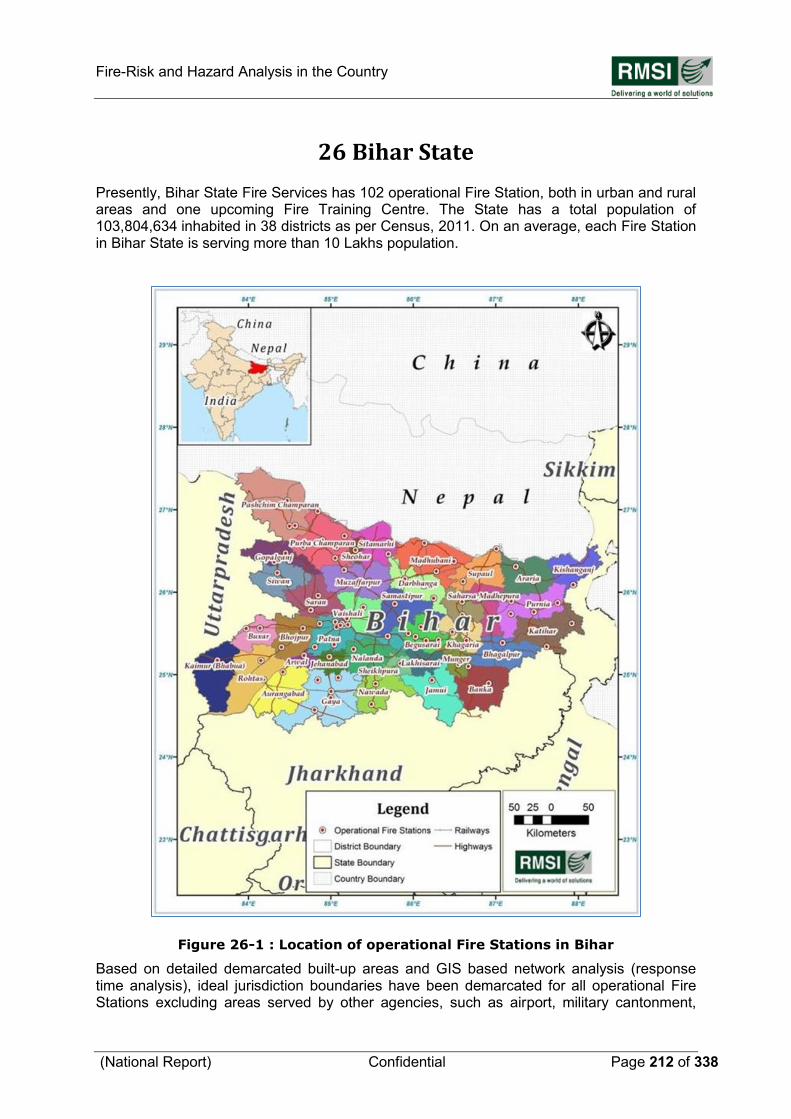
Fire-Risk and Hazard Analysis in the Country
(National Report) Confidential Page 212 of 338
26 Bihar State
Presently, Bihar State Fire Services has 102 operational Fire Station, both in urban and rural areas and one upcoming Fire Training Centre. The State has a total population of 103,804,634 inhabited in 38 districts as per Census, 2011. On an average, each Fire Station in Bihar State is serving more than 10 Lakhs population.
Figure 26-1 : Location of operational Fire Stations in Bihar Based on detailed demarcated built-up areas and GIS based network analysis (response time analysis), ideal jurisdiction boundaries have been demarcated for all operational Fire Stations excluding areas served by other agencies, such as airport, military cantonment,
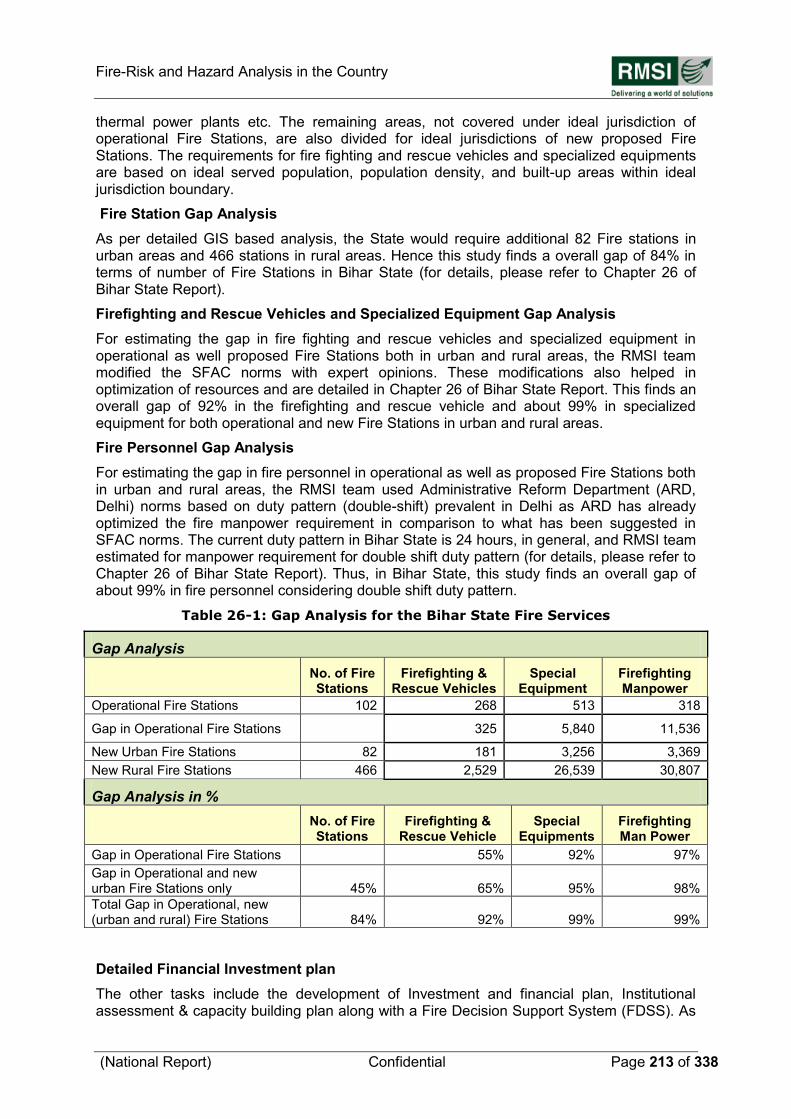
Fire-Risk and Hazard Analysis in the Country
(National Report) Confidential Page 213 of 338
thermal power plants etc. The remaining areas, not covered under ideal jurisdiction of operational Fire Stations, are also divided for ideal jurisdictions of new proposed Fire Stations. The requirements for fire fighting and rescue vehicles and specialized equipments are based on ideal served population, population density, and built-up areas within ideal jurisdiction boundary.
Fire Station Gap Analysis
As per detailed GIS based analysis, the State would require additional 82 Fire stations in urban areas and 466 stations in rural areas. Hence this study finds a overall gap of 84% in terms of number of Fire Stations in Bihar State (for details, please refer to Chapter 26 of Bihar State Report).
Firefighting and Rescue Vehicles and Specialized Equipment Gap Analysis
For estimating the gap in fire fighting and rescue vehicles and specialized equipment in operational as well proposed Fire Stations both in urban and rural areas, the RMSI team modified the SFAC norms with expert opinions. These modifications also helped in optimization of resources and are detailed in Chapter 26 of Bihar State Report. This finds an overall gap of 92% in the firefighting and rescue vehicle and about 99% in specialized equipment for both operational and new Fire Stations in urban and rural areas.
Fire Personnel Gap Analysis
For estimating the gap in fire personnel in operational as well as proposed Fire Stations both in urban and rural areas, the RMSI team used Administrative Reform Department (ARD, Delhi) norms based on duty pattern (double-shift) prevalent in Delhi as ARD has already optimized the fire manpower requirement in comparison to what has been suggested in SFAC norms. The current duty pattern in Bihar State is 24 hours, in general, and RMSI team estimated for manpower requirement for double shift duty pattern (for details, please refer to Chapter 26 of Bihar State Report). Thus, in Bihar State, this study finds an overall gap of about 99% in fire personnel considering double shift duty pattern.
Table 26-1: Gap Analysis for the Bihar State Fire Services
Gap Analysis
No. of Fire Stations
Firefighting & Rescue Vehicles
Special Equipment
Firefighting Manpower
Operational Fire Stations 102 268 513 318
Gap in Operational Fire Stations 325 5,840 11,536
New Urban Fire Stations 82 181 3,256 3,369
New Rural Fire Stations 466 2,529 26,539 30,807
Gap Analysis in %
No. of Fire Stations
Firefighting & Rescue Vehicle
Special Equipments
Firefighting Man Power
Gap in Operational Fire Stations 55% 92% 97%
Gap in Operational and new urban Fire Stations only 45% 65% 95% 98%
Total Gap in Operational, new (urban and rural) Fire Stations 84% 92% 99% 99%
Detailed Financial Investment plan
The other tasks include the development of Investment and financial plan, Institutional assessment & capacity building plan along with a Fire Decision Support System (FDSS). As
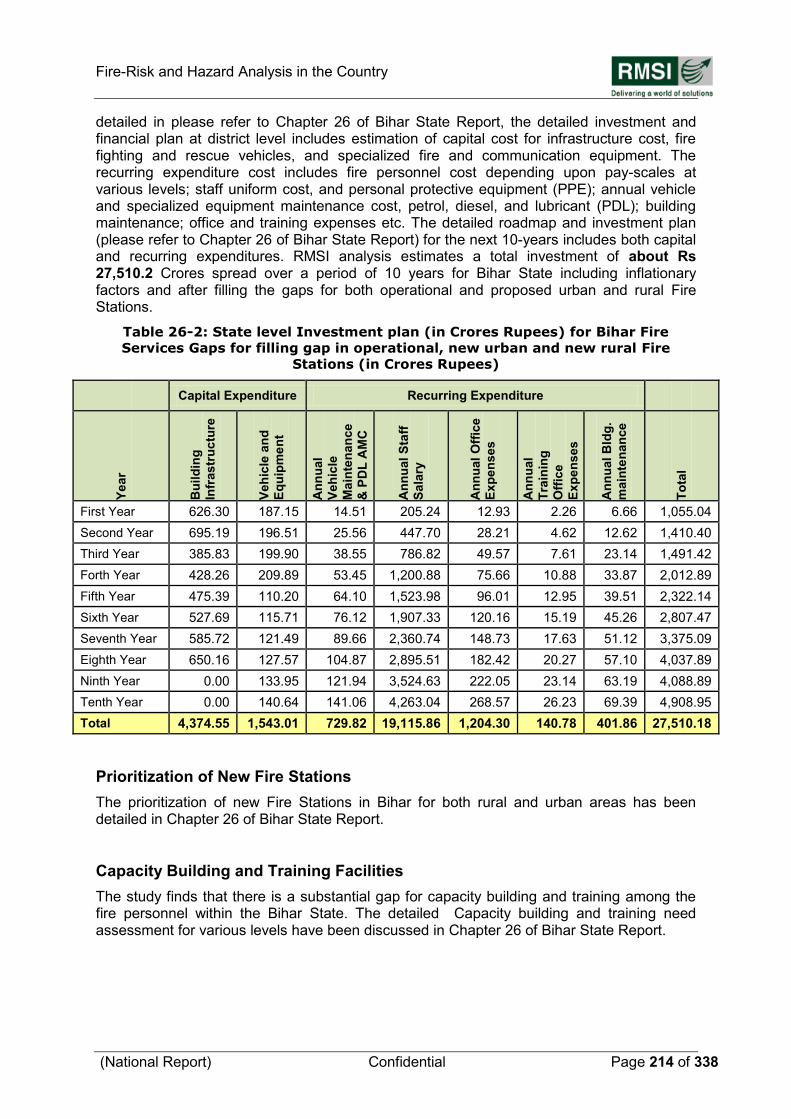
Fire-Risk and Hazard Analysis in the Country
(National Report) Confidential Page 214 of 338
detailed in please refer to Chapter 26 of Bihar State Report, the detailed investment and financial plan at district level includes estimation of capital cost for infrastructure cost, fire fighting and rescue vehicles, and specialized fire and communication equipment. The recurring expenditure cost includes fire personnel cost depending upon pay-scales at various levels; staff uniform cost, and personal protective equipment (PPE); annual vehicle and specialized equipment maintenance cost, petrol, diesel, and lubricant (PDL); building maintenance; office and training expenses etc. The detailed roadmap and investment plan (please refer to Chapter 26 of Bihar State Report) for the next 10-years includes both capital and recurring expenditures. RMSI analysis estimates a total investment of about Rs 27,510.2 Crores spread over a period of 10 years for Bihar State including inflationary factors and after filling the gaps for both operational and proposed urban and rural Fire Stations.
Table 26-2: State level Investment plan (in Crores Rupees) for Bihar Fire
Services Gaps for filling gap in operational, new urban and new rural Fire
Stations (in Crores Rupees)
Capital Expenditure Recurring Expenditure
Year
Bu
ild
ing
Infr
astr
uc
ture
Veh
icle
an
d
Eq
uip
me
nt
An
nu
al
Veh
icle
Ma
inte
nan
ce
& P
DL
AM
C
An
nu
al S
taff
Sala
ry
An
nu
al
Off
ice
Exp
en
ses
An
nu
al
Tra
inin
g
Off
ice
Exp
en
ses
An
nu
al B
ldg
.
main
ten
an
ce
To
tal
First Year 626.30 187.15 14.51 205.24 12.93 2.26 6.66 1,055.04
Second Year 695.19 196.51 25.56 447.70 28.21 4.62 12.62 1,410.40
Third Year 385.83 199.90 38.55 786.82 49.57 7.61 23.14 1,491.42
Forth Year 428.26 209.89 53.45 1,200.88 75.66 10.88 33.87 2,012.89
Fifth Year 475.39 110.20 64.10 1,523.98 96.01 12.95 39.51 2,322.14
Sixth Year 527.69 115.71 76.12 1,907.33 120.16 15.19 45.26 2,807.47
Seventh Year 585.72 121.49 89.66 2,360.74 148.73 17.63 51.12 3,375.09
Eighth Year 650.16 127.57 104.87 2,895.51 182.42 20.27 57.10 4,037.89
Ninth Year 0.00 133.95 121.94 3,524.63 222.05 23.14 63.19 4,088.89
Tenth Year 0.00 140.64 141.06 4,263.04 268.57 26.23 69.39 4,908.95
Total 4,374.55 1,543.01 729.82 19,115.86 1,204.30 140.78 401.86 27,510.18
Prioritization of New Fire Stations
The prioritization of new Fire Stations in Bihar for both rural and urban areas has been detailed in Chapter 26 of Bihar State Report.
Capacity Building and Training Facilities
The study finds that there is a substantial gap for capacity building and training among the fire personnel within the Bihar State. The detailed Capacity building and training need assessment for various levels have been discussed in Chapter 26 of Bihar State Report.
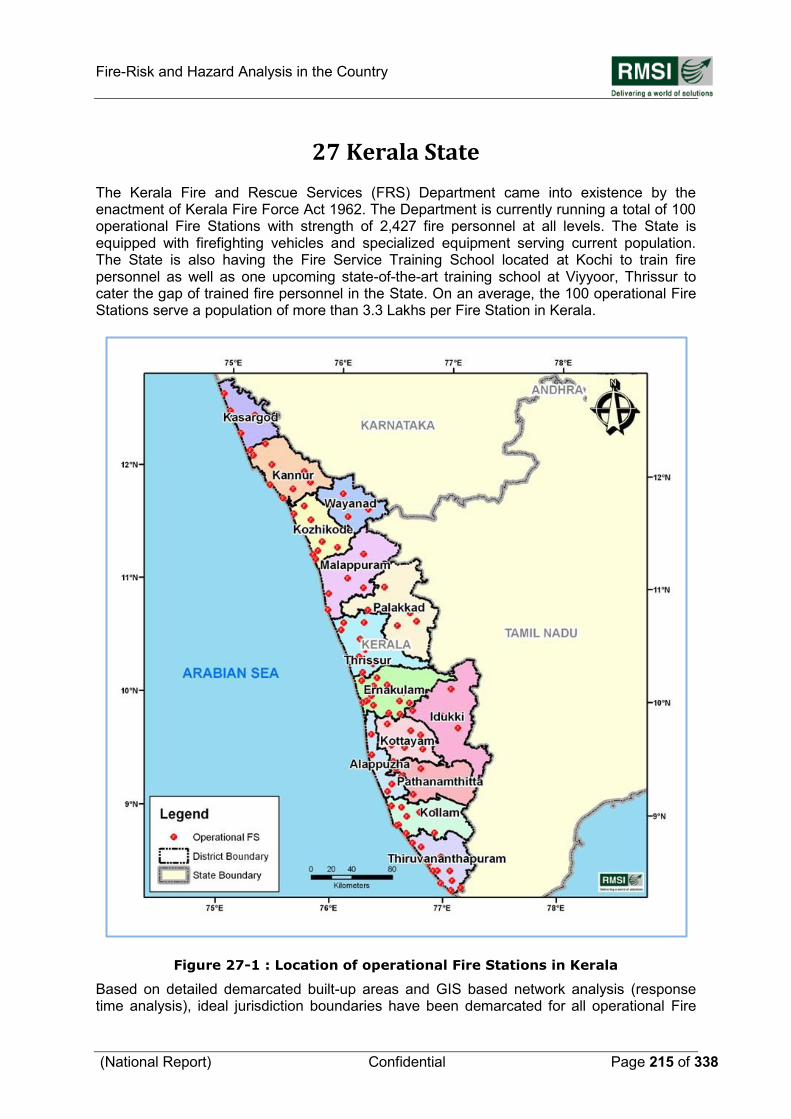
Fire-Risk and Hazard Analysis in the Country
(National Report) Confidential Page 215 of 338
27 Kerala State
The Kerala Fire and Rescue Services (FRS) Department came into existence by the enactment of Kerala Fire Force Act 1962. The Department is currently running a total of 100 operational Fire Stations with strength of 2,427 fire personnel at all levels. The State is equipped with firefighting vehicles and specialized equipment serving current population. The State is also having the Fire Service Training School located at Kochi to train fire personnel as well as one upcoming state-of-the-art training school at Viyyoor, Thrissur to cater the gap of trained fire personnel in the State. On an average, the 100 operational Fire Stations serve a population of more than 3.3 Lakhs per Fire Station in Kerala.
Figure 27-1 : Location of operational Fire Stations in Kerala Based on detailed demarcated built-up areas and GIS based network analysis (response time analysis), ideal jurisdiction boundaries have been demarcated for all operational Fire
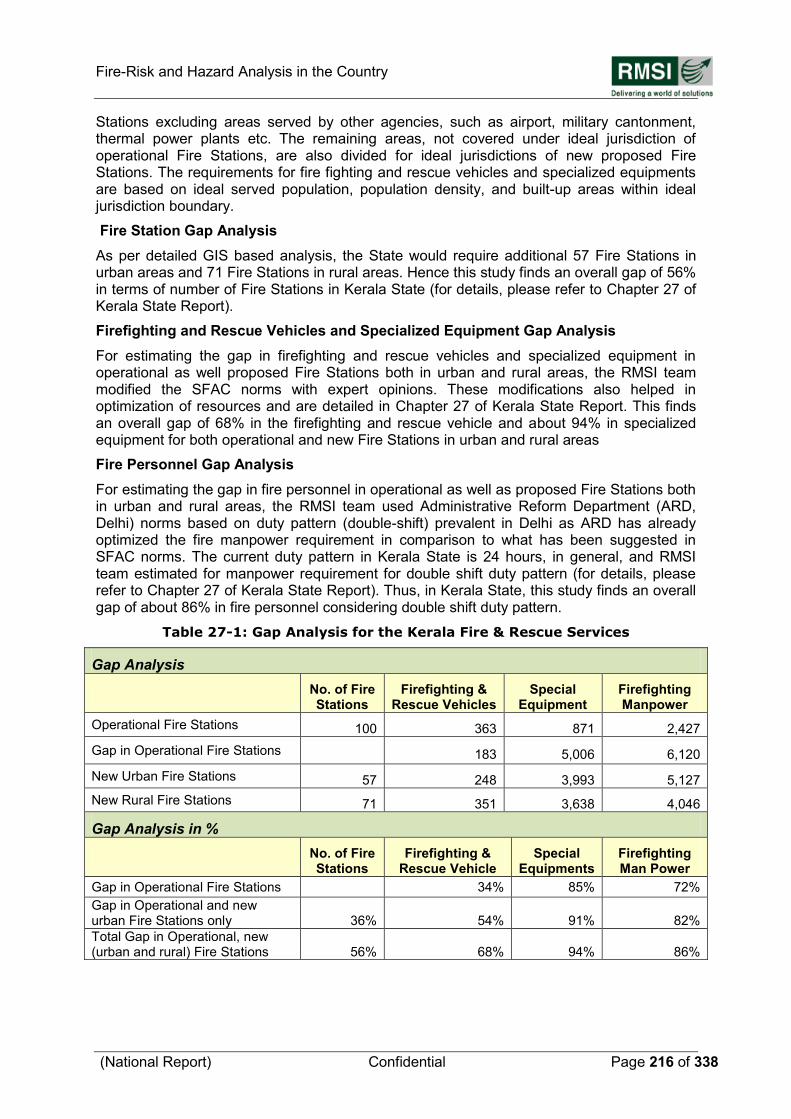
Fire-Risk and Hazard Analysis in the Country
(National Report) Confidential Page 216 of 338
Stations excluding areas served by other agencies, such as airport, military cantonment, thermal power plants etc. The remaining areas, not covered under ideal jurisdiction of operational Fire Stations, are also divided for ideal jurisdictions of new proposed Fire Stations. The requirements for fire fighting and rescue vehicles and specialized equipments are based on ideal served population, population density, and built-up areas within ideal jurisdiction boundary.
Fire Station Gap Analysis
As per detailed GIS based analysis, the State would require additional 57 Fire Stations in urban areas and 71 Fire Stations in rural areas. Hence this study finds an overall gap of 56% in terms of number of Fire Stations in Kerala State (for details, please refer to Chapter 27 of Kerala State Report).
Firefighting and Rescue Vehicles and Specialized Equipment Gap Analysis
For estimating the gap in firefighting and rescue vehicles and specialized equipment in operational as well proposed Fire Stations both in urban and rural areas, the RMSI team modified the SFAC norms with expert opinions. These modifications also helped in optimization of resources and are detailed in Chapter 27 of Kerala State Report. This finds an overall gap of 68% in the firefighting and rescue vehicle and about 94% in specialized equipment for both operational and new Fire Stations in urban and rural areas
Fire Personnel Gap Analysis
For estimating the gap in fire personnel in operational as well as proposed Fire Stations both in urban and rural areas, the RMSI team used Administrative Reform Department (ARD, Delhi) norms based on duty pattern (double-shift) prevalent in Delhi as ARD has already optimized the fire manpower requirement in comparison to what has been suggested in SFAC norms. The current duty pattern in Kerala State is 24 hours, in general, and RMSI team estimated for manpower requirement for double shift duty pattern (for details, please refer to Chapter 27 of Kerala State Report). Thus, in Kerala State, this study finds an overall gap of about 86% in fire personnel considering double shift duty pattern.
Table 27-1: Gap Analysis for the Kerala Fire & Rescue Services
Gap Analysis
No. of Fire Stations
Firefighting & Rescue Vehicles
Special Equipment
Firefighting Manpower
Operational Fire Stations 100 363 871 2,427
Gap in Operational Fire Stations 183 5,006 6,120
New Urban Fire Stations 57 248 3,993 5,127
New Rural Fire Stations 71 351 3,638 4,046
Gap Analysis in %
No. of Fire Stations
Firefighting & Rescue Vehicle
Special Equipments
Firefighting Man Power
Gap in Operational Fire Stations 34% 85% 72%
Gap in Operational and new urban Fire Stations only 36% 54% 91% 82%
Total Gap in Operational, new (urban and rural) Fire Stations 56% 68% 94% 86%
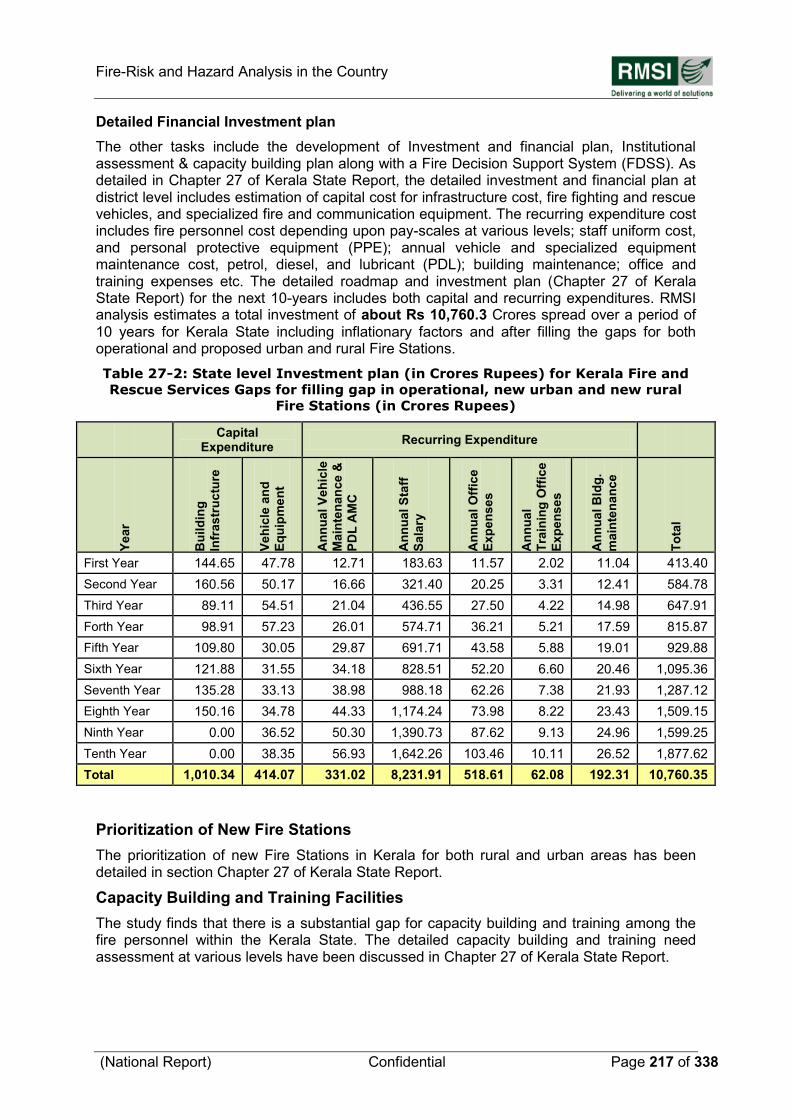
Fire-Risk and Hazard Analysis in the Country
(National Report) Confidential Page 217 of 338
Detailed Financial Investment plan
The other tasks include the development of Investment and financial plan, Institutional assessment & capacity building plan along with a Fire Decision Support System (FDSS). As detailed in Chapter 27 of Kerala State Report, the detailed investment and financial plan at district level includes estimation of capital cost for infrastructure cost, fire fighting and rescue vehicles, and specialized fire and communication equipment. The recurring expenditure cost includes fire personnel cost depending upon pay-scales at various levels; staff uniform cost, and personal protective equipment (PPE); annual vehicle and specialized equipment maintenance cost, petrol, diesel, and lubricant (PDL); building maintenance; office and training expenses etc. The detailed roadmap and investment plan (Chapter 27 of Kerala State Report) for the next 10-years includes both capital and recurring expenditures. RMSI analysis estimates a total investment of about Rs 10,760.3 Crores spread over a period of 10 years for Kerala State including inflationary factors and after filling the gaps for both operational and proposed urban and rural Fire Stations.
Table 27-2: State level Investment plan (in Crores Rupees) for Kerala Fire and
Rescue Services Gaps for filling gap in operational, new urban and new rural
Fire Stations (in Crores Rupees)
Capital Expenditure
Recurring Expenditure
Year
Bu
ild
ing
Infr
astr
uc
ture
Veh
icle
an
d
Eq
uip
me
nt
An
nu
al V
eh
icle
Ma
inte
nan
ce &
PD
L A
MC
An
nu
al S
taff
Sala
ry
An
nu
al
Off
ice
Exp
en
ses
An
nu
al
Tra
inin
g O
ffic
e
Exp
en
ses
An
nu
al B
ldg
.
main
ten
an
ce
To
tal
First Year 144.65 47.78 12.71 183.63 11.57 2.02 11.04 413.40
Second Year 160.56 50.17 16.66 321.40 20.25 3.31 12.41 584.78
Third Year 89.11 54.51 21.04 436.55 27.50 4.22 14.98 647.91
Forth Year 98.91 57.23 26.01 574.71 36.21 5.21 17.59 815.87
Fifth Year 109.80 30.05 29.87 691.71 43.58 5.88 19.01 929.88
Sixth Year 121.88 31.55 34.18 828.51 52.20 6.60 20.46 1,095.36
Seventh Year 135.28 33.13 38.98 988.18 62.26 7.38 21.93 1,287.12
Eighth Year 150.16 34.78 44.33 1,174.24 73.98 8.22 23.43 1,509.15
Ninth Year 0.00 36.52 50.30 1,390.73 87.62 9.13 24.96 1,599.25
Tenth Year 0.00 38.35 56.93 1,642.26 103.46 10.11 26.52 1,877.62
Total 1,010.34 414.07 331.02 8,231.91 518.61 62.08 192.31 10,760.35
Prioritization of New Fire Stations
The prioritization of new Fire Stations in Kerala for both rural and urban areas has been detailed in section Chapter 27 of Kerala State Report.
Capacity Building and Training Facilities
The study finds that there is a substantial gap for capacity building and training among the fire personnel within the Kerala State. The detailed capacity building and training need assessment at various levels have been discussed in Chapter 27 of Kerala State Report.
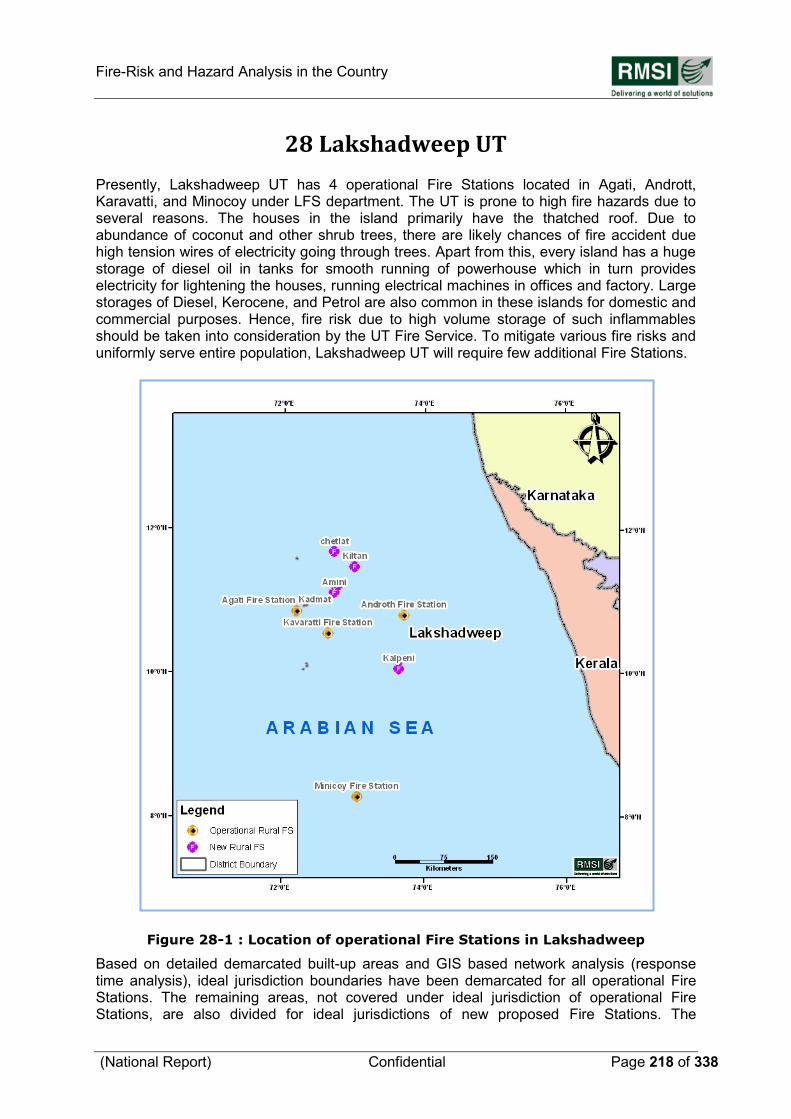
Fire-Risk and Hazard Analysis in the Country
(National Report) Confidential Page 218 of 338
28 Lakshadweep UT
Presently, Lakshadweep UT has 4 operational Fire Stations located in Agati, Andrott, Karavatti, and Minocoy under LFS department. The UT is prone to high fire hazards due to several reasons. The houses in the island primarily have the thatched roof. Due to abundance of coconut and other shrub trees, there are likely chances of fire accident due high tension wires of electricity going through trees. Apart from this, every island has a huge storage of diesel oil in tanks for smooth running of powerhouse which in turn provides electricity for lightening the houses, running electrical machines in offices and factory. Large storages of Diesel, Kerocene, and Petrol are also common in these islands for domestic and commercial purposes. Hence, fire risk due to high volume storage of such inflammables should be taken into consideration by the UT Fire Service. To mitigate various fire risks and uniformly serve entire population, Lakshadweep UT will require few additional Fire Stations.
Figure 28-1 : Location of operational Fire Stations in Lakshadweep Based on detailed demarcated built-up areas and GIS based network analysis (response time analysis), ideal jurisdiction boundaries have been demarcated for all operational Fire Stations. The remaining areas, not covered under ideal jurisdiction of operational Fire Stations, are also divided for ideal jurisdictions of new proposed Fire Stations. The
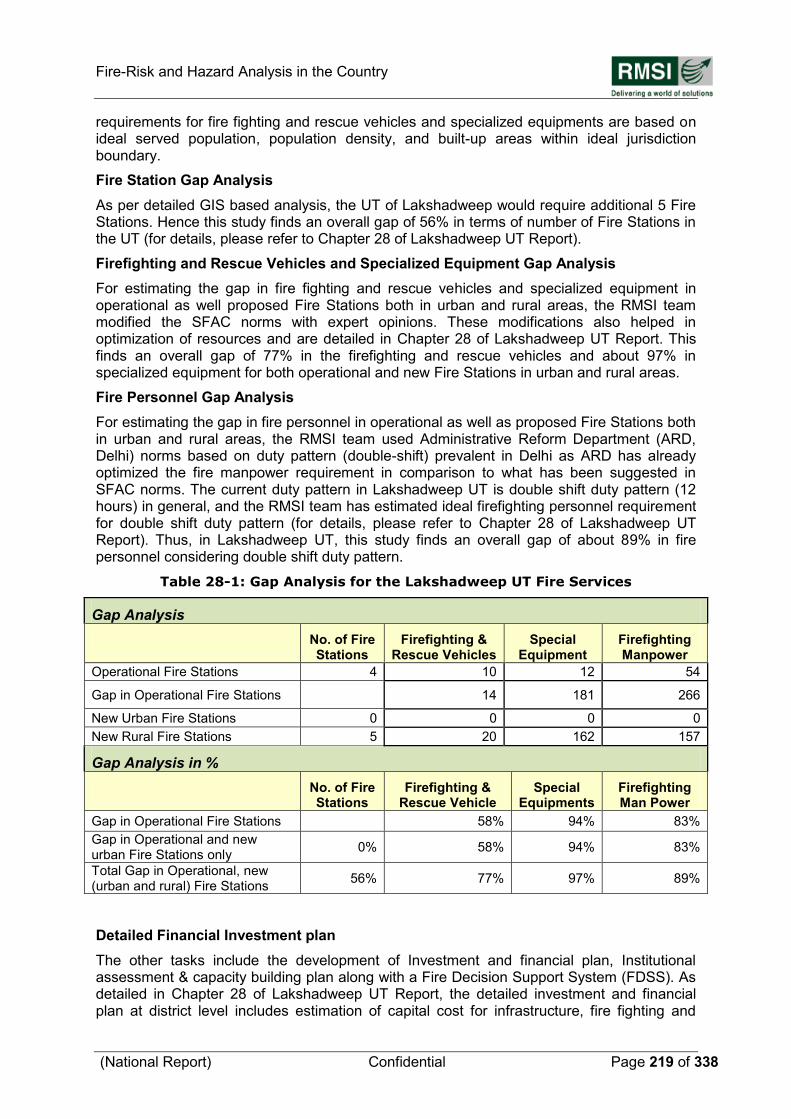
Fire-Risk and Hazard Analysis in the Country
(National Report) Confidential Page 219 of 338
requirements for fire fighting and rescue vehicles and specialized equipments are based on ideal served population, population density, and built-up areas within ideal jurisdiction boundary.
Fire Station Gap Analysis
As per detailed GIS based analysis, the UT of Lakshadweep would require additional 5 Fire Stations. Hence this study finds an overall gap of 56% in terms of number of Fire Stations in the UT (for details, please refer to Chapter 28 of Lakshadweep UT Report).
Firefighting and Rescue Vehicles and Specialized Equipment Gap Analysis
For estimating the gap in fire fighting and rescue vehicles and specialized equipment in operational as well proposed Fire Stations both in urban and rural areas, the RMSI team modified the SFAC norms with expert opinions. These modifications also helped in optimization of resources and are detailed in Chapter 28 of Lakshadweep UT Report. This finds an overall gap of 77% in the firefighting and rescue vehicles and about 97% in specialized equipment for both operational and new Fire Stations in urban and rural areas.
Fire Personnel Gap Analysis
For estimating the gap in fire personnel in operational as well as proposed Fire Stations both in urban and rural areas, the RMSI team used Administrative Reform Department (ARD, Delhi) norms based on duty pattern (double-shift) prevalent in Delhi as ARD has already optimized the fire manpower requirement in comparison to what has been suggested in SFAC norms. The current duty pattern in Lakshadweep UT is double shift duty pattern (12 hours) in general, and the RMSI team has estimated ideal firefighting personnel requirement for double shift duty pattern (for details, please refer to Chapter 28 of Lakshadweep UT Report). Thus, in Lakshadweep UT, this study finds an overall gap of about 89% in fire personnel considering double shift duty pattern.
Table 28-1: Gap Analysis for the Lakshadweep UT Fire Services
Gap Analysis
No. of Fire Stations
Firefighting & Rescue Vehicles
Special Equipment
Firefighting Manpower
Operational Fire Stations 4 10 12 54
Gap in Operational Fire Stations 14 181 266
New Urban Fire Stations 0 0 0 0
New Rural Fire Stations 5 20 162 157
Gap Analysis in %
No. of Fire Stations
Firefighting & Rescue Vehicle
Special Equipments
Firefighting Man Power
Gap in Operational Fire Stations 58% 94% 83%
Gap in Operational and new urban Fire Stations only
0% 58% 94% 83%
Total Gap in Operational, new (urban and rural) Fire Stations
56% 77% 97% 89%
Detailed Financial Investment plan
The other tasks include the development of Investment and financial plan, Institutional assessment & capacity building plan along with a Fire Decision Support System (FDSS). As detailed in Chapter 28 of Lakshadweep UT Report, the detailed investment and financial plan at district level includes estimation of capital cost for infrastructure, fire fighting and
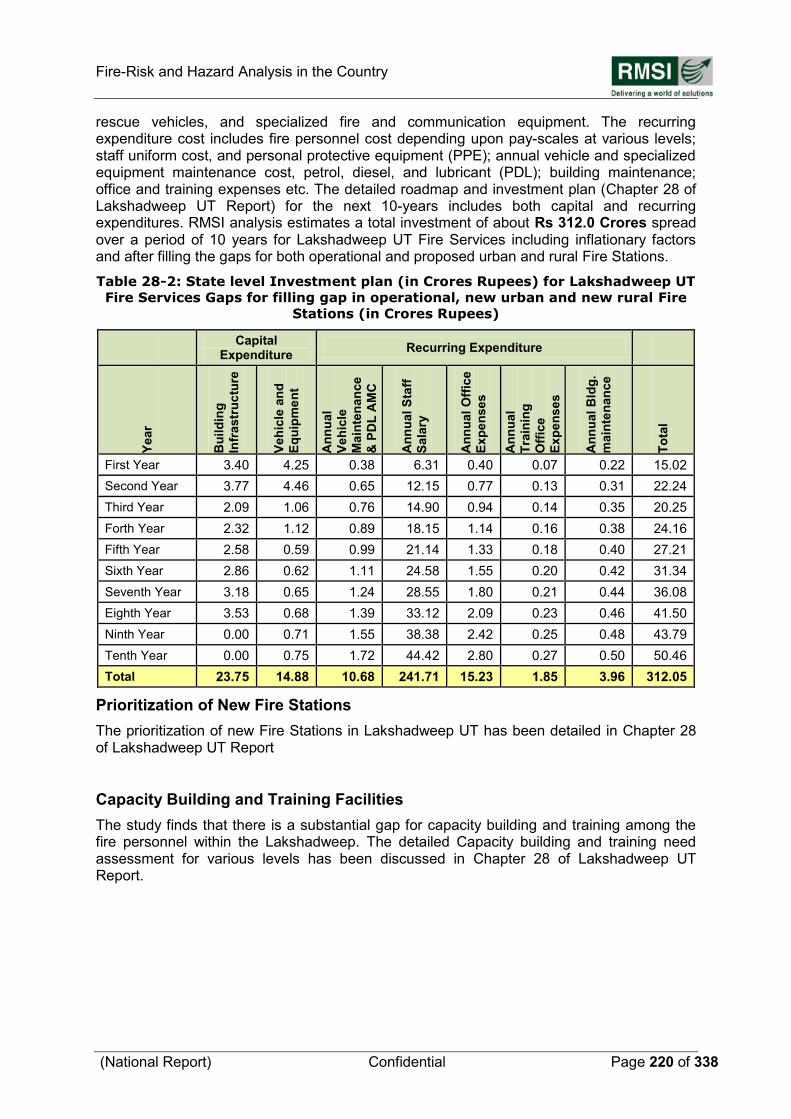
Fire-Risk and Hazard Analysis in the Country
(National Report) Confidential Page 220 of 338
rescue vehicles, and specialized fire and communication equipment. The recurring expenditure cost includes fire personnel cost depending upon pay-scales at various levels; staff uniform cost, and personal protective equipment (PPE); annual vehicle and specialized equipment maintenance cost, petrol, diesel, and lubricant (PDL); building maintenance; office and training expenses etc. The detailed roadmap and investment plan (Chapter 28 of Lakshadweep UT Report) for the next 10-years includes both capital and recurring expenditures. RMSI analysis estimates a total investment of about Rs 312.0 Crores spread over a period of 10 years for Lakshadweep UT Fire Services including inflationary factors and after filling the gaps for both operational and proposed urban and rural Fire Stations.
Table 28-2: State level Investment plan (in Crores Rupees) for Lakshadweep UT
Fire Services Gaps for filling gap in operational, new urban and new rural Fire
Stations (in Crores Rupees)
Capital Expenditure
Recurring Expenditure
Year
Bu
ild
ing
Infr
astr
uc
ture
Veh
icle
an
d
Eq
uip
me
nt
An
nu
al
Veh
icle
Ma
inte
nan
ce
& P
DL
AM
C
An
nu
al S
taff
Sala
ry
An
nu
al
Off
ice
Exp
en
ses
An
nu
al
Tra
inin
g
Off
ice
Exp
en
ses
An
nu
al B
ldg
.
main
ten
an
ce
To
tal
First Year 3.40 4.25 0.38 6.31 0.40 0.07 0.22 15.02
Second Year 3.77 4.46 0.65 12.15 0.77 0.13 0.31 22.24
Third Year 2.09 1.06 0.76 14.90 0.94 0.14 0.35 20.25
Forth Year 2.32 1.12 0.89 18.15 1.14 0.16 0.38 24.16
Fifth Year 2.58 0.59 0.99 21.14 1.33 0.18 0.40 27.21
Sixth Year 2.86 0.62 1.11 24.58 1.55 0.20 0.42 31.34
Seventh Year 3.18 0.65 1.24 28.55 1.80 0.21 0.44 36.08
Eighth Year 3.53 0.68 1.39 33.12 2.09 0.23 0.46 41.50
Ninth Year 0.00 0.71 1.55 38.38 2.42 0.25 0.48 43.79
Tenth Year 0.00 0.75 1.72 44.42 2.80 0.27 0.50 50.46
Total 23.75 14.88 10.68 241.71 15.23 1.85 3.96 312.05
Prioritization of New Fire Stations
The prioritization of new Fire Stations in Lakshadweep UT has been detailed in Chapter 28 of Lakshadweep UT Report
Capacity Building and Training Facilities
The study finds that there is a substantial gap for capacity building and training among the fire personnel within the Lakshadweep. The detailed Capacity building and training need assessment for various levels has been discussed in Chapter 28 of Lakshadweep UT Report.
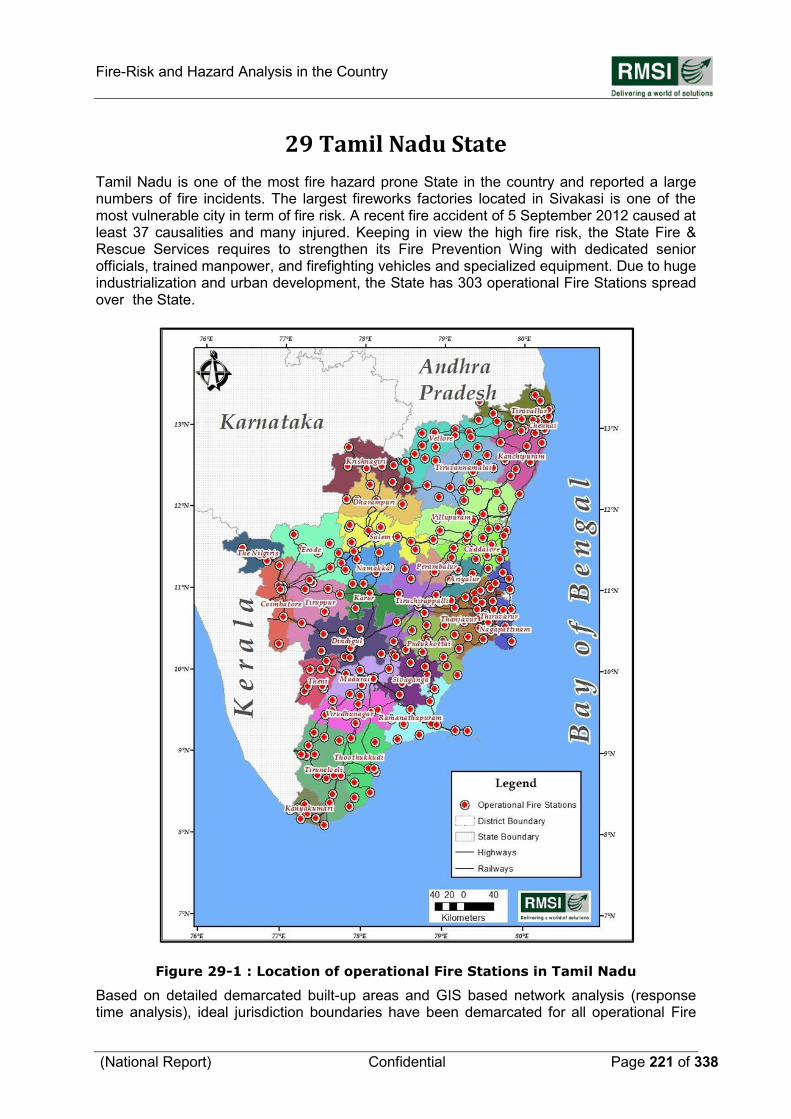
Fire-Risk and Hazard Analysis in the Country
(National Report) Confidential Page 221 of 338
29 Tamil Nadu State
Tamil Nadu is one of the most fire hazard prone State in the country and reported a large numbers of fire incidents. The largest fireworks factories located in Sivakasi is one of the most vulnerable city in term of fire risk. A recent fire accident of 5 September 2012 caused at least 37 causalities and many injured. Keeping in view the high fire risk, the State Fire & Rescue Services requires to strengthen its Fire Prevention Wing with dedicated senior officials, trained manpower, and firefighting vehicles and specialized equipment. Due to huge industrialization and urban development, the State has 303 operational Fire Stations spread over the State.
Figure 29-1 : Location of operational Fire Stations in Tamil Nadu Based on detailed demarcated built-up areas and GIS based network analysis (response time analysis), ideal jurisdiction boundaries have been demarcated for all operational Fire
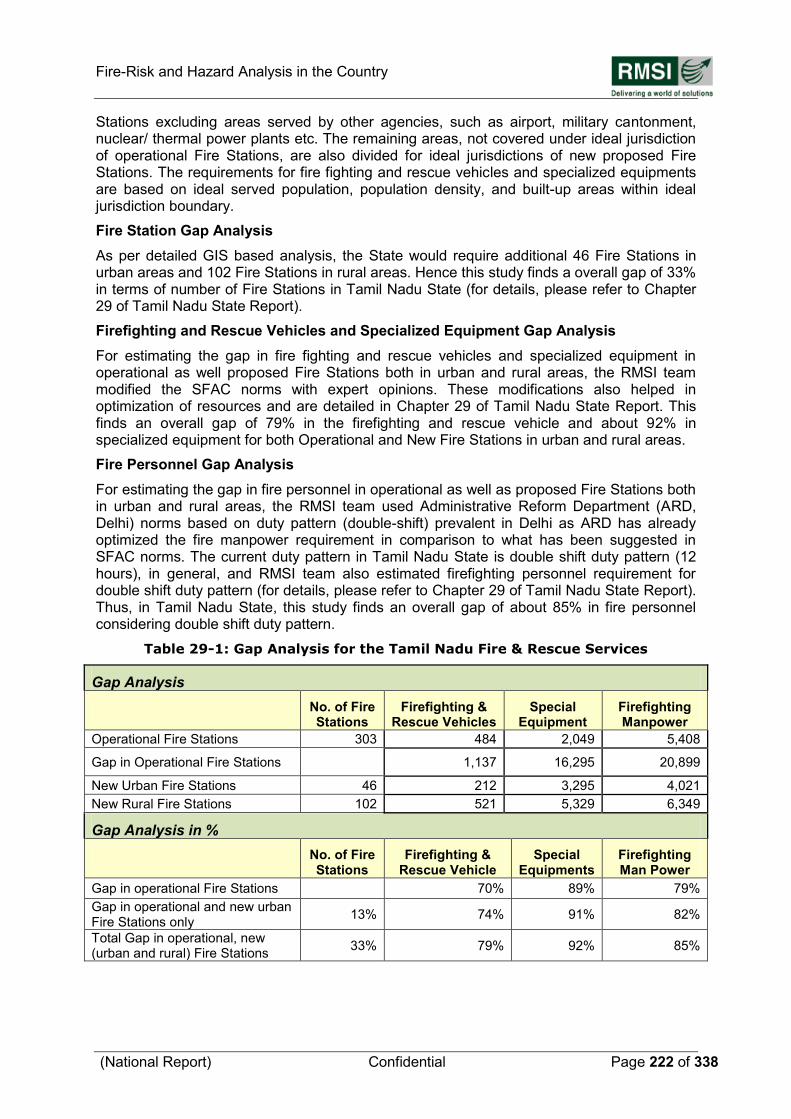
Fire-Risk and Hazard Analysis in the Country
(National Report) Confidential Page 222 of 338
Stations excluding areas served by other agencies, such as airport, military cantonment, nuclear/ thermal power plants etc. The remaining areas, not covered under ideal jurisdiction of operational Fire Stations, are also divided for ideal jurisdictions of new proposed Fire Stations. The requirements for fire fighting and rescue vehicles and specialized equipments are based on ideal served population, population density, and built-up areas within ideal jurisdiction boundary.
Fire Station Gap Analysis
As per detailed GIS based analysis, the State would require additional 46 Fire Stations in urban areas and 102 Fire Stations in rural areas. Hence this study finds a overall gap of 33% in terms of number of Fire Stations in Tamil Nadu State (for details, please refer to Chapter 29 of Tamil Nadu State Report).
Firefighting and Rescue Vehicles and Specialized Equipment Gap Analysis
For estimating the gap in fire fighting and rescue vehicles and specialized equipment in operational as well proposed Fire Stations both in urban and rural areas, the RMSI team modified the SFAC norms with expert opinions. These modifications also helped in optimization of resources and are detailed in Chapter 29 of Tamil Nadu State Report. This finds an overall gap of 79% in the firefighting and rescue vehicle and about 92% in specialized equipment for both Operational and New Fire Stations in urban and rural areas.
Fire Personnel Gap Analysis
For estimating the gap in fire personnel in operational as well as proposed Fire Stations both in urban and rural areas, the RMSI team used Administrative Reform Department (ARD, Delhi) norms based on duty pattern (double-shift) prevalent in Delhi as ARD has already optimized the fire manpower requirement in comparison to what has been suggested in SFAC norms. The current duty pattern in Tamil Nadu State is double shift duty pattern (12 hours), in general, and RMSI team also estimated firefighting personnel requirement for double shift duty pattern (for details, please refer to Chapter 29 of Tamil Nadu State Report). Thus, in Tamil Nadu State, this study finds an overall gap of about 85% in fire personnel considering double shift duty pattern.
Table 29-1: Gap Analysis for the Tamil Nadu Fire & Rescue Services
Gap Analysis
No. of Fire Stations
Firefighting & Rescue Vehicles
Special Equipment
Firefighting Manpower
Operational Fire Stations 303 484 2,049 5,408
Gap in Operational Fire Stations 1,137 16,295 20,899
New Urban Fire Stations 46 212 3,295 4,021
New Rural Fire Stations 102 521 5,329 6,349
Gap Analysis in %
No. of Fire Stations
Firefighting & Rescue Vehicle
Special Equipments
Firefighting Man Power
Gap in operational Fire Stations 70% 89% 79%
Gap in operational and new urban Fire Stations only
13% 74% 91% 82%
Total Gap in operational, new (urban and rural) Fire Stations
33% 79% 92% 85%
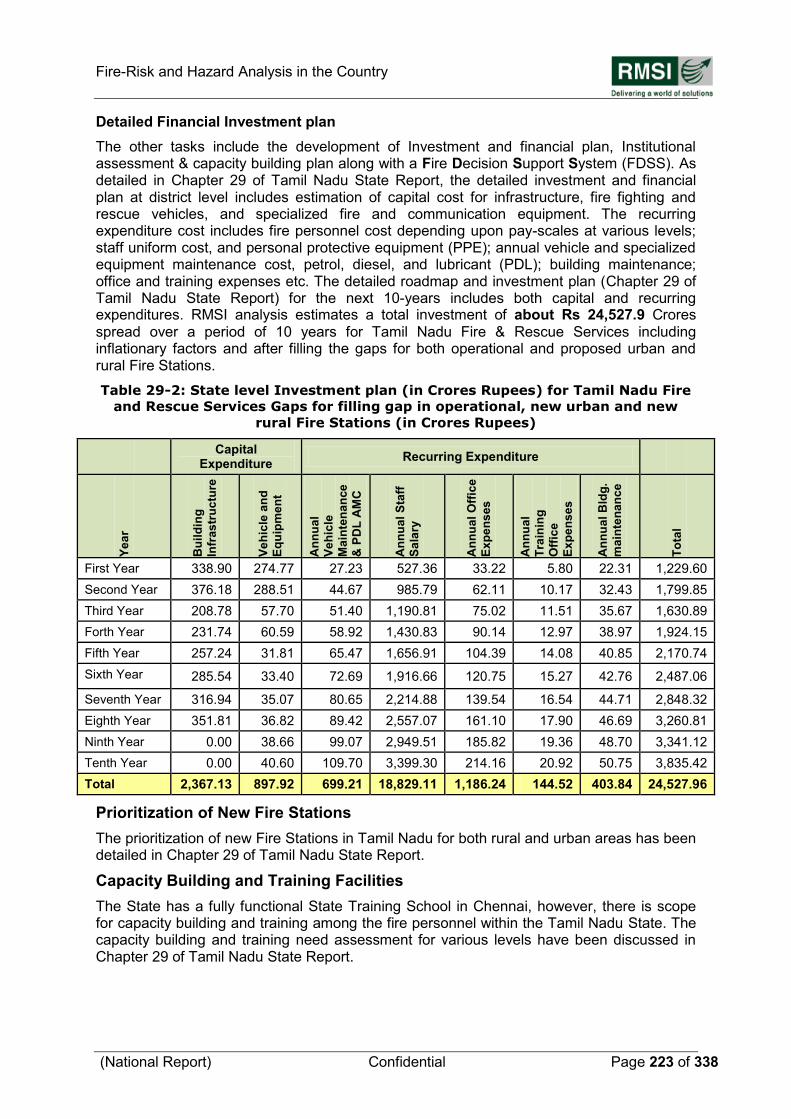
Fire-Risk and Hazard Analysis in the Country
(National Report) Confidential Page 223 of 338
Detailed Financial Investment plan
The other tasks include the development of Investment and financial plan, Institutional assessment & capacity building plan along with a Fire Decision Support System (FDSS). As detailed in Chapter 29 of Tamil Nadu State Report, the detailed investment and financial plan at district level includes estimation of capital cost for infrastructure, fire fighting and rescue vehicles, and specialized fire and communication equipment. The recurring expenditure cost includes fire personnel cost depending upon pay-scales at various levels; staff uniform cost, and personal protective equipment (PPE); annual vehicle and specialized equipment maintenance cost, petrol, diesel, and lubricant (PDL); building maintenance; office and training expenses etc. The detailed roadmap and investment plan (Chapter 29 of Tamil Nadu State Report) for the next 10-years includes both capital and recurring expenditures. RMSI analysis estimates a total investment of about Rs 24,527.9 Crores spread over a period of 10 years for Tamil Nadu Fire & Rescue Services including inflationary factors and after filling the gaps for both operational and proposed urban and rural Fire Stations.
Table 29-2: State level Investment plan (in Crores Rupees) for Tamil Nadu Fire
and Rescue Services Gaps for filling gap in operational, new urban and new
rural Fire Stations (in Crores Rupees)
Capital Expenditure
Recurring Expenditure
Ye
ar
Bu
ild
ing
Infr
as
tru
ctu
re
Ve
hic
le a
nd
Eq
uip
me
nt
An
nu
al
Ve
hic
le
Ma
inte
na
nce
& P
DL
AM
C
An
nu
al
Sta
ff
Sa
lary
An
nu
al
Off
ice
Ex
pe
ns
es
An
nu
al
Tra
inin
g
Off
ice
Ex
pe
ns
es
An
nu
al
Bld
g.
ma
inte
na
nc
e
To
tal
First Year 338.90 274.77 27.23 527.36 33.22 5.80 22.31 1,229.60
Second Year 376.18 288.51 44.67 985.79 62.11 10.17 32.43 1,799.85
Third Year 208.78 57.70 51.40 1,190.81 75.02 11.51 35.67 1,630.89
Forth Year 231.74 60.59 58.92 1,430.83 90.14 12.97 38.97 1,924.15
Fifth Year 257.24 31.81 65.47 1,656.91 104.39 14.08 40.85 2,170.74
Sixth Year 285.54 33.40 72.69 1,916.66 120.75 15.27 42.76 2,487.06
Seventh Year 316.94 35.07 80.65 2,214.88 139.54 16.54 44.71 2,848.32
Eighth Year 351.81 36.82 89.42 2,557.07 161.10 17.90 46.69 3,260.81
Ninth Year 0.00 38.66 99.07 2,949.51 185.82 19.36 48.70 3,341.12
Tenth Year 0.00 40.60 109.70 3,399.30 214.16 20.92 50.75 3,835.42
Total 2,367.13 897.92 699.21 18,829.11 1,186.24 144.52 403.84 24,527.96
Prioritization of New Fire Stations
The prioritization of new Fire Stations in Tamil Nadu for both rural and urban areas has been detailed in Chapter 29 of Tamil Nadu State Report.
Capacity Building and Training Facilities
The State has a fully functional State Training School in Chennai, however, there is scope for capacity building and training among the fire personnel within the Tamil Nadu State. The capacity building and training need assessment for various levels have been discussed in Chapter 29 of Tamil Nadu State Report.
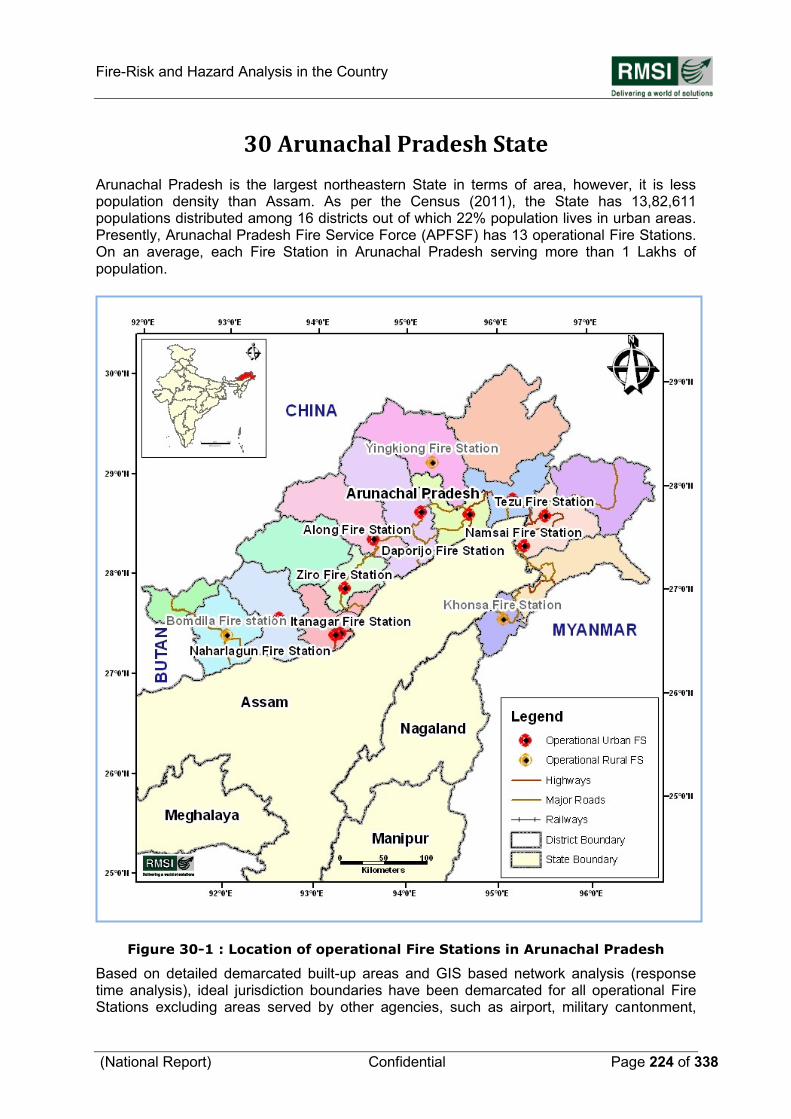
Fire-Risk and Hazard Analysis in the Country
(National Report) Confidential Page 224 of 338
30 Arunachal Pradesh State
Arunachal Pradesh is the largest northeastern State in terms of area, however, it is less population density than Assam. As per the Census (2011), the State has 13,82,611 populations distributed among 16 districts out of which 22% population lives in urban areas. Presently, Arunachal Pradesh Fire Service Force (APFSF) has 13 operational Fire Stations. On an average, each Fire Station in Arunachal Pradesh serving more than 1 Lakhs of population.
Figure 30-1 : Location of operational Fire Stations in Arunachal Pradesh Based on detailed demarcated built-up areas and GIS based network analysis (response time analysis), ideal jurisdiction boundaries have been demarcated for all operational Fire Stations excluding areas served by other agencies, such as airport, military cantonment,
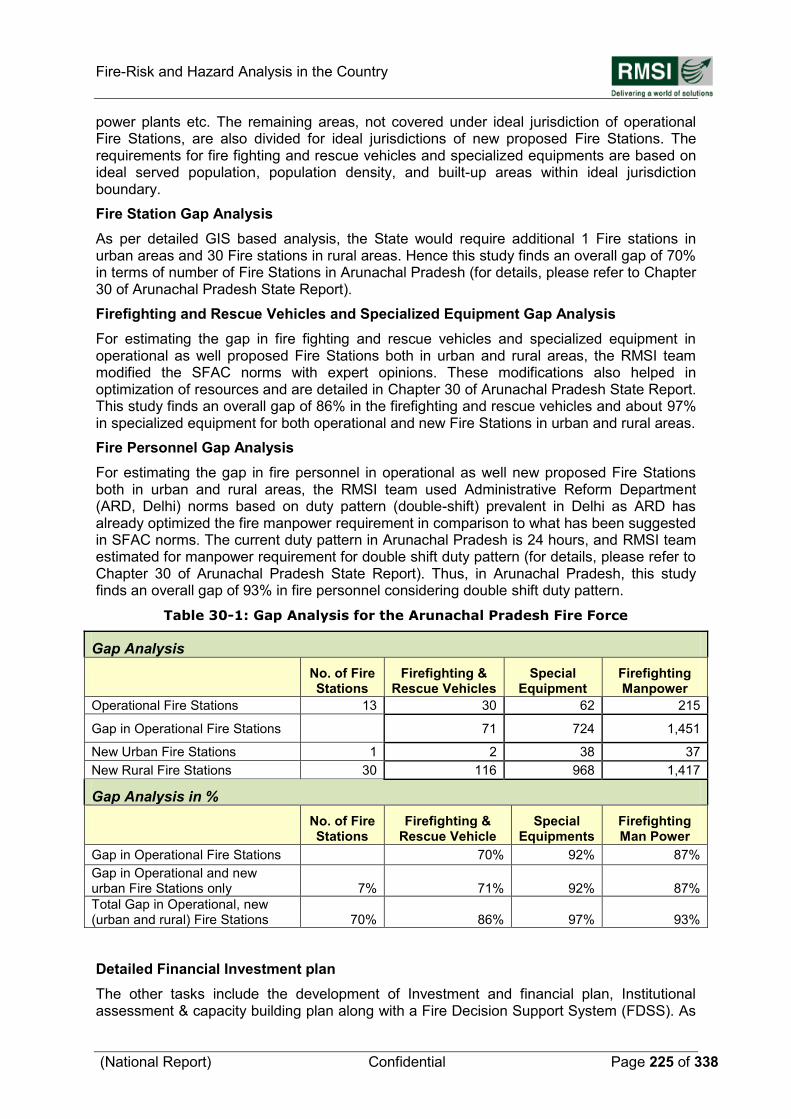
Fire-Risk and Hazard Analysis in the Country
(National Report) Confidential Page 225 of 338
power plants etc. The remaining areas, not covered under ideal jurisdiction of operational Fire Stations, are also divided for ideal jurisdictions of new proposed Fire Stations. The requirements for fire fighting and rescue vehicles and specialized equipments are based on ideal served population, population density, and built-up areas within ideal jurisdiction boundary.
Fire Station Gap Analysis
As per detailed GIS based analysis, the State would require additional 1 Fire stations in urban areas and 30 Fire stations in rural areas. Hence this study finds an overall gap of 70% in terms of number of Fire Stations in Arunachal Pradesh (for details, please refer to Chapter 30 of Arunachal Pradesh State Report).
Firefighting and Rescue Vehicles and Specialized Equipment Gap Analysis
For estimating the gap in fire fighting and rescue vehicles and specialized equipment in operational as well proposed Fire Stations both in urban and rural areas, the RMSI team modified the SFAC norms with expert opinions. These modifications also helped in optimization of resources and are detailed in Chapter 30 of Arunachal Pradesh State Report. This study finds an overall gap of 86% in the firefighting and rescue vehicles and about 97% in specialized equipment for both operational and new Fire Stations in urban and rural areas.
Fire Personnel Gap Analysis
For estimating the gap in fire personnel in operational as well new proposed Fire Stations both in urban and rural areas, the RMSI team used Administrative Reform Department (ARD, Delhi) norms based on duty pattern (double-shift) prevalent in Delhi as ARD has already optimized the fire manpower requirement in comparison to what has been suggested in SFAC norms. The current duty pattern in Arunachal Pradesh is 24 hours, and RMSI team estimated for manpower requirement for double shift duty pattern (for details, please refer to Chapter 30 of Arunachal Pradesh State Report). Thus, in Arunachal Pradesh, this study finds an overall gap of 93% in fire personnel considering double shift duty pattern.
Table 30-1: Gap Analysis for the Arunachal Pradesh Fire Force
Gap Analysis
No. of Fire Stations
Firefighting & Rescue Vehicles
Special Equipment
Firefighting Manpower
Operational Fire Stations 13 30 62 215
Gap in Operational Fire Stations 71 724 1,451
New Urban Fire Stations 1 2 38 37
New Rural Fire Stations 30 116 968 1,417
Gap Analysis in %
No. of Fire Stations
Firefighting & Rescue Vehicle
Special Equipments
Firefighting Man Power
Gap in Operational Fire Stations 70% 92% 87%
Gap in Operational and new urban Fire Stations only 7% 71% 92% 87%
Total Gap in Operational, new (urban and rural) Fire Stations 70% 86% 97% 93%
Detailed Financial Investment plan
The other tasks include the development of Investment and financial plan, Institutional assessment & capacity building plan along with a Fire Decision Support System (FDSS). As
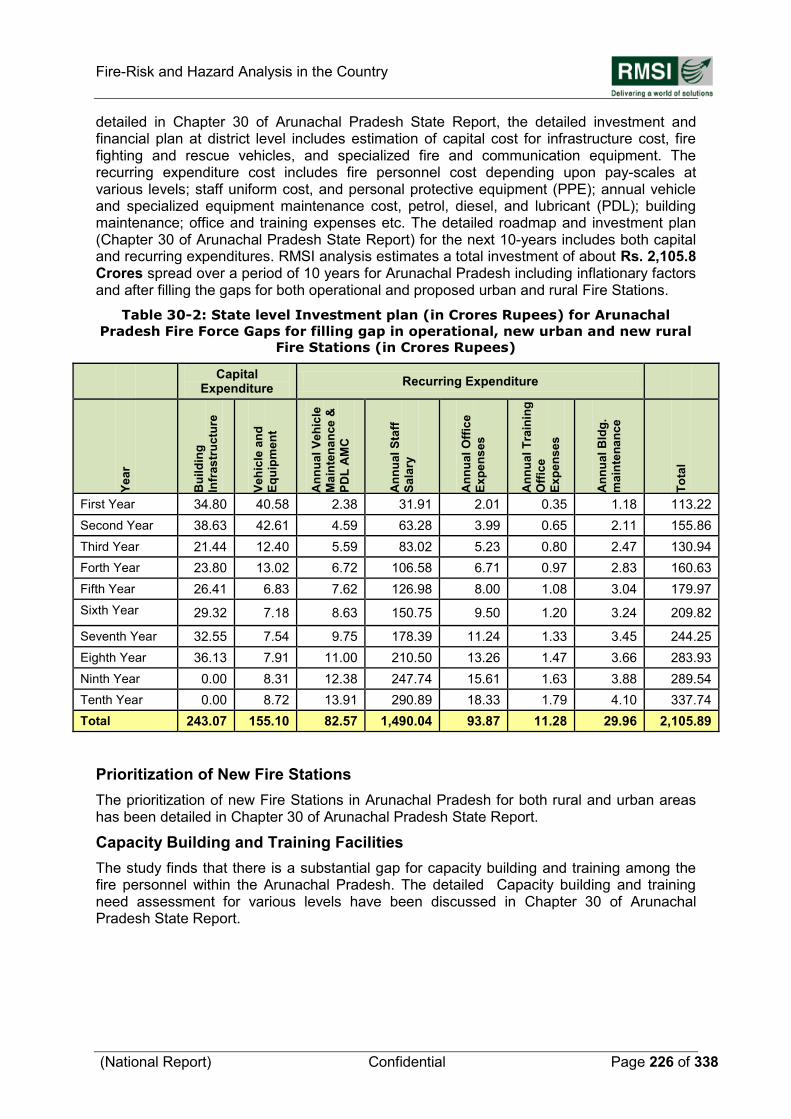
Fire-Risk and Hazard Analysis in the Country
(National Report) Confidential Page 226 of 338
detailed in Chapter 30 of Arunachal Pradesh State Report, the detailed investment and financial plan at district level includes estimation of capital cost for infrastructure cost, fire fighting and rescue vehicles, and specialized fire and communication equipment. The recurring expenditure cost includes fire personnel cost depending upon pay-scales at various levels; staff uniform cost, and personal protective equipment (PPE); annual vehicle and specialized equipment maintenance cost, petrol, diesel, and lubricant (PDL); building maintenance; office and training expenses etc. The detailed roadmap and investment plan (Chapter 30 of Arunachal Pradesh State Report) for the next 10-years includes both capital and recurring expenditures. RMSI analysis estimates a total investment of about Rs. 2,105.8 Crores spread over a period of 10 years for Arunachal Pradesh including inflationary factors and after filling the gaps for both operational and proposed urban and rural Fire Stations.
Table 30-2: State level Investment plan (in Crores Rupees) for Arunachal
Pradesh Fire Force Gaps for filling gap in operational, new urban and new rural
Fire Stations (in Crores Rupees)
Capital Expenditure
Recurring Expenditure
Ye
ar
Bu
ild
ing
Infr
as
tru
ctu
re
Ve
hic
le a
nd
Eq
uip
me
nt
An
nu
al
Ve
hic
le
Ma
inte
na
nce
&
PD
L A
MC
An
nu
al
Sta
ff
Sa
lary
An
nu
al
Off
ice
Ex
pe
ns
es
An
nu
al
Tra
inin
g
Off
ice
Ex
pe
ns
es
An
nu
al
Bld
g.
ma
inte
na
nc
e
To
tal
First Year 34.80 40.58 2.38 31.91 2.01 0.35 1.18 113.22
Second Year 38.63 42.61 4.59 63.28 3.99 0.65 2.11 155.86
Third Year 21.44 12.40 5.59 83.02 5.23 0.80 2.47 130.94
Forth Year 23.80 13.02 6.72 106.58 6.71 0.97 2.83 160.63
Fifth Year 26.41 6.83 7.62 126.98 8.00 1.08 3.04 179.97
Sixth Year 29.32 7.18 8.63 150.75 9.50 1.20 3.24 209.82
Seventh Year 32.55 7.54 9.75 178.39 11.24 1.33 3.45 244.25
Eighth Year 36.13 7.91 11.00 210.50 13.26 1.47 3.66 283.93
Ninth Year 0.00 8.31 12.38 247.74 15.61 1.63 3.88 289.54
Tenth Year 0.00 8.72 13.91 290.89 18.33 1.79 4.10 337.74
Total 243.07 155.10 82.57 1,490.04 93.87 11.28 29.96 2,105.89
Prioritization of New Fire Stations
The prioritization of new Fire Stations in Arunachal Pradesh for both rural and urban areas has been detailed in Chapter 30 of Arunachal Pradesh State Report.
Capacity Building and Training Facilities
The study finds that there is a substantial gap for capacity building and training among the fire personnel within the Arunachal Pradesh. The detailed Capacity building and training need assessment for various levels have been discussed in Chapter 30 of Arunachal Pradesh State Report.
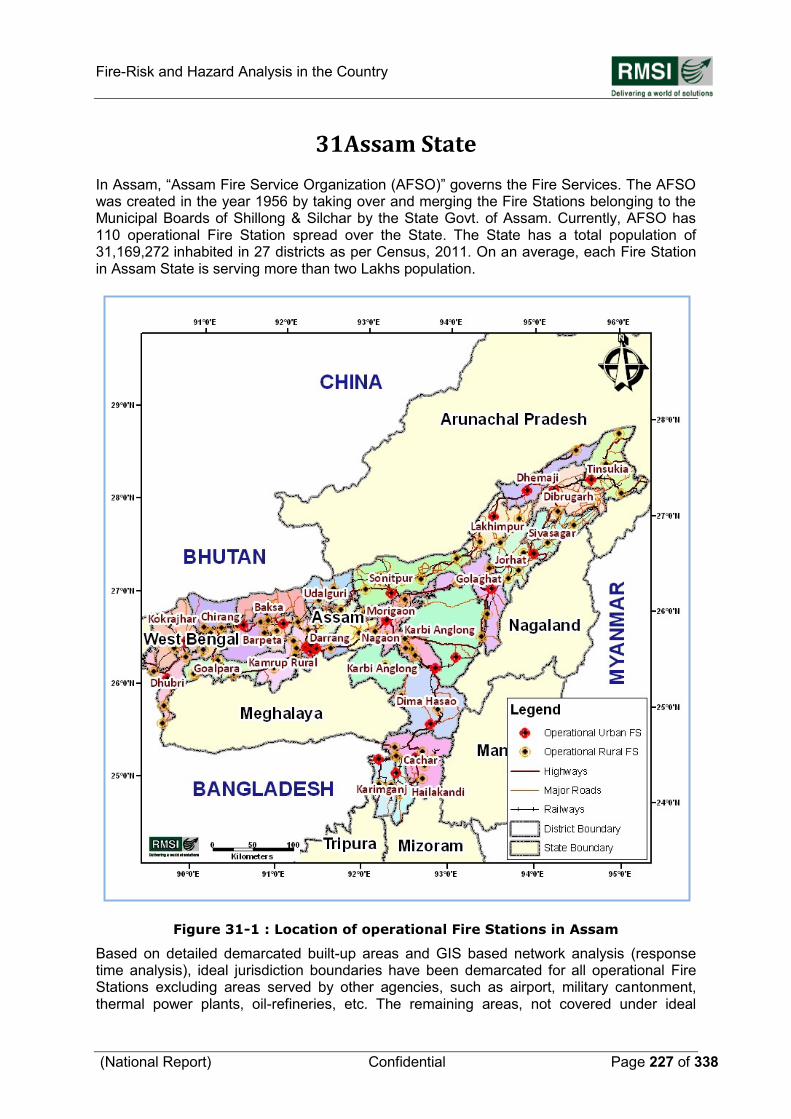
Fire-Risk and Hazard Analysis in the Country
(National Report) Confidential Page 227 of 338
31 Assam State
In Assam, “Assam Fire Service Organization (AFSO)” governs the Fire Services. The AFSO was created in the year 1956 by taking over and merging the Fire Stations belonging to the Municipal Boards of Shillong & Silchar by the State Govt. of Assam. Currently, AFSO has 110 operational Fire Station spread over the State. The State has a total population of 31,169,272 inhabited in 27 districts as per Census, 2011. On an average, each Fire Station in Assam State is serving more than two Lakhs population.
Figure 31-1 : Location of operational Fire Stations in Assam Based on detailed demarcated built-up areas and GIS based network analysis (response time analysis), ideal jurisdiction boundaries have been demarcated for all operational Fire Stations excluding areas served by other agencies, such as airport, military cantonment, thermal power plants, oil-refineries, etc. The remaining areas, not covered under ideal
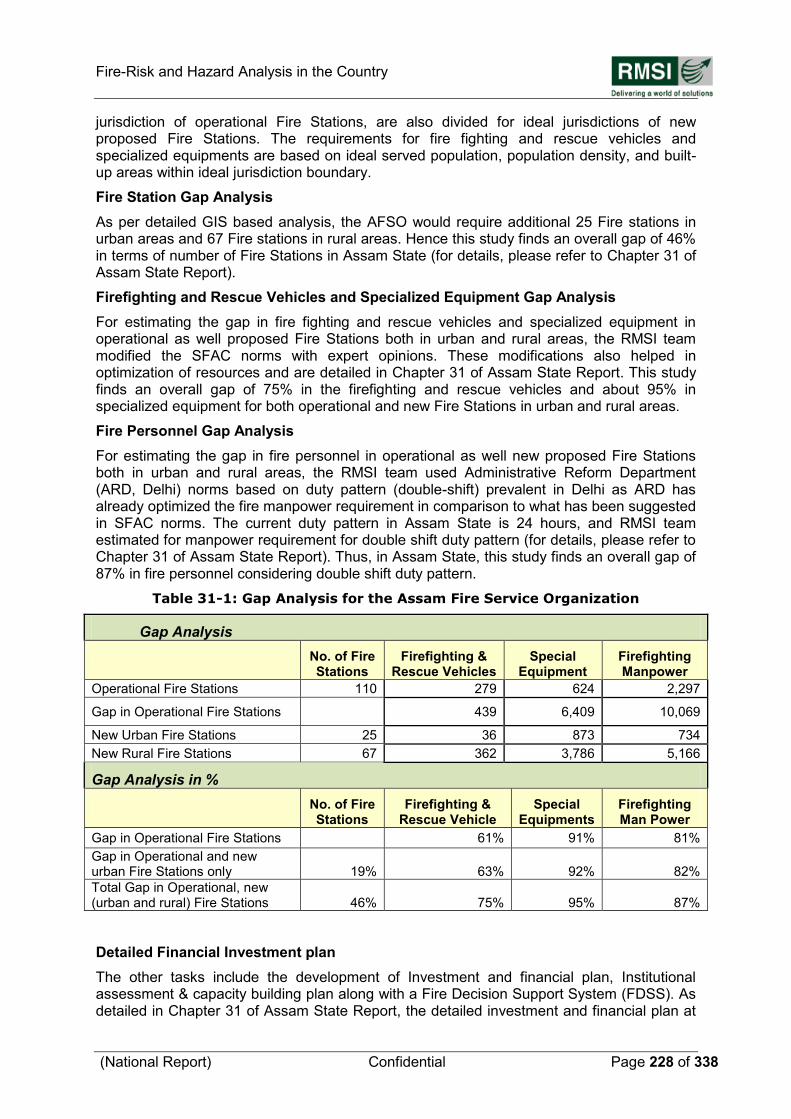
Fire-Risk and Hazard Analysis in the Country
(National Report) Confidential Page 228 of 338
jurisdiction of operational Fire Stations, are also divided for ideal jurisdictions of new proposed Fire Stations. The requirements for fire fighting and rescue vehicles and specialized equipments are based on ideal served population, population density, and built-up areas within ideal jurisdiction boundary.
Fire Station Gap Analysis
As per detailed GIS based analysis, the AFSO would require additional 25 Fire stations in urban areas and 67 Fire stations in rural areas. Hence this study finds an overall gap of 46% in terms of number of Fire Stations in Assam State (for details, please refer to Chapter 31 of Assam State Report).
Firefighting and Rescue Vehicles and Specialized Equipment Gap Analysis
For estimating the gap in fire fighting and rescue vehicles and specialized equipment in operational as well proposed Fire Stations both in urban and rural areas, the RMSI team modified the SFAC norms with expert opinions. These modifications also helped in optimization of resources and are detailed in Chapter 31 of Assam State Report. This study finds an overall gap of 75% in the firefighting and rescue vehicles and about 95% in specialized equipment for both operational and new Fire Stations in urban and rural areas.
Fire Personnel Gap Analysis
For estimating the gap in fire personnel in operational as well new proposed Fire Stations both in urban and rural areas, the RMSI team used Administrative Reform Department (ARD, Delhi) norms based on duty pattern (double-shift) prevalent in Delhi as ARD has already optimized the fire manpower requirement in comparison to what has been suggested in SFAC norms. The current duty pattern in Assam State is 24 hours, and RMSI team estimated for manpower requirement for double shift duty pattern (for details, please refer to Chapter 31 of Assam State Report). Thus, in Assam State, this study finds an overall gap of 87% in fire personnel considering double shift duty pattern.
Table 31-1: Gap Analysis for the Assam Fire Service Organization
Gap Analysis
No. of Fire Stations
Firefighting & Rescue Vehicles
Special Equipment
Firefighting Manpower
Operational Fire Stations 110 279 624 2,297
Gap in Operational Fire Stations 439 6,409 10,069
New Urban Fire Stations 25 36 873 734
New Rural Fire Stations 67 362 3,786 5,166
Gap Analysis in %
No. of Fire Stations
Firefighting & Rescue Vehicle
Special Equipments
Firefighting Man Power
Gap in Operational Fire Stations 61% 91% 81%
Gap in Operational and new urban Fire Stations only 19% 63% 92% 82%
Total Gap in Operational, new (urban and rural) Fire Stations 46% 75% 95% 87%
Detailed Financial Investment plan
The other tasks include the development of Investment and financial plan, Institutional assessment & capacity building plan along with a Fire Decision Support System (FDSS). As detailed in Chapter 31 of Assam State Report, the detailed investment and financial plan at
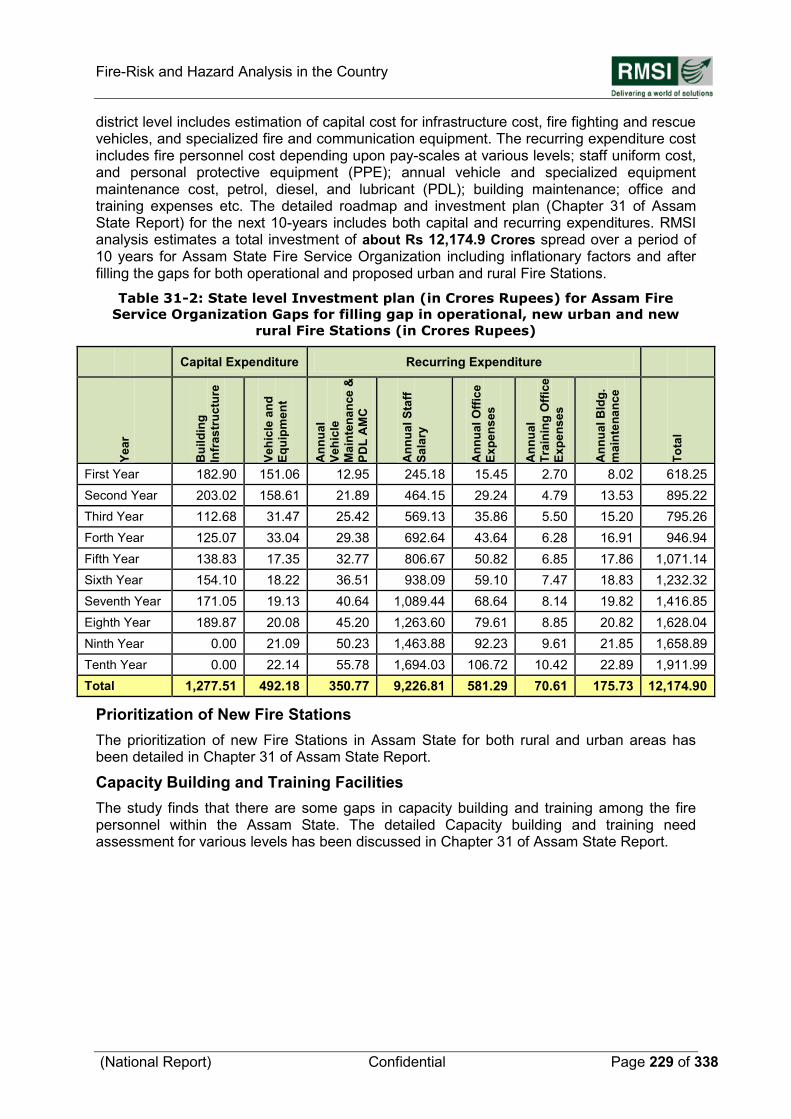
Fire-Risk and Hazard Analysis in the Country
(National Report) Confidential Page 229 of 338
district level includes estimation of capital cost for infrastructure cost, fire fighting and rescue vehicles, and specialized fire and communication equipment. The recurring expenditure cost includes fire personnel cost depending upon pay-scales at various levels; staff uniform cost, and personal protective equipment (PPE); annual vehicle and specialized equipment maintenance cost, petrol, diesel, and lubricant (PDL); building maintenance; office and training expenses etc. The detailed roadmap and investment plan (Chapter 31 of Assam State Report) for the next 10-years includes both capital and recurring expenditures. RMSI analysis estimates a total investment of about Rs 12,174.9 Crores spread over a period of 10 years for Assam State Fire Service Organization including inflationary factors and after filling the gaps for both operational and proposed urban and rural Fire Stations.
Table 31-2: State level Investment plan (in Crores Rupees) for Assam Fire
Service Organization Gaps for filling gap in operational, new urban and new
rural Fire Stations (in Crores Rupees)
Capital Expenditure Recurring Expenditure
Ye
ar
Bu
ild
ing
Infr
as
tru
ctu
re
Ve
hic
le a
nd
Eq
uip
me
nt
An
nu
al
Ve
hic
le
Ma
inte
na
nce
&
PD
L A
MC
An
nu
al
Sta
ff
Sa
lary
An
nu
al
Off
ice
Ex
pe
ns
es
An
nu
al
Tra
inin
g O
ffic
e
Ex
pe
ns
es
An
nu
al
Bld
g.
ma
inte
na
nc
e
To
tal
First Year 182.90 151.06 12.95 245.18 15.45 2.70 8.02 618.25
Second Year 203.02 158.61 21.89 464.15 29.24 4.79 13.53 895.22
Third Year 112.68 31.47 25.42 569.13 35.86 5.50 15.20 795.26
Forth Year 125.07 33.04 29.38 692.64 43.64 6.28 16.91 946.94
Fifth Year 138.83 17.35 32.77 806.67 50.82 6.85 17.86 1,071.14
Sixth Year 154.10 18.22 36.51 938.09 59.10 7.47 18.83 1,232.32
Seventh Year 171.05 19.13 40.64 1,089.44 68.64 8.14 19.82 1,416.85
Eighth Year 189.87 20.08 45.20 1,263.60 79.61 8.85 20.82 1,628.04
Ninth Year 0.00 21.09 50.23 1,463.88 92.23 9.61 21.85 1,658.89
Tenth Year 0.00 22.14 55.78 1,694.03 106.72 10.42 22.89 1,911.99
Total 1,277.51 492.18 350.77 9,226.81 581.29 70.61 175.73 12,174.90
Prioritization of New Fire Stations
The prioritization of new Fire Stations in Assam State for both rural and urban areas has been detailed in Chapter 31 of Assam State Report.
Capacity Building and Training Facilities
The study finds that there are some gaps in capacity building and training among the fire personnel within the Assam State. The detailed Capacity building and training need assessment for various levels has been discussed in Chapter 31 of Assam State Report.
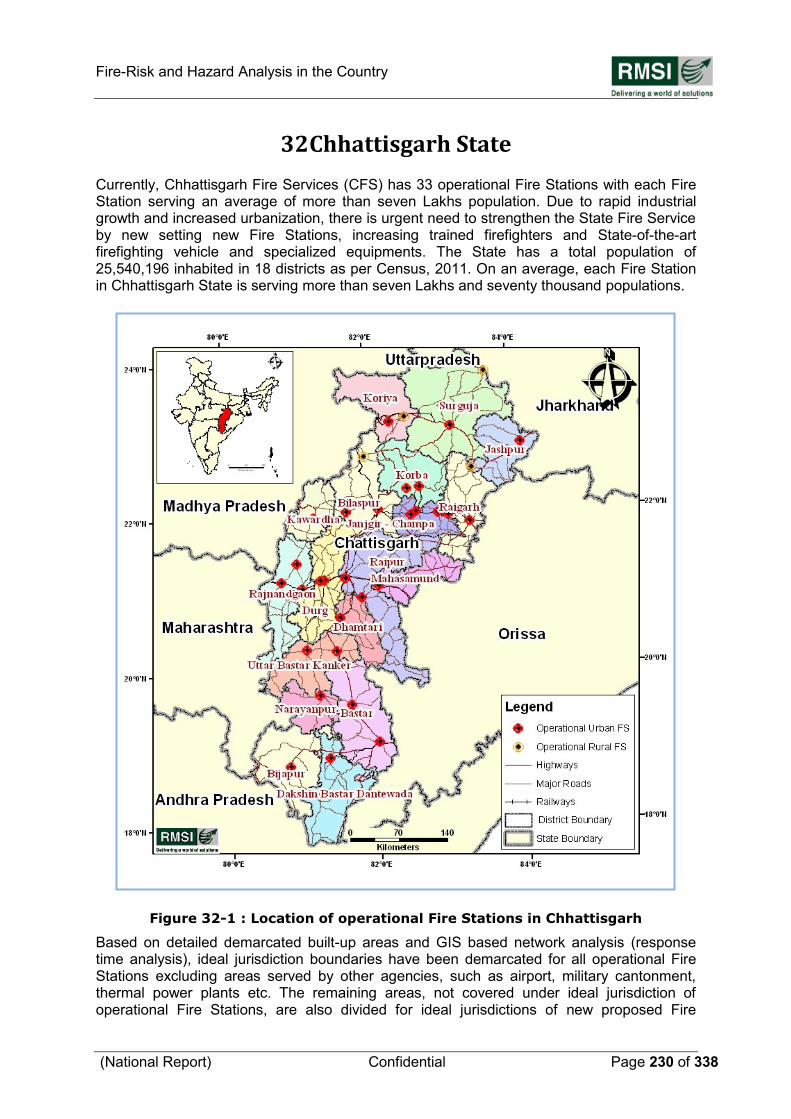
Fire-Risk and Hazard Analysis in the Country
(National Report) Confidential Page 230 of 338
32 Chhattisgarh State
Currently, Chhattisgarh Fire Services (CFS) has 33 operational Fire Stations with each Fire Station serving an average of more than seven Lakhs population. Due to rapid industrial growth and increased urbanization, there is urgent need to strengthen the State Fire Service by new setting new Fire Stations, increasing trained firefighters and State-of-the-art firefighting vehicle and specialized equipments. The State has a total population of 25,540,196 inhabited in 18 districts as per Census, 2011. On an average, each Fire Station in Chhattisgarh State is serving more than seven Lakhs and seventy thousand populations.
Figure 32-1 : Location of operational Fire Stations in Chhattisgarh Based on detailed demarcated built-up areas and GIS based network analysis (response time analysis), ideal jurisdiction boundaries have been demarcated for all operational Fire Stations excluding areas served by other agencies, such as airport, military cantonment, thermal power plants etc. The remaining areas, not covered under ideal jurisdiction of operational Fire Stations, are also divided for ideal jurisdictions of new proposed Fire

Fire-Risk and Hazard Analysis in the Country
(National Report) Confidential Page 231 of 338
Stations. The requirements for fire fighting and rescue vehicles and specialized equipments are based on ideal served population, population density, and built-up areas within ideal jurisdiction boundary.
Fire Station Gap Analysis
As per detailed GIS based analysis, the Chhattisgarh Fire Service would require additional 14 Fire Stations in urban areas and 103 Fire Stations in rural areas. Hence this study finds an overall gap of 78% in terms of number of Fire Stations in Chhattisgarh State (for details, please refer to Chapter 32 of Chhattisgarh State Report).
Firefighting and Rescue Vehicles and Specialized Equipment Gap Analysis
For estimating the gap in fire fighting and rescue vehicles and specialized equipment in operational as well proposed Fire Stations both in urban and rural areas, the RMSI team modified the SFAC norms with expert opinions. These modifications also helped in optimization of resources and are detailed in Chapter 32 of Chhattisgarh State Report. This study finds an overall gap of 93% in the firefighting and rescue vehicles and about 98% in specialized equipment for both operational and new Fire Stations in urban and rural areas.
Fire Personnel Gap Analysis
For estimating the gap in fire personnel in operational as well new proposed Fire Stations both in urban and rural areas, the RMSI team used Administrative Reform Department (ARD, Delhi) norms based on duty pattern (double-shift) prevalent in Delhi as ARD has already optimized the fire manpower requirement in comparison to what has been suggested in SFAC norms. The current duty pattern for firefighters in Chhattisgarh State is generally 8 hours (3-shift), and RMSI team has estimated for manpower requirement for double shift duty pattern (for details, please refer to Chapter 32 of Chhattisgarh State Report). Thus, in Chhattisgarh State, this study finds an overall gap of 97% in fire personnel considering double shift duty pattern.
Table 32-1: Gap Analysis for the Chhattisgarh Fire Services
Gap Analysis
No. of Fire Stations
Firefighting & Rescue Vehicles
Special Equipment
Firefighting Manpower
Operational Fire Stations 33 59 153 125
Gap in Operational Fire Stations 158 1,828 882
New Urban Fire Stations 14 47 768 220
New Rural Fire Stations 103 603 6,397 2,790
Gap Analysis in %
No. of Fire Stations
Firefighting & Rescue Vehicle
Special Equipments
Firefighting Man Power
Gap in Operational Fire Stations 73% 92% 88%
Gap in Operational and new urban Fire Stations only 30% 78% 94% 90%
Total Gap in Operational, new (urban and rural) Fire Stations 78% 93% 98% 97%
Detailed Financial Investment plan
The other tasks include the development of Investment and financial plan, Institutional assessment & capacity building plan along with a Fire Decision Support System (FDSS). As detailed in Chapter 32 of Chhattisgarh State Report, the detailed investment and financial
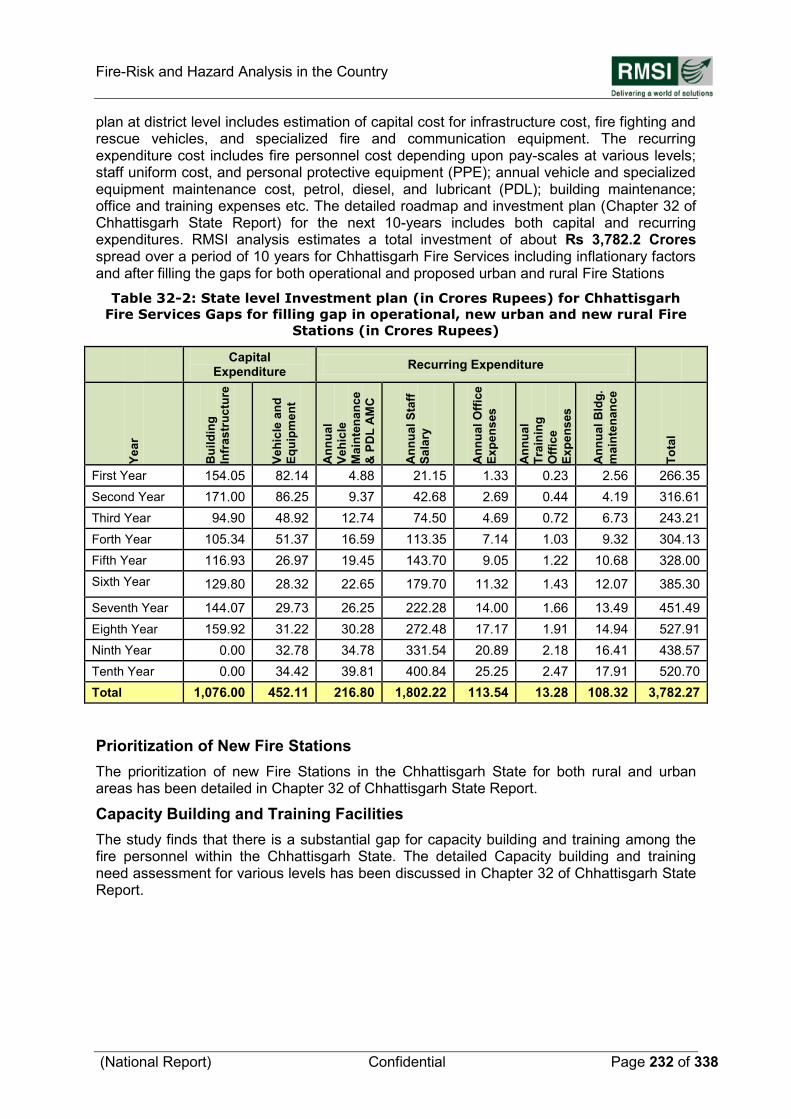
Fire-Risk and Hazard Analysis in the Country
(National Report) Confidential Page 232 of 338
plan at district level includes estimation of capital cost for infrastructure cost, fire fighting and rescue vehicles, and specialized fire and communication equipment. The recurring expenditure cost includes fire personnel cost depending upon pay-scales at various levels; staff uniform cost, and personal protective equipment (PPE); annual vehicle and specialized equipment maintenance cost, petrol, diesel, and lubricant (PDL); building maintenance; office and training expenses etc. The detailed roadmap and investment plan (Chapter 32 of Chhattisgarh State Report) for the next 10-years includes both capital and recurring expenditures. RMSI analysis estimates a total investment of about Rs 3,782.2 Crores spread over a period of 10 years for Chhattisgarh Fire Services including inflationary factors and after filling the gaps for both operational and proposed urban and rural Fire Stations
Table 32-2: State level Investment plan (in Crores Rupees) for Chhattisgarh
Fire Services Gaps for filling gap in operational, new urban and new rural Fire
Stations (in Crores Rupees)
Capital Expenditure
Recurring Expenditure
Ye
ar
Bu
ild
ing
Infr
as
tru
ctu
re
Ve
hic
le a
nd
Eq
uip
me
nt
An
nu
al
Ve
hic
le
Ma
inte
na
nce
& P
DL
AM
C
An
nu
al
Sta
ff
Sa
lary
An
nu
al
Off
ice
Ex
pe
ns
es
An
nu
al
Tra
inin
g
Off
ice
Ex
pe
ns
es
An
nu
al
Bld
g.
ma
inte
na
nc
e
To
tal
First Year 154.05 82.14 4.88 21.15 1.33 0.23 2.56 266.35
Second Year 171.00 86.25 9.37 42.68 2.69 0.44 4.19 316.61
Third Year 94.90 48.92 12.74 74.50 4.69 0.72 6.73 243.21
Forth Year 105.34 51.37 16.59 113.35 7.14 1.03 9.32 304.13
Fifth Year 116.93 26.97 19.45 143.70 9.05 1.22 10.68 328.00
Sixth Year 129.80 28.32 22.65 179.70 11.32 1.43 12.07 385.30
Seventh Year 144.07 29.73 26.25 222.28 14.00 1.66 13.49 451.49
Eighth Year 159.92 31.22 30.28 272.48 17.17 1.91 14.94 527.91
Ninth Year 0.00 32.78 34.78 331.54 20.89 2.18 16.41 438.57
Tenth Year 0.00 34.42 39.81 400.84 25.25 2.47 17.91 520.70
Total 1,076.00 452.11 216.80 1,802.22 113.54 13.28 108.32 3,782.27
Prioritization of New Fire Stations
The prioritization of new Fire Stations in the Chhattisgarh State for both rural and urban areas has been detailed in Chapter 32 of Chhattisgarh State Report.
Capacity Building and Training Facilities
The study finds that there is a substantial gap for capacity building and training among the fire personnel within the Chhattisgarh State. The detailed Capacity building and training need assessment for various levels has been discussed in Chapter 32 of Chhattisgarh State Report.
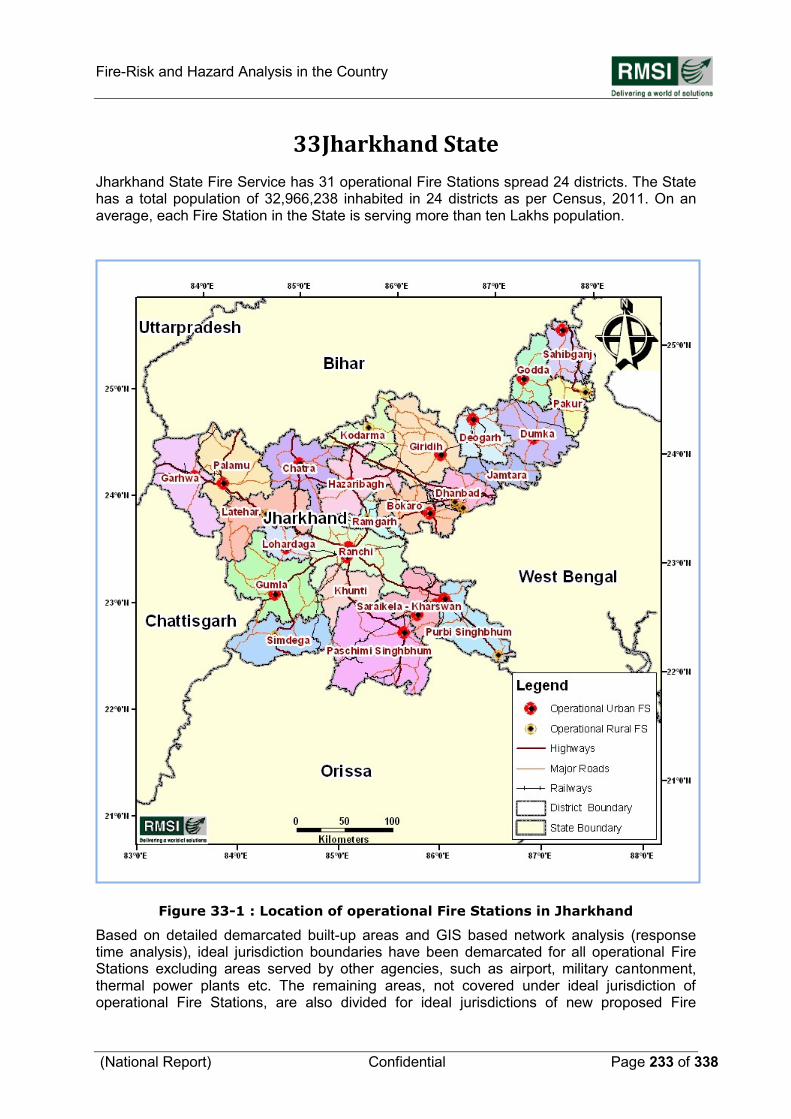
Fire-Risk and Hazard Analysis in the Country
(National Report) Confidential Page 233 of 338
33 Jharkhand State
Jharkhand State Fire Service has 31 operational Fire Stations spread 24 districts. The State has a total population of 32,966,238 inhabited in 24 districts as per Census, 2011. On an average, each Fire Station in the State is serving more than ten Lakhs population.
Figure 33-1 : Location of operational Fire Stations in Jharkhand Based on detailed demarcated built-up areas and GIS based network analysis (response time analysis), ideal jurisdiction boundaries have been demarcated for all operational Fire Stations excluding areas served by other agencies, such as airport, military cantonment, thermal power plants etc. The remaining areas, not covered under ideal jurisdiction of operational Fire Stations, are also divided for ideal jurisdictions of new proposed Fire
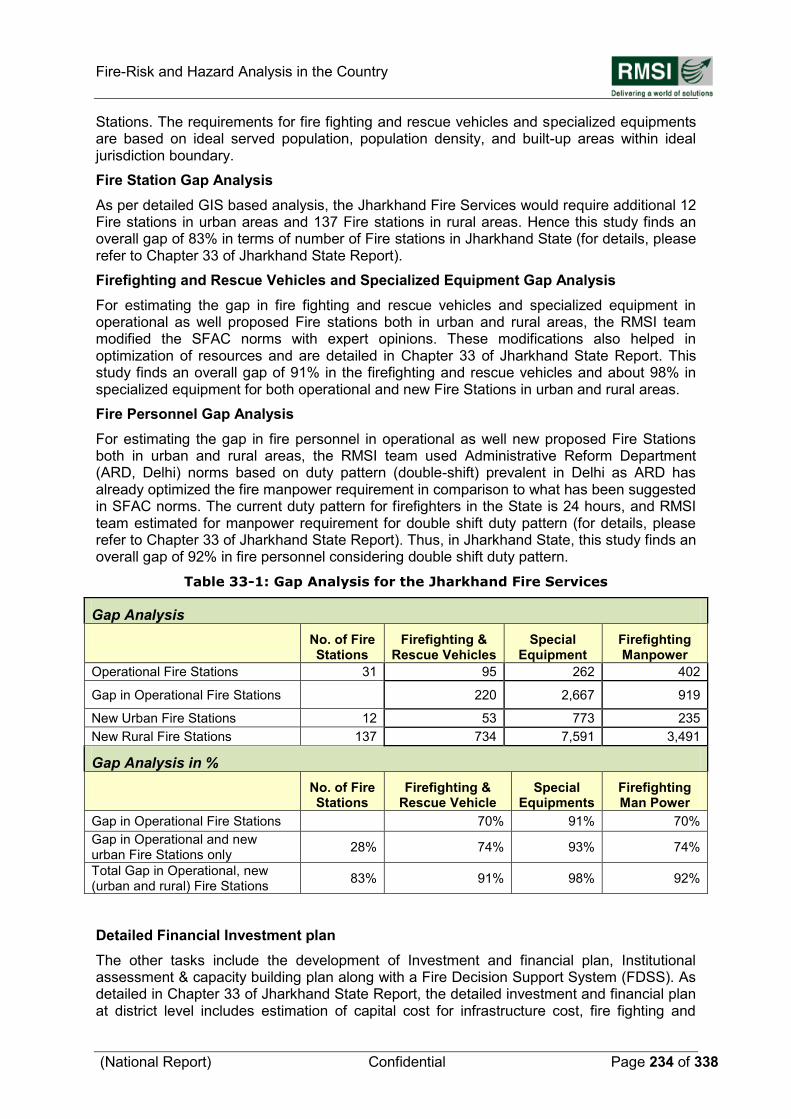
Fire-Risk and Hazard Analysis in the Country
(National Report) Confidential Page 234 of 338
Stations. The requirements for fire fighting and rescue vehicles and specialized equipments are based on ideal served population, population density, and built-up areas within ideal jurisdiction boundary.
Fire Station Gap Analysis
As per detailed GIS based analysis, the Jharkhand Fire Services would require additional 12 Fire stations in urban areas and 137 Fire stations in rural areas. Hence this study finds an overall gap of 83% in terms of number of Fire stations in Jharkhand State (for details, please refer to Chapter 33 of Jharkhand State Report).
Firefighting and Rescue Vehicles and Specialized Equipment Gap Analysis
For estimating the gap in fire fighting and rescue vehicles and specialized equipment in operational as well proposed Fire stations both in urban and rural areas, the RMSI team modified the SFAC norms with expert opinions. These modifications also helped in optimization of resources and are detailed in Chapter 33 of Jharkhand State Report. This study finds an overall gap of 91% in the firefighting and rescue vehicles and about 98% in specialized equipment for both operational and new Fire Stations in urban and rural areas.
Fire Personnel Gap Analysis
For estimating the gap in fire personnel in operational as well new proposed Fire Stations both in urban and rural areas, the RMSI team used Administrative Reform Department (ARD, Delhi) norms based on duty pattern (double-shift) prevalent in Delhi as ARD has already optimized the fire manpower requirement in comparison to what has been suggested in SFAC norms. The current duty pattern for firefighters in the State is 24 hours, and RMSI team estimated for manpower requirement for double shift duty pattern (for details, please refer to Chapter 33 of Jharkhand State Report). Thus, in Jharkhand State, this study finds an overall gap of 92% in fire personnel considering double shift duty pattern.
Table 33-1: Gap Analysis for the Jharkhand Fire Services
Gap Analysis
No. of Fire Stations
Firefighting & Rescue Vehicles
Special Equipment
Firefighting Manpower
Operational Fire Stations 31 95 262 402
Gap in Operational Fire Stations 220 2,667 919
New Urban Fire Stations 12 53 773 235
New Rural Fire Stations 137 734 7,591 3,491
Gap Analysis in %
No. of Fire Stations
Firefighting & Rescue Vehicle
Special Equipments
Firefighting Man Power
Gap in Operational Fire Stations 70% 91% 70%
Gap in Operational and new urban Fire Stations only
28% 74% 93% 74%
Total Gap in Operational, new (urban and rural) Fire Stations
83% 91% 98% 92%
Detailed Financial Investment plan
The other tasks include the development of Investment and financial plan, Institutional assessment & capacity building plan along with a Fire Decision Support System (FDSS). As detailed in Chapter 33 of Jharkhand State Report, the detailed investment and financial plan at district level includes estimation of capital cost for infrastructure cost, fire fighting and
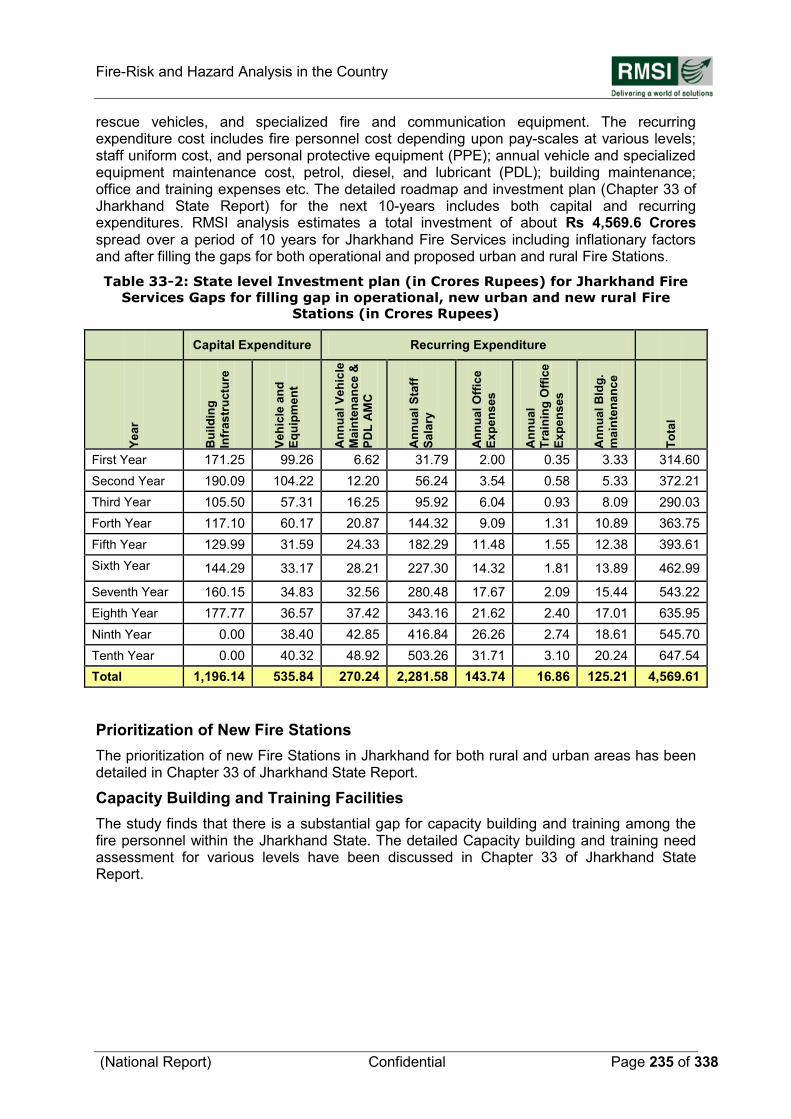
Fire-Risk and Hazard Analysis in the Country
(National Report) Confidential Page 235 of 338
rescue vehicles, and specialized fire and communication equipment. The recurring expenditure cost includes fire personnel cost depending upon pay-scales at various levels; staff uniform cost, and personal protective equipment (PPE); annual vehicle and specialized equipment maintenance cost, petrol, diesel, and lubricant (PDL); building maintenance; office and training expenses etc. The detailed roadmap and investment plan (Chapter 33 of Jharkhand State Report) for the next 10-years includes both capital and recurring expenditures. RMSI analysis estimates a total investment of about Rs 4,569.6 Crores spread over a period of 10 years for Jharkhand Fire Services including inflationary factors and after filling the gaps for both operational and proposed urban and rural Fire Stations.
Table 33-2: State level Investment plan (in Crores Rupees) for Jharkhand Fire
Services Gaps for filling gap in operational, new urban and new rural Fire
Stations (in Crores Rupees)
Capital Expenditure Recurring Expenditure
Ye
ar
Bu
ild
ing
Infr
as
tru
ctu
re
Ve
hic
le a
nd
Eq
uip
me
nt
An
nu
al
Ve
hic
le
Ma
inte
na
nce
&
PD
L A
MC
An
nu
al
Sta
ff
Sa
lary
An
nu
al
Off
ice
Ex
pe
ns
es
An
nu
al
Tra
inin
g O
ffic
e
Ex
pe
ns
es
An
nu
al
Bld
g.
ma
inte
na
nc
e
To
tal
First Year 171.25 99.26 6.62 31.79 2.00 0.35 3.33 314.60
Second Year 190.09 104.22 12.20 56.24 3.54 0.58 5.33 372.21
Third Year 105.50 57.31 16.25 95.92 6.04 0.93 8.09 290.03
Forth Year 117.10 60.17 20.87 144.32 9.09 1.31 10.89 363.75
Fifth Year 129.99 31.59 24.33 182.29 11.48 1.55 12.38 393.61
Sixth Year 144.29 33.17 28.21 227.30 14.32 1.81 13.89 462.99
Seventh Year 160.15 34.83 32.56 280.48 17.67 2.09 15.44 543.22
Eighth Year 177.77 36.57 37.42 343.16 21.62 2.40 17.01 635.95
Ninth Year 0.00 38.40 42.85 416.84 26.26 2.74 18.61 545.70
Tenth Year 0.00 40.32 48.92 503.26 31.71 3.10 20.24 647.54
Total 1,196.14 535.84 270.24 2,281.58 143.74 16.86 125.21 4,569.61
Prioritization of New Fire Stations
The prioritization of new Fire Stations in Jharkhand for both rural and urban areas has been detailed in Chapter 33 of Jharkhand State Report.
Capacity Building and Training Facilities
The study finds that there is a substantial gap for capacity building and training among the fire personnel within the Jharkhand State. The detailed Capacity building and training need assessment for various levels have been discussed in Chapter 33 of Jharkhand State Report.
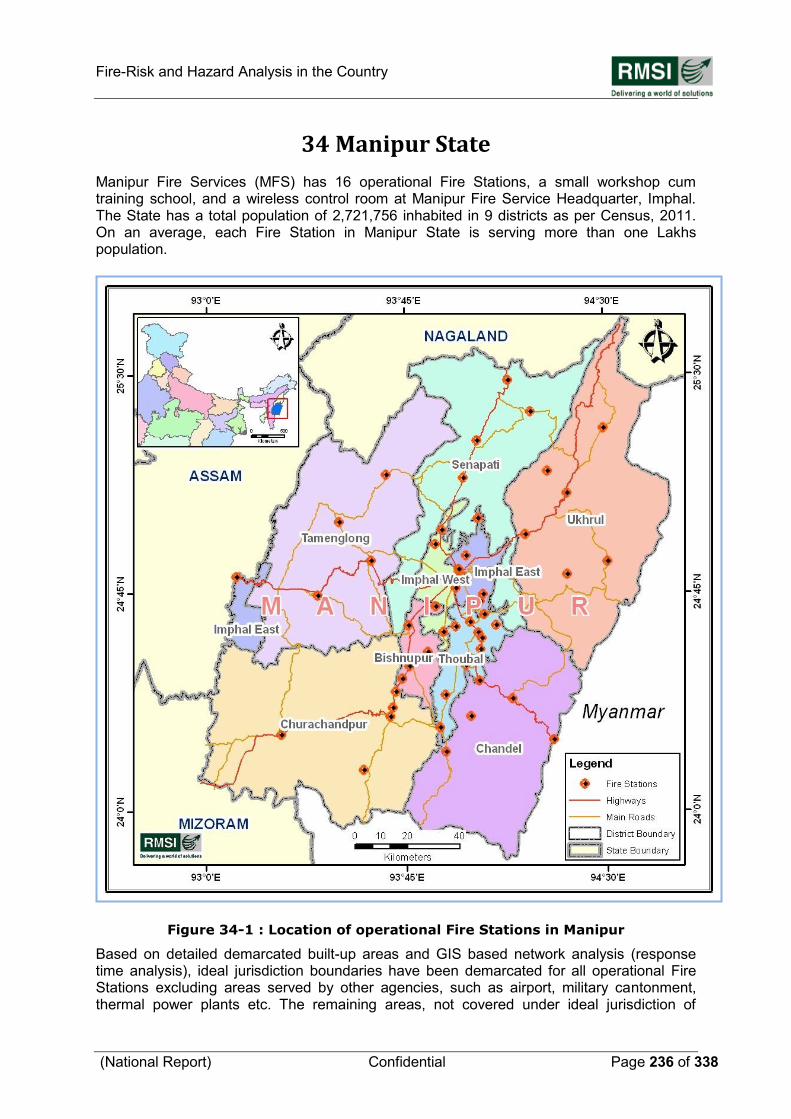
Fire-Risk and Hazard Analysis in the Country
(National Report) Confidential Page 236 of 338
34 Manipur State
Manipur Fire Services (MFS) has 16 operational Fire Stations, a small workshop cum training school, and a wireless control room at Manipur Fire Service Headquarter, Imphal. The State has a total population of 2,721,756 inhabited in 9 districts as per Census, 2011. On an average, each Fire Station in Manipur State is serving more than one Lakhs population.
Figure 34-1 : Location of operational Fire Stations in Manipur Based on detailed demarcated built-up areas and GIS based network analysis (response time analysis), ideal jurisdiction boundaries have been demarcated for all operational Fire Stations excluding areas served by other agencies, such as airport, military cantonment, thermal power plants etc. The remaining areas, not covered under ideal jurisdiction of
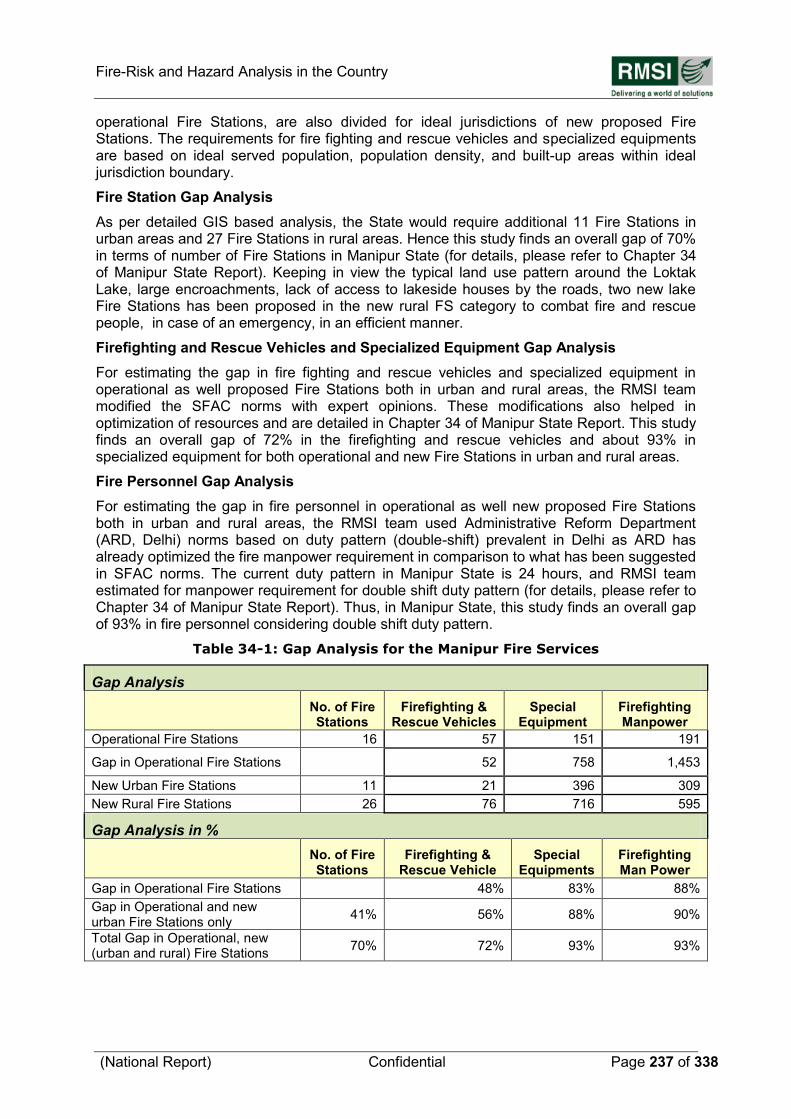
Fire-Risk and Hazard Analysis in the Country
(National Report) Confidential Page 237 of 338
operational Fire Stations, are also divided for ideal jurisdictions of new proposed Fire Stations. The requirements for fire fighting and rescue vehicles and specialized equipments are based on ideal served population, population density, and built-up areas within ideal jurisdiction boundary.
Fire Station Gap Analysis
As per detailed GIS based analysis, the State would require additional 11 Fire Stations in urban areas and 27 Fire Stations in rural areas. Hence this study finds an overall gap of 70% in terms of number of Fire Stations in Manipur State (for details, please refer to Chapter 34 of Manipur State Report). Keeping in view the typical land use pattern around the Loktak Lake, large encroachments, lack of access to lakeside houses by the roads, two new lake Fire Stations has been proposed in the new rural FS category to combat fire and rescue people, in case of an emergency, in an efficient manner.
Firefighting and Rescue Vehicles and Specialized Equipment Gap Analysis
For estimating the gap in fire fighting and rescue vehicles and specialized equipment in operational as well proposed Fire Stations both in urban and rural areas, the RMSI team modified the SFAC norms with expert opinions. These modifications also helped in optimization of resources and are detailed in Chapter 34 of Manipur State Report. This study finds an overall gap of 72% in the firefighting and rescue vehicles and about 93% in specialized equipment for both operational and new Fire Stations in urban and rural areas.
Fire Personnel Gap Analysis
For estimating the gap in fire personnel in operational as well new proposed Fire Stations both in urban and rural areas, the RMSI team used Administrative Reform Department (ARD, Delhi) norms based on duty pattern (double-shift) prevalent in Delhi as ARD has already optimized the fire manpower requirement in comparison to what has been suggested in SFAC norms. The current duty pattern in Manipur State is 24 hours, and RMSI team estimated for manpower requirement for double shift duty pattern (for details, please refer to Chapter 34 of Manipur State Report). Thus, in Manipur State, this study finds an overall gap of 93% in fire personnel considering double shift duty pattern.
Table 34-1: Gap Analysis for the Manipur Fire Services
Gap Analysis
No. of Fire Stations
Firefighting & Rescue Vehicles
Special Equipment
Firefighting Manpower
Operational Fire Stations 16 57 151 191
Gap in Operational Fire Stations 52 758 1,453
New Urban Fire Stations 11 21 396 309
New Rural Fire Stations 26 76 716 595
Gap Analysis in %
No. of Fire Stations
Firefighting & Rescue Vehicle
Special Equipments
Firefighting Man Power
Gap in Operational Fire Stations 48% 83% 88%
Gap in Operational and new urban Fire Stations only
41% 56% 88% 90%
Total Gap in Operational, new (urban and rural) Fire Stations
70% 72% 93% 93%
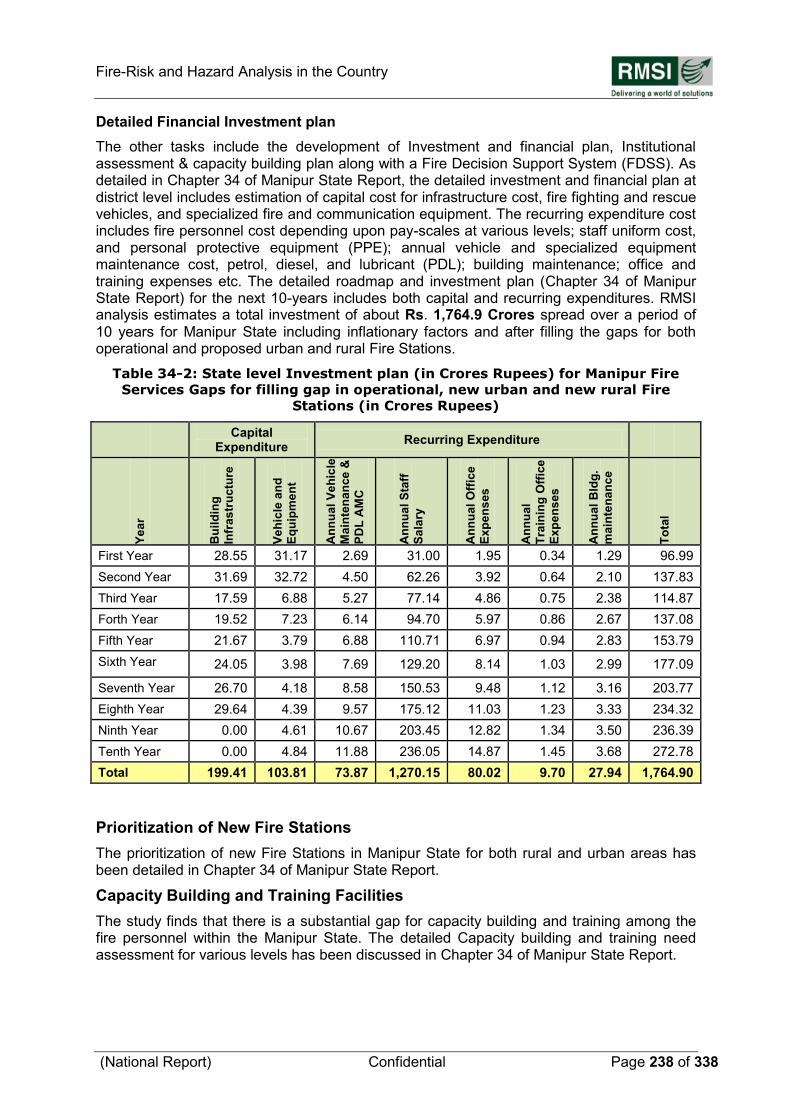
Fire-Risk and Hazard Analysis in the Country
(National Report) Confidential Page 238 of 338
Detailed Financial Investment plan
The other tasks include the development of Investment and financial plan, Institutional assessment & capacity building plan along with a Fire Decision Support System (FDSS). As detailed in Chapter 34 of Manipur State Report, the detailed investment and financial plan at district level includes estimation of capital cost for infrastructure cost, fire fighting and rescue vehicles, and specialized fire and communication equipment. The recurring expenditure cost includes fire personnel cost depending upon pay-scales at various levels; staff uniform cost, and personal protective equipment (PPE); annual vehicle and specialized equipment maintenance cost, petrol, diesel, and lubricant (PDL); building maintenance; office and training expenses etc. The detailed roadmap and investment plan (Chapter 34 of Manipur State Report) for the next 10-years includes both capital and recurring expenditures. RMSI analysis estimates a total investment of about Rs. 1,764.9 Crores spread over a period of 10 years for Manipur State including inflationary factors and after filling the gaps for both operational and proposed urban and rural Fire Stations.
Table 34-2: State level Investment plan (in Crores Rupees) for Manipur Fire
Services Gaps for filling gap in operational, new urban and new rural Fire
Stations (in Crores Rupees)
Capital Expenditure
Recurring Expenditure
Ye
ar
Bu
ild
ing
Infr
as
tru
ctu
re
Ve
hic
le a
nd
Eq
uip
me
nt
An
nu
al
Ve
hic
le
Ma
inte
na
nce
&
PD
L A
MC
An
nu
al
Sta
ff
Sa
lary
An
nu
al
Off
ice
Ex
pe
ns
es
An
nu
al
Tra
inin
g O
ffic
e
Ex
pe
ns
es
An
nu
al
Bld
g.
ma
inte
na
nc
e
To
tal
First Year 28.55 31.17 2.69 31.00 1.95 0.34 1.29 96.99
Second Year 31.69 32.72 4.50 62.26 3.92 0.64 2.10 137.83
Third Year 17.59 6.88 5.27 77.14 4.86 0.75 2.38 114.87
Forth Year 19.52 7.23 6.14 94.70 5.97 0.86 2.67 137.08
Fifth Year 21.67 3.79 6.88 110.71 6.97 0.94 2.83 153.79
Sixth Year 24.05 3.98 7.69 129.20 8.14 1.03 2.99 177.09
Seventh Year 26.70 4.18 8.58 150.53 9.48 1.12 3.16 203.77
Eighth Year 29.64 4.39 9.57 175.12 11.03 1.23 3.33 234.32
Ninth Year 0.00 4.61 10.67 203.45 12.82 1.34 3.50 236.39
Tenth Year 0.00 4.84 11.88 236.05 14.87 1.45 3.68 272.78
Total 199.41 103.81 73.87 1,270.15 80.02 9.70 27.94 1,764.90
Prioritization of New Fire Stations
The prioritization of new Fire Stations in Manipur State for both rural and urban areas has been detailed in Chapter 34 of Manipur State Report.
Capacity Building and Training Facilities
The study finds that there is a substantial gap for capacity building and training among the fire personnel within the Manipur State. The detailed Capacity building and training need assessment for various levels has been discussed in Chapter 34 of Manipur State Report.
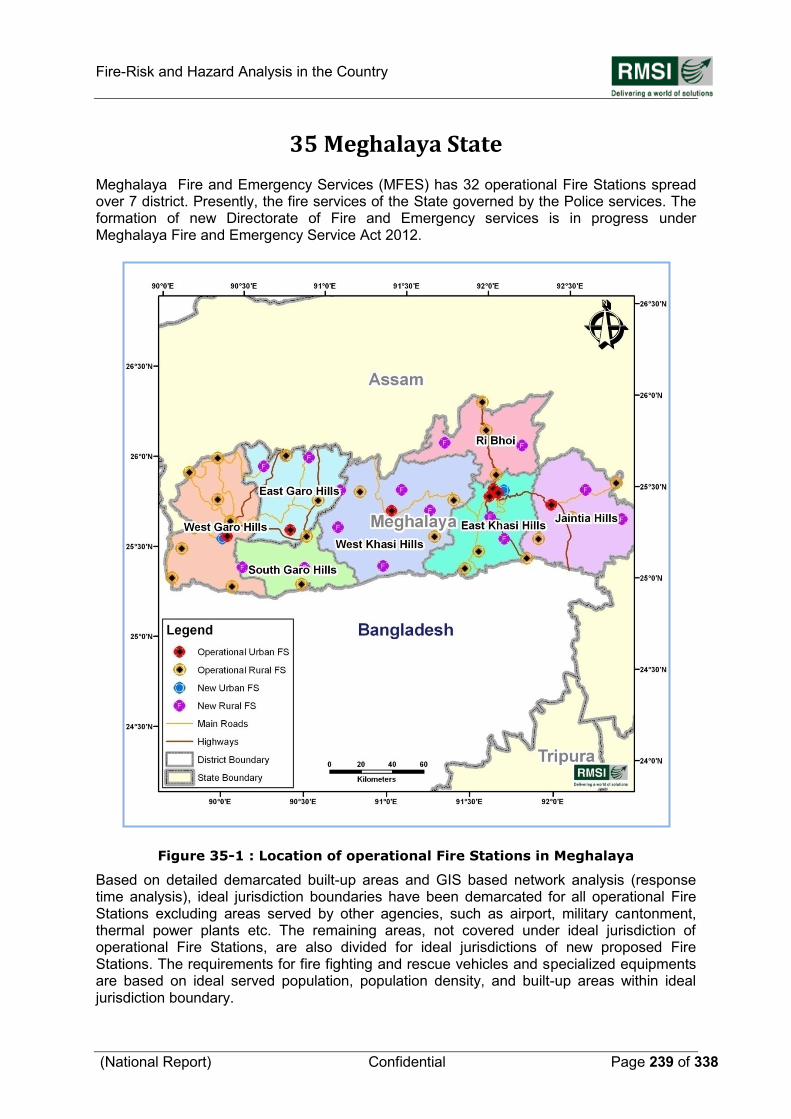
Fire-Risk and Hazard Analysis in the Country
(National Report) Confidential Page 239 of 338
35 Meghalaya State
Meghalaya Fire and Emergency Services (MFES) has 32 operational Fire Stations spread over 7 district. Presently, the fire services of the State governed by the Police services. The formation of new Directorate of Fire and Emergency services is in progress under Meghalaya Fire and Emergency Service Act 2012.
Figure 35-1 : Location of operational Fire Stations in Meghalaya Based on detailed demarcated built-up areas and GIS based network analysis (response time analysis), ideal jurisdiction boundaries have been demarcated for all operational Fire Stations excluding areas served by other agencies, such as airport, military cantonment, thermal power plants etc. The remaining areas, not covered under ideal jurisdiction of operational Fire Stations, are also divided for ideal jurisdictions of new proposed Fire Stations. The requirements for fire fighting and rescue vehicles and specialized equipments are based on ideal served population, population density, and built-up areas within ideal jurisdiction boundary.
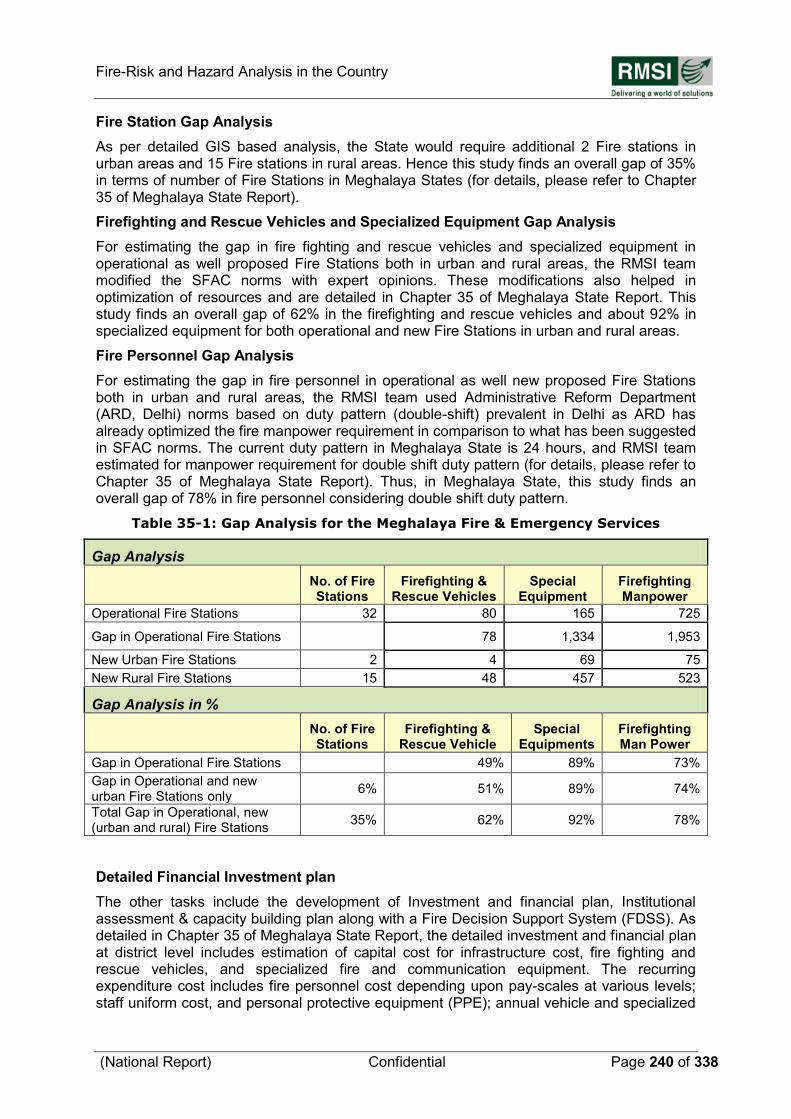
Fire-Risk and Hazard Analysis in the Country
(National Report) Confidential Page 240 of 338
Fire Station Gap Analysis
As per detailed GIS based analysis, the State would require additional 2 Fire stations in urban areas and 15 Fire stations in rural areas. Hence this study finds an overall gap of 35% in terms of number of Fire Stations in Meghalaya States (for details, please refer to Chapter 35 of Meghalaya State Report).
Firefighting and Rescue Vehicles and Specialized Equipment Gap Analysis
For estimating the gap in fire fighting and rescue vehicles and specialized equipment in operational as well proposed Fire Stations both in urban and rural areas, the RMSI team modified the SFAC norms with expert opinions. These modifications also helped in optimization of resources and are detailed in Chapter 35 of Meghalaya State Report. This study finds an overall gap of 62% in the firefighting and rescue vehicles and about 92% in specialized equipment for both operational and new Fire Stations in urban and rural areas.
Fire Personnel Gap Analysis
For estimating the gap in fire personnel in operational as well new proposed Fire Stations both in urban and rural areas, the RMSI team used Administrative Reform Department (ARD, Delhi) norms based on duty pattern (double-shift) prevalent in Delhi as ARD has already optimized the fire manpower requirement in comparison to what has been suggested in SFAC norms. The current duty pattern in Meghalaya State is 24 hours, and RMSI team estimated for manpower requirement for double shift duty pattern (for details, please refer to Chapter 35 of Meghalaya State Report). Thus, in Meghalaya State, this study finds an overall gap of 78% in fire personnel considering double shift duty pattern.
Table 35-1: Gap Analysis for the Meghalaya Fire & Emergency Services
Gap Analysis
No. of Fire Stations
Firefighting & Rescue Vehicles
Special Equipment
Firefighting Manpower
Operational Fire Stations 32 80 165 725
Gap in Operational Fire Stations 78 1,334 1,953
New Urban Fire Stations 2 4 69 75
New Rural Fire Stations 15 48 457 523
Gap Analysis in %
No. of Fire Stations
Firefighting & Rescue Vehicle
Special Equipments
Firefighting Man Power
Gap in Operational Fire Stations 49% 89% 73%
Gap in Operational and new urban Fire Stations only
6% 51% 89% 74%
Total Gap in Operational, new (urban and rural) Fire Stations
35% 62% 92% 78%
Detailed Financial Investment plan
The other tasks include the development of Investment and financial plan, Institutional assessment & capacity building plan along with a Fire Decision Support System (FDSS). As detailed in Chapter 35 of Meghalaya State Report, the detailed investment and financial plan at district level includes estimation of capital cost for infrastructure cost, fire fighting and rescue vehicles, and specialized fire and communication equipment. The recurring expenditure cost includes fire personnel cost depending upon pay-scales at various levels; staff uniform cost, and personal protective equipment (PPE); annual vehicle and specialized
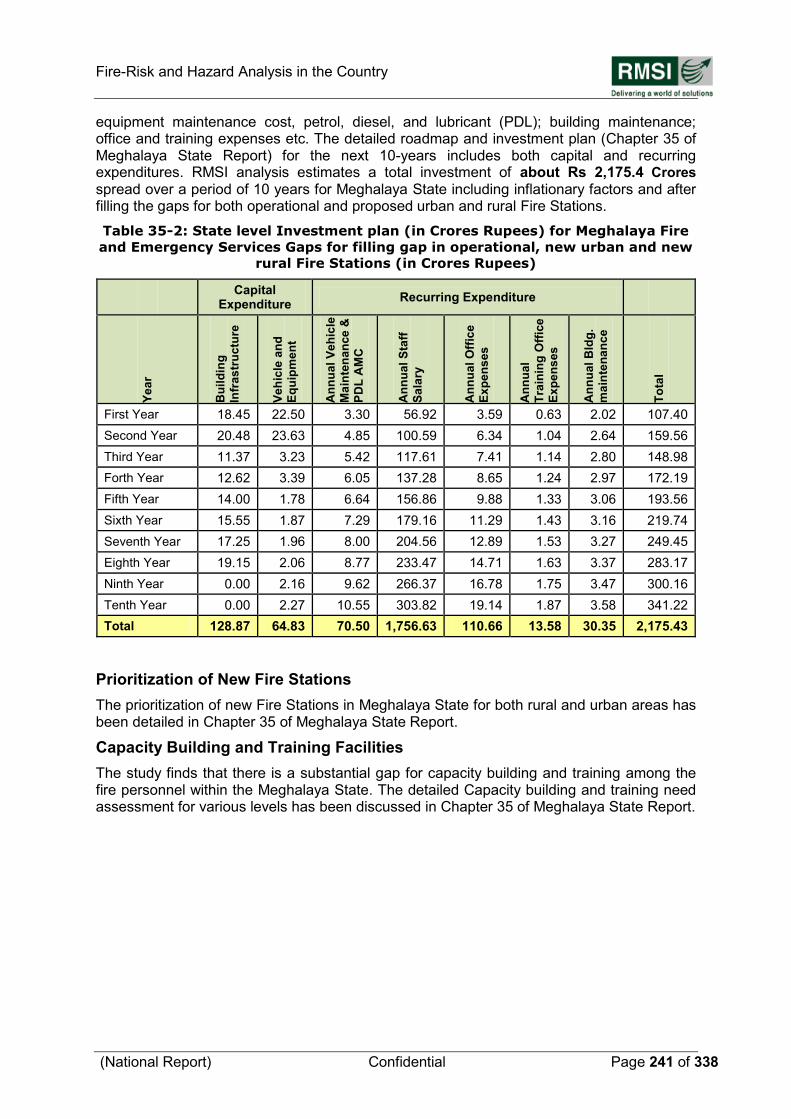
Fire-Risk and Hazard Analysis in the Country
(National Report) Confidential Page 241 of 338
equipment maintenance cost, petrol, diesel, and lubricant (PDL); building maintenance; office and training expenses etc. The detailed roadmap and investment plan (Chapter 35 of Meghalaya State Report) for the next 10-years includes both capital and recurring expenditures. RMSI analysis estimates a total investment of about Rs 2,175.4 Crores
spread over a period of 10 years for Meghalaya State including inflationary factors and after filling the gaps for both operational and proposed urban and rural Fire Stations.
Table 35-2: State level Investment plan (in Crores Rupees) for Meghalaya Fire
and Emergency Services Gaps for filling gap in operational, new urban and new
rural Fire Stations (in Crores Rupees)
Capital Expenditure
Recurring Expenditure
Ye
ar
Bu
ild
ing
Infr
as
tru
ctu
re
Ve
hic
le a
nd
Eq
uip
me
nt
An
nu
al
Ve
hic
le
Ma
inte
na
nce
&
PD
L A
MC
An
nu
al
Sta
ff
Sa
lary
An
nu
al
Off
ice
Ex
pe
ns
es
An
nu
al
Tra
inin
g O
ffic
e
Ex
pe
ns
es
An
nu
al
Bld
g.
ma
inte
na
nc
e
To
tal
First Year 18.45 22.50 3.30 56.92 3.59 0.63 2.02 107.40
Second Year 20.48 23.63 4.85 100.59 6.34 1.04 2.64 159.56
Third Year 11.37 3.23 5.42 117.61 7.41 1.14 2.80 148.98
Forth Year 12.62 3.39 6.05 137.28 8.65 1.24 2.97 172.19
Fifth Year 14.00 1.78 6.64 156.86 9.88 1.33 3.06 193.56
Sixth Year 15.55 1.87 7.29 179.16 11.29 1.43 3.16 219.74
Seventh Year 17.25 1.96 8.00 204.56 12.89 1.53 3.27 249.45
Eighth Year 19.15 2.06 8.77 233.47 14.71 1.63 3.37 283.17
Ninth Year 0.00 2.16 9.62 266.37 16.78 1.75 3.47 300.16
Tenth Year 0.00 2.27 10.55 303.82 19.14 1.87 3.58 341.22
Total 128.87 64.83 70.50 1,756.63 110.66 13.58 30.35 2,175.43
Prioritization of New Fire Stations
The prioritization of new Fire Stations in Meghalaya State for both rural and urban areas has been detailed in Chapter 35 of Meghalaya State Report.
Capacity Building and Training Facilities
The study finds that there is a substantial gap for capacity building and training among the fire personnel within the Meghalaya State. The detailed Capacity building and training need assessment for various levels has been discussed in Chapter 35 of Meghalaya State Report.
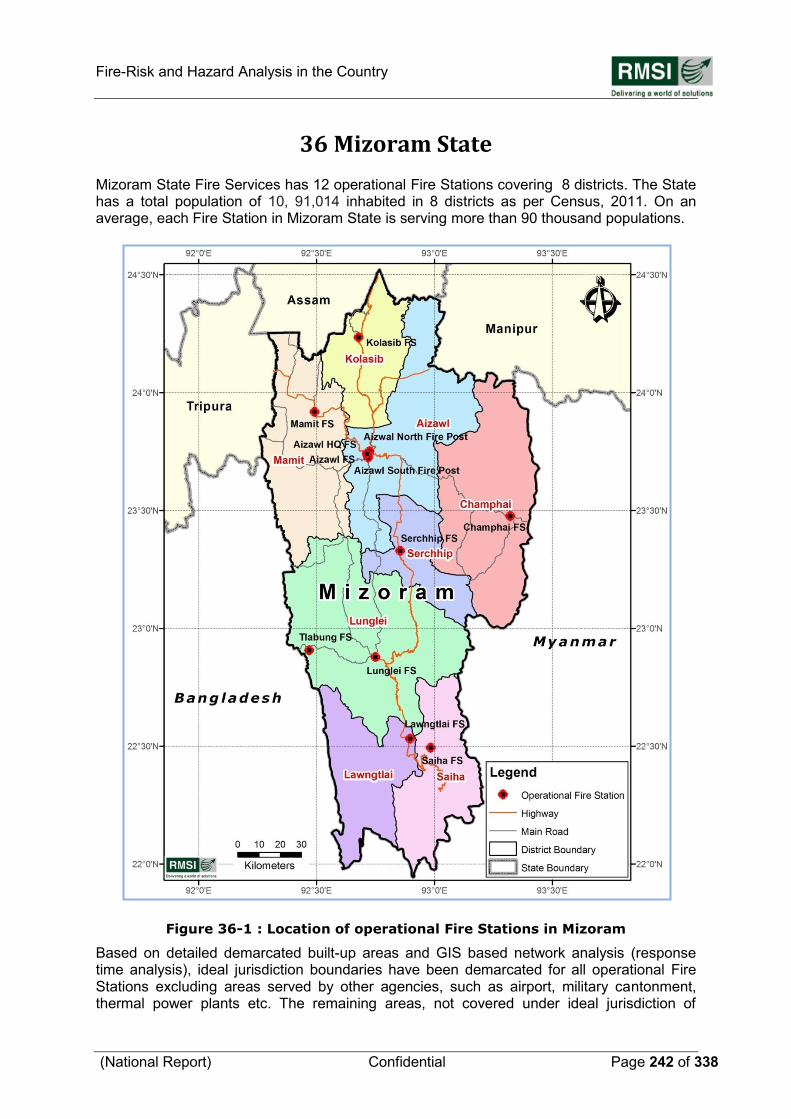
Fire-Risk and Hazard Analysis in the Country
(National Report) Confidential Page 242 of 338
36 Mizoram State
Mizoram State Fire Services has 12 operational Fire Stations covering 8 districts. The State has a total population of 10, 91,014 inhabited in 8 districts as per Census, 2011. On an average, each Fire Station in Mizoram State is serving more than 90 thousand populations.
Figure 36-1 : Location of operational Fire Stations in Mizoram Based on detailed demarcated built-up areas and GIS based network analysis (response time analysis), ideal jurisdiction boundaries have been demarcated for all operational Fire Stations excluding areas served by other agencies, such as airport, military cantonment, thermal power plants etc. The remaining areas, not covered under ideal jurisdiction of
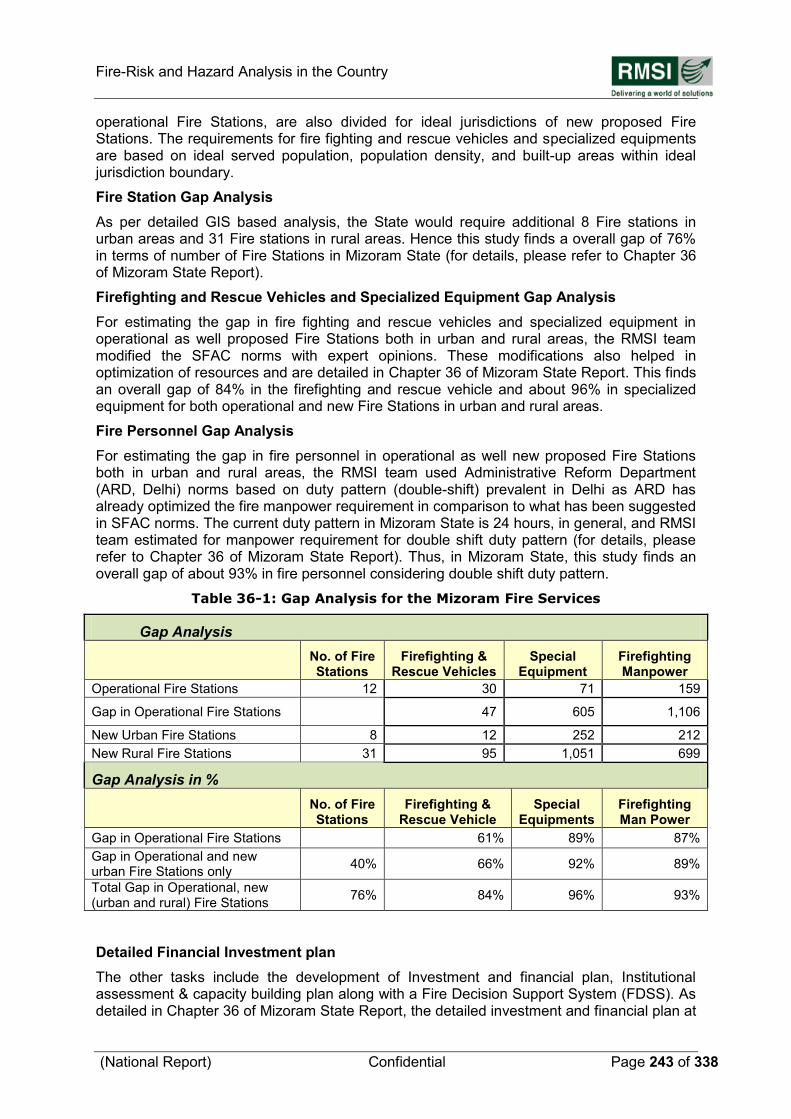
Fire-Risk and Hazard Analysis in the Country
(National Report) Confidential Page 243 of 338
operational Fire Stations, are also divided for ideal jurisdictions of new proposed Fire Stations. The requirements for fire fighting and rescue vehicles and specialized equipments are based on ideal served population, population density, and built-up areas within ideal jurisdiction boundary.
Fire Station Gap Analysis
As per detailed GIS based analysis, the State would require additional 8 Fire stations in urban areas and 31 Fire stations in rural areas. Hence this study finds a overall gap of 76% in terms of number of Fire Stations in Mizoram State (for details, please refer to Chapter 36 of Mizoram State Report).
Firefighting and Rescue Vehicles and Specialized Equipment Gap Analysis
For estimating the gap in fire fighting and rescue vehicles and specialized equipment in operational as well proposed Fire Stations both in urban and rural areas, the RMSI team modified the SFAC norms with expert opinions. These modifications also helped in optimization of resources and are detailed in Chapter 36 of Mizoram State Report. This finds an overall gap of 84% in the firefighting and rescue vehicle and about 96% in specialized equipment for both operational and new Fire Stations in urban and rural areas.
Fire Personnel Gap Analysis
For estimating the gap in fire personnel in operational as well new proposed Fire Stations both in urban and rural areas, the RMSI team used Administrative Reform Department (ARD, Delhi) norms based on duty pattern (double-shift) prevalent in Delhi as ARD has already optimized the fire manpower requirement in comparison to what has been suggested in SFAC norms. The current duty pattern in Mizoram State is 24 hours, in general, and RMSI team estimated for manpower requirement for double shift duty pattern (for details, please refer to Chapter 36 of Mizoram State Report). Thus, in Mizoram State, this study finds an overall gap of about 93% in fire personnel considering double shift duty pattern.
Table 36-1: Gap Analysis for the Mizoram Fire Services
Gap Analysis
No. of Fire Stations
Firefighting & Rescue Vehicles
Special Equipment
Firefighting Manpower
Operational Fire Stations 12 30 71 159
Gap in Operational Fire Stations 47 605 1,106
New Urban Fire Stations 8 12 252 212
New Rural Fire Stations 31 95 1,051 699
Gap Analysis in %
No. of Fire Stations
Firefighting & Rescue Vehicle
Special Equipments
Firefighting Man Power
Gap in Operational Fire Stations 61% 89% 87%
Gap in Operational and new urban Fire Stations only
40% 66% 92% 89%
Total Gap in Operational, new (urban and rural) Fire Stations
76% 84% 96% 93%
Detailed Financial Investment plan
The other tasks include the development of Investment and financial plan, Institutional assessment & capacity building plan along with a Fire Decision Support System (FDSS). As detailed in Chapter 36 of Mizoram State Report, the detailed investment and financial plan at
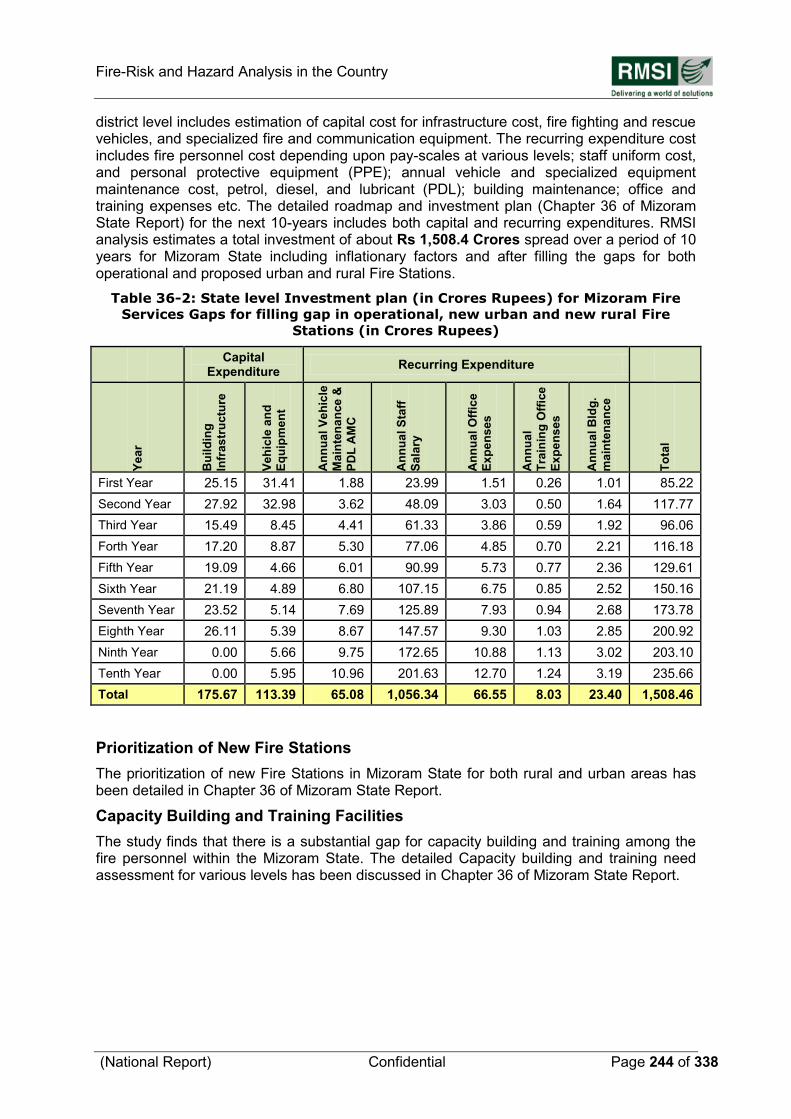
Fire-Risk and Hazard Analysis in the Country
(National Report) Confidential Page 244 of 338
district level includes estimation of capital cost for infrastructure cost, fire fighting and rescue vehicles, and specialized fire and communication equipment. The recurring expenditure cost includes fire personnel cost depending upon pay-scales at various levels; staff uniform cost, and personal protective equipment (PPE); annual vehicle and specialized equipment maintenance cost, petrol, diesel, and lubricant (PDL); building maintenance; office and training expenses etc. The detailed roadmap and investment plan (Chapter 36 of Mizoram State Report) for the next 10-years includes both capital and recurring expenditures. RMSI analysis estimates a total investment of about Rs 1,508.4 Crores spread over a period of 10 years for Mizoram State including inflationary factors and after filling the gaps for both operational and proposed urban and rural Fire Stations.
Table 36-2: State level Investment plan (in Crores Rupees) for Mizoram Fire
Services Gaps for filling gap in operational, new urban and new rural Fire
Stations (in Crores Rupees)
Capital Expenditure
Recurring Expenditure
Ye
ar
Bu
ild
ing
Infr
as
tru
ctu
re
Ve
hic
le a
nd
Eq
uip
me
nt
An
nu
al
Ve
hic
le
Ma
inte
na
nce
&
PD
L A
MC
An
nu
al
Sta
ff
Sa
lary
An
nu
al
Off
ice
Ex
pe
ns
es
An
nu
al
Tra
inin
g O
ffic
e
Ex
pe
ns
es
An
nu
al
Bld
g.
ma
inte
na
nc
e
To
tal
First Year 25.15 31.41 1.88 23.99 1.51 0.26 1.01 85.22
Second Year 27.92 32.98 3.62 48.09 3.03 0.50 1.64 117.77
Third Year 15.49 8.45 4.41 61.33 3.86 0.59 1.92 96.06
Forth Year 17.20 8.87 5.30 77.06 4.85 0.70 2.21 116.18
Fifth Year 19.09 4.66 6.01 90.99 5.73 0.77 2.36 129.61
Sixth Year 21.19 4.89 6.80 107.15 6.75 0.85 2.52 150.16
Seventh Year 23.52 5.14 7.69 125.89 7.93 0.94 2.68 173.78
Eighth Year 26.11 5.39 8.67 147.57 9.30 1.03 2.85 200.92
Ninth Year 0.00 5.66 9.75 172.65 10.88 1.13 3.02 203.10
Tenth Year 0.00 5.95 10.96 201.63 12.70 1.24 3.19 235.66
Total 175.67 113.39 65.08 1,056.34 66.55 8.03 23.40 1,508.46
Prioritization of New Fire Stations
The prioritization of new Fire Stations in Mizoram State for both rural and urban areas has been detailed in Chapter 36 of Mizoram State Report.
Capacity Building and Training Facilities
The study finds that there is a substantial gap for capacity building and training among the fire personnel within the Mizoram State. The detailed Capacity building and training need assessment for various levels has been discussed in Chapter 36 of Mizoram State Report.
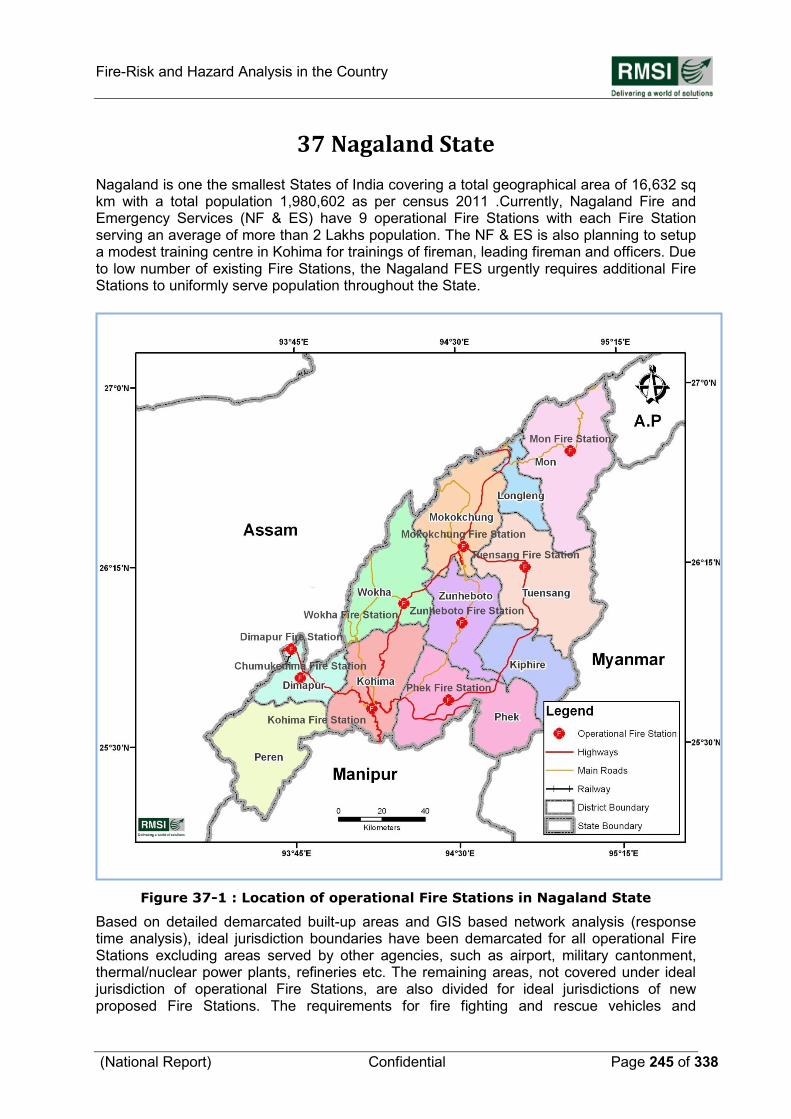
Fire-Risk and Hazard Analysis in the Country
(National Report) Confidential Page 245 of 338
37 Nagaland State
Nagaland is one the smallest States of India covering a total geographical area of 16,632 sq km with a total population 1,980,602 as per census 2011 .Currently, Nagaland Fire and Emergency Services (NF & ES) have 9 operational Fire Stations with each Fire Station serving an average of more than 2 Lakhs population. The NF & ES is also planning to setup a modest training centre in Kohima for trainings of fireman, leading fireman and officers. Due to low number of existing Fire Stations, the Nagaland FES urgently requires additional Fire Stations to uniformly serve population throughout the State.
Figure 37-1 : Location of operational Fire Stations in Nagaland State Based on detailed demarcated built-up areas and GIS based network analysis (response time analysis), ideal jurisdiction boundaries have been demarcated for all operational Fire Stations excluding areas served by other agencies, such as airport, military cantonment, thermal/nuclear power plants, refineries etc. The remaining areas, not covered under ideal jurisdiction of operational Fire Stations, are also divided for ideal jurisdictions of new proposed Fire Stations. The requirements for fire fighting and rescue vehicles and
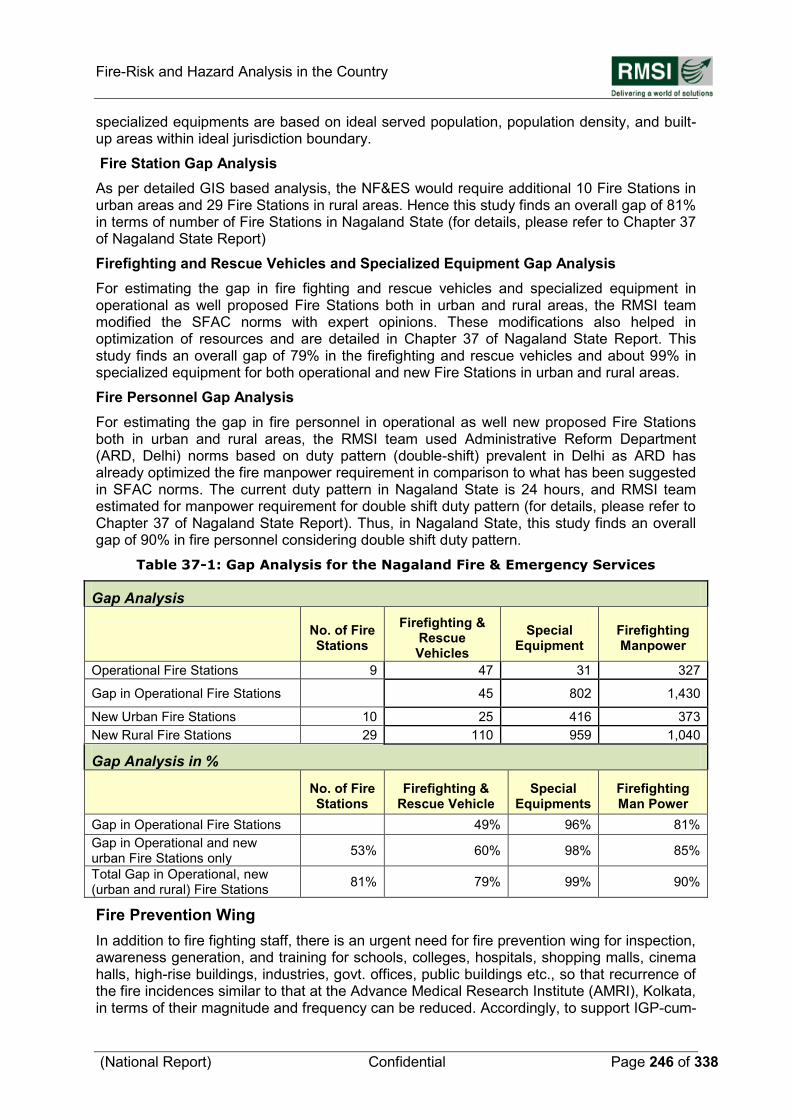
Fire-Risk and Hazard Analysis in the Country
(National Report) Confidential Page 246 of 338
specialized equipments are based on ideal served population, population density, and built-up areas within ideal jurisdiction boundary.
Fire Station Gap Analysis
As per detailed GIS based analysis, the NF&ES would require additional 10 Fire Stations in urban areas and 29 Fire Stations in rural areas. Hence this study finds an overall gap of 81% in terms of number of Fire Stations in Nagaland State (for details, please refer to Chapter 37 of Nagaland State Report)
Firefighting and Rescue Vehicles and Specialized Equipment Gap Analysis
For estimating the gap in fire fighting and rescue vehicles and specialized equipment in operational as well proposed Fire Stations both in urban and rural areas, the RMSI team modified the SFAC norms with expert opinions. These modifications also helped in optimization of resources and are detailed in Chapter 37 of Nagaland State Report. This study finds an overall gap of 79% in the firefighting and rescue vehicles and about 99% in specialized equipment for both operational and new Fire Stations in urban and rural areas.
Fire Personnel Gap Analysis
For estimating the gap in fire personnel in operational as well new proposed Fire Stations both in urban and rural areas, the RMSI team used Administrative Reform Department (ARD, Delhi) norms based on duty pattern (double-shift) prevalent in Delhi as ARD has already optimized the fire manpower requirement in comparison to what has been suggested in SFAC norms. The current duty pattern in Nagaland State is 24 hours, and RMSI team estimated for manpower requirement for double shift duty pattern (for details, please refer to Chapter 37 of Nagaland State Report). Thus, in Nagaland State, this study finds an overall gap of 90% in fire personnel considering double shift duty pattern.
Table 37-1: Gap Analysis for the Nagaland Fire & Emergency Services
Gap Analysis
No. of Fire Stations
Firefighting & Rescue Vehicles
Special Equipment
Firefighting Manpower
Operational Fire Stations 9 47 31 327
Gap in Operational Fire Stations 45 802 1,430
New Urban Fire Stations 10 25 416 373
New Rural Fire Stations 29 110 959 1,040
Gap Analysis in %
No. of Fire Stations
Firefighting & Rescue Vehicle
Special Equipments
Firefighting Man Power
Gap in Operational Fire Stations 49% 96% 81%
Gap in Operational and new urban Fire Stations only
53% 60% 98% 85%
Total Gap in Operational, new (urban and rural) Fire Stations
81% 79% 99% 90%
Fire Prevention Wing
In addition to fire fighting staff, there is an urgent need for fire prevention wing for inspection, awareness generation, and training for schools, colleges, hospitals, shopping malls, cinema halls, high-rise buildings, industries, govt. offices, public buildings etc., so that recurrence of the fire incidences similar to that at the Advance Medical Research Institute (AMRI), Kolkata, in terms of their magnitude and frequency can be reduced. Accordingly, to support IGP-cum-
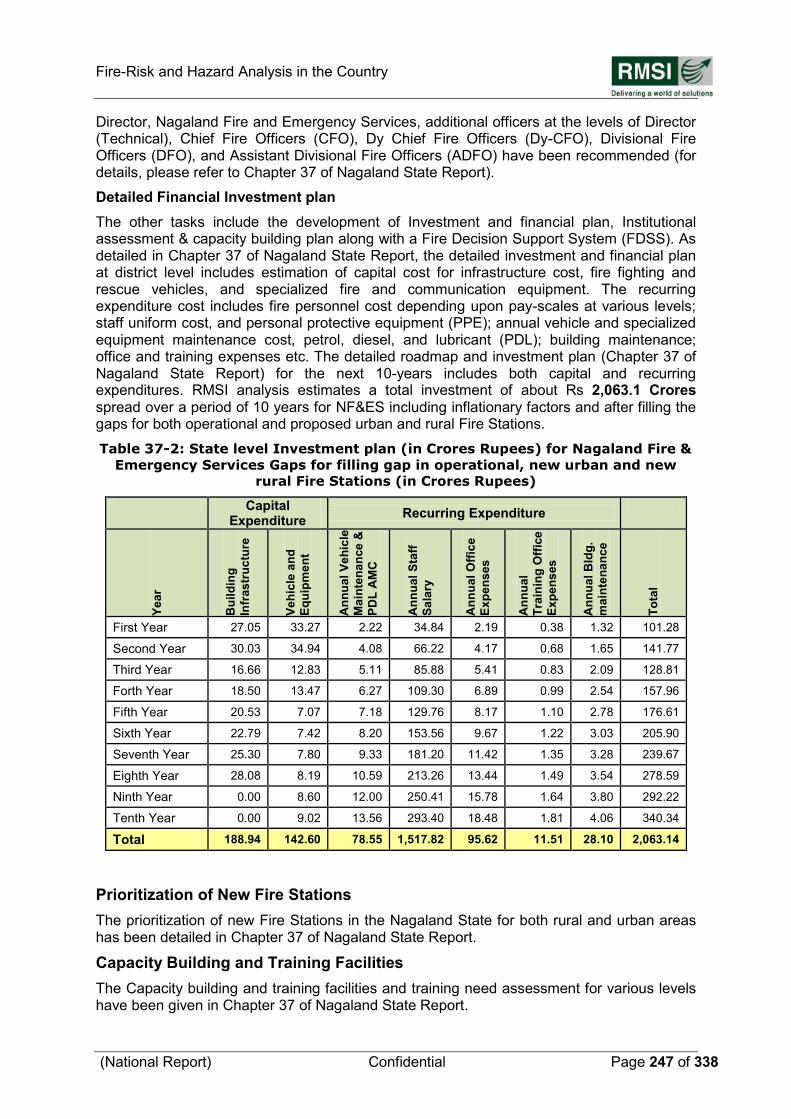
Fire-Risk and Hazard Analysis in the Country
(National Report) Confidential Page 247 of 338
Director, Nagaland Fire and Emergency Services, additional officers at the levels of Director (Technical), Chief Fire Officers (CFO), Dy Chief Fire Officers (Dy-CFO), Divisional Fire Officers (DFO), and Assistant Divisional Fire Officers (ADFO) have been recommended (for details, please refer to Chapter 37 of Nagaland State Report).
Detailed Financial Investment plan
The other tasks include the development of Investment and financial plan, Institutional assessment & capacity building plan along with a Fire Decision Support System (FDSS). As detailed in Chapter 37 of Nagaland State Report, the detailed investment and financial plan at district level includes estimation of capital cost for infrastructure cost, fire fighting and rescue vehicles, and specialized fire and communication equipment. The recurring expenditure cost includes fire personnel cost depending upon pay-scales at various levels; staff uniform cost, and personal protective equipment (PPE); annual vehicle and specialized equipment maintenance cost, petrol, diesel, and lubricant (PDL); building maintenance; office and training expenses etc. The detailed roadmap and investment plan (Chapter 37 of Nagaland State Report) for the next 10-years includes both capital and recurring expenditures. RMSI analysis estimates a total investment of about Rs 2,063.1 Crores spread over a period of 10 years for NF&ES including inflationary factors and after filling the gaps for both operational and proposed urban and rural Fire Stations.
Table 37-2: State level Investment plan (in Crores Rupees) for Nagaland Fire &
Emergency Services Gaps for filling gap in operational, new urban and new
rural Fire Stations (in Crores Rupees)
Capital Expenditure
Recurring Expenditure
Ye
ar
Bu
ild
ing
Infr
as
tru
ctu
re
Ve
hic
le a
nd
Eq
uip
me
nt
An
nu
al
Ve
hic
le
Ma
inte
na
nce
&
PD
L A
MC
An
nu
al
Sta
ff
Sa
lary
An
nu
al
Off
ice
Ex
pe
ns
es
An
nu
al
Tra
inin
g O
ffic
e
Ex
pe
ns
es
An
nu
al
Bld
g.
ma
inte
na
nc
e
To
tal
First Year 27.05 33.27 2.22 34.84 2.19 0.38 1.32 101.28
Second Year 30.03 34.94 4.08 66.22 4.17 0.68 1.65 141.77
Third Year 16.66 12.83 5.11 85.88 5.41 0.83 2.09 128.81
Forth Year 18.50 13.47 6.27 109.30 6.89 0.99 2.54 157.96
Fifth Year 20.53 7.07 7.18 129.76 8.17 1.10 2.78 176.61
Sixth Year 22.79 7.42 8.20 153.56 9.67 1.22 3.03 205.90
Seventh Year 25.30 7.80 9.33 181.20 11.42 1.35 3.28 239.67
Eighth Year 28.08 8.19 10.59 213.26 13.44 1.49 3.54 278.59
Ninth Year 0.00 8.60 12.00 250.41 15.78 1.64 3.80 292.22
Tenth Year 0.00 9.02 13.56 293.40 18.48 1.81 4.06 340.34
Total 188.94 142.60 78.55 1,517.82 95.62 11.51 28.10 2,063.14
Prioritization of New Fire Stations
The prioritization of new Fire Stations in the Nagaland State for both rural and urban areas has been detailed in Chapter 37 of Nagaland State Report.
Capacity Building and Training Facilities
The Capacity building and training facilities and training need assessment for various levels have been given in Chapter 37 of Nagaland State Report.
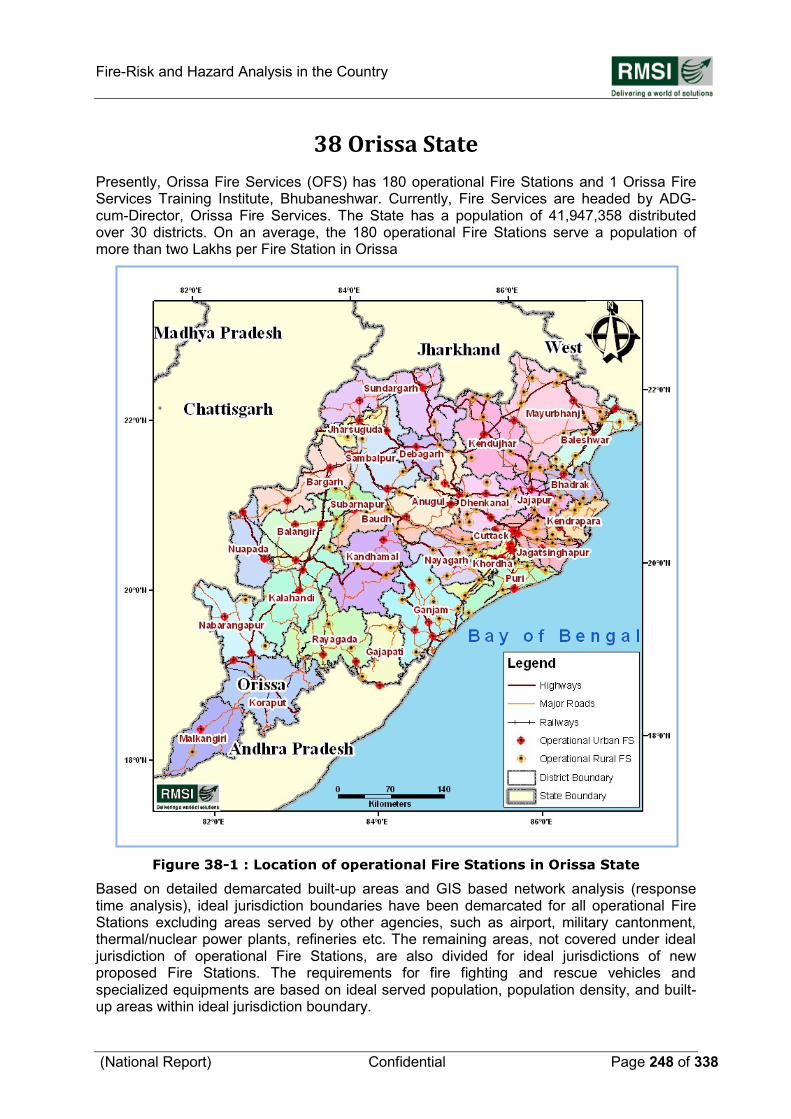
Fire-Risk and Hazard Analysis in the Country
(National Report) Confidential Page 248 of 338
38 Orissa State
Presently, Orissa Fire Services (OFS) has 180 operational Fire Stations and 1 Orissa Fire Services Training Institute, Bhubaneshwar. Currently, Fire Services are headed by ADG-cum-Director, Orissa Fire Services. The State has a population of 41,947,358 distributed over 30 districts. On an average, the 180 operational Fire Stations serve a population of more than two Lakhs per Fire Station in Orissa
Figure 38-1 : Location of operational Fire Stations in Orissa State Based on detailed demarcated built-up areas and GIS based network analysis (response time analysis), ideal jurisdiction boundaries have been demarcated for all operational Fire Stations excluding areas served by other agencies, such as airport, military cantonment, thermal/nuclear power plants, refineries etc. The remaining areas, not covered under ideal jurisdiction of operational Fire Stations, are also divided for ideal jurisdictions of new proposed Fire Stations. The requirements for fire fighting and rescue vehicles and specialized equipments are based on ideal served population, population density, and built-up areas within ideal jurisdiction boundary.
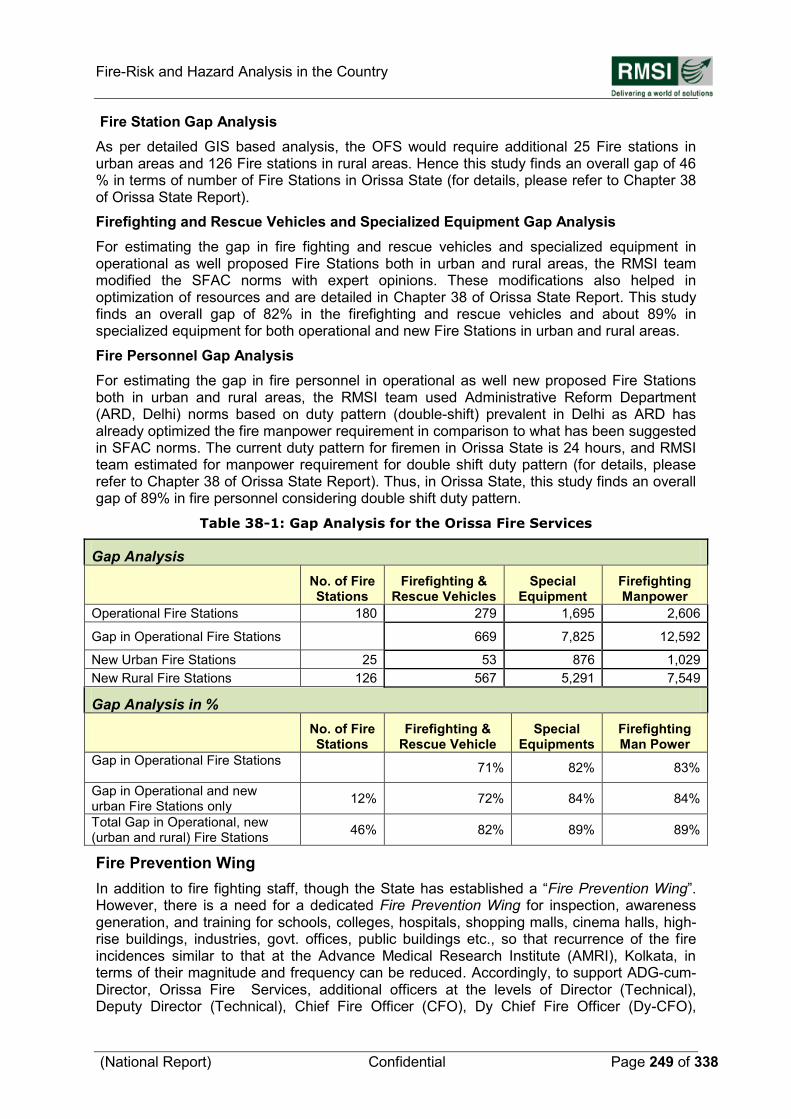
Fire-Risk and Hazard Analysis in the Country
(National Report) Confidential Page 249 of 338
Fire Station Gap Analysis
As per detailed GIS based analysis, the OFS would require additional 25 Fire stations in urban areas and 126 Fire stations in rural areas. Hence this study finds an overall gap of 46 % in terms of number of Fire Stations in Orissa State (for details, please refer to Chapter 38 of Orissa State Report).
Firefighting and Rescue Vehicles and Specialized Equipment Gap Analysis
For estimating the gap in fire fighting and rescue vehicles and specialized equipment in operational as well proposed Fire Stations both in urban and rural areas, the RMSI team modified the SFAC norms with expert opinions. These modifications also helped in optimization of resources and are detailed in Chapter 38 of Orissa State Report. This study finds an overall gap of 82% in the firefighting and rescue vehicles and about 89% in specialized equipment for both operational and new Fire Stations in urban and rural areas.
Fire Personnel Gap Analysis
For estimating the gap in fire personnel in operational as well new proposed Fire Stations both in urban and rural areas, the RMSI team used Administrative Reform Department (ARD, Delhi) norms based on duty pattern (double-shift) prevalent in Delhi as ARD has already optimized the fire manpower requirement in comparison to what has been suggested in SFAC norms. The current duty pattern for firemen in Orissa State is 24 hours, and RMSI team estimated for manpower requirement for double shift duty pattern (for details, please refer to Chapter 38 of Orissa State Report). Thus, in Orissa State, this study finds an overall gap of 89% in fire personnel considering double shift duty pattern.
Table 38-1: Gap Analysis for the Orissa Fire Services
Gap Analysis
No. of Fire Stations
Firefighting & Rescue Vehicles
Special Equipment
Firefighting Manpower
Operational Fire Stations 180 279 1,695 2,606
Gap in Operational Fire Stations 669 7,825 12,592
New Urban Fire Stations 25 53 876 1,029
New Rural Fire Stations 126 567 5,291 7,549
Gap Analysis in %
No. of Fire Stations
Firefighting & Rescue Vehicle
Special Equipments
Firefighting Man Power
Gap in Operational Fire Stations 71% 82% 83%
Gap in Operational and new urban Fire Stations only
12% 72% 84% 84%
Total Gap in Operational, new (urban and rural) Fire Stations
46% 82% 89% 89%
Fire Prevention Wing
In addition to fire fighting staff, though the State has established a “Fire Prevention Wing”. However, there is a need for a dedicated Fire Prevention Wing for inspection, awareness generation, and training for schools, colleges, hospitals, shopping malls, cinema halls, high-rise buildings, industries, govt. offices, public buildings etc., so that recurrence of the fire incidences similar to that at the Advance Medical Research Institute (AMRI), Kolkata, in terms of their magnitude and frequency can be reduced. Accordingly, to support ADG-cum-Director, Orissa Fire Services, additional officers at the levels of Director (Technical), Deputy Director (Technical), Chief Fire Officer (CFO), Dy Chief Fire Officer (Dy-CFO),
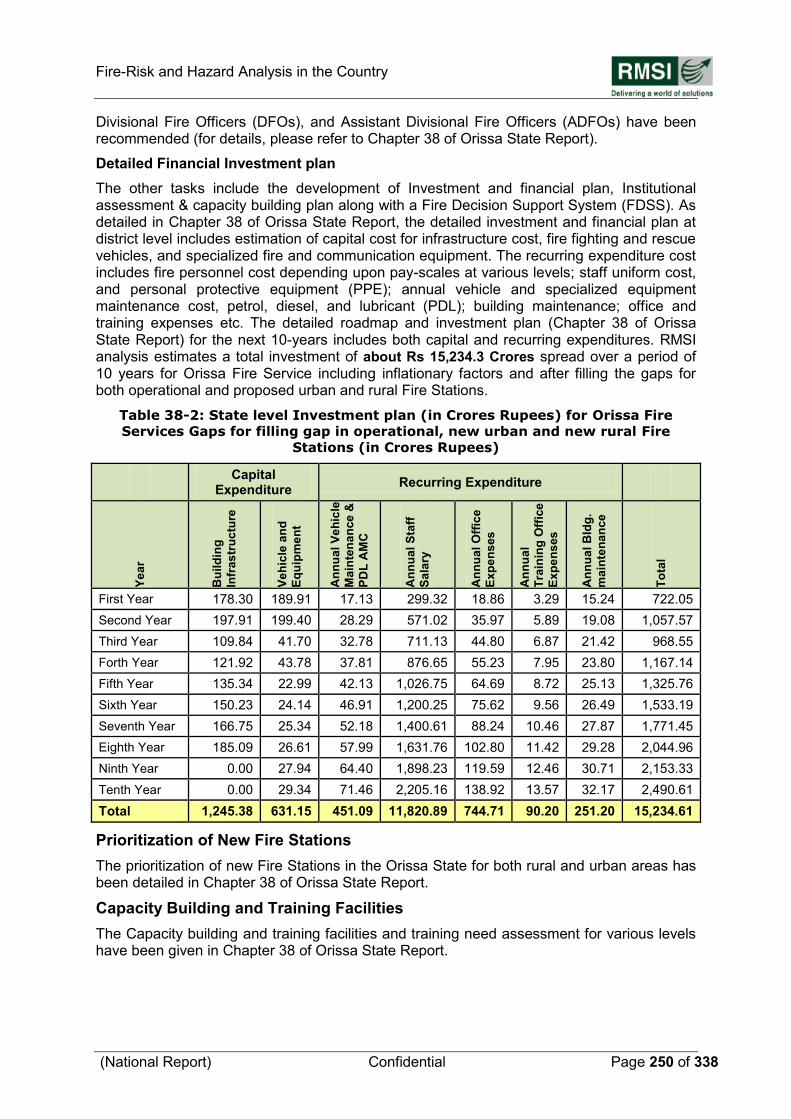
Fire-Risk and Hazard Analysis in the Country
(National Report) Confidential Page 250 of 338
Divisional Fire Officers (DFOs), and Assistant Divisional Fire Officers (ADFOs) have been recommended (for details, please refer to Chapter 38 of Orissa State Report).
Detailed Financial Investment plan
The other tasks include the development of Investment and financial plan, Institutional assessment & capacity building plan along with a Fire Decision Support System (FDSS). As detailed in Chapter 38 of Orissa State Report, the detailed investment and financial plan at district level includes estimation of capital cost for infrastructure cost, fire fighting and rescue vehicles, and specialized fire and communication equipment. The recurring expenditure cost includes fire personnel cost depending upon pay-scales at various levels; staff uniform cost, and personal protective equipment (PPE); annual vehicle and specialized equipment maintenance cost, petrol, diesel, and lubricant (PDL); building maintenance; office and training expenses etc. The detailed roadmap and investment plan (Chapter 38 of Orissa State Report) for the next 10-years includes both capital and recurring expenditures. RMSI analysis estimates a total investment of about Rs 15,234.3 Crores spread over a period of 10 years for Orissa Fire Service including inflationary factors and after filling the gaps for both operational and proposed urban and rural Fire Stations.
Table 38-2: State level Investment plan (in Crores Rupees) for Orissa Fire
Services Gaps for filling gap in operational, new urban and new rural Fire
Stations (in Crores Rupees)
Capital Expenditure
Recurring Expenditure
Ye
ar
Bu
ild
ing
Infr
as
tru
ctu
re
Ve
hic
le a
nd
Eq
uip
me
nt
An
nu
al
Ve
hic
le
Ma
inte
na
nce
&
PD
L A
MC
An
nu
al
Sta
ff
Sa
lary
An
nu
al
Off
ice
Ex
pe
ns
es
An
nu
al
Tra
inin
g O
ffic
e
Ex
pe
ns
es
An
nu
al
Bld
g.
ma
inte
na
nc
e
To
tal
First Year 178.30 189.91 17.13 299.32 18.86 3.29 15.24 722.05
Second Year 197.91 199.40 28.29 571.02 35.97 5.89 19.08 1,057.57
Third Year 109.84 41.70 32.78 711.13 44.80 6.87 21.42 968.55
Forth Year 121.92 43.78 37.81 876.65 55.23 7.95 23.80 1,167.14
Fifth Year 135.34 22.99 42.13 1,026.75 64.69 8.72 25.13 1,325.76
Sixth Year 150.23 24.14 46.91 1,200.25 75.62 9.56 26.49 1,533.19
Seventh Year 166.75 25.34 52.18 1,400.61 88.24 10.46 27.87 1,771.45
Eighth Year 185.09 26.61 57.99 1,631.76 102.80 11.42 29.28 2,044.96
Ninth Year 0.00 27.94 64.40 1,898.23 119.59 12.46 30.71 2,153.33
Tenth Year 0.00 29.34 71.46 2,205.16 138.92 13.57 32.17 2,490.61
Total 1,245.38 631.15 451.09 11,820.89 744.71 90.20 251.20 15,234.61
Prioritization of New Fire Stations
The prioritization of new Fire Stations in the Orissa State for both rural and urban areas has been detailed in Chapter 38 of Orissa State Report.
Capacity Building and Training Facilities
The Capacity building and training facilities and training need assessment for various levels have been given in Chapter 38 of Orissa State Report.
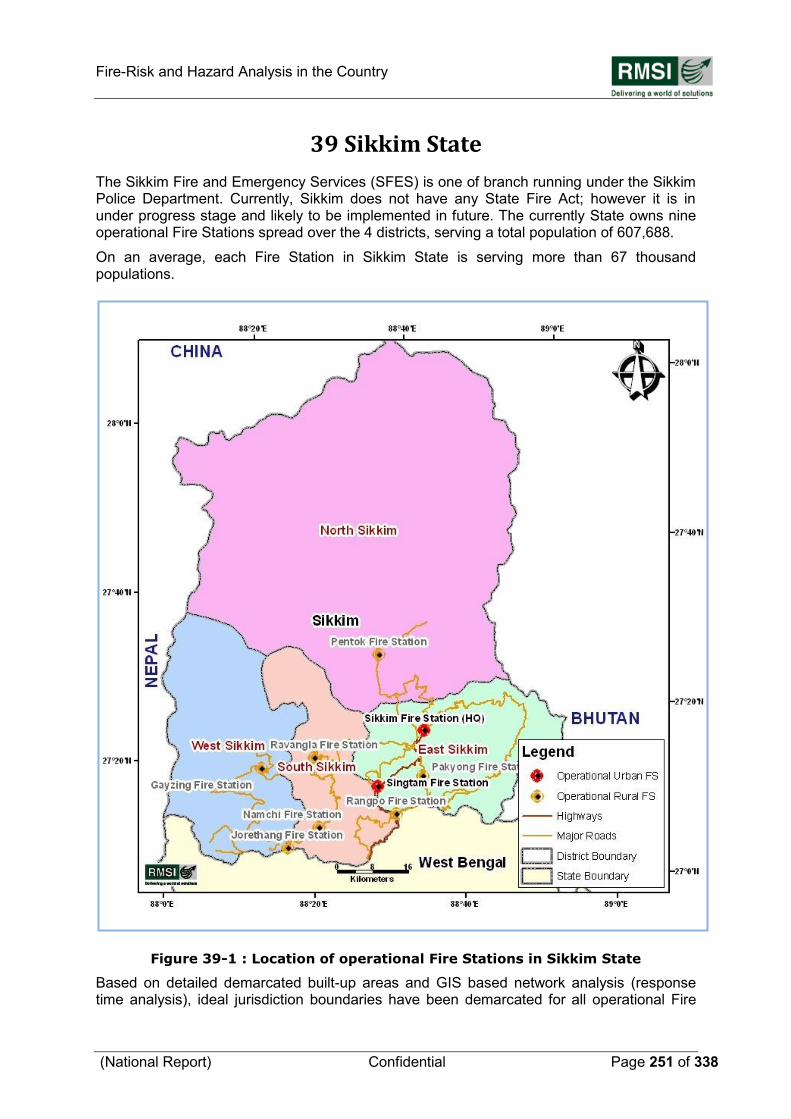
Fire-Risk and Hazard Analysis in the Country
(National Report) Confidential Page 251 of 338
39 Sikkim State
The Sikkim Fire and Emergency Services (SFES) is one of branch running under the Sikkim Police Department. Currently, Sikkim does not have any State Fire Act; however it is in under progress stage and likely to be implemented in future. The currently State owns nine operational Fire Stations spread over the 4 districts, serving a total population of 607,688.
On an average, each Fire Station in Sikkim State is serving more than 67 thousand populations.
Figure 39-1 : Location of operational Fire Stations in Sikkim State Based on detailed demarcated built-up areas and GIS based network analysis (response time analysis), ideal jurisdiction boundaries have been demarcated for all operational Fire
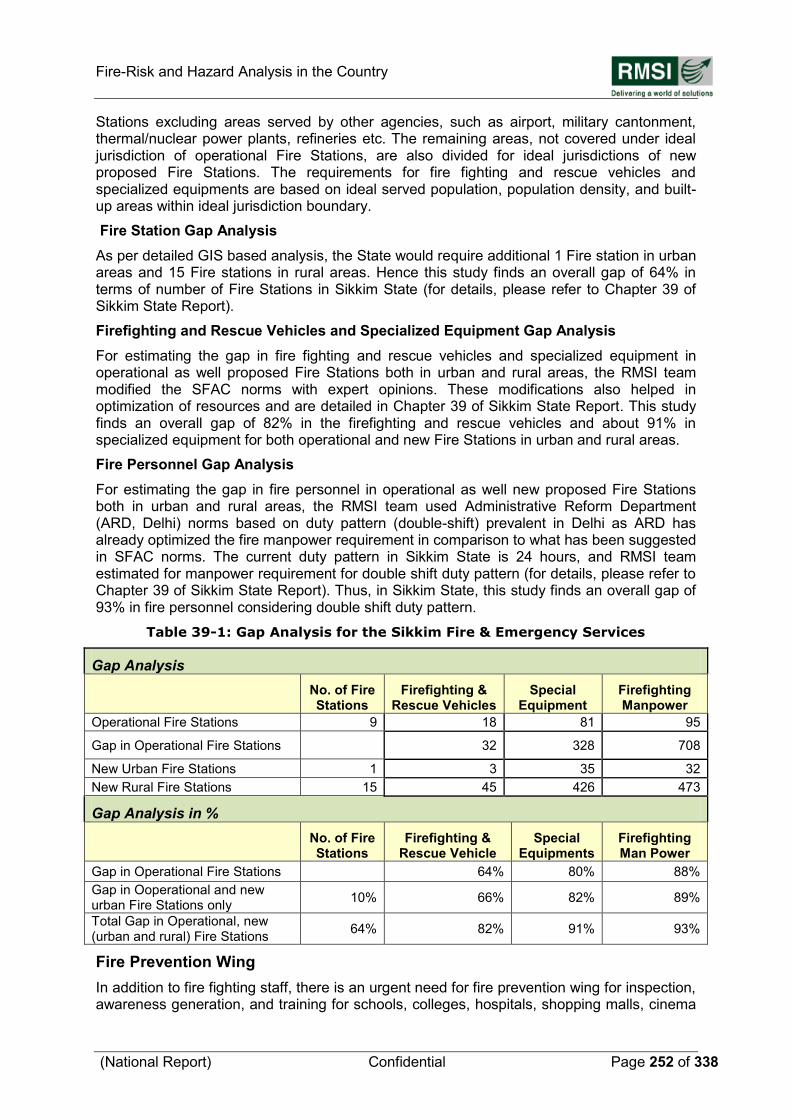
Fire-Risk and Hazard Analysis in the Country
(National Report) Confidential Page 252 of 338
Stations excluding areas served by other agencies, such as airport, military cantonment, thermal/nuclear power plants, refineries etc. The remaining areas, not covered under ideal jurisdiction of operational Fire Stations, are also divided for ideal jurisdictions of new proposed Fire Stations. The requirements for fire fighting and rescue vehicles and specialized equipments are based on ideal served population, population density, and built-up areas within ideal jurisdiction boundary.
Fire Station Gap Analysis
As per detailed GIS based analysis, the State would require additional 1 Fire station in urban areas and 15 Fire stations in rural areas. Hence this study finds an overall gap of 64% in terms of number of Fire Stations in Sikkim State (for details, please refer to Chapter 39 of Sikkim State Report).
Firefighting and Rescue Vehicles and Specialized Equipment Gap Analysis
For estimating the gap in fire fighting and rescue vehicles and specialized equipment in operational as well proposed Fire Stations both in urban and rural areas, the RMSI team modified the SFAC norms with expert opinions. These modifications also helped in optimization of resources and are detailed in Chapter 39 of Sikkim State Report. This study finds an overall gap of 82% in the firefighting and rescue vehicles and about 91% in specialized equipment for both operational and new Fire Stations in urban and rural areas.
Fire Personnel Gap Analysis
For estimating the gap in fire personnel in operational as well new proposed Fire Stations both in urban and rural areas, the RMSI team used Administrative Reform Department (ARD, Delhi) norms based on duty pattern (double-shift) prevalent in Delhi as ARD has already optimized the fire manpower requirement in comparison to what has been suggested in SFAC norms. The current duty pattern in Sikkim State is 24 hours, and RMSI team estimated for manpower requirement for double shift duty pattern (for details, please refer to Chapter 39 of Sikkim State Report). Thus, in Sikkim State, this study finds an overall gap of 93% in fire personnel considering double shift duty pattern.
Table 39-1: Gap Analysis for the Sikkim Fire & Emergency Services
Gap Analysis
No. of Fire Stations
Firefighting & Rescue Vehicles
Special Equipment
Firefighting Manpower
Operational Fire Stations 9 18 81 95
Gap in Operational Fire Stations 32 328 708
New Urban Fire Stations 1 3 35 32
New Rural Fire Stations 15 45 426 473
Gap Analysis in %
No. of Fire Stations
Firefighting & Rescue Vehicle
Special Equipments
Firefighting Man Power
Gap in Operational Fire Stations 64% 80% 88%
Gap in Ooperational and new urban Fire Stations only
10% 66% 82% 89%
Total Gap in Operational, new (urban and rural) Fire Stations
64% 82% 91% 93%
Fire Prevention Wing
In addition to fire fighting staff, there is an urgent need for fire prevention wing for inspection, awareness generation, and training for schools, colleges, hospitals, shopping malls, cinema
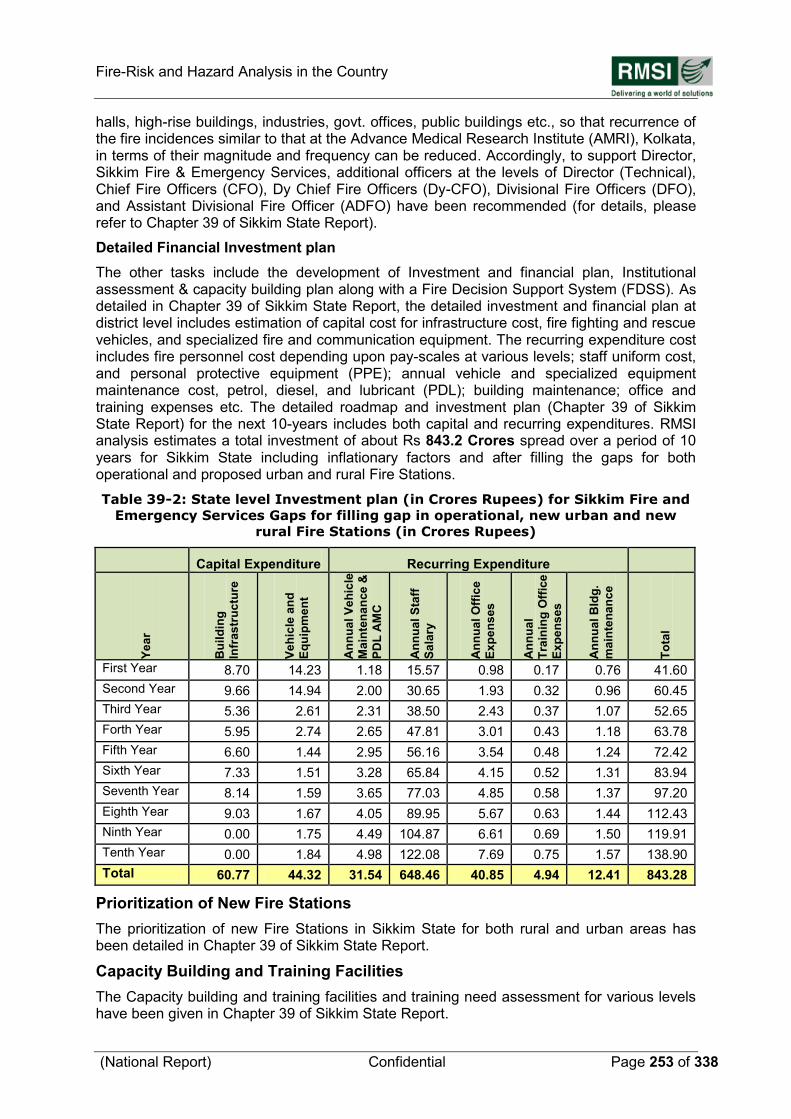
Fire-Risk and Hazard Analysis in the Country
(National Report) Confidential Page 253 of 338
halls, high-rise buildings, industries, govt. offices, public buildings etc., so that recurrence of the fire incidences similar to that at the Advance Medical Research Institute (AMRI), Kolkata, in terms of their magnitude and frequency can be reduced. Accordingly, to support Director, Sikkim Fire & Emergency Services, additional officers at the levels of Director (Technical), Chief Fire Officers (CFO), Dy Chief Fire Officers (Dy-CFO), Divisional Fire Officers (DFO), and Assistant Divisional Fire Officer (ADFO) have been recommended (for details, please refer to Chapter 39 of Sikkim State Report).
Detailed Financial Investment plan
The other tasks include the development of Investment and financial plan, Institutional assessment & capacity building plan along with a Fire Decision Support System (FDSS). As detailed in Chapter 39 of Sikkim State Report, the detailed investment and financial plan at district level includes estimation of capital cost for infrastructure cost, fire fighting and rescue vehicles, and specialized fire and communication equipment. The recurring expenditure cost includes fire personnel cost depending upon pay-scales at various levels; staff uniform cost, and personal protective equipment (PPE); annual vehicle and specialized equipment maintenance cost, petrol, diesel, and lubricant (PDL); building maintenance; office and training expenses etc. The detailed roadmap and investment plan (Chapter 39 of Sikkim State Report) for the next 10-years includes both capital and recurring expenditures. RMSI analysis estimates a total investment of about Rs 843.2 Crores spread over a period of 10 years for Sikkim State including inflationary factors and after filling the gaps for both operational and proposed urban and rural Fire Stations.
Table 39-2: State level Investment plan (in Crores Rupees) for Sikkim Fire and
Emergency Services Gaps for filling gap in operational, new urban and new
rural Fire Stations (in Crores Rupees)
Capital Expenditure Recurring Expenditure
Ye
ar
Bu
ild
ing
Infr
as
tru
ctu
re
Ve
hic
le a
nd
Eq
uip
me
nt
An
nu
al
Ve
hic
le
Ma
inte
na
nce
&
PD
L A
MC
An
nu
al
Sta
ff
Sa
lary
An
nu
al
Off
ice
Ex
pe
ns
es
An
nu
al
Tra
inin
g O
ffic
e
Ex
pe
ns
es
An
nu
al
Bld
g.
ma
inte
na
nc
e
To
tal
First Year 8.70 14.23 1.18 15.57 0.98 0.17 0.76 41.60
Second Year 9.66 14.94 2.00 30.65 1.93 0.32 0.96 60.45
Third Year 5.36 2.61 2.31 38.50 2.43 0.37 1.07 52.65
Forth Year 5.95 2.74 2.65 47.81 3.01 0.43 1.18 63.78
Fifth Year 6.60 1.44 2.95 56.16 3.54 0.48 1.24 72.42
Sixth Year 7.33 1.51 3.28 65.84 4.15 0.52 1.31 83.94
Seventh Year 8.14 1.59 3.65 77.03 4.85 0.58 1.37 97.20
Eighth Year 9.03 1.67 4.05 89.95 5.67 0.63 1.44 112.43
Ninth Year 0.00 1.75 4.49 104.87 6.61 0.69 1.50 119.91
Tenth Year 0.00 1.84 4.98 122.08 7.69 0.75 1.57 138.90
Total 60.77 44.32 31.54 648.46 40.85 4.94 12.41 843.28
Prioritization of New Fire Stations
The prioritization of new Fire Stations in Sikkim State for both rural and urban areas has been detailed in Chapter 39 of Sikkim State Report.
Capacity Building and Training Facilities
The Capacity building and training facilities and training need assessment for various levels have been given in Chapter 39 of Sikkim State Report.
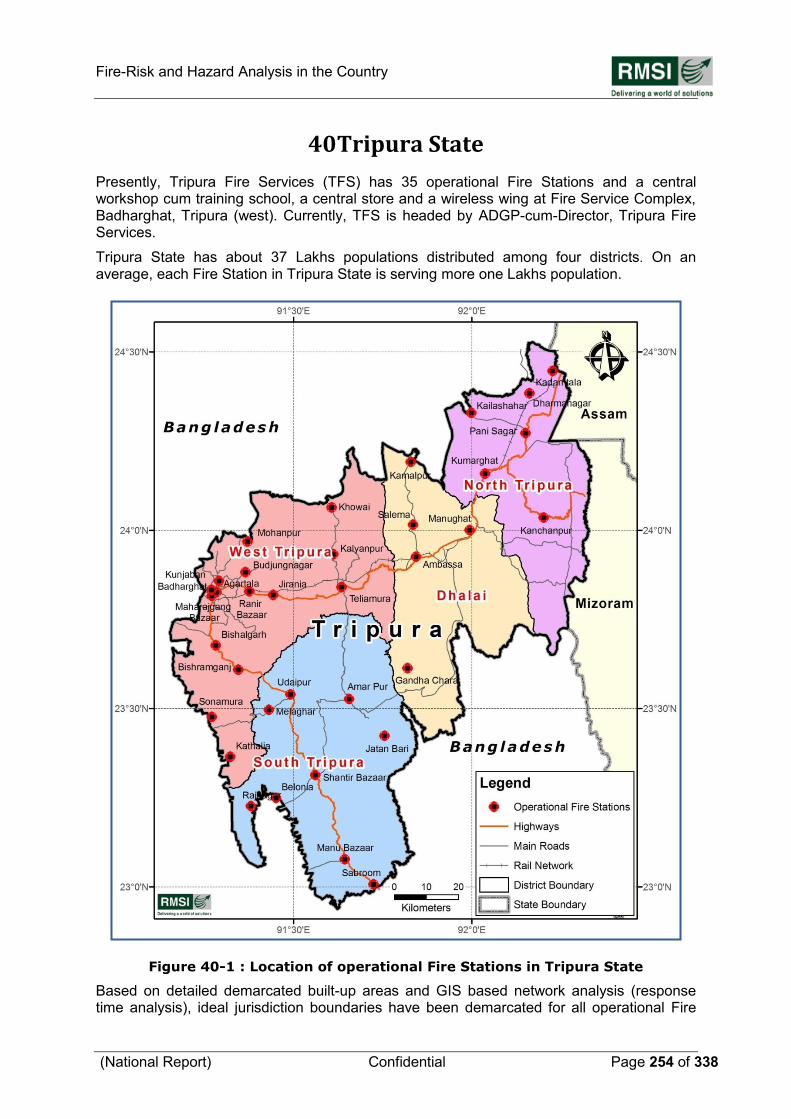
Fire-Risk and Hazard Analysis in the Country
(National Report) Confidential Page 254 of 338
40 Tripura State
Presently, Tripura Fire Services (TFS) has 35 operational Fire Stations and a central workshop cum training school, a central store and a wireless wing at Fire Service Complex, Badharghat, Tripura (west). Currently, TFS is headed by ADGP-cum-Director, Tripura Fire Services.
Tripura State has about 37 Lakhs populations distributed among four districts. On an average, each Fire Station in Tripura State is serving more one Lakhs population.
Figure 40-1 : Location of operational Fire Stations in Tripura State Based on detailed demarcated built-up areas and GIS based network analysis (response time analysis), ideal jurisdiction boundaries have been demarcated for all operational Fire
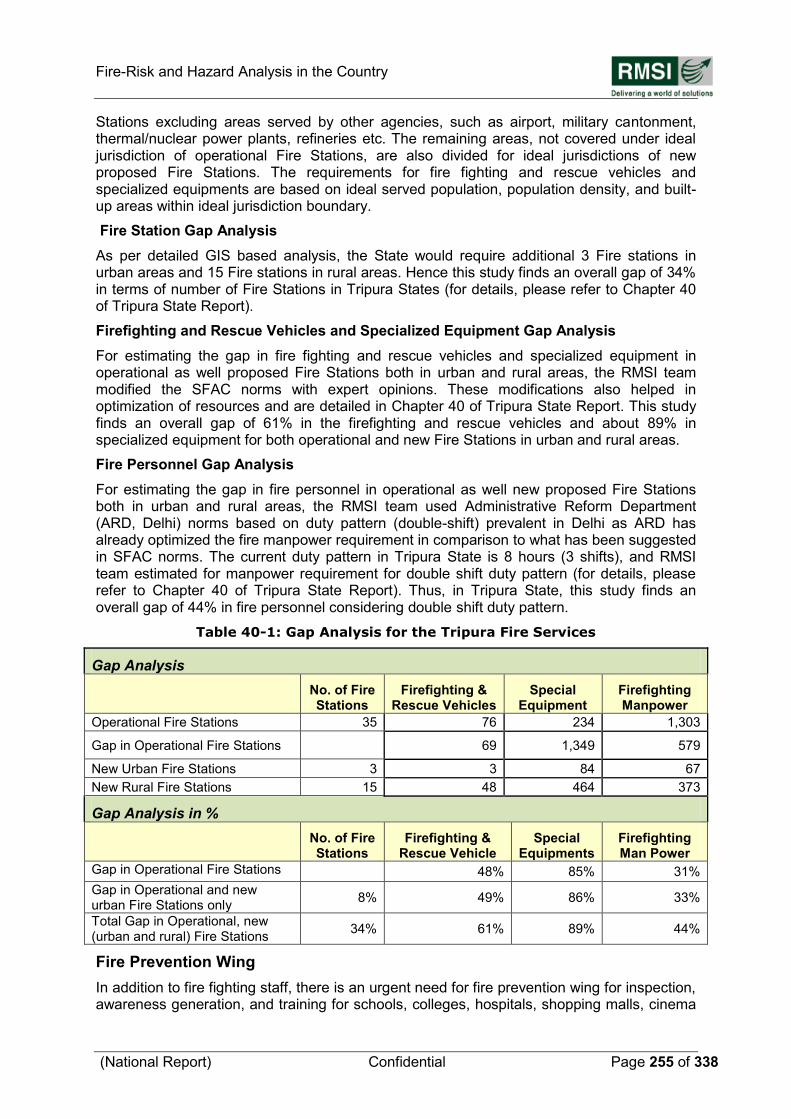
Fire-Risk and Hazard Analysis in the Country
(National Report) Confidential Page 255 of 338
Stations excluding areas served by other agencies, such as airport, military cantonment, thermal/nuclear power plants, refineries etc. The remaining areas, not covered under ideal jurisdiction of operational Fire Stations, are also divided for ideal jurisdictions of new proposed Fire Stations. The requirements for fire fighting and rescue vehicles and specialized equipments are based on ideal served population, population density, and built-up areas within ideal jurisdiction boundary.
Fire Station Gap Analysis
As per detailed GIS based analysis, the State would require additional 3 Fire stations in urban areas and 15 Fire stations in rural areas. Hence this study finds an overall gap of 34% in terms of number of Fire Stations in Tripura States (for details, please refer to Chapter 40 of Tripura State Report).
Firefighting and Rescue Vehicles and Specialized Equipment Gap Analysis
For estimating the gap in fire fighting and rescue vehicles and specialized equipment in operational as well proposed Fire Stations both in urban and rural areas, the RMSI team modified the SFAC norms with expert opinions. These modifications also helped in optimization of resources and are detailed in Chapter 40 of Tripura State Report. This study finds an overall gap of 61% in the firefighting and rescue vehicles and about 89% in specialized equipment for both operational and new Fire Stations in urban and rural areas.
Fire Personnel Gap Analysis
For estimating the gap in fire personnel in operational as well new proposed Fire Stations both in urban and rural areas, the RMSI team used Administrative Reform Department (ARD, Delhi) norms based on duty pattern (double-shift) prevalent in Delhi as ARD has already optimized the fire manpower requirement in comparison to what has been suggested in SFAC norms. The current duty pattern in Tripura State is 8 hours (3 shifts), and RMSI team estimated for manpower requirement for double shift duty pattern (for details, please refer to Chapter 40 of Tripura State Report). Thus, in Tripura State, this study finds an overall gap of 44% in fire personnel considering double shift duty pattern.
Table 40-1: Gap Analysis for the Tripura Fire Services
Gap Analysis
No. of Fire Stations
Firefighting & Rescue Vehicles
Special Equipment
Firefighting Manpower
Operational Fire Stations 35 76 234 1,303
Gap in Operational Fire Stations 69 1,349 579
New Urban Fire Stations 3 3 84 67
New Rural Fire Stations 15 48 464 373
Gap Analysis in %
No. of Fire Stations
Firefighting & Rescue Vehicle
Special Equipments
Firefighting Man Power
Gap in Operational Fire Stations 48% 85% 31%
Gap in Operational and new urban Fire Stations only
8% 49% 86% 33%
Total Gap in Operational, new (urban and rural) Fire Stations
34% 61% 89% 44%
Fire Prevention Wing
In addition to fire fighting staff, there is an urgent need for fire prevention wing for inspection, awareness generation, and training for schools, colleges, hospitals, shopping malls, cinema
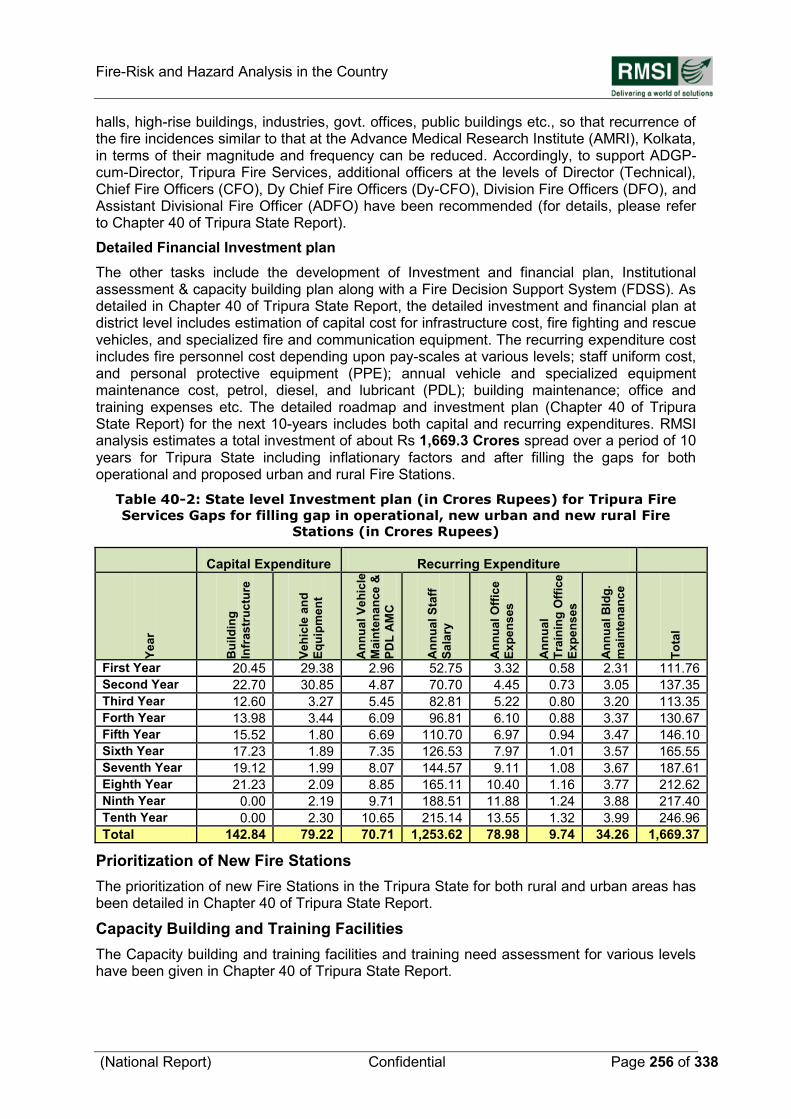
Fire-Risk and Hazard Analysis in the Country
(National Report) Confidential Page 256 of 338
halls, high-rise buildings, industries, govt. offices, public buildings etc., so that recurrence of the fire incidences similar to that at the Advance Medical Research Institute (AMRI), Kolkata, in terms of their magnitude and frequency can be reduced. Accordingly, to support ADGP-cum-Director, Tripura Fire Services, additional officers at the levels of Director (Technical), Chief Fire Officers (CFO), Dy Chief Fire Officers (Dy-CFO), Division Fire Officers (DFO), and Assistant Divisional Fire Officer (ADFO) have been recommended (for details, please refer to Chapter 40 of Tripura State Report).
Detailed Financial Investment plan
The other tasks include the development of Investment and financial plan, Institutional assessment & capacity building plan along with a Fire Decision Support System (FDSS). As detailed in Chapter 40 of Tripura State Report, the detailed investment and financial plan at district level includes estimation of capital cost for infrastructure cost, fire fighting and rescue vehicles, and specialized fire and communication equipment. The recurring expenditure cost includes fire personnel cost depending upon pay-scales at various levels; staff uniform cost, and personal protective equipment (PPE); annual vehicle and specialized equipment maintenance cost, petrol, diesel, and lubricant (PDL); building maintenance; office and training expenses etc. The detailed roadmap and investment plan (Chapter 40 of Tripura State Report) for the next 10-years includes both capital and recurring expenditures. RMSI analysis estimates a total investment of about Rs 1,669.3 Crores spread over a period of 10 years for Tripura State including inflationary factors and after filling the gaps for both operational and proposed urban and rural Fire Stations.
Table 40-2: State level Investment plan (in Crores Rupees) for Tripura Fire
Services Gaps for filling gap in operational, new urban and new rural Fire
Stations (in Crores Rupees)
Capital Expenditure Recurring Expenditure
Ye
ar
Bu
ild
ing
Infr
as
tru
ctu
re
Ve
hic
le a
nd
Eq
uip
me
nt
An
nu
al
Ve
hic
le
Ma
inte
na
nce
&
PD
L A
MC
An
nu
al
Sta
ff
Sa
lary
An
nu
al
Off
ice
Ex
pe
ns
es
An
nu
al
Tra
inin
g O
ffic
e
Ex
pe
ns
es
An
nu
al
Bld
g.
ma
inte
na
nc
e
To
tal
First Year 20.45 29.38 2.96 52.75 3.32 0.58 2.31 111.76
Second Year 22.70 30.85 4.87 70.70 4.45 0.73 3.05 137.35
Third Year 12.60 3.27 5.45 82.81 5.22 0.80 3.20 113.35
Forth Year 13.98 3.44 6.09 96.81 6.10 0.88 3.37 130.67
Fifth Year 15.52 1.80 6.69 110.70 6.97 0.94 3.47 146.10
Sixth Year 17.23 1.89 7.35 126.53 7.97 1.01 3.57 165.55
Seventh Year 19.12 1.99 8.07 144.57 9.11 1.08 3.67 187.61
Eighth Year 21.23 2.09 8.85 165.11 10.40 1.16 3.77 212.62
Ninth Year 0.00 2.19 9.71 188.51 11.88 1.24 3.88 217.40
Tenth Year 0.00 2.30 10.65 215.14 13.55 1.32 3.99 246.96
Total 142.84 79.22 70.71 1,253.62 78.98 9.74 34.26 1,669.37
Prioritization of New Fire Stations
The prioritization of new Fire Stations in the Tripura State for both rural and urban areas has been detailed in Chapter 40 of Tripura State Report.
Capacity Building and Training Facilities
The Capacity building and training facilities and training need assessment for various levels have been given in Chapter 40 of Tripura State Report.
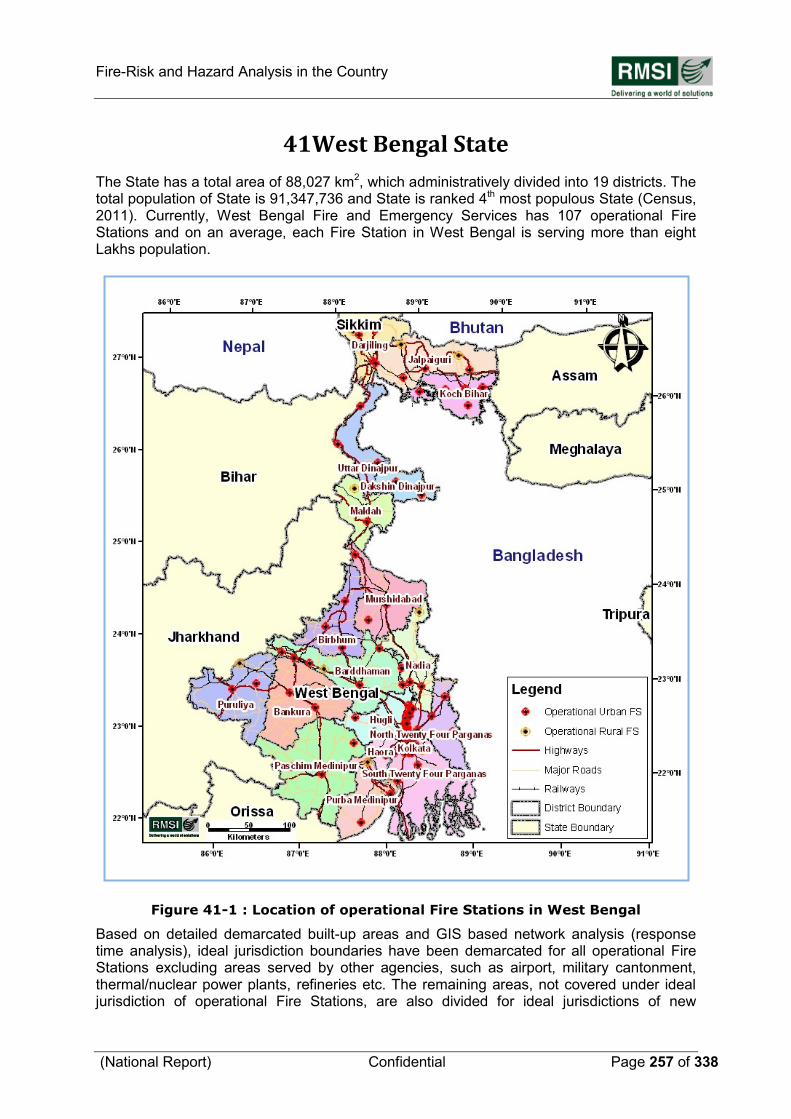
Fire-Risk and Hazard Analysis in the Country
(National Report) Confidential Page 257 of 338
41 West Bengal State
The State has a total area of 88,027 km2, which administratively divided into 19 districts. The total population of State is 91,347,736 and State is ranked 4th most populous State (Census, 2011). Currently, West Bengal Fire and Emergency Services has 107 operational Fire Stations and on an average, each Fire Station in West Bengal is serving more than eight Lakhs population.
Figure 41-1 : Location of operational Fire Stations in West Bengal Based on detailed demarcated built-up areas and GIS based network analysis (response time analysis), ideal jurisdiction boundaries have been demarcated for all operational Fire Stations excluding areas served by other agencies, such as airport, military cantonment, thermal/nuclear power plants, refineries etc. The remaining areas, not covered under ideal jurisdiction of operational Fire Stations, are also divided for ideal jurisdictions of new
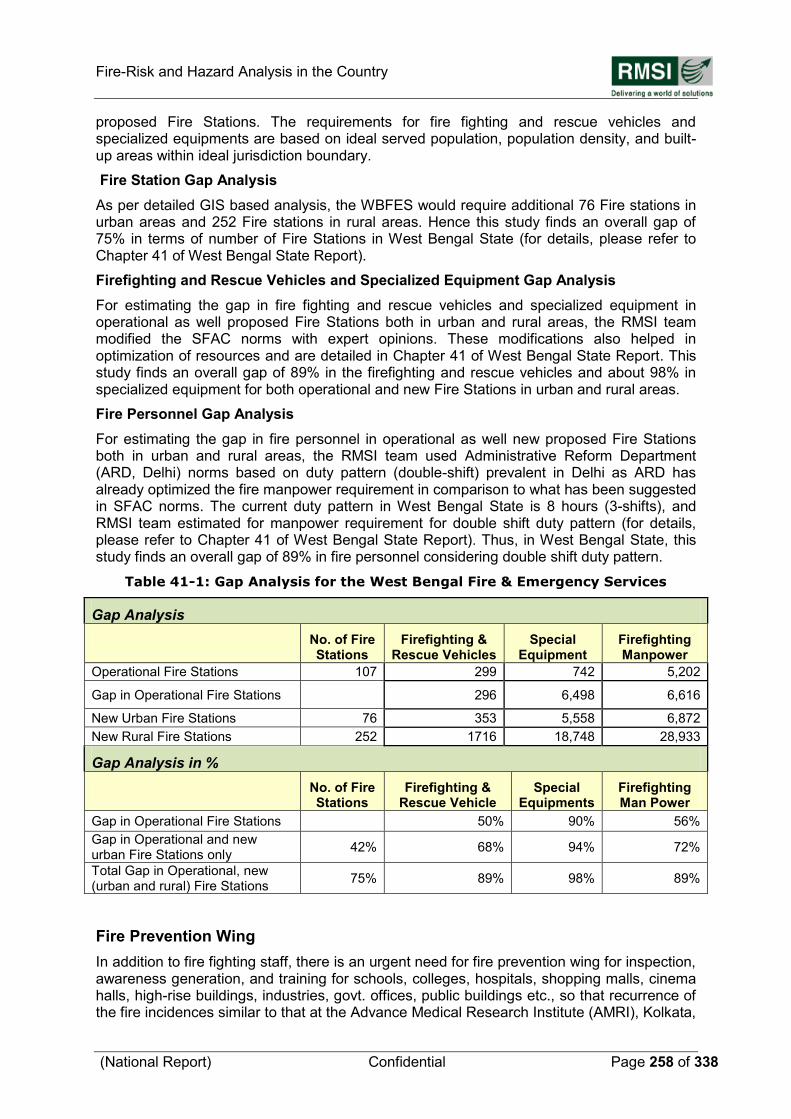
Fire-Risk and Hazard Analysis in the Country
(National Report) Confidential Page 258 of 338
proposed Fire Stations. The requirements for fire fighting and rescue vehicles and specialized equipments are based on ideal served population, population density, and built-up areas within ideal jurisdiction boundary.
Fire Station Gap Analysis
As per detailed GIS based analysis, the WBFES would require additional 76 Fire stations in urban areas and 252 Fire stations in rural areas. Hence this study finds an overall gap of 75% in terms of number of Fire Stations in West Bengal State (for details, please refer to Chapter 41 of West Bengal State Report).
Firefighting and Rescue Vehicles and Specialized Equipment Gap Analysis
For estimating the gap in fire fighting and rescue vehicles and specialized equipment in operational as well proposed Fire Stations both in urban and rural areas, the RMSI team modified the SFAC norms with expert opinions. These modifications also helped in optimization of resources and are detailed in Chapter 41 of West Bengal State Report. This study finds an overall gap of 89% in the firefighting and rescue vehicles and about 98% in specialized equipment for both operational and new Fire Stations in urban and rural areas.
Fire Personnel Gap Analysis
For estimating the gap in fire personnel in operational as well new proposed Fire Stations both in urban and rural areas, the RMSI team used Administrative Reform Department (ARD, Delhi) norms based on duty pattern (double-shift) prevalent in Delhi as ARD has already optimized the fire manpower requirement in comparison to what has been suggested in SFAC norms. The current duty pattern in West Bengal State is 8 hours (3-shifts), and RMSI team estimated for manpower requirement for double shift duty pattern (for details, please refer to Chapter 41 of West Bengal State Report). Thus, in West Bengal State, this study finds an overall gap of 89% in fire personnel considering double shift duty pattern.
Table 41-1: Gap Analysis for the West Bengal Fire & Emergency Services
Gap Analysis
No. of Fire Stations
Firefighting & Rescue Vehicles
Special Equipment
Firefighting Manpower
Operational Fire Stations 107 299 742 5,202
Gap in Operational Fire Stations 296 6,498 6,616
New Urban Fire Stations 76 353 5,558 6,872
New Rural Fire Stations 252 1716 18,748 28,933
Gap Analysis in %
No. of Fire Stations
Firefighting & Rescue Vehicle
Special Equipments
Firefighting Man Power
Gap in Operational Fire Stations 50% 90% 56%
Gap in Operational and new urban Fire Stations only
42% 68% 94% 72%
Total Gap in Operational, new (urban and rural) Fire Stations
75% 89% 98% 89%
Fire Prevention Wing
In addition to fire fighting staff, there is an urgent need for fire prevention wing for inspection, awareness generation, and training for schools, colleges, hospitals, shopping malls, cinema halls, high-rise buildings, industries, govt. offices, public buildings etc., so that recurrence of the fire incidences similar to that at the Advance Medical Research Institute (AMRI), Kolkata,
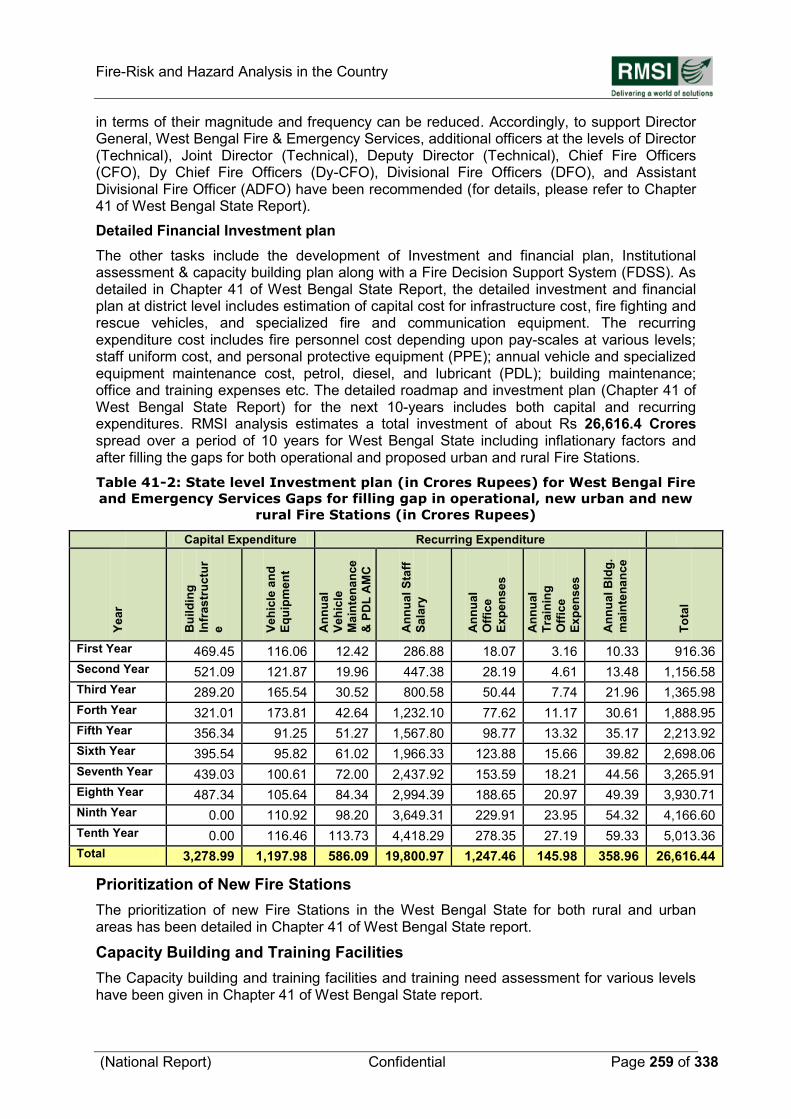
Fire-Risk and Hazard Analysis in the Country
(National Report) Confidential Page 259 of 338
in terms of their magnitude and frequency can be reduced. Accordingly, to support Director General, West Bengal Fire & Emergency Services, additional officers at the levels of Director (Technical), Joint Director (Technical), Deputy Director (Technical), Chief Fire Officers (CFO), Dy Chief Fire Officers (Dy-CFO), Divisional Fire Officers (DFO), and Assistant Divisional Fire Officer (ADFO) have been recommended (for details, please refer to Chapter 41 of West Bengal State Report).
Detailed Financial Investment plan
The other tasks include the development of Investment and financial plan, Institutional assessment & capacity building plan along with a Fire Decision Support System (FDSS). As detailed in Chapter 41 of West Bengal State Report, the detailed investment and financial plan at district level includes estimation of capital cost for infrastructure cost, fire fighting and rescue vehicles, and specialized fire and communication equipment. The recurring expenditure cost includes fire personnel cost depending upon pay-scales at various levels; staff uniform cost, and personal protective equipment (PPE); annual vehicle and specialized equipment maintenance cost, petrol, diesel, and lubricant (PDL); building maintenance; office and training expenses etc. The detailed roadmap and investment plan (Chapter 41 of West Bengal State Report) for the next 10-years includes both capital and recurring expenditures. RMSI analysis estimates a total investment of about Rs 26,616.4 Crores spread over a period of 10 years for West Bengal State including inflationary factors and after filling the gaps for both operational and proposed urban and rural Fire Stations.
Table 41-2: State level Investment plan (in Crores Rupees) for West Bengal Fire
and Emergency Services Gaps for filling gap in operational, new urban and new
rural Fire Stations (in Crores Rupees)
Capital Expenditure Recurring Expenditure
Ye
ar
Bu
ild
ing
Infr
as
tru
ctu
r
e
Ve
hic
le a
nd
Eq
uip
me
nt
An
nu
al
Ve
hic
le
Ma
inte
na
nce
& P
DL
AM
C
An
nu
al
Sta
ff
Sa
lary
An
nu
al
Off
ice
Ex
pe
ns
es
An
nu
al
Tra
inin
g
Off
ice
Ex
pe
ns
es
An
nu
al
Bld
g.
ma
inte
na
nc
e
To
tal
First Year 469.45 116.06 12.42 286.88 18.07 3.16 10.33 916.36
Second Year 521.09 121.87 19.96 447.38 28.19 4.61 13.48 1,156.58
Third Year 289.20 165.54 30.52 800.58 50.44 7.74 21.96 1,365.98
Forth Year 321.01 173.81 42.64 1,232.10 77.62 11.17 30.61 1,888.95
Fifth Year 356.34 91.25 51.27 1,567.80 98.77 13.32 35.17 2,213.92
Sixth Year 395.54 95.82 61.02 1,966.33 123.88 15.66 39.82 2,698.06
Seventh Year 439.03 100.61 72.00 2,437.92 153.59 18.21 44.56 3,265.91
Eighth Year 487.34 105.64 84.34 2,994.39 188.65 20.97 49.39 3,930.71
Ninth Year 0.00 110.92 98.20 3,649.31 229.91 23.95 54.32 4,166.60
Tenth Year 0.00 116.46 113.73 4,418.29 278.35 27.19 59.33 5,013.36
Total 3,278.99 1,197.98 586.09 19,800.97 1,247.46 145.98 358.96 26,616.44
Prioritization of New Fire Stations
The prioritization of new Fire Stations in the West Bengal State for both rural and urban areas has been detailed in Chapter 41 of West Bengal State report.
Capacity Building and Training Facilities
The Capacity building and training facilities and training need assessment for various levels have been given in Chapter 41 of West Bengal State report.

Fire-Risk and Hazard Analysis in the Country
(National Report) Confidential Page 260 of 338
PART C
Fire-Risk and Hazard Analysis in the Country
(National Report) Confidential Page 261 of 338
42 Fire Services in India
42.1 Introduction
In India, fire service is one of the most important emergency response services. In India, Fire Services come under the 12th Schedule of the constitution dealing with Municipal functions. At present, fire prevention and fire fighting services are organized by the concerned States and Union Territories (UTs), and Urban Local Bodies (ULBs). As per a recent analysis by the Standing Fire and Advisory Council (SFAC), the overall deficiency in the country in terms of number of Fire Stations is 97.54%, in terms of fire fighting and rescue vehicles is 80.04% and in terms of fire personnel is 96.28%, respectively, which is quite alarming (NDMA Guideline, 2012, CR SFAC, 2011).
The growth of fire-services in India has been on an ad-hoc basis, without much scientific analysis of existing fire risks in different parts of the country. Varying risk scenarios need different types of equipment to combat fire. The risk varies with geographical location such as hilly-area, coastal-area, desert–area, and with residential (high-rise, medium, and low rise-buildings), industrial, commercial area or a combination of these. Moreover, lack of knowledge management for future planning and institutional capacity and funds are also seen as major challenges in addressing improvements in fire and emergency services in the country.
As far as the role of fire services is concerned, the primary job of fire services has been to attend to fire incidents. However, they also attend to other emergencies like rescue from building collapse, road traffic accidents, human and animal rescue etc., and other special service calls. Some fire services also attend medical emergencies for transportation of casualties through ambulances maintained by them. Similarly, some States have separate flood department with rescue boats and trained divers, like Delhi. The Fire Services maintain skeleton facility to act as „first responder‟ and wait until assistance from flood department is reached. It is therefore, considered appropriate that the specialized facilities for such job is maintained and operated by the concerned department.
The role of fire services also includes effective fire prevention, creating awareness on fire safety, and enforcing the inbuilt fire protection arrangements for various types of occupancies in line with National Building Code (NBC) part – IV. However, some of the States/Municipal Fire Services are unable to enforce the fire safety provisions due to a lack of appropriate directives from the authorities controlling the function of fire services. Some of the Fire Services do not adhere to NBC and have created their own fire-safety building bye - laws, e.g., Mumbai Fire Brigade. It may be noted that in-built fire safety arrangements and escape facilities are much more important than having a fire service within the premises without the above facilities. It is, therefore, necessary to enforce the fire-safety provisions through appropriate directives to all the States/UTs by the Ministry of Home Affairs (MHA) directly or through DG, NDRF & CD office.
In addition to the regular fire services, various other organizations/ industries, such as Ports, Airports, Defence, Power, Oil and Gas, Steel, Heavy Engineering, Fertilizers, Chemicals etc. have their own fire service set-ups (including their own captive resources), in order to provide fire protection to their facilities and some of them at times provide support to local fire services on request. All of them have their rules and regulations concerning fire safety. For example, Oil India Safety Directorate (OISD) norms for Oil and Gas Industries, International Civil Aviation Organization (ICAO) norms for Airports, Tariff Advisory Committee (TAC) regulations- now discontinued, for industries etc. and Electricity Rules for power sector.
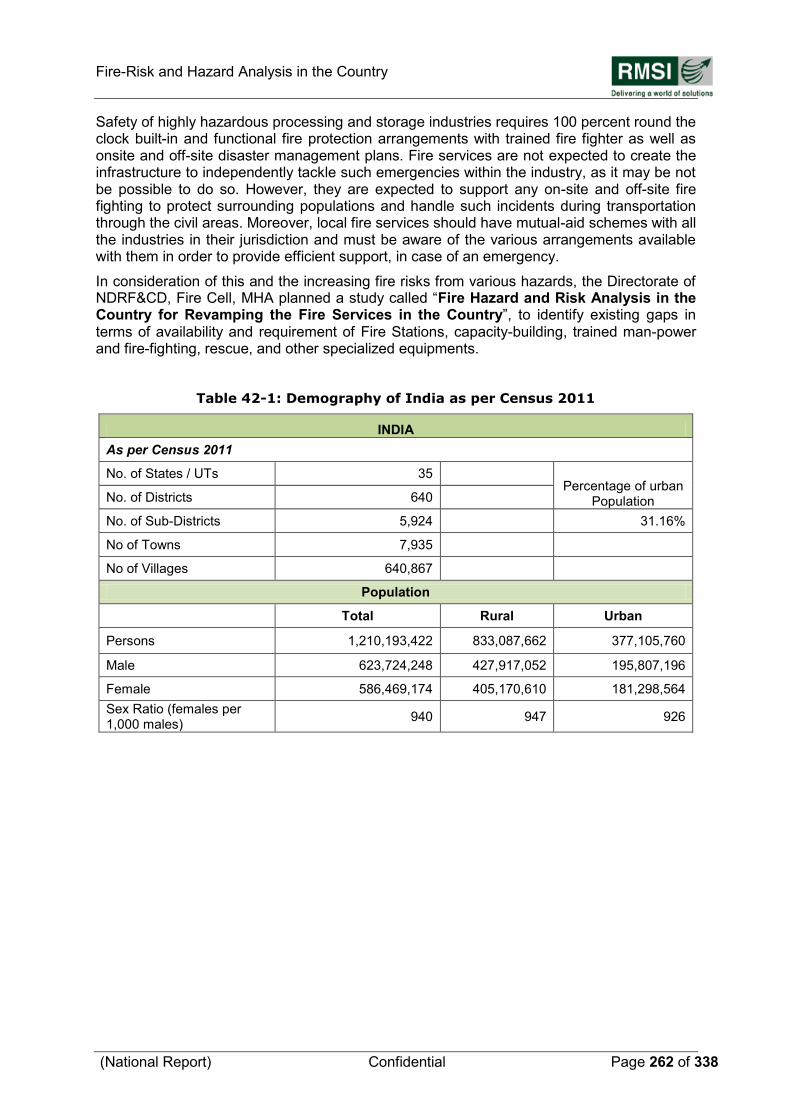
Fire-Risk and Hazard Analysis in the Country
(National Report) Confidential Page 262 of 338
Safety of highly hazardous processing and storage industries requires 100 percent round the clock built-in and functional fire protection arrangements with trained fire fighter as well as onsite and off-site disaster management plans. Fire services are not expected to create the infrastructure to independently tackle such emergencies within the industry, as it may be not be possible to do so. However, they are expected to support any on-site and off-site fire fighting to protect surrounding populations and handle such incidents during transportation through the civil areas. Moreover, local fire services should have mutual-aid schemes with all the industries in their jurisdiction and must be aware of the various arrangements available with them in order to provide efficient support, in case of an emergency.
In consideration of this and the increasing fire risks from various hazards, the Directorate of NDRF&CD, Fire Cell, MHA planned a study called “Fire Hazard and Risk Analysis in the Country for Revamping the Fire Services in the Country”, to identify existing gaps in terms of availability and requirement of Fire Stations, capacity-building, trained man-power and fire-fighting, rescue, and other specialized equipments.
Table 42-1: Demography of India as per Census 2011
INDIA
As per Census 2011
No. of States / UTs 35
Percentage of urban
Population No. of Districts 640
No. of Sub-Districts 5,924
31.16%
No of Towns 7,935
No of Villages 640,867
Population
Total Rural Urban
Persons 1,210,193,422 833,087,662 377,105,760
Male 623,724,248 427,917,052 195,807,196
Female 586,469,174 405,170,610 181,298,564
Sex Ratio (females per 1,000 males)
940 947 926
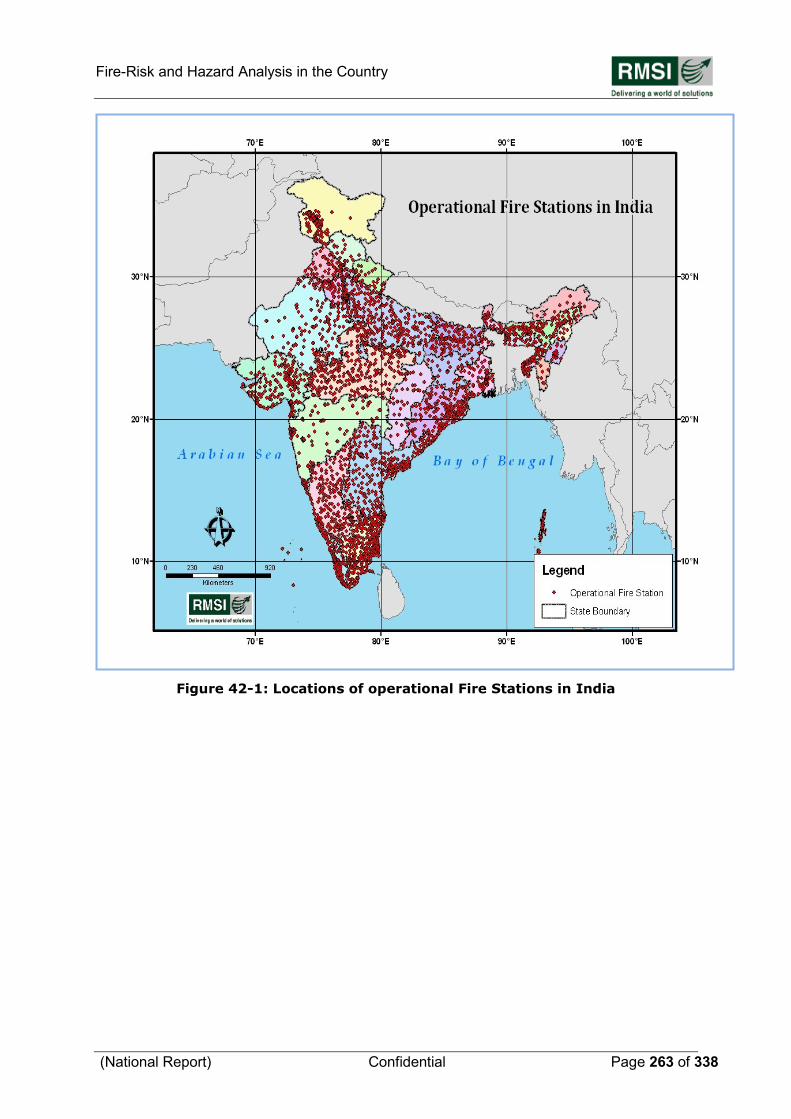
Fire-Risk and Hazard Analysis in the Country
(National Report) Confidential Page 263 of 338
Figure 42-1: Locations of operational Fire Stations in India
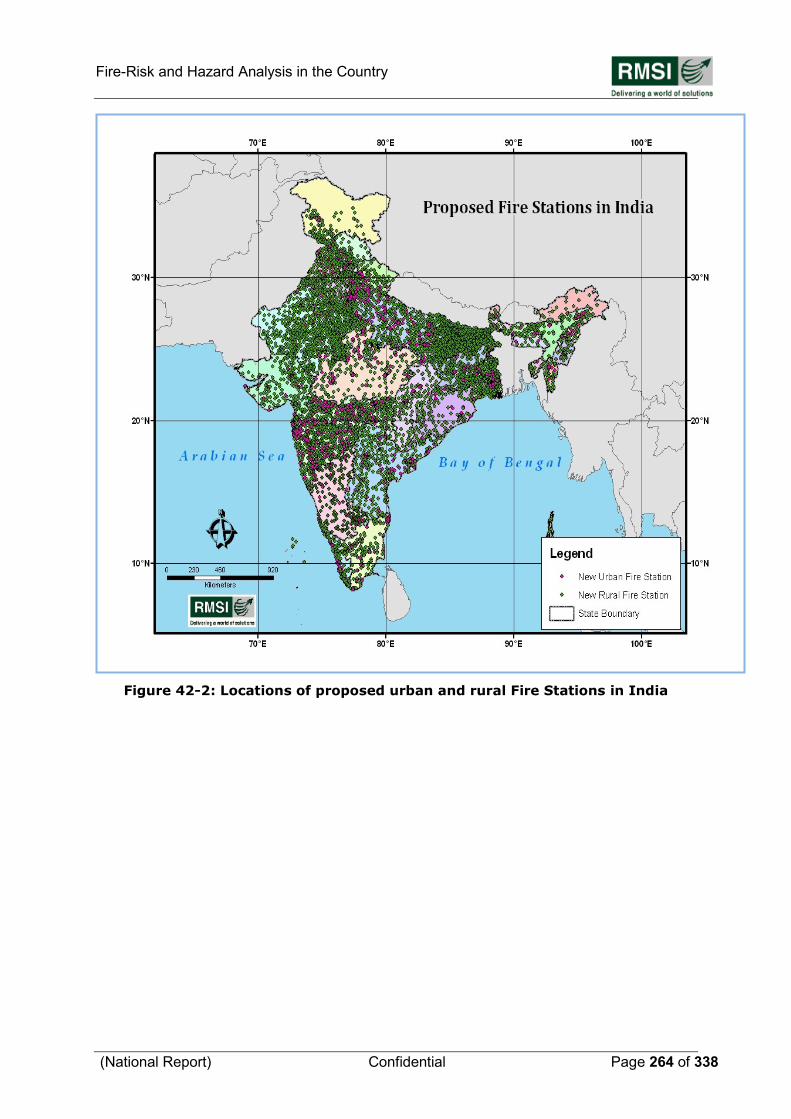
Fire-Risk and Hazard Analysis in the Country
(National Report) Confidential Page 264 of 338
Figure 42-2: Locations of proposed urban and rural Fire Stations in India
Fire-Risk and Hazard Analysis in the Country
(National Report) Confidential Page 265 of 338
42.2 Field Surveys of Fire Stations for Data Collection
To have first-hand information on the distribution of the fire service stations across the country, infrastructure availability and their status, fire fighting manpower etc., RMSI project team has carried out detailed surveys of Fire Stations and collected data though individual “Fire Station Survey Form” and Fire Headquarter Data Collection Form” as shown in Annexure 1 & 2. The collected information for each Fire Station is following categories:
1. Fire station general information
2. Fire station infrastructure details
3. Communication systems
4. Water supply details for firefighting purpose
5. Human resources
6. Fire risk covered in the area under jurisdiction
7. Status of fire fighting vehicles
8. Specialized equipments provided (Specify whether kept in vehicle or in stores)
9. Other accessories
10. Fire calls and other fire incidence statistics (last 3-5 years)
Besides the collection of field survey data, RMSI team has also collected the location coordinates (latitude, longitude) of Fire Stations using Geo Positioning System (GPS). The geographical coordinate information is used for plotting all the Fire Station locations in the map to perform GIS based spatial analyses. This is also used in the analysis of distribution of new proposed Fire Stations and gap analysis on fire-infrastructure, based on risk-category, response time, and population criteria.
42.3 Infrastructure Gap Analysis
42.3.1 FIRE STATION LOCATION GAP ANALYSIS
As discussed in section 6.2.5, response time of 5-7 minutes in urban area and 20 minutes in rural area has been considered. With network analysis, ideal jurisdiction areas have been delineated for all operating Fire Stations. In delineation of ideal jurisdiction areas, built-up areas such as various types of residential areas and industrial areas with estimated population has also been considered. After delineation of ideal jurisdiction area, un-served gaps in urban agglomeration have been identified. These un-served gaps are shown to be filled by new proposed urban Fire Stations. Table 42-2 shows State level summary of number of operational and new proposed Fire Stations with population covered within their ideal jurisdiction area.
Rural areas of entire India similarly covered with new rural Fire Stations. It may be noted that rural populations are very sparsely distributed in the State. Hence, locations of rural Fire Stations are demarcated to the nearest relatively bigger village having population of more than 5,000 -10,000 or major roads intersection. State/UT level numbers of new urban and new rural Fire Stations are given in Table 42-2. Figures 42-1 to 42-2 depict representative detailed maps showing delineated ideal jurisdiction areas for operational and new proposed urban Fire Stations and locations of new rural Fire Stations in entire India.
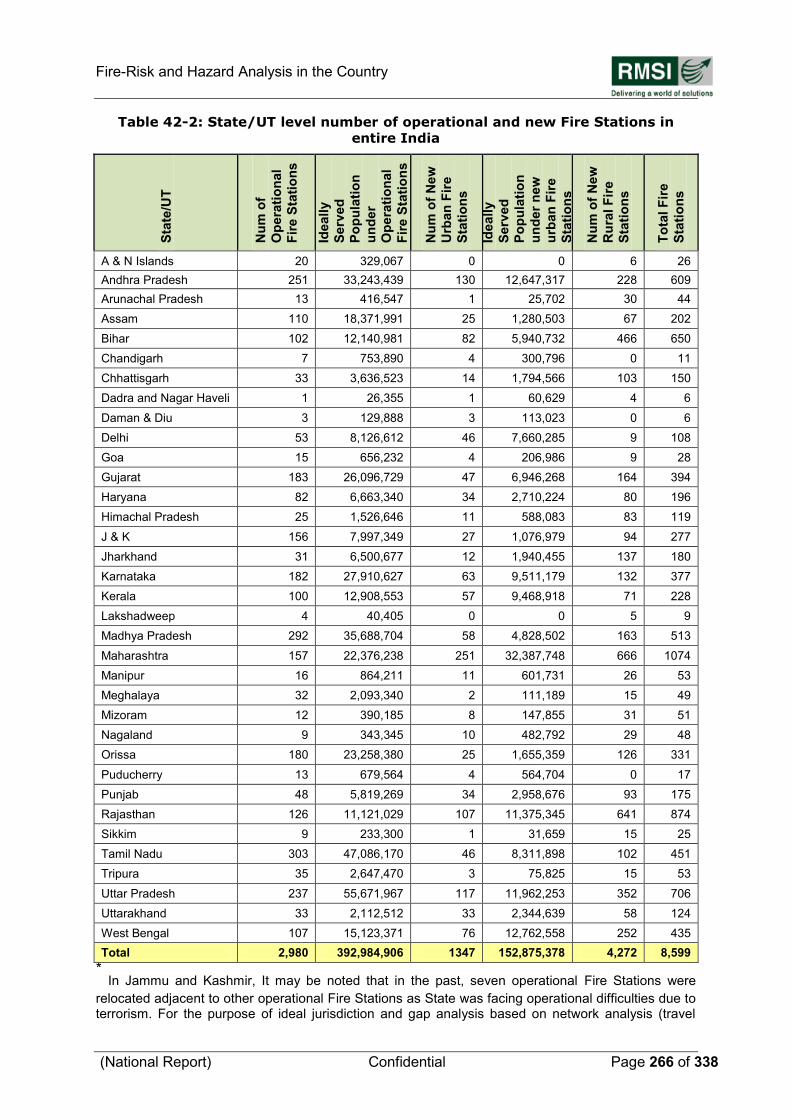
Fire-Risk and Hazard Analysis in the Country
(National Report) Confidential Page 266 of 338
Table 42-2: State/UT level number of operational and new Fire Stations in
entire India
Sta
te/U
T
Nu
m o
f
Op
era
tio
nal
Fir
e S
tati
on
s
Ideally
Serv
ed
Po
pu
lati
on
un
der
Op
era
tio
nal
Fir
e S
tati
on
s
Nu
m o
f N
ew
Urb
an
Fir
e
Sta
tio
ns
Ideally
Serv
ed
Po
pu
lati
on
un
der
new
urb
an
Fir
e
Sta
tio
ns
Nu
m o
f N
ew
Ru
ral F
ire
Sta
tio
ns
To
tal F
ire
Sta
tio
ns
A & N Islands 20 329,067 0 0 6 26
Andhra Pradesh 251 33,243,439 130 12,647,317 228 609
Arunachal Pradesh 13 416,547 1 25,702 30 44
Assam 110 18,371,991 25 1,280,503 67 202
Bihar 102 12,140,981 82 5,940,732 466 650
Chandigarh 7 753,890 4 300,796 0 11
Chhattisgarh 33 3,636,523 14 1,794,566 103 150
Dadra and Nagar Haveli 1 26,355 1 60,629 4 6
Daman & Diu 3 129,888 3 113,023 0 6
Delhi 53 8,126,612 46 7,660,285 9 108
Goa 15 656,232 4 206,986 9 28
Gujarat 183 26,096,729 47 6,946,268 164 394
Haryana 82 6,663,340 34 2,710,224 80 196
Himachal Pradesh 25 1,526,646 11 588,083 83 119
J & K 156 7,997,349 27 1,076,979 94 277
Jharkhand 31 6,500,677 12 1,940,455 137 180
Karnataka 182 27,910,627 63 9,511,179 132 377
Kerala 100 12,908,553 57 9,468,918 71 228
Lakshadweep 4 40,405 0 0 5 9
Madhya Pradesh 292 35,688,704 58 4,828,502 163 513
Maharashtra 157 22,376,238 251 32,387,748 666 1074
Manipur 16 864,211 11 601,731 26 53
Meghalaya 32 2,093,340 2 111,189 15 49
Mizoram 12 390,185 8 147,855 31 51
Nagaland 9 343,345 10 482,792 29 48
Orissa 180 23,258,380 25 1,655,359 126 331
Puducherry 13 679,564 4 564,704 0 17
Punjab 48 5,819,269 34 2,958,676 93 175
Rajasthan 126 11,121,029 107 11,375,345 641 874
Sikkim 9 233,300 1 31,659 15 25
Tamil Nadu 303 47,086,170 46 8,311,898 102 451
Tripura 35 2,647,470 3 75,825 15 53
Uttar Pradesh 237 55,671,967 117 11,962,253 352 706
Uttarakhand 33 2,112,512 33 2,344,639 58 124
West Bengal 107 15,123,371 76 12,762,558 252 435
Total 2,980 392,984,906 1347 152,875,378 4,272 8,599
* In Jammu and Kashmir, It may be noted that in the past, seven operational Fire Stations were
relocated adjacent to other operational Fire Stations as State was facing operational difficulties due to terrorism. For the purpose of ideal jurisdiction and gap analysis based on network analysis (travel
Fire-Risk and Hazard Analysis in the Country
(National Report) Confidential Page 267 of 338
distance by first fire vehicle and ideal population served), these Fire Stations are not accounted as separate Fire Stations. Thus, total numbers of operating Fire Stations in the State of Jammu and Kashmir are considered 156 stations for analysis point of view against 163 operational as per State records. Once situation permits, these stations can be relocated to their original/ any other suitable location. Hence, in the analysis section, in all the tables total count of Fire Stations is coming 2,980.
42.3.2 FIRE FIGHTING AND RESCUE VEHICLES AND SPECIALIZED EQUIPMENT GAP
For firefighting and rescue vehicles and specialized equipment gap analysis at the operational Fire Stations and the additional Fire Stations in urban and rural areas, the following criteria have been followed, which have been basically taken from SFAC norms and minor changes have been made with expert opinion, for optimization of resources.
1. Pumping Unit: For counting of existing pumping units at various Fire Stations, equipments such as Fire Tender, Water Bowser, Water Mist Mini Fire Tender, Foam Tender, Crash Fire Tender, Fire Engine, Jumbo Tanker, and Multi-purpose Tender have been counted as one pumping unit. The SFAC criteria with some modifications have been proposed for estimating the requirement of pumping units. Accordingly, one pumping unit per 50,000 populations (subject to minimum one) up to 3 lakhs population has been considered. For population of more than 3 Lakhs, one additional pumping unit per Lakhs of population has been considered. For example, if the population is 3,50,000 or more but less than 4,50,000, there should be 7 pumping units. At Fire Stations, where pumping unit requirements are coming to 2 or more units, half the units will be Water Tender and half the units will be Water Bowser, for example, for 2 pumping unit requirement, one will be Water Tender and one Water Bowser, however, for 3 pumping unit requirement, 2 will be Water Tender and 1 will be Water Bowser. However, in hilly States, the criteria have been further relaxed.
Note: we have considered pumping unit as a complete unit with water carrying capacity pumping unit, however, trailer fire pump with towing vehicle or a jeep fire engine, QRT with mist unit, or motor cycle with mist set have not been considered as a pumping unit. QRT with mist unit or motor cycle with mist set has been considered as a unit to cut response time in congested areas in urban areas.
2. Foam Tender: For those Fire Stations, in whose jurisdiction small industrial area also lie, one Water Tender should be replaced with Foam Tender.
3. DCP Tender: Minimum one per district or one for 8-10 Fire Stations. Fire stations, having a large industrial plot area (in their ideal jurisdiction) of above 1.0 - 3.0 sq km, should have additionally one DCP tender. For industrial areas more than 3.0 - 6.0 sq km, there should be 2 DCP Tenders and so on.
4. Advanced Rescue Tender: One per district (minimum) up to 10 Lakhs population, and one additional unit for every 10 Lakhs urban population.
5. Hydraulic Platform/ALP/TTL: One per district depending upon the presence of high-rise buildings (height more than 15 m). Additional unit is to be provided for districts having a large number of such building blocks, i.e., Central Business Districts.
It may be noted that Hydraulic Platform/ALP/TTL is not a replacement for in-built systems in high-rise buildings. Moreover, equipment is heavy and maneuvering on roads becomes difficult, where there are overhead electrical lines.
6. HAZMAT Van: Hazmat van is used rarely and is a very costly equipment requiring highly trained manpower. Hence, to optimize on resources and manpower, HAZMAT van is not recommended for future procurement in the State/UT. However, for that
Fire-Risk and Hazard Analysis in the Country
(National Report) Confidential Page 268 of 338
purpose, an Advanced Rescue Responder is proposed (at Sr. No 4), which will have equipment to handle hazardous material release.
7. Crash Fire Tender: Crash Fire Tender is not recommended for the State Fire and Emergency Service. Instead, for Fire Stations in the funnel area on either side of the airport, one WT should be replaced with Foam Tender depending upon the State/UT policy.
8. BA Van, Light Van and Control Van: One each per district. However, to optimize on resources and manpower, we are proposing a BA Van- cum-Light Van – cum- Control Van.
9. Hose Tender: One per district (minimum) or one for 8-10 Fire Stations.
10. Trailer Pump: Though Trailer Pumps are prescribed in SFAC norms, it is not recommended for future use, as this needs an additional towing vehicle. In place of this, procurement of Portable Pumps are recommended, which will be part of a Fire Tender (Specialized Equipment at Sl. No. 12).
11. QRT: One each at Fire Stations serving a population density (total population in the FS jurisdiction/area of jurisdiction, in sq km) above 30,000 persons/sq km in metro and big cities, above 15,000 persons/sq km in other cities, or in congested areas based on field-survey and State/UT specific study).
Note: The criteria of population density has been relaxed for hilly State/UT from 15,000 person/sq km (in plains) to 5,000 person/sq km in the Fire Station jurisdiction.
12. Motorcycle with 2-water mist sets: One each at Fire Stations serving higher population density or in congested areas with each QRT.
13. Fire Boat: One each at selected Fire Stations, in whose jurisdiction some inhabitated areas exist near water bodies, such as lake, major river, sea, where fire fighting can be better performed, through watercourse.
14. Ambulance: It is seen that Ambulance services are also with some of the State fire services and in few other States/UTs this is looked after by the Ministry of Health of the States/UTs e.g., Rajasthan State has a modern fleet of Ambulances (108), well equipped with GPS, medical equipments and staff under National Rural Health Mission (Rajasthan), CATS (Centralized Accident Trauma Service, Ministry of Health) in case of Delhi State.
It is observed during visit to the Fire Stations by the RMSI team that wherever the Ambulance are available with fire services, they neither have the Paramedic staff, nor adequate life support/normal equipments, and cannot be considered as an efficient system. It is therefore felt that either ambulance service should be run by Health Department through various hospitals / health centers or provide fully trained staff to fire services with properly equipped Ambulances. Accordingly, cost of the ambulance is not included in the gap analysis of the present study. However, the ambulance cost may be added, in case, it is decided in a particular State/UT that Ambulance service should be part of fire services.
15. Educational Van: One per district and one additional unit for every 30 Lakhs district population.
At rural Fire Station/ Fire Post, if the estimated pumping unit is two, then one water tender with a QRT on pickup truck having 500 - 600 liters of water mist capacity along with a motor cycle with two water mist backpacks will be provided. This will help in quick response, as majority of rural villages inside roads are small in width and congested. This will also help in optimization of resources. For rural Fire Stations/ Fire Posts where less
Fire-Risk and Hazard Analysis in the Country
(National Report) Confidential Page 269 of 338
than 10,000 persons are residing within its jurisdiction, QRT and motor cycle with two water mist backpacks has only been recommended.
It may be noted that if a fire is responded to immediately, it may not flare-up into large fire; hence, QRT and Motorcycle are being considered as a quick responder and not as full-fledged fire units. In case of large fires, nearby Fire Station(s) will provide support with Water Tenders and Water Bowsers.
For reserve requirement, RMSI estimated reserve requirement of 20% at district level, and these will be distributed to individual Fire Stations by the concerned fire officials. This will help in optimizing the additional requirements of minimum one reserve at each Fire Station.
Specialized Equipment:
Specialized equipment for Fire Stations in urban areas shall be provided as per the following criteria:
1. Hydraulic Rescue Tool: One for each Fire Station depending upon the seismic Zone IV and V, or Fire Station having urban population more than 1.5 Lakhs in its ideal jurisdiction including Hydraulic Cutter, Hydraulic Spreader, Hydraulic Pump, Power Wedge, and Hydraulic Rescue Ram depending upon the seismic Zone IV and V or minimum one per district.
2. Combi-Tool: One Combi-Tool set shall be provided with each fire-fighting vehicle.
3. B.A. Set with BA Compressor: Four B. A. Sets per fire fighting vehicle with minimum one compressor per Fire Station
4. First Aid Box: One for each fire fighting vehicle (minimum two at each Fire Station) with regular replacement of expired medicines
5. Thermal Imaging Camera: One for each Fire Station depending upon the seismic Zone IV and V, or Fire Station having urban population more than 1.5 Lakhs in its ideal jurisdiction or minimum one per district
6. Personal Protection Equipment (PPE): One Set for each pumping unit or a minimum of two for each Fire Station
7. Hydraulic Chain Saw/Cutter for Wood: One for each Fire Station
8. Electric/Petrol Chain Saw/Cutter for Wood: One for each Fire Station
9. Electric/Petrol Chain Saw/Cutter for Concrete: One for each Fire Station
10. Hand Held Gas Detector: One piece per Vehicle
11. Victim Location Device (Acoustic): One for each Fire Station depending upon the seismic Zone IV and V, or Fire Station having urban population more than 1.5 Lakhs in its ideal jurisdiction or minimum one per district
12. Portable Pump: One for each fire fighting unit
13. Floating Pump: One for each Fire Boat
14. Smoke Exhauster/PPV: One per Fire Stations located in urban areas (minimum one per district)
15. Pneumatic Lifting Bags: One for each Fire Station depending upon the seismic Zone IV and V, or Fire Station having urban population more than 1.5 Lakhs in its ideal jurisdiction or minimum one per district
Fire-Risk and Hazard Analysis in the Country
(National Report) Confidential Page 270 of 338
16. Inflatable Lighting Tower: One per Fire Station
17. High Capacity LED Torch Light: One piece per vehicle
Note: Other smaller equipments such as ropes, Fireman Axe, Small Hammer, different Branches/Nozzles, Foam Compound has not been mentioned separately, as these are standard items for any Fire Station/post.
For rural Fire Station/Fire Post, following specialized equipment has been recommended:
1. B.A. Set with BA Compressor: Two B. A. set per fire fighting vehicle with one
compressor per Fire Station/post
2. Personal Protection Equipment (PPE): One set per fire fighting vehicle
3. Electric/Petrol Chain Saw/Cutter for Wood: One per Fire Station/post
4. Hydraulic Chain Saw/Cutter for Wood: One per Fire Station/post
5. Portable Pump: One for each fire fighting unit
6. Inflatable Lighting Tower: One per Fire Station
7. High Capacity LED Torch Light: One piece per fire fighting vehicle
8. First Aid Box: One per fire fighting vehicle
For reserve requirement, RMSI estimated reserve requirement of 20% at district level, and
these will be distributed to individual Fire Stations by the concerned fire officials. . The replacement of condemned / major repair (off road) vehicles as well as instruments from operating Fire Stations can be accounted as reserve and these will be distributed to individual Fire Stations by the concerned fire officials. This will help in optimizing the additional requirements of minimum one reserve at each Fire Station.
Communication Equipment:
For better coordination between Fire Station and fire fighting staff, communication plays an important role. Hence, there is a need that each fire vehicle and Fire Station is equipped with a communication device. Accordingly, following communication equipments for urban Fire Station are recommended:
1. Static Wireless Set (VHF): One set at each Fire Station
2. Mobile Wireless Set (VHF): One per vehicle
3. Walky-Talky: One per vehicle
4. Megaphone: One set per Fire Station/Post
Additionally, at each rural Fire Post, each QRT should be equipped with 1 mobile wireless set and 1 walky-talky.
Detailed State/UT level list of currently operational fire fighting vehicles available with Fire Service (As on Nov- 2012), vehicle gap in operational Fire Stations for ideal Jurisdiction area, additional vehicle required for new urban and rural Fire Stations and total vehicle gap for existing and new Urban Fire stations are shown in Table 42-3 to 42-6. Similarly, gap analysis for specialized fire equipment is shown in Tables 42-7 to 42-14.
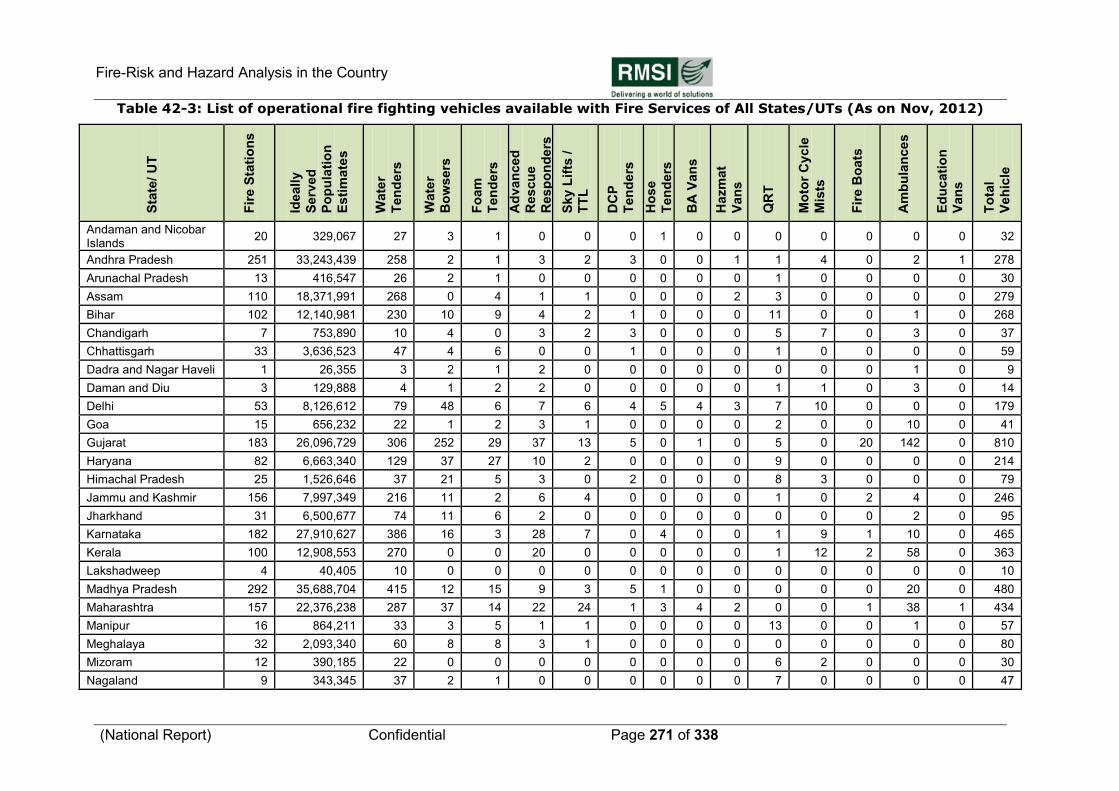
Fire-Risk and Hazard Analysis in the Country
(National Report) Confidential Page 271 of 338
Table 42-3: List of operational fire fighting vehicles available with Fire Services of All States/UTs (As on Nov, 2012)
Sta
te/ U
T
Fir
e S
tati
on
s
Ideally
Serv
ed
Po
pu
lati
on
Esti
mate
s
Wate
r
Ten
ders
Wate
r
Bo
wsers
Fo
am
Ten
ders
Ad
van
ced
Rescu
e
Resp
on
ders
Sky L
ifts
/
TT
L
DC
P
Ten
ders
Ho
se
Ten
ders
BA
Van
s
Hazm
at
Van
s
QR
T
Mo
tor
Cyc
le
Mis
ts
Fir
e B
oats
Am
bu
lan
ce
s
Ed
ucati
on
Van
s
To
tal
Veh
icle
Andaman and Nicobar Islands
20 329,067 27 3 1 0 0 0 1 0 0 0 0 0 0 0 32
Andhra Pradesh 251 33,243,439 258 2 1 3 2 3 0 0 1 1 4 0 2 1 278
Arunachal Pradesh 13 416,547 26 2 1 0 0 0 0 0 0 1 0 0 0 0 30
Assam 110 18,371,991 268 0 4 1 1 0 0 0 2 3 0 0 0 0 279
Bihar 102 12,140,981 230 10 9 4 2 1 0 0 0 11 0 0 1 0 268
Chandigarh 7 753,890 10 4 0 3 2 3 0 0 0 5 7 0 3 0 37
Chhattisgarh 33 3,636,523 47 4 6 0 0 1 0 0 0 1 0 0 0 0 59
Dadra and Nagar Haveli 1 26,355 3 2 1 2 0 0 0 0 0 0 0 0 1 0 9
Daman and Diu 3 129,888 4 1 2 2 0 0 0 0 0 1 1 0 3 0 14
Delhi 53 8,126,612 79 48 6 7 6 4 5 4 3 7 10 0 0 0 179
Goa 15 656,232 22 1 2 3 1 0 0 0 0 2 0 0 10 0 41
Gujarat 183 26,096,729 306 252 29 37 13 5 0 1 0 5 0 20 142 0 810
Haryana 82 6,663,340 129 37 27 10 2 0 0 0 0 9 0 0 0 0 214
Himachal Pradesh 25 1,526,646 37 21 5 3 0 2 0 0 0 8 3 0 0 0 79
Jammu and Kashmir 156 7,997,349 216 11 2 6 4 0 0 0 0 1 0 2 4 0 246
Jharkhand 31 6,500,677 74 11 6 2 0 0 0 0 0 0 0 0 2 0 95
Karnataka 182 27,910,627 386 16 3 28 7 0 4 0 0 1 9 1 10 0 465
Kerala 100 12,908,553 270 0 0 20 0 0 0 0 0 1 12 2 58 0 363
Lakshadweep 4 40,405 10 0 0 0 0 0 0 0 0 0 0 0 0 0 10
Madhya Pradesh 292 35,688,704 415 12 15 9 3 5 1 0 0 0 0 0 20 0 480
Maharashtra 157 22,376,238 287 37 14 22 24 1 3 4 2 0 0 1 38 1 434
Manipur 16 864,211 33 3 5 1 1 0 0 0 0 13 0 0 1 0 57
Meghalaya 32 2,093,340 60 8 8 3 1 0 0 0 0 0 0 0 0 0 80
Mizoram 12 390,185 22 0 0 0 0 0 0 0 0 6 2 0 0 0 30
Nagaland 9 343,345 37 2 1 0 0 0 0 0 0 7 0 0 0 0 47
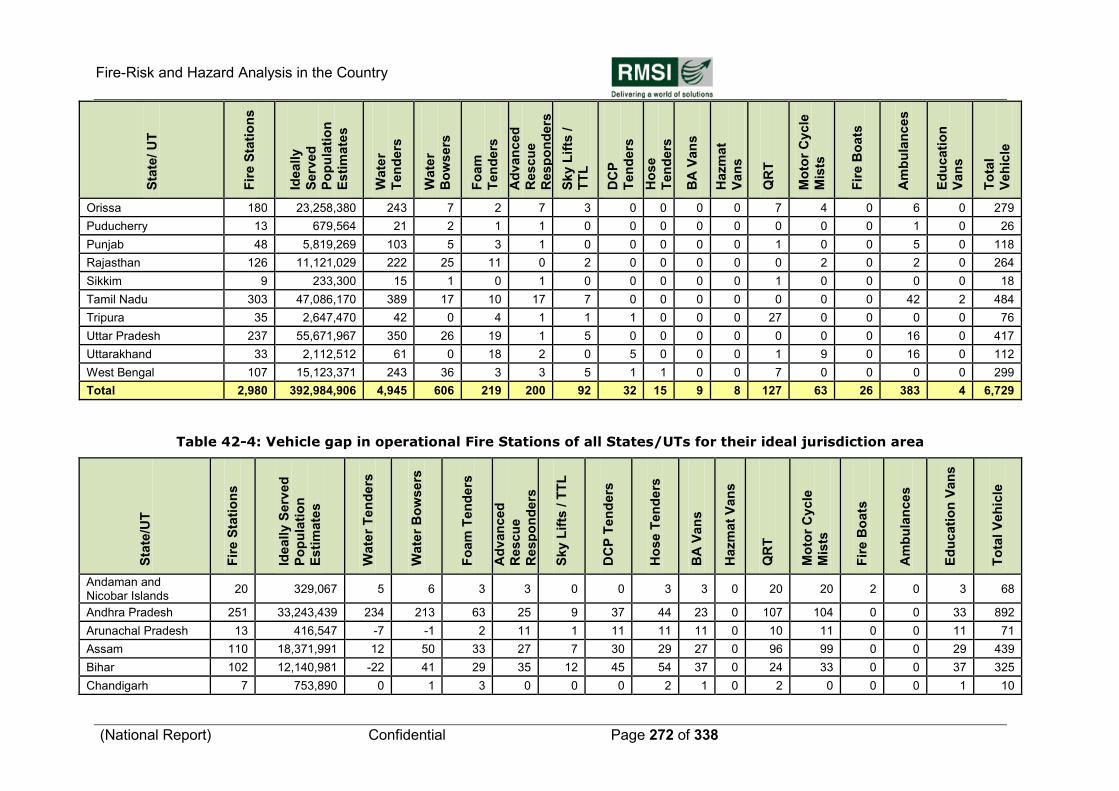
Fire-Risk and Hazard Analysis in the Country
(National Report) Confidential Page 272 of 338
Sta
te/ U
T
Fir
e S
tati
on
s
Ideally
Serv
ed
Po
pu
lati
on
Esti
mate
s
Wate
r
Ten
ders
Wate
r
Bo
wsers
Fo
am
Ten
ders
Ad
van
ced
Rescu
e
Resp
on
ders
Sky L
ifts
/
TT
L
DC
P
Ten
ders
Ho
se
Ten
ders
BA
Van
s
Hazm
at
Van
s
QR
T
Mo
tor
Cyc
le
Mis
ts
Fir
e B
oats
Am
bu
lan
ce
s
Ed
ucati
on
Van
s
To
tal
Veh
icle
Orissa 180 23,258,380 243 7 2 7 3 0 0 0 0 7 4 0 6 0 279
Puducherry 13 679,564 21 2 1 1 0 0 0 0 0 0 0 0 1 0 26
Punjab 48 5,819,269 103 5 3 1 0 0 0 0 0 1 0 0 5 0 118
Rajasthan 126 11,121,029 222 25 11 0 2 0 0 0 0 0 2 0 2 0 264
Sikkim 9 233,300 15 1 0 1 0 0 0 0 0 1 0 0 0 0 18
Tamil Nadu 303 47,086,170 389 17 10 17 7 0 0 0 0 0 0 0 42 2 484
Tripura 35 2,647,470 42 0 4 1 1 1 0 0 0 27 0 0 0 0 76
Uttar Pradesh 237 55,671,967 350 26 19 1 5 0 0 0 0 0 0 0 16 0 417
Uttarakhand 33 2,112,512 61 0 18 2 0 5 0 0 0 1 9 0 16 0 112
West Bengal 107 15,123,371 243 36 3 3 5 1 1 0 0 7 0 0 0 0 299
Total 2,980 392,984,906 4,945 606 219 200 92 32 15 9 8 127 63 26 383 4 6,729
Table 42-4: Vehicle gap in operational Fire Stations of all States/UTs for their ideal jurisdiction area
Sta
te/U
T
Fir
e S
tati
on
s
Ideally
Serv
ed
Po
pu
lati
on
Esti
mate
s
Wate
r T
en
de
rs
Wate
r B
ow
se
rs
Fo
am
Ten
ders
Ad
van
ced
Rescu
e
Resp
on
ders
Sky L
ifts
/ T
TL
DC
P T
en
ders
Ho
se T
en
de
rs
BA
Van
s
Hazm
at
Van
s
QR
T
Mo
tor
Cyc
le
Mis
ts
Fir
e B
oats
Am
bu
lan
ce
s
Ed
ucati
on
Van
s
To
tal V
eh
icle
Andaman and Nicobar Islands
20 329,067 5 6 3 3 0 0 3 3 0 20 20 2 0 3 68
Andhra Pradesh 251 33,243,439 234 213 63 25 9 37 44 23 0 107 104 0 0 33 892
Arunachal Pradesh 13 416,547 -7 -1 2 11 1 11 11 11 0 10 11 0 0 11 71
Assam 110 18,371,991 12 50 33 27 7 30 29 27 0 96 99 0 0 29 439
Bihar 102 12,140,981 -22 41 29 35 12 45 54 37 0 24 33 0 0 37 325
Chandigarh 7 753,890 0 1 3 0 0 0 2 1 0 2 0 0 0 1 10
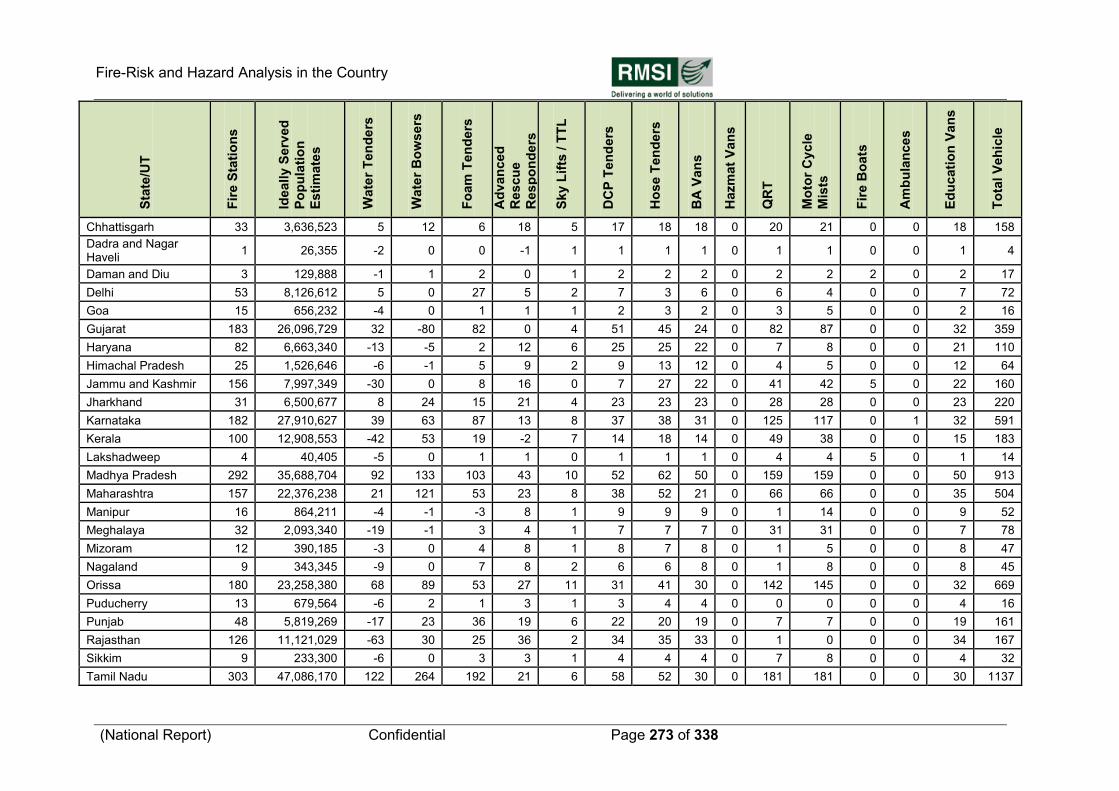
Fire-Risk and Hazard Analysis in the Country
(National Report) Confidential Page 273 of 338
Sta
te/U
T
Fir
e S
tati
on
s
Ideally
Serv
ed
Po
pu
lati
on
Esti
mate
s
Wate
r T
en
de
rs
Wate
r B
ow
se
rs
Fo
am
Ten
ders
Ad
van
ced
Rescu
e
Resp
on
ders
Sky L
ifts
/ T
TL
DC
P T
en
ders
Ho
se T
en
de
rs
BA
Van
s
Hazm
at
Van
s
QR
T
Mo
tor
Cyc
le
Mis
ts
Fir
e B
oats
Am
bu
lan
ce
s
Ed
ucati
on
Van
s
To
tal V
eh
icle
Chhattisgarh 33 3,636,523 5 12 6 18 5 17 18 18 0 20 21 0 0 18 158
Dadra and Nagar Haveli
1 26,355 -2 0 0 -1 1 1 1 1 0 1 1 0 0 1 4
Daman and Diu 3 129,888 -1 1 2 0 1 2 2 2 0 2 2 2 0 2 17
Delhi 53 8,126,612 5 0 27 5 2 7 3 6 0 6 4 0 0 7 72
Goa 15 656,232 -4 0 1 1 1 2 3 2 0 3 5 0 0 2 16
Gujarat 183 26,096,729 32 -80 82 0 4 51 45 24 0 82 87 0 0 32 359
Haryana 82 6,663,340 -13 -5 2 12 6 25 25 22 0 7 8 0 0 21 110
Himachal Pradesh 25 1,526,646 -6 -1 5 9 2 9 13 12 0 4 5 0 0 12 64
Jammu and Kashmir 156 7,997,349 -30 0 8 16 0 7 27 22 0 41 42 5 0 22 160
Jharkhand 31 6,500,677 8 24 15 21 4 23 23 23 0 28 28 0 0 23 220
Karnataka 182 27,910,627 39 63 87 13 8 37 38 31 0 125 117 0 1 32 591
Kerala 100 12,908,553 -42 53 19 -2 7 14 18 14 0 49 38 0 0 15 183
Lakshadweep 4 40,405 -5 0 1 1 0 1 1 1 0 4 4 5 0 1 14
Madhya Pradesh 292 35,688,704 92 133 103 43 10 52 62 50 0 159 159 0 0 50 913
Maharashtra 157 22,376,238 21 121 53 23 8 38 52 21 0 66 66 0 0 35 504
Manipur 16 864,211 -4 -1 -3 8 1 9 9 9 0 1 14 0 0 9 52
Meghalaya 32 2,093,340 -19 -1 3 4 1 7 7 7 0 31 31 0 0 7 78
Mizoram 12 390,185 -3 0 4 8 1 8 7 8 0 1 5 0 0 8 47
Nagaland 9 343,345 -9 0 7 8 2 6 6 8 0 1 8 0 0 8 45
Orissa 180 23,258,380 68 89 53 27 11 31 41 30 0 142 145 0 0 32 669
Puducherry 13 679,564 -6 2 1 3 1 3 4 4 0 0 0 0 0 4 16
Punjab 48 5,819,269 -17 23 36 19 6 22 20 19 0 7 7 0 0 19 161
Rajasthan 126 11,121,029 -63 30 25 36 2 34 35 33 0 1 0 0 0 34 167
Sikkim 9 233,300 -6 0 3 3 1 4 4 4 0 7 8 0 0 4 32
Tamil Nadu 303 47,086,170 122 264 192 21 6 58 52 30 0 181 181 0 0 30 1137
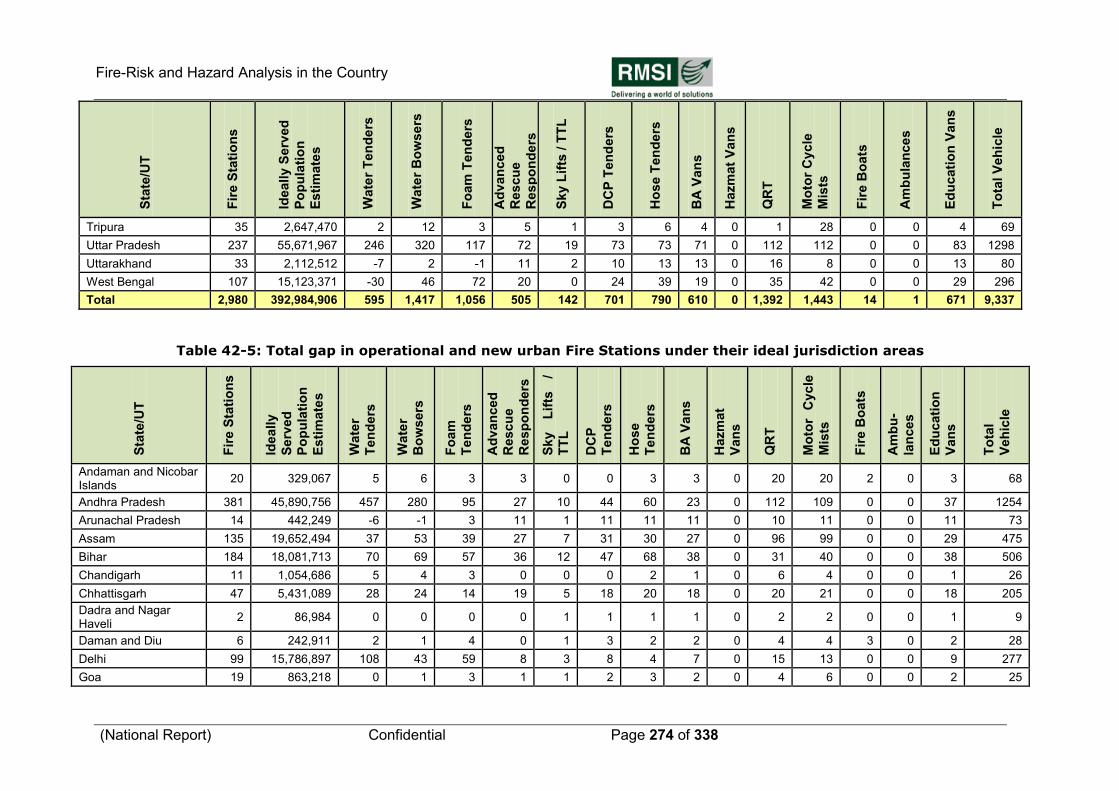
Fire-Risk and Hazard Analysis in the Country
(National Report) Confidential Page 274 of 338
Sta
te/U
T
Fir
e S
tati
on
s
Ideally
Serv
ed
Po
pu
lati
on
Esti
mate
s
Wate
r T
en
de
rs
Wate
r B
ow
se
rs
Fo
am
Ten
ders
Ad
van
ced
Rescu
e
Resp
on
ders
Sky L
ifts
/ T
TL
DC
P T
en
ders
Ho
se T
en
de
rs
BA
Van
s
Hazm
at
Van
s
QR
T
Mo
tor
Cyc
le
Mis
ts
Fir
e B
oats
Am
bu
lan
ce
s
Ed
ucati
on
Van
s
To
tal V
eh
icle
Tripura 35 2,647,470 2 12 3 5 1 3 6 4 0 1 28 0 0 4 69
Uttar Pradesh 237 55,671,967 246 320 117 72 19 73 73 71 0 112 112 0 0 83 1298
Uttarakhand 33 2,112,512 -7 2 -1 11 2 10 13 13 0 16 8 0 0 13 80
West Bengal 107 15,123,371 -30 46 72 20 0 24 39 19 0 35 42 0 0 29 296
Total 2,980 392,984,906 595 1,417 1,056 505 142 701 790 610 0 1,392 1,443 14 1 671 9,337
Table 42-5: Total gap in operational and new urban Fire Stations under their ideal jurisdiction areas
Sta
te/U
T
Fir
e S
tati
on
s
Ideally
Serv
ed
Po
pu
lati
on
Esti
mate
s
Wate
r
Ten
ders
Wate
r
Bo
wsers
Fo
am
Ten
ders
Ad
van
ced
Rescu
e
Resp
on
ders
Sky
L
ifts
/
TT
L
DC
P
Ten
ders
Ho
se
Ten
ders
BA
Van
s
Hazm
at
Van
s
QR
T
Mo
tor
Cyc
le
Mis
ts
Fir
e B
oats
Am
bu
-
lan
ces
Ed
ucati
on
Van
s
To
tal
Veh
icle
Andaman and Nicobar Islands
20 329,067 5 6 3 3 0 0 3 3 0 20 20 2 0 3 68
Andhra Pradesh 381 45,890,756 457 280 95 27 10 44 60 23 0 112 109 0 0 37 1254
Arunachal Pradesh 14 442,249 -6 -1 3 11 1 11 11 11 0 10 11 0 0 11 73
Assam 135 19,652,494 37 53 39 27 7 31 30 27 0 96 99 0 0 29 475
Bihar 184 18,081,713 70 69 57 36 12 47 68 38 0 31 40 0 0 38 506
Chandigarh 11 1,054,686 5 4 3 0 0 0 2 1 0 6 4 0 0 1 26
Chhattisgarh 47 5,431,089 28 24 14 19 5 18 20 18 0 20 21 0 0 18 205
Dadra and Nagar Haveli
2 86,984 0 0 0 0 1 1 1 1 0 2 2 0 0 1 9
Daman and Diu 6 242,911 2 1 4 0 1 3 2 2 0 4 4 3 0 2 28
Delhi 99 15,786,897 108 43 59 8 3 8 4 7 0 15 13 0 0 9 277
Goa 19 863,218 0 1 3 1 1 2 3 2 0 4 6 0 0 2 25
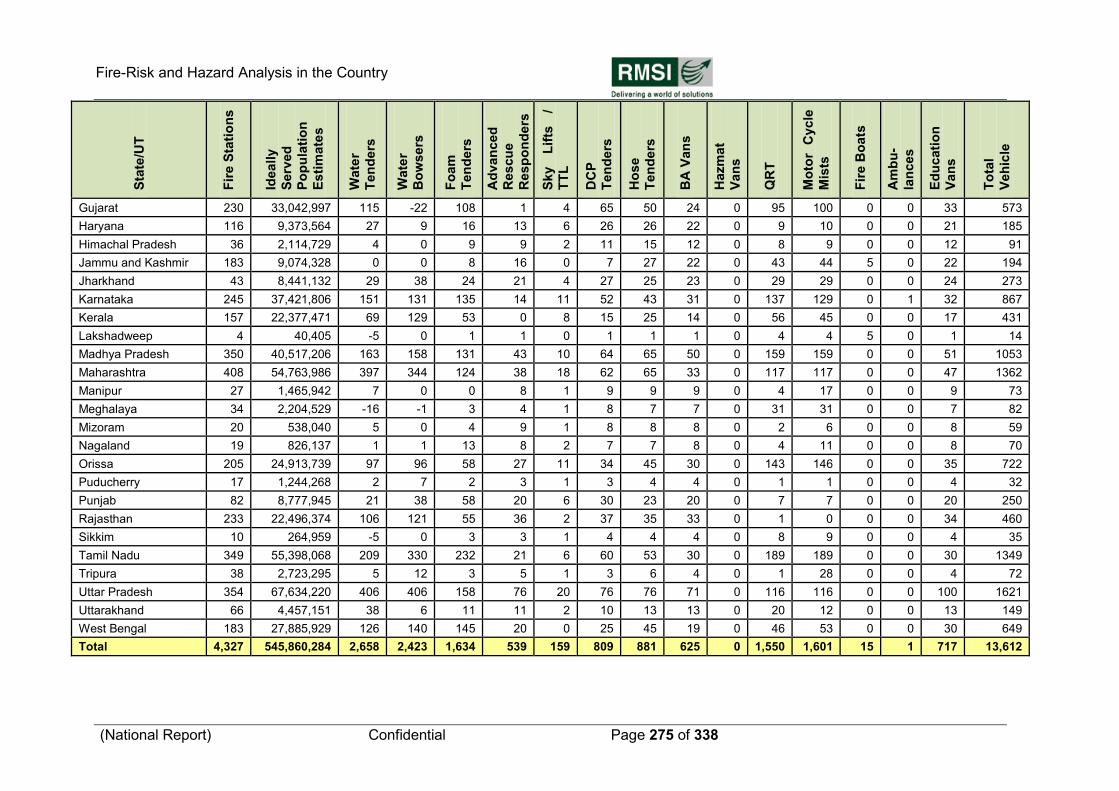
Fire-Risk and Hazard Analysis in the Country
(National Report) Confidential Page 275 of 338
Sta
te/U
T
Fir
e S
tati
on
s
Ideally
Serv
ed
Po
pu
lati
on
Esti
mate
s
Wate
r
Ten
ders
Wate
r
Bo
wsers
Fo
am
Ten
ders
Ad
van
ced
Rescu
e
Resp
on
ders
Sky
L
ifts
/
TT
L
DC
P
Ten
ders
Ho
se
Ten
ders
BA
Van
s
Hazm
at
Van
s
QR
T
Mo
tor
Cyc
le
Mis
ts
Fir
e B
oats
Am
bu
-
lan
ces
Ed
ucati
on
Van
s
To
tal
Veh
icle
Gujarat 230 33,042,997 115 -22 108 1 4 65 50 24 0 95 100 0 0 33 573
Haryana 116 9,373,564 27 9 16 13 6 26 26 22 0 9 10 0 0 21 185
Himachal Pradesh 36 2,114,729 4 0 9 9 2 11 15 12 0 8 9 0 0 12 91
Jammu and Kashmir 183 9,074,328 0 0 8 16 0 7 27 22 0 43 44 5 0 22 194
Jharkhand 43 8,441,132 29 38 24 21 4 27 25 23 0 29 29 0 0 24 273
Karnataka 245 37,421,806 151 131 135 14 11 52 43 31 0 137 129 0 1 32 867
Kerala 157 22,377,471 69 129 53 0 8 15 25 14 0 56 45 0 0 17 431
Lakshadweep 4 40,405 -5 0 1 1 0 1 1 1 0 4 4 5 0 1 14
Madhya Pradesh 350 40,517,206 163 158 131 43 10 64 65 50 0 159 159 0 0 51 1053
Maharashtra 408 54,763,986 397 344 124 38 18 62 65 33 0 117 117 0 0 47 1362
Manipur 27 1,465,942 7 0 0 8 1 9 9 9 0 4 17 0 0 9 73
Meghalaya 34 2,204,529 -16 -1 3 4 1 8 7 7 0 31 31 0 0 7 82
Mizoram 20 538,040 5 0 4 9 1 8 8 8 0 2 6 0 0 8 59
Nagaland 19 826,137 1 1 13 8 2 7 7 8 0 4 11 0 0 8 70
Orissa 205 24,913,739 97 96 58 27 11 34 45 30 0 143 146 0 0 35 722
Puducherry 17 1,244,268 2 7 2 3 1 3 4 4 0 1 1 0 0 4 32
Punjab 82 8,777,945 21 38 58 20 6 30 23 20 0 7 7 0 0 20 250
Rajasthan 233 22,496,374 106 121 55 36 2 37 35 33 0 1 0 0 0 34 460
Sikkim 10 264,959 -5 0 3 3 1 4 4 4 0 8 9 0 0 4 35
Tamil Nadu 349 55,398,068 209 330 232 21 6 60 53 30 0 189 189 0 0 30 1349
Tripura 38 2,723,295 5 12 3 5 1 3 6 4 0 1 28 0 0 4 72
Uttar Pradesh 354 67,634,220 406 406 158 76 20 76 76 71 0 116 116 0 0 100 1621
Uttarakhand 66 4,457,151 38 6 11 11 2 10 13 13 0 20 12 0 0 13 149
West Bengal 183 27,885,929 126 140 145 20 0 25 45 19 0 46 53 0 0 30 649
Total 4,327 545,860,284 2,658 2,423 1,634 539 159 809 881 625 0 1,550 1,601 15 1 717 13,612
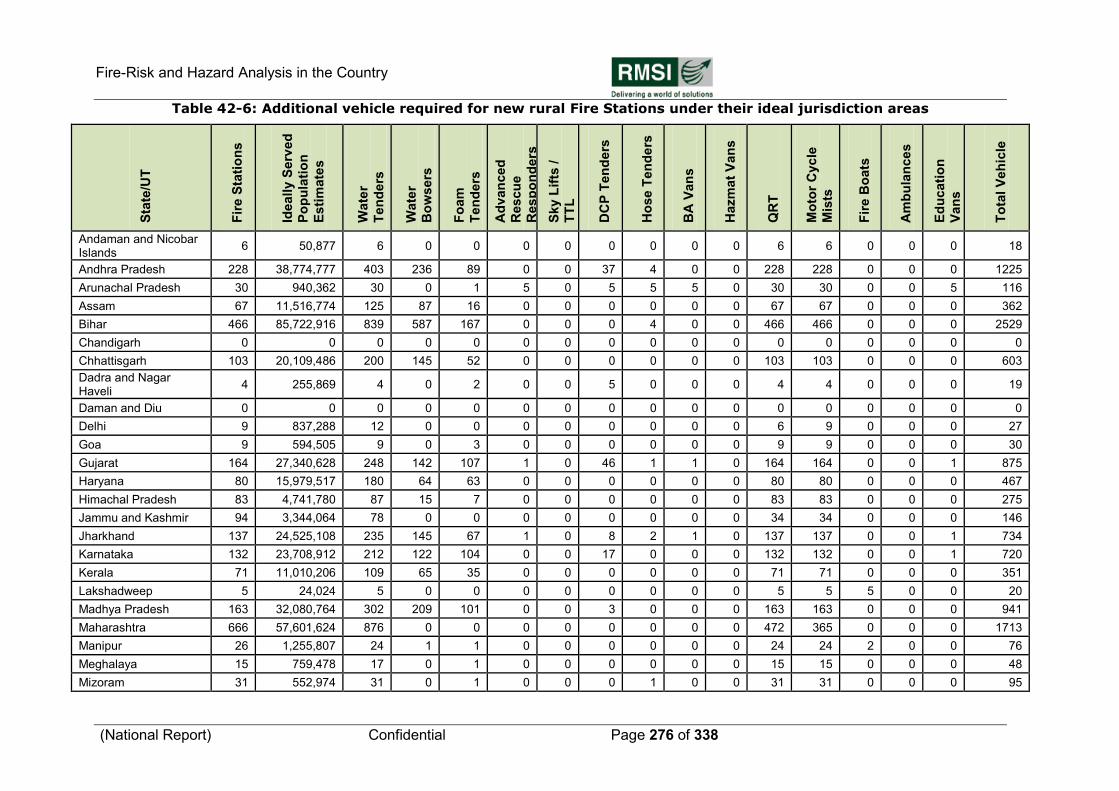
Fire-Risk and Hazard Analysis in the Country
(National Report) Confidential Page 276 of 338
Table 42-6: Additional vehicle required for new rural Fire Stations under their ideal jurisdiction areas
Sta
te/U
T
Fir
e S
tati
on
s
Ideally
Serv
ed
Po
pu
lati
on
Esti
mate
s
Wate
r
Ten
ders
Wate
r
Bo
wsers
Fo
am
Ten
ders
Ad
van
ced
Rescu
e
Resp
on
ders
Sky L
ifts
/
TT
L
DC
P T
en
ders
Ho
se T
en
de
rs
BA
Van
s
Hazm
at
Van
s
QR
T
Mo
tor
Cyc
le
Mis
ts
Fir
e B
oats
Am
bu
lan
ce
s
Ed
ucati
on
Van
s
To
tal V
eh
icle
Andaman and Nicobar Islands
6 50,877 6 0 0 0 0 0 0 0 0 6 6 0 0 0 18
Andhra Pradesh 228 38,774,777 403 236 89 0 0 37 4 0 0 228 228 0 0 0 1225
Arunachal Pradesh 30 940,362 30 0 1 5 0 5 5 5 0 30 30 0 0 5 116
Assam 67 11,516,774 125 87 16 0 0 0 0 0 0 67 67 0 0 0 362
Bihar 466 85,722,916 839 587 167 0 0 0 4 0 0 466 466 0 0 0 2529
Chandigarh 0 0 0 0 0 0 0 0 0 0 0 0 0 0 0 0 0
Chhattisgarh 103 20,109,486 200 145 52 0 0 0 0 0 0 103 103 0 0 0 603
Dadra and Nagar Haveli
4 255,869 4 0 2 0 0 5 0 0 0 4 4 0 0 0 19
Daman and Diu 0 0 0 0 0 0 0 0 0 0 0 0 0 0 0 0 0
Delhi 9 837,288 12 0 0 0 0 0 0 0 0 6 9 0 0 0 27
Goa 9 594,505 9 0 3 0 0 0 0 0 0 9 9 0 0 0 30
Gujarat 164 27,340,628 248 142 107 1 0 46 1 1 0 164 164 0 0 1 875
Haryana 80 15,979,517 180 64 63 0 0 0 0 0 0 80 80 0 0 0 467
Himachal Pradesh 83 4,741,780 87 15 7 0 0 0 0 0 0 83 83 0 0 0 275
Jammu and Kashmir 94 3,344,064 78 0 0 0 0 0 0 0 0 34 34 0 0 0 146
Jharkhand 137 24,525,108 235 145 67 1 0 8 2 1 0 137 137 0 0 1 734
Karnataka 132 23,708,912 212 122 104 0 0 17 0 0 0 132 132 0 0 1 720
Kerala 71 11,010,206 109 65 35 0 0 0 0 0 0 71 71 0 0 0 351
Lakshadweep 5 24,024 5 0 0 0 0 0 0 0 0 5 5 5 0 0 20
Madhya Pradesh 163 32,080,764 302 209 101 0 0 3 0 0 0 163 163 0 0 0 941
Maharashtra 666 57,601,624 876 0 0 0 0 0 0 0 0 472 365 0 0 0 1713
Manipur 26 1,255,807 24 1 1 0 0 0 0 0 0 24 24 2 0 0 76
Meghalaya 15 759,478 17 0 1 0 0 0 0 0 0 15 15 0 0 0 48
Mizoram 31 552,974 31 0 1 0 0 0 1 0 0 31 31 0 0 0 95
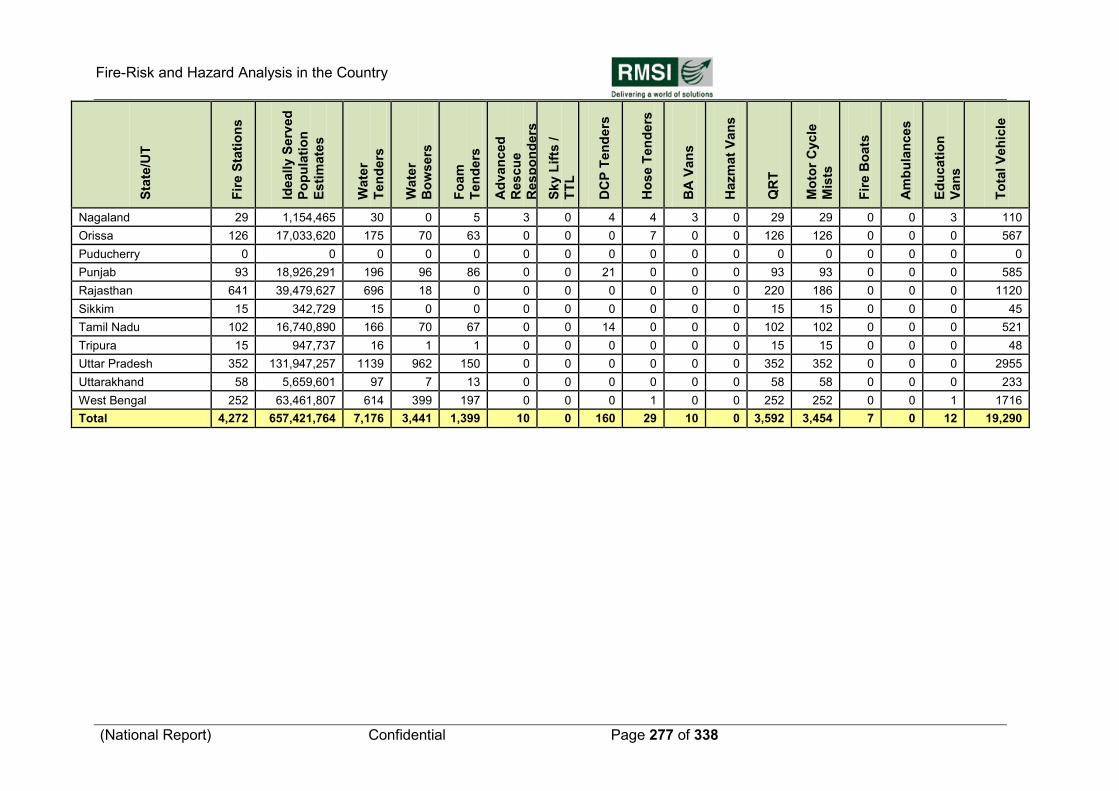
Fire-Risk and Hazard Analysis in the Country
(National Report) Confidential Page 277 of 338
Sta
te/U
T
Fir
e S
tati
on
s
Ideally
Serv
ed
Po
pu
lati
on
Esti
mate
s
Wate
r
Ten
ders
Wate
r
Bo
wsers
Fo
am
Ten
ders
Ad
van
ced
Rescu
e
Resp
on
ders
Sky L
ifts
/
TT
L
DC
P T
en
ders
Ho
se T
en
de
rs
BA
Van
s
Hazm
at
Van
s
QR
T
Mo
tor
Cyc
le
Mis
ts
Fir
e B
oats
Am
bu
lan
ce
s
Ed
ucati
on
Van
s
To
tal V
eh
icle
Nagaland 29 1,154,465 30 0 5 3 0 4 4 3 0 29 29 0 0 3 110
Orissa 126 17,033,620 175 70 63 0 0 0 7 0 0 126 126 0 0 0 567
Puducherry 0 0 0 0 0 0 0 0 0 0 0 0 0 0 0 0 0
Punjab 93 18,926,291 196 96 86 0 0 21 0 0 0 93 93 0 0 0 585
Rajasthan 641 39,479,627 696 18 0 0 0 0 0 0 0 220 186 0 0 0 1120
Sikkim 15 342,729 15 0 0 0 0 0 0 0 0 15 15 0 0 0 45
Tamil Nadu 102 16,740,890 166 70 67 0 0 14 0 0 0 102 102 0 0 0 521
Tripura 15 947,737 16 1 1 0 0 0 0 0 0 15 15 0 0 0 48
Uttar Pradesh 352 131,947,257 1139 962 150 0 0 0 0 0 0 352 352 0 0 0 2955
Uttarakhand 58 5,659,601 97 7 13 0 0 0 0 0 0 58 58 0 0 0 233
West Bengal 252 63,461,807 614 399 197 0 0 0 1 0 0 252 252 0 0 1 1716
Total 4,272 657,421,764 7,176 3,441 1,399 10 0 160 29 10 0 3,592 3,454 7 0 12 19,290
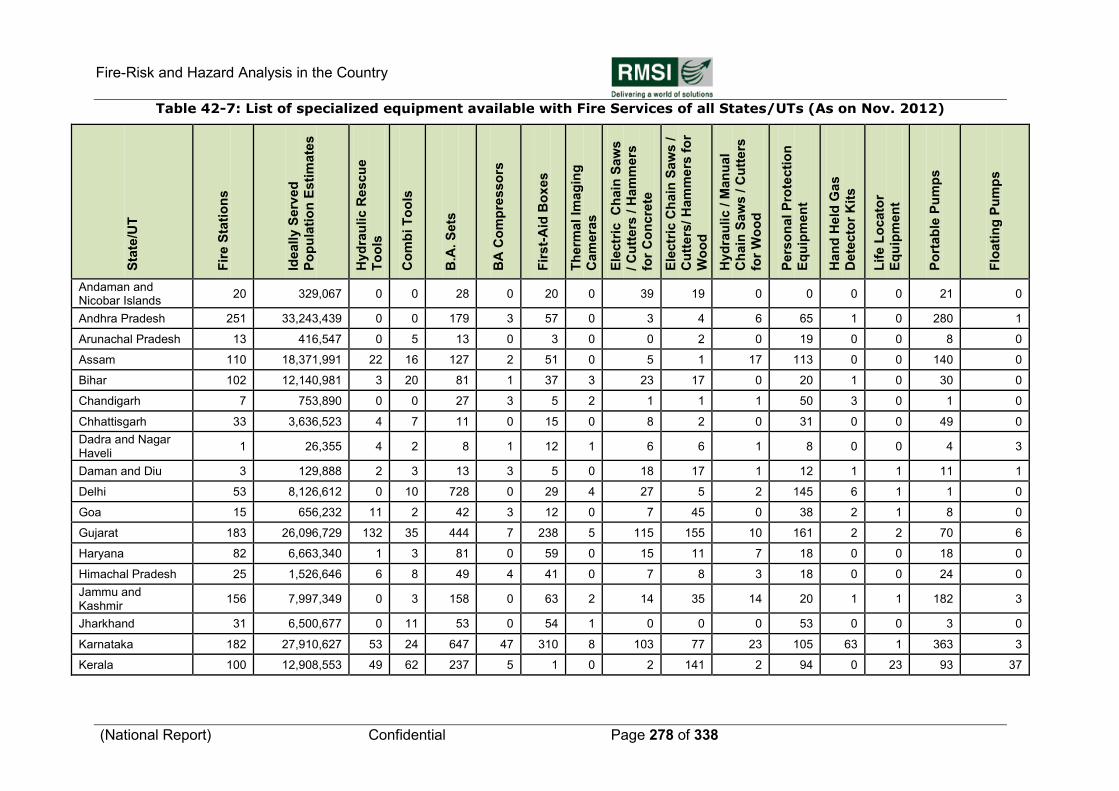
Fire-Risk and Hazard Analysis in the Country
(National Report) Confidential Page 278 of 338
Table 42-7: List of specialized equipment available with Fire Services of all States/UTs (As on Nov. 2012)
Sta
te/U
T
Fir
e S
tati
on
s
Ideally
Serv
ed
Po
pu
lati
on
Esti
mate
s
Hyd
rau
lic R
escu
e
To
ols
Co
mb
i T
oo
ls
B.A
. S
ets
BA
Co
mp
resso
rs
Fir
st-
Aid
Bo
xes
Th
erm
al
Imag
ing
Cam
era
s
Ele
ctr
ic
Ch
ain
Saw
s
/ C
utt
ers
/ H
am
mers
for
Co
ncre
te
Ele
ctr
ic C
hain
Saw
s /
Cu
tters
/ H
am
me
rs f
or
Wo
od
Hyd
rau
lic / M
an
ual
Ch
ain
Saw
s / C
utt
ers
for
Wo
od
Pers
on
al
Pro
tecti
on
Eq
uip
men
t
Han
d H
eld
Ga
s
Dete
cto
r K
its
Lif
e L
ocato
r
Eq
uip
men
t
Po
rtab
le P
um
ps
Flo
ati
ng
Pu
mp
s
Andaman and Nicobar Islands
20 329,067 0 0 28 0 20 0 39 19 0 0 0 0 21 0
Andhra Pradesh 251 33,243,439 0 0 179 3 57 0 3 4 6 65 1 0 280 1
Arunachal Pradesh 13 416,547 0 5 13 0 3 0 0 2 0 19 0 0 8 0
Assam 110 18,371,991 22 16 127 2 51 0 5 1 17 113 0 0 140 0
Bihar 102 12,140,981 3 20 81 1 37 3 23 17 0 20 1 0 30 0
Chandigarh 7 753,890 0 0 27 3 5 2 1 1 1 50 3 0 1 0
Chhattisgarh 33 3,636,523 4 7 11 0 15 0 8 2 0 31 0 0 49 0
Dadra and Nagar Haveli
1 26,355 4 2 8 1 12 1 6 6 1 8 0 0 4 3
Daman and Diu 3 129,888 2 3 13 3 5 0 18 17 1 12 1 1 11 1
Delhi 53 8,126,612 0 10 728 0 29 4 27 5 2 145 6 1 1 0
Goa 15 656,232 11 2 42 3 12 0 7 45 0 38 2 1 8 0
Gujarat 183 26,096,729 132 35 444 7 238 5 115 155 10 161 2 2 70 6
Haryana 82 6,663,340 1 3 81 0 59 0 15 11 7 18 0 0 18 0
Himachal Pradesh 25 1,526,646 6 8 49 4 41 0 7 8 3 18 0 0 24 0
Jammu and Kashmir
156 7,997,349 0 3 158 0 63 2 14 35 14 20 1 1 182 3
Jharkhand 31 6,500,677 0 11 53 0 54 1 0 0 0 53 0 0 3 0
Karnataka 182 27,910,627 53 24 647 47 310 8 103 77 23 105 63 1 363 3
Kerala 100 12,908,553 49 62 237 5 1 0 2 141 2 94 0 23 93 37
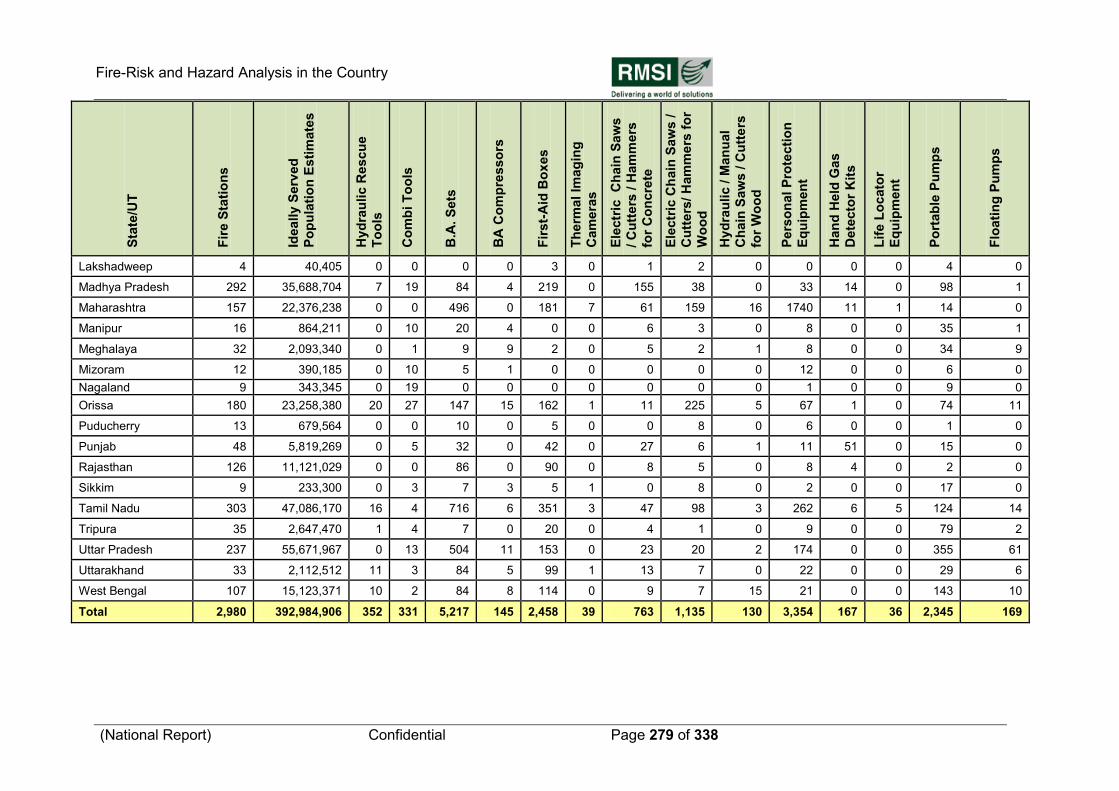
Fire-Risk and Hazard Analysis in the Country
(National Report) Confidential Page 279 of 338
Sta
te/U
T
Fir
e S
tati
on
s
Ideally
Serv
ed
Po
pu
lati
on
Esti
mate
s
Hyd
rau
lic R
escu
e
To
ols
Co
mb
i T
oo
ls
B.A
. S
ets
BA
Co
mp
resso
rs
Fir
st-
Aid
Bo
xes
Th
erm
al
Imag
ing
Cam
era
s
Ele
ctr
ic
Ch
ain
Saw
s
/ C
utt
ers
/ H
am
mers
for
Co
ncre
te
Ele
ctr
ic C
hain
Saw
s /
Cu
tters
/ H
am
me
rs f
or
Wo
od
Hyd
rau
lic / M
an
ual
Ch
ain
Saw
s / C
utt
ers
for
Wo
od
Pers
on
al
Pro
tecti
on
Eq
uip
men
t
Han
d H
eld
Ga
s
Dete
cto
r K
its
Lif
e L
ocato
r
Eq
uip
men
t
Po
rtab
le P
um
ps
Flo
ati
ng
Pu
mp
s
Lakshadweep 4 40,405 0 0 0 0 3 0 1 2 0 0 0 0 4 0
Madhya Pradesh 292 35,688,704 7 19 84 4 219 0 155 38 0 33 14 0 98 1
Maharashtra 157 22,376,238 0 0 496 0 181 7 61 159 16 1740 11 1 14 0
Manipur 16 864,211 0 10 20 4 0 0 6 3 0 8 0 0 35 1
Meghalaya 32 2,093,340 0 1 9 9 2 0 5 2 1 8 0 0 34 9
Mizoram 12 390,185 0 10 5 1 0 0 0 0 0 12 0 0 6 0
Nagaland 9 343,345 0 19 0 0 0 0 0 0 0 1 0 0 9 0
Orissa 180 23,258,380 20 27 147 15 162 1 11 225 5 67 1 0 74 11
Puducherry 13 679,564 0 0 10 0 5 0 0 8 0 6 0 0 1 0
Punjab 48 5,819,269 0 5 32 0 42 0 27 6 1 11 51 0 15 0
Rajasthan 126 11,121,029 0 0 86 0 90 0 8 5 0 8 4 0 2 0
Sikkim 9 233,300 0 3 7 3 5 1 0 8 0 2 0 0 17 0
Tamil Nadu 303 47,086,170 16 4 716 6 351 3 47 98 3 262 6 5 124 14
Tripura 35 2,647,470 1 4 7 0 20 0 4 1 0 9 0 0 79 2
Uttar Pradesh 237 55,671,967 0 13 504 11 153 0 23 20 2 174 0 0 355 61
Uttarakhand 33 2,112,512 11 3 84 5 99 1 13 7 0 22 0 0 29 6
West Bengal 107 15,123,371 10 2 84 8 114 0 9 7 15 21 0 0 143 10
Total 2,980 392,984,906 352 331 5,217 145 2,458 39 763 1,135 130 3,354 167 36 2,345 169
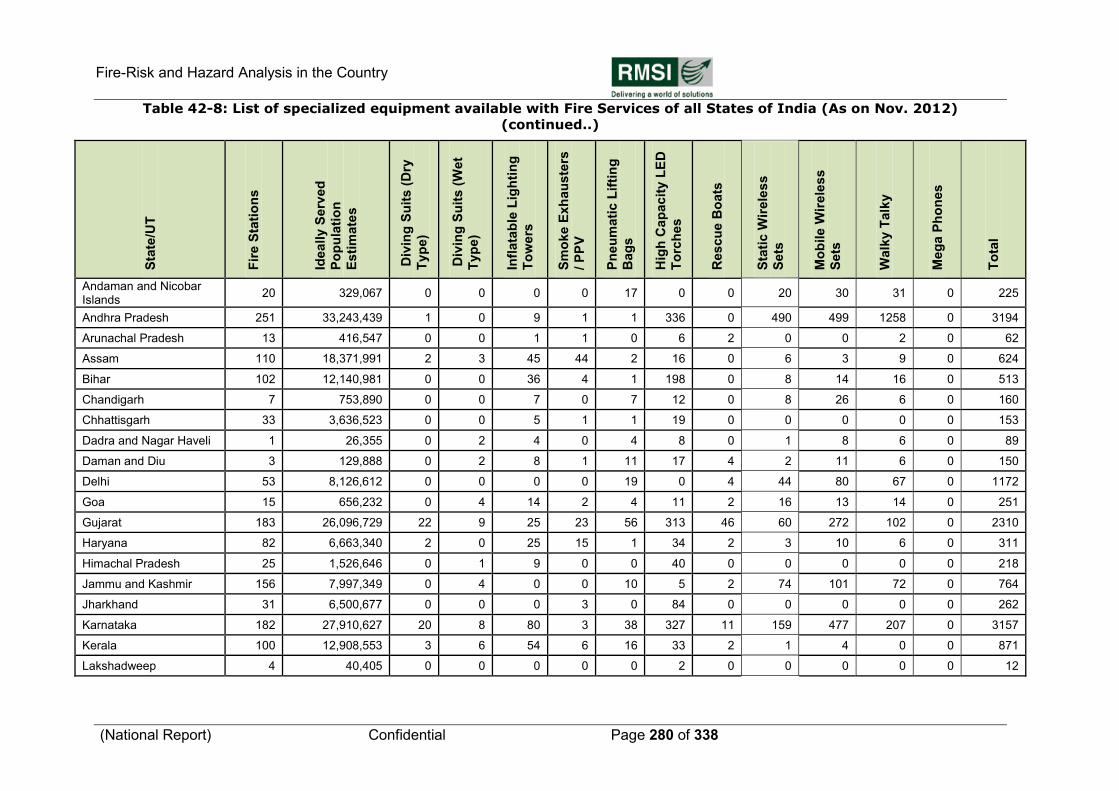
Fire-Risk and Hazard Analysis in the Country
(National Report) Confidential Page 280 of 338
Table 42-8: List of specialized equipment available with Fire Services of all States of India (As on Nov. 2012)
(continued..)
Sta
te/U
T
Fir
e S
tati
on
s
Ideally
Serv
ed
Po
pu
lati
on
Esti
mate
s
Div
ing
Su
its (
Dry
Typ
e)
Div
ing
Su
its (
Wet
Typ
e)
Infl
ata
ble
Lig
hti
ng
To
wers
Sm
oke E
xh
au
ste
rs
/ P
PV
Pn
eu
mati
c L
ifti
ng
Bag
s
Hig
h C
ap
ac
ity L
ED
To
rch
es
Rescu
e B
oats
Sta
tic W
irele
ss
Sets
Mo
bile W
irele
ss
Sets
Walk
y T
alk
y
Meg
a P
ho
nes
To
tal
Andaman and Nicobar Islands
20 329,067 0 0 0 0 17 0 0 20 30 31 0 225
Andhra Pradesh 251 33,243,439 1 0 9 1 1 336 0 490 499 1258 0 3194
Arunachal Pradesh 13 416,547 0 0 1 1 0 6 2 0 0 2 0 62
Assam 110 18,371,991 2 3 45 44 2 16 0 6 3 9 0 624
Bihar 102 12,140,981 0 0 36 4 1 198 0 8 14 16 0 513
Chandigarh 7 753,890 0 0 7 0 7 12 0 8 26 6 0 160
Chhattisgarh 33 3,636,523 0 0 5 1 1 19 0 0 0 0 0 153
Dadra and Nagar Haveli 1 26,355 0 2 4 0 4 8 0 1 8 6 0 89
Daman and Diu 3 129,888 0 2 8 1 11 17 4 2 11 6 0 150
Delhi 53 8,126,612 0 0 0 0 19 0 4 44 80 67 0 1172
Goa 15 656,232 0 4 14 2 4 11 2 16 13 14 0 251
Gujarat 183 26,096,729 22 9 25 23 56 313 46 60 272 102 0 2310
Haryana 82 6,663,340 2 0 25 15 1 34 2 3 10 6 0 311
Himachal Pradesh 25 1,526,646 0 1 9 0 0 40 0 0 0 0 0 218
Jammu and Kashmir 156 7,997,349 0 4 0 0 10 5 2 74 101 72 0 764
Jharkhand 31 6,500,677 0 0 0 3 0 84 0 0 0 0 0 262
Karnataka 182 27,910,627 20 8 80 3 38 327 11 159 477 207 0 3157
Kerala 100 12,908,553 3 6 54 6 16 33 2 1 4 0 0 871
Lakshadweep 4 40,405 0 0 0 0 0 2 0 0 0 0 0 12
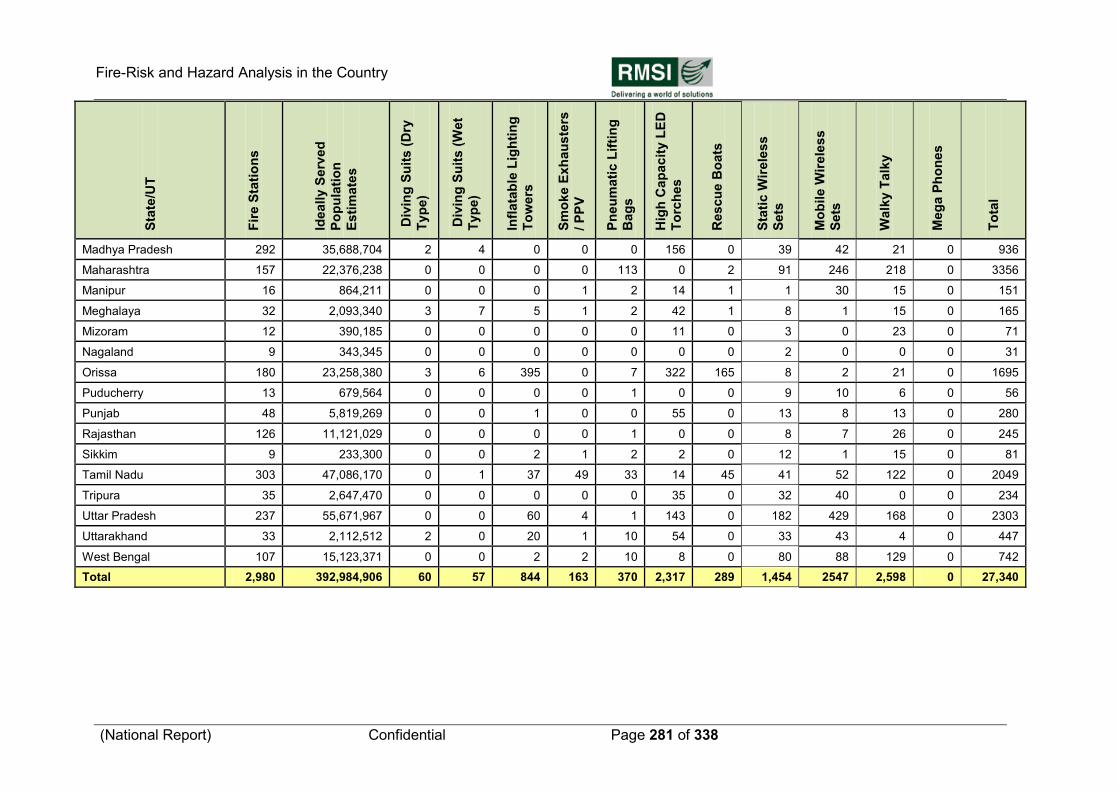
Fire-Risk and Hazard Analysis in the Country
(National Report) Confidential Page 281 of 338
Sta
te/U
T
Fir
e S
tati
on
s
Ideally
Serv
ed
Po
pu
lati
on
Esti
mate
s
Div
ing
Su
its (
Dry
Typ
e)
Div
ing
Su
its (
Wet
Typ
e)
Infl
ata
ble
Lig
hti
ng
To
wers
Sm
oke E
xh
au
ste
rs
/ P
PV
Pn
eu
mati
c L
ifti
ng
Bag
s
Hig
h C
ap
ac
ity L
ED
To
rch
es
Rescu
e B
oats
Sta
tic W
irele
ss
Sets
Mo
bile W
irele
ss
Sets
Walk
y T
alk
y
Meg
a P
ho
nes
To
tal
Madhya Pradesh 292 35,688,704 2 4 0 0 0 156 0 39 42 21 0 936
Maharashtra 157 22,376,238 0 0 0 0 113 0 2 91 246 218 0 3356
Manipur 16 864,211 0 0 0 1 2 14 1 1 30 15 0 151
Meghalaya 32 2,093,340 3 7 5 1 2 42 1 8 1 15 0 165
Mizoram 12 390,185 0 0 0 0 0 11 0 3 0 23 0 71
Nagaland 9 343,345 0 0 0 0 0 0 0 2 0 0 0 31
Orissa 180 23,258,380 3 6 395 0 7 322 165 8 2 21 0 1695
Puducherry 13 679,564 0 0 0 0 1 0 0 9 10 6 0 56
Punjab 48 5,819,269 0 0 1 0 0 55 0 13 8 13 0 280
Rajasthan 126 11,121,029 0 0 0 0 1 0 0 8 7 26 0 245
Sikkim 9 233,300 0 0 2 1 2 2 0 12 1 15 0 81
Tamil Nadu 303 47,086,170 0 1 37 49 33 14 45 41 52 122 0 2049
Tripura 35 2,647,470 0 0 0 0 0 35 0 32 40 0 0 234
Uttar Pradesh 237 55,671,967 0 0 60 4 1 143 0 182 429 168 0 2303
Uttarakhand 33 2,112,512 2 0 20 1 10 54 0 33 43 4 0 447
West Bengal 107 15,123,371 0 0 2 2 10 8 0 80 88 129 0 742
Total 2,980 392,984,906 60 57 844 163 370 2,317 289 1,454 2547 2,598 0 27,340
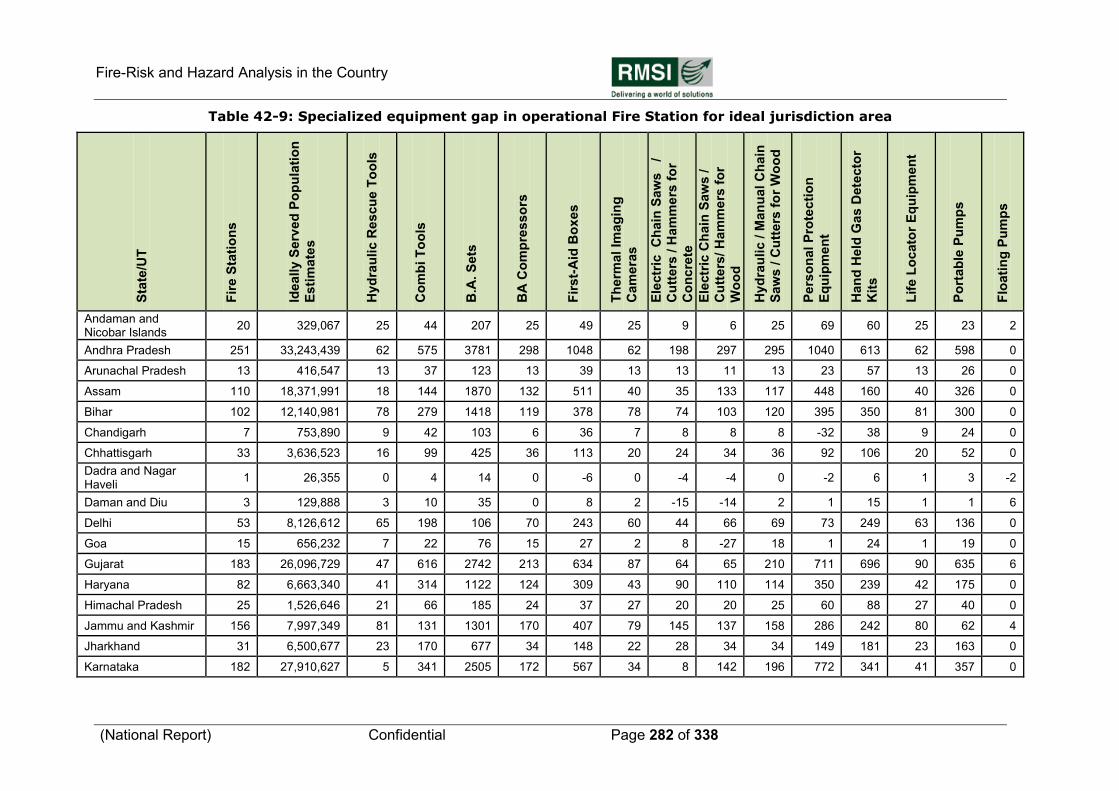
Fire-Risk and Hazard Analysis in the Country
(National Report) Confidential Page 282 of 338
Table 42-9: Specialized equipment gap in operational Fire Station for ideal jurisdiction area
Sta
te/U
T
Fir
e S
tati
on
s
Ideally
Serv
ed
Po
pu
lati
on
Esti
mate
s
Hyd
rau
lic R
escu
e T
oo
ls
Co
mb
i T
oo
ls
B.A
. S
ets
BA
Co
mp
resso
rs
Fir
st-
Aid
Bo
xes
Th
erm
al
Imag
ing
Cam
era
s
Ele
ctr
ic
Ch
ain
Saw
s
/
Cu
tters
/ H
am
me
rs f
or
Co
ncre
te
Ele
ctr
ic C
hain
Saw
s /
Cu
tters
/ H
am
me
rs f
or
Wo
od
Hyd
rau
lic / M
an
ual
Ch
ain
Saw
s /
Cu
tters
fo
r W
oo
d
Pers
on
al
Pro
tecti
on
Eq
uip
men
t
Han
d H
eld
Ga
s D
ete
cto
r
Kit
s
Lif
e L
ocato
r E
qu
ipm
en
t
Po
rtab
le P
um
ps
Flo
ati
ng
Pu
mp
s
Andaman and Nicobar Islands
20 329,067 25 44 207 25 49 25 9 6 25 69 60 25 23 2
Andhra Pradesh 251 33,243,439 62 575 3781 298 1048 62 198 297 295 1040 613 62 598 0
Arunachal Pradesh 13 416,547 13 37 123 13 39 13 13 11 13 23 57 13 26 0
Assam 110 18,371,991 18 144 1870 132 511 40 35 133 117 448 160 40 326 0
Bihar 102 12,140,981 78 279 1418 119 378 78 74 103 120 395 350 81 300 0
Chandigarh 7 753,890 9 42 103 6 36 7 8 8 8 -32 38 9 24 0
Chhattisgarh 33 3,636,523 16 99 425 36 113 20 24 34 36 92 106 20 52 0
Dadra and Nagar Haveli
1 26,355 0 4 14 0 -6 0 -4 -4 0 -2 6 1 3 -2
Daman and Diu 3 129,888 3 10 35 0 8 2 -15 -14 2 1 15 1 1 6
Delhi 53 8,126,612 65 198 106 70 243 60 44 66 69 73 249 63 136 0
Goa 15 656,232 7 22 76 15 27 2 8 -27 18 1 24 1 19 0
Gujarat 183 26,096,729 47 616 2742 213 634 87 64 65 210 711 696 90 635 6
Haryana 82 6,663,340 41 314 1122 124 309 43 90 110 114 350 239 42 175 0
Himachal Pradesh 25 1,526,646 21 66 185 24 37 27 20 20 25 60 88 27 40 0
Jammu and Kashmir 156 7,997,349 81 131 1301 170 407 79 145 137 158 286 242 80 62 4
Jharkhand 31 6,500,677 23 170 677 34 148 22 28 34 34 149 181 23 163 0
Karnataka 182 27,910,627 5 341 2505 172 567 34 8 142 196 772 341 41 357 0
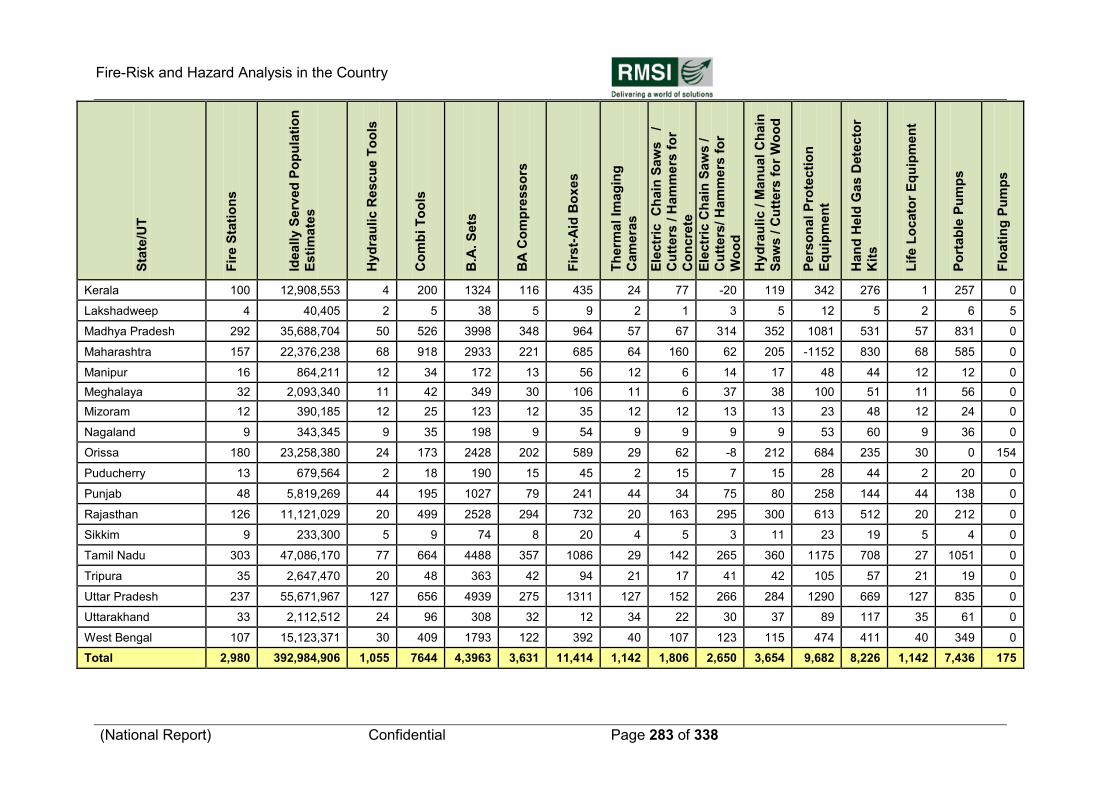
Fire-Risk and Hazard Analysis in the Country
(National Report) Confidential Page 283 of 338
Sta
te/U
T
Fir
e S
tati
on
s
Ideally
Serv
ed
Po
pu
lati
on
Esti
mate
s
Hyd
rau
lic R
escu
e T
oo
ls
Co
mb
i T
oo
ls
B.A
. S
ets
BA
Co
mp
resso
rs
Fir
st-
Aid
Bo
xes
Th
erm
al
Imag
ing
Cam
era
s
Ele
ctr
ic
Ch
ain
Saw
s
/
Cu
tters
/ H
am
me
rs f
or
Co
ncre
te
Ele
ctr
ic C
hain
Saw
s /
Cu
tters
/ H
am
me
rs f
or
Wo
od
Hyd
rau
lic / M
an
ual
Ch
ain
Saw
s /
Cu
tters
fo
r W
oo
d
Pers
on
al
Pro
tecti
on
Eq
uip
men
t
Han
d H
eld
Ga
s D
ete
cto
r
Kit
s
Lif
e L
ocato
r E
qu
ipm
en
t
Po
rtab
le P
um
ps
Flo
ati
ng
Pu
mp
s
Kerala 100 12,908,553 4 200 1324 116 435 24 77 -20 119 342 276 1 257 0
Lakshadweep 4 40,405 2 5 38 5 9 2 1 3 5 12 5 2 6 5
Madhya Pradesh 292 35,688,704 50 526 3998 348 964 57 67 314 352 1081 531 57 831 0
Maharashtra 157 22,376,238 68 918 2933 221 685 64 160 62 205 -1152 830 68 585 0
Manipur 16 864,211 12 34 172 13 56 12 6 14 17 48 44 12 12 0
Meghalaya 32 2,093,340 11 42 349 30 106 11 6 37 38 100 51 11 56 0
Mizoram 12 390,185 12 25 123 12 35 12 12 13 13 23 48 12 24 0
Nagaland 9 343,345 9 35 198 9 54 9 9 9 9 53 60 9 36 0
Orissa 180 23,258,380 24 173 2428 202 589 29 62 -8 212 684 235 30 0 154
Puducherry 13 679,564 2 18 190 15 45 2 15 7 15 28 44 2 20 0
Punjab 48 5,819,269 44 195 1027 79 241 44 34 75 80 258 144 44 138 0
Rajasthan 126 11,121,029 20 499 2528 294 732 20 163 295 300 613 512 20 212 0
Sikkim 9 233,300 5 9 74 8 20 4 5 3 11 23 19 5 4 0
Tamil Nadu 303 47,086,170 77 664 4488 357 1086 29 142 265 360 1175 708 27 1051 0
Tripura 35 2,647,470 20 48 363 42 94 21 17 41 42 105 57 21 19 0
Uttar Pradesh 237 55,671,967 127 656 4939 275 1311 127 152 266 284 1290 669 127 835 0
Uttarakhand 33 2,112,512 24 96 308 32 12 34 22 30 37 89 117 35 61 0
West Bengal 107 15,123,371 30 409 1793 122 392 40 107 123 115 474 411 40 349 0
Total 2,980 392,984,906 1,055 7644 4,3963 3,631 11,414 1,142 1,806 2,650 3,654 9,682 8,226 1,142 7,436 175
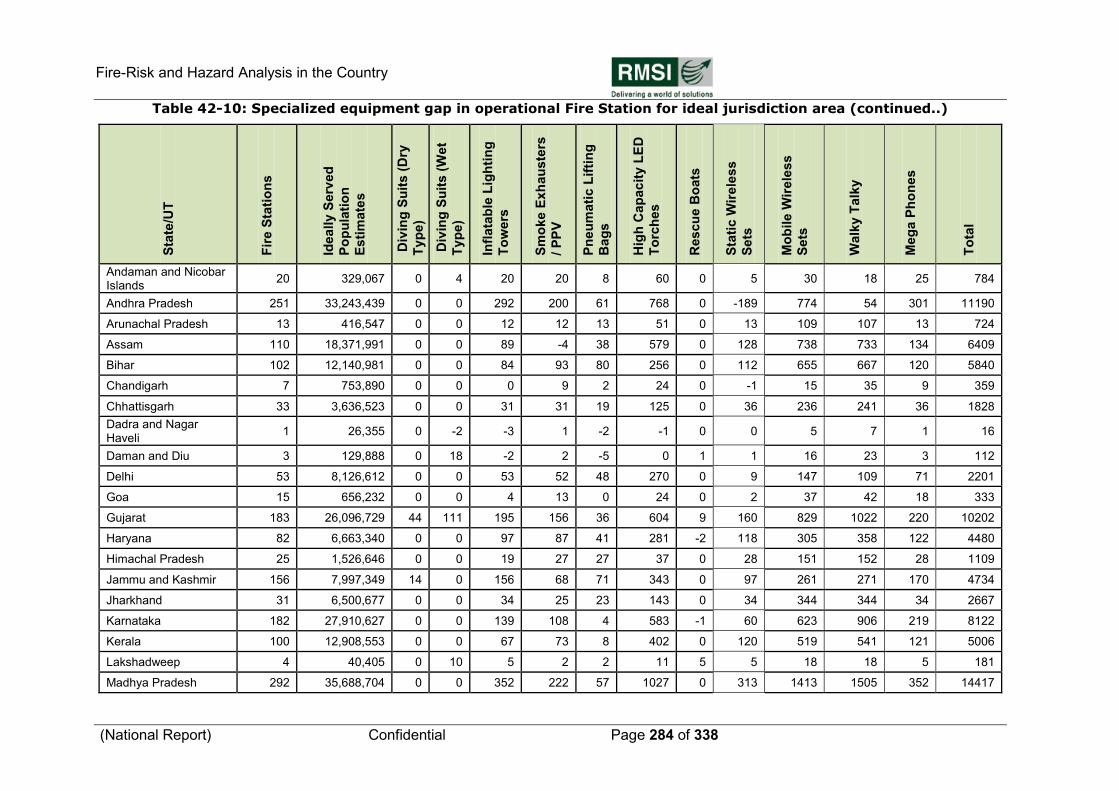
Fire-Risk and Hazard Analysis in the Country
(National Report) Confidential Page 284 of 338
Table 42-10: Specialized equipment gap in operational Fire Station for ideal jurisdiction area (continued..)
Sta
te/U
T
Fir
e S
tati
on
s
Ideally
Serv
ed
Po
pu
lati
on
Esti
mate
s
Div
ing
Su
its (
Dry
Typ
e)
Div
ing
Su
its (
Wet
Typ
e)
Infl
ata
ble
Lig
hti
ng
To
wers
Sm
oke E
xh
au
ste
rs
/ P
PV
Pn
eu
mati
c L
ifti
ng
Bag
s
Hig
h C
ap
ac
ity L
ED
To
rch
es
Rescu
e B
oats
Sta
tic W
irele
ss
Sets
Mo
bile W
irele
ss
Sets
Walk
y T
alk
y
Meg
a P
ho
nes
To
tal
Andaman and Nicobar Islands
20 329,067 0 4 20 20 8 60 0 5 30 18 25 784
Andhra Pradesh 251 33,243,439 0 0 292 200 61 768 0 -189 774 54 301 11190
Arunachal Pradesh 13 416,547 0 0 12 12 13 51 0 13 109 107 13 724
Assam 110 18,371,991 0 0 89 -4 38 579 0 128 738 733 134 6409
Bihar 102 12,140,981 0 0 84 93 80 256 0 112 655 667 120 5840
Chandigarh 7 753,890 0 0 0 9 2 24 0 -1 15 35 9 359
Chhattisgarh 33 3,636,523 0 0 31 31 19 125 0 36 236 241 36 1828
Dadra and Nagar Haveli
1 26,355 0 -2 -3 1 -2 -1 0 0 5 7 1 16
Daman and Diu 3 129,888 0 18 -2 2 -5 0 1 1 16 23 3 112
Delhi 53 8,126,612 0 0 53 52 48 270 0 9 147 109 71 2201
Goa 15 656,232 0 0 4 13 0 24 0 2 37 42 18 333
Gujarat 183 26,096,729 44 111 195 156 36 604 9 160 829 1022 220 10202
Haryana 82 6,663,340 0 0 97 87 41 281 -2 118 305 358 122 4480
Himachal Pradesh 25 1,526,646 0 0 19 27 27 37 0 28 151 152 28 1109
Jammu and Kashmir 156 7,997,349 14 0 156 68 71 343 0 97 261 271 170 4734
Jharkhand 31 6,500,677 0 0 34 25 23 143 0 34 344 344 34 2667
Karnataka 182 27,910,627 0 0 139 108 4 583 -1 60 623 906 219 8122
Kerala 100 12,908,553 0 0 67 73 8 402 0 120 519 541 121 5006
Lakshadweep 4 40,405 0 10 5 2 2 11 5 5 18 18 5 181
Madhya Pradesh 292 35,688,704 0 0 352 222 57 1027 0 313 1413 1505 352 14417
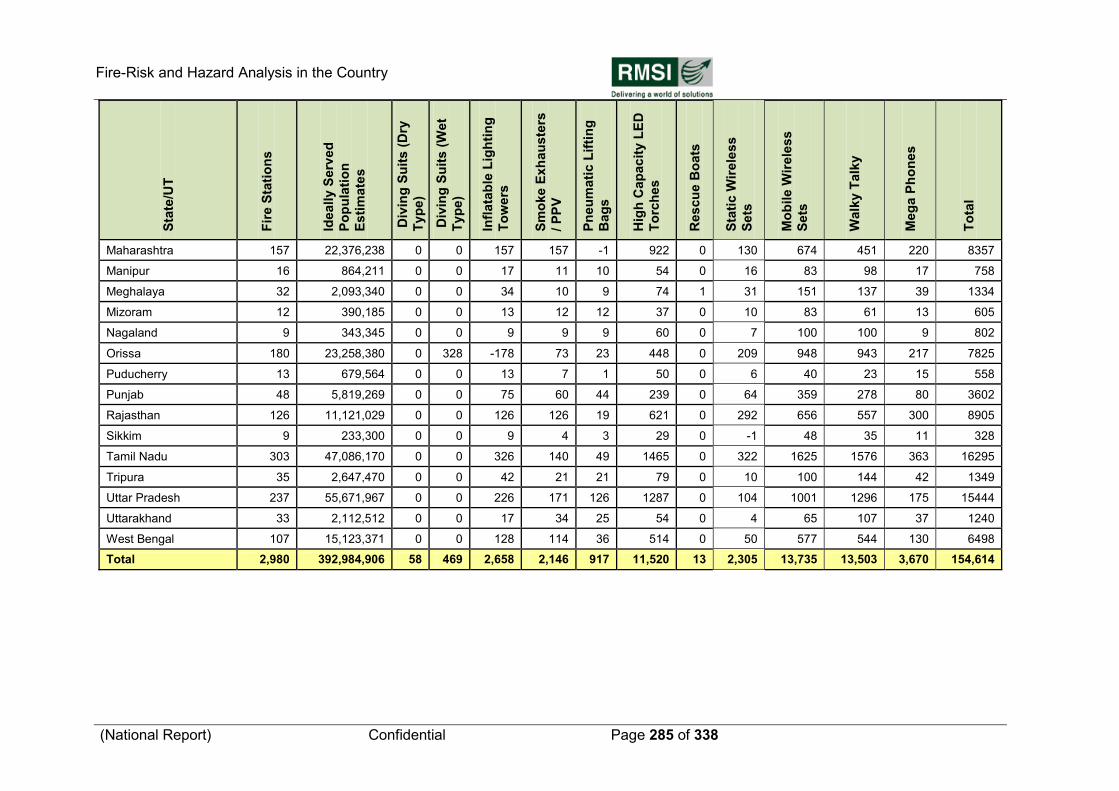
Fire-Risk and Hazard Analysis in the Country
(National Report) Confidential Page 285 of 338
Sta
te/U
T
Fir
e S
tati
on
s
Ideally
Serv
ed
Po
pu
lati
on
Esti
mate
s
Div
ing
Su
its (
Dry
Typ
e)
Div
ing
Su
its (
Wet
Typ
e)
Infl
ata
ble
Lig
hti
ng
To
wers
Sm
oke E
xh
au
ste
rs
/ P
PV
Pn
eu
mati
c L
ifti
ng
Bag
s
Hig
h C
ap
ac
ity L
ED
To
rch
es
Rescu
e B
oats
Sta
tic W
irele
ss
Sets
Mo
bile W
irele
ss
Sets
Walk
y T
alk
y
Meg
a P
ho
nes
To
tal
Maharashtra 157 22,376,238 0 0 157 157 -1 922 0 130 674 451 220 8357
Manipur 16 864,211 0 0 17 11 10 54 0 16 83 98 17 758
Meghalaya 32 2,093,340 0 0 34 10 9 74 1 31 151 137 39 1334
Mizoram 12 390,185 0 0 13 12 12 37 0 10 83 61 13 605
Nagaland 9 343,345 0 0 9 9 9 60 0 7 100 100 9 802
Orissa 180 23,258,380 0 328 -178 73 23 448 0 209 948 943 217 7825
Puducherry 13 679,564 0 0 13 7 1 50 0 6 40 23 15 558
Punjab 48 5,819,269 0 0 75 60 44 239 0 64 359 278 80 3602
Rajasthan 126 11,121,029 0 0 126 126 19 621 0 292 656 557 300 8905
Sikkim 9 233,300 0 0 9 4 3 29 0 -1 48 35 11 328
Tamil Nadu 303 47,086,170 0 0 326 140 49 1465 0 322 1625 1576 363 16295
Tripura 35 2,647,470 0 0 42 21 21 79 0 10 100 144 42 1349
Uttar Pradesh 237 55,671,967 0 0 226 171 126 1287 0 104 1001 1296 175 15444
Uttarakhand 33 2,112,512 0 0 17 34 25 54 0 4 65 107 37 1240
West Bengal 107 15,123,371 0 0 128 114 36 514 0 50 577 544 130 6498
Total 2,980 392,984,906 58 469 2,658 2,146 917 11,520 13 2,305 13,735 13,503 3,670 154,614
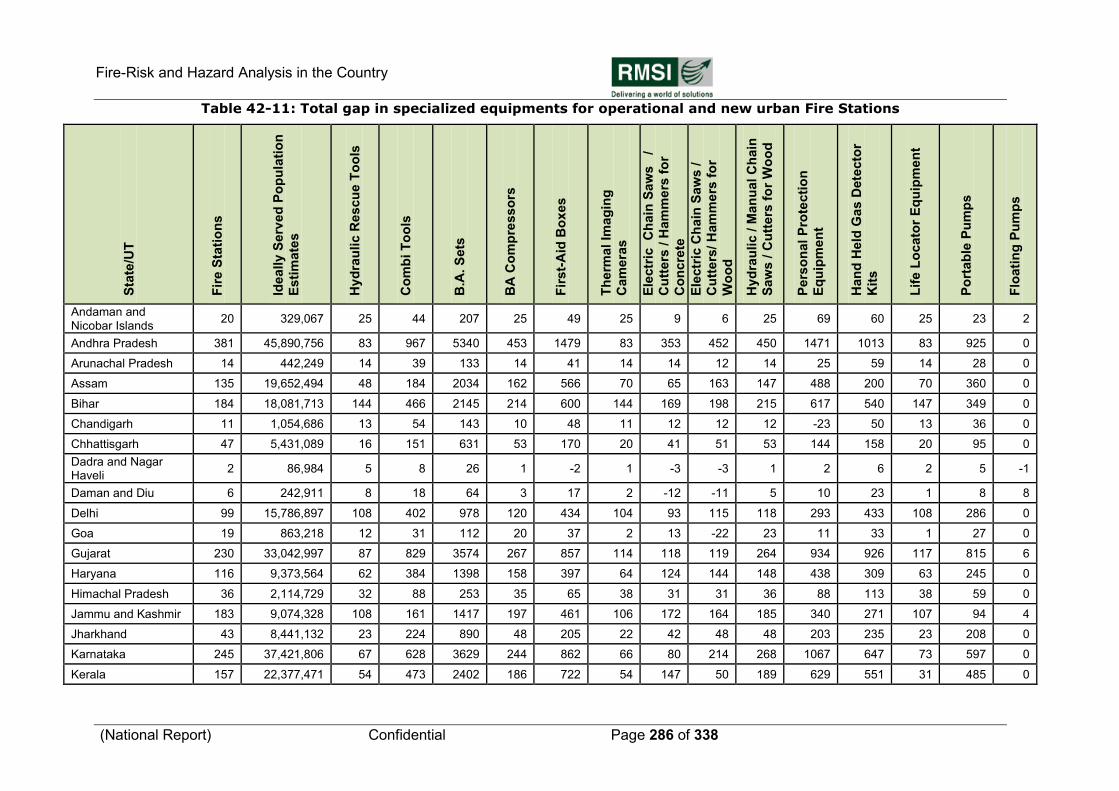
Fire-Risk and Hazard Analysis in the Country
(National Report) Confidential Page 286 of 338
Table 42-11: Total gap in specialized equipments for operational and new urban Fire Stations
Sta
te/U
T
Fir
e S
tati
on
s
Ideally
Serv
ed
Po
pu
lati
on
Esti
mate
s
Hyd
rau
lic R
escu
e T
oo
ls
Co
mb
i T
oo
ls
B.A
. S
ets
BA
Co
mp
resso
rs
Fir
st-
Aid
Bo
xes
Th
erm
al
Imag
ing
Cam
era
s
Ele
ctr
ic
Ch
ain
Saw
s
/
Cu
tters
/ H
am
me
rs f
or
Co
ncre
te
Ele
ctr
ic C
hain
Saw
s /
Cu
tters
/ H
am
me
rs f
or
Wo
od
Hyd
rau
lic / M
an
ual
Ch
ain
Saw
s /
Cu
tters
fo
r W
oo
d
Pers
on
al
Pro
tecti
on
Eq
uip
men
t
Han
d H
eld
Ga
s D
ete
cto
r
Kit
s
Lif
e L
ocato
r E
qu
ipm
en
t
Po
rtab
le P
um
ps
Flo
ati
ng
Pu
mp
s
Andaman and Nicobar Islands
20 329,067 25 44 207 25 49 25 9 6 25 69 60 25 23 2
Andhra Pradesh 381 45,890,756 83 967 5340 453 1479 83 353 452 450 1471 1013 83 925 0
Arunachal Pradesh 14 442,249 14 39 133 14 41 14 14 12 14 25 59 14 28 0
Assam 135 19,652,494 48 184 2034 162 566 70 65 163 147 488 200 70 360 0
Bihar 184 18,081,713 144 466 2145 214 600 144 169 198 215 617 540 147 349 0
Chandigarh 11 1,054,686 13 54 143 10 48 11 12 12 12 -23 50 13 36 0
Chhattisgarh 47 5,431,089 16 151 631 53 170 20 41 51 53 144 158 20 95 0
Dadra and Nagar Haveli
2 86,984 5 8 26 1 -2 1 -3 -3 1 2 6 2 5 -1
Daman and Diu 6 242,911 8 18 64 3 17 2 -12 -11 5 10 23 1 8 8
Delhi 99 15,786,897 108 402 978 120 434 104 93 115 118 293 433 108 286 0
Goa 19 863,218 12 31 112 20 37 2 13 -22 23 11 33 1 27 0
Gujarat 230 33,042,997 87 829 3574 267 857 114 118 119 264 934 926 117 815 6
Haryana 116 9,373,564 62 384 1398 158 397 64 124 144 148 438 309 63 245 0
Himachal Pradesh 36 2,114,729 32 88 253 35 65 38 31 31 36 88 113 38 59 0
Jammu and Kashmir 183 9,074,328 108 161 1417 197 461 106 172 164 185 340 271 107 94 4
Jharkhand 43 8,441,132 23 224 890 48 205 22 42 48 48 203 235 23 208 0
Karnataka 245 37,421,806 67 628 3629 244 862 66 80 214 268 1067 647 73 597 0
Kerala 157 22,377,471 54 473 2402 186 722 54 147 50 189 629 551 31 485 0
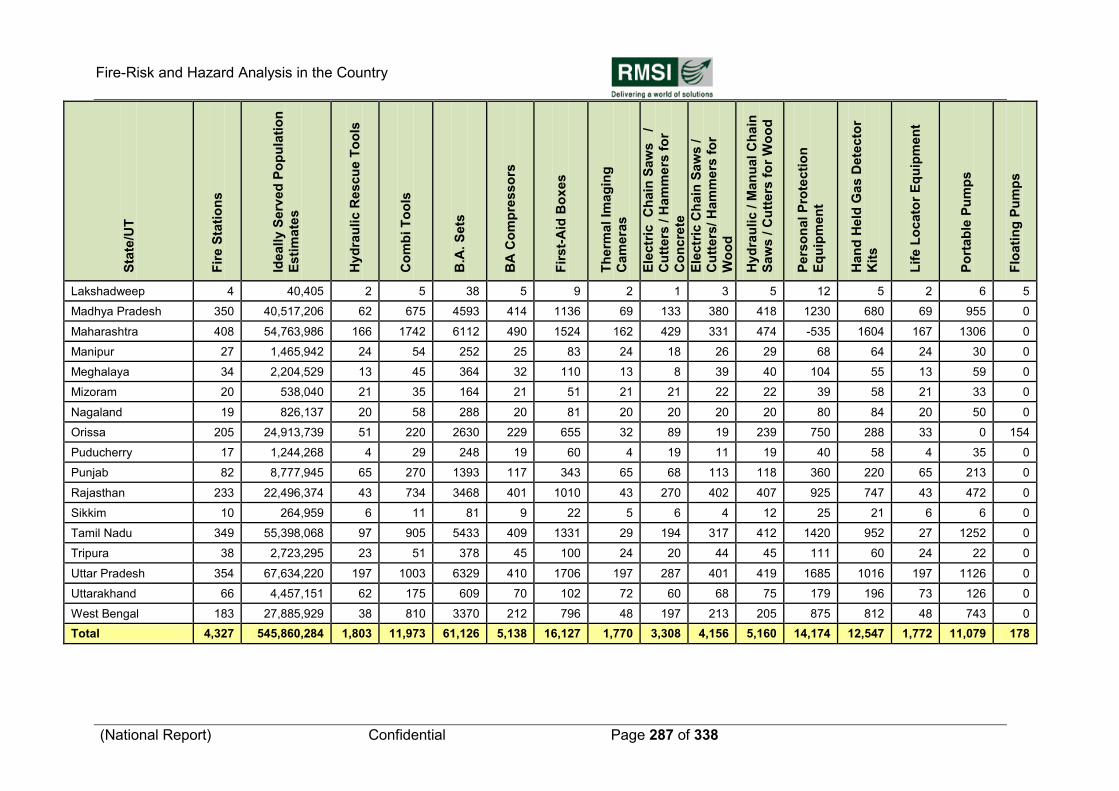
Fire-Risk and Hazard Analysis in the Country
(National Report) Confidential Page 287 of 338
Sta
te/U
T
Fir
e S
tati
on
s
Ideally
Serv
ed
Po
pu
lati
on
Esti
mate
s
Hyd
rau
lic R
escu
e T
oo
ls
Co
mb
i T
oo
ls
B.A
. S
ets
BA
Co
mp
resso
rs
Fir
st-
Aid
Bo
xes
Th
erm
al
Imag
ing
Cam
era
s
Ele
ctr
ic
Ch
ain
Saw
s
/
Cu
tters
/ H
am
me
rs f
or
Co
ncre
te
Ele
ctr
ic C
hain
Saw
s /
Cu
tters
/ H
am
me
rs f
or
Wo
od
Hyd
rau
lic / M
an
ual
Ch
ain
Saw
s /
Cu
tters
fo
r W
oo
d
Pers
on
al
Pro
tecti
on
Eq
uip
men
t
Han
d H
eld
Ga
s D
ete
cto
r
Kit
s
Lif
e L
ocato
r E
qu
ipm
en
t
Po
rtab
le P
um
ps
Flo
ati
ng
Pu
mp
s
Lakshadweep 4 40,405 2 5 38 5 9 2 1 3 5 12 5 2 6 5
Madhya Pradesh 350 40,517,206 62 675 4593 414 1136 69 133 380 418 1230 680 69 955 0
Maharashtra 408 54,763,986 166 1742 6112 490 1524 162 429 331 474 -535 1604 167 1306 0
Manipur 27 1,465,942 24 54 252 25 83 24 18 26 29 68 64 24 30 0
Meghalaya 34 2,204,529 13 45 364 32 110 13 8 39 40 104 55 13 59 0
Mizoram 20 538,040 21 35 164 21 51 21 21 22 22 39 58 21 33 0
Nagaland 19 826,137 20 58 288 20 81 20 20 20 20 80 84 20 50 0
Orissa 205 24,913,739 51 220 2630 229 655 32 89 19 239 750 288 33 0 154
Puducherry 17 1,244,268 4 29 248 19 60 4 19 11 19 40 58 4 35 0
Punjab 82 8,777,945 65 270 1393 117 343 65 68 113 118 360 220 65 213 0
Rajasthan 233 22,496,374 43 734 3468 401 1010 43 270 402 407 925 747 43 472 0
Sikkim 10 264,959 6 11 81 9 22 5 6 4 12 25 21 6 6 0
Tamil Nadu 349 55,398,068 97 905 5433 409 1331 29 194 317 412 1420 952 27 1252 0
Tripura 38 2,723,295 23 51 378 45 100 24 20 44 45 111 60 24 22 0
Uttar Pradesh 354 67,634,220 197 1003 6329 410 1706 197 287 401 419 1685 1016 197 1126 0
Uttarakhand 66 4,457,151 62 175 609 70 102 72 60 68 75 179 196 73 126 0
West Bengal 183 27,885,929 38 810 3370 212 796 48 197 213 205 875 812 48 743 0
Total 4,327 545,860,284 1,803 11,973 61,126 5,138 16,127 1,770 3,308 4,156 5,160 14,174 12,547 1,772 11,079 178
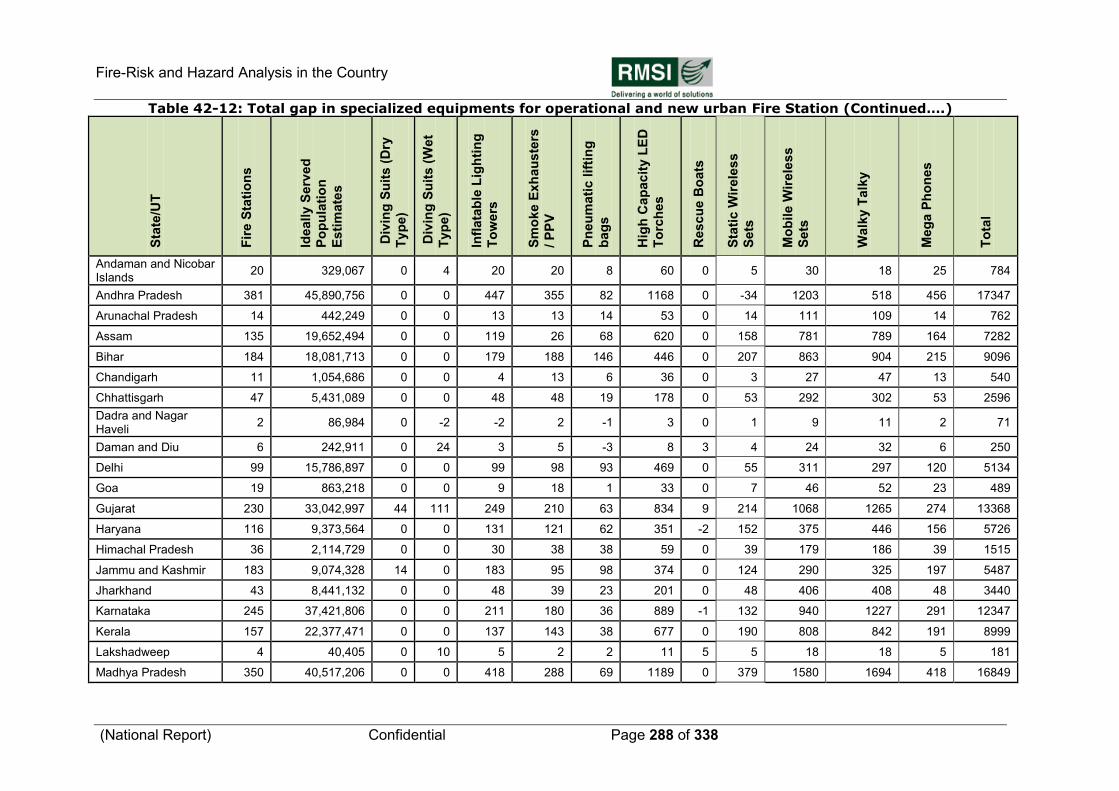
Fire-Risk and Hazard Analysis in the Country
(National Report) Confidential Page 288 of 338
Table 42-12: Total gap in specialized equipments for operational and new urban Fire Station (Continued….)
Sta
te/U
T
Fir
e S
tati
on
s
Ideally
Serv
ed
Po
pu
lati
on
Esti
mate
s
Div
ing
Su
its (
Dry
Typ
e)
Div
ing
Su
its (
Wet
Typ
e)
Infl
ata
ble
Lig
hti
ng
To
wers
Sm
oke E
xh
au
ste
rs
/ P
PV
Pn
eu
mati
c lif
tin
g
bag
s
Hig
h C
ap
ac
ity L
ED
To
rch
es
Rescu
e B
oats
Sta
tic W
irele
ss
Sets
Mo
bile W
irele
ss
Sets
Walk
y T
alk
y
Meg
a P
ho
nes
To
tal
Andaman and Nicobar Islands
20 329,067 0 4 20 20 8 60 0 5 30 18 25 784
Andhra Pradesh 381 45,890,756 0 0 447 355 82 1168 0 -34 1203 518 456 17347
Arunachal Pradesh 14 442,249 0 0 13 13 14 53 0 14 111 109 14 762
Assam 135 19,652,494 0 0 119 26 68 620 0 158 781 789 164 7282
Bihar 184 18,081,713 0 0 179 188 146 446 0 207 863 904 215 9096
Chandigarh 11 1,054,686 0 0 4 13 6 36 0 3 27 47 13 540
Chhattisgarh 47 5,431,089 0 0 48 48 19 178 0 53 292 302 53 2596
Dadra and Nagar Haveli
2 86,984 0 -2 -2 2 -1 3 0 1 9 11 2 71
Daman and Diu 6 242,911 0 24 3 5 -3 8 3 4 24 32 6 250
Delhi 99 15,786,897 0 0 99 98 93 469 0 55 311 297 120 5134
Goa 19 863,218 0 0 9 18 1 33 0 7 46 52 23 489
Gujarat 230 33,042,997 44 111 249 210 63 834 9 214 1068 1265 274 13368
Haryana 116 9,373,564 0 0 131 121 62 351 -2 152 375 446 156 5726
Himachal Pradesh 36 2,114,729 0 0 30 38 38 59 0 39 179 186 39 1515
Jammu and Kashmir 183 9,074,328 14 0 183 95 98 374 0 124 290 325 197 5487
Jharkhand 43 8,441,132 0 0 48 39 23 201 0 48 406 408 48 3440
Karnataka 245 37,421,806 0 0 211 180 36 889 -1 132 940 1227 291 12347
Kerala 157 22,377,471 0 0 137 143 38 677 0 190 808 842 191 8999
Lakshadweep 4 40,405 0 10 5 2 2 11 5 5 18 18 5 181
Madhya Pradesh 350 40,517,206 0 0 418 288 69 1189 0 379 1580 1694 418 16849
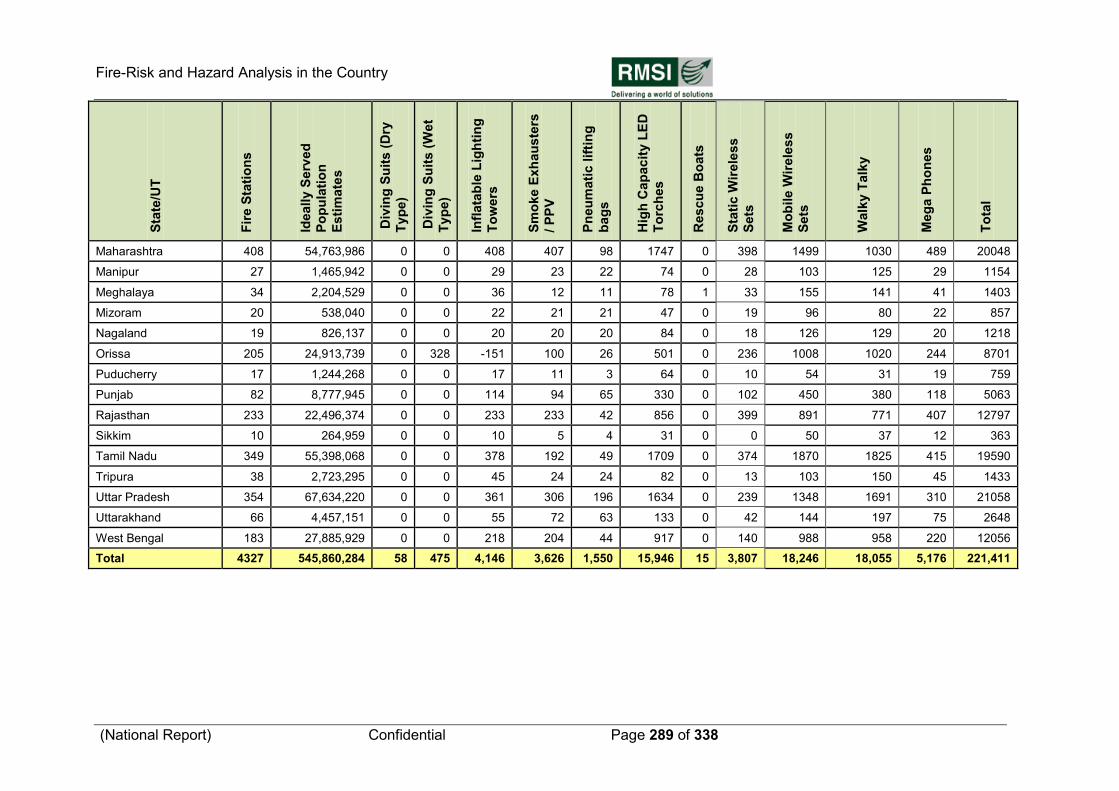
Fire-Risk and Hazard Analysis in the Country
(National Report) Confidential Page 289 of 338
Sta
te/U
T
Fir
e S
tati
on
s
Ideally
Serv
ed
Po
pu
lati
on
Esti
mate
s
Div
ing
Su
its (
Dry
Typ
e)
Div
ing
Su
its (
Wet
Typ
e)
Infl
ata
ble
Lig
hti
ng
To
wers
Sm
oke E
xh
au
ste
rs
/ P
PV
Pn
eu
mati
c lif
tin
g
bag
s
Hig
h C
ap
ac
ity L
ED
To
rch
es
Rescu
e B
oats
Sta
tic W
irele
ss
Sets
Mo
bile W
irele
ss
Sets
Walk
y T
alk
y
Meg
a P
ho
nes
To
tal
Maharashtra 408 54,763,986 0 0 408 407 98 1747 0 398 1499 1030 489 20048
Manipur 27 1,465,942 0 0 29 23 22 74 0 28 103 125 29 1154
Meghalaya 34 2,204,529 0 0 36 12 11 78 1 33 155 141 41 1403
Mizoram 20 538,040 0 0 22 21 21 47 0 19 96 80 22 857
Nagaland 19 826,137 0 0 20 20 20 84 0 18 126 129 20 1218
Orissa 205 24,913,739 0 328 -151 100 26 501 0 236 1008 1020 244 8701
Puducherry 17 1,244,268 0 0 17 11 3 64 0 10 54 31 19 759
Punjab 82 8,777,945 0 0 114 94 65 330 0 102 450 380 118 5063
Rajasthan 233 22,496,374 0 0 233 233 42 856 0 399 891 771 407 12797
Sikkim 10 264,959 0 0 10 5 4 31 0 0 50 37 12 363
Tamil Nadu 349 55,398,068 0 0 378 192 49 1709 0 374 1870 1825 415 19590
Tripura 38 2,723,295 0 0 45 24 24 82 0 13 103 150 45 1433
Uttar Pradesh 354 67,634,220 0 0 361 306 196 1634 0 239 1348 1691 310 21058
Uttarakhand 66 4,457,151 0 0 55 72 63 133 0 42 144 197 75 2648
West Bengal 183 27,885,929 0 0 218 204 44 917 0 140 988 958 220 12056
Total 4327 545,860,284 58 475 4,146 3,626 1,550 15,946 15 3,807 18,246 18,055 5,176 221,411
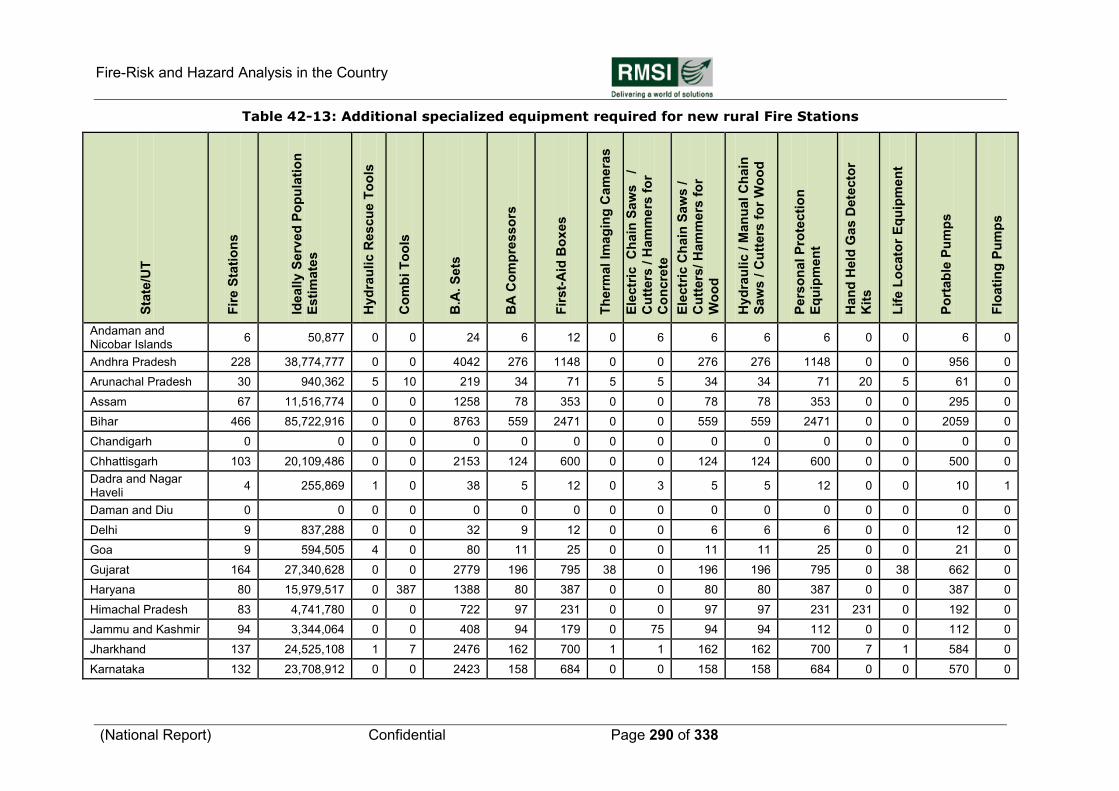
Fire-Risk and Hazard Analysis in the Country
(National Report) Confidential Page 290 of 338
Table 42-13: Additional specialized equipment required for new rural Fire Stations
Sta
te/U
T
Fir
e S
tati
on
s
Ideally
Serv
ed
Po
pu
lati
on
Esti
mate
s
Hyd
rau
lic R
escu
e T
oo
ls
Co
mb
i T
oo
ls
B.A
. S
ets
BA
Co
mp
resso
rs
Fir
st-
Aid
Bo
xes
Th
erm
al
Imag
ing
Cam
era
s
Ele
ctr
ic
Ch
ain
Saw
s
/
Cu
tters
/ H
am
me
rs f
or
Co
ncre
te
Ele
ctr
ic C
hain
Saw
s /
Cu
tters
/ H
am
me
rs f
or
Wo
od
Hyd
rau
lic / M
an
ual
Ch
ain
Saw
s /
Cu
tters
fo
r W
oo
d
Pers
on
al
Pro
tecti
on
Eq
uip
men
t
Han
d H
eld
Ga
s D
ete
cto
r
Kit
s
Lif
e L
ocato
r E
qu
ipm
en
t
Po
rtab
le P
um
ps
Flo
ati
ng
Pu
mp
s
Andaman and Nicobar Islands
6 50,877 0 0 24 6 12 0 6 6 6 6 0 0 6 0
Andhra Pradesh 228 38,774,777 0 0 4042 276 1148 0 0 276 276 1148 0 0 956 0
Arunachal Pradesh 30 940,362 5 10 219 34 71 5 5 34 34 71 20 5 61 0
Assam 67 11,516,774 0 0 1258 78 353 0 0 78 78 353 0 0 295 0
Bihar 466 85,722,916 0 0 8763 559 2471 0 0 559 559 2471 0 0 2059 0
Chandigarh 0 0 0 0 0 0 0 0 0 0 0 0 0 0 0 0
Chhattisgarh 103 20,109,486 0 0 2153 124 600 0 0 124 124 600 0 0 500 0
Dadra and Nagar Haveli
4 255,869 1 0 38 5 12 0 3 5 5 12 0 0 10 1
Daman and Diu 0 0 0 0 0 0 0 0 0 0 0 0 0 0 0 0
Delhi 9 837,288 0 0 32 9 12 0 0 6 6 6 0 0 12 0
Goa 9 594,505 4 0 80 11 25 0 0 11 11 25 0 0 21 0
Gujarat 164 27,340,628 0 0 2779 196 795 38 0 196 196 795 0 38 662 0
Haryana 80 15,979,517 0 387 1388 80 387 0 0 80 80 387 0 0 387 0
Himachal Pradesh 83 4,741,780 0 0 722 97 231 0 0 97 97 231 231 0 192 0
Jammu and Kashmir 94 3,344,064 0 0 408 94 179 0 75 94 94 112 0 0 112 0
Jharkhand 137 24,525,108 1 7 2476 162 700 1 1 162 162 700 7 1 584 0
Karnataka 132 23,708,912 0 0 2423 158 684 0 0 158 158 684 0 0 570 0
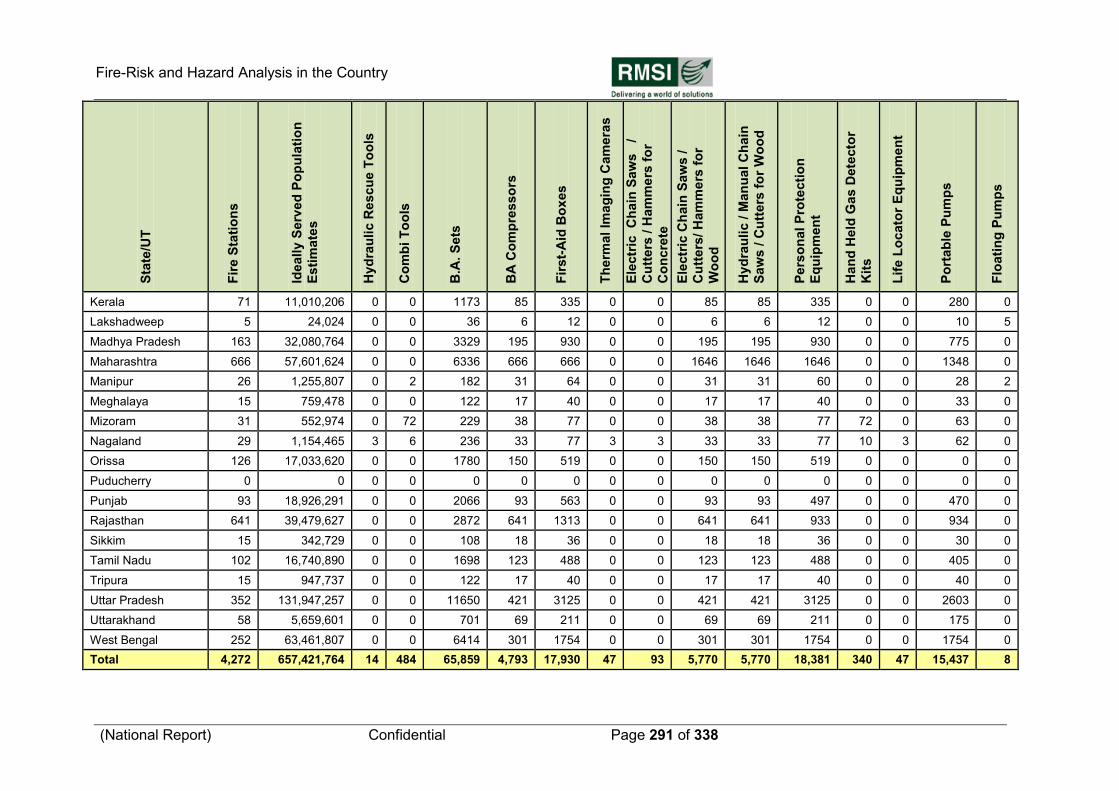
Fire-Risk and Hazard Analysis in the Country
(National Report) Confidential Page 291 of 338
Sta
te/U
T
Fir
e S
tati
on
s
Ideally
Serv
ed
Po
pu
lati
on
Esti
mate
s
Hyd
rau
lic R
escu
e T
oo
ls
Co
mb
i T
oo
ls
B.A
. S
ets
BA
Co
mp
resso
rs
Fir
st-
Aid
Bo
xes
Th
erm
al
Imag
ing
Cam
era
s
Ele
ctr
ic
Ch
ain
Saw
s
/
Cu
tters
/ H
am
me
rs f
or
Co
ncre
te
Ele
ctr
ic C
hain
Saw
s /
Cu
tters
/ H
am
me
rs f
or
Wo
od
Hyd
rau
lic / M
an
ual
Ch
ain
Saw
s /
Cu
tters
fo
r W
oo
d
Pers
on
al
Pro
tecti
on
Eq
uip
men
t
Han
d H
eld
Ga
s D
ete
cto
r
Kit
s
Lif
e L
ocato
r E
qu
ipm
en
t
Po
rtab
le P
um
ps
Flo
ati
ng
Pu
mp
s
Kerala 71 11,010,206 0 0 1173 85 335 0 0 85 85 335 0 0 280 0
Lakshadweep 5 24,024 0 0 36 6 12 0 0 6 6 12 0 0 10 5
Madhya Pradesh 163 32,080,764 0 0 3329 195 930 0 0 195 195 930 0 0 775 0
Maharashtra 666 57,601,624 0 0 6336 666 666 0 0 1646 1646 1646 0 0 1348 0
Manipur 26 1,255,807 0 2 182 31 64 0 0 31 31 60 0 0 28 2
Meghalaya 15 759,478 0 0 122 17 40 0 0 17 17 40 0 0 33 0
Mizoram 31 552,974 0 72 229 38 77 0 0 38 38 77 72 0 63 0
Nagaland 29 1,154,465 3 6 236 33 77 3 3 33 33 77 10 3 62 0
Orissa 126 17,033,620 0 0 1780 150 519 0 0 150 150 519 0 0 0 0
Puducherry 0 0 0 0 0 0 0 0 0 0 0 0 0 0 0 0
Punjab 93 18,926,291 0 0 2066 93 563 0 0 93 93 497 0 0 470 0
Rajasthan 641 39,479,627 0 0 2872 641 1313 0 0 641 641 933 0 0 934 0
Sikkim 15 342,729 0 0 108 18 36 0 0 18 18 36 0 0 30 0
Tamil Nadu 102 16,740,890 0 0 1698 123 488 0 0 123 123 488 0 0 405 0
Tripura 15 947,737 0 0 122 17 40 0 0 17 17 40 0 0 40 0
Uttar Pradesh 352 131,947,257 0 0 11650 421 3125 0 0 421 421 3125 0 0 2603 0
Uttarakhand 58 5,659,601 0 0 701 69 211 0 0 69 69 211 0 0 175 0
West Bengal 252 63,461,807 0 0 6414 301 1754 0 0 301 301 1754 0 0 1754 0
Total 4,272 657,421,764 14 484 65,859 4,793 17,930 47 93 5,770 5,770 18,381 340 47 15,437 8
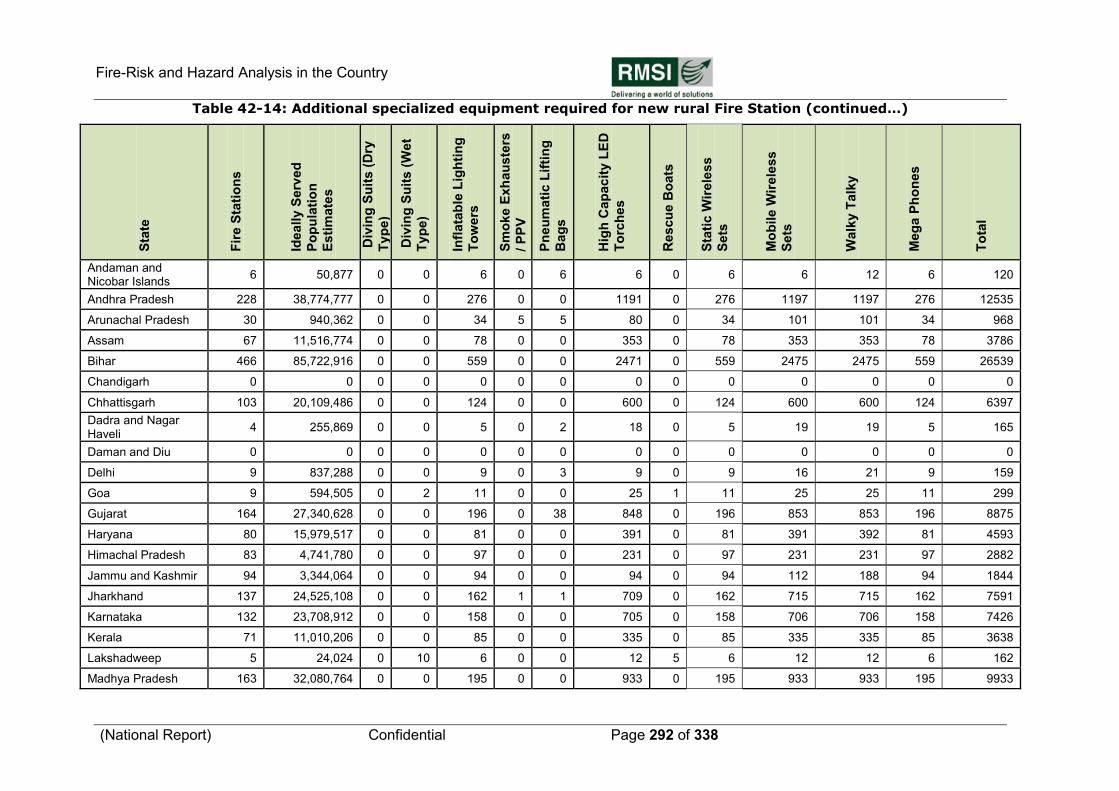
Fire-Risk and Hazard Analysis in the Country
(National Report) Confidential Page 292 of 338
Table 42-14: Additional specialized equipment required for new rural Fire Station (continued…)
Sta
te
Fir
e S
tati
on
s
Ideally
Serv
ed
Po
pu
lati
on
Esti
mate
s
Div
ing
Su
its (
Dry
Typ
e)
Div
ing
Su
its (
Wet
Typ
e)
Infl
ata
ble
Lig
hti
ng
To
wers
Sm
oke E
xh
au
ste
rs
/ P
PV
Pn
eu
mati
c L
ifti
ng
Bag
s
Hig
h C
ap
ac
ity L
ED
To
rch
es
Rescu
e B
oats
Sta
tic W
irele
ss
Sets
Mo
bile W
irele
ss
Sets
Walk
y T
alk
y
Meg
a P
ho
nes
To
tal
Andaman and Nicobar Islands
6 50,877 0 0 6 0 6 6 0 6 6 12 6 120
Andhra Pradesh 228 38,774,777 0 0 276 0 0 1191 0 276 1197 1197 276 12535
Arunachal Pradesh 30 940,362 0 0 34 5 5 80 0 34 101 101 34 968
Assam 67 11,516,774 0 0 78 0 0 353 0 78 353 353 78 3786
Bihar 466 85,722,916 0 0 559 0 0 2471 0 559 2475 2475 559 26539
Chandigarh 0 0 0 0 0 0 0 0 0 0 0 0 0 0
Chhattisgarh 103 20,109,486 0 0 124 0 0 600 0 124 600 600 124 6397
Dadra and Nagar Haveli
4 255,869 0 0 5 0 2 18 0 5 19 19 5 165
Daman and Diu 0 0 0 0 0 0 0 0 0 0 0 0 0 0
Delhi 9 837,288 0 0 9 0 3 9 0 9 16 21 9 159
Goa 9 594,505 0 2 11 0 0 25 1 11 25 25 11 299
Gujarat 164 27,340,628 0 0 196 0 38 848 0 196 853 853 196 8875
Haryana 80 15,979,517 0 0 81 0 0 391 0 81 391 392 81 4593
Himachal Pradesh 83 4,741,780 0 0 97 0 0 231 0 97 231 231 97 2882
Jammu and Kashmir 94 3,344,064 0 0 94 0 0 94 0 94 112 188 94 1844
Jharkhand 137 24,525,108 0 0 162 1 1 709 0 162 715 715 162 7591
Karnataka 132 23,708,912 0 0 158 0 0 705 0 158 706 706 158 7426
Kerala 71 11,010,206 0 0 85 0 0 335 0 85 335 335 85 3638
Lakshadweep 5 24,024 0 10 6 0 0 12 5 6 12 12 6 162
Madhya Pradesh 163 32,080,764 0 0 195 0 0 933 0 195 933 933 195 9933
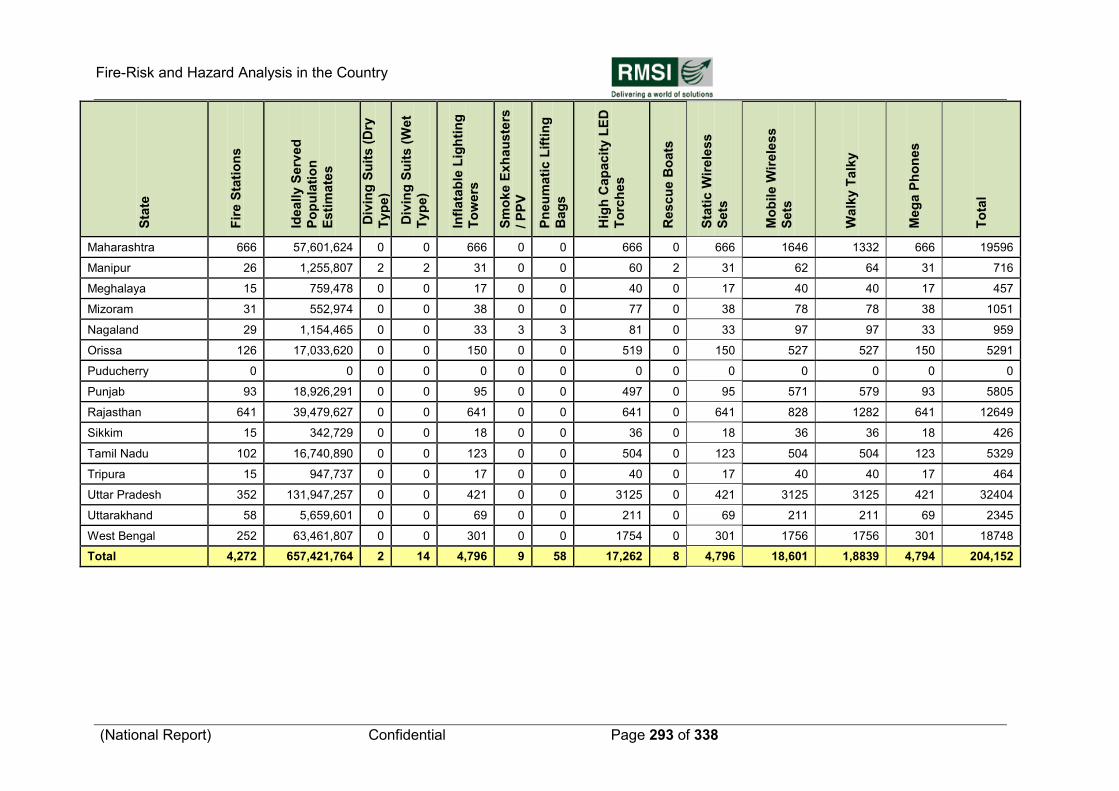
Fire-Risk and Hazard Analysis in the Country
(National Report) Confidential Page 293 of 338
Sta
te
Fir
e S
tati
on
s
Ideally
Serv
ed
Po
pu
lati
on
Esti
mate
s
Div
ing
Su
its (
Dry
Typ
e)
Div
ing
Su
its (
Wet
Typ
e)
Infl
ata
ble
Lig
hti
ng
To
wers
Sm
oke E
xh
au
ste
rs
/ P
PV
Pn
eu
mati
c L
ifti
ng
Bag
s
Hig
h C
ap
ac
ity L
ED
To
rch
es
Rescu
e B
oats
Sta
tic W
irele
ss
Sets
Mo
bile W
irele
ss
Sets
Walk
y T
alk
y
Meg
a P
ho
nes
To
tal
Maharashtra 666 57,601,624 0 0 666 0 0 666 0 666 1646 1332 666 19596
Manipur 26 1,255,807 2 2 31 0 0 60 2 31 62 64 31 716
Meghalaya 15 759,478 0 0 17 0 0 40 0 17 40 40 17 457
Mizoram 31 552,974 0 0 38 0 0 77 0 38 78 78 38 1051
Nagaland 29 1,154,465 0 0 33 3 3 81 0 33 97 97 33 959
Orissa 126 17,033,620 0 0 150 0 0 519 0 150 527 527 150 5291
Puducherry 0 0 0 0 0 0 0 0 0 0 0 0 0 0
Punjab 93 18,926,291 0 0 95 0 0 497 0 95 571 579 93 5805
Rajasthan 641 39,479,627 0 0 641 0 0 641 0 641 828 1282 641 12649
Sikkim 15 342,729 0 0 18 0 0 36 0 18 36 36 18 426
Tamil Nadu 102 16,740,890 0 0 123 0 0 504 0 123 504 504 123 5329
Tripura 15 947,737 0 0 17 0 0 40 0 17 40 40 17 464
Uttar Pradesh 352 131,947,257 0 0 421 0 0 3125 0 421 3125 3125 421 32404
Uttarakhand 58 5,659,601 0 0 69 0 0 211 0 69 211 211 69 2345
West Bengal 252 63,461,807 0 0 301 0 0 1754 0 301 1756 1756 301 18748
Total 4,272 657,421,764 2 14 4,796 9 58 17,262 8 4,796 18,601 1,8839 4,794 204,152
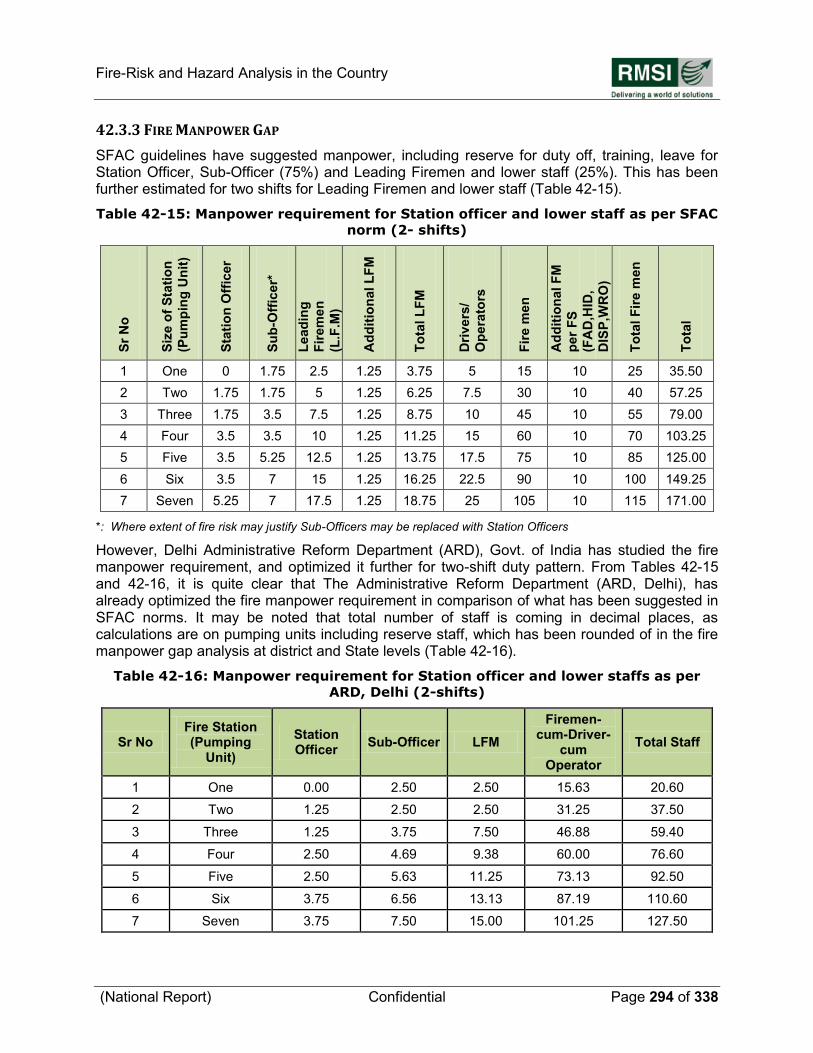
Fire-Risk and Hazard Analysis in the Country
(National Report) Confidential Page 294 of 338
42.3.3 FIRE MANPOWER GAP
SFAC guidelines have suggested manpower, including reserve for duty off, training, leave for Station Officer, Sub-Officer (75%) and Leading Firemen and lower staff (25%). This has been further estimated for two shifts for Leading Firemen and lower staff (Table 42-15).
Table 42-15: Manpower requirement for Station officer and lower staff as per SFAC
norm (2- shifts)
Sr
No
Siz
e o
f S
tati
on
(Pu
mp
ing
Un
it)
Sta
tio
n O
ffic
er
Su
b-O
ffic
er*
Lead
ing
Fir
em
en
(L.F
.M)
Ad
dit
ion
al L
FM
To
tal L
FM
Dri
ve
rs/
Op
era
tors
Fir
e m
en
Ad
dit
ion
al F
M
per
FS
(FA
D,H
ID,
DIS
P,W
RO
)
To
tal F
ire m
en
To
tal
1 One 0 1.75 2.5 1.25 3.75 5 15 10 25 35.50
2 Two 1.75 1.75 5 1.25 6.25 7.5 30 10 40 57.25
3 Three 1.75 3.5 7.5 1.25 8.75 10 45 10 55 79.00
4 Four 3.5 3.5 10 1.25 11.25 15 60 10 70 103.25
5 Five 3.5 5.25 12.5 1.25 13.75 17.5 75 10 85 125.00
6 Six 3.5 7 15 1.25 16.25 22.5 90 10 100 149.25
7 Seven 5.25 7 17.5 1.25 18.75 25 105 10 115 171.00
*: Where extent of fire risk may justify Sub-Officers may be replaced with Station Officers
However, Delhi Administrative Reform Department (ARD), Govt. of India has studied the fire manpower requirement, and optimized it further for two-shift duty pattern. From Tables 42-15 and 42-16, it is quite clear that The Administrative Reform Department (ARD, Delhi), has already optimized the fire manpower requirement in comparison of what has been suggested in SFAC norms. It may be noted that total number of staff is coming in decimal places, as calculations are on pumping units including reserve staff, which has been rounded of in the fire manpower gap analysis at district and State levels (Table 42-16).
Table 42-16: Manpower requirement for Station officer and lower staffs as per
ARD, Delhi (2-shifts)
Sr No Fire Station (Pumping
Unit)
Station Officer
Sub-Officer LFM
Firemen-cum-Driver-
cum Operator
Total Staff
1 One 0.00 2.50 2.50 15.63 20.60
2 Two 1.25 2.50 2.50 31.25 37.50
3 Three 1.25 3.75 7.50 46.88 59.40
4 Four 2.50 4.69 9.38 60.00 76.60
5 Five 2.50 5.63 11.25 73.13 92.50
6 Six 3.75 6.56 13.13 87.19 110.60
7 Seven 3.75 7.50 15.00 101.25 127.50
Fire-Risk and Hazard Analysis in the Country
(National Report) Confidential Page 295 of 338
Thus for optimization on resources, following manpower criteria have been suggested for manpower gap analysis. Accordingly, total firefighting manpower gap in both urban and rural Fire Stations in entire India has been estimated, which comes to 559,681 (Table 42.18 to 42.20) against the present strength of 51,163(Table 42.17)
During the analysis, it has been observed that there is a need to have merit-based promotion, so that deserving employees remain motivated and do not leave the organization at midst of their career. Moreover, there is no uniformity on the applicability of building by-laws on fire safety and the applicability of National Building Code (NBC) of fire safety.
In addition to fire fighting staffs, there is an urgent need of senior level fire officers for making a well coordinated State/UT level hierarchy for creation of a dedicated fire prevention wing for inspection, awareness generation and training, so that recurrence of the fire incidences, such as Advance Medical Research Institute (AMRI), Kolkata, in terms of their magnitude and frequency can be reduced. Accordingly, to support State/ UTs Fire Service Organization, additional officers at the levels of Director (Technical), Joint Director (Technical), Deputy Director (Technical), Chief Fire Officer (CFO), Dy Chief Fire Officer (Dy-CFO), Divisional Fire Officer (DFO), and Assistant Divisional Fire Officer (ADFO) etc have been suggested. To meet the ideal requirement of officials, following numbers of total officials have been proposed (including existing officials), which may be recruited in a phased manner approach:
It may be noted that for cleaning staff, we recommend hiring of Cleaners on contract basis. For computation in financial analysis, we have assumed a fixed salary of Rs 7,000/pm, and without any reserve over that.
Accordingly, existing fire manpower and gap analysis for all States/UTs of entire India have been carried out and are shown in respective tables.
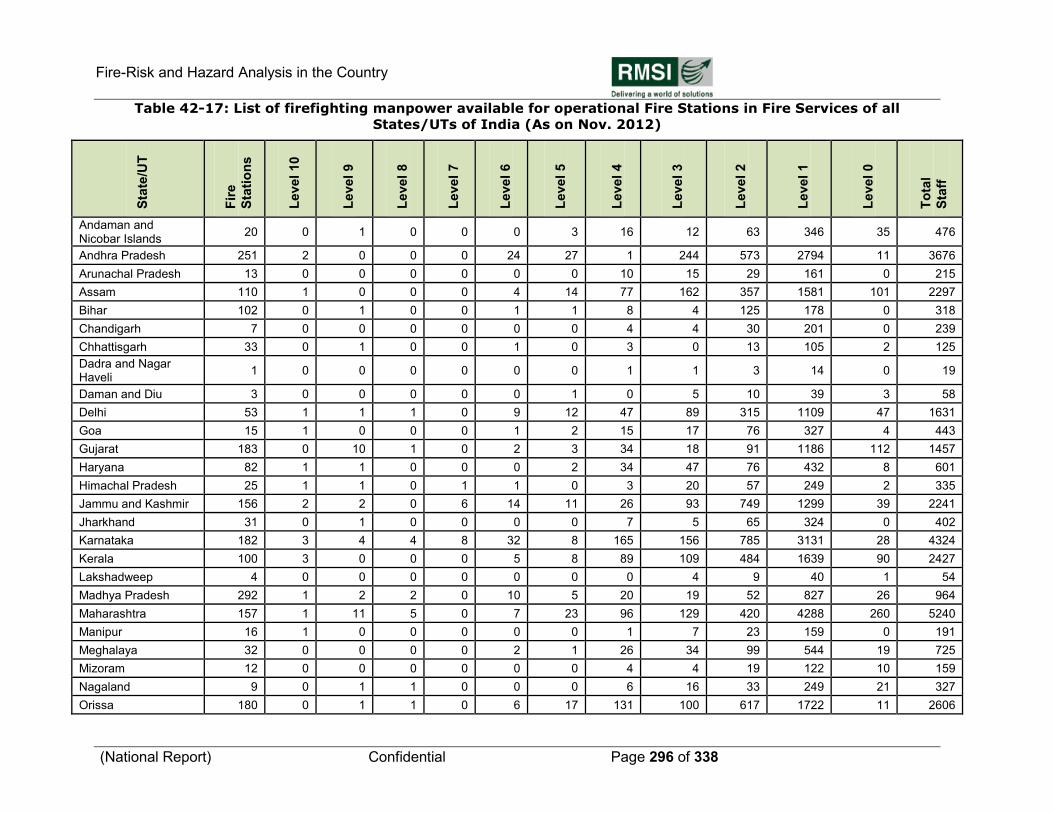
Fire-Risk and Hazard Analysis in the Country
(National Report) Confidential Page 296 of 338
Table 42-17: List of firefighting manpower available for operational Fire Stations in Fire Services of all
States/UTs of India (As on Nov. 2012)
Sta
te/U
T
Fir
e
Sta
tio
ns
Level
10
Level
9
Level
8
Level
7
Level
6
Level
5
Level
4
Level
3
Level
2
Level
1
Level
0
To
tal
Sta
ff
Andaman and Nicobar Islands
20 0 1 0 0 0 3 16 12 63 346 35 476
Andhra Pradesh 251 2 0 0 0 24 27 1 244 573 2794 11 3676
Arunachal Pradesh 13 0 0 0 0 0 0 10 15 29 161 0 215
Assam 110 1 0 0 0 4 14 77 162 357 1581 101 2297
Bihar 102 0 1 0 0 1 1 8 4 125 178 0 318
Chandigarh 7 0 0 0 0 0 0 4 4 30 201 0 239
Chhattisgarh 33 0 1 0 0 1 0 3 0 13 105 2 125
Dadra and Nagar Haveli
1 0 0 0 0 0 0 1 1 3 14 0 19
Daman and Diu 3 0 0 0 0 0 1 0 5 10 39 3 58
Delhi 53 1 1 1 0 9 12 47 89 315 1109 47 1631
Goa 15 1 0 0 0 1 2 15 17 76 327 4 443
Gujarat 183 0 10 1 0 2 3 34 18 91 1186 112 1457
Haryana 82 1 1 0 0 0 2 34 47 76 432 8 601
Himachal Pradesh 25 1 1 0 1 1 0 3 20 57 249 2 335
Jammu and Kashmir 156 2 2 0 6 14 11 26 93 749 1299 39 2241
Jharkhand 31 0 1 0 0 0 0 7 5 65 324 0 402
Karnataka 182 3 4 4 8 32 8 165 156 785 3131 28 4324
Kerala 100 3 0 0 0 5 8 89 109 484 1639 90 2427
Lakshadweep 4 0 0 0 0 0 0 0 4 9 40 1 54
Madhya Pradesh 292 1 2 2 0 10 5 20 19 52 827 26 964
Maharashtra 157 1 11 5 0 7 23 96 129 420 4288 260 5240
Manipur 16 1 0 0 0 0 0 1 7 23 159 0 191
Meghalaya 32 0 0 0 0 2 1 26 34 99 544 19 725
Mizoram 12 0 0 0 0 0 0 4 4 19 122 10 159
Nagaland 9 0 1 1 0 0 0 6 16 33 249 21 327
Orissa 180 0 1 1 0 6 17 131 100 617 1722 11 2606
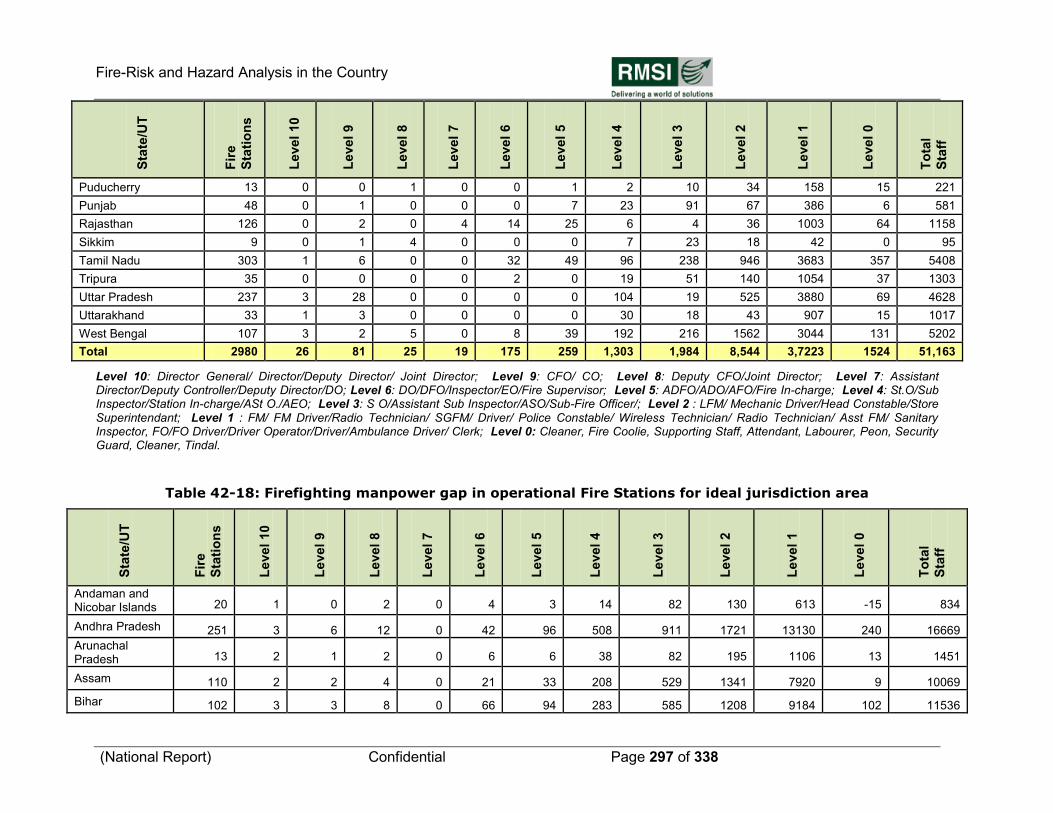
Fire-Risk and Hazard Analysis in the Country
(National Report) Confidential Page 297 of 338
Sta
te/U
T
Fir
e
Sta
tio
ns
Level
10
Level
9
Level
8
Level
7
Level
6
Level
5
Level
4
Level
3
Level
2
Level
1
Level
0
To
tal
Sta
ff
Puducherry 13 0 0 1 0 0 1 2 10 34 158 15 221
Punjab 48 0 1 0 0 0 7 23 91 67 386 6 581
Rajasthan 126 0 2 0 4 14 25 6 4 36 1003 64 1158
Sikkim 9 0 1 4 0 0 0 7 23 18 42 0 95
Tamil Nadu 303 1 6 0 0 32 49 96 238 946 3683 357 5408
Tripura 35 0 0 0 0 2 0 19 51 140 1054 37 1303
Uttar Pradesh 237 3 28 0 0 0 0 104 19 525 3880 69 4628
Uttarakhand 33 1 3 0 0 0 0 30 18 43 907 15 1017
West Bengal 107 3 2 5 0 8 39 192 216 1562 3044 131 5202
Total 2980 26 81 25 19 175 259 1,303 1,984 8,544 3,7223 1524 51,163
Level 10: Director General/ Director/Deputy Director/ Joint Director; Level 9: CFO/ CO; Level 8: Deputy CFO/Joint Director; Level 7: Assistant Director/Deputy Controller/Deputy Director/DO; Level 6: DO/DFO/Inspector/EO/Fire Supervisor; Level 5: ADFO/ADO/AFO/Fire In-charge; Level 4: St.O/Sub Inspector/Station In-charge/ASt O./AEO; Level 3: S O/Assistant Sub Inspector/ASO/Sub-Fire Officer/; Level 2 : LFM/ Mechanic Driver/Head Constable/Store Superintendant; Level 1 : FM/ FM Driver/Radio Technician/ SGFM/ Driver/ Police Constable/ Wireless Technician/ Radio Technician/ Asst FM/ Sanitary Inspector, FO/FO Driver/Driver Operator/Driver/Ambulance Driver/ Clerk; Level 0: Cleaner, Fire Coolie, Supporting Staff, Attendant, Labourer, Peon, Security Guard, Cleaner, Tindal.
Table 42-18: Firefighting manpower gap in operational Fire Stations for ideal jurisdiction area
Sta
te/U
T
Fir
e
Sta
tio
ns
Level
10
Level
9
Level
8
Level
7
Level
6
Leve
l 5
Level
4
Level
3
Level
2
Level
1
Level
0
To
tal
Sta
ff
Andaman and Nicobar Islands 20 1 0 2 0 4 3 14 82 130 613 -15 834
Andhra Pradesh 251 3 6 12 0 42 96 508 911 1721 13130 240 16669
Arunachal Pradesh 13 2 1 2 0 6 6 38 82 195 1106 13 1451
Assam 110 2 2 4 0 21 33 208 529 1341 7920 9 10069
Bihar 102 3 3 8 0 66 94 283 585 1208 9184 102 11536
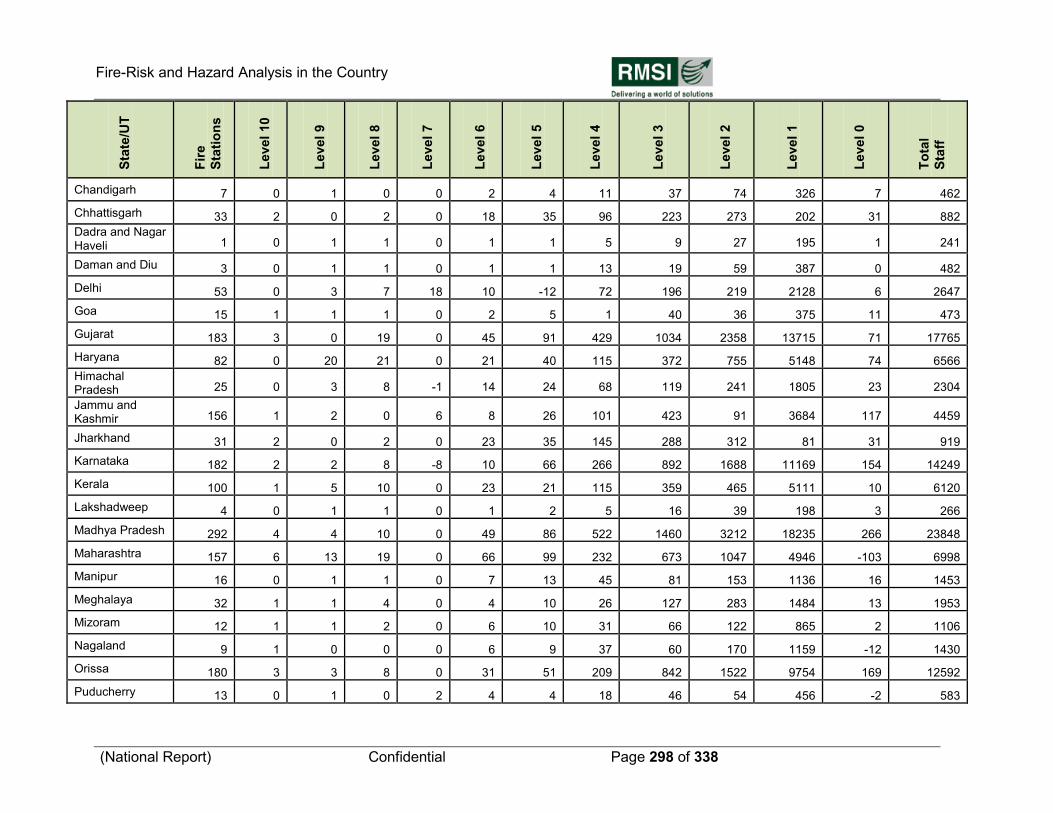
Fire-Risk and Hazard Analysis in the Country
(National Report) Confidential Page 298 of 338
Sta
te/U
T
Fir
e
Sta
tio
ns
Level
10
Level
9
Level
8
Level
7
Level
6
Leve
l 5
Level
4
Level
3
Level
2
Level
1
Level
0
To
tal
Sta
ff
Chandigarh 7 0 1 0 0 2 4 11 37 74 326 7 462
Chhattisgarh 33 2 0 2 0 18 35 96 223 273 202 31 882
Dadra and Nagar Haveli 1 0 1 1 0 1 1 5 9 27 195 1 241
Daman and Diu 3 0 1 1 0 1 1 13 19 59 387 0 482
Delhi 53 0 3 7 18 10 -12 72 196 219 2128 6 2647
Goa 15 1 1 1 0 2 5 1 40 36 375 11 473
Gujarat 183 3 0 19 0 45 91 429 1034 2358 13715 71 17765
Haryana 82 0 20 21 0 21 40 115 372 755 5148 74 6566
Himachal Pradesh 25 0 3 8 -1 14 24 68 119 241 1805 23 2304
Jammu and Kashmir 156 1 2 0 6 8 26 101 423 91 3684 117 4459
Jharkhand 31 2 0 2 0 23 35 145 288 312 81 31 919
Karnataka 182 2 2 8 -8 10 66 266 892 1688 11169 154 14249
Kerala 100 1 5 10 0 23 21 115 359 465 5111 10 6120
Lakshadweep 4 0 1 1 0 1 2 5 16 39 198 3 266
Madhya Pradesh 292 4 4 10 0 49 86 522 1460 3212 18235 266 23848
Maharashtra 157 6 13 19 0 66 99 232 673 1047 4946 -103 6998
Manipur 16 0 1 1 0 7 13 45 81 153 1136 16 1453
Meghalaya 32 1 1 4 0 4 10 26 127 283 1484 13 1953
Mizoram 12 1 1 2 0 6 10 31 66 122 865 2 1106
Nagaland 9 1 0 0 0 6 9 37 60 170 1159 -12 1430
Orissa 180 3 3 8 0 31 51 209 842 1522 9754 169 12592
Puducherry 13 0 1 0 2 4 4 18 46 54 456 -2 583
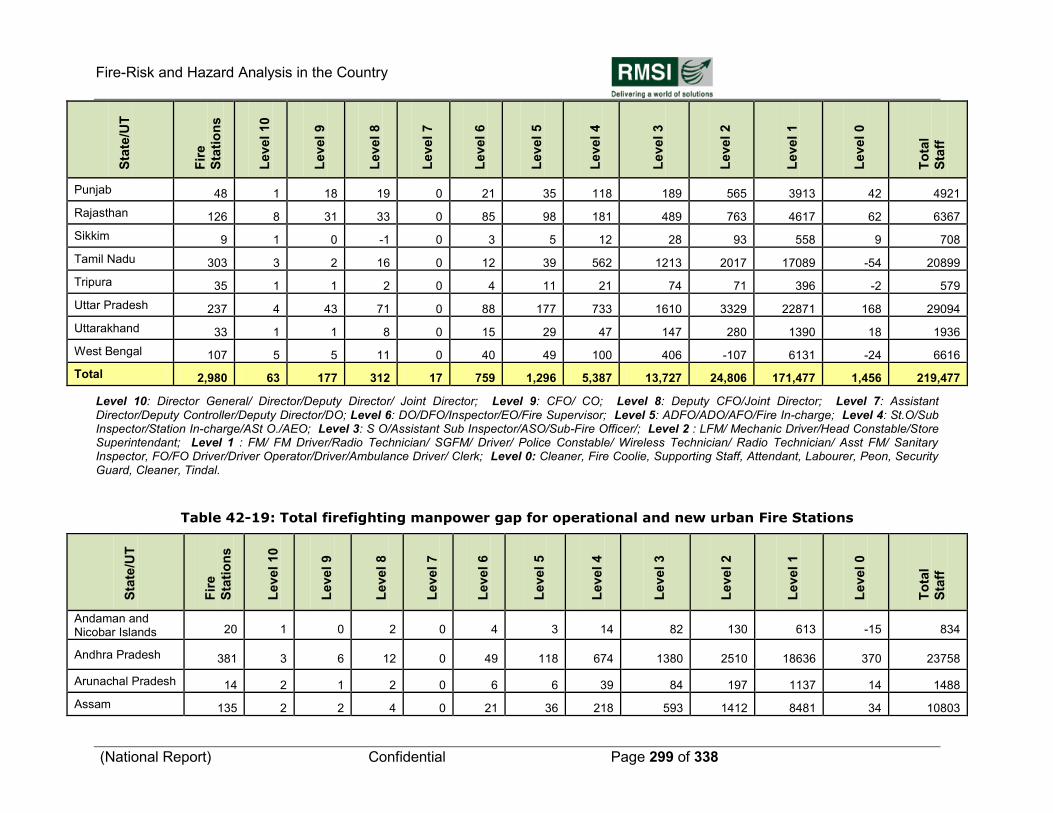
Fire-Risk and Hazard Analysis in the Country
(National Report) Confidential Page 299 of 338
Sta
te/U
T
Fir
e
Sta
tio
ns
Level
10
Level
9
Level
8
Level
7
Level
6
Leve
l 5
Level
4
Level
3
Level
2
Level
1
Level
0
To
tal
Sta
ff
Punjab 48 1 18 19 0 21 35 118 189 565 3913 42 4921
Rajasthan 126 8 31 33 0 85 98 181 489 763 4617 62 6367
Sikkim 9 1 0 -1 0 3 5 12 28 93 558 9 708
Tamil Nadu 303 3 2 16 0 12 39 562 1213 2017 17089 -54 20899
Tripura 35 1 1 2 0 4 11 21 74 71 396 -2 579
Uttar Pradesh 237 4 43 71 0 88 177 733 1610 3329 22871 168 29094
Uttarakhand 33 1 1 8 0 15 29 47 147 280 1390 18 1936
West Bengal 107 5 5 11 0 40 49 100 406 -107 6131 -24 6616
Total 2,980 63 177 312 17 759 1,296 5,387 13,727 24,806 171,477 1,456 219,477
Level 10: Director General/ Director/Deputy Director/ Joint Director; Level 9: CFO/ CO; Level 8: Deputy CFO/Joint Director; Level 7: Assistant Director/Deputy Controller/Deputy Director/DO; Level 6: DO/DFO/Inspector/EO/Fire Supervisor; Level 5: ADFO/ADO/AFO/Fire In-charge; Level 4: St.O/Sub Inspector/Station In-charge/ASt O./AEO; Level 3: S O/Assistant Sub Inspector/ASO/Sub-Fire Officer/; Level 2 : LFM/ Mechanic Driver/Head Constable/Store Superintendant; Level 1 : FM/ FM Driver/Radio Technician/ SGFM/ Driver/ Police Constable/ Wireless Technician/ Radio Technician/ Asst FM/ Sanitary Inspector, FO/FO Driver/Driver Operator/Driver/Ambulance Driver/ Clerk; Level 0: Cleaner, Fire Coolie, Supporting Staff, Attendant, Labourer, Peon, Security Guard, Cleaner, Tindal.
Table 42-19: Total firefighting manpower gap for operational and new urban Fire Stations
Sta
te/U
T
Fir
e
Sta
tio
ns
Level
10
Level
9
Level
8
Level
7
Level
6
Level
5
Level
4
Level
3
Level
2
Level
1
Level
0
To
tal
Sta
ff
Andaman and Nicobar Islands 20 1 0 2 0 4 3 14 82 130 613 -15 834
Andhra Pradesh 381 3 6 12 0 49 118 674 1380 2510 18636 370 23758
Arunachal Pradesh 14 2 1 2 0 6 6 39 84 197 1137 14 1488
Assam 135 2 2 4 0 21 36 218 593 1412 8481 34 10803
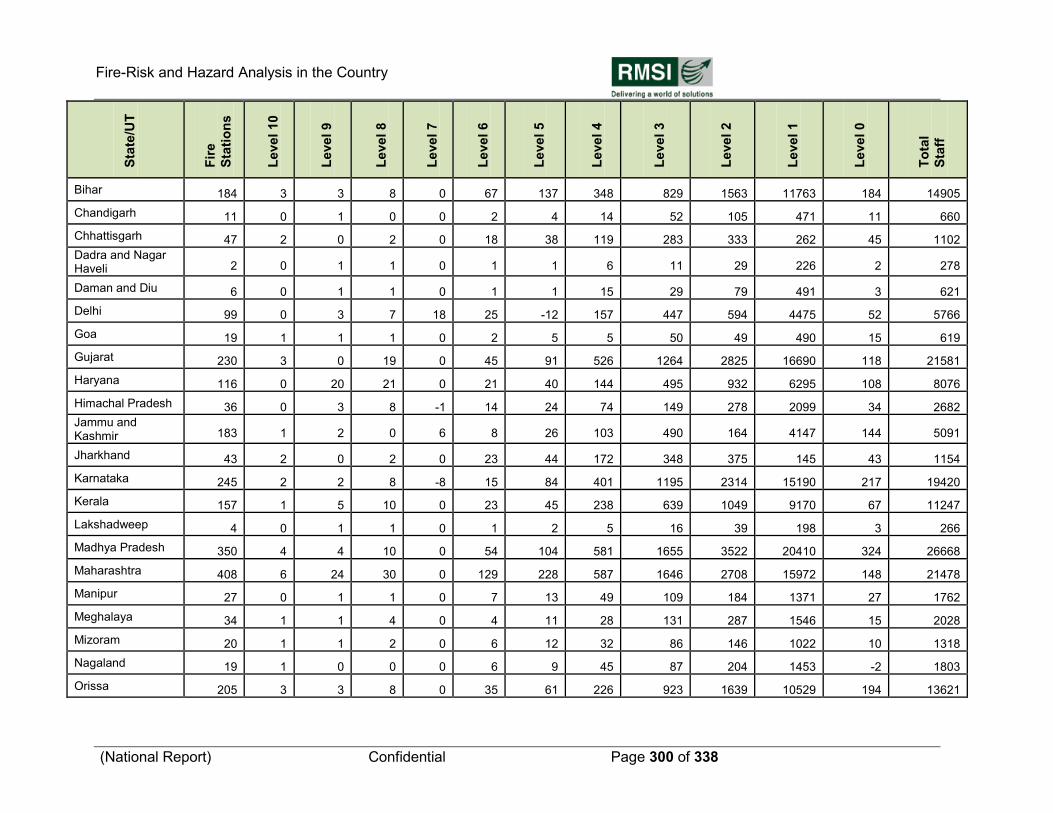
Fire-Risk and Hazard Analysis in the Country
(National Report) Confidential Page 300 of 338
Sta
te/U
T
Fir
e
Sta
tio
ns
Level
10
Level
9
Level
8
Level
7
Level
6
Level
5
Level
4
Level
3
Level
2
Level
1
Level
0
To
tal
Sta
ff
Bihar 184 3 3 8 0 67 137 348 829 1563 11763 184 14905
Chandigarh 11 0 1 0 0 2 4 14 52 105 471 11 660
Chhattisgarh 47 2 0 2 0 18 38 119 283 333 262 45 1102
Dadra and Nagar Haveli 2 0 1 1 0 1 1 6 11 29 226 2 278
Daman and Diu 6 0 1 1 0 1 1 15 29 79 491 3 621
Delhi 99 0 3 7 18 25 -12 157 447 594 4475 52 5766
Goa 19 1 1 1 0 2 5 5 50 49 490 15 619
Gujarat 230 3 0 19 0 45 91 526 1264 2825 16690 118 21581
Haryana 116 0 20 21 0 21 40 144 495 932 6295 108 8076
Himachal Pradesh 36 0 3 8 -1 14 24 74 149 278 2099 34 2682
Jammu and Kashmir 183 1 2 0 6 8 26 103 490 164 4147 144 5091
Jharkhand 43 2 0 2 0 23 44 172 348 375 145 43 1154
Karnataka 245 2 2 8 -8 15 84 401 1195 2314 15190 217 19420
Kerala 157 1 5 10 0 23 45 238 639 1049 9170 67 11247
Lakshadweep 4 0 1 1 0 1 2 5 16 39 198 3 266
Madhya Pradesh 350 4 4 10 0 54 104 581 1655 3522 20410 324 26668
Maharashtra 408 6 24 30 0 129 228 587 1646 2708 15972 148 21478
Manipur 27 0 1 1 0 7 13 49 109 184 1371 27 1762
Meghalaya 34 1 1 4 0 4 11 28 131 287 1546 15 2028
Mizoram 20 1 1 2 0 6 12 32 86 146 1022 10 1318
Nagaland 19 1 0 0 0 6 9 45 87 204 1453 -2 1803
Orissa 205 3 3 8 0 35 61 226 923 1639 10529 194 13621
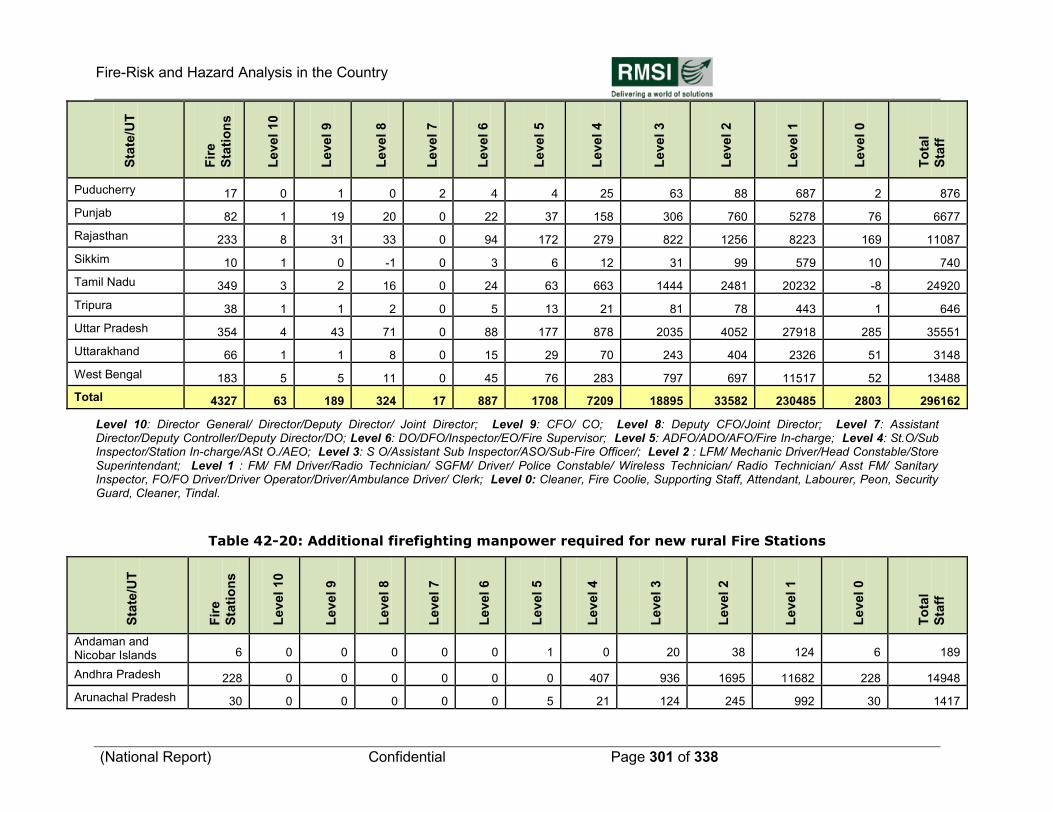
Fire-Risk and Hazard Analysis in the Country
(National Report) Confidential Page 301 of 338
Sta
te/U
T
Fir
e
Sta
tio
ns
Level
10
Level
9
Level
8
Level
7
Level
6
Level
5
Level
4
Level
3
Level
2
Level
1
Level
0
To
tal
Sta
ff
Puducherry 17 0 1 0 2 4 4 25 63 88 687 2 876
Punjab 82 1 19 20 0 22 37 158 306 760 5278 76 6677
Rajasthan 233 8 31 33 0 94 172 279 822 1256 8223 169 11087
Sikkim 10 1 0 -1 0 3 6 12 31 99 579 10 740
Tamil Nadu 349 3 2 16 0 24 63 663 1444 2481 20232 -8 24920
Tripura 38 1 1 2 0 5 13 21 81 78 443 1 646
Uttar Pradesh 354 4 43 71 0 88 177 878 2035 4052 27918 285 35551
Uttarakhand 66 1 1 8 0 15 29 70 243 404 2326 51 3148
West Bengal 183 5 5 11 0 45 76 283 797 697 11517 52 13488
Total 4327 63 189 324 17 887 1708 7209 18895 33582 230485 2803 296162
Level 10: Director General/ Director/Deputy Director/ Joint Director; Level 9: CFO/ CO; Level 8: Deputy CFO/Joint Director; Level 7: Assistant Director/Deputy Controller/Deputy Director/DO; Level 6: DO/DFO/Inspector/EO/Fire Supervisor; Level 5: ADFO/ADO/AFO/Fire In-charge; Level 4: St.O/Sub Inspector/Station In-charge/ASt O./AEO; Level 3: S O/Assistant Sub Inspector/ASO/Sub-Fire Officer/; Level 2 : LFM/ Mechanic Driver/Head Constable/Store Superintendant; Level 1 : FM/ FM Driver/Radio Technician/ SGFM/ Driver/ Police Constable/ Wireless Technician/ Radio Technician/ Asst FM/ Sanitary Inspector, FO/FO Driver/Driver Operator/Driver/Ambulance Driver/ Clerk; Level 0: Cleaner, Fire Coolie, Supporting Staff, Attendant, Labourer, Peon, Security Guard, Cleaner, Tindal.
Table 42-20: Additional firefighting manpower required for new rural Fire Stations
Sta
te/U
T
Fir
e
Sta
tio
ns
Level
10
Level
9
Level
8
Level
7
Level
6
Level
5
Level
4
Level
3
Level
2
Level
1
Level
0
To
tal
Sta
ff
Andaman and Nicobar Islands 6 0 0 0 0 0 1 0 20 38 124 6 189
Andhra Pradesh 228 0 0 0 0 0 0 407 936 1695 11682 228 14948
Arunachal Pradesh 30 0 0 0 0 0 5 21 124 245 992 30 1417
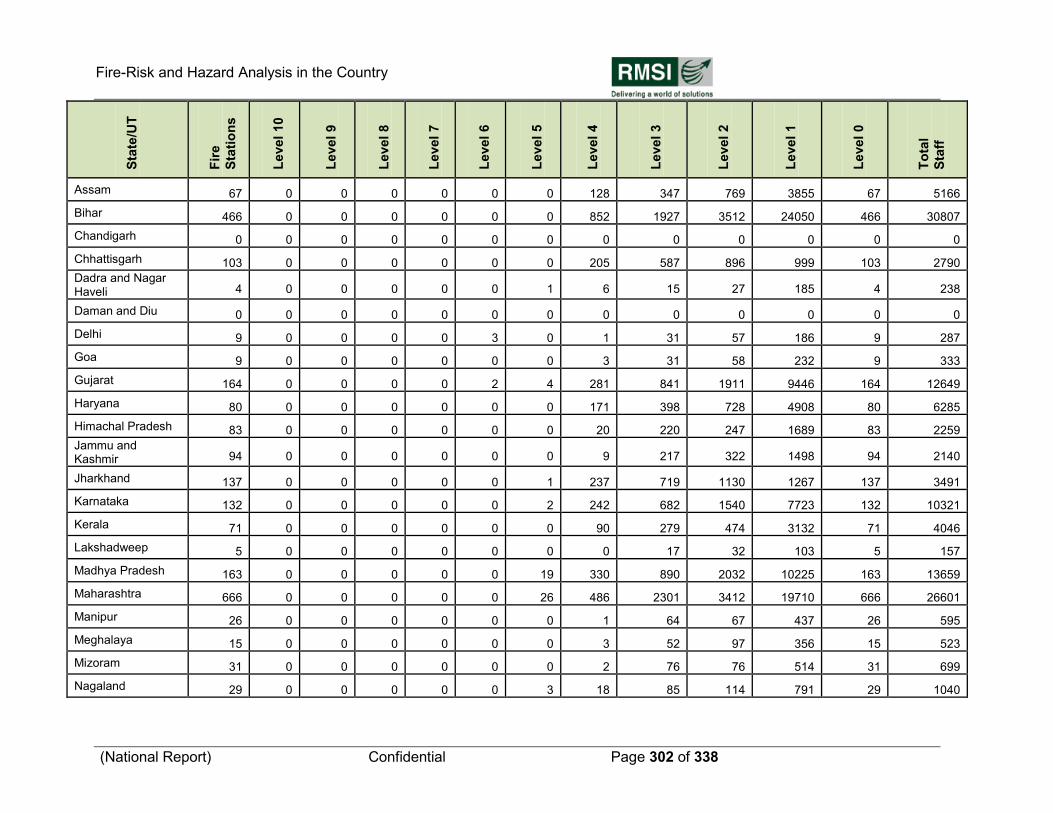
Fire-Risk and Hazard Analysis in the Country
(National Report) Confidential Page 302 of 338
Sta
te/U
T
Fir
e
Sta
tio
ns
Level
10
Level
9
Level
8
Level
7
Level
6
Level
5
Level
4
Level
3
Level
2
Level
1
Level
0
To
tal
Sta
ff
Assam 67 0 0 0 0 0 0 128 347 769 3855 67 5166
Bihar 466 0 0 0 0 0 0 852 1927 3512 24050 466 30807
Chandigarh 0 0 0 0 0 0 0 0 0 0 0 0 0
Chhattisgarh 103 0 0 0 0 0 0 205 587 896 999 103 2790
Dadra and Nagar Haveli 4 0 0 0 0 0 1 6 15 27 185 4 238
Daman and Diu 0 0 0 0 0 0 0 0 0 0 0 0 0
Delhi 9 0 0 0 0 3 0 1 31 57 186 9 287
Goa 9 0 0 0 0 0 0 3 31 58 232 9 333
Gujarat 164 0 0 0 0 2 4 281 841 1911 9446 164 12649
Haryana 80 0 0 0 0 0 0 171 398 728 4908 80 6285
Himachal Pradesh 83 0 0 0 0 0 0 20 220 247 1689 83 2259
Jammu and Kashmir 94 0 0 0 0 0 0 9 217 322 1498 94 2140
Jharkhand 137 0 0 0 0 0 1 237 719 1130 1267 137 3491
Karnataka 132 0 0 0 0 0 2 242 682 1540 7723 132 10321
Kerala 71 0 0 0 0 0 0 90 279 474 3132 71 4046
Lakshadweep 5 0 0 0 0 0 0 0 17 32 103 5 157
Madhya Pradesh 163 0 0 0 0 0 19 330 890 2032 10225 163 13659
Maharashtra 666 0 0 0 0 0 26 486 2301 3412 19710 666 26601
Manipur 26 0 0 0 0 0 0 1 64 67 437 26 595
Meghalaya 15 0 0 0 0 0 0 3 52 97 356 15 523
Mizoram 31 0 0 0 0 0 0 2 76 76 514 31 699
Nagaland 29 0 0 0 0 0 3 18 85 114 791 29 1040
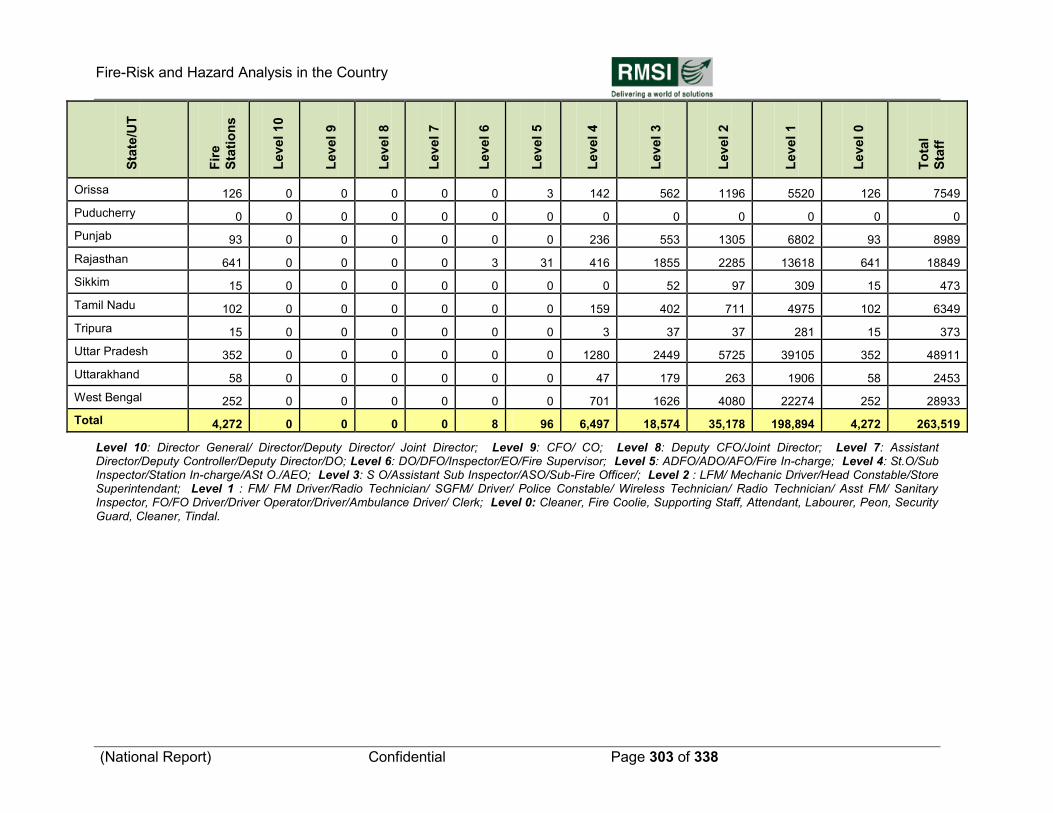
Fire-Risk and Hazard Analysis in the Country
(National Report) Confidential Page 303 of 338
Sta
te/U
T
Fir
e
Sta
tio
ns
Level
10
Level
9
Level
8
Level
7
Level
6
Level
5
Level
4
Level
3
Level
2
Level
1
Level
0
To
tal
Sta
ff
Orissa 126 0 0 0 0 0 3 142 562 1196 5520 126 7549
Puducherry 0 0 0 0 0 0 0 0 0 0 0 0 0
Punjab 93 0 0 0 0 0 0 236 553 1305 6802 93 8989
Rajasthan 641 0 0 0 0 3 31 416 1855 2285 13618 641 18849
Sikkim 15 0 0 0 0 0 0 0 52 97 309 15 473
Tamil Nadu 102 0 0 0 0 0 0 159 402 711 4975 102 6349
Tripura 15 0 0 0 0 0 0 3 37 37 281 15 373
Uttar Pradesh 352 0 0 0 0 0 0 1280 2449 5725 39105 352 48911
Uttarakhand 58 0 0 0 0 0 0 47 179 263 1906 58 2453
West Bengal 252 0 0 0 0 0 0 701 1626 4080 22274 252 28933
Total 4,272 0 0 0 0 8 96 6,497 18,574 35,178 198,894 4,272 263,519
Level 10: Director General/ Director/Deputy Director/ Joint Director; Level 9: CFO/ CO; Level 8: Deputy CFO/Joint Director; Level 7: Assistant Director/Deputy Controller/Deputy Director/DO; Level 6: DO/DFO/Inspector/EO/Fire Supervisor; Level 5: ADFO/ADO/AFO/Fire In-charge; Level 4: St.O/Sub Inspector/Station In-charge/ASt O./AEO; Level 3: S O/Assistant Sub Inspector/ASO/Sub-Fire Officer/; Level 2 : LFM/ Mechanic Driver/Head Constable/Store Superintendant; Level 1 : FM/ FM Driver/Radio Technician/ SGFM/ Driver/ Police Constable/ Wireless Technician/ Radio Technician/ Asst FM/ Sanitary Inspector, FO/FO Driver/Driver Operator/Driver/Ambulance Driver/ Clerk; Level 0: Cleaner, Fire Coolie, Supporting Staff, Attendant, Labourer, Peon, Security Guard, Cleaner, Tindal.
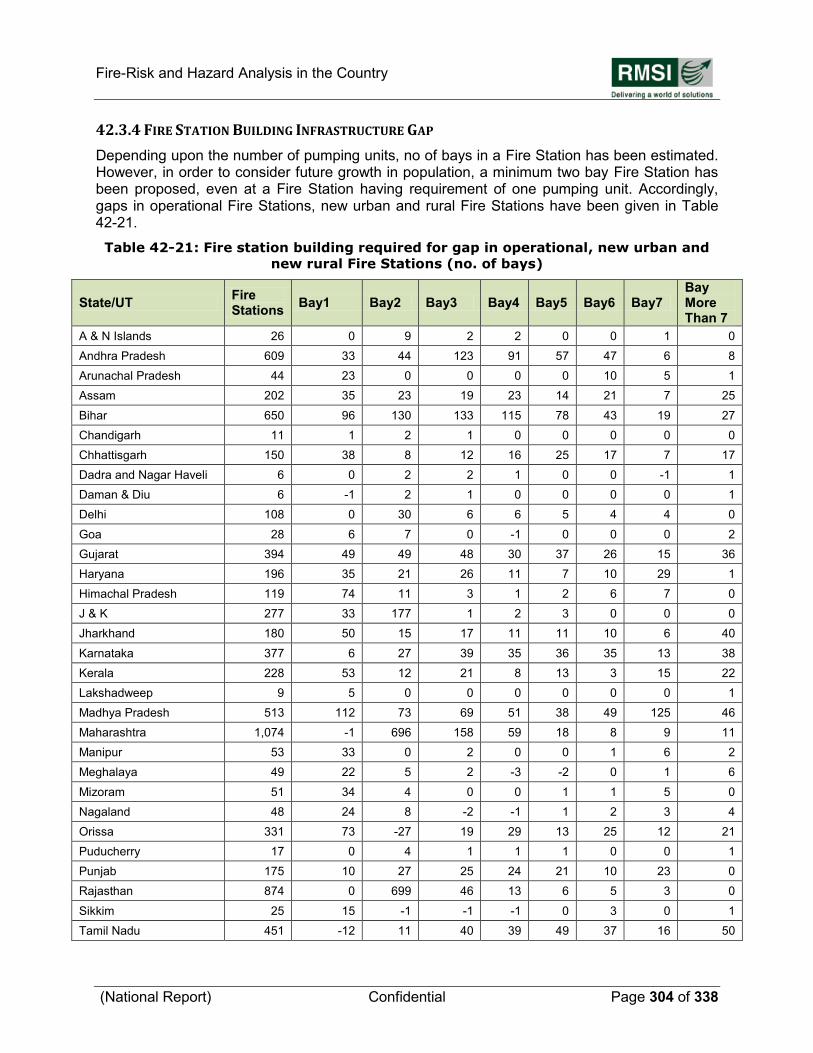
Fire-Risk and Hazard Analysis in the Country
(National Report) Confidential Page 304 of 338
42.3.4 FIRE STATION BUILDING INFRASTRUCTURE GAP
Depending upon the number of pumping units, no of bays in a Fire Station has been estimated. However, in order to consider future growth in population, a minimum two bay Fire Station has been proposed, even at a Fire Station having requirement of one pumping unit. Accordingly, gaps in operational Fire Stations, new urban and rural Fire Stations have been given in Table 42-21.
Table 42-21: Fire station building required for gap in operational, new urban and
new rural Fire Stations (no. of bays)
State/UT Fire Stations
Bay1 Bay2 Bay3 Bay4 Bay5 Bay6 Bay7 Bay More Than 7
A & N Islands 26 0 9 2 2 0 0 1 0
Andhra Pradesh 609 33 44 123 91 57 47 6 8
Arunachal Pradesh 44 23 0 0 0 0 10 5 1
Assam 202 35 23 19 23 14 21 7 25
Bihar 650 96 130 133 115 78 43 19 27
Chandigarh 11 1 2 1 0 0 0 0 0
Chhattisgarh 150 38 8 12 16 25 17 7 17
Dadra and Nagar Haveli 6 0 2 2 1 0 0 -1 1
Daman & Diu 6 -1 2 1 0 0 0 0 1
Delhi 108 0 30 6 6 5 4 4 0
Goa 28 6 7 0 -1 0 0 0 2
Gujarat 394 49 49 48 30 37 26 15 36
Haryana 196 35 21 26 11 7 10 29 1
Himachal Pradesh 119 74 11 3 1 2 6 7 0
J & K 277 33 177 1 2 3 0 0 0
Jharkhand 180 50 15 17 11 11 10 6 40
Karnataka 377 6 27 39 35 36 35 13 38
Kerala 228 53 12 21 8 13 3 15 22
Lakshadweep 9 5 0 0 0 0 0 0 1
Madhya Pradesh 513 112 73 69 51 38 49 125 46
Maharashtra 1,074 -1 696 158 59 18 8 9 11
Manipur 53 33 0 2 0 0 1 6 2
Meghalaya 49 22 5 2 -3 -2 0 1 6
Mizoram 51 34 4 0 0 1 1 5 0
Nagaland 48 24 8 -2 -1 1 2 3 4
Orissa 331 73 -27 19 29 13 25 12 21
Puducherry 17 0 4 1 1 1 0 0 1
Punjab 175 10 27 25 24 21 10 23 0
Rajasthan 874 0 699 46 13 6 5 3 0
Sikkim 25 15 -1 -1 -1 0 3 0 1
Tamil Nadu 451 -12 11 40 39 49 37 16 50
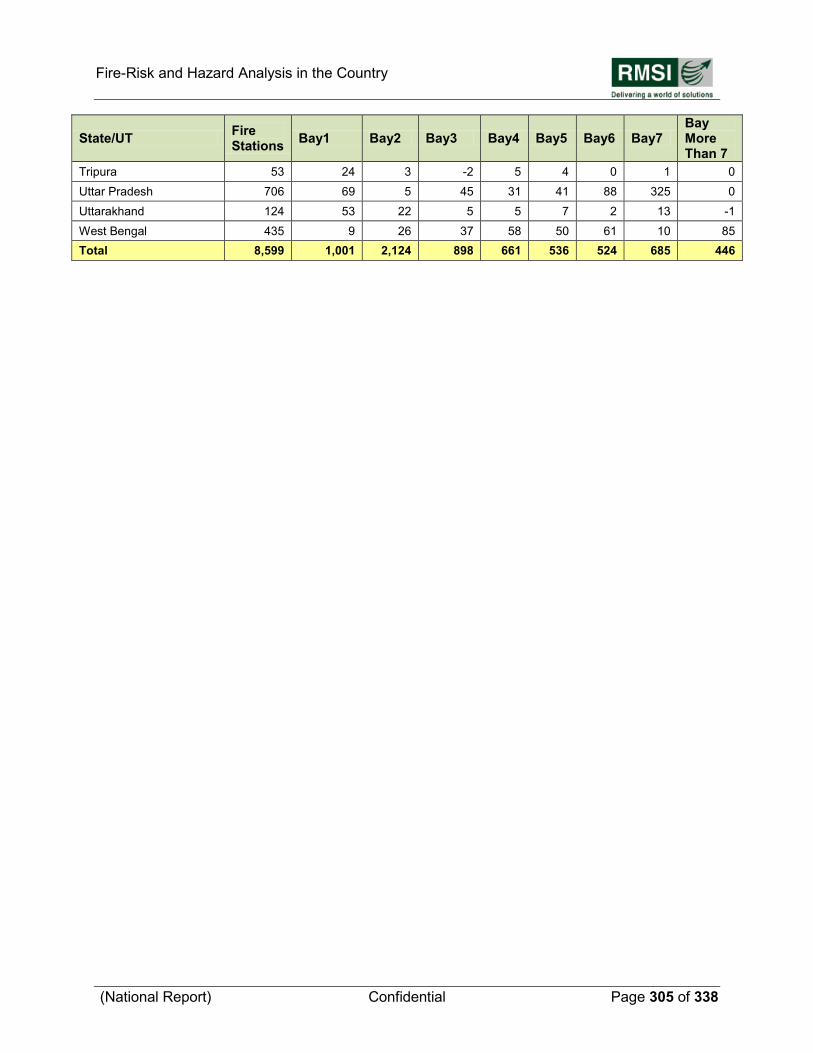
Fire-Risk and Hazard Analysis in the Country
(National Report) Confidential Page 305 of 338
State/UT Fire Stations
Bay1 Bay2 Bay3 Bay4 Bay5 Bay6 Bay7 Bay More Than 7
Tripura 53 24 3 -2 5 4 0 1 0
Uttar Pradesh 706 69 5 45 31 41 88 325 0
Uttarakhand 124 53 22 5 5 7 2 13 -1
West Bengal 435 9 26 37 58 50 61 10 85
Total 8,599 1,001 2,124 898 661 536 524 685 446
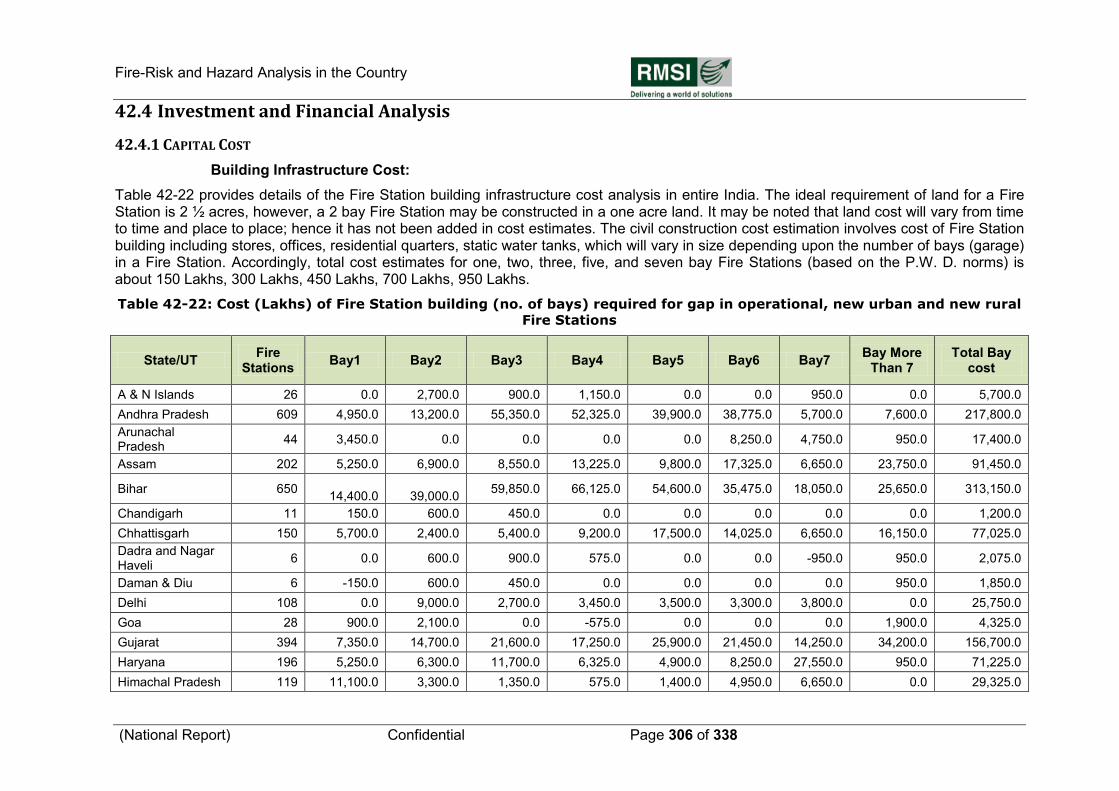
Fire-Risk and Hazard Analysis in the Country
(National Report) Confidential Page 306 of 338
42.4 Investment and Financial Analysis
42.4.1 CAPITAL COST
Building Infrastructure Cost:
Table 42-22 provides details of the Fire Station building infrastructure cost analysis in entire India. The ideal requirement of land for a Fire Station is 2 ½ acres, however, a 2 bay Fire Station may be constructed in a one acre land. It may be noted that land cost will vary from time to time and place to place; hence it has not been added in cost estimates. The civil construction cost estimation involves cost of Fire Station building including stores, offices, residential quarters, static water tanks, which will vary in size depending upon the number of bays (garage) in a Fire Station. Accordingly, total cost estimates for one, two, three, five, and seven bay Fire Stations (based on the P.W. D. norms) is about 150 Lakhs, 300 Lakhs, 450 Lakhs, 700 Lakhs, 950 Lakhs.
Table 42-22: Cost (Lakhs) of Fire Station building (no. of bays) required for gap in operational, new urban and new rural
Fire Stations
State/UT Fire
Stations Bay1 Bay2 Bay3 Bay4 Bay5 Bay6 Bay7
Bay More Than 7
Total Bay cost
A & N Islands 26 0.0 2,700.0 900.0 1,150.0 0.0 0.0 950.0 0.0 5,700.0
Andhra Pradesh 609 4,950.0 13,200.0 55,350.0 52,325.0 39,900.0 38,775.0 5,700.0 7,600.0 217,800.0
Arunachal Pradesh
44 3,450.0 0.0 0.0 0.0 0.0 8,250.0 4,750.0 950.0 17,400.0
Assam 202 5,250.0 6,900.0 8,550.0 13,225.0 9,800.0 17,325.0 6,650.0 23,750.0 91,450.0
Bihar 650
14,400.0
39,000.0 59,850.0 66,125.0 54,600.0 35,475.0 18,050.0 25,650.0 313,150.0
Chandigarh 11 150.0 600.0 450.0 0.0 0.0 0.0 0.0 0.0 1,200.0
Chhattisgarh 150 5,700.0 2,400.0 5,400.0 9,200.0 17,500.0 14,025.0 6,650.0 16,150.0 77,025.0
Dadra and Nagar Haveli
6 0.0 600.0 900.0 575.0 0.0 0.0 -950.0 950.0 2,075.0
Daman & Diu 6 -150.0 600.0 450.0 0.0 0.0 0.0 0.0 950.0 1,850.0
Delhi 108 0.0 9,000.0 2,700.0 3,450.0 3,500.0 3,300.0 3,800.0 0.0 25,750.0
Goa 28 900.0 2,100.0 0.0 -575.0 0.0 0.0 0.0 1,900.0 4,325.0
Gujarat 394 7,350.0 14,700.0 21,600.0 17,250.0 25,900.0 21,450.0 14,250.0 34,200.0 156,700.0
Haryana 196 5,250.0 6,300.0 11,700.0 6,325.0 4,900.0 8,250.0 27,550.0 950.0 71,225.0
Himachal Pradesh 119 11,100.0 3,300.0 1,350.0 575.0 1,400.0 4,950.0 6,650.0 0.0 29,325.0

Fire-Risk and Hazard Analysis in the Country
(National Report) Confidential Page 307 of 338
State/UT Fire
Stations Bay1 Bay2 Bay3 Bay4 Bay5 Bay6 Bay7
Bay More Than 7
Total Bay cost
J & K 277 4,950.0 53,100.0 450.0 1,150.0 2,100.0 0.0 0.0 0.0 61,750.0
Jharkhand 180 7,500.0 4,500.0 7,650.0 6,325.0 7,700.0 8,250.0 5,700.0 38,000.0 85,625.0
Karnataka 377 900.0 8,100.0 17,550.0 20,125.0 25,200.0 28,875.0 12,350.0 36,100.0 149,200.0
Kerala 228 7,950.0 3,600.0 9,450.0 4,600.0 9,100.0 2,475.0 14,250.0 20,900.0 72,325.0
Lakshadweep 9 750.0 0.0 0.0 0.0 0.0 0.0 0.0 950.0 1,700.0
Madhya Pradesh 513 16,800.0 21,900.0 31,050.0 29,325.0 26,600.0 40,425.0 118,750.0 43,700.0 328,550.0
Maharashtra 1074 -150.0 208,800.0 71,100.0 33,925.0 12,600.0 6,600.0 8,550.0 10,450.0 351,875.0
Manipur 53 4,950.0 0.0 900.0 0.0 0.0 825.0 5,700.0 1,900.0 14,275.0
Meghalaya 49 3,300.0 1,500.0 900.0 -1,725.0 -1,400.0 0.0 950.0 5,700.0 9,225.0
Mizoram 51 5,100.0 1,200.0 0.0 0.0 700.0 825.0 4,750.0 0.0 12,575.0
Nagaland 48 3,600.0 2,400.0 -900.0 -575.0 700.0 1,650.0 2,850.0 3,800.0 13,525.0
Orissa 331 10,950.0 -8,100.0 8,550.0 16,675.0 9,100.0 20,625.0 11,400.0 19,950.0 89,150.0
Puducherry 17 0.0 1,200.0 450.0 575.0 700.0 0.0 0.0 950.0 3,875.0
Punjab 175 1,500.0 8,100.0 11,250.0 13,800.0 14,700.0 8,250.0 21,850.0 0.0 79,450.0
Rajasthan 874 0.0 209,700.0 20,700.0 7,475.0 4,200.0 4,125.0 2,850.0 0.0 249,050.0
Sikkim 25 2,250.0 -300.0 -450.0 -575.0 0.0 2,475.0 0.0 950.0 4,350.0
Tamil Nadu 451 -1,800.0 3,300.0 18,000.0 22,425.0 34,300.0 30,525.0 15,200.0 47,500.0 169,450.0
Tripura 53 3,600.0 900.0 -900.0 2,875.0 2,800.0 0.0 950.0 0.0 10,225.0
Uttar Pradesh 706 10,350.0 1,500.0 20,250.0 17,825.0 28,700.0 72,600.0 308,750.0 0.0 459,975.0
Uttarakhand 124 7,950.0 6,600.0 2,250.0 2,875.0 4,900.0 1,650.0 12,350.0 -950.0 37,625.0
West Bengal 435 1,350.0 7,800.0 16,650.0 33,350.0 35,000.0 50,325.0 9,500.0 80,750.0 234,725.0
Total 8,599 150,150.0 637,200.0 404,100.0 380,075.0 375,200.0 432,300.0 650,750.0 423,700.0 3,453,475.0
Thus, total estimated capital cost for the Fire Stations building development for gap in operational and all the proposed and new urban and rural Fire Stations is Rs. 34,534.75 Crores (Table 42-22).
Fire-Risk and Hazard Analysis in the Country
(National Report) Confidential Page 308 of 338
Firefighting and Rescue Vehicles and Specialized Equipment Cost:
The costs of different fire fighting vehicles and specialized equipments including communication sets (static and mobile VHF sets) have been taken as approximate rates quoted by fire equipment suppliers. Accordingly, capital cost for fire fighting vehicles and equipments for all the all States/UTs of India have been estimated (Tables 42-23 to 42-28).
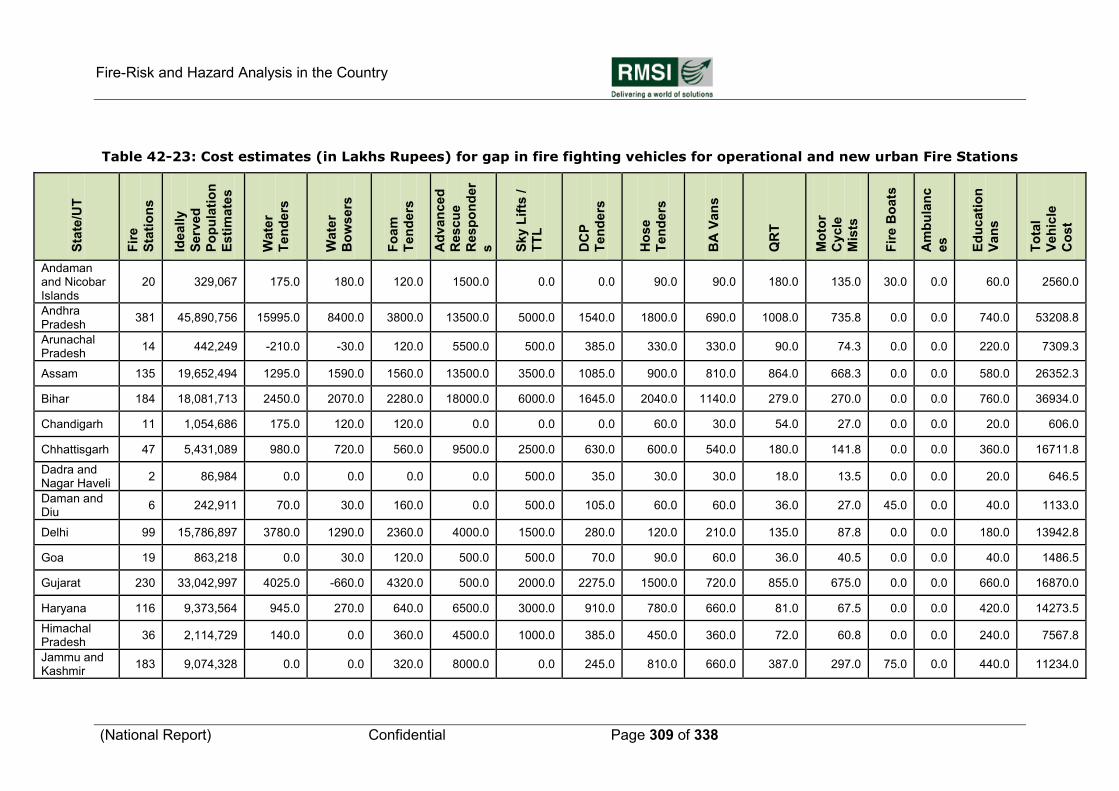
Fire-Risk and Hazard Analysis in the Country
(National Report) Confidential Page 309 of 338
Table 42-23: Cost estimates (in Lakhs Rupees) for gap in fire fighting vehicles for operational and new urban Fire Stations
Sta
te/U
T
Fir
e
Sta
tio
ns
Ideally
Serv
ed
Po
pu
lati
on
Esti
mate
s
Wate
r
Ten
ders
Wate
r
Bo
wsers
Fo
am
Ten
ders
Ad
van
ced
Rescu
e
Resp
on
der
s
Sky L
ifts
/
TT
L
DC
P
Ten
ders
Ho
se
Ten
ders
BA
Van
s
QR
T
Mo
tor
Cycle
Mis
ts
Fir
e B
oats
Am
bu
lan
c
es
Ed
ucati
on
Van
s
To
tal
Veh
icle
Co
st
Andaman and Nicobar Islands
20 329,067 175.0 180.0 120.0 1500.0 0.0 0.0 90.0 90.0 180.0 135.0 30.0 0.0 60.0 2560.0
Andhra Pradesh
381 45,890,756 15995.0 8400.0 3800.0 13500.0 5000.0 1540.0 1800.0 690.0 1008.0 735.8 0.0 0.0 740.0 53208.8
Arunachal Pradesh
14 442,249 -210.0 -30.0 120.0 5500.0 500.0 385.0 330.0 330.0 90.0 74.3 0.0 0.0 220.0 7309.3
Assam 135 19,652,494 1295.0 1590.0 1560.0 13500.0 3500.0 1085.0 900.0 810.0 864.0 668.3 0.0 0.0 580.0 26352.3
Bihar 184 18,081,713 2450.0 2070.0 2280.0 18000.0 6000.0 1645.0 2040.0 1140.0 279.0 270.0 0.0 0.0 760.0 36934.0
Chandigarh 11 1,054,686 175.0 120.0 120.0 0.0 0.0 0.0 60.0 30.0 54.0 27.0 0.0 0.0 20.0 606.0
Chhattisgarh 47 5,431,089 980.0 720.0 560.0 9500.0 2500.0 630.0 600.0 540.0 180.0 141.8 0.0 0.0 360.0 16711.8
Dadra and Nagar Haveli
2 86,984 0.0 0.0 0.0 0.0 500.0 35.0 30.0 30.0 18.0 13.5 0.0 0.0 20.0 646.5
Daman and Diu
6 242,911 70.0 30.0 160.0 0.0 500.0 105.0 60.0 60.0 36.0 27.0 45.0 0.0 40.0 1133.0
Delhi 99 15,786,897 3780.0 1290.0 2360.0 4000.0 1500.0 280.0 120.0 210.0 135.0 87.8 0.0 0.0 180.0 13942.8
Goa 19 863,218 0.0 30.0 120.0 500.0 500.0 70.0 90.0 60.0 36.0 40.5 0.0 0.0 40.0 1486.5
Gujarat 230 33,042,997 4025.0 -660.0 4320.0 500.0 2000.0 2275.0 1500.0 720.0 855.0 675.0 0.0 0.0 660.0 16870.0
Haryana 116 9,373,564 945.0 270.0 640.0 6500.0 3000.0 910.0 780.0 660.0 81.0 67.5 0.0 0.0 420.0 14273.5
Himachal Pradesh
36 2,114,729 140.0 0.0 360.0 4500.0 1000.0 385.0 450.0 360.0 72.0 60.8 0.0 0.0 240.0 7567.8
Jammu and Kashmir
183 9,074,328 0.0 0.0 320.0 8000.0 0.0 245.0 810.0 660.0 387.0 297.0 75.0 0.0 440.0 11234.0
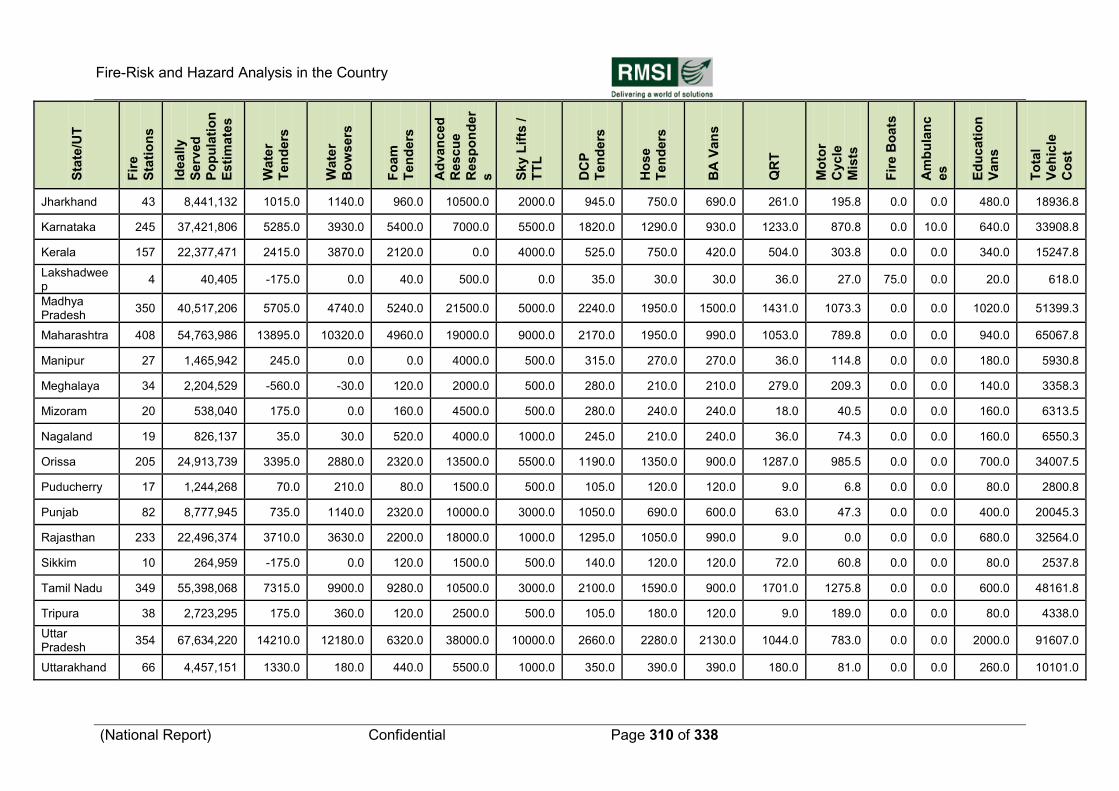
Fire-Risk and Hazard Analysis in the Country
(National Report) Confidential Page 310 of 338
Sta
te/U
T
Fir
e
Sta
tio
ns
Ideally
Serv
ed
Po
pu
lati
on
Esti
mate
s
Wate
r
Ten
ders
Wate
r
Bo
wsers
Fo
am
Ten
ders
Ad
van
ced
Rescu
e
Resp
on
der
s
Sky L
ifts
/
TT
L
DC
P
Ten
ders
Ho
se
Ten
ders
BA
Van
s
QR
T
Mo
tor
Cycle
Mis
ts
Fir
e B
oats
Am
bu
lan
c
es
Ed
ucati
on
Van
s
To
tal
Veh
icle
Co
st
Jharkhand 43 8,441,132 1015.0 1140.0 960.0 10500.0 2000.0 945.0 750.0 690.0 261.0 195.8 0.0 0.0 480.0 18936.8
Karnataka 245 37,421,806 5285.0 3930.0 5400.0 7000.0 5500.0 1820.0 1290.0 930.0 1233.0 870.8 0.0 10.0 640.0 33908.8
Kerala 157 22,377,471 2415.0 3870.0 2120.0 0.0 4000.0 525.0 750.0 420.0 504.0 303.8 0.0 0.0 340.0 15247.8
Lakshadweep
4 40,405 -175.0 0.0 40.0 500.0 0.0 35.0 30.0 30.0 36.0 27.0 75.0 0.0 20.0 618.0
Madhya Pradesh
350 40,517,206 5705.0 4740.0 5240.0 21500.0 5000.0 2240.0 1950.0 1500.0 1431.0 1073.3 0.0 0.0 1020.0 51399.3
Maharashtra 408 54,763,986 13895.0 10320.0 4960.0 19000.0 9000.0 2170.0 1950.0 990.0 1053.0 789.8 0.0 0.0 940.0 65067.8
Manipur 27 1,465,942 245.0 0.0 0.0 4000.0 500.0 315.0 270.0 270.0 36.0 114.8 0.0 0.0 180.0 5930.8
Meghalaya 34 2,204,529 -560.0 -30.0 120.0 2000.0 500.0 280.0 210.0 210.0 279.0 209.3 0.0 0.0 140.0 3358.3
Mizoram 20 538,040 175.0 0.0 160.0 4500.0 500.0 280.0 240.0 240.0 18.0 40.5 0.0 0.0 160.0 6313.5
Nagaland 19 826,137 35.0 30.0 520.0 4000.0 1000.0 245.0 210.0 240.0 36.0 74.3 0.0 0.0 160.0 6550.3
Orissa 205 24,913,739 3395.0 2880.0 2320.0 13500.0 5500.0 1190.0 1350.0 900.0 1287.0 985.5 0.0 0.0 700.0 34007.5
Puducherry 17 1,244,268 70.0 210.0 80.0 1500.0 500.0 105.0 120.0 120.0 9.0 6.8 0.0 0.0 80.0 2800.8
Punjab 82 8,777,945 735.0 1140.0 2320.0 10000.0 3000.0 1050.0 690.0 600.0 63.0 47.3 0.0 0.0 400.0 20045.3
Rajasthan 233 22,496,374 3710.0 3630.0 2200.0 18000.0 1000.0 1295.0 1050.0 990.0 9.0 0.0 0.0 0.0 680.0 32564.0
Sikkim 10 264,959 -175.0 0.0 120.0 1500.0 500.0 140.0 120.0 120.0 72.0 60.8 0.0 0.0 80.0 2537.8
Tamil Nadu 349 55,398,068 7315.0 9900.0 9280.0 10500.0 3000.0 2100.0 1590.0 900.0 1701.0 1275.8 0.0 0.0 600.0 48161.8
Tripura 38 2,723,295 175.0 360.0 120.0 2500.0 500.0 105.0 180.0 120.0 9.0 189.0 0.0 0.0 80.0 4338.0
Uttar Pradesh
354 67,634,220 14210.0 12180.0 6320.0 38000.0 10000.0 2660.0 2280.0 2130.0 1044.0 783.0 0.0 0.0 2000.0 91607.0
Uttarakhand 66 4,457,151 1330.0 180.0 440.0 5500.0 1000.0 350.0 390.0 390.0 180.0 81.0 0.0 0.0 260.0 10101.0
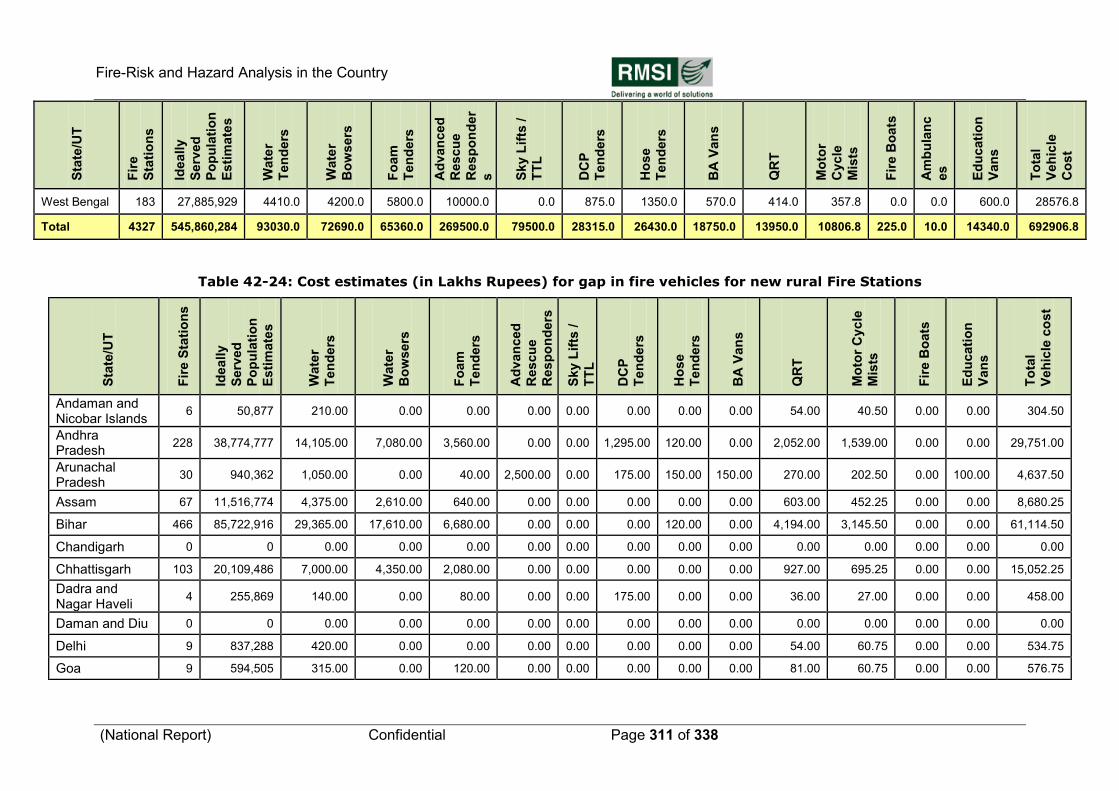
Fire-Risk and Hazard Analysis in the Country
(National Report) Confidential Page 311 of 338
Sta
te/U
T
Fir
e
Sta
tio
ns
Ideally
Serv
ed
Po
pu
lati
on
Esti
mate
s
Wate
r
Ten
ders
Wate
r
Bo
wsers
Fo
am
Ten
ders
Ad
van
ced
Rescu
e
Resp
on
der
s
Sky L
ifts
/
TT
L
DC
P
Ten
ders
Ho
se
Ten
ders
BA
Van
s
QR
T
Mo
tor
Cycle
Mis
ts
Fir
e B
oats
Am
bu
lan
c
es
Ed
ucati
on
Van
s
To
tal
Veh
icle
Co
st
West Bengal 183 27,885,929 4410.0 4200.0 5800.0 10000.0 0.0 875.0 1350.0 570.0 414.0 357.8 0.0 0.0 600.0 28576.8
Total 4327 545,860,284 93030.0 72690.0 65360.0 269500.0 79500.0 28315.0 26430.0 18750.0 13950.0 10806.8 225.0 10.0 14340.0 692906.8
Table 42-24: Cost estimates (in Lakhs Rupees) for gap in fire vehicles for new rural Fire Stations
Sta
te/U
T
Fir
e S
tati
on
s
Ideally
Serv
ed
Po
pu
lati
on
Esti
mate
s
Wate
r
Ten
ders
Wate
r
Bo
wsers
Fo
am
Ten
ders
Ad
van
ced
Rescu
e
Resp
on
ders
Sky L
ifts
/
TT
L
DC
P
Ten
ders
Ho
se
Ten
ders
BA
Van
s
QR
T
Mo
tor
Cyc
le
Mis
ts
Fir
e B
oats
Ed
ucati
on
Van
s
To
tal
Veh
icle
co
st
Andaman and Nicobar Islands
6 50,877 210.00 0.00 0.00 0.00 0.00 0.00 0.00 0.00 54.00 40.50 0.00 0.00 304.50
Andhra Pradesh
228 38,774,777 14,105.00 7,080.00 3,560.00 0.00 0.00 1,295.00 120.00 0.00 2,052.00 1,539.00 0.00 0.00 29,751.00
Arunachal Pradesh
30 940,362 1,050.00 0.00 40.00 2,500.00 0.00 175.00 150.00 150.00 270.00 202.50 0.00 100.00 4,637.50
Assam 67 11,516,774 4,375.00 2,610.00 640.00 0.00 0.00 0.00 0.00 0.00 603.00 452.25 0.00 0.00 8,680.25
Bihar 466 85,722,916 29,365.00 17,610.00 6,680.00 0.00 0.00 0.00 120.00 0.00 4,194.00 3,145.50 0.00 0.00 61,114.50
Chandigarh 0 0 0.00 0.00 0.00 0.00 0.00 0.00 0.00 0.00 0.00 0.00 0.00 0.00 0.00
Chhattisgarh 103 20,109,486 7,000.00 4,350.00 2,080.00 0.00 0.00 0.00 0.00 0.00 927.00 695.25 0.00 0.00 15,052.25
Dadra and Nagar Haveli
4 255,869 140.00 0.00 80.00 0.00 0.00 175.00 0.00 0.00 36.00 27.00 0.00 0.00 458.00
Daman and Diu 0 0 0.00 0.00 0.00 0.00 0.00 0.00 0.00 0.00 0.00 0.00 0.00 0.00 0.00
Delhi 9 837,288 420.00 0.00 0.00 0.00 0.00 0.00 0.00 0.00 54.00 60.75 0.00 0.00 534.75
Goa 9 594,505 315.00 0.00 120.00 0.00 0.00 0.00 0.00 0.00 81.00 60.75 0.00 0.00 576.75
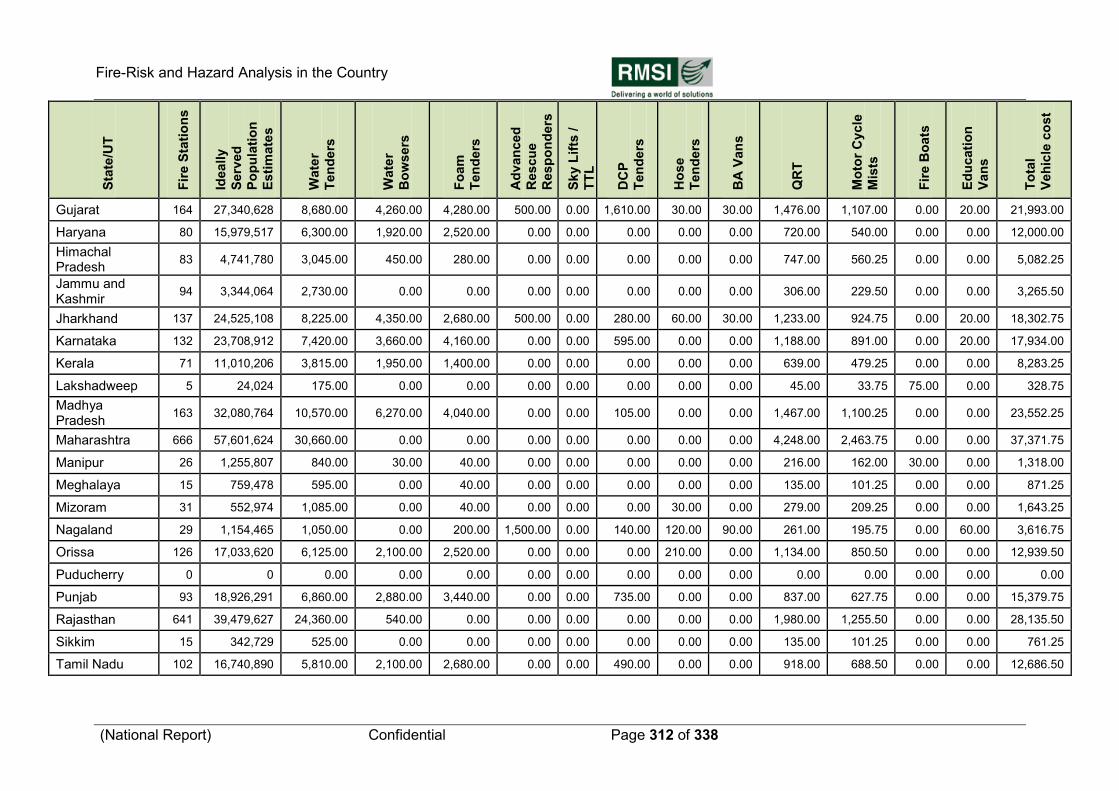
Fire-Risk and Hazard Analysis in the Country
(National Report) Confidential Page 312 of 338
Sta
te/U
T
Fir
e S
tati
on
s
Ideally
Serv
ed
Po
pu
lati
on
Esti
mate
s
Wate
r
Ten
ders
Wate
r
Bo
wsers
Fo
am
Ten
ders
Ad
van
ced
Rescu
e
Resp
on
ders
Sky L
ifts
/
TT
L
DC
P
Ten
ders
Ho
se
Ten
ders
BA
Van
s
QR
T
Mo
tor
Cyc
le
Mis
ts
Fir
e B
oats
Ed
ucati
on
Van
s
To
tal
Veh
icle
co
st
Gujarat 164 27,340,628 8,680.00 4,260.00 4,280.00 500.00 0.00 1,610.00 30.00 30.00 1,476.00 1,107.00 0.00 20.00 21,993.00
Haryana 80 15,979,517 6,300.00 1,920.00 2,520.00 0.00 0.00 0.00 0.00 0.00 720.00 540.00 0.00 0.00 12,000.00
Himachal Pradesh
83 4,741,780 3,045.00 450.00 280.00 0.00 0.00 0.00 0.00 0.00 747.00 560.25 0.00 0.00 5,082.25
Jammu and Kashmir
94 3,344,064 2,730.00 0.00 0.00 0.00 0.00 0.00 0.00 0.00 306.00 229.50 0.00 0.00 3,265.50
Jharkhand 137 24,525,108 8,225.00 4,350.00 2,680.00 500.00 0.00 280.00 60.00 30.00 1,233.00 924.75 0.00 20.00 18,302.75
Karnataka 132 23,708,912 7,420.00 3,660.00 4,160.00 0.00 0.00 595.00 0.00 0.00 1,188.00 891.00 0.00 20.00 17,934.00
Kerala 71 11,010,206 3,815.00 1,950.00 1,400.00 0.00 0.00 0.00 0.00 0.00 639.00 479.25 0.00 0.00 8,283.25
Lakshadweep 5 24,024 175.00 0.00 0.00 0.00 0.00 0.00 0.00 0.00 45.00 33.75 75.00 0.00 328.75
Madhya Pradesh
163 32,080,764 10,570.00 6,270.00 4,040.00 0.00 0.00 105.00 0.00 0.00 1,467.00 1,100.25 0.00 0.00 23,552.25
Maharashtra 666 57,601,624 30,660.00 0.00 0.00 0.00 0.00 0.00 0.00 0.00 4,248.00 2,463.75 0.00 0.00 37,371.75
Manipur 26 1,255,807 840.00 30.00 40.00 0.00 0.00 0.00 0.00 0.00 216.00 162.00 30.00 0.00 1,318.00
Meghalaya 15 759,478 595.00 0.00 40.00 0.00 0.00 0.00 0.00 0.00 135.00 101.25 0.00 0.00 871.25
Mizoram 31 552,974 1,085.00 0.00 40.00 0.00 0.00 0.00 30.00 0.00 279.00 209.25 0.00 0.00 1,643.25
Nagaland 29 1,154,465 1,050.00 0.00 200.00 1,500.00 0.00 140.00 120.00 90.00 261.00 195.75 0.00 60.00 3,616.75
Orissa 126 17,033,620 6,125.00 2,100.00 2,520.00 0.00 0.00 0.00 210.00 0.00 1,134.00 850.50 0.00 0.00 12,939.50
Puducherry 0 0 0.00 0.00 0.00 0.00 0.00 0.00 0.00 0.00 0.00 0.00 0.00 0.00 0.00
Punjab 93 18,926,291 6,860.00 2,880.00 3,440.00 0.00 0.00 735.00 0.00 0.00 837.00 627.75 0.00 0.00 15,379.75
Rajasthan 641 39,479,627 24,360.00 540.00 0.00 0.00 0.00 0.00 0.00 0.00 1,980.00 1,255.50 0.00 0.00 28,135.50
Sikkim 15 342,729 525.00 0.00 0.00 0.00 0.00 0.00 0.00 0.00 135.00 101.25 0.00 0.00 761.25
Tamil Nadu 102 16,740,890 5,810.00 2,100.00 2,680.00 0.00 0.00 490.00 0.00 0.00 918.00 688.50 0.00 0.00 12,686.50
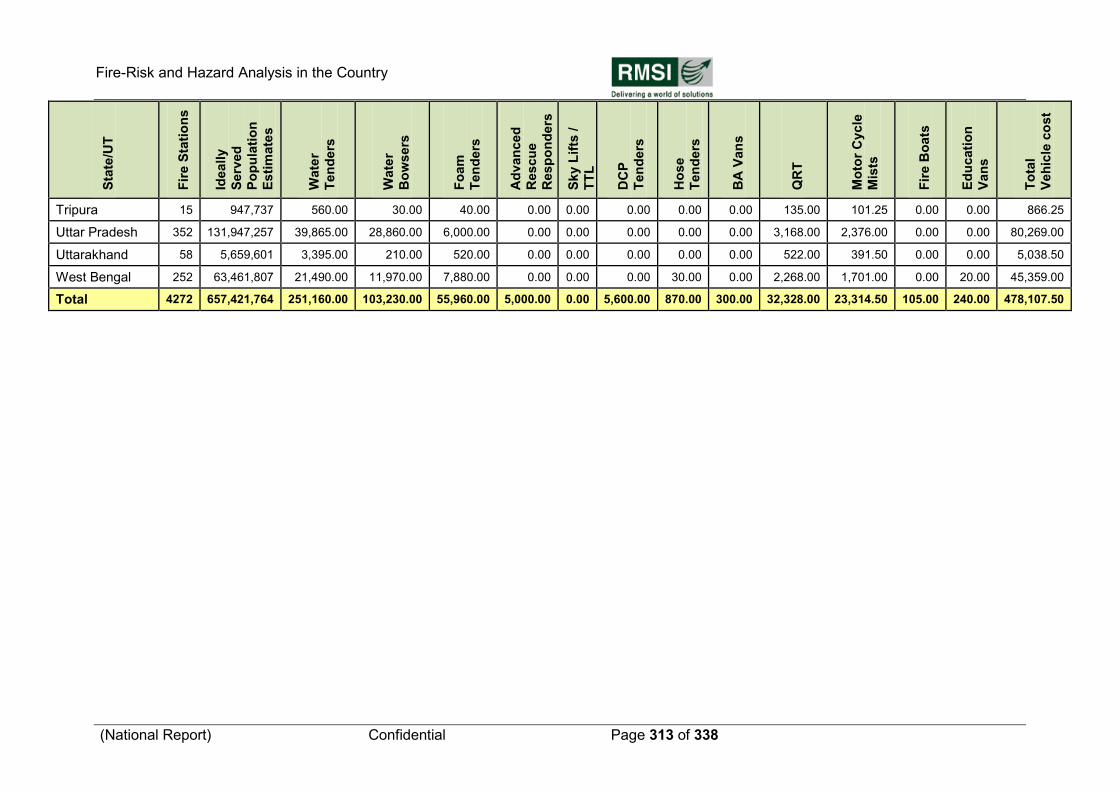
Fire-Risk and Hazard Analysis in the Country
(National Report) Confidential Page 313 of 338
Sta
te/U
T
Fir
e S
tati
on
s
Ideally
Serv
ed
Po
pu
lati
on
Esti
mate
s
Wate
r
Ten
ders
Wate
r
Bo
wsers
Fo
am
Ten
ders
Ad
van
ced
Rescu
e
Resp
on
ders
Sky L
ifts
/
TT
L
DC
P
Ten
ders
Ho
se
Ten
ders
BA
Van
s
QR
T
Mo
tor
Cyc
le
Mis
ts
Fir
e B
oats
Ed
ucati
on
Van
s
To
tal
Veh
icle
co
st
Tripura 15 947,737 560.00 30.00 40.00 0.00 0.00 0.00 0.00 0.00 135.00 101.25 0.00 0.00 866.25
Uttar Pradesh 352 131,947,257 39,865.00 28,860.00 6,000.00 0.00 0.00 0.00 0.00 0.00 3,168.00 2,376.00 0.00 0.00 80,269.00
Uttarakhand 58 5,659,601 3,395.00 210.00 520.00 0.00 0.00 0.00 0.00 0.00 522.00 391.50 0.00 0.00 5,038.50
West Bengal 252 63,461,807 21,490.00 11,970.00 7,880.00 0.00 0.00 0.00 30.00 0.00 2,268.00 1,701.00 0.00 20.00 45,359.00
Total 4272 657,421,764 251,160.00 103,230.00 55,960.00 5,000.00 0.00 5,600.00 870.00 300.00 32,328.00 23,314.50 105.00 240.00 478,107.50
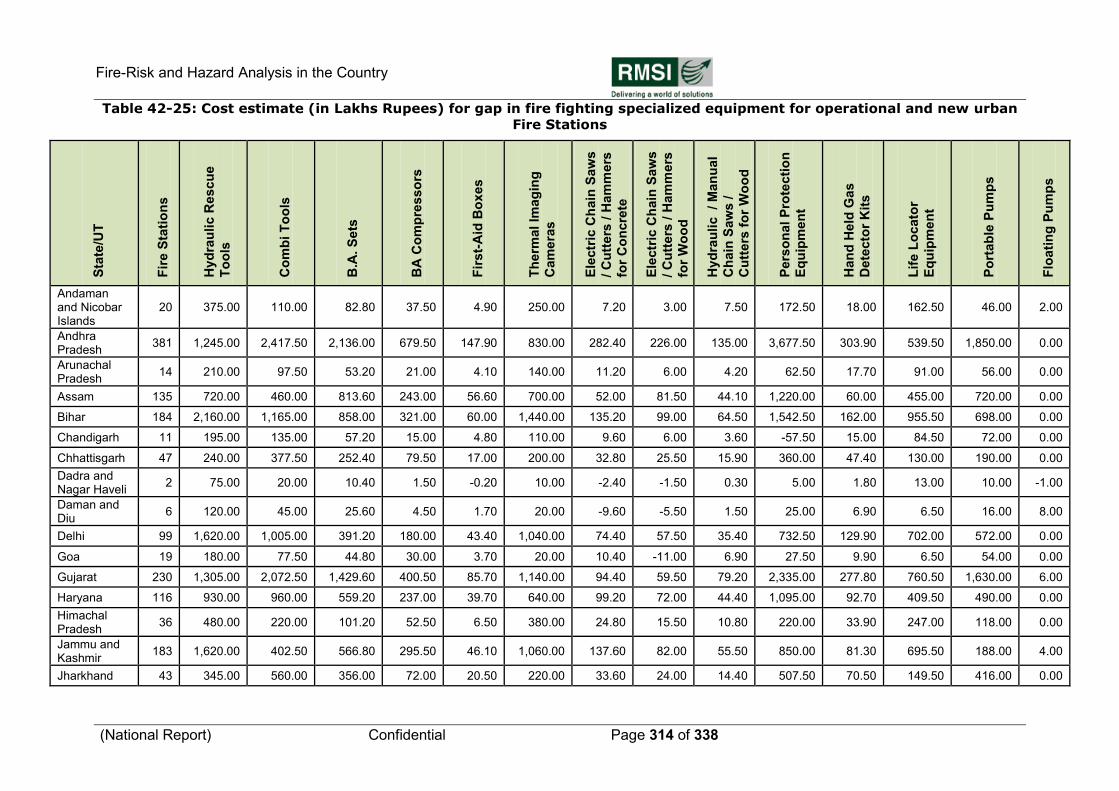
Fire-Risk and Hazard Analysis in the Country
(National Report) Confidential Page 314 of 338
Table 42-25: Cost estimate (in Lakhs Rupees) for gap in fire fighting specialized equipment for operational and new urban
Fire Stations
Sta
te/U
T
Fir
e S
tati
on
s
Hyd
rau
lic R
escu
e
To
ols
Co
mb
i T
oo
ls
B.A
. S
ets
BA
Co
mp
resso
rs
Fir
st-
Aid
Bo
xes
Th
erm
al
Imag
ing
Cam
era
s
Ele
ctr
ic C
hain
Saw
s
/ C
utt
ers
/ H
am
mers
for
Co
ncre
te
Ele
ctr
ic C
hain
Saw
s
/ C
utt
ers
/ H
am
mers
for
Wo
od
Hyd
rau
lic
/ M
an
ual
Ch
ain
Saw
s /
Cu
tters
fo
r W
oo
d
Pers
on
al
Pro
tecti
on
Eq
uip
men
t
Han
d H
eld
Ga
s
Dete
cto
r K
its
Lif
e L
ocato
r
Eq
uip
men
t
Po
rtab
le P
um
ps
Flo
ati
ng
Pu
mp
s
Andaman and Nicobar Islands
20 375.00 110.00 82.80 37.50 4.90 250.00 7.20 3.00 7.50 172.50 18.00 162.50 46.00 2.00
Andhra Pradesh
381 1,245.00 2,417.50 2,136.00 679.50 147.90 830.00 282.40 226.00 135.00 3,677.50 303.90 539.50 1,850.00 0.00
Arunachal Pradesh
14 210.00 97.50 53.20 21.00 4.10 140.00 11.20 6.00 4.20 62.50 17.70 91.00 56.00 0.00
Assam 135 720.00 460.00 813.60 243.00 56.60 700.00 52.00 81.50 44.10 1,220.00 60.00 455.00 720.00 0.00
Bihar 184 2,160.00 1,165.00 858.00 321.00 60.00 1,440.00 135.20 99.00 64.50 1,542.50 162.00 955.50 698.00 0.00
Chandigarh 11 195.00 135.00 57.20 15.00 4.80 110.00 9.60 6.00 3.60 -57.50 15.00 84.50 72.00 0.00
Chhattisgarh 47 240.00 377.50 252.40 79.50 17.00 200.00 32.80 25.50 15.90 360.00 47.40 130.00 190.00 0.00
Dadra and Nagar Haveli
2 75.00 20.00 10.40 1.50 -0.20 10.00 -2.40 -1.50 0.30 5.00 1.80 13.00 10.00 -1.00
Daman and Diu
6 120.00 45.00 25.60 4.50 1.70 20.00 -9.60 -5.50 1.50 25.00 6.90 6.50 16.00 8.00
Delhi 99 1,620.00 1,005.00 391.20 180.00 43.40 1,040.00 74.40 57.50 35.40 732.50 129.90 702.00 572.00 0.00
Goa 19 180.00 77.50 44.80 30.00 3.70 20.00 10.40 -11.00 6.90 27.50 9.90 6.50 54.00 0.00
Gujarat 230 1,305.00 2,072.50 1,429.60 400.50 85.70 1,140.00 94.40 59.50 79.20 2,335.00 277.80 760.50 1,630.00 6.00
Haryana 116 930.00 960.00 559.20 237.00 39.70 640.00 99.20 72.00 44.40 1,095.00 92.70 409.50 490.00 0.00
Himachal Pradesh
36 480.00 220.00 101.20 52.50 6.50 380.00 24.80 15.50 10.80 220.00 33.90 247.00 118.00 0.00
Jammu and Kashmir
183 1,620.00 402.50 566.80 295.50 46.10 1,060.00 137.60 82.00 55.50 850.00 81.30 695.50 188.00 4.00
Jharkhand 43 345.00 560.00 356.00 72.00 20.50 220.00 33.60 24.00 14.40 507.50 70.50 149.50 416.00 0.00
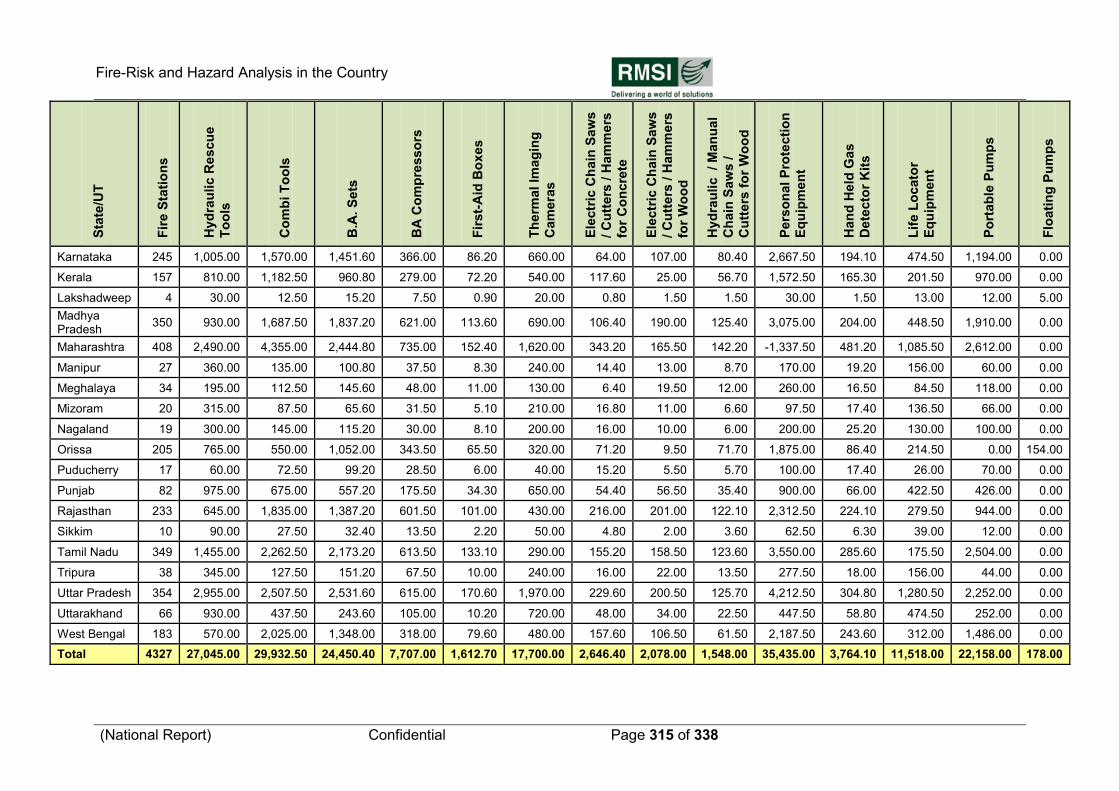
Fire-Risk and Hazard Analysis in the Country
(National Report) Confidential Page 315 of 338
Sta
te/U
T
Fir
e S
tati
on
s
Hyd
rau
lic R
escu
e
To
ols
Co
mb
i T
oo
ls
B.A
. S
ets
BA
Co
mp
resso
rs
Fir
st-
Aid
Bo
xes
Th
erm
al
Imag
ing
Cam
era
s
Ele
ctr
ic C
hain
Saw
s
/ C
utt
ers
/ H
am
mers
for
Co
ncre
te
Ele
ctr
ic C
hain
Saw
s
/ C
utt
ers
/ H
am
mers
for
Wo
od
Hyd
rau
lic /
Man
ual
Ch
ain
Saw
s /
Cu
tters
fo
r W
oo
d
Pers
on
al
Pro
tecti
on
Eq
uip
men
t
Han
d H
eld
Ga
s
Dete
cto
r K
its
Lif
e L
ocato
r
Eq
uip
men
t
Po
rtab
le P
um
ps
Flo
ati
ng
Pu
mp
s
Karnataka 245 1,005.00 1,570.00 1,451.60 366.00 86.20 660.00 64.00 107.00 80.40 2,667.50 194.10 474.50 1,194.00 0.00
Kerala 157 810.00 1,182.50 960.80 279.00 72.20 540.00 117.60 25.00 56.70 1,572.50 165.30 201.50 970.00 0.00
Lakshadweep 4 30.00 12.50 15.20 7.50 0.90 20.00 0.80 1.50 1.50 30.00 1.50 13.00 12.00 5.00
Madhya Pradesh
350 930.00 1,687.50 1,837.20 621.00 113.60 690.00 106.40 190.00 125.40 3,075.00 204.00 448.50 1,910.00 0.00
Maharashtra 408 2,490.00 4,355.00 2,444.80 735.00 152.40 1,620.00 343.20 165.50 142.20 -1,337.50 481.20 1,085.50 2,612.00 0.00
Manipur 27 360.00 135.00 100.80 37.50 8.30 240.00 14.40 13.00 8.70 170.00 19.20 156.00 60.00 0.00
Meghalaya 34 195.00 112.50 145.60 48.00 11.00 130.00 6.40 19.50 12.00 260.00 16.50 84.50 118.00 0.00
Mizoram 20 315.00 87.50 65.60 31.50 5.10 210.00 16.80 11.00 6.60 97.50 17.40 136.50 66.00 0.00
Nagaland 19 300.00 145.00 115.20 30.00 8.10 200.00 16.00 10.00 6.00 200.00 25.20 130.00 100.00 0.00
Orissa 205 765.00 550.00 1,052.00 343.50 65.50 320.00 71.20 9.50 71.70 1,875.00 86.40 214.50 0.00 154.00
Puducherry 17 60.00 72.50 99.20 28.50 6.00 40.00 15.20 5.50 5.70 100.00 17.40 26.00 70.00 0.00
Punjab 82 975.00 675.00 557.20 175.50 34.30 650.00 54.40 56.50 35.40 900.00 66.00 422.50 426.00 0.00
Rajasthan 233 645.00 1,835.00 1,387.20 601.50 101.00 430.00 216.00 201.00 122.10 2,312.50 224.10 279.50 944.00 0.00
Sikkim 10 90.00 27.50 32.40 13.50 2.20 50.00 4.80 2.00 3.60 62.50 6.30 39.00 12.00 0.00
Tamil Nadu 349 1,455.00 2,262.50 2,173.20 613.50 133.10 290.00 155.20 158.50 123.60 3,550.00 285.60 175.50 2,504.00 0.00
Tripura 38 345.00 127.50 151.20 67.50 10.00 240.00 16.00 22.00 13.50 277.50 18.00 156.00 44.00 0.00
Uttar Pradesh 354 2,955.00 2,507.50 2,531.60 615.00 170.60 1,970.00 229.60 200.50 125.70 4,212.50 304.80 1,280.50 2,252.00 0.00
Uttarakhand 66 930.00 437.50 243.60 105.00 10.20 720.00 48.00 34.00 22.50 447.50 58.80 474.50 252.00 0.00
West Bengal 183 570.00 2,025.00 1,348.00 318.00 79.60 480.00 157.60 106.50 61.50 2,187.50 243.60 312.00 1,486.00 0.00
Total 4327 27,045.00 29,932.50 24,450.40 7,707.00 1,612.70 17,700.00 2,646.40 2,078.00 1,548.00 35,435.00 3,764.10 11,518.00 22,158.00 178.00
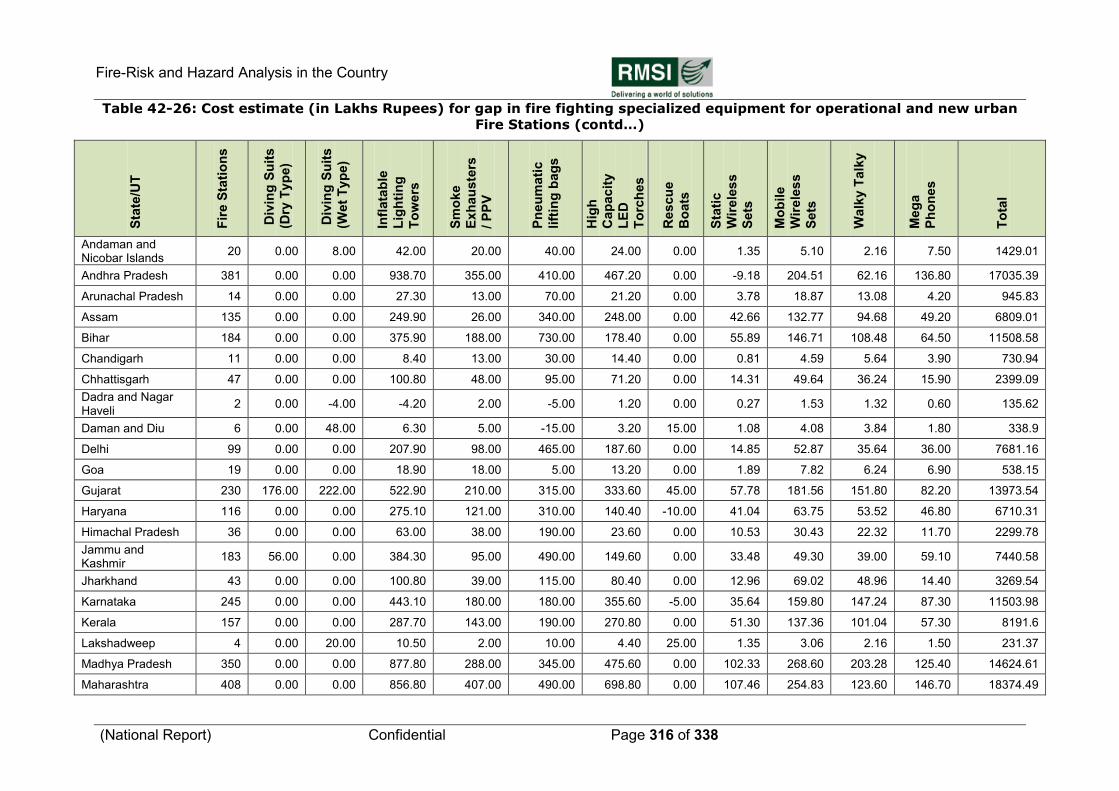
Fire-Risk and Hazard Analysis in the Country
(National Report) Confidential Page 316 of 338
Table 42-26: Cost estimate (in Lakhs Rupees) for gap in fire fighting specialized equipment for operational and new urban
Fire Stations (contd…) S
tate
/UT
Fir
e S
tati
on
s
Div
ing
Su
its
(Dry
Typ
e)
Div
ing
Su
its
(Wet
Typ
e)
Infl
ata
ble
Lig
hti
ng
To
wers
Sm
oke
Exh
au
ste
rs
/ P
PV
Pn
eu
mati
c
lift
ing
bag
s
Hig
h
Cap
acit
y
LE
D
To
rch
es
Rescu
e
Bo
ats
Sta
tic
Wir
ele
ss
Sets
Mo
bile
Wir
ele
ss
Sets
Walk
y T
alk
y
Meg
a
Ph
on
es
To
tal
Andaman and Nicobar Islands
20 0.00 8.00 42.00 20.00 40.00 24.00 0.00 1.35 5.10 2.16 7.50 1429.01
Andhra Pradesh 381 0.00 0.00 938.70 355.00 410.00 467.20 0.00 -9.18 204.51 62.16 136.80 17035.39
Arunachal Pradesh 14 0.00 0.00 27.30 13.00 70.00 21.20 0.00 3.78 18.87 13.08 4.20 945.83
Assam 135 0.00 0.00 249.90 26.00 340.00 248.00 0.00 42.66 132.77 94.68 49.20 6809.01
Bihar 184 0.00 0.00 375.90 188.00 730.00 178.40 0.00 55.89 146.71 108.48 64.50 11508.58
Chandigarh 11 0.00 0.00 8.40 13.00 30.00 14.40 0.00 0.81 4.59 5.64 3.90 730.94
Chhattisgarh 47 0.00 0.00 100.80 48.00 95.00 71.20 0.00 14.31 49.64 36.24 15.90 2399.09
Dadra and Nagar Haveli
2 0.00 -4.00 -4.20 2.00 -5.00 1.20 0.00 0.27 1.53 1.32 0.60 135.62
Daman and Diu 6 0.00 48.00 6.30 5.00 -15.00 3.20 15.00 1.08 4.08 3.84 1.80 338.9
Delhi 99 0.00 0.00 207.90 98.00 465.00 187.60 0.00 14.85 52.87 35.64 36.00 7681.16
Goa 19 0.00 0.00 18.90 18.00 5.00 13.20 0.00 1.89 7.82 6.24 6.90 538.15
Gujarat 230 176.00 222.00 522.90 210.00 315.00 333.60 45.00 57.78 181.56 151.80 82.20 13973.54
Haryana 116 0.00 0.00 275.10 121.00 310.00 140.40 -10.00 41.04 63.75 53.52 46.80 6710.31
Himachal Pradesh 36 0.00 0.00 63.00 38.00 190.00 23.60 0.00 10.53 30.43 22.32 11.70 2299.78
Jammu and Kashmir
183 56.00 0.00 384.30 95.00 490.00 149.60 0.00 33.48 49.30 39.00 59.10 7440.58
Jharkhand 43 0.00 0.00 100.80 39.00 115.00 80.40 0.00 12.96 69.02 48.96 14.40 3269.54
Karnataka 245 0.00 0.00 443.10 180.00 180.00 355.60 -5.00 35.64 159.80 147.24 87.30 11503.98
Kerala 157 0.00 0.00 287.70 143.00 190.00 270.80 0.00 51.30 137.36 101.04 57.30 8191.6
Lakshadweep 4 0.00 20.00 10.50 2.00 10.00 4.40 25.00 1.35 3.06 2.16 1.50 231.37
Madhya Pradesh 350 0.00 0.00 877.80 288.00 345.00 475.60 0.00 102.33 268.60 203.28 125.40 14624.61
Maharashtra 408 0.00 0.00 856.80 407.00 490.00 698.80 0.00 107.46 254.83 123.60 146.70 18374.49
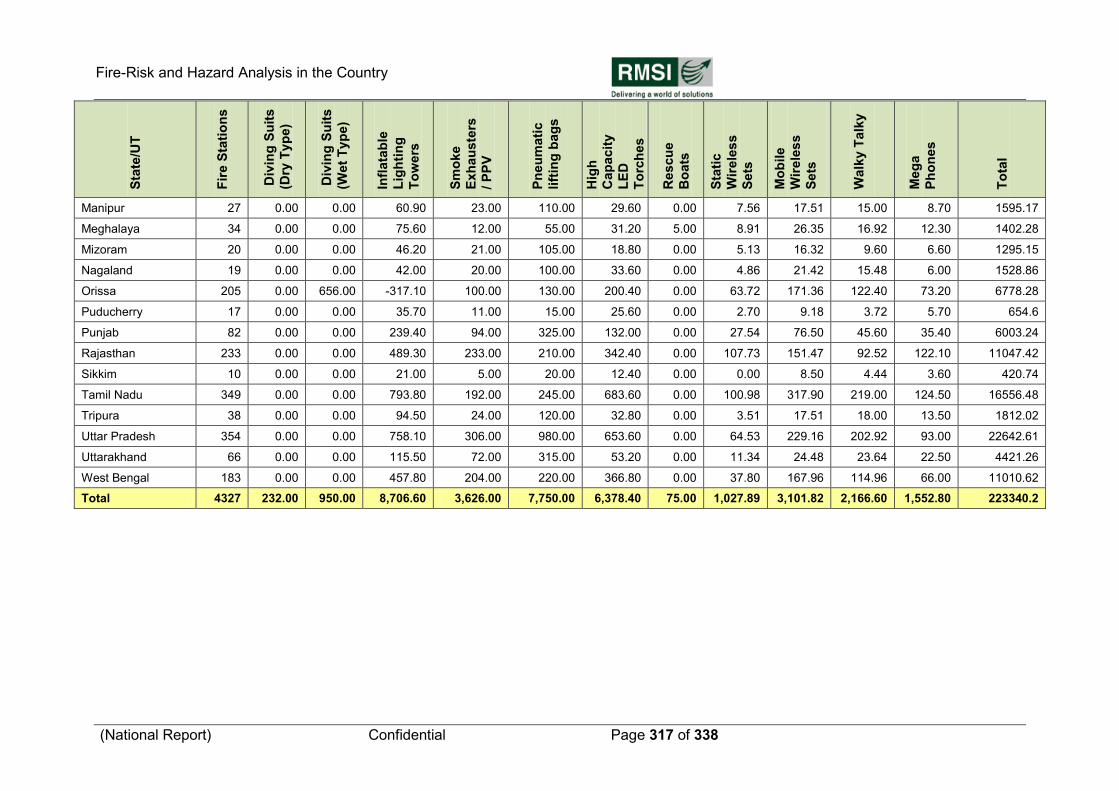
Fire-Risk and Hazard Analysis in the Country
(National Report) Confidential Page 317 of 338
Sta
te/U
T
Fir
e S
tati
on
s
Div
ing
Su
its
(Dry
Typ
e)
Div
ing
Su
its
(Wet
Typ
e)
Infl
ata
ble
Lig
hti
ng
To
wers
Sm
oke
Exh
au
ste
rs
/ P
PV
Pn
eu
mati
c
lift
ing
bag
s
Hig
h
Cap
acit
y
LE
D
To
rch
es
Rescu
e
Bo
ats
Sta
tic
Wir
ele
ss
Sets
Mo
bile
Wir
ele
ss
Sets
Walk
y T
alk
y
Meg
a
Ph
on
es
To
tal
Manipur 27 0.00 0.00 60.90 23.00 110.00 29.60 0.00 7.56 17.51 15.00 8.70 1595.17
Meghalaya 34 0.00 0.00 75.60 12.00 55.00 31.20 5.00 8.91 26.35 16.92 12.30 1402.28
Mizoram 20 0.00 0.00 46.20 21.00 105.00 18.80 0.00 5.13 16.32 9.60 6.60 1295.15
Nagaland 19 0.00 0.00 42.00 20.00 100.00 33.60 0.00 4.86 21.42 15.48 6.00 1528.86
Orissa 205 0.00 656.00 -317.10 100.00 130.00 200.40 0.00 63.72 171.36 122.40 73.20 6778.28
Puducherry 17 0.00 0.00 35.70 11.00 15.00 25.60 0.00 2.70 9.18 3.72 5.70 654.6
Punjab 82 0.00 0.00 239.40 94.00 325.00 132.00 0.00 27.54 76.50 45.60 35.40 6003.24
Rajasthan 233 0.00 0.00 489.30 233.00 210.00 342.40 0.00 107.73 151.47 92.52 122.10 11047.42
Sikkim 10 0.00 0.00 21.00 5.00 20.00 12.40 0.00 0.00 8.50 4.44 3.60 420.74
Tamil Nadu 349 0.00 0.00 793.80 192.00 245.00 683.60 0.00 100.98 317.90 219.00 124.50 16556.48
Tripura 38 0.00 0.00 94.50 24.00 120.00 32.80 0.00 3.51 17.51 18.00 13.50 1812.02
Uttar Pradesh 354 0.00 0.00 758.10 306.00 980.00 653.60 0.00 64.53 229.16 202.92 93.00 22642.61
Uttarakhand 66 0.00 0.00 115.50 72.00 315.00 53.20 0.00 11.34 24.48 23.64 22.50 4421.26
West Bengal 183 0.00 0.00 457.80 204.00 220.00 366.80 0.00 37.80 167.96 114.96 66.00 11010.62
Total 4327 232.00 950.00 8,706.60 3,626.00 7,750.00 6,378.40 75.00 1,027.89 3,101.82 2,166.60 1,552.80 223340.2
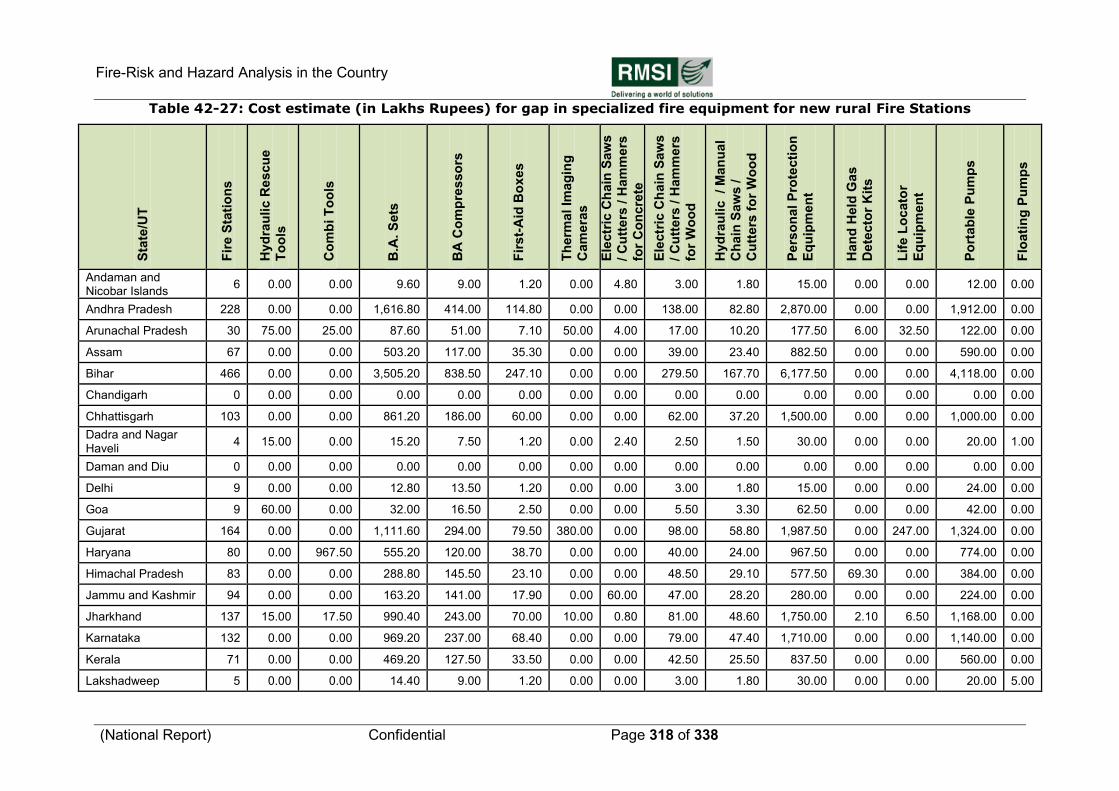
Fire-Risk and Hazard Analysis in the Country
(National Report) Confidential Page 318 of 338
Table 42-27: Cost estimate (in Lakhs Rupees) for gap in specialized fire equipment for new rural Fire Stations
Sta
te/U
T
Fir
e S
tati
on
s
Hyd
rau
lic R
escu
e
To
ols
Co
mb
i T
oo
ls
B.A
. S
ets
BA
Co
mp
resso
rs
Fir
st-
Aid
Bo
xes
Th
erm
al
Imag
ing
Cam
era
s
Ele
ctr
ic C
hain
Saw
s
/ C
utt
ers
/ H
am
mers
for
Co
ncre
te
Ele
ctr
ic C
hain
Saw
s
/ C
utt
ers
/ H
am
mers
for
Wo
od
Hyd
rau
lic /
Man
ual
Ch
ain
Saw
s /
Cu
tters
fo
r W
oo
d
Pers
on
al
Pro
tecti
on
Eq
uip
men
t
Han
d H
eld
Ga
s
Dete
cto
r K
its
Lif
e L
ocato
r
Eq
uip
men
t
Po
rtab
le P
um
ps
Flo
ati
ng
Pu
mp
s
Andaman and Nicobar Islands
6 0.00 0.00 9.60 9.00 1.20 0.00 4.80 3.00 1.80 15.00 0.00 0.00 12.00 0.00
Andhra Pradesh 228 0.00 0.00 1,616.80 414.00 114.80 0.00 0.00 138.00 82.80 2,870.00 0.00 0.00 1,912.00 0.00
Arunachal Pradesh 30 75.00 25.00 87.60 51.00 7.10 50.00 4.00 17.00 10.20 177.50 6.00 32.50 122.00 0.00
Assam 67 0.00 0.00 503.20 117.00 35.30 0.00 0.00 39.00 23.40 882.50 0.00 0.00 590.00 0.00
Bihar 466 0.00 0.00 3,505.20 838.50 247.10 0.00 0.00 279.50 167.70 6,177.50 0.00 0.00 4,118.00 0.00
Chandigarh 0 0.00 0.00 0.00 0.00 0.00 0.00 0.00 0.00 0.00 0.00 0.00 0.00 0.00 0.00
Chhattisgarh 103 0.00 0.00 861.20 186.00 60.00 0.00 0.00 62.00 37.20 1,500.00 0.00 0.00 1,000.00 0.00
Dadra and Nagar Haveli
4 15.00 0.00 15.20 7.50 1.20 0.00 2.40 2.50 1.50 30.00 0.00 0.00 20.00 1.00
Daman and Diu 0 0.00 0.00 0.00 0.00 0.00 0.00 0.00 0.00 0.00 0.00 0.00 0.00 0.00 0.00
Delhi 9 0.00 0.00 12.80 13.50 1.20 0.00 0.00 3.00 1.80 15.00 0.00 0.00 24.00 0.00
Goa 9 60.00 0.00 32.00 16.50 2.50 0.00 0.00 5.50 3.30 62.50 0.00 0.00 42.00 0.00
Gujarat 164 0.00 0.00 1,111.60 294.00 79.50 380.00 0.00 98.00 58.80 1,987.50 0.00 247.00 1,324.00 0.00
Haryana 80 0.00 967.50 555.20 120.00 38.70 0.00 0.00 40.00 24.00 967.50 0.00 0.00 774.00 0.00
Himachal Pradesh 83 0.00 0.00 288.80 145.50 23.10 0.00 0.00 48.50 29.10 577.50 69.30 0.00 384.00 0.00
Jammu and Kashmir 94 0.00 0.00 163.20 141.00 17.90 0.00 60.00 47.00 28.20 280.00 0.00 0.00 224.00 0.00
Jharkhand 137 15.00 17.50 990.40 243.00 70.00 10.00 0.80 81.00 48.60 1,750.00 2.10 6.50 1,168.00 0.00
Karnataka 132 0.00 0.00 969.20 237.00 68.40 0.00 0.00 79.00 47.40 1,710.00 0.00 0.00 1,140.00 0.00
Kerala 71 0.00 0.00 469.20 127.50 33.50 0.00 0.00 42.50 25.50 837.50 0.00 0.00 560.00 0.00
Lakshadweep 5 0.00 0.00 14.40 9.00 1.20 0.00 0.00 3.00 1.80 30.00 0.00 0.00 20.00 5.00
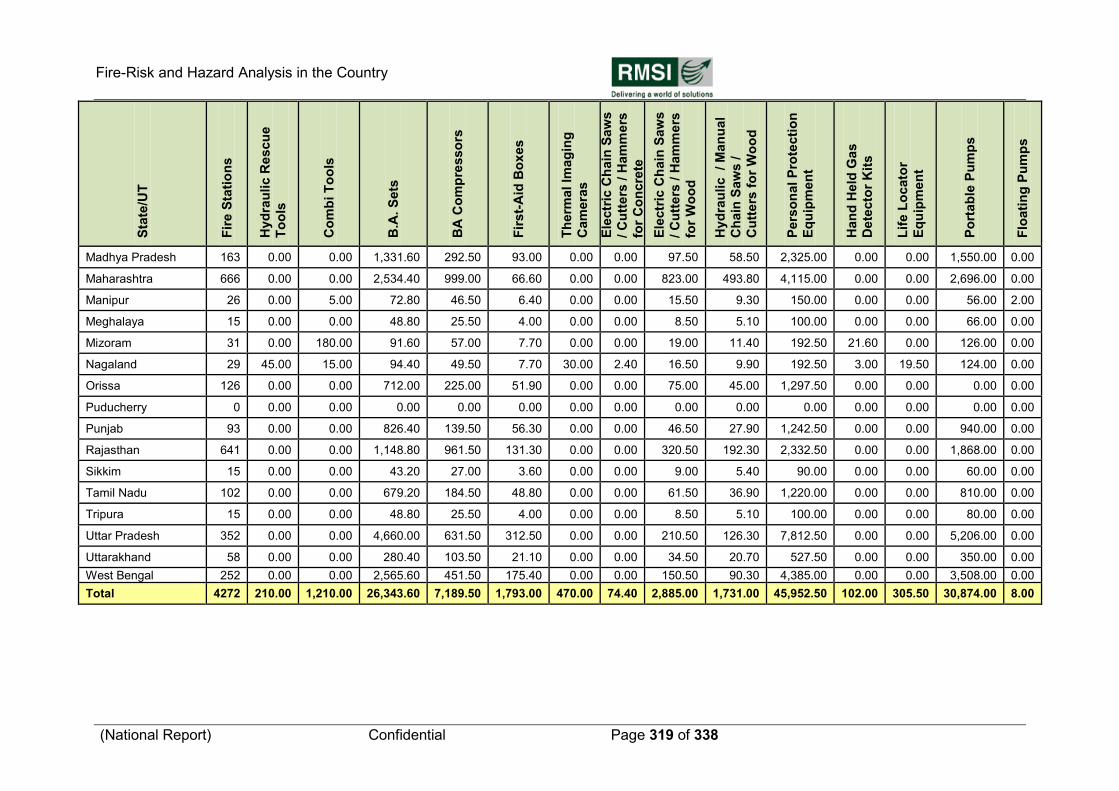
Fire-Risk and Hazard Analysis in the Country
(National Report) Confidential Page 319 of 338
Sta
te/U
T
Fir
e S
tati
on
s
Hyd
rau
lic R
escu
e
To
ols
Co
mb
i T
oo
ls
B.A
. S
ets
BA
Co
mp
resso
rs
Fir
st-
Aid
Bo
xes
Th
erm
al
Imag
ing
Cam
era
s
Ele
ctr
ic C
hain
Saw
s
/ C
utt
ers
/ H
am
mers
for
Co
ncre
te
Ele
ctr
ic C
hain
Saw
s
/ C
utt
ers
/ H
am
mers
for
Wo
od
Hyd
rau
lic /
Man
ual
Ch
ain
Saw
s /
Cu
tters
fo
r W
oo
d
Pers
on
al
Pro
tecti
on
Eq
uip
men
t
Han
d H
eld
Ga
s
Dete
cto
r K
its
Lif
e L
ocato
r
Eq
uip
men
t
Po
rtab
le P
um
ps
Flo
ati
ng
Pu
mp
s
Madhya Pradesh 163 0.00 0.00 1,331.60 292.50 93.00 0.00 0.00 97.50 58.50 2,325.00 0.00 0.00 1,550.00 0.00
Maharashtra 666 0.00 0.00 2,534.40 999.00 66.60 0.00 0.00 823.00 493.80 4,115.00 0.00 0.00 2,696.00 0.00
Manipur 26 0.00 5.00 72.80 46.50 6.40 0.00 0.00 15.50 9.30 150.00 0.00 0.00 56.00 2.00
Meghalaya 15 0.00 0.00 48.80 25.50 4.00 0.00 0.00 8.50 5.10 100.00 0.00 0.00 66.00 0.00
Mizoram 31 0.00 180.00 91.60 57.00 7.70 0.00 0.00 19.00 11.40 192.50 21.60 0.00 126.00 0.00
Nagaland 29 45.00 15.00 94.40 49.50 7.70 30.00 2.40 16.50 9.90 192.50 3.00 19.50 124.00 0.00
Orissa 126 0.00 0.00 712.00 225.00 51.90 0.00 0.00 75.00 45.00 1,297.50 0.00 0.00 0.00 0.00
Puducherry 0 0.00 0.00 0.00 0.00 0.00 0.00 0.00 0.00 0.00 0.00 0.00 0.00 0.00 0.00
Punjab 93 0.00 0.00 826.40 139.50 56.30 0.00 0.00 46.50 27.90 1,242.50 0.00 0.00 940.00 0.00
Rajasthan 641 0.00 0.00 1,148.80 961.50 131.30 0.00 0.00 320.50 192.30 2,332.50 0.00 0.00 1,868.00 0.00
Sikkim 15 0.00 0.00 43.20 27.00 3.60 0.00 0.00 9.00 5.40 90.00 0.00 0.00 60.00 0.00
Tamil Nadu 102 0.00 0.00 679.20 184.50 48.80 0.00 0.00 61.50 36.90 1,220.00 0.00 0.00 810.00 0.00
Tripura 15 0.00 0.00 48.80 25.50 4.00 0.00 0.00 8.50 5.10 100.00 0.00 0.00 80.00 0.00
Uttar Pradesh 352 0.00 0.00 4,660.00 631.50 312.50 0.00 0.00 210.50 126.30 7,812.50 0.00 0.00 5,206.00 0.00
Uttarakhand 58 0.00 0.00 280.40 103.50 21.10 0.00 0.00 34.50 20.70 527.50 0.00 0.00 350.00 0.00
West Bengal 252 0.00 0.00 2,565.60 451.50 175.40 0.00 0.00 150.50 90.30 4,385.00 0.00 0.00 3,508.00 0.00
Total 4272 210.00 1,210.00 26,343.60 7,189.50 1,793.00 470.00 74.40 2,885.00 1,731.00 45,952.50 102.00 305.50 30,874.00 8.00
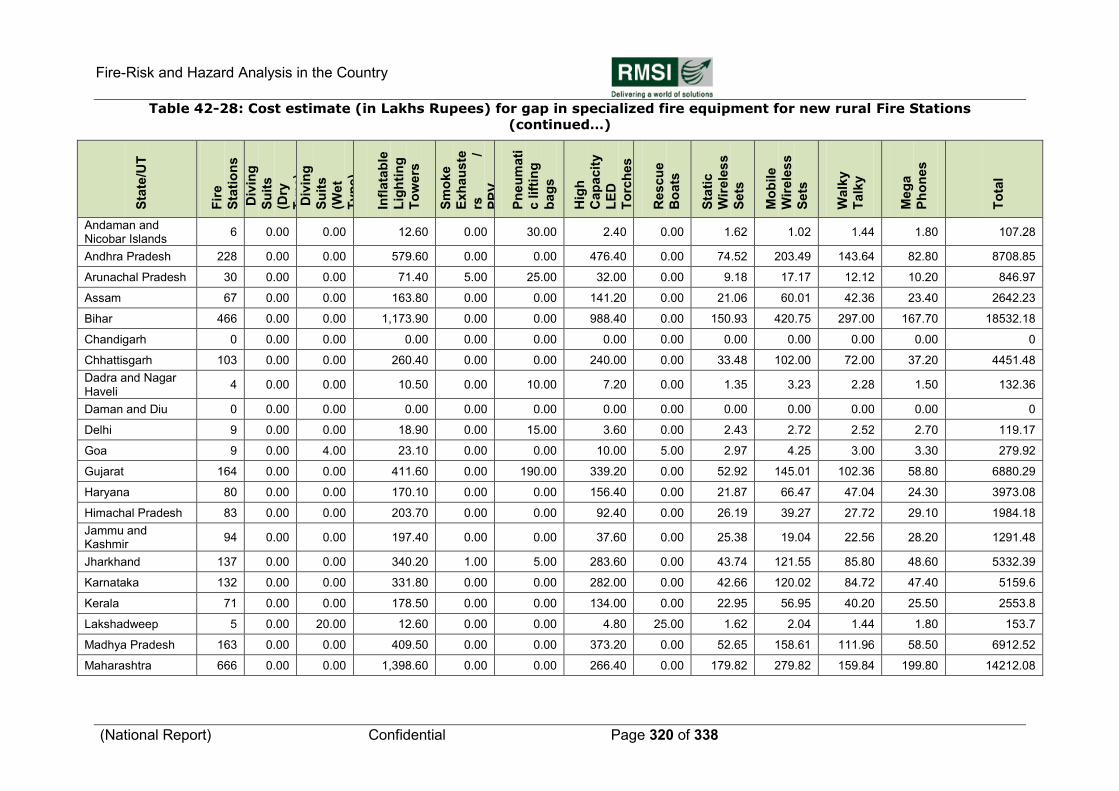
Fire-Risk and Hazard Analysis in the Country
(National Report) Confidential Page 320 of 338
Table 42-28: Cost estimate (in Lakhs Rupees) for gap in specialized fire equipment for new rural Fire Stations
(continued…) S
tate
/UT
Fir
e
Sta
tio
ns
Div
ing
Su
its
(Dry
Typ
e)
Div
ing
Su
its
(Wet
Typ
e)
Infl
ata
ble
Lig
hti
ng
To
wers
Sm
oke
Exh
au
ste
rs
/
PP
V
Pn
eu
mati
c lif
tin
g
bag
s
Hig
h
Cap
acit
y
LE
D
To
rch
es
Rescu
e
Bo
ats
Sta
tic
Wir
ele
ss
Sets
Mo
bile
Wir
ele
ss
Sets
Walk
y
Talk
y
Meg
a
Ph
on
es
To
tal
Andaman and Nicobar Islands
6 0.00 0.00 12.60 0.00 30.00 2.40 0.00 1.62 1.02 1.44 1.80 107.28
Andhra Pradesh 228 0.00 0.00 579.60 0.00 0.00 476.40 0.00 74.52 203.49 143.64 82.80 8708.85
Arunachal Pradesh 30 0.00 0.00 71.40 5.00 25.00 32.00 0.00 9.18 17.17 12.12 10.20 846.97
Assam 67 0.00 0.00 163.80 0.00 0.00 141.20 0.00 21.06 60.01 42.36 23.40 2642.23
Bihar 466 0.00 0.00 1,173.90 0.00 0.00 988.40 0.00 150.93 420.75 297.00 167.70 18532.18
Chandigarh 0 0.00 0.00 0.00 0.00 0.00 0.00 0.00 0.00 0.00 0.00 0.00 0
Chhattisgarh 103 0.00 0.00 260.40 0.00 0.00 240.00 0.00 33.48 102.00 72.00 37.20 4451.48
Dadra and Nagar Haveli
4 0.00 0.00 10.50 0.00 10.00 7.20 0.00 1.35 3.23 2.28 1.50 132.36
Daman and Diu 0 0.00 0.00 0.00 0.00 0.00 0.00 0.00 0.00 0.00 0.00 0.00 0
Delhi 9 0.00 0.00 18.90 0.00 15.00 3.60 0.00 2.43 2.72 2.52 2.70 119.17
Goa 9 0.00 4.00 23.10 0.00 0.00 10.00 5.00 2.97 4.25 3.00 3.30 279.92
Gujarat 164 0.00 0.00 411.60 0.00 190.00 339.20 0.00 52.92 145.01 102.36 58.80 6880.29
Haryana 80 0.00 0.00 170.10 0.00 0.00 156.40 0.00 21.87 66.47 47.04 24.30 3973.08
Himachal Pradesh 83 0.00 0.00 203.70 0.00 0.00 92.40 0.00 26.19 39.27 27.72 29.10 1984.18
Jammu and Kashmir
94 0.00 0.00 197.40 0.00 0.00 37.60 0.00 25.38 19.04 22.56 28.20 1291.48
Jharkhand 137 0.00 0.00 340.20 1.00 5.00 283.60 0.00 43.74 121.55 85.80 48.60 5332.39
Karnataka 132 0.00 0.00 331.80 0.00 0.00 282.00 0.00 42.66 120.02 84.72 47.40 5159.6
Kerala 71 0.00 0.00 178.50 0.00 0.00 134.00 0.00 22.95 56.95 40.20 25.50 2553.8
Lakshadweep 5 0.00 20.00 12.60 0.00 0.00 4.80 25.00 1.62 2.04 1.44 1.80 153.7
Madhya Pradesh 163 0.00 0.00 409.50 0.00 0.00 373.20 0.00 52.65 158.61 111.96 58.50 6912.52
Maharashtra 666 0.00 0.00 1,398.60 0.00 0.00 266.40 0.00 179.82 279.82 159.84 199.80 14212.08
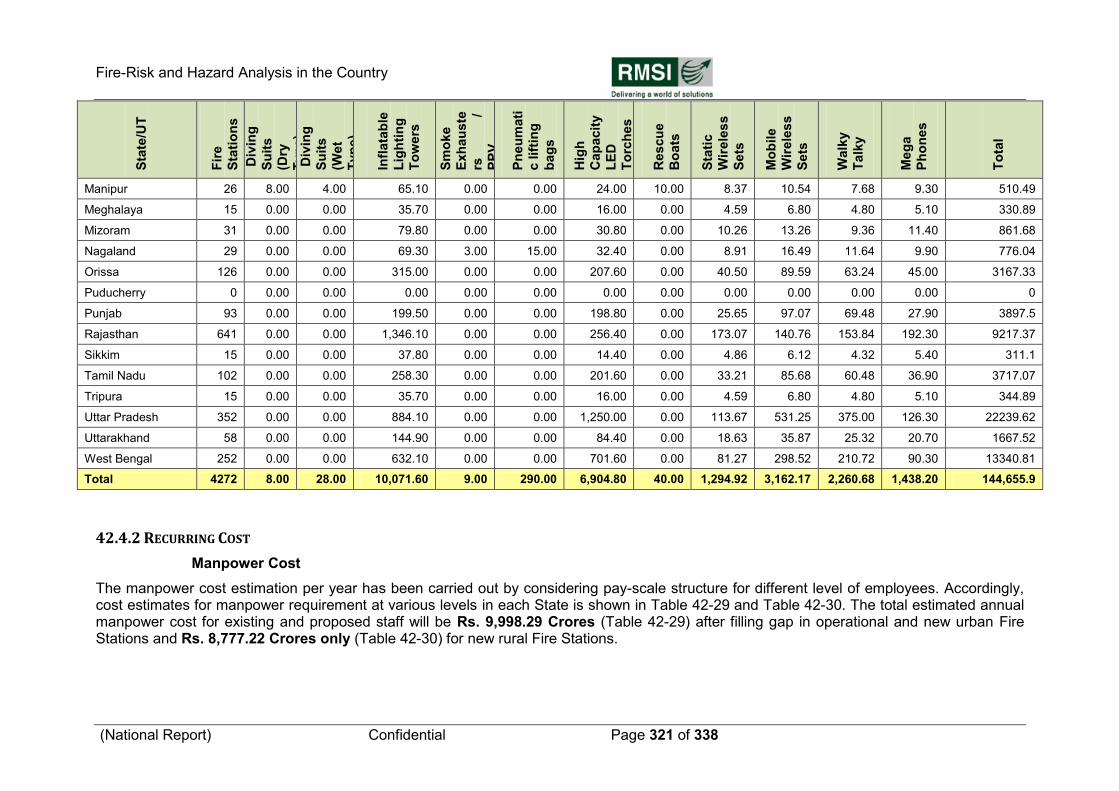
Fire-Risk and Hazard Analysis in the Country
(National Report) Confidential Page 321 of 338
Sta
te/U
T
Fir
e
Sta
tio
ns
Div
ing
Su
its
(Dry
Typ
e)
Div
ing
Su
its
(Wet
Typ
e)
Infl
ata
ble
Lig
hti
ng
To
wers
Sm
oke
Exh
au
ste
rs
/
PP
V
Pn
eu
mati
c lif
tin
g
bag
s
Hig
h
Cap
acit
y
LE
D
To
rch
es
Rescu
e
Bo
ats
Sta
tic
Wir
ele
ss
Sets
Mo
bile
Wir
ele
ss
Sets
Walk
y
Talk
y
Meg
a
Ph
on
es
To
tal
Manipur 26 8.00 4.00 65.10 0.00 0.00 24.00 10.00 8.37 10.54 7.68 9.30 510.49
Meghalaya 15 0.00 0.00 35.70 0.00 0.00 16.00 0.00 4.59 6.80 4.80 5.10 330.89
Mizoram 31 0.00 0.00 79.80 0.00 0.00 30.80 0.00 10.26 13.26 9.36 11.40 861.68
Nagaland 29 0.00 0.00 69.30 3.00 15.00 32.40 0.00 8.91 16.49 11.64 9.90 776.04
Orissa 126 0.00 0.00 315.00 0.00 0.00 207.60 0.00 40.50 89.59 63.24 45.00 3167.33
Puducherry 0 0.00 0.00 0.00 0.00 0.00 0.00 0.00 0.00 0.00 0.00 0.00 0
Punjab 93 0.00 0.00 199.50 0.00 0.00 198.80 0.00 25.65 97.07 69.48 27.90 3897.5
Rajasthan 641 0.00 0.00 1,346.10 0.00 0.00 256.40 0.00 173.07 140.76 153.84 192.30 9217.37
Sikkim 15 0.00 0.00 37.80 0.00 0.00 14.40 0.00 4.86 6.12 4.32 5.40 311.1
Tamil Nadu 102 0.00 0.00 258.30 0.00 0.00 201.60 0.00 33.21 85.68 60.48 36.90 3717.07
Tripura 15 0.00 0.00 35.70 0.00 0.00 16.00 0.00 4.59 6.80 4.80 5.10 344.89
Uttar Pradesh 352 0.00 0.00 884.10 0.00 0.00 1,250.00 0.00 113.67 531.25 375.00 126.30 22239.62
Uttarakhand 58 0.00 0.00 144.90 0.00 0.00 84.40 0.00 18.63 35.87 25.32 20.70 1667.52
West Bengal 252 0.00 0.00 632.10 0.00 0.00 701.60 0.00 81.27 298.52 210.72 90.30 13340.81
Total 4272 8.00 28.00 10,071.60 9.00 290.00 6,904.80 40.00 1,294.92 3,162.17 2,260.68 1,438.20 144,655.9
42.4.2 RECURRING COST
Manpower Cost
The manpower cost estimation per year has been carried out by considering pay-scale structure for different level of employees. Accordingly, cost estimates for manpower requirement at various levels in each State is shown in Table 42-29 and Table 42-30. The total estimated annual manpower cost for existing and proposed staff will be Rs. 9,998.29 Crores (Table 42-29) after filling gap in operational and new urban Fire Stations and Rs. 8,777.22 Crores only (Table 42-30) for new rural Fire Stations.
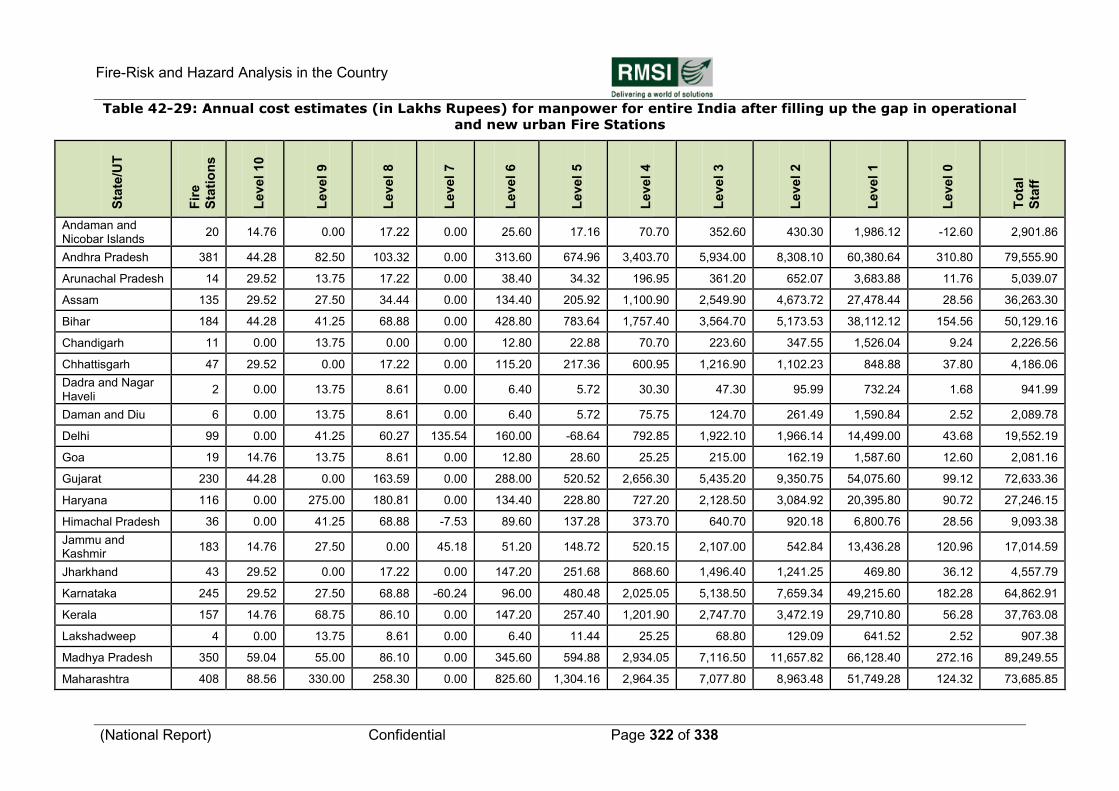
Fire-Risk and Hazard Analysis in the Country
(National Report) Confidential Page 322 of 338
Table 42-29: Annual cost estimates (in Lakhs Rupees) for manpower for entire India after filling up the gap in operational
and new urban Fire Stations S
tate
/UT
Fir
e
Sta
tio
ns
Level
10
Level
9
Level
8
Level
7
Level
6
Level
5
Level
4
Level
3
Level
2
Level
1
Level
0
To
tal
Sta
ff
Andaman and Nicobar Islands
20 14.76 0.00 17.22 0.00 25.60 17.16 70.70 352.60 430.30 1,986.12 -12.60 2,901.86
Andhra Pradesh 381 44.28 82.50 103.32 0.00 313.60 674.96 3,403.70 5,934.00 8,308.10 60,380.64 310.80 79,555.90
Arunachal Pradesh 14 29.52 13.75 17.22 0.00 38.40 34.32 196.95 361.20 652.07 3,683.88 11.76 5,039.07
Assam 135 29.52 27.50 34.44 0.00 134.40 205.92 1,100.90 2,549.90 4,673.72 27,478.44 28.56 36,263.30
Bihar 184 44.28 41.25 68.88 0.00 428.80 783.64 1,757.40 3,564.70 5,173.53 38,112.12 154.56 50,129.16
Chandigarh 11 0.00 13.75 0.00 0.00 12.80 22.88 70.70 223.60 347.55 1,526.04 9.24 2,226.56
Chhattisgarh 47 29.52 0.00 17.22 0.00 115.20 217.36 600.95 1,216.90 1,102.23 848.88 37.80 4,186.06
Dadra and Nagar Haveli
2 0.00 13.75 8.61 0.00 6.40 5.72 30.30 47.30 95.99 732.24 1.68 941.99
Daman and Diu 6 0.00 13.75 8.61 0.00 6.40 5.72 75.75 124.70 261.49 1,590.84 2.52 2,089.78
Delhi 99 0.00 41.25 60.27 135.54 160.00 -68.64 792.85 1,922.10 1,966.14 14,499.00 43.68 19,552.19
Goa 19 14.76 13.75 8.61 0.00 12.80 28.60 25.25 215.00 162.19 1,587.60 12.60 2,081.16
Gujarat 230 44.28 0.00 163.59 0.00 288.00 520.52 2,656.30 5,435.20 9,350.75 54,075.60 99.12 72,633.36
Haryana 116 0.00 275.00 180.81 0.00 134.40 228.80 727.20 2,128.50 3,084.92 20,395.80 90.72 27,246.15
Himachal Pradesh 36 0.00 41.25 68.88 -7.53 89.60 137.28 373.70 640.70 920.18 6,800.76 28.56 9,093.38
Jammu and Kashmir
183 14.76 27.50 0.00 45.18 51.20 148.72 520.15 2,107.00 542.84 13,436.28 120.96 17,014.59
Jharkhand 43 29.52 0.00 17.22 0.00 147.20 251.68 868.60 1,496.40 1,241.25 469.80 36.12 4,557.79
Karnataka 245 29.52 27.50 68.88 -60.24 96.00 480.48 2,025.05 5,138.50 7,659.34 49,215.60 182.28 64,862.91
Kerala 157 14.76 68.75 86.10 0.00 147.20 257.40 1,201.90 2,747.70 3,472.19 29,710.80 56.28 37,763.08
Lakshadweep 4 0.00 13.75 8.61 0.00 6.40 11.44 25.25 68.80 129.09 641.52 2.52 907.38
Madhya Pradesh 350 59.04 55.00 86.10 0.00 345.60 594.88 2,934.05 7,116.50 11,657.82 66,128.40 272.16 89,249.55
Maharashtra 408 88.56 330.00 258.30 0.00 825.60 1,304.16 2,964.35 7,077.80 8,963.48 51,749.28 124.32 73,685.85
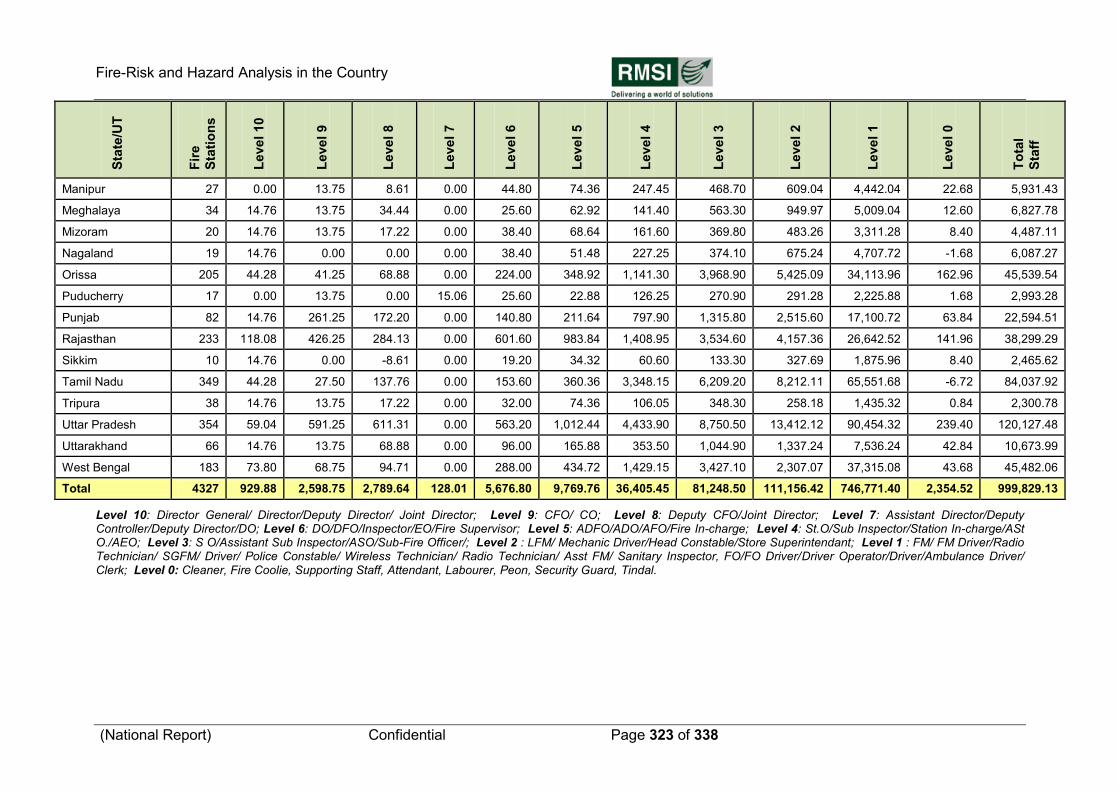
Fire-Risk and Hazard Analysis in the Country
(National Report) Confidential Page 323 of 338
Sta
te/U
T
Fir
e
Sta
tio
ns
Level
10
Level
9
Level
8
Level
7
Level
6
Level
5
Level
4
Level
3
Level
2
Level
1
Level
0
To
tal
Sta
ff
Manipur 27 0.00 13.75 8.61 0.00 44.80 74.36 247.45 468.70 609.04 4,442.04 22.68 5,931.43
Meghalaya 34 14.76 13.75 34.44 0.00 25.60 62.92 141.40 563.30 949.97 5,009.04 12.60 6,827.78
Mizoram 20 14.76 13.75 17.22 0.00 38.40 68.64 161.60 369.80 483.26 3,311.28 8.40 4,487.11
Nagaland 19 14.76 0.00 0.00 0.00 38.40 51.48 227.25 374.10 675.24 4,707.72 -1.68 6,087.27
Orissa 205 44.28 41.25 68.88 0.00 224.00 348.92 1,141.30 3,968.90 5,425.09 34,113.96 162.96 45,539.54
Puducherry 17 0.00 13.75 0.00 15.06 25.60 22.88 126.25 270.90 291.28 2,225.88 1.68 2,993.28
Punjab 82 14.76 261.25 172.20 0.00 140.80 211.64 797.90 1,315.80 2,515.60 17,100.72 63.84 22,594.51
Rajasthan 233 118.08 426.25 284.13 0.00 601.60 983.84 1,408.95 3,534.60 4,157.36 26,642.52 141.96 38,299.29
Sikkim 10 14.76 0.00 -8.61 0.00 19.20 34.32 60.60 133.30 327.69 1,875.96 8.40 2,465.62
Tamil Nadu 349 44.28 27.50 137.76 0.00 153.60 360.36 3,348.15 6,209.20 8,212.11 65,551.68 -6.72 84,037.92
Tripura 38 14.76 13.75 17.22 0.00 32.00 74.36 106.05 348.30 258.18 1,435.32 0.84 2,300.78
Uttar Pradesh 354 59.04 591.25 611.31 0.00 563.20 1,012.44 4,433.90 8,750.50 13,412.12 90,454.32 239.40 120,127.48
Uttarakhand 66 14.76 13.75 68.88 0.00 96.00 165.88 353.50 1,044.90 1,337.24 7,536.24 42.84 10,673.99
West Bengal 183 73.80 68.75 94.71 0.00 288.00 434.72 1,429.15 3,427.10 2,307.07 37,315.08 43.68 45,482.06
Total 4327 929.88 2,598.75 2,789.64 128.01 5,676.80 9,769.76 36,405.45 81,248.50 111,156.42 746,771.40 2,354.52 999,829.13
Level 10: Director General/ Director/Deputy Director/ Joint Director; Level 9: CFO/ CO; Level 8: Deputy CFO/Joint Director; Level 7: Assistant Director/Deputy Controller/Deputy Director/DO; Level 6: DO/DFO/Inspector/EO/Fire Supervisor; Level 5: ADFO/ADO/AFO/Fire In-charge; Level 4: St.O/Sub Inspector/Station In-charge/ASt O./AEO; Level 3: S O/Assistant Sub Inspector/ASO/Sub-Fire Officer/; Level 2 : LFM/ Mechanic Driver/Head Constable/Store Superintendant; Level 1 : FM/ FM Driver/Radio Technician/ SGFM/ Driver/ Police Constable/ Wireless Technician/ Radio Technician/ Asst FM/ Sanitary Inspector, FO/FO Driver/Driver Operator/Driver/Ambulance Driver/ Clerk; Level 0: Cleaner, Fire Coolie, Supporting Staff, Attendant, Labourer, Peon, Security Guard, Tindal.
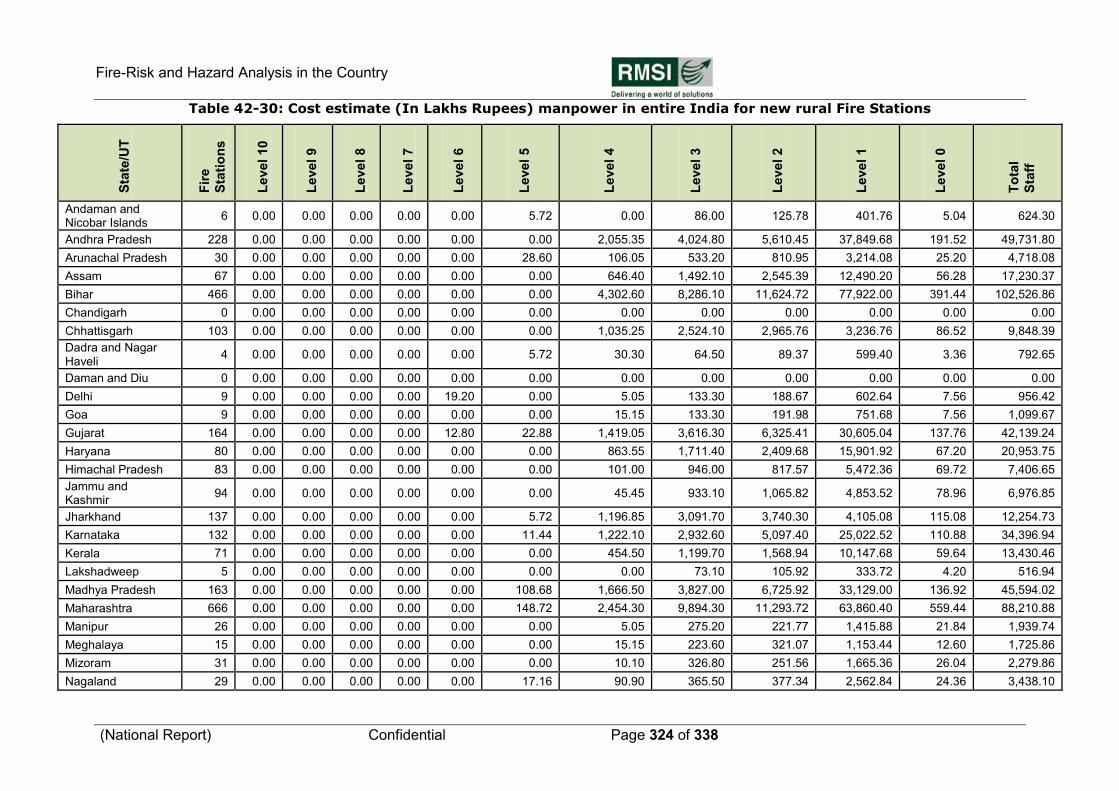
Fire-Risk and Hazard Analysis in the Country
(National Report) Confidential Page 324 of 338
Table 42-30: Cost estimate (In Lakhs Rupees) manpower in entire India for new rural Fire Stations S
tate
/UT
Fir
e
Sta
tio
ns
Level
10
Level
9
Level
8
Level
7
Level
6
Level
5
Level
4
Level
3
Level
2
Level
1
Level
0
To
tal
Sta
ff
Andaman and Nicobar Islands
6 0.00 0.00 0.00 0.00 0.00 5.72 0.00 86.00 125.78 401.76 5.04 624.30
Andhra Pradesh 228 0.00 0.00 0.00 0.00 0.00 0.00 2,055.35 4,024.80 5,610.45 37,849.68 191.52 49,731.80
Arunachal Pradesh 30 0.00 0.00 0.00 0.00 0.00 28.60 106.05 533.20 810.95 3,214.08 25.20 4,718.08
Assam 67 0.00 0.00 0.00 0.00 0.00 0.00 646.40 1,492.10 2,545.39 12,490.20 56.28 17,230.37
Bihar 466 0.00 0.00 0.00 0.00 0.00 0.00 4,302.60 8,286.10 11,624.72 77,922.00 391.44 102,526.86
Chandigarh 0 0.00 0.00 0.00 0.00 0.00 0.00 0.00 0.00 0.00 0.00 0.00 0.00
Chhattisgarh 103 0.00 0.00 0.00 0.00 0.00 0.00 1,035.25 2,524.10 2,965.76 3,236.76 86.52 9,848.39
Dadra and Nagar Haveli
4 0.00 0.00 0.00 0.00 0.00 5.72 30.30 64.50 89.37 599.40 3.36 792.65
Daman and Diu 0 0.00 0.00 0.00 0.00 0.00 0.00 0.00 0.00 0.00 0.00 0.00 0.00
Delhi 9 0.00 0.00 0.00 0.00 19.20 0.00 5.05 133.30 188.67 602.64 7.56 956.42
Goa 9 0.00 0.00 0.00 0.00 0.00 0.00 15.15 133.30 191.98 751.68 7.56 1,099.67
Gujarat 164 0.00 0.00 0.00 0.00 12.80 22.88 1,419.05 3,616.30 6,325.41 30,605.04 137.76 42,139.24
Haryana 80 0.00 0.00 0.00 0.00 0.00 0.00 863.55 1,711.40 2,409.68 15,901.92 67.20 20,953.75
Himachal Pradesh 83 0.00 0.00 0.00 0.00 0.00 0.00 101.00 946.00 817.57 5,472.36 69.72 7,406.65
Jammu and Kashmir
94 0.00 0.00 0.00 0.00 0.00 0.00 45.45 933.10 1,065.82 4,853.52 78.96 6,976.85
Jharkhand 137 0.00 0.00 0.00 0.00 0.00 5.72 1,196.85 3,091.70 3,740.30 4,105.08 115.08 12,254.73
Karnataka 132 0.00 0.00 0.00 0.00 0.00 11.44 1,222.10 2,932.60 5,097.40 25,022.52 110.88 34,396.94
Kerala 71 0.00 0.00 0.00 0.00 0.00 0.00 454.50 1,199.70 1,568.94 10,147.68 59.64 13,430.46
Lakshadweep 5 0.00 0.00 0.00 0.00 0.00 0.00 0.00 73.10 105.92 333.72 4.20 516.94
Madhya Pradesh 163 0.00 0.00 0.00 0.00 0.00 108.68 1,666.50 3,827.00 6,725.92 33,129.00 136.92 45,594.02
Maharashtra 666 0.00 0.00 0.00 0.00 0.00 148.72 2,454.30 9,894.30 11,293.72 63,860.40 559.44 88,210.88
Manipur 26 0.00 0.00 0.00 0.00 0.00 0.00 5.05 275.20 221.77 1,415.88 21.84 1,939.74
Meghalaya 15 0.00 0.00 0.00 0.00 0.00 0.00 15.15 223.60 321.07 1,153.44 12.60 1,725.86
Mizoram 31 0.00 0.00 0.00 0.00 0.00 0.00 10.10 326.80 251.56 1,665.36 26.04 2,279.86
Nagaland 29 0.00 0.00 0.00 0.00 0.00 17.16 90.90 365.50 377.34 2,562.84 24.36 3,438.10
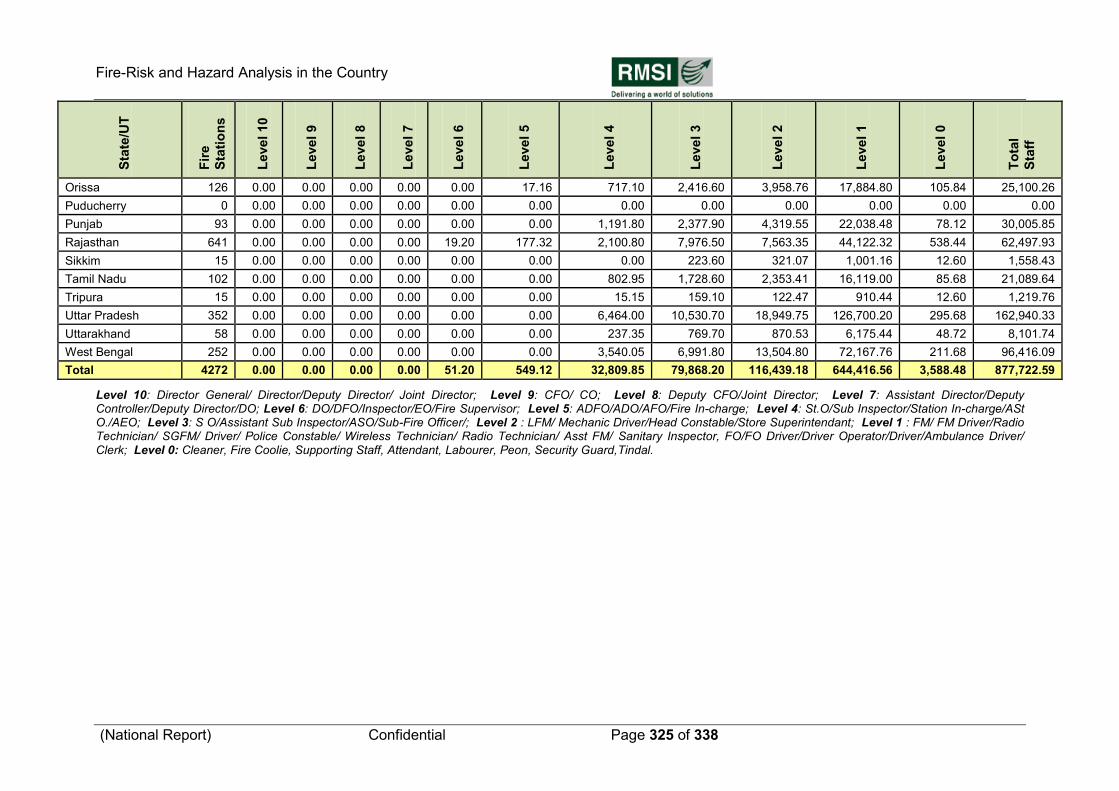
Fire-Risk and Hazard Analysis in the Country
(National Report) Confidential Page 325 of 338
Sta
te/U
T
Fir
e
Sta
tio
ns
Level
10
Level
9
Level
8
Level
7
Level
6
Level
5
Level
4
Level
3
Level
2
Level
1
Level
0
To
tal
Sta
ff
Orissa 126 0.00 0.00 0.00 0.00 0.00 17.16 717.10 2,416.60 3,958.76 17,884.80 105.84 25,100.26
Puducherry 0 0.00 0.00 0.00 0.00 0.00 0.00 0.00 0.00 0.00 0.00 0.00 0.00
Punjab 93 0.00 0.00 0.00 0.00 0.00 0.00 1,191.80 2,377.90 4,319.55 22,038.48 78.12 30,005.85
Rajasthan 641 0.00 0.00 0.00 0.00 19.20 177.32 2,100.80 7,976.50 7,563.35 44,122.32 538.44 62,497.93
Sikkim 15 0.00 0.00 0.00 0.00 0.00 0.00 0.00 223.60 321.07 1,001.16 12.60 1,558.43
Tamil Nadu 102 0.00 0.00 0.00 0.00 0.00 0.00 802.95 1,728.60 2,353.41 16,119.00 85.68 21,089.64
Tripura 15 0.00 0.00 0.00 0.00 0.00 0.00 15.15 159.10 122.47 910.44 12.60 1,219.76
Uttar Pradesh 352 0.00 0.00 0.00 0.00 0.00 0.00 6,464.00 10,530.70 18,949.75 126,700.20 295.68 162,940.33
Uttarakhand 58 0.00 0.00 0.00 0.00 0.00 0.00 237.35 769.70 870.53 6,175.44 48.72 8,101.74
West Bengal 252 0.00 0.00 0.00 0.00 0.00 0.00 3,540.05 6,991.80 13,504.80 72,167.76 211.68 96,416.09
Total 4272 0.00 0.00 0.00 0.00 51.20 549.12 32,809.85 79,868.20 116,439.18 644,416.56 3,588.48 877,722.59
Level 10: Director General/ Director/Deputy Director/ Joint Director; Level 9: CFO/ CO; Level 8: Deputy CFO/Joint Director; Level 7: Assistant Director/Deputy Controller/Deputy Director/DO; Level 6: DO/DFO/Inspector/EO/Fire Supervisor; Level 5: ADFO/ADO/AFO/Fire In-charge; Level 4: St.O/Sub Inspector/Station In-charge/ASt O./AEO; Level 3: S O/Assistant Sub Inspector/ASO/Sub-Fire Officer/; Level 2 : LFM/ Mechanic Driver/Head Constable/Store Superintendant; Level 1 : FM/ FM Driver/Radio Technician/ SGFM/ Driver/ Police Constable/ Wireless Technician/ Radio Technician/ Asst FM/ Sanitary Inspector, FO/FO Driver/Driver Operator/Driver/Ambulance Driver/ Clerk; Level 0: Cleaner, Fire Coolie, Supporting Staff, Attendant, Labourer, Peon, Security Guard,Tindal.
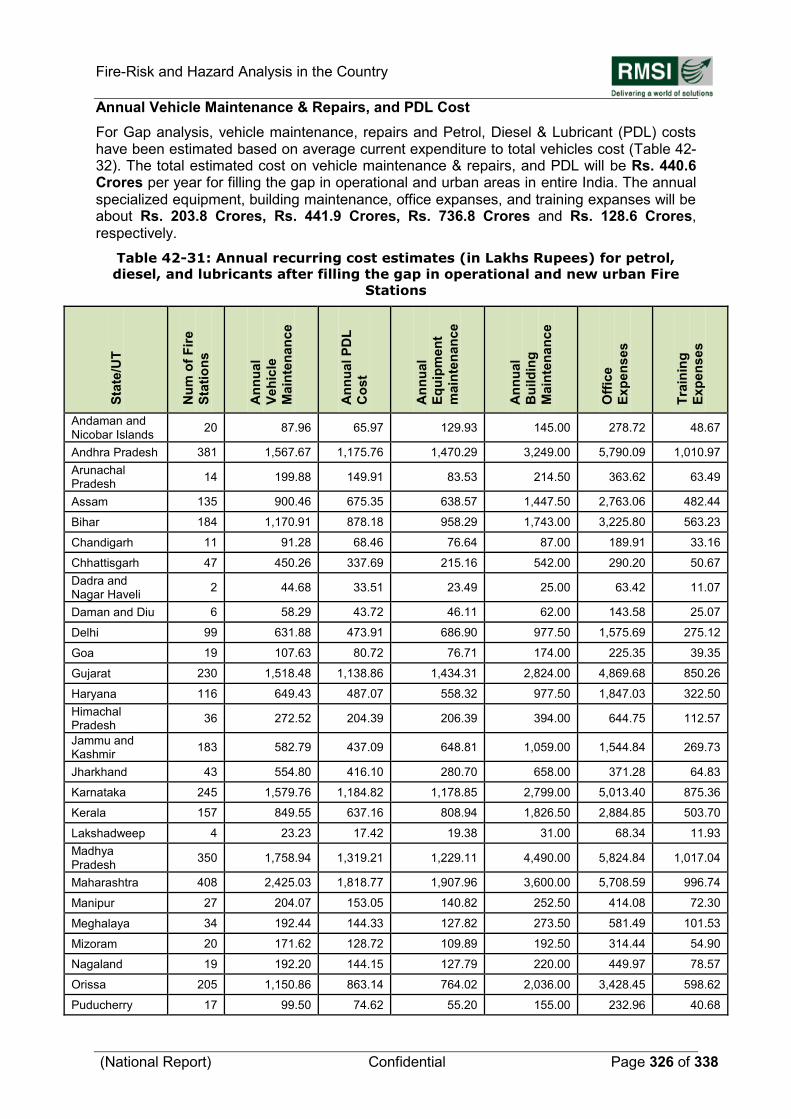
Fire-Risk and Hazard Analysis in the Country
(National Report) Confidential Page 326 of 338
Annual Vehicle Maintenance & Repairs, and PDL Cost
For Gap analysis, vehicle maintenance, repairs and Petrol, Diesel & Lubricant (PDL) costs have been estimated based on average current expenditure to total vehicles cost (Table 42-32). The total estimated cost on vehicle maintenance & repairs, and PDL will be Rs. 440.6 Crores per year for filling the gap in operational and urban areas in entire India. The annual specialized equipment, building maintenance, office expanses, and training expanses will be about Rs. 203.8 Crores, Rs. 441.9 Crores, Rs. 736.8 Crores and Rs. 128.6 Crores, respectively.
Table 42-31: Annual recurring cost estimates (in Lakhs Rupees) for petrol,
diesel, and lubricants after filling the gap in operational and new urban Fire
Stations
Sta
te/U
T
Nu
m o
f F
ire
Sta
tio
ns
An
nu
al
Veh
icle
Main
ten
an
ce
An
nu
al P
DL
Co
st
An
nu
al
Eq
uip
men
t
main
ten
an
ce
An
nu
al
Bu
ild
ing
Main
ten
an
ce
Off
ice
Exp
en
ses
Tra
inin
g
Exp
en
ses
Andaman and Nicobar Islands
20 87.96 65.97 129.93 145.00 278.72 48.67
Andhra Pradesh 381 1,567.67 1,175.76 1,470.29 3,249.00 5,790.09 1,010.97
Arunachal Pradesh
14 199.88 149.91 83.53 214.50 363.62 63.49
Assam 135 900.46 675.35 638.57 1,447.50 2,763.06 482.44
Bihar 184 1,170.91 878.18 958.29 1,743.00 3,225.80 563.23
Chandigarh 11 91.28 68.46 76.64 87.00 189.91 33.16
Chhattisgarh 47 450.26 337.69 215.16 542.00 290.20 50.67
Dadra and Nagar Haveli
2 44.68 33.51 23.49 25.00 63.42 11.07
Daman and Diu 6 58.29 43.72 46.11 62.00 143.58 25.07
Delhi 99 631.88 473.91 686.90 977.50 1,575.69 275.12
Goa 19 107.63 80.72 76.71 174.00 225.35 39.35
Gujarat 230 1,518.48 1,138.86 1,434.31 2,824.00 4,869.68 850.26
Haryana 116 649.43 487.07 558.32 977.50 1,847.03 322.50
Himachal Pradesh
36 272.52 204.39 206.39 394.00 644.75 112.57
Jammu and Kashmir
183 582.79 437.09 648.81 1,059.00 1,544.84 269.73
Jharkhand 43 554.80 416.10 280.70 658.00 371.28 64.83
Karnataka 245 1,579.76 1,184.82 1,178.85 2,799.00 5,013.40 875.36
Kerala 157 849.55 637.16 808.94 1,826.50 2,884.85 503.70
Lakshadweep 4 23.23 17.42 19.38 31.00 68.34 11.93
Madhya Pradesh
350 1,758.94 1,319.21 1,229.11 4,490.00 5,824.84 1,017.04
Maharashtra 408 2,425.03 1,818.77 1,907.96 3,600.00 5,708.59 996.74
Manipur 27 204.07 153.05 140.82 252.50 414.08 72.30
Meghalaya 34 192.44 144.33 127.82 273.50 581.49 101.53
Mizoram 20 171.62 128.72 109.89 192.50 314.44 54.90
Nagaland 19 192.20 144.15 127.79 220.00 449.97 78.57
Orissa 205 1,150.86 863.14 764.02 2,036.00 3,428.45 598.62
Puducherry 17 99.50 74.62 55.20 155.00 232.96 40.68
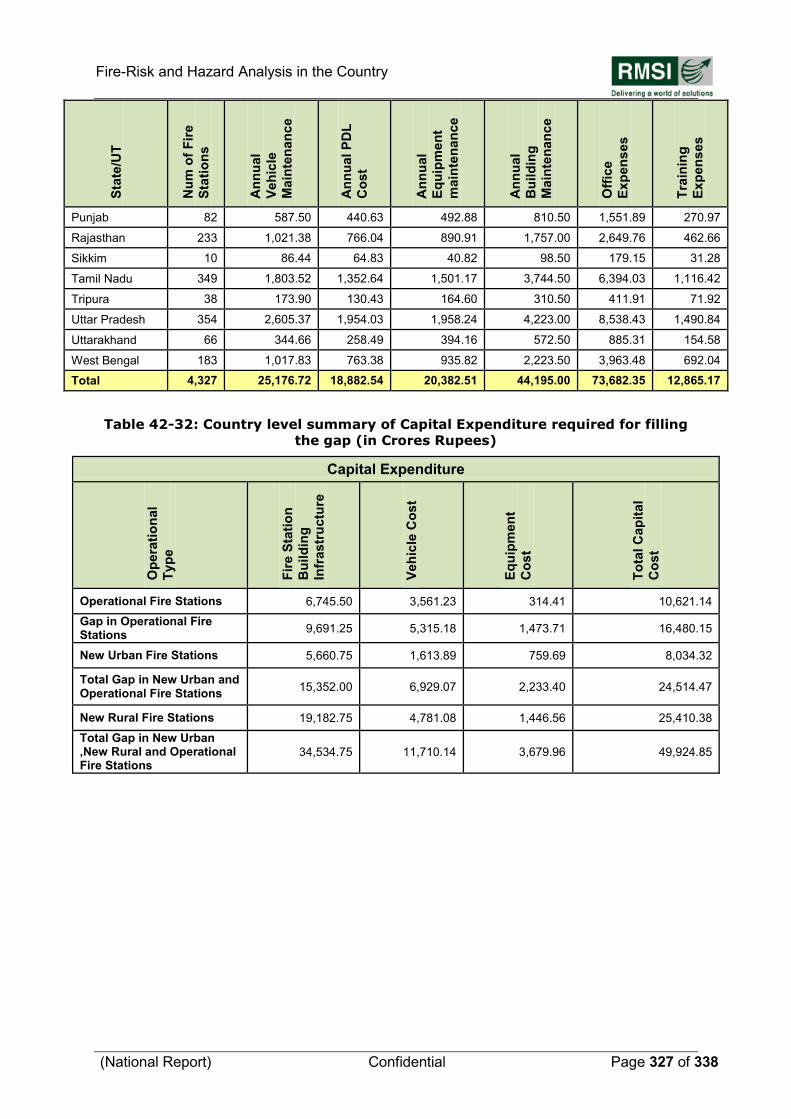
Fire-Risk and Hazard Analysis in the Country
(National Report) Confidential Page 327 of 338
Sta
te/U
T
Nu
m o
f F
ire
Sta
tio
ns
An
nu
al
Veh
icle
Main
ten
an
ce
An
nu
al P
DL
Co
st
An
nu
al
Eq
uip
men
t
main
ten
an
ce
An
nu
al
Bu
ild
ing
Main
ten
an
ce
Off
ice
Exp
en
ses
Tra
inin
g
Exp
en
ses
Punjab 82 587.50 440.63 492.88 810.50 1,551.89 270.97
Rajasthan 233 1,021.38 766.04 890.91 1,757.00 2,649.76 462.66
Sikkim 10 86.44 64.83 40.82 98.50 179.15 31.28
Tamil Nadu 349 1,803.52 1,352.64 1,501.17 3,744.50 6,394.03 1,116.42
Tripura 38 173.90 130.43 164.60 310.50 411.91 71.92
Uttar Pradesh 354 2,605.37 1,954.03 1,958.24 4,223.00 8,538.43 1,490.84
Uttarakhand 66 344.66 258.49 394.16 572.50 885.31 154.58
West Bengal 183 1,017.83 763.38 935.82 2,223.50 3,963.48 692.04
Total 4,327 25,176.72 18,882.54 20,382.51 44,195.00 73,682.35 12,865.17
Table 42-32: Country level summary of Capital Expenditure required for filling
the gap (in Crores Rupees)
Capital Expenditure
Op
era
tio
nal
Typ
e
Fir
e S
tati
on
Bu
ild
ing
Infr
astr
uctu
re
Veh
icle
Co
st
Eq
uip
men
t
Co
st
To
tal C
ap
ital
Co
st
Operational Fire Stations 6,745.50 3,561.23 314.41 10,621.14
Gap in Operational Fire Stations
9,691.25 5,315.18 1,473.71 16,480.15
New Urban Fire Stations 5,660.75 1,613.89 759.69 8,034.32
Total Gap in New Urban and Operational Fire Stations
15,352.00 6,929.07 2,233.40 24,514.47
New Rural Fire Stations 19,182.75 4,781.08 1,446.56 25,410.38
Total Gap in New Urban ,New Rural and Operational Fire Stations
34,534.75 11,710.14 3,679.96 49,924.85
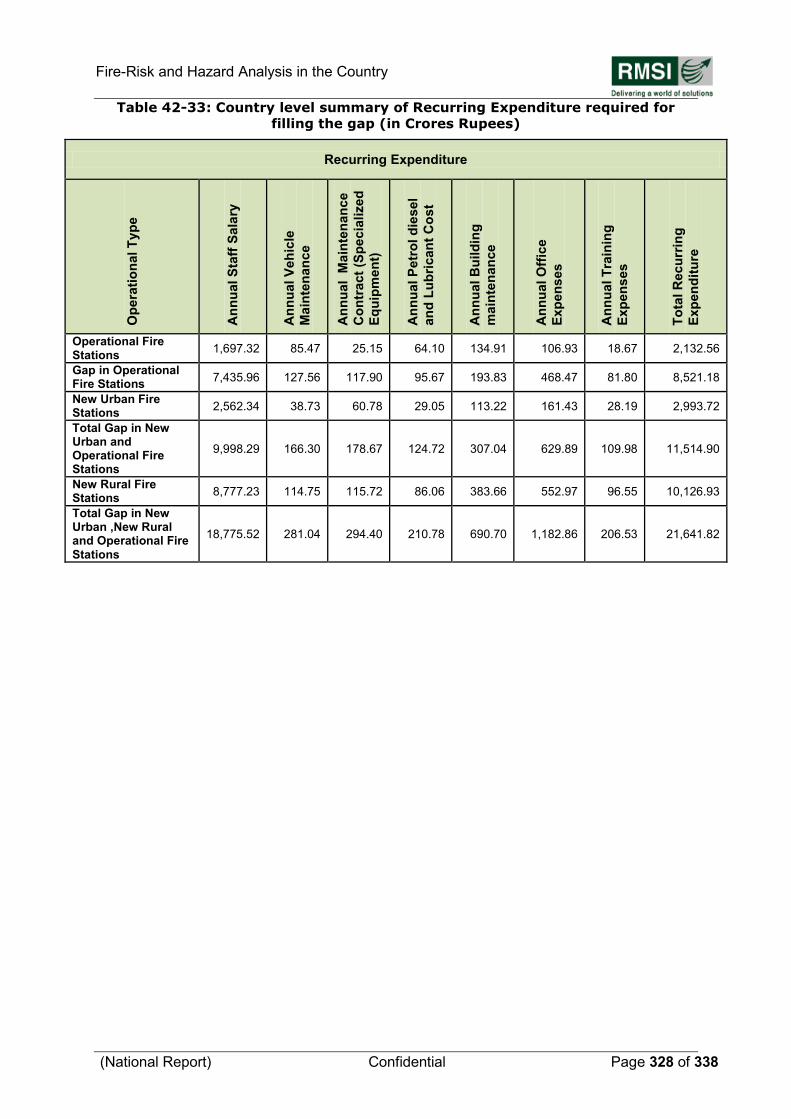
Fire-Risk and Hazard Analysis in the Country
(National Report) Confidential Page 328 of 338
Table 42-33: Country level summary of Recurring Expenditure required for
filling the gap (in Crores Rupees)
Recurring Expenditure
Op
era
tio
nal T
yp
e
An
nu
al S
taff
Sala
ry
An
nu
al V
eh
icle
Main
ten
an
ce
An
nu
al M
ain
ten
an
ce
Co
ntr
act
(Sp
ecia
lized
Eq
uip
men
t)
An
nu
al P
etr
ol d
iesel
an
d L
ub
rican
t C
ost
An
nu
al B
uild
ing
main
ten
an
ce
An
nu
al O
ffic
e
Exp
en
ses
An
nu
al T
rain
ing
Exp
en
ses
To
tal R
ecu
rrin
g
Exp
en
dit
ure
Operational Fire Stations
1,697.32 85.47 25.15 64.10 134.91 106.93 18.67 2,132.56
Gap in Operational Fire Stations
7,435.96 127.56 117.90 95.67 193.83 468.47 81.80 8,521.18
New Urban Fire Stations
2,562.34 38.73 60.78 29.05 113.22 161.43 28.19 2,993.72
Total Gap in New Urban and Operational Fire Stations
9,998.29 166.30 178.67 124.72 307.04 629.89 109.98 11,514.90
New Rural Fire Stations
8,777.23 114.75 115.72 86.06 383.66 552.97 96.55 10,126.93
Total Gap in New Urban ,New Rural and Operational Fire Stations
18,775.52 281.04 294.40 210.78 690.70 1,182.86 206.53 21,641.82
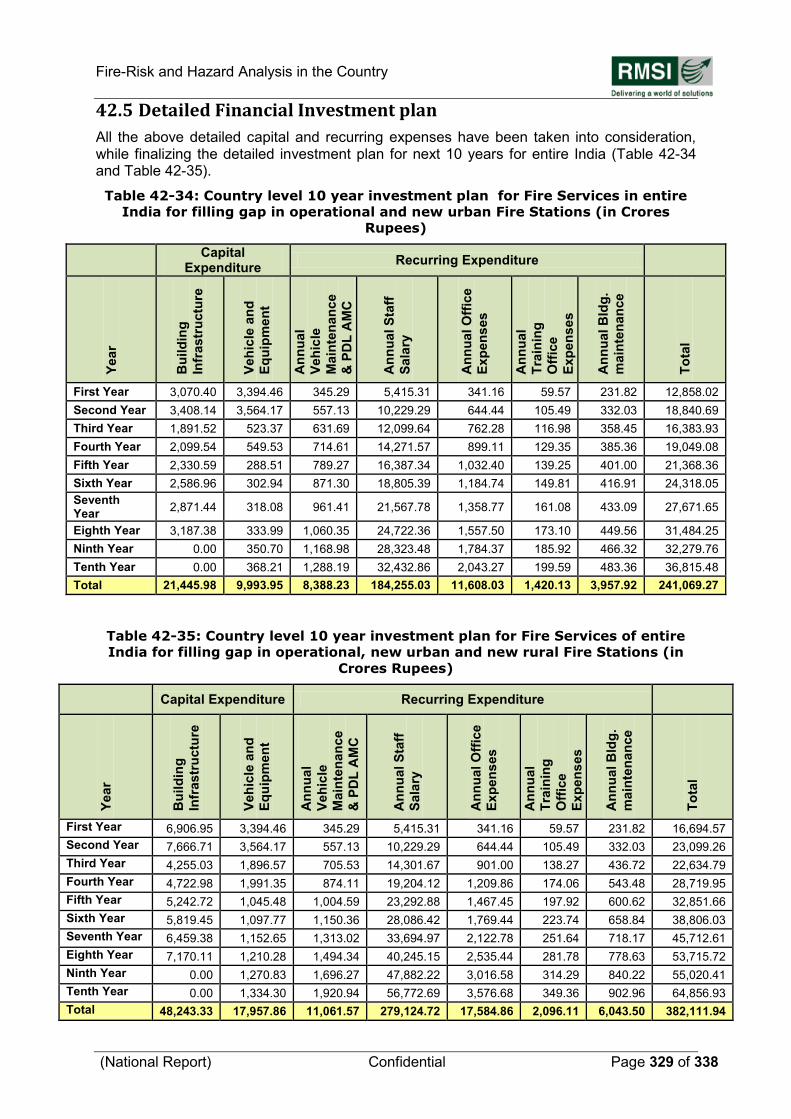
Fire-Risk and Hazard Analysis in the Country
(National Report) Confidential Page 329 of 338
42.5 Detailed Financial Investment plan
All the above detailed capital and recurring expenses have been taken into consideration, while finalizing the detailed investment plan for next 10 years for entire India (Table 42-34 and Table 42-35).
Table 42-34: Country level 10 year investment plan for Fire Services in entire
India for filling gap in operational and new urban Fire Stations (in Crores
Rupees)
Capital
Expenditure Recurring Expenditure
Yea
r
Bu
ild
ing
Infr
astr
uctu
re
Veh
icle
an
d
Eq
uip
men
t
An
nu
al
Veh
icle
Main
ten
an
ce
& P
DL
AM
C
An
nu
al S
taff
Sala
ry
An
nu
al O
ffic
e
Exp
en
ses
An
nu
al
Tra
inin
g
Off
ice
Exp
en
ses
An
nu
al B
ldg
.
main
ten
an
ce
To
tal
First Year 3,070.40 3,394.46 345.29 5,415.31 341.16 59.57 231.82 12,858.02
Second Year 3,408.14 3,564.17 557.13 10,229.29 644.44 105.49 332.03 18,840.69
Third Year 1,891.52 523.37 631.69 12,099.64 762.28 116.98 358.45 16,383.93
Fourth Year 2,099.54 549.53 714.61 14,271.57 899.11 129.35 385.36 19,049.08
Fifth Year 2,330.59 288.51 789.27 16,387.34 1,032.40 139.25 401.00 21,368.36
Sixth Year 2,586.96 302.94 871.30 18,805.39 1,184.74 149.81 416.91 24,318.05
Seventh Year
2,871.44 318.08 961.41 21,567.78 1,358.77 161.08 433.09 27,671.65
Eighth Year 3,187.38 333.99 1,060.35 24,722.36 1,557.50 173.10 449.56 31,484.25
Ninth Year 0.00 350.70 1,168.98 28,323.48 1,784.37 185.92 466.32 32,279.76
Tenth Year 0.00 368.21 1,288.19 32,432.86 2,043.27 199.59 483.36 36,815.48
Total 21,445.98 9,993.95 8,388.23 184,255.03 11,608.03 1,420.13 3,957.92 241,069.27
Table 42-35: Country level 10 year investment plan for Fire Services of entire
India for filling gap in operational, new urban and new rural Fire Stations (in
Crores Rupees)
Capital Expenditure Recurring Expenditure
Yea
r
Bu
ild
ing
Infr
astr
uctu
re
Veh
icle
an
d
Eq
uip
men
t
An
nu
al
Veh
icle
Main
ten
an
ce
& P
DL
AM
C
An
nu
al S
taff
Sala
ry
An
nu
al O
ffic
e
Exp
en
ses
An
nu
al
Tra
inin
g
Off
ice
Exp
en
ses
An
nu
al B
ldg
.
main
ten
an
ce
To
tal
First Year 6,906.95 3,394.46 345.29 5,415.31 341.16 59.57 231.82 16,694.57
Second Year 7,666.71 3,564.17 557.13 10,229.29 644.44 105.49 332.03 23,099.26
Third Year 4,255.03 1,896.57 705.53 14,301.67 901.00 138.27 436.72 22,634.79
Fourth Year 4,722.98 1,991.35 874.11 19,204.12 1,209.86 174.06 543.48 28,719.95
Fifth Year 5,242.72 1,045.48 1,004.59 23,292.88 1,467.45 197.92 600.62 32,851.66
Sixth Year 5,819.45 1,097.77 1,150.36 28,086.42 1,769.44 223.74 658.84 38,806.03
Seventh Year 6,459.38 1,152.65 1,313.02 33,694.97 2,122.78 251.64 718.17 45,712.61
Eighth Year 7,170.11 1,210.28 1,494.34 40,245.15 2,535.44 281.78 778.63 53,715.72
Ninth Year 0.00 1,270.83 1,696.27 47,882.22 3,016.58 314.29 840.22 55,020.41
Tenth Year 0.00 1,334.30 1,920.94 56,772.69 3,576.68 349.36 902.96 64,856.93
Total 48,243.33 17,957.86 11,061.57 279,124.72 17,584.86 2,096.11 6,043.50 382,111.94
Fire-Risk and Hazard Analysis in the Country
(National Report) Confidential Page 330 of 338
42.6 Prioritization of New Fire Stations/Fire Posts
For prioritization of new Fire Stations/Fire Posts, the RMSI team has strictly followed risk categorization and estimated population density in the jurisdiction of new Fire Station/Fire Post as criteria. Accordingly, the priority for establishing new urban Fire Stations and rural Fire Stations/posts has been given in individual State/ UT report submitted by RMSI.
However, It may be noted that actual implementation of priority depends upon a number of factors such as land availability, land possession, tackling any encroachment on available land, getting construction clearances from various authorities for implementation of construction work. Hence, there may be some change in priority of a new Fire Station depending upon the local situation and requirements.
42.7 Avenues of Fund Generation
Fire Services in India can generate new avenues for funds from the followings:
Introduction of Fire Tax (1% of existing property tax)
Introduction of Fire Cess, which can be collected for auditing and inspecting various occupancies for adoption of Fire Safety Measures besides training public manpower for use of first aid firefighting equipment
Training programs at different levels and duration to private sector employee on chargeable basis
Capitation fees can be charged for scrutiny of building plans
Clearance of building plans from fire safety point of view
Sale of condemned fire appliances, equipment, uniform articles and general store items
Fee on deployment of members of Fire Service along-with necessary equipment and appliances beyond the jurisdiction of the State Fire Services
Standby charges on deployment of members of Fire Service along-with equipment and appliances in the area for stand by for a specific duration can be charged except the visits of Government authorities, or in public interest, if demanded by the district administration
Training Charges from the external trainees sponsored by private industries for short and long duration courses.
42.8 Capacity Building and Training Facilities
The Municipal Corporations has framed Recruitment Rules (RR), which are being used for the recruitment. However, there is a need to have uniform RRs for each level at the State level.
Presently, the National Fire Service College (NFSC), Nagpur and other State fire training centres across the country are key institutions involved in improving the level of fire personnel knowledge and their overall capabilities to face the challenges of fire-fighting.
The roles of firefighter cannot be performed until and unless sufficient training is being imparted to the fire service personnel. The types of training and duration depend upon the type of entry to the fire service department or change of responsibility on promotion. Broadly, there are two entry levels in fire services in India; 1) Fireman level and 2) Middle level (Sub Officer/ Asstt. Station Officer). Immediately after joining the Fire Services, it is mandatory that every fire personnel needs to undergo professional training.
Fire-Risk and Hazard Analysis in the Country
(National Report) Confidential Page 331 of 338
In order to further strengthen, the Fire & Emergency Services across the country, the gap in training has been estimated for various levels of fire personnel. The Fire Station survey and gap analysis reveal that there are some gaps in training need for existing staff. The previous section (section 42.3.3) details about gap in firefighting manpower in operational Fire Stations and need of additional fire personnel for new urban and new rural Fire Stations. As per the guidelines of SFAC, immediately after recruitment, fire personnel should undertake professional trainings. Moreover, there should be refresher-training courses at an interval of 3 to 5 years for every fire personnel. The following sections detail about the estimation of training need at different levels (fireman, leading fireman, station officer, sub-officer etc.). For more detailed information, please refer to the National Level Training report as well as individual State/ UT report submitted by RMSI.
42.8.1 BASIC TRAINING FOR FIREMAN
The basic training course should provide practical experience of fire fighting to meet the challenge in fire fighting operations. Fire personnel should also be trained for operation and maintenance of fire fighting vehicles and equipments.
Estimated number of fire personnel who require basic training for fireman in operational Fire Stations (after filling the gap of manpower), and additional new recruitment for new urban and new rural Fire Stations is shown in Table 42-36. Additional requirement of Refresher Training Course for fireman after every 3-5 years of service is also shown the Table 42-36. Some of the special training for handling specialized equipment such as Breathing Apparatus, Global-positioning System etc should also be part of the Refresher course. As a whole, Fire Services in entire India would require to train 440,546 fire personnel in basic and 251,913 fire personnel in refresher training in next 10 years. Therefore, State/UT level training centre should have adequate capacity and infrastructure for meeting such training requirement.
42.8.2 TRAINING COURSE FOR LEADING FIREMAN
While promotion from fireman to leading fireman category, fire personnel should undertake training course designed for leading fireman. This training will provide both theoretical and practical training required for effective deployment of fire vehicles and fire equipment as well.
Estimated number of fire personnel who require training for leading fireman in operational Fire Stations (after filling the gap of manpower), and additional new recruitment for new urban and new rural Fire Stations is shown in Table 42-36. In total, Fire Services in entire India would need to train at least 71,323 leading fireman in next 10 years.
42.8.3 OTHER SPECIALIZED TRAINING COURSES
Besides regular normal training course for leading fireman, every leading fireman should also undergo at least one special training for multi-tasking performance in due course of time. In many cases, the fire services need to face new challenges and play an important role in other emergencies. Therefore, fire personnel must be well trained to perform in all possible situations. Some of the other specialized trainings courses are mentioned below:
Breathing Apparatus
Collapsed structure – Search & Rescue
Advanced Search & Rescue
Flood Rescue
Chemical Disaster
Flood / Cyclone Disaster Response
Earthquake Disaster Response
Emergency Response to Rail Accidents
Fire-Risk and Hazard Analysis in the Country
(National Report) Confidential Page 332 of 338
Hazardous Material Emergency
The syllabi for above courses are already provided in SFAC guidelines. Number of leading fireman need to attend specialized course is also shown in Table 42-36. In total, Fire Services in entire India would need to train at least 36,145 fire personnel for specialized courses to meet the requirement in next 10 years.
Table 42-36: Estimated training requirements for fire personnel in Fire Services
in entire India
Basic Training for Fireman
Number of Fire Personnel in Operational Fire Stations 182,644
Number of Fire Personnel in New Urban Fire Stations 59,008
Number of Fire Personnel in New Rural Fire Stations 198,894
Total Number of Fire Personnel for Training 440,546
Refresher Training for Fireman
Total Number of Fire Personnel 251,913
Leading Fireman Training Course
Number of Fire Personnel in Operational Fire Stations 27,369
Number of Fire Personnel in New Urban Fire Stations 8,776
Number of Fire Personnel in New Rural Fire Stations 35,178
Total Number of Fire Personnel for Training 71,323
Other specialized Training Course
Total Number of Fire Personnel for Training 36,145
Junior Officer Training Course
Number of Fire Personnel in Operational Fire Stations 20,100
Number of Fire Personnel in New Urban Fire Stations 6,990
Number of Fire Personnel in New Rural Fire Stations 25,071
Total Number of Fire Personnel for Training 52,161
Divisional Officer Training Course
Number of Fire Personnel in Operational Fire Stations 2,729
Number of Fire Personnel in New Urban Fire Stations 564
Number of Fire Personnel in New Rural Fire Stations 104
Total Number of Fire Personnel for Training 3,397
Fire Prevention Course
Total Number of Fire Personnel for Training 3,788
Fire-Risk and Hazard Analysis in the Country
(National Report) Confidential Page 333 of 338
42.8.4 JUNIOR OFFICER TRAINING COURSE
While promotion from leading fireman to sub-officer/ station officer fire personnel should undertake a Junior Officer training course. This course should provide an understanding of Fire Station administration, fire safety management and leadership as to be able to command a Fire Station and command a fire crew in case of an emergency. Upon successful completion of the training, fire officers should be able to identify components of an effective fire service organization and planning requirement. The officials will be responsible for implementation of fire safety and prevention programs at their assigned Fire Station.
Estimated number of fire officers who need to participate in Junior Officer training course in operational Fire Stations (after filling the gap of manpower), and additional new recruitment for new urban and new rural Fire Stations is shown in Table 42.36. After filling gap in operational Fire Stations, new urban and rural Fire Stations, Fire Services in entire India would require to train 52,161 junior officers in next 10 years.
42.8.5 DIVISIONAL FIRE OFFICER TRAINING COURSE
On promotion to divisional officer, every fire officer should undertake a Divisional Fire Officer (DFO) training course. This course should provide with theory, principles and practices in terms of Fire Station management, facilities, fire inspection as well as effective guidelines to command fire crew and control at an incident site. This course should be designed to promote them for their roles as senior fire officers. Upon successful completion of training, officers should be able to identify components of an effective fire service organization, and implementation of fire prevention and fire safety programs at their assigned area of jurisdiction.
Estimated number of fire officers who require Divisional Officer training course in operational and new Fire Stations (after filling the gap of manpower) is shown in Table 42.36. About 3,397 fire officers in Fire Services in entire India would require this training in next 10 years.
42.8.6 AWARENESS GENERATION PROGRAMS
Besides attending regular fire and other rescue calls, the State fire services should also work on awareness generation programs, and it should conduct regular awareness programs in schools, colleges, residential areas, cinema halls, shopping malls, hospitals, NCC camps, industries, Govt.& private offices etc. Currently, numbers of awareness programs conducted so far by different State Fire Services in India are not up to the satisfactory level and there is a need to enhance such activities. For large scale public awareness generation, each district is being recommended with an Education Van equipped with short video films as produced by MHA, distribution of pamphlets on “DO”s and “DON‟T”s to prevent fire produced by MHA, live- demonstrations of how to use “portable extinguishers” and how to handle small kitchen fires.
For large scale public awareness generation, each district is being recommended with an Education Van equipped with short video films as produced by MHA, distribution of pamphlets on “DO”s and “DON‟T”s to prevent fire produced by MHA, live- demonstrations of how to use “portable extinguishers” and how to handle small kitchen fires.
Fire-Risk and Hazard Analysis in the Country
(National Report) Confidential Page 334 of 338
42.9 Limitations of the Study
1. In fire hazard and risk analysis, fire-load of specific industry has not been taken into consideration. However, weightage has been given to the size of industrial area in the fire hazard and risk analysis of the base unit (district level). An attempt has been made even in the present assignment to go further down at lower levels. Providing special weightage of type of industry will require building level survey including estimation of fire-load for each industry, which is out of scope of present assignment.
2. Currently, Census 2011 has published only district level demographic data (the Tehsil/ Block level data is still unavailable), which has been used for further estimation and analysis purpose.
3. Floating population in cities has not been considered for distribution over the land use (built-up area); this may be attempted in future detailed studies.
4. Non-availability of a uniform level of fire statistics of all the fire events in the past 5 years.
5. Designation, rank structure and administrative control are very heterogeneous from State to State, which in the present State creates ambiguity while brining in at National level. For example, Director Position pay scale in one State may not be equal to that of Chief Fire Officer in another State. For the purpose of present assignment, we have divided the rank/designation structure into 11 levels (level 0 to level 10). For this, a system needs to be put in place through having a uniform administrative structure at national level to State level. This may require development and implementation of National Fire Act, which MHA is trying to develop in near future.
6. The fire fighting infrastructure of forest department, privately owned companies/ organizations, military cantonment and airbases, nuclear power plants, nuclear research reactors, heavy water plants, mines, ports, airports, oil exploration and oil refineries are out of scope of present study. However, RMSI has tried to get information about the fire-fighting infrastructure for these, and will include whatever information will be available, as there are limitations due to security concerns. This is more so, as result of this study may be made available in public domain with their spatial location. Studying fire infrastructure in above areas will require special MOU‟s with MHA and controlling agencies, and may be attempted in future studies to have a complete coverage of the country.
Fire-Risk and Hazard Analysis in the Country
(National Report) Confidential Page 335 of 338
42.10 Recommendations for Fire Services in India
1. There is an urgent need for Fire Prevention and Fire Safety Act for every State and UT of India. In the Fire Act, there should be strict implementation of fire code in building design and construction. The National Building Code (NBC) should be strictly adhered to in high-rise buildings, schools, colleges, cinema halls, hospitals, industrial units including those dealing with hazardous materials, institutions and public and private buildings. Moreover, in areas of high seismic risk (Seismic Zone IV and V), even low-rise buildings need strict implementation of building code.
2. Computerization of Fire and Emergency Services is highly recommended across the
country from modernization of Fire and Emergency Services point of view. All the
Fire Stations in the States/ UTs should be connected through INTRANET and fire
personnel should be trained properly. The Fire and Emergency Services in the
country should be capable of making fire reports available online to public within 48-
hours for an incident.
3. In order to provide best possible services to people against fire, the firefighting
manpower should be recruited in a systematic manner. It has been observed that
there is large number of vacancies present at all levels in the operational Fire
Stations of various States/UTs. These gap needs to be filled up at the earliest.
4. Since availability of trained manpower in various States/ UTs is a key issue, there is
a need that States/ UTs should fill up the gap of manpower in operational Fire
Stations and provide at-least 6-months basic fireman training in the State training
center or at NFSC, Nagpur.
5. Instead of having fireman, driver, and operator separately, the States/UTs should
recruit fireman-cum-driver-cum-operators. This will help in optimizing the large
manpower requirements. Since, the fireman-cum-driver-cum-operators may not be
readily available, the State/UT should train the new recruit in a systematic manner,
and encourage all existing staff, specially, firemen and leading firemen to obtain
heavy vehicle driving license. The State may offer some incentive towards this, as
this will help in optimization of resources. The other advantages are in terms of heavy
additional vehicles that can be used as water carrier, in case of bigger fire incidence.
This ensures that absence of lone driver, which can lead to whole of the fire crew
immobile. This can also solve problem of drivers, who don‟t have promotional avenue
during their long service leading to frustration, and last but not least, in terms of
optimization of resources.
6. There is an urgent need to have merit-based promotion in State‟s/ UT‟s Fire Services
organization, so that deserving employees would remain motivated and not leaving
the organization at midst of their career.
7. Based on prioritization of Fire Stations, State/ UT Fire Services need to add new Fire Stations at a faster pace, as there is a huge gap both in urban and rural areas. The priority ranking for all the newly proposed urban and rural Fire Stations has already been mentioned in the State/ UT specific reports.
8. Though, some of the State Fire Services has online vehicle tracking through Global
Positioning System (GPS) in place, there is a need for all the other State/ UT Fire
Fire-Risk and Hazard Analysis in the Country
(National Report) Confidential Page 336 of 338
Services to develop a fully computerized integrated response system as part of the
modernization process and better infrastructure management.
9. In order to reduce the frequency and extent of fire events, creating public awareness
programs for schools, colleges, hospitals, Govt. offices, high-rise buildings, etc. plays
an important role. For that purpose sufficient manpower at senior officer levels have
been recommended to have a dedicated “Fire Prevention Wing”. The fire prevention
wing should have trained officials for fire inspection, awareness and training, so that
fire incidences similar to that of AMRI, Kolkata should not occur in the State. The
State should have a dedicated “Education Van” in each district for the purpose. The
van should be well equipped with short video films as produced by MHA, distribution
of pamphlets on “DO”s and “DON‟T”s generated by MHA, and live demonstration of
how to use “portable extinguishers” and handle small fires.
10. The periodic fire drills and fire-inspection of schools, colleges, hospitals, shopping
malls, cinema halls, multi-storied buildings, and major industrial centers should be
taken care by the State/ UT Fire Services.
11. The State/ UT Fire Services should ensure that for operational duty, physically unfit
firefighters should not be part of the team, and he/she should be allowed to work in
the areas, other than fire response.
12. For congested areas, and by-lanes where movement of Water Tender and Water
Bowser is difficult, QRTs and motorcycle with mist sets should be used for fastest
response, supplemented by the Water Tenders and Water Bowsers by laying the
large hose pipelines. Additionally, the State/UT Fire Services should identify
congested areas with higher fire risk and request district administration to decongest
such areas with the help of police. The congestion could be in terms of illegal
extension of residential buildings, shops, unauthorized parking on roads. For
unauthorized parking, State traffic department can also play an important role. Here
role of fire prevention officials is important, as these exercises are not one time
matter and should be carried out regularly.
13. The State/ UT Fire Services should adopt a system of payment of incentives for
driving specialized vehicles like ALP / TTL/Hydraulic Platform. Controlling these
vehicle is difficult and requires specialized firefighters to handle it. State/ UT Fire
Services are requested to perform regular fire drills with such specialized vehicles.
14. Fire Stations/ Fire Posts in areas under extreme cold temperature/ climatic condition
such as Leh (J&K), Gurez (J&K), Keylong (Himachal Pradesh) etc. should have
special heating and other means of arrangement for firefighting vehicles and
equipment as water gets freezed up during extreme winter.
15. Fire statistics of the past fire events (last past 5 years) in the States/ UTs is not
uniformly available for all the Fire Stations. The State/ UT Fire Services should issue
strict order to all the Fire Stations to prepare fire statistics data in the prescribed
performa for future fire/ rescue calls, and ensure their compliance.
16. Firefighting vehicles and equipment should not be used for cleaning drains, sewer
lines, as well as water supply purposes. This may delay in response, if there is a fire
Fire-Risk and Hazard Analysis in the Country
(National Report) Confidential Page 337 of 338
incidence at the same time. Such use of fire vehicles should be discouraged at all
levels, as a small fire incident can turn into a major fire disaster.
17. The State/ UT Fire Services should ensure that higher fire personnel (ADFO/DFO
upwards) should be provided with light official vehicle for inspection and fire
prevention work, depending upon State/UT Policy.
18. The State/ UT Fire Services need to have well-equipped model workshop to take
care of day-to-day repairs of fire vehicles. Because of the lack of connectivity of other
stations with headquarter in a large State/ UT by road, there is need to have special
arrangement for repairing staff and mobile/ small workshop for quick repairs.
19. The State/ UT should have Insurance for all the Firefighting vehicles and costly
equipment, so that in case of an accident/malfunctioning there is sufficient cover
available for any damage.
20. Each Municipal Corporation/ Municipality cannot be made self sufficient in isolation to deal with serious nature of Fire & Emergency. Moreover, there are plenty of sub-urban and large village areas that need to have good fire response adjacent to the Municipal areas. Because of these reasons, RMSI team recommends that Municipal Fire Services should come under the State/ UT Services. Accordingly, a hierarchy should be created to have proper co-ordination at all levels.
21. In many of the States/ UTs, roads are narrow in their width or not in a good condition. There is an urgent need for widening the roads, so that firefighting & rescue vehicles can reach to the fire scene and respond faster. For this, the State/ UT Fire Services should coordinate with State Administration to take quick and efficient steps.
22. The Fire & Rescue Services in the State should have audit by a central authority to
ensure good finance mechanism for capital, and O&M expenditures.