Embed Size (px)
Citation preview
Fire Safety Challenges of Tall Wood Buildings – Phase 2: Task 4 – Engineering Methods FINAL REPORT BY: Daniel Brandon RISE Research Institutes of Sweden Borås, Sweden March 2018
© 2018 Fire Protection Research Foundation
1 Batterymarch Park, Quincy, MA 02169-7417, USA Email: [email protected] | Web: nfpa.org/foundation

—— Page ii ——
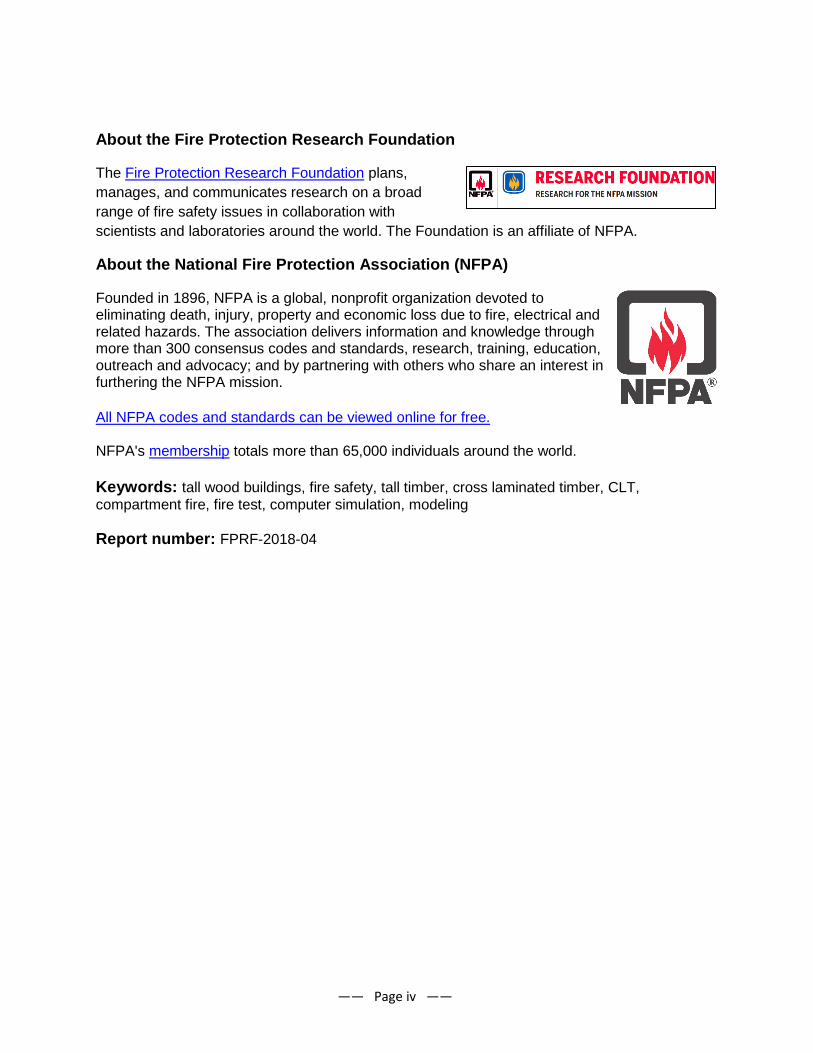
FOREWORD Recent architectural trends include the design and construction of increasingly tall buildings with structural components comprised of engineered wood referred to by names including; cross laminated timber (CLT), laminated veneer lumber (LVL), or glued laminated timber (Glulam). These buildings are cited for their advantages in sustainability resulting from the use of wood as a renewable construction material. Research and testing are needed to evaluate the contribution of mass timber elements to room/compartment fires with the types of structural systems that are expected to be found in tall buildings (e.g. CLT, etc.). Previous research has shown that timber elements contribute to the fuel load in buildings and can increase the initial fire growth rate. This has the potential to overwhelm fire protection systems, which may result in more severe conditions for occupants, fire fighters, property and neighboring property. There is a need to quantify the contribution of timber elements to compartment fires to assess the relative performance compared to noncombustible structural materials. The contribution of exposed timber to room fires should be quantified for the full fire duration using metrics such as charring rate, visibility, temperature and toxicity. This will allow a designer to quantify the contribution, validate design equations and develop a fire protection strategy to mitigate the level of risk to occupants, fire fighters, property and neighboring property. In addition, the effect of encapsulating the timber as means of preventing or delaying involvement in the fire (e.g. gypsum, thermal barrier) needs to be characterized. This report is part of a larger project with the goal to quantify the contribution of Cross Laminated Timber (CLT) building elements (wall and/or floor‐ceiling assemblies) in compartment fires. This Task 4 report summarizes engineering methods for structural assessment of CLT members with design fires which are dependent on the design of the compartment and the contribution of CLT to the fuel load of the fire. These methods involve the prevention of phenomena leading to sudden exposure of protected timber material to the fire, such as gypsum failure and delamination of CLT. The Fire Protection Research Foundation expresses gratitude to the report author Daniel Brandon, who is with RISE Research Institutes of Sweden located in Borås, Sweden. The Research Foundation appreciates the guidance provided by the Project Technical Panelists, the funding provided by the project sponsors, and all others that contributed to this research effort. Special thanks are expressed to the USDA, Forest Service for being a sponsor of this study. The content, opinions and conclusions contained in this report are solely those of the authors and do not necessarily represent the views of the Fire Protection Research Foundation, NFPA, Technical Panel or Sponsors. The Foundation makes no guaranty or warranty as to the accuracy or completeness of any information published herein.
—— Page iii ——
About the Fire Protection Research Foundation
The Fire Protection Research Foundation plans, manages, and communicates research on a broad range of fire safety issues in collaboration with scientists and laboratories around the world. The Foundation is an affiliate of NFPA.
About the National Fire Protection Association (NFPA)
Founded in 1896, NFPA is a global, nonprofit organization devoted to eliminating death, injury, property and economic loss due to fire, electrical and related hazards. The association delivers information and knowledge through more than 300 consensus codes and standards, research, training, education, outreach and advocacy; and by partnering with others who share an interest in furthering the NFPA mission. All NFPA codes and standards can be viewed online for free. NFPA's membership totals more than 65,000 individuals around the world. Keywords: tall wood buildings, fire safety, tall timber, cross laminated timber, CLT, compartment fire, fire test, computer simulation, modeling Report number: FPRF-2018-04
—— Page iv ——

—— Page v ——
PROJECT TECHNICAL PANEL
Carl Baldassarra, Wiss, Janney, Elstner Associates David Barber, Arup
Jim Brinkley, International Association of Fire Fighters Charlie Carter, American Institute Steel Construction
Kim Clawson, Jensen Hughes Ronny Coleman, Fireforce One
Sean DeCrane, Battalion Chief (Retired), Cleveland Fire Department, OH Michael Engelhardt, University of Texas at Austin
Patricia Layton, Clemson Steven Lohr, Fire Chief, Hagerstown Fire Department, MD
Rick McCullough, Fire Chief (Retired), City of Regina, Saskatchewan, Canada
Kevin McGrattan, NIST Ben Johnson, Skidmore, Owings, and Merrill LLP
Paul Shipp, USG Corporation Ray Walker, Fire Marshal, Vernon, CT, International Fire Marshals
Association Tracy Vecchiarelli, NFPA Staff Liaison
PROJECT SPONSORS
American Wood Council (AWC)
US Department of Agriculture, Forest Service
Property Insurance Research Group (PIRG):
American International Group, Inc. (AIG) CNA Insurance
FM Global Liberty Mutual Insurance
Tokio Marine America Travelers Insurance
XL Group Zurich Insurance Group
—— Page vi ——

—— Page vii ——
SAFETY AND TRANSPORT FIRE RESEARCH Fire Safety Challenges of Tall Wood Buildings. Phase 2: Task 4 - Engineering Methods for Performance Based Design Daniel Brandon
Fire Safety Challenges of Tall Wood Buildings. Phase 2: Task 4 - Engineering Methods for Performance Based Design Daniel Brandon
2 Abstract Fire Safety Challenges of Tall Wood Buildings. Phase 2: Task 4 - Engineering Methods Recent architectural trends include the design and construction of tall buildings with visible structural members comprised of mass timber. Cross-laminated timber (CLT) is such a mass timber material and is increasingly used for tall buildings because of a combination of advantages regarding its structural performance, low environmental impact and more. As timber is a combustible material, CLT can become involved in the fire if it is not protected against the fire. Previous tests have shown that the contribution of the timber possibly leads to sustained fires that do not burn out, because of failure of the base layer of gypsum boards, debonding of CLT lamellas (delamination) or due to an excess of unprotected timber. If it cannot be assumed that the fire brigade or sprinkler activation will suppress a fire, it can be needed to design for burn-out without successful fire suppression. Engineering methods to limit the impact of gypsum failure, delamination and an excess of exposed timber are needed. Additionally, a method for structural design for CLT structures considering natural fires is needed. This report proposes and evaluates pragmatic design methods using parametric design fires. The methods using parametric design fires can only be valid if delamination and failure of the base layer of gypsum boards are avoided. Therefore, an additional method to predict gypsum fall-off is presented. A method to avoid delamination is presented in other work. The parametric fire design methods proposed, resulted in conservative predictions of the damage of exposed CLT and conservative predictions of the occurrence of gypsum board fall-off. Parametric design fires can be used for structural predictions of the timber building exposed to fire using recently developed methods. Key words: Burn-out; Performance based design; CLT RISE Research Institutes of Sweden AB Stockholm 2017
3 Content Abstract ...................................................................................................... 2 Content ...................................................................................................... 3 Preface ....................................................................................................... 4 1 Introduction......................................................................................... 5 2 Brief review of compartment tests ....................................................... 6 2.1 FPRF compartment fire tests ................................................................................ 6 2.2 ATF compartment fire tests ................................................................................... 7 2.3 Relevant compartment fire tests from the literature .......................................... 8 3 Analysis of FPRF and ATF test results ................................................ 10 3.1 Heat release rates ..................................................................................................10 3.2 Temperatures ........................................................................................................ 12 4 Parametric fire design for post-flashover fires .................................... 13 4.1 Parametric fires (EN 1991-1-2) ............................................................................ 15 4.2 Charring of timber in parametric fires ................................................................ 16 4.3 Including the contribution of CLT to the fuel load ............................................. 17 4.4 Validation of the method ...................................................................................... 18 4.5 Predictions of the structural behaviour in parametric fires ............................. 20 4.6 Gypsum board fall-off time .................................................................................. 21 5 Conclusions .........................................................................................27 Acknowledgements .................................................................................. 28 References ............................................................................................... 28 Appendix: Worked example of determining a parametric time-temperature curve including the contribution of exposed CLT ..................................... 32
4 Preface The research of this report is conducted at RISE Fire Research and Wood Building Technology in Stockholm, Sweden.
5 1 Introduction Architectural trends currently include the construction of tall buildings with mass timber as structural members. Cross-laminated timber (CLT) is such a mass timber material and is used in multi-storey timber buildings because of a combination of advantages regarding its environmental impact and structural performance. As timber is a combustible material, an increased height of timber buildings involves new fire safety challenges. If CLT is exposed or not sufficiently protected, it can contribute to the fuel load of a potential fire. Recent studies involving compartment fire tests have shown that compartment fires with mass timber structures may remain in a fully developed state or re-intensify after a period of decay (Hakkarainen, 2000; McGregor, 2013; Medina Hevia, 2014; Hox, 2015; Hadden et al. 2017; Janssens, 2017; Su et al.,2018) . This is occurred when (Brandon and Östman, 2016): - bond line failure within the CLT caused by fire led to heat delamination and sudden exposure of cold timber or char, and/or; - fire protective boards (usually gypsum) fell from the protected timber surface, and/or; - the area of the exposed surface was too large. In the (improbable) scenario that sprinkler activation and interference of the fire brigade are absent or not effective, a continuous fire may lead to high damages, especially in large buildings. Therefore, a conservative approach regarding fire safety of tall timber buildings is to design for complete burn-out, without interference of the fire brigade or automatic fire suppression systems such as sprinklers. The structural fire safety of buildings has traditionally relied on standard fire resistance ratings, which indicate the time a structural element or a compartment separating element should withstand the prescribed thermal exposure of a standard fire resistance test. This exposure is described by a standard time-temperature curve. Prescriptive building code regulations are mostly based on previous experience and could, therefore, be questioned for unusual buildings (or compartments), such as tall buildings with an unusual amount of exposed timber elements, or buildings with compartments with an unusually high fuel load density. As seen from multiple previous compartment fire tests, continuous fully developed fires are possible if for example there is not enough gypsum board protection and if the ventilation conditions are challenging. Preventing these continuous fires can partially be done with prescriptive regulations regarding the number, thickness and type of protective gypsum boards and the maximum amount of exposed timber in a compartment. However, for unusual compartments or buildings, a performance based approach could be used to achieve a level of safety related to the design of the buildings. The methods proposed in this report are not meant to replace existing fire resistance requirements, but are meant to provide an additional check for the fire safety of unusual buildings or compartments. This report proposes and evaluates pragmatic engineering methods to design for burn-out. The methods include the contribution of timber as fuel in parametric design fires and aims to give a conservative prediction for post-flashover fires in compartments with non-delaminating CLT. Using the parametric design fires, recent calculation
6 methods (Lang et al. 2015; Brandon et al. 2017; Brandon et al.; 2018) can be used for the assessment of the structural capacity during and after the fire. The implementation of parametric design fires can only be valid if heat delamination and failure base layer of passive fire protection of CLT is avoided. A possible method to prevent heat delamination involves the use of non-delaminating adhesives, which can be identified with furnace fire tests according to Brandon and Dagenais (2018) or tests described in Annex B of the 2018 version of ANSI/APA PRG 320. In this report a design method to prevent gypsum fall-off is proposed and evaluated. It should be noted that delamination and fall-off of the base layer of gypsum boards do not necessarily lead to a secondary flashover in the late stages of a fire. However, the model presented in this report is not equipped to consider the effects of delamination or fall-off of the base layer. The approach taken is conservative as it does not allow delamination and fall-off of the base layer during the whole fire, but may be extended to consider the effects of delamination of fall-off of the base layer at a late stage of the fire. 2 Brief review of compartment tests In Task 1 of this study, a literature review of compartment tests with timber structures was made (Brandon and Östman, 2016). This section gives a brief review of compartment tests that were used for analysis and validation of the engineering methods discussed in this report. For more information the reader is referred to the more extensive literature review of Task 1. Raw data sets of two test series were available. Access to these data allowed more extensive analysis. These two test series are discussed first. 2.1 FPRF compartment fire tests The compartment fire tests performed recently for this research project are extensively reported by Su et al. (2018). Here only a brief overview of the tests is provided. Six fire tests of compartments of 9.1 x 4.6 x 2.7m were performed by NRC Canada and NIST at the fire laboratory of NIST in Gaithersburg. Parameters that were varied are the size of the ventilation opening and the amount of CLT that was unprotected. An overview of the tests is given in Table 1. Opening factors can be calculated using too
AHAO /= , where Ao and Ho are the area and height of the opening and At is the total area of the boundary surfaces. To quantify the contribution of exposed CLT to the fire load, comparisons were made between results of tests with only non-combustible linings (Tests 1-1 and 1-2) and tests with partially exposed CLT (Tests 1-3 to 1-6). In this report, data obtained from the tests are used for analysis and validation of the engineering methods proposed.
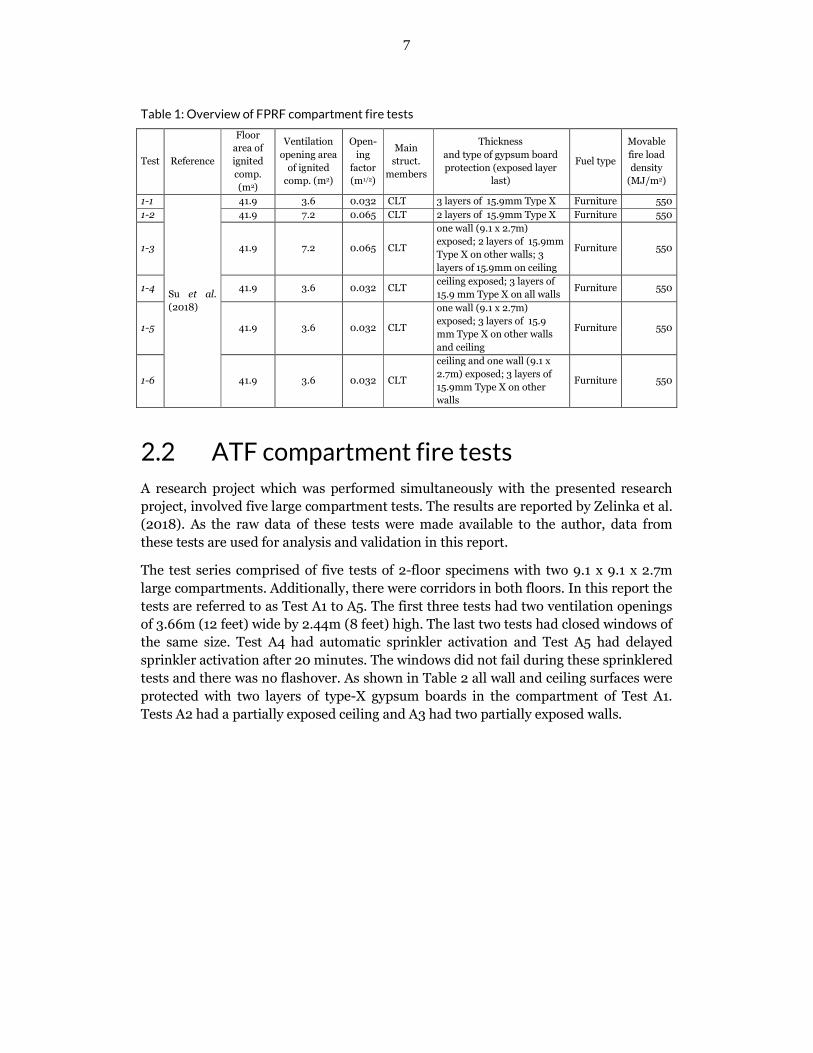
7 Table 1: Overview of FPRF compartment fire tests Test Reference Floor area of ignited comp. (m2) Ventilation opening area of ignited comp. (m2) Open-ing factor (m1/2) Main struct. members Thickness and type of gypsum board protection (exposed layer last) Fuel type Movable fire load density (MJ/m2) 1-1 Su et al. (2018) 41.9 3.6 0.032 CLT 3 layers of 15.9mm Type X Furniture 550 1-2 41.9 7.2 0.065 CLT 2 layers of 15.9mm Type X Furniture 550 1-3 41.9 7.2 0.065 CLT one wall (9.1 x 2.7m) exposed; 2 layers of 15.9mm Type X on other walls; 3 layers of 15.9mm on ceiling Furniture 550 1-4 41.9 3.6 0.032 CLT ceiling exposed; 3 layers of 15.9 mm Type X on all walls Furniture 550 1-5 41.9 3.6 0.032 CLT one wall (9.1 x 2.7m) exposed; 3 layers of 15.9 mm Type X on other walls and ceiling Furniture 550 1-6 41.9 3.6 0.032 CLT ceiling and one wall (9.1 x 2.7m) exposed; 3 layers of 15.9mm Type X on other walls Furniture 550 2.2 ATF compartment fire tests A research project which was performed simultaneously with the presented research project, involved five large compartment tests. The results are reported by Zelinka et al. (2018). As the raw data of these tests were made available to the author, data from these tests are used for analysis and validation in this report. The test series comprised of five tests of 2-floor specimens with two 9.1 x 9.1 x 2.7m large compartments. Additionally, there were corridors in both floors. In this report the tests are referred to as Test A1 to A5. The first three tests had two ventilation openings of 3.66m (12 feet) wide by 2.44m (8 feet) high. The last two tests had closed windows of the same size. Test A4 had automatic sprinkler activation and Test A5 had delayed sprinkler activation after 20 minutes. The windows did not fail during these sprinklered tests and there was no flashover. As shown in Table 2 all wall and ceiling surfaces were protected with two layers of type-X gypsum boards in the compartment of Test A1. Tests A2 had a partially exposed ceiling and A3 had two partially exposed walls.
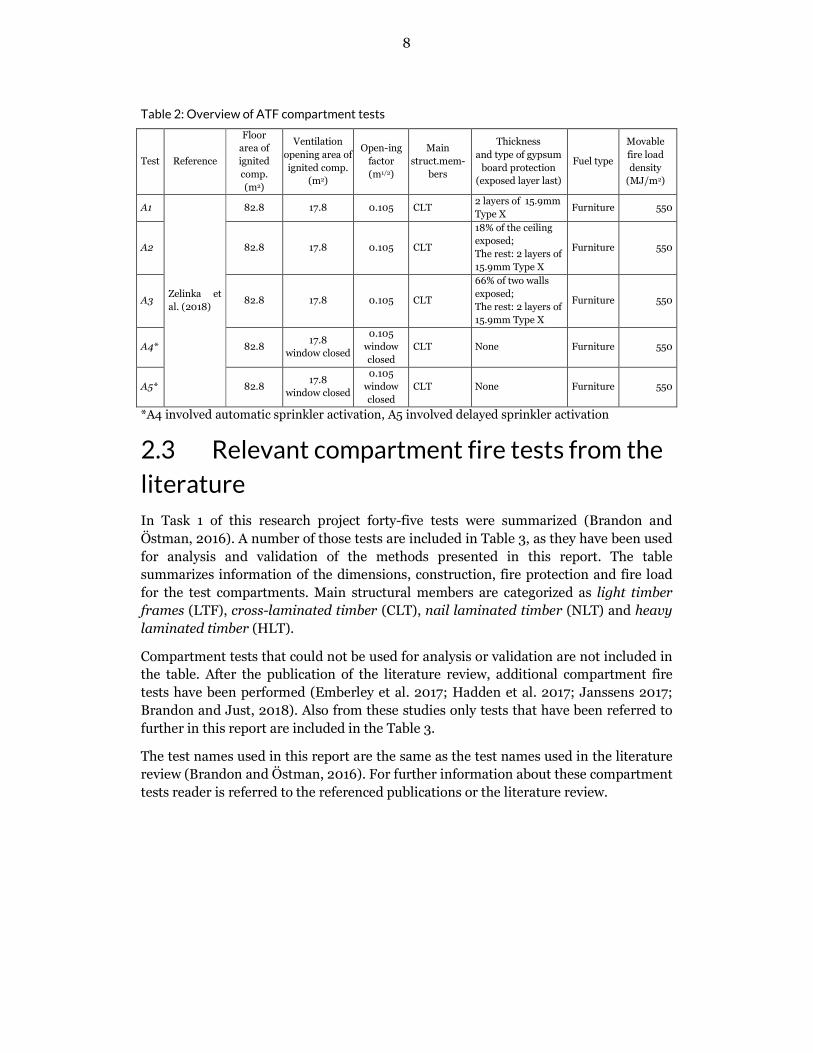
8 Table 2: Overview of ATF compartment tests Test Reference Floor area of ignited comp. (m2) Ventilation opening area of ignited comp. (m2) Open-ing factor (m1/2) Main struct.mem-bers Thickness and type of gypsum board protection (exposed layer last) Fuel type Movable fire load density (MJ/m2) A1 Zelinka et al. (2018) 82.8 17.8 0.105 CLT 2 layers of 15.9mm Type X Furniture 550 A2 82.8 17.8 0.105 CLT 18% of the ceiling exposed; The rest: 2 layers of 15.9mm Type X Furniture 550 A3 82.8 17.8 0.105 CLT 66% of two walls exposed; The rest: 2 layers of 15.9mm Type X Furniture 550 A4* 82.8 17.8 window closed 0.105 window closed CLT None Furniture 550 A5* 82.8 17.8 window closed 0.105 window closed CLT None Furniture 550 *A4 involved automatic sprinkler activation, A5 involved delayed sprinkler activation 2.3 Relevant compartment fire tests from the literature In Task 1 of this research project forty-five tests were summarized (Brandon and Östman, 2016). A number of those tests are included in Table 3, as they have been used for analysis and validation of the methods presented in this report. The table summarizes information of the dimensions, construction, fire protection and fire load for the test compartments. Main structural members are categorized as light timber frames (LTF), cross-laminated timber (CLT), nail laminated timber (NLT) and heavy laminated timber (HLT). Compartment tests that could not be used for analysis or validation are not included in the table. After the publication of the literature review, additional compartment fire tests have been performed (Emberley et al. 2017; Hadden et al. 2017; Janssens 2017; Brandon and Just, 2018). Also from these studies only tests that have been referred to further in this report are included in the Table 3. The test names used in this report are the same as the test names used in the literature review (Brandon and Östman, 2016). For further information about these compartment tests reader is referred to the referenced publications or the literature review.
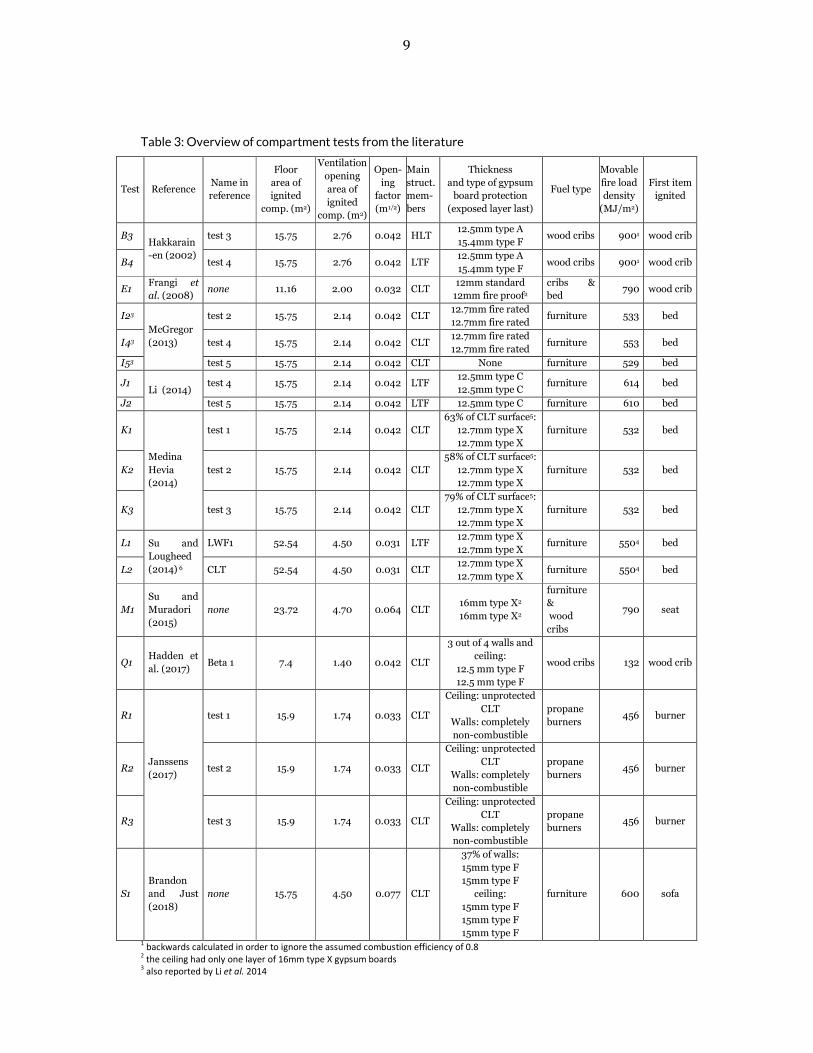
9 Table 3: Overview of compartment tests from the literature Test Reference Name in reference Floor area of ignited comp. (m2) Ventilation opening area of ignited comp. (m2) Open-ing factor (m1/2) Main struct.mem-bers Thickness and type of gypsum board protection (exposed layer last) Fuel type Movable fire load density (MJ/m2) First item ignited B3 Hakkarain-en (2002) test 3 15.75 2.76 0.042 HLT 12.5mm type A 15.4mm type F wood cribs 9001 wood crib B4 test 4 15.75 2.76 0.042 LTF 12.5mm type A 15.4mm type F wood cribs 9001 wood crib E1 Frangi et
al. (2008) none 11.16 2.00 0.032 CLT 12mm standard 12mm fire proof2 cribs & bed 790 wood crib I23 McGregor (2013) test 2 15.75 2.14 0.042 CLT 12.7mm fire rated 12.7mm fire rated furniture 533 bed I43 test 4 15.75 2.14 0.042 CLT 12.7mm fire rated 12.7mm fire rated furniture 553 bed I53 test 5 15.75 2.14 0.042 CLT None furniture 529 bed J1 Li (2014) test 4 15.75 2.14 0.042 LTF 12.5mm type C 12.5mm type C furniture 614 bed J2 test 5 15.75 2.14 0.042 LTF 12.5mm type C furniture 610 bed K1 Medina Hevia (2014) test 1 15.75 2.14 0.042 CLT 63% of CLT surface5: 12.7mm type X 12.7mm type X furniture 532 bed K2 test 2 15.75 2.14 0.042 CLT 58% of CLT surface5: 12.7mm type X 12.7mm type X furniture 532 bed K3 test 3 15.75 2.14 0.042 CLT 79% of CLT surface5: 12.7mm type X 12.7mm type X furniture 532 bed L1 Su and Lougheed (2014) 6 LWF1 52.54 4.50 0.031 LTF 12.7mm type X 12.7mm type X furniture 5504 bed L2 CLT 52.54 4.50 0.031 CLT 12.7mm type X 12.7mm type X furniture 5504 bed M1
Su and Muradori (2015) none 23.72 4.70 0.064 CLT 16mm type X2 16mm type X2 furniture & wood cribs 790 seat Q1 Hadden et al. (2017) Beta 1 7.4 1.40 0.042 CLT 3 out of 4 walls and ceiling: 12.5 mm type F 12.5 mm type F wood cribs 132 wood crib R1 Janssens (2017) test 1 15.9 1.74 0.033 CLT Ceiling: unprotected CLT Walls: completely non-combustible propane burners 456 burner R2 test 2 15.9 1.74 0.033 CLT Ceiling: unprotected CLT Walls: completely non-combustible propane burners 456 burner R3 test 3 15.9 1.74 0.033 CLT Ceiling: unprotected CLT Walls: completely non-combustible propane burners 456 burner S1
Brandon and Just (2018) none 15.75 4.50 0.077 CLT 37% of walls: 15mm type F 15mm type F ceiling: 15mm type F 15mm type F 15mm type F furniture 600 sofa 1 backwards calculated in order to ignore the assumed combustion efficiency of 0.8 2 the ceiling had only one layer of 16mm type X gypsum boards 3 also reported by Li et al. 2014
10 4 movable fire load density for Tests L1&L2: • bedroom 510 MJ/m2; • living area 380 MJ/m2 • kitchen dining area 970 MJ/m2 • average living/dining/kitchen 575 MJ/m2 • whole apartment average 550 MJ/m2 5 the percentage of CLT surface of the ceiling and the walls that was protected. In all cases the ceiling was protected. 6 a compartment fire with light timber frame timber LWF2 by these authors is not used in this study, as the fire seemed to entere the cavities before gypsum fall-off, due to failure of an inner wall with low fire resistance. 3 Analysis of FPRF and ATF test results Analysis of Test 1-1 to Test 1-6 and Test A1 to Test A3 have been performed to justify aspects of the model presented later in this report. The analysis is presented in this chapter. 3.1 Heat release rates From previous compartment tests it is known that compartment fires with large exposed timber surfaces result in an increase of external combustion (Frangi and Fontana, 2005; Hakkarainen 2002; Su et al. 2018). Therefore, it could be too conservative to assume that all combustion takes place inside the compartment for structural assessment. In order to provide a more accurate assessment, knowledge of the additional external combustion during the fully developed phase caused by the combustion of exposed timber is needed. In this section this is determined from the results of the FPRF compartment test series and test series I, described in Table 1. These test series each involved a reference test of a compartment with non-combustible linings and one or more compartment fire tests with different quantities of exposed CLT. The tests of series A, described in Table 1, could not be used as the charring rate in solely the fully developed phase could not be directly determined from the data. In the first part of the analysis, the average heat release rate during the fully developed phase was determined for tests of compartments with non-combustible linings of the test series. The fully developed phase was, for this purpose, defined as the period between the moment that the heat release rate exceeded 4 MW and the moment before a decrease of 0.8 MW in two minutes (the drop after the initial peak is disregarded). Additionally, the average heat release rate was determined for corresponding compartments with exposed CLT for the same duration (the duration of the fully developed fire of the reference test). The contribution of the CLT to the fire during the fully developed phase of these tests can be estimated from charring rates. The charring rates of exposed CLT during the fully developed phase were determined from thermocouple measurements (Table 4). The heat release rate corresponding to the charring rate was calculated using an experimentally determined ratio of 5.39 MJ/m2mm (Schmid et al, 2016).
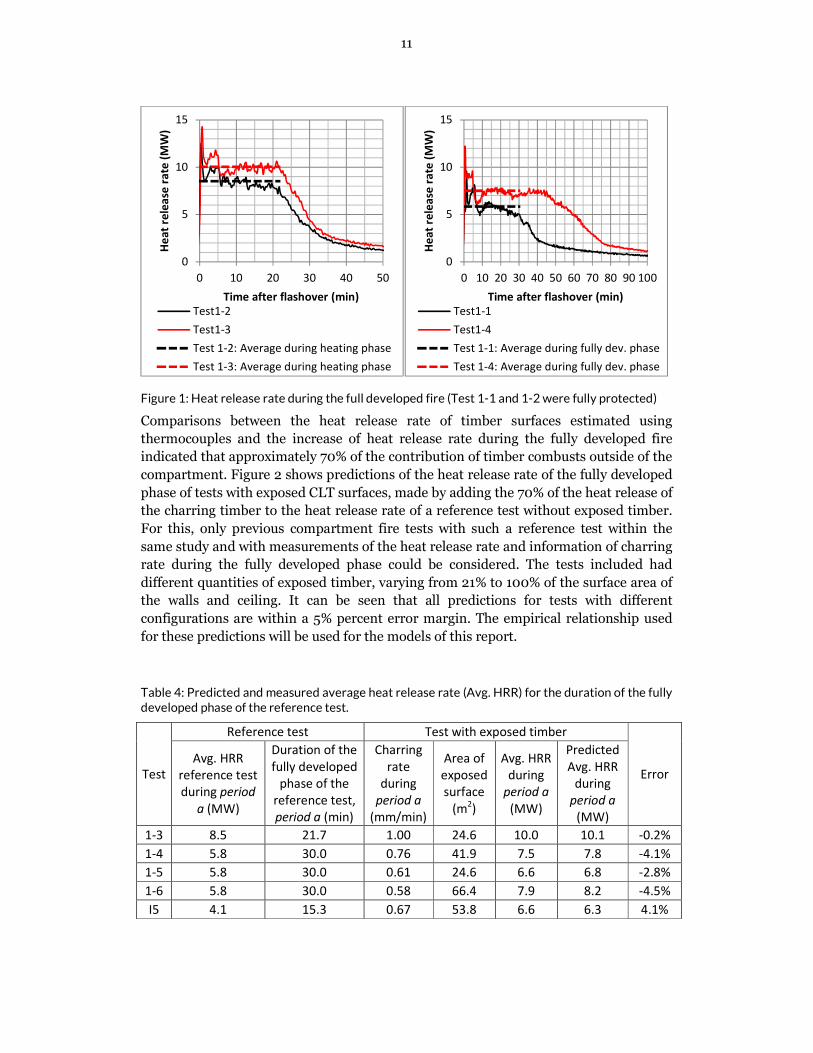
11 Figure 1: Heat release rate during the full developed fire (Test 1-1 and 1-2 were fully protected) Comparisons between the heat release rate of timber surfaces estimated using thermocouples and the increase of heat release rate during the fully developed fire indicated that approximately 70% of the contribution of timber combusts outside of the compartment. Figure 2 shows predictions of the heat release rate of the fully developed phase of tests with exposed CLT surfaces, made by adding the 70% of the heat release of the charring timber to the heat release rate of a reference test without exposed timber. For this, only previous compartment fire tests with such a reference test within the same study and with measurements of the heat release rate and information of charring rate during the fully developed phase could be considered. The tests included had different quantities of exposed timber, varying from 21% to 100% of the surface area of the walls and ceiling. It can be seen that all predictions for tests with different configurations are within a 5% percent error margin. The empirical relationship used for these predictions will be used for the models of this report. Table 4: Predicted and measured average heat release rate (Avg. HRR) for the duration of the fully developed phase of the reference test. Test Reference test Test with exposed timber Error Avg. HRR reference test during period a (MW) Duration of the fully developed phase of the reference test, period a (min) Charring rate during period a (mm/min) Area of exposed surface (m2) Avg. HRR during period a (MW) Predicted Avg. HRR during period a (MW) 1-3 8.5 21.7 1.00 24.6 10.0 10.1 -0.2% 1-4 5.8 30.0 0.76 41.9 7.5 7.8 -4.1% 1-5 5.8 30.0 0.61 24.6 6.6 6.8 -2.8% 1-6 5.8 30.0 0.58 66.4 7.9 8.2 -4.5% I5 4.1 15.3 0.67 53.8 6.6 6.3 4.1% 051015 0 10 20 30 40 50Heat release rate (MW) Time after flashover (min)Test1-2Test1-3Test 1-2: Average during heating phaseTest 1-3: Average during heating phase 051015 0 10 20 30 40 50 60 70 80 90 100Heat release rate (MW) Time after flashover (min)Test1-1Test1-4Test 1-1: Average during fully dev. phaseTest 1-4: Average during fully dev. phase
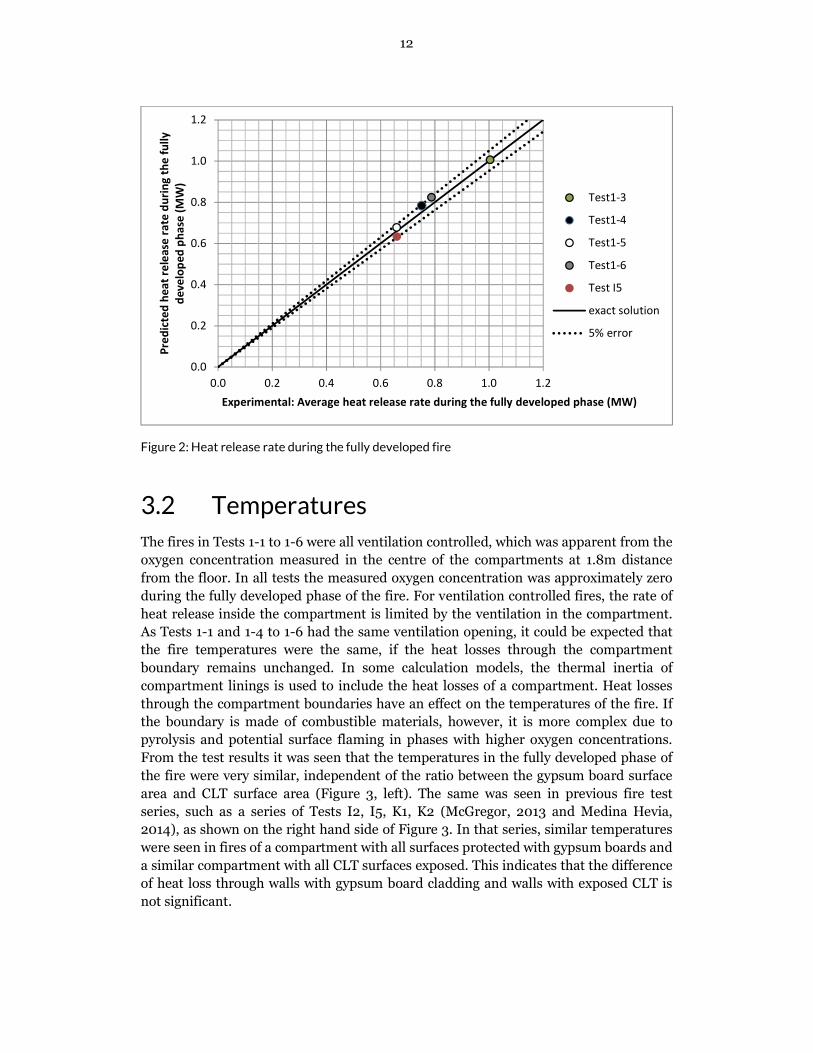
12 Figure 2: Heat release rate during the fully developed fire 3.2 Temperatures The fires in Tests 1-1 to 1-6 were all ventilation controlled, which was apparent from the oxygen concentration measured in the centre of the compartments at 1.8m distance from the floor. In all tests the measured oxygen concentration was approximately zero during the fully developed phase of the fire. For ventilation controlled fires, the rate of heat release inside the compartment is limited by the ventilation in the compartment. As Tests 1-1 and 1-4 to 1-6 had the same ventilation opening, it could be expected that the fire temperatures were the same, if the heat losses through the compartment boundary remains unchanged. In some calculation models, the thermal inertia of compartment linings is used to include the heat losses of a compartment. Heat losses through the compartment boundaries have an effect on the temperatures of the fire. If the boundary is made of combustible materials, however, it is more complex due to pyrolysis and potential surface flaming in phases with higher oxygen concentrations. From the test results it was seen that the temperatures in the fully developed phase of the fire were very similar, independent of the ratio between the gypsum board surface area and CLT surface area (Figure 3, left). The same was seen in previous fire test series, such as a series of Tests I2, I5, K1, K2 (McGregor, 2013 and Medina Hevia, 2014), as shown on the right hand side of Figure 3. In that series, similar temperatures were seen in fires of a compartment with all surfaces protected with gypsum boards and a similar compartment with all CLT surfaces exposed. This indicates that the difference of heat loss through walls with gypsum board cladding and walls with exposed CLT is not significant. 0.00.20.40.60.81.01.2 0.0 0.2 0.4 0.6 0.8 1.0 1.2Predicted heat release rate during the fully developed phase (MW) Experimental: Average heat release rate during the fully developed phase (MW)Test1-3Test1-4Test1-5Test1-6Test I5exact solution5% error
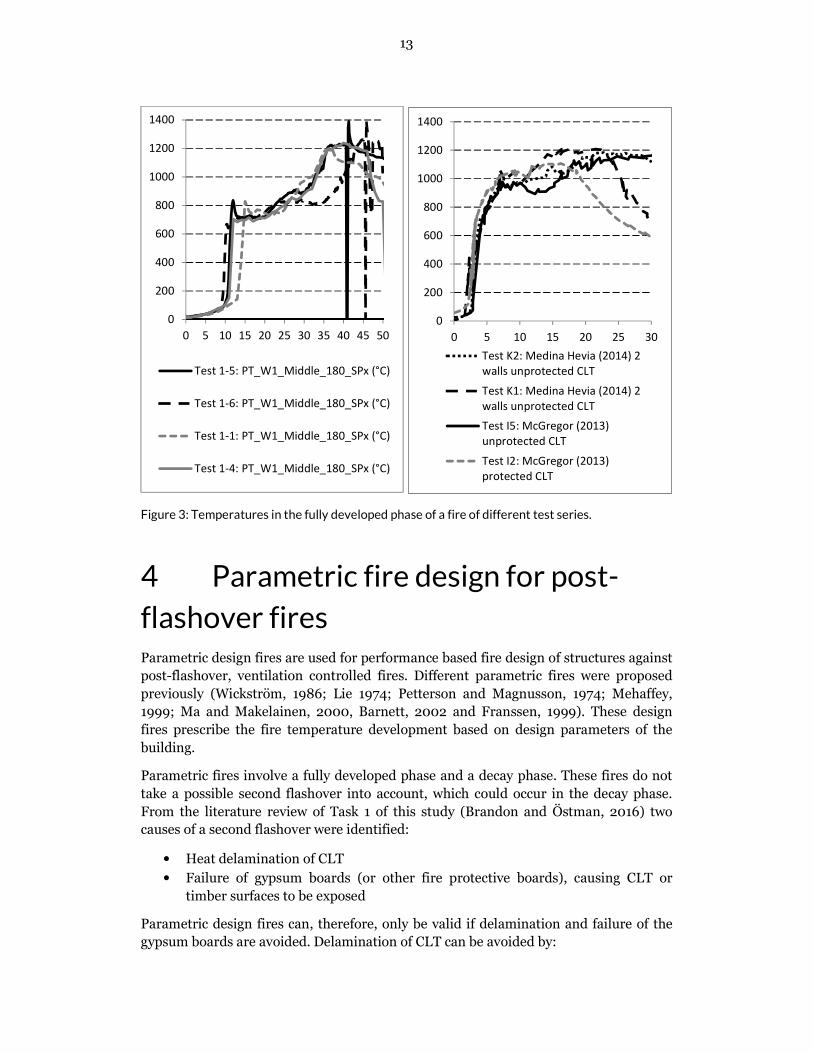
13 Figure 3: Temperatures in the fully developed phase of a fire of different test series. 4 Parametric fire design for post-flashover fires Parametric design fires are used for performance based fire design of structures against post-flashover, ventilation controlled fires. Different parametric fires were proposed previously (Wickström, 1986; Lie 1974; Petterson and Magnusson, 1974; Mehaffey, 1999; Ma and Makelainen, 2000, Barnett, 2002 and Franssen, 1999). These design fires prescribe the fire temperature development based on design parameters of the building. Parametric fires involve a fully developed phase and a decay phase. These fires do not take a possible second flashover into account, which could occur in the decay phase. From the literature review of Task 1 of this study (Brandon and Östman, 2016) two causes of a second flashover were identified: • Heat delamination of CLT • Failure of gypsum boards (or other fire protective boards), causing CLT or timber surfaces to be exposed Parametric design fires can, therefore, only be valid if delamination and failure of the gypsum boards are avoided. Delamination of CLT can be avoided by: 0200400600800100012001400 0 5 10 15 20 25 30 35 40 45 50Test 1-5: PT_W1_Middle_180_SPx (°C)Test 1-6: PT_W1_Middle_180_SPx (°C)Test 1-1: PT_W1_Middle_180_SPx (°C)Test 1-4: PT_W1_Middle_180_SPx (°C) 0200400600800100012001400 0 5 10 15 20 25 30Test K2: Medina Hevia (2014) 2walls unprotected CLTTest K1: Medina Hevia (2014) 2walls unprotected CLTTest I5: McGregor (2013)unprotected CLTTest I2: McGregor (2013)protected CLT
14 1. using non-delaminating adhesives, as shown by Brandon and Dagenais (2018) and Janssens (2017); 2. designing the apartment so that the delamination temperatures of the bond line are not reached. Examples of compartment fires in which the critical bond line temperature was not reached during the full duration of a flashover fire are the compartment fire tests recently performed at the Bureau of Alcohol, Tobacco, Firearms and Explosives (ATF). Also tests by Medina Hevia (2014), Hadden (2017) and Emberley at al. (2017) involved exposed CLT, without occurrence of heat delamination. Failure of the gypsum board protection can be avoided, by using the right type and a sufficient amount of fire rated gypsum board layers. In the USA type-X and type-C gypsum boards are available for the protection of structures. In ASTM C1396, type-X is defined using an ASTM E119 fire resistance test of a loadbearing wood framed wall assembly (Shipp, 2016). Type-C gypsum boards have improved dimensional stability when exposed to fire in comparison with Type-X gypsum boards and are developed for the use in ceiling assemblies (Shipp, 2016). However, there is no generic definition of type C gypsum boards in ASTM or CEN specifications. The only studies of the behaviour of timber in parametric fires found, correspond to the parametric fires first introduced by Wickström (1986) and further developed in an extensive international research programme named ‘Natural Fire Safety Concept’, which included more than 100 compartment fire tests for the evaluation of the parametric fires (Sleich et al. 2003; Lennon and Moore, 2003). These parametric fires were implemented in the European design standard (EN1991-1-2, 2002). Studies of temperature calculations, charring rates and the structural performance in these fires have been presented by Hadvig (1981), König (2005), Hopkin (2011), Lange et al. (2015), Brandon et al. (2017) and Brandon et al. (2018). In order to be able to use this knowledge, it was chosen to base this study on these parametric fires. The parametric design fires describe the development of the compartment fire temperature based on: • the opening factor of a compartment (suitable for vertical ventilation openings only) • the thermal inertia of compartment linings • the fuel load density relative to the surface area of the compartment boundaries It can be noted that the fuel load of the fire should be known, which includes the potential contribution of timber. As the contribution of timber is dependent on the fire development, it is not possible to directly obtain a suitable temperature development with the equations for parametric fires. In this report a method is proposed to include the contribution of timber to the fuel load. A successful model results in conservative predictions of the damaged timber after the fire. The parametric fire curves assume that the fire temperature is independent of the location in the compartment. This assumption is suitable for relatively small compartments (with floor areas up to 500m2 according to EN1991-1-2, 2002), but becomes less applicable for increasingly large compartments. In this study, the assumption is applied for compartments with dimensions of typical apartments (up to 92m2) and evaluated.
15 4.1 Parametric fires (EN 1991-1-2) The model for parametric fires used is based on a publication by Wickström (1986), which was further developed based on natural fire tests and implemented in design standards EN1991-1-2 (2002). The calculation method presented in this section is taken from a summary by Wickström (2016). The relationship between the fire temperature, Θ, and the time, t, is given by: )
− ⋅ − ⋅ − ⋅= + − − −
0.2t Γ 1.7t Γ 19t ΓΘ 20 1325(1 0.324e 0.204e 0.472e (1) where Г is a heating rate/time factor that changes the heating rate corresponding to the thermal inertia of the compartment boundaries and the opening factor, O(m1/2), of a compartment: 22 0)/(0.04/116)pcλ(O/Γ = (2) vtv hAAO = (3) Where, p is the density in kg/m3, c is the specific heat J/kg K and λ is the thermal conductivity in W/mK of the compartment’s boundary, Av is the total area of the ventilation openings, At is the total area of floors walls and ceilings of the compartment, hv is the height of the opening or the weighted average of the height of multiple openings. The duration of the heating phase tmax (h) is related to the fuel load within the compartment: [ ]limdt,3max t/O);q10(0.2maxt −
⋅= (4) Where: qt,d is the fuel load divided by the total surface area of the compartment boundaries (including walls and ceiling) in MJ/m2; tlim is the lower limit of the duration of the heating phase, which is 0:15h, 0:20h or 0:25h for slow, medium and fast fire growth, respectively. After the start of the cooling phase at tmax, the temperature decreases linearly until it reaches 20°C. After the start of the cooling phase at tmax, the temperature decreases linearly until it reaches 20°C according to one of the following expressions: x)ΓtΓ625(tΘΘ maxmax ⋅⋅−⋅−= if 0.5Γt max ≤⋅ (5) x)ΓtΓΓ)(tt250(3ΘΘ maxmaxmax ⋅⋅−⋅⋅−−= if 2Γt0.5 max <⋅< (6) x)ΓtΓ250(tΘΘ maxmax ⋅⋅−⋅−= if 2Γt max ≥⋅ (7) 1.0x = if limmax tt > or ΓΓ/ttx maxlim= if limmax tt = Figure 4 shows time-temperature curves of some parametric fires together with the standard ISO 834 time-temperature curve. The opening factor and the heating rate factor corresponding to the parametric curves are mentioned in the labels. The fuel load per floor area (q) and the
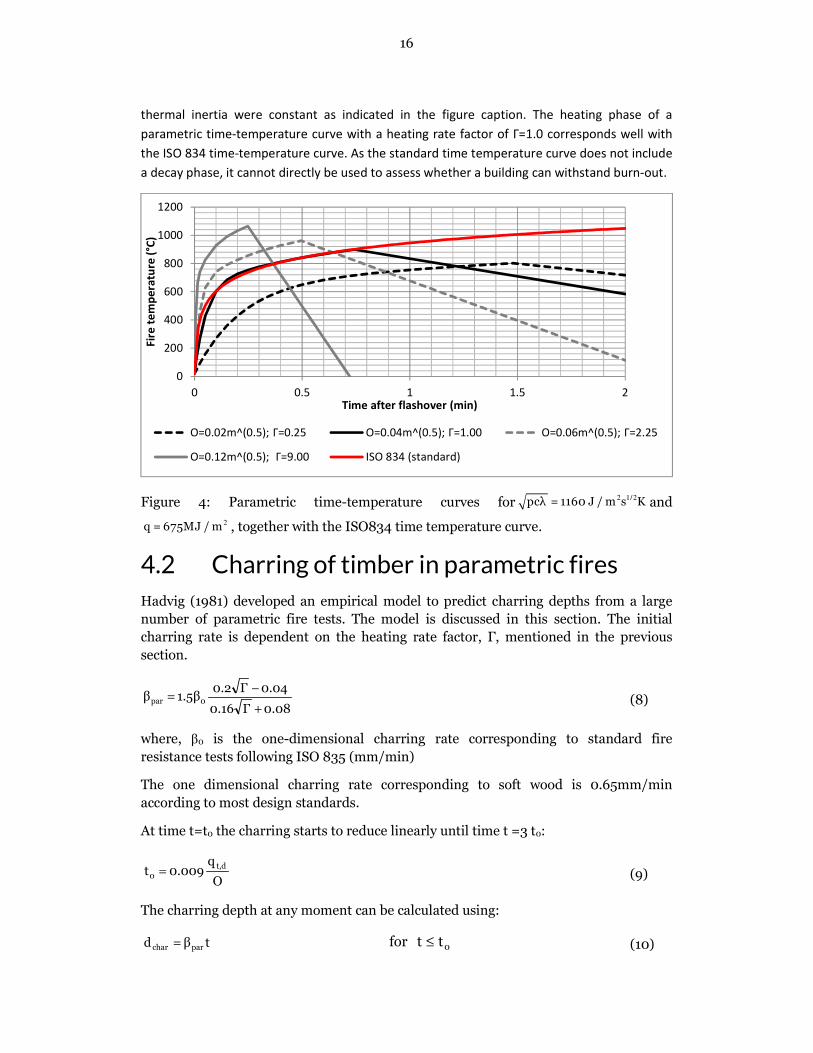
16 thermal inertia were constant as indicated in the figure caption. The heating phase of a parametric time-temperature curve with a heating rate factor of Г=1.0 corresponds well with the ISO 834 time-temperature curve. As the standard time temperature curve does not include a decay phase, it cannot directly be used to assess whether a building can withstand burn-out. Figure 4: Parametric time-temperature curves for 2 1/2pcλ = 1160 J / m s K and 2q = 675MJ / m , together with the ISO834 time temperature curve. 4.2 Charring of timber in parametric fires Hadvig (1981) developed an empirical model to predict charring depths from a large number of parametric fire tests. The model is discussed in this section. The initial charring rate is dependent on the heating rate factor, Г, mentioned in the previous section. 0.08Γ0.16 0.04Γ0.21.5ββ 0par
+
−= (8) where, β0 is the one-dimensional charring rate corresponding to standard fire resistance tests following ISO 835 (mm/min) The one dimensional charring rate corresponding to soft wood is 0.65mm/min according to most design standards. At time t=t0 the charring starts to reduce linearly until time t =3 t0: Oq0.009t dt,0 = (9) The charring depth at any moment can be calculated using: tβd parchar = 0ttfor ≤ (10) 020040060080010001200 0 0.5 1 1.5 2Fire temperature (°C) Time after flashover (min)O=0.02m^(0.5); Г=0.25 O=0.04m^(0.5); Г=1.00 O=0.06m^(0.5); Г=2.25O=0.12m^(0.5); Г=9.00 ISO 834 (standard)
17
−−= 4t4tt1.5tβd 002parchar 3≤ ≤0 0for t t t (11) 0parchar t2βd = 3> 0for t t (12) 4.3 Including the contribution of CLT to the fuel load The contribution of exposed CLT to the fuel load of the fire can be estimated from charring rates, given by Hadvig (1981) using the ratio between heat release and char depth of α1=5.39 MJ/m2mm (Schmid et al, 2016). Instead, it can also be chosen to estimate the heat release corresponding to CLT as follows:
2= ⋅ ⋅ ⋅ ⋅CLT par CLT dry woodq α β A ρ H (13) Where α2 is the fraction of the mass loss relative to the initial mass of timber (approximately 0.7), ACLT is the surface area of exposed CLT, ρdry is the dry density of timber excluding mass of moisture, Hwood is the heat of combustion of dry wood (approximately, 18.75 MJ/kg according to Krajnc, 2015). It should be noted that the units of βpar should correspond with the units of the other parameters in eq. 13. In the equation it is conservatively assumed that the combustion efficiency of the CLT is 100%. The contribution of timber is calculated iteratively using the following expression. (14) Where qmfl is the fuel load corresponding to the moveable fuel divided by the total surface area of the compartment boundaries in MJ/m2 (qmfl= qtd for compartments with non-combustible linings). ACLT is given in m2, dchar in mm, βpar in mm/min and t1max in min. The superscripted letter i denotes the number of the iteration, meaning that the char depth from the first calculation is used to calculate the fuel load density used for the second calculation (iteration) and so forth. From the analysis in Section 3.1, it was concluded that approximately 70% of the contribution of the timber combusts outside for at least the duration of the fully developed phase of a similar compartment without combustible linings (t1max). It should be noted that this is not valid if the moveable fuel load alone would not be sufficient to reach a fully developed state. A worked example of the iterative procedure is given in the appendix of this report. The number of iterations needed depends on whether the charring depth converges to a certain value. For this study the iterative calculations were stopped after a change of calculated charring depth in subsequent calculations was less than 0.1% or if the time of the fully developed phase exceeded 2 hours. Fires that have a continuous fully developed phase according to the calculations will never converge, as the fire duration will be extended with every iteration. ( )+
⋅ ⋅ − ⋅ ⋅= +
i 1CLT 1 char par maxi 1td mfl cA α d 0.7 β tq q A
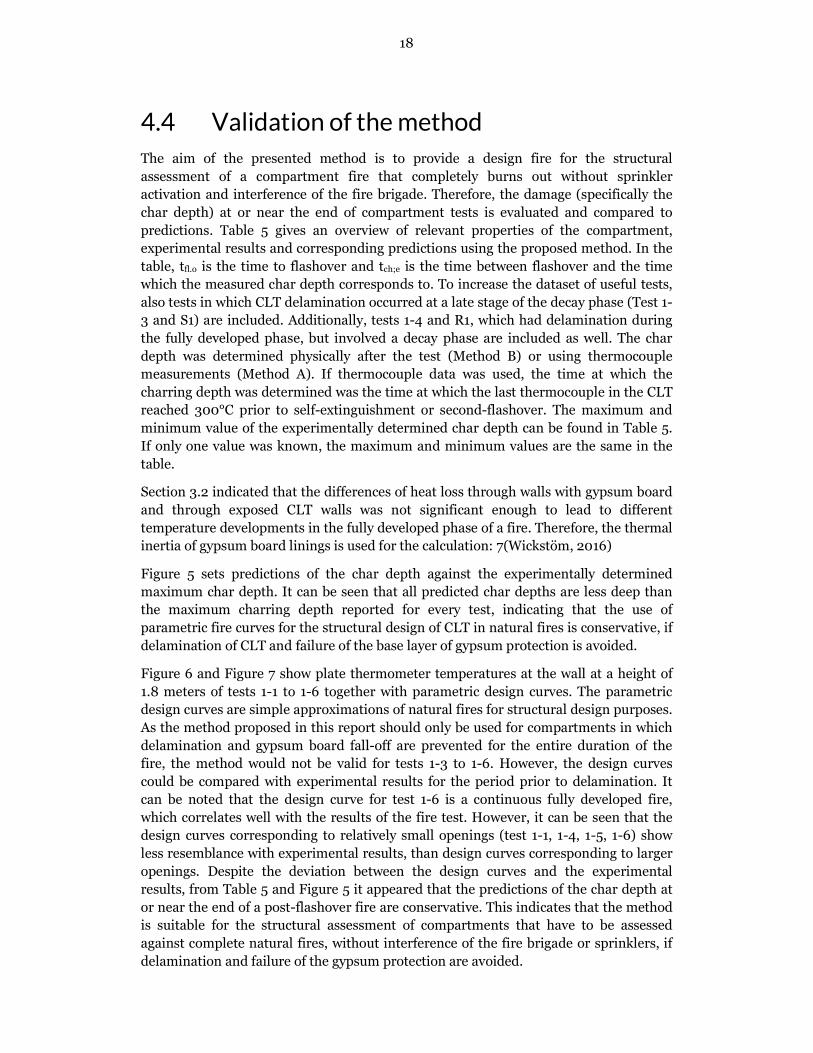
18 4.4 Validation of the method The aim of the presented method is to provide a design fire for the structural assessment of a compartment fire that completely burns out without sprinkler activation and interference of the fire brigade. Therefore, the damage (specifically the char depth) at or near the end of compartment tests is evaluated and compared to predictions. Table 5 gives an overview of relevant properties of the compartment, experimental results and corresponding predictions using the proposed method. In the table, tfl.o is the time to flashover and tch;e is the time between flashover and the time which the measured char depth corresponds to. To increase the dataset of useful tests, also tests in which CLT delamination occurred at a late stage of the decay phase (Test 1-3 and S1) are included. Additionally, tests 1-4 and R1, which had delamination during the fully developed phase, but involved a decay phase are included as well. The char depth was determined physically after the test (Method B) or using thermocouple measurements (Method A). If thermocouple data was used, the time at which the charring depth was determined was the time at which the last thermocouple in the CLT reached 300°C prior to self-extinguishment or second-flashover. The maximum and minimum value of the experimentally determined char depth can be found in Table 5. If only one value was known, the maximum and minimum values are the same in the table. Section 3.2 indicated that the differences of heat loss through walls with gypsum board and through exposed CLT walls was not significant enough to lead to different temperature developments in the fully developed phase of a fire. Therefore, the thermal inertia of gypsum board linings is used for the calculation: 7(Wickstöm, 2016) Figure 5 sets predictions of the char depth against the experimentally determined maximum char depth. It can be seen that all predicted char depths are less deep than the maximum charring depth reported for every test, indicating that the use of parametric fire curves for the structural design of CLT in natural fires is conservative, if delamination of CLT and failure of the base layer of gypsum protection is avoided. Figure 6 and Figure 7 show plate thermometer temperatures at the wall at a height of 1.8 meters of tests 1-1 to 1-6 together with parametric design curves. The parametric design curves are simple approximations of natural fires for structural design purposes. As the method proposed in this report should only be used for compartments in which delamination and gypsum board fall-off are prevented for the entire duration of the fire, the method would not be valid for tests 1-3 to 1-6. However, the design curves could be compared with experimental results for the period prior to delamination. It can be noted that the design curve for test 1-6 is a continuous fully developed fire, which correlates well with the results of the fire test. However, it can be seen that the design curves corresponding to relatively small openings (test 1-1, 1-4, 1-5, 1-6) show less resemblance with experimental results, than design curves corresponding to larger openings. Despite the deviation between the design curves and the experimental results, from Table 5 and Figure 5 it appeared that the predictions of the char depth at or near the end of a post-flashover fire are conservative. This indicates that the method is suitable for the structural assessment of compartments that have to be assessed against complete natural fires, without interference of the fire brigade or sprinklers, if delamination and failure of the gypsum protection are avoided.
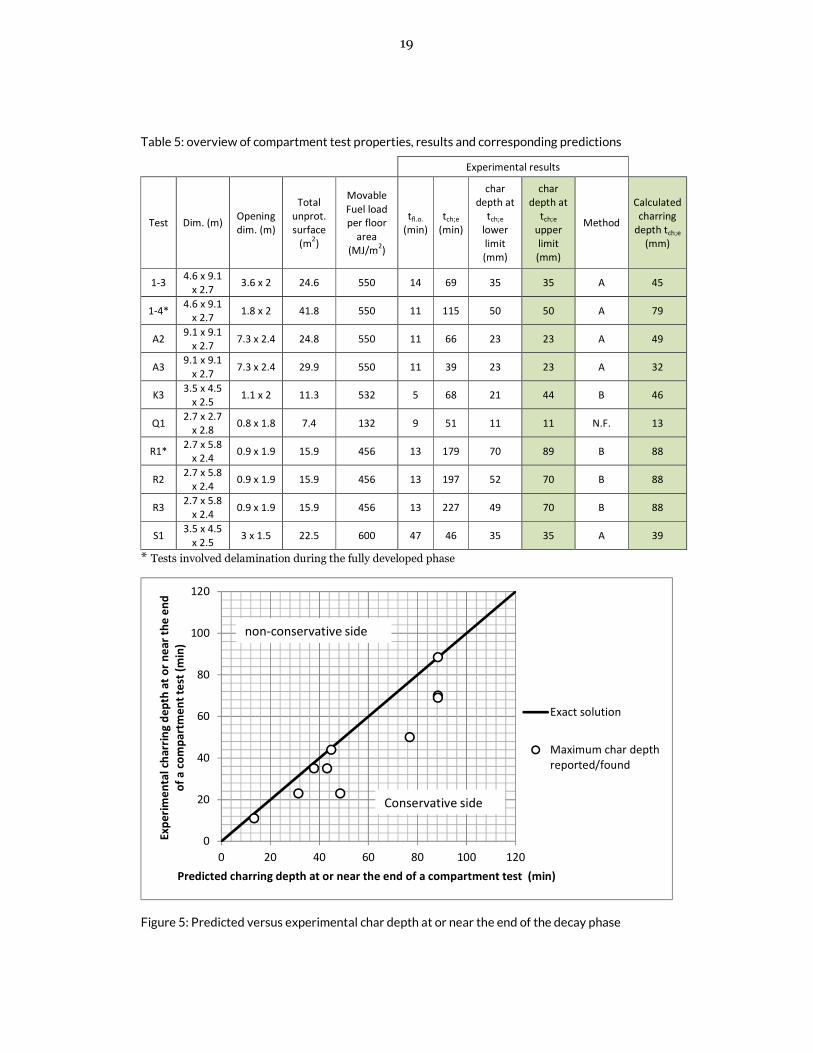
19 Table 5: overview of compartment test properties, results and corresponding predictions Experimental results Test Dim. (m) Opening dim. (m) Total unprot. surface (m2) Movable Fuel load per floor area (MJ/m2) tfl.o. (min) tch;e (min) char depth at tch;e lower limit (mm) char depth at tch;e upper limit (mm) Method Calculated charring depth tch;e (mm) 1-3 4.6 x 9.1 x 2.7 3.6 x 2 24.6 550 14 69 35 35 A 45 1-4* 4.6 x 9.1 x 2.7 1.8 x 2 41.8 550 11 115 50 50 A 79 A2 9.1 x 9.1 x 2.7 7.3 x 2.4 24.8 550 11 66 23 23 A 49 A3 9.1 x 9.1 x 2.7 7.3 x 2.4 29.9 550 11 39 23 23 A 32 K3 3.5 x 4.5 x 2.5 1.1 x 2 11.3 532 5 68 21 44 B 46 Q1 2.7 x 2.7 x 2.8 0.8 x 1.8 7.4 132 9 51 11 11 N.F. 13 R1* 2.7 x 5.8 x 2.4 0.9 x 1.9 15.9 456 13 179 70 89 B 88 R2 2.7 x 5.8 x 2.4 0.9 x 1.9 15.9 456 13 197 52 70 B 88 R3 2.7 x 5.8 x 2.4 0.9 x 1.9 15.9 456 13 227 49 70 B 88 S1 3.5 x 4.5 x 2.5 3 x 1.5 22.5 600 47 46 35 35 A 39 * Tests involved delamination during the fully developed phase Figure 5: Predicted versus experimental char depth at or near the end of the decay phase 020406080100120 0 20 40 60 80 100 120Experimental charring depth at or near the end of a compartment test (min)Predicted charring depth at or near the end of a compartment test (min)Exact solutionMaximum char depthreported/foundConservative sidenon-conservative side
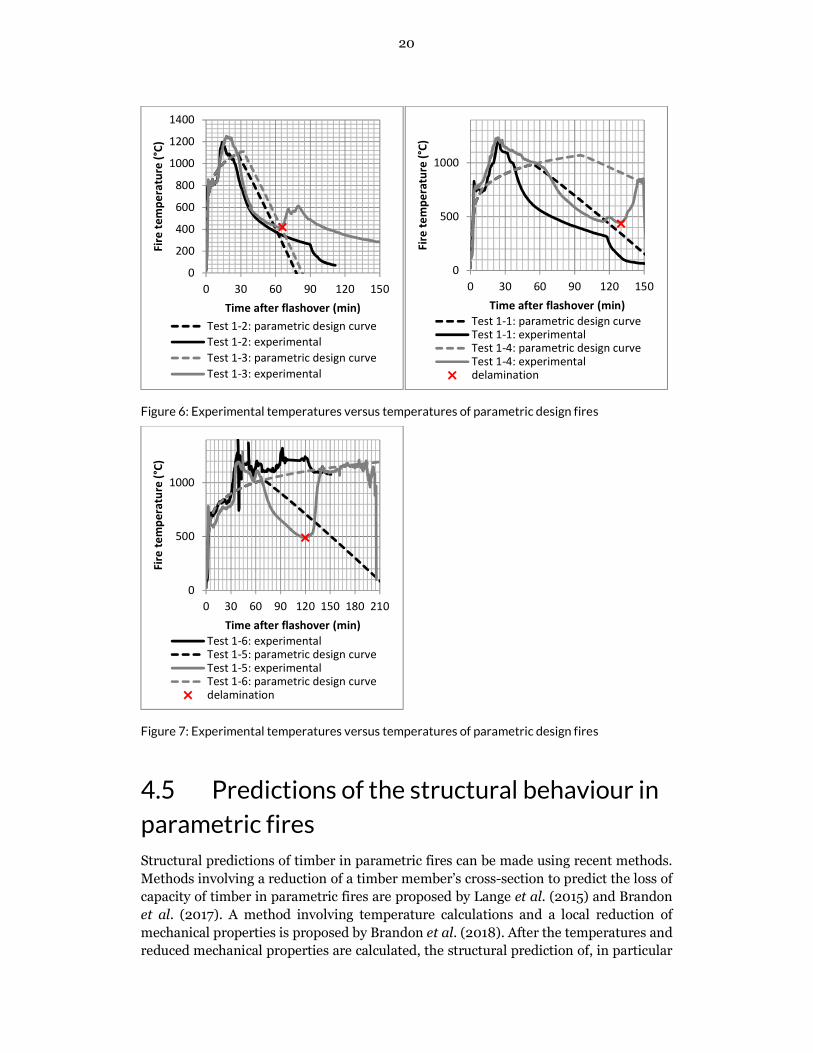
20 Figure 6: Experimental temperatures versus temperatures of parametric design fires Figure 7: Experimental temperatures versus temperatures of parametric design fires 4.5 Predictions of the structural behaviour in parametric fires Structural predictions of timber in parametric fires can be made using recent methods. Methods involving a reduction of a timber member’s cross-section to predict the loss of capacity of timber in parametric fires are proposed by Lange et al. (2015) and Brandon et al. (2017). A method involving temperature calculations and a local reduction of mechanical properties is proposed by Brandon et al. (2018). After the temperatures and reduced mechanical properties are calculated, the structural prediction of, in particular 0200400600800100012001400 0 30 60 90 120 150Fire temperature (°C) Time after flashover (min)Test 1-2: parametric design curveTest 1-2: experimentalTest 1-3: parametric design curveTest 1-3: experimental 05001000 0 30 60 90 120 150Fire temperature (°C) Time after flashover (min)Test 1-1: parametric design curveTest 1-1: experimentalTest 1-4: parametric design curveTest 1-4: experimentaldelamination05001000 0 30 60 90 120 150 180 210Fire temperature (°C) Time after flashover (min)Test 1-6: experimentalTest 1-5: parametric design curveTest 1-5: experimentalTest 1-6: parametric design curvedelamination
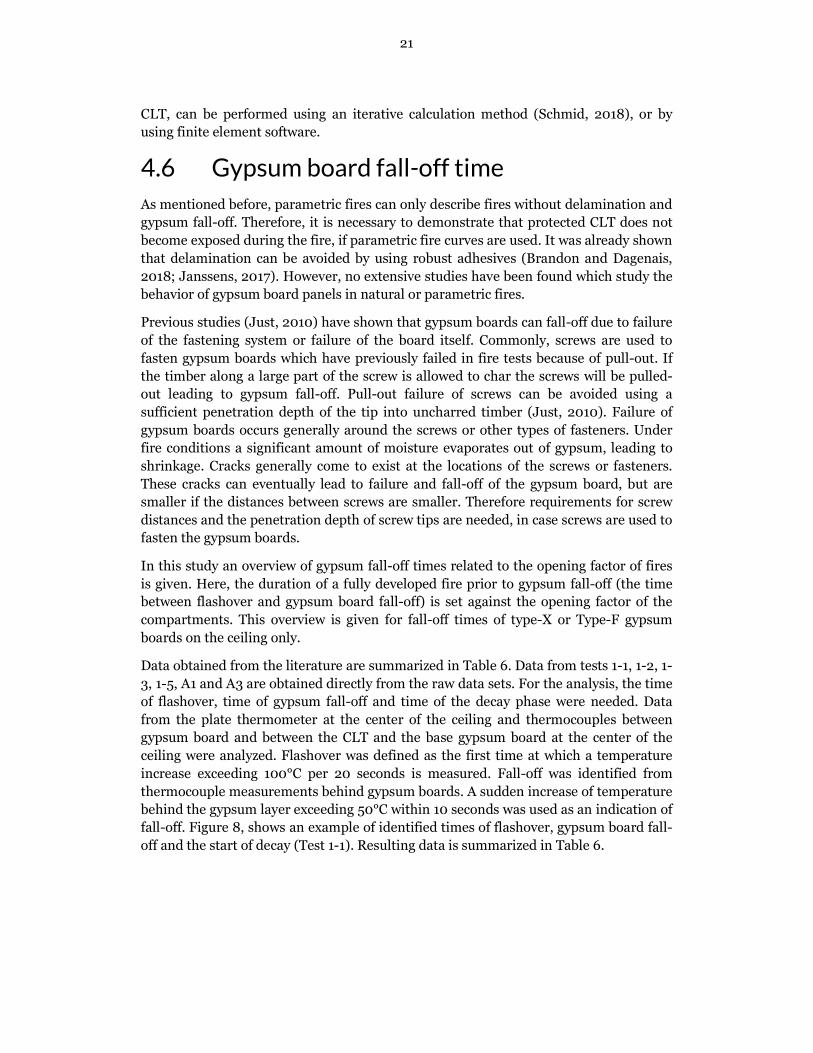
21 CLT, can be performed using an iterative calculation method (Schmid, 2018), or by using finite element software. 4.6 Gypsum board fall-off time As mentioned before, parametric fires can only describe fires without delamination and gypsum fall-off. Therefore, it is necessary to demonstrate that protected CLT does not become exposed during the fire, if parametric fire curves are used. It was already shown that delamination can be avoided by using robust adhesives (Brandon and Dagenais, 2018; Janssens, 2017). However, no extensive studies have been found which study the behavior of gypsum board panels in natural or parametric fires. Previous studies (Just, 2010) have shown that gypsum boards can fall-off due to failure of the fastening system or failure of the board itself. Commonly, screws are used to fasten gypsum boards which have previously failed in fire tests because of pull-out. If the timber along a large part of the screw is allowed to char the screws will be pulled-out leading to gypsum fall-off. Pull-out failure of screws can be avoided using a sufficient penetration depth of the tip into uncharred timber (Just, 2010). Failure of gypsum boards occurs generally around the screws or other types of fasteners. Under fire conditions a significant amount of moisture evaporates out of gypsum, leading to shrinkage. Cracks generally come to exist at the locations of the screws or fasteners. These cracks can eventually lead to failure and fall-off of the gypsum board, but are smaller if the distances between screws are smaller. Therefore requirements for screw distances and the penetration depth of screw tips are needed, in case screws are used to fasten the gypsum boards. In this study an overview of gypsum fall-off times related to the opening factor of fires is given. Here, the duration of a fully developed fire prior to gypsum fall-off (the time between flashover and gypsum board fall-off) is set against the opening factor of the compartments. This overview is given for fall-off times of type-X or Type-F gypsum boards on the ceiling only. Data obtained from the literature are summarized in Table 6. Data from tests 1-1, 1-2, 1-3, 1-5, A1 and A3 are obtained directly from the raw data sets. For the analysis, the time of flashover, time of gypsum fall-off and time of the decay phase were needed. Data from the plate thermometer at the center of the ceiling and thermocouples between gypsum board and between the CLT and the base gypsum board at the center of the ceiling were analyzed. Flashover was defined as the first time at which a temperature increase exceeding 100°C per 20 seconds is measured. Fall-off was identified from thermocouple measurements behind gypsum boards. A sudden increase of temperature behind the gypsum layer exceeding 50°C within 10 seconds was used as an indication of fall-off. Figure 8, shows an example of identified times of flashover, gypsum board fall-off and the start of decay (Test 1-1). Resulting data is summarized in Table 6.
22 Figure 8: Indication of flashover, gypsum fall-off and decay (Test 1-1) In the FPRF test series fall-off of the exposed gypsum layer from the ceiling was observed when the temperature behind the exposed gypsum board was between 300°C and 500°C. Using a temperature of 300°C on the unexposed side of the exposed gypsum layer as a criterion for fall-off makes it is possible to predict the fall-off time with temperature calculations. Therefore, for the calculations discussed in this section, fall-off is assumed to occur if and when the temperature behind the gypsum board reaches 300°C. This fall-off criterion is conservative in comparison with results of fire resistance tests summarized by Just (2010), which involved an extensive database in which none of the temperatures measured behind the exposed gypsum board was under 300°C at the moment of fall-off. 020040060080010001200 0 30 60 90 120 150 180Temperature (°C) Time (min)Plate thermometer 1 ceiling 34: TC_Ceiling_Center_2GB (°C)33: TC_Ceiling_Center_1GB (°C) 32: TC_Ceiling_Center_CLT (°C)Start of decay Flashover time (min)1st layer fall-off Interface base GB & CLTInterface middle & base GB Interface exposed & middle GBExposed GB fall-off
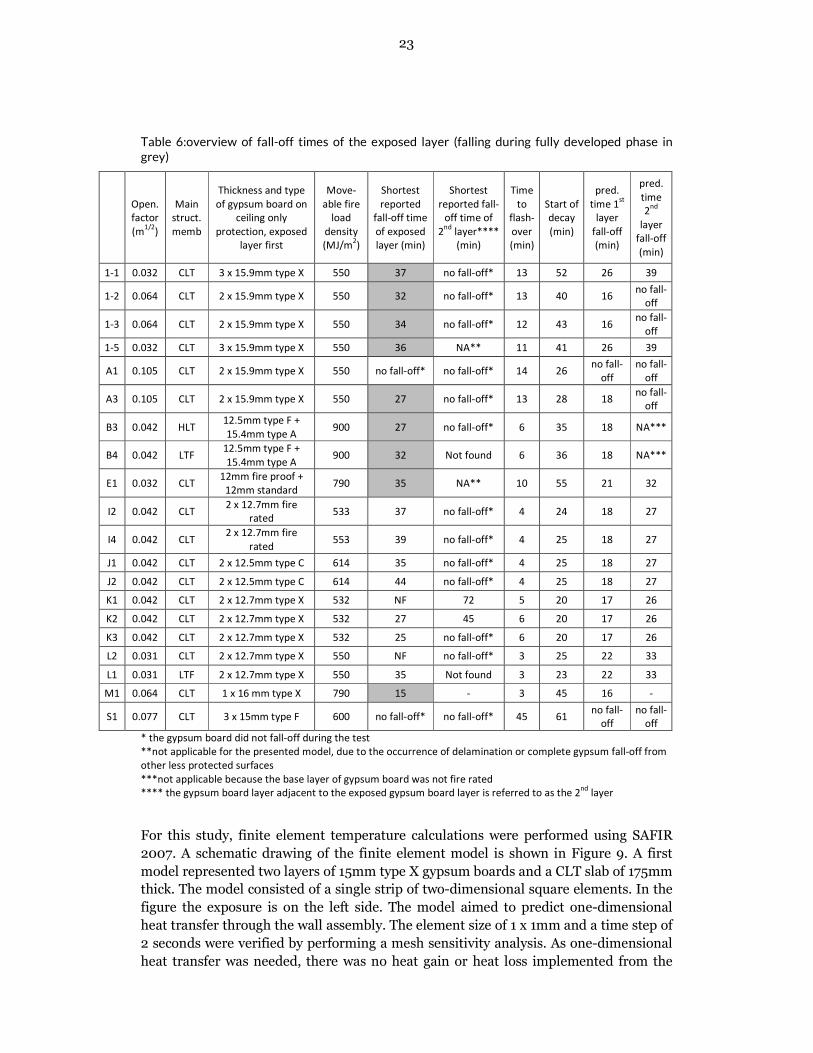
23 Table 6:overview of fall-off times of the exposed layer (falling during fully developed phase in grey) Open. factor (m1/2) Main struct. memb Thickness and type of gypsum board on ceiling only protection, exposed layer first Move-able fire load density (MJ/m2) Shortest reported fall-off time of exposed layer (min) Shortest reported fall-off time of 2nd layer**** (min) Time to flash-over (min) Start of decay (min) pred. time 1st layer fall-off (min) pred. time 2nd layer fall-off (min) 1-1 0.032 CLT 3 x 15.9mm type X 550 37 no fall-off* 13 52 26 39 1-2 0.064 CLT 2 x 15.9mm type X 550 32 no fall-off* 13 40 16 no fall-off 1-3 0.064 CLT 2 x 15.9mm type X 550 34 no fall-off* 12 43 16 no fall-off 1-5 0.032 CLT 3 x 15.9mm type X 550 36 NA** 11 41 26 39 A1 0.105 CLT 2 x 15.9mm type X 550 no fall-off* no fall-off* 14 26 no fall-off no fall-off A3 0.105 CLT 2 x 15.9mm type X 550 27 no fall-off* 13 28 18 no fall-off B3 0.042 HLT 12.5mm type F + 15.4mm type A 900 27 no fall-off* 6 35 18 NA*** B4 0.042 LTF 12.5mm type F + 15.4mm type A 900 32 Not found 6 36 18 NA*** E1 0.032 CLT 12mm fire proof + 12mm standard 790 35 NA** 10 55 21 32 I2 0.042 CLT 2 x 12.7mm fire rated 533 37 no fall-off* 4 24 18 27 I4 0.042 CLT 2 x 12.7mm fire rated 553 39 no fall-off* 4 25 18 27 J1 0.042 CLT 2 x 12.5mm type C 614 35 no fall-off* 4 25 18 27 J2 0.042 CLT 2 x 12.5mm type C 614 44 no fall-off* 4 25 18 27 K1 0.042 CLT 2 x 12.7mm type X 532 NF 72 5 20 17 26 K2 0.042 CLT 2 x 12.7mm type X 532 27 45 6 20 17 26 K3 0.042 CLT 2 x 12.7mm type X 532 25 no fall-off* 6 20 17 26 L2 0.031 CLT 2 x 12.7mm type X 550 NF no fall-off* 3 25 22 33 L1 0.031 LTF 2 x 12.7mm type X 550 35 Not found 3 23 22 33 M1 0.064 CLT 1 x 16 mm type X 790 15 - 3 45 16 - S1 0.077 CLT 3 x 15mm type F 600 no fall-off* no fall-off* 45 61 no fall-off no fall-off * the gypsum board did not fall-off during the test **not applicable for the presented model, due to the occurrence of delamination or complete gypsum fall-off from other less protected surfaces ***not applicable because the base layer of gypsum board was not fire rated **** the gypsum board layer adjacent to the exposed gypsum board layer is referred to as the 2nd layer For this study, finite element temperature calculations were performed using SAFIR 2007. A schematic drawing of the finite element model is shown in Figure 9. A first model represented two layers of 15mm type X gypsum boards and a CLT slab of 175mm thick. The model consisted of a single strip of two-dimensional square elements. In the figure the exposure is on the left side. The model aimed to predict one-dimensional heat transfer through the wall assembly. The element size of 1 x 1mm and a time step of 2 seconds were verified by performing a mesh sensitivity analysis. As one-dimensional heat transfer was needed, there was no heat gain or heat loss implemented from the
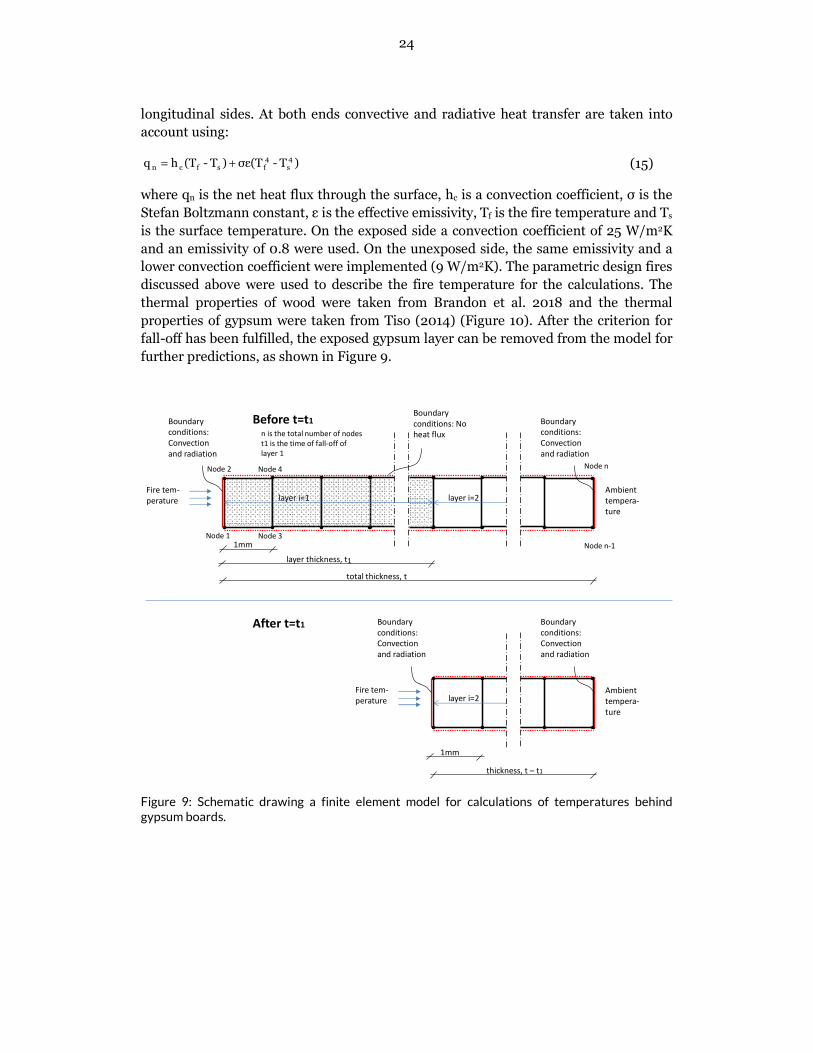
24 longitudinal sides. At both ends convective and radiative heat transfer are taken into account using: )T-σε(T)T-(Thq 4s4fsfcn += (15) where qn is the net heat flux through the surface, hc is a convection coefficient, σ is the Stefan Boltzmann constant, ε is the effective emissivity, Tf is the fire temperature and Ts is the surface temperature. On the exposed side a convection coefficient of 25 W/m2K and an emissivity of 0.8 were used. On the unexposed side, the same emissivity and a lower convection coefficient were implemented (9 W/m2K). The parametric design fires discussed above were used to describe the fire temperature for the calculations. The thermal properties of wood were taken from Brandon et al. 2018 and the thermal properties of gypsum were taken from Tiso (2014) (Figure 10). After the criterion for fall-off has been fulfilled, the exposed gypsum layer can be removed from the model for further predictions, as shown in Figure 9. Figure 9: Schematic drawing a finite element model for calculations of temperatures behind gypsum boards. Boundaryconditions: Convectionand radiationFire tem-perature 1mm total thickness, t Ambient tempera-tureBoundaryconditions: Convectionand radiationlayer thickness, t1layer i=1 layer i=2Boundaryconditions: Convectionand radiation 1mm thickness, t – t1 Ambient tempera-tureBoundaryconditions: Convectionand radiationlayer i=2Fire tem-peratureAfter t=t1Before t=t1Node 2Node 1 Node 4Node 3 Node nNode n-1n is the total number of nodest1 is the time of fall-off oflayer 1 Boundaryconditions: No heat flux
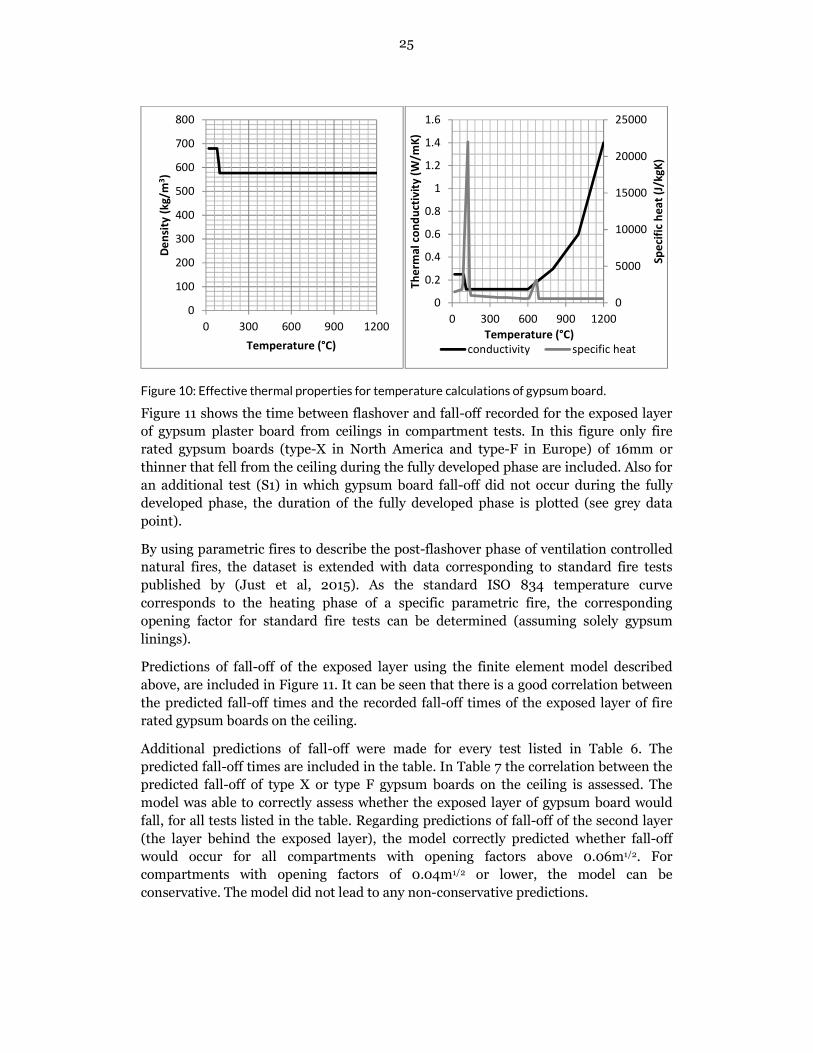
25 Figure 10: Effective thermal properties for temperature calculations of gypsum board. Figure 11 shows the time between flashover and fall-off recorded for the exposed layer of gypsum plaster board from ceilings in compartment tests. In this figure only fire rated gypsum boards (type-X in North America and type-F in Europe) of 16mm or thinner that fell from the ceiling during the fully developed phase are included. Also for an additional test (S1) in which gypsum board fall-off did not occur during the fully developed phase, the duration of the fully developed phase is plotted (see grey data point). By using parametric fires to describe the post-flashover phase of ventilation controlled natural fires, the dataset is extended with data corresponding to standard fire tests published by (Just et al, 2015). As the standard ISO 834 temperature curve corresponds to the heating phase of a specific parametric fire, the corresponding opening factor for standard fire tests can be determined (assuming solely gypsum linings). Predictions of fall-off of the exposed layer using the finite element model described above, are included in Figure 11. It can be seen that there is a good correlation between the predicted fall-off times and the recorded fall-off times of the exposed layer of fire rated gypsum boards on the ceiling. Additional predictions of fall-off were made for every test listed in Table 6. The predicted fall-off times are included in the table. In Table 7 the correlation between the predicted fall-off of type X or type F gypsum boards on the ceiling is assessed. The model was able to correctly assess whether the exposed layer of gypsum board would fall, for all tests listed in the table. Regarding predictions of fall-off of the second layer (the layer behind the exposed layer), the model correctly predicted whether fall-off would occur for all compartments with opening factors above 0.06m1/2. For compartments with opening factors of 0.04m1/2 or lower, the model can be conservative. The model did not lead to any non-conservative predictions. 0100200300400500600700800 0 300 600 900 1200Density (kg/m3 ) Temperature (°C) 050001000015000200002500000.20.40.60.811.21.41.6 0 300 600 900 1200 Specific heat (J/kgK)Thermal conductivity (W/mK) Temperature (°C)conductivity specific heat
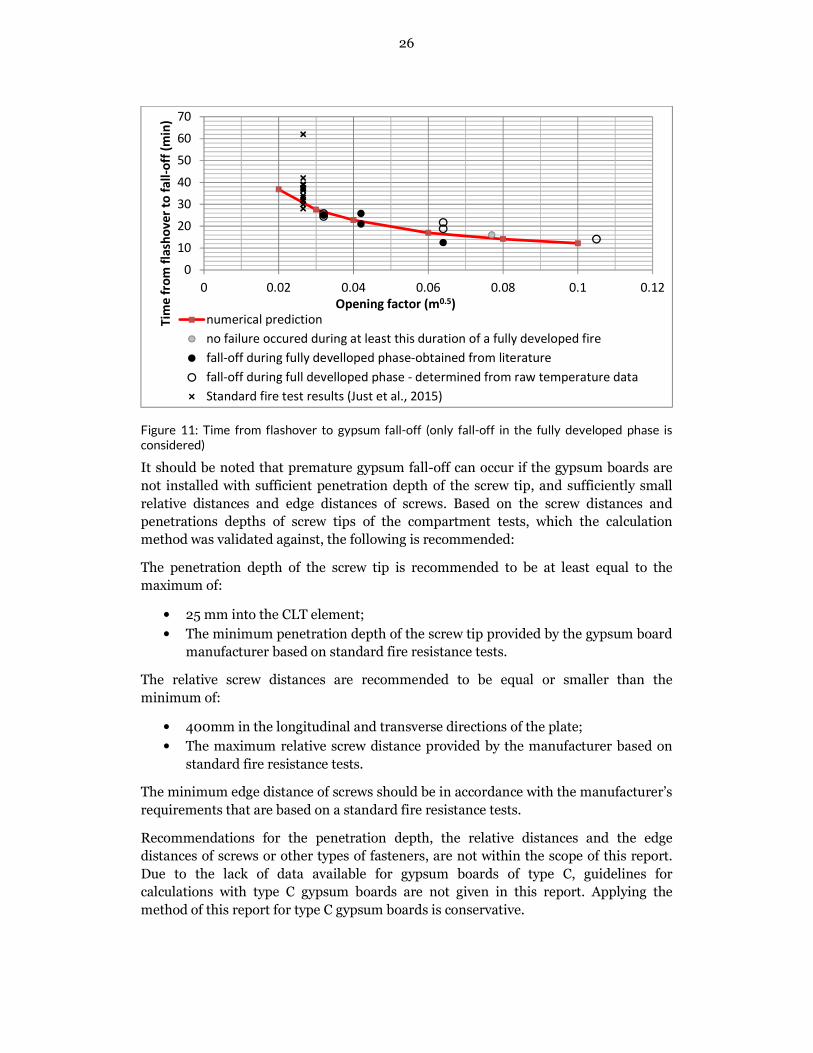
26 Figure 11: Time from flashover to gypsum fall-off (only fall-off in the fully developed phase is considered) It should be noted that premature gypsum fall-off can occur if the gypsum boards are not installed with sufficient penetration depth of the screw tip, and sufficiently small relative distances and edge distances of screws. Based on the screw distances and penetrations depths of screw tips of the compartment tests, which the calculation method was validated against, the following is recommended: The penetration depth of the screw tip is recommended to be at least equal to the maximum of: • 25 mm into the CLT element; • The minimum penetration depth of the screw tip provided by the gypsum board manufacturer based on standard fire resistance tests. The relative screw distances are recommended to be equal or smaller than the minimum of: • 400mm in the longitudinal and transverse directions of the plate; • The maximum relative screw distance provided by the manufacturer based on standard fire resistance tests. The minimum edge distance of screws should be in accordance with the manufacturer’s requirements that are based on a standard fire resistance tests. Recommendations for the penetration depth, the relative distances and the edge distances of screws or other types of fasteners, are not within the scope of this report. Due to the lack of data available for gypsum boards of type C, guidelines for calculations with type C gypsum boards are not given in this report. Applying the method of this report for type C gypsum boards is conservative. 010203040506070 0 0.02 0.04 0.06 0.08 0.1 0.12Time from flashover to fall-off (min) Opening factor (m0.5)numerical predictionno failure occured during at least this duration of a fully developed firefall-off during fully develloped phase-obtained from literaturefall-off during full develloped phase - determined from raw temperature dataStandard fire test results (Just et al., 2015)
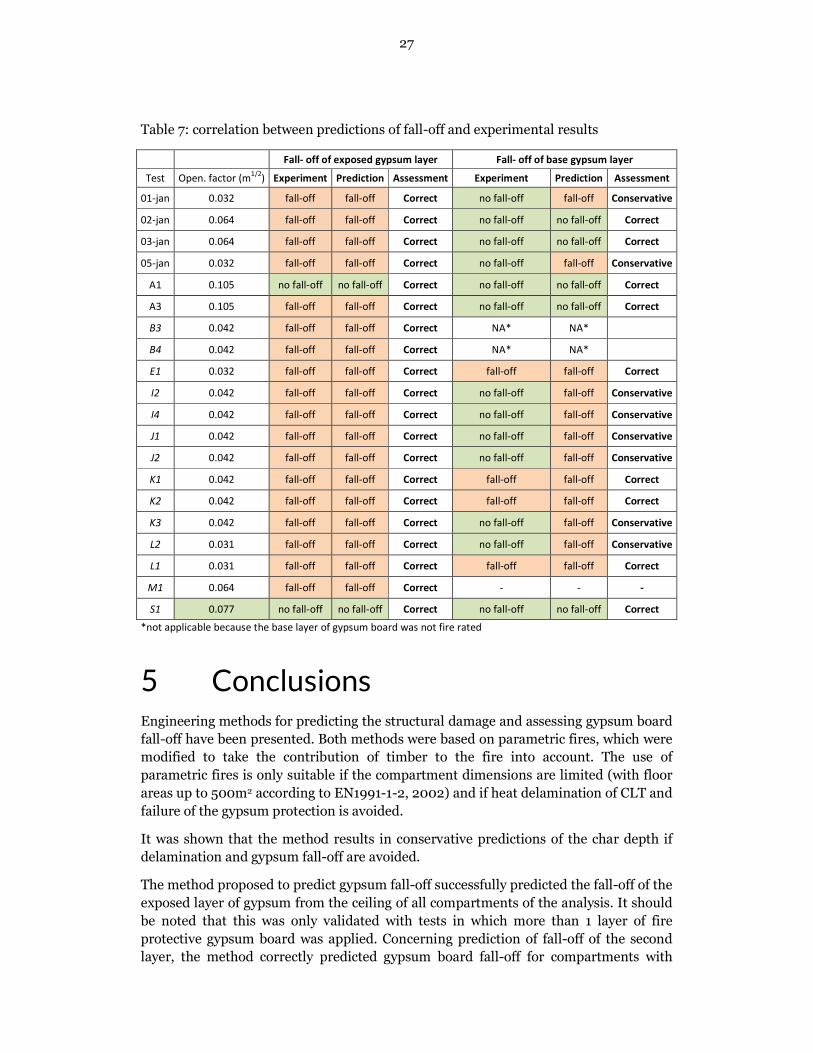
27 Table 7: correlation between predictions of fall-off and experimental results Fall- off of exposed gypsum layer Fall- off of base gypsum layer Test Open. factor (m1/2) Experiment Prediction Assessment Experiment Prediction Assessment 01-jan 0.032 fall-off fall-off Correct no fall-off fall-off Conservative 02-jan 0.064 fall-off fall-off Correct no fall-off no fall-off Correct 03-jan 0.064 fall-off fall-off Correct no fall-off no fall-off Correct 05-jan 0.032 fall-off fall-off Correct no fall-off fall-off Conservative A1 0.105 no fall-off no fall-off Correct no fall-off no fall-off Correct A3 0.105 fall-off fall-off Correct no fall-off no fall-off Correct B3 0.042 fall-off fall-off Correct NA* NA* B4 0.042 fall-off fall-off Correct NA* NA* E1 0.032 fall-off fall-off Correct fall-off fall-off Correct I2 0.042 fall-off fall-off Correct no fall-off fall-off Conservative I4 0.042 fall-off fall-off Correct no fall-off fall-off Conservative J1 0.042 fall-off fall-off Correct no fall-off fall-off Conservative J2 0.042 fall-off fall-off Correct no fall-off fall-off Conservative K1 0.042 fall-off fall-off Correct fall-off fall-off Correct K2 0.042 fall-off fall-off Correct fall-off fall-off Correct K3 0.042 fall-off fall-off Correct no fall-off fall-off Conservative L2 0.031 fall-off fall-off Correct no fall-off fall-off Conservative L1 0.031 fall-off fall-off Correct fall-off fall-off Correct M1 0.064 fall-off fall-off Correct - - - S1 0.077 no fall-off no fall-off Correct no fall-off no fall-off Correct *not applicable because the base layer of gypsum board was not fire rated 5 Conclusions Engineering methods for predicting the structural damage and assessing gypsum board fall-off have been presented. Both methods were based on parametric fires, which were modified to take the contribution of timber to the fire into account. The use of parametric fires is only suitable if the compartment dimensions are limited (with floor areas up to 500m2 according to EN1991-1-2, 2002) and if heat delamination of CLT and failure of the gypsum protection is avoided. It was shown that the method results in conservative predictions of the char depth if delamination and gypsum fall-off are avoided. The method proposed to predict gypsum fall-off successfully predicted the fall-off of the exposed layer of gypsum from the ceiling of all compartments of the analysis. It should be noted that this was only validated with tests in which more than 1 layer of fire protective gypsum board was applied. Concerning prediction of fall-off of the second layer, the method correctly predicted gypsum board fall-off for compartments with
28 medium to high opening factors. Predictions of fall-off for compartments with opening factors equal to or lower than 0.04m1/2 were more conservative. A method to avoid heat delamination of CLT involves the use of non-delaminating adhesives. Some of these adhesives were identified by Janssens (2017) and Brandon and Dagenais (2018). It should be noted that delamination and fall-off of the base layer of gypsum boards do not necessarily lead to a secondary flashover in the late stages of a fire. However, the model presented in this report is not equipped to consider the effects of delamination or fall-off of the base layer. The approach taken is conservative as it does not allow delamination and fall-off of the base layer during the whole fire, but may be extended to consider the effects of delamination of fall-off of the base layer at a late stage of the fire in future studies. Acknowledgements The author gratefully acknowledges the Fire Protection Research Foundation, Property Insurance Research Group, U.S. Department of Agriculture, U.S. Forest Service and the American Wood Council for the financial support that made this project possible. The author gratefully acknowledges Amanda Kimball, Joseph Su, Matthew Hoehler, Birgit Östman, Casey Grant and the technical panel for their advice and corrections. References Barnett CR (2002) BFD curve: A New Empirical Model for Fire Compartment Temperatures. Fire Safety J 37: 437-463. Brandon D., Östman B. (2016) Fire Safety Challenges of Tall Wood Buildings – Phase 2: Literature Review. NFPA report: FPRF-2016-22. Brandon D., Dagenais C. (2018) Fire Safety Challenges of Tall Wood Buildings – Phase 2: Task 5 – Experimental Study of Delamination of Cross Laminated Timber (CLT) in Fire. NFPA report: FPRF-2018-xx (DRAFT) Brandon D., Lange D., Wickström U., Schmid S. (2018) Parametric fire design of timber structures – implementation of a local-material-property-reduction method. Submitted to Fire Technology. Brandon D., Just A., Lange D., Tiso M. (2017) Parametric fire design – Zero-Strength-Layers and Charring Rates. Brandon D. and Just A. (2018) Fire Safety Design of CLT buildings – an experimental case study. RISE rapport 2018:24 Research Institutes of Sweden, Stockholm, Sweden. ISBN 978-91-88695-59-8. Emberley R., Gorska Putynska C., Bolanos A., Lucherini A., Solarte A. , Soriguer D., Gutierrez Gonzalez M., Humphreys K., Hidalgo JP., Maluk C., Law A., and Torero JL. (2017) Description of Small and Large-Scale CLT Fire Tests, Fire Safety Journal, doi:10.1016/j.firesaf.2017.03.024
29 EN1991-1-2 (2002) Eurocode 1: Actions on structures - Part 1-2: General actions - Actions on structures exposed to fire. CEN, Brussels. Frangi, A., & Fontana, M. (2005). Fire Performance of Timber Structures under Natural Fire Conditions. Fire Safety Science Symposium 8: 279-290. IAFSS, Beijing, China. Frangi, A., Bochicchio, G., Ceccotti, A., Lauriola, M. (2008). Natural Full-Scale Fire Test on a 3 Storey XLam Timber Building. Engineered Wood Products Association, Madison, Wisconsin, USA. Franssen JM (1999) Improvement of the Parametric Fire of Eurocode 1 based on Experimental Results. Hadden RM., Bartlett AI., Hidalgo JP., Santamaria S., Wiesner F., Bisby LA., Deeny S., Lane B. (2017) Effects of exposed cross laminated timber on compartment fire dynamics. Fire Safety Journal (91): 480-489. Hadvig S (1981) Charring of wood in building fires. Technical University of Denmark. ISBN 87-87 245-83-3. Hakkarainen T. (2002) Post-flashover fire in light and heavy timber construction compartments. Journal of Fire Sciences, 20 (2002): 133-175. Hopkin, D., El-Rimawi, J., Silberschmidt, V., and Lennon, T. (2011) An effective thermal property framework for softwood in parametric design fires. Journal of Construction & Building Materials 25(5), pp 2584-2595. Janssens (2017) Development of a fire performance assessment methodology for qualifying cross-laminated timber adhesives. South West Research Institute Just A. (2010) Structural fire design of timber frame assemblies Insulated by glass wool and covered by gypsum plasterboards. PhD Thesis. Tallinn University of Technology, Estonia. Just A, Kraudok K, Schmid J, Östman B (2015) Protection by gypsum plasterboads – state of the art. In: Werther N, Winter S, Proceedings of the 1st European Workshop, Fire Safety of Green Buildings. TU Munich, Germany König (2005) Effective thermal actions and thermal properties of timber members in natural fires. Fire and Material 30(1): 51-63. Lange D., Boström L., Schmid J., Albrektsson J. (2015) The reduced cross section method applied to glulam timber exposed to non-standard fire curves. Fire Technology DOI: 10.1007/s10694-015-0485-y Lennon T., Moore D. (2003) The natural fire safety concept – full scale tests at Cardington. Fire Safety Journal 38(7): 623-643. Lie TT (1974) Characteristics Temperature Curves for Various Fire Severities. Fire Technology 10(4): 315-326. Li X., Zhang X., Hadjisophocleus G., McGregor C. (2014) Experimental study of combustible and non-combustible construction in a natural fire. Fire Technology, 2014.
30 Magnusson S.E., Thelanderson S. (1970) Temperature-time curves of complete process of fire development. Acta Polytechnica Scandinavica, 65. McGregor, C.J. (2014) Contribution of cross-laminated timber panels to room fires. Master thesis. Department of Civil and Environmental Engineering Carleton University. Ottawa-Carleton Institute of Civil and Environmental Engineering, Ottawa, Ontario, Canada. Medina Hevia A.R. (2014). Fire resistance of partially protected cross-laminated timber rooms. Master thesis. Department of Civil and Environmental Engineering Carleton University. Ottawa-Carleton Institute of Civil and Environmental Engineering, Ottawa, Ontario, Canada. Ma Z and Makelainen P (2000) Parametric Temperature-Time Curves of Medium Compartment Fires for Structural Design. Fire Safety J 34: 361-375. Mehaffey JR (1999) Performance-Based Design of Fire Resistance in Wood-Frame Buildings. In: Interflam 1999: 293-304. Petterson O, Magnusson SE and Thou J (1974) Fire Engineering Design of Steel Structures. Swedish Institute of Steel Construction, Bulletin 50. Schleich JB., Cajot LG., Pierre M., Moore D., Lennon T., Kruppa J., Joyeax D., Huller V., Hosser D., Dobbernack R., Kirchner U., Eger U., Twilt L., Van Oerle J., Kokkala M., Hostikka S. (2003) Natural fire safety concept – Full-scale tests, implementation in the Eurocodes and development of a user-friendly design tool. Shipp P (2016) Personal communication Su J.Z. and Lougheed G.D. (2014) Report to research consortium for wood and wood hybrid mid-rise buildings – Fire safety summary – Fire research conducted for the project on mid-rise wood construction. National Research Council Canada, Client report: A1-004377.1, Ottawa, Ontario, Canada. Schmid J. (2018) CST fire. submitted to Fire Technology. Schmid J., Santomaso A., Brandon D., Wickström U., Frangi, A. (2017) Timber under real fire conditions – the influence of oxygen content and gas velocity on the charring behaviour. Su J.Z. and Muradori S. (2015) Fire demonstration – Cross-laminated timber stair/elevator shaft. National Research Council Canada, Client report: A1-004377.1, Ottawa, Ontario, Canada. Su J. Lafrance P-S. Hoehler M. Bundy M. (2017) Cross Laminated Timber Compartment Fire Tests for Research on Fire Safety Challenges of Tall Wood Buildings – Phase 2 (DRAFT). Tiso M (2014) Charring behavior of cross-laminated timber with respect to the fire protection; comparison of different methods in small, model and large scale with simulations. Master Thesis. Univeristy of Trieste, Italy. Wickström U. (1986). Application of the standard fire curve for expressing natural fires for design purposes. Fire Safety: Science and Engineering, ASTM STP 882
31 Wickström U. (2016) Temperature Calculation in Fire Safety Engineering. Springer International Publishing AG, Switzerland. Zelinka, S.L.; Hasburgh, L.E.; Bourne, K.L.; Tucholski, D.R. Oullette, J.P. (2018). Compartment fire testing of a two-storey mass timber building. General Technical Report FPL-GTR-247. Madison, WI. U.S. Department of Agriculture, Forest Service, Forest Products Laboratory.
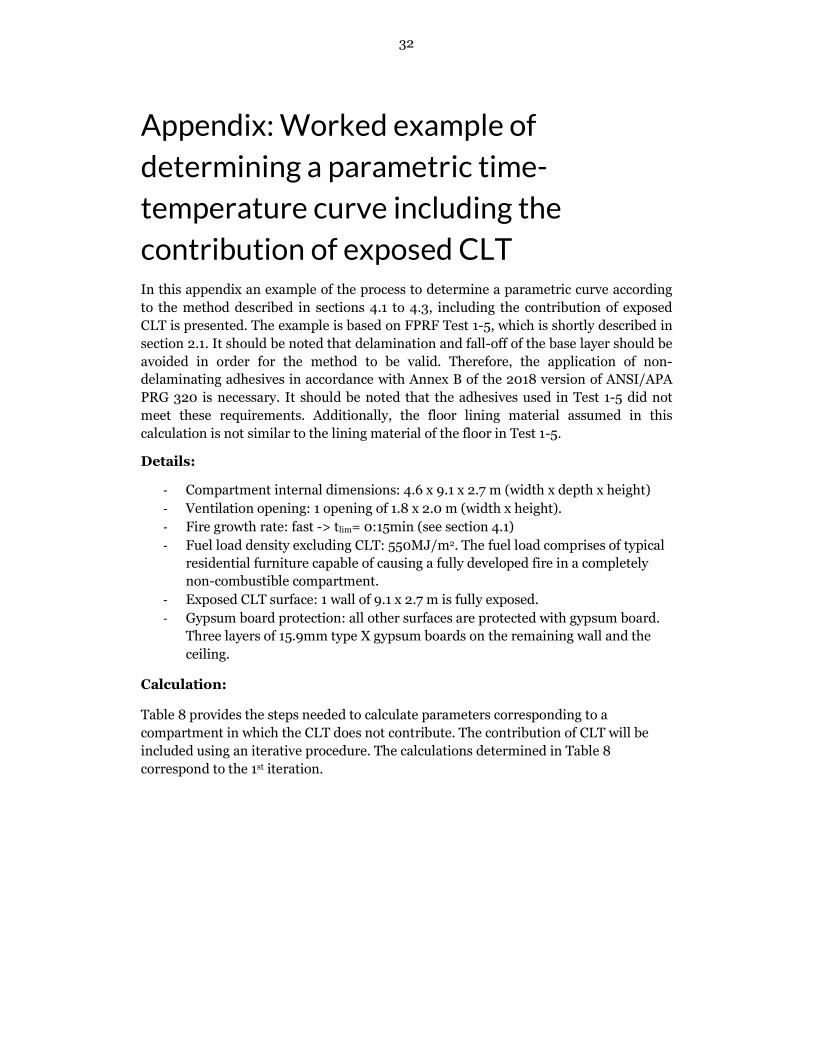
32 Appendix: Worked example of determining a parametric time-temperature curve including the contribution of exposed CLT In this appendix an example of the process to determine a parametric curve according to the method described in sections 4.1 to 4.3, including the contribution of exposed CLT is presented. The example is based on FPRF Test 1-5, which is shortly described in section 2.1. It should be noted that delamination and fall-off of the base layer should be avoided in order for the method to be valid. Therefore, the application of non-delaminating adhesives in accordance with Annex B of the 2018 version of ANSI/APA PRG 320 is necessary. It should be noted that the adhesives used in Test 1-5 did not meet these requirements. Additionally, the floor lining material assumed in this calculation is not similar to the lining material of the floor in Test 1-5. Details: - Compartment internal dimensions: 4.6 x 9.1 x 2.7 m (width x depth x height) - Ventilation opening: 1 opening of 1.8 x 2.0 m (width x height). - Fire growth rate: fast -> tlim= 0:15min (see section 4.1) - Fuel load density excluding CLT: 550MJ/m2. The fuel load comprises of typical residential furniture capable of causing a fully developed fire in a completely non-combustible compartment. - Exposed CLT surface: 1 wall of 9.1 x 2.7 m is fully exposed. - Gypsum board protection: all other surfaces are protected with gypsum board. Three layers of 15.9mm type X gypsum boards on the remaining wall and the ceiling. Calculation: Table 8 provides the steps needed to calculate parameters corresponding to a compartment in which the CLT does not contribute. The contribution of CLT will be included using an iterative procedure. The calculations determined in Table 8 correspond to the 1st iteration.
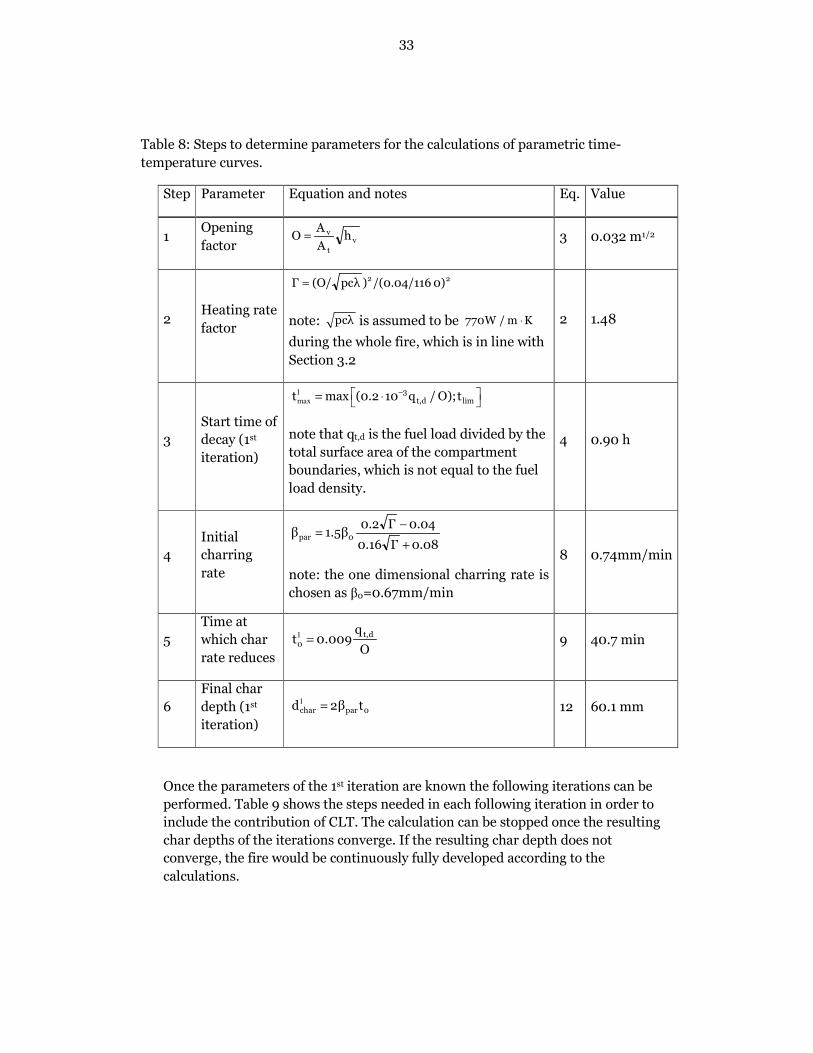
33 Table 8: Steps to determine parameters for the calculations of parametric time-temperature curves. Step Parameter Equation and notes Eq. Value 1 Opening factor vtv hAAO = 3 0.032 m1/2 2 Heating rate factor 22 0)/(0.04/116)pcλ(O/Γ = note: pcλ is assumed to be ⋅770W / m K during the whole fire, which is in line with Section 3.2 2 1.48 3 Start time of decay (1st iteration) 1
max
− = ⋅ 3 t,d limt max (0.2 10 q / O);t note that qt,d is the fuel load divided by the total surface area of the compartment boundaries, which is not equal to the fuel load density. 4 0.90 h 4 Initial charring rate 0.08Γ0.16 0.04Γ0.21.5ββ 0par+
−= note: the one dimensional charring rate is chosen as β0=0.67mm/min 8 0.74mm/min 5 Time at which char rate reduces 1
=t,d0 qt 0.009 O 9 40.7 min 6 Final char depth (1st iteration) 1
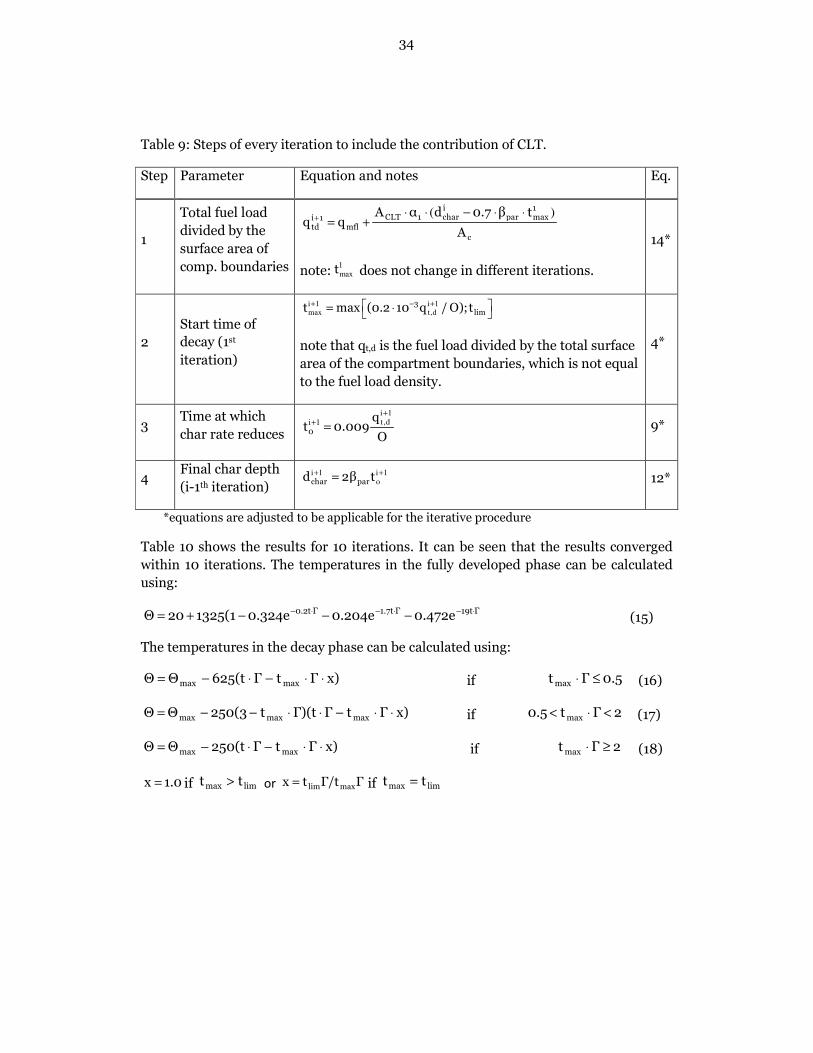
=char par 0d 2β t 12 60.1 mm Once the parameters of the 1st iteration are known the following iterations can be performed. Table 9 shows the steps needed in each following iteration in order to include the contribution of CLT. The calculation can be stopped once the resulting char depths of the iterations converge. If the resulting char depth does not converge, the fire would be continuously fully developed according to the calculations.
34 Table 9: Steps of every iteration to include the contribution of CLT. Step Parameter Equation and notes Eq. 1 Total fuel load divided by the surface area of comp. boundaries note: 1
maxt does not change in different iterations. 14* 2 Start time of decay (1st iteration) i 1 i 1
max t,d
+ − + = ⋅ 3 limt max (0.2 10 q / O);t note that qt,d is the fuel load divided by the total surface area of the compartment boundaries, which is not equal to the fuel load density. 4* 3 Time at which char rate reduces i 1
t ,di 1
+
+=0 qt 0.009 O 9* 4 Final char depth (i-1th iteration) i 1 i 1
o
+ +=char pard 2β t 12* *equations are adjusted to be applicable for the iterative procedure Table 10 shows the results for 10 iterations. It can be seen that the results converged within 10 iterations. The temperatures in the fully developed phase can be calculated using: Γ19tΓ1.7tΓ0.2t 0.472e0.204e0.324e1325(120Θ ⋅−⋅−⋅−
−−−+= (15) The temperatures in the decay phase can be calculated using: x)ΓtΓ625(tΘΘ maxmax ⋅⋅−⋅−= if 0.5Γt max ≤⋅ (16) x)ΓtΓΓ)(tt250(3ΘΘ maxmaxmax ⋅⋅−⋅⋅−−= if 2Γt0.5 max <⋅< (17) x)ΓtΓ250(tΘΘ maxmax ⋅⋅−⋅−= if 2Γt max ≥⋅ (18) 1.0x = if limmax tt > or ΓΓ/ttx maxlim= if limmax tt = ( )+
⋅ ⋅ − ⋅ ⋅= +
i 1CLT 1 char par maxi 1td mfl cA α d 0.7 β tq q A
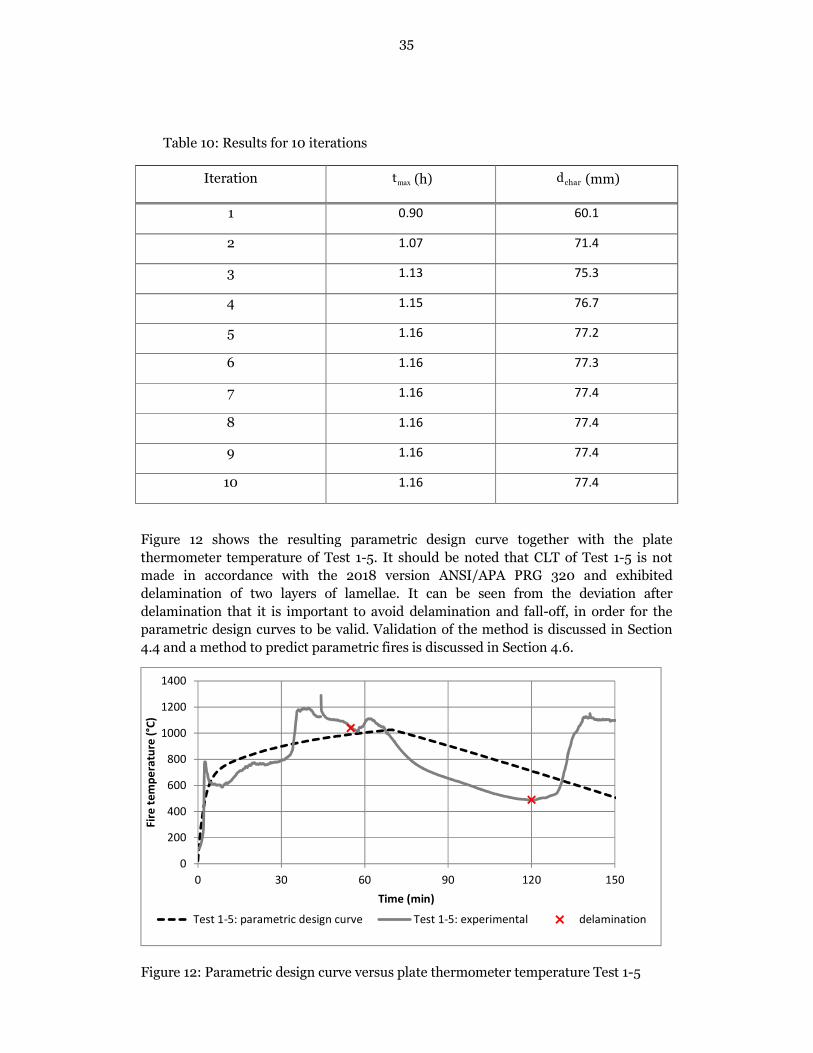
35 Table 10: Results for 10 iterations Iteration maxt (h) chard (mm) 1 0.90 60.1 2 1.07 71.4 3 1.13 75.3 4 1.15 76.7 5 1.16 77.2 6 1.16 77.3 7 1.16 77.4 8 1.16 77.4 9 1.16 77.4 10 1.16 77.4 Figure 12 shows the resulting parametric design curve together with the plate thermometer temperature of Test 1-5. It should be noted that CLT of Test 1-5 is not made in accordance with the 2018 version ANSI/APA PRG 320 and exhibited delamination of two layers of lamellae. It can be seen from the deviation after delamination that it is important to avoid delamination and fall-off, in order for the parametric design curves to be valid. Validation of the method is discussed in Section 4.4 and a method to predict parametric fires is discussed in Section 4.6. Figure 12: Parametric design curve versus plate thermometer temperature Test 1-5 0200400600800100012001400 0 30 60 90 120 150Fire temperature (°C) Time (min)Test 1-5: parametric design curve Test 1-5: experimental delamination

36
37 Through our international collaboration programmes with academia, industry, and the public sector, we ensure the competitiveness of the Swedish business community on an international level and contribute to a sustainable society. Our 2,200 employees support and promote all manner of innovative processes, and our roughly 100 testbeds and demonstration facilities are instrumental in developing the future-proofing of products, technologies, and services. RISE Research Institutes of Sweden is fully owned by the Swedish state. I internationell samverkan med akademi, näringsliv och offentlig sektor bidrar vi till ett konkurrenskraftigt näringsliv och ett hållbart samhälle. RISE 2 200 medarbetare driver och stöder alla typer av innovationsprocesser. Vi erbjuder ett 100-tal test- och demonstrationsmiljöer för framtidssäkra produkter, tekniker och tjänster. RISE Research Institutes of Sweden ägs av svenska staten. RISE Research Institutes of Sweden AB Box 5608, SE-114 86 STOCKHOLM, Sweden Telephone: +46 10 516 50 00 E-mail: [email protected], Internet: www.ri.se

38