Embed Size (px)
Citation preview
FireEye App for Splunk Enterprise
DocumentationVersion 1.1
FireEye App for Splunk Enterprise
Table of Contents
FireEye App for Splunk Enterprise
Welcome 3
Supported FireEye Event Formats 3
Original Build Environment 3
Possible Dashboard Configurations 4
Screenshots 4
Installing the FireEye App for Splunk Enterprise 7
Procedures 7
Configuring Splunk 8
Splunk User 10
SYSLOG - TCP & UDP 11
Configuring FireEye 13
JSON over HTTPS 13
XML over SYSLOG (TCP) 15
Troubleshooting 16
Using Curl 16
Splunk Search 17
Project Contact Information 18
3 FireEye App for Splunk Enterprise Documentation Version 1.1
WelcomeThis document provides instructions on installing the FireEye App for Splunk Enterprise and configuring the devices to communicate.
Supported FireEye Event Formats
Order of preference:
# Protocol Enc Reason1 HTTPS JSON Yes Encrypted, lighter than XML2 HTTPS XML Yes Encrypted
3 SYSLOG - TCP XML NoTCP does not require command-line configuration on FireEye Appliance
4 SYSLOG - UDP XML No XML provides more data than CEF and CSV
5 SYSLOG - TCP CEF No TCP does not require command-line configuration on FireEye Appliance
6 SYSLOG - UDP CEF No Provides more data than CSV
7 SYSLOG - TCP CSV NoTCP does not require command-line configuration on FireEye Appliance
8 SYSLOG - UDP CSV No Last resort - May not send protocol field
General notes:When sending JSON or XML to EX, use concise alerting
For everything else, use normal alerting
Warning:Preference is to use TCP, but if UDP is necessary -- set FireEye UDP syslog to max chunk-size of 4096:
ssh admin@<FireEyeBox>enconf tfenotify rsyslog trap-sink <splunk_connector> chunk-size 4096
Original Build Environment•Linux base OS
•Splunk 6.X
•FireEye Appliances - CM, NX, EX, AX, FX and HX
4 FireEye App for Splunk Enterprise Documentation Version 1.1
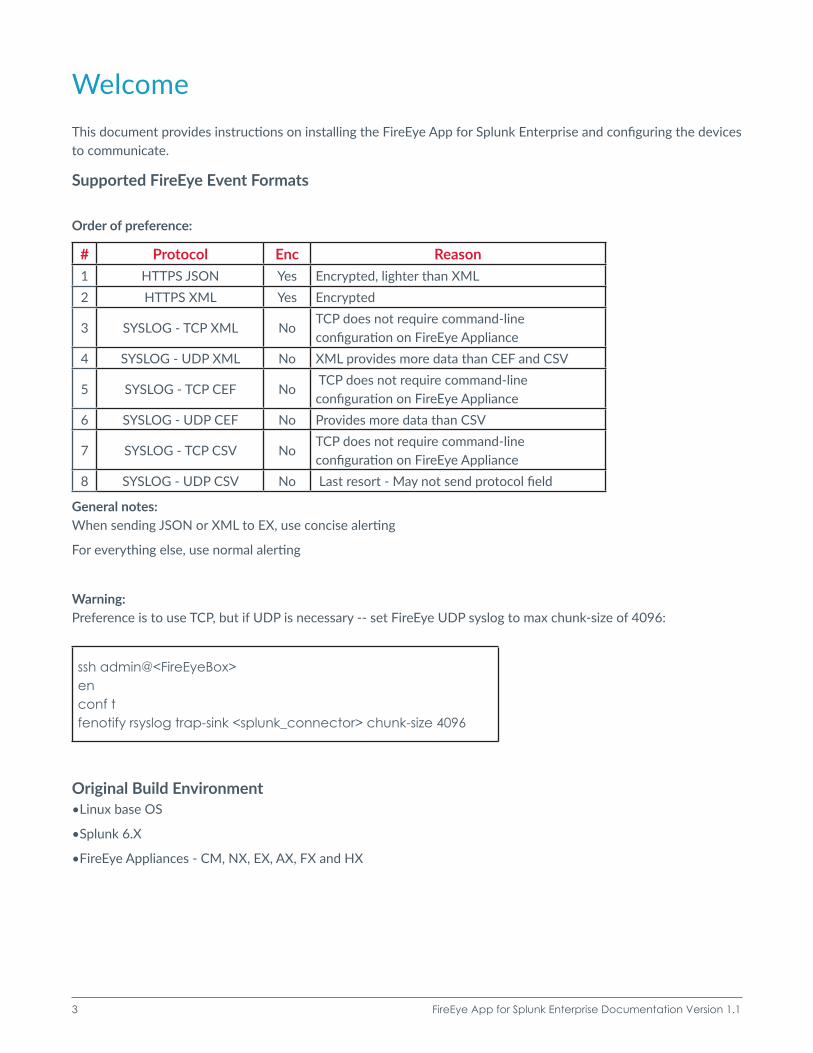
Possible Dashboard Configurations
Visualization: Intended as a heads-up display for a NOC/SOC. GeoIP, trends, and charts.
Analysis: Analyst dashboard contains more detailed event data
Comprehensive: All panels displayed on one screen--Visualization + Comprehensive
ScreenshotsThe screenshots below provide default dashboards included in the FireEye App for Splunk Enterprise.
Figure 1: Analytics Dashboard
5 FireEye App for Splunk Enterprise Documentation Version 1.1
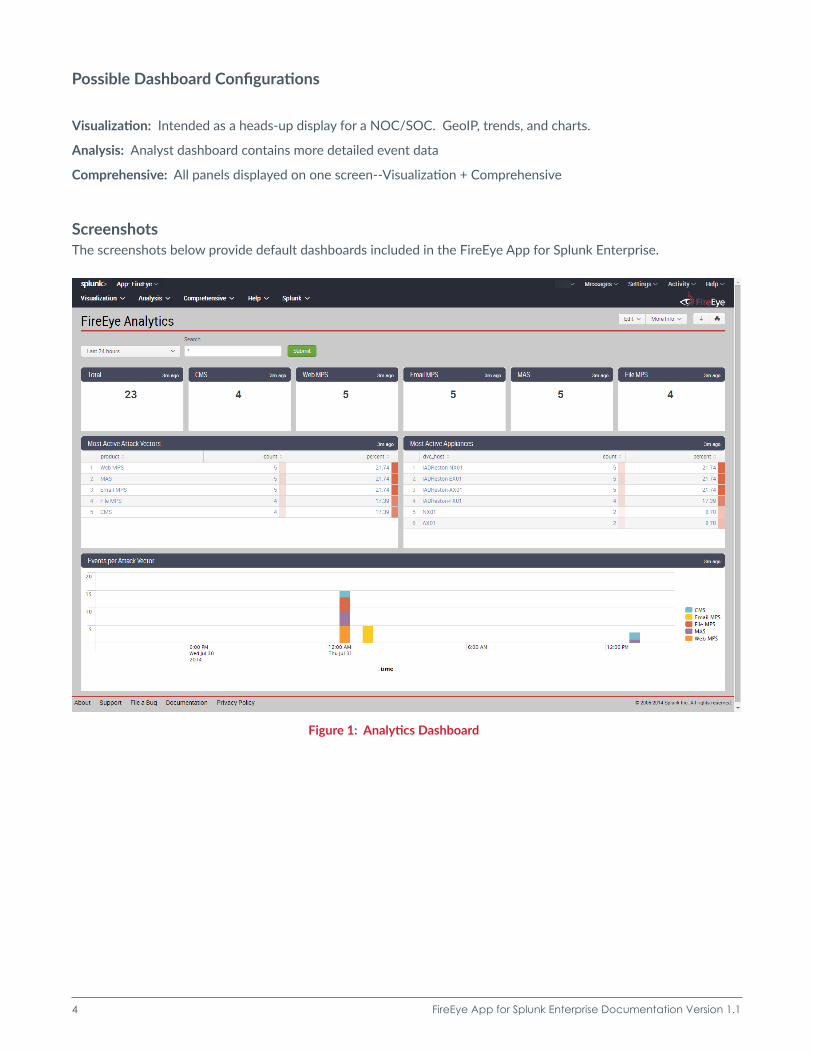
Figure 2: FireEye NX Visualization
Figure 3: FireEye NX Analysis
6 FireEye App for Splunk Enterprise Documentation Version 1.1
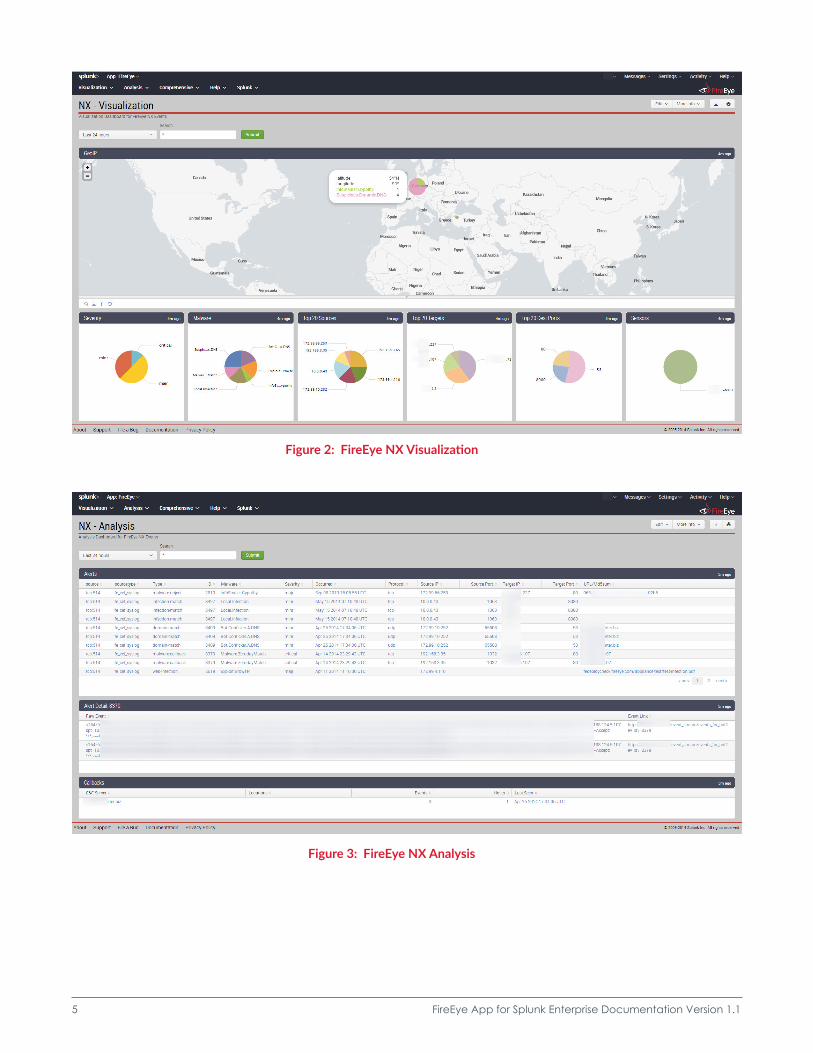
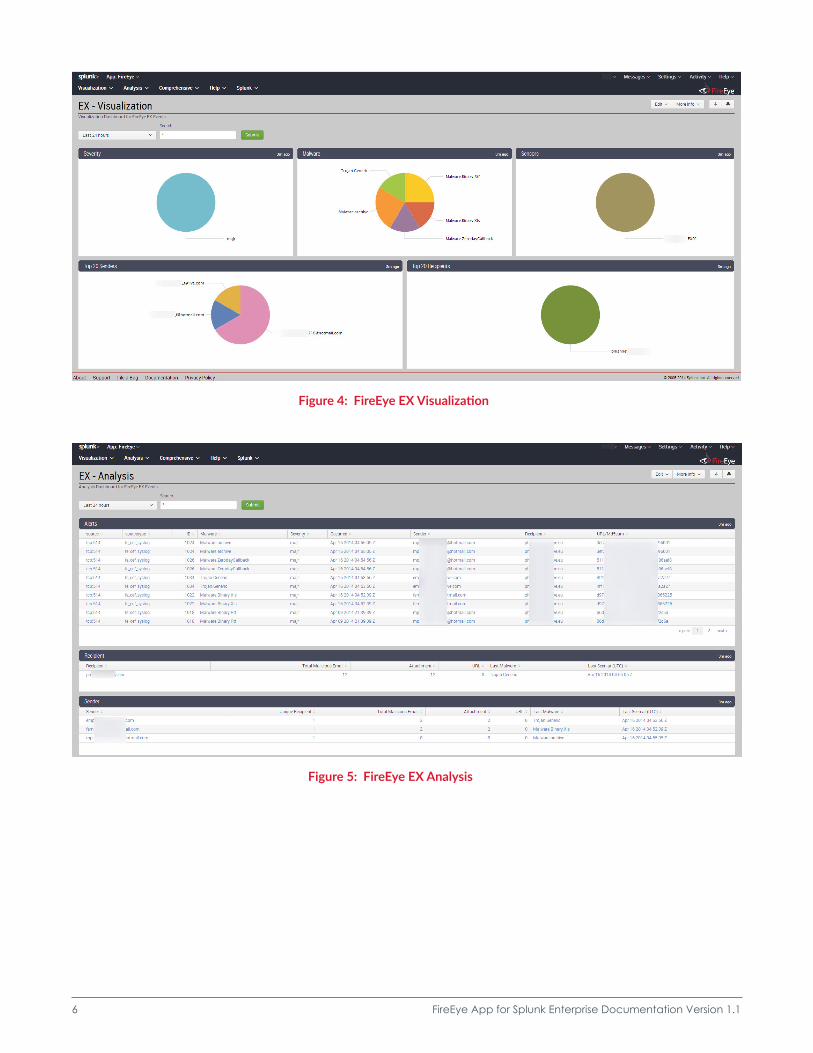
Figure 4: FireEye EX Visualization
Figure 5: FireEye EX Analysis
7 FireEye App for Splunk Enterprise Documentation Version 1.1
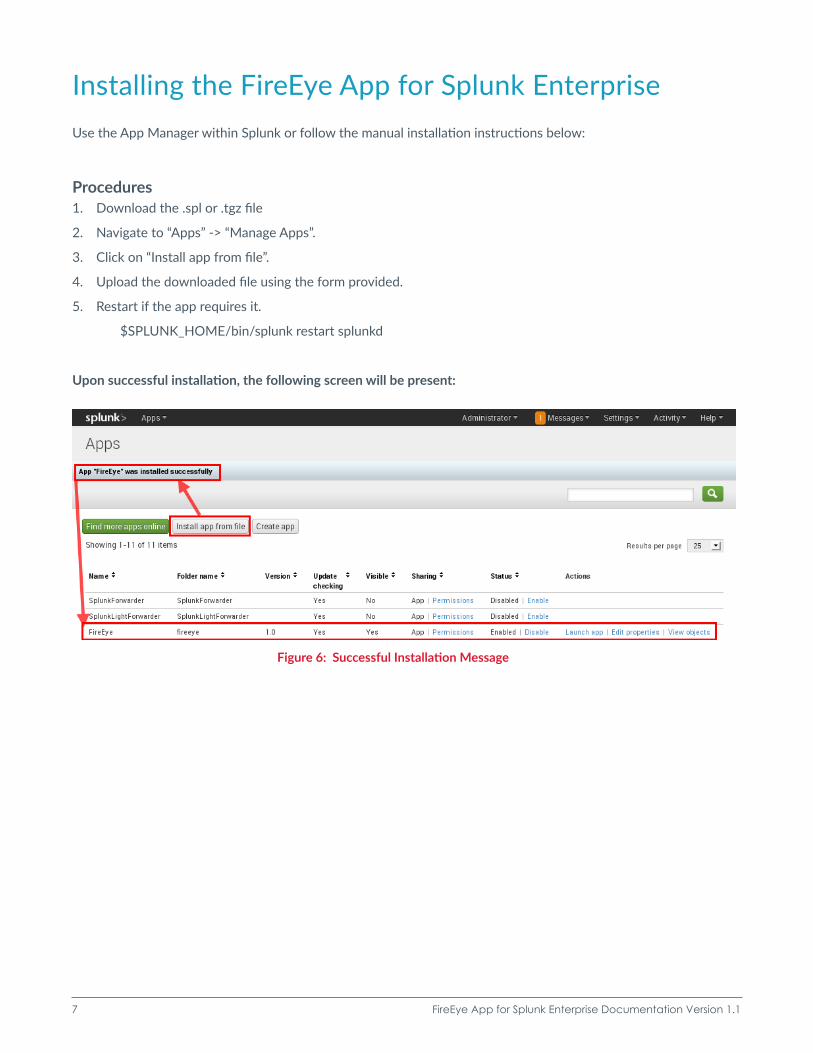
Installing the FireEye App for Splunk EnterpriseUse the App Manager within Splunk or follow the manual installation instructions below:
Procedures1. Download the .spl or .tgz file
2. Navigate to “Apps” -> “Manage Apps”.
3. Click on “Install app from file”.
4. Upload the downloaded file using the form provided.
5. Restart if the app requires it.
$SPLUNK_HOME/bin/splunk restart splunkd
Upon successful installation, the following screen will be present:
Figure 6: Successful Installation Message
8 FireEye App for Splunk Enterprise Documentation Version 1.1
Configuring SplunkThere are many options for configuring Splunk, but the main options are listed below. You choice will depend on the constraints in your environment.
Order of preference:
# Protocol Enc Reason1 HTTPS via Splunk RESTful API Yes Encrypted, flexible sending large amounts of data2 SYSLOG - TCP No Easier to send large amounts of data than UDP3 SYSLOG - UDP No Last resort - requires shell configuration of FireEye devices
HTTPS via Splunk RESTful APIThe steps below should assist in the setup.
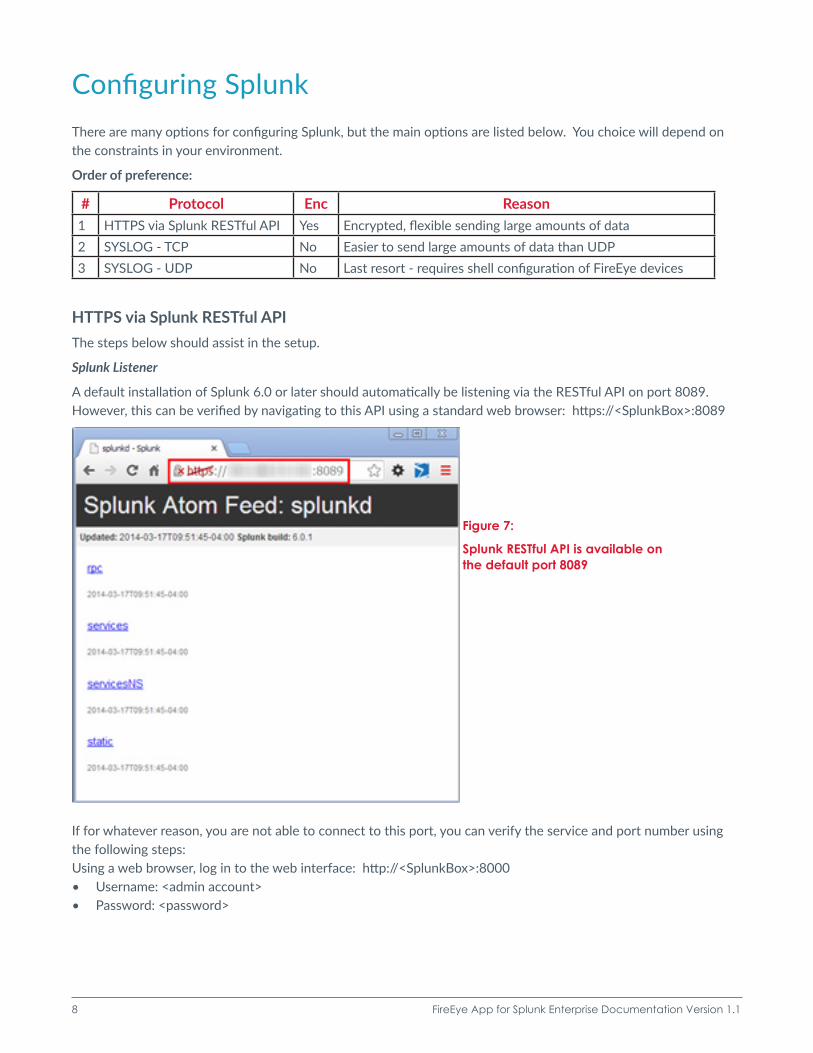
Splunk Listener
A default installation of Splunk 6.0 or later should automatically be listening via the RESTful API on port 8089. However, this can be verified by navigating to this API using a standard web browser: https://<SplunkBox>:8089
If for whatever reason, you are not able to connect to this port, you can verify the service and port number using the following steps:Using a web browser, log in to the web interface: http://<SplunkBox>:8000• Username: <admin account>• Password: <password>
Figure 7:
Splunk RESTful API is available on the default port 8089
9 FireEye App for Splunk Enterprise Documentation Version 1.1
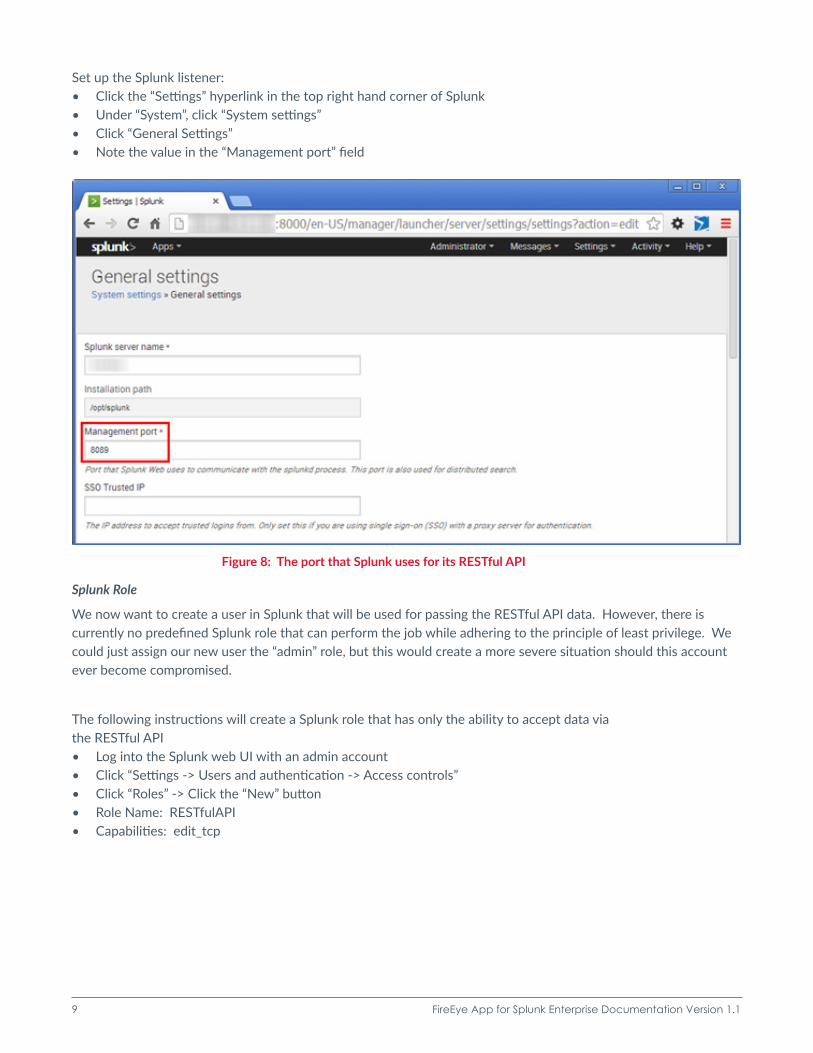
Set up the Splunk listener:• Click the “Settings” hyperlink in the top right hand corner of Splunk• Under “System”, click “System settings”• Click “General Settings”• Note the value in the “Management port” field
Splunk Role
We now want to create a user in Splunk that will be used for passing the RESTful API data. However, there is currently no predefined Splunk role that can perform the job while adhering to the principle of least privilege. We could just assign our new user the “admin” role, but this would create a more severe situation should this account ever become compromised.
The following instructions will create a Splunk role that has only the ability to accept data via the RESTful API • Log into the Splunk web UI with an admin account• Click “Settings -> Users and authentication -> Access controls”• Click “Roles” -> Click the “New” button• Role Name: RESTfulAPI• Capabilities: edit_tcp
Figure 8: The port that Splunk uses for its RESTful API
10 FireEye App for Splunk Enterprise Documentation Version 1.1
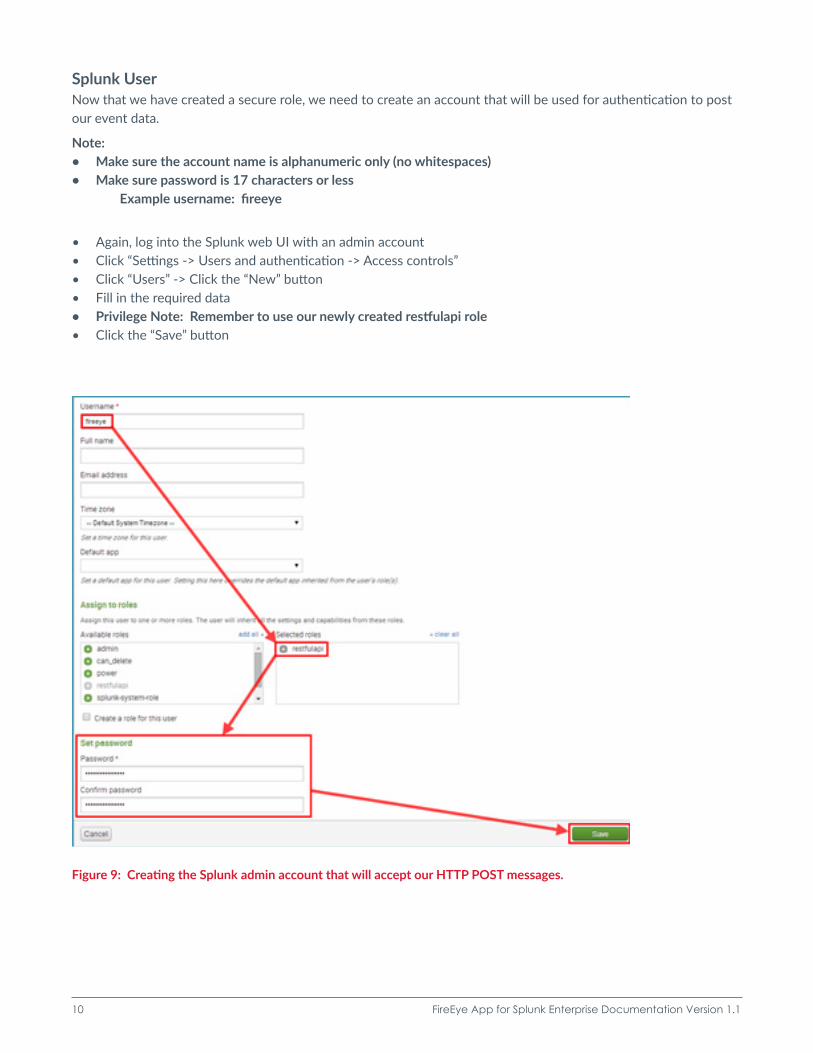
Splunk UserNow that we have created a secure role, we need to create an account that will be used for authentication to post our event data.
Note: • Make sure the account name is alphanumeric only (no whitespaces)• Make sure password is 17 characters or less Example username: fireeye
• Again, log into the Splunk web UI with an admin account• Click “Settings -> Users and authentication -> Access controls”• Click “Users” -> Click the “New” button• Fill in the required data• Privilege Note: Remember to use our newly created restfulapi role• Click the “Save” button
Figure 9: Creating the Splunk admin account that will accept our HTTP POST messages.
11 FireEye App for Splunk Enterprise Documentation Version 1.1
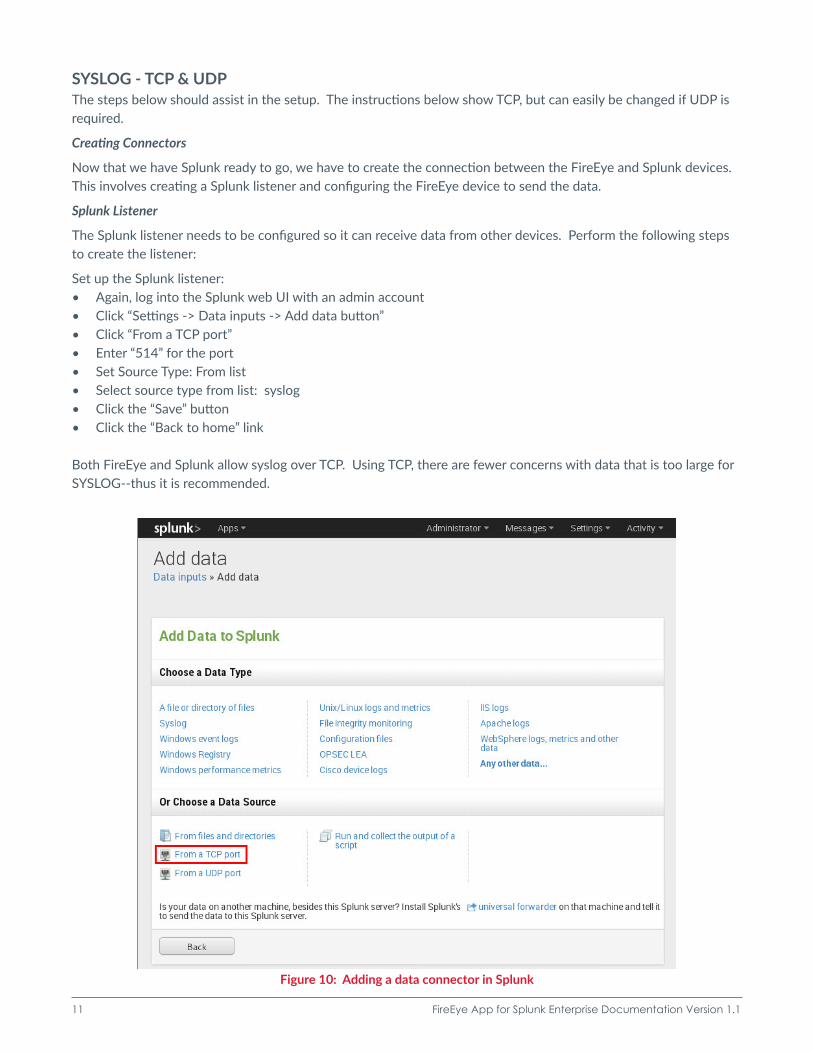
SYSLOG - TCP & UDPThe steps below should assist in the setup. The instructions below show TCP, but can easily be changed if UDP is required.
Creating Connectors
Now that we have Splunk ready to go, we have to create the connection between the FireEye and Splunk devices. This involves creating a Splunk listener and configuring the FireEye device to send the data.
Splunk Listener
The Splunk listener needs to be configured so it can receive data from other devices. Perform the following steps to create the listener:
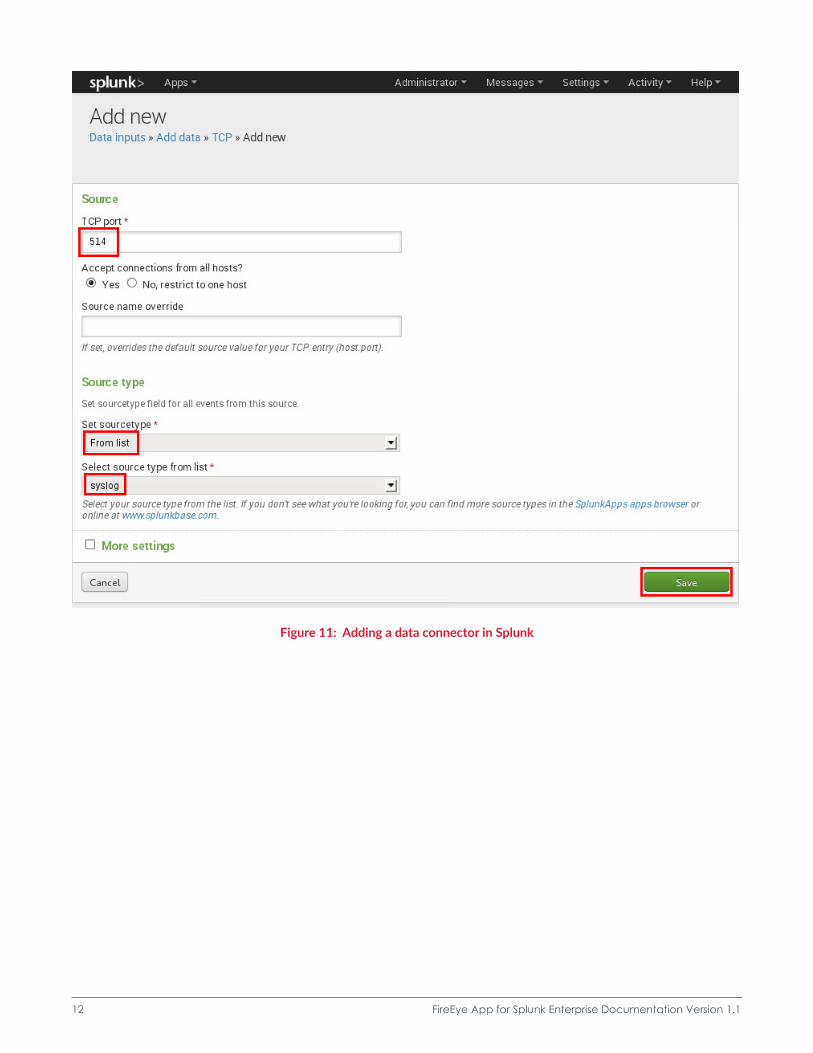
Set up the Splunk listener:• Again, log into the Splunk web UI with an admin account• Click “Settings -> Data inputs -> Add data button”• Click “From a TCP port” • Enter “514” for the port • Set Source Type: From list• Select source type from list: syslog• Click the “Save” button • Click the “Back to home” link
Both FireEye and Splunk allow syslog over TCP. Using TCP, there are fewer concerns with data that is too large for SYSLOG--thus it is recommended.
Figure 10: Adding a data connector in Splunk
12 FireEye App for Splunk Enterprise Documentation Version 1.1
Figure 11: Adding a data connector in Splunk
13 FireEye App for Splunk Enterprise Documentation Version 1.1
Configuring FireEyeThere are many options for installation, but the most reliable options are listed below in order of preference. You choice will depend on the constraints in your environment.
Order of preference:
# Protocol Enc Reason1 HTTPS JSON Yes Encrypted, lighter than XML2 HTTPS XML Yes Encrypted
3 SYSLOG - TCP XML NoTCP does not require command-line configuration on FireEye Appliance
4 SYSLOG - UDP XML No XML provides more data than CEF and CSV
5 SYSLOG - TCP CEF No TCP does not require command-line configuration on FireEye Appliance
6 SYSLOG - UDP CEF No Provides more data than CSV
7 SYSLOG - TCP CSV NoTCP does not require command-line configuration on FireEye Appliance
8 SYSLOG - UDP CSV No Last resort - May not send protocol field
General notes:
When sending JSON or XML to EX, use concise alertingFor everything else, use normal alerting
Warning:
Preference is to use TCP, but if UDP is necessary -- set FireEye UDP syslog to max chunk-size of 4096:
ssh admin@<FireEyeBox>enconf tfenotify rsyslog trap-sink <splunk_connector> chunk-size 4096
Two examples are provided below--First for HTTPS and Second for SYSLOG.
JSON over HTTPSThe first option we will show is how to configure the FireEye device to send JSON over HTTPS. HTTPS can be a good option if you are required or prefer to send data over an encrypted channel.
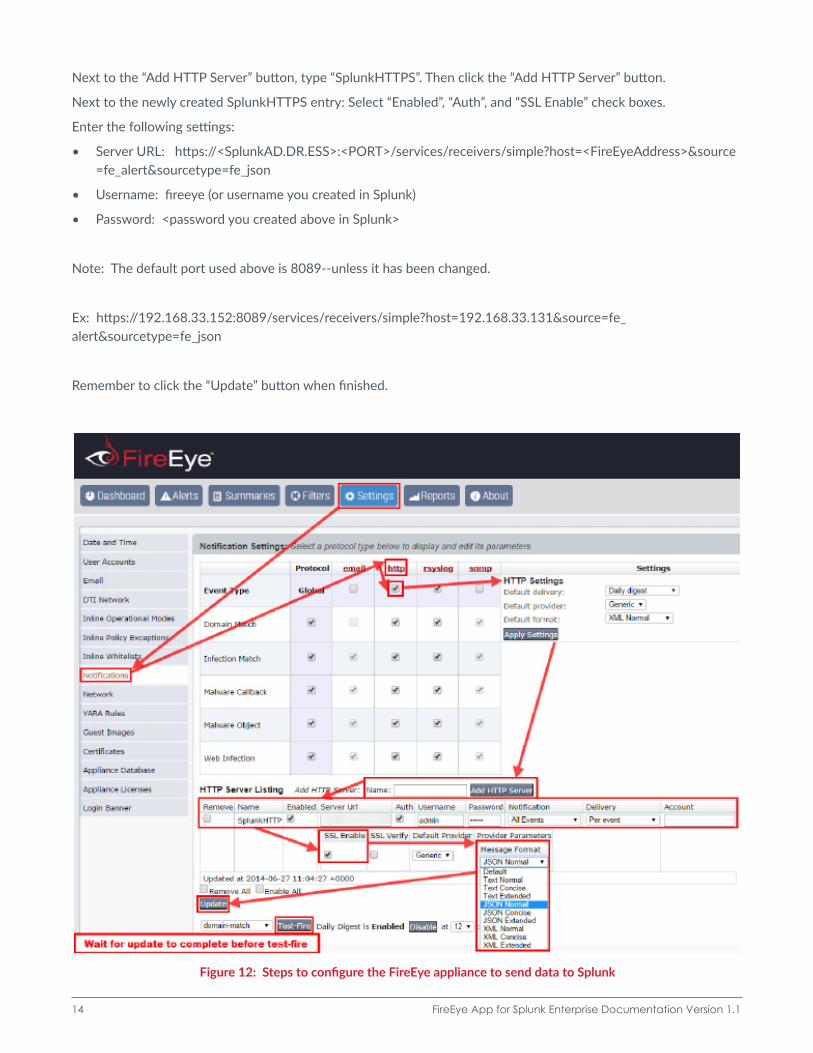
Complete the following steps to send data to Splunk using extended JSON via HTTPS Post:• Log into the FireEye appliance with an administrator account• Click “Settings”• Click “Notifications”• Click the “http” hyperlink• Under the http hyperlink, make sure the “Event type” check box is selected• HTTP settings should be: Default delivery: Per event Default provider: Generic Default format: JSON concise for EX, JSON normal for everything else• Click the “Apply Settings” button
14 FireEye App for Splunk Enterprise Documentation Version 1.1
Next to the “Add HTTP Server” button, type “SplunkHTTPS”. Then click the “Add HTTP Server” button.
Next to the newly created SplunkHTTPS entry: Select “Enabled”, “Auth”, and “SSL Enable” check boxes.
Enter the following settings:
• Server URL: https://<SplunkAD.DR.ESS>:<PORT>/services/receivers/simple?host=<FireEyeAddress>&source=fe_alert&sourcetype=fe_json
• Username: fireeye (or username you created in Splunk)
• Password: <password you created above in Splunk>
Note: The default port used above is 8089--unless it has been changed.
Ex: https://192.168.33.152:8089/services/receivers/simple?host=192.168.33.131&source=fe_alert&sourcetype=fe_json
Remember to click the “Update” button when finished.
Figure 12: Steps to configure the FireEye appliance to send data to Splunk
15 FireEye App for Splunk Enterprise Documentation Version 1.1
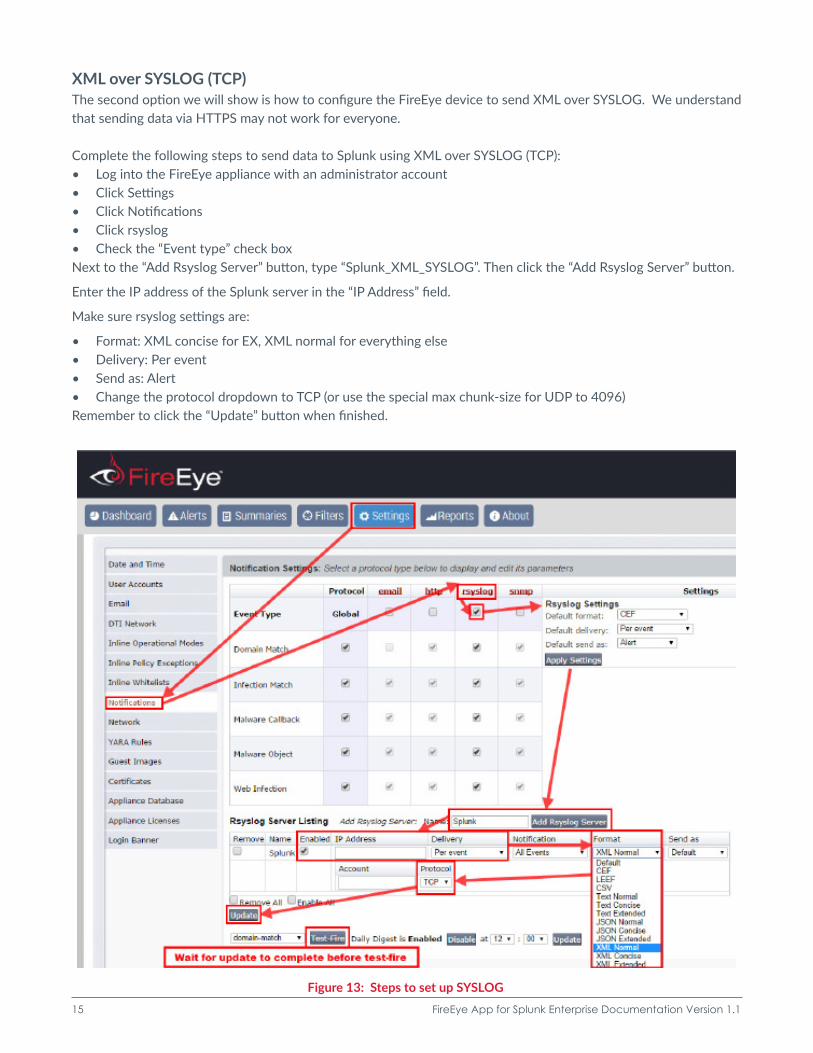
XML over SYSLOG (TCP)The second option we will show is how to configure the FireEye device to send XML over SYSLOG. We understand that sending data via HTTPS may not work for everyone.
Complete the following steps to send data to Splunk using XML over SYSLOG (TCP):• Log into the FireEye appliance with an administrator account• Click Settings• Click Notifications• Click rsyslog• Check the “Event type” check box Next to the “Add Rsyslog Server” button, type “Splunk_XML_SYSLOG”. Then click the “Add Rsyslog Server” button.
Enter the IP address of the Splunk server in the “IP Address” field.
Make sure rsyslog settings are:
• Format: XML concise for EX, XML normal for everything else• Delivery: Per event• Send as: Alert• Change the protocol dropdown to TCP (or use the special max chunk-size for UDP to 4096)Remember to click the “Update” button when finished.
Figure 13: Steps to set up SYSLOG
16 FireEye App for Splunk Enterprise Documentation Version 1.1
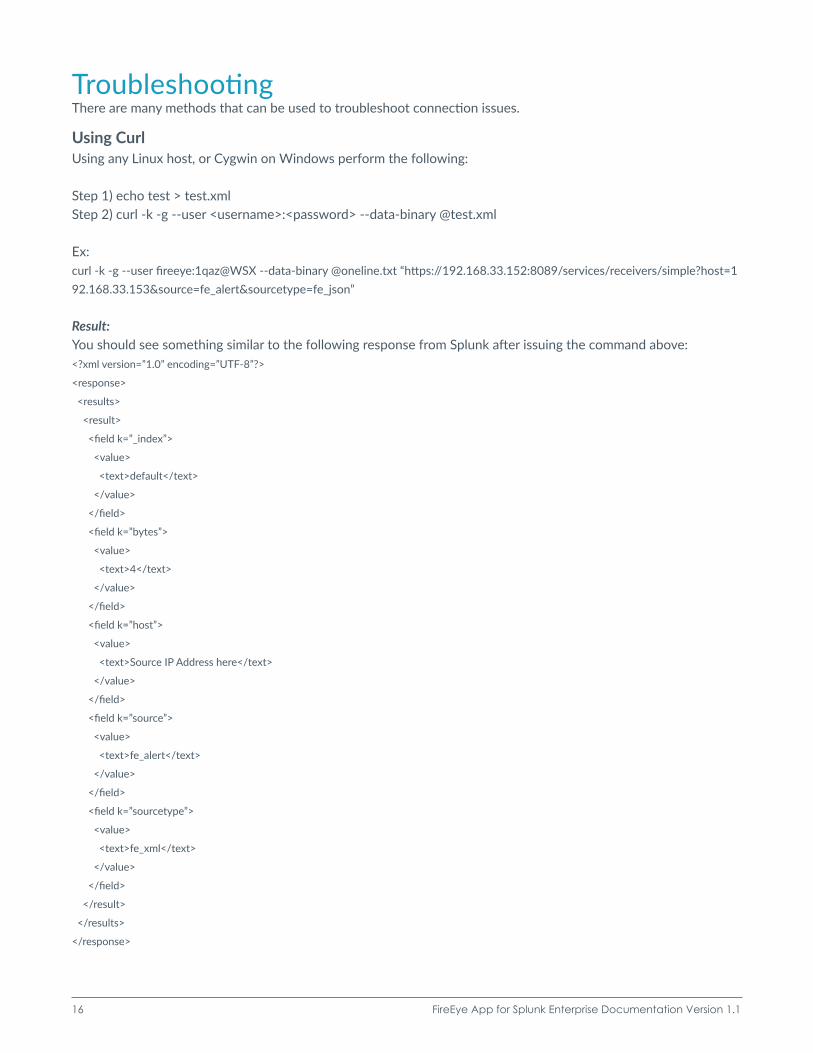
TroubleshootingThere are many methods that can be used to troubleshoot connection issues.
Using CurlUsing any Linux host, or Cygwin on Windows perform the following:
Step 1) echo test > test.xmlStep 2) curl -k -g --user <username>:<password> --data-binary @test.xml
Ex:curl -k -g --user fireeye:1qaz@WSX --data-binary @oneline.txt “https://192.168.33.152:8089/services/receivers/simple?host=192.168.33.153&source=fe_alert&sourcetype=fe_json”
Result:You should see something similar to the following response from Splunk after issuing the command above:<?xml version=”1.0” encoding=”UTF-8”?>
<response>
<results>
<result>
<field k=”_index”>
<value>
<text>default</text>
</value>
</field>
<field k=”bytes”>
<value>
<text>4</text>
</value>
</field>
<field k=”host”>
<value>
<text>Source IP Address here</text>
</value>
</field>
<field k=”source”>
<value>
<text>fe_alert</text>
</value>
</field>
<field k=”sourcetype”>
<value>
<text>fe_xml</text>
</value>
</field>
</result>
</results>
</response>

17 FireEye App for Splunk Enterprise Documentation Version 1.1
Splunk SearchAfter the data is successfully sent to Splunk, you should be able to search for it using the following search term:
source=fe_alert
You should see “test” as the message body because it was in the body of test.xml
FireEye, Inc. | 1440 McCarthy Blvd. Milpitas, CA 95035 | 408.321.6300 | 877.FIREEYE (347.3393) | [email protected] | www.FireEye.com
© 2014 FireEye, Inc. All rights reserved. FireEye is a registered trademark of FireEye, Inc. All other brands, products, or service names are or may be trademarks or service marks of their respective owners. – CG.FAS.EN-US.082014
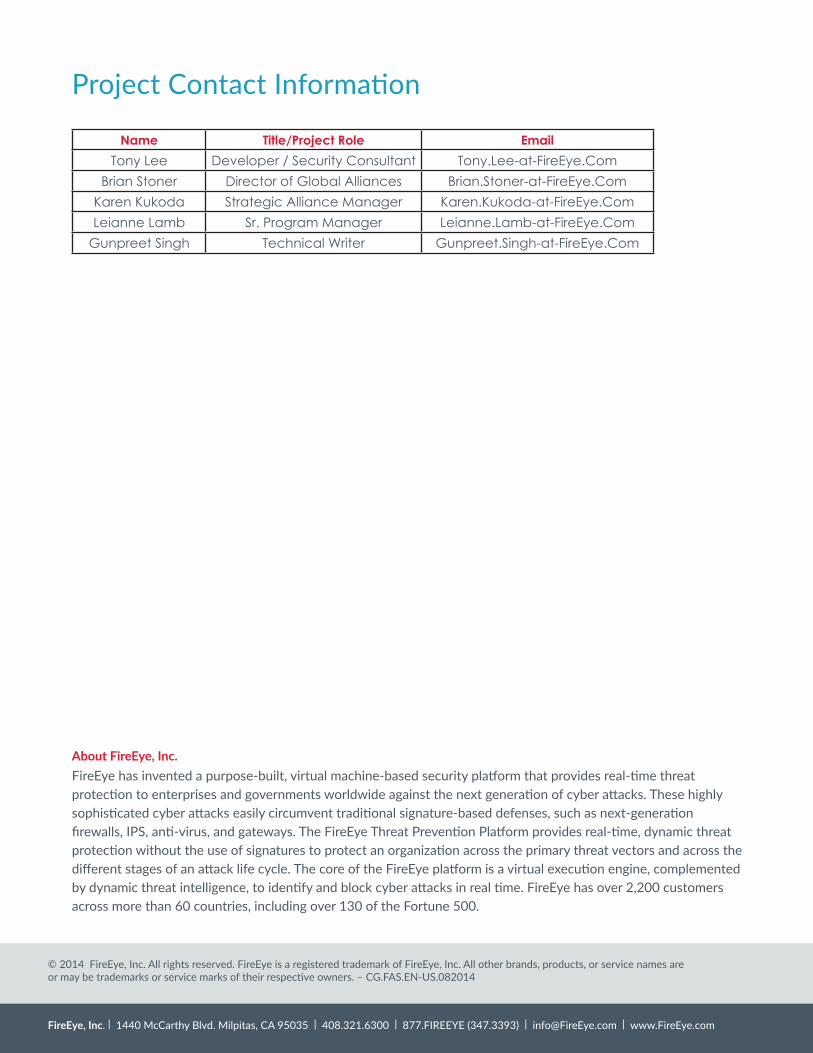
Project Contact Information
Name Title/Project Role EmailTony Lee Developer / Security Consultant Tony.Lee-at-FireEye.Com
Brian Stoner Director of Global Alliances Brian.Stoner-at-FireEye.ComKaren Kukoda Strategic Alliance Manager Karen.Kukoda-at-FireEye.ComLeianne Lamb Sr. Program Manager Leianne.Lamb-at-FireEye.Com
Gunpreet Singh Technical Writer Gunpreet.Singh-at-FireEye.Com
About FireEye, Inc.FireEye has invented a purpose-built, virtual machine-based security platform that provides real-time threat protection to enterprises and governments worldwide against the next generation of cyber attacks. These highly sophisticated cyber attacks easily circumvent traditional signature-based defenses, such as next-generation firewalls, IPS, anti-virus, and gateways. The FireEye Threat Prevention Platform provides real-time, dynamic threat protection without the use of signatures to protect an organization across the primary threat vectors and across the different stages of an attack life cycle. The core of the FireEye platform is a virtual execution engine, complemented by dynamic threat intelligence, to identify and block cyber attacks in real time. FireEye has over 2,200 customers across more than 60 countries, including over 130 of the Fortune 500.