Embed Size (px)
Citation preview

İPƏK YOLU, No.2, 2017, səh.109-131
109
FIRM SPECIFIC DETERMINANTS OF CAPITAL STRUCTURE:
EVIDENCE FROM AZERBAIJAN FIRMS
Elmir Safarli
SEFCO Consulting Group, Baku, Azerbaijan
e-mail: [email protected]
Abstract. The main purpose of this study is to determine the capital
structure policies of Azerbaijan companies and to provide firm specific
determinants of financing choice. The implication of capital structure
theories and the effect of the firm specific determinants on the capital
structure in Azerbaijan firms are tested over the 2007-2014 periods. The
empirical results indicate that, there are only 2 explanatory and significant
determinants of capital structure in Azerbaijan firms.
Keywords: Azerbaijan, capital structure, leverage ratio, GDP, inflation.
SƏRMAYƏ STRUKTURUNA TƏSİR EDƏN
FİRMADAXİLİ FAKTORLAR: AZƏRBAY-
CAN ŞİRKƏTLƏRİ ÜZƏRINƏ ARAŞDIRMA Elmir Səfərli
SEFCO Consulting Group, Bakı, Azərbaycan
Xülasə. Bu araşdırmanın əsas məqsədi Azər-
baycanda fəaliyyət göstərən şirkətlərin sərmayə
strukturu seçimi siyasətini formalaşdırmaq və ma-
liyyə seçiminə təsir göstərən firmadaxili faktorları
müəyyən etməkdir. Sərmayə strukturu nəzəriy-
yələri və firmadaxili faktorlar 2007-2014-cü illər
ərzində Azərbaycan şirkətləri üzərinə analiz edil-
mişdir. Analiz nəticələri göstərir ki, Azərbaycan
şirkətlərinin sərmayə strukturuna təsir edən sadəcə
2 açıqlayıcı və uyğun faktor mövcuddur.
Açar sözlər: Azərbaycan, sərmayə strukturu,
borclanma əmsalı, ÜDM, inflyasiya.
ВНУТРЕННИЕ ФАКТОРЫ ВЛИЯЩИЕ НА
СТРУКТУРУ КАПИТАЛА: ИССЛЕДОВА-
НИЕ АЗЕРБАДЖАНСКИХ ФИРМ
Эльмир Сафарли SEFCO Consulting Group, Баку, Азербайджан
Резюме. Целью данной статьи является фор-
мирование политики выбора структуры капи-
тала Азербайджанских фирм и опредление фак-
торов влияющих на этот выбор. Теории струк-
туры капитала и внутренние факторы анализи-
ровались для Азербайджанских фирм на период
2007-2014 гг. Результаты анализа показывают, что
существуют только две соответствующие фокто-
ры влияющие на структуру капитала Азербай-
джанских фирм. Ключевые слова: Азербайджан, структура
капитала, финансового левериджа, ВВП,
инфляция.
1. Introduction
Globalization has changed and strengthened the nature and conditions of finance and
economy over the last decade. Based on all these advancements, financial economists try to
analyze formal and scientific corporate finance theories, which can be applied by different
corporations.
Generally, a manager tries to generate more cash to cover capital expenditures. A
question here arises: “How can a firm increase its financial sources?” “How can we formalize
capital structure of the companies?” “How can we get an optimal capital structure of the
firms?”

İPƏK YOLU, No.2, 2017
Azərbaycan Universiteti
110
In these circumstances, the capital structure is the most discussed and tested issue in
corporate finance. Since the fundamental work of Modigliani and Miller (1958) [21] capital
structure and its determinants has been considered one of the major and important debate
topics. Literature results indicate that corporate finance is mostly analyzed in developed
countries. However, financial structure of the firms in developing countries has rarely been
analyzed. The Republic of Azerbaijan is also one of the transition countries and gained
independence after the collapse of the Soviet Union in 1991. Oil and gas industry secures the
bulk of economy and the state budget of the country. The share of oil and gas industry
accounts for approximately 54% of the gross domestic product. The bulk of foreign
investment has been channeled into the oil sector since Azerbaijan regained independence,
thus leading to large-scale development throughout the country. Foreign investment stood at
USD 10.5 billion in 2013, including AZN 4.9 billion poured into the oil and gas industry.
The president of Azerbaijan Republic in 2005 endorsed state programs to develop the
non-oil sector. Thus, oil and gas revenues over the years have been allocated to develop non-
oil sector, and the budget of the Fund for Entrepreneurship Support has increased
respectively.
So, we tried to analyze determinants of financing choice of Azerbaijan non-oil sectors
over the 2007-2014 periods. These benefits are useful for banks and financial institutions and
lenders, as this research provides leverage classification of the companies and sectors in
Azerbaijan. Simultaneously, relationship between firm specific factors and financing choice,
especially relationship with debt ratio is very helpful. Government representatives can also
benefit from this research by getting information about effect of macroeconomic factors on
the capital structure choice of Azerbaijan companies over 2008-2013
The contribution of this study to the literature about the capital structure is that it is the
first investigation, which determines the effect of firm specific factors and macroeconomic
indicators on the capital structure choice of Azerbaijan firms.
2. Theoritical background
The selection of adequate financing type and financial source are very complicated and
arduous for companies. A company has two fundamental financing alternatives: equity
financing (including issue stock, the most useful method) and debt financing (bonds, bank
debts, commercial papers, etc.). Retained earnings is the first useful and inexpensive
financing, as there are no costs to shape the funds. Debt financing is another type of

E. SAFARLI: FIRM SPECIFIC DETERMINANTS OF CAPITAL …
111
alternatives. For example, bank debts, commercial papers, and bonds. However, firms must be
prudent in their borrowing activities to avoid excessive risk and costs. In 1958, Franco
Modigliani and Merton H. Miller developed fundamental capital structure theory and gave
some theoretical background for financial structuring. The root of the main proposition in this
theory is that the debt financing has no effects on the value of the firm. It means that, if there
is insufficient equity to finance a project, the firm can apply to debt financing. And the
proportion of debt will not change the value of the firm. (Modigliani and Miller, 1958) [21].
For example, let`s assume that V is the market values of the firm, with D and E
indicating debt financing and equity respectively.
V = D + E.
Modigliani and Miller’s Proposition says that the market values of the firm V is
independent from the proportions of debt and equity. It means that the firms will regulate the
proportion of debt and equity. So, total value of the firm will not change.
For example, if the equity balance of the firm is 75%, it will use 25% of debt financing.
In case of decreasing the equity degree, debt financing will increase automatically. And total
value will not change. And this assumption also emphasizes that profitable companies will
tend to use internal equity.
In this theory, capital markets are considered as a perfect market. Ross (1988) [29]
listed the main restrictive notions, emphasized in Modigliani and Miller’s perfect market
theory assumptions.
1. Capital markets are considered to be perfect. It means that there was symmetric
information in a market, and there are not any information costs in the market.
2. The second assumptions indicate that there were no transaction costs.
3. There is rationality in a market. All investors have rational expectations for
maximizing profit of the companies.
4. There is no corporate tax.
5. The cost of capital is also estimated as zero in proposition. Myers (2001) [23] notified
that the cost of capital was counted as the expected return of whole securities in the
firm. Consequently, expected return of securities is considered zero in the first
proposition.
But some scholars argue that it is not acceptable in a real world. Because corporate taxes,
information asymmetry, agency and bankruptcy costs exist under real conditions and the
value of the firms has direct relationship with these elements, so these notions are restrictive
for this theory. So, the results indicate that Modigliani and Miller’s Proposition I is

İPƏK YOLU, No.2, 2017
Azərbaycan Universiteti
112
irrelevance. Mandacı (2009) [17] also proved that in case of non-taxes and bankruptcy costs,
markets were always efficient and the proportion of debt or equity financing would not
influence the value of the firm.
After Modigliani and Miller’s theorem, several empirical works have been tested to
determine the effects of debt on the value of the firms. In 1976 Jensen and Meckling
investigated that if the company wanted to get optimal capital structure, they had to balance
and to take into account the benefits and injuries of borrowings. Because too much debt such
as financial distress and underinvestment can destroy total value of the firm.
Figure 1. Explanation of trade off theory
Source: Myers ``Capital Structure Puzzle``, (1984)
However too little debt financing can effect to overinvestment. (Barclay and Smith,
2005) [4]. Myers (1984) [22] stated that it was good point and could be good theoretical
background for companies for obtaining optimal capital structure. So, it is called as trade off
theory. Consequently, it is the trading of benefits and disadvantages of borrowings.
Scott (1977) [32] also analyzed that optimal capital structure would be provided over
the balancing net tax advantages of debt, financial distress and bankruptcy costs. The results
PV of interest tax
shield
Value of
unlevered firm
Optimal debt level
Debt level
Costs of financial
distress
Maximum value of the firm

E. SAFARLI: FIRM SPECIFIC DETERMINANTS OF CAPITAL …
113
of Bradley, Jarrel and Kim (1984) [8], Sbeiti (2010) [31] and Caglayan (2011) [9] articles are
consistent with previous assumptions.
Figure states the explanation of trade off theory. According to the Figure, present value
of tax shield increases in parallel to firm debt line, until additional borrowing effects for the
increasing of financial distress. It means that at moderate debt level probability of bankruptcy
and financial distress degree are very trifling, if the company continues to take additional
borrowings, financial distress will increase significantly. So, a company must obtain
equilibrium between the tax advantages and financial distress costs. In this point the firm
value will be optimal and maximum.
Another alternative theory in capital structure is pecking order theory. Myers (1984)
[22] emphasized that Donaldson (1961) [11] must be considered founder of pecking order
theory. Basically, theory explains that when a company needs financing during the investment
process it generally prefers internal financing. In this situation, managers can minimize the
asymmetric information costs for the company. If internal funding of the company is
insufficient, the external funding becomes considerable. And firstly, the firm issues the safest
securities (Meyer and Allen,1991 [19]).
It must be noted that there are two types of external funding sources. One of them is
retained earnings and the other is common stock. The retained earnings is the first useful
funding source in external financing. If the quantity of financing is insufficient, common
stock will be considerable (Mandaci, 2009 [17]).
Some scholars notice that pecking order theory is not suitable for all conditions. Because real
world conditions for companies can be different than pecking order theory suggests.
So, company must analyze options for using the assumptions of pecking order theory by
considering its own conditions. For example, let's assume that a company has not been
profitable in late years, it has more borrowing, and the debt ratio is very high.
In this situation companies cannot use internal funding. If the company carries the
second option of pecking order theory, company must tend to use more debts. But company
has already more debts and debt ratio is very high.
3. Literature review
After the primary work of Modigliani and Miller (1958) [21], the source and the
structure of financing has been the main research question in the literature. Periodically,
scholars also tried to measure determinants of the capital structure.

İPƏK YOLU, No.2, 2017
Azərbaycan Universiteti
114
Some studies have been focused on developing and developed countries and some of
them have been tested over the combination of sample countries to compare international
strategies.
The main part of existing literature embraces models on a basis of certain firm level
indicators, such as size, profitability, growth opportunities, etc.
The main purpose of the research of Titman and Wessels (1988) [33] is to determine the
effect of unobservable factors on the leverage ratio of companies by using factor analytic
technique. Total 469 manufacturing companies were included to the sample over the 1974-
1982 period. Regards on the result of investigation, uniqueness and firm size are negatively
related to leverage levels. They also indicated that transaction was the main variable for
determining capital structure.
Rajan and Zingales (1995) [27] analyzed the firm specific factors of capital structure in
public firms. G-7 countries (the United States of America, Japan, Germany, France, Italy, the
United Kingdom and Canada) were the main sample for research. According to empirical
results of the study, all variables are significantly related to firm leverage only in USA
companies. Results of regression analysis also determine that tangibility is significantly
related to debt ratio in Japan, Germany, France, the United Kingdom and Canada.
There is negative and significant relationship between profitability and leverage in
Japan and Canada. Market to book is explanatory for Germany, France, the United Kingdom
and Canada. And Logsale is significantly related to debt ratio in Japan, Germany, the United
Kingdom and Canada.
Hussain and Nivorozhkin (1997) [14] analyzed the determinants of capital structure in
Poland companies. 17 companies are selected for testing over the transition period of the
country, 1991-1994. In regards to results, the age of the company was explanatory
determinant for companies.
Thus, firm age has negative and significant relationship with leverage level of the
company. It means new firm uses more debt than older one does. Firms size is positively
related to the debt ratio. Otherwise, tangibility has negative effect on the financing choice of
the company.
Chen, Lensink and Sterken (1998) [10] studied the determinants of capital structure in
Dutch companies. The main objective of analysis is to measure the relationship between
determinants and leverage ratio of the firm.

E. SAFARLI: FIRM SPECIFIC DETERMINANTS OF CAPITAL …
115
Total 51 firms are tested over the 1984 - 1995 periods. Researcher argues that the
findings of investigation are relevant to pecking order theory assumptions. Profitability,
tangibility and growth opportunities are significant at 1 % significance level. The coefficient
signs of all relationships are obtained positive. Only profitability is negatively related to debt
ratio. Size has positive and significant relationship with leverage ratio at 10 % significance
level. Earning volatility was found insignificant in tests.
One of the main studies about capital structure and implementation of theories is
investigation of Myers and Sunder (1999). The main purpose of this article is to analyze
differentiation of factor effects between trade off theory and pecking order theory. Total 157
companies of the United States of America were implemented for tests over the 1971-1989
period.
Empirical findings indicate that tangibility has positive relationship with leverage level
of the company. It means that companies with more tangible assets use more debt financing.
Profitability is negatively and significantly related to the leverage ratio of the firm.
Author indicates that all these results are consistent with pecking order theory. The
retesting of sample by using cross sectional analysis significance level and coefficients of
variable are found unchanged.
Antoniou, Guney and Paudyal (2002) [2] researched determinants of capital structure in
European countries. Germany, the United Kingdom and France are selected for the testing of
capital structure theories in this paper. Sample covers 1987-2000 period for Germany, 1983-
2000 period for France and 1969-2000 period for the United Kingdom.
Firm size is positively and significantly related with the leverage level of the companies
for all countries. At the same time, interest rate has negative and significant effect on the debt
ratio of the companies. Profitability and market to book ratio are also negatively related with
borrowings for all countries with exception of Germany.
Tangibility is significantly related with the leverage level for Germany and the United
Kingdom. The signs of variables are positive and negative respectively. However, this value
is insignificant for France companies. Simultaneously, liquidity and volatility do not indicate
significant relationship with leverage.
Bauer (2004) [5] investigated the firm specific factors of capital structure in Chezh
Republic over the 2000-2001 period. Total 72 companies are included into sample for each
year. The findings of research show that profitability is negatively related to debt ratio and
this result is matching the pecking order theory.

İPƏK YOLU, No.2, 2017
Azərbaycan Universiteti
116
According to the results there is positive and significant relationship between size and
leverage. This result affirms trade off theory. Tangibility and growth opportunities are also
negatively related to debt ratio. Regretfully, volatility is not related to leverage.
Determinants of capital structure in Nepal listed firms are analyzed by Baral (2004) [3].
Size, risk, dividend, growth rate are selected main independent variables in research. Baral
cited to previous research and calculated the dependent variables as the ratio of total debt to
total assets.
The results of multiple regression indicate that only 3 variables were significant in
research. Size of the firms and growth have positive relationship with leverage of the firms. In
other way, earning rate of business has inverse sign with debt ratio. Business risk, degree of
leverage and dividend payout are not explanatory variables for capital structure choice of
Nepal Listed firms.
Mandaci (2009) [17] tested optimal capital structure theories over the Turkish non-
financial firms. Researcher selected 247 firms from different industrial sectors and sample
also covered 1996-2004 period. The method of research is tested by regression analysis.
In regards to the empirical results, there is negative relation with leverage ratio and this
result is consistent with pecking order theory. It means that high profitable Turkish firms
prefer to use internal financing. The tangibility is also negatively related to debt ratio and
implies the result of trade off theory. There are also negative relationships between size,
liquidity and leverage.
4. Methodology and variables
In the shade of the literature the research questions of investigation are determined as
follows:
1) What is the capital structure and what are the main determinants?
2) Which factors have the influence on the leverage ratio of the company?
3) Is there any relationship between macroeconomic indicators and leverage ratio?
4) Is the empirical result of analysis consistent with the assumptions of pecking order theory
and trade off theory?
So, the selection of variables is the most important part of the answer to these research
questions. Generally, the findings of literature survey show that the companies use different
variables for measuring the effects. Of course, the assumption of theories is also important for
choosing variables.

E. SAFARLI: FIRM SPECIFIC DETERMINANTS OF CAPITAL …
117
Dependent Variables
As mentioned in theoretical part of investigation, capital structure is a mix of securities
and different financial sources for the financing of real investment. In other words, capital
structure represents the proportion and combination of financial sources which are securities,
short and long-term debt and equity.
Matos (2001) [18] assumes that if the company uses debt financing together with
equity, it means that the firm is levered firm. In regards to literature survey, dimension of
capital structure is indicated as the leverage ratio of the companies. Another explanation of
this ratio is debt ratio.
The main used calculation method is a ratio of total liabilities to total assets. Researcher
emphasizes that all combination of liability items. such as accounts payable, deposits, foreign
exchange liabilities, reserves and long-term debts provide total liabilities.
There are two types of calculation methods for debt ratio. One of them is calculation
with book values and the other is calculation with market values. Frank and Goyal (2003) [12]
assume that book value represents the past situation of companies. Otherwise, market values
show the future position of the firms.
There are different calculation approaches for total leverage ratio. Padron, Apoloniraio,
Santana, Conceptio, Martel and Sales (2005) [26] used leverage ratio by dividing total
borrowings of the company to the sum of the debt and equity.
Sayilgan, Karabacak, Kucukkocaoglu (2006) [30] counted the leverage ratio as total
debt to total equity. The calculation method of leverage ratio in Booth, Aivazian, Demirguc
Kunt and Maksimovic (2001) [7] articles are also consistent with previous studies.
As a result, total leverage ratio is selected as dependent variable and calculated by
dividing total liabilities to the sum of the total liabilities and total equities.
𝑇𝑜𝑡𝑎𝑙 𝑑𝑒𝑏𝑡 𝑟𝑎𝑡𝑖𝑜 =𝑡𝑜𝑡𝑎𝑙 𝑙𝑖𝑎𝑏𝑖𝑙𝑖𝑡𝑖𝑒𝑠
𝑡𝑜𝑡𝑎𝑙 𝑙𝑖𝑎𝑏𝑖𝑙𝑖𝑡𝑖𝑒𝑠 + 𝑡𝑜𝑡𝑎𝑙 𝑒𝑞𝑢𝑖𝑡𝑖𝑒𝑠
Independent Variables
Theories and studies suggest that the companies use capital structure choice for getting
information about costs and benefits of financing. According to the literature some factors
which have influence on the capital structure choice are selected as independent variables.
➢ Size - There are different conflicts over the explanations of relationship between firm
size and leverage ratio. In regards of theory discussions, there are two main
assumptions. Pecking order theory argues that there are negative relationships between
variables. However, trade off theory defenders argue that there occurs positive

İPƏK YOLU, No.2, 2017
Azərbaycan Universiteti
118
relationship between firm size and debt ratio. In this study, positive relationship is
assumed between firm size and leverage ratio. It means the assumption of trade off
theory is appropriate for Azerbaijan companies. And Natural Logarithm is used for the
counting of firm size.
Hypothesis 1: There are positive relationships between firm size and leverage ratio of
Azerbaijan companies.
➢ Profitability - Myers (1984) [22] indicates that earnings level of the company is the
main indicator for the choosing of financing type. Pecking order theory assumes that
there is negative relationship between profitability and leverage ratio. It means that
profitable companies have more earnings and high level retained earnings. These
companies will use internal fund firstly. The borrowing level will indicate minimum
level. So, there are negative relationships between profitability and debt ratio. The
results of investigation of Caglayan (2011) [9] Mishra (2011) [20] and Joever (2006)
[16] are consistent with the assumptions of pecking order theory. Vice versa, trade off
theory argues that positive relation must be between profitability and leverage ratio.
Because, high profitable companies have more earnings and they can repay interest
and main debt payments easily. So, they tend to more borrowing. EBIT/total assets are
selected main calculation method of profitability ratio. There are assumed negative
relationships between profitability and debt ratio of the companies.
Hypothesis 2: There are negative relationships between profitability and leverage ratio of
Azerbaijan companies.
➢ Non-debt tax shield - Theories always assume that companies use debt financing for
saving tax. The increasing of non-debt tax shield effects for the minimizing of tax
benefits. So, there are negative relationships between non-debt tax shield and debt
financings. In this situation, both of the trade off theory and pecking order theory
suggest that there are negative relationships between non-debt tax shield and leverage
ratio of the firms. According to the literature survey and assumption of theories ratio
of annual depreciation of expenses to total assets is the main indicator of this
investigation. And negative relationship is assumed for Azerbaijan companies.
Hypothesis 3: There are negative relationships between non-debt tax shields and leverage
ratio of Azerbaijan companies.
➢ Asset tangibility - Tangibility is the most important determinant of capital structure.
Pecking order theory assumes that companies with more tangible assets tend to less

E. SAFARLI: FIRM SPECIFIC DETERMINANTS OF CAPITAL …
119
borrowing. Researcher argues that companies with more tangible assets generally are
large companies. And large companies use internal finance and use debt financing in
minimum level. So, there are negative relationships between asset tangibility and debt
ratio. Trade off theory indicates positive relationship between tangibility and
profitability. Because these assets are collateral for debt financing and it is the
guarantee of debt. At the same time collateral reduces the risk of debt and maintains
the constancy of purpose between lender and companies. The main calculation method
for this research is selected as follows:
𝑡𝑎𝑛𝑔𝑖𝑏𝑖𝑙𝑖𝑡𝑦 =(𝑡𝑎𝑛𝑔𝑖𝑏𝑙𝑒 𝑎𝑠𝑠𝑒𝑡𝑠 + 𝑖𝑛𝑣𝑒𝑛𝑡𝑜𝑟𝑖𝑒𝑠)
𝑡𝑜𝑡𝑎𝑙 𝑎𝑠𝑠𝑒𝑡𝑠.
And positive relationship is argued for determining relationship between tangibility
and debt ratio.
Hypothesis 4: There are positive relationships between tangibility and leverage ratio of
Azerbaijan companies.
➢ Growth Opportunities - As other variables, relationship between growth
opportunities and leverage ratio has various explanations. The pecking order theory
assumes that growth opportunities have positive relationship with debt financing.
Because, companies need additional funding in growth level. And most probably,
many companies choose external financing for it. So, the increasing of growth
opportunities will effect the increasing of debt level. Vice versa, trade off theory
suggests that the relationship between growth opportunities and debt level is negative.
Jensen and Meckling (1976) [15] predict that there are negative relationships between
growth opportunities and debt ratio. Because when the companies have growth
opportunities, they take more risk and have more financial distress expenses. It means
that in case of growth opportunities firms intend to accept the higher risky projects,
thus increasing the risky debts and borrowing costs. Two types of growth
opportunities are used in this research: growth opportunities in plant, property and
equipment; growth opportunities in total assets. Growth opportunities in plant,
property and equipment are counted as the percentage change of the plant, property
and equipment values. But the ratio of growth opportunities to total assets is calculated
as the percentage change of total assets. The sign of relationship between leverage
ratio and both of the growth opportunities in plant, property and equipment and
growth opportunities in total assets is assumed negative.

İPƏK YOLU, No.2, 2017
Azərbaycan Universiteti
120
Hypothesis 5: There are negative relationships between growth opportunities in plant,
property and equipment and leverage ratio of Azerbaijan companies.
Hypothesis 6: There are negative relationships between growth opportunities in total assets
and leverage ratio of Azerbaijan companies.
In regards to theories and studies about firm specific determinants of capital structure,
following table shows the calculation method and the sign of the relationships between
variables.
Table 1. Explanation of independent variables
Variables Definition
Relationship
for theories
and models
Relationships
from studies
Expected
relationshi
p
Theories
Profitability EBIT/Total
assets - - -
Pecking
order
theory
+ Trade off
theory
Firm size Natural
logarithm of
total sales
-
Pecking
order
theory
+ + + Trade off
theory
Growth
opportunities
in plant,
property and
equipment
Percentage
change in
property,
plant and
equipment
+
Pecking
order
theory
- - - Trade off
theory
Growth
opportunities
in total
assets
Percentage
change in
total assets
+
Pecking
order
theory
- - - Trade off
theory
Non-debt tax
shield
Annual
depreciation
expenses/tota
l assets
-
Pecking
order
theory
- - - Trade off
theory
Tangibility (tangible
assets +
inventories)/
total assets
-
Pecking
order
theory
+ + + Trade off
theory
Taking into consideration all variables equation model of investigation will be as follows:

E. SAFARLI: FIRM SPECIFIC DETERMINANTS OF CAPITAL …
121
Leverage of the firms = β0 + β1 profitability + β2 firm size
+ β3 growth opportunities on plant, property and equipment
+ β4 growth opportunities on total assets + β5 non-debt tax shield + β6 tangibility + ε
The main purpose of this research is to analyze the firm specific determinants of capital
structure in Azerbaijan firms over the 2007-2014 period. 6 main firm specific factors are
considered in analysis.
The main source for calculation ratios and variables in analysis are balance sheet and
income statements of Azerbaijan companies. These data are obtained from internet website of
the companies and by the meeting chief financial officer. And all data are shown annually.
The contribution of this investigation to the literature about the capital structure is that it
is the first study which determines the firm specific factors of capital structure in Azerbaijan.
Unfortunately, data are not available for all companies through the years. So,
unbalanced panel data analysis will be used for this investigation. Firstly, total 76 companies
are used in this research.
And these companies are from various sectors. As stated in the article by Nyangoro
(2013), the strong leverage level of financial institutions may change the correctness and
robustness of the results. So, five financial companies were excluded from the sample and
there are a total of 71 companies and 222 observations in the study. As to the currency, all
data are shown in US dollars. The relationship between variables will be tested in E-views
program.
5. Empirical results
Unbalanced panel data analysis is the best suitable method for measuring relationships
between variables on these conditions. To decide on selecting Cross Section Method type of
panel data is the main requirement in the analysis. According to Ashenfelter, Levine and
Zimmerman (2003), it is important to take into consideration advantages and disadvantages of
models for comparing fixed and random effects models in the study.
But with the help of the Hausman test we can decide which model is very useful in the
analysis. The results of the test offer that the cross random effect is not systematic and fixed
effect method is very useful for measurement of relationship between variables. The value of
the chi square Hausman test was 27.96 and this value was statistically significant.
After the Hausman test all variables are included into the program and fixed effect are
applied for measurement. The results of panel data regression analysis are presented in below:

İPƏK YOLU, No.2, 2017
Azərbaycan Universiteti
122
Table 2. Panel data regression analysis results
Variables Coefficients St. errors T Values P> | t |
Profitability -0.1782 0.1099 -1.62 0.113
Firm size 0.0008 0.0091 0.10 0.922
GOTA (growth
opportunities on
total assets)
0.0001 0.0001 0.58 0.567
GOPPE (growth
opportunities on
plant, property
and equipment)
-0.0001 0.00002 -0.64 0.525
NDTS -0.3021 0.2769 -1.09 0.282
Tangibility -0.0685 0.0893 -0.77 0.448
Constant 0.8135 0.1008 8.07 0.000
As seen from Table, there is no significant relationship between leverage ratio of the
companies and explanatory variables. And simultaneously, R-squared (R2) value is 0.1508. It
means that the model has approximately 15% explanation percentage. F statistics is calculated
as 1.15.
The table also indicates that there is a negative relationship between profitability and
debt ratios. GOPPE, NDTS and Tangibility are also negatively related to the leverage ratio of
the firms. But unfortunately, all relationships are not significant.
The analysis also indicates that corr (u_i, Xb) = 0.0995. At the same time correlation
values prove that there are no strong correlations between variables.
According to Table, there is not any strong relationship between variables. For example,
the correlation value between profitability and firm size is 0.069. It means that the correlation
between these variables is 6.9 % and variables are positively correlated.
Moreover, there is a negative correlation between profitability and GOPPE, and the
figures indicate that the correlation value is calculated as 0.022 or -2.2%.
E. SAFARLI: FIRM SPECIFIC DETERMINANTS OF CAPITAL …
123
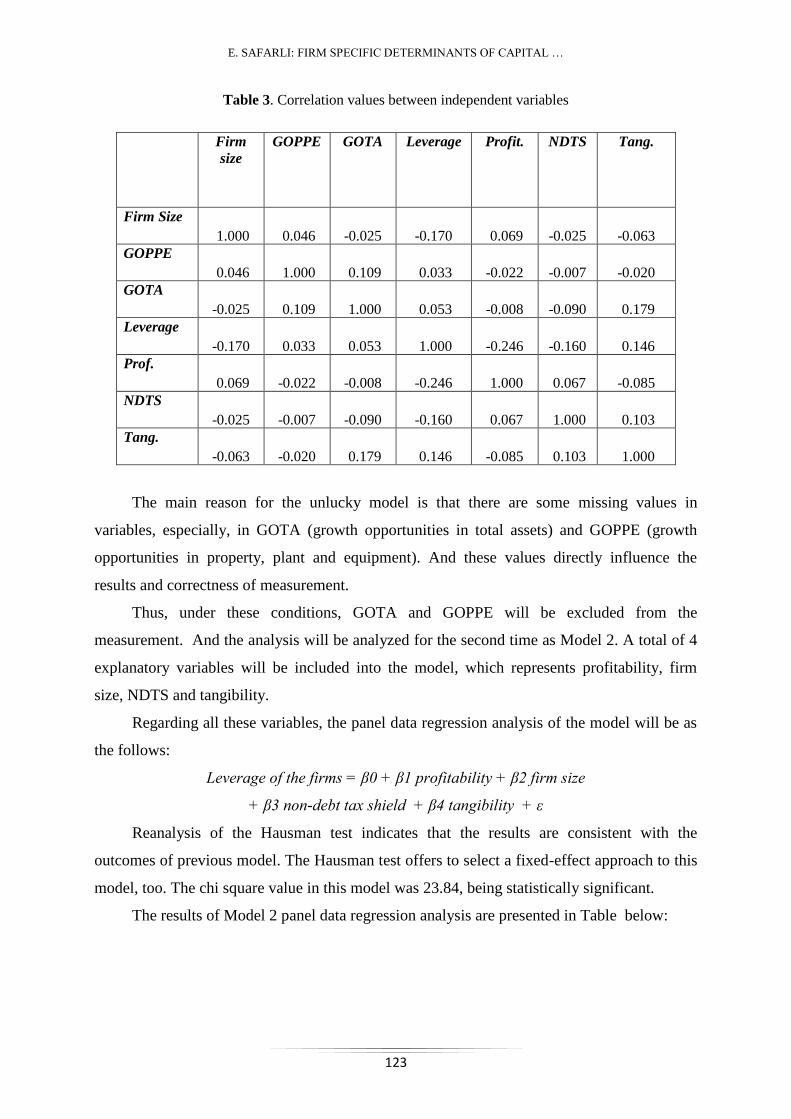
Table 3. Correlation values between independent variables
Firm
size
GOPPE GOTA Leverage Profit. NDTS Tang.
Firm Size
1.000 0.046 -0.025 -0.170 0.069 -0.025 -0.063
GOPPE
0.046 1.000 0.109 0.033 -0.022 -0.007 -0.020
GOTA
-0.025 0.109 1.000 0.053 -0.008 -0.090 0.179
Leverage
-0.170 0.033 0.053 1.000 -0.246 -0.160 0.146
Prof.
0.069 -0.022 -0.008 -0.246 1.000 0.067 -0.085
NDTS
-0.025 -0.007 -0.090 -0.160 0.067 1.000 0.103
Tang.
-0.063 -0.020 0.179 0.146 -0.085 0.103 1.000
The main reason for the unlucky model is that there are some missing values in
variables, especially, in GOTA (growth opportunities in total assets) and GOPPE (growth
opportunities in property, plant and equipment). And these values directly influence the
results and correctness of measurement.
Thus, under these conditions, GOTA and GOPPE will be excluded from the
measurement. And the analysis will be analyzed for the second time as Model 2. A total of 4
explanatory variables will be included into the model, which represents profitability, firm
size, NDTS and tangibility.
Regarding all these variables, the panel data regression analysis of the model will be as
the follows:
Leverage of the firms = β0 + β1 profitability + β2 firm size
+ β3 non-debt tax shield + β4 tangibility + ε
Reanalysis of the Hausman test indicates that the results are consistent with the
outcomes of previous model. The Hausman test offers to select a fixed-effect approach to this
model, too. The chi square value in this model was 23.84, being statistically significant.
The results of Model 2 panel data regression analysis are presented in Table below:

İPƏK YOLU, No.2, 2017
Azərbaycan Universiteti
124
Table 4. Panel data regression analysis results - Model 2
Variables Coefficients St. Errors T Values P> | t |
Profitability -0.5338 0.1259 -4.24 0.000٭٭٭
Firm size 0.0166 0.089 1.85 0.068٭٭٭
NDTS -0.0676 0.2552 -0.26 0.7992
Tangibility -0.0969 0.0798 -1.21 0.228
Constant 0.7353 0.0823 8.43 0.000٭٭٭
Notes: ٭٭٭indicates the significance level at 10%
Taking into consideration the results of Table and Model 2, there are two significant
relationships between variables: the relationship between profitability and leverage ratio of
the firms and the relationship between firm size and leverage ratio.
Profitability is negatively and significantly related with the leverage ratio. The
significance level of relationship is 10%. The coefficient of relationship is -0,5338. It means
that 1 percent increase in profitability effects -0,5338 decrease in leverage ratio.
The results of relationship are consistent with pecking order theory. In literature,
pecking order theory defenders assume that there must be a negative relationship between
profitability and debt ratio.
Secondly, there are positive and significant relationships between leverage ratio and
firm size. The significance level is also within 10% for this relationship. The coefficient of
relationship is 0.0166. It means that 1 percent increase in firm size increases leverage of the
firm by 0.0166 percent.
However, the non-debt tax shield and tangibility are not significantly correlated with
debt ratio. The coefficient of both relationships is negative.
Additionally, R-squared (R2) value is 0.2103. This figure proves that the model has 21%
explanation percentage. F statistics is calculated as 5.86 and this value is significant. Analysis
also indicates that corr (u_i, Xb) = -0.129.
Finally, we decided to reanalyze measurement of relationship between leverage ratio
and explanatory variables by including two variables only, which are profitability and firm
size. These variables had a significant relationship with leverage ratio. So, it will be very
concrete to determine the real signs and coefficient of relationship and significance with
leverage ratio.

E. SAFARLI: FIRM SPECIFIC DETERMINANTS OF CAPITAL …
125
So, profitability and firm size are included in the testing as Model 3. The Hausman test
indicates that fixed effect method is systematic for Model 3. This result is consistent with the
previous one. And it is significant, too. The chi square value was 6.58. Equation of Model 3
will be:
Leverage of the firms = β0 + β1 profitability + β2 firm size + ε
The results of Model 3 are presented in following table:
Table 5. Panel data regression analysis results - Model 3
Variables Coefficients St. Errors T Values P> | t |
Profitability -0.5631 0.1236 -4.55 0.000٭٭٭
Firm size 0.0155 0.0088 1.76 0.068٭٭٭
Constant 0.6887 0.0724 9.51 0.000٭٭٭
Notes: ٭٭٭indicates the significance level at 10%
As can be seen from Table , both variables are significant at 10% significance level.
Profitability is negatively and significantly related to the leverage ratio of the firms. The
coefficient of relationship indicated -0.5631. It means that 1 percent increase in profitability
affects -0.5631 decrease in leverage ratio.
The results of relationship are consistent with pecking order theory. Allen (1991)
explained that companies firstly preferred internal financing. If the internal financing channel
is insufficient, the external financing channel becomes more relevant.
With regard to this information, Mandaci (2009) [17] pointed that there are two types of
external financing: retained earnings and common stock. Retained earnings are the highly
reliable financing type.
Ross, Westerfield and Jaffe (2005) also describe that profitable companies use debt
financing at a minimum level. Therefore, the debt ratio decreases in case of higher profits.
All this theoretical background explains that the results of measurement are accurate.
So, there is a negative relationship between profitability and leverage ratio. Literature review
also affirms the results of the analysis.
Rajan and Zingales (1995) [27] proved that there is negative relationship between
profitability and leverage ratio in Japanese and Canadian companies. Simultaneously,
profitability is negatively related to debt ratio of U.S. companies (Myers and Sunder,1999).

İPƏK YOLU, No.2, 2017
Azərbaycan Universiteti
126
Booth, Aivazian, Demirguc, Kunt and Maksimovic (2001) [7] determined the firm-
specific factors of companies in Brasil, Mexico, India, Korea, Jordan, Malaysia, Pakistan,
Thailand, Turkey and Zimbabwe over the period between 1985 and 1991.
The results of regression analysis indicate that profitability had negative relationship
with debt ratio. And it is significantly explanatory variable for capital structure.
Research by Bauer (2004) [5], Berk (2005) [6], Akhtar and Oliver (2005) [1] also
approves the relationship position between profitability and leverage ratio.
Secondly, firm size has significant relationship with leverage. And the sign of the
relationship is positive and coefficient indicates 0.0155. It means that in case of an increase in
firm size, it will influence the increasing of leverage ratio.
Theoretically, trade off theory defenders assume that debt financing will increase in
parallel with firm size. It means that there must be a positive relationship between
profitability and debt ratio.
Ozkan (2001) [25] tests the firm specific determinants of capital structure in UK
companies. Outcomes of measurement imply that firm size is positively related with leverage
ratio. The findings are consistent in Swiss firms, too (Graud, 2005).
Zhou Zang (2006) [34] described the same issues in Canadian firms. He explained that
the size of the company was the strongest explanatory variable for debt financing of the
company. It is described that firm size has positive relationship with leverage ratio. And the
researcher also emphasizes that multinationals have higher level debt ratio than domestic
corporations. Regarding the outcome of the test in the article by Sbeiti (2010) [31], size is
positively related to debt ratio for all 3 countries ( Kuwait, Saudi Arabia and Oman). R square
of Model 3 is figured 0.20. It means that there is 20% explanation degree of analysis. F
statistics is counted as 10.88, which is a statistically significant value. Analysis also indicates
that corr (u_i, Xb) = 0.031. Findings of the three models are summarized in below:
Table 6. Results of all models
Model 1
(Coefficients)
Model 2
(Coefficients)
Model 3
(Coefficients)
Profitability -0.1782 -0.5338٭٭٭0.5631- ٭٭٭
Firm size 0.0008 0.0166٭٭٭0.0155 ٭٭٭

E. SAFARLI: FIRM SPECIFIC DETERMINANTS OF CAPITAL …
127
GOTA 0.0001 - -
GOPPE -0.0001 - -
NDTS -0.3021 -0.0676 -
Tangibility -0.0685 -0.0969 -
Constant 0.8135 0.7353 0.6887
Haussmann Test 27.86٭٭٭
(fixed effect)
٭٭٭23.84
(fixed effect)
٭٭٭6.58
(fixed effect)
R2 0.15 0.21 0.20
F Statistics 1.15 5.86٭٭٭10.88 ٭٭٭
Corr (u_i.Xb) 0.094 -0.129 0.031
Notes: ٭٭٭indicates the significance level at 10%
Taking into account Table 6 and all the models, our final equation will be as follows:
Leverage of the firms = 0.6887 – 0.5631 profitability + 0.0155 firm size
Before measurement and predetermining there were 6 hypotheses. Only the first and the
second hypotheses are accepted. Only these arguments are maintained with measurement.
Other hypotheses are rejected and H0 is accepted.
6. Conclusion
Since 1958, capital structure has been considered the most discussed topic in corporate
finance. The major question is to find optimal capital structure point and determine the
fundamental determinants. Extensive investigations have been attracted to provide the effects
of factors on the leverage ratio of the companies. The main part of these studies explaines, the
firm specific determinants in corporate. Another part of investigations determines the
influence of macroeconomic factors on the financing choice of companies. According to
previous literature, the majority of these articles have been applied to developing countries.
In light of previous literatures and theories, the main purpose of this study is to
determine capital structure policies of Azerbaijan companies.
Development of economy, tendency of macroeconomic indicators, current position of
sectors and enterprises were the main part of this investigation. Results of study have three
explanations. The main selected factors for measurement were profitability, firm size, growth

İPƏK YOLU, No.2, 2017
Azərbaycan Universiteti
128
opportunities in plant, property and equipment, growth opportunities in total assets, non-debt
tax shields and tangibility.
Unfortunately, no significant explanation was found between variables in the first
model. The main reason for the unlucky model is that there are some missing values in
variables, especially, in GOTA (growth opportunities in total assets) and GOPPE (growth
opportunities in property, plant and equipment). And these values directly influence the
results and correctness of measurement.
So, the next 4 variables are included in the second model. According to the finding,
only profitability and firm size were explanatory and significant factor for leverage ratio of
the companies. The results of relationship are consistent with pecking order theory. In
literature, pecking order theory defenders assume that there must be a negative relationship
between profitability and debt ratio.
Finally, the including of only two factors (profitability and firm size) was re-tested in
Model 3. And the results of Model 3, indicate that both of determinants are significant and
explanatory variables for financing decision of companies.
There were some limitations that affect the results of analysis and constrain the
generalization of the findings.
• Firstly, there were not included all companies by years, because of data unavailability.
• Secondly, the investigation covers 2007-2014 period. But including period from 1994,
would be very explanatory and preferable to gain sufficient results.
• World financial crisis in 2008-2009 has inevitable impacts on Azerbaijan. It will be
very important in future investigations to analyze capital structure decisions and
determinants in companies over the period before and after crisis.
Capital structure issues are very important for future studies. In the light of this
investigation, there are some suggestions for the future researches:
1. To collect great sample size for analysis.
2. To extend the number of years
3. More firm specific determinants and macroeconomic indicators can be included in the
investigations.
4. To extend size of industries and sectors.

E. SAFARLI: FIRM SPECIFIC DETERMINANTS OF CAPITAL …
129
References
1. Akhtar S.H., Oliver B., (2005) The determinants of capital structure for Japanese
multinational and domestic companies, Finance and Applies Statistics, AFAANZ
Conference.
2. Antoniou A., Guney Y., Paudyal K., (2002) Determinants of corporate capital structure:
evidence from European countries, centre for empirical research, Working Paper.
3. Baral K., (2004) Determinants of capital structure: a case study of listed companies of
Nepal, The journal of Nepalese Business studies, 1(1).
4. Barclay M.J., Smith C.W., (2005) The capital structure puzzle: evidince revisitted,
Journal of Applied Corporate Finance, 17(1).
5. Bauer P., (2004), Determinants of capital sctructure, empirical evidence from the Czech
Republic, Czech Journal of Finance and Economics, 54(1-2), 2-21.
6. Berk A., (2005) Drivers of leverage in Slovenian blue-chip firms and stock performance
following substantial debt increases, University of Ljubljana, Faculty of Economics
Working Paper, 172.
7. Booth L., Aivazian V., Demirguc Kunt A., Maksimov V., (2001) Capital structures in
developing countries, The Journal of Finance, LVI(1).
8. Bradley M., Jarrel G., Han Kim E., (1984) On the existence of optimal capital structure:
Theory and Evidence, The Journal of Finance, 39(3), 856-878.
9. Caglayan E., (2011) An empirical Investigation on the determinants of capital structurees
of Turkish firms, Middle Eastern Finance and Economics, Issue 9, 35-42.
10. Chen L., Lensink R., Sterken E., (1998) The determinants of capital structure: evidence
from Dutch Panel Data, Working Paper.
11. Donaldson G., (1961) Corporate debt capacity: a study of corporate debt policy and the
determination of corporate debt capacity, Boston: Division of Research, Harvard School
of Business Administration.
12. Frank M.Z., Goyal V.K., (2003) Testing the pecking order theory of capital structure,
Journal of Financial Economics, 67, 217-248.
13. Gaud P., Jani E., Hoesli M., Bender A., (2003) The capital structure of Swiss companies:
an empirical analysis using dynamic panel data, FAME Research Paper, 68.
14. Hussain Q., Nivorozhkin E., (1997) The capital structure of listed companies in Poland,
IMF Working Paper, 97/175.
15. Jensen M.C., Meckling W.H., (1976) Theory of the firm: managerial behavior, agency
costs, and capital structure, Journal of Financial Economics, 3, 305-360.
İPƏK YOLU, No.2, 2017
Azərbaycan Universiteti
130
16. Jooever K., (2006) Source of capital structure: evidence from transition countries,
Working Paper Series, Electron Version.
17. Mandaci P.E., (2009) Testing capital structure models for Turkish non financial firms:
the analysis of firm specific financial factors and agnecy variables, Investment
Management and Financial Innovations, 6(1)
18. Matos J.A., (2001) Theoritical foundations of corporate finance, Princeton University
Press.
19. Meyer J.P., Allen N.J., (1991) A three-component conceptualization of organizational
commitment, Human Resource Management Review, 1, 61–89.
20. Mishra Ch.S., (2011). Determinants of capital structure - a study of manufacturing sector
PSU in India, Internation Conference on financial management and Economics, 11.
21. Modigliani M., Miller M.H., (1958) The cost of capital, corporation finance and the
theory of investment, The American Economic Review, 48(3), 261-297.
22. Myers S.C., (1984) The capital structure puzzle, The Journal of Finance, 39(3), 575-592.
23. Myers S.C., (2001) Capital structure, Journal of Economic Perspectives, 15(2), 81-102.
24. Nyangoro O., (2013) Determinants of capital structure of listed firms in Kenya and the
impact of corporate tax, African Economic research consortium, Working Paper.
25. Ozkan A., (2001) Determinants of capital structure and adjustment to long run target:
evidence from UK company panel data, Journal of Business Finance & Accounting,
28(1&2), 175-198.
26. Padron Y.G., Apolinario R.M.C., Santana O.M., Martel M.V.C., Sales L.J., (2006)
Determinant factors of leverage: an empirical analysis of Spanish corporations, Journal of
Risk Finance, 6(1), 60-68.
27. Rajan R.G., Zingales L., (1995) What do we know about capital structure? Some
evidence from international data, The Journal of Finance, 50(5), 1421-1460.
28. Ross S.Z., (1977) The determination of financial structure: The incentive signalling
approach, The Bell Journal of Economics, 8(1), 23-40.
29. Ross S.Z., (1988) Comment on the Modigliani Miller Propositions, The Journal of
Economic Perspectives, 2(4), 127-133.
30. Sayilgan G., Karabacak H., Kucukkocaoglu G., (2006) The firm specific determinants of
corporate capital structure: evidence from Turkish panel data.Working Paper.
31. Sbeiti W., (2010) The determinants of capital structure : evidence from GCC countries,
International Research Journal of Finance and Economics. Issue 47.

E. SAFARLI: FIRM SPECIFIC DETERMINANTS OF CAPITAL …
131
32. Scott J., (1977) Bancruptcy, secured debt and optimal capital structure: Reply, The
Journal of Finance, 34(1), 253-260.
33. Titman S.H., Wessels R., (1988) The determinants of capital structure choice, The
Journal of Finance, 43(1), 1-19.
34. Zhang Z., (2006) Three essays on the capital structure of Canadian corporations, PhD
Dissertation, University of Manitoba.