Embed Size (px)
Citation preview

FIRMS IN COMPETITIVE FIRMS IN COMPETITIVE MARKETSMARKETS

Characteristics of Perfect CompetitionCharacteristics of Perfect Competition
1. There are many buyers and sellers in the market.
2. The goods offered by the various sellers are largely the same.
3. Firms can freely enter or exit the market.
4. The individual firm produces a small portion of total market output.
5. The firm cannot have any influence over the price it charges.
6. The individual firm in a perfectly competitive market is a price taker.
7. It takes the price determined by the market as the price that it will receive for its output.

Revenue of a Competitive FirmRevenue of a Competitive Firm
• Total revenue for a firm is the selling price times the quantity sold.
TR = (P X Q)

Revenue of a Competitive FirmRevenue of a Competitive Firm
• Total revenue is proportional to the amount of output.

Revenue of a Competitive FirmRevenue of a Competitive Firm
• Average revenue tells us how much revenue a firm receives for the typical unit sold.

Revenue of a Competitive FirmRevenue of a Competitive Firm
• In perfect competition, average revenue equals the price of the good.

Revenue of a Competitive FirmRevenue of a Competitive Firm
• In perfect competition, average revenue equals the price of the good.
Average revenue=Total revenue
Quantity
=(Price Quantity)
Quantity
=Price

Revenue of a Competitive FirmRevenue of a Competitive Firm
• Marginal revenue is the change in total revenue from an additional unit sold.
MR =TR/Q

Revenue of a Competitive FirmRevenue of a Competitive Firm
• For competitive firms, marginal revenue equals the price of the good.

Profit Maximization for the Profit Maximization for the Competitive FirmCompetitive Firm
• The goal of a competitive firm is to maximize profit. This means that the firm will want to
produce the quantity that maximizes the difference between total revenue and
total cost.

Profit Maximization for the Profit Maximization for the Competitive FirmCompetitive Firm
• Profit maximization occurs at the quantity where marginal revenue equals marginal cost.
If MR > MC, increase Q to increase profit.
If MR < MC, decrease Q to increase profit.
If MR = MC, profit is maximized.

Profit Maximization for the Profit Maximization for the Competitive FirmCompetitive Firm
Quantity0
Costsand
Revenue

Profit Maximization for the Profit Maximization for the Competitive FirmCompetitive Firm
Quantity0
Costsand
Revenue
ATC
AVC

Profit Maximization for the Profit Maximization for the Competitive FirmCompetitive Firm
Quantity0
Costsand
RevenueMC
ATC
AVC

Profit Maximization for the Profit Maximization for the Competitive FirmCompetitive Firm
Quantity0
Costsand
RevenueMC
ATC
AVC P P = AR = MR

Profit Maximization for the Profit Maximization for the Competitive FirmCompetitive Firm
Quantity0
Costsand
RevenueMC
ATC
AVC
QMAX
P = AR = MR
The firm maximizesprofit by producingthe quantity at whichmarginal cost equalsmarginal revenue.
P

Profit Maximization for the Profit Maximization for the Competitive FirmCompetitive Firm
• A competitive firm will adjust its production level until quantity reaches QMAX where profit is maximized.

Profit Maximization for the Profit Maximization for the Competitive FirmCompetitive Firm
Quantity0
Costsand
RevenueMC
ATC
AVC
QMAX
P = AR = MR P

Profit Maximization for the Profit Maximization for the Competitive FirmCompetitive Firm
Quantity0
Costsand
RevenueMC
ATC
AVC
MC1
Q1 QMAX
P = MR1 P = AR = MR

Profit Maximization for the Profit Maximization for the Competitive FirmCompetitive Firm
Quantity0
Costsand
RevenueMC
ATC
AVC
MC1
Q1 QMAX
P = MR1 P = AR = MR
MR > MC,
increase Q

Profit Maximization for the Profit Maximization for the Competitive FirmCompetitive Firm
Quantity0
Costsand
RevenueMC
ATC
AVC
MC2
Q2QMAX
P = MR2 P = AR = MR

Profit Maximization for the Profit Maximization for the Competitive FirmCompetitive Firm
Quantity0
Costsand
RevenueMC
ATC
AVC
MC2
Q2QMAX
P = MR2 P = AR = MR
MR < MC,
decrease Q

The Firm’s Decision to Shut The Firm’s Decision to Shut DownDown
• A shutdown refers to a short-run decision not to produce anything during a specific period of time.
• Exit refers to a long-run decision to leave the market.

The Firm’s Decision to Shut The Firm’s Decision to Shut DownDown
• The firm considers its sunk costs when deciding to exit, but ignores them when deciding whether to shut down.
Sunk costs are costs that have already been committed and cannot be
recovered.
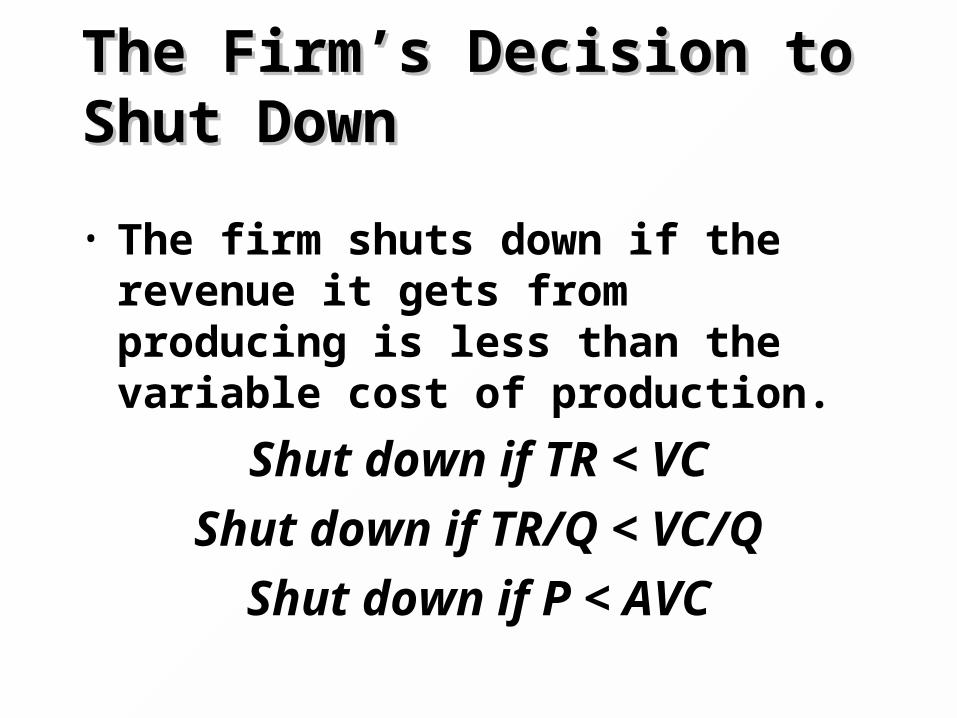
The Firm’s Decision to Shut The Firm’s Decision to Shut DownDown
• The firm shuts down if the revenue it gets from producing is less than the variable cost of production.
Shut down if TR < VC
Shut down if TR/Q < VC/Q
Shut down if P < AVC

The Firm’s Decision to Shut The Firm’s Decision to Shut DownDown
Quantity0
Costs

The Firm’s Decision to Shut The Firm’s Decision to Shut DownDown
Quantity
MC
ATC
AVC
0
Costs

The Firm’s Decision to Shut The Firm’s Decision to Shut DownDown
Quantity
MC
ATC
AVC
0
Costs
If P > ATC, keep producing at a profit.

The Firm’s Decision to Shut The Firm’s Decision to Shut DownDown
Quantity
MC
ATC
AVC
0
Costs
If P > ATC, keep producing at a profit.
If P > AVC, keep producing in the short run.

The Firm’s Decision to Shut The Firm’s Decision to Shut DownDown
Quantity
MC
ATC
AVC
0
Costs
If P > ATC, keep producing at a profit.
If P < AVC, shut down.
If P > AVC, keep producing in the short run.

The Firm’s Decision to Shut The Firm’s Decision to Shut DownDown
• The portion of the marginal-cost curve that lies above average variable cost is the competitive firm’s short-run supply curve.

The Firm’s Decision to Shut The Firm’s Decision to Shut DownDown
Quantity
MC
ATC
AVC
0
Costs
If P > ATC, keep producing at a profit.
If P > AVC, keep producing in the short run.
If P < AVC, shut down.

The Firm’s Decision to Shut The Firm’s Decision to Shut DownDown
Quantity
MC
ATC
AVC
0
Costs
Firm’s short-runsupply curve

The Long-Run Decision to Exit The Long-Run Decision to Exit an Industryan Industry
• In the long-run, the firm exits if the revenue it would get from producing is less than its total cost.
Exit if TR < TC
Exit if TR/Q < TC/Q
Exit if P < ATC

The Long-Run Decision to The Long-Run Decision to Enter an IndustryEnter an Industry
• A firm will enter the industry if such an action would be profitable.
Enter if TR > TC
Enter if TR/Q > TC/Q
Enter if P > ATC

The Competitive Firm’s Long-The Competitive Firm’s Long-Run Supply CurveRun Supply Curve

The Competitive Firm’s Long-The Competitive Firm’s Long-Run Supply CurveRun Supply Curve
Quantity0
Costs

The Competitive Firm’s Long-The Competitive Firm’s Long-Run Supply CurveRun Supply Curve
Quantity
MC
ATC
AVC
0
Costs

The Competitive Firm’s Long-The Competitive Firm’s Long-Run Supply CurveRun Supply Curve
Firm enters if P > ATC
Quantity
MC
ATC
AVC
0
Costs

The Competitive Firm’s Long-The Competitive Firm’s Long-Run Supply CurveRun Supply Curve
Firm enters if P > ATC
Firm exitsif P < ATC
Quantity
MC
ATC
AVC
0
Costs

The Competitive Firm’s Long-The Competitive Firm’s Long-Run Supply CurveRun Supply Curve
• The competitive firm’s long-run supply curve is the portion of its marginal-cost curve that lies above average total cost.

The Competitive Firm’s Long-The Competitive Firm’s Long-Run Supply CurveRun Supply Curve
Firm enters if P > ATC
Firm exitsif P < ATC
Quantity
MC
ATC
AVC
0
Costs

The Competitive Firm’s Long-The Competitive Firm’s Long-Run Supply CurveRun Supply Curve
Quantity
MC
ATC
AVC
0
Costs
Firm’s long-runsupply curve

The Firm’s Short-Run and The Firm’s Short-Run and Long-Run Supply CurvesLong-Run Supply Curves
• Short-Run Supply Curve The portion of its marginal cost curve that lies
above average variable cost.
• Long-Run Supply Curve The marginal cost curve above the
minimum point of its average total cost curve.

Profit as the Area Between Price Profit as the Area Between Price and Average Total Costand Average Total Cost

Profit as the Area Between Price Profit as the Area Between Price and Average Total Costand Average Total Cost
Quantity0
Price

Profit as the Area Between Price Profit as the Area Between Price and Average Total Costand Average Total Cost
Quantity0
Price
ATCMC

Profit as the Area Between Price Profit as the Area Between Price and Average Total Costand Average Total Cost
Quantity0
Price
P = AR = MR
ATCMC
P
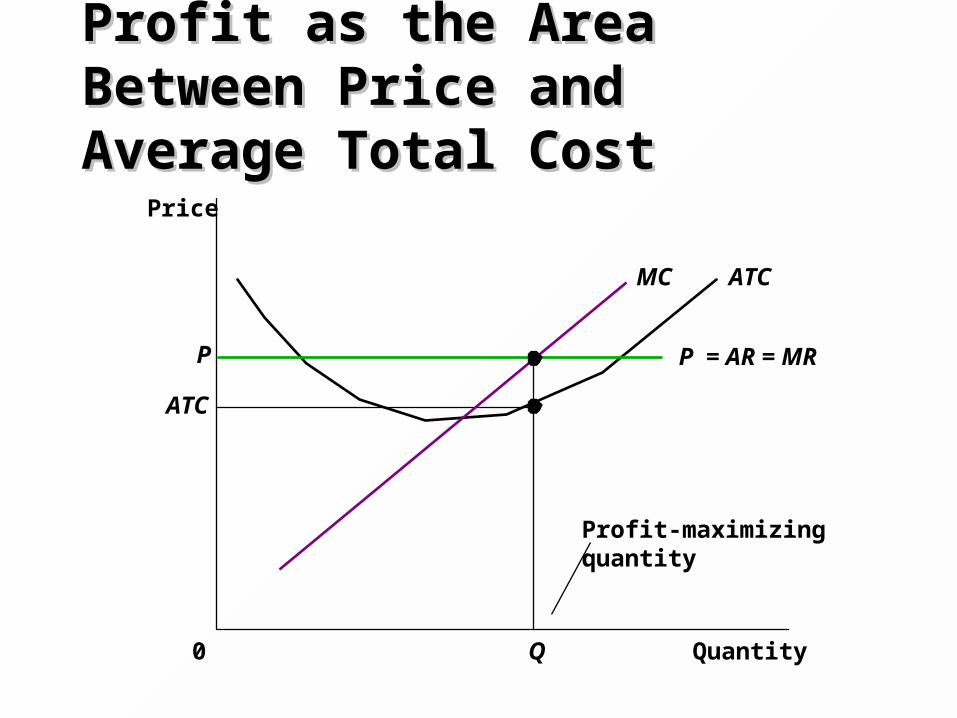
Profit as the Area Between Price Profit as the Area Between Price and Average Total Costand Average Total Cost
Quantity0
Price
ATCMC
P
ATC
Q
Profit-maximizingquantity
P = AR = MR

Profit as the Area Between Price Profit as the Area Between Price and Average Total Costand Average Total Cost
Quantity0
Price
ProfitATCMC
P
ATC
Q
Profit-maximizingquantity
P = AR = MR

Loss as the Area Between Price Loss as the Area Between Price and Average Total Costand Average Total Cost

Loss as the Area Between Price Loss as the Area Between Price and Average Total Costand Average Total Cost
Quantity0
Price
ATCMC

Loss as the Area Between Price Loss as the Area Between Price and Average Total Costand Average Total Cost
Quantity0
Price
ATCMC
P P = AR = MR

Loss as the Area Between Price Loss as the Area Between Price and Average Total Costand Average Total Cost
Quantity0
Price
ATC
ATCMC
Q
Loss-minimizing quantity
P P = AR = MR

Loss as the Area Between Price Loss as the Area Between Price and Average Total Costand Average Total Cost
Quantity0
Price
ATC
Loss
ATCMC
Q
Loss-minimizing quantity
P P = AR = MR

Quick Quiz!Quick Quiz!
• How does the price faced by a profit-maximizing competitive firm compare to its marginal cost?

Quick Quiz!Quick Quiz!
• When will a profit-maximizing firm decide to shut down?

Supply in a Competitive Supply in a Competitive MarketMarket
• Market supply equals the sum of the quantities supplied by the individual firms in the market.

Supply in a Competitive Supply in a Competitive Market Market
• Market Supply with a Fixed Number of Firms
For any given price, each firm supplies a quantity of output so that price equals its marginal cost.
The market supply curve reflects the individual firms’ marginal cost curves.

Supply in a Competitive Supply in a Competitive MarketMarket
• Market Supply with Entry and Exit Firms will enter or exit the market until
profit is driven to zero.
In the long-run, price equals the minimum of average total cost.
The long-run market supply curve is horizontal at this price.

The Supply Curve in a The Supply Curve in a Competitive MarketCompetitive Market
(a) Firm’s Zero-Profit Condition
Quantity(firm)
0
Price
P =minimum
ATC
(b) Market Supply
Quantity(market)
Price
0
Supply
MC
ATC

Increase in Demand in the Increase in Demand in the Short RunShort Run
• An increase in demand raises price and quantity in the short run.
• Firms earn profits because price now exceeds average total cost.

Initial ConditionInitial Condition
MarketFirm
Quantity(firm)
0
Price
Quantity(market)
Price
0

Initial ConditionInitial Condition
MarketFirm
Quantity(firm)
0
Price
MC ATC
P1
Quantity(market)
Price
0
D1
P1
Q1
A
S1
Long-runsupply

Short-Run ResponseShort-Run Response
MarketFirm
Quantity(firm)
0
Price
P1
Quantity(market)
Price
0
D1
D2
P1
Q1
A
S1
Long-runsupply
MC ATC
P1
B
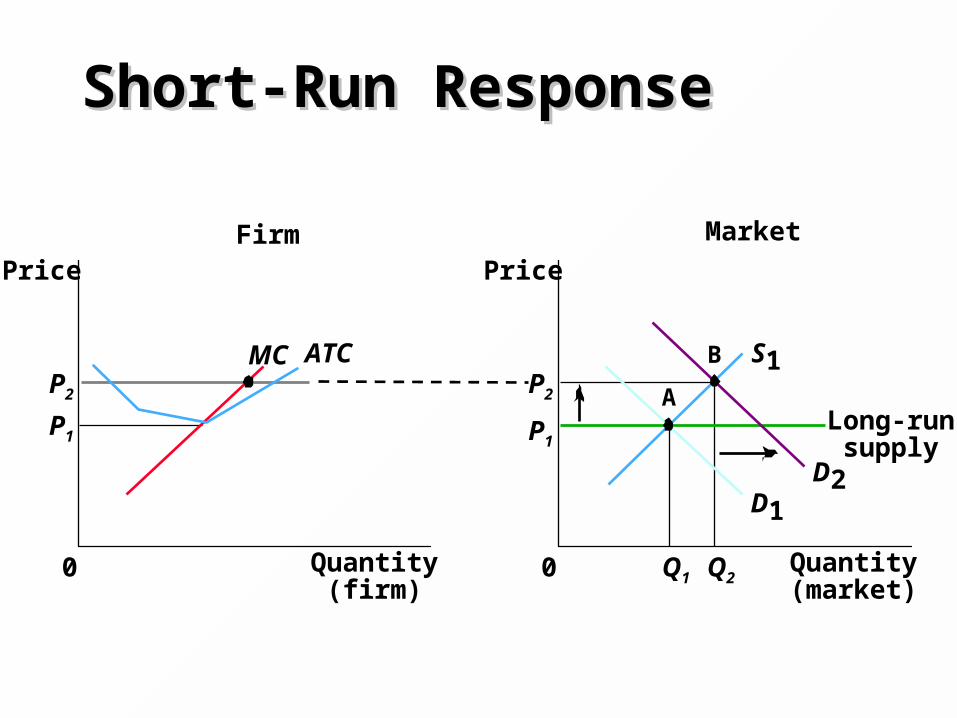
Short-Run ResponseShort-Run Response
MarketFirm
Quantity(firm)
0
Price
MC ATC
P1
P2
Quantity(market)
Price
0
D1
D2
P1
Q1 Q2
P2 A
B S1
Long-runsupply

Short-Run ResponseShort-Run Response
MarketFirm
Quantity(firm)
0
Price
MC ATCProfit
P1
P2
Quantity(market)
Price
0
D1
D2
P1
Q1 Q2
P2 A
B S1
Long-runsupply

Increase in Demand in the Increase in Demand in the Long RunLong Run
• Over time, the short-run supply curve shifts as profits encourage new firms to enter the market.

Increase in Demand in the Increase in Demand in the Long RunLong Run
• Price falls as new firms enter the market.

Increase in Demand in the Increase in Demand in the Long RunLong Run
• In the new long-run equilibrium profits return to zero and price returns to minimum average total cost.

Increase in Demand in the Increase in Demand in the Long RunLong Run
• The market has more firms to satisfy the greater demand.

Long-Run ResponseLong-Run Response
MarketFirm
Quantity(firm)
0
Price
MC ATCProfit
P1
P2
Quantity(market)
Price
0
D1
D2
P1
Q1 Q2
P2 A
B S1
Long-runsupply

Long-Run ResponseLong-Run Response
MarketFirm
Quantity(firm)
0
Price
MC ATCProfit
P1
P2
Quantity(market)
Price
0
P1
Q1 Q2
P2 A
B
Long-runsupply
S2
D1
D2
S1

Long-Run ResponseLong-Run Response
MarketFirm
Quantity(firm)
0
Price
MC ATC
P1
Quantity(market)
Price
0
D1
D2
P1
Q1 Q2
P2 A
B S1
Long-runsupply
S2

Increase in Demand in the Increase in Demand in the Short and Long RunShort and Long Run
MarketFirm
Quantity(firm)
0
Price
MC ATC
P1
Quantity(market)
Price
0
D2
P1
Q1
D1
Q2
A
B S1
Long-runsupply
S2
Q3
C

Why the Long-Run Supply Why the Long-Run Supply Curve Might Slope UpwardCurve Might Slope Upward
• Some resources used in production may be available only in limited quantities.
• Firms may have different costs.

ConclusionConclusion
• Because a competitive firm is a price taker, its revenue is proportional to the amount of output it produces.
• The price of the good equals both the firm’s average revenue and its marginal revenue

ConclusionConclusion
• To maximize profit a firm chooses the quantity of output where marginal revenue equals marginal cost.
• This is also the quantity at which price equals marginal cost.

ConclusionConclusion
• In the short run, the firm will choose to shut down temporarily if the price of the good is less than average variable cost.
• In the long run, it will choose to exit if the price is less than average total cost.

ConclusionConclusion
• If firms can freely enter and exit the market, the price also equals the lowest possible average total cost of production in the long run.
• The number of firms adjusts to drive the market back to the zero-profit equilibrium.

ConclusionConclusion
• Because firms can enter and exit more easily in the long run than the short run, the long-run supply curve is typically more elastic than the short-run supply curve.

FIRMS IN COMPETITIVE FIRMS IN COMPETITIVE MARKETSMARKETS
End of Chapter 14


Quantity0
Costsand
RevenueMC
ATC
AVC
MC2
MC1
Q1 Q2QMAX
P = MR1 = MR2 P = AR = MR
The firm maximizesprofit by producingthe quantity at whichmarginal cost equalsmarginal revenue.
Figure 14-1

Quantity0
Price
MC
ATC
AVC
P2
P1
Q1 Q2
Figure 14-2

Quantity
MC
ATC
AVC
0
Costs
Firmshutsdown ifP < AVC
Firm’s short-runsupply curve
Figure 14-3

Firm exitsif P < ATC
Quantity
MC
ATC
AVC
0
Costs
Firm’s long-runsupply curve
Figure 14-4

(a) A Firm with Profits
Quantity0
Price
P = AR = MR
ProfitATCMC
P
ATC
Q(profit-maximizing quantity)
Figure 14-5a

(b) A Firm with Losses
Quantity0
Price
ATC
Loss
ATCMC
Q(loss-minimizing quantity)
P P = AR = MR
Figure 14-5b

(a) Individual Firm Supply
Quantity (firm)0
Price
MC
$2.00
1.00
100 200
(b) Market Supply
Quantity (market)0
Price
Supply
$2.00
1.00
100,000 200,000
Figure 14-6

(a) Firm s Zero-Profit Condition
Quantity (firm)0
Price
PP= minimumATC
(b) Market Supply
Quantity (market)
Price
0
Supply
MC
ATC
Figure 14-7

Firm(a) Initial Condition
Quantity (firm)0
Price
Market
Quantity (market)
Long-runsupply
Price
0
Demand
Short-run supply
P1 P
MC ATC
P1PA
Q1
MarketFirm(b) Short-Run Response
Quantity (firm)0
Price
MC ATCProfit
P1
P2
Quantity (market)
Long-runsupply
Price
0
D 1D 2
P1
Q1 Q2
P2A
B S1
P1
Firm(c) Long-Run Response
Quantity (firm)0
Price
MC ATC
Market
Quantity (market)
Price
0
P1
P2
Q1 Q2
Long-runsupply
Q3
C
B
D 1
D 2
S1
AS2
Figure 14-8

Firm
(a) Initial Condition
0
PriceMarket
Long-runsupply
Price
0
Demand, D1
Short-run supply, S1
P1 P
MC ATC
P1PA
Q1
Figure 14-8a
Quantity(market)
Quantity(firm)

(b) Short-Run Response
Figure 14-8b
MarketFirm
Quantity(firm)
0
Price
MC ATCProfit
P1
P2
Quantity(market)
Price
0
D1
D2
P1
Q1 Q2
P2 A
B S1
Long-runsupply

(c) Long-Run Response
Figure 14-8c
P1
Firm
0
Price
MC ATC
MarketPrice
0
P1
P2
Q1 Q2
Long-runsupply
Q3
C
B
D1
D2
S1
AS2
Quantity(firm)
Quantity(market)