Embed Size (px)
Citation preview

The on-line version of the agenda is posted for your convenience at http://www.first5sacramento.net/default.html. As they become available, hard copies of all documents are
available from the Clerk of the Commission at the First 5 Sacramento Commission offices.
FIRST 5 SACRAMENTO COMMISSION ADVISORY COMMITTEE
2750 Gateway Oaks Drive, Suite 330 Sacramento, CA 95833
AGENDA
FRIDAY June 9, 2017 2:00 P.M. Members: Robert Silva (Chair), Judy Walker (Vice-Chair)
Ernie Brown, Carolyn Curtis, LeAnne Ruzzamenti, Cid Van Koersel, Trinh Vu, Walter Wyniarczuk, Angelina Woodberry, Alyssa Hall, Kimberly Bushard, Jeff Rabinovitz, Tony Smith, Emily Bowen
Staff: Julie Gallelo, Executive Director Gail Syputa, Clerk of the Commission
1. Call to Order and Roll Call
2. Public Comment on Non-Agenda Matters
3. “Mindfulness” Exercise
4. Icebreaker/Connection Activity
5. Approval of April 14, 2017 Draft Action Summary
6. First 5 Commission Report
Julie Gallelo
7. Presentation: School Readiness Evaluation Findings
8. Presentation: Update on First 5’s Oral Health Efforts
9. Announcements/Comments
10. Adjourn
FIRST 5 SACRAMENTO COMMISSION ADVISORY COMMITTEE
2750 Gateway Oaks Drive, Suite 330 Sacramento, CA 95833
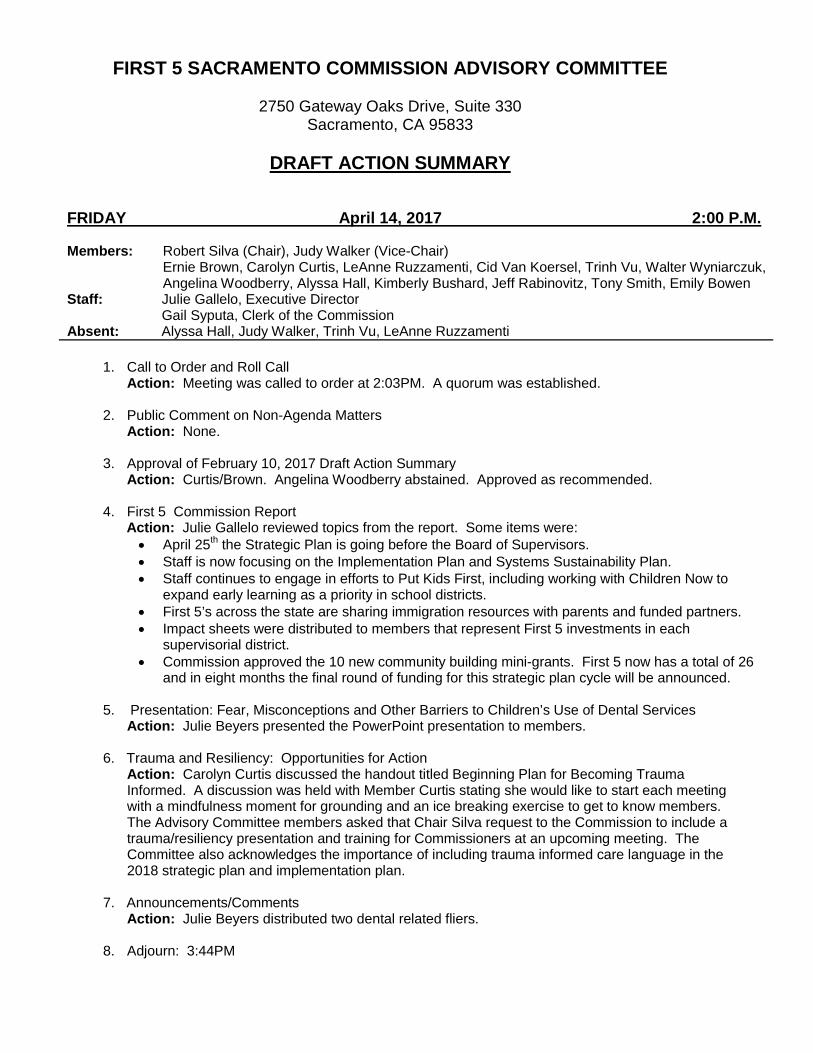
DRAFT ACTION SUMMARY
FRIDAY April 14, 2017 2:00 P.M. Members: Robert Silva (Chair), Judy Walker (Vice-Chair)
Ernie Brown, Carolyn Curtis, LeAnne Ruzzamenti, Cid Van Koersel, Trinh Vu, Walter Wyniarczuk, Angelina Woodberry, Alyssa Hall, Kimberly Bushard, Jeff Rabinovitz, Tony Smith, Emily Bowen
Staff: Julie Gallelo, Executive Director Gail Syputa, Clerk of the Commission Absent: Alyssa Hall, Judy Walker, Trinh Vu, LeAnne Ruzzamenti
1. Call to Order and Roll Call Action: Meeting was called to order at 2:03PM. A quorum was established.
2. Public Comment on Non-Agenda Matters Action: None.
3. Approval of February 10, 2017 Draft Action Summary Action: Curtis/Brown. Angelina Woodberry abstained. Approved as recommended.
4. First 5 Commission Report Action: Julie Gallelo reviewed topics from the report. Some items were:
• April 25th the Strategic Plan is going before the Board of Supervisors. • Staff is now focusing on the Implementation Plan and Systems Sustainability Plan. • Staff continues to engage in efforts to Put Kids First, including working with Children Now to
expand early learning as a priority in school districts. • First 5’s across the state are sharing immigration resources with parents and funded partners. • Impact sheets were distributed to members that represent First 5 investments in each
supervisorial district. • Commission approved the 10 new community building mini-grants. First 5 now has a total of 26
and in eight months the final round of funding for this strategic plan cycle will be announced.
5. Presentation: Fear, Misconceptions and Other Barriers to Children’s Use of Dental Services Action: Julie Beyers presented the PowerPoint presentation to members.
6. Trauma and Resiliency: Opportunities for Action Action: Carolyn Curtis discussed the handout titled Beginning Plan for Becoming Trauma Informed. A discussion was held with Member Curtis stating she would like to start each meeting with a mindfulness moment for grounding and an ice breaking exercise to get to know members. The Advisory Committee members asked that Chair Silva request to the Commission to include a trauma/resiliency presentation and training for Commissioners at an upcoming meeting. The Committee also acknowledges the importance of including trauma informed care language in the 2018 strategic plan and implementation plan.
7. Announcements/Comments Action: Julie Beyers distributed two dental related fliers.
8. Adjourn: 3:44PM
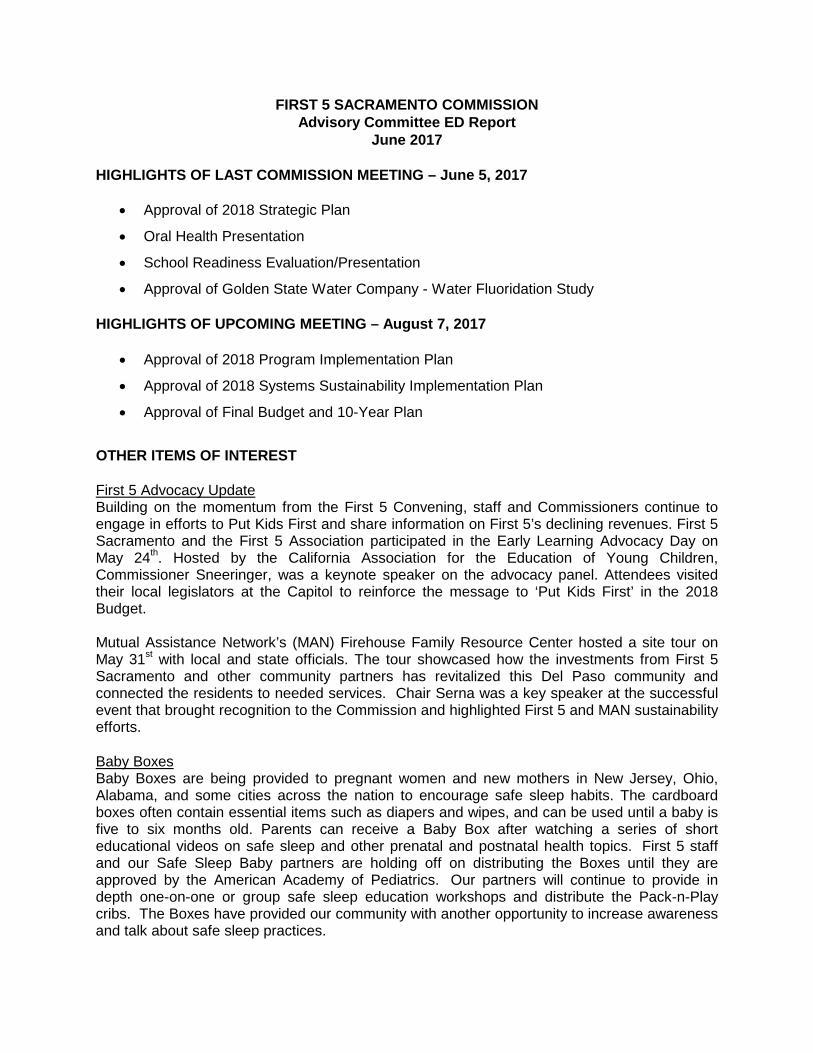
FIRST 5 SACRAMENTO COMMISSION Advisory Committee ED Report
June 2017 HIGHLIGHTS OF LAST COMMISSION MEETING – June 5, 2017
• Approval of 2018 Strategic Plan
• Oral Health Presentation
• School Readiness Evaluation/Presentation
• Approval of Golden State Water Company - Water Fluoridation Study HIGHLIGHTS OF UPCOMING MEETING – August 7, 2017
• Approval of 2018 Program Implementation Plan
• Approval of 2018 Systems Sustainability Implementation Plan
• Approval of Final Budget and 10-Year Plan
OTHER ITEMS OF INTEREST First 5 Advocacy Update Building on the momentum from the First 5 Convening, staff and Commissioners continue to engage in efforts to Put Kids First and share information on First 5’s declining revenues. First 5 Sacramento and the First 5 Association participated in the Early Learning Advocacy Day on May 24th. Hosted by the California Association for the Education of Young Children, Commissioner Sneeringer, was a keynote speaker on the advocacy panel. Attendees visited their local legislators at the Capitol to reinforce the message to ‘Put Kids First’ in the 2018 Budget. Mutual Assistance Network’s (MAN) Firehouse Family Resource Center hosted a site tour on May 31st with local and state officials. The tour showcased how the investments from First 5 Sacramento and other community partners has revitalized this Del Paso community and connected the residents to needed services. Chair Serna was a key speaker at the successful event that brought recognition to the Commission and highlighted First 5 and MAN sustainability efforts. Baby Boxes Baby Boxes are being provided to pregnant women and new mothers in New Jersey, Ohio, Alabama, and some cities across the nation to encourage safe sleep habits. The cardboard boxes often contain essential items such as diapers and wipes, and can be used until a baby is five to six months old. Parents can receive a Baby Box after watching a series of short educational videos on safe sleep and other prenatal and postnatal health topics. First 5 staff and our Safe Sleep Baby partners are holding off on distributing the Boxes until they are approved by the American Academy of Pediatrics. Our partners will continue to provide in depth one-on-one or group safe sleep education workshops and distribute the Pack-n-Play cribs. The Boxes have provided our community with another opportunity to increase awareness and talk about safe sleep practices.
Executive Director Report – April 2017 Page 2 of 2 Outreach In partnership with Moms Rising, a nationwide parent advocacy group, First 5 Sacramento participated in ‘Let’s Get Movin for Kids’ on June 1st. Held, on the lawn of the State Capitol, the family friendly dance party was aimed to encourage the legislature prioritize funding for kids in the budget. Co-hosts included Senator Pan, Children NOW and Common Sense Kids Action. Outdoor Advertising In partnership with Sagent Marketing, a two month outdoor campaign featuring the nationally recognized Sugar Bites ads, is running through June in both English and Spanish. Co-branded with the campaign creator, First 5 Contra Costa, the outdoor ads target high-needs areas throughout Sacramento County with (47) convenience store ads in English and (30) in Spanish language. Placements are in low income areas as well as areas where the Spanish language is prevalent. Other elements of the campaign include 40 window clings that will be placed on the sliding glass doors in convenience stores near sugary beverages such as sodas, and 11 ads in Spanish language in laundromats. Overall expected impressions for the two-month campaign are 13 million.
First 5 Sacramento 2016 School Readiness Study
2
Acknowledgments
Applied Survey Research (ASR) would like to acknowledge the following individuals for their support and assistance in the planning and implementation of the 2016 school readiness assessment in Sacramento County:
Julie Gallelo, First 5 Sacramento, Executive Director
Monin Mendoza, First 5 Sacramento, School Readiness Planner
First 5 Sacramento School Readiness Coordinators:
– Mikako Fisher, Karin Nakahira-Young (Elk Grove USD)
– Lupe Fussell, Jacqueline Wyse (Folsom Cordova USD)
– Sherri Miller, Donna Mayo-Whitlock (Galt USD)
– Christine Smith, Lisa Claussen (Natomas USD)
– Carrie Norris, Heather Goss (River Delta USD)
– Robin Smith, Laura Lystrup (Robla School District)
– Arturo Jimenez, Jacquie Bonini (Sacramento City USD)
– Dave Pascoa, Lizet Martinez (San Juan USD)
– Leslie Cohen, Elizabeth Cunnion (Twin Rivers USD)
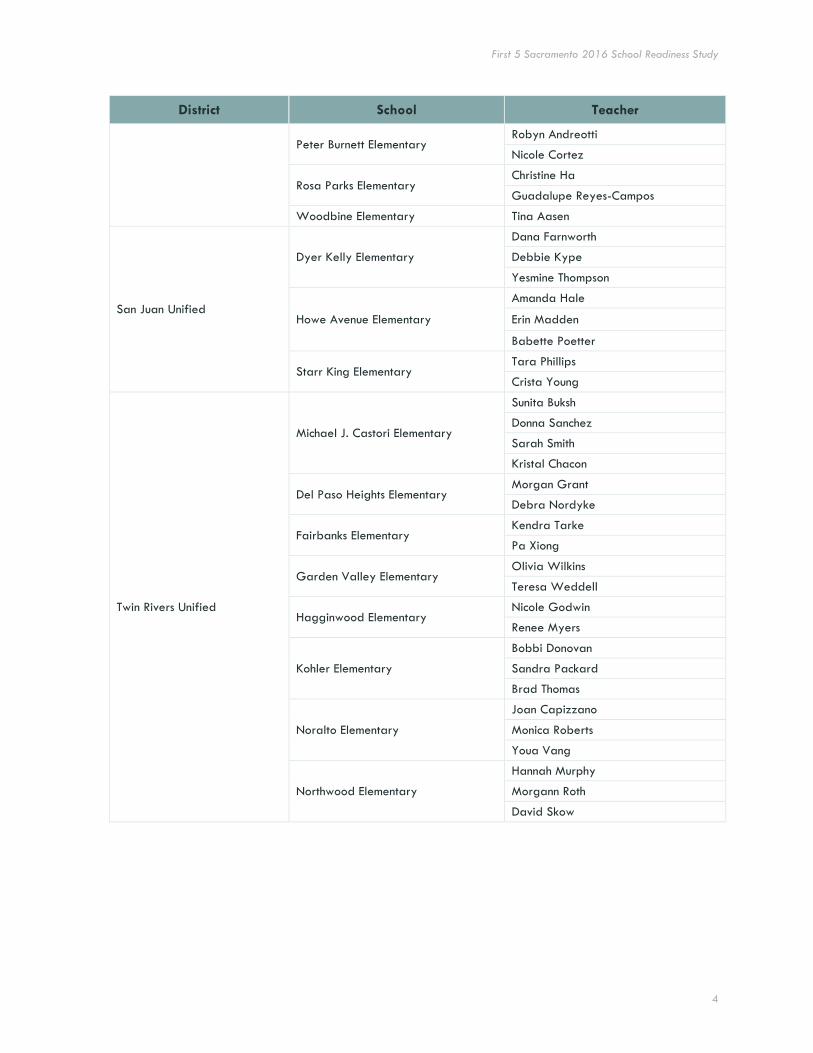
This assessment would also not have been possible without the support of the families and teachers of participating kindergarteners who generously gave their time and energy to help us better understand the skills of the children entering their classrooms. We gratefully acknowledge the assistance of the many kindergarten teachers listed in the following table.
Participating Sacramento County Districts, Schools, and Teachers
District School Teacher
Elk Grove Unified
Charles E. Mack Elementary Teri Krouse
Nicole Roschak
David Reese Elementary Jennifer Mederos
Marilyn Yu
Florin Elementary
Sandra Ferrer
Nia Welsh
Houa Vang
Herman Leimbach Elementary
Cheryl Crane
Heidi Donnelly
Gayle Gerdes
Samuel Kennedy Elementary Denise Brenenstall
Miska Pearson
Folsom Cordova Unified Cordova Gardens Elementary
Yoly Stroeve & Suemi Oxford
Christine Suleiman & Danielle Dalton
Cordova Villa Elementary Megan Bussman
First 5 Sacramento 2016 School Readiness Study
3
District School Teacher
Kristine Miramontes
Rancho Cordova Elementary Joanna Slaughter
Theodore Judah Elementary Celeste Sonneborn
Barbara Young
White Rock Elementary
Sarah Bohorquez
Zhanna Marin
Jessica Waugh
Williamson Elementary Deanna La Greca
Susanna Verplanken
Galt Joint Union Elementary
Greer Elementary Emily Oliveira
Kathy Pletcher
Valley Oaks Elementary Lourdes Anton
Sara Mullins
Natomas Unified
American Lakes Elementary Kathryn Freer
Laura Farbstein
Jefferson Elementary Amber Allison
Wendy Heu
River Delta Joint Unified Isleton Elementary Stephen Wright
Walnut Grove Elementary Makayla Perlot
Robla
Bell Avenue Elementary
Caitlin Tipton
Christie Erhart
Katy Yund
Main Avenue Elementary Crystal Saladin
Irma Tchamourian
Sacramento City Unified
Edward Kemble Elementary
Patricia Arellano
Alyce Hammond
Nancy Lopez
Ethel I. Baker Elementary Jenny Nguyen
Charisse Tuvilla
Father Keith B. Kenny Elementary Char Feagins
Estella Fuller
John Still Elementary
Maria Lares
Muang Saeteurn
Joua Vang
Leataata Floyd Elementary Shaneka Harvey
Demetria Stanley
Oak Ridge Elementary Jacqueline Inama
Heather Joyce
Pacific Elementary Chue Lao
Siphiwe Mashinini-Nigl
First 5 Sacramento 2016 School Readiness Study
4
District School Teacher
Peter Burnett Elementary Robyn Andreotti
Nicole Cortez
Rosa Parks Elementary Christine Ha
Guadalupe Reyes-Campos
Woodbine Elementary Tina Aasen
San Juan Unified
Dyer Kelly Elementary
Dana Farnworth
Debbie Kype
Yesmine Thompson
Howe Avenue Elementary
Amanda Hale
Erin Madden
Babette Poetter
Starr King Elementary Tara Phillips
Crista Young
Twin Rivers Unified
Michael J. Castori Elementary
Sunita Buksh
Donna Sanchez
Sarah Smith
Kristal Chacon
Del Paso Heights Elementary Morgan Grant
Debra Nordyke
Fairbanks Elementary Kendra Tarke
Pa Xiong
Garden Valley Elementary Olivia Wilkins
Teresa Weddell
Hagginwood Elementary Nicole Godwin
Renee Myers
Kohler Elementary
Bobbi Donovan
Sandra Packard
Brad Thomas
Noralto Elementary
Joan Capizzano
Monica Roberts
Youa Vang
Northwood Elementary
Hannah Murphy
Morgann Roth
David Skow
First 5 Sacramento 2016 School Readiness Study
5
Table of Contents
Acknowledgments ............................................................................................................................................................... 2
Table of Contents ............................................................................................................................................................... 5
List of Figures ....................................................................................................................................................................... 7
Introduction ........................................................................................................................................................................... 9
Defining School Readiness .......................................................................................................................................... 9
The Applied Survey Research School Readiness Assessment Model .................................................................... 10
Purpose of This Study ............................................................................................................................................... 11
Methodology .................................................................................................................................................................... 12
Sample ..................................................................................................................................................................... 12
Data Collection Instruments and Implementation ........................................................................................................ 13
Instruments and Data Sources ............................................................................................................................. 13
Implementation .................................................................................................................................................... 13
Schools, Classrooms, Parent Consent, and Response Rates .................................................................................. 14
Analyses and Statistical Notation ........................................................................................................................ 15
A Portrait of Students and Families in First 5 Sacramento-Supported School Communities ............................. 16
Demographics .......................................................................................................................................................... 16
Child Language................................................................................................................................................... 17
Household Composition and Mobility .................................................................................................................. 17
Pre-kindergarten Experiences .................................................................................................................................... 18
First 5 School Readiness Service Participation .................................................................................................... 19
Children’s Health ...................................................................................................................................................... 22
Insurance, Access to Care, and Screenings .......................................................................................................... 22
Birth and Developmental Outcomes .................................................................................................................... 22
Dental Health Indicators and Access to Care ...................................................................................................... 23
Child Well-Being and Attendance Patterns ........................................................................................................ 23
Family Activities ........................................................................................................................................................ 24
Family Activities in the Home ............................................................................................................................... 24
Use of Local Educational Resources ..................................................................................................................... 24
Other Home Practices: Screen Time, Bedtime, and Internet Access ...................................................................... 25
Preparation for Kindergarten in the Home ................................................................................................................ 25
Preparation for Kindergarten ............................................................................................................................. 25
Parental Supports and Stressors ................................................................................................................................ 28
Use of Parenting Programs, Services, and Other Support .................................................................................. 28
Social Support, Parenting Strain and Protective Factors ..................................................................................... 28
Household Stressors ............................................................................................................................................ 30
First 5 Sacramento 2016 School Readiness Study
6
Family Background Summary .................................................................................................................................... 31
Kindergarten Student Readiness .................................................................................................................................. 32
Basic Building Blocks of Readiness ............................................................................................................................ 32
Basic Building Blocks Scores ................................................................................................................................ 33
Performance across the Individual Skills .............................................................................................................. 33
Greatest Strengths and Needs across Years ....................................................................................................... 35
How Many Students Were Ready for Kindergarten? ................................................................................................. 36
What Are the Key Predictors of School Readiness Across the First 5 Network? .......................................................... 38
Predictors of Overall Readiness .......................................................................................................................... 38
What are the Specific Gains in Kindergarten Readiness Associated with First 5 Preschool Attendance? ............ 39
Other First 5 School Readiness Services and Readiness ...................................................................................... 41
Summary .................................................................................................................................................................. 41
Summary and Conclusion ............................................................................................................................................... 43
References ......................................................................................................................................................................... 45

First 5 Sacramento 2016 School Readiness Study
7
List of Figures
Figure 1. Map of First 5 Sacramento Network Schools in the 2016 Readiness Assessment, by District . 12
Figure 2. Completion Metrics of the Sacramento County School Readiness Assessment, Fall 2016 ...... 14
Figure 3. School Readiness Completion by District ................................................................................ 15
Figure 4. Demographics of Sampled Kindergartners and their Families ............................................... 16
Figure 5. Child Language ...................................................................................................................... 17
Figure 6. Household Composition and Mobility ..................................................................................... 17
Figure 7. Types of Pre-K Experience in Year Prior to Kindergarten, 2016 .......................................... 18
Figure 8. Preschool Attendance, by Select Demographics..................................................................... 19
Figure 9. Preschool or TK Attendance, by Year .................................................................................... 19
Figure 10. First 5-Funded School Readiness Services .............................................................................. 20
Figure 11. Type of Service Received by First 5 Service Recipients ......................................................... 21
Figure 12. Students Who Received First 5-Funded School Readiness Services, by District ...................... 21
Figure 13. Health Screenings (Parent Report on PIF) ............................................................................... 22
Figure 14. Number of Children with Most Commonly Reported Disabilities ............................................ 22
Figure 15. Dental Health and Access to Care ......................................................................................... 23
Figure 16. Child Well-Being and Attendance ......................................................................................... 23
Figure 17. Family Activities 5 times per Week or More, 2016 ............................................................... 24
Figure 18. Use of Local Educational Resources ........................................................................................ 24
Figure 19. Home Environment: TV, Bedtime, Internet ............................................................................... 25
Figure 20. Information Received About School Readiness, by Year ........................................................ 26
Figure 21. Information Received About School Readiness, by First 5 Services, Fall 2016 ....................... 26
Figure 22. How Parents Helped Children Prepare for Kindergarten ...................................................... 27
Figure 23. Family Utilization of Parenting Services and Support, by Type ............................................. 28
Figure 24. Social Support ........................................................................................................................ 29
Figure 25. Parenting Strain ..................................................................................................................... 29
Figure 26. Protective Factors ................................................................................................................... 30

First 5 Sacramento 2016 School Readiness Study
8
Figure 27. Proportion of Families Indicating Stress by Source of Concern, 2016 .................................... 30
Figure 28. The Basic Building Blocks of Readiness ................................................................................... 32
Figure 29. Average Scores Across the Basic Building Blocks of Readiness, 2016.................................... 33
Figure 30. Percentage of Children at Each Proficiency Level Across Readiness Skills ............................. 34
Figure 31. Percentage of Children Scoring Proficient, 2012-2016 ........................................................ 35
Figure 32. Percent Ready for Kindergarten ............................................................................................ 36
Figure 33. Percent Ready in Each Building Block ..................................................................................... 36
Figure 34. Percent Ready, Partially Ready, and Not Ready, by Preschool Experience ............................. 37
Figure 35. Readiness Scores, by Preschool Experience (Adjusted for Other Child/Family Factors) ........ 37
Figure 36. Strongest Predictors of Overall School Readiness (in Order of Strength) .............................. 39
Figure 37. Readiness Scores, by F5-Supported Preschool Experience
(Adjusted for Other Child/Family Factors) ............................................................................ 40
Figure 38. Percent Ready for School, By F5-Supported Preschool Experience and Family Income
(Adjusted for Other Child/Family Factors) ............................................................................ 40
Figure 39. Readiness Scores for English Learners, by F5-Supported Preschool Experience (Adjusted for
Other Child/Family Factors) ................................................................................................... 41
Figure 40. Common Predictors of Overall Readiness, 2012-2016 ......................................................... 42
First 5 Sacramento 2016 School Readiness Study
9
Introduction
DEFINING SCHOOL READINESS
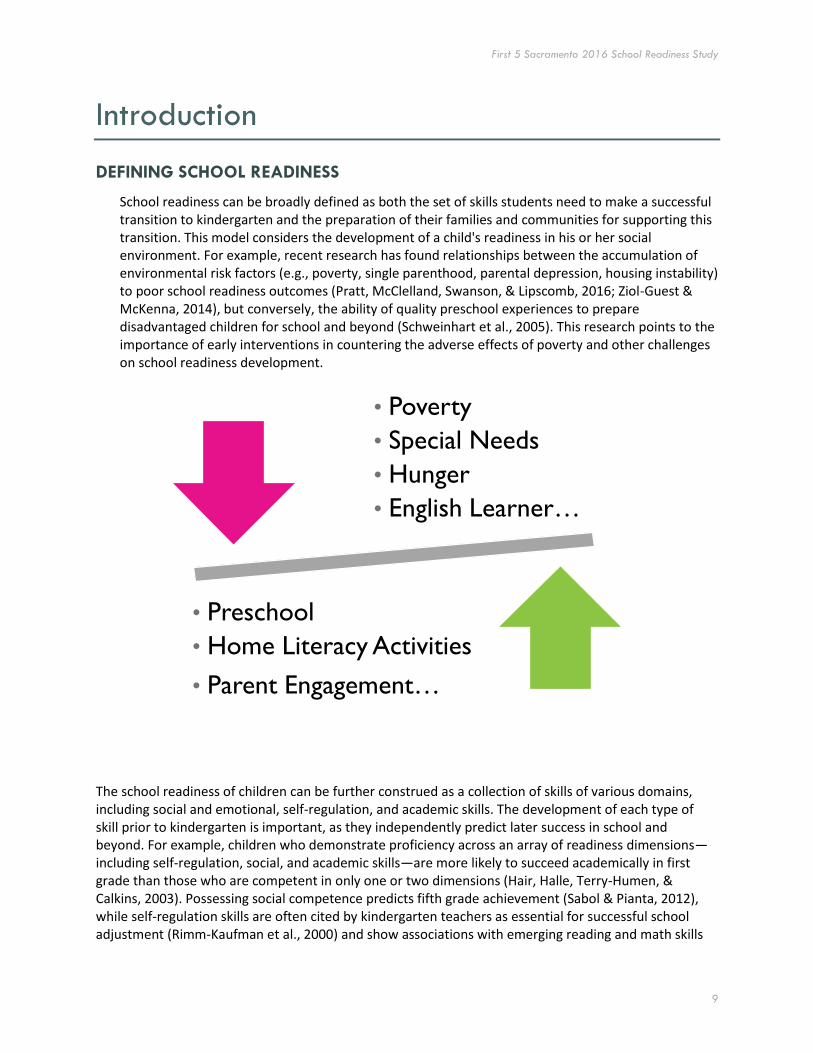
School readiness can be broadly defined as both the set of skills students need to make a successful transition to kindergarten and the preparation of their families and communities for supporting this transition. This model considers the development of a child's readiness in his or her social environment. For example, recent research has found relationships between the accumulation of environmental risk factors (e.g., poverty, single parenthood, parental depression, housing instability) to poor school readiness outcomes (Pratt, McClelland, Swanson, & Lipscomb, 2016; Ziol-Guest & McKenna, 2014), but conversely, the ability of quality preschool experiences to prepare disadvantaged children for school and beyond (Schweinhart et al., 2005). This research points to the importance of early interventions in countering the adverse effects of poverty and other challenges on school readiness development.
The school readiness of children can be further construed as a collection of skills of various domains, including social and emotional, self-regulation, and academic skills. The development of each type of skill prior to kindergarten is important, as they independently predict later success in school and beyond. For example, children who demonstrate proficiency across an array of readiness dimensions—including self-regulation, social, and academic skills—are more likely to succeed academically in first grade than those who are competent in only one or two dimensions (Hair, Halle, Terry-Humen, & Calkins, 2003). Possessing social competence predicts fifth grade achievement (Sabol & Pianta, 2012), while self-regulation skills are often cited by kindergarten teachers as essential for successful school adjustment (Rimm-Kaufman et al., 2000) and show associations with emerging reading and math skills
• Poverty
• Special Needs
• Hunger
• English Learner…
• Preschool
• Home Literacy Activities
• Parent Engagement…
First 5 Sacramento 2016 School Readiness Study
10
(Welsh et al., 2010). Further research shows that academic skills (e.g., knowing numbers and letters) and the ability to sustain attention (an aspect of self-regulation) significantly predict math and reading achievement later in elementary school and early adolescence (Duncan et al., 2007). Children who demonstrate poor achievement early in their school careers are more likely to experience grade retention, which puts them at greater risk factor for school dropout, even if the retention occurs during elementary school (Alexander, Entwisle, & Kabani, 2001; Roderick, 1994). The evidence is clear: school readiness sets the stage for successful outcomes throughout life.
The Applied Survey Research School Readiness Assessment Model
Since 2001, Applied Survey Research (ASR) has conducted school readiness assessments across Northern California, as well is in Lake County, Illinois, Coconino County, Arizona, and throughout the network of providers in the Los Angeles Unified Preschool (LAUP). ASR’s readiness assessment materials and protocols have been designed to reflect both the local context of school readiness as well as the current research from early education and K-12 literature. The central instrument of the assessment, the Kindergarten Observation Form (KOF), was created using the input of subject matter experts including community stakeholders, child development and education experts, preschool teachers, and kindergarten teachers.
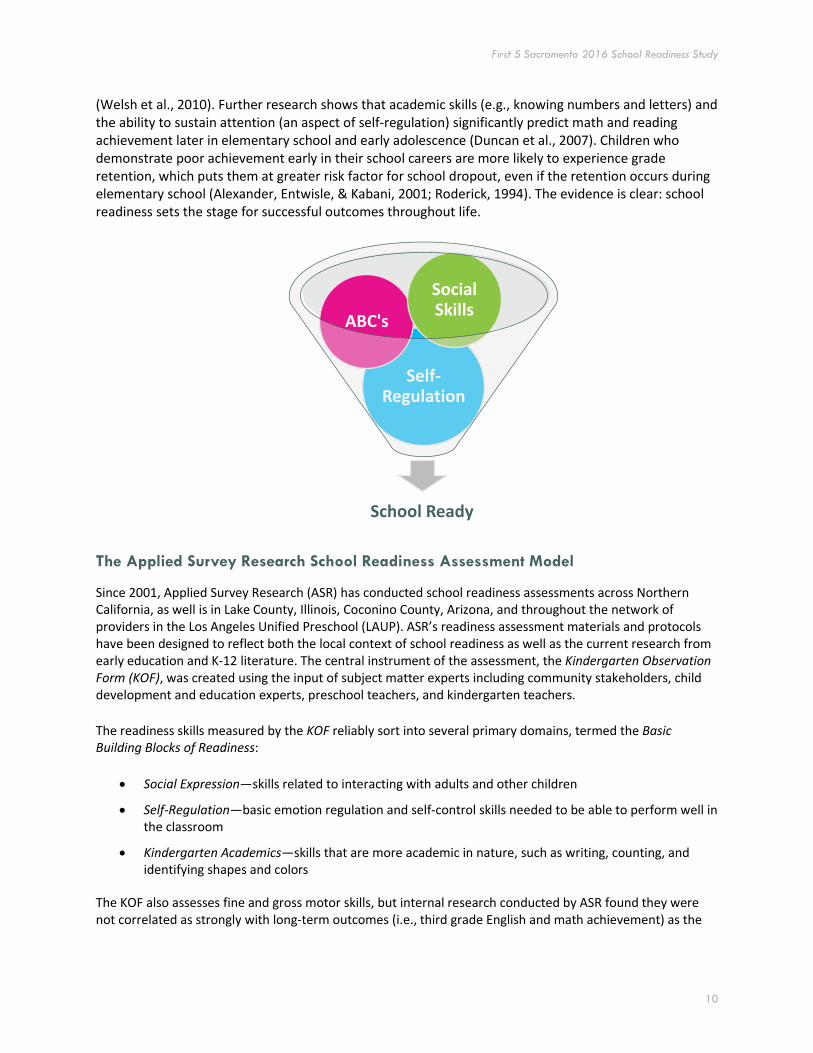
The readiness skills measured by the KOF reliably sort into several primary domains, termed the Basic Building Blocks of Readiness:
Social Expression—skills related to interacting with adults and other children
Self-Regulation—basic emotion regulation and self-control skills needed to be able to perform well in the classroom
Kindergarten Academics—skills that are more academic in nature, such as writing, counting, and identifying shapes and colors
The KOF also assesses fine and gross motor skills, but internal research conducted by ASR found they were not correlated as strongly with long-term outcomes (i.e., third grade English and math achievement) as the
School Ready
Self-Regulation
ABC's
SocialSkills

First 5 Sacramento 2016 School Readiness Study
11
other domains, and the literature is mixed on whether they are critical components of school readiness. Therefore, they are included in the assessment, but not called out as their own Building Block.
Given their importance in shaping school readiness, the ASR model also incorporates community and family preparation for school. The Parent Information Form (PIF) is a parent survey that captures family background and risk factors, and the degree to which the family has been involved in readiness-related activities and utilized community resources, including preschool, to help the child become ready for school. The model recognizes the contribution of early experiences to each of the skills that make up the Building Blocks.
PURPOSE OF THIS STUDY
The readiness assessment described in this report was conducted on behalf of First 5 Sacramento. The mission of First 5 Sacramento is to support the healthy development and well-being of children ages 0-5 by providing resources and services throughout the county that:
Improve children’s access to health care, especially oral health,
Improve nutrition and physical activity for young children,
Build effective parenting skills,
Increase access to and participation in quality early child care and education,
Strengthen communities, and
Develop school readiness.
In 2012, First 5 Sacramento and ASR first engaged in a partnership to assess incoming kindergarteners’ readiness for school across the First 5 countywide network of elementary schools. The assessment has been conducted annually since then to help First 5 and its partners understand how prepared students and their families are for kindergarten across the network, as well as the connections between readiness and early childhood experiences, including participation in First 5 services.
The readiness assessment was largely framed around three primary research questions.
1) How ready for kindergarten are children across the First 5 Sacramento network of schools?
2) How ready are families to support their children’s readiness?
3) What are the major factors or “predictors” of readiness across the First 5 Sacramento network? Are any specific First 5-funded interventions associated with enhanced student readiness?
This report provides a “snapshot” of readiness in the First 5 Sacramento network, as well as a “story” of readiness that examines the family and early education contexts of children entering kindergarten in fall 2015. The first section of this report presents the study’s methodology: sample design, instruments, and data collection methods. The next section presents the demographic, health and well-being characteristics, as well as family backgrounds of the children assessed. This is followed by a detailed analysis of student readiness across the different skill domains and an exploration of the various child and family factors associated with school readiness. The report then describes an analysis of the associations between First 5 participation and school readiness and concludes with a summary of major findings.

First 5 Sacramento 2016 School Readiness Study
12
Methodology
This section provides a brief overview of the data sample and response rates, data collection instruments, and sources that comprised the school readiness assessment model for First 5 Sacramento, followed by an explanation of the statistical notations used throughout the report.
SAMPLE
The sample of schools and classrooms was drawn by First 5 Sacramento staff to cover the entire First 5 service area, particularly those schools whose incoming kindergartners and their families were most likely to have been provided First 5 school readiness services in recent years. The sample was drawn to reflect the First 5 Sacramento target population and service network, which covered parts of Sacramento City, Twin Rivers, Elk Grove, Natomas, River Delta, Folsom Cordova, Galt, Robla, and San Juan school districts. The sample was not designed to be representative or generalizable to the county at large nor to any individual district or school. The map below shows the schools included in the 2016 readiness assessment.
Note: Galt Joint Union Elementary (two schools) and River Delta Joint Unified (two schools) are not pictured. These schools are south of
Sacramento in the cities of Galt, Walnut Grove, and Isleton.
First 5 Sacramento 2016 School Readiness Study
13
DATA COLLECTION INSTRUMENTS AND IMPLEMENTATION
Instruments and Data Sources
The two primary instruments used in this study were the Kindergarten Observation Form, completed by teachers to record ratings of child readiness, and the Parent Information Form, completed by parents and guardians to provide information about their children and family background. First 5 service and participation records for children and their parents were obtained and matched to school readiness data.
Kindergarten Observation Form (KOF)
Teachers used the Kindergarten Observation Form to record their observations of children across 20 readiness skills. Teachers observed and scored each child according to his or her level of proficiency in each skill, using the following response options: Not Yet (1), Beginning (2), In Progress (3), and Proficient (4). An option of Don't Know/Not Observed was provided as well. The KOF also includes fields to capture students’ basic demographic information to understand who took part in the study and to examine the characteristics that are associated with children’s skill development (e.g., experience in preschool and other child care settings, age, gender, whether or not the child has special needs).
Parent Information Form (PIF)
To better understand the family-based factors that contribute to children's readiness for school, all parents of children in participating classrooms were asked to complete a Parent Information Form. This is a survey that collects a variety of information about the child and the family, such as preschool and child care arrangements for children, parenting stressors and supports, and information and services families received.
Implementation
Obtaining Participation Agreement
To launch the study, First 5 Sacramento personnel, school readiness coordinators, and ASR staff reached out to the principals of each school selected to be in the assessment. Principals were provided with information about the assessment, including its purpose, what participation would entail for the kindergarten teachers, and a timeline for completion of the study. Each principal designated one to four teachers to participate in the assessment.
Teacher Trainings
Prior to and at the beginning of the 2016-17 school year, ASR conducted a series of in-depth assessment trainings for teachers at multiple Sacramento area locations and by web conference. The trainings included an overview of the project and study purpose and a detailed explanation of the data collection steps, student assessment protocol, and parent survey administration.
Parent Consent
Parents granted consent for their children to participate through a process of passive consent. At the beginning of the school year, teachers explained the project and the consent process to parents before distributing the parent consent forms and Parent Information Forms. Parents who filled out a PIF returned it to the teacher in a sealed manila envelope that was sent back to ASR. If, after being informed of the study, parents requested that their child not participate, the child was excluded from the study. All families in the assessed kindergarten classes (both those who participated and those who did not) were given a bilingual (Spanish/English) children’s book as a token of appreciation.
First 5 Sacramento 2016 School Readiness Study
14
Conducting Student Assessments
Teachers were instructed to conduct their student assessments approximately three to four weeks after the start of the school year, drawing upon their knowledge and observations of children during the first few weeks of school. The average length of time that elapsed between the start of school and teachers’ observations was 20 days – approximately three weeks after their classes had started. Once complete, each teacher mailed the packet of completed Kindergarten Observation Forms and Parent Information Forms to ASR. When the final packets were received in full by ASR, each of the teachers was mailed a thank-you letter and a $150 stipend in appreciation of their contribution to the assessment.
Schools, Classrooms, Parent Consent, and Response Rates
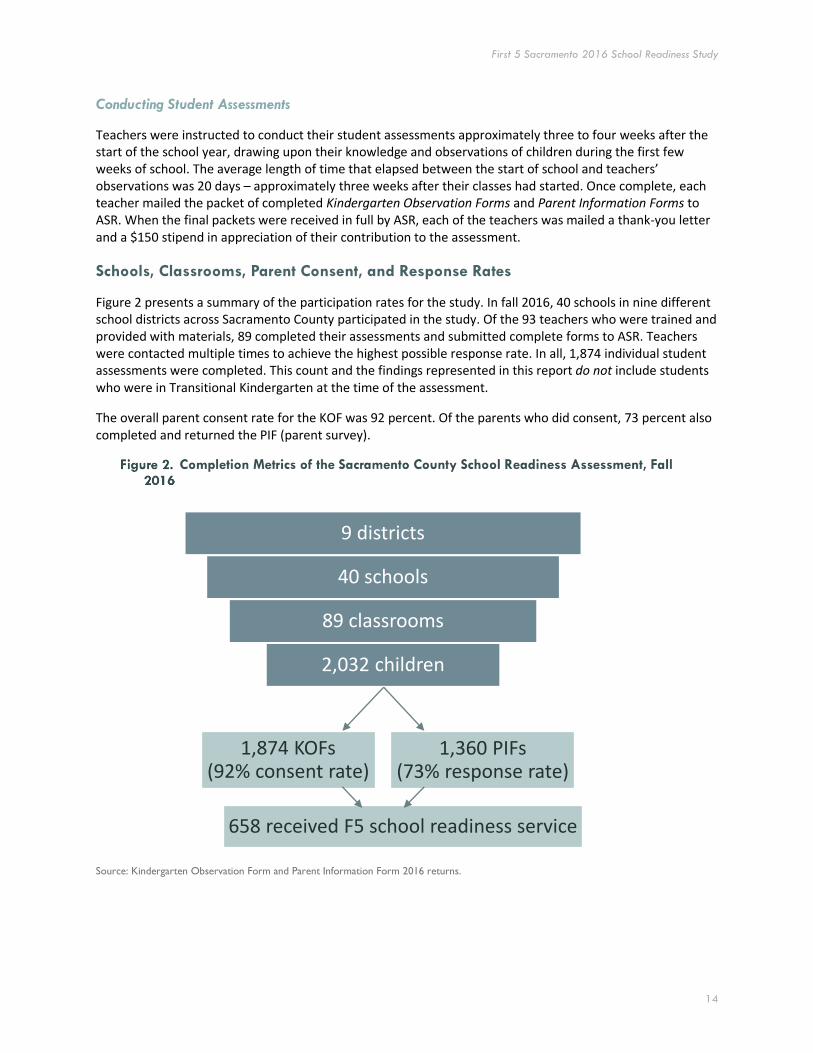
Figure 2 presents a summary of the participation rates for the study. In fall 2016, 40 schools in nine different school districts across Sacramento County participated in the study. Of the 93 teachers who were trained and provided with materials, 89 completed their assessments and submitted complete forms to ASR. Teachers were contacted multiple times to achieve the highest possible response rate. In all, 1,874 individual student assessments were completed. This count and the findings represented in this report do not include students who were in Transitional Kindergarten at the time of the assessment.
The overall parent consent rate for the KOF was 92 percent. Of the parents who did consent, 73 percent also completed and returned the PIF (parent survey).
Source: Kindergarten Observation Form and Parent Information Form 2016 returns.
9 districts
40 schools
89 classrooms
2,032 children
1,874 KOFs(92% consent rate)
658 received F5 school readiness service
1,360 PIFs(73% response rate)
First 5 Sacramento 2016 School Readiness Study
15
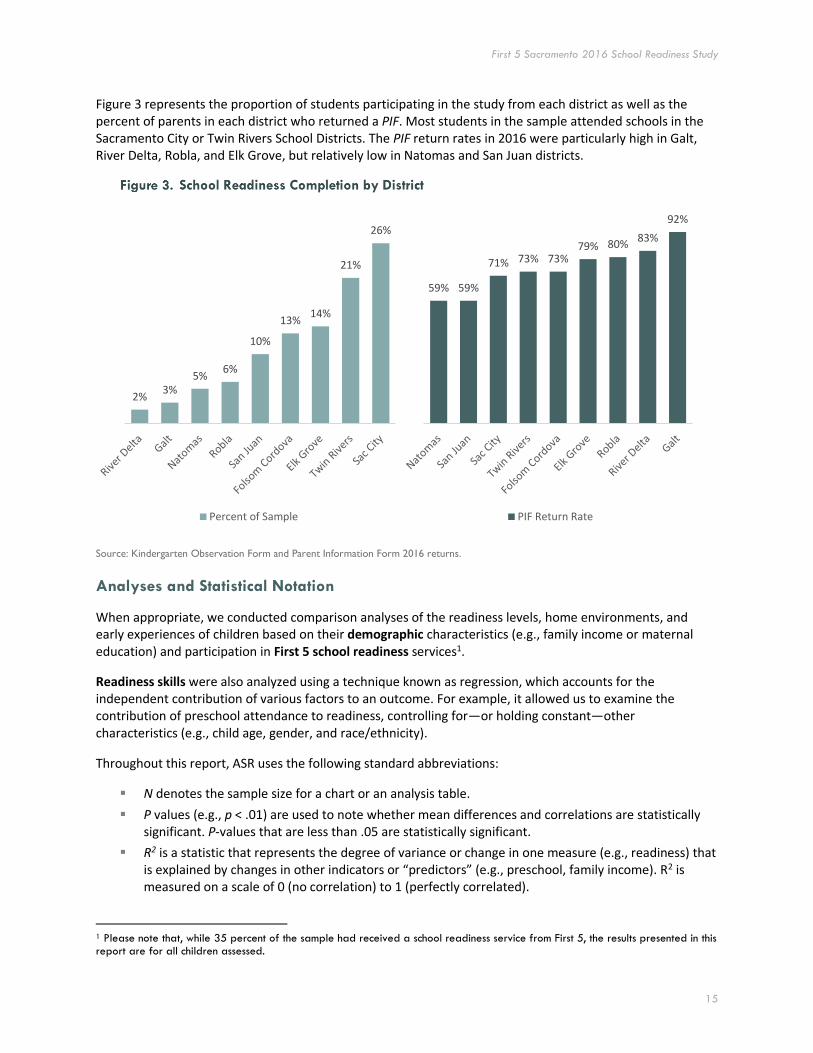
Figure 3 represents the proportion of students participating in the study from each district as well as the percent of parents in each district who returned a PIF. Most students in the sample attended schools in the Sacramento City or Twin Rivers School Districts. The PIF return rates in 2016 were particularly high in Galt, River Delta, Robla, and Elk Grove, but relatively low in Natomas and San Juan districts.
Source: Kindergarten Observation Form and Parent Information Form 2016 returns.
Analyses and Statistical Notation
When appropriate, we conducted comparison analyses of the readiness levels, home environments, and early experiences of children based on their demographic characteristics (e.g., family income or maternal education) and participation in First 5 school readiness services1.
Readiness skills were also analyzed using a technique known as regression, which accounts for the independent contribution of various factors to an outcome. For example, it allowed us to examine the contribution of preschool attendance to readiness, controlling for—or holding constant—other characteristics (e.g., child age, gender, and race/ethnicity).
Throughout this report, ASR uses the following standard abbreviations:
N denotes the sample size for a chart or an analysis table.
P values (e.g., p < .01) are used to note whether mean differences and correlations are statistically significant. P-values that are less than .05 are statistically significant.
R2 is a statistic that represents the degree of variance or change in one measure (e.g., readiness) that is explained by changes in other indicators or “predictors” (e.g., preschool, family income). R2 is measured on a scale of 0 (no correlation) to 1 (perfectly correlated).
1 Please note that, while 35 percent of the sample had received a school readiness service from First 5, the results presented in this report are for all children assessed.
2%3%
5%6%
10%
13%14%
21%
26%
Percent of Sample
59% 59%
71% 73% 73%79% 80%
83%
92%
PIF Return Rate
First 5 Sacramento 2016 School Readiness Study
16
A Portrait of Students and Families in First 5 Sacramento-Supported School Communities
DEMOGRAPHICS
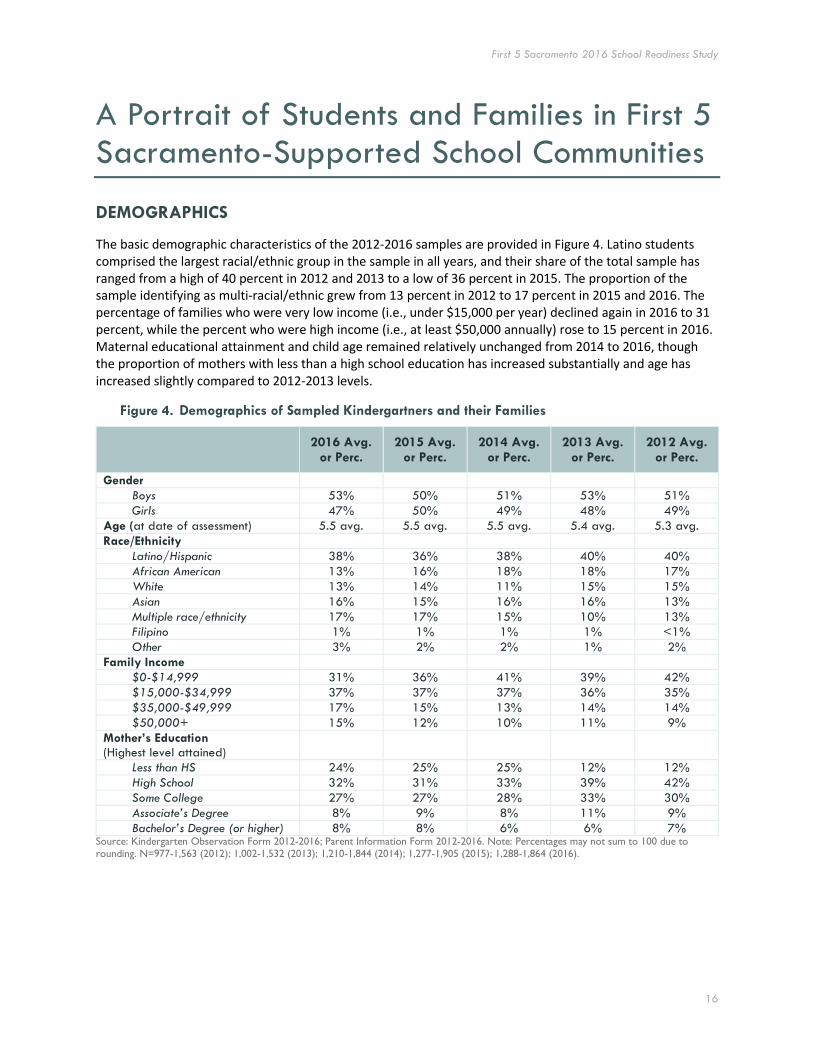
The basic demographic characteristics of the 2012-2016 samples are provided in Figure 4. Latino students comprised the largest racial/ethnic group in the sample in all years, and their share of the total sample has ranged from a high of 40 percent in 2012 and 2013 to a low of 36 percent in 2015. The proportion of the sample identifying as multi-racial/ethnic grew from 13 percent in 2012 to 17 percent in 2015 and 2016. The percentage of families who were very low income (i.e., under $15,000 per year) declined again in 2016 to 31 percent, while the percent who were high income (i.e., at least $50,000 annually) rose to 15 percent in 2016. Maternal educational attainment and child age remained relatively unchanged from 2014 to 2016, though the proportion of mothers with less than a high school education has increased substantially and age has increased slightly compared to 2012-2013 levels.
2016 Avg.
or Perc. 2015 Avg.
or Perc. 2014 Avg.
or Perc. 2013 Avg.
or Perc. 2012 Avg.
or Perc.
Gender
Boys 53% 50% 51% 53% 51%
Girls 47% 50% 49% 48% 49%
Age (at date of assessment) 5.5 avg. 5.5 avg. 5.5 avg. 5.4 avg. 5.3 avg.
Race/Ethnicity
Latino/Hispanic 38% 36% 38% 40% 40%
African American 13% 16% 18% 18% 17%
White 13% 14% 11% 15% 15%
Asian 16% 15% 16% 16% 13%
Multiple race/ethnicity 17% 17% 15% 10% 13%
Filipino 1% 1% 1% 1% <1%
Other 3% 2% 2% 1% 2%
Family Income
$0-$14,999 31% 36% 41% 39% 42%
$15,000-$34,999 37% 37% 37% 36% 35%
$35,000-$49,999 17% 15% 13% 14% 14%
$50,000+ 15% 12% 10% 11% 9%
Mother’s Education (Highest level attained)
Less than HS 24% 25% 25% 12% 12%
High School 32% 31% 33% 39% 42%
Some College 27% 27% 28% 33% 30%
Associate’s Degree 8% 9% 8% 11% 9%
Bachelor’s Degree (or higher) 8% 8% 6% 6% 7% Source: Kindergarten Observation Form 2012-2016; Parent Information Form 2012-2016. Note: Percentages may not sum to 100 due to rounding. N=977-1,563 (2012); 1,002-1,532 (2013); 1,210-1,844 (2014); 1,277-1,905 (2015); 1,288-1,864 (2016).
First 5 Sacramento 2016 School Readiness Study
17
Child Language
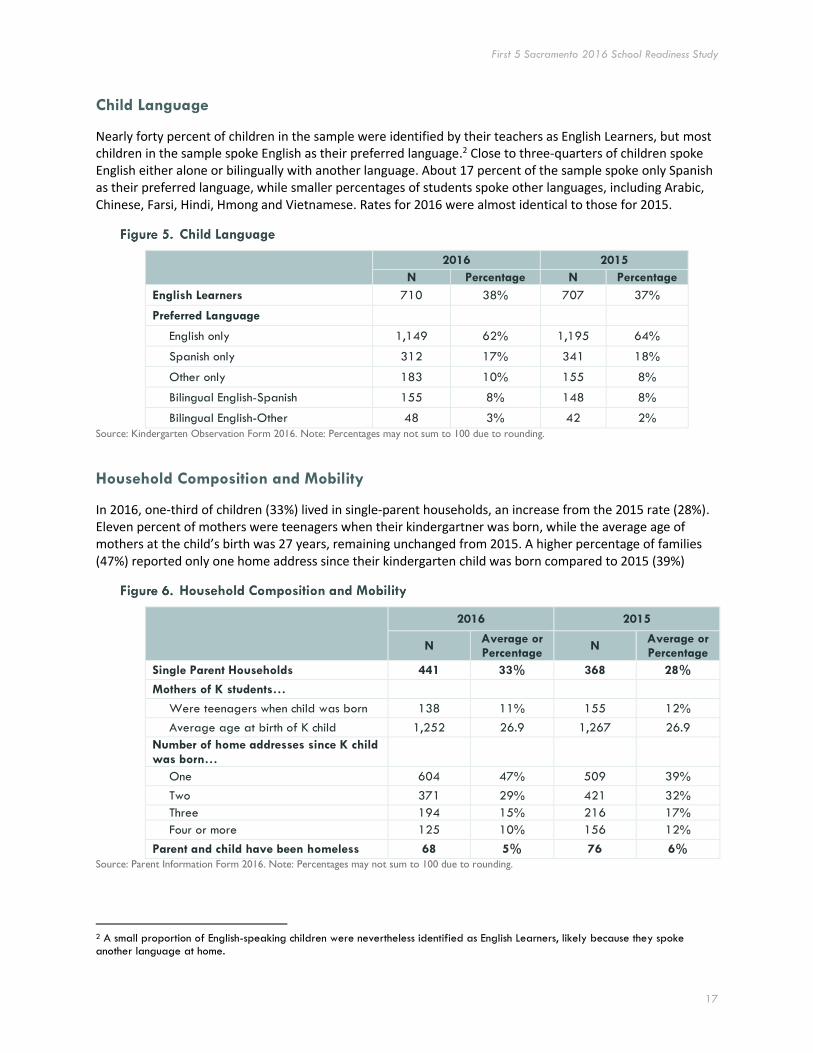
Nearly forty percent of children in the sample were identified by their teachers as English Learners, but most children in the sample spoke English as their preferred language.2 Close to three-quarters of children spoke English either alone or bilingually with another language. About 17 percent of the sample spoke only Spanish as their preferred language, while smaller percentages of students spoke other languages, including Arabic, Chinese, Farsi, Hindi, Hmong and Vietnamese. Rates for 2016 were almost identical to those for 2015.
2016 2015
N Percentage N Percentage
English Learners 710 38% 707 37%
Preferred Language
English only 1,149 62% 1,195 64%
Spanish only 312 17% 341 18%
Other only 183 10% 155 8%
Bilingual English-Spanish 155 8% 148 8%
Bilingual English-Other 48 3% 42 2%
Source: Kindergarten Observation Form 2016. Note: Percentages may not sum to 100 due to rounding.
Household Composition and Mobility
In 2016, one-third of children (33%) lived in single-parent households, an increase from the 2015 rate (28%). Eleven percent of mothers were teenagers when their kindergartner was born, while the average age of mothers at the child’s birth was 27 years, remaining unchanged from 2015. A higher percentage of families (47%) reported only one home address since their kindergarten child was born compared to 2015 (39%)
2016 2015
N Average or Percentage
N Average or Percentage
Single Parent Households 441 33% 368 28%
Mothers of K students…
Were teenagers when child was born 138 11% 155 12%
Average age at birth of K child 1,252 26.9 1,267 26.9
Number of home addresses since K child was born…
One 604 47% 509 39%
Two 371 29% 421 32%
Three 194 15% 216 17%
Four or more 125 10% 156 12%
Parent and child have been homeless 68 5% 76 6%
Source: Parent Information Form 2016. Note: Percentages may not sum to 100 due to rounding.
2 A small proportion of English-speaking children were nevertheless identified as English Learners, likely because they spoke another language at home.
First 5 Sacramento 2016 School Readiness Study
18
PRE-KINDERGARTEN EXPERIENCES
ASR used three sources to identify the specific types of preschool experiences children in the assessment had in the years prior to kindergarten entry. The Kindergarten Observation Form and Parent Information Form asked teachers and parents a series of questions about the child’s child care and/or preschool arrangements during the year prior to kindergarten entry. Participation records from First 5 were also obtained to supplement these sources and identify children enrolled in First 5 pre-K.
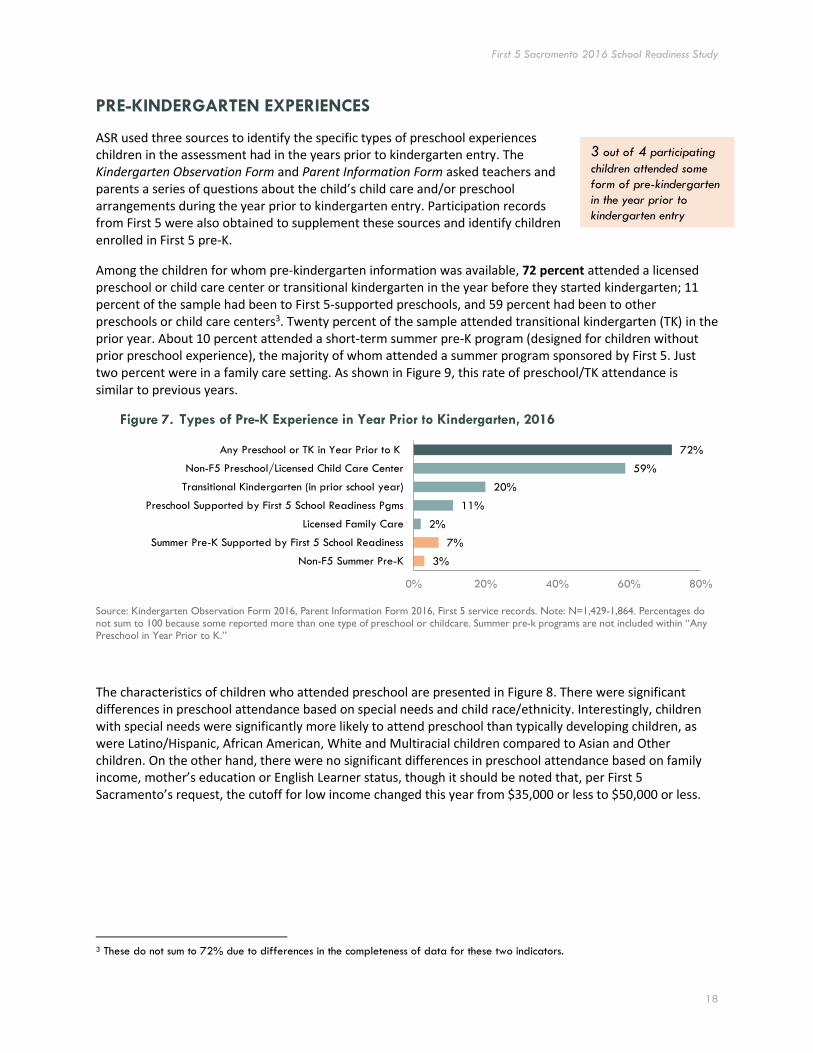
Among the children for whom pre-kindergarten information was available, 72 percent attended a licensed preschool or child care center or transitional kindergarten in the year before they started kindergarten; 11 percent of the sample had been to First 5-supported preschools, and 59 percent had been to other preschools or child care centers3. Twenty percent of the sample attended transitional kindergarten (TK) in the prior year. About 10 percent attended a short-term summer pre-K program (designed for children without prior preschool experience), the majority of whom attended a summer program sponsored by First 5. Just two percent were in a family care setting. As shown in Figure 9, this rate of preschool/TK attendance is similar to previous years.
Source: Kindergarten Observation Form 2016, Parent Information Form 2016, First 5 service records. Note: N=1,429-1,864. Percentages do not sum to 100 because some reported more than one type of preschool or childcare. Summer pre-k programs are not included within “Any Preschool in Year Prior to K.”
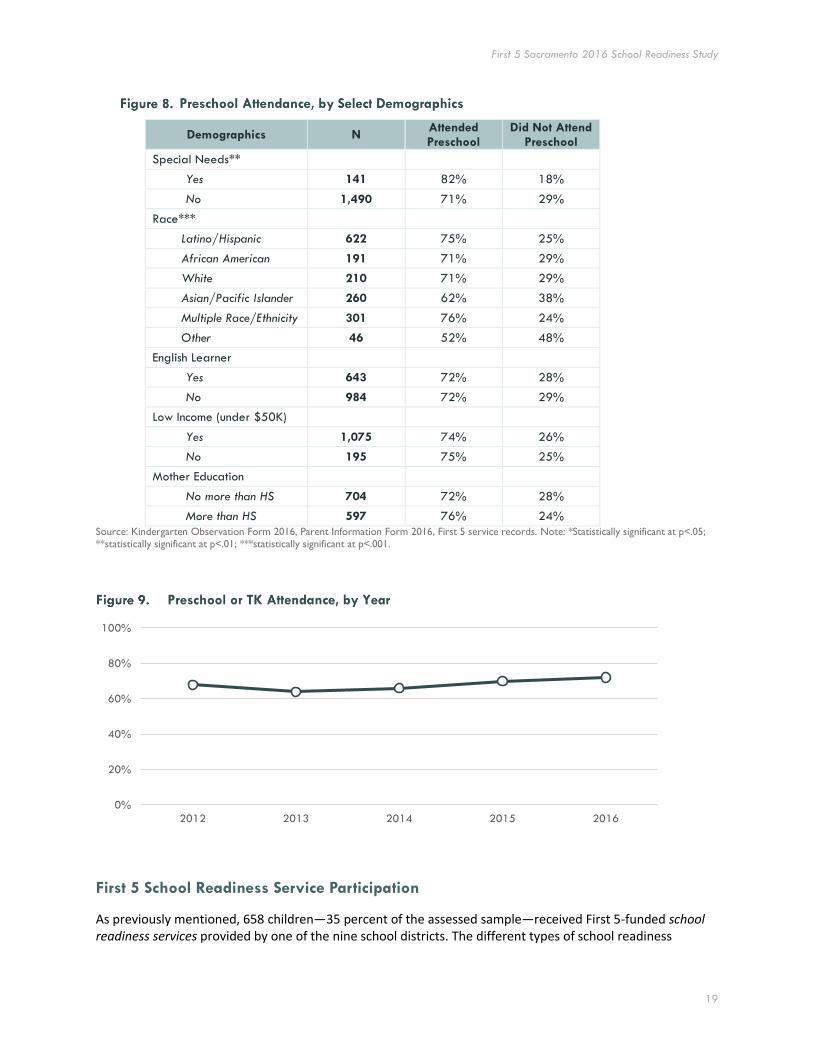
The characteristics of children who attended preschool are presented in Figure 8. There were significant differences in preschool attendance based on special needs and child race/ethnicity. Interestingly, children with special needs were significantly more likely to attend preschool than typically developing children, as were Latino/Hispanic, African American, White and Multiracial children compared to Asian and Other children. On the other hand, there were no significant differences in preschool attendance based on family income, mother’s education or English Learner status, though it should be noted that, per First 5 Sacramento’s request, the cutoff for low income changed this year from $35,000 or less to $50,000 or less.
3 These do not sum to 72% due to differences in the completeness of data for these two indicators.
3%
7%
2%
11%
20%
59%
72%
0% 20% 40% 60% 80%
Non-F5 Summer Pre-K
Summer Pre-K Supported by First 5 School Readiness
Licensed Family Care
Preschool Supported by First 5 School Readiness Pgms
Transitional Kindergarten (in prior school year)
Non-F5 Preschool/Licensed Child Care Center
Any Preschool or TK in Year Prior to K
3 out of 4 participating
children attended some
form of pre-kindergarten
in the year prior to
kindergarten entry
First 5 Sacramento 2016 School Readiness Study
19
Demographics N Attended Preschool
Did Not Attend Preschool
Special Needs**
Yes 141 82% 18%
No 1,490 71% 29%
Race***
Latino/Hispanic 622 75% 25%
African American 191 71% 29%
White 210 71% 29%
Asian/Pacific Islander 260 62% 38%
Multiple Race/Ethnicity 301 76% 24%
Other 46 52% 48%
English Learner
Yes 643 72% 28%
No 984 72% 29%
Low Income (under $50K)
Yes 1,075 74% 26%
No 195 75% 25%
Mother Education
No more than HS 704 72% 28%
More than HS 597 76% 24%
Source: Kindergarten Observation Form 2016, Parent Information Form 2016, First 5 service records. Note: *Statistically significant at p<.05; **statistically significant at p<.01; ***statistically significant at p<.001.
First 5 School Readiness Service Participation
As previously mentioned, 658 children—35 percent of the assessed sample—received First 5-funded school readiness services provided by one of the nine school districts. The different types of school readiness
0%
20%
40%
60%
80%
100%
2012 2013 2014 2015 2016
First 5 Sacramento 2016 School Readiness Study
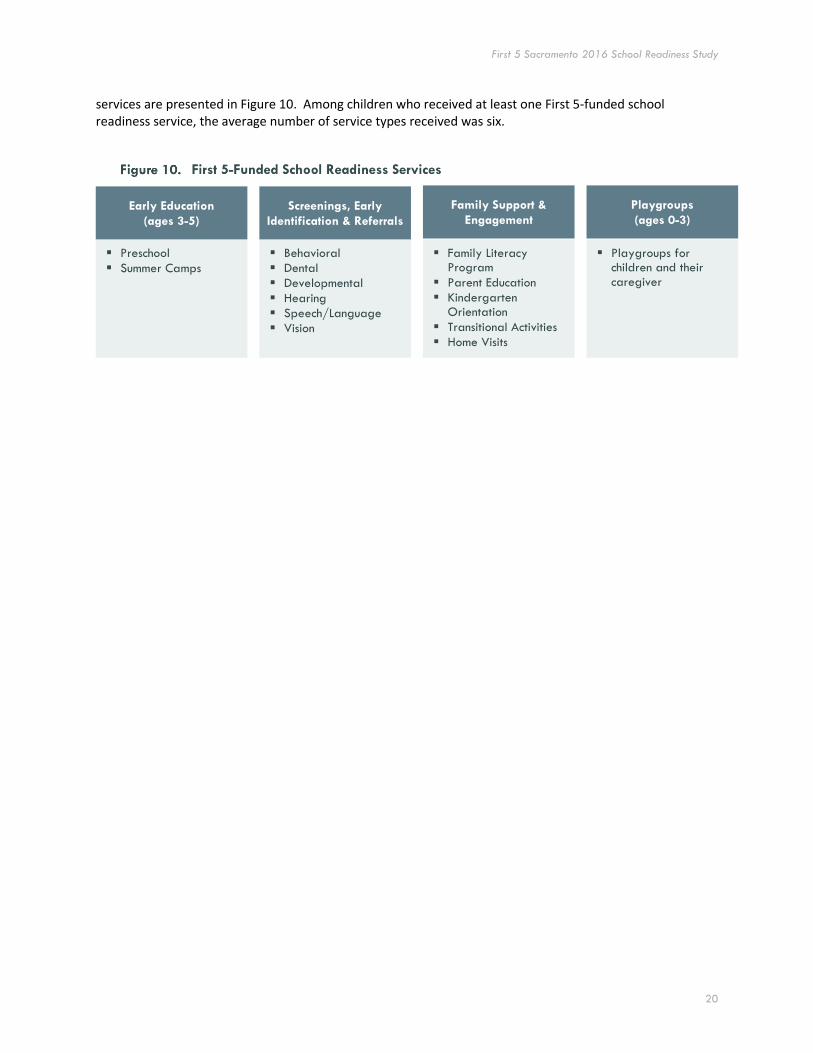
20
services are presented in Figure 10. Among children who received at least one First 5-funded school readiness service, the average number of service types received was six.
Early Education
(ages 3-5)
Preschool
Summer Camps
Screenings, Early
Identification & Referrals
Behavioral
Dental
Developmental
Hearing
Speech/Language
Vision
Family Support &
Engagement
Family Literacy Program
Parent Education
Kindergarten Orientation
Transitional Activities
Home Visits
Playgroups
(ages 0-3)
Playgroups for children and their caregiver
First 5 Sacramento 2016 School Readiness Study
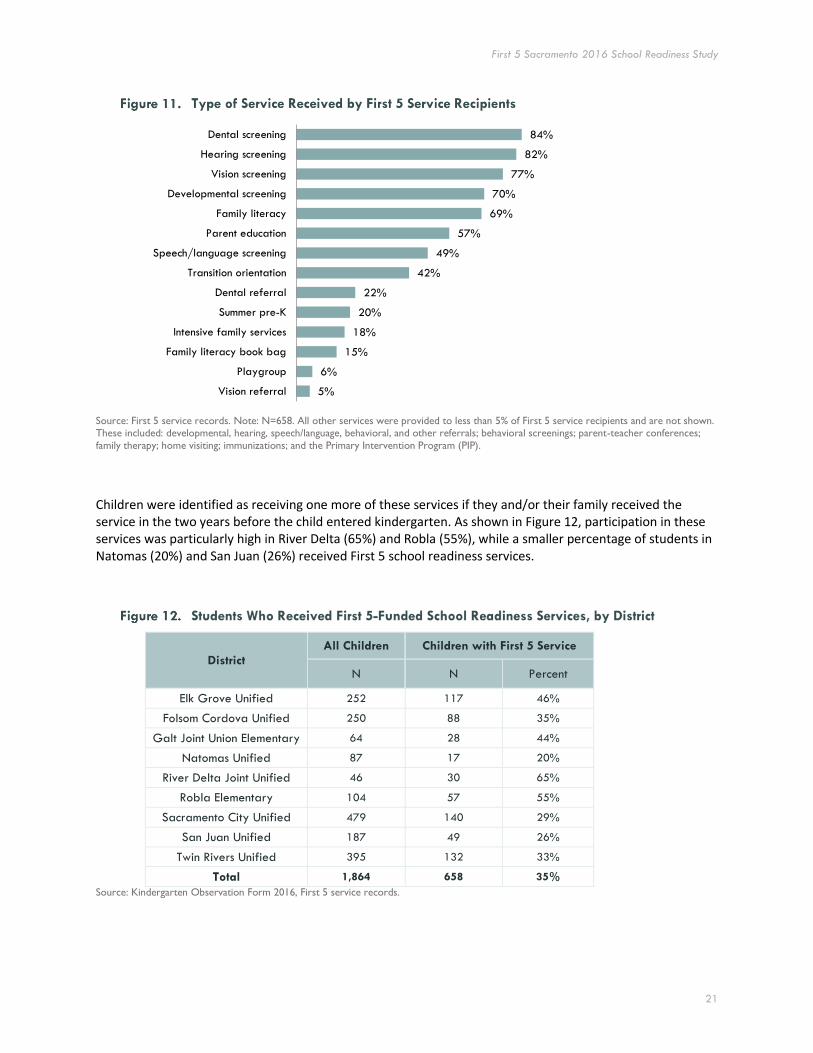
21
Source: First 5 service records. Note: N=658. All other services were provided to less than 5% of First 5 service recipients and are not shown. These included: developmental, hearing, speech/language, behavioral, and other referrals; behavioral screenings; parent-teacher conferences;
family therapy; home visiting; immunizations; and the Primary Intervention Program (PIP).
Children were identified as receiving one more of these services if they and/or their family received the service in the two years before the child entered kindergarten. As shown in Figure 12, participation in these services was particularly high in River Delta (65%) and Robla (55%), while a smaller percentage of students in Natomas (20%) and San Juan (26%) received First 5 school readiness services.
District
All Children Children with First 5 Service
N N Percent
Elk Grove Unified 252 117 46%
Folsom Cordova Unified 250 88 35%
Galt Joint Union Elementary 64 28 44%
Natomas Unified 87 17 20%
River Delta Joint Unified 46 30 65%
Robla Elementary 104 57 55%
Sacramento City Unified 479 140 29%
San Juan Unified 187 49 26%
Twin Rivers Unified 395 132 33%
Total 1,864 658 35%
Source: Kindergarten Observation Form 2016, First 5 service records.
5%
6%
15%
18%
20%
22%
42%
49%
57%
69%
70%
77%
82%
84%
Vision referral
Playgroup
Family literacy book bag
Intensive family services
Summer pre-K
Dental referral
Transition orientation
Speech/language screening
Parent education
Family literacy
Developmental screening
Vision screening
Hearing screening
Dental screening
First 5 Sacramento 2016 School Readiness Study
22
CHILDREN’S HEALTH
This section describes results from the Parent Information Form and teachers’ observations on the KOF about children’s health and well-being and access to health care.
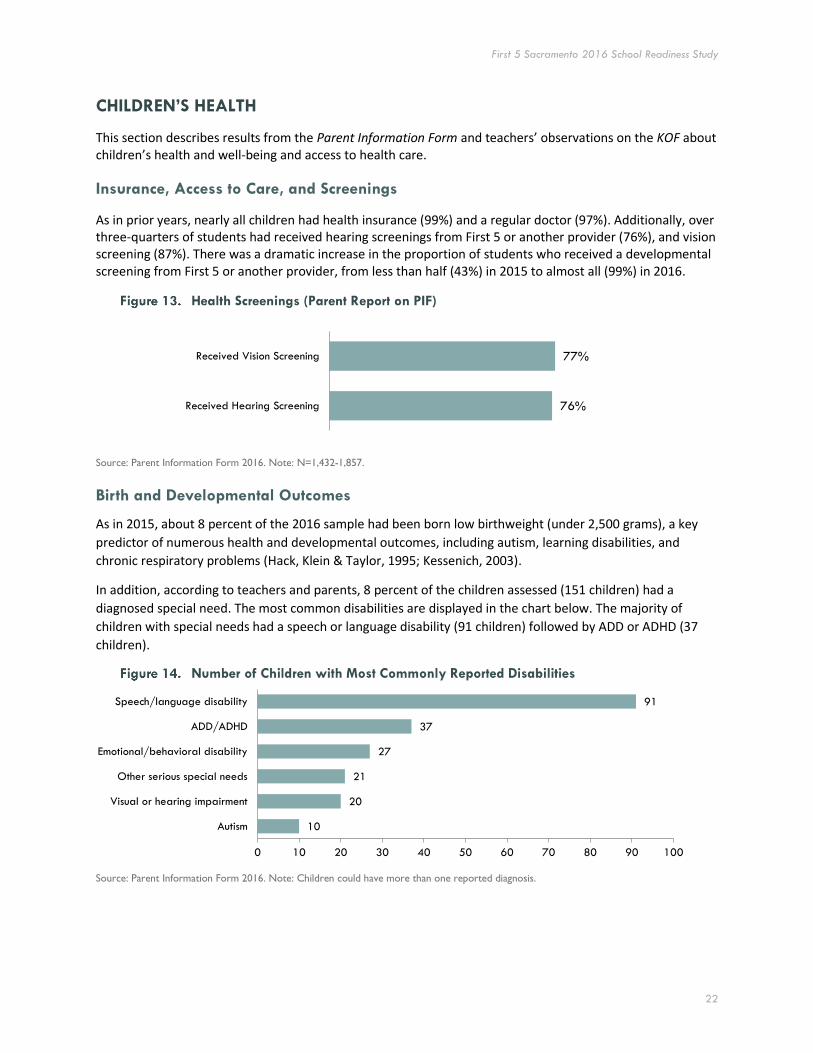
Insurance, Access to Care, and Screenings
As in prior years, nearly all children had health insurance (99%) and a regular doctor (97%). Additionally, over three-quarters of students had received hearing screenings from First 5 or another provider (76%), and vision screening (87%). There was a dramatic increase in the proportion of students who received a developmental screening from First 5 or another provider, from less than half (43%) in 2015 to almost all (99%) in 2016.
Source: Parent Information Form 2016. Note: N=1,432-1,857.
Birth and Developmental Outcomes
As in 2015, about 8 percent of the 2016 sample had been born low birthweight (under 2,500 grams), a key
predictor of numerous health and developmental outcomes, including autism, learning disabilities, and
chronic respiratory problems (Hack, Klein & Taylor, 1995; Kessenich, 2003).
In addition, according to teachers and parents, 8 percent of the children assessed (151 children) had a
diagnosed special need. The most common disabilities are displayed in the chart below. The majority of
children with special needs had a speech or language disability (91 children) followed by ADD or ADHD (37
children).
Source: Parent Information Form 2016. Note: Children could have more than one reported diagnosis.
76%
77%
Received Hearing Screening
Received Vision Screening
10
20
21
27
37
91
0 10 20 30 40 50 60 70 80 90 100
Autism
Visual or hearing impairment
Other serious special needs
Emotional/behavioral disability
ADD/ADHD
Speech/language disability

First 5 Sacramento 2016 School Readiness Study
23
Dental Health Indicators and Access to Care
Across all five readiness studies (2012-2016), about 9 out of 10 children had a regular dentist, and a little over 8 in 10 had received a dental exam in the past year. In 2016, 17 percent reported a toothache, similar to rates for the past three years. Ten percent of students had missed school (or preschool) due to dental issues and nearly a quarter (23%) came into kindergarten having had at least three cavities, nearly the same percentages as in prior years.
Source: Parent Information Form 2016. Note: N=1,285-1,312. Percentages may not sum to 100 due to rounding and exclusion of “Don’t Know” responses.
Child Well-Being and Attendance Patterns
Teachers were asked to report the degree to which students were hungry, tired, sick, absent, or tardy at school. As shown in Figure 16, the most commonly reported problems were hunger—14 percent told the teacher they were hungry on some days, most days, or just about every day—and fatigue—19 percent appeared tired on some days, most days, or just about every day.
Source: Kindergarten Observation Form 2016. Note: N=1,859-1,861. Proportions less than 5% not labeled. Percentages may not sum to 100 due to rounding.
23%
24%
43%
10%
85%
17%
84%
90%
3+ cavities
1-2 cavities
0 cavities
1 or more days
0 days
Toothache or Mouth Pain Ever
Had Dental Exam in Past Year
Child has Regular Dentist
Days missed due to dental
issues
Num. of cavities
child has
85% 83%92% 99%
84% 87%
13% 14%8%
15% 10%
Hungry Appeared tired Sick or ill Toothache Absent Tardy
Just about every day
On most days
On some days
Rarely or almost never
First 5 Sacramento 2016 School Readiness Study
24
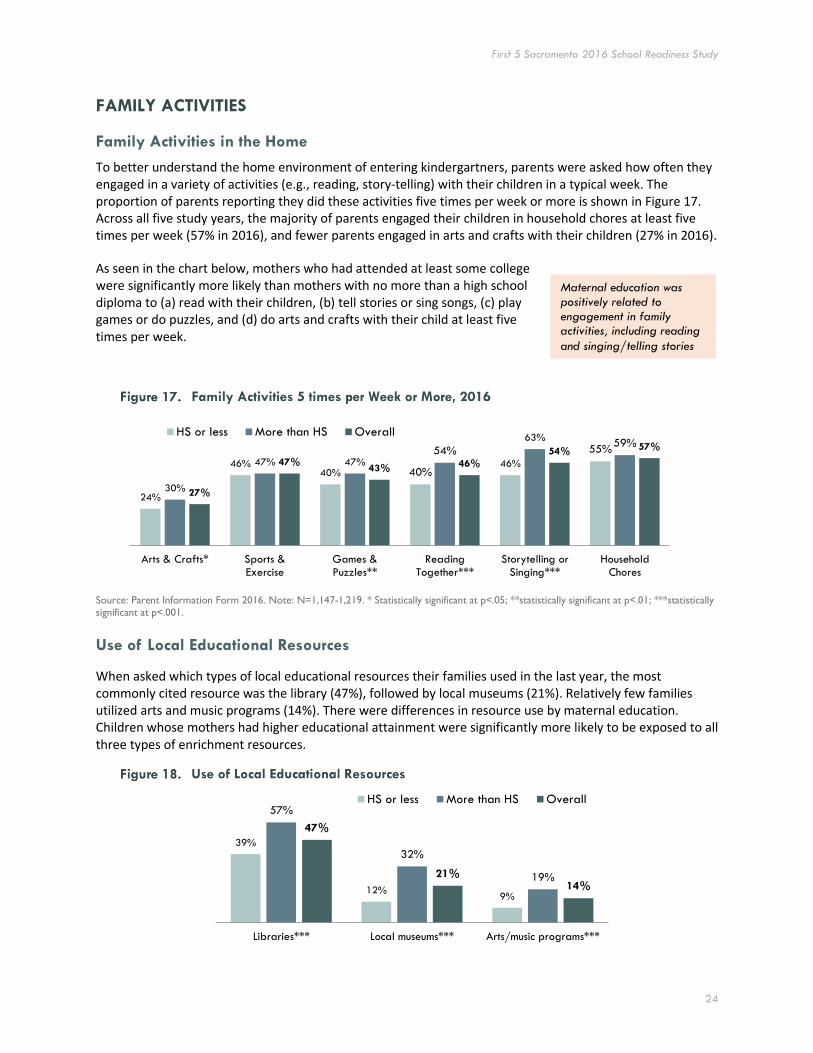
FAMILY ACTIVITIES
Family Activities in the Home
To better understand the home environment of entering kindergartners, parents were asked how often they engaged in a variety of activities (e.g., reading, story-telling) with their children in a typical week. The proportion of parents reporting they did these activities five times per week or more is shown in Figure 17. Across all five study years, the majority of parents engaged their children in household chores at least five times per week (57% in 2016), and fewer parents engaged in arts and crafts with their children (27% in 2016).
As seen in the chart below, mothers who had attended at least some college were significantly more likely than mothers with no more than a high school diploma to (a) read with their children, (b) tell stories or sing songs, (c) play games or do puzzles, and (d) do arts and crafts with their child at least five times per week.
Source: Parent Information Form 2016. Note: N=1,147-1,219. * Statistically significant at p<.05; **statistically significant at p<.01; ***statistically significant at p<.001.
Use of Local Educational Resources
When asked which types of local educational resources their families used in the last year, the most commonly cited resource was the library (47%), followed by local museums (21%). Relatively few families utilized arts and music programs (14%). There were differences in resource use by maternal education. Children whose mothers had higher educational attainment were significantly more likely to be exposed to all three types of enrichment resources.
24%
46%40% 40%
46%
55%
30%
47% 47%54%
63%59%
27%
47%43% 46%
54% 57%
Arts & Crafts* Sports &Exercise
Games &Puzzles**
ReadingTogether***
Storytelling orSinging***
HouseholdChores
HS or less More than HS Overall
39%
12%9%
57%
32%
19%
47%
21%14%
Libraries*** Local museums*** Arts/music programs***
HS or less More than HS Overall
Maternal education was positively related to engagement in family activities, including reading
and singing/telling stories
First 5 Sacramento 2016 School Readiness Study
25
Source: Parent Information Form 2016. Note: N=1,295. *Statistically significant at p<.05; **statistically significant at p<.01; ***statistically
significant at p<.001.
Other Home Practices: Screen Time, Bedtime, and Internet Access
In 2016, the American Academy of Pediatrics changed its screen time guidelines, recommending that young children ages 2 to 5 years spend no more than one hour per day (down from two hours per day) watching TV, using a computer, or playing video games and videos. Thus, results on this measure for 2016 are not equivalent to data for previous years.
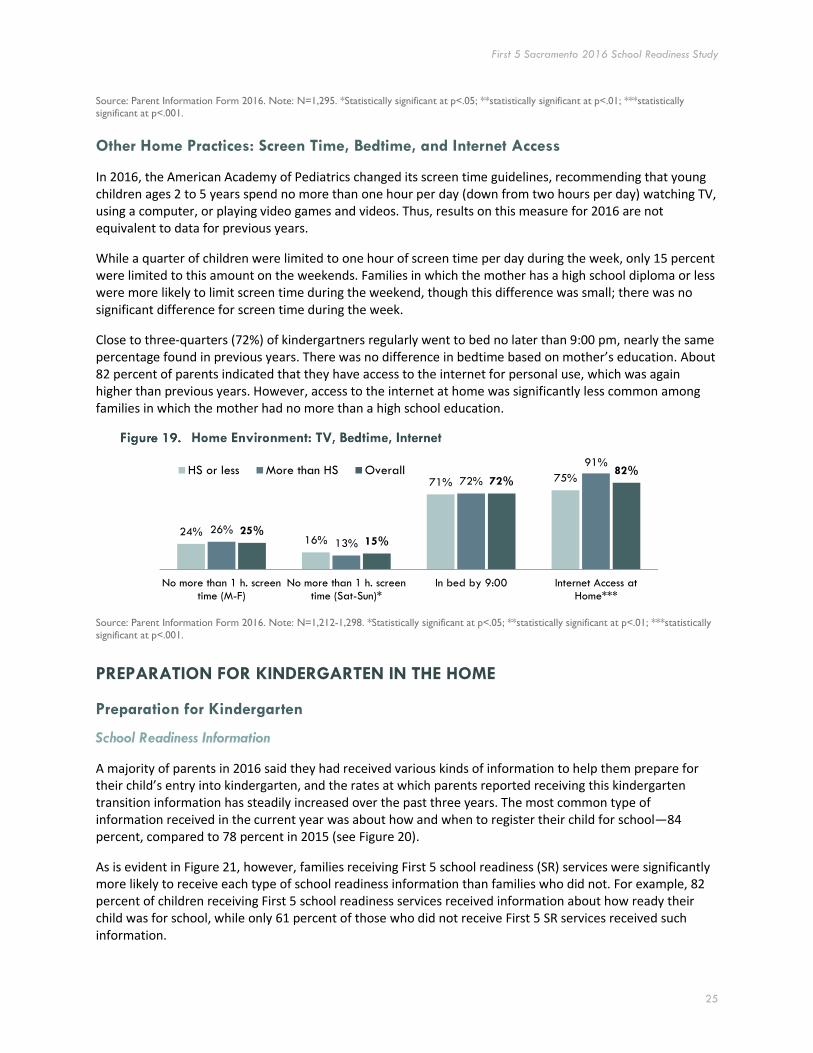
While a quarter of children were limited to one hour of screen time per day during the week, only 15 percent were limited to this amount on the weekends. Families in which the mother has a high school diploma or less were more likely to limit screen time during the weekend, though this difference was small; there was no significant difference for screen time during the week.
Close to three-quarters (72%) of kindergartners regularly went to bed no later than 9:00 pm, nearly the same percentage found in previous years. There was no difference in bedtime based on mother’s education. About 82 percent of parents indicated that they have access to the internet for personal use, which was again higher than previous years. However, access to the internet at home was significantly less common among families in which the mother had no more than a high school education.
Source: Parent Information Form 2016. Note: N=1,212-1,298. *Statistically significant at p<.05; **statistically significant at p<.01; ***statistically
significant at p<.001.
PREPARATION FOR KINDERGARTEN IN THE HOME
Preparation for Kindergarten
School Readiness Information
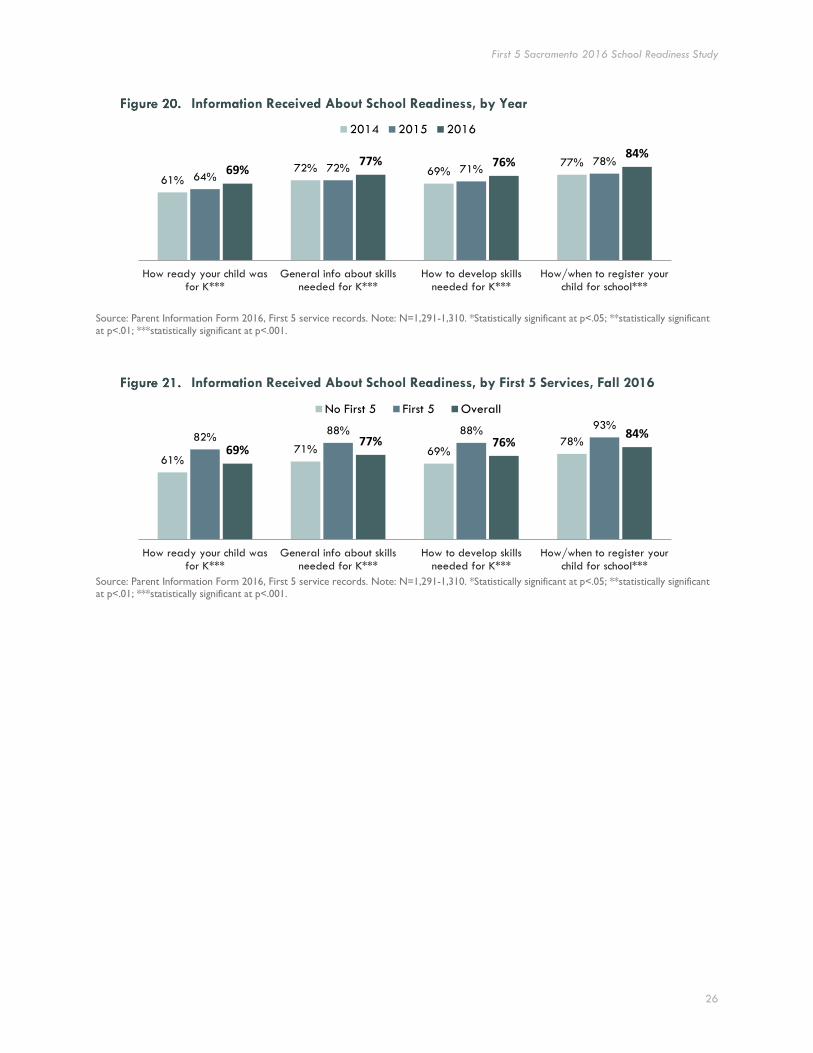
A majority of parents in 2016 said they had received various kinds of information to help them prepare for their child’s entry into kindergarten, and the rates at which parents reported receiving this kindergarten transition information has steadily increased over the past three years. The most common type of information received in the current year was about how and when to register their child for school—84 percent, compared to 78 percent in 2015 (see Figure 20).
As is evident in Figure 21, however, families receiving First 5 school readiness (SR) services were significantly more likely to receive each type of school readiness information than families who did not. For example, 82 percent of children receiving First 5 school readiness services received information about how ready their child was for school, while only 61 percent of those who did not receive First 5 SR services received such information.
24%16%
71% 75%
26%
13%
72%
91%
25%15%
72%82%
No more than 1 h. screentime (M-F)
No more than 1 h. screentime (Sat-Sun)*
In bed by 9:00 Internet Access atHome***
HS or less More than HS Overall
First 5 Sacramento 2016 School Readiness Study
26
Source: Parent Information Form 2016, First 5 service records. Note: N=1,291-1,310. *Statistically significant at p<.05; **statistically significant
at p<.01; ***statistically significant at p<.001.
Source: Parent Information Form 2016, First 5 service records. Note: N=1,291-1,310. *Statistically significant at p<.05; **statistically significant at p<.01; ***statistically significant at p<.001.
61%72% 69%
77%
64%72% 71%
78%69%
77% 76%84%
How ready your child wasfor K***
General info about skillsneeded for K***
How to develop skillsneeded for K***
How/when to register yourchild for school***
2014 2015 2016
61%71% 69%
78%82%88% 88%
93%
69%77% 76%
84%
How ready your child wasfor K***
General info about skillsneeded for K***
How to develop skillsneeded for K***
How/when to register yourchild for school***
No First 5 First 5 Overall
First 5 Sacramento 2016 School Readiness Study
27
Kindergarten Preparation Activities at Home
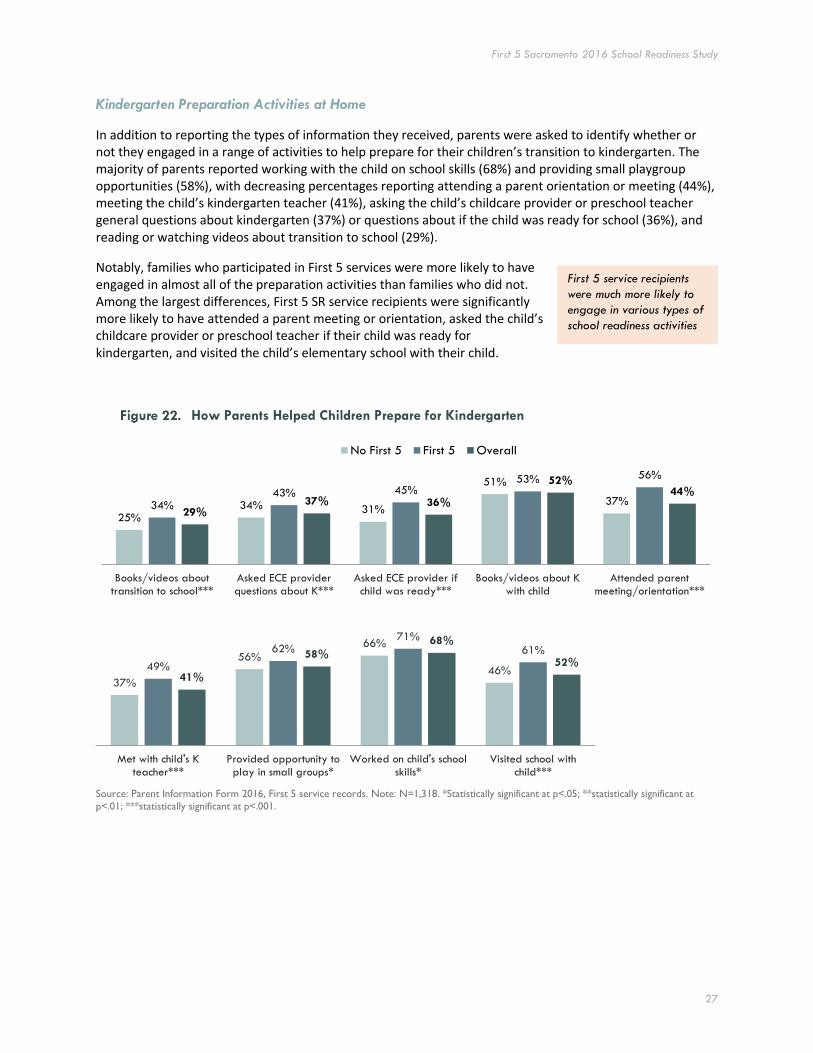
In addition to reporting the types of information they received, parents were asked to identify whether or not they engaged in a range of activities to help prepare for their children’s transition to kindergarten. The majority of parents reported working with the child on school skills (68%) and providing small playgroup opportunities (58%), with decreasing percentages reporting attending a parent orientation or meeting (44%), meeting the child’s kindergarten teacher (41%), asking the child’s childcare provider or preschool teacher general questions about kindergarten (37%) or questions about if the child was ready for school (36%), and reading or watching videos about transition to school (29%).
Notably, families who participated in First 5 services were more likely to have engaged in almost all of the preparation activities than families who did not. Among the largest differences, First 5 SR service recipients were significantly more likely to have attended a parent meeting or orientation, asked the child’s childcare provider or preschool teacher if their child was ready for kindergarten, and visited the child’s elementary school with their child.
Source: Parent Information Form 2016, First 5 service records. Note: N=1,318. *Statistically significant at p<.05; **statistically significant at
p<.01; ***statistically significant at p<.001.
25%34% 31%
51%
37%34%43% 45%
53% 56%
29%37% 36%
52%44%
Books/videos abouttransition to school***
Asked ECE providerquestions about K***
Asked ECE provider ifchild was ready***
Books/videos about Kwith child
Attended parentmeeting/orientation***
No First 5 First 5 Overall
37%
56%
66%
46%49%
62%71%
61%
41%
58%
68%
52%
Met with child's Kteacher***
Provided opportunity toplay in small groups*
Worked on child's schoolskills*
Visited school withchild***
First 5 service recipients
were much more likely to
engage in various types of
school readiness activities
First 5 Sacramento 2016 School Readiness Study
28
PARENTAL SUPPORTS AND STRESSORS
Use of Parenting Programs, Services, and Other Support
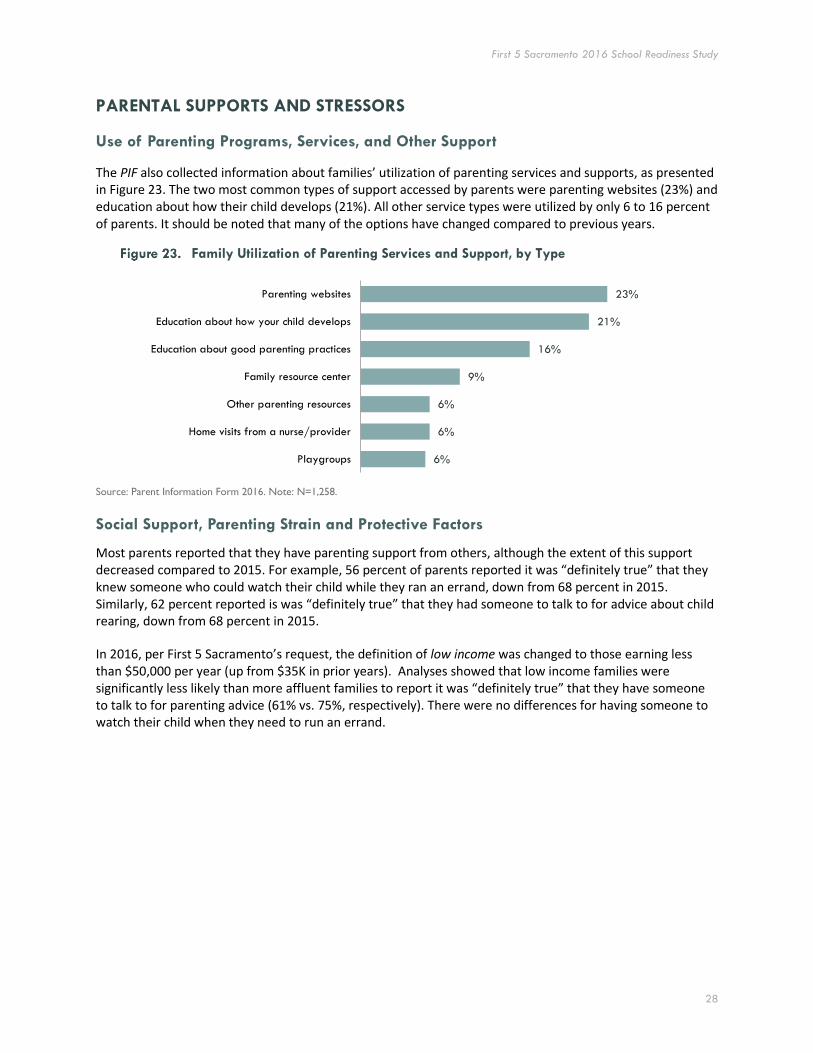
The PIF also collected information about families’ utilization of parenting services and supports, as presented in Figure 23. The two most common types of support accessed by parents were parenting websites (23%) and education about how their child develops (21%). All other service types were utilized by only 6 to 16 percent of parents. It should be noted that many of the options have changed compared to previous years.
Source: Parent Information Form 2016. Note: N=1,258.
Social Support, Parenting Strain and Protective Factors
Most parents reported that they have parenting support from others, although the extent of this support decreased compared to 2015. For example, 56 percent of parents reported it was “definitely true” that they knew someone who could watch their child while they ran an errand, down from 68 percent in 2015. Similarly, 62 percent reported is was “definitely true” that they had someone to talk to for advice about child rearing, down from 68 percent in 2015.
In 2016, per First 5 Sacramento’s request, the definition of low income was changed to those earning less than $50,000 per year (up from $35K in prior years). Analyses showed that low income families were significantly less likely than more affluent families to report it was “definitely true” that they have someone to talk to for parenting advice (61% vs. 75%, respectively). There were no differences for having someone to watch their child when they need to run an errand.
6%
6%
6%
9%
16%
21%
23%
Playgroups
Home visits from a nurse/provider
Other parenting resources
Family resource center
Education about good parenting practices
Education about how your child develops
Parenting websites

First 5 Sacramento 2016 School Readiness Study
29
Source: Parent Information Form 2016. Note: N=1,283-1,294. Percentages may not sum to 100 due to rounding.
As the figure below indicates, the vast majority of parents did not show signs of serious parenting strain. Just 4-6 percent of parents reported that their child was hard to care for or bothered them “often” or “almost always.” These percentages were similar to those from 2012 to 2015. There were no significant differences by income level for the first two items, but a significantly higher percentage of low income parents reported that they were “rarely” or “sometimes” able to soothe their child (21%) than more affluent parents (12%).
Source: Parent Information Form 2016. Note: N=1,279-1,290. Percentages may not sum to 100 due to rounding. Proportions under 5% not
labeled.
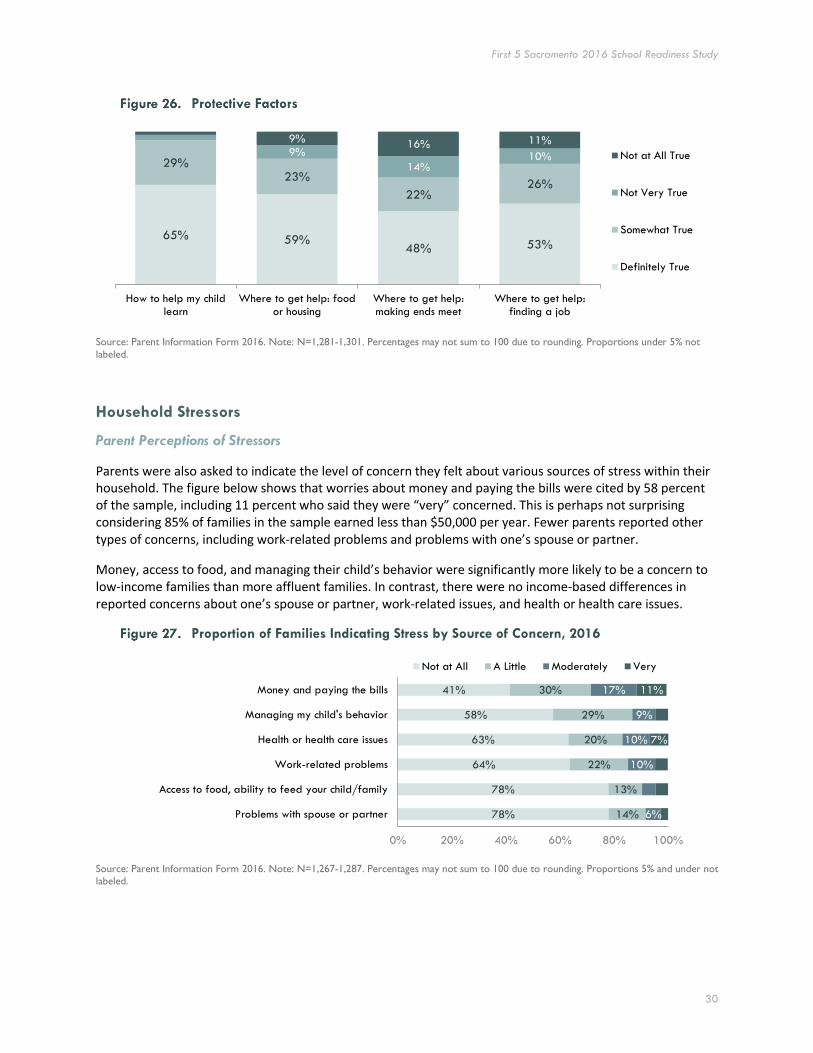
There were several new items related to family protective factors included on the PIF in 2016, including items asking how much parents agreed that they know how to help their child learn, and whether they would know where to go to get help if they needed food/housing, help making ends meet, or finding a job. As shown in Figure 26, the majority of parents (70% to 94%) “definitely” or “somewhat” agreed with each these statements, although 30% did report that it was “not very true” or “not at all true” that they knew where to go if they needed help making ends meet. There were significant differences by income level across all four items: low income parents were more likely than more affluent parents to report parenting strain.
68%56%
68% 62%
20%26%
19% 24%
6%9%
7% 7%6% 9% 6% 7%
2015 2016 2015 2016
Not at All True
Not Very True
Somewhat True
Definitely True
I have someone to watch my child when I need to run an errand
I have someone to talk to when I need advice about parenting
76%68%
9%
18% 28%
11%
15%
65%
Feel your child was much harder tocare for than most children
Feel your child does things thatreally bother you a lot
Feel you are able to soothe yourchild when upset
Almost Always
Often
Sometimes
Rarely
First 5 Sacramento 2016 School Readiness Study
30
Source: Parent Information Form 2016. Note: N=1,281-1,301. Percentages may not sum to 100 due to rounding. Proportions under 5% not
labeled.
Household Stressors
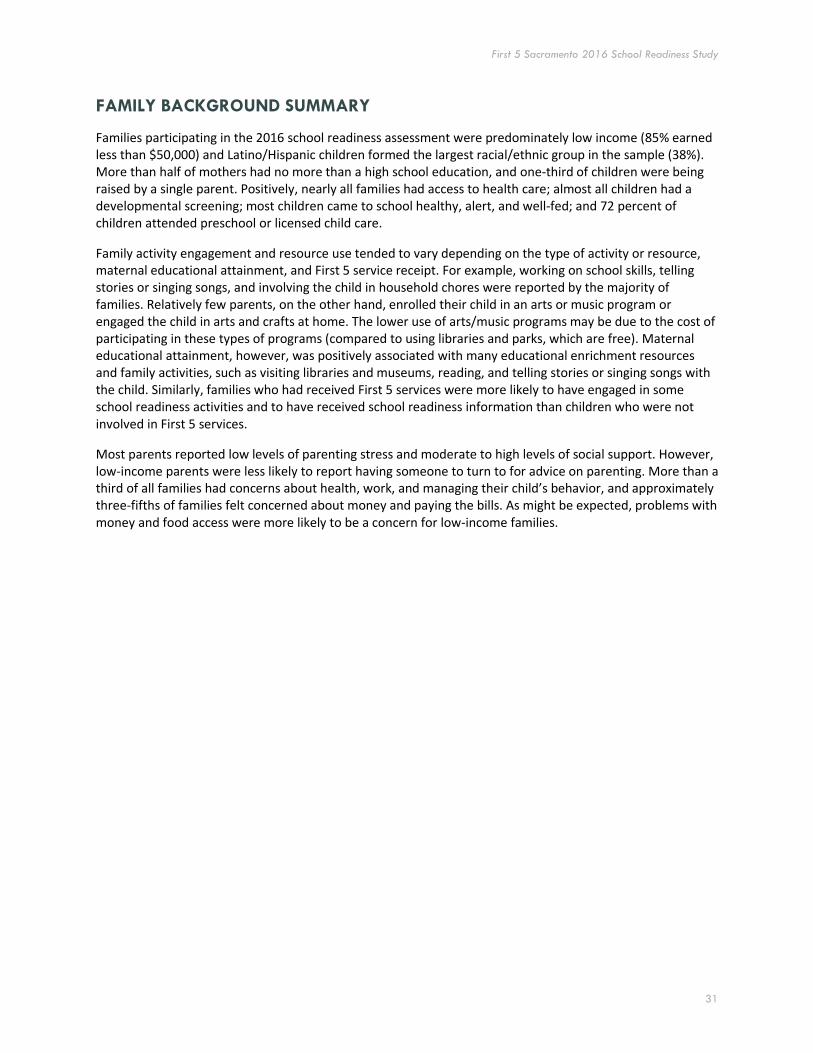
Parent Perceptions of Stressors
Parents were also asked to indicate the level of concern they felt about various sources of stress within their household. The figure below shows that worries about money and paying the bills were cited by 58 percent of the sample, including 11 percent who said they were “very” concerned. This is perhaps not surprising considering 85% of families in the sample earned less than $50,000 per year. Fewer parents reported other types of concerns, including work-related problems and problems with one’s spouse or partner.
Money, access to food, and managing their child’s behavior were significantly more likely to be a concern to low-income families than more affluent families. In contrast, there were no income-based differences in reported concerns about one’s spouse or partner, work-related issues, and health or health care issues.
Source: Parent Information Form 2016. Note: N=1,267-1,287. Percentages may not sum to 100 due to rounding. Proportions 5% and under not labeled.
65% 59%48% 53%
29%23%
22%26%
9%
14%10%
9%16% 11%
How to help my childlearn
Where to get help: foodor housing
Where to get help:making ends meet
Where to get help:finding a job
Not at All True
Not Very True
Somewhat True
Definitely True
78%
78%
64%
63%
58%
41%
14%
13%
22%
20%
29%
30%
6%
10%
10%
9%
17%
7%
11%
0% 20% 40% 60% 80% 100%
Problems with spouse or partner
Access to food, ability to feed your child/family
Work-related problems
Health or health care issues
Managing my child's behavior
Money and paying the bills
Not at All A Little Moderately Very
First 5 Sacramento 2016 School Readiness Study
31
FAMILY BACKGROUND SUMMARY
Families participating in the 2016 school readiness assessment were predominately low income (85% earned less than $50,000) and Latino/Hispanic children formed the largest racial/ethnic group in the sample (38%). More than half of mothers had no more than a high school education, and one-third of children were being raised by a single parent. Positively, nearly all families had access to health care; almost all children had a developmental screening; most children came to school healthy, alert, and well-fed; and 72 percent of children attended preschool or licensed child care.
Family activity engagement and resource use tended to vary depending on the type of activity or resource, maternal educational attainment, and First 5 service receipt. For example, working on school skills, telling stories or singing songs, and involving the child in household chores were reported by the majority of families. Relatively few parents, on the other hand, enrolled their child in an arts or music program or engaged the child in arts and crafts at home. The lower use of arts/music programs may be due to the cost of participating in these types of programs (compared to using libraries and parks, which are free). Maternal educational attainment, however, was positively associated with many educational enrichment resources and family activities, such as visiting libraries and museums, reading, and telling stories or singing songs with the child. Similarly, families who had received First 5 services were more likely to have engaged in some school readiness activities and to have received school readiness information than children who were not involved in First 5 services.
Most parents reported low levels of parenting stress and moderate to high levels of social support. However, low-income parents were less likely to report having someone to turn to for advice on parenting. More than a third of all families had concerns about health, work, and managing their child’s behavior, and approximately three-fifths of families felt concerned about money and paying the bills. As might be expected, problems with money and food access were more likely to be a concern for low-income families.

First 5 Sacramento 2016 School Readiness Study
32
Kindergarten Student Readiness
BASIC BUILDING BLOCKS OF READINESS
Using the Kindergarten Observation Form, participating teachers rated the proficiency of their students across 20 readiness skills. All but two of these skills are part of the three Basic Building Blocks, as displayed in the pyramid shown in Figure 28: Self-Regulation, Social Expression, and Kindergarten Academics. Because there are only two motor skills items, they do not constitute a separate building block.
Although all of these skill dimensions are essential components of readiness, the pyramid suggests a framework of skill progression. That is, basic motor skills are at the base because they are likely to precede the more advanced self-regulation and socio-emotional skills. The top of the pyramid contains some of the early academic skills that are the foundation for academic content covered in kindergarten and beyond.
These Basic Building Blocks will be discussed in greater detail through the remainder of this report. They form the basis upon which to examine general patterns of readiness.
First 5 Sacramento 2016 School Readiness Study
33
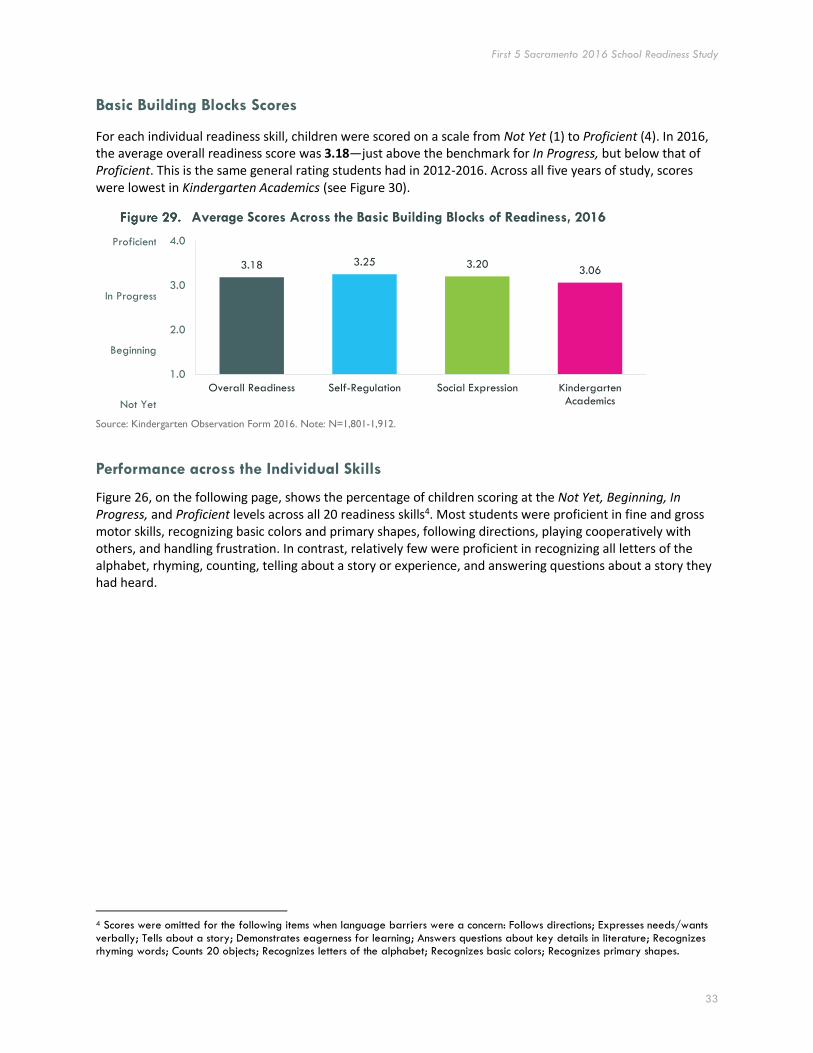
Basic Building Blocks Scores
For each individual readiness skill, children were scored on a scale from Not Yet (1) to Proficient (4). In 2016, the average overall readiness score was 3.18—just above the benchmark for In Progress, but below that of Proficient. This is the same general rating students had in 2012-2016. Across all five years of study, scores were lowest in Kindergarten Academics (see Figure 30).
Source: Kindergarten Observation Form 2016. Note: N=1,801-1,912.
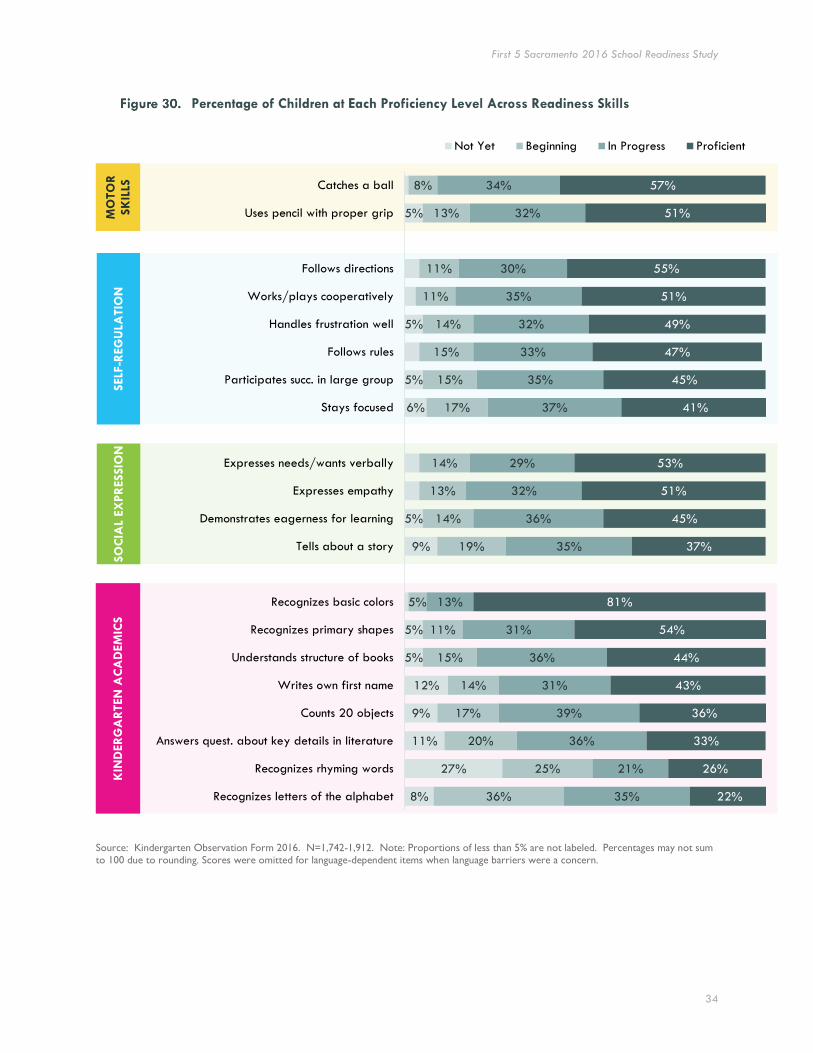
Performance across the Individual Skills
Figure 26, on the following page, shows the percentage of children scoring at the Not Yet, Beginning, In Progress, and Proficient levels across all 20 readiness skills4. Most students were proficient in fine and gross motor skills, recognizing basic colors and primary shapes, following directions, playing cooperatively with others, and handling frustration. In contrast, relatively few were proficient in recognizing all letters of the alphabet, rhyming, counting, telling about a story or experience, and answering questions about a story they had heard.
4 Scores were omitted for the following items when language barriers were a concern: Follows directions; Expresses needs/wants verbally; Tells about a story; Demonstrates eagerness for learning; Answers questions about key details in literature; Recognizes rhyming words; Counts 20 objects; Recognizes letters of the alphabet; Recognizes basic colors; Recognizes primary shapes.
3.18 3.25 3.203.06
1.0
2.0
3.0
4.0
Overall Readiness Self-Regulation Social Expression KindergartenAcademics
Proficient
In Progress
Beginning
Not Yet
First 5 Sacramento 2016 School Readiness Study
34
Source: Kindergarten Observation Form 2016. N=1,742-1,912. Note: Proportions of less than 5% are not labeled. Percentages may not sum to 100 due to rounding. Scores were omitted for language-dependent items when language barriers were a concern.
8%
27%
11%
9%
12%
5%
5%
9%
5%
6%
5%
5%
5%
36%
25%
20%
17%
14%
15%
11%
5%
19%
14%
13%
14%
17%
15%
15%
14%
11%
11%
13%
8%
35%
21%
36%
39%
31%
36%
31%
13%
35%
36%
32%
29%
37%
35%
33%
32%
35%
30%
32%
34%
22%
26%
33%
36%
43%
44%
54%
81%
37%
45%
51%
53%
41%
45%
47%
49%
51%
55%
51%
57%
Recognizes letters of the alphabet
Recognizes rhyming words
Answers quest. about key details in literature
Counts 20 objects
Writes own first name
Understands structure of books
Recognizes primary shapes
Recognizes basic colors
Tells about a story
Demonstrates eagerness for learning
Expresses empathy
Expresses needs/wants verbally
Stays focused
Participates succ. in large group
Follows rules
Handles frustration well
Works/plays cooperatively
Follows directions
Uses pencil with proper grip
Catches a ball
Not Yet Beginning In Progress Proficient
MO
TO
R
SK
ILLS
SELF
-REG
ULA
TIO
N
SO
CIA
L EX
PR
ESSIO
N
KIN
DER
GA
RTEN
AC
AD
EM
ICS
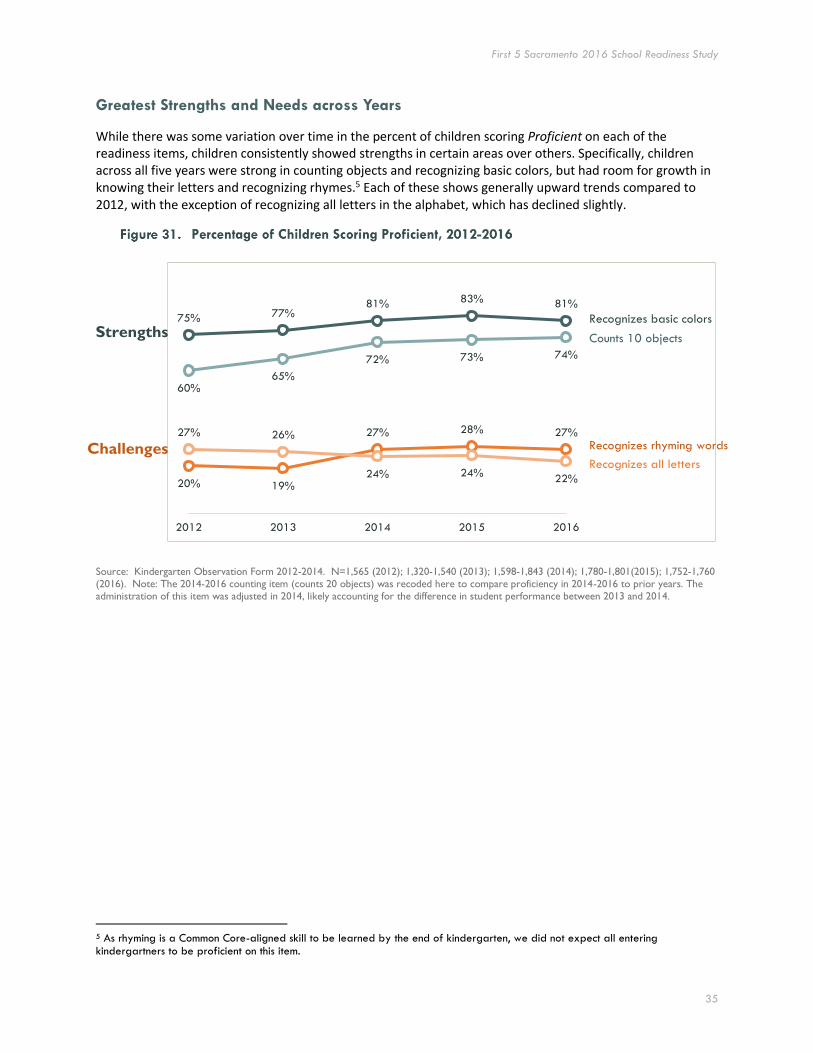
First 5 Sacramento 2016 School Readiness Study
35
Greatest Strengths and Needs across Years
While there was some variation over time in the percent of children scoring Proficient on each of the readiness items, children consistently showed strengths in certain areas over others. Specifically, children across all five years were strong in counting objects and recognizing basic colors, but had room for growth in knowing their letters and recognizing rhymes.5 Each of these shows generally upward trends compared to 2012, with the exception of recognizing all letters in the alphabet, which has declined slightly.
Source: Kindergarten Observation Form 2012-2014. N=1,565 (2012); 1,320-1,540 (2013); 1,598-1,843 (2014); 1,780-1,801(2015); 1,752-1,760
(2016). Note: The 2014-2016 counting item (counts 20 objects) was recoded here to compare proficiency in 2014-2016 to prior years. The administration of this item was adjusted in 2014, likely accounting for the difference in student performance between 2013 and 2014.
5 As rhyming is a Common Core-aligned skill to be learned by the end of kindergarten, we did not expect all entering kindergartners to be proficient on this item.
75% 77%81% 83% 81%
60%65%
72% 73% 74%
20% 19%
27% 28% 27%27% 26%
24% 24%22%
2012 2013 2014 2015 2016
Strengths
Challenges
Recognizes basic colors
Counts 10 objects
Recognizes all letters
Recognizes rhyming words

First 5 Sacramento 2016 School Readiness Study
36
HOW MANY STUDENTS WERE READY FOR KINDERGARTEN?
Students were considered “ready” for Kindergarten if they scored at or above 3.25 on all Building Blocks, meaning they were Proficient or nearing proficiency on Self-Regulation, Social Expression, and Kindergarten Academics. Using these criteria, 35 percent of the sample were Ready for kindergarten, while another 37 percent were Partially Ready, having scored at or above 3.25 on some but not all of the Building Blocks. The remaining 28 percent were Not Ready, having scored below 3.25 on all three Building Blocks. Readiness rates for 2015 and 2016 were nearly identical.
Source: Kindergarten Observation Form 2016. N=1,756.
The figure below shows the percentage ready in each domain. As in previous years, the lowest rate of readiness was in the area of Kindergarten Academics.
Readiness and Preschool Attendance
Children who attended preschool were significantly more likely to be Ready for kindergarten across all readiness domains, compared to their peers who did not attend preschool. As shown in Figure 35, 41 percent of children who attended preschool were Ready, compared to just 26 percent of children who had not.
35% 37% 28%
Fully Ready Partially Ready Not Ready
58% 59%
48%
Self-Regulation Social Expression Kindergarten Academics
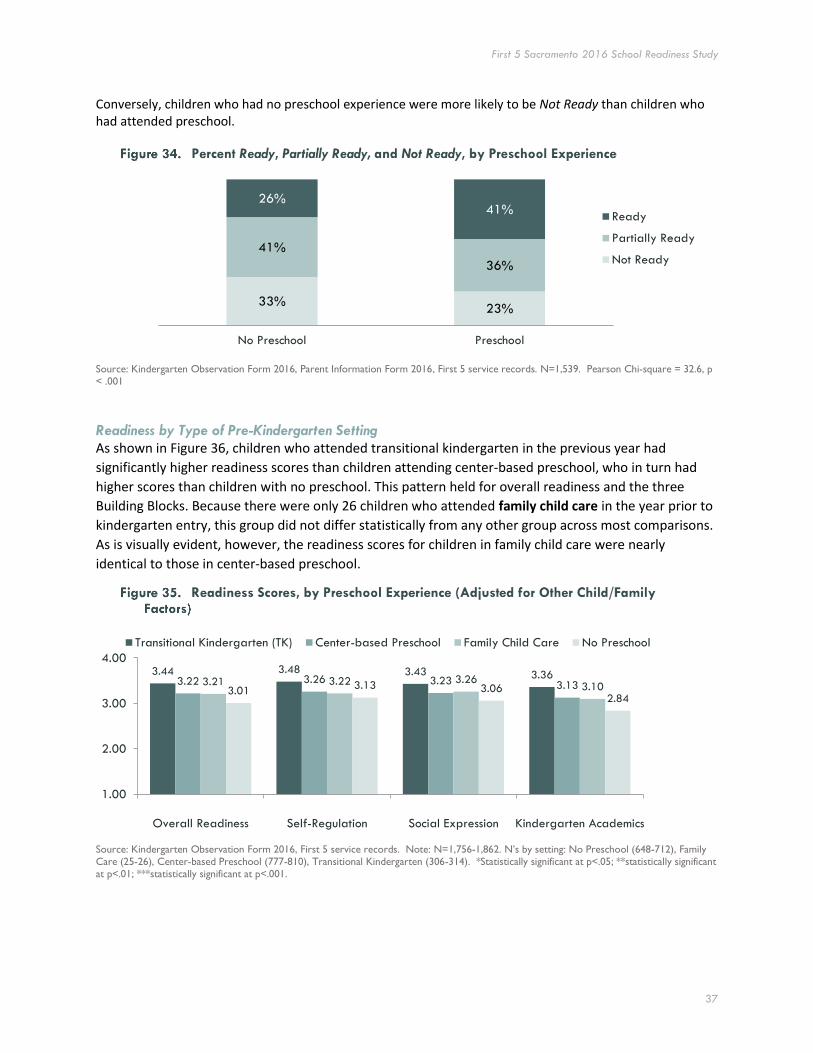
First 5 Sacramento 2016 School Readiness Study
37
Conversely, children who had no preschool experience were more likely to be Not Ready than children who had attended preschool.
Source: Kindergarten Observation Form 2016, Parent Information Form 2016, First 5 service records. N=1,539. Pearson Chi-square = 32.6, p < .001
Readiness by Type of Pre-Kindergarten Setting
As shown in Figure 36, children who attended transitional kindergarten in the previous year had
significantly higher readiness scores than children attending center-based preschool, who in turn had
higher scores than children with no preschool. This pattern held for overall readiness and the three
Building Blocks. Because there were only 26 children who attended family child care in the year prior to
kindergarten entry, this group did not differ statistically from any other group across most comparisons.
As is visually evident, however, the readiness scores for children in family child care were nearly
identical to those in center-based preschool.
Source: Kindergarten Observation Form 2016, First 5 service records. Note: N=1,756-1,862. N’s by setting: No Preschool (648-712), Family Care (25-26), Center-based Preschool (777-810), Transitional Kindergarten (306-314). *Statistically significant at p<.05; **statistically significant at p<.01; ***statistically significant at p<.001.
33%23%
41%
36%
26%41%
No Preschool Preschool
Ready
Partially Ready
Not Ready
3.44 3.48 3.43 3.363.22 3.26 3.23 3.133.21 3.22 3.26
3.103.013.13 3.06
2.84
1.00
2.00
3.00
4.00
Overall Readiness Self-Regulation Social Expression Kindergarten Academics
Transitional Kindergarten (TK) Center-based Preschool Family Child Care No Preschool
First 5 Sacramento 2016 School Readiness Study
38
WHAT ARE THE KEY PREDICTORS OF SCHOOL READINESS ACROSS THE FIRST 5 NETWORK?
This section presents an analysis of the relationship between readiness and a wide range of child and family backgrounds and experiences. These potential “predictors” of readiness included child demographics (e.g., age, gender, race/ethnicity, English Learner status, special needs); family characteristics (e.g., income, mother’s education, parental stress, parental use of resources); early educational experiences; child health/well-being; school attendance; school readiness activities; family protective factors; and receipt of First 5 services (e.g., literacy programs, parent education, preschool).
Each potential predictor was tested for its association with school readiness through an analysis called multiple regression. This approach allows us to look at how a set of variables are uniquely related to readiness levels, holding constant any other possible predictors. For example, it allows us to examine how preschool experience is related to readiness levels above and beyond the contribution from other factors, like family income and maternal education level. In addition, the regression analyses conducted for this report utilized multilevel modeling techniques, which help account for similarities that exist among students within a classroom and for unmeasured variations in classrooms (e.g., different teachers, different classroom environments, and different groups of peers).6
It is important to note that a multivariate approach like this cannot conclusively determine why children have different levels of readiness, and cannot be used to infer that certain predictors necessarily caused readiness. It is simply a method of understanding which observed and measured characteristics tend to be associated with readiness. In the absence of a controlled experiment, the possibility remains that other factors not measured in this study account for differences in school readiness.
Predictors of Overall Readiness
Figure 37 displays the predictors significantly associated with overall kindergarten readiness scores across the First 5 network, in order of predictive strength. Similar to the previous three years, age, child well-being, special needs, prior preschool or transitional kindergarten (TK) attendance, and gender were significant predictors of readiness.
The pattern was slightly different this year, however, as child’s age was clearly the single strongest predictor. Children who were older when they entered kindergarten had higher readiness scores. Child well-being was the second strongest predictor, with children who came to school well-rested and well-fed had significantly higher readiness scores than children who did not.
Children who attended a licensed preschool—both First 5-supported and other programs—or transitional kindergarten had higher readiness scores. Likewise, girls had higher readiness scores than boys, and children without special needs had higher scores than those with a diagnosed disability.
Finally, three parent-related factors were significantly associated with readiness. Specifically, children in higher income households had higher readiness skills. Controlling for other factors, including maternal education, parents who engaged in a greater number of school readiness activities (e.g., working on school skills with the child, meeting the child’s teacher, attending a parent orientation or meeting, reading books about kindergarten) also had children with significantly higher readiness scores. Children whose families read with them at least five times a week had higher readiness scores than those who read less frequently. Additionally, we found that parents who reported having lower levels of parenting strain related to their
6 This technique is used for “nested” data (e.g., students nested within classrooms).

First 5 Sacramento 2016 School Readiness Study
39
child’s behavior had children with stronger readiness skills. Finally, participation in First 5-funded parent education was linked to higher readiness scores.
Source: Kindergarten Observation Form 2016, Parent Information Form 2016, First 5 service records. N=1,014.
What are the Specific Gains in Kindergarten Readiness Associated with First 5 Preschool Attendance?
Figure 37 shows the differences in readiness scores children who attended a First 5-supported preschool compared to children who did not attend any preschool, after adjusting for other factors linked to readiness, including child and family demographics. Children who attended preschools supported by First 5 readiness services had significantly higher overall readiness scores than children who did not attend preschool. These children also had significantly higher Self-Regulation, Social Expression, and Kindergarten Academics scores.
How to Interpret Figure 36:
1. Predictors are listed in descending order of their association with overall school readiness.
2. Only statistically significant predictors are shown.
3. The strength of each predictor has been standardized for comparison purposes. This makes it possible to compare factors on a common scale even if they were initially
measured on different scales.
First 5 service: Parent education
Read at home more
Not an English Learner
Family income over $35K
Less parenting stress about child's behavior
More readiness activities
Child did not come to school hungry or tired
Attended Preschool or TK in Prior Year (includes F5-…
Child is a girl
Child does not have special needs
Child's age (Older)

First 5 Sacramento 2016 School Readiness Study
40
Source: Kindergarten Observation Form 2016, First 5 service records. Note: N=610. *Statistically significant at p<.05; **statistically significant at p<.01; ***statistically significant at p<.001.
The figure below shows the percentage of children ready by preschool attendance and income,7 adjusting for other factors. The effects of both income and setting are evident in Figure 39. Children attending First 5-supported preschool are more ready than children with no preschool experience, and children from families making $35,000 or more per year are more ready than children from families making less than $35,000 per year. Unlike last year, the effect of preschool attendance was similar for both low income and more affluent families.
Source: Kindergarten Observation Form 2016, Parent Information Form 2016, First 5 Records. Note: N=618. *Statistically significant at p<.05;
**statistically significant at p<.01; ***statistically significant at p<.001.
The figure below shows adjusted readiness scores for English Learners, comparing those who attended a First 5 supported preschool and those who did not attend preschool. Those who attended a First 5-supported preschool had higher readiness scores Overall, and in Kindergarten Academics and Self-Regulation.
7 We used the cutoff of $35,000 for this analysis as well due to lack of variance associated with a cutoff of $50,000 (see footnote 7).
3.35 3.43 3.32 3.243.04
3.18 3.122.84
1.00
2.00
3.00
4.00
Overall*** Self-Regulation*** Social Expression*** KindergartenAcademics***
F5-Supported Preschool No Preschool
45%
57%
24%
36%
Less than $35,000 $35,000 and More
F5-Supported Preschool No Preschool
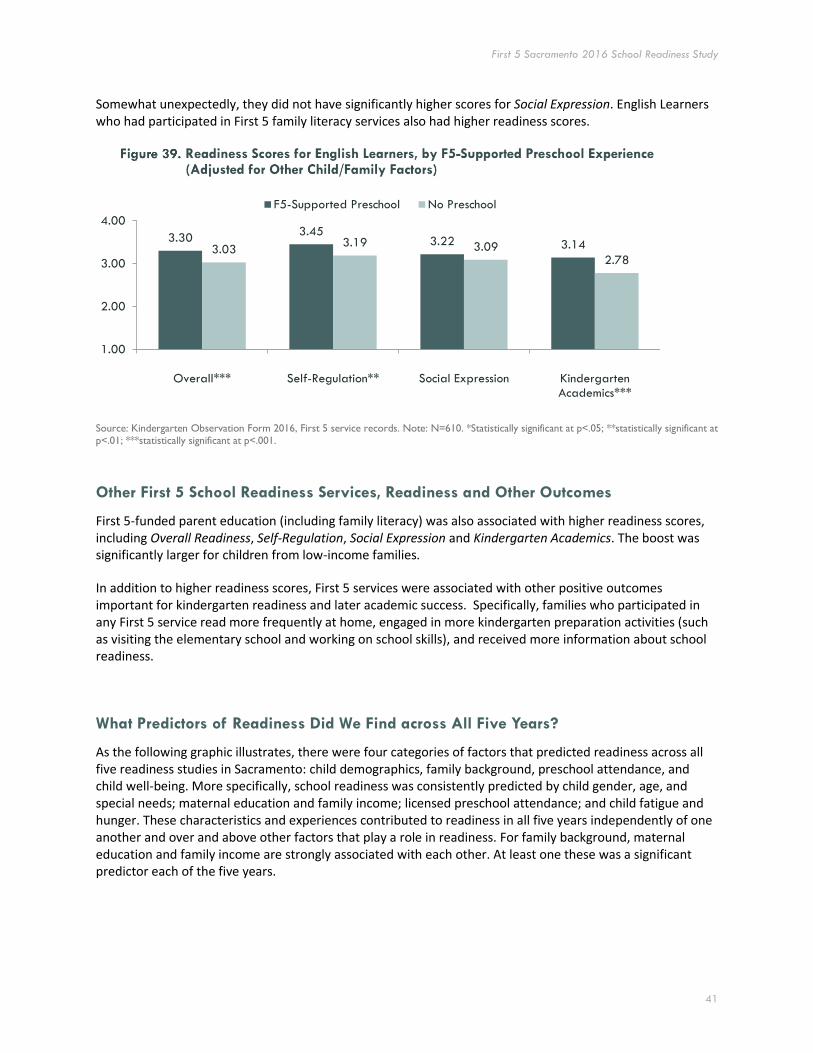
First 5 Sacramento 2016 School Readiness Study
41
Somewhat unexpectedly, they did not have significantly higher scores for Social Expression. English Learners who had participated in First 5 family literacy services also had higher readiness scores.
Source: Kindergarten Observation Form 2016, First 5 service records. Note: N=610. *Statistically significant at p<.05; **statistically significant at p<.01; ***statistically significant at p<.001.
Other First 5 School Readiness Services, Readiness and Other Outcomes
First 5-funded parent education (including family literacy) was also associated with higher readiness scores, including Overall Readiness, Self-Regulation, Social Expression and Kindergarten Academics. The boost was significantly larger for children from low-income families.
In addition to higher readiness scores, First 5 services were associated with other positive outcomes important for kindergarten readiness and later academic success. Specifically, families who participated in any First 5 service read more frequently at home, engaged in more kindergarten preparation activities (such as visiting the elementary school and working on school skills), and received more information about school readiness.
What Predictors of Readiness Did We Find across All Five Years?
As the following graphic illustrates, there were four categories of factors that predicted readiness across all five readiness studies in Sacramento: child demographics, family background, preschool attendance, and child well-being. More specifically, school readiness was consistently predicted by child gender, age, and special needs; maternal education and family income; licensed preschool attendance; and child fatigue and hunger. These characteristics and experiences contributed to readiness in all five years independently of one another and over and above other factors that play a role in readiness. For family background, maternal education and family income are strongly associated with each other. At least one these was a significant predictor each of the five years.
3.303.45
3.22 3.143.033.19 3.09
2.78
1.00
2.00
3.00
4.00
Overall*** Self-Regulation** Social Expression KindergartenAcademics***
F5-Supported Preschool No Preschool
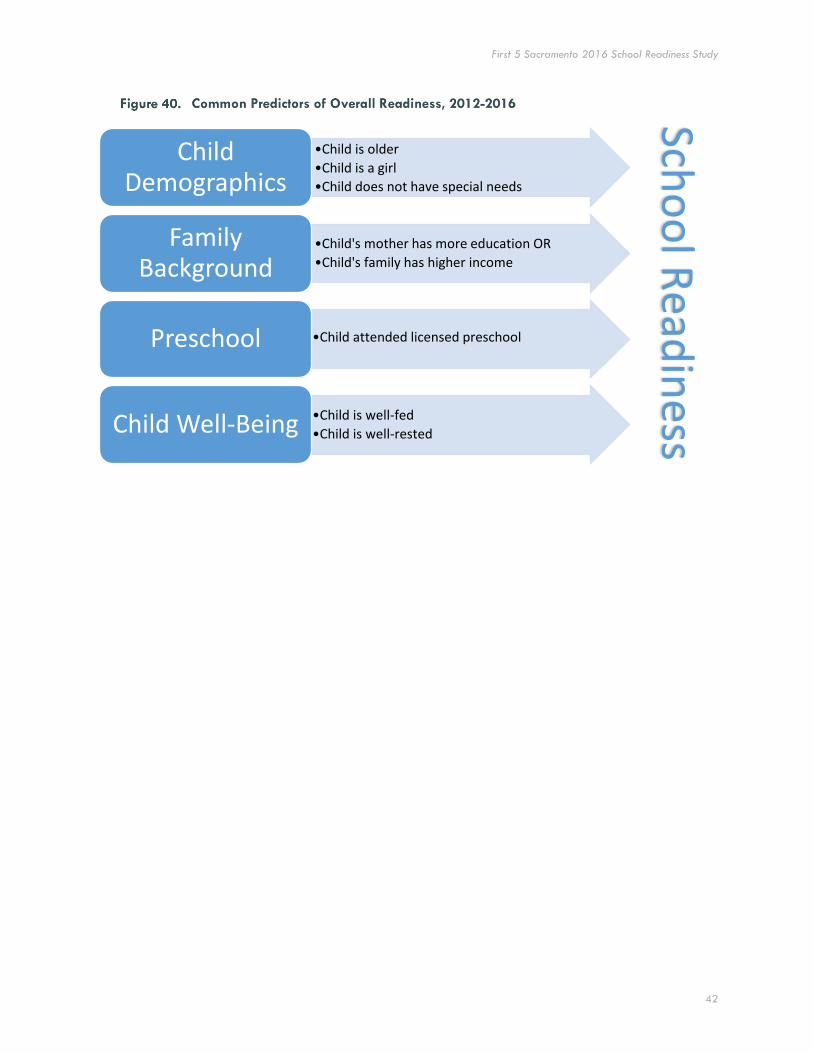
First 5 Sacramento 2016 School Readiness Study
42
•Child is older
•Child is a girl
•Child does not have special needs
Child Demographics
•Child's mother has more education OR
•Child's family has higher income
Family Background
•Child attended licensed preschoolPreschool
•Child is well-fed
•Child is well-restedChild Well-Being
Scho
ol R
eadin
ess
First 5 Sacramento 2016 School Readiness Study
43
Summary and Conclusion
In 2016, the fifth annual school readiness study in the First 5 Sacramento network was conducted. As in previous years, most families in the study were low-income (68% earned under $35,000) and came from diverse racial/ethnic backgrounds (36% of children were Hispanic/Latino, 16% were Asian, 13% were African American, and 17% were mixed race/ethnicity). Nevertheless, children in the study had several types of experiences and backgrounds that helped prepare them for school. For example, 72 percent of children had attended preschool or TK in the prior year. Moreover, nearly all children were connected to regular health care and came to school healthy, and most had received health and developmental screenings.
SAMPLE
Demographics have remained fairly consistent over the past five years, including high rates of low income and lower maternal education, and a fairly high percentage of Hispanic/Latino children. One exception is a possible upward trend in economic well-being, as evidenced by a decrease in percentages in the lowest income group and slight increase in housing stability.
It should be noted that even though the same number of schools participated, there were some changes in the specific schools that participated, resulting in a slight shift in district participation (one fewer school in Rancho Cordova, one added school in Twin Rivers). This may have shifted the overall demographics slightly.
The majority of parents also engaged in at least one school readiness activity and few reported significant parenting stressors or problems. However, maternal education level was related to family activity engagement such that enrichment activities, like reading and working on school skills, were more prevalent among families in which the mother had more than a high school education. First 5 participation also related to families’ preparation for
kindergarten. Children who participated in First 5 school readiness services had parents who received more information about the kindergarten transition and who engaged in more readiness activities with their children.
A majority of children had attended preschool or TK (72%). There were some differences in early education attendance by race, with most at 72%, Asian/PI at 62%, and other at 52%, indicating some communities may need additional outreach.
READINESS SCORES
Over the five years of readiness studies in First 5 Sacramento’s network, the average readiness levels remained just above In Progress on the four-point scale of readiness (1=Not Yet, 2=Beginning, 3=In Progress, 4=Proficient). Across all four years, students have had the greatest needs in Kindergarten Academics, particularly recognizing rhymes and knowing their letters.
Mother’s education and
First 5 participation
were positively related
to family engagement in
enrichment activities.
First 5 Sacramento 2016 School Readiness Study
44
Readiness levels varied, however, depending on a range of child and family characteristics and experiences. In all five years, children were better prepared for kindergarten when they were older, female, did not have special needs, and came to school well-rested and well-fed. In addition, children with higher readiness levels tended to come from families of higher socio-economic status. Finally, we consistently found that children who had attended licensed preschool (including First 5-supported preschool) had significantly higher Overall Readiness levels than those without preschool experience. In the current study year, we also found parents who engaged in readiness activities and felt they had less parenting strain had children with higher readiness levels.
FIRST 5 SERVICES
As in previous years, children who attended a First 5-supported preschool had significantly higher readiness scores than those who did not attend preschool. Unlike last year, there was not a significantly larger boost for low-income children.
Parent education (including family literacy) was also associated with greater readiness, and lower-income families did benefit more than mid/upper-income families.
Other benefits of participation in F5-funded services included: reading more at home, participating in more kindergarten preparation activities and receiving more information about the transition to kindergarten.
While the numbers of children who participated in the transitional summer camp and playgroups were too small to detect associations with readiness, there are plans to conduct multi-year analyses to better understand the impact of these services.
The findings from the 2016 study largely confirm the results from prior studies in Sacramento. Children in Sacramento are better prepared for school when their early experiences involve high-quality preschool and adequate supports for children’s well-being. Given the important role family background and home environment play in school readiness, children benefit from supports provided to their parents as well, such as family literacy programs and parent education. First 5 school readiness services that promote readiness for children and their families are particularly beneficial for low-income children. These points of intervention highlight the role First 5 and their partners play in contributing to the school readiness of children in Sacramento County.
We have consistently found
readiness relates to child
well-being, preschool
attendance, and family
background—important
points of interventions for
First 5 and its partners.
First 5 Sacramento 2016 School Readiness Study
45
References
Alexander, K., Entwisle, D., & Kabbani, N. (2001). The dropout process in life course perspective: Early risk factors
at home and school. The Teachers College Record, 103(5), 760-822.
American Academy of Pediatrics (n.d.). Media and children. Retrieved from http://www.aap.org/en-us/advocacy-and-policy/aap-health-initiatives/pages/media-and-children.aspx
Duncan, G. D., Claessens, A., Huston, A. C., Pagani, L. S., Engel, M., Sexton, H., Dowsett, C. J., Magnuson, K., Klebanov, P., Feinstein, L., Brooks-Gunn, J., Duckworth, K., & Japel, C. (2007). School readiness and later achievement. Developmental Psychology, 43, 1428-1446.
Guarnizo-Herreno, C. C. & Wehby, G. L. (2012). Children’s dental health, school performance, and psychosocial well-being. Journal of Pediatrics, 161(6), 1153–1159.
Grissmer, D., Grimm, K. J., Aiyer, S. M., Murrah, W. M., & Steele, J. S. (2010). Fine motor skills and early
comprehension of the world: Two new school readiness indicators. Developmental Psychology, 46(5), 1008.
Hack, M., Klein, N. K., & Taylor, H.G. (1995). Long-term developmental outcomes of low birth weight infants.
Future of Children, 5, 176-196.
Hair, E.C., Halle, T., Terry‐Humen, E., and Calkins, J. (2003). Naturally occurring patterns of school readiness: How the multiple dimensions of school readiness fit together. Paper presented at the 2003 Biennial Meeting for the Society for Research in Child Development: Tampa, Fl.
Jackson, S. L., Vann, W. F., Koch, J. B., Pahel, B. T., & Lee, J. Y. (2011). Impact of poor oral health on children’s
school attendance and performance. American Journal of Public Health, 101(10), 1900–1906.
Kessenich, M. (2003). Developmental outcomes of premature, low birth weight and medically fragile infants.
Newborn and Infant Nursing Reviews, 3, 80-87.
Megan E. Pratt, Megan M. McClelland, Jodi Swanson, Shannon T. Lipscomb, Family risk profiles and school
readiness: A person-centered approach, Early Childhood Research Quarterly, Volume 36, 3rd Quarter 2016,
Pages 462-474, ISSN 0885-2006, http://dx.doi.org/10.1016/j.ecresq.2016.01.017.Pianta, R. C., Cox, M. J., &
Snow, K. L. (2007). School readiness and the transition to kindergarten in the era of accountability. Baltimore,
MD: Brookes.
Roderick, M. (1994). Grade retention and school dropout: Investigating the association. American Educational
Research Journal, 31(4), 729-759. doi:10.3102/00028312031004729
Sabol, T. J., & Pianta, R. C. (2012). Patterns of school readiness forecast achievement and socioemotional
development at the end of elementary school. Child Development, 83(1), 282-299. doi:10.1111/j.1467-
8624.2011.01678.x
Schweinhart, L. J., Montie, J., Xiang, Z., Barnett, W. S., Belfield, C. R., & Nores, M. (2005). Lifetime effects: the
High/Scope Perry Preschool study through age 40. Monographs of the High/Scope Educational Research
Foundation 14. Ypsilanti, MI: High/Scope Press
Welsh, J. A., Nix, R. L., Blair, C., Bierman, K. L., and Nelson, K. E. (2010). The development of cognitive skills and
gains in academic school readiness for children from low income families. Journal of Educational Psychology,
102, 43–53.
Ziol-Guest, K. M. and McKenna, C. C. (2014), Early Childhood Housing Instability and School Readiness. Child
Development, 85: 103–113. doi: 10.1111/cdev.12105
First 5 Sacramento, in partnership with other agencies, is working to improve the oral health of our youngest children and their families.
Improving the Oral Health Of Young Children
In Sacramento County
June 9, 2017 1
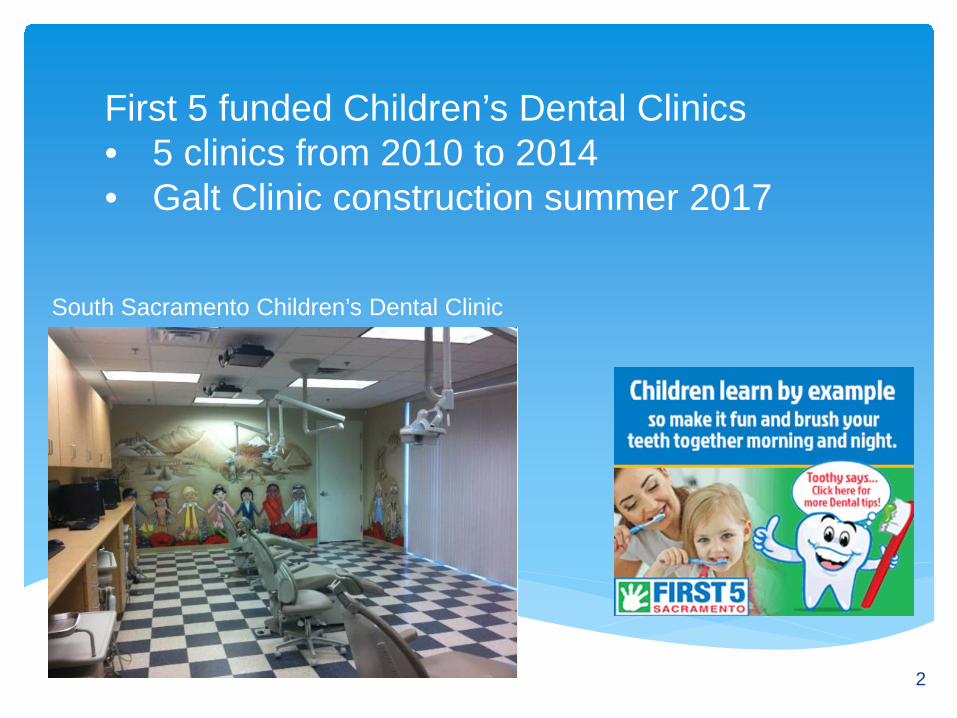
First 5 funded Children’s Dental Clinics • 5 clinics from 2010 to 2014 • Galt Clinic construction summer 2017
South Sacramento Children’s Dental Clinic
2

Test Test Test
Smile Keepers Mobile Dental Services
• Visiting more than 450 classrooms, including State pre-schools, Head Start classrooms, and preschools in Elementary schools
• Providing dental screenings and fluoride varnishes twice a year to more than 7,700 preschoolers across the county
• Attending at least 8 community events each year
3
Community Water Fluoridation
• Committed to Community Water Fluoridation since 2003 • Each project included a 20 year commitment to fluoridation • More than 885,470 residents and more than 78,400 children ages 0 to 5 benefit from this significant effort
4
Now it is a Community effort – • Every Smile Counts! - DHHS awarded Dental
Transformation Initiative Grant Funding –2017 to 2020 • Early Smiles Sacramento – Center For Oral Health’s mobile dental services program in Sacramento County • Dental Plans – Health Net Dental, Access Dental &
Liberty Dental • Medi-Cal Dental Advisory Committee
5

What else is First 5 doing?
• Targeted messaging to reduce fear and encourage visits
• Education and outreach
• Dental website
• Social marketing and social media
Good Oral Health is a part of Good Overall Health
6
www.First5SacDental.org 7
First 5 Sacramento Dental Website

Oral Health Internet Web Ads
Oral Health video on YouTube: https://www.youtube.com/watch?v=ySiHTcP0W80 8

• Key messages
• Community partners
• Policy & Advocacy
Continuing Our Oral Health Efforts
Contact: Julie Beyers, Oral Health Program Planner (916) 876-6529 [email protected]
9