Embed Size (px)
Citation preview
First College Year
Experience Survey
Spring 2016
California State University, Sacramento Office of Institutional Research 6000 J Street | Sacramento Hall 250 | Sacramento, CA 95819-6028
Table of Contents University
Highlights .......................................................................................................................................... I Background Information .................................................................................................................. 1 Concerns and Adjustment to College Life ....................................................................................... 2 Satisfaction with College Life .......................................................................................................... 3 Figure: Satisfaction with Campus Services and Facilities ................................................................ 4 Figure: Satisfaction with College Life .............................................................................................. 5 Campus Climate ............................................................................................................................... 6 Student Activities .............................................................................................................................. 7 Interaction among Racial/Ethnic Groups and Current Abilities ....................................................... 8 Figure: Adjustment to College Life .................................................................................................. 9 Figure: Interaction among Racial/Ethnic Groups .............................................................................. 9 Academic and Intellectual Experience ............................................................................................ 10
College
Highlights .......................................................................................................................................... I Background Information .................................................................................................................. 1 Concerns ............................................................................................................................................ 2 Satisfaction with Campus Services and Facilities ............................................................................ 3 Satisfaction with College Life .......................................................................................................... 4 Adjustment to College Life .............................................................................................................. 5 Campus Climate ................................................................................................................................ 6 Student Activities .............................................................................................................................. 7 Interaction among Racial/Ethnic Groups and Current Abilities ....................................................... 9 Academic and Intellectual Experience ........................................................................................... 10 Overall Experience and Current Abilities ....................................................................................... 11 Figure: Satisfaction with Overall College Experience .................................................................... 12 Figure: Would Choose to Enroll at Sacramento State Again .......................................................... 13
Sacramento State Office of Institutional Research I
First College Year Experience Survey - Highlights
In spring of 2016, the Office of Institutional Research administered a First College Year Experience survey to first-year students in an effort to better understand student learning and to help improve the quality of college education. This survey asked first-time freshmen to share their views on a variety of issues covering many aspects of their journey to Sacramento State, as well as their educational expectations once they got here.
This survey was administered to first-time freshmen who were admitted in fall 2015 and who were still enrolled as of spring 2016. Subsequently, 3,608 survey questionnaires were distributed in February of 2016. 822 of those students completed and returned their surveys for an overall response rate of 23%. The margin of error for this survey calculates to 3.0. This basically means that if 90% of the respondents selected a particular response, it is relatively "certain" (at a 95% confidence level) that between 87% (90% - 3.0) and 93% (90% + 3.0) of all freshmen would have selected that same response. When students were asked whether they had any concern about their ability to finance their college education, 78% responded that they either had some concern or had major concern with respect to having enough funds. In relation to Adjustment to College Life, 82% of the respondents stated that it was either “Very easy” or “Somewhat easy” to understand what your professors expect of you academically. When asked about their experiences in relation to developing close friendships with students from the opposite gender, or from a different racial/ethnic group, fewer freshmen thought that it had been either “Very easy” or “Somewhat easy” with 11% and 7% decrease, respectively compared to the responses collected in 2013. In addition, the positive response to utilize campus services available to students also dropped 10% between 2013 and 2016 (87% vs. 77%). When asked to relay their satisfaction with their overall academic experience at this university, 69% indicated that they were either “Satisfied” or “Very satisfied”. In a correlated finding, 67% responded in the same manner with regard to their satisfaction with their overall college experience. Please note that respondents who selected “Cannot rate/No experience” were excluded from the calculation of satisfaction ratings. The top four Campus Services and Facilities with the highest rates of satisfaction were: Library facilities and equipment – 79% Recreational facilities – 78% First-year programs & Technology resources – 74% The top three aspects of College Life with the highest rates of satisfaction were: Respect for the expression of diverse beliefs – 79% Racial/ethnic diversity of student body – 76% Availability of campus social activities – 73% The three Campus Services and Facilities with the lowest rates of satisfaction were as follows: Student housing facilities (residence halls, etc.) – 49% Student housing office/services – 53% Opportunities for community service – 59% The three aspects of College Life with the lowest rates of satisfaction were as follows: Relevance of coursework to everyday life – 51% Relevance of coursework to future career plans – 55% Amount of contact with faculty – 56% When reviewing the differences with respect to responses to this survey between 2013 and 2016, 5 areas of College Life have improved notably, including the satisfaction rating for racial/ethnic diversity of student body
Sacramento State Office of Institutional Research II
(11% higher), class size and racial/ethnic diversity of faculty (both 8% higher), amount of contact with faculty (showing an increase of 6%), and availability of campus social activities (increased by 5%). With regard to Campus Climate, 90% and 88% of the respondents stated that they either “agree” or “strongly agree” that faculty and staff here, respectively, were interested in students’ academic problems. In addition, 82% of the respondents stated that they see themselves as part of the campus community (showing an increase of almost 10%). They also either “agree” or “strongly agree” that they had been able to find a balance between academics and extracurricular activities and the college experiences have exposed them to diverse opinions, cultures, and values (both were 7% higher than the responses collected in 2013). When asked the extent of their personal experience in relation to being discriminated against based upon race/ethnicity, socio-economic status, gender, religion, sexual orientation, political affiliation, or disability, very few students (about 5%) reported having had any personal experience in this regard. When discussing Interaction among Ethnic/Racial Groups on Campus, 59% of the students stated that they either “Often” or “Very often” studied or prepared for class with students from racial/ethnic groups other than their own, which showed an increase of 6% compared to the response collected in 2013. Moreover, 44% and 38% stated that they had “dined or shared a meal” or “had intellectual discussions outside of class” with students from racial/ethnic groups other than their own, respectively. It was a notable change that the respondents who reported that they “had difficulty getting the courses they need” have dropped 5% within a year (50% in 2015 vs. 45% in 2016).
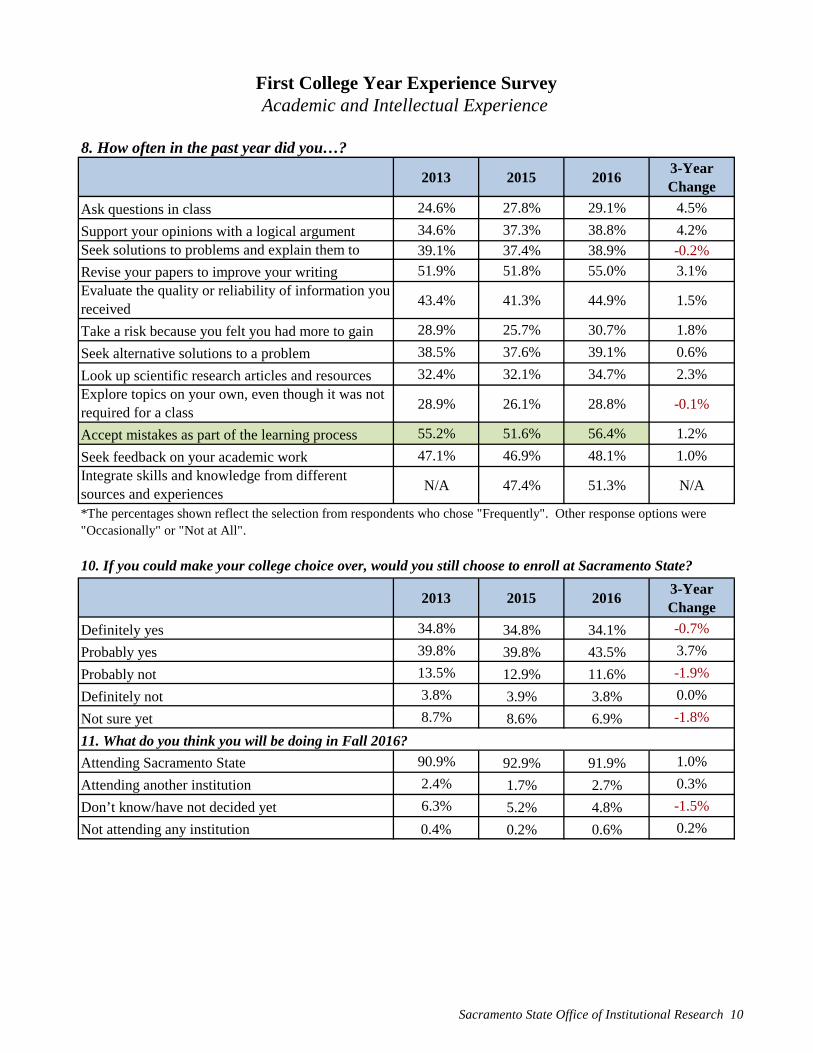
With regard to their Academic and Intellectual Experience, 56% of the respondents stated that they frequently accept mistakes as part of the learning process, 51% reported that they frequently integrate skills and knowledge from different sources and experiences and 48% reported that they frequently sought feedback on their academic work. When asking students “Think about your current abilities and tell us how strong or weak you believe you are in each of the following areas”. The top three abilities included “ability to work as part of a team” (76%), “problem-solving skills” (70%), and “critical thinking skills” (64%), which are consistent with the responses collected in 2015. When asked “If you could make your college choice over, would you still choose to enroll at Sacramento State”, 78% either stated “Definitely yes” or “Probably yes”. When asked “What do you think you will be doing in fall 2016”, 92% of the respondents stated that they would be attending Sacramento State.
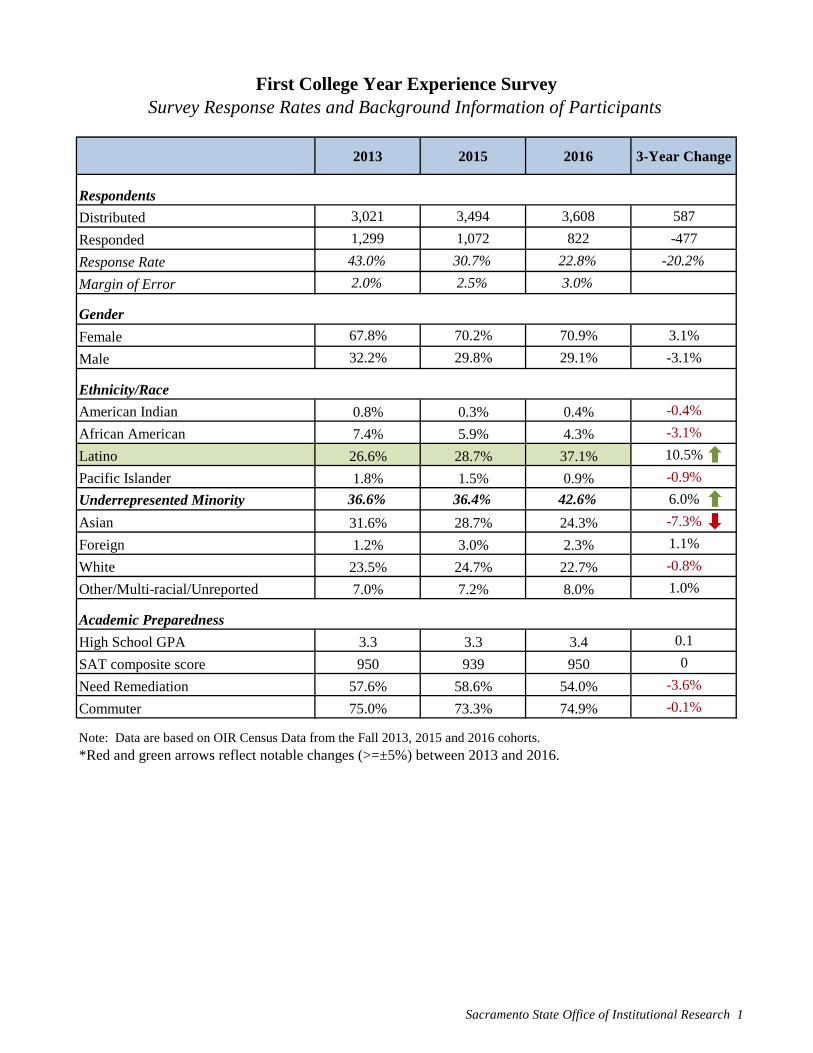
2013 2015 2016 3-Year Change
Respondents
Distributed 3,021 3,494 3,608 587
Responded 1,299 1,072 822 -477
Response Rate 43.0% 30.7% 22.8% -20.2%
Margin of Error 2.0% 2.5% 3.0%
Gender
Female 67.8% 70.2% 70.9% 3.1%
Male 32.2% 29.8% 29.1% -3.1%
American Indian 0.8% 0.3% 0.4% -0.4%
African American 7.4% 5.9% 4.3% -3.1%
Latino 26.6% 28.7% 37.1% 10.5%
Pacific Islander 1.8% 1.5% 0.9% -0.9%
Underrepresented Minority 36.6% 36.4% 42.6% 6.0%
Asian 31.6% 28.7% 24.3% -7.3%
Foreign 1.2% 3.0% 2.3% 1.1%
White 23.5% 24.7% 22.7% -0.8%
Other/Multi-racial/Unreported 7.0% 7.2% 8.0% 1.0%
Academic Preparedness
High School GPA 3.3 3.3 3.4 0.1
SAT composite score 950 939 950 0
Need Remediation 57.6% 58.6% 54.0% -3.6%
Commuter 75.0% 73.3% 74.9% -0.1%
*Red and green arrows reflect notable changes (>=±5%) between 2013 and 2016.Note: Data are based on OIR Census Data from the Fall 2013, 2015 and 2016 cohorts.
Ethnicity/Race
First College Year Experience SurveySurvey Response Rates and Background Information of Participants
Sacramento State Office of Institutional Research 1
2013 2015 20163-Year Change
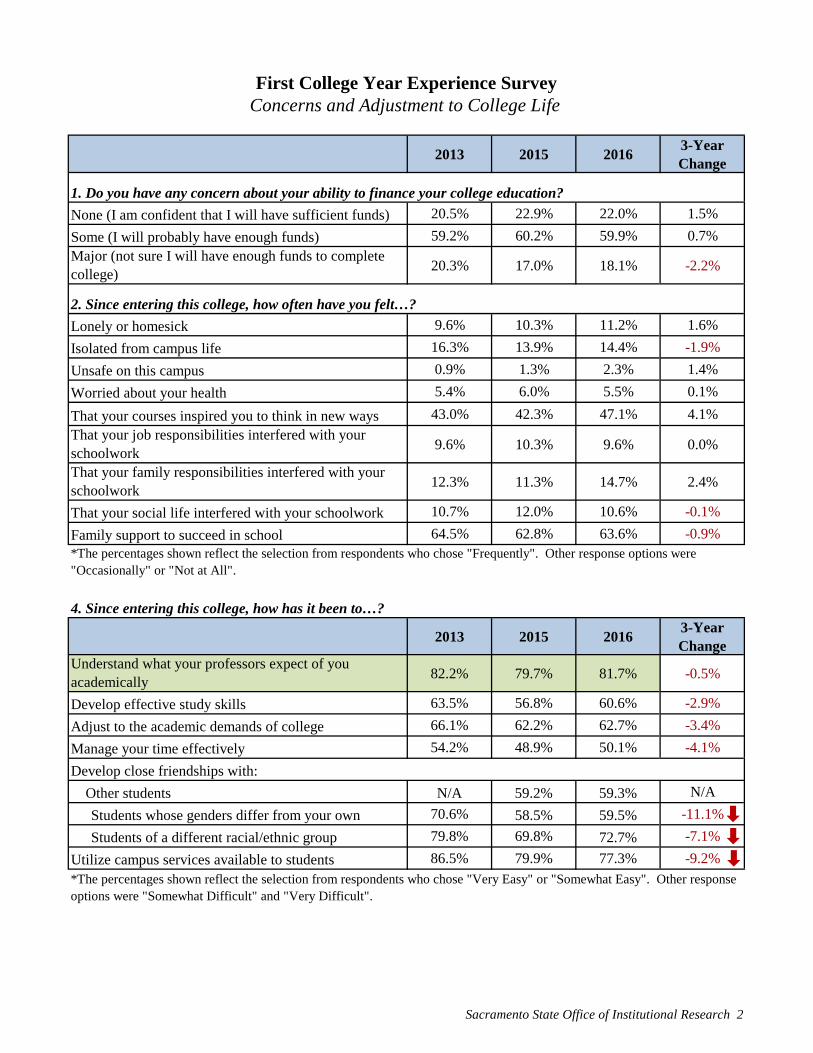
None (I am confident that I will have sufficient funds) 20.5% 22.9% 22.0% 1.5%
Some (I will probably have enough funds) 59.2% 60.2% 59.9% 0.7%Major (not sure I will have enough funds to complete college)
20.3% 17.0% 18.1% -2.2%
2. Since entering this college, how often have you felt…?
Lonely or homesick 9.6% 10.3% 11.2% 1.6%
Isolated from campus life 16.3% 13.9% 14.4% -1.9%
Unsafe on this campus 0.9% 1.3% 2.3% 1.4%
Worried about your health 5.4% 6.0% 5.5% 0.1%
That your courses inspired you to think in new ways 43.0% 42.3% 47.1% 4.1%
That your job responsibilities interfered with your schoolwork
9.6% 10.3% 9.6% 0.0%
That your family responsibilities interfered with your schoolwork
12.3% 11.3% 14.7% 2.4%
That your social life interfered with your schoolwork 10.7% 12.0% 10.6% -0.1%
Family support to succeed in school 64.5% 62.8% 63.6% -0.9%
2013 2015 20163-Year Change
Understand what your professors expect of you academically
82.2% 79.7% 81.7% -0.5%
Develop effective study skills 63.5% 56.8% 60.6% -2.9%
Adjust to the academic demands of college 66.1% 62.2% 62.7% -3.4%
Manage your time effectively 54.2% 48.9% 50.1% -4.1%
Develop close friendships with:
Other students N/A 59.2% 59.3% N/A
Students whose genders differ from your own 70.6% 58.5% 59.5% -11.1%
Students of a different racial/ethnic group 79.8% 69.8% 72.7% -7.1%
Utilize campus services available to students 86.5% 79.9% 77.3% -9.2%*The percentages shown reflect the selection from respondents who chose "Very Easy" or "Somewhat Easy". Other response options were "Somewhat Difficult" and "Very Difficult".
First College Year Experience Survey
4. Since entering this college, how has it been to…?
Concerns and Adjustment to College Life
1. Do you have any concern about your ability to finance your college education?
*The percentages shown reflect the selection from respondents who chose "Frequently". Other response options were "Occasionally" or "Not at All".
Sacramento State Office of Institutional Research 2
2013 2015 20163-Year Change
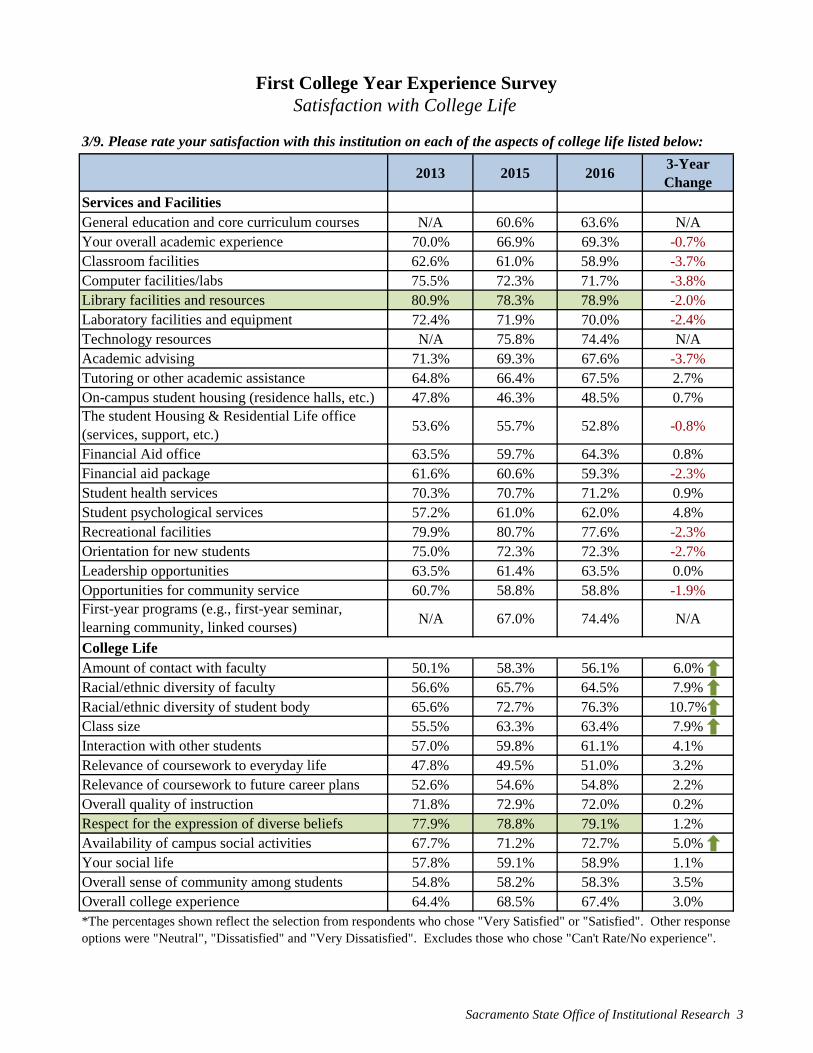
Services and FacilitiesGeneral education and core curriculum courses N/A 60.6% 63.6% N/AYour overall academic experience 70.0% 66.9% 69.3% -0.7%Classroom facilities 62.6% 61.0% 58.9% -3.7%Computer facilities/labs 75.5% 72.3% 71.7% -3.8%Library facilities and resources 80.9% 78.3% 78.9% -2.0%Laboratory facilities and equipment 72.4% 71.9% 70.0% -2.4%Technology resources N/A 75.8% 74.4% N/AAcademic advising 71.3% 69.3% 67.6% -3.7%Tutoring or other academic assistance 64.8% 66.4% 67.5% 2.7%On-campus student housing (residence halls, etc.) 47.8% 46.3% 48.5% 0.7%The student Housing & Residential Life office (services, support, etc.)
53.6% 55.7% 52.8% -0.8%
Financial Aid office 63.5% 59.7% 64.3% 0.8%Financial aid package 61.6% 60.6% 59.3% -2.3%Student health services 70.3% 70.7% 71.2% 0.9%Student psychological services 57.2% 61.0% 62.0% 4.8%Recreational facilities 79.9% 80.7% 77.6% -2.3%Orientation for new students 75.0% 72.3% 72.3% -2.7%Leadership opportunities 63.5% 61.4% 63.5% 0.0%Opportunities for community service 60.7% 58.8% 58.8% -1.9%First-year programs (e.g., first-year seminar, learning community, linked courses)
N/A 67.0% 74.4% N/A
College LifeAmount of contact with faculty 50.1% 58.3% 56.1% 6.0%Racial/ethnic diversity of faculty 56.6% 65.7% 64.5% 7.9%Racial/ethnic diversity of student body 65.6% 72.7% 76.3% 10.7%Class size 55.5% 63.3% 63.4% 7.9%Interaction with other students 57.0% 59.8% 61.1% 4.1%Relevance of coursework to everyday life 47.8% 49.5% 51.0% 3.2%Relevance of coursework to future career plans 52.6% 54.6% 54.8% 2.2%Overall quality of instruction 71.8% 72.9% 72.0% 0.2%Respect for the expression of diverse beliefs 77.9% 78.8% 79.1% 1.2%Availability of campus social activities 67.7% 71.2% 72.7% 5.0%Your social life 57.8% 59.1% 58.9% 1.1%Overall sense of community among students 54.8% 58.2% 58.3% 3.5%Overall college experience 64.4% 68.5% 67.4% 3.0%
3/9. Please rate your satisfaction with this institution on each of the aspects of college life listed below:
First College Year Experience SurveySatisfaction with College Life
*The percentages shown reflect the selection from respondents who chose "Very Satisfied" or "Satisfied". Other response options were "Neutral", "Dissatisfied" and "Very Dissatisfied". Excludes those who chose "Can't Rate/No experience".
Sacramento State Office of Institutional Research 3
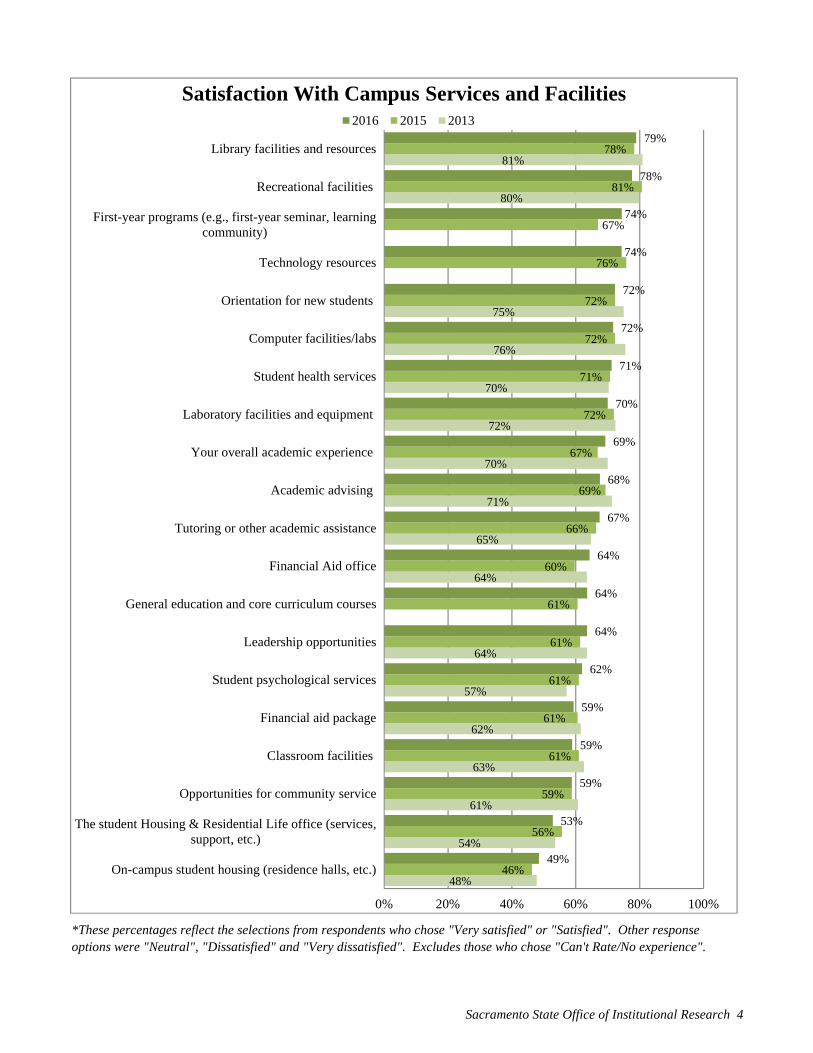
*These percentages reflect the selections from respondents who chose "Very satisfied" or "Satisfied". Other response options were "Neutral", "Dissatisfied" and "Very dissatisfied". Excludes those who chose "Can't Rate/No experience".
48%
54%
61%
63%
62%
57%
64%
64%
65%
71%
70%
72%
70%
76%
75%
80%
81%
46%
56%
59%
61%
61%
61%
61%
61%
60%
66%
69%
67%
72%
71%
72%
72%
76%
67%
81%
78%
49%
53%
59%
59%
59%
62%
64%
64%
64%
67%
68%
69%
70%
71%
72%
72%
74%
74%
78%
79%
0% 20% 40% 60% 80% 100%
On-campus student housing (residence halls, etc.)
The student Housing & Residential Life office (services,support, etc.)
Opportunities for community service
Classroom facilities
Financial aid package
Student psychological services
Leadership opportunities
General education and core curriculum courses
Financial Aid office
Tutoring or other academic assistance
Academic advising
Your overall academic experience
Laboratory facilities and equipment
Student health services
Computer facilities/labs
Orientation for new students
Technology resources
First-year programs (e.g., first-year seminar, learningcommunity)
Recreational facilities
Library facilities and resources
Satisfaction With Campus Services and Facilities 2016 2015 2013
Sacramento State Office of Institutional Research 4
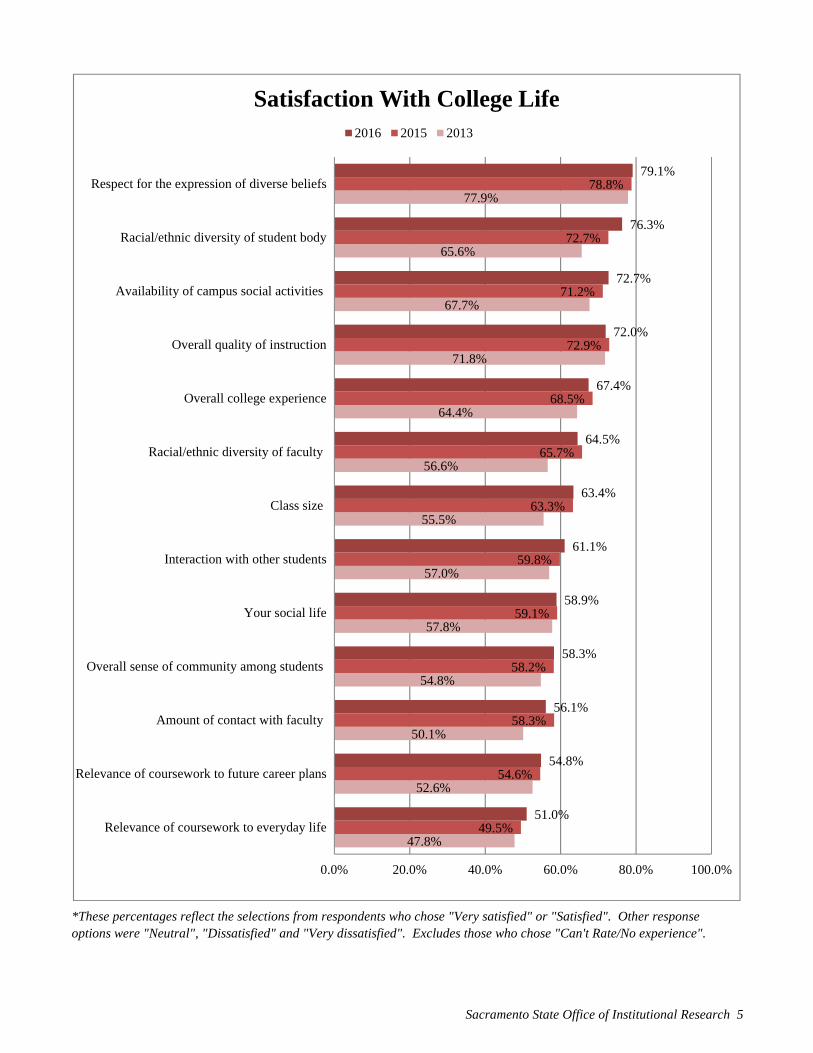
*These percentages reflect the selections from respondents who chose "Very satisfied" or "Satisfied". Other response options were "Neutral", "Dissatisfied" and "Very dissatisfied". Excludes those who chose "Can't Rate/No experience".
47.8%
52.6%
50.1%
54.8%
57.8%
57.0%
55.5%
56.6%
64.4%
71.8%
67.7%
65.6%
77.9%
49.5%
54.6%
58.3%
58.2%
59.1%
59.8%
63.3%
65.7%
68.5%
72.9%
71.2%
72.7%
78.8%
51.0%
54.8%
56.1%
58.3%
58.9%
61.1%
63.4%
64.5%
67.4%
72.0%
72.7%
76.3%
79.1%
0.0% 20.0% 40.0% 60.0% 80.0% 100.0%
Relevance of coursework to everyday life
Relevance of coursework to future career plans
Amount of contact with faculty
Overall sense of community among students
Your social life
Interaction with other students
Class size
Racial/ethnic diversity of faculty
Overall college experience
Overall quality of instruction
Availability of campus social activities
Racial/ethnic diversity of student body
Respect for the expression of diverse beliefs
Satisfaction With College Life2016 2015 2013
Sacramento State Office of Institutional Research 5
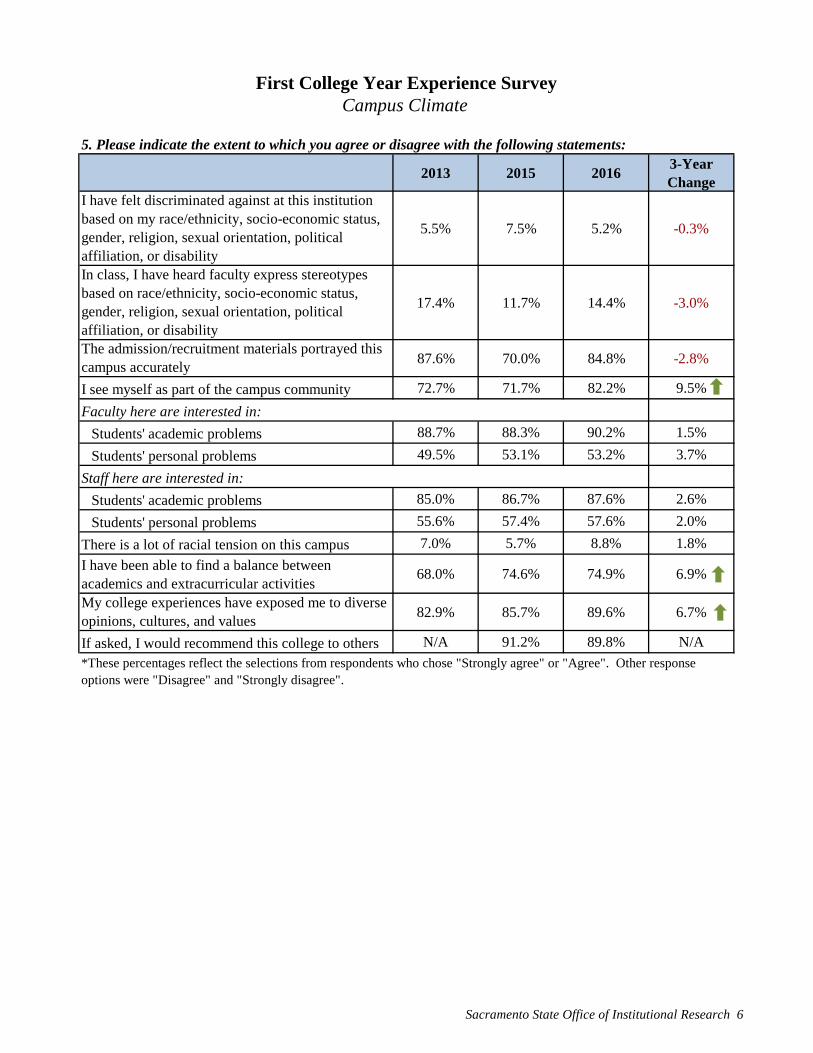
2013 2015 20163-Year Change
I have felt discriminated against at this institution based on my race/ethnicity, socio-economic status, gender, religion, sexual orientation, political affiliation, or disability
5.5% 7.5% 5.2% -0.3%
In class, I have heard faculty express stereotypes based on race/ethnicity, socio-economic status, gender, religion, sexual orientation, political affiliation, or disability
17.4% 11.7% 14.4% -3.0%
The admission/recruitment materials portrayed this campus accurately
87.6% 70.0% 84.8% -2.8%
I see myself as part of the campus community 72.7% 71.7% 82.2% 9.5%
Faculty here are interested in:
Students' academic problems 88.7% 88.3% 90.2% 1.5%
Students' personal problems 49.5% 53.1% 53.2% 3.7%
Staff here are interested in:
Students' academic problems 85.0% 86.7% 87.6% 2.6%
Students' personal problems 55.6% 57.4% 57.6% 2.0%
There is a lot of racial tension on this campus 7.0% 5.7% 8.8% 1.8%
I have been able to find a balance between academics and extracurricular activities
68.0% 74.6% 74.9% 6.9%
My college experiences have exposed me to diverse opinions, cultures, and values
82.9% 85.7% 89.6% 6.7%
If asked, I would recommend this college to others N/A 91.2% 89.8% N/A
First College Year Experience SurveyCampus Climate
*These percentages reflect the selections from respondents who chose "Strongly agree" or "Agree". Other response options were "Disagree" and "Strongly disagree".
5. Please indicate the extent to which you agree or disagree with the following statements:
Sacramento State Office of Institutional Research 6
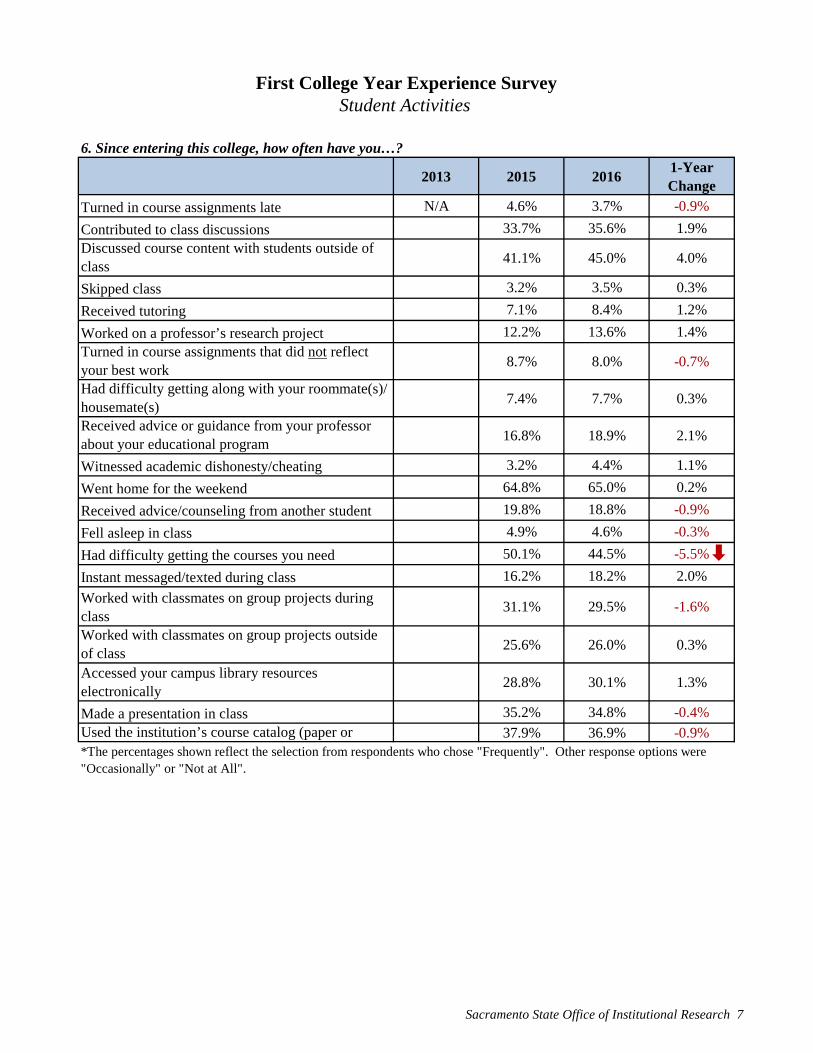
2013 2015 20161-Year Change
Turned in course assignments late N/A 4.6% 3.7% -0.9%
Contributed to class discussions 33.7% 35.6% 1.9%Discussed course content with students outside of class
41.1% 45.0% 4.0%
Skipped class 3.2% 3.5% 0.3%
Received tutoring 7.1% 8.4% 1.2%
Worked on a professor’s research project 12.2% 13.6% 1.4%Turned in course assignments that did not reflect your best work
8.7% 8.0% -0.7%
Had difficulty getting along with your roommate(s)/ housemate(s)
7.4% 7.7% 0.3%
Received advice or guidance from your professor about your educational program
16.8% 18.9% 2.1%
Witnessed academic dishonesty/cheating 3.2% 4.4% 1.1%
Went home for the weekend 64.8% 65.0% 0.2%
Received advice/counseling from another student 19.8% 18.8% -0.9%
Fell asleep in class 4.9% 4.6% -0.3%
Had difficulty getting the courses you need 50.1% 44.5% -5.5%
Instant messaged/texted during class 16.2% 18.2% 2.0%
Worked with classmates on group projects during class
31.1% 29.5% -1.6%
Worked with classmates on group projects outside of class
25.6% 26.0% 0.3%
Accessed your campus library resources electronically
28.8% 30.1% 1.3%
Made a presentation in class 35.2% 34.8% -0.4%Used the institution’s course catalog (paper or 37.9% 36.9% -0.9%
First College Year Experience SurveyStudent Activities
6. Since entering this college, how often have you…?
*The percentages shown reflect the selection from respondents who chose "Frequently". Other response options were "Occasionally" or "Not at All".
Sacramento State Office of Institutional Research 7
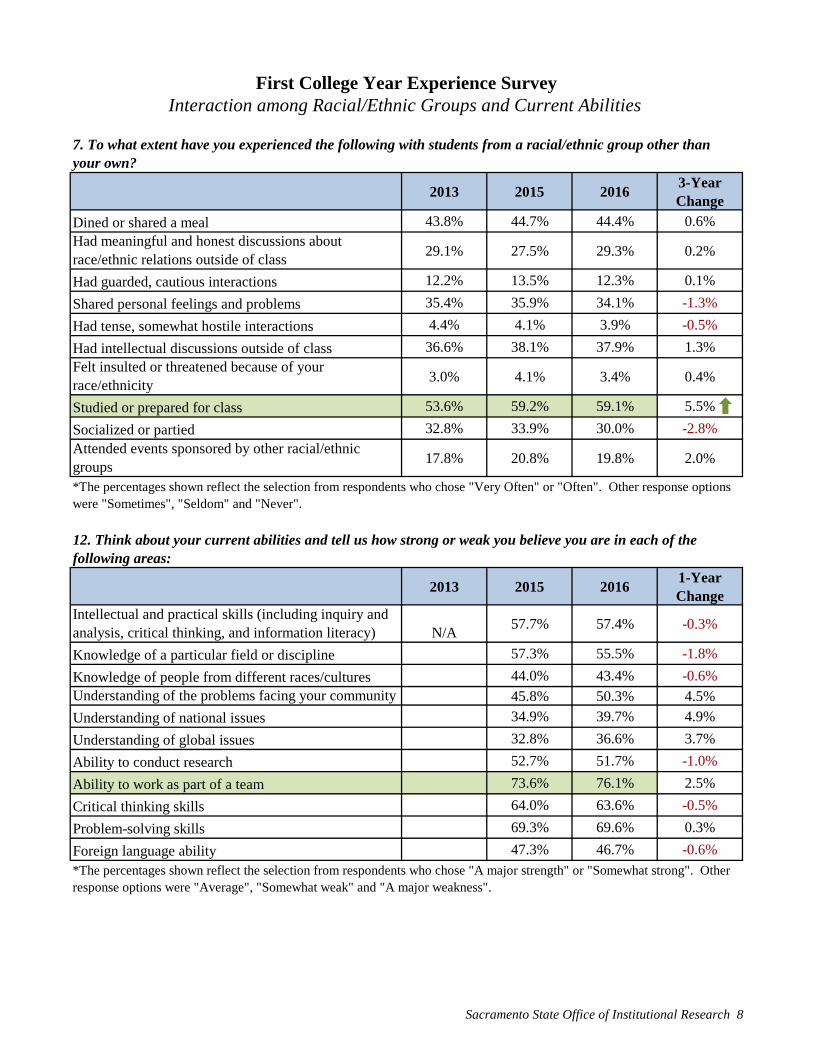
2013 2015 20163-Year Change
Dined or shared a meal 43.8% 44.7% 44.4% 0.6%Had meaningful and honest discussions about race/ethnic relations outside of class
29.1% 27.5% 29.3% 0.2%
Had guarded, cautious interactions 12.2% 13.5% 12.3% 0.1%
Shared personal feelings and problems 35.4% 35.9% 34.1% -1.3%
Had tense, somewhat hostile interactions 4.4% 4.1% 3.9% -0.5%
Had intellectual discussions outside of class 36.6% 38.1% 37.9% 1.3%Felt insulted or threatened because of your race/ethnicity
3.0% 4.1% 3.4% 0.4%
Studied or prepared for class 53.6% 59.2% 59.1% 5.5%
Socialized or partied 32.8% 33.9% 30.0% -2.8%Attended events sponsored by other racial/ethnic groups
17.8% 20.8% 19.8% 2.0%
2013 2015 20161-Year Change
Intellectual and practical skills (including inquiry and analysis, critical thinking, and information literacy) N/A
57.7% 57.4% -0.3%
Knowledge of a particular field or discipline 57.3% 55.5% -1.8%
Knowledge of people from different races/cultures 44.0% 43.4% -0.6%Understanding of the problems facing your community 45.8% 50.3% 4.5%
Understanding of national issues 34.9% 39.7% 4.9%
Understanding of global issues 32.8% 36.6% 3.7%
Ability to conduct research 52.7% 51.7% -1.0%
Ability to work as part of a team 73.6% 76.1% 2.5%
Critical thinking skills 64.0% 63.6% -0.5%
Problem-solving skills 69.3% 69.6% 0.3%
Foreign language ability 47.3% 46.7% -0.6%*The percentages shown reflect the selection from respondents who chose "A major strength" or "Somewhat strong". Other response options were "Average", "Somewhat weak" and "A major weakness".
First College Year Experience SurveyInteraction among Racial/Ethnic Groups and Current Abilities
12. Think about your current abilities and tell us how strong or weak you believe you are in each of the following areas:
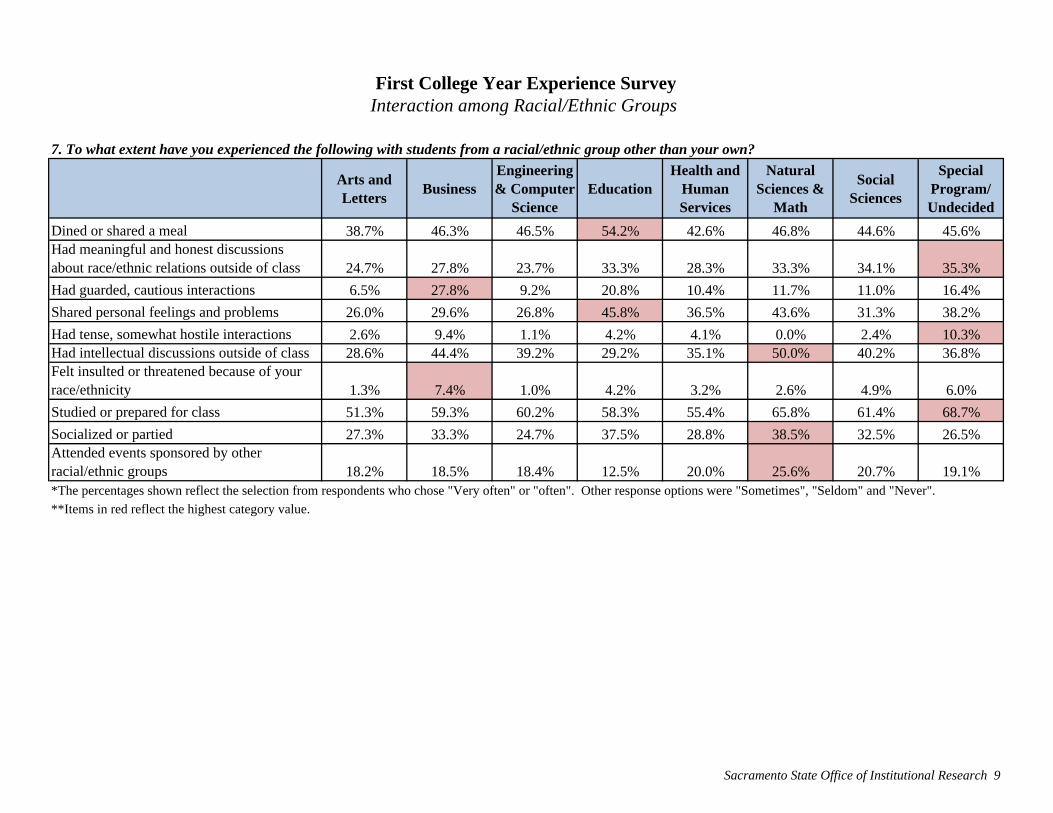
7. To what extent have you experienced the following with students from a racial/ethnic group other than your own?
*The percentages shown reflect the selection from respondents who chose "Very Often" or "Often". Other response options were "Sometimes", "Seldom" and "Never".
Sacramento State Office of Institutional Research 8

*The percentages shown reflect the selection from respondents who chose "Very easy" or "Somewhat easy". Other response options were "Somewhat difficult" and "Very difficult".
The percentages shown reflect the selection from respondents who chose "Very often" or "often". Other response options were "Sometimes", "Seldom" and "Never".
54.2%
70.6%
63.5%
66.1%
79.8%
86.5%
82.2%
48.9%
59.2%
58.5%
56.8%
62.2%
69.8%
79.9%
79.7%
50.1%
59.3%
59.5%
60.6%
62.7%
72.7%
77.3%
81.7%
0% 20% 40% 60% 80% 100%
Manage your time effectively
Develop close friendships with other students
Develop close friendships with students whosegenders differ from your own
Develop effective study skills
Adjust to the academic demands of college
Develop close friendships with students of adifferent racial/ethnic group
Utilize campus services available to students
Understand what your professors expect of youacademically
Adjustment to College Life
2016
2015
2013
3%
4%
14%
17%
31%
37%
37%
37%
45%
55%
3%
4%
12%
18%
29%
33%
35%
37%
44%
54%
4%
4%
14%
21%
28%
34%
36%
38%
45%
59%
0% 20% 40% 60% 80%
Felt insulted or threatened because of yourrace/ethnicity
Had tense, somewhat hostile interactions
Had guarded, cautious interactions
Attended events sponsored by otherracial/ethnic groups
Had meaningful and honest discussions aboutrace/ethnic relations outside of class
Socialized or partied
Shared personal feelings and problems
Had intellectual discussions outside of class
Dined or shared a meal
Studied or prepared for class
Interaction among Racial/Ethnic Groups on Campus
2016
2015
2013
Sacramento State Office of Institutional Research 9
2013 2015 20163-Year Change
Ask questions in class 24.6% 27.8% 29.1% 4.5%
Support your opinions with a logical argument 34.6% 37.3% 38.8% 4.2%Seek solutions to problems and explain them to 39.1% 37.4% 38.9% -0.2%
Revise your papers to improve your writing 51.9% 51.8% 55.0% 3.1%Evaluate the quality or reliability of information you received
43.4% 41.3% 44.9% 1.5%
Take a risk because you felt you had more to gain 28.9% 25.7% 30.7% 1.8%
Seek alternative solutions to a problem 38.5% 37.6% 39.1% 0.6%
Look up scientific research articles and resources 32.4% 32.1% 34.7% 2.3%Explore topics on your own, even though it was not required for a class
28.9% 26.1% 28.8% -0.1%
Accept mistakes as part of the learning process 55.2% 51.6% 56.4% 1.2%
Seek feedback on your academic work 47.1% 46.9% 48.1% 1.0%Integrate skills and knowledge from different sources and experiences
N/A 47.4% 51.3% N/A
2013 2015 20163-Year Change
Definitely yes 34.8% 34.8% 34.1% -0.7%
Probably yes 39.8% 39.8% 43.5% 3.7%
Probably not 13.5% 12.9% 11.6% -1.9%
Definitely not 3.8% 3.9% 3.8% 0.0%
Not sure yet 8.7% 8.6% 6.9% -1.8%
Attending Sacramento State 90.9% 92.9% 91.9% 1.0%
Attending another institution 2.4% 1.7% 2.7% 0.3%
Don’t know/have not decided yet 6.3% 5.2% 4.8% -1.5%
Not attending any institution 0.4% 0.2% 0.6% 0.2%
11. What do you think you will be doing in Fall 2016?
8. How often in the past year did you…?
*The percentages shown reflect the selection from respondents who chose "Frequently". Other response options were "Occasionally" or "Not at All".
10. If you could make your college choice over, would you still choose to enroll at Sacramento State?
First College Year Experience SurveyAcademic and Intellectual Experience
Sacramento State Office of Institutional Research 10
Sacramento State Office of Institutional Research I
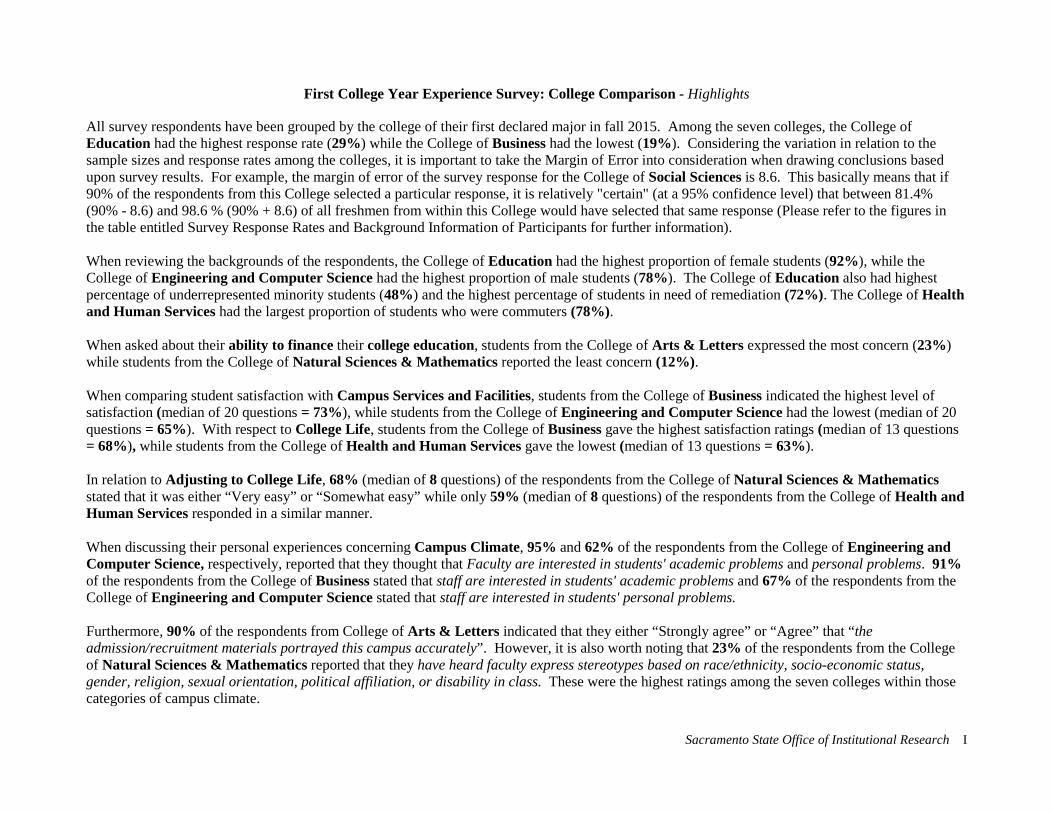
First College Year Experience Survey: College Comparison - Highlights
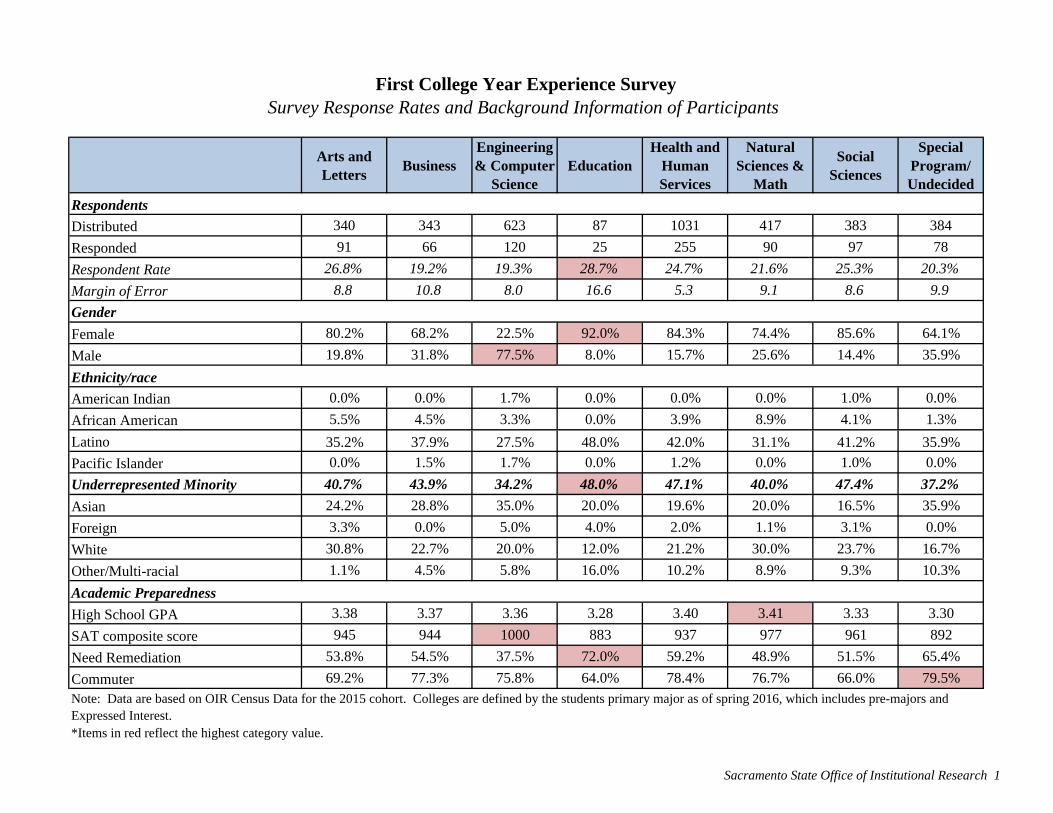
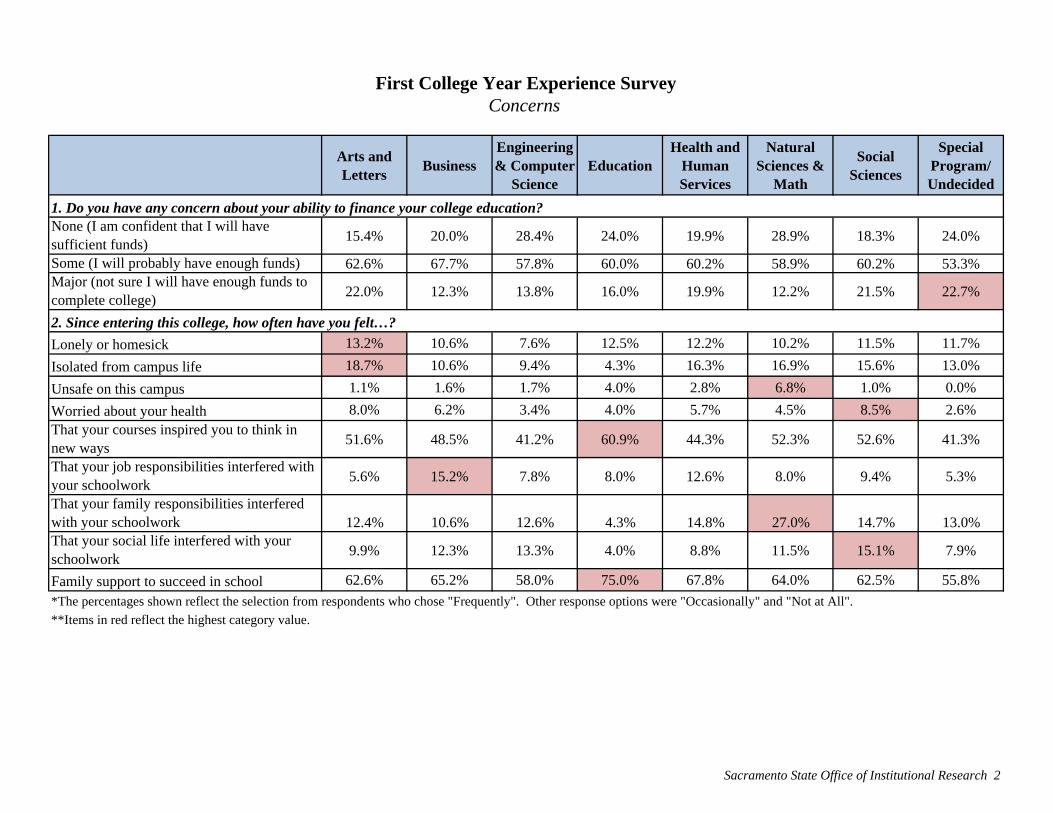
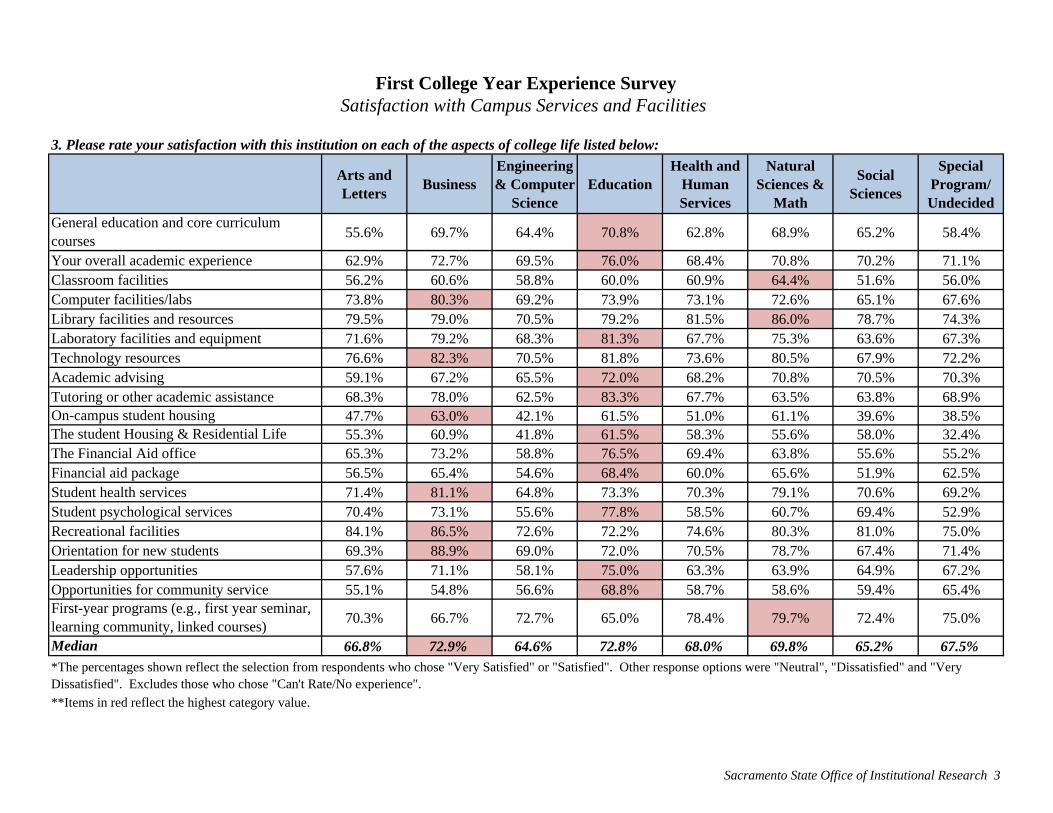
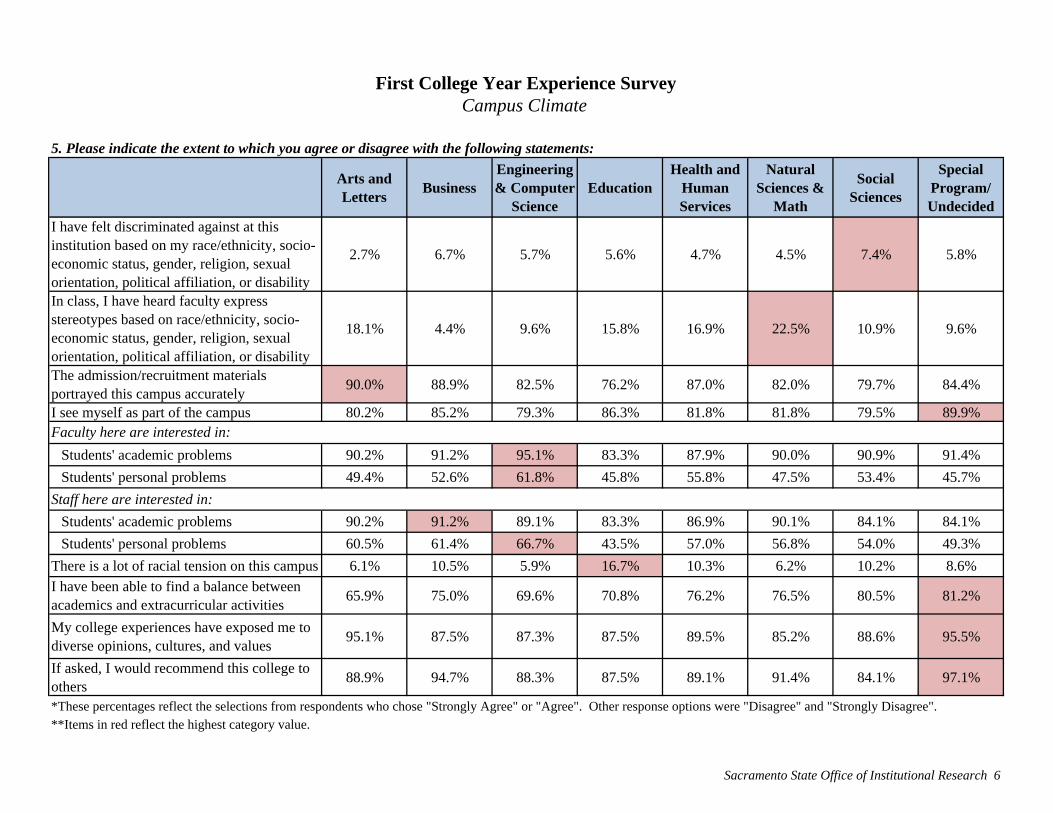
All survey respondents have been grouped by the college of their first declared major in fall 2015. Among the seven colleges, the College of Education had the highest response rate (29%) while the College of Business had the lowest (19%). Considering the variation in relation to the sample sizes and response rates among the colleges, it is important to take the Margin of Error into consideration when drawing conclusions based upon survey results. For example, the margin of error of the survey response for the College of Social Sciences is 8.6. This basically means that if 90% of the respondents from this College selected a particular response, it is relatively "certain" (at a 95% confidence level) that between 81.4% (90% - 8.6) and 98.6 % (90% + 8.6) of all freshmen from within this College would have selected that same response (Please refer to the figures in the table entitled Survey Response Rates and Background Information of Participants for further information). When reviewing the backgrounds of the respondents, the College of Education had the highest proportion of female students (92%), while the College of Engineering and Computer Science had the highest proportion of male students (78%). The College of Education also had highest percentage of underrepresented minority students (48%) and the highest percentage of students in need of remediation (72%). The College of Health and Human Services had the largest proportion of students who were commuters (78%). When asked about their ability to finance their college education, students from the College of Arts & Letters expressed the most concern (23%) while students from the College of Natural Sciences & Mathematics reported the least concern (12%). When comparing student satisfaction with Campus Services and Facilities, students from the College of Business indicated the highest level of satisfaction (median of 20 questions = 73%), while students from the College of Engineering and Computer Science had the lowest (median of 20 questions = 65%). With respect to College Life, students from the College of Business gave the highest satisfaction ratings (median of 13 questions = 68%), while students from the College of Health and Human Services gave the lowest (median of 13 questions = 63%). In relation to Adjusting to College Life, 68% (median of 8 questions) of the respondents from the College of Natural Sciences & Mathematics stated that it was either “Very easy” or “Somewhat easy” while only 59% (median of 8 questions) of the respondents from the College of Health and Human Services responded in a similar manner. When discussing their personal experiences concerning Campus Climate, 95% and 62% of the respondents from the College of Engineering and Computer Science, respectively, reported that they thought that Faculty are interested in students' academic problems and personal problems. 91% of the respondents from the College of Business stated that staff are interested in students' academic problems and 67% of the respondents from the College of Engineering and Computer Science stated that staff are interested in students' personal problems. Furthermore, 90% of the respondents from College of Arts & Letters indicated that they either “Strongly agree” or “Agree” that “the admission/recruitment materials portrayed this campus accurately”. However, it is also worth noting that 23% of the respondents from the College of Natural Sciences & Mathematics reported that they have heard faculty express stereotypes based on race/ethnicity, socio-economic status, gender, religion, sexual orientation, political affiliation, or disability in class. These were the highest ratings among the seven colleges within those categories of campus climate.

Sacramento State Office of Institutional Research II
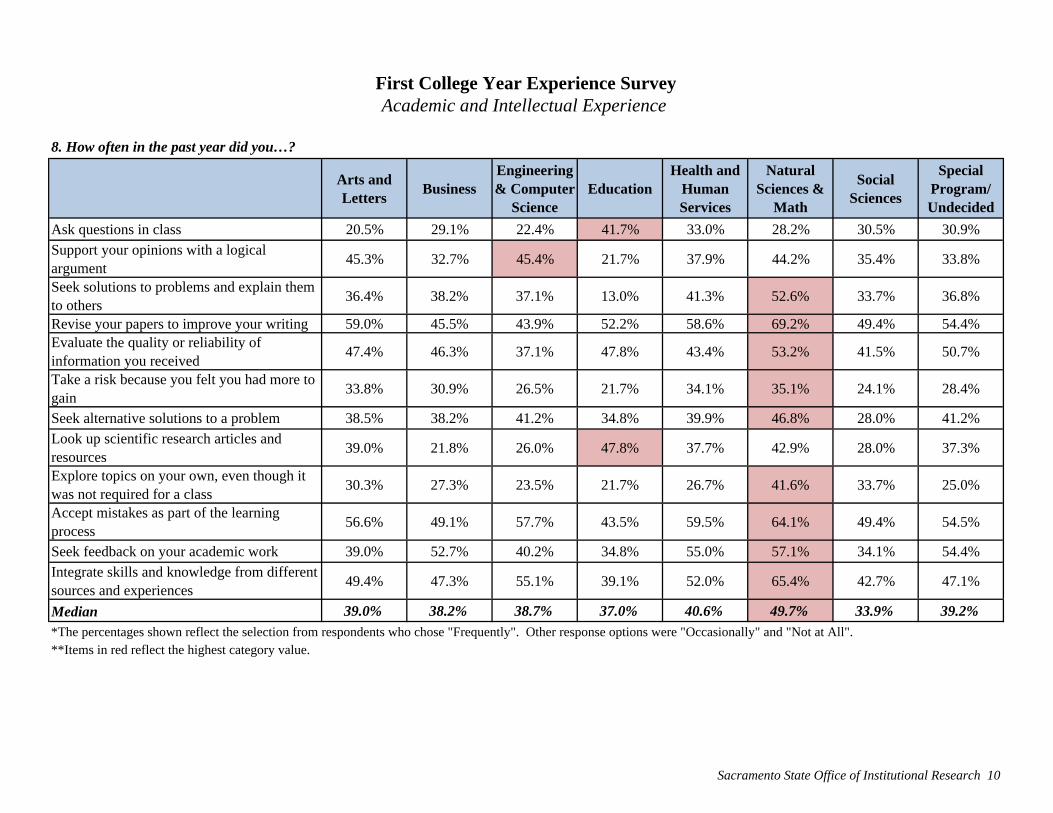
When asking about the interactions among racial/ethnic groups, respondents from the College of Natural Sciences & Mathematics reported having had the most positive interaction with “students from a racial/ethnic group other than their own”: 66% of the respondents stated that they had “studied or prepared for class” with such students. 50% of the respondents reported that they “had intellectual discussions outside of class” with students from racial/ethnic groups other than their own, while 39% reported having “socialized or partied” with such students. With respect to Academic and Intellectual Experience, the respondents from College of Natural Sciences & Mathematics gave the highest rating in 9 of the total 12 categories (median of 12 questions = 50%) and the ratings selected below are also at least 5% greater than that of any of the other college.
• 69% of respondents reported that they frequently revise their papers to improve their writing • 65% of the respondents reported that they frequently integrate skills and knowledge from different sources and experiences • 64% of the respondents reported that they frequently accept mistakes as part of the learning process • 53% of the respondents reported that they frequently evaluate the quality or reliability of information they received
The following colleges had response rates with respect to specific areas of Student Activities which were at least 5% greater than that of any of the other college:
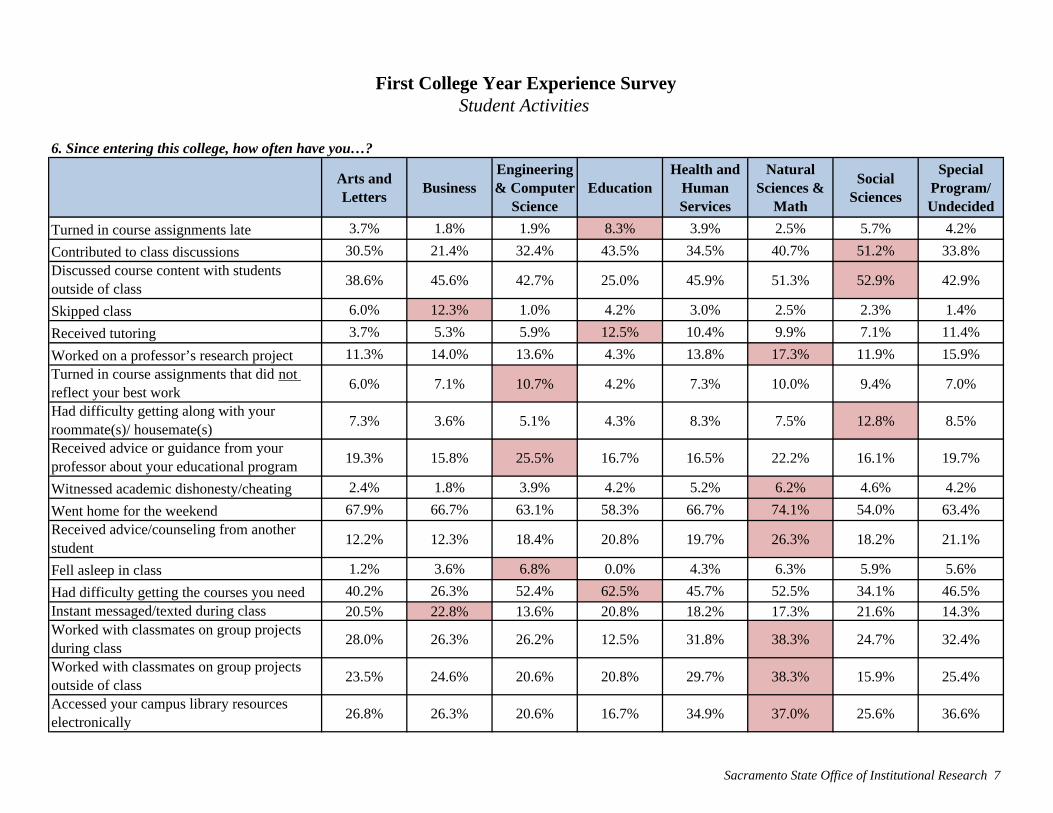
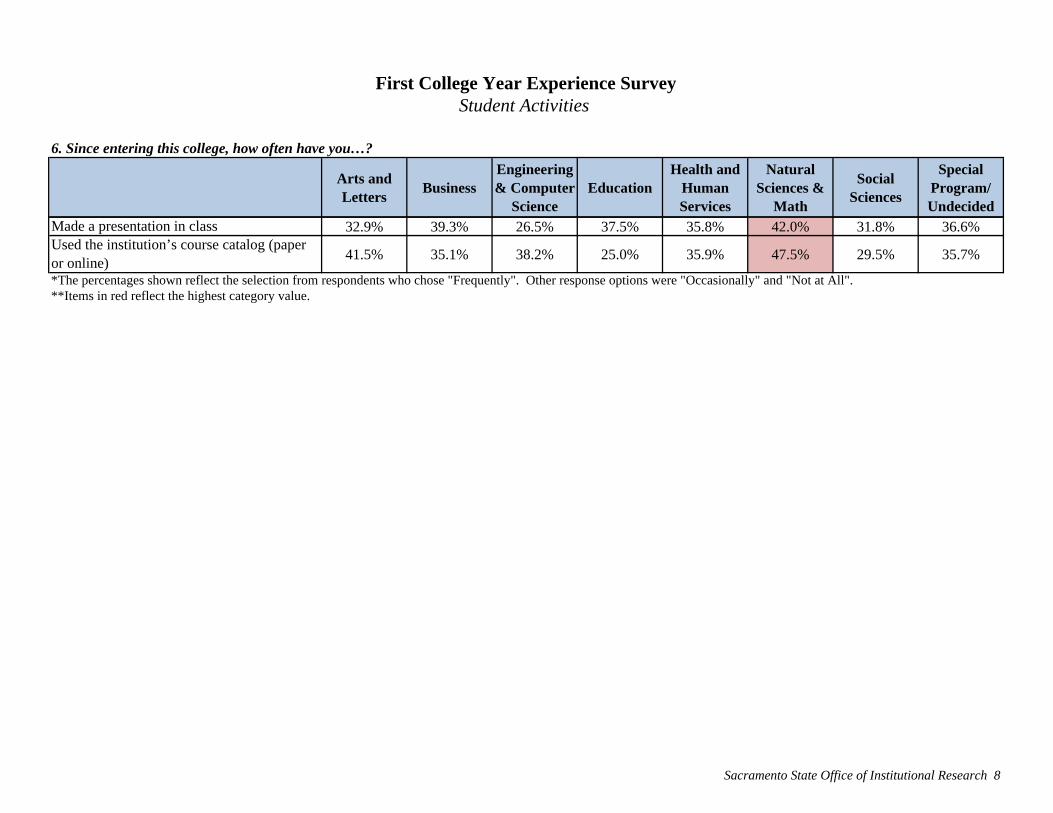
• 74% of the respondents from the College of Natural Sciences & Mathematics frequently went home for the weekend • 63% of the respondents from College of Education stated that they frequently Had difficulty getting the courses they need • 53% of the respondents from the College of Social Sciences frequently Discussed course content with students outside of class • 51% of the respondents from the College of Social Sciences frequently Contributed to class discussions • 48% of the respondents from the College of Natural Sciences & Mathematics stated that they had frequently Used the institution’s course
catalog (paper or online) • 38% of the respondents from the College of Natural Sciences & Mathematics frequently worked with classmates on group projects during
class and outside of class • 12% of respondents from College of Business reported that they frequently skipped class
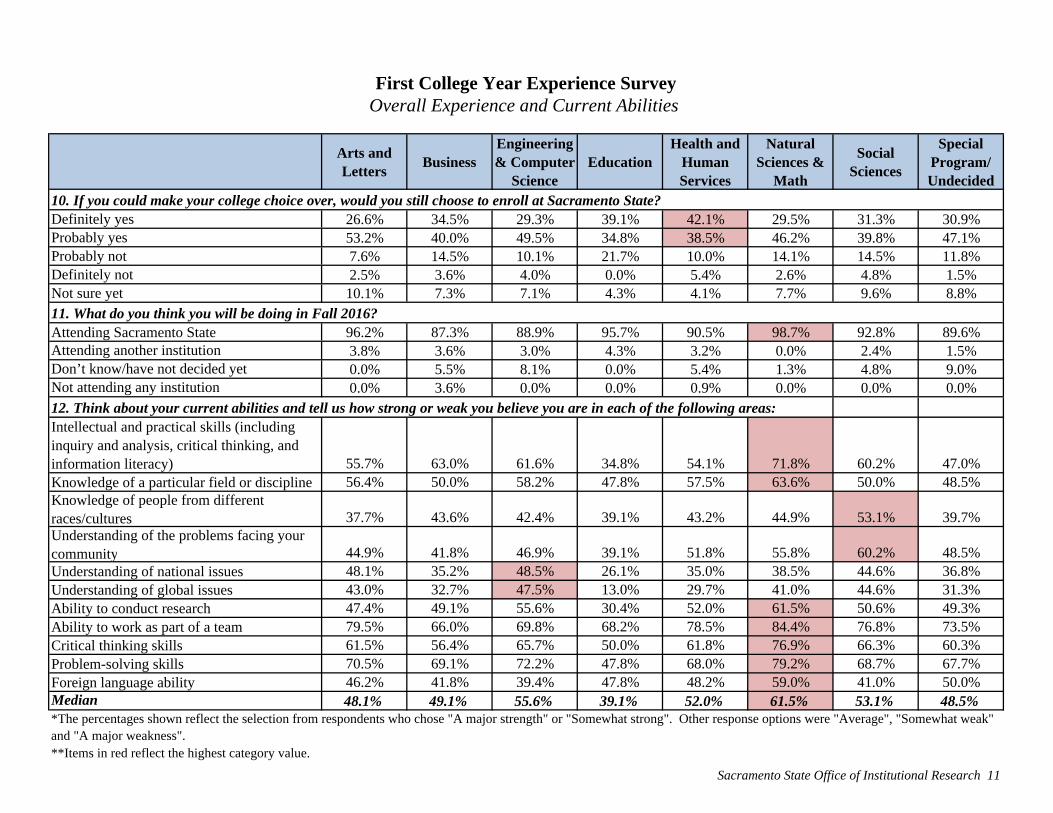
When asked to think about and rate their Current Abilities, respondents from the College of Natural Sciences & Mathematics had the highest percentage of students who reported having a major strength or being somewhat strong in relation to their abilities/skills (median of 11 questions = 62%). Their self –assessment were also at least 5% greater than that of any of the other college at following selected categories:
• Ability to work as part of a team (84%) • Problem-solving skills (79%) • Critical thinking skills (77%)

Sacramento State Office of Institutional Research III
The following colleges had response rates with respect to specific areas of their Current Abilities which were at least 5% greater than that of any of the other college:
• 60% of the respondents from the College of Social Sciences reported having a major strength or being somewhat strong in relation to their
understanding of the problems facing their community • 53% of the respondents from the College of Social Sciences reported having a major strength or being somewhat strong in relation to their
knowledge of people from different races/cultures
When asked “If you could make your college choice over, would you still choose to enroll at Sacramento State”, 81% of the respondents from the College of Health and Human Services stated “Definitely yes” or “Probably yes”, while just 71% of the respondents from the College of Social Science responded in the same manner. When asked “what do you think you will be doing in Fall 2016, 99% of the respondents from the College of Natural Sciences & Mathematics indicated that they will be Attending Sacramento State, while 87% of the respondents from the College of Business responded in the same manner.
Arts and Letters
BusinessEngineering & Computer
ScienceEducation
Health and Human Services
Natural Sciences &
Math
Social Sciences
Special Program/ Undecided
Distributed 340 343 623 87 1031 417 383 384
Responded 91 66 120 25 255 90 97 78
Respondent Rate 26.8% 19.2% 19.3% 28.7% 24.7% 21.6% 25.3% 20.3%
Margin of Error 8.8 10.8 8.0 16.6 5.3 9.1 8.6 9.9
Gender
Female 80.2% 68.2% 22.5% 92.0% 84.3% 74.4% 85.6% 64.1%
Male 19.8% 31.8% 77.5% 8.0% 15.7% 25.6% 14.4% 35.9%
American Indian 0.0% 0.0% 1.7% 0.0% 0.0% 0.0% 1.0% 0.0%
African American 5.5% 4.5% 3.3% 0.0% 3.9% 8.9% 4.1% 1.3%
Latino 35.2% 37.9% 27.5% 48.0% 42.0% 31.1% 41.2% 35.9%
Pacific Islander 0.0% 1.5% 1.7% 0.0% 1.2% 0.0% 1.0% 0.0%
Underrepresented Minority 40.7% 43.9% 34.2% 48.0% 47.1% 40.0% 47.4% 37.2%
Asian 24.2% 28.8% 35.0% 20.0% 19.6% 20.0% 16.5% 35.9%
Foreign 3.3% 0.0% 5.0% 4.0% 2.0% 1.1% 3.1% 0.0%
White 30.8% 22.7% 20.0% 12.0% 21.2% 30.0% 23.7% 16.7%
Other/Multi-racial 1.1% 4.5% 5.8% 16.0% 10.2% 8.9% 9.3% 10.3%
Academic Preparedness
High School GPA 3.38 3.37 3.36 3.28 3.40 3.41 3.33 3.30
SAT composite score 945 944 1000 883 937 977 961 892
Need Remediation 53.8% 54.5% 37.5% 72.0% 59.2% 48.9% 51.5% 65.4%
Commuter 69.2% 77.3% 75.8% 64.0% 78.4% 76.7% 66.0% 79.5%
*Items in red reflect the highest category value.
First College Year Experience SurveySurvey Response Rates and Background Information of Participants
Ethnicity/race
Respondents
Note: Data are based on OIR Census Data for the 2015 cohort. Colleges are defined by the students primary major as of spring 2016, which includes pre-majors and Expressed Interest.
Sacramento State Office of Institutional Research 1
Arts and Letters
BusinessEngineering & Computer
ScienceEducation
Health and Human Services
Natural Sciences &
Math
Social Sciences
Special Program/ Undecided
None (I am confident that I will have sufficient funds)
15.4% 20.0% 28.4% 24.0% 19.9% 28.9% 18.3% 24.0%
Some (I will probably have enough funds) 62.6% 67.7% 57.8% 60.0% 60.2% 58.9% 60.2% 53.3%Major (not sure I will have enough funds to complete college)
22.0% 12.3% 13.8% 16.0% 19.9% 12.2% 21.5% 22.7%
2. Since entering this college, how often have you felt…?
Lonely or homesick 13.2% 10.6% 7.6% 12.5% 12.2% 10.2% 11.5% 11.7%
Isolated from campus life 18.7% 10.6% 9.4% 4.3% 16.3% 16.9% 15.6% 13.0%
Unsafe on this campus 1.1% 1.6% 1.7% 4.0% 2.8% 6.8% 1.0% 0.0%
Worried about your health 8.0% 6.2% 3.4% 4.0% 5.7% 4.5% 8.5% 2.6%That your courses inspired you to think in new ways
51.6% 48.5% 41.2% 60.9% 44.3% 52.3% 52.6% 41.3%
That your job responsibilities interfered with your schoolwork
5.6% 15.2% 7.8% 8.0% 12.6% 8.0% 9.4% 5.3%
That your family responsibilities interfered with your schoolwork 12.4% 10.6% 12.6% 4.3% 14.8% 27.0% 14.7% 13.0%That your social life interfered with your schoolwork
9.9% 12.3% 13.3% 4.0% 8.8% 11.5% 15.1% 7.9%
Family support to succeed in school 62.6% 65.2% 58.0% 75.0% 67.8% 64.0% 62.5% 55.8%
*The percentages shown reflect the selection from respondents who chose "Frequently". Other response options were "Occasionally" and "Not at All".
**Items in red reflect the highest category value.
First College Year Experience SurveyConcerns
1. Do you have any concern about your ability to finance your college education?
Sacramento State Office of Institutional Research 2
Arts and Letters
BusinessEngineering & Computer
ScienceEducation
Health and Human Services
Natural Sciences &
Math
Social Sciences
Special Program/ Undecided
General education and core curriculum courses
55.6% 69.7% 64.4% 70.8% 62.8% 68.9% 65.2% 58.4%
Your overall academic experience 62.9% 72.7% 69.5% 76.0% 68.4% 70.8% 70.2% 71.1%Classroom facilities 56.2% 60.6% 58.8% 60.0% 60.9% 64.4% 51.6% 56.0%Computer facilities/labs 73.8% 80.3% 69.2% 73.9% 73.1% 72.6% 65.1% 67.6%Library facilities and resources 79.5% 79.0% 70.5% 79.2% 81.5% 86.0% 78.7% 74.3%Laboratory facilities and equipment 71.6% 79.2% 68.3% 81.3% 67.7% 75.3% 63.6% 67.3%Technology resources 76.6% 82.3% 70.5% 81.8% 73.6% 80.5% 67.9% 72.2%Academic advising 59.1% 67.2% 65.5% 72.0% 68.2% 70.8% 70.5% 70.3%Tutoring or other academic assistance 68.3% 78.0% 62.5% 83.3% 67.7% 63.5% 63.8% 68.9%On-campus student housing 47.7% 63.0% 42.1% 61.5% 51.0% 61.1% 39.6% 38.5%The student Housing & Residential Life 55.3% 60.9% 41.8% 61.5% 58.3% 55.6% 58.0% 32.4%The Financial Aid office 65.3% 73.2% 58.8% 76.5% 69.4% 63.8% 55.6% 55.2%Financial aid package 56.5% 65.4% 54.6% 68.4% 60.0% 65.6% 51.9% 62.5%Student health services 71.4% 81.1% 64.8% 73.3% 70.3% 79.1% 70.6% 69.2%Student psychological services 70.4% 73.1% 55.6% 77.8% 58.5% 60.7% 69.4% 52.9%Recreational facilities 84.1% 86.5% 72.6% 72.2% 74.6% 80.3% 81.0% 75.0%Orientation for new students 69.3% 88.9% 69.0% 72.0% 70.5% 78.7% 67.4% 71.4%Leadership opportunities 57.6% 71.1% 58.1% 75.0% 63.3% 63.9% 64.9% 67.2%Opportunities for community service 55.1% 54.8% 56.6% 68.8% 58.7% 58.6% 59.4% 65.4%First-year programs (e.g., first year seminar, learning community, linked courses)
70.3% 66.7% 72.7% 65.0% 78.4% 79.7% 72.4% 75.0%
Median 66.8% 72.9% 64.6% 72.8% 68.0% 69.8% 65.2% 67.5%
**Items in red reflect the highest category value.
First College Year Experience SurveySatisfaction with Campus Services and Facilities
3. Please rate your satisfaction with this institution on each of the aspects of college life listed below:
*The percentages shown reflect the selection from respondents who chose "Very Satisfied" or "Satisfied". Other response options were "Neutral", "Dissatisfied" and "Very Dissatisfied". Excludes those who chose "Can't Rate/No experience".
Sacramento State Office of Institutional Research 3

Arts and Letters
BusinessEngineering & Computer
ScienceEducation
Health and Human Services
Natural Sciences &
Math
Social Sciences
Special Program/ Undecided
Amount of contact with faculty 56.2% 59.1% 60.5% 60.0% 52.1% 64.8% 56.3% 48.1%
Racial/ethnic diversity of faculty 62.4% 72.9% 64.1% 68.0% 62.6% 72.7% 63.2% 58.4%
Racial/ethnic diversity of student body 81.4% 82.0% 70.7% 80.0% 70.9% 84.9% 78.5% 78.9%
Class size 64.4% 69.7% 58.0% 56.0% 63.4% 66.7% 64.6% 62.8%
Interaction with other students 66.7% 55.4% 65.5% 68.0% 59.5% 60.2% 62.5% 54.5%
Relevance of coursework to everyday life 51.7% 55.6% 52.5% 48.0% 48.8% 50.6% 52.6% 50.7%Relevance of coursework to future career plans
50.6% 61.9% 63.5% 50.0% 52.6% 53.9% 54.3% 51.4%
Overall quality of instruction 71.1% 78.8% 67.2% 80.0% 72.0% 77.8% 67.7% 70.1%
Respect for the expression of diverse beliefs 84.3% 84.6% 73.5% 84.0% 76.8% 85.6% 78.1% 76.6%
Availability of campus social activities 64.6% 72.4% 66.4% 68.0% 78.4% 77.4% 78.0% 63.2%
Your social life 56.3% 67.7% 65.0% 58.3% 55.3% 56.8% 60.4% 57.5%
Overall sense of community among students 53.4% 63.5% 61.2% 56.0% 59.3% 59.6% 54.2% 56.0%
Overall college experience 66.7% 68.2% 68.1% 72.0% 70.4% 67.8% 65.6% 57.7%
Median 64.4% 68.2% 65.0% 68.0% 62.6% 66.7% 63.2% 57.7%
First College Year Experience SurveySatisfaction with College Life
9. Please rate your satisfaction with this institution on each of the aspects of college life listed below:
*The percentages shown reflect the selection from respondents who chose "Very Satisfied" or "Satisfied". Other response options were "Neutral", "Dissatisfied" and "Very Dissatisfied". Excludes those who chose "Can't Rate/No experience".
**Items in red reflect the highest category value.
Sacramento State Office of Institutional Research 4

Arts and Letters
BusinessEngineering & Computer
ScienceEducation
Health and Human Services
Natural Sciences &
Math
Social Sciences
Special Program/ Undecided
Understand what your professors expect of you academically
85.7% 80.3% 76.3% 72.0% 82.4% 84.4% 83.5% 82.1%
Develop effective study skills 57.1% 69.7% 58.0% 66.7% 57.1% 67.4% 65.6% 56.4%
Adjust to the academic demands of college 62.6% 60.6% 61.0% 60.0% 60.9% 68.9% 65.6% 63.6%
Manage your time effectively 44.0% 52.3% 47.1% 56.5% 48.4% 55.2% 55.2% 51.9%
Develop close friendships with:
Other students 57.8% 65.6% 63.6% 56.0% 57.4% 58.0% 56.8% 61.0%Students whose genders differ from your own
58.2% 63.6% 65.3% 48.0% 56.0% 62.9% 58.3% 61.5%
Students of a different racial/ethnic group 63.7% 76.6% 69.5% 68.0% 72.5% 76.1% 78.4% 76.6%
Utilize campus services available to students 73.0% 73.8% 71.8% 80.0% 81.7% 78.9% 81.3% 71.8%Median 60.4% 67.7% 64.4% 63.3% 59.1% 68.2% 65.6% 62.6%
**Items in red reflect the highest category value.
First College Year Experience SurveyAdjustment to College Life
4. Since entering this college, how has it been to…?
*The percentages shown reflect the selection from respondents who chose "Very Easy" or "Somewhat Easy". Other response options were "Somewhat Difficult" and "Very Difficult".
Sacramento State Office of Institutional Research 5
Arts and Letters
BusinessEngineering & Computer
ScienceEducation
Health and Human Services
Natural Sciences &
Math
Social Sciences
Special Program/ Undecided
I have felt discriminated against at this institution based on my race/ethnicity, socio-economic status, gender, religion, sexual orientation, political affiliation, or disability
2.7% 6.7% 5.7% 5.6% 4.7% 4.5% 7.4% 5.8%
In class, I have heard faculty express stereotypes based on race/ethnicity, socio-economic status, gender, religion, sexual orientation, political affiliation, or disability
18.1% 4.4% 9.6% 15.8% 16.9% 22.5% 10.9% 9.6%
The admission/recruitment materials portrayed this campus accurately
90.0% 88.9% 82.5% 76.2% 87.0% 82.0% 79.7% 84.4%
I see myself as part of the campus 80.2% 85.2% 79.3% 86.3% 81.8% 81.8% 79.5% 89.9%
Students' academic problems 90.2% 91.2% 95.1% 83.3% 87.9% 90.0% 90.9% 91.4%
Students' personal problems 49.4% 52.6% 61.8% 45.8% 55.8% 47.5% 53.4% 45.7%
Staff here are interested in:
Students' academic problems 90.2% 91.2% 89.1% 83.3% 86.9% 90.1% 84.1% 84.1%
Students' personal problems 60.5% 61.4% 66.7% 43.5% 57.0% 56.8% 54.0% 49.3%
There is a lot of racial tension on this campus 6.1% 10.5% 5.9% 16.7% 10.3% 6.2% 10.2% 8.6%
I have been able to find a balance between academics and extracurricular activities
65.9% 75.0% 69.6% 70.8% 76.2% 76.5% 80.5% 81.2%
My college experiences have exposed me to diverse opinions, cultures, and values
95.1% 87.5% 87.3% 87.5% 89.5% 85.2% 88.6% 95.5%
If asked, I would recommend this college to others
88.9% 94.7% 88.3% 87.5% 89.1% 91.4% 84.1% 97.1%
*These percentages reflect the selections from respondents who chose "Strongly Agree" or "Agree". Other response options were "Disagree" and "Strongly Disagree".**Items in red reflect the highest category value.
First College Year Experience SurveyCampus Climate
5. Please indicate the extent to which you agree or disagree with the following statements:
Faculty here are interested in:
Sacramento State Office of Institutional Research 6
Arts and Letters
BusinessEngineering & Computer
ScienceEducation
Health and Human Services
Natural Sciences &
Math
Social Sciences
Special Program/ Undecided
Turned in course assignments late 3.7% 1.8% 1.9% 8.3% 3.9% 2.5% 5.7% 4.2%
Contributed to class discussions 30.5% 21.4% 32.4% 43.5% 34.5% 40.7% 51.2% 33.8%Discussed course content with students outside of class
38.6% 45.6% 42.7% 25.0% 45.9% 51.3% 52.9% 42.9%
Skipped class 6.0% 12.3% 1.0% 4.2% 3.0% 2.5% 2.3% 1.4%
Received tutoring 3.7% 5.3% 5.9% 12.5% 10.4% 9.9% 7.1% 11.4%
Worked on a professor’s research project 11.3% 14.0% 13.6% 4.3% 13.8% 17.3% 11.9% 15.9%Turned in course assignments that did not reflect your best work
6.0% 7.1% 10.7% 4.2% 7.3% 10.0% 9.4% 7.0%
Had difficulty getting along with your roommate(s)/ housemate(s)
7.3% 3.6% 5.1% 4.3% 8.3% 7.5% 12.8% 8.5%
Received advice or guidance from your professor about your educational program
19.3% 15.8% 25.5% 16.7% 16.5% 22.2% 16.1% 19.7%
Witnessed academic dishonesty/cheating 2.4% 1.8% 3.9% 4.2% 5.2% 6.2% 4.6% 4.2%
Went home for the weekend 67.9% 66.7% 63.1% 58.3% 66.7% 74.1% 54.0% 63.4%Received advice/counseling from another student
12.2% 12.3% 18.4% 20.8% 19.7% 26.3% 18.2% 21.1%
Fell asleep in class 1.2% 3.6% 6.8% 0.0% 4.3% 6.3% 5.9% 5.6%
Had difficulty getting the courses you need 40.2% 26.3% 52.4% 62.5% 45.7% 52.5% 34.1% 46.5%Instant messaged/texted during class 20.5% 22.8% 13.6% 20.8% 18.2% 17.3% 21.6% 14.3%Worked with classmates on group projects during class
28.0% 26.3% 26.2% 12.5% 31.8% 38.3% 24.7% 32.4%
Worked with classmates on group projects outside of class
23.5% 24.6% 20.6% 20.8% 29.7% 38.3% 15.9% 25.4%
Accessed your campus library resources electronically
26.8% 26.3% 20.6% 16.7% 34.9% 37.0% 25.6% 36.6%
First College Year Experience SurveyStudent Activities
6. Since entering this college, how often have you…?
Sacramento State Office of Institutional Research 7
Arts and Letters
BusinessEngineering & Computer
ScienceEducation
Health and Human Services
Natural Sciences &
Math
Social Sciences
Special Program/ Undecided
First College Year Experience SurveyStudent Activities
6. Since entering this college, how often have you…?
Made a presentation in class 32.9% 39.3% 26.5% 37.5% 35.8% 42.0% 31.8% 36.6%Used the institution’s course catalog (paper or online)
41.5% 35.1% 38.2% 25.0% 35.9% 47.5% 29.5% 35.7%
*The percentages shown reflect the selection from respondents who chose "Frequently". Other response options were "Occasionally" and "Not at All".**Items in red reflect the highest category value.
Sacramento State Office of Institutional Research 8
Arts and Letters
BusinessEngineering & Computer
ScienceEducation
Health and Human Services
Natural Sciences &
Math
Social Sciences
Special Program/ Undecided
Dined or shared a meal 38.7% 46.3% 46.5% 54.2% 42.6% 46.8% 44.6% 45.6%Had meaningful and honest discussions about race/ethnic relations outside of class 24.7% 27.8% 23.7% 33.3% 28.3% 33.3% 34.1% 35.3%
Had guarded, cautious interactions 6.5% 27.8% 9.2% 20.8% 10.4% 11.7% 11.0% 16.4%
Shared personal feelings and problems 26.0% 29.6% 26.8% 45.8% 36.5% 43.6% 31.3% 38.2%
Had tense, somewhat hostile interactions 2.6% 9.4% 1.1% 4.2% 4.1% 0.0% 2.4% 10.3%Had intellectual discussions outside of class 28.6% 44.4% 39.2% 29.2% 35.1% 50.0% 40.2% 36.8%Felt insulted or threatened because of your race/ethnicity 1.3% 7.4% 1.0% 4.2% 3.2% 2.6% 4.9% 6.0%
Studied or prepared for class 51.3% 59.3% 60.2% 58.3% 55.4% 65.8% 61.4% 68.7%
Socialized or partied 27.3% 33.3% 24.7% 37.5% 28.8% 38.5% 32.5% 26.5%Attended events sponsored by other racial/ethnic groups 18.2% 18.5% 18.4% 12.5% 20.0% 25.6% 20.7% 19.1%*The percentages shown reflect the selection from respondents who chose "Very often" or "often". Other response options were "Sometimes", "Seldom" and "Never".
First College Year Experience SurveyInteraction among Racial/Ethnic Groups
7. To what extent have you experienced the following with students from a racial/ethnic group other than your own?
**Items in red reflect the highest category value.
Sacramento State Office of Institutional Research 9
Arts and Letters
BusinessEngineering & Computer
ScienceEducation
Health and Human Services
Natural Sciences &
Math
Social Sciences
Special Program/ Undecided
Ask questions in class 20.5% 29.1% 22.4% 41.7% 33.0% 28.2% 30.5% 30.9%
Support your opinions with a logical argument
45.3% 32.7% 45.4% 21.7% 37.9% 44.2% 35.4% 33.8%
Seek solutions to problems and explain them to others
36.4% 38.2% 37.1% 13.0% 41.3% 52.6% 33.7% 36.8%
Revise your papers to improve your writing 59.0% 45.5% 43.9% 52.2% 58.6% 69.2% 49.4% 54.4%Evaluate the quality or reliability of information you received
47.4% 46.3% 37.1% 47.8% 43.4% 53.2% 41.5% 50.7%
Take a risk because you felt you had more to gain
33.8% 30.9% 26.5% 21.7% 34.1% 35.1% 24.1% 28.4%
Seek alternative solutions to a problem 38.5% 38.2% 41.2% 34.8% 39.9% 46.8% 28.0% 41.2%
Look up scientific research articles and resources
39.0% 21.8% 26.0% 47.8% 37.7% 42.9% 28.0% 37.3%
Explore topics on your own, even though it was not required for a class
30.3% 27.3% 23.5% 21.7% 26.7% 41.6% 33.7% 25.0%
Accept mistakes as part of the learning process
56.6% 49.1% 57.7% 43.5% 59.5% 64.1% 49.4% 54.5%
Seek feedback on your academic work 39.0% 52.7% 40.2% 34.8% 55.0% 57.1% 34.1% 54.4%
Integrate skills and knowledge from different sources and experiences
49.4% 47.3% 55.1% 39.1% 52.0% 65.4% 42.7% 47.1%
Median 39.0% 38.2% 38.7% 37.0% 40.6% 49.7% 33.9% 39.2%
First College Year Experience SurveyAcademic and Intellectual Experience
8. How often in the past year did you…?
*The percentages shown reflect the selection from respondents who chose "Frequently". Other response options were "Occasionally" and "Not at All".**Items in red reflect the highest category value.
Sacramento State Office of Institutional Research 10
Arts and Letters
BusinessEngineering & Computer
ScienceEducation
Health and Human Services
Natural Sciences &
Math
Social Sciences
Special Program/ Undecided
Definitely yes 26.6% 34.5% 29.3% 39.1% 42.1% 29.5% 31.3% 30.9%Probably yes 53.2% 40.0% 49.5% 34.8% 38.5% 46.2% 39.8% 47.1%Probably not 7.6% 14.5% 10.1% 21.7% 10.0% 14.1% 14.5% 11.8%Definitely not 2.5% 3.6% 4.0% 0.0% 5.4% 2.6% 4.8% 1.5%Not sure yet 10.1% 7.3% 7.1% 4.3% 4.1% 7.7% 9.6% 8.8%11. What do you think you will be doing in Fall 2016?Attending Sacramento State 96.2% 87.3% 88.9% 95.7% 90.5% 98.7% 92.8% 89.6%Attending another institution 3.8% 3.6% 3.0% 4.3% 3.2% 0.0% 2.4% 1.5%Don’t know/have not decided yet 0.0% 5.5% 8.1% 0.0% 5.4% 1.3% 4.8% 9.0%Not attending any institution 0.0% 3.6% 0.0% 0.0% 0.9% 0.0% 0.0% 0.0%12. Think about your current abilities and tell us how strong or weak you believe you are in each of the following areas:Intellectual and practical skills (including inquiry and analysis, critical thinking, and information literacy) 55.7% 63.0% 61.6% 34.8% 54.1% 71.8% 60.2% 47.0%Knowledge of a particular field or discipline 56.4% 50.0% 58.2% 47.8% 57.5% 63.6% 50.0% 48.5%Knowledge of people from different races/cultures 37.7% 43.6% 42.4% 39.1% 43.2% 44.9% 53.1% 39.7%Understanding of the problems facing your community 44.9% 41.8% 46.9% 39.1% 51.8% 55.8% 60.2% 48.5%Understanding of national issues 48.1% 35.2% 48.5% 26.1% 35.0% 38.5% 44.6% 36.8%Understanding of global issues 43.0% 32.7% 47.5% 13.0% 29.7% 41.0% 44.6% 31.3%Ability to conduct research 47.4% 49.1% 55.6% 30.4% 52.0% 61.5% 50.6% 49.3%Ability to work as part of a team 79.5% 66.0% 69.8% 68.2% 78.5% 84.4% 76.8% 73.5%Critical thinking skills 61.5% 56.4% 65.7% 50.0% 61.8% 76.9% 66.3% 60.3%Problem-solving skills 70.5% 69.1% 72.2% 47.8% 68.0% 79.2% 68.7% 67.7%Foreign language ability 46.2% 41.8% 39.4% 47.8% 48.2% 59.0% 41.0% 50.0%Median 48.1% 49.1% 55.6% 39.1% 52.0% 61.5% 53.1% 48.5%
**Items in red reflect the highest category value.
*The percentages shown reflect the selection from respondents who chose "A major strength" or "Somewhat strong". Other response options were "Average", "Somewhat weak" and "A major weakness".
First College Year Experience SurveyOverall Experience and Current Abilities
10. If you could make your college choice over, would you still choose to enroll at Sacramento State?
Sacramento State Office of Institutional Research 11
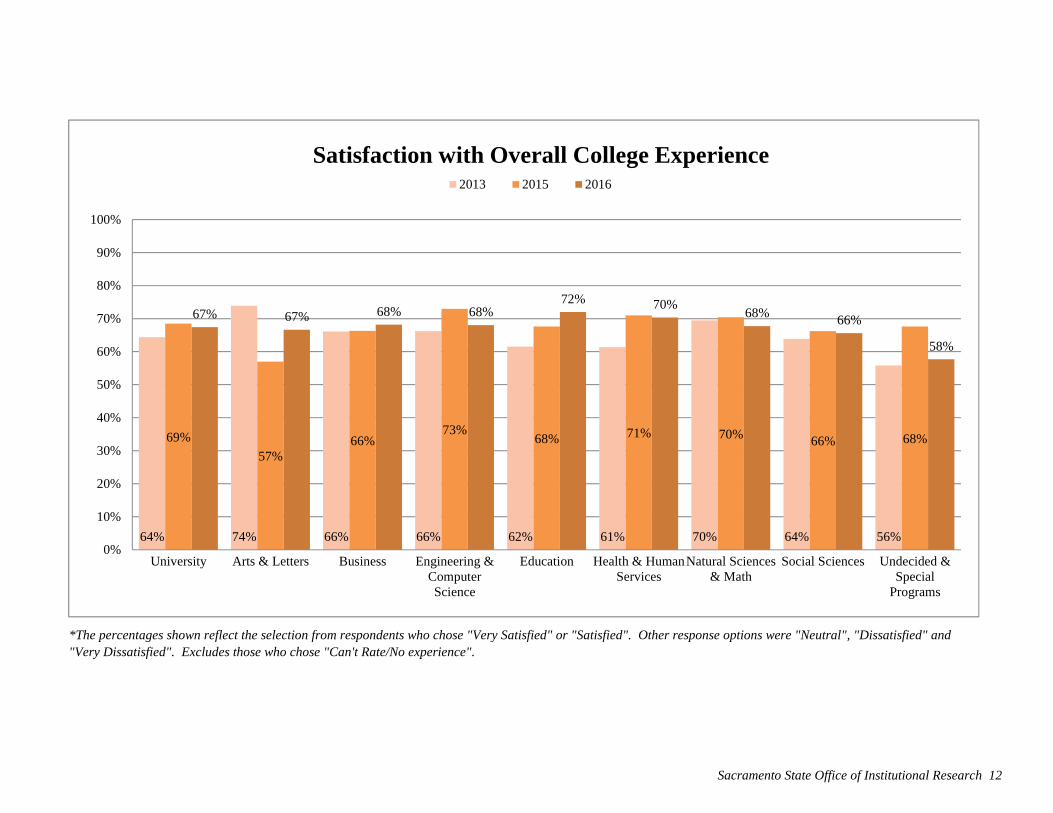
*The percentages shown reflect the selection from respondents who chose "Very Satisfied" or "Satisfied". Other response options were "Neutral", "Dissatisfied" and "Very Dissatisfied". Excludes those who chose "Can't Rate/No experience".
64% 74% 66% 66% 62% 61% 70% 64% 56%
69%
57%66%
73%68% 71% 70% 66% 68%
67% 67% 68% 68%72% 70%
68% 66%
58%
0%
10%
20%
30%
40%
50%
60%
70%
80%
90%
100%
University Arts & Letters Business Engineering &ComputerScience
Education Health & HumanServices
Natural Sciences& Math
Social Sciences Undecided &Special
Programs
Satisfaction with Overall College Experience2013 2015 2016
Sacramento State Office of Institutional Research 12
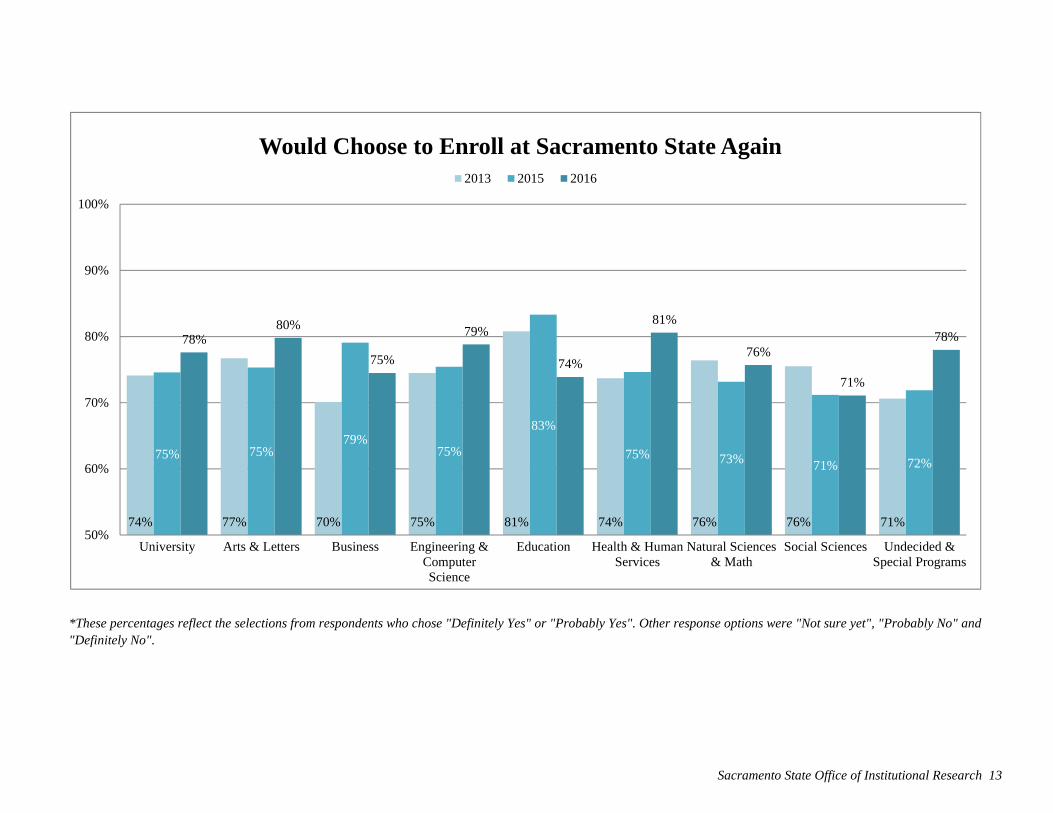
*These percentages reflect the selections from respondents who chose "Definitely Yes" or "Probably Yes". Other response options were "Not sure yet", "Probably No" and "Definitely No".
74% 77% 70% 75% 81% 74% 76% 76% 71%
75% 75%79%
75%
83%
75% 73% 71% 72%
78%80%
75%
79%
74%
81%
76%
71%
78%
50%
60%
70%
80%
90%
100%
University Arts & Letters Business Engineering &ComputerScience
Education Health & HumanServices
Natural Sciences& Math
Social Sciences Undecided &Special Programs
Would Choose to Enroll at Sacramento State Again2013 2015 2016
Sacramento State Office of Institutional Research 13