Embed Size (px)
Citation preview

FIRST ESTIMATES OF COVARIANCE FUNCTIONS FOR LIFETIME GROWTH OFANGUS CATTLE
Karin Meyer
Animal Genetics and Breeding Unit1, University of New England, Armidale, NSW 2351
SUMMARYEstimates of covariance functions for weights of Angus cattle from birth to 3000 days of age wereobtained using Bayesian analysis. Data consisted of records in 69 herds with at least 50 mature cowweights, and records in 6 additional herds with 60% or more animals having at least four weights,551,259 records on 197,915 animals in total. The model of analysis fitted contemporary groups andcubic regressions on orthogonal polynomials of age nested within sex, birth type, dam age class andlactation status as fixed effects. Random effects fitted were cubic and quartic regressions on orthogo-nal polynomials of age for animals’ direct genetic and permanent environmental effects, and quadraticregressions, restricted to 0 to 600 days of age, for maternal genetic and environmental effects. Mea-surement error variances were modelled through a step function with 32 classes, yielding 69 covariancecomponents to be estimated.Keywords : Beef cattle, growth, covariance function, genetic parameters
INTRODUCTIONRandom regression (RR) analyses have been used to model growth of beef cattle from birth to abouttwo years of age (Albuquerque and Meyer, 2001; Meyer, 2002a). Genetic evaluation systems for beefcattle, such as BREEDPLAN however, consider weights of mature cows in addition. Ideally, weightsof animals at all ages are to be treated as ’repeated’ records of the same trait, and modelled as a singlecurve. Analogously, covariances for lifetime growth are summarised by one covariance function foreach source of variation. This paper presents a first attempt at estimating such covariance functions forgrowth of Australian Angus cattle.
MATERIAL AND METHODSData. Raw data comprised more than 1.6 million weights until 2 years of age, and pedigree informationfor 0.9 million animals, but only 34,302 records for weights of mature cows. After initial edits, meansand standard deviations (SD) for ages at recording, grouped in 7-day intervals were calculated. Weightsup to 3000 days of age were extracted for all animals in 69 herds, which had at least 50 mature cowweight records, and 6 additional herds with more than 50 animals in which at least 60% of animalshad 4 or more observations. Observations more than 2.5 SD from the respective, weekly mean andrecords clearly ’out of sequence’, i.e. records taken more than 45 days apart and corresponding to adaily growth rate less than -1 or greater than 2.5 kg/day since the previous weighing were disregarded.Only mature cow weight (MCW) records for which a matching weaning weight of the calf was foundwere retained.
Data structure, This yielded a total of 551,259 records on 197,915 animals in total, with a meanweight of 269.0 kg and mean age of 323.2 days. Birth weight was recorded for 126,045 animals.
1AGBU is a joint venture of NSW Agriculture and UNE

Age (days)
No.
reco
rds
x 10
00
100 300 500 700
05
1015
20
100
300
500
700
Age (days)1000 1500 2000 2500 3000
01
2
100
300
500
700
Wei
ght (
kg)
Figure 1. Numbers of records (�) and means weights(•) for ages at recording in 10 day intervalsup to 2 years of age (left), and 30 day intervals for mature cow weights (right).
Figure 1 shows the distribution of weights over other ages at recording, together with correspondingmeans. There were 34,216, 58,957, 46,044, 40,506 and 12,733 animals with 1, 2, 3, 4 and 5 records,respectively, and 5,459 animals had 6 or more weights recorded, up to a maximum of 11. Animalswith records were progeny of 5,722 sires and 71,675 dams. Pedigree information for parents not inthe data was obtained for up to 4 generations backwards, resulting in 232,779 animals in the analysis.Whilst only 30% of animals in the data had 4 or more records themselves, 30,239 and 113,519 of theremainder had a parent or a sib, respectively, with at least 4 records, i.e. at least 85% of animals in thedata had sufficient information available to allow a cubic polynomial to be fitted.
Analyses. Estimates of (co)variance components were obtained by Bayesian analysis, employing aGibbs sampling algorithm via program RRGIBBS (Meyer, 2002b). Two Markov chains with 160,000and 170,000 samples, respectively, were drawn, assuming flat priors. Variances and genetic parametersfor ages in 10 day intervals were calculated for each sample. Estimates were obtained as posteriormeans, disregarding the first 30,000 samples in each chain as “burn-in” period.
Random effects.The model of analysis fitted a RR on Legendre polynomials (LP) of age at recordingfor each random effect. A cubic (4 coefficients) and quartic (5 coefficients) polynomial was fittedfor direct genetic (A) and permanent environmental (R) effects, respectively. Maternal genetic (M)and permanent environmental (C) effects were modelled through quadratic regressions, restricting theireffect to ages from 0 to 600 days. Pedigrees for direct and maternal effects were “pruned” separately,treating any animals without a direct expression and pedigree links to only one other animal as ifthey were unknown. This left 221,757 direct and 75,853 maternal genetic effects. Residuals wereconsidered independently distributed with heterogeneous measurement error variances (σ2
i ). Changesin σ2
i with age were modelled as a step function with 32 classes (0, 1–30,. . ., 271–300, 301–360,. . .,721–780 and 781–820 days). This gave a total of 69 covariance components to be estimated.
Fixed effects. Changes in mean with age were modelled through fixed, cubic regressions on LP ofage, nested within sex, dam age class (in years, treating ages> 9 years as one class), birth type (sin-gle vs. twin) and calf number× age subclass (7 classes). In addition, contemporary groups (CG)were fitted as cross-classified fixed effects (43,548 levels). CG were defined as herd-sex-management
Age (days)0 1000 2000 3000
01
23
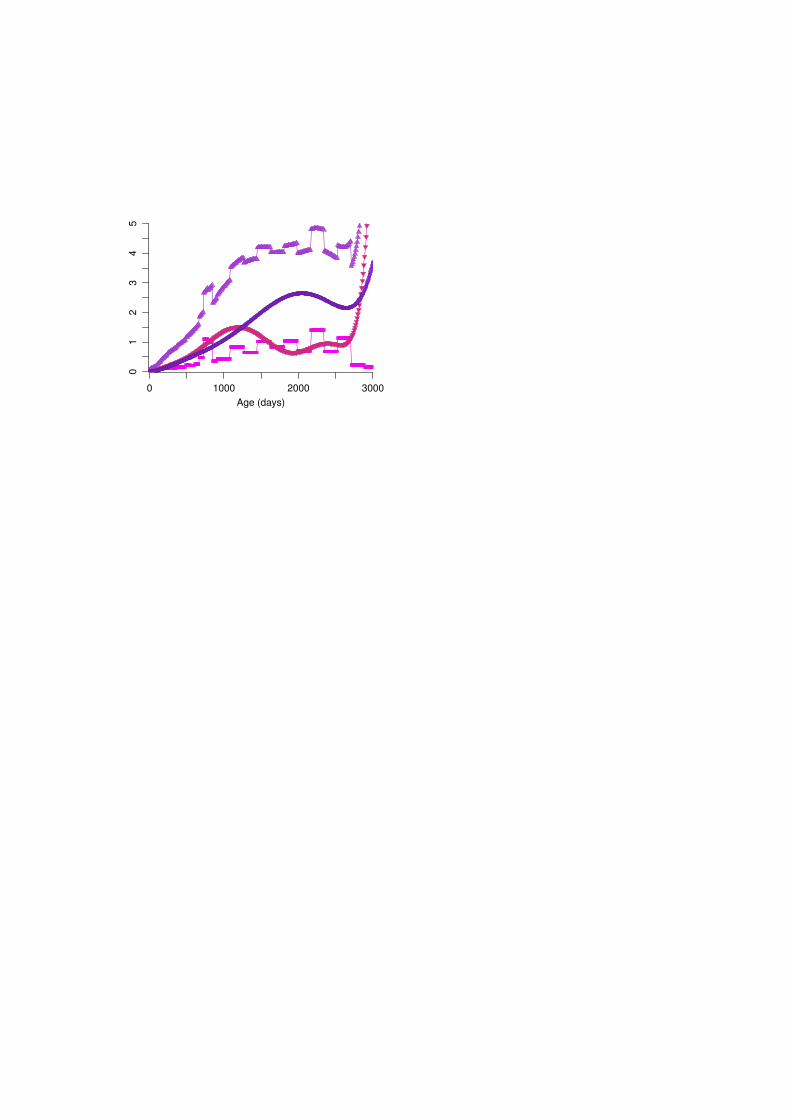
45
Figure 2. Estimates of variance components (Nphenotypic, • direct genetic,H direct perma-nent environmental, and� measurement er-ror; in 1000 kg2)
Age (days)0 1000 2000 3000
00.
20.
40.
60.
8Figure 3. Direct heritability ( •) and propor-tion of permanent environmental effects (H)together with 95% highest posterior densityregions (shaded areas)
group-year/month of weighing subclasses for birth weights, and herd-sex-management group-date ofweighing subclasses for other weights till 2 years. To reduce the range of ages compared directly, CGclasses were further subdivided applying an “age slicing” of 45 days up to 300 days, and 60 days forhigher ages. CG for MCW records were defined as herd of origin-herd-lactation status-managementgroup-date of weighing subclasses.
RESULTS AND DISCUSSIONFigure 2 shows estimates of phenotypic (σ2
P), direct genetic (σ2A), direct permanent environmental (σ2
R)and measurement errorσ2
i variances. As observed in other studies, estimates for the highest ages withleast observations, from about 2800 days in this case, were implausible. In particular, the variancefunction forσ2
R showed a drastic increase. Estimates ofσ2i fluctuated between age classes, with a peak
between 720 and 840 days of age, i.e. ages in the transition period between late final weights and earlyMCW and very few records, and an erratic decline at the highest ages, compensating for the excessivevariation ’taken up’ by the covariance function forσ2
R. Alternatively, seasonal differences as observedfor MCW in Western Australian data (Meyer, 2000) cannot be ruled out - whilst most MCW recordscorresponded to spring calvings, there was a proportion of records for autumn calvers. Phenotypicvariances for MCW of 3500 to 4000 kg2 were higher than values reported for Angus (Johnstonet al.,1996), but in line with estimates of 3189 kg2 and 4354 kg2 for Polled Hereford and Wokalup cows inthe Wokalup selection experiment (Meyer, 1995).
Direct heritabilities (h2), shown in Figure 3, decreased sharply from 0.40 at birth to 0.10, and thenincreased gradually with age, to 0.25 at 200, 0.35 at 400 and 0.38 at 600 days, and values above 0.50for MCW. Similarly low h2 for early weights have been reported byAlbuquerque and Meyer(2001);Meyer (2001, 2002a). Estimates for MCW from 1500 to 2800 days ranged from 0.48–0.66 with amean of 0.57, higher than estimates of 0.43–0.47 for Australian Angus from a repeatability modelanalysis (Johnstonet al., 1996), but comparable with ah2 of 0.59 from an analysis of mature weightof Angus estimated as the parameter of Brody’s curve, when including weaning weight and repeated

Age (days)100 300 500
0
0.1
0.2
Figure 4. Estimates of maternalheritability ( •) and permanentenvironmental effects (N)
MCW records (Kapset al., 1999). The importance of direct, per-manent environmental effects declined ash2 increased, leadingto an almost constant repeatability from about 900 to 2800 days(mean 0.79).
Estimates of maternal heritabilities (m2) and permanent environ-mental effects (c2) are shown in Figure 4. Both peak around 200days, with values of 0.06 form2 and 0.15 forc2 in good agreementwith previous weaning weight estimates for Angus, and a gradualdecline to almost zero at 600 days. Fitting a quadratic rather thana cubic polynomial for maternal effects and restricting their influ-ence to 600 days yielded more plausible estimates for postweaningweights than a previous, unrestricted analysis (Meyer, 2002a).
Figure 5 shows contour lines for direct genetic (rA) and phenotypic (rP) correlations, in steps of 0.05.Estimates ofrA declined gradually with differences in age, with an extended area ofrA > 0.8 betweenages up to 800 and above 2500 days presumably spurious. Except for early ages, estimates ofrA
between records 500 to 600 days apart were 0.9 or higher. Estimates ofrP were considerably lower,with few values 10 days apart above 0.8, but showed a similar pattern of decline. Angularity in contourlines was due to the step function used to model temporary environmental variances.
CONCLUSIONSOverall estimates showed reasonable agreement with literature results, suggesting that changes in co-variances between weights of beef cattle over a large range of ages can be modelled adequately bylifetime covariance functions. There were relatively few records for mature cow weights, resulting inlarge confidence regions for estimates for ages greater than 1200 days.
0 1000 2000 3000
010
0020
0030
00
Figure 5. Estimates of direct genetic(upper triangle) and phenotypic (lowertriangle) correlations
REFERENCESAlbuquerque, L. G. and Meyer, K. (2001)J. Anim. Sci.
79:2776–2789.Johnston, D. J., Chandler, H. and Graser, H.-U. (1996)
Aust. J. Agric. Res.47:1251–1260.Kaps, M., Herring, W. O. and Lamberson, W. R. (1999)
J. Anim. Sci.77:569–574.Meyer, K. (1995)Livest. Prod. Sci.44:125–137.Meyer, K. (2000)Livest. Prod. Sci.65:19–38.Meyer, K. (2001)Genet. Select. Evol.33:487–514.Meyer, K. (2002a)CD-ROM 7th World Congr. Genet.
Appl. Livest. Prod.Comm. No. 11–01.Meyer, K. (2002b)CD-ROM 7th World Congr. Genet.
Appl. Livest. Prod.Comm. No. 28–27.
ACKNOWLEDGEMENTSThis work was supported by Meat and Livestock Aus-tralia under grant BFGEN.100 .