Embed Size (px)
Citation preview

First Ever ROZ (Residual Oil Zone)
SYMPOSIUM
Midland College Advanced Technology CenterOctober 22, 2009

Symposium Objectives
•
Describe the Progress of Understanding the Origins and Distributions of ROZs
in the PB
•
Show Some Case Histories•
‘Flip the Paradigm’
–
from Zones to be Avoided
to Intervals of Opportunity•
Potential Magnitude of the Prize
•
Gather New Anecdotal Evidence by Learning from the Audience (Breakout Sessions)
•
Begin to Chart a Future for the Effort

Welcome and Introductions
•
Steve and Bob, Edith
•
Chevron and Legado
•
The Research Team:–
Phil, Arcadis
(Dave and Steve), Saswati,
Jimmy, Bob K., Hoxie
•
Valued Contributors–
Bill, Blake, Lon
•
And you!!!
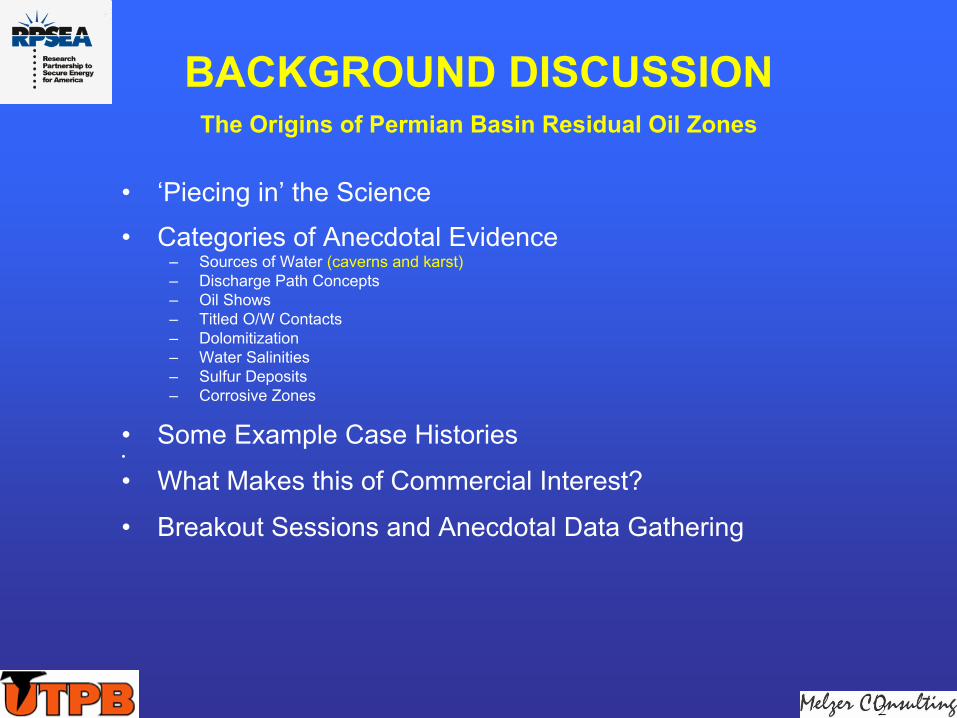
BACKGROUND DISCUSSION The Origins of Permian Basin Residual Oil Zones
•
‘Piecing in’
the Science
•
Categories of Anecdotal Evidence–
Sources of Water (caverns and karst)–
Discharge Path Concepts–
Oil Shows–
Titled O/W Contacts–
Dolomitization–
Water Salinities–
Sulfur Deposits–
Corrosive Zones
•
Some Example Case Histories•
•
What Makes this of Commercial Interest?
•
Breakout Sessions and Anecdotal Data Gathering

THE ROZ BACKGROUND
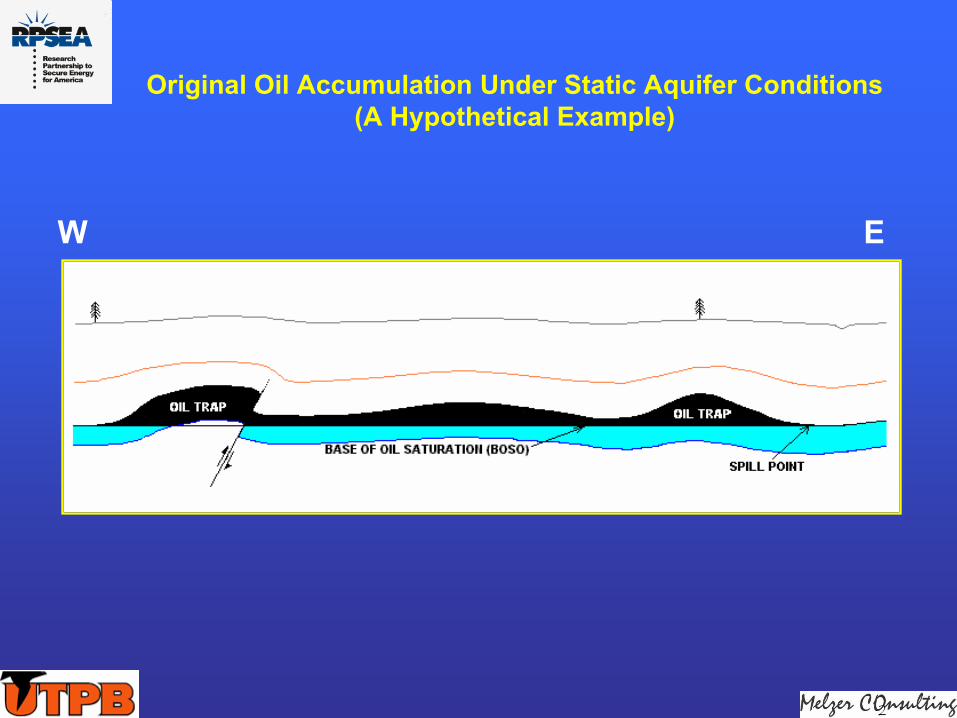
Original Oil Accumulation Under Static Aquifer Conditions
(A Hypothetical Example)
W E
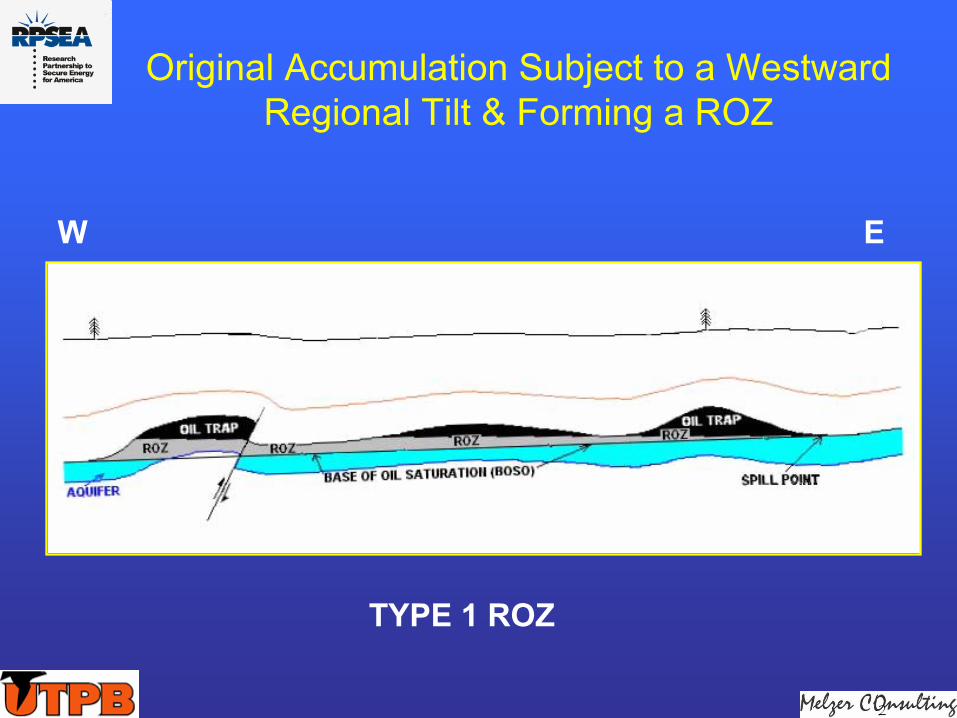
Original Accumulation Subject to a Westward Regional Tilt & Forming a ROZ
W E
TYPE 1 ROZ
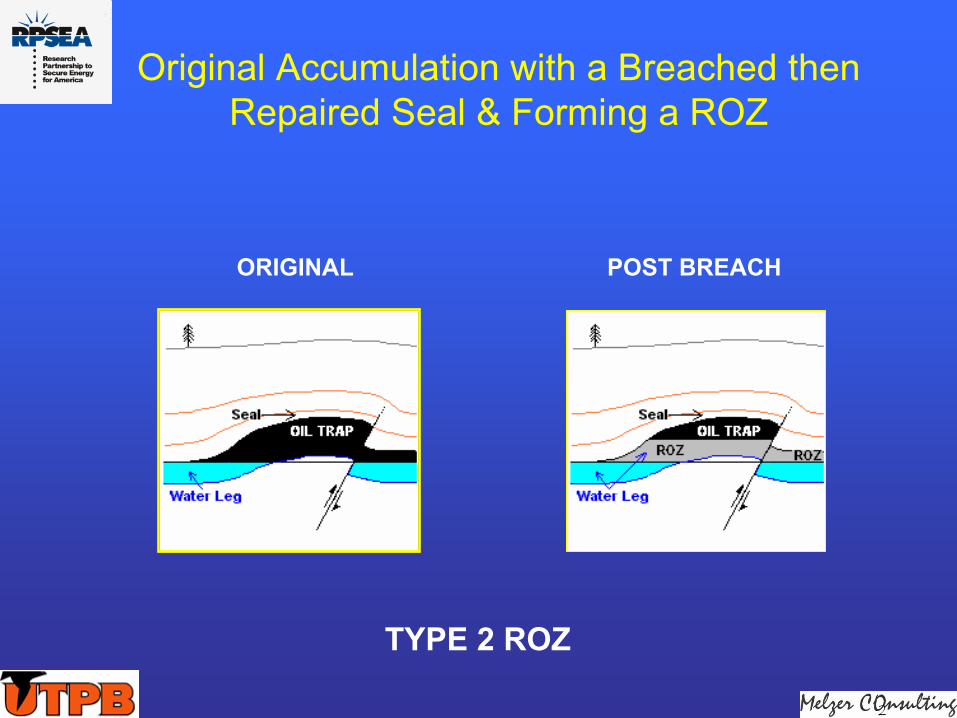
Original Accumulation with a Breached then Repaired Seal & Forming a ROZ
ORIGINAL POST BREACH
TYPE 2 ROZ
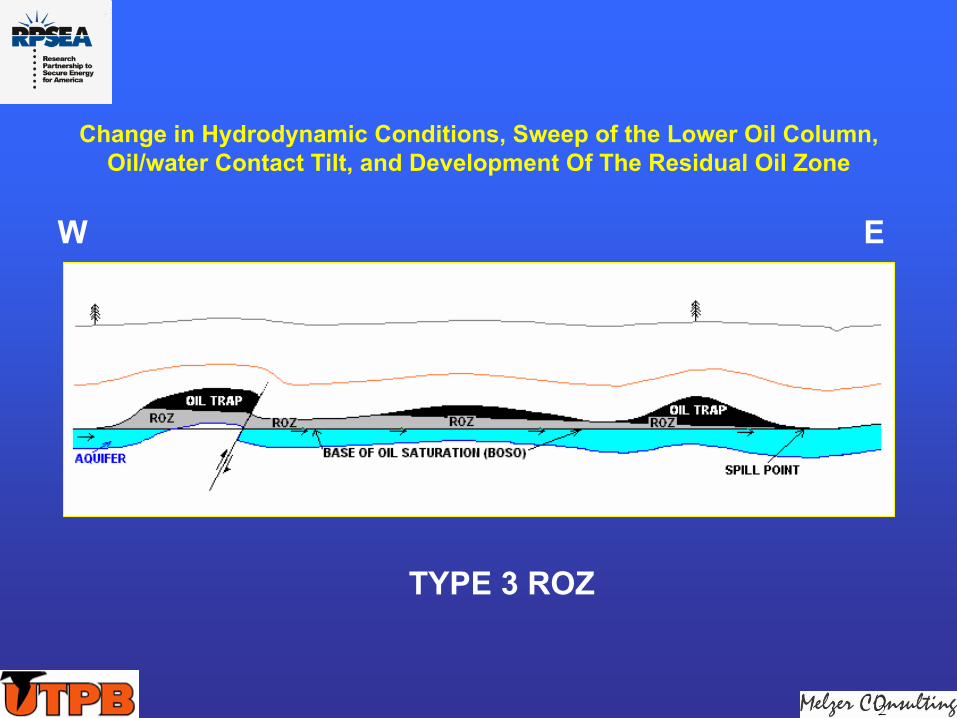
Change in Hydrodynamic Conditions, Sweep of the Lower Oil Column, Oil/water Contact Tilt, and Development Of The Residual Oil Zone
TYPE 3 ROZ
W E

Attributes of the ROZ Types
So Let’s Examine the Evidence for Type 3 in the Permian Basin

First, Let’s Look at OWC Tilt

Seminole (San Andres) Field
O/W Contact Structure Map –
Adapted from Texas Railroad Commission Unitization Filings, 1969
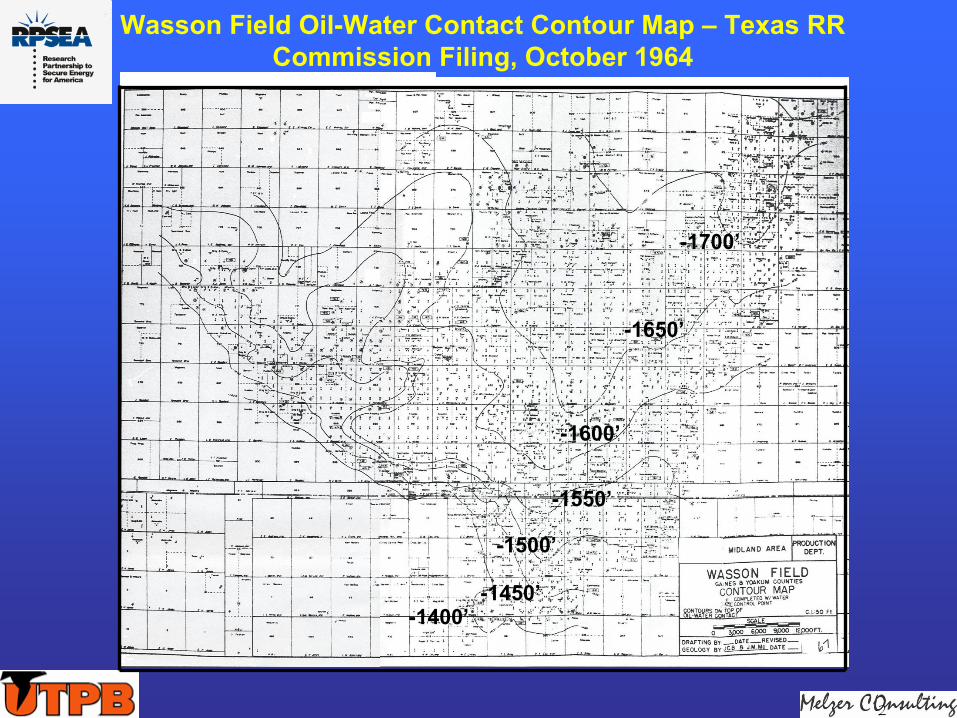
-1700’
-1650’
-1600’
-1550’
-1500’
-1450’-1400’
Wasson Field Oil-Water Contact Contour Map –
Texas RR Commission Filing, October 1964

Wasson Field Area O/W Contact Structural Contours*
* From Ref 6

Wasson and Seminole are Huge Fields We Know a Lot About
•
Are They Unique?–
Tilted OWCs?
–
Very Thick ROZs?–
In being Exploited in the ROZ?
•
We Will Make a Case That They are Not
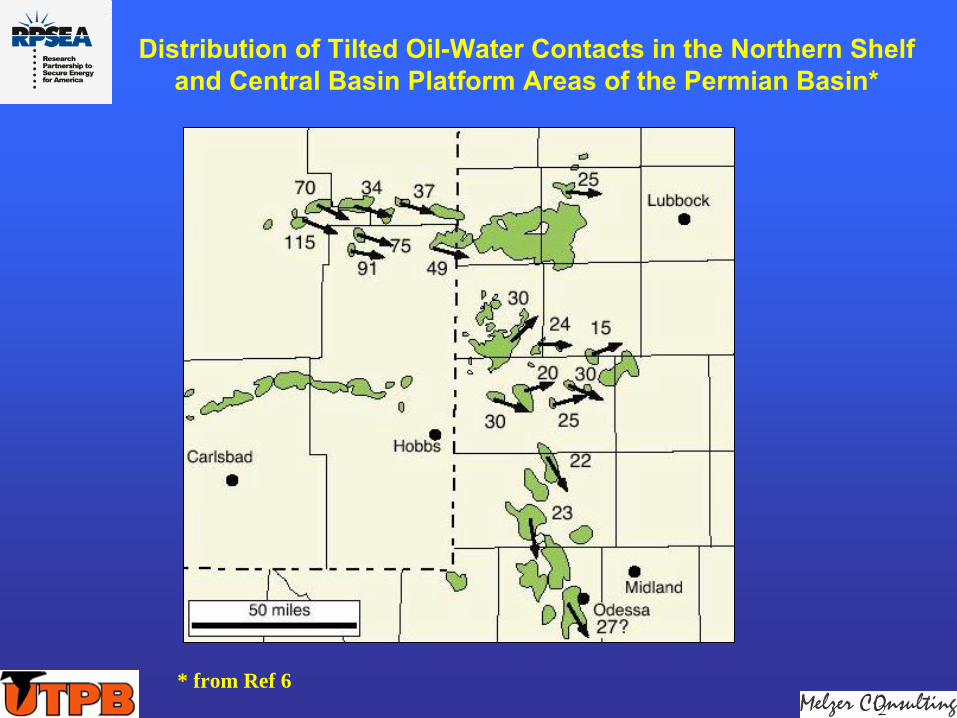
Distribution of Tilted Oil-Water Contacts in the Northern Shelf and Central Basin Platform Areas of the Permian Basin*
* from Ref 6

Other Anecdotal Evidence
•
Mutual Occurrence of Water, Oil and a Source of Sulfur–
Water
–
Flushed Oil (Replenishing the Food for the Anaerobes)
–
Sulfur (product-of-reaction, residue)•
As the Source of H2
S (and Sour Oil)•
As Proof of Oil ‘Passing By’
& Fairways of Oil
Movement•
As Proof of Oil ‘Consumption’
THE FLUSHING MEDIUM
•
Updip
Origins–
Surface Caverns–
Karst
•
Evidence of “Connection”
to Petroleum Sources and Entrapments–
Back to the Fairway Concept•
ROZs•
Sulfur?•
As Facilitator of Pervasive Dolomitization
•
Discharge Concepts–
Lineaments–
Outcrops

Lechiguilla
Cave Map
Crossectional
View
Plan View
DISCHARGE PATH CONCEPTS
•
If we have a source of the water, we have to have discharge points as well
•
Direction of OWC tilt is evidence of Movement Direction (we’ll come back to this)
•
Do we have other pathway clues?
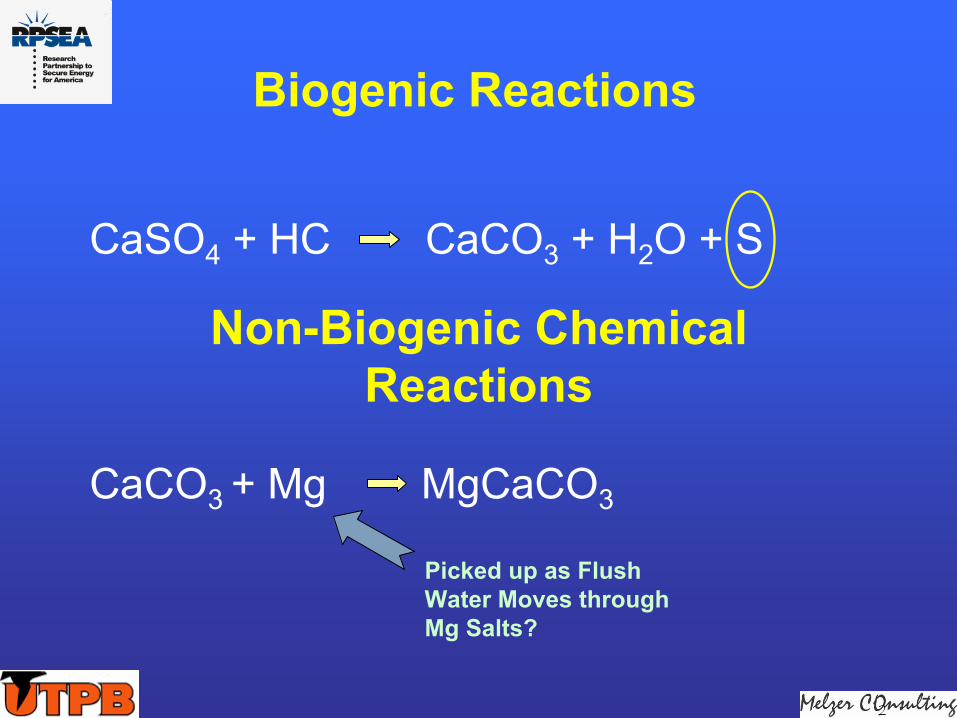
CaSO4
+ HC CaCO3
+ H2
O + S
CaCO3 + Mg MgCaCO3
Biogenic Reactions
Picked up as Flush Water Moves through Mg Salts?
Non-Biogenic Chemical Reactions
Sulfur in the ROZ?
Core on Display

The ‘Heel of the Boot’ of the Central Basin Platform
San Andres Water Salinities and Sulfur Deposits

What About Other Evidence?
How about Using Trends of Producing San Andres Fields?

SE NM San Andres Dolomitization
Trends (First Draft)
Slaughter Fairway
Roswell Fairway
Artesia Fairway
Karsted
Pgs (U. San Andres)
Outcrop
Bottomless Lakes Recharge Field
Ref: Future Petroleum Provinces in New Mexico –
Discovering New Reserves, Philip R. Grant, Jr. and Roy W. Foster, NM Bur of Mining & Mineral Resources, 1989
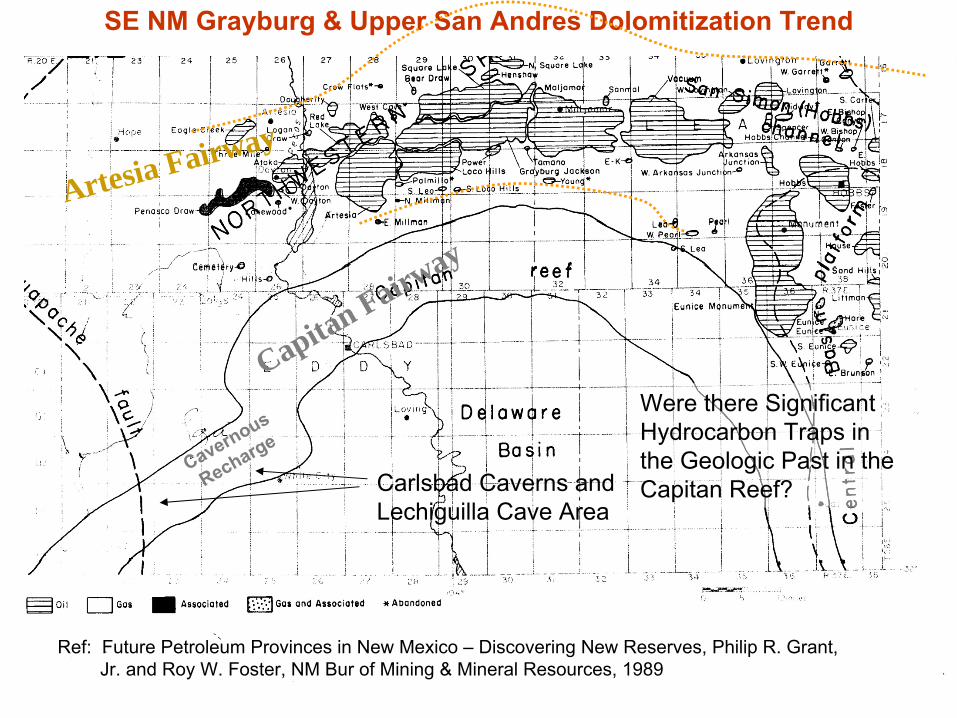
SE NM Grayburg
& Upper San Andres Dolomitization
Trend
Artesia Fairway
Capitan Fairway
Ref: Future Petroleum Provinces in New Mexico –
Discovering New Reserves, Philip R. Grant, Jr. and Roy W. Foster, NM Bur of Mining & Mineral Resources, 1989
Cavernous
Recharge
Carlsbad Caverns and Lechiguilla
Cave Area
Were there Significant Hydrocarbon Traps in the Geologic Past in the Capitan Reef?

Do These Fields have Tilted OWCs?

Distribution of Tilted Oil-Water Contacts in the Northern Shelf and Central Basin Platform Areas of the Permian Basin*
There are More Fields to Examine, More Work to be Done
* from Ref 6

OIL SHOWS
•
Residual Oil in Cuttings•
Mud log Utility

Oil, Gas and Water Saturation for Continuous Phase and Residual Hydrocarbon Oil Shows*
OIL
GAS
WATER
OIL
GAS
WATER
At Surface %
12 40 48
12 40 48
In Core Barrel %
30 0 70
30 0 70
In Reservoir
%
70 0 30
30 0 70
CONTINUOUS PHASE
RESIDUAL OIL
* Schowalter, T.T, and Hess, P.D. (1982), Interpretation of Subsurface Hydrocarbon Shows, AAPG Bull Vol
66, No 9, Sep 82, pp 1302-1327

TILTED OIL/WATER CONTACTS
•
Previous Work•
Sponsor’s Fields
•
New Field Evidence
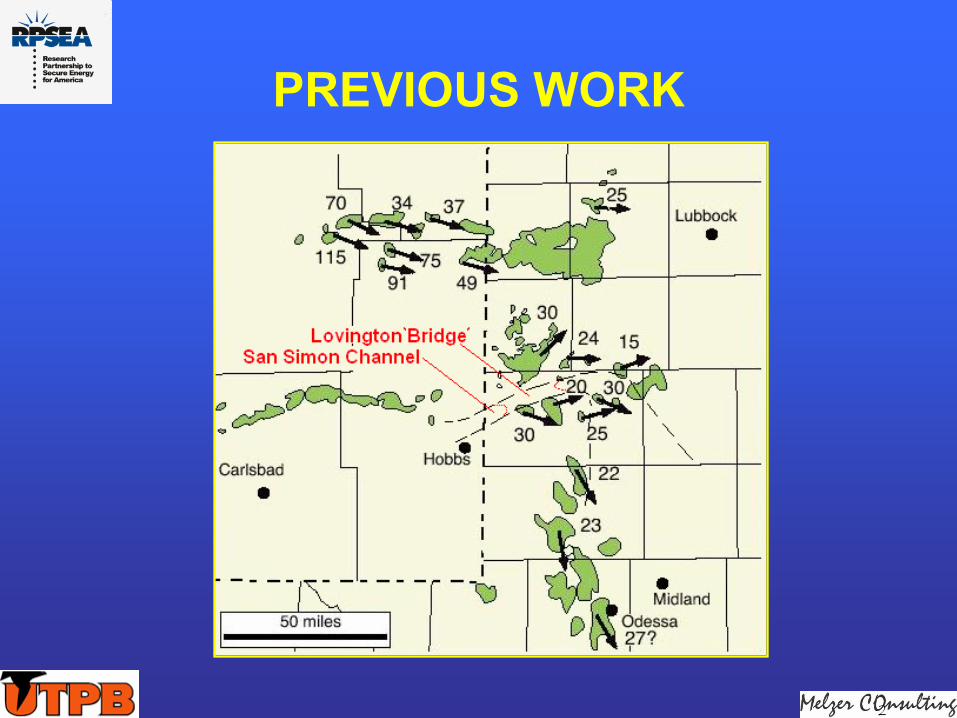
PREVIOUS WORK

PLANNED WORK

DOLOMITIZATION
•
Magnesium Rich Waters•
Porosity Enhancements
•
Pervasive Zonations•
Geological Timing (Staged Dolomitization?)
•
…..and Thoughts on Wetting

Typical Log Character
•
Spontaneous Potential Logs Illustrate Consistent Leftward Shift through the entire ROZ interval
•
Porosity and Electric Logs Show Leftward (baseline type) Shift through the Interval
•
Log Calculations Result in Sor
values in the range of 10-50%
•
Transition zones at top and bottom are common

DOLOMITIZATION & PERVASIVE ZONATION (1)
Vt
= Total Volume = Vs
(Vol
solids) + Vf
(Vol
water)
and V = m
/ρ
where m = mass and ρ
= density
Assume porosity saturated with fresh water (ρf
= ρw
= 1 gm/cc)
For a unit mass of 1, Vt
= (1-Øi
)/ρs
+ Øi
/ρw
Assume initially that is all limestone (ρs
= 2.71 gm/cc) and then becomes completely replaced by dolomite (ρs
= 2.87 gm/cc). Say that the Øi
for limestone rock was 8%)
Vt
= (1-.08)/2.71 + .08/1
Vt
= 0.34 + 0.08 = 0.42 = Total Volume of the unit mass

DOLOMITIZATION & PERVASIVE ZONATION (2)
Now, Conserving Volume with complete dolomite replacement of limestone solids –
what is new Ø
(Øn
)?
0.42 = (1-Øn
)/ρs
+ Øn
/ρw
ρs
*(0.42) = 1-Øn
+ ρs
*Øn
/ρw
ρs
*(0.42) –1 = (ρs /ρw
-1
)*Øn
or
Øn
= {ρs
*(0.42) –1 } / (ρs /ρw -1
)
Øn
= (0.42*2.87-1) / (2.87/1 -
1)
Øn
= 0.21/1.87 = 0.109 –
10.9%
POROSITY ENHANCEMENT OF 10.9-8.0 = 2.9%
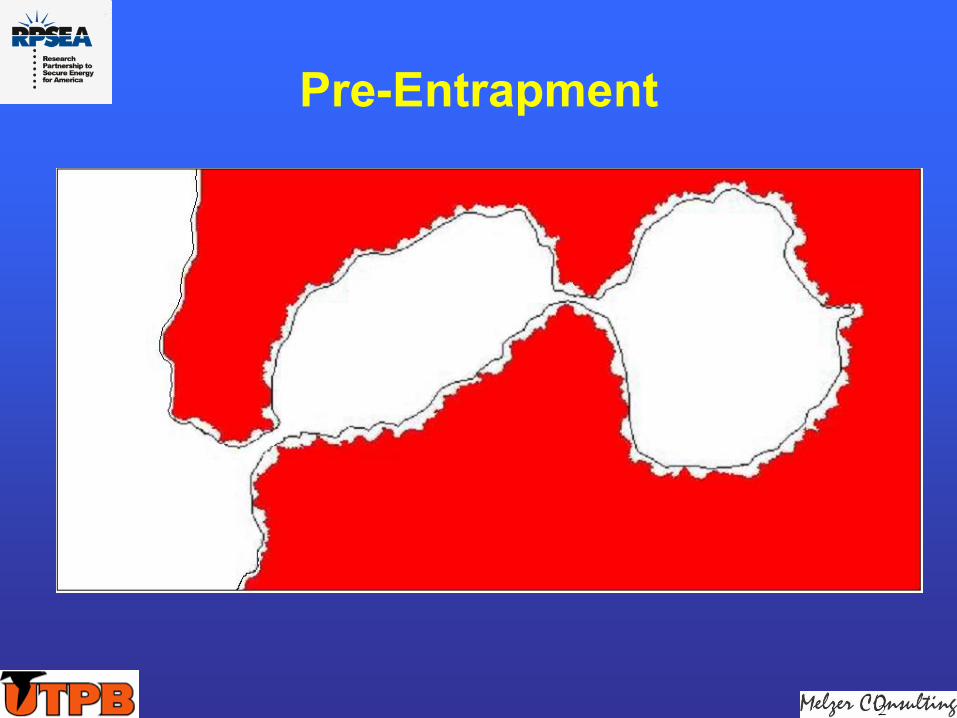
Pre-Entrapment
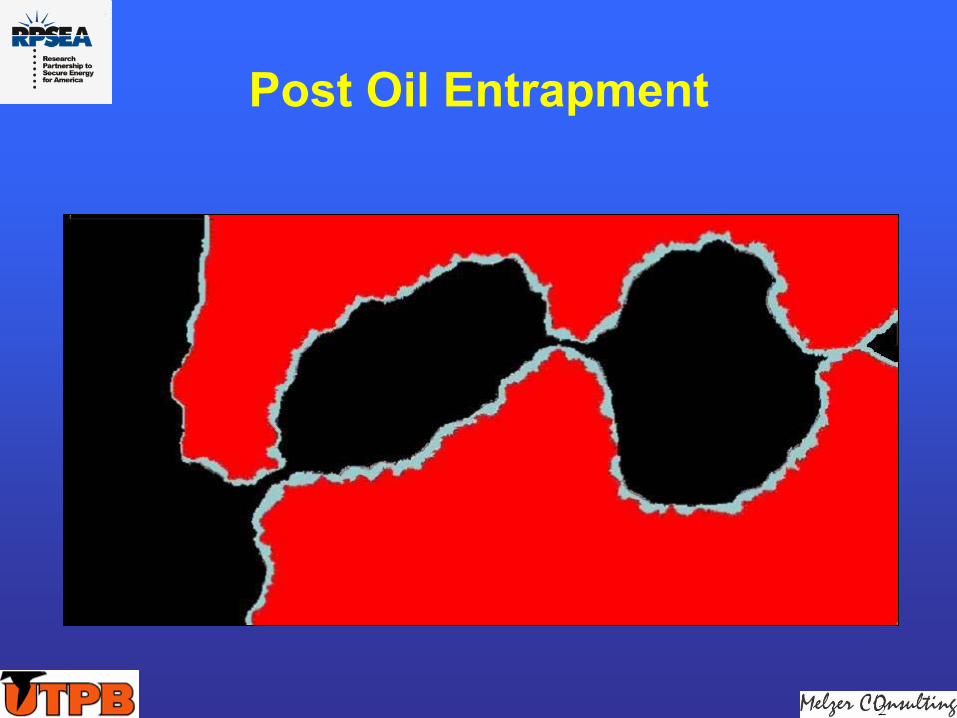
Post Oil Entrapment

ROZ Development and Flushed Entrapment
Note: Wetting Change*
* Volumetric Changes in Rock and Pore Structure Due to Dolomitization
Not Simulated Here
WATER SALINITIES
•
Sulfur Water Occurrence•
Source to Discharge Mixing
•
Evidence of Pathways
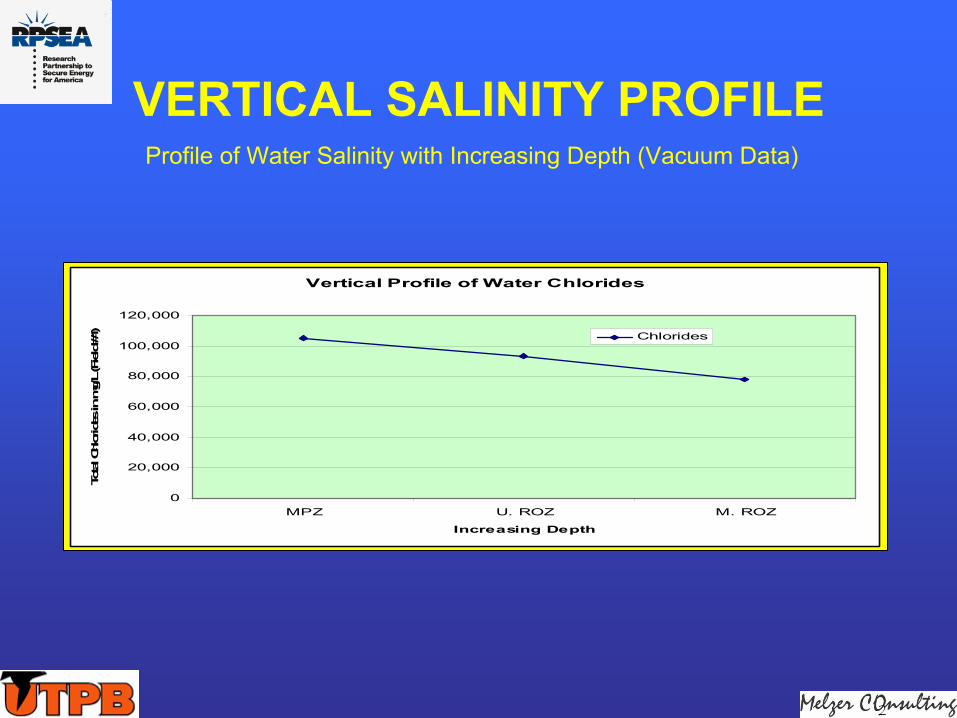
VERTICAL SALINITY PROFILE
Vertical Profile of Water Chlorides
0
20,000
40,000
60,000
80,000
100,000
120,000
MPZ U. ROZ M. ROZ
Increasing Depth
Total C
hlor
ides
in m
g/L (Field #1) Chlorides
Profile of Water Salinity with Increasing Depth (Vacuum Data)

SULFUR ACCUMULATIONS
•
Biological Processes–
Aerobic
–
Anaerobic•
Associations
•
Geographical Occurrence•
Quantitative Estimates of Petroleum ‘Consumption’
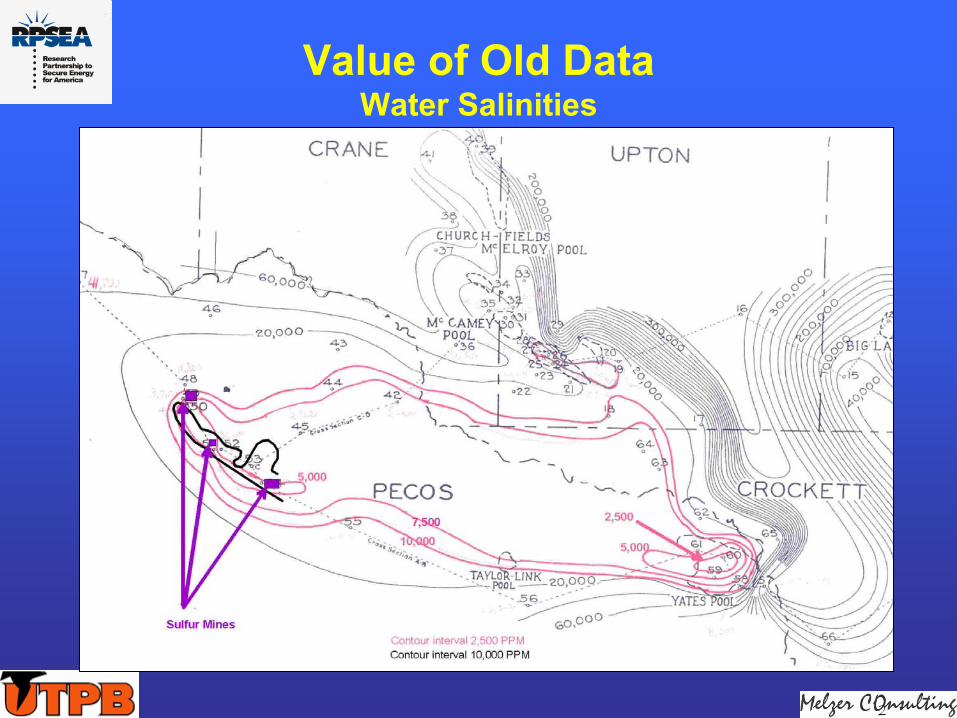
Value of Old Data Water Salinities
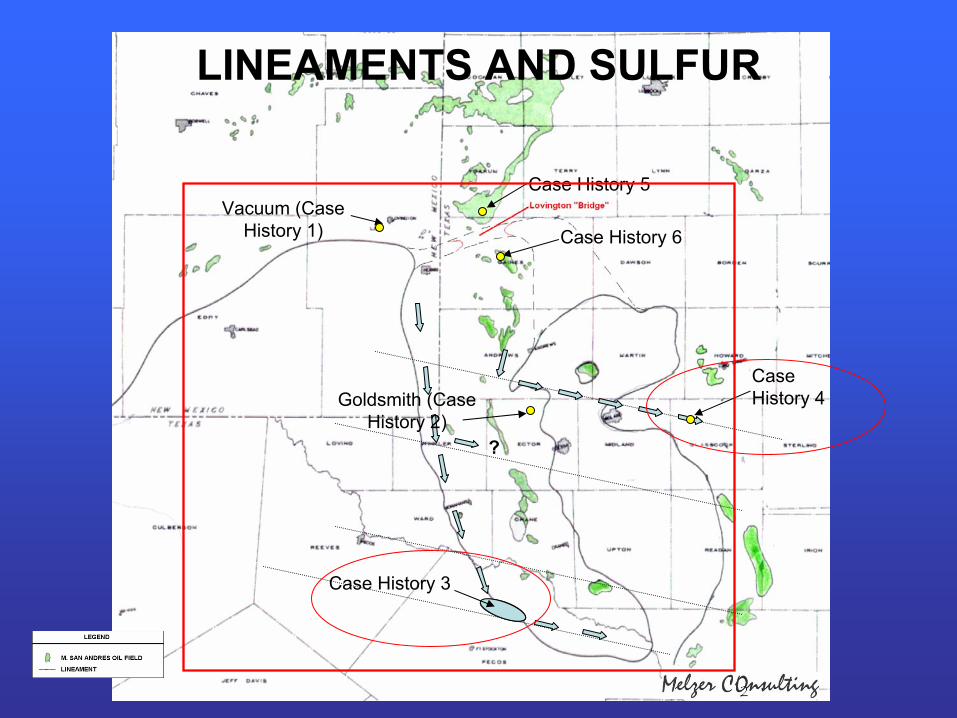
Case History 6
Case History 5
LINEAMENTS AND SULFUR
Vacuum (Case History 1)
Case History 4
Case History 3
?
Goldsmith (Case History 2)

CORROSIVE ZONES
•
ATTRIBUTES OF EXIT PATHS•
ACIDIC NATURE OF WATER
•
WHAT WORK EXISTS ON THESE ZONES?–
From Corrosion Engineers?
–
Geographically Speaking•
Coleman Junction•
Lower San Andres•
Wichita Albany
•
OTHER

Post-Subsidence Phase of Permian Basin Development*
* Adapted from Lindsay, R.F. (2001), W. Tx Geological Society Fall Symposium, Oct 01, Midland Tx USA
~50% of Permian Basin Production
WEST EAST
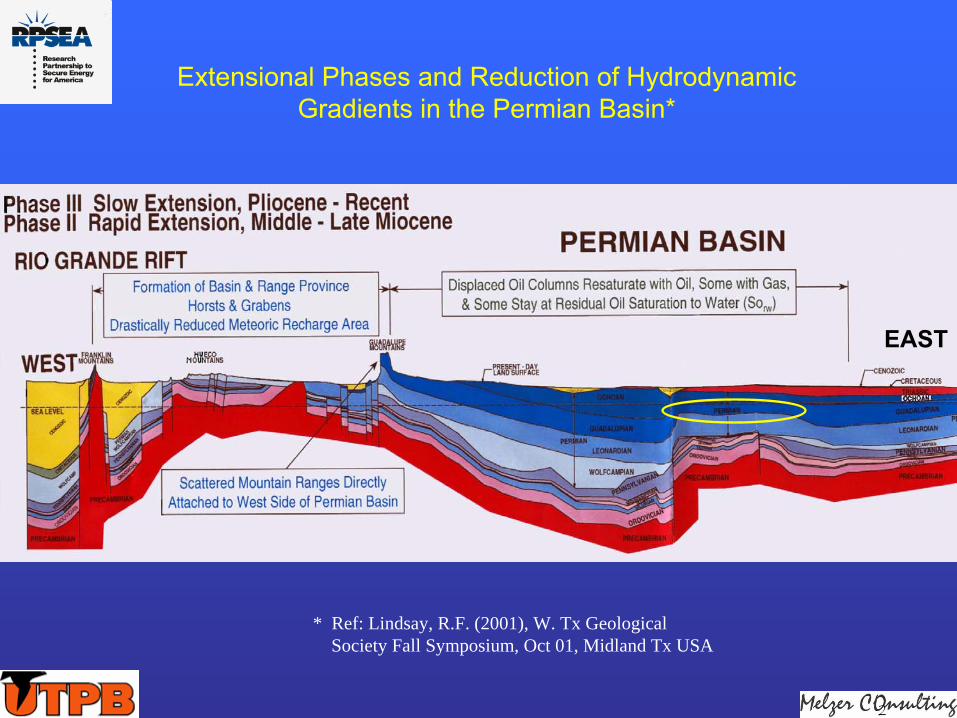
Extensional Phases and Reduction of Hydrodynamic Gradients in the Permian Basin*
* Ref: Lindsay, R.F. (2001), W. Tx Geological Society Fall Symposium, Oct 01, Midland Tx USA
EAST

Permian Basin Stratigraphic
Column

San Andres (Permian Guadalupian)
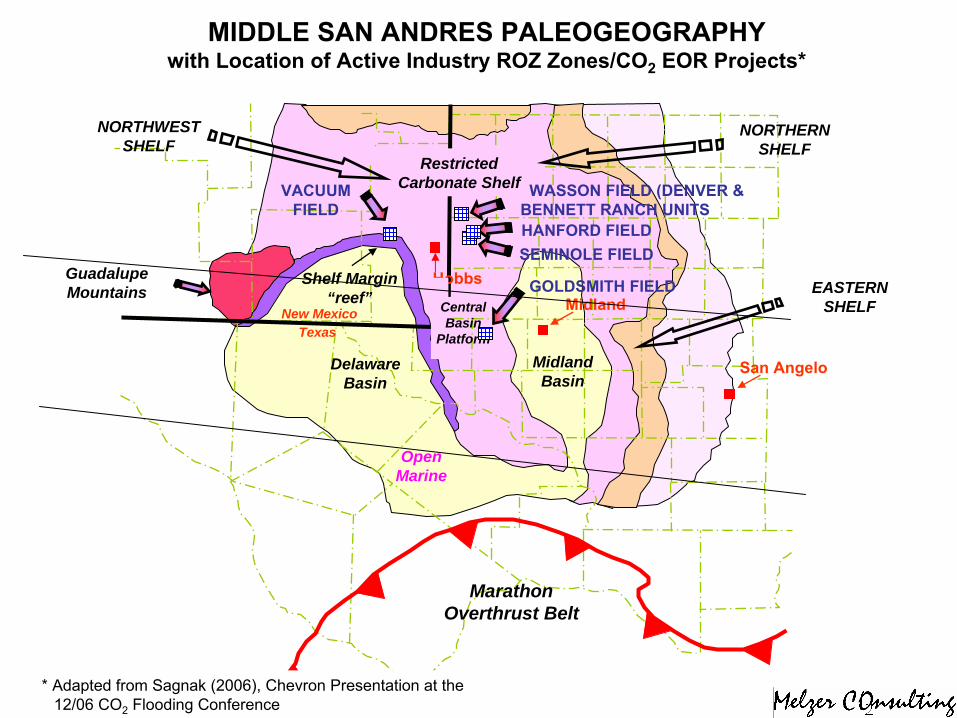
MIDDLE SAN ANDRES PALEOGEOGRAPHY
with Location of Active Industry ROZ Zones/CO2
EOR Projects*
Hobbs
VACUUMFIELD
GuadalupeMountains
MidlandBasin
DelawareBasin
CentralBasin
Platform
Shelf Margin “reef”
TexasNew Mexico Midland
San Angelo
Restricted Carbonate Shelf
OpenMarine
MarathonOverthrust Belt
NORTHWESTSHELF
NORTHERNSHELF
EASTERNSHELF
WASSON FIELD (DENVER & BENNETT RANCH UNITS
SEMINOLE FIELD
* Adapted from Sagnak
(2006), Chevron Presentation at the 12/06 CO2
Flooding Conference
GOLDSMITH FIELD
HANFORD FIELD

WHERE WE ARE TODAY

WHERE WE THINK WE ARE GOING
(BUT THIS IS RESEARCH, LET’S BE ‘NIMBLE’)

SUMMARY: THE “ANECDOTAL”
EVIDENCE
Oil ShowsTitled O/W Contacts
Water Salinities, Sulfur WaterCorrosive ZonesSulfur DepositsDolomitization
Sources of Water (caverns and karst)Discharge Paths, Lineaments
In the breakout sessions, your observations related
to these are key

Let’s Look at Some Field Case History Examples
1
2
34
Breakout Session Areas

BACKUP SLIDES
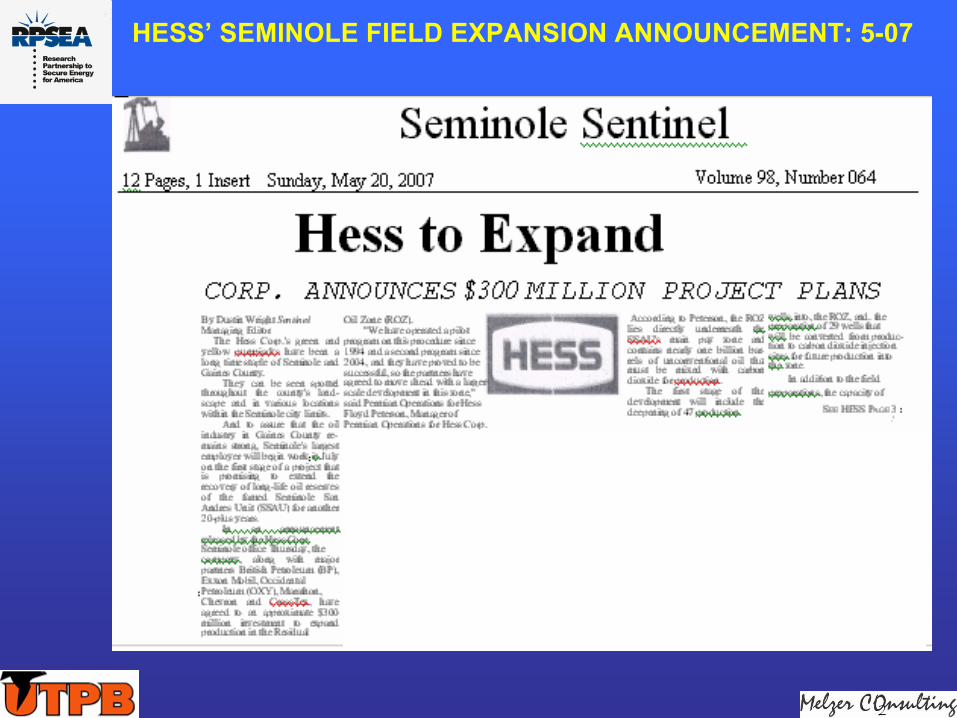
HESS’
SEMINOLE FIELD EXPANSION ANNOUNCEMENT: 5-07

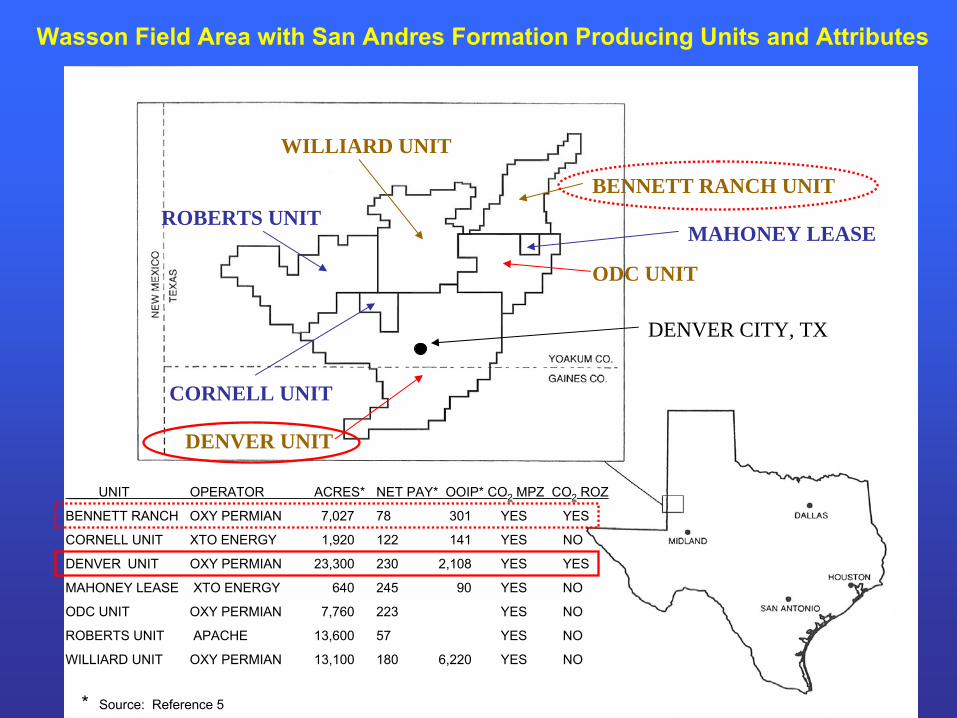
Wasson Field Area with San Andres Formation Producing Units and Attributes
BENNETT RANCH UNIT
ODC UNIT
DENVER UNIT
ROBERTS UNIT
WILLIARD UNIT
____UNIT
OPERATOR
ACRES*
NET PAY* OOIP* CO2
MPZ CO2
ROZ
BENNETT RANCH
OXY PERMIAN 7,027
78
301
YES
YES
CORNELL UNIT
XTO ENERGY
1,920
122
141 YES
NO
DENVER UNIT
OXY PERMIAN 23,300
230
2,108
YES
YES
MAHONEY LEASE
XTO ENERGY 640
245
90
YES
NO
ODC UNIT
OXY PERMIAN
7,760
223
YES
NO
ROBERTS UNIT
APACHE 13,600
57
YES
NO
WILLIARD UNIT
OXY PERMIAN 13,100
180
6,220
YES
NO
* Source: Reference 5
MAHONEY LEASE
CORNELL UNIT
DENVER CITY, TX