Embed Size (px)
Citation preview

FIRST LANGUAGE AND SOCIOLINGUISTIC INFLUENCES ON THE SOUND
PATTERNS OF INDIAN ENGLISH
by
HEMA SIRSA
A DISSERTATION
Presented to the Department of Linguistics
and the Graduate School of the University of Oregon
in partial fulfillment of the requirements
for the degree of
Doctor of Philosophy
December 2014

ii
DISSERTATION APPROVAL PAGE
Student: Hema Sirsa
Title: First Language and Sociolinguistic Influences on the Sound Patterns of Indian
English
This dissertation has been accepted and approved in partial fulfillment of the
requirements for the Doctor of Philosophy degree in the Department of Linguistics by:
Melissa A. Redford Chairperson
Vsevolod Kapatsinski Core Member
Tyler Kendall Core Member
Kaori Idemaru Institutional Representative
and
J. Andrew Berglund Dean of the Graduate School
Original approval signatures are on file with the University of Oregon Graduate School.
Degree awarded December 2014

iii
© 2014 Hema Sirsa

iv
DISSERTATION ABSTRACT
Hema Sirsa
Doctor of Philosophy
Department of Linguistics
December 2014
Title: First Language and Sociolinguistic Influences on the Sound Patterns of Indian
English
The current dissertation is a systematic study of variation in the English spoken in
multilingual and multicultural India. Three experiments were conducted to investigate the
influence of two native languages (Hindi and Telugu) on English, which is spoken by
almost all Indians as a second language. The first experiment indicated that Indian
English (IE) is accented by the first language of its speakers, but high English proficiency
and the degree of divergence between the sound patterns of the speaker’s native language
and his or her IE suggested that other factors might influence the preservation of a native
language accent in IE. The second experiment controlled for language investigated the
effect of region on IE, finding that listeners were able to distinguish speakers based on
region even when they spoke the same native language. The regional variation in IE was
more noticeable for native Telugu speakers than for native Hindi speakers. This
difference was attributed to differences in the social and political power associated with
these native languages: Hindi being the national language and the language of the capital
city of India; Telugu, a regional language of Andhra Pradesh and spoken by many fewer
people than Hindi. The third experiment was motivated by the idea that persistent effects
of the speaker’s native language might also be used to reflect a speaker’s personal

v
identity. Accordingly, the experiment investigated the effect of speaking about personal
versus neutral topics on IE pronunciation. The results were that speakers’ IE
pronunciation was more like their native language when speakers’ discussed personal
topics then when they discussed neutral topics. Overall, the results suggest that the
pronunciation of IE is conditioned by social factors, meaning that it has entered the
differentiation phase of Schneider’s dynamic model of English evolution.
This dissertation includes previously published co-authored material.
vi
CURRICULUM VITAE
NAME OF AUTHOR: Hema Sirsa
GRADUATE AND UNDERGRADUATE SCHOOLS ATTENDED:
University of Oregon, Eugene
University of Delhi, Delhi, India
DEGREES AWARDED:
Doctor of Philosophy, Linguistics, 2014, University of Oregon
Master of Philosophy, Linguistics, 2007, University of Delhi
Master of Arts, Linguistics, 2005, University of Delhi
Bachelor of Arts, Electronics (Gen), 2002, University of Delhi
AREAS OF SPECIAL INTEREST:
Experimental phonetics and phonology
Second Language Acquisition
English as Second Language
PROFESSIONAL EXPERIENCE:
Senior Linguist, Sensory Inc. Portland, 2012 – present
Research Assistant to Professor Melissa A. Redford, Speech and Language Lab,
University of Oregon, 2010-2012
Graduate Teaching Fellow, Department of Linguistics, University of Oregon,
2008-2010
Target Language Expert (Hindi), Avant Assessment, Eugene, 2009-2011
Instructor for Hindi Self Study Program, Yamada Language Center, University of
Oregon, 2008-2010
Target Language Expert (Hindi), Center for Applied Second Language Studies
(CASLS), University of Oregon, 2007-2008
Visiting Faculty Member, University of Delhi, India, 2005-2007

vii
GRANTS, AWARDS, AND HONORS:
Graduate Research Fellowship, University of Oregon, 2010-2012
Graduate Teaching Fellowship, University of Oregon, 2008-2010
Bakony Professional Development Grant, 2010
Sushil Jajodia Indian Student Scholarship, University of Oregon, 2008, 2009
Jhamandas Watumull Scholarship, University of Oregon, 2009, 2012
Professor R. N. Srivastava Memorial Gold Medal, University of Delhi, 2005
Shri Uggersain Memorial Gold Medal, University of Delhi, 2005
PUBLICATIONS:
Sirsa, H., & Redford, M.A. (2013). The subtle effects of native language on
Indian English sounds and rhythm patterns. Journal of Phonetics, 41, 393-406.
Sirsa, H., & Redford, M.A. (2011). Towards understanding the protracted
acquisition of English rhythm. In Lee, W.-S., Zee, E. (eds.),Proceedings from the 17th
International Congress of Phonetic Sciences, (ICPhS-11 Hong Kong), pp. 1862-1865.

viii
ACKNOWLEDGMENTS
It’s been a long road, but with support of so many people here I am at the end.
Unfortunately, I can list a few names here, but my sincere gratitude goes to anyone who
helped me in this journey, including family, friends, advisors, teachers, co-workers,
employers.
First of all I would like to express my deepest appreciation to my advisor,
Professor Melissa A. Redford for supporting throughout the process, be it academically,
emotionally. Without her guidance and persistent help this dissertation would not have
been possible. She has been my mentor and family, and will always have special place in
my life.
I would like to thank my committee members: Professor Vsevolod Kapatsinski,
Professor Tyler Kendall, and Professor Kaori Idemari who were more than generous with
their expertise and precious time. Their valuable comments have greatly improved this
dissertation. My special appreciation also goes to Professor K. V. Subbarao and
Professor Ravinder Gargesh of University of Delhi for their constant support and
encouragement. I am also thankful to other faculty and non-faculty members in the
Linguistics program at the University of Oregon and University of Delhi for their
guidance and encouragement.
My hearty appreciation goes to Magid, Becky and Abe at International Affairs for
helping with visa and also for constant support. I am also thankful to Jeff Magoto at YLC
for always being supportive. I also feel lucky to get in the best workplace be it CASLS,
YLC, Speech and Language lab or Sensory Inc. Thanks to all the colleagues for the
support and encouragement.

ix
I would also like to express my gratitude to my childhood friends Poornima,
Rajesh Bhat, Rajesh Shirali, Venkatesh, Prashant, Lokesh, Sindhoor, Venugopal,
Sriganesh, and Sharad for always standing by my side through thick and thin. I want to
thank all my friends Amit, Nidhi, Neelam, Kalpana, Dinesh, Rajaneesh, and Shun for
their warm encouragement. Special thanks to my friend Ghulam Memon for motivating
me to learn Python and for helping in writing and editing scripts to make the process easy
and also for all the help and support. My thanks also go to my host family Gene, Peggy
and Shandi for providing home away from home. I would also like to acknowledge and
thank all the informants who provided their speech data.
Finally, I am thankful to my family, whose love and support kept me strong
through all the phases of life. In particular, a special feeling of gratitude to my loving
parents, without whom I would have never been able to complete my dissertation. My
sisters Jaya Lata, Bijli and brother Toofan have never left my side, always supported me
in every way and are very special. In addition, unconditional love from my nephew
Manas and Viraj and niece Poorvi kept me going on this long journey. Thanks to my
sister-in-law Swapna, brother-in-laws Madhu and Mohan for their support. Special thanks
to my husband and friend Arun for being a critic and helping me get through the tough
times. I also want to express my gratitude to my in-laws for their support. A very special
gratitude to have my son Aadhav enter into our life at the end of the PhD journey, his
unconditional love, smile and touch has provided new life to me.
I also wish to express my sense of gratitude to one and all who, directly or
indirectly, have lent their helping hand in this venture.

x
To my Family and Friends

xi
TABLE OF CONTENTS
Chapter Page
I. INTRODUCTION ........................................................................................................... 1
II. BACKGROUND ............................................................................................................ 6
2.1. English in India ........................................................................................................ 6
2.2. Indian English (IE) ................................................................................................. 10
2.3. Socio-Political and Cultural ................................................................................... 12
2.4. Sound Structure of IE ............................................................................................. 15
2.5. First Language Influences on IE ............................................................................ 18
2.6. Region as a Source of Variation ............................................................................. 20
2.7. L1 and Social Identity ............................................................................................ 25
2.8. Current Dissertation ............................................................................................... 28
III. EXPERIMENT 1: NATIVE LANGUAGE INFLUENCES....................................... 30
3.1. INTRODUCTION .................................................................................................. 30
3.2. Methods .................................................................................................................. 37
3.2.1. Participants ...................................................................................................... 37
3.2.2. Material ............................................................................................................ 38
3.2.3. Production Task ............................................................................................... 39
3.2.4. Perceptual Judgment Task ............................................................................... 39
3.2.5. Acoustic Measurements ................................................................................... 41
3.2.6. Analyses........................................................................................................... 45
3.3. Results .................................................................................................................... 46

xii
Chapter Page
3.3.1. Perceptual Judgments ...................................................................................... 46
3.3.2. Acoustic Measurements ................................................................................... 50
3.4. General Discussion ................................................................................................. 61
IV. EXPERIMENT 2: REGIONAL INFLUENCES ........................................................ 65
4.1. Introduction ............................................................................................................ 65
4.2. Methods .................................................................................................................. 71
4.2.1. Participants ...................................................................................................... 71
4.2.2. Material ............................................................................................................ 73
4.2.3. Production Task ............................................................................................... 73
4.2.4. Perceptual Judgment Task ............................................................................... 74
4.2.5. Acoustic Measurements ................................................................................... 75
4.2.6. Analyses........................................................................................................... 75
4.3. Results .................................................................................................................... 76
4.3.1. Perceptual Judgments ...................................................................................... 76
4.3.2. Acoustic Measurements ................................................................................... 78
4.4. General Discussion ................................................................................................. 87
V. EXPERIMENT 3: EFFECTS OF LINGUISTIC-IDENTITY ..................................... 92
5.1. Introduction ............................................................................................................ 92
5.2. Methods .................................................................................................................. 95
5.2.1. Participants ...................................................................................................... 95

xiii
Chapter Page
5.2.2. Elicitation Task ................................................................................................ 95
5.2.3. Perceptual Judgment Task ............................................................................... 97
5.2.4. Acoustic Measurements ................................................................................... 98
5.2.5. Analyses........................................................................................................... 99
5.3. Results .................................................................................................................. 100
5.3.1. Perceptual Judgments .................................................................................... 100
5.3.2. Acoustic Measurements ................................................................................. 103
5.4. General Discussion ............................................................................................... 111
VI. CONCLUSION......................................................................................................... 114
6.1. IE Use Across Domains ....................................................................................... 115
6.2. IE as a Possible National Language ..................................................................... 116
6.3. Remaining Issues.................................................................................................. 118
APPENDICES
A. CONSONANT INVENTORIES OF GIE, HINDI AND TELUGU ...................... 121
B. LORD GANESHA STORY IN IE, HINDI AND TELUGU ................................. 123
C. SENTENCES ON MARRIAGE, CHILDHOOD MEMORIES, SCHOOLING
AND EMPLOYMENT ............................................................................................... 127
REFERENCES CITED ................................................................................................... 134

xiv
LIST OF FIGURES
Figure Page
3.1. Listener difference ratings of IE sentence pairs are shown as a function of the
speakers' native language (same vs. different) and listeners' experience
(naïve=native American-English speaking, experienced=native Hindi or Telugu
speaking). .......................................................................................................................... 47
3.2. Naïve listener difference ratings on IE and L1 sentence pairs are shown as a
function of the speakers' native language (same vs. different). ........................................ 48
3.3. The monophthongal vowel space is shown for IE (top) and L1 (bottom) as a
function of speakers’ native language. Vowel measures were taken at the F1 and F2
midpoint and normalized using the Lobanov method (note: i=/i/ or /i:/, I=/ɪ/ or /i/, e=/e/
or /e:/, E=/ɛ/ or /e/, A=/æ/, a=/ɑ/ or /ɑ:/, 3=/ə/, 3r=/ɚ/, o=/o/ or /o:/, O=/ɔ/ or /o/, u=/ʊ/
or /u/, u=/u/ or /u:/). .......................................................................................................... 52
3.4. Degree of retroflexion of post-vocalic stops is shown for IE and L1 as a function
of the speakers' native language. Retroflexion was measured as the difference
between the F2 and F3 offset values in the preceding vowel (note: T=/ʈ/, D=/ɖ/). .......... 53
3.5. Syllable-initial, voiceless bilabial and velar stop voice onset times (VOT) are
shown for IE and L1 as a function of the speakers' native language. ............................... 54
3.6. The average frequency of syllable-initial /s/ is shown for IE and L1 as a function of
the speakers' native languages (L1). ................................................................................. 55
3.7. IE and native language (L1) lexical stress in disyllabic words, measured as the
ratio of the duration of the first vowel to the duration of the second, is shown as a
function of speakers' native language (Hindi and Telugu). .............................................. 56
3.8. Phrase-final lengthening, measured as the ratio of the ultimate vowel duration to
the penultimate vowel duration, is shown for IE and the speakers' native languages
(L1) as a function of the speakers' native language. ......................................................... 58

xv
Figure Page
3.9. Several global measures of language rhythm are shown for IE and L1 as a
function of the speakers' native language. The top panel shows the results for the
average percent of vowel duration (bars) and the standard deviation in consonant
duration (line) across each phrase. The bottom panel shows the results for speaking
rate, also calculated separately for each phrase. ............................................................... 59
4.1. Listeners’ difference ratings of IE sentence pairs are shown as a function of
cities (same vs. different) and speakers' native language (Hindi or Telugu). Note that
analyses were conducted on the untransformed dependent variable (see Analyses). ....... 77
4.2. The monophthongal vowel space is shown for speakers’ native language Hindi
(top) and Telugu (bottom) as a function of city (Delhi or Hyderabad). Vowel measures
were taken at the F1 and F2 midpoint and normalized using the Lobanov method (note:
i=/i/ or /i:/, I=/ɪ/ or /i/, e=/e/ or /e:/, E=/ɛ/ or /e/, A=/æ/, a=/ɑ/ or /ɑ:/, 3=/ə/, 3r=/ɚ/,
o=/o/ or /o:/, O=/ɔ/ or /o/, u=/ʊ/ or /u/, u=/u/ or /u:/). ....................................................... 80
4.3. Degree of retroflexion of post-vocalic stops is shown as a function of the city
(Delhi or Hyderabad) and the speakers' native language (Hindi or Telugu).
Retroflexion was measured as the difference between the F3 and F2 offset values in
the preceding vowel (note: T=/ʈ/, D=/ɖ/). ......................................................................... 81
4.4. The average frequency of syllable-initial /s/ is shown as a function of the city
(Delhi or Hyderabad) and the speakers' native languages (Hindi or Telugu). .................. 82
4.5. IE lexical stress in disyllabic words, measured as the ratio of the duration of the
first vowel to the duration of the second, is shown as a function of the city (Delhi
and Hyderabad) and the speakers' native language (Hindi and Telugu). .......................... 84
4.6. Phrase-final lengthening, measured as the ratio of the ultimate vowel duration to
the penultimate vowel duration, is shown as function of city and the speakers' native
languages........................................................................................................................... 84
xvi
Figure Page
4.7. Several global measures of language rhythm are shown as a function of the city
and the speakers' native language background. The top panel shows the results for the
average percent of vowel duration (bars) and the standard deviation in vowel duration
(line) across each phrase. The bottom panel shows the results for speaking rate (bars)
and the nPVI (lines) across each phrase. .......................................................................... 86
5.1. Listener difference ratings of IE sentence pairs are shown as a function of the
topic (Personal vs. Neutral) and native language (same or different). Note that
analyses were conducted on the untransformed dependent variable (see Analyses). ..... 101
5.2. The monophthongal vowel space is shown by native language (Hindi or Telugu)
and by topic (Personal: top panel; Neutral: bottom panel). Vowel measures were
taken at the F1 and F2 midpoint and normalized using the Lobanov method (note:
i=/i/ or /i:/, I=/ɪ/ or /i/, e=/e/ or /e:/, E=/ɛ/ or /e/, A=/æ/, a=/ɑ/ or /ɑ:/, 3=/ə/, 3r=/ɚ/,
o=/o/ or /o:/, O=/ɔ/ or /o/, u=/ʊ/ or /u/, u=/u/ or /u:/). ..................................................... 105
5.3. Degree of retroflexion of post-vocalic stops is shown as a function of topic
(Personal vs. Neutral) and native language (Hindi vs. Telugu). Retroflexion was
measured as the difference between the F2 and F3 offset values in the preceding
vowel (note: T=/ʈ/, D=/ɖ/). .............................................................................................. 106
5.4. The average frequency of syllable-initial /s/ is shown as a function of topic
(Personal vs. Neutral), and the native language (Hindi vs. Telugu). .............................. 107
5.5. IE lexical stress in disyllabic words, measured as the ratio of the duration of the
first vowel to the duration of the second is shown as a function of topic (Personal vs.
Neutral), and native language (Hindi vs. Telugu). .......................................................... 108
5.6. Phrase-final lengthening, measured as the ratio of the ultimate vowel duration to
the penultimate vowel duration, is shown as function of topic (Personal vs. Neutral),
and the speakers' native language (Hindi vs. Telugu)..................................................... 109
5.7. Speech rate shown as a function of topic (Personal vs. Neutral), and speakers'
native language (Hindi vs. Telugu). ................................................................................ 110
xvii
LIST OF TABLES
Table Page
2.1. Consonant inventory of GIE (CIEFL, 1972) ............................................................. 17
3.1. List of words with retroflex stops /ʈ, ɖ /, voiceless stops /p, k/ and fricative /s/ in
English, Hindi and Telugu. ............................................................................................... 42
3.2. Disyllabic words selected from English, Hindi, and Telugu texts for analyzing
lexical stress. ..................................................................................................................... 44
3. 3. Distribution of listeners’ response as a function of speakers’ native language,
language task and listeners’ background. ......................................................................... 49
4.1. Speakers’ usage of language in different domains. ................................................... 72
4.2. Distribution of listeners’ response as a function of geographical region (target)
and speakers’ native language. ......................................................................................... 78
5.1. List of words with retroflex stops /ʈ, ɖ / and fricative /s/ in English.......................... 99
5.2. Disyllabic words selected for analyzing lexical stress. .............................................. 99
5.3. Distribution of listeners’ response as a function of native language (target) and
topic................................................................................................................................. 102
1
CHAPTER I
INTRODUCTION
India is the second-most populated country in the world with over 1.2 billion
people, it is the seventh largest country by area (3,287,590 square kilometers), and a
political democracy composed of 30 states and 7 union territories. India is a religiously
diverse country with adherents to Hinduism, Buddhism, Jainism, Sikhism, Islam,
Christianity, Judaism and Zoroastrianism. It is also home to people who speak 416
languages (SIL Ethnologue), 1,635 mother tongues as counted in India, which are in turn
grouped into 122 language categories (Census, 2001). Languages in India belong to four
basic language families: Indo-Aryan, Dravidian, Austro-Asiatic, and Tibeto-Burman.
Indo-Aryan languages are spoken by about 75% of the population; Dravidian languages
by about 23% of the population; together Austro-Asiatic and Tibeto-Burman languages
are spoken by a little over 1% of the population, that is, by 7 million and 9 million people
each. Apart from the languages belonging to the four major language families, there are
some spoken by smaller speech communities that are not strictly categorizable into one of
the 4 main language families. Andamanese and Nahali are two such languages.
Andamanese is spoken by a very small group of people living on the Andaman Islands in
the Bay of Bengal. Nahali is a language with fewer than 1,000 speakers, and is spoken in
a small area in southwest Madhya Pradesh.
India is thus one of the most linguistically diverse countries in the world.
However, the Indian government has given official status to only 22 regional languages
in the 8th
schedule. Hindi is the official language of the Union, but it shares this status
2
with the language of the British colonizers, English, rather than with another indigenous
language. By the time India became independent in 1947, English had already
consolidated its position in primary school and higher education (Agnihotri & Khanna,
1997). Today, next to its legal status as associate official national language, English is the
official language of four states (Manipur, Meghalaya, Nagaland and Tripura) and of
seven Union territories that are under direct control from New Delhi (the Andaman and
Nicobar Islands, Chandigarh, Dadra and Nagar Haveli, Delhi, Lakshadweep, Mizoram
and Pondicherry). Today in India, English is the primary medium of education, law,
media, and business. It is also used for social interactions and in a pan-Indian literature.
Even though Hindi is an indigenous language, it has not been able to unite India due to
constant opposition from non-Hindi speaking community. This is why English has
continued to play a role as an official language: it is needed to keep India united. Along
these lines, Indian author Salman Rushdie (2003) observed that:
In many parts of South India, people will prefer to converse with visiting North
Indians in English rather than Hindi, which feels, ironically, more like a colonial
language to speakers of Tamil, Kannada or Malayalam than does English, which
has acquired, in the South, an aura of lingua franca cultural neutrality.
According to the 2001 census of India, 226,449 speakers have English as a native
language, but most Indians speak English as a second language. Due to the large number
of speakers (225 million), English of India has become a recognized variety: Indian
English (IE). This variety was standardized in a monograph issued by the Central
Institute of English and Foreign Languages (CIEFL). CIEFL was established in 1958 to
conduct research on Indian English and to train English teachers. In the early 1970s,

3
research conducted by CIEFL led to the compilation of a list of linguistic features of
English in India. These features were consolidated in the above-mentioned monograph to
become the standardized variety of English in India. This official variety of English in
used throughout India, and is meant to be devoid of regional influences. Although it owes
its origin to the British Received Pronunciation, GIE deviates in its phonology and
quality of phones. It takes into account the common segmental features across Indian
languages such that GIE is distinctly Indian, but without prominent regional influences.
English teachers go through training to make sure that students are introduced to this
standardized variety.
New varieties of English are often stigmatized, and IE is no exception. According
to Prator (1968) IE is the most unintelligible of the educated varieties of World
Englishes. It is not only the British and other native speakers of English that have a
negative attitude towards IE. In speaking of Indian attitudes towards IE, Kachru (1986)
noted that during the phase of development of IE “to have one’s English labeled Indian
was an ego-cracking linguistic insult (p. 40).” Although this attitude has generally
subsided among Indians themselves, the negative stereotype persists among those who
live in countries where English is a native language. A simple search on the internet gives
ample evidence of people’s negative attitude towards IE. On one discussion board
(http://www.antimoon.com/forum/t11954.htm), on Oct 21, 2008 a participant writes
“why is it that there is not an Indian on earth who does not have an heinously strong
accent, even when they are born and bred in English speaking countries?” People even
equate the accent to that of IQ. Another discussion board posted on
(https://answers.yahoo.com/question/index?qid=20120212190404AAyVCjl) asks “(d)o
4
most Indians have low IQs and bad English?” Many others comments wonder at why
Indians have bad grammar and speak English so badly.
At one time, scholars also viewed non-native varieties of English, like IE, as non-
standard varieties and unacceptable in a formal context. However, there is growing
consensus that there is no longer a single English language (Crystal, 1997). Instead many
Englishes have developed in different parts of the world. Today, scholars suggest that
new varieties of English are innovations that are contributing to the growth and evolution
of the English language (Bhatt, 1997; Sridhar, 1989).
In this dissertation, I will argue that the new variety of English in India has
emerged as a language of prestige and power, and is increasingly being used across most
domains of life in India by many highly proficient speakers. The term proficiency is
applied here to persons educated only in English medium schools, that is, since age 6
years through college, and so exposed to GIE as the target variety. These proficient
speakers use English fluently and on daily basis. With this use, IE has diversified within
India itself to function as language of national, regional, and personal identity.
Because of the diversity of languages in India and the cultural and socio-political
factors involved, IE has evolved from a contact language to an official variety. To
understand this evolution, I will focus on the question of how Indian native languages
effect the acquisition and use of IE. Specifically, this dissertation investigates how a
second language can become not only a national language, but also a language of
regional and personal identity. The answer to this question will be in the preservation of
an L1 influence. It is argued here, based on the results from 3 experiments that
investigate IE pronunciation while manipulating L1, region, and context, that an L1

5
accent in IE should not be seen as an index of second language proficiency so much as a
marker of identity. Note that some of the evidence for this argument, presented in
Chapter III, was previously published as a co-authored journal article.

6
CHAPTER II
BACKGROUND
2.1. English in India
English was introduced in India in the early 1600s by Christian missionaries.
English was established firmly as the medium of instruction and administration with the
Minute of 1835 by T. B. Macaulay. According to the Minute, a class of people were to be
formed; “a class who may be interpreters between us (the British) and the millions whom
we govern, a class of persons, Indians in blood and colour, but English in taste, in
opinion, in morals and in intellect (quoted in Kachru, 1983:22).” The colonial strategy
was to use English education as a means to strengthen British political authority in the
country. People who knew English were given jobs, thereby compelling Indians to pursue
English education. English became the lingua franca of the educated people in India.
English gradually became the language of government, education, and advancement; in
sum, "a symbol of imperial rule and of self-improvement (McCrum et al., 1988:325).”
After independence from the British in 1947, it was considered important to have
an indigenous Indian language as the official language of India for maintaining the
linguistic unity of the nation: “Hindi seemed most qualified (to serve as a national
language), since it had more native speakers than any other Indian language and was
already widely used in interethnic communications (Fasold, 1984:24).” Thus Hindi was
designated as the language of communication between and within the states. However,
due to opposition from non-Hindi states—especially, from Tamil Nadu—English was
also introduced as an associate language (Article 343 of the Indian constitution). The plan

7
was that Hindi would eventually be promoted so that it might express all parts of the
“composite culture of India” (Spolsky, 1978:56). But the south and other Indian
communities continued to feel they would be professionally, politically and socially
disadvantaged were Hindi to become the national language, and so opposition grew
stronger to the planned phasing out of English in preference to Hindi. Thus the
government was forced to adapt a policy that would help to maintain a status quo.
In 1967, Parliament passed the Official Language (Amendment) Act, which
specified that:
Notwithstanding the expiration of the period of fifteen years from the
commencement of the Constitution, the English language shall continue to be
used for all the official purposes of the Union for which it was being used
immediately before such commencement (Constitution of India, 2007:212).
The act sanctioned the use of both Hindi and English for all official purposes, and this
continues to be the case. But at the same time that the Indian Parliament re-designated
Hindi as the national language and made English an official language for an indefinite
period of time, 14 other languages (22 by 8th
schedule, 2008) also continued to be
designated as official languages. This meant that each state could choose its own regional
language for use in local government affairs and in education according to Article 346
and 347. India's constitution thus guarantees the right of all citizens to communicate in
their own language with any governmental agency.
Spolsky (1978) described the situation on the Indian subcontinent as one
highlighting the "multitude of problems facing a political unit that contains a great
number of languages (p. 42)." He further pointed out that it comes as no surprise that

8
India has had some difficulty in setting up a language policy. As a solution, in the early
1950s, the Indian government established eighteen states along linguistic lines, so that the
majority in each spoke a common regional language and learned Hindi and English as
official languages. However, the position of Hindi as an official language of India that
must be learned by all has had constant opposition from non-Hindi speaking
communities. By contrast, English is free from any undesirable (e.g. ethnic or religious)
connotations that the native languages may have (Kachru, 1986). Thus, the pros of using
English as a lingua franca in India might wipe away the fact that it originally was the
colonizer's language. In principle, English could serve as a sole official language given its
use across all regions for official purposes. According to Kachru, English provides a
linguistic tool for the administrative cohesiveness of a country, and it serves as a
language of wider communication.
Before independence, English was the language of the elite, of the administration,
and of the pan-Indian press. The first universities were established in India in 1857 in
Bombay, Calcutta and Madras. English provided a medium for understanding
technological and scientific development. Ultimately, the legal system, the national
media and important professions were conducted in English. By the 1920s, English had
become the language of political discourse, intra-national administration, and law. It is
the language associated with liberal thinking. Since independence in 1947, English has
penetrated even deeper into Indian society (Kachru, 1986).
Even though English has a high index of communicativity in India, Fasold
(1984:139) suggested that English lacks symbolic power because it has not been declared
as a national language; it is just an associate official language. Fasold acknowledged that

9
other multilingual countries like Malaysia and Indonesia adopted, standardized, and
developed a non-indigenous language as their lingua franca, and then promoted the
lingua franca to serve as a national language. According to Fasold, these languages were
standardized and developed as national languages because there was no obvious
indigenous language that could be used. Fasold did not find this to be the case of English
in India since Hindi is spoken by more people than any other language in India and has
cultural attributes that English does not have. However, Kachru (1986) stressed the
importance of speakers’ attitudes when determining the (symbolic) power of a language:
what one thinks the language will do for the person and what others think of a person
when one uses the language. Similarly, Bourdieu (1991) argued that symbolic power rests
on social recognition. Unification and codification of a language is an important way of
achieving recognition because these lead to the use of a language as a common language.
Insofar as this affects access to economic and social power, use of a language provides its
speakers with linguistic capital. But linguistic capital is not restricted to economic and
social prestige, it also provides cultural power. The more a language is used, the more
linguistic capital will be available for its holders to get access to cultural power, and thus
to symbolic power. Thus, for Kachru and Bourdieu, it is the usefulness and the prestige of
a language that provides it with symbolic power.
We would note that the situation in India has changed considerably since Fasold
(1984) first made his observations about English in India. In the last three decades, Indian
English has been established as a language of national affairs; similar in status and
function as, for example, Bahasa Indonesia, which is the language of education,
communication, transaction, and trade in Indonesia. Like the lingua franca of Indonesia,

10
Indian English is now also used in the development of national culture, science,
technology, and mass media.
2.2. Indian English (IE)
Laporte (2012) argued that communities of World Englishes (e.g. Indian English)
often take pride in the distinctive features of their varieties, which are tokens of their
identity. According to this view, World Englishes are varieties in their own right.
Schneider (2003) has explained that the evolution of World Englishes takes place in 5
phases. The first phase is the foundation phase. This is when English is introduced to a
population through trade or colonization, and its use is very limited. Next comes
exonormative stabilization, which describes increased contact between native English
speakers and the locals and, with this, an expanded use of English. It is during this second
phase that English begins to be marked by local features. The third phase is nativization.
During this phase, the range of English use increases with nativization at all linguistic
levels. English also equates with the expression of a new national identity. Fourth comes
endonormative stabilization. This phase follows political independence of the territory
and corresponds to almost unanimous acceptance of the nativized language norms. The
variety becomes codified and is used to express local identity. Finally, there is
differentiation. During this phase, the nativized English variety becomes internally
diversified and there is the emergence of dialects and local variants. Symbolic power
might be acquired during phase 4 (endonormative stabilization) since this phase is
characterized by “the gradual adoption and acceptance of an indigenous linguistic norm,
supported by a new, locally rooted linguistic self-confidence (Schneider, 2003:249).”

11
Communities in the endonormative stablization phase of English nativization see
themselves as part of a new nation; ethnic boundaries become redefined with the
codification of the new variety.
Schneider (2003) argued that IE is very advanced in the nativization process and
displays signs of endonormative stabilization. Balasubramanian (2009) claimed that IE
has already entered endonormative stabilization phase, and possibly even the last phase,
differentiation. Consistent with both views, a number of social theorists argue that IE is a
variety on its own (e.g., Kachru, 1986; Bailey, 1991; Jenkins, 2003). Their argument is
summed up by Kachru (1986) and Bailey (1991) as follows: Kachru noted that the
functions of English "extend far beyond those normally associated with an outside
language, including the instrumental, the regulative, the interpersonal and the innovative,
self-expressive function (p. 37)." Bailey argued that “IE has emerged as a self-
perpetuating national variety, though one mainly used by Indians whose native language
is not English. IE is a minority tongue, and yet the language of national affairs (p. 145).”
In this dissertation, I test the view that IE is a distinct variety of English and,
further, that IE has moved beyond the endonormative stabilization phase and is now in
the process of differentiation. That is, like other established varieties of English, I
hypothesize that IE is not homogeneous, but instead incorporates a range of varieties.
Bhatt (1997:275) formulates this hypothesis in the following way:
As a result of over 200 years of contact with native Indian languages, English has
become an Indian language, both in its structure and use. And like other natural
language, IE displays a hierarchy of varieties – from standard (monitored) to
vernacular (unmonitored).

12
Stronger statements yet come from other applied linguists, Jenkins (2003:7), who argued
that English in India has undergone “a process of Indianization in which it has developed
a distinctive national character comparable to that of American or Australian English.”
Balasubramanian (2009:228) observed that the IE of younger speakers has more Indian
features than the IE of older speakers, regardless of proficiency level. This latter
observation suggests innovation around accent, a point that we will explore in this
dissertation. Collectively, the observations about IE from these authors are consistent
with my thesis that IE has advanced through most, if not all, of the World Englishes
phases enumerated by Schneider (2003).
In the remainder of this chapter we will first consider the social political factors
that argue for IE as a distinct variety of English, similar in status as British and American
English. After that, we will present a canonical description of the sound structure of IE,
which is the focus of my investigation in this dissertation. Finally, we will look at the
different factors that likely continue to play an important role in transforming this non-
indigenous language into a language of power and Indian identity.
2.3. Socio-Political and Cultural
In a multilingual and multicultural country like India, the position of English is
determined by various social, political, and cultural considerations. During British
colonization, English was used as a tool of power to cultivate a group of people who
identified with the cultural and other norms of the political elite. English was considered
a tool of civilization. Europeans thought they would contribute to the well-being of the
13
native people in the colonies, and elevated their language to the almost divine
(Bonvillain, 1993).
Since independence, the perception of English as representative of an alien power
base has changed. Today IE is very frequently learned as a second or third language after
a native language. According to Spolsky (1978:42), English is more useful as a "lingua
franca" in India than Hindi, the use of which is regionally limited. Spolsky also noted that
the language policy of the school system in India, where English is first encountered, is
both a result of the social and economic pressures that make English a good lingua franca
in India, and a source of pressure on English itself. He argued that education is the best
way to enforce language policy, listing the following pressures that effect language
planning in a society: family (attitudes at home), religion (the language represents a "holy
tongue"), ethnicity, political pressures (national unity), cultural pressures, economic
pressures (commerce, science and technology), the mass media (e.g., if there is no media
in a particular language, there will be strong pressure to learn another language which is
better provided), legal pressures (language can often become the basis for
discrimination), and military pressure (cohesion is better maintained if one language is
used).
Regarding language policy, non-Hindi speaking communities found it unfair that
they would have to learn Hindi as a national language and English as the official
language where native speakers of Hindi would only have to learn English. As a result,
the Three Language Formula was developed. The goals were to promote national
integration and to make the educational load be fair to all communities (Srivastava,
1990:43). According to the formula, people from non-Hindi areas are supposed to learn

14
their regional language, English, and Hindi in school. In Hindi speaking areas, people
study Hindi, English and any other modern Indian language. Sridhar (1989:22) observed
that the Three Language Formula “seeks to accommodate the interests of group identity
(mother tongues and regional languages), national pride and unity (Hindi), and
administrative efficiency and technological progress (English)”.
The introduction of the Three Language Formula also resulted in two different
kinds of schools: the vernacular schools and the English-medium schools. In vernacular
schools, students are taught all the subjects in their regional language. In English-medium
schools, students are taught all the subjects in English except for the language courses. In
both schools, students learn 3 languages. The difference is when English is first
introduced to students. Students in vernacular schools encounter English later than those
in English-medium schools. Thus, the different types of schools have divided IE speakers
into early learners of English (beginning pre-school) and late learners (beginning high
school; 5th
or 8th
grade). Since Indians generally feel that English equips them for
socially-valued roles, and that regional languages are not economically valuable, English-
medium schools have become symbol of prestige and power.
According to the 2001 census in India, 226,449 Indians are native speakers of IE,
whereas 225 million speakers are second or third language speakers of IE. Due to the
importance of English being the medium of interaction in the public domain, English
speaking individuals lead India's economic, industrial, professional, political, and social
life. With India's massive population, the 225 million IE speakers in India make India one
of the top four countries in the world with the highest number of English speakers. As
noted already, the large number of speakers and high prestige of English has resulted in

15
its nativization according to many scholars (e.g. Kachru, 1986; Sridhar, 1989; Wells,
1982). Nativization is due presumably both to transfer from the local native languages as
well as to the new cultural environment and communicative needs that English serves
(Sahgal, 1991:300). Because of the deep social penetration of English in India and its
extended range of functions, the nativized variety is likely differentiating. At least this is
the thesis that I intend to test in the present experiment by examining first language,
regional, and social influences on the sound structure of IE.
2.4. Sound Structure of IE
English in India has evolved characteristic features at the phonological, lexical,
syntactic and discourse levels. Some of the prominent phonological characteristics of IE
are as follows: the replacement of alveolar consonants with retroflex consonants; an
absence of dental fricatives /θ/ and /ð/; the substitution of aspirated voiceless dental
plosive [t̪ʰ] for /θ/ and the unaspirated voiced dental plosive [d̪] for /ð/; the use of
unaspirated voiceless plosives /p/, /t/, /k/; the use of /v/ for /w/; r-pronunciation, and
epenthesis into consonant clusters (Bansal, 1978; Trudgill & Hannah, 1994; Sahgal &
Agnihotri, 1988; Chaudhary, 1989; Coelho, 1997; Gargesh, 2004). A number of these
features were incorporated into the standardization of IE, which is discussed next.
In the early 1970s, after the Three Languages Formula was introduced, IE was
standardized in a monograph issued by the Central Institute of English and Foreign
Languages so that there would be a consistent variety for use in primary and secondary
education (CIEFL, 1972). The standardized variety was called General Indian English
(GIE) and it was meant to serve as “a socially acceptable pronunciation (of IE) devoid of

16
regional peculiarities that may impair communication with speakers from within and
from outside the country (Pandey, 1981:11).”
GIE has several salient phonological features such as a reduced vowel inventory
compared to the Received Pronunciation (RP) of British English, the substitution of
retroflex stops for RP British English alveolar stops, and the omission of some fricative
sounds (Bansal, 1976; Wells, 1982). Although suprasegmental features were not
standardized in the CIEFL monograph, the rhythms of (G)IE are notably different from
those of most other Englishes. For example, whereas British English is a canonical stress-
timed language, IE has most often been characterized as syllable-timed (Gargesh, 2004)
or nearly syllable-timed (Babu, 1971).
General Indian English (GIE) has a 17-vowel system (11 monophthongs and 6
diphthongs): /iː, i, eː, ɛ, æ, ɑː, ɒ, oː, ʊ, uː, and ə/ and /ai, ɔi, aʊ, ɪə, eə, and ʊə/. Table 2.1
shows the consonant inventory of GIE described by CIEFL (1972). Frequent phonetic
variants are shown in parentheses; the slash between [u] and [w] means that they are in
allophonic variation.
Since the early 1970s, GIE has been used throughout the education system in
India. It is important to note, though, that English is taught to Indians by first language
speakers of Indian languages. Thus, depending on the focus and subjects in studies on IE,
different viewpoints have emerged in the literature regarding its standardization. On one
hand, certain scholars suggest that certain features have become so well-established in IE
that they should be considered stable features of the language; that is, features found
virtually everywhere English is used in the country (Verma, 1980; Nihalani et al., 2004).

17
Table 2.1. Consonant inventory of GIE (CIEFL, 1972)
Labial labio-
dental
Dental Alveolar post-
alveolar
Retrofle
x
Palatal Velar glotta
l
Stop p
b
(p) (t̪)
d̪
t̪ʰ
ʈ
ɖ
(ʈʰ) k
ɡ
(kʰ)
Affricate tʃ
(tʃʰ)
dʒ
Nasal m n Ŋ
Fricative f s z ʃ h
Approxim
ant
ʋ/w r j
Lateral
approxima
nt
l (Ɩ)
On the other hand, other researchers have suggested that the English spoken in India
differs with respect to a number of variables including first language (L1), proficiency in
English, region and register (Bansal, 1976; Kachru, 1986; Wells, 1982; Gargesh,
2004).These competing descriptions of IE indicate that the question of variation is not
settled. Kachru (1994) noted that:
there is as yet no large-scale study of spoken or written South Asian English. Nor
has any serious attempt been made to distinguish the features in terms of
proficiency scale, the register-specificity of the features, and the distribution of
grammatical features with reference to the regions (p. 518).
This dissertation may not represent the kind of large-scale study that Kachru’s critique
would seem to advocate for, but it is a step in the right direction in that a number of
influences on the details of IE pronunciation are considered.

18
2.5. First Language Influences on IE
It has been widely recognized that languages vary depending on a number of
linguistic and non-linguistic factors. Non-linguistic factors include, but are not limited to,
geography, ethnicity, and social class. In the case of IE, the literature reviewed earlier
strongly suggests that there are already established varieties of IE. But unlike the social
theorists who see variety as a mark of acceptance by Indians of English, others have
attributed it to poor proficiency. For example, Quirk (1972) described a spectrum of IE
varieties that extend from pidgin-like to standard English with “imperceptible gradations
the whole way along (p. 49).”
Linguists have been more circumspect in their explanation for IE varieties, but the
suggestion still seems to be that proficiency is the principal reason for variation. For
example, Wells (1982) suggested that IE phonetic characteristics are to be accounted for
almost entirely in terms of interference from the native language. According to the 2001
census, there are 122 languages in India, even though only 22 have official status.
Dialectal variation within these 122 languages puts the number at 253 mother tongues. If
we take Wells suggestion seriously then there should be at least 122 varieties of IE,
which is at odds with our previous discussion of a set of homogenous IE features.
Wiltshire (2005) suggested instead that IE varieties may reflect different language
families. There are four language families in India: Indo-Aryan, Dravidian, Tibeto-
Burman and Austro-Asiatic. If variation is conditioned by the native language, and
languages within a family share many features, then it is possible that we might see
distinct varieties of IE emerge depending on the substratum influences associated with a
particular language family. Again, though, the implicit suggestion is that the proximal

19
cause for variation is poor English proficiency. This conclusion is consistent with
Gargesh’s (2004) observation that only a small number of people in India have a near-
native command over English. There are a significant number of additional people who
have a high-level of English proficiency, but Gargesh do not consider them to be in
native-like command of the language. That said, the high proficiency group includes
administrators, teachers, scientists, journalists, and businessmen; all individuals whose
variety is considered to be the educated variety and a benchmark for English language
teaching (ELT). Finally, Gargesh noted that there are many people in India with only a
low level of English proficiency, and whose competence in English is severely limited
and used only in restricted domains. Shopkeepers, waiters and like are included in this
group who are also mostly illiterate in English.
Odlin (1989:112) noted that “there is no little doubt that native language
phonetics and phonology are powerful influences on second language pronunciation.”
Avery and Ehrlich (1992) pointed out that the sound system of the native language (L1)
can influence the learners’ pronunciation of a second language (L2) in at least three ways.
First, when there is a sound in the L2, which is absent from the learners’ native sound
inventory, or vice versa, learners may not be able to produce or even perceive the
sound(s). Second, when the phonotactics are different in the learners’ L1 from those of
the L2, they cause problems for learners because these rules are language specific. Third,
rhythm and melody of a language determine its patterns of stress and intonation; learners
may transfer these patterns into their L2.
Most researchers contend that adult learners cannot achieve native-like phonology
in their second language (L2), and attribute the failure to language transfer and age-
20
dependent factors. However, it has been suggested that the second language learner has a
very good chance of attaining native-like pronunciation in a language if s/he starts
learning before the age of 6 (Oyama, 1976; Tahta et al., 1981; Thompson, 1991; Flege,
1988; Flege & Fletcher, 1992). Thus, in order to better investigate the kind of influence
that the native languages of India have on IE, the current experiment investigated
pronunciation of IE in speakers who were first exposed to English at 6 years of age or
before and who continue to use English on a daily basis. The rationale was that if L1
influences were identified in this highly proficient (educated in English medium schools
through university) group of IE speakers, then factors other than proficiency might
account for variation in IE.
2.6. Region as a Source of Variation
Chapter III will show that there are L1 influences on IE even in the speech of
highly proficient IE speakers. Chapter IV reports an experiment of the effect of region on
IE to determine whether the L1 influences on IE are better understood as regional
varieties of IE.
Regional distribution of different accents and dialects has been widely discussed
by the dialectologists. As early as 1284, dialect division between the north and the south
of France was noted by the poet Bernart d’Auriac, who coined the terms langue d’oil and
langue d’oc from the words for ‘yes’ which were used in the north (oil, now oui) and in
the south (oc), respectively (Chambers & Trudgill, 1998). The systematic study of
dialects goes back well over a century. For example, George Wenker’s work in Germany,
based on the translation of High German sentences into dialectal ones by schoolmasters,
21
resulted in the first dialect map of Germany in 1876. Wenker’s methodology was
improved by Jules Gillieron in France, who sent trained field workers out to obtain
consistent data from informants. According to Trudgill (1974) numerous European and
American atlases have been produced using the methodology pioneered by Wenker and
Gillieron. The methodology of using surveys and questionnaires to produce atlases of
geographic dialects continues today in America and the United Kingdom.
McArthur (1998) also pointed out that in countries where the native language is
English (England and the United States) there is “not a single variety of English, (instead
English) differs markedly from one territory to another, and even from one region within
a given territory to another (McArthur, 1998:43).” Given the vastness of the United
States, several dialect atlases have been produced, and several are still under production.
These include the Linguistic Atlas of New England (1939-43); A Word Geography of the
Eastern United States (1949); The Linguistic Atlas of the Upper Midwest (1973-79); The
Linguistic Atlas of the Gulf States (1968-92) and the Linguistic Atlas of the Middle and
South Atlantic States (1980), to name just a few. Two more recent and on-going projects
are DARE, the Dictionary of American Regional English and The Atlas of North
American English (Labov, Ash & Boberg, 2006). Similarly, The Survey of English
Dialects (SED) was inaugurated in 1948, the survey was organized by dividing the
country into four regions: the north, the east and west midlands and the south. The
resulted maps are the Phonological Atlas of the Northern Region (1964); A Word
Geography of England (1974); The Linguistic Atlas of England (1978); Word Maps
(1987); the Dictionary and Grammar (1994) and An Atlas of English Dialects (1996).

22
Studies on the defining features of different varieties of English provide evidence
that they are well distinguished based on phonology. Consider, for example, Labov et
al.’s (2006) Atlas of North American English, which is based primarily on vowel
production. Consonants tend to be less studied, though a number of researcher have
looked carefully at particular contrasts. For example, Byrd and Mintz (2010) showed that
Southern Californians typically have an interdental [θ] and [ð] where standard American
English has dental consonants. Jacewicz et al. (2009) even found evidence of dialectal
variations in the duration of closure voicing for /b/. This was longer in speech produced
by people from Wisconsin than in that produced by North Carolina speakers. Other
studies have investigated regional differences in suprasegmental features like rhythm, and
speech rate. For example, White & Mattys (2007) examined the rhythmic contrasts
between different accents of British English, with results showing evidence of rhythmic
gradience between the most stress-timed Standard Southern British English (SSBE) to the
least stress-timed Shetland English, with Bristolian English, Welsh Valleys English, and
Orkney English falling somewhere in between. Dialect variation has been shown for
speech rate too. For example, O’Neill (2008) found that Wisconsin speakers had faster
articulation rates than North Carolina speakers for both read and spontaneous speech.
Kendall (2009) found that speakers from Texas, Southern North Carolina (NC), Ohio,
and Eastern NC have faster speech rates (≥ 5 syll/sec) than speakers from Central NC,
Western NC, and Washington, DC (< 5 syll/sec). Jacewicz et al. (2009) found similar
regional variation between north and south speakers of American English. Northern
speakers (from Wisconsin) spoke faster than Southern speakers (from North Carolina).
Finally, Byrd (1994) found that out of eight dialect regions in TIMIT database, the

23
speakers from the South had the slowest speaking rate, and the “Army Brat” category had
the fastest.
Perceptual studies confirm that the phonological and phonetic patterns such as the
ones described above are indeed perceptible. Listeners can judge the regional or ethnic
background of unfamiliar talkers based on very short speech samples (5 to 8 words) with
above-chance accuracy (Clopper, Conrey, & Pisoni, 2005; Clopper & Pisoni, 2006).
Regional variation is less discussed in second language situations since the focus
of variation is typically on L1 rather than on geography. Even so, Pingali (2009)
described IE accents as regional in nature, and classifies them on the basis of the
geographical regions and further regions within them. Corpus studies on particular
features (light verb construction, complementation) support the idea of regional varieties.
Although these studies find overall similarities between different varieties of English on
the Indian sub-continent (i.e., between IE, Pakistani English, Bangladeshi English and Sri
Lankan English; Hoffman et al., 2011; Nam et al., 2013), subtle differences also exist.
For instance, the light verb construction with an indefinite article (e.g. take a walk, to
have a chat) is very frequent in IE compared to other Englishes (Hoffman et al., 2011;
Nam et al., 2013). Thus, even though the regional varieties in South Asia all originated at
more or less the same time and from British colonization, they seem to have taken on
subtly different characteristics in different countries.
Of course, the indigenous languages in different regions across South Asia also
differ. It is therefore difficult to know whether the regional differences in South Asian
Englishes and in IE are attributable to the same social-cultural factors that drive regional
variation in the monolingual situation. The most prominent such factor is the urge to
24
maintain a regional identity (Crawford, 2007) which may correlate with an ethnic (e.g.,
Scottish versus British) or social-political (e.g., Northeastern versus Southerner) identity.
Evidence that language conveys identity can be found in the phenomenon of
“Convergence/divergence” whereby speakers deliberately align or diverge in
pronunciation and style from an interlocutor based on context (Wamalwa & Oluoch,
2013). When the context is threatening to the self-identity, the speaker may diverge from
a standard dialect to a more vernacular one or vice versa, depending on whether he or she
wants to distance or more closely resemble the person they are talking to.
Following independence in 1947, much of the initial divisions of India into states
was traced along linguistic lines. For example, where most of the population spoke
Tamil, the state of Tamil Nadu was formed; where most of the people spoke Telugu, the
state of Andhra Pradesh was formed; where they spoke Gujarati, the state of Gujarat was
formed; and so on. Division along linguistic lines occurred because India’s independence
encouraged many of the region-based linguistic groups to become self-conscious and
demand self-determination (Bhattacharyya, 1989). Bhattacharyya (2001) argued that
Indian patriotism is “aggressively attached to its provincial frontiers,” and people
continue to have very strong regional sentiments. Not all of these sentiments are tied to
language, though. For example, the recent division of Andhra Pradesh into the states of
Telangana and Seemandhra was driven by a rather complex situation of deprivation and
ecology rather than by language. The dominant indigenous language in both regions is
Telugu, but the people in Telangana are poorer and more rural than the people in
Seemandhra. In spite of this, development was happening in Seemandhra and not in
25
Telangana. Political representation was also biased. Of the parliamentary constituencies,
25 were from Seemandhra, whereas 17 were from Telangana.
Altogether, history suggests that Indians have a strong sense of regional identity.
Insofar as this factor contributes to linguistic diversity in a monolingual setting, it could
also drive variation in IE.
2.7. L1 and Social Identity
Our previous discussion of regional identification in India indicated that these
regions are often strongly associated with different languages. In the main, the languages
of south India are Dravidian, but the languages of north India are Indo-Aryan. Regional
differences could therefore reflect linguistic differences, not necessarily because of
proficiency, but because indigenous languages stand in for a social identity.
According to Pattanayak (1990) a "(m)other tongue anchors the child to culture."
He goes on to describe mother tongue as the "expression of primary identity and of group
solidarity." The strong suggestion is that people are identified with certain ethnic,
religious or cultural groups through ones mother tongue. Similarly Tully (1997:160)
suggested that one can obtain a deeper knowledge of a culture only through knowledge of
that culture’s language. Tang (1999) stated simply that “culture is language and language
is culture.” In the case of English in India, it might be that variation in IE is influenced
by the speakers’ identity, and this identity may be best expressed by their mother tongue.
This would mean that L1 influenced IE could be a metric of the speaker’s sense of self
rather than a metric of proficiency.

26
Pingali (2009:6) suggested that “English is not used in domains that are more
emotional and non-intellectual. English is the language of the intellect and formality.”
Similarly, according to Dasgupta (1993), the topic being discussed is often a crucial
determining factor for the language used in India. Politics, education, medicine are likely
to be discussed in English; relationships and emotions are likely to be discussed is one’s
mother tongue, especially by those who are less proficient in English. The claim that IE
and native languages are used in non-overlapping domains receives support in
questionnaire studies (Pandit, 1978; Kachru, 1976; Sridhar, 1989). These studies have
shown that the mother tongue is the preferred language in intimate or affective domains
(family, friends, neighbors, and friends and relatives during weddings etc.), and English
in more formal or utilitarian ones (teachers, strangers on the bus, office and bank
employees, political and technical discussions).
But it is important to understand the dynamic change of attitude towards English
in India in recent years. For example, a recent questionnaire study conducted by
Hohenthal (2003) found that use of English has spread into personal domains. The same
study also found that 90% of her informants considered English an important language
for the development of the country; only 33% of informant perceived Hindi in this way.
If it is true that IE is also being used more now in personal domains, then it may help
account for why IE varies in systematic ways with speakers’ first languages. A mother
tongue codes identity. If IE is being used in place of the mother tongue, then the IE must
code that identity instead. Evidence for a social-identity interpretation of L1-accented
English is provided by Sharma and Sankaran (2009), who found that heritage Punjabi
speakers, born and raised in London, England, frequently used retroflexion, which they

27
recognized as a strong marker of their ethnic identity. Evidence like this is consistent
with the hypothesis that accented IE need not index proficiency; it can also index social-
cultural identity.
It is also well documented in the sociolinguistic literature that participants
produce more vernacular speech in less formal settings, such as interview speech, than in
more formal settings, such as reading passages or word lists (e.g., Labov, 1972). The
effect of formality on variation may reflect a listener-oriented attempt on the part of the
speaker to better approximate a set of standard variants. Labov also suggested that the
most natural style of speech for a speaker comes out in the most casual situations. In
addition, Kiesling (2009) suggested that the position of a speaker varies with respect to a
particular conversation, thus it may vary according to the setting, including the topic of
discourse or the relationship of speaker to listener. Finally, according to Schieffelin and
Ochs (1986) children who learn language in a particular context/environment will tend to
adopt a similar style in the same context even when they are grown. Conversational
setting thus effects a speakers’ use of the vernacular, with more informal and personal
settings encouraging more “accented” speech. This could mean that if English is used to
discuss topics in the personal realm, the Indian speaker may produce more L1-accented
English by way of expressing his or her primary social identity or because it is more
comfortable, homey variety of the language. Identification with language would be less
important when English is used to discuss topics that are associated with the public
domain, such as education and employment. Also, in order to sound more educated and
professional, speakers may aspire to a more standard variety. It is possible that when IE is

28
used in these domains it is produced with less obvious L1-influence than if used in
domains where identity matters more.
2.8. Current Dissertation
In this dissertation, we will examine empirically the question of Indian English
(IE) variation in a multilingual context. The study aim is to understand the nature of IE in
India. Is it merely a highly useful language that is learned by millions of Indians for
pragmatic reasons? Or does IE show some of the hallmark traits of national languages,
including the ability to express regional and social identity? Put another way, we suspect
that IE varies substantially across India. Is this due solely to its status as an L2? Is second
language transfer due to non-native like proficiency or poor teaching, and is this the
entire explanation for IE variation? For that matter, does IE really vary much between
speakers of different L1s when proficiency is controlled? The current dissertation
addresses all these questions by investigating the effect of native language, regional and
social factors on IE pronunciation.
Three experiments were conducted. Experiment 1 investigated the influence of L1
on the segmental and suprasegmental features of IE produced by native Hindi speakers
living in Delhi and native Telugu speakers residing in Hyderabad. All speakers had
attended English-medium schools from primary school onwards, and thus learned GIE as
the target variety of English. The speakers all reported extremely high proficiency in
English and used the language on a daily basis. The findings from this experiment
showed that there is an influence of L1 on IE even when language proficiency is
controlled. Experiment 2 was conducted to disambiguate the effect of region and

29
language on IE pronunciation. English produced by native Hindi and Telugu speakers
residing in Delhi was compared to that produced by native Hindi and Telugu speakers
residing in Hyderabad. The results suggested distinct regional accents, but they also
indicated that Telugu speakers were more likely to adopt the regional variety than Hindi
speakers, suggesting other social factors might also be relevant. Experiment 3 was
conducted to investigate one of these factors; namely, setting. Native Hindi and Telugu
speakers were engaged in an English language conversation that covered topics in both
the personal and neutral domains. The findings were that the L1 influence in IE was
stronger when the topic was personal compared to when it was neutral. Overall, the
findings were taken to suggest that variation in IE does not only reflect variation in
proficiency. Instead, variation has also emerged from sociolinguistic and cultural factors
that cannot be easily parsed out from those associated with proficiency-based transfer.
The implications of the results are discussed in each of the chapters and revisited with
respect to the issue of the symbolic power of IE in the final chapter.
30
CHAPTER III
EXPERIMENT 1: NATIVE LANGUAGE INFLUENCES
The work presented in this chapter was previously reported in a co-authored
article published in the Journal of Phonetics: Sirsa, H., & Redford, M. A. (2013). The
effects of native language on Indian English sounds and timing patterns. Journal of
Phonetics, 41, 393-406.
3.1. Introduction
Native language interference in second language acquisition is well documented
(Lado, 1957; Selinker, 1971; Flege, 1980; Dulay et al., 1982; Lott, 1983; Ellis, 1997;
Carroll, 1964; Beardsmore, 1982). Interference takes the form of automatic transfer of
structures from the L1 to the L2 resulting in variable errors in the learners L2, especially
when L1 and L2 are distinctly different (Ellis, 1997; Dechert, 1983). Many researchers
have suggested that IE phonetics and phonology can be attributed to L1 transfer (Bansal,
1970; Balasubramanian, 1972; Chaswal, 1973; Thundy, 1976; Wells, 1982). Early
investigations of native language influences on IE phonology used the contrastive
analysis framework to compare IE with British English or American English, assumed to
be the purer varieties. The differences found between IE and these varieties were
attributed to L1. More recent studies have compared IE produced by speakers with
different L1s and compared this with the standardized variant, GIE (Maxwell & Fletcher,
2009, 2010; Pickering & Wiltshire, 2000; Wiltshire & Moon, 2003; Wiltshire &

31
Harnsberger, 2006). The results from these studies suggest that L1 influences IE, but that
there are many similarities between IE varieties.
Maxwell and Fletcher (2009, 2010) investigated the acoustic–phonetic
characteristics of IE vowels in L1 speakers of Punjabi and Hindi from northern India.
Although Maxwell and Fletcher noted that both Punjabi and Hindi are Indo-Aryan
languages, they were careful to document differences in the vowel inventories and
suprasegmental features of the two languages based on phonological descriptions of these
languages. Very few differences were observed in the IE vowels produced by the two
groups, but Punjabi speakers produced IE diphthongs with more phonetic variation than
Hindi speakers. Maxwell and Fletcher concluded that Punjabi and Hindi speakers shared
vowel categories for IE monophthongs, but that native language phonology may
influence the representation of IE diphthongs.
In spite of Maxwell and Fletcher’s (2010) conclusion of persistent L1 influences
on IE, their methods leave room for an alternative explanation. In particular, 2 of the 4
Punjabi speakers began English medium education in secondary school. All other
speakers were educated in English from primary school onwards. Thus, variability in age-
of-acquisition may have accounted for the larger degree of phonetic variation observed in
Punjabi speakers' productions of IE diphthongs compared to Hindi speakers' productions
of IE diphthongs (for age of acquisition effects on pronunciation see, e.g., Flege &
Fletcher, 1992; Long, 1990). This possibility is further supported by Maxwell and
Fletcher's acknowledgment that the differences between the groups did not conform to
predictions based on differences in the phonologies of Punjabi and Hindi.

32
Two studies on the realization of prominence in IE have documented only
similarities across speakers with different language background, and so provide no
further evidence for persistent effects of L1 on IE (Pickering & Wiltshire, 2000; Wiltshire
& Moon, 2003). The larger of the two studies (Wiltshire & Moon, 2003) investigated the
effect in speakers of Indo-Aryan (Hindi and Gujarati) and Dravidian (Tamil and Telugu)
languages. These speakers were asked to produce English noun/verb pairs that differed
only in canonical stress placement. There were 10 speakers in each group, and all
speakers had been educated in English from primary school onwards. Multiple acoustic
correlates of prominence (duration, amplitude, and F0 changes) were measured and no
significant differences between Indo-Aryan and Dravidian speakers' productions were
found. IE productions did however differ significantly from American English
productions of the same words. In particular, duration differences between stressed and
unstressed syllables were much smaller in IE productions than in American English
productions, consistent with the reports that IE is syllable-timed rather than stress-timed
(Gargesh, 2004). IE productions also differed from American English in the direction of
pitch change from prominent to non-prominent syllables.
In contrast to the Wiltshire and Moon (2003) study, Wiltshire and Harnsberger
(2006) reported some L1-dependent differences in the production of IE rhotics, voiceless
stops, and pitch accents. Five Gujarati (Indo-Aryan) and 5 Tamil (Dravidian) speakers of
IE produced English word lists, isolated sentences, and a read passage for later acoustic–
phonetic analysis and a transcription-based analysis of intonation. These analyses
indicated many similarities across the categories examined, but also a few differences
across groups. For example, Gujarati and Tamil speakers of English produced the high

33
and mid back vowels differently from one another and from the canonical descriptions of
GIE back vowels. One of the differences between Gujarati English and descriptions of
GIE, namely the near merger of /u/ and /ʊ/ in Gujarati English, was attributed to the
absence of a short, high back vowel in Gujarati. The other differences observed could not
be explained with reference to the L1 of the speaker.
Consonantal and intonational differences were also noted in the English produced
by Gujarati and Tamil speakers. Specifically, there was substantial variation in the
production of rhotics across speakers, but unlike Gujarati speakers, Tamil speakers also
produced a Tamil-style fricativized approximant in this category. Tamil speakers of
English also produced longer VOTs than Gujarati speakers of English. And while both
Tamil and Gujarati speakers of English produced many more pitch accents per utterance
than would be typical in American or British English, there were also L1 related
differences in proportion of rising versus falling pitch accents. The sum of these
segmental and suprasegmental differences led Wiltshire and Harnsberger to conclude that
the effects of L1 on IE may “supersede GIE norms (p. 103).” This conclusion is
consistent with the view that IE representations are persistently influenced by the L1 of
its speakers, and so may lack a stable phonology that is characteristic of a dialect.
Although the Wiltshire and Harnsberger (2006) study is comprehensive, their
conclusion that IE is strongly influenced by L1 might be called into question for two
reasons. First, like Maxwell and Fletcher (2010) who found some subtle L1 effects on IE,
Wiltshire and Harnsberger's study included speakers who were first exposed to English at
different ages. Three of the five Tamil speakers were educated in English from the
beginning of primary school. The other two were first exposed to English later: one

34
began English medium education in the 3rd grade (age 9), and one in higher secondary
school (age 15). The Gujarati speakers were more homogeneous in that all had been
educated in English from primary school onwards. The variability in age of acquisition
could account for the differences observed between groups, and especially for why Tamil
speakers were found to occasionally use a Tamil-style fricativized approximant for the
English rhotic.
The second reason that we might call into question Wiltshire and Harnsberger's
(2006) conclusion that L1 influences supersede GIE norms is that no comparable L1 data
are presented. Here, a number of similarities between the groups are at issue. Although
some of these were interpreted as more consistent with similarities between Tamil and
Gujarati when different than GIE, no empirical data is offered to support this
interpretation. In fact, with the exception of the Pickering and Wiltshire (2000) study,
none of the acoustic–phonetic investigations of L1 influences on IE compare the
segmental and suprasegmental characteristics of L1 and IE in the same speakers. The
Pickering and Wiltshire (2000) study does however support Wiltshire and Harnsberger's
idea that similarities across indigenous Indian languages may account for similarities in
the IE produced by speakers with different language backgrounds. In particular,
Pickering and Wiltshire found that the variable of interest in that study, prominence
realization, was the same in the IE and across the different L1s of their 3 speakers.
If both the similarities and differences in IE sound patterns across groups can be
attributed to the native languages of the speakers, then the acquisition of IE sound
patterns may simply involve the selective transference of L1 categories to L2. An
alternative hypothesis is that Indians acquire a common IE phonology that is distinct

35
from their native language phonology. This latter hypothesis does not contradict the idea
that IE phonology reflects indigenous Indian languages influences; it merely suggests that
these influences are historical in nature. To test between these competing hypotheses, we
investigated the perceptual and acoustic similarities and differences of IE produced by
native Hindi and native Telugu speakers, all of whom had been educated in English from
primary school onwards. We also investigated acoustic similarities and differences
between the native languages of the speakers.
We focused on native Hindi and Telugu speakers' production of IE because Hindi
has the most speakers among the Indo-Aryan language family, and Telugu among the
Dravidian language family. Hindi is the official language of 11 states, and its speakers
account for 41.03% of total population of India. Telugu is an official language of Andhra
Pradesh, and its speakers account for 7.19% of the total population of India. Hindi and
Telugu are also known to be phonologically distinct: Hindi has a larger phonemic
inventory than Telugu (Maddieson, 1984). The Hindi vowel inventory includes a tense-
lax distinction and a quantity difference as well as a central vowel: /i, i:, e:, ɛ, æ, ə, a, ɔ,
o:, u, u:/ (Ohala, 1999). In contrast, the Telugu vowel inventory includes just 5 vowels
and a phonemic length contrast, /i:, i, e:, e, a:, a, o:, o, u:, u/, as well as a low-front vowel
/æ:/ in borrowed English words (Krishnamurti, 1972). Although Hindi and Telugu
consonantal inventories are roughly similar in size, as shown in Appendix I, the Telugu
set is functionally smaller than the Hindi set because the contrasts due to voicing and
aspiration are strictly features of written or literary Telugu in the retroflex, palatal, and
velar series (Krishnamurti, 1972:5). Also, there is some indication that Hindi and Telugu
may vary in the degree of retroflexion for particular speech sounds (Ladefoged &

36
Bhaskararao, 1983). Finally, Hindi and Telugu are both described as quantity sensitive
languages, but default stress is on the last syllable in Hindi and on the first in Telugu
(Ohala, 1999; Srinivas, 1992). Hindi has been described as a syllable-timed language
(Crystal, 1995; Dauer, 1983), and Telugu as mora-timed (Murty, Otake, & Cutler, 2007).
We investigated the similarities and differences in IE as a function of native
language using global perceptual analyses, and specific acoustic measurements. Naïve
and experienced listeners provided perceptual judgments on IE sentences produced by
different speakers. The listeners had to determine whether the speakers had the same or
different native languages. The naïve listeners were native speakers of American English
with little exposure to IE; the experienced listeners were native Hindi or Telugu speakers
and fluent IE speakers. We expected that naïve listeners would only be able to distinguish
between IE produced by native Hindi and Telugu speakers if speaker’s native language
strongly influences IE production. We expected that experienced listeners might be able
to distinguish between IE produced by Hindi and Telugu speakers if native language
effects on IE are subtle and salient to regional or social identity.
The acoustic measurements focused on vowel and obstruent production as well as
on temporal patterns that contribute to the perception of language rhythm, which
reportedly differs in Hindi and Telugu. We reasoned that if IE involves the transference
of native language categories, then IE sound patterns produced by Hindi and Telugu
speakers should parallel the native language sound patterns produced by the same
speakers. If IE phonology is acquired separately from native language phonology, then
there should be little to no measurable differences in the IE sound patterns produced by

37
Hindi and Telugu speakers, and measurable differences in the native language sound
patterns produced by the same speakers.
3.2. Methods
3.2.1. Participants
Fourteen IE speakers provided speech samples for the present experiment. Seven
speakers had Hindi as their native language and 7 had Telugu as their native language.
Three of the Hindi speakers were female and 4 were male. Five of the Telugu speakers
were female and 2 were male. All speakers were between the ages of 20 and 35 years old.
All speakers were exposed to English education from the 1st grade onwards (age 6), and
all continued to be educated in English through college. Five of the native Hindi speakers
and 5 of the native Telugu speakers were residing in India at the time of the experiment.
The remaining 4 IE speakers were residing in Oregon (Eugene or Portland), but had been
in the United States for less than 6 months at the time of recording. All Hindi speakers
were from Delhi and all Telugu speakers were from Hyderabad. All the Indian English
speakers and listeners are exposed to English taught by the teachers who are native
speakers of one of the indigenous languages of India rather than native speakers of
English (British or American English). Thus the input variety of English is the codified
and standard variety of Indian English – GIE.
Ten naïve listeners and 10 experienced listeners participated in the perceptual
judgment task that compared IE produced by native Hindi and Telugu speakers. Ten
additional naïve listeners participated in a perceptual judgment task that compared Hindi
and Telugu. The naïve listeners were American-English speaking undergraduates from

38
University of Oregon, who received course credit for their participation. The experienced
listeners were 4 native speakers of Hindi and 6 native speakers of Telugu, who were
residing in Eugene, Oregon, and had been in the United States for at least one year. None
of the experienced listeners were acquainted with any of the Indian speakers who
provided the spoken material for the experiment.
3.2.2. Material
The language samples were sentences from different language versions of a story
familiar to all Indians; that of Lord Ganesha and his adventurous ride on his mouse at
night on Ganesha Puja. The English version was obtained on-line from http://pz26.com
(accessed summer 2009). The story was then translated, sentence-by-sentence, into Hindi
and Telugu by native speakers of these languages. The translations were then checked
against the intuitions, a multilingual speaker with native-like fluency in Hindi, Telugu,
and English.
Each story consisted of 13 sentences that varied in length from 11 to 49 syllables
in English, from 12 to 43 syllables in Hindi, and from 15 to 53 syllables in Telugu.
Appendix II provides the text for each language. The English, Hindi, and Telugu
sentences were printed on separate cards in native orthographies (Roman, Devanagari,
and Brahmi scripts, respectively). The cards were then shuffled to randomize sentence
order before being presented to speakers. The randomization process was used to avoid
storytelling prosody.

39
3.2.3. Production Task
The participants were given a stack of cards that were either in their native
language (Hindi or Telugu) or in English. If participants were given cards with sentences
in their native language, they were then instructed either in Hindi or Telugu to look
through the cards to familiarize themselves with the text. If they were given cards with
sentences in English, they were instructed to do so in English. Participants were then
asked to read the sentences on each card at a comfortable speed. Participants read through
the entire stack in one language, and then the process was repeated for the other language
with instructions given in the language that corresponded to the language of the cards.
Participants then took a break before returning to the first stack to repeat the process.
Participants alternated between stacks (languages) in this way until 3 repetitions of all the
sentences had been obtained for each of the languages. The cards were shuffled between
each re-reading so that the sentences were read in a new random order every time they
were read. Participants were recorded in a quiet room using a Shure professional
unidirectional microphone and a Marantz Professional PMD660 portable solid-state
recorder. All measures reported in this paper were taken from either the second or third
repetition of the sentences. The third repetition was used if the second repetition was not
fluently spoken.
3.2.4. Perceptual Judgment Task
On each trial, naïve and experienced listeners were presented with the most fluent
IE renditions of two different sentences produced by different IE speakers (sentences 5
and 8, see Appendix II). A second group of naïve listeners were also presented with the

40
most fluent native language renditions of these same two sentences on every trial. The
same pair of different speakers was never repeated for a particular sentence order (5, 8 or
8, 5) in either language task. In half of the stimuli, the different speakers had the same
native language background. In the other half, the different speakers had different native
language backgrounds. The same and different stimuli were amplitude normalized (70
dB) and presented in random order over headphones to listeners, who were seated in front
of a computer in a quiet experimental room. Listeners were instructed that they would
hear speech samples from native Hindi speakers and native Telugu speakers. They were
then told that their job was to listen to each pair of sentences and judge whether the
different speakers had the same language background or different language backgrounds.
Judgments were to be made on a 5-point scale, where “1” equaled a confident “same”
judgment and “5” equaled a confident “different” judgment. The scale was presented on a
computer monitor, and the listeners indicated their response by clicking on the box with
the number that corresponded to their judgment. We expected that only experienced
listeners might be able to tell the difference in IE produced by speakers with different
language backgrounds if the differences were subtle. We expected that naïve listeners
would be able to distinguish between Hindi and Telugu, since these languages are
reported to differ phonologically.
Perceptual judgments on the paired sentences took approximately 25 minutes to
complete. Preliminary analyses indicated that 1 of the 10 naïve listeners who made
judgments on IE defaulted to a single judgment and then did not complete the task as
required. The judgments from this listener were therefore excluded from further analysis.

41
For each of the response options the total number of responses was calculated within
speaker language background and listeners’ experience.
3.2.5. Acoustic Measurements
Acoustic measurements were also used to investigate group differences in the
production of IE as well as the similarities and differences between Hindi and Telugu. A
number of segmental and suprasegmental characteristics were chosen for analysis
including vowel quality, degree of retroflexion for /ʈ/ and /ɖ/, extent of aspiration for
voiceless stops, the spectral characteristics of /s/, and temporal patterns associated with
lexical stress, phrase final lengthening, language rhythm, as well as a measure of speech
rate. The measurement procedures are described in more detail next.
Vowels: Using the Praat speech processing software (Boersma & Weenink, 2011),
utterances were displayed and segmented into consonantal and vocalic intervals. F1 and
F2 values were extracted automatically at the midpoint of every vowel using formant
tracking and a script. Every measure was also visually inspected and when a mismatch
between the tracks and the formant band in the spectrogram was detected, script
parameters were changed until a proper match was obtained. Formant values were then
normalized using the Lobanov method (Thomas & Kendall, 2007) to control for
variability due to speaker vocal tract characteristics. Normalized F1 and F2 and the ratio
of F1 to F2 were used as dependent variables in the analyses of vowel quality.
Consonants: Six words with post-vocalic retroflex consonants were chosen from
the IE, Hindi, and Telugu sample (see Table 3.1) to investigate the degree of retroflexion
across languages. Retroflexion was quantified as the difference between F3 and F2 at

42
vowel offset, which was meant to characterize the degree of F3 depression due to
retroflexion (Wiltshire & Harnsberger, 2006). As with the vowel measures, values at F2
and F3 offset were extracted automatically, but the formant tracks for every measure
were visually inspected and parameters were adjusted if there was a mismatch between
the tracks and the visible formant bands on the spectrogram.
Table 3.1. List of words with retroflex stops /ʈ, ɖ /, voiceless stops /p, k/ and fricative /s/
in English, Hindi and Telugu.
Obstruent English Hindi (= gloss) Telugu (=gloss)
/ʈ/ /hɪʈ/ “hit” /peʈ/ (stomach) /ʧuʈʈu/ (around)
/kᴐʈ/ “caught” /fəʈ/ (rip off) /kəʈʈu/ (tie)
/gᴐʈ/ “got” /ghəʈnɑ/ (event) /pᴐʈʈɑ/ (stomach)
/ɖ/ /lᴐrɖ/ “lord” /pɑkəɖ/ (hold) /ʧeɖɖɑ/ (bad)
/lɑɖɖu/ “laddoo” /lɑddu/ (Indian sweet) /lɑddu/ (Indian
sweet)
/roɖ/ “road” /bɑɖɑ/ (big) /roɖɖu/ (road)
/p/ /pɚsnalɪti/ “personality” /pəsand/ (like) /pəɖɪndi/ (fell)
/pʊld/ “pulled” /puja/ (worship) /puji/ (worship)
/əpon/ “upon” /pure/ (whole) /apuɽu/ (that time)
/k/ /kəpɛsɪti/ “capacity” /kaha:ni/ (story) /kada/ (story)
/kɔʈ/ “caught” /ka:ran/ (reason) /kaʈʈu/ (tie)
/kɚsd/ “cursed” /kar/ (do) /kalʊgʊ/ (happen)
/s/ /səmθɪŋ/ “something” /sa:np/ (snake) /sarɪkɪ/ (as a result)
/tasks/ “tusks” /uska/ (his) /ʧuste/ (if sees)
/si/ “see” /vese/ (as a result) /tisi/ (pull out)

43
Six words with syllable-initial voiceless stops were chosen from the IE, Hindi,
and Telugu sample (Table 3.1) to investigate aspiration across languages. Aspiration was
quantified using VOT. With regards to these measures, 3 of the Hindi speakers and 6 of
the Telugu speakers produced at least one stop with multiple bursts. When this occurred,
VOT was measured from the last burst to voicing onset.
Finally, three additional words were chosen from the IE, Hindi, and Telugu
sample (Table 3.1) to compare non-final syllable /s/ production across the 3 languages.
Some studies have shown that spectro-temporal properties of /s/ vary with language
contact (Erker, 2012). An effect of first language on the production of /s/ in IE might be
anticipated based on the differences in the phonemic inventories of Hindi and Telugu:
Hindi has /s/ in contrast to /ʃ/ and /z/, whereas Telugu has /s/ in opposition to /ʃ/ and to
/ʂ/. The spectral characteristic of /s/ across the 3 languages was captured by a center of
gravity (COG) measurement.
Suprasegmentals: Twelve disyllabic words were selected to investigate temporal
patterns associated with lexical prominence, which help to define language rhythm
(Dauer, 1983). The English words were further categorized according to their dictionary-
defined prominence pattern (trochaic or iambic). We attempted to match the prominence
patterns of the English words with prominence patterns in Hindi and Telugu words
following the quantity-sensitive stress rules for the different languages and the intuition
on prominence placement. Table 3.2 provides the list of words selected for this analysis.
Lexical prominence was captured as the ratio of first vowel duration to second
vowel duration in the disyllabic word (V1:V2) since duration represents the best correlate

44
of lexical prominence in English (Huss, 1978) and since the temporal pattern
corresponded best with our interest in rhythm.
Table 3.2. Disyllabic words selected from English, Hindi, and Telugu texts for analyzing
lexical stress.
Language Trochaic pattern Iambic pattern
English after, nothing, something, stomach, story,
temper, very, witnessed
event, himself, respect,
result
Hindi dekha, galti, gusse, jese, mani, niche,
puja, pure
ise, laddu, lekin, pakad
Telugu meda, mani, oka, pedda, peru, poṭṭa, puji,
velli
kopam, laddu, tatar
Phrase final lengthening also contributes to the perception of language rhythm
(Nooteboom, 1997). Final lengthening in IE, Hindi, and Telugu was assessed by dividing
the final vowel duration by penultimate vowel duration in the sentence for each of the 13
sentences.
Finally, we calculated several global rhythm metrics based on interval duration
and speech rate. These measures have all been used to distinguish between languages
from different rhythm classes (Dellwo, 2010; Grabe & Low, 2002; Ramus, Nespor, &
Mehler, 1999). Although we acknowledge the controversy surrounding the hypothesis
that interval duration measures adequately convey language rhythm (see, e.g., Arvaniti,
2009), we also note that the measures provide an objective description of vocalic and
consonantal durations, and these are at least in part correlated with long-established
notions of rhythm.
The interval duration measures used in the current experiment were as follows:
the proportion of vowel duration to total speech duration in a sentence (%V, Ramus et al.,
1999); the standard deviation of consonant duration for each sentence (ΔC, Ramus et al.,
45
1999); and the normalized weighted summed difference of sequential vowel durations
across a sentence minus the final syllable (nPVI, Deterding, 2001; Grabe & Low, 2002).
Speech rate was calculated as the number of vowel intervals (=syllabic nuclei) per second
of speech for each sentence, following one of the measures used by Dellwo (2010).
3.2.6. Analyses
The perception data were analyzed using an ordinal logistic regression model in
SPSS. We used the listener’s response (1-5) as the dependent variable. Speakers’ native
language and listeners’ experience were entered into the analysis as predictors. The
ratings were also z-transformed within each listener so that the results could be visualized
using a normally distributed dependent measure, comparable across listeners.
For the acoustic data linear mixed effects modeling was used to investigate the
effect of native language on IE as well as on the similarities and differences of the sound
patterns of the native languages involved. The analysis investigated the fixed effects of
speakers’ native language (Hindi or Telugu speakers) and language task (IE or L1) on the
various acoustic measures. Segment identity was an additional fixed factor in the analysis
on retroflexion and aspiration. The English lexical prominence pattern was an additional
fixed factor in the analysis on V1:V2 duration. Again, item (word or sentence) and
speaker were treated as random factors. All results are given with the denominator
degrees of freedom rounded to the nearest whole number.

46
3.3. Results
American-English speaking listeners were less able to distinguish between
English sentences produced by native Hindi and Telugu speakers than native Hindi and
Telugu speaking listeners, but the naïve listeners easily distinguished between Hindi and
Telugu sentences. Moreover, naïve listeners were better able to differentiate between
Hindi and Telugu than experienced listeners were able to differentiate between English
produced by Hindi and Telugu speakers. The acoustic measures were consistent with the
perceptual results. Although Hindi and Telugu differed on almost every measure, the
English produced by native Hindi and Telugu speakers differed on only 3 measures.
These results are presented in detail below.
3.3.1. Perceptual Judgments
The analysis of similarity ratings on IE sentences as a function of speakers’ native
language (Hindi or Telugu) and listener experience (naïve or experienced listener)
revealed a simple effect of speakers’ native language, χ2
(1) = 8.40, p = .004, and a
significant interaction between speakers’ native language and listener experience, χ2
(1) =
41.37, p < .001. The significant interaction is shown in Figure 3.1.
Analyses on ratings split by listener experience indicated that the effect of
speakers’ native language was significant for both naïve American-English speaking
listeners χ 2
(1) = 6.25, p = .012, and for experienced Hindi and Telugu speaking listener
[χ 2
(1) = 44.08, p < .001]; however, it was only experienced listeners who could
accurately differentiate English sentences produced by native Hindi speakers from those
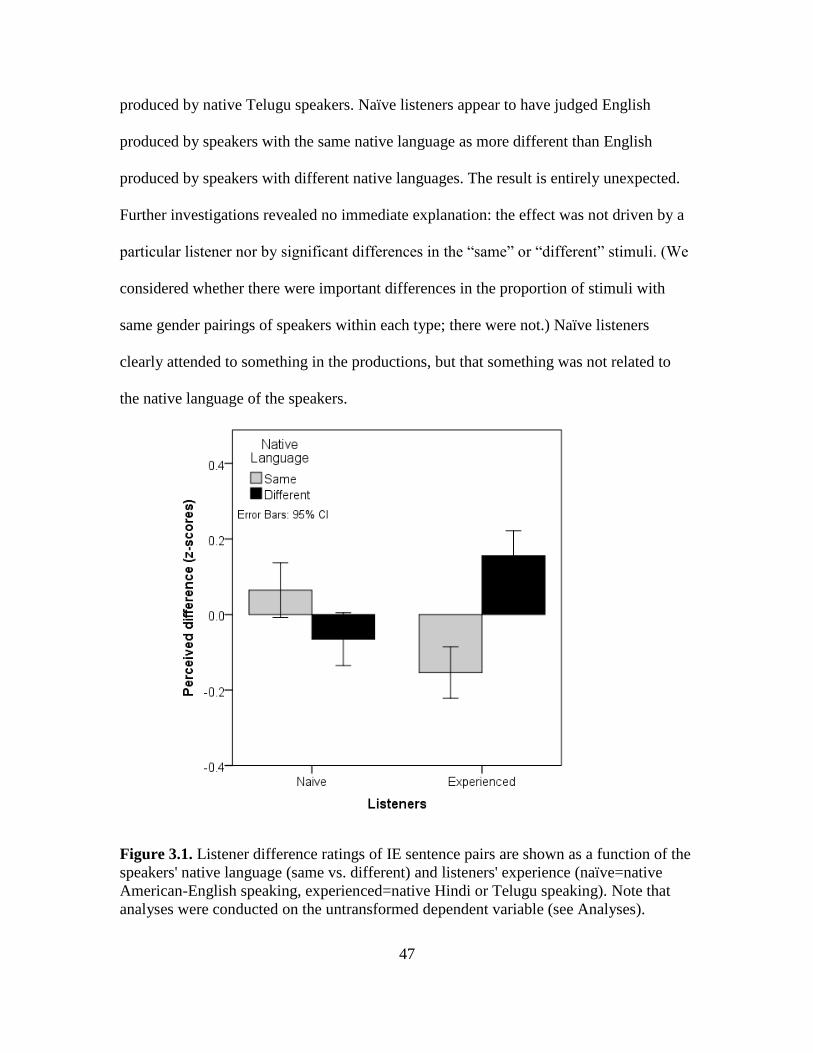
47
produced by native Telugu speakers. Naïve listeners appear to have judged English
produced by speakers with the same native language as more different than English
produced by speakers with different native languages. The result is entirely unexpected.
Further investigations revealed no immediate explanation: the effect was not driven by a
particular listener nor by significant differences in the “same” or “different” stimuli. (We
considered whether there were important differences in the proportion of stimuli with
same gender pairings of speakers within each type; there were not.) Naïve listeners
clearly attended to something in the productions, but that something was not related to
the native language of the speakers.
Figure 3.1. Listener difference ratings of IE sentence pairs are shown as a function of the
speakers' native language (same vs. different) and listeners' experience (naïve=native
American-English speaking, experienced=native Hindi or Telugu speaking). Note that
analyses were conducted on the untransformed dependent variable (see Analyses).

48
The analysis of naïve listeners’ similarity ratings on IE and L1 sentences also
revealed a significant effect of language task, χ 2
(1) = 11.38, p = .001, significant effect
of speakers’ native language, χ 2
(1) = 26.25, p < .001 and significant interaction effect of
language task and speakers' native language, χ 2
(1) = 77.60, p < .001. It is clear from
Figure 3.2 that the interaction was due to the fact that naïve American-English speaking
listeners were very clearly able to appropriately differentiate Hindi from Telugu
sentences. Listener difference ratings of IE sentence pairs are shown as a function of the
speakers' native language (same vs. different) and listeners' experience (naïve = native
American-English speaking, experienced = native Hindi or Telugu speaking).
Figure 3.2. Naïve listener difference ratings on IE and L1 sentence pairs are shown as a
function of the speakers' native language (same vs. different). Note that analyses were
conducted on the untransformed dependent variable (see Analyses).
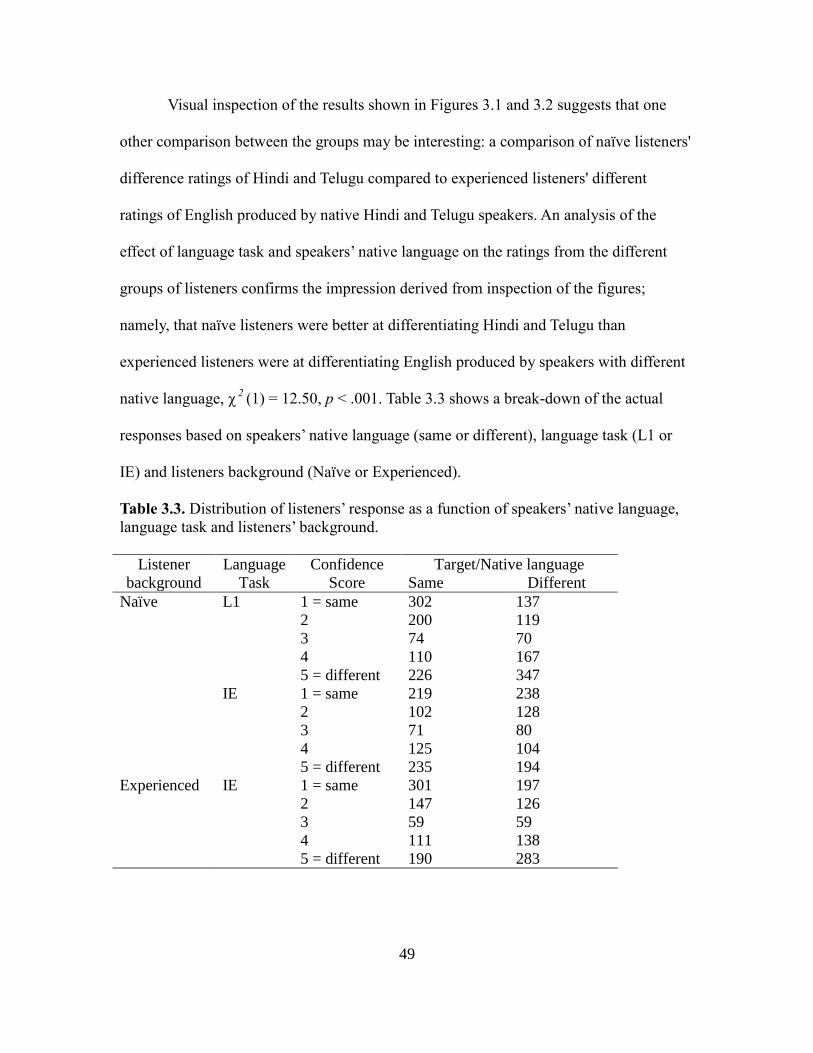
49
Visual inspection of the results shown in Figures 3.1 and 3.2 suggests that one
other comparison between the groups may be interesting: a comparison of naïve listeners'
difference ratings of Hindi and Telugu compared to experienced listeners' different
ratings of English produced by native Hindi and Telugu speakers. An analysis of the
effect of language task and speakers’ native language on the ratings from the different
groups of listeners confirms the impression derived from inspection of the figures;
namely, that naïve listeners were better at differentiating Hindi and Telugu than
experienced listeners were at differentiating English produced by speakers with different
native language, χ 2
(1) = 12.50, p < .001. Table 3.3 shows a break-down of the actual
responses based on speakers’ native language (same or different), language task (L1 or
IE) and listeners background (Naïve or Experienced).
Table 3.3. Distribution of listeners’ response as a function of speakers’ native language,
language task and listeners’ background.
Listener
background
Language
Task
Confidence
Score
Target/Native language
Same Different
Naïve L1 1 = same 302 137
2 200 119
3 74 70
4 110 167
5 = different 226 347
IE 1 = same 219 238
2 102 128
3 71 80
4 125 104
5 = different 235 194
Experienced IE 1 = same 301 197
2 147 126
3 59 59
4 111 138
5 = different 190 283

50
Taken together, the similarity ratings on IE sentences by naïve and experienced
listeners indicate perceptible effects of L1 on IE, albeit fairly subtle ones that are only
identified by experienced listeners. Note that the results on ratings of Hindi vs. Telugu
show that naïve listeners' are very good at picking up on phonological differences when
these are sufficiently robust.
3.3.2. Acoustic Measurements
The next set of analyses addressed the effect of language task and speakers’
native language on the production of specific segmental and suprasegmental attributes.
The results on vowel production are presented first, followed by those on retroflexion,
aspiration, /s/ production, lexical stress, final lengthening, and rhythm, in that order.
The IE and L1 vowels are plotted in Figure 3.3 according to their normalized F1
and F2 values and shown as a function of speakers’ native language. A qualitative
comparison of the different vowel spaces depicted in the figure suggests that IE does vary
somewhat with speakers’ native language, but the differences between IE and the L1s are
more striking. Quantitative analyses were conducted to determine which, if any, of the
differences evident in Figure 3.3 were systematic enough across speakers to be
statistically significant. In particular, the analyses investigated the effects of native
language and language task on F1 and F2 separately; the focus was just on F1 and F2
because these contribute the most to vowel perception (Fry, 1979; Aylett, 1996).
Analyses of F2 revealed significant effect of task on /e/, F(1, 24) = 10.27, p
=.004. This vowel was more centralized in IE compared to the L1. Analyses on F1
revealed a suite of high and mid vowels that were lower in IE compared to L1: /i/, F(1,

51
24) = 8.02, p = .009; /e/, F(1, 24) = 24.78, p < .001; /ɔ/, F(1, 24) = 68.89, p < .001; /o/,
F(1, 18) = 35.04, p < .001; /ʊ/, F(1, 24) = 18.44, p = .001. Figure 3.3 shows that IE
vowels are more centralized compared to the L1 vowels, suggesting different vowel
spaces for IE and the L1s. There were also significant effects of native language on F1
for /i/, F(1, 24) = 4.47, p = .045, and /e/, F(1, 24) = 6.87, p = .015, and a significant
interaction between task and native language for /ɪ/, F(1, 17) = 4.88, p = .041. If we
interpret these results with reference to the group mean values shown in Figure 3.3, we
find that the main effects were due to Hindi speakers producing more raised front vowels
/i/ and /e/ than Telugu speakers across the language tasks. The interaction was due to a
relatively raised /ɪ/ in Hindi compared to Telugu, but similar productions of /ɪ/ in IE
regardless of speakers’ native language.

52
Figure 3.3. The monophthongal vowel space is shown for IE (top) and L1 (bottom) as a
function of speakers’ native language. Vowel measures were taken at the F1 and F2
midpoint and normalized using the Lobanov method (note: i=/i/ or /i:/, I=/ɪ/ or /i/, e=/e/ or
/e:/, E=/ɛ/ or /e/, A=/æ/, a=/ɑ/ or /ɑ:/, 3=/ə/, 3r=/ɚ/, o=/o/ or /o:/, O=/ɔ/ or /o/, u=/ʊ/ or /u/,
u=/u/ or /u:/).
With respect to degree of stop retroflexion, an analysis of the difference between
F3 and F2 at vowel offset indicated no significant main effects of speakers’ native
language, language task or consonant type, but there was a significant 2-way interaction
between native language and consonant type, F(1, 134) = 4.35, p = .039, and 3-way
interaction between these factors, F(1, 134) = 7.48, p = .007. This result, shown in Figure
3.4 appears to have been due to similar degrees of retroflexion across consonant types in
IE compared to the L1, and a native language difference in the consonant that was
produced with more retroflexion (i.e., a smaller difference in F2 and F3 offset). Hindi
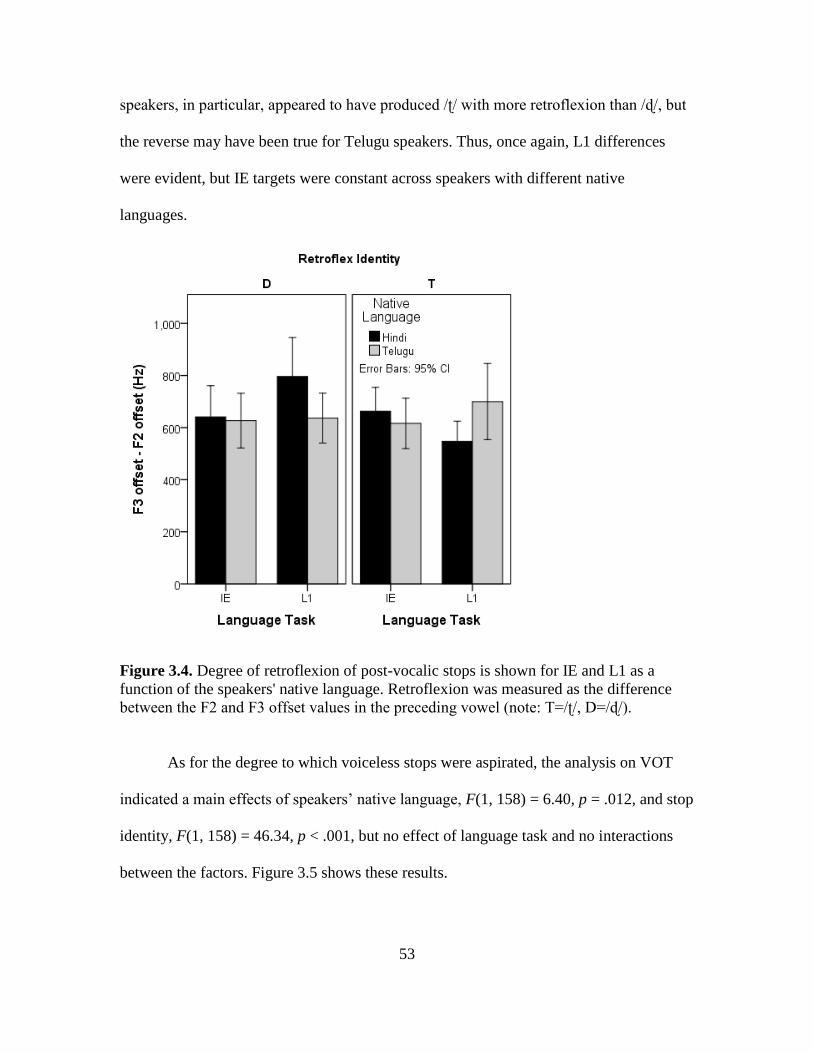
53
speakers, in particular, appeared to have produced /ʈ/ with more retroflexion than /ɖ/, but
the reverse may have been true for Telugu speakers. Thus, once again, L1 differences
were evident, but IE targets were constant across speakers with different native
languages.
Figure 3.4. Degree of retroflexion of post-vocalic stops is shown for IE and L1 as a
function of the speakers' native language. Retroflexion was measured as the difference
between the F2 and F3 offset values in the preceding vowel (note: T=/ʈ/, D=/ɖ/).
As for the degree to which voiceless stops were aspirated, the analysis on VOT
indicated a main effects of speakers’ native language, F(1, 158) = 6.40, p = .012, and stop
identity, F(1, 158) = 46.34, p < .001, but no effect of language task and no interactions
between the factors. Figure 3.5 shows these results.
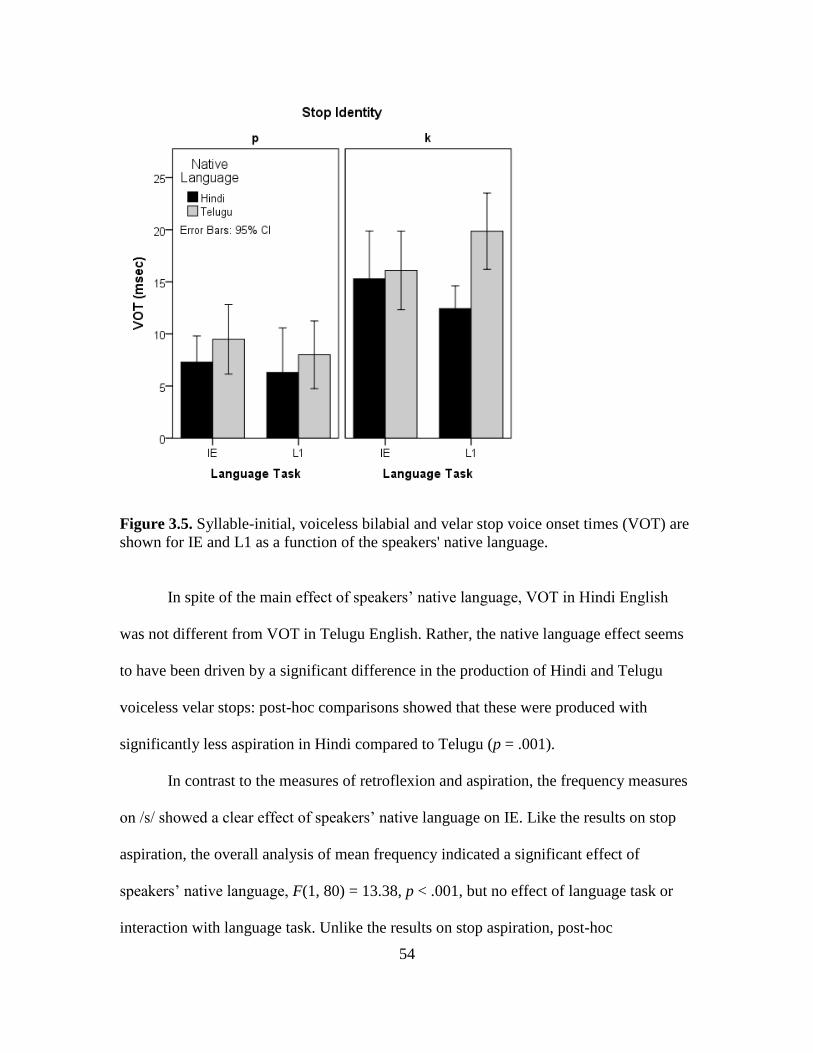
54
Figure 3.5. Syllable-initial, voiceless bilabial and velar stop voice onset times (VOT) are
shown for IE and L1 as a function of the speakers' native language.
In spite of the main effect of speakers’ native language, VOT in Hindi English
was not different from VOT in Telugu English. Rather, the native language effect seems
to have been driven by a significant difference in the production of Hindi and Telugu
voiceless velar stops: post-hoc comparisons showed that these were produced with
significantly less aspiration in Hindi compared to Telugu (p = .001).
In contrast to the measures of retroflexion and aspiration, the frequency measures
on /s/ showed a clear effect of speakers’ native language on IE. Like the results on stop
aspiration, the overall analysis of mean frequency indicated a significant effect of
speakers’ native language, F(1, 80) = 13.38, p < .001, but no effect of language task or
interaction with language task. Unlike the results on stop aspiration, post-hoc

55
comparisons indicated that the difference between speakers’ native language was
significant for IE (p = .021) as well as for the L1 (p < .001). Figure 3.6 shows that Hindi
speakers produced /s/ with a lower average frequency in English and in their L1
compared to Telugu speakers.
Figure 3.6. The average frequency of syllable-initial /s/ is shown for IE and L1 as a
function of the speakers' native languages (L1).
The analyses on suprasegmental temporal patterns indicated a minimal effect of
native language on IE, but substantial differences in the sound patterns of Hindi and
Telugu. For example, the results on temporal patterns associated with lexical stress in
English indicated a significant effect of speakers’ native language, F(1, 297) = 29.84, p <
.001, and stress pattern, F(1, 297) = 5.18, p = .024, on the vowel-to-vowel duration ratio.
There was also a significant interaction between speakers’ native language and task, F(1,

56
297) = 9.12, p = .003. When the data were split by language task, the effect of speakers’
native language was significant for L1 disyllabic words, F(1, 140) = 39.09, p < .001, but
not for IE. Of course, the effect of lexical stress pattern was significant in IE, F(1, 157) =
8.50, p = .004, but not in the L1s. The results are shown in Figure 3.7.
Figure 3.7. IE and native language (L1) lexical stress in disyllabic words, measured as
the ratio of the duration of the first vowel to the duration of the second, is shown as a
function of speakers' native language (Hindi and Telugu).
We can see in Figure 3.7 that trochaically- and iambically-stressed English words
were differentiated regardless of the speakers’ native language, and that the striking
differences between Hindi and Telugu speakers occurred in the L1s where disyllabic
words were produced either with a long V2 relative to V1 (Hindi) or a long V1 relative to
V2 (Telugu). Thus, the results once again indicated a strong contrast between Hindi and

57
Telugu, but none in the IE produced by Hindi and Telugu speakers. The difference in this
stress pattern in Hindi and Telugu speakers must be due to the fact that Hindi is more
stress-timed than Telugu. The literature strongly points to the view that Hindi speakers
have intuitions with respect to the location of stress in Hindi words. Arun (1961:21)
claimed that “stress is not so prominent in Hindi as in English. However, it is sometimes
phonemic”. Similarly, Mehrotra (1965) suggested that stress plays a vital part in Hindi,
although not as vital as in English, or Russian, or Greek. In addition, the current
experiment suggests an effect of L1 on rhythm with Hindi speakers having higher
variability in vowel duration than Telugu speakers.
In contrast to the results on lexical prominence patterns, the results on phrase-
final lengthening suggested an effect of native language on IE. The overall analysis
indicated a main effect of speakers’ native language on the measure of final lengthening,
F(1, 347) = 4.33, p = .038, but no effect of language task or any interaction between the
factors. Post-hoc analyses indicated that the effect of speakers’ native language on final
lengthening was not significant within each language, so the effect was small (see Figure
3.8). Overall, Hindi speakers engaged in more phrase-final lengthening than Telugu
speakers regardless of the language they were speaking.
Finally, the analyses on global rhythm metrics and speech rate suggested that IE
has a rhythm pattern that is distinct from either Hindi or Telugu, and that the native
language has little influence on speakers' production of IE rhythm. Specifically, the
analyses indicated an effect of speakers’ native language on ΔC F(1, 166) = 3.96, p =
.048 and on speech rate, F(1, 163) = 69.28, p < .001, an effect of language task on %V,
F(1, 171) = 122.11, p < .001, ΔC, F(1, 164) = 11.63, p = .001 and speech rate F(1, 151) =

58
257.23, p < .001, and an interaction between speakers’ native language and language task
on speech rate, F(1, 151) = 148.44, p < .001.
Figure 3.8. Phrase-final lengthening, measured as the ratio of the ultimate vowel duration
to the penultimate vowel duration, is shown for IE and the speakers' native languages
(L1) as a function of the speakers' native language.
Post-hoc comparisons indicated no significant effect of speakers’ native language on any
of the measures in IE, but a significant effect of speakers’ native language on L1 ΔC (p =
011), and speech rate (p < .001). Note that there were no significant main effects or
interactions on nPVI. The significant results are shown in Figure 3.9.
Although the %V value (46.8%) in IE was lower than the values for Hindi
(52.3%) and Telugu (51.2%), it was still much higher than that reported for the
canonically stress-timed language, British English (41.1%; Grabe & Low, 2002).

59
Figure 3.9. Several global measures of language rhythm are shown for IE and L1 as a
function of the speakers' native language. The top panel shows the results for the average
percent of vowel duration (bars) and the standard deviation in consonant duration (line)
across each phrase. The bottom panel shows the results for speaking rate, also calculated
separately for each phrase.

60
Similarly, the ΔC value for IE (29.7) was marginally higher than the value for Hindi
(28.6) and for Telugu (26.4), but much lower than that reported for British English (54;
Ramus et al., 1999). Of course, the interval-based measures, including speech rate, are
sensitive to a variety of factors that are not strictly rhythmic, and so a cross-study
comparison of mean values should be interpreted with caution. The comparison does,
nonetheless, support the intuition that timing in IE is significantly different than timing in
British English. We have further shown here that the timing of IE is also substantially
different from that of two indigenous Indian languages.
In sum, the acoustic measures indicated some effects of native language on IE. In
particular, there were L1 effects on IE /i/, /e/, /ɑ/, and /u/, on the articulation of /s/, and on
final lengthening. The L1 effect on vowels and final lengthening can be interpreted with
respect to the values obtained for each native language. The L1 effect on /s/ might be due
to the fact the Hindi has a different sibilant / shusher set than Telugu: /s, ʃ, z/ versus /s, ʃ,
ʂ/. Although there were some language-specific differences in IE, many more differences
were found in the sound patterns of Hindi and Telugu themselves. The degree of stop
retroflexion varied by language with Hindi speakers producing /ʈ/ with more retroflexion
than /ɖ/ and vice versa for Telugu speakers consistent with Ladefoged and Bhaskararao
(1983) who also found that the degree of retroflexion varies between Hindi and Telugu
language. Hindi speakers also produced stops with less aspiration and /s/ with a lower
mean frequency than Telugu speakers. In addition, Hindi speakers lengthened V2 relative
to V1 in disyllabic words, whereas Telugu speakers did the reverse. This finding is likely
due to differences in stress placement: the last syllable is typically stressed in Hindi, but
the first syllable in Telugu. Finally, Hindi speakers engaged in somewhat more final
61
lengthening than Telugu speakers, and produced phrases with higher %V and ΔC, but at
slower speech rates than Telugu speakers. Altogether, the results are consistent with the
suggestion that Indians with similar educational backgrounds have similar IE
representations that are minimally influenced by their L1.
3.4. General Discussion
The current experiment investigated native language influences on IE as spoken
by Indians with different language backgrounds and educated in English medium schools.
This experiment was undertaken to assess the competing hypotheses that IE represents L1
influenced English or a perfectly acquired pan-Indic variety of English. Although most
contemporary linguists likely accept that IE is a distinct variety of English, IE diverges
from other major dialects of English in that its speakers are nearly always exposed to the
language after they have acquired one or more indigenous Indian languages. It is
therefore reasonable to assume that IE phonology may not be stable across speakers in
India. The strongest version of this assumption predicts that native language phonologies
will account for both the similarities and differences in IE produced by speakers with
different language backgrounds. The current findings are consistent with previous
findings in contradicting this strong prediction. Specifically, the present results indicate
that the sound patterns of IE show minimal variation with native language background
even while the sound patterns of the native languages are substantially different from one
another.
The present results are not fully consistent with the alternative strong hypothesis,
namely, that IE represents a perfectly acquired pan-Indic variety of English with a

62
distinct and stable phonology. Like Maxwell and Fletcher (2010) and Wiltshire and
Harnsberger (2006), we found some effects of L1 on IE. Because we controlled for age of
acquisition, the L1 effects found in the present experiment cannot be easily attributed to
divergent proficiency levels. This ambiguity raises the following questions: do the L1
effects on IE indicate its incomplete acquisition, which is defined here as partial overlap
between speaker’s L1 and IE phonology? Or are the subtle L1 effects due to
sociolinguistic factors, including identity and/or regional variation? Although the results
from the current and previous studies on IE do not provide definitive answers to these
questions, we suspect that the noticeable effects of indigenous languages on IE are due to
sociolinguistic factors rather than to psycholinguistic ones.
As noted in Chapter II, many Indians are first exposed to English at age 6 in
primary schools. There is evidence to suggest that this is early enough for individuals to
acquire an “accentless” variety of a target language (Flege & Fletcher, 1992; Long,
1990). Let us consider what this might mean in the Indian context. English medium
school teachers do not speak English natively, nor do they have the same L1 as each
other or as their students, and there is also some indication that not all teachers have
equal proficiency in English (Annamalai, 2005; Mohanty, 2006). Putting aside the
question of how one assesses proficiency in a variety that is not well described and has
emerged through use by multilingual speakers, let us assume for the moment that children
received highly variable English input. If this is not currently the case (and it may not be),
then we can at least assume that it was the case for young English-learning Indians at
some point since the adoption of the Three Language Policy in 1968. Under these
circumstances, the notion of accentless IE may be the same as that of language

63
emergence. That is, adults who learned IE from a young age may have come to produce
the same IE patterns regardless of their first language if they regularized the variable
input that they received.
We know from the example of Nicaraguan Sign Language that young children
can regularize highly variable input to create a grammatically structured language within
a single generation (Senghas, Sotaro, & Ozyurek, 2004). What appears to be critical to
the speed at which this process occurs is the size of the community of young people
involved, and their motivation for learning the language and using it among themselves
(Senghas, Senghas, & Pyers, 2005). As noted in Chapter II, the community of young
people learning English in India is extremely large. Moreover, the language has become a
lingua franca for young people of different language backgrounds, who interact regularly
in the multilingual urban cities of India. Under these circumstances, it is hard to imagine
that IE is anything other than another variety of English, albeit one that may have already
evolved into multiple varieties (see, e.g., Wiltshire, 2005).
Strong social and regional pressures may account for multiple IE varieties. The
prevailing political unrest in Northeastern India and the secessionist impulses of many
citizens in the region provide an extreme example of these pressures. Wiltshire (2005)
noted that such pressures could account for the Tibeto-Burman influenced variety of IE
spoken in the region. She also advocated for descriptive work to determine the number of
varieties in existence and the extent to which they are based on L1 phonologies. A
complementary research program would be to investigate regionally based differences on
IE that are independent of L1. For example, we are interested in the possibility that the IE
spoken by native Hindi speakers from cities other than Delhi may differ from that spoken

64
by native Hindi speakers in Delhi. Similarly, for the IE of native Telugu speakers living
in different cities. An experiment of this sort would disambiguate psycholinguistic and
sociolinguistic factors to some degree. And, if the regional varieties of IE varied in the
way that IE varied by language group in this experiment, then we would have better
evidence for sociolinguistic explanations of what otherwise looks (merely) like L1
influenced IE.
65
CHAPTER IV
EXPERIMENT 2: REGIONAL INFLUENCES
4.1. Introduction
The previous experiment indicated that the sound patterns of IE show minimal
variation with native language even while the sound patterns of the native languages are
substantially different from one another. However, the experiment design did not control
for region: Hindi speakers were from Delhi, and Telugu speakers from Hyderabad. This
confound of L1 and region does not allow us to conclude that the differences found in IE
are necessarily explained by L1 differences. As discussed in Chapter II, regional
influences are very evident in language, even in monolingual countries like the United
States and the United Kingdom where English “… differs markedly from one territory to
another and even from one region within a given territory to another McArthur
(1998:43).” Balasubramanian (2006:4) also suggested that English used as a second
language in other countries, “cannot and should not be regarded as a (single) variety, as
there is no single geographical region to talk about, no single language background …
(particularly in a highly multilingual situation like India), and no one situation of use.”
Also noted in Chapter II, IE has been described as having regional varieties. In
particular, Pingali (2009:18) stated that “the speech of Indians can be classified on the
basis of the geographical regions and further regions within them.” Unfortunately, she
does not list these geographical varieties. However, Bhaskararao (2002) suggested that IE
has very distinct pronunciation patterns in the following regions: North-Eastern India,
Bengal, and Orissa (East), Andhra, Karnataka, Tamil Nadu, & Kerala (South),
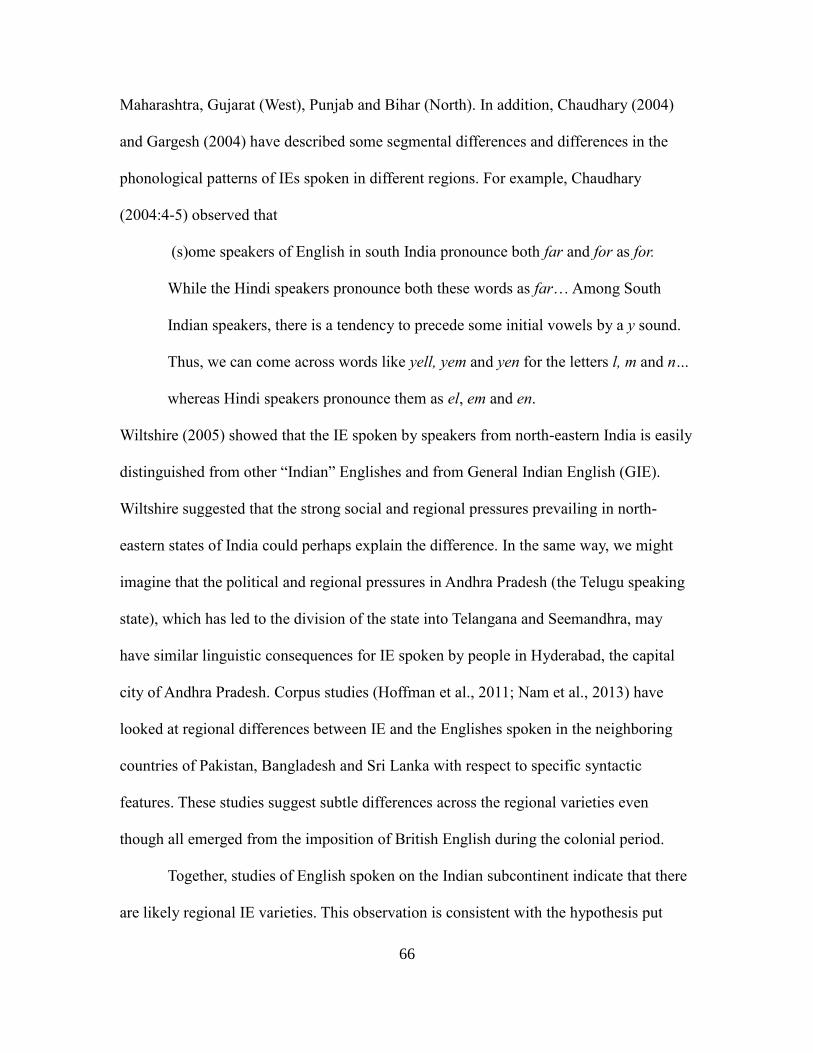
66
Maharashtra, Gujarat (West), Punjab and Bihar (North). In addition, Chaudhary (2004)
and Gargesh (2004) have described some segmental differences and differences in the
phonological patterns of IEs spoken in different regions. For example, Chaudhary
(2004:4-5) observed that
(s)ome speakers of English in south India pronounce both far and for as for.
While the Hindi speakers pronounce both these words as far… Among South
Indian speakers, there is a tendency to precede some initial vowels by a y sound.
Thus, we can come across words like yell, yem and yen for the letters l, m and n…
whereas Hindi speakers pronounce them as el, em and en.
Wiltshire (2005) showed that the IE spoken by speakers from north-eastern India is easily
distinguished from other “Indian” Englishes and from General Indian English (GIE).
Wiltshire suggested that the strong social and regional pressures prevailing in north-
eastern states of India could perhaps explain the difference. In the same way, we might
imagine that the political and regional pressures in Andhra Pradesh (the Telugu speaking
state), which has led to the division of the state into Telangana and Seemandhra, may
have similar linguistic consequences for IE spoken by people in Hyderabad, the capital
city of Andhra Pradesh. Corpus studies (Hoffman et al., 2011; Nam et al., 2013) have
looked at regional differences between IE and the Englishes spoken in the neighboring
countries of Pakistan, Bangladesh and Sri Lanka with respect to specific syntactic
features. These studies suggest subtle differences across the regional varieties even
though all emerged from the imposition of British English during the colonial period.
Together, studies of English spoken on the Indian subcontinent indicate that there
are likely regional IE varieties. This observation is consistent with the hypothesis put

67
forward in Chapter III whereby subtle differences between Hindi IE and Telugu IE could
be attributed as much to regional factors as to the L1 itself. The hypothesis of regional
varieties (dialects of IE) seems even more likely when we consider that the divide
between north and south is especially salient in India. This divide has been explained in
terms of the Aryan Invasion theory (see Frawley, 2005). According to this theory, India
was invaded and conquered by nomadic light-skinned Indo-European tribes from Central
Asia around 1500-100 BC, who overthrew an earlier and more advanced dark-skinned
Dravidian civilization from which they took most of what later became Hindu culture.
Frawley observed that this theory
(F)irstly, served to divide Indians into a northern Aryan and southern Dravidian
culture which were made hostile to each other. This kept the Hindus divided and
is still a source of social tension. Second, it gave the British an excuse in their
conquest of India. They could claim to be doing only what the Aryan ancestors of
the Hindus had previously done millennia ago.
Even after independence from the British, a North/South divide has persisted in
India. People are identified as belonging to a particular region based on stereotyped looks
and IE accents. Although, to the best of my knowledge, there is no academic work that
has looked at the sociolinguistic aspects of the situation, ample evidence for the
persistence of the divide can be found in books and films, and in the way people talk
about one another on the internet. For example Kushwant Singh in his book India
Without Humbugs distinguishes his characters by taking a mocking tone to their Tamilian
English (South Indian): “India govvermentta no gudda Madras govvermentta very gudda
India govvermentta morning appointmentta evening ruttrunchmentta Madras
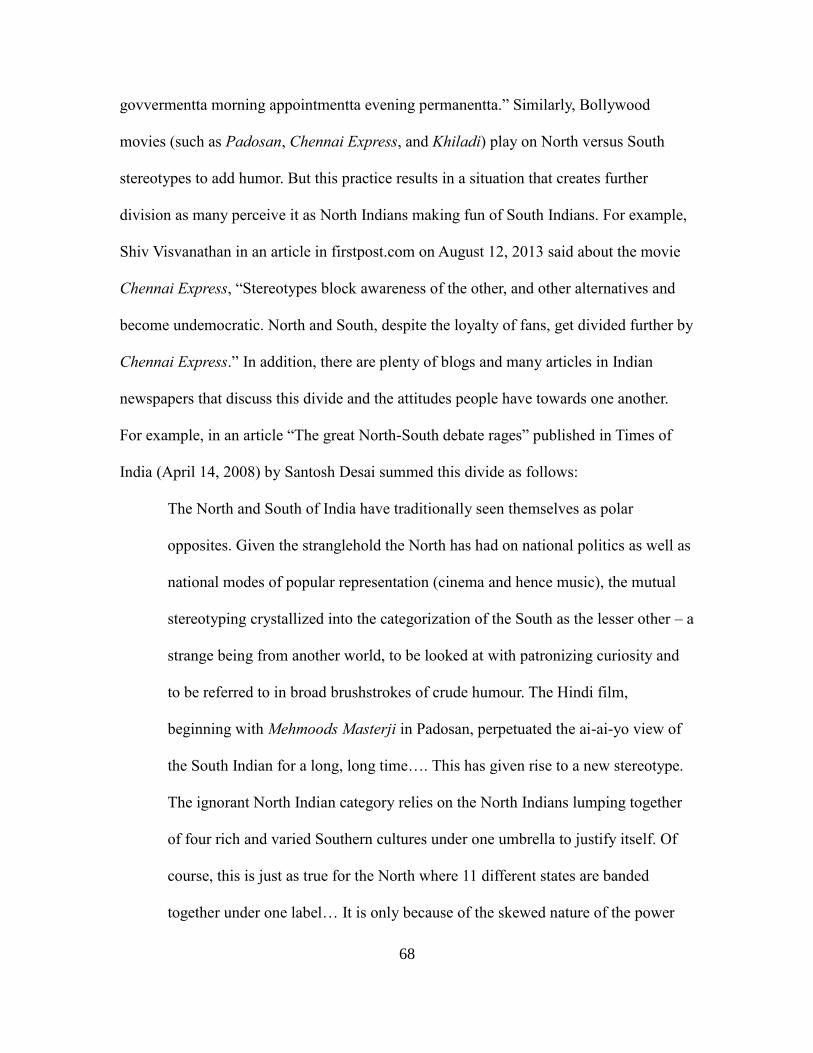
68
govvermentta morning appointmentta evening permanentta.” Similarly, Bollywood
movies (such as Padosan, Chennai Express, and Khiladi) play on North versus South
stereotypes to add humor. But this practice results in a situation that creates further
division as many perceive it as North Indians making fun of South Indians. For example,
Shiv Visvanathan in an article in firstpost.com on August 12, 2013 said about the movie
Chennai Express, “Stereotypes block awareness of the other, and other alternatives and
become undemocratic. North and South, despite the loyalty of fans, get divided further by
Chennai Express.” In addition, there are plenty of blogs and many articles in Indian
newspapers that discuss this divide and the attitudes people have towards one another.
For example, in an article “The great North-South debate rages” published in Times of
India (April 14, 2008) by Santosh Desai summed this divide as follows:
The North and South of India have traditionally seen themselves as polar
opposites. Given the stranglehold the North has had on national politics as well as
national modes of popular representation (cinema and hence music), the mutual
stereotyping crystallized into the categorization of the South as the lesser other – a
strange being from another world, to be looked at with patronizing curiosity and
to be referred to in broad brushstrokes of crude humour. The Hindi film,
beginning with Mehmoods Masterji in Padosan, perpetuated the ai-ai-yo view of
the South Indian for a long, long time…. This has given rise to a new stereotype.
The ignorant North Indian category relies on the North Indians lumping together
of four rich and varied Southern cultures under one umbrella to justify itself. Of
course, this is just as true for the North where 11 different states are banded
together under one label… It is only because of the skewed nature of the power

69
equation that North Indian ignorance has a punitive consequence while South
Indian ignorance is ignored.
Another article, “Indian English Blemishes” by Sajeesh in the online newspaper
Non Resident Indian (NRI) (May 03, 2012), argued that “Indian English can at best, be
categorized into two – northern and southern.” These examples provide evidence of a
strong native sentiment that there is a North/South divide in India.
Regionalism in the north and south has led to division of states (e.g., Andhra
Pradesh into Telangana and Seemandhra). In India, regions are socio-culturally very
distinct from one other, and often home to majorities with different L1s. Since
Independence, states or sub-states of India have been created with autonomous powers in
order to politically accommodate linguistic identity. However, regional identity goes
beyond language as noted previously in Chapter II. For instance, of the states that have
been created in 2000—Uttaranchal, Chhattisgarh, and Jharkhand—language did not play
the predominant role. Similarly, statehood or sub-statehood in the north-east is based on
tribal ethnicity, not language (Bhattacharyya, 2003).
Regional accents may have evolved due to geographical separation and social
differences, but they are maintained because they mark identity. For example,
Underwood (1988) showed that a strong Texas accent is indexed by use of low
monophthong /a/ where the standard variety of American English uses diphthong /ai/ and
“the regional Texas /a/ has retained its popularity because many Texans, regardless of
their social transformations, have not abandoned their identity as Texans (p. 418).” Thus
it seems reasonable to assume that even though IE is not a native language, its status as a
lingua franca in India may mean that its regional differences have evolved and are being

70
maintained so that when people from the north and south talk, for instance, they are
communicating social information as much as linguistic information.
Social and economic circumstances in present day India allow us to test the
hypothesis of IE dialects by disambiguating L1 influences on IE from regional influences
on IE because people with different L1s now routinely live together in major cities. Delhi
and Hyderabad are among the top 10 big cities in India that have shaped the regional
pattern of urbanization and inter-regional flow of migration since 1990 (NSSO, 2010).
According to the 2001 Indian census, 309 million people, 30% of the total population of
India, were migrant workers. Migration into large metropolises became especially
significant between 1991-2001 Delhi grew by about 45 percent (2.17 million) due to in
migration, and Hyderabad by about 26 percent (500,000). This migration into cities has
rendered them multilingual. So, for example, Delhi in the north has 28,067 Telugu
speakers according to the 2001 census figures. It is reasonable to assume that South
Indians moving to Delhi may adjust to a Delhi IE accent and lifestyle so that they may
more easily integrate into the social-economic life of the city. There is also a very well-
known proverb in Hindi, “Jaisa des waisa bhes,” which is parallel to “when in Rome do
as the Romans do,” suggesting that there is also social pressure to integrate.
In the current experiment, we focused on Delhi (North) and Hyderabad (South)
speakers’ production of IE, selecting individuals from each city who had Hindi as a native
language and others who had Telugu as a native language. Speakers with these L1s were
chosen so that we could make a direct comparison with the results from the experiment
reported in Chapter III. For this reason, we also used the same elicitation task as in the
previous experiment. Once again, similarities and differences in IE were investigated

71
using global perceptual analyses and specific acoustic measurements. We expected that
listeners would be able to differentiate Delhi speakers from Hyderabad speakers and that
acoustic measurement would show differences for Hindi and Telugu speakers similar to
previous experiment. In particular, we expected vowel space differences, differences in
the production of the retroflex consonants and of /s/, and differences in suprasegmental
temporal patterns. In general, we expected that speakers would adapt features from the
prominent language of the region. Thus, we expected Delhi speakers to produce IE with
features from Hindi and Hyderabad speakers features from Telugu. Of particular interest
was the question of whether native Hindi- and Telugu-speaking listeners could determine
whether speakers were from the same or different geographical regions based on limited
exposure to their speech. We reasoned that if IE differs by geographical region, then IE
sound patterns produced by Delhi and Hyderabad speakers should be different regardless
of the speaker’s L1, assuming that the speakers had assimilated the regional IE accent.
4.2. Methods
4.2.1. Participants
Twenty two IE speakers provided speech samples for the present experiment.
Twelve speakers had Hindi as their native language and 10 had Telugu as their native
language. Three of the Hindi speakers were males, as were two of the Telugu speakers.
All speakers were between the ages of 18 and 35 years old. Six of the native Hindi
speakers were from Delhi and still residing there at the time of the experiment. The other
6, also originally from Delhi, had resided in Hyderabad for between 4 and 7 years (M =
5.8 years) at the time of the experiment. Six of the native Telugu speakers were from

72
Hyderabad and still residing there at the time of the experiment. The other 4, also from
Hyderabad, had resided in Delhi for between 6 and 10 years (M = 7.2 years) at the time of
the experiment. All speakers had been exposed to English from the 1st grade onwards
(age 6), all continued to be educated in English through college, and all used English on a
daily basis for education and work-related conversation (see Table 4.1).
Table 4.1. Speakers’ usage of language in different domains.
L1 City Family Friends Strangers Work/Scho
ol
Media
Hindi Delhi Mother
tongue;
occasional
use of IE
with father
by 2 speakers
Hindi Hindi and
IE
IE Hindi
and IE
Hindi Hyderaba
d
Mother
tongue;
occasional
use of IE
with father
by 1 speaker
Hindi
and IE
IE IE Hindi
and IE
Telugu Delhi Mother
tongue;
occasional
use of IE
with father
by 1 speaker
Hindi Hindi and
IE
IE IE
Telugu Hyderaba
d
Mother
tongue;
occasional
use of IE
with father
by 2 speakers
Telugu
and IE
IE IE Telugu
and IE
Two of the Hindi speakers residing in Delhi were working; one as a teacher at
high school level and one as lab assistant (computer science department). The other four
were in their final year of higher-education (one as a Master’s level student and the others
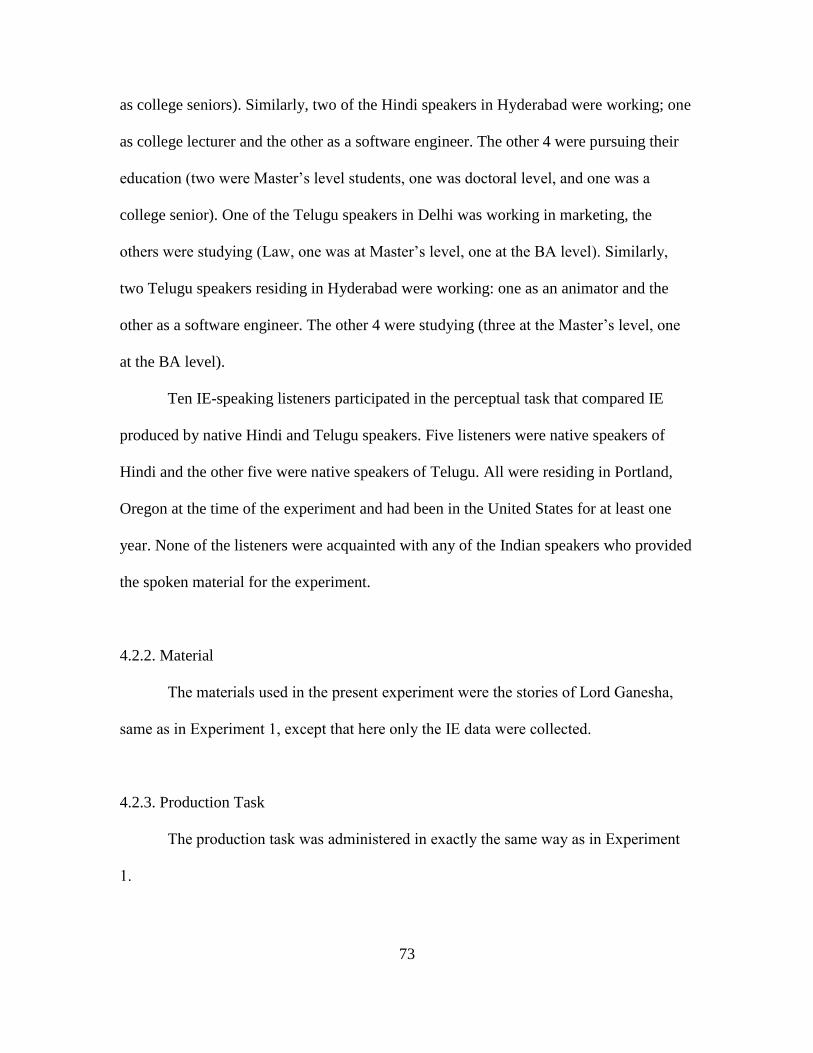
73
as college seniors). Similarly, two of the Hindi speakers in Hyderabad were working; one
as college lecturer and the other as a software engineer. The other 4 were pursuing their
education (two were Master’s level students, one was doctoral level, and one was a
college senior). One of the Telugu speakers in Delhi was working in marketing, the
others were studying (Law, one was at Master’s level, one at the BA level). Similarly,
two Telugu speakers residing in Hyderabad were working: one as an animator and the
other as a software engineer. The other 4 were studying (three at the Master’s level, one
at the BA level).
Ten IE-speaking listeners participated in the perceptual task that compared IE
produced by native Hindi and Telugu speakers. Five listeners were native speakers of
Hindi and the other five were native speakers of Telugu. All were residing in Portland,
Oregon at the time of the experiment and had been in the United States for at least one
year. None of the listeners were acquainted with any of the Indian speakers who provided
the spoken material for the experiment.
4.2.2. Material
The materials used in the present experiment were the stories of Lord Ganesha,
same as in Experiment 1, except that here only the IE data were collected.
4.2.3. Production Task
The production task was administered in exactly the same way as in Experiment
1.

74
4.2.4. Perceptual Judgment Task
As in Experiment 1, on each trial, listeners were presented with the most fluent IE
renditions of two different sentences produced by different IE speakers (sentences 5 and
8, see Appendix II). The same pair of different speakers was never repeated for a
particular sentence order (5, 8 or 8, 5). The same and different stimuli were amplitude
normalized (70 dB) and presented in random order over headphones to listeners.
Unlike in Experiment 1, stimuli were blocked by language so that listeners only
heard sentences produced by speakers with the same L1. The pair of speakers was either
female or male but never a combination of male and female. In half of the stimuli, the
different speakers were from the same city. In the other half, the different speakers were
from different cities. The listeners’ task was to judge whether the sentences they heard
were spoken by two speakers living in the same city or in different cities. Listeners were
seated in front of a computer in a quiet room and instructed in their task. They were asked
to make their same/different judgments on a 5-point scale, where “1” equaled a confident
“same” judgment and “5” equaled a confident “different” judgment. The scale was
presented on a computer monitor, and the listeners indicated their response by clicking on
the box with the number that corresponded to their judgment. The order of presentation of
the L1 blocks (Hindi or Telugu) were counterbalanced, and listeners were given a 10
minute break between the blocks. Perceptual judgments on the paired sentences took
approximately 30 minutes to complete.

75
4.2.5. Acoustic Measurements
The segmental and suprasegmental characteristics that differentiated IE spoken by
Hindi and Telugu speakers were chosen for analysis, including vowel quality, degree of
retroflexion for /ʈ/ and /ɖ/, the spectral characteristics of /s/, and temporal patterns
associated with lexical stress, phrase-final lengthening, language rhythm, and speech rate.
4.2.6. Analyses
The perception data were analyzed using ordinal logistic regression in SPSS. We
used the listeners’ responses (1-5) as the dependent variable. Cities, speakers’ native
language, and listeners’ language background were entered into the analysis as predictors.
The ratings were also z-transformed within each listener so that a normally distributed
dependent measure, comparable across listeners, could be used for visualization of the
results. Preliminary analyses indicated no effect of listeners’ language background so
their judgments were averaged in subsequent analyses.
Linear mixed effects modeling was used to investigate the fixed effects of
speakers’ cities (Delhi or Hyderabad) and speakers’ native language (Hindi or Telugu) on
the various acoustic measures. Segment identity was an additional fixed factor in the
analyses of retroflexion and aspiration. Target lexical prominence patterns were added as
a fixed factor in the analysis on V1:V2 duration. As in Experiment 1, item (word or
sentence) and speaker were treated as random factors. All results are given with the
denominator degrees of freedom rounded to the nearest whole number.

76
4.3. Results
IE-speaking listeners were able to distinguish English sentences produced by
speakers residing in Delhi from those produced by speakers residing in Hyderabad.
Region-based discrimination was higher for sentences produced by native Telugu
speakers than for those produced by native Hindi speakers. The acoustic measures were
consistent with the perceptual results. The English produced by speakers residing in
Delhi and Hyderabad differed, but regional IE accents were more evident in native
Telugu speaker’s English than native Hindi speaker’s English. These results are presented
in detail below.
4.3.1. Perceptual Judgments
The analysis of similarity ratings on IE sentences revealed a simple effect of cities
(same versus different), χ 2
(1) = 18.56, p < .001, an effect of native language (Hindi
versus Telugu), χ 2
(1) = 14.15, p < .001, and a significant interaction between these
factors, χ 2
(1) = 4.01, p = .045. The significant interaction is shown in Figure 4.1.
Analyses on ratings split by speaker’s native language indicated that the effect of
region was significant only for Telugu speakers, χ 2
(1) = 17.04, p < .001. Listeners seem
to be better at identifying phonological differences for the Telugu speakers from different
cities than for Hindi speakers from different cities. Even in the block with native Telugu
speakers, listeners preferentially selected “2” and “4,” indicating less than perfect
certainty in their judgments; for example, listeners made a total of 115 “2” responses

77
Figure 4.1. Listeners’ difference ratings of IE sentence pairs are shown as a function of
cities (same vs. different) and speakers' native language (Hindi or Telugu). Note that
analyses were conducted on the untransformed dependent variable (see Analyses).
compared to just 45 “1” responses on IE sentences produced by two native Telugu
speakers residing in the same city. Table 4.2 shows a break-down of the actual responses
based on city (same or different) and speakers’ native language (Hindi or Telugu).
In sum, the similarity ratings on IE sentences indicate that listeners can
differentiate IE spoken in different regions even when it is produced by native speakers
of the same L1. However, this effect seems to have been due primarily to the ease with
which listeners distinguished between Telugu speakers living in different cities. We might
conclude from this that IE produced by Hindi speakers was fairly consistent in the two
cities examined.

78
Table 4.2. Distribution of listeners’ response as a function of geographical region (target)
and speakers’ native language.
Speakers’ native
language
Confidence
Score
Target/Region
Same Different
Hindi 1 = same 28 54
2 133 119
3 21 16
4 87 152
5 = different 72 99
Telugu 1 = same 45 35
2 115 98
3 4 8
4 62 128
5 = different 34 51
4.3.2. Acoustic Measurements
The next set of analyses addressed the effect of cities and speaker’s native
language on the production of specific segmental and suprasegmental attributes. The
results on vowel production are presented first, followed by those on retroflexion,
aspiration, /s/ production, lexical stress, final lengthening, and rhythm, in that order.
With regards to vowel production, the vowels were first plotted according to their
normalized F1 and F2 values and as a function of cities and native language (Figure 4.2).
A qualitative comparison of the different vowel spaces depicted in Figure 4.2 suggests
that vowel production varies somewhat with both factors. Quantitative analyses were
conducted to determine which, if any, of the differences evident in the figure were
systematic enough across speakers to be statistically significant. In particular, the
analyses investigated the effects of cities and native language on F1 and F2 separately.
Analyses of F1 revealed a significant effect of cities only on vowel /ə/, F(1, 18) =
6.94, p = .017, and a significant effect of native language on /u/, F(1, 18) = 7.34, p =

79
.014. The main effect of region was due to Hyderabad speakers producing a more
centralized /ə/ than the speakers residing in Delhi. The main effect of native language was
due to Telugu speakers’ production of a more open /u/ vowel in comparison to Hindi
speakers.
Analyses of F2 revealed a significant effect of cities again on /ə/, F(1, 18) = 5.78,
p = .027 and on /u/, F(1, 18) = 5.49, p = .031. In addition, a significant interaction
between cities and native language was observed for /ᴐ/, F(1, 18) = 6.10, p = .024. When
the data were split by native language, an effect of cities was observed only for Telugu
/ᴐ/, F(1, 18) = 22.53, p = .001. If we interpret these results with reference to the mean
values shown in Figure 4.2, we find that the main effect of cities was due to the
production of more centralized /ə/ and fronted /u/ vowels by Hyderabad speakers in
comparison to speakers residing in Delhi. The interaction effect was due to a more
fronted production of /ᴐ/ by Telugu speakers residing in Delhi than Hindi speakers
residing in Delhi. The fronted vowel is nonetheless consistent with that which Hindi
speakers produced in Experiment 1. It is possible that this result therefore indicates a kind
of overshoot or hyper-adaptation to Delhi norms.
With respect to the consonants, an analysis on the degree of retroflexion
associated with stop production indicated an effect of cities on the difference between F3
and F2 at vowel offset, F(1, 101) = 9.46, p = .003, as well as an effect of native language,
F(1, 101) = 5.95, p = .016. There was no interaction between these factors. When the
data were split by stop identity, the effect of city was significant for both /ɖ/, F(1, 55) =
4.57, p = .037 and /ʈ/, F(1, 46) = 4.80, p = .037, whereas the effect of native language
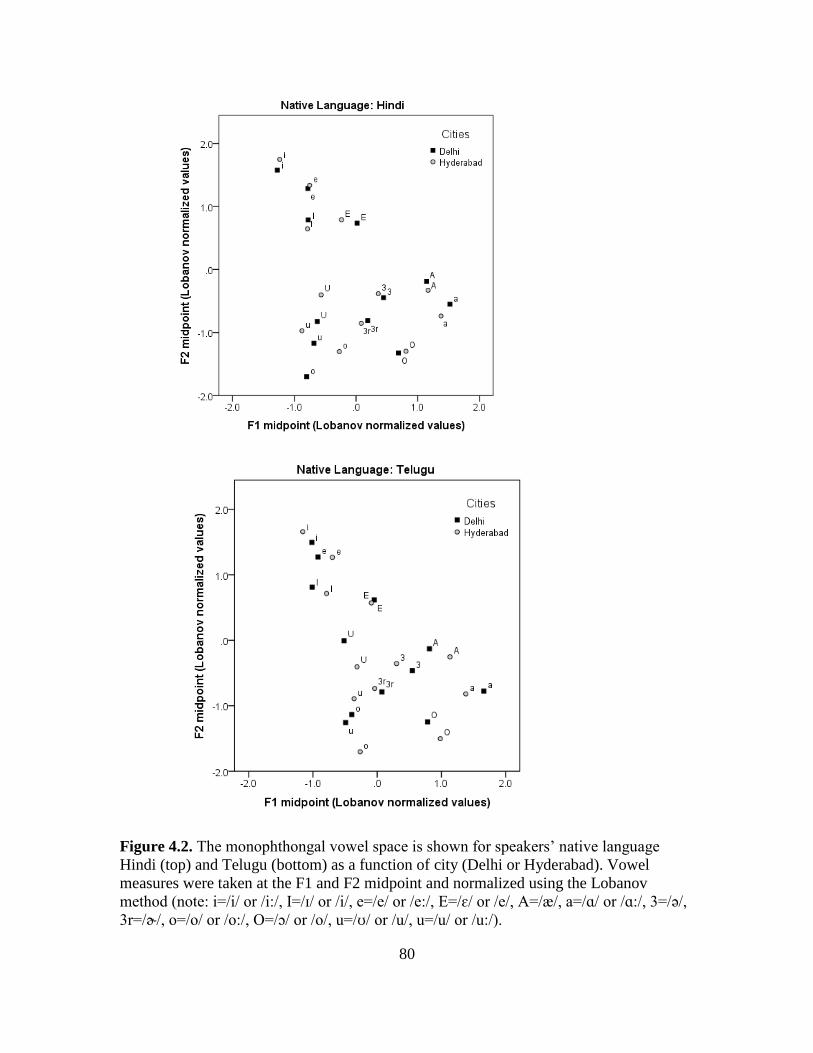
80
Figure 4.2. The monophthongal vowel space is shown for speakers’ native language
Hindi (top) and Telugu (bottom) as a function of city (Delhi or Hyderabad). Vowel
measures were taken at the F1 and F2 midpoint and normalized using the Lobanov
method (note: i=/i/ or /i:/, I=/ɪ/ or /i/, e=/e/ or /e:/, E=/ɛ/ or /e/, A=/æ/, a=/ɑ/ or /ɑ:/, 3=/ə/,
3r=/ɚ/, o=/o/ or /o:/, O=/ɔ/ or /o/, u=/ʊ/ or /u/, u=/u/ or /u:/).

81
was only significant for /ɖ/, F(1, 55) = 11.12, p = .002. These results, shown in Figure
4.3., indicate that speakers residing in Delhi exhibited higher degree of retroflexion than
speakers residing in Hyderabad. The main effect of native language on /ɖ/ was driven by
speakers residing in Delhi: Hindi speakers from Delhi produced retroflexes with higher
F3 values than Telugu speakers from Delhi. This result suggests a persistent effect of L1
in that Hindi speakers in Experiment 1 also produced more retroflexion than Telugu
speakers.
Figure 4.3. Degree of retroflexion of post-vocalic stops is shown as a function of the city
(Delhi or Hyderabad) and the speakers' native language (Hindi or Telugu). Retroflexion
was measured as the difference between the F3 and F2 offset values in the preceding
vowel (note: T=/ʈ/, D=/ɖ/).
The effect of region and native language on the production of fricative /s/ was
also investigated. As expected from Experiment 1, the results indicated a main effect of

82
native language, F(1, 57) = 13.12, p = .001, and an interaction effect of city and native
language, F(1, 57) = 4.19, p = .045. The interaction effect, shown in Figure 4.4 shows
that Hindi speakers from Hyderabad produced /s/ with much lower frequency than
Telugu speakers residing in Hyderabad. Post hoc comparisons indicated a significant
effect of native language only on /s/ produced by speakers residing in Hyderabad (p =
.01). This result was just as in Experiment 1 where Hindi speakers also produced /s/ with
lower average mean frequency than Telugu speakers.
Figure 4.4. The average frequency of syllable-initial /s/ is shown as a function of the city
(Delhi or Hyderabad) and the speakers' native languages (Hindi or Telugu).
Turning now to the suprasegmental measures, we expected based on the results
from the previous experiment that Hindi and Telugu speakers would produce lexical

83
stress differently such that Hindi speakers would lengthen V2 relative to V1 more than
Telugu speakers; Hindi speakers were also expected to produce more final lengthening
than Telugu speakers, and to produce speech with a higher rhythm value but lower
speech rate than Telugu speakers. Assuming that the regional influences reflect the
dominant languages spoken in the two cities of interest, we expected that IE produced by
speakers residing in Delhi would reflect features associated with L1 Hindi and that IE
produced by speakers residing in Hyderabad would reflect those associated with L1
Telugu.
The analysis of the temporal patterns associated with lexical stress production
indicated a significant effect of native language, F(1, 222) = 4.82, p = .029, and of stress
pattern, F(1, 222) = 11.97, p = .001, but no main effect of city or any interaction of these
factors. These results are shown in Figure 4.5. From the figure we see that Hindi speakers
produced iambically-stressed disyllabic words with longer V2 relative to V1, whereas
Telugu speakers produced the pattern in a manner more similar to their trochaic pattern;
that is, with nearly equal V1 and V2 durations. This result parallels the one reported in
Chapter III (see Figure 3.7).
The results on phrase-final lengthening also indicated an effect of native
language, F(1, 241) = 10.90, p = .001, with an effect of cities that approached
significance, F(1, 242) = 3.71, p = .051. The almost significant effect of city was due to a
pattern whereby speakers from Delhi showed more phrase-final lengthening than
speakers from Hyderabad (see Figure 4.6). This result is consistent with the assumption
that speakers residing in Delhi would produce a variety of IE consistent with L1 Hindi IE
regardless of the speaker’s actual native language.

84
Figure 4.5. IE lexical stress in disyllabic words, measured as the ratio of the duration of
the first vowel to the duration of the second, is shown as a function of the city (Delhi and
Hyderabad) and the speakers' native language (Hindi and Telugu).
Figure 4.6. Phrase-final lengthening, measured as the ratio of the ultimate vowel duration
to the penultimate vowel duration, is shown as function of city and the speakers' native
languages.

85
The final analyses of suprasegmental patterns showed an effect of cities on
several global rhythm metrics: %V, F(1, 241) = 42.16, p < .001; ΔV, F(1, 242) = 5.33, p =
.022; nPVI, F(1, 240) = 8.38, p = .004. The effect of cities on speech rate was also
significant, F(1, 241) = 6.10, p = .014. Also, there were effects of native language on
several of the global rhythm metrics: ΔC, F(1, 241) = 4.97, p = .027; ΔV, F(1, 242) =
6.97, p = .009, and nPVI, F(1, 240) = 7.66, p = .006. These results, shown in Figure 4.7
appear to be due to more variable and longer vowel durations and faster speech rates by
speakers residing in Hyderabad compared to those residing in Delhi regardless of their
native language. It is likely that the rate differences account for the final result, which is
that speakers residing in Hyderabad produced higher variability of successive syllabic
durations (nPVI value) than speakers residing in Delhi. Delhi speakers exhibited IE that
was more syllable-timed; it had higher %V and lower nPVI (Low & Grabe, 2002; Low,
2006). Again, the effect of region here is what one would expect if regional accents are
influenced by the dominant L1.
In sum, the acoustic measures indicated effects of geographical region and native
language on IE. In particular, there was an effect of city on IE /ə/, /u/, on the degree of
retroflexion, and on rhythm and speech rate. With regard to the degree of retroflexion
speakers’ residing in Delhi produced /ɖ/ and /ʈ/ with more retroflexion than speakers
residing in Hyderabad. Thus, as expected, no matter the L1, Delhi speakers seem to
follow the features of Hindi speakers who engage in higher degree of retroflexion. For
the suprasegmental features too speakers residing in Delhi displayed features of Hindi
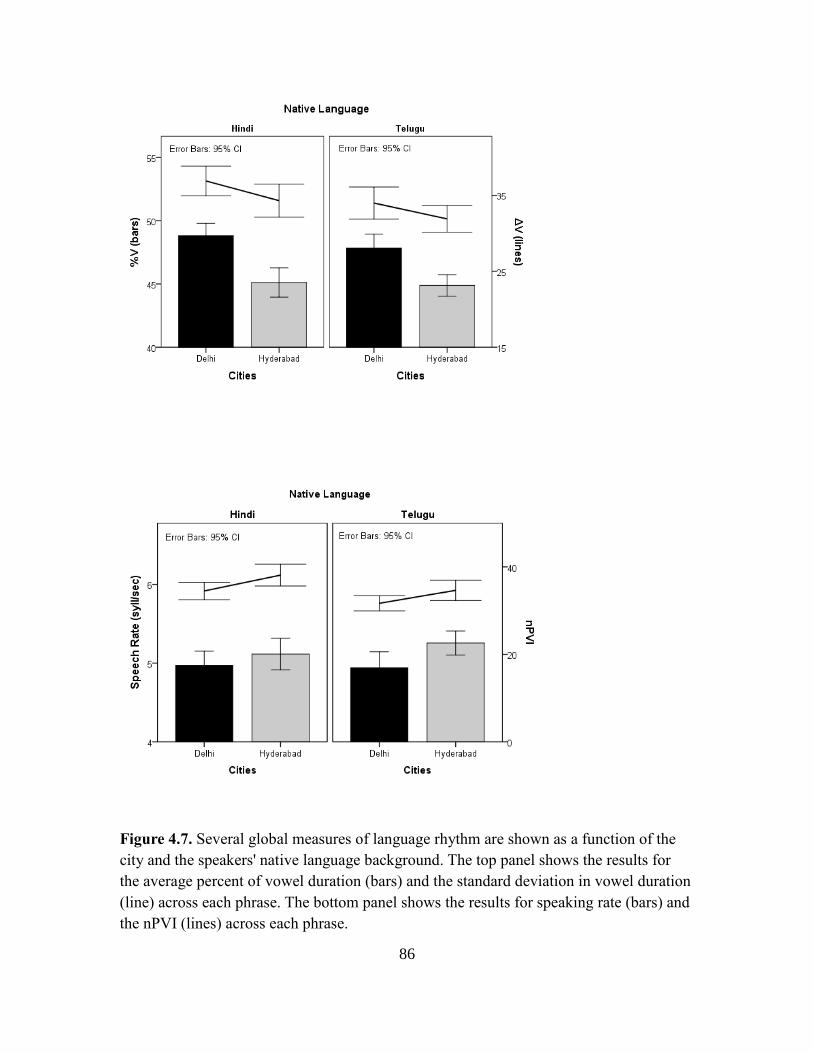
86
Figure 4.7. Several global measures of language rhythm are shown as a function of the
city and the speakers' native language background. The top panel shows the results for
the average percent of vowel duration (bars) and the standard deviation in vowel duration
(line) across each phrase. The bottom panel shows the results for speaking rate (bars) and
the nPVI (lines) across each phrase.

87
speakers such that speakers residing in Delhi engaged in somewhat more final
lengthening and produced phrases with higher %V, ΔV and at slower speech rates and
lower nPVI than speakers residing in Hyderabad. Nonetheless, effects of speakers’ native
language on IE were also observed regardless of their city of residence. Similar to the
results reported in Chapter III, L1 influenced vowel quality, degree of retroflexion for /ɖ/,
the articulation of /s/, temporal patterns in iambically stressed words, final lengthening
and the rhythm measures. Overall results suggest regional influences on IE along with
L1 effects.
4.4. General Discussion
The current experiment investigated regional influences on IE as spoken by
Indians with different native languages. Previous studies indicate strong influences of L1
on IE (Bansal, 1970; Chaswal, 1972; Thundy, 1973; Wells, 1982; Maxwell and Fletcher,
2010), but qualitative descriptions of IE variation and social-historical factors also point
to the possibility that IE is influenced by region (e.g., Gargesh, 2004; Balasubramania,
2006; Pingali, 2009). The results from the present experiment in which native languages
were controlled indicate that the effects of region on IE go beyond the effects of L1 on
IE. That is, the results suggest that there are likely distinct IE “accents” in the north and
south of India. However, the results also suggest that Telugu speakers are more likely to
adopt a regional accent than Hindi speakers.
The current results align well with other published studies on regional variation.
In particular, we find differences in the vowel space across regions and native languages.
This result is consistent with many of the studies on dialectal variation, which frequently

88
report differences in vowel systems as a hallmark of regional accent (Wise, 1933, on
Southern English; Kurath & McDavid, 1961, on the east coast; Allen, 1976, on the Upper
Midwest; Labov, Ash, & Boberg, 2006; inter alia). For example, Jacewicz, Fox, &
Salmons (2007) have shown that the regional varieties spoken in the South of the United
States, in the Midland and in the North of the United States differ not only in vowel
position within an F1/F2 vowel space, but also in vowel duration and in the amount of
spectral change over the course of the vowels. Similarly, Leinonen (2010) suggests that
Swedish dialects differ more in vowel quality than in consonantal articulation.
Our results also revealed consonantal variation across regions, where the degree
of retroflexion differed from one region to the other such that speakers residing in Delhi
had higher degree of retroflexion than speakers residing in Hyderabad. This result is also
consistent with the broader literature on regional accents where consonants are known to
vary by dialects. “The degree of retroflexion seems to vary regionally, socially and
stylistically to some extent…” ( Wells, 1982: 432). Similarly, Kolarik (2013) suggested
regional variation in the use of retroflex [ɻ] which is predominant in Dublin but not in
other parts of Ireland. Regional variation in consonantal articulation has also been
reported. For example, Recasens (2011) found dialectal variation for several
consonants—dental /t/, the alveolars /n, l, s, r/ and the alveolopalatals /ʧ, ʃ, ʎ, ɲ/—across
three Catalan dialects (Valencian, Easter, Majorcan). Similarly, a number of American-
English dialects, such as the New York, Cajun English, and African-American Vernacular
English frequently substitute /d/ for /ð/ (Wolfram, 1969; Dubois and Horvath, 1998;
Gordon, 2004; Thomas, 2007).

89
The current experiment also revealed regional variation in temporal patterns,
where speakers residing in Delhi engaged in more phrase-final lengthening, spoke a more
syllable-timed variety of IE and at a faster rate than speakers residing in Hyderabad.
These results are also in line with the sociolinguistic literature. For example, Hirst and Di
Cristo (1998) found that dialects within languages and even related languages exhibit
different degrees of final lengthening. And White & Mattys (2007) showed that different
regional accents in the United Kingdom (Standard Southern British English (SSBE),
Bristol, the Welsh Valleys, Orkney and Shetland) are associated with different speech
rhythms. Other studies of regional variation have also demonstrated differences in speech
rate (e.g., O’Neill, 2008; Byrd, 1994; Verhoeven, De Pauw, & Kloots, 2004). Thus, the
current experiment shows that many of the same markers of regional variation found in
previous studies also differentiate IE that is spoken in the north and south of India.
Overall, the effect of region on sound patterns of IE strongly suggests regional
varieties of IE akin to those described for languages that are the L1 for large and
geographically dispersed speech communities. The perceptual results also indicated that
regional differences are identifiable, especially for Telugu speakers. Evidence for
perceivable regional differences in Hindi speakers’ IE might have been possible if
listeners were exposed to more speech. On the other hand, the absence of strong
perceptual differences in the IE spoken by L1 Hindi speakers residing in Delhi and
Hyderabad could suggest that regional IE accents are not adopted by all Indians or that
the Hindi speakers in Hyderabad had not resided in the city long enough to acquire the
regional accent. In particular, it is possible that age of arrival in the new city and other
individual difference variables might explain the absence of an effect of region on IE

90
produced by Hindi speakers in Hyderabad. On the other hand, the mean difference in
length of residence for Telugu speakers in Delhi and Hindi speakers in Hyderabad was
only 1.4 years. Length of residence is therefore unlikely to be the sole explanation for
why regional variation was particularly noticeable in the IE produced by native Telugu
speakers. Here we consider an explanation for the difference based on language prestige
below.,
At the time of Indian Independence, Khariboli, a vernacular Hindi was
standardized, becoming the official language of 11 states (Hindi-belt area). Speakers from
these areas speak different regional dialects of Hindi at home, but they still identify with
the larger Hindi-speaking community. Although a few of the Hindi speakers in this
experiment reported usage of one of the regional dialects of Hindi with their
grandparents, they strongly identified themselves as part of the larger Hindi-speaking
community in India. Thus an absence of an effect of city on IE might be due to a greater
allegiance to Hindi (and therefore to Hindi-inflected IE) than to region. This possibility is
made even more likely when considering that Hindi is the only national language in
India. The language can therefore act as a link between Hindi speakers across regions,
discouraging them from adapting to regional variations in IE. A strong allegiance to Hindi
and other Hindi speakers is also consistent with self-reported usage in this experiment.
Hindi speakers reported using Hindi (and IE) with friends in Hyderabad. This contrasts
with Telugu speakers who lived in Delhi and used only Hindi with friends.
Telugu speakers might feel more compelled to adapt to the regional IE variety
than their Hindi-speaking peers given that Telugu does not have the same symbolic power
as Hindi. It was pretty clear from the Telugu speakers’ responses to the language usage

91
questionnaire that Telugu speakers residing in Delhi used their L1 only in the family
domain. Delhi-ites also exhibit the kind of superiority that denizens of capital cities often
exhibit. It is possible that the social environment in Delhi signals a disdain for non-Hindi
speakers. This possibility is consistent with the north-south stereotyping discussed in
Chapter II, where stereotyping of South Indians is perceived as derogatory. These factors
could encourage Telugu speakers residing in Delhi to adopt the regional accent so as not
to be excluded from the social-economic life of the city.
Of course, it could also be that the elicitation method and speech materials used in
the present experiment did not allow for regional accents to emerge in the IE produced by
Hindi speakers. It has long been known that speakers’ select a speech style based on their
assessment of the formality that the situation requires, and that regional effects on
language are best detected in the least conscientious (most casual) speech (Labov, 1972).
Could it be that the sentence reading task we used was too formal or perhaps overly
structured? To better understand possible interactions between native language and region
on IE and in the promotion of self-identity. We turn now to an experiment in which the
speech data were elicited in a conversational context to assess the effect of setting on L1-
accentedness in IE.

92
CHAPTER V
EXPERIMENT 3: EFFECTS OF LINGUISTIC-IDENTITY
5.1. Introduction
In the previous studies, speech was elicited by asking speakers to read the
sentences based on the story of Lord Ganesha. This story is learnt in childhood, usually
told to the child by their parents and grandparents in their mother tongue. According to
learning stance theory (Schieffelin & Ochs, 1986), when the context is reminiscent of the
past, speakers are likely to reproduce the kind of speech used in that past situation. In this
case, speakers may have recreated something of their parents/grandparents speech when
producing the Lord Ganesha story for us. Thus, it is possible that the effects of L1 on IE
found in our previous experiments were due to the nature of the speech materials used.
This possibility is consistent with sociolinguistic and corpus research on setting. For
example, Labov (1972) have shown that a speakers’ style of speech depends on the
formality of the situation, and that casual situations where participants discuss personal
topics elicit the most vernacular speech. Similarly, Liu (2010) found that spontaneous
speech acoustics carried more dialect cues than read speech acoustics. Golcher and
Reznicek (2011) found that German texts produced by non-native speakers of German
are more readily classified by topic than by native language.
With respect to the effect of setting on IE, Leitner (1994) has shown that the
choice between British, American and Indian English and the varieties within these
dialects are influenced by the type of text that speakers are asked to read. Non-fictional
texts elicit more standard British and American pronunciations; fictional texts, more IE

93
and “accented” language. Similarly, Balasubramanian (2009) found that IE has more
Indian features in spontaneous speech than in read speech, and that when Indians adopt a
more formal register their pronunciation becomes closer to the British English dialect.
Balasubramanian also found that the proportion of Indian features in written text was
higher in personal correspondence than in business correspondence.
The way a speaker speaks reflects the identity (or dimension of identity) that is
active during the interaction; reflecting how the speaker defines the interaction situation
(Krauss & Pardo, 2006). According to Krauss and Pardo, identity concerns people’s
sense of who they are; the attributes and features that distinguish them from others
(personal identity), and also the attributes that make them members of coherent classes or
categories to which they belong, or with which they are identified (social identity). Many
of these aspects of identity are embodied in speech. This is in line with Tajfel (1978) who
argued that the individual has multiple identities, but that a distinction can be made
between personal identities and group-related identities. Meyerhoff (2006) noted that
even style can be thought as an act of identity. The speaker design approaches to style
similarly suggest that styles are used to create and then foreground certain speaker
identities (Schilling-Estes, 2002; Rickford & Eckert, 2001).
L1 accent in L2 speech can also be thought of as an act of identity. Guiora (1972)
suggested that the more rigid language ego boundaries in adults compared to children
results in their assertion of cultural and ethnic identity through maintenance of a
stereotypical accent. That is, he argued that socio-emotional factors are as powerful in
determining the pronunciation of L2 language as learning itself. Insofar as Indian people
are identified with familial, ethnic, religious or cultural groups through their mother

94
tongue, we might wonder whether L1-accented IE is a reflection of this personal and
social identity.
In Chapter II it was noted that some studies have found that people regularly use
their mother tongue in the intimate or affective domains (i.e., with family, friends,
neighbors, religion, emotions) and use English in formal or utilitarian domains (i.e., with
teachers, strangers, in technical and political discussions; Kachru, 1976; Shridhar, 1982;
Pandit, 1978; Dasgupta, 1993). In Chapter II, it was also noted that for many speakers, IE
has penetrated into the intimate and affective domains (Hohenthal, 2003). The extension
of IE into more domains suggests that speakers must also command different styles of IE
appropriate to the different domains within which it is used. If the affective and intimate
domains encourage a more vernacular style, in-line with what the sociolinguistics
literature tells us, then we might expect that IE is most “accented” in these domains,
assuming that accent is a way to convey personal and social identity in India. In the
present experiment, we used conversational topics as a stand-in for domain. The goal was
to determine whether L1 accentedness varied with the topic of conversation. Assuming
that L1 accentedness is a socio-indexical marker of personal identity, we expected that
accentedness might be more evident in discussions of more personal topics or of topics
that recall childhood than in discussion of more neutral topics. This prediction was tested
by measuring the perceptual and acoustic similarities and differences of IE elicited in a
conversational setting. Native Hindi and Telugu speakers engaged in an English
conversation with another IE speaker to discuss schooling, employment/career plans,
childhood memories, and marriage. If the prediction is upheld, then it may be that the

95
effects of L1 on IE observed in Experiment 1 and Experiment 2 were due to the
association of the Lord Ganesha stories with childhood rather than to IE proficiency.
5.2. Methods
5.2.1. Participants
Sixteen of the 22 IE speakers from Experiment 2 participated in the present
experiment. Eight of the speakers had Hindi as their native language and 8 had Telugu as
their native language. Four of the native Hindi speakers were residing in Delhi and the
other 4 were residing in Hyderabad. Similarly, 4 of the native Telugu speakers were
residing in Delhi and the other 4 were residing in Hyderabad.
Thirty new listeners participated in a perceptual task that compared IE produced
by native Hindi and Telugu speakers. Fifteen listeners were native speakers of Hindi and
other 15 were native speakers of Telugu. All listeners were residing in Portland, Oregon
and had been in the United States for at least one year. As in the previous experiments,
none of the listeners were acquainted with any of the speakers who provided the spoken
material for the experiment.
5.2.2. Elicitation Task
Conversational speech was elicited from each speaker. The experimenter
manipulated the conversation so that the following topics were discussed: 1) schooling,
2) employment, 3) marriage and 4) childhood memories. At the beginning of the
conversation, each speaker was asked about their mother tongue and the languages they
used on a daily basis. The conversation flowed from there, with the next topic chosen on

96
the basis of what had been previously discussed. For example, when a speaker said that
they spoke Hindi/Telugu at home but English at work, then the experimenter shifted the
conversation so that the speaker would talk about their job and career plan; however, if a
speaker said that they had been using English since their school days, then the
experimenter shifted the conversation so that the speaker would talk about schooling
and/or childhood memories and so forth. Thus the order in which the topics were
discussed was quasi-randomized by the flow of the conversation. The length of the
conversation with each speaker varied from 7–12 minutes, with each topic discussed for
1-3 minutes. The length of discussion and amount of speech produced varied from one
speaker to other, with some participants initially providing little speech due to shyness.
The experimenter managed shyness by following the interests of the speaker rather than
keeping the discussion strictly focused on the specific topic. For example, one speaker
who talked about her childhood memories said that she used to play kho-kho (a field
game), and nothing much after that. The experimenter therefore turned the conversation
over to asking questions about kho-kho. The discussion of kho-kho then provided the
basis for the sample of speech on the topic “childhood memories.”
Participants were recorded in a quiet room using a Shure professional
unidirectional microphone and a Marantz Professional PMD660 portable solid-state
recorder. To be consistent with previous experiments, utterances that were approximately
2 to 6 seconds in length were chosen for analysis. In spite of some shyness, every speaker
produced at least 2 utterances on each topic that met the minimum requirement of being 2
seconds long and prosodically coherent. These sentences varied in length from 8 to 27

97
syllables. Orthographic transcriptions of the 128 sentences selected for analysis are given
in Appendix III.
5.2.3. Perceptual Judgment Task
The 128 sentences selected for analysis were amplitude normalized to 70 dB and
divided into two sets. Each set consisted of just one sentence per topic from each speaker.
Thirty listeners participated in the task. Twenty listeners completed the judgment task
that used the first set of sentences, and 10 listeners completed the task that used the
second set of the sentences. Half of the listeners in each group (N = 15) heard only
sentences elicited from conversations of personal topics, and the other half (N = 15) heard
only sentences elicited from conversations on neutral topics. Half of the listeners in each
topic-based condition were Hindi speakers and other half were Telugu speakers.
On each trial, listeners were presented with two different sentences produced by
different IE speakers. Listeners either participated in a condition where all sentences were
drawn from conversations on a personal topic or from those on a neutral topic. The
sentences were produced by speakers who had either the same native language or
different native languages, but their city of residence was controlled by dividing the
judgment tasks into two blocks. In one they heard just speakers residing in Delhi and in
the other just speakers residing in Hyderabad. The same pair of different speakers was
never repeated for a particular sentence order. The pairs of speakers were either female or
male, but never a combination of male and female. The sentence pairs were presented in
random order over headphones to listeners. Listeners were told that their job was to listen
to each pair of sentences and judge whether the different speakers had the same native

98
language background or different native language backgrounds. Judgments were to be
made on a 5-point scale, where “1” equaled a confident “same” judgment and “5”
equaled a confident “different” judgment. The scale was presented on a computer
monitor, and the listeners indicated their response by clicking on the box with the number
that corresponded to their judgment. The order of the block of speakers (from Delhi or
Hyderabad) was counter-balanced across listeners. Listeners were given a 10 minute
break after completion of the first block. Perceptual judgments on the paired sentences
took approximately 30-40 minutes to complete.
5.2.4. Acoustic Measurements
As in the previous two experiments, acoustic measurements were used to
investigate differences in IE pronunciation. In the present case, the factors of interest
were the conversational topic, and native language of the speaker. The same segmental
and suprasegmental characteristics were chosen for measurement: F1 and F2 for all
vowels, degree of retroflexion for /ʈ/ and /ɖ/, the spectral characteristics of /s/, and
temporal patterns associated with lexical stress, phrase-final lengthening, language
rhythm, as well as a measure of speech rate. To be consistent with previous experiments
the selection criteria for each category was same: only syllable-initial stops, non-final /s/,
and disyllabic words were chosen for measurement. All possible occurrences of each
were extracted from the 128 sentences obtained. Table 5.1 provides the list of words
selected to investigate the degree of retroflexion and /s/ production. The list of disyllabic
words selected for stress pattern analysis is provided in Table 5.2. The number of vowels

99
measured was 353. Vowel identity was determined based on what would be the canonical
GIE pronunciation of the word.
Table 5.1. List of words with retroflex stops /ʈ, ɖ / and fricative /s/ in English.
Obstruent Words
/ʈ/ auto, but, forget, got, it, lot, not, out, right, sort, that, what, write
/ɖ/ abroad, bad, bit, dad, did, field, good, had, mad, period, side, today, would,
weird
/s/ school, scale, saint, said, research, civils, certain, science, second, sector,
see, select, self, sense, seriously, seventh, side, sisters, sixth, slap, small,
so, software, some, something, sort, south, speak, spend, stand, standard,
starting, strict, student, studied, studying, success, such, sudden, syllabus,
system, CBSE, CS, ICICI,
Table 5.2. Disyllabic words selected for analyzing lexical stress.
Trochaic pattern Iambic pattern
after, always, commerce, conflicts, convent, easy,
either, English, enter, even, every, family, father,
fifty, finish, future, gamble, hundred, interest, into,
legal, level, many, market, marriage, marry, masters,
mobile, moment, never, only, parents, pattern,
people, person, public, rather, rickshaw, sector,
software, something, student, teacher, theater,
trouble, very, writer
about, abroad, accept, arrange,
because, become, before,
believe, belong, between,
commit, depend, forget, oppose,
select, success
5.2.5. Analyses
Preliminary analyses indicated no effect of sentence set or listener background on
the results for both sets of analyses. Thus, the data were combined in all analyses reported

100
below. The perception data were analyzed using ordinal logistic regression in SPSS. We
used the listeners’ responses (1-5) as the dependent variable. Topic and native language
were entered into the analysis as predictors. The acoustic data were analyzed using linear
mixed effects modeling. These analyses investigated the fixed effect of conversational
topic (Neutral or Personal) and speakers’ native language (Hindi or Telugu) on the
various acoustic measures. Segment identity was an additional fixed factor in the analysis
of retroflexion. The English lexical prominence pattern was an additional fixed factor in
the analysis on V1:V2 duration. Item (word or sentence) and speaker were treated as
random factors. All results reported below are given with the denominator degrees of
freedom rounded to the nearest whole number.
5.3. Results
Indian-English speaking listeners were able to distinguish between English
sentences produced by native Hindi speakers and native Telugu speakers. More
importantly, listeners were better able to differentiate between native speakers of Hindi
and Telugu when the speech sample was extracted from discussion of a personal topic.
The acoustic measures were consistent with the perceptual results. The English produced
during discussion of a personal topic differed on 5 measures from that which was
produced during discussion of a neutral topic. These results are presented in detail below.
5.3.1. Perceptual Judgments
The analysis of similarity ratings on IE sentences revealed a simple effect of
native language, χ 2
(1) = 5.23, p = .019, and an effect of topic, χ 2
(1) = 65.72, p < .001.

101
These effects are shown in Figure 5.1. Listeners could accurately differentiate English
sentences produced by native Hindi speakers from those produced by native Telugu
speakers especially when sentences had been extracted from the conversations on
personal topics. The result is consistent with the prediction that L1 influence on IE would
be stronger for topics that are more personal to the speaker.
Figure 5.1. Listener difference ratings of IE sentence pairs are shown as a function of the
topic (Personal vs. Neutral) and native language (same or different). Note that analyses
were conducted on the untransformed dependent variable (see Analyses).
Table 5.3 shows the distribution of the actual responses based on topic (Personal
or Neutral) and speakers’ native language (same or different). The numbers confirm that
listeners were able to easily differentiate speakers with different L1s when the speech
samples were extracted from discussion of a personal topic: when the sentences came

102
from speakers with the same L1, the majority of responses were “1” and “2”; when the
sentences came from speakers with different L1s the majority of responses were “4” and
“5”. Listeners correctly differentiated speakers based on L1 52% of the time, were wrong
43% of the time, and uncertain 5% of the time. When the speech samples were extracted
from conversations on a neutral topic from different L1s they were correct 49% of the
time, wrong 38% of the time, and not sure 3% of the time. The effect of topic shown in
the Figure 5.1 seems to be due to the certainty of the correct responses in the personal
topic condition.
Table 5.3. Distribution of listeners’ response as a function of native language (target) and
topic.
Topic Response Native Language/Target
Same Different
Personal 1=same 110 160
2 206 233
3 30 31
4 124 210
5=different 141 251
Neutral 1=same 86 120
2 124 177
3 22 23
4 139 201
5=different 169 259
In sum, the similarity ratings on IE sentences indicate that effect of topic on IE is
strong enough for listeners to be able to differentiate speakers’ native language, especially
when the speech sample was been extracted from discussion of a personal topic. Listeners
had more difficulty distinguishing the speakers’ L1 when sentences were extracted from
discussion on a neutral topic. These results are consistent with the idea that socio-

103
indexical markers of personal identity become more pronounced when speakers’ speech
is about a personal topic.
5.3.2. Acoustic Measurements
The next set of analyses addressed the effect of topic (Personal vs. Neutral), and
native language (Hindi or Telugu) on the production of specific segmental and
suprasegmental attributes. The results on vowel production are presented first, followed
by those on retroflexion, /s/ production, lexical stress, final lengthening, and rhythm, in
that order. We expected that, similar to the previous two experiments, vowel systems
would be different for IE produced by Hindi and Telugu speakers, and that Hindi
speakers of IE would produce a higher degree of retroflexion and lower mean frequency
for /s/ production than Telugu speakers as well as greater final lengthening, a more
variable rhythm pattern, and a slower speech rate from Telugu speakers. In terms of
topic, we expected greater effects of L1 during discussion of personal topics compared to
during discussion of neutral topics.
The IE vowels are plotted in Figure 5.2 according to their normalized F1 and F2
values and shown as a function of topic and speakers' native language. A qualitative
comparison of the different vowel spaces depicted in the figure suggests that IE does vary
somewhat with topic and with native language. Quantitative analyses were conducted to
determine which, if any, of the differences evident in Figure 5.2 were systematic enough
across speakers to be statistically significant. In particular, the analyses on F1 and F2
values separately tested for effects of topic, and native language on the production of
particular vowels.

104
Analyses of F1 revealed a significant effect of topic on /ə/, F(1,23) = 5.82, p =
.024; on /e/, F(1,28) = 5.45, p = .027; and on /u/, F(1,20) = 5.54, p = .029, a significant
effect of native language on /ɑ/, F(1,28) = 12.45, p = .001; and on /u/, F(1,20) = 6.82, p =
.017. Visual inspection of the Figure 5.2 shows that the main effect of topic was due to
speakers’ production of more raised vowels for the personal topic than the neutral topic.
The main effect of native language was due to Hindi speakers producing more raised
back vowels than Telugu speakers. This result is similar to the results for back vowels
from Experiment 2.
Analyses of F2 revealed a significant effect of topic on /ᴐ/, F(1, 29) = 6.33, p =
.018, a significant interaction between topic and native language was observed for /u/,
F(1,20) = 4.47, p = .047. The main effect of topic was due to a more centralized vowel in
the personal topic condition compared to the neutral topic condition. The interaction
effect of topic and native language was due to Hindi speakers’ production of a more
backed /u/ in speech extracted from conversations on a personal topic whereas Telugu
speakers produced a more centralized /u/ in this context. Thus, as expected, Hindi and
Telugu speakers showed more L1 accented vowels for the conversations on personal
topic than neutral topic.
With respect to degree of retroflexion, an analysis of the difference between F3
and F2 at vowel offset indicated a significant effect of topic, F(1, 90) = 10.69, p = .002, a
significant effect of native language, F(1, 90) = 7.76, p = .007, and an interaction
between native language and retroflex identity, F(1, 90) = 15.67, p < .001. When data

105
Figure 5.2. The monophthongal vowel space is shown by native language (Hindi or
Telugu) and by topic (Personal: top panel; Neutral: bottom panel). Vowel measures were
taken at the F1 and F2 midpoint and normalized using the Lobanov method (note: i=/i/ or
/i:/, I=/ɪ/ or /i/, e=/e/ or /e:/, E=/ɛ/ or /e/, A=/æ/, a=/ɑ/ or /ɑ:/, 3=/ə/, 3r=/ɚ/, o=/o/ or /o:/,
O=/ɔ/ or /o/, u=/ʊ/ or /u/, u=/u/ or /u:/).
were split by retroflex identity, the effect of topic was significant only for the /ɖ/, F(1, 39)
= 12.49, p = .001, whereas effect of native language was significant for /ʈ/, F(1,51) =
20.96, p < .001. This result, shown in Figure 5.3, indicates that speakers produced the
consonant with more retroflexion when speaking on a personal topic than when speaking
on a neutral topic, consistent with the expectation of more L1-accented speech when the
topic is more personal. As before, Hindi speakers were found to produce consonants with
a higher degree of retroflexion than Telugu speakers, albeit only for /ʈ/.

106
Figure 5.3. Degree of retroflexion of post-vocalic stops is shown as a function of topic
(Personal vs. Neutral) and native language (Hindi vs. Telugu). Retroflexion was
measured as the difference between the F2 and F3 offset values in the preceding vowel
(note: T=/ʈ/, D=/ɖ/).
The overall analysis of mean /s/ frequency indicated a main effect of native
language, F(1, 82) = 9.50, p = .003, but no effect of topic or any interaction between
factors. The result in Figure 5.4 shows that Hindi speakers’ once again produced /s/ with
a lower average frequency compared to Telugu speakers.

107
Figure 5.4. The average frequency of syllable-initial /s/ is shown as a function of topic
(Personal vs. Neutral), and the native language (Hindi vs. Telugu).
The results on temporal patterns associated with lexical stress in English indicated
a significant effect of stress pattern, F(1, 116) = 91.24, p < .001, but no main effect of
topic, native language or any interaction between these factors. When the data were split
by stress pattern, a nearly significant interaction between topic and native language was
observed for the trochaic stress pattern, F(1, 82) = 4.86 p = .054. This result, shown in
Figure 5.5, was due to Hindi speakers, who tended to produce trochaically-stressed
disyllabic words with long V1 relative to V2 when speaking on a personal topic
compared to neutral topic. This result is consistent with the expectation that IE would be
more “accented” when speaking on a personal topic compared to a neutral topic.

108
Figure 5.5.IE lexical stress in disyllabic words, measured as the ratio of the duration of
the first vowel to the duration of the second is shown as a function of topic (Personal vs.
Neutral), and native language (Hindi vs. Telugu).
The results on phrase-final lengthening also indicated an effect of topic, F(1,124) = 4.19,
p = .043, but no effect of native language. There was also no interaction between these
factors. Speakers simply produced more phrase-final lengthening when speaking on a
personal topic compared to a neutral topic (aee Figure 5.6). The analyses on global
rhythm and speech rate also indicated no effect of topic or native language or interaction
between factors.

109
Figure 5.6. Phrase-final lengthening, measured as the ratio of the ultimate vowel duration
to the penultimate vowel duration, is shown as function of topic (Personal vs. Neutral),
and the speakers' native language (Hindi vs. Telugu).
Finally, the analysis on global rhythm metrics and speech rate indicated no effect
of topic or native language or interaction between factors. Figure 5.7 shows no
difference in the speech rate for Hindi and Telugu speakers and for the personal and
neutral topics.

110
Figure 5.7. Speech rate shown as a function of topic (Personal vs. Neutral), and speakers'
native language (Hindi vs. Telugu).
In sum, the acoustic measures indicated effects of topic and native language on
IE. The effect of topic and native language was observed for vowels and retroflexion.
Topic also affected final lengthening. The effect of native language on vowels and
retroflexion were similar to the ones seen in Experiment 1 and 2: Hindi speakers
produced /ʈ/ with more retroflexion than /ɖ/ and vice versa for Telugu speakers. Hindi
speakers also produced /s/ with a lower mean frequency than Telugu speakers, similar to
previous studies. Altogether, the results are consistent with the suggestion that speech

111
varies not only by speakers’ native language but also by the conversational setting such
that more accented speech is elicited when the topic is personal.
5.4. General Discussion
The current experiment investigated the effect of conversational topic on IE
accentedness. The results indicate that this effect of topic go beyond the effect of native
language on IE, which is also still observed. The results provide some minimal support
the view that accentedness is a socio-indexical marker of personal identity (Tajfel, 1978;
Krauss & Pardo, 2006; Meyerhoff, 2006). As expected based on sociolinguistic studies
with monolingual speakers (Labov, 1972; Kiesling, 2009; Schieffelin and Ochs, 1986;
Guiora, et. al., 1972; Dasgupta, 1993), the domain of speech indexed by the topic
influenced the variety of speech that speakers used in conversation: more personal topics
elicited more L1-accented IE than neutral topics. For example, we found an effect of
topic on vowel space such that vowels produced in conversation about a personal topic
were raised and centralized relative to those produced in conversation about a neutral
topic. It is to be noted that vowel system of Hindi and Telugu are smaller than that of the
GIE vowel system. The Indian languages also exhibit a length contrast for almost all the
vowels. It is also been suggested that short vowels in Hindi and other Indian languages
tend to be more centralized compared to long vowels, resulting in a smaller vowel space
(Mishra et al., 2010). Thus, the greater degree of vowel centralization when speaking on a
personal topic could reflect greater L1 accentedness. Of course, centralization is also a
feature of vowel reduction, which is frequently observed in casual speech (Picheny et al.
1986; Bradlow, 2002; Harst et al., 2011). Casual speech is produced in settings where the

112
listeners are familiar and the conversation is easy, for example, the familial domain. Thus,
it could also be that Hindi and Telugu speakers produced more centralized vowels in
discussion of personal topics than neutral topics because their speaking style varied with
the topic. Still, the finding that speakers also produced consonants with more retroflexion
when speaking on a personal topic is clearly consistent with the prediction of greater L1
accentedness when speaking on a personal topic. Retroflexion is characteristic of many
South Asian languages, and thus may serve as a strong marker of personal or social
identity, just as it seems to do for Punjabi speakers in London (Sharma & Sankaran,
2009).
With respect to the effect of topic on final-lengthening, Odlin (1989: 56) has
claimed that “many paralinguistic elements can also serve to mark a conversational style:
intonation and related characteristics such as loudness and speech rate, gestures, facial
expression, physical posture, and the like.” This result too might indicate the emergence
of a more vernacular, casual IE when speaking on a personal topic. This casual IE is also
more influenced by the L1.
Together the results from the present experiment continue to undermine the idea
that proficiency is the best explanation for L1 influence in IE. A partial explanation for
the effect of native language in Experiments 1 and 2 may be due to the speech materials
used in those experiments. The telling of Lord Ganesha’s story may have put speakers in
mind of the context in which they would have first encountered the story: a very personal,
very familial context. Such a reinterpretation of the earlier results accords with learning
stance theory discussed earlier (Schieffelin & Ochs, 1986).

113
The present results might also be interpreted in terms of psychological factors
rather than in terms of social factors. A number of scholars suggest that a vernacular-to-
standard continuum results from the amount of attention paid to the linguistic form while
speaking (e.g., Tarone, 1983; VanPatten, 1990). When speakers are engaged in casual
conversation or are excited about the topic they are discussing they may pay more
attention to the content of what they are saying and, as a consequence, less attention to
the form of the language. Less attention to form could result in more accented/vernacular
speech and in more errors in the non-native language. When speakers are neutral about
the topic and emotionally less excited, they may pay more attention to the linguistic form,
resulting in a more standard L2. This psycholinguistic interpretation of the results may be
fully compatible with the social interpretation given above, particularly if we imagine
that a speech community grammaticalizes individual tendencies towards more accented
speech under more personal and casual speaking conditions. Still, the different
explanations for the findings do highlight once again the complexities of understanding
IE variation in the multi-lingual context in which it is used.

114
CHAPTER VI
CONCLUSION
This dissertation investigated linguistic and social factors that were hypothesized
to contribute to variation in IE. The goal was to understand the status of IE as one of the
World Englishes. The findings reported in Chapter III indicate that different L1s
influence the pronunciation of IE, but that this influence is relatively subtle in nature. The
results reported in Chapter IV suggested that L1 influences on IE might be partly regional
in nature. Although persistent effects of L1 on IE were observed, listeners were able to
differentiate IE speakers by region when L1 was controlled. However, it was largely the
Telugu speakers who showed strong regional variation in IE; Hindi speakers much less
so. This difference was interpreted to reflect the relative social and political power of the
two indigenous languages. Hindi has higher prestige than Telugu by virtue of being a
national language and the language of the capital city. Thus IE spoken by Hindi speakers
and by speakers residing in Delhi might be considered more prestigious than English
spoken by Telugu speakers and speakers living in Hyderabad. In other words, the IE
variety spoken in Delhi might be the emerging standard variety of IE.
As for the persistent effects of L1 on IE, we wondered whether the elicitation task
encouraged people to use a variety of the language that indexed a personal identity since
they were asked to tell a story that they would have learned as children. The experiment
presented in Chapter V tested for variation along personal to professional and familiar to
formal axes by investigating the pronunciation of IE when speaking on topics designed to
orient the speaker to his or her personal identity and to recall the family domain or to IE

115
as a language of education and economic power. The results indicated that, as expected
based on the sociolinguistic literature, speaking on personal topics brought out more
accentedness than speaking on neutral topics. This result was interpreted to suggest that
speakers have found a way to modify IE to foreground their personal and social/ethnic
identity; a task that may also be accomplished by using the mother tongue. Alternatively,
result could be interpreted to suggest style switching and that while discussion personal
topics speakers pay less attention to linguistic form resulting in a more accented speech.
Overall, the findings suggest that, among highly proficient speakers of IE,
variation in pronunciation is socially conditioned, suggesting that IE has entered the
differentiation phase of Schneider’s (2003) dynamic model of English evolution. At least
among the speakers in this experiment, IE tracks personal expression even while allowing
for communication across regional, ethnic and other social boundaries. Thus IE is truly
an Indian language; one that people can relate to and call their own even while it is also
used as a lingua franca without any loaded aspect of ethnic group. Due to globalization
and the importance of English in the global market, IE is becoming more important to
Indians than any of the other indigenous languages of India. Thus it might not be far-
fetched to say that IE will soon acquire the status of (national) language that unifies the
country.
6.1. IE Use Across Domains
There are contradictory views on the use of IE in different domains. Some
scholars claim that IE is used exclusively as a utilitarian language (Das, 2002; Pingali,
2009). Others suggest that IE is used across domains, from the personal to the economic

116
domain (Pandit, 1978; Kachru, 1976; Sridhar, 1989; Hohenthal, 2003). From the self-
reported language use reported by participants in experiment 2 (Chapter IV), IE seems to
have penetrated the friendship domain for many speakers and the family domain to a
lesser extent. Exclusive use of IE in the professional domain suggests that this is still its
principle domain. But there are signs that this situation is continuing to change. With
increased mobility of people from one region to other in India, there has also been rise in
intermarriages between partners of different backgrounds. Although this does not
necessarily imply a change in the language used in the personal domains, the trend is
towards marriages between people who share an educational background rather than
merely a social or ethnic background. When this happens, individuals who do not speak
the same L1 may marry, and the couple falls back on IE to communicate in the personal
domain. This situation is observed especially in marriages where one partner is from a
Tamil- or Hindi-speaking state as these individuals are least likely to speak another
indigenous language besides Tamil or Hindi. The rate of intermarriages is only likely to
increase with in-migration to large cities and with the importance and emphasis on
education and English. As intermarriages increase, so too will the penetration of IE into
the personal domain.
6.2. IE as a Possible National Language
Due to the enormous linguistic and ethnic diversity of India, India has had
problems choosing a national language. The biggest problem has been that there is no
single indigenous language that a large majority of the citizens accept as a symbol of
national identity due to jealousies between groups. It is for this reason that Hindi, an
117
indigenous language, is questioned in its status as national language. As an ethnic and
regional language, the use of Hindi as a national language is perceived by a significant
portion of the population an imposition of one group over the others. Any attempts to
enforce the use of one indigenous national language throughout India might lead to
greater state autonomy or division of a country that readily divides along ethnic/regional
and social/economic lines. Recall that Indian independence cost it the division of Indian
subcontinent into present day India and Pakistan, based on religion. This division is fierce
and symptomatic of the strong differences in social identities that occur throughout India.
Because of the constant threat of division, India needs a language that is neutral
with respect to ethnic and regional identities and so could act as uniting power. Many
think English can be that one language, for example, Kachru (1986), stresses the
neutrality of English: “English is free from any undesirable (e.g. ethnic or religious)
connotations native languages may have. The pros of using English have wiped away the
fact that it originally was the colonizer's language (p. 9).” Famed author Salman Rushdie
(2003) wrote that
IE is not “English” English, to be sure, any more than Irish or American or
Caribbean English is. And it is a part of the achievement of English-language
Indian writers to have found literary voices as distinctively India, and also as
suitable for any and all of the purposes of art, as those other Englishes forged in
Ireland, Africa, the West Indies, and the United States.
In modern day India, it is clear that IE is the language of economic power without
which one cannot become a doctor, an engineer, a scientist, or obtain any other high-
prestige job. This power has conferred prestige upon English, and along with this,

118
prestige on the increasing number of English-medium schools in Indian. As this
dissertation shows, IE is now also a malleable and flexible language that mixes with the
vocabulary of the home and hearth. It is Indian now. IE does not hold to any Oxford
norms, and is continually being adjusted according to the Indian speakers’ wish. And the
differentiation of IE into multiple varieties continues apace. That said, a standardized
variety is also important. GIE is supposed to be this variety, and is meant to be
consistently taught in primary and secondary education. But English teachers are also
native speakers of an Indian language, and thus likely also exhibit an L1-accented IE that
is then imparted to students. In this scenario, it may be that students who have teachers
with Hindi as their L1 receive a variety of IE that has higher prestige given that Hindi
itself is more associated with political and other social power than other Indian
languages.
6.3. Remaining Issues
As suggested by Kachru (1986) a large-scale study of variation of IE is needed.
The current dissertation provides initial insights into the linguistic and socio-linguistic
factors that continue to play an important role in the evolution of IE into different
varieties. However, the present study was restricted to the most educated Indians; those
who are highly proficient in English. Future work will need to investigate English in the
context of different proficiency levels. Along these lines, the present study focused just
on the social aspects of the IE acquisition; psychological factors were not explicitly taken
into consideration even though the personal topics and elicitation methods used in
Experiment 3 are also sometimes used to investigate accentedness in the second language

119
acquisition literature. Still, a truer study of attention to form might need to use more
controlled speech materials than the ones used here. Finally, the present study did not
provide information on attitudes towards differently accented IE, even though there was
some indication from Experiment 2 that Hindi-accented IE might be more prestigious
than Telugu-accented IE. According to Acculturation Model by Schumann (1978) the
degree to which the second-language learners acculturate themselves towards the culture
of target-language group generally depends on social and psychological factors. These
factors will determine respectively the level of social distance and psychological distance
an L2 learner is having in course of his learning the target language. Thus it is important
for the future work to explore these factors in detail.
Although the number of people getting educated in English has been on the rise in
India, it is nonetheless true that a large portion of the Indian population are uneducated or
have limited education and so little to no access to English. A discussion of IE as a
national language leaves underprivileged people out. On the other hand, it is important to
note that any discussion of national language leaves these people out. With little to no
education, their use of language is largely restricted to their mother tongue. This situation
calls for serious reform of education in India and the proper implementation of language
policy. In spite of the Right of Children to Free and Compulsory Education Act or Right
to Education (RTE) Act which came into force on 1st April 2010, there are many
loopholes in Indian law and also deliberate ignorance of the act in most private schools.
The act requires all private schools to reserve 25% of seats to underprivileged children;
however, children continue to be admitted to private schools based only on caste. In
addition, most of the public schools in India do not have proper infrastructure, and have a

120
shortage of teachers. As a consequence, the quality of education not held to a high
standard and English education is frequently ignored. In all, the policy needs to be
revised to take input from educators, and the government needs to monitor the schools to
enforce the rule or face dire consequences. Additional funding must also be allocated to
public schools so that they may be improved and brought to par with the private schools
in the quality of education that they offer in English and other subjects.
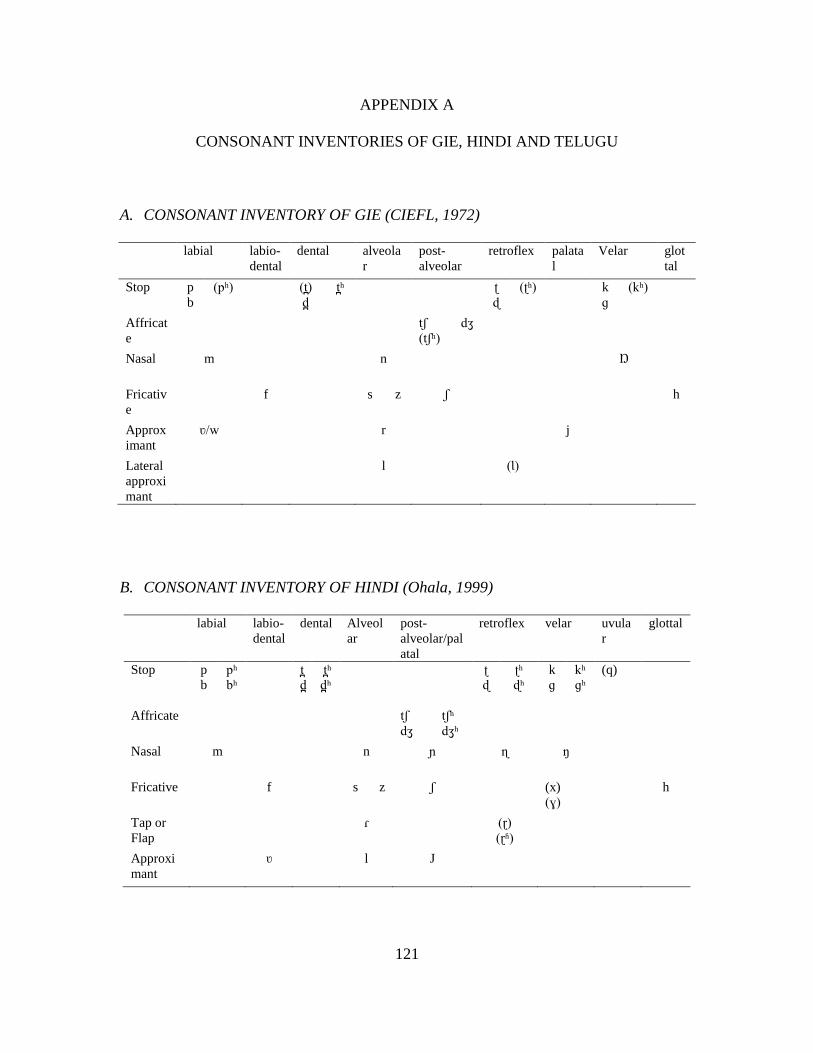
121
APPENDIX A
CONSONANT INVENTORIES OF GIE, HINDI AND TELUGU
A. CONSONANT INVENTORY OF GIE (CIEFL, 1972)
labial labio-
dental
dental alveola
r
post-
alveolar
retroflex palata
l
Velar glot
tal
Stop p
b
(pʰ) (t̪)
d̪
t̪ʰ ʈ
ɖ
(ʈʰ) k
ɡ
(kʰ)
Affricat
e
tʃ
(tʃʰ)
dʒ
Nasal m n Ŋ
Fricativ
e
f s z ʃ h
Approx
imant
ʋ/w r j
Lateral
approxi
mant
l (Ɩ)
B. CONSONANT INVENTORY OF HINDI (Ohala, 1999)
labial labio-
dental
dental Alveol
ar
post-
alveolar/pal
atal
retroflex velar uvula
r
glottal
Stop p
b
pʰ
bʰ
t̪
d̪
t̪ʰ
d̪ʰ
ʈ
ɖ
ʈʰ
ɖʰ
k
ɡ
kʰ
ɡʰ
(q)
Affricate tʃ
dʒ
tʃʰ
dʒʰ
Nasal m n ɲ ɳ ŋ
Fricative f s z ʃ (x)
(ɣ)
h
Tap or
Flap
ɾ (ɽ)
(ɽʱ)
Approxi
mant
ʋ l J

122
C. CONSONANT INVENTORY OF TELUGU (Krishnamurti, 1972)
Bilabial Labio-
dental
Dental/
Alveolar
Retroflex Post-
alveolar/Pa
latal
Velar Uvular Glottal
Nasal m n ɳ
Plosive p
b
pʰ
bʱ
t̪
d̪
d̪ʱ ʈ
ɖ
ʈʰ
ɖʱ
k
ɡ
kʰ
ɡʱ
Affricate tʃ
tʃʰ
dʒ
dʒʱ
Fricative f s ʂ ʃ h
Tap or
Flap
ɾ
Approxima
nt
w l ɭ j

123
APPENDIX B
LORD GANESHA STORY IN IE, HINDI AND TELUGU
A. STORY IN INDIAN ENGLISH
1. Lord Ganesha is very fond of laddoo (modaka, a sweet delicacy).
2. Once upon a day of Ganesh Puja, Ganesha went from house to house and
accepted the offering of laddoo.
3. He stuffed himself to the capacity and decided to take a ride on his mouse at
night.
4. Along the moonlit road, they got to see a large snake, and the troubled rat
stumbled, with the consequence Ganpati fell down.
5. He hit the ground hard and as a result his stomach burst open.
6. All the laddoo came out, but Ganesha again stuffed them into his stomach.
7. He caught the snake and tied it around his belly.
8. Moon witnessed the whole event and laughed heartily.
9. Lord Ganesha lost his temper and furiously looked about for something to throw
at his tormentor.
10. Getting nothing, he pulled out one of his tusks and hurled it at the moon.
11. He cursed the moon that no one should look at the moon on the day of Ganesh
Puja.
12. If anyone would look at it, he will get a bad name, criticism, or ill reputation.

124
13. If anyone gets to see the moon by chance he would be free from that bad name or
blame after hearing the story of Lord Krishna’s clearing his personality in respect
of syamantaka jewel.
B. STORY IN HINDI (Standard transliteration, sentences were presented in Devanagari
script.)
1. Bhagwan Ganesh ko laddoo bahut pasand hai.
2. Ek baar Ganesh Puja ke din Ganesh ghar ghar gaye, tatha jo laddoo diye gaye veh
swikar kiye.
3. Vah baDi mushkil se raat me apne vahan chuhhe par sawar hokar nikle.
4. Chandni raat me unhe ek baDa saanp dikha jise dekh kar vah bhaybhit ho gaye
aur Dagmagane ke karan Ganapati niche gir paDe.
5. Vah jese hi sakht zamin par gira, vese hi uska peT faT gaya.
6. Girte sabhi laddoo bahar gir gaye lekin Ganesh ne unhe dubara apne peT me Daal
diya.
7. Usne saanp ko pakaD kar apne kamar me bandh liya.
8. Chaand is pure ghaTna kram ko dekhte hue ji bhar kar hasa.
9. Bhagwan Ganesh gusse me aa kar aag babula hote hue kuch fekne ke liye idhar
udhar dekha.
10. Jab kuch nahi mila to usne apna ek daant bahar nikaal kar chaand par vaar kiya.
11. Usne chaand ko shrap diya ki Ganesh Puja ke din koi bhi chaand ko nahi dekhega.
12. Agar koi ise dekhega to vah badnaam hoga aur use burai aur badnaami milegi.
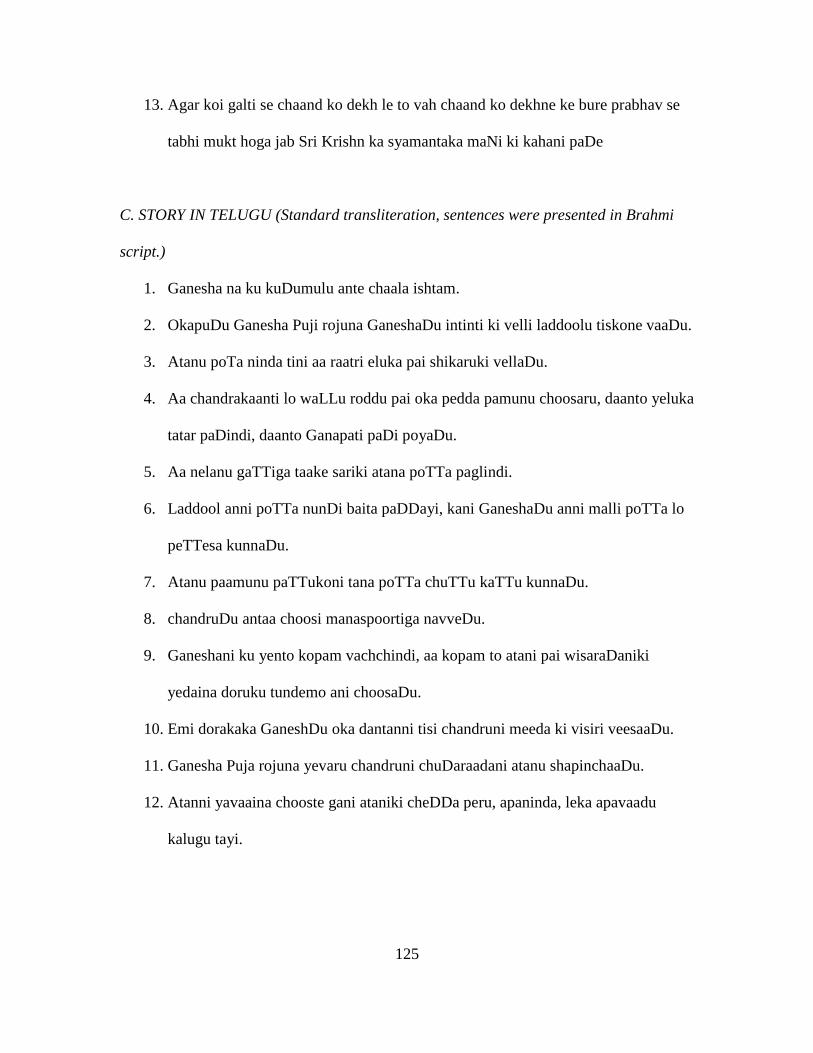
125
13. Agar koi galti se chaand ko dekh le to vah chaand ko dekhne ke bure prabhav se
tabhi mukt hoga jab Sri Krishn ka syamantaka maNi ki kahani paDe
C. STORY IN TELUGU (Standard transliteration, sentences were presented in Brahmi
script.)
1. Ganesha na ku kuDumulu ante chaala ishtam.
2. OkapuDu Ganesha Puji rojuna GaneshaDu intinti ki velli laddoolu tiskone vaaDu.
3. Atanu poTa ninda tini aa raatri eluka pai shikaruki vellaDu.
4. Aa chandrakaanti lo waLLu roddu pai oka pedda pamunu choosaru, daanto yeluka
tatar paDindi, daanto Ganapati paDi poyaDu.
5. Aa nelanu gaTTiga taake sariki atana poTTa paglindi.
6. Laddool anni poTTa nunDi baita paDDayi, kani GaneshaDu anni malli poTTa lo
peTTesa kunnaDu.
7. Atanu paamunu paTTukoni tana poTTa chuTTu kaTTu kunnaDu.
8. chandruDu antaa choosi manaspoortiga navveDu.
9. Ganeshani ku yento kopam vachchindi, aa kopam to atani pai wisaraDaniki
yedaina doruku tundemo ani choosaDu.
10. Emi dorakaka GaneshDu oka dantanni tisi chandruni meeda ki visiri veesaaDu.
11. Ganesha Puja rojuna yevaru chandruni chuDaraadani atanu shapinchaaDu.
12. Atanni yavaaina chooste gani ataniki cheDDa peru, apaninda, leka apavaadu
kalugu tayi.

126
13. Porpaatuna yevraina chandruni chooste vallu apanindala paalayete KrishnuDu
syamantaka maNi pondeTappuDu paaleina apanindalu kada chadivite aa
apanindalanunDi vimukti pondutaaru.

127
APPENDIX C
SENTENCES ON MARRIAGE, CHILDHOOD MEMORIES, SCHOOLING AND
EMPLOYMENT
A. SENTENCES ON MARRIAGE
1. We have to spend whole our life with that guy, so we should know him like
properly.
2. Arrange marriage it’s a gamble, can work if you want to.
3. At a personal level, I won’t go for arrange marriage.
4. Love cum arrange marriage is the best, it gives you a lot of commitment.
5. Love marriage is something, I find it quite tricky.
6. Prefer arrange marriage, I don’t believe in love.
7. After marriage, it doesn’t depend that I like love marriage or arrange marriage.
8. Love marriage, in 100%, 5% is success.
9. Marriage is like far far away, and probably not there at all. I don’t really want to
get married.
10. Love marriage, it depends sometimes it’s good sometimes it’s not.
11. If I fall in love, then I will go for that.
12. Until and unless the guy is qualified, they don’t have any problem.
13. I will go for an arranged marriage not for love marriage.
14. I prefer arranged marriage, because I am very bad at choosing things to myself.
15. In my place it is mostly arranged marriages, in my family.
16. Love marriage is only girl’s choice.

128
17. We don’t know the guy, then how can we marry him without knowing, so we
must know him first.
18. Love marriage, at least you don’t have anyone else to put the blame.
19. I do trust my parents they will take a right decision for me.
20. You know kids can look upto their parents they can learn lot of things.
21. And marriage is not only between two people it’s about two families.
22. Because my father and family will not prefer for love marriage.
23. I have done it for my marriage only, I didn’t take any dowry.
24. Mom dad is also arranged marriage.
25. With marriage comes so many other things like having kids and this and that.
26. Conflicts and fights are always there is love marriage or arrange marriage.
27. If even after your marriage if he throws you, at least you can do whatever you
want.
28. Because I think it is quite weird to, you know to spend the whole life with the
person whom you don’t know at all.
29. No man in our family did a love marriage or nothing, maybe because of that also.
30. I think arrange marriage, my parents will choose for me.
31. So I think even if I prefer any guy I think they will accept.
32. She only will be selecting and everyone will oppose her in Indian culture.
B. SENTENCES ON CHILDHOOD MEMORIES
1. Actually, I got many punishment from my teacher.
2. My first English flick, Titanic, and I was underage.

129
3. Do remember one slap of my teacher, because I forgot to take my scale to the
school.
4. I was in class 4 at that time, so it was really a moment for me at the award
ceremony.
5. When I was in 8th
standard, so I decided there I have to do law.
6. I fell down from 1st floor to ground floor.
7. New feeling that I am going to new place for my education.
8. In my 8th
class I played kho-kho.
9. And when the teacher asked me where I wanted to sit, I pointed near the dustbin.
10. When I was in 5th
class there was a annual sports day.
11. I once scolded my brother, I used some very bad words.
12. To be honest I didn’t have any male friends.
13. There is an instant that my dad and mom told me.
14. More than my parents I used to go and approach her, wheneve I used to write
poems.
15. Initially it was a horrible place for me.
16. When the rickshaw man comes, we just tell him to go away, we don’t want to go
to school today.
17. I used to stand outside everyday in my library period.
18. At that time I was 12 or 13 and I went to this theater.
19. The school that I was studying earlier was quite small.
20. I was taking the award at such a small age.

130
21. In the serial, he had the principles that I have to fight with the true people and true
things.
22. And I was going to see the banana and I fell down.
23. Because don’t know to follow up their studies, lot of trouble I faced.
24. I think kho-kho is very good game to play.
25. Plus I was always a bit of a loner in school, like I didn’t make a lot of friends.
26. My class teacher, she forced me to take part and I was not willing to do it.
27. And he said that you are studying in English medium school and learning these all
things.
28. So they only asked me that you can go and come back at 12.
29. They are thinking that there is too much in my brain and I will become mad and
all.
30. There used to be my principal, who used to encourage me in writing poem. I don’t
know why.
31. But, then later on I got used to that school, I got used to those people.
32. The rickshaw man doesn’t come, my father used to drop us.
C. SENTENCES ON SCHOOLING
1. My 1st class till 12
th I was very good at English rather than in science.
2. I did my schooling from Hillgrove public school.
3. Before that I was into Saint. Mary, south ex.
4. Upto 10th
I did my schooling from Bal Bharati.

131
5. Since from the beginning I was in Lady Irvine school only, it’s an English
medium school.
6. LKG to 7th
studied from Holy Angle school.
7. But, in my school, I didn’t get science side.
8. I miss my those days, 11th
and 12th
.
9. They tried to make it compulsory many times.
10. Force us to go outside the class and we can’t finish our syllabus.
11. I was in Hillgrove public school, right from the beginning.
12. I am from a convent, so we were also encouraged to speak in English only.
13. But, only shifted different schools, that’s it.
14. There was a strict rule that we should speak in English, but we never used to do
that.
15. From my nursery till 10th
standard I was in ICIC board school.
16. Sister’s convent from nursery to 10th
standard same school.
17. When I studied commerce than I got interest.
18. In fact not only me, but the whole class, you have to speak in English.
19. From starting commerce is one thing which interest me a lot.
20. Well shifting school was ok, I mean there was not much to think about.
21. Actually, when I was in 12th
I was in science.
22. New school crowd was not very good, but adjusted myself in that atmosphere.
23. Upto 10th
class I studied in the same school.
24. I miss my those days 11th
and 12th
.
25. Teachers of course they imparted the education etc in English.

132
26. Force us to go outside the class and we can’t finish our syllabus.
27. I was like 50-50 in science, whereas in English I was average student.
28. And the courses are also really good and the teachers are like of a great
reputation.
29. Studied through my 6th
class in CBSE pattern and then suddenly shifted to SSC
pattern.
30. I am a monitor, so I had to speak English.
31. 11th
and 12th
I just changed to other college.
32. I did not change any school, had same teachers and friends, till 10th
class.
D. SENTENCES ON EMPLOYMENT OR CAREER PLAN
1. I have to do MBA after my graduation
2. It will be good for my career if I end up or enter piping sector.
3. I want to do my post graduation from abroad.
4. I have two plans in mind, either do M.Com and then get into lectureship.
5. Basically, after this passing out I want to practice for certain years.
6. Doing B.Tech in CS so hoping for software engineer.
7. Actually, my profession is marketing.
8. After graduation, I want to do MBA.
9. Plan to work after finishing my M.A, probably as a technical writer.
10. 99% translation, 1% for professor.
11. I wanted to teach, I don’t want to go for research.
12. I think I will do M.A in literature only.

133
13. Ya, I am interested in civils, I wanted to become IAS or IPS officer.
14. I want to become professor in English.
15. I think I like teaching but I am not seriously considering it.
16. Plan is to take masters in English, after M.A., Ph.D.
17. I want to do outside India, so it depends on my marks.
18. Just being a mechanical engineer, you are not gonna enter into an automobile
firm.
19. Right now I am thinking of masters.
20. I am not a sort of girl who can think such a long term thing.
21. And then I want to go into a firm, as a legal advisor.
22. IT is low but can develop in 4 years.
23. If I get any opportunity I will enter the market.
24. After graduation MBA.
25. There are not a lot of technical writer around.
26. Right now the market value for French is little bit low.
27. Those who are really very interested in learning a second language as English.
28. Maybe I will try for MNCs or something.
29. Some point of view I have that, that I have to teach.
30. I don’t know what will be my future right, I don’t know where I belong.
31. I will try to be a translator.
32. Teacher, I think it’s a best and easy job, easy in the sense, cool, many holidays.

134
REFERENCES CITED
Agnihotri, R.K., & Khanna, A. L. (1997). Problematizing English in India.
New Delhi: Sage Publication
Annamalai, E. (2005). Nation-building in a globalised world: language choice and
education in India. In Angel Lin and Peter W. Martin (Ed.), Decolonisation,
globalization: language-in-education policy and practice (pp. 20-37).
Tonawanda, NY: Multilingual Matters.
Arun, V. B. (1961). A comparative phonology of Hindi and Panjabi. Hoshiarpur: Panjabi
Sahitya Akademi.
Arvaniti, A. (2009). Rhythm, timing, and the timing of rhythm. Phonetica, 46-63.
Avery, P., & Ehrlich, S. (1992). Teaching American English Pronunciation. Oxford,
England: Oxford University Press
Aylett, M. (1996). Using Statistics to Model the Vowel Space. In Proceedings of the
Edinburg Linguistics Department Conference, 1-17.
Babu, P. (1971). Prosodic Features in Indian English: Stress, Rhythm and Intonation.
Research Diploma dissertation. CIEFL: Hyderabad.
Bailey, R. W. (1991). Images of English. A Cultural History of the Language.
Cambridge: CUP.
Balasubramanian, T. (1972). The vowels of Tamil and English: a study in contrast.
CIEFL Bulletin (Hyderabad), 9, 27-34.
Balasubramanian, C. (2009). Register Variation in Indian English. Amsterdam: John
Benjamin.
Bansal, R. K. (1970). A phonetic analysis of English spoken by a group of well-educated
speakers from Uttar-Pradesh. CIEFL Bulletin (Hyderabad), 8, 1-11.
Bansal, R.K. (1976). The Intelligibility of Indian English, Monograph 4. Hyderabad:
CIEFL.
Beardsmore, H.B. (1982). Bilingualism: Basic Principles. Tieto: Avon
Bhatt, R. M. (1997). Optimality and the syntax of lectal variation. University of
Pennsylvania Working Papers in Linguistics 4 (1), 271-298.

135
Bhattacharyya, H. (1989). The Emergence of Tripuri Nationalism, 1948-50. South Asia
Research, 2 (1), 54-71.
Bhattacharyya, H. (2005). Federalism and Regionalism in India: Institutional Strategies
and Political Accommodation of Identity. Heidelberg Papers in South Asian and
Comparative Politics. Working Papers No. 27.
Boeree, G. C. (2004). Dialects of English. Online resource
[http://webspace.ship.edu/cgboer/dialectsofenglish.html]
Boersma, P., & Weenink, D. (1996). PRAAT, a system for doing phonetics by computer,
version 3.4. Institute of Phonetic Sciences of the University of Amsterdam, Report
132. 182 pages.
Bonvillain, N. (1993). Language, Culture and Communication: the Meaning of
Messages. New Jersey: Prentice Hall.
Bourdieu, P. (1991). Language & Symbolic Power. Cambridge: Polity.
Byrd, D. M. (1994). Relations of sex and dialect to reduction. Speech Communication,
15, 39-54.
Byrd, D. M., & Mintz, T. H. (2010). Discovering Speech, Words, and Mind. Wiley-
Blackwell Publishing.
Carroll, J. B. (1964). Language and Thought. Englewood Cliffs: Prentice-Hall
Census of India. (2001). Online resource
[http://censusindia.gov.in/Census_Data_2001/Census_Data_Online/Language/dat
a_on_language.html]
Chambers, J. & Trudgill, P. (1998). Dialectology. Cambridge: Cambridge University
Press.
Chaswal, K.K. (1973). A comparative study of the intonation of English and Hindi.
Research Diploma Thesis, CIEFL: Hyderabad.
Chaudhary, S. (1989). Some aspects of the phonology of Indian English. Ranchi:
Jayaswal Press.
CIEFL (1972). The Sound System of Indian English. Monograph 7. CIEFL: Hyderabad.
Clopper, C.G., Conrey, B.L., & Pisoni, D.B. (2005). Effects of talker gender on dialect
categorization. Journal of Language and Social Psychology, 24, 182-206.

136
Clopper, C.G. & Pisoni, D.B. (2006). Effects of region of origin and geographic mobility
on perceptual dialect categorization. Language, Variation and Change, 18, 193-
221.
Coelho, G. M. (1997). Anglo-Indian English: A nativized variety of Indian English.
Language in Society, 26, 561-589.
Constitution of India. (2007). Online resource
[http://lawmin.nic.in/coi/coiason29july08.pdf]
Crawford B. (2007). Globalization and Cultural Conflict: An Institutional Approach. In
H. Anheier and Y. R. Isar (Eds.), The Cultures and Globalization Series:
Conflicts and Tensions (pp. 31-50). Thousand Oaks CA: Sage.
Crystal, D. (1995). Documenting rhythmical change. In Jack W. Lewis (Ed.), Studies in
general and English phonetics: essays in honour of Professor J. D. O’Connor.
New York: Routledge.
Crystal, D. (1997). English as a global language. Cambridge: Cambridge University
Press.
Dasgupta, P. (1993). The Otherness of English: India's Auntie Tongue Syndrome. New
Delhi: Sage Publications.
Dauer, R. M. (1983). Stress-timing and syllable-timing reanalysed. Journal of Phonetics,
11, 51-69.
Dechert, H.W. (1983). How a story is done in a second language. In C. Faerch and G.
Kasper (Eds.), Strategies in Interlanguage Communication. Longman, London.
Dellwo, V. (2010). Influences of speech rate on the acoustic correlates of speech rhythm:
An experimental phonetic study based on acoustic and perceptual evidence. Ph.D
Dissertation, Universität Bonn (electronic publication: http://hss.ulb.uni-
bonn.de:90/2010/2003/2003.htm).
Deterding, D. (2001). The measurement of rhythm: a comparison of Singapore and
British English. Journal of Phonetics, 29, 217-230.
Dhamija, P. V. (1976). A phonological analysis of Rajasthani English. MPhil, CIEFL:
Hyderabad.
Dubois, S., & Horvath, B. M. (1998). Let’s tink about dat: Interdental fricatives in Cajun
English. Language Variation and Change, 10, 245-261.

137
Dulay, H., Burt, M., & Krashen, S. (1982). Language Two. Oxford University Press, New
York.
Eckert, P., & Rickford, J. R. (2001). Style and Sociolinguistic Variation. Cambridge
University Press.
Ellis, R. (1997). Second Language Acquisition. Oxford: Oxford University Press.
Erker, D. (2012). Of Categories and Continua: Relating Discrete and Gradient Properties
of Sociophonetic Variation. University of Pennsylvania Working Papers in
Linguistics 18: Iss. 2, Article 3.
Fasold, R. (1984). The Sociolinguistics of Society. Oxford: Basil Blackwell.
Flege, J. E. (1988). Factors affecting degree of perceived foreign accent in English
sentences. Journal of the Acoustical Society of America, 84, 70-79.
Flege, J. E., & Fletcher, K. L. (1992). Talker and listener effects on the perception of
degree of foreign accent. Journal of the Acoustical Society of America, 91, 370-
389.
Frawley, D. (2005). The Myth of the Aryan Invasion of India. Online resource
[http://www.hindunet.org/hindu_history/ancient/aryan/aryan_frawley.html]
Fry, D. (1979). The physics of speech. Cambridge: Cambridge University Press.
Gargesh, R. (2004). Indian English: Phonology. In E. W. Schneider, K. Burridge, B.
Kortmann and R. Mesthrie (Eds.), A Handbook of Varieties of English (pp. 992-
1002). Berlin: Mouton de Gruyter.
Golcher, F., & Reznicek, M. (2011). Stylometry and the interplay of topic and L1 in the
different annotation layers in the FALKO corpus. In Amri Zeldes & Ande
Ludeling (Eds.), QITL-4 – Proceedings of Quantitative Investigations in
Theoretical Linguistics 4 (pp. 29-34). Berlin: Humboldt-Universitat zu Berlin.
Gordon, M. J. (2004). Investigating chain shifts and mergers. In Chambers J. K., Trudgill
P., and Shilling-Estes N. (Eds.), The Handbook of Language Variation and
Change (pp. 244-266). Blackwell, Oxford.
Grabe, E., & Low, E. L. (2002). Durational variability in speech and the rhythm class
hypothesis. In Carlos Gussenhoven and Natasha Warner (Eds.), Laboratory
Phonology, 7 (pp. 515-546). Berlin: Mouton de Gruyter.

138
Guiora, A. Z., Beit-Hallahmi, B., & Brannon, R. (1972). The effects of experimentally
induced changes in ego status on pronunciation ability in a second language: an
explanatory study. Comprehensive Psychiatry, 13. 421-428.
Hirst, D., & Di Cristo, A. (1998). Intonation systems: a survey of twenty languages.
Cambridge: Cambridge University Press.
Hoffmann, S., Hundt, M., & Mukherjee, J. (2011). Indian English An Emerging
Epicentre? A Pilot Study on Light Verbs in Web-derived Corpora of South Asian
Englishes. Anglia-Zeitschrift fr englische Philologie, 129(3-4), 258-280.
Hohenthal, A. (2003). English in India – Loyalty and attitudes. Language in India 3.
Online resource [http://www.languageinindia.com/may2003/annika.html]
Huss, V. (1978). English word stress in postnuclear position. Phonetica, 35, 86-105.
Jacewicz E., Fox R. A., O’Neill K., & Salmons J. (2009). Articulation rate across dialect,
age, and gender. Language Variation and Change 21, 233–256
Jenkins, J. (2003). World Englishes: A resource book for students. London: Routledge.
Kachru, B. (1976). Models of English for the Third World: white man’s linguistic burden
or language pragmatics? TESOL Quarterly, 10(2), 221-239.
Kachru, B. (1983). The Indianization of English. The English Language in India. Oxford:
OUP.
Kachru, B. (1986). The Alchemy of English. The Spread, Functions and Models of Non-
Native Englishes. Oxford: Pergamon Press Ltd.
Kachru, B. (1994). English in South Asia. In Robert Burchfield (Ed.). The Cambridge
History of the English Language: English in Britain and Overseas: Origins and
Development V (pp. 497-626). Cambridge: Cambridge University Press.
Kandiah, T. (1991). Variation in society - the background and its impact. In J. Cheshire
(Ed.), English Around the World: Sociolinguistic Perspectives. New York:
Cambridge University Press, 271-287.
Kendall, T. (2009). Speech Rate, Pause, and Linguistic Variation: An Examination
Through the Sociolinguistic Archive and Analysis Project. Ph.D Dissertation,
Duke University (electronic publication:
http://ncslaap.lib.ncsu.edu/kendall/kendall-dissertation-final.pdf

139
Kiesling, S. F. (2009). Style as Stance: Stance as the explanation for patterns of
sociolinguistic variation. In Alexandra Jaffe (Ed.), Stance: Sociolinguistic
perspectives. 171-194.
Kolárik, A. (2010). Pronunciation of Irish English: Materials for Seminar in English
Phonetics. Online resource [http://theses.cz/id/9rui8g/BC_Kolarik.pdf]
Krauss, R. M., & Pardo, J. S. (2006). Speaker Perception and Social Behavior: Bridging
Social Psychology and Speech Science. Online resource
[http://www.columbia.edu/~rmk7/PDF/Bridges.pdf ]
Krishnamurti, B. (1972). Telugu Verbal Bases. Motilal Banarsidass Publication.
Labov, W. (1972). Sociolinguistic Patterns. Philadelphia: University of Pennsylvania
Press.
Labov, W., Ash, S., & Boberg, C. (2006). The Atlas of North American English. New
York: Mouton de Gruyter.
Ladefoged, P., & Bhaskararao, P. (1983). Non-quantal aspects of consonant production:
A study of retroflex consonants. Journal of Phonetics, 11. 291-302.
Laporte, S. (2012). Mind the Gap! Bridge between World Englishes and Learner
Englishes in the making. English Text Construction, 5 (2). 265-292.
Leinonen, T. (2010). An acoustic analysis of vowel pronunciation in Swedish dialects.
Groningen Dissertations in Linguistics, Vol 83. Groningen.
Leitner, G. (1994). Begin and Start in British, American and India English. Journal of
Linguistics, 13, 99-122.
Lewis, M. Paul, G. F., Simons, and Charles D. Fennig (Eds.). (2014). Ethnologue:
Languages of the World, Seventeenth edition. Dallas, Texas: SIL International.
Online version: http://www.ethnologue.com.
Liu, G., Lei, Y., & Hansen, J, H. L. (2010). Dialect identification: impact of differences
between read versus spontaneous speech. 18th
European Signal Processing
Conference. Aalborg, Denmark, August 23-27, 2003-06.
Long, M. H. (1990). Maturational constraints on language development. Studies in
Second Language Acquisition, 12, 251-285.
Lott, D. (1983). Analysing and counteracting interference errors. ELT Journal, 37(3),
256- 261
140
Maddieson, I. (1984). Patterns of Sounds. New York: Cambridge University Press.
Mahapatra, B.P. (1990). A demographic appraisal of multilingualism in India. In
Pattanayak (Ed.). Multilingualism in India (pp. 1-14). Clevedon, UK: Multilingual
Matters.
McArthur, T. (1998). The English Languages. Cambridge: Cambridge University Press.
McCrum, R., Cran, W., MacNeil, R. (1988). The Story of English. London: Faber& Faber
Ltd. & BBC Books.
Maxwell, O., & Fletcher, J. (2009). Acoustic and durational properties of Indian English
vowels. World Englishes, 28, 52-70.
Maxwell, O., & Fletcher, J. (2010). The acoustic characteristics of diphthongs in Indian
English. World Englishes, 29, 27-44.
Mehrotra, R. C. (1965). Stress in Hindi. Indian Linguistics, 26, 96-105.
Meyerhoff, M. (2006). Introducing Sociolinguistics. London & New York: Routledge.
Misra, D., Yadav, R., Punyayodhin, S., & Narang, V. (2010). Durational Contrast and
Centralization of Vowels in Hindi and Thai. International Conference on Asian
Language Processing (IALP), Harbin, China, December 28-30, 339-342.
Mohanty, A. K. (2006). Multilingualism of the unequals and predicaments of education
in India: Mother tongue or other tongue? In Ofelia Garcia, Tove Skutnabb-
Kangas, and Maria E. Torres-Guzman (Eds.). Imagining multilingual schools (pp.
262-283). Clevedon, UK: Multilingual Matters.
Murty, L., Otake, T., & Cutler, A. (2007). Perceptual Tests of Rhythmic Similarity: I.
Mora Rhythm. Language and Speech. 50 (1), 77-99.
Nam, C, F. H., Mukherjee, S., Schilk, M., & Mukherjee, J. (2013). Statistical analysis of
varieties of English. Journal of the Royal Statistical Society – Series A: Statistics
in Society, 176 (3), 777-793.
Nihalani, P., Tongue, R. K., & Hosali, P. (2004). Indian and British English: A handbook
of Usage and Pronunciation. Delhi: Oxford University Press.
Nooteboom, S. (1999). The prosody of speech: Melody and rhythm. In William
Hardcastle and John Laver (Eds.). Handbook of phonetic sciences (pp.640-673).
Oxford: Blackwell.
Odlin, T. (1989). Language Transfer. Cambridge, UK: Cambridge University Press.

141
Ohala, M. (1999). Hindi. In Handbook of the International Phonetic Association (pp.
100-103). Cambridge: Cambridge University Press.
O’Neill, C. G. (2008). Dialect Variation in Speaking Rate. Honors Thesis, Ohio State
University. (electronic publication:
https://kb.osu.edu/dspace/bitstream/handle/1811/32122/Thesis_Dialect_Variation
_in_Speaking_Rate.pdf?sequence=1)
Oyama, S. C. (1976). A Sensitive Period for the Acquisition of a Phonological System.
Journal of Psycholinguistic Research, 5, 261-283.
Pandey, P. (1981). On a description of the phonology of Indian English. CIEFL Bulletin
XVII (1), 11-19.
Pandit, P. B. (1978). Language and identity: the Panjabi language in Delhi. In Braj B.
Kachru and S. N. Sridhar (Eds.), Aspects of sociolinguistics in South Asia: special
issue of International Journal of the Sociology of Language, 16, 93-108.
Pattanayak, D.P. (Ed.). (1990). Multilingualism in India . Clevedon, UK: Multilingual
Matters.
Platt, J., Weber, H., & Ho, M.L. (1984). The New Englishes. London: Routledge &
Kegan Paul.
Pickering, L., & Wiltshire, C. (2000). Pitch accent in Indian-English teaching discourse.
World Englishes, 19, 173-83.
Pinjali, S. (2009). Indian English. Edinburgh: Edinburgh University Press.
Prator, C. (1968). The British Heresy in TESL. In J. Fishmann, Charles Ferguson and
Jyotindra Das Gupta (Eds.). Language Problem in Developing Nations. New
York: Wiley.
Quirk, R. (1972). The English Language and Images of Matter. London: Oxford
University Press.
Ramus, F., Nespor, M., & Mehler, J. (1999). Correlates of linguistic rhythm in the speech
signal. Cognition, 73, 265-292.
Rashdie, S. (2003). Step Across This Line: Collected Nonfiction 1992-2002. Random
House: Knopf Canada
Recasens, D. (2011). Velar and dental stop consonant softening in
Romance. Diachronica, 28, 186–224

142
Sahgal, A. (1991). Patterns of language use in a bilingual setting in India. In J. Cheshire
(ed.), English Around the World: Sociolinguistic Perspectives (pp. 299-307). New
York: Cambridge University Press.
Sahgal, A. & Agnihotri, R. K. (1988). Indian English Phonology: a Sociolinguistic
Perspectvie. English World-Wide, 9 (1), 51-64.
Schieffelin, B. B., & Ochs, E. (1986). Language Socialization. Annual Review of
Anthropology, 15, 163-191.
Schilling-Estes, N. (2002). Investigating stylistic variation. In J.K. Chambers, Peter
Trudgill, and Natalie Schilling-Estes (Eds.), The Handbook of Language
Variation and Change (pp. 375-401). Malden/Oxford: Blackwell.
Schneider, E.W. (2003). Postcolonial English: Varieties around the world. Cambridge:
Cambridge University Press.
Schumann, J. (1986). Research on acculturation model for L2 acquisition. Journal of
Multilingual and Multicultural Development, 7, 379-397
Selinker, L. (1971). The psychologically relevant data of second language learning. In P.
Pimsleur and T. Quinn (Eds.), The Psychology of Second Language Learning.
Cambridge University Press, London
Senghas, A., Sotaro, K., & Ozyurek, A. (2004). Children creating core properties of
language: Evidence from an emerging sign language in Nicaragua. Science, 305,
1779-1782.
Senghas, R. J., Senghas, A., & Pyers, J. E. (2005). The emergence of Nicaraguan Sign
Language: Questions of development, acquisition, and evolution. In Sue T.
Parker, Jonas Langer, and Constance Milbrath (Eds.), Biology and knowledge
revisisted: From Neurogenesis to psychogenesis (pp. 287-306). Mahwah, N.J.:
Erlbaum.
Sharma, D., & Sankaran, L. (2009). Retroflexion in first and second generation Punjabi
London English. Online resource
[http://www.ncl.ac.uk/linguistics/assets/documents/Sharma.pdf]
Singh, K. (1977). Kushwant Singh’s India Without Humbug. Bombay: India Book House.
Spolsky, R. (1978). Educational Linguistics: an Introduction. Rowley, Mass: Newbury
House.

143
Sridhar, K. K. (1989). English in a South Indian urban context. In Braj B. Kachru (Ed.).
The Other Tongue: English Across Cultures (pp. 141-153). Urbana: University of
Illinois Press.
Srinivas, Ch. (1992). Word stress in Telugu and English: a study in contrast. MPhil
Thesis, CIEFL: Hyderabad.
Srivastava, A. K. (1990). Multilingualism and School Education in India: Special
Features, Problems and Prospects. In Pattanayak (Ed.). Multilingualism in India
(pp. 37-53). Clevedon, UK: Multilingual Matters.
Tahta, S., Wood, M., & Lowenthal, K. (1981). Foreign Accents: Factors Relating to
Transfer of Accent from the first Language to a Second Language. Language and
Speech, 24, 265-272.
Tajfel, H. (Ed.) (1978). Differentiation Between Social Groups: Studies in the Social
Psychology of Intergroup Relations. London: Academic Press.
Tang, R. (1999). The place of “culture” in the foreign language classroom: A reflection.
The Internet TESL Journal, 5 (8). Online resource: http://iteslj.org/Articles/Tang-
Culture.html
Tarone, E. (1983). On the variability of the interlanguage system. Applied Linguistics, 4,
143-63.
Thomas, E. R., & Kendall, T. (2007). NORM: The vowel normalization and plotting
suite. [ Online Resource: http://ncslaap.lib.ncsu.edu/tools/norm/ ]
Thompson, I. (1991). Foreign accents revisited: The English pronunciation of Russian
immigrants. Language Learning, 41, 177-204.
Trudgill, P. (1974). The Social Differentiation of English in Norwich. Cambridge:
Cambridge University Press.
Trudgill, P., & Hannah, J. (1994). International English: A Guide to Varieties of
Standard English. London: Edward Arnold.
Thundy, Z. (1976). The origins of Indian English. CIEFL Bulletin (Hyderabad), 12, 29-
40.
Tully, Mark. 1997. "English: an advantage to India?" In ELT Journal, 51 (2), 157-164.
Underwood, G. N. (1988). Accent and identity. In A. R. Thomas (Ed.), Methods in
Dialectology: 6th International Conference: Selected Papers, 406–427

144
VanPatten, B. (1990). Attending to form and content in the input. Studies in Second
Language Acquisition, 12, 287-301.
Verma, S. K. (1980). Swadeshi English: Form and functions. Indian English, 41, 73-84.
Verhoeven, J., De Pauw, G., & Kloots, H. (2004). Speech Rate in a Pluricentric
Language: A Comparison Between Dutch in Belgium and the Netherlands.
Language and Speech, 47, 297-308.
Vijayakrishnan, K.G. (1978). Stress in Tamilian English: a study within the framework of
generative phonology. MPhil Thesis. CIEFL: Hyderabad.
Wamalwa, E. W., & Oluoch, B. J. (2013). Language Endangerment and Language
Maintenance: Can Endangered Indigenous Languages of Kenya Be Electronically
Preserved? International Journal of Humanities and Social Science, 3 (7), 258-
266.
Wells, J. C. (1982). Accents of English. Cambridge: Cambridge University Press.
White, L., & Mattys, S. L. (2007). Calibrating rhythm: First language and second
language studies. Journal of Phonetics, 35, 501-522
Wiltshire, C., & Moon, R. (2003). Phonetic stress in Indian English vs. American
English. World Englishes, 22, 291-303.
Wiltshire, C. R. (2005). The ‘Indian English’ of Tibeto-Burman language speakers.
English World-Wide, 26, 275-300.
Wiltshire, C. R., & Harnsberger, J. D. (2006). The influence of Gujarati and Tamil L1s
on Indian English: a preliminary study. World Englishes, 25, 91-104.
Wolfram, W. (1969). A sociolinguistic description of Detroit Negro speech. Washington,
DC: Center for Applied Linguistics.