Embed Size (px)
Citation preview
REPUBLIC OF BOLIVIAMinistry of Sustanaible
Development and Planning_______________________Vice-Ministry of Environment,
Natural Resources and Forestry Development
FIRST NATIONAL COMMUNICATIONTO THE UNFCCC
YEAR 2000
INSTITUTIONAL CREDITS
Inter-institutional Council of Climate Change
Neisa Roca (Vice – Minister of Environment, Natural Resources and Forestry)Marianela Curi y Verónica López (LIDEMA)Cecilia Suaznabar (Camera of Hydrocarbons)Ramiro Guillén (Ministry of Agriculture)Erwin Ortiz (Ministry of International Relations)Jairo Escobar (United Nations Program for Development)Ivan Rodríguez (Vice-Minister of Public Inversion and External Finances)Andrés Trepp (Bolivian Academia of Sciences)Rodolfo Barriga (Vice- Ministry of Energy)
EDITORSIng. José Luis Carvajal PalmaMinister of Sustainable Development and Planning
Neisa Roca HurtadoVice – Minister of Environment, Natural Resources and Forestry
Oscar Paz RadaGeneral Coordinator of the National Program of Climate Change
NATIONAL PROGRAM OF CLIMATE CHANGE
Oscar Paz Rada (Coordinator)Javier Hanna Figueroa (Consultant)Freddy Tejada Miranda (Consultant)David Cruz Choque (Consultant)Javier Gonzales Iwanciw (Consultant)Sergio Paz-Soldán Martinic (Consultant – Administration)Jessica Miranda (Secretary)Gerardo Pablo Saca (support)
INTRODUCTION
The Bolivian National Communication provides a general vision of the actions andpolicies that Bolivia is carrying out in relation to climate change. These actions areexecuted under the United Nations Framework Convention on Climate Change (UNFCCC)and specifically under the articles 4 (first paragraph) and 12.1 of this convention, thatmakes reference to the commitments of the developing countries.
Bolivia signed the UNFCCC in the Earth Summit (United Nations Conference on theEnvironment and the Development) held in Río de Janeiro in 1992 and ratified it by LawN°1576 on July 25 1994, under ordinance approved by the National Congress and theExecutive Power. Later on, in November 1994, the Secretary of the Convention receivedthis ratification.
In 1993, reforms in the Executive Power were set down and in 1997 these reforms werereinforced, giving execution to one of the most important postulates of the Summit ofRío, which proposed a commitment to sustainable development in all the countries ofthe world, according to Agenda 21. In this sense, Bolivia accomplished this precept,creating a governmental body committed to planning development in terms of fightingagainst poverty (through the generation of employment and economic activity inharmony with natural resources and environmental protection).
In this context, the Ministry of Sustainable Development and Planning and the ViceMinistry of Environment, Natural Resources and Forest Development have been createdwith the objectives of reinforcing national environmental administration andconsolidating patterns of sustainable development. In addition, The National Program ofClimate Change (NPCC) was created in 1995 as a branch of the Vice Ministry ofEnvironment, Natural Resources and Forest Development.
With the support of the US Country Studies Program, the NPCC initiated actions in orderto fulfill the contracted obligations of the UNFCCC and to develop the first investigationsrelating to a National Inventory of greenhouse gas emissions of anthropogenic origin(GHG); the analysis of vulnerability and adaptation of forest, agriculture, livestock andwater resources to possible climate change and the analysis of mitigation options forgreenhouse gas emissions in the energy and not-energy sectors.
In 1996 the PNCC worked on the possibility of developing a National Plan of Action onclimate change with cooperation of the U.S. Environmental Protection Agency, throughthe US Country Studies Program and the National Strategy of Implementation of theUNFCCC, with the support of the of United Nations Program for Development, inside theCC:TRAIN project.
In 1997, the new government restructured the executive power and prioritized activitiessuch as the protection of natural resources and forestry development, supporting theenvironmental administration and the execution of international agreements.
The new governmental structure has also promoted the cooperation of the governmentof Holland through the Netherlands Climate Change Studies Assistance Programcommissioned by the Netherlands Development Assistance (NEDA). This support isadministered by the Institute of Environmental Sciences of the University of Amsterdam,and consists of the development of complementary studies; national inventories; use ofnew IPCC methodologies; studies of impact on agriculture, forest and water resourcesto possible climate change, and mitigation studies in the forest and energy sector inorder to consolidate the National Communication. The main objective is to develop theFirst National Bolivian Communication on the Convention of Climate Change with thesupport of the Global Environmental Facility (GEF) through the Program of EnablingActivities.
Like other developing countries, Bolivia has specific fundamental priorities: to eliminatepoverty, to generate employment, to stimulate economic development and to improvehealth conditions for its inhabitants. Climate change is therefore not a priority, althoughthe characteristics of the country make it considerably vulnerable to this issue.
Its points of vulnerability are mostly related to the large extensions of arid and semi-aridareas, regions exposed to forest deterioration and areas exposed to natural disasterslike flooding or desertification. Bolivia is, in addition, a country without a coast and withan extensive and fragile ecosystem that suffers the consequences of technological andindustrial development.
The National Communication is based on studies carried out by the PNCC and on thework of universities and institutions related to the investigation. The project outlinesthe possibility of incorporating certain measures in the energy and non-energy sectorsallowing a reduction in GHG emissions. However, this would need the economic supportof developed countries inside what the UNFCCC denominates as common butdifferentiated responsibilities.
This national report also outlines a meticulous analysis of the levels of GHG emissionsduring 1994, taking as a comparative methodology the IPCC guidelines for 1996. Theguides for the preparation of initial communications of the parts are included in theAnnex 1 (I Document FCCC/CP/1996/L.12), and it is also part of decision number 10 ofthe Second Conference of Parts (10/CP2). Finally, the report contains an analysis ofnational necessities for the implementation of projects, climate scenarios, vulnerability ofsome ecosystems, mitigation options and measures that could be developed in order totackle climate change.
This National Communication represents another effort of the Bolivian Government inorder to cooperate with the implementation of the Climate Change Convention. It isnecessary to mention that these efforts were made in spite of very limited human andeconomic resources, and restricted scientific and technological means.
This was made to show the international community that Bolivia meets its commitmentsand it is appropriate that Annex I countries set an example in meeting with theirpromises under the UNFCCC and reduce their GHG emissions.
Additionally, Bolivia ratified the Kyoto Protocol through its Law No. 1988, dated July 22,1999, as a demonstration of its willingness to face negative climate change impact.Later on, in November 1999, the Secretary of the Climate Change Convention receivedthis ratification.
NATIONAL COMMUNICATION
EXECUTIVE SUMMARY
1. INTRODUCTION
Bolivia signed the United NationsFramework Convention on ClimateChange (UNFCCC) during the EarthSummit (UN Conference on Environmentand Development) held in Rio de Janeiroin 1992, and ratified it by Law No.1576,dated July 25, 1994 approved by theBolivian Congress and the ExecutiveGovernment. The UNFCCC Secretariatacknowledged and concurred theBolivian ratification in November 1994.
Bolivia, as a highly vulnerable country,also ratified the Kyoto Protocol throughits Law No. 1988, dated July 22, 1999,as a demonstration of its willingness toface negative climate change impact.
The National Climate Change Program(NCCP); that depends on the Vice-Ministry of Environment, NaturalResources, and Forestry Development;was established in 1995 to initiateactions aimed at meeting Boliviancommitments under the UNFCCC, anddeveloping the first research activities toaddress climate change issues.
In 1996, the NCCP developed a BolivianNational Action Plan on Climate Change;prepared the Greenhouse Gas (GHG)Emission Inventory applying the 1996revised Intergovernmental Panel onClimate Change (IPCC) Guidelines; andinitiated the National ImplementationStrategy (NIS) of the UNFCCC.
The Bolivian National Communication,as submitted herewith, contains adetailed analysis of the 1994 GHGemission levels in Bolivia according to
the 1996 IPCC Guidelines, following theInitial Communications Guidelines forthe Non-Annex I Parties(FCCC/CP/1996/L.12) and the 10thDecision, adopted by the Conference ofthe Parties (10/CP2).
This Communication includes theanalysis of climate scenarios,assessment of some ecosystemvulnerability, mitigation options,adaptation measures that could beadopted to address climate changeimpact and the analysis of nationalresources to implement projects.
This National Communication representsanother of the government’s efforts tocomply with its commitments, and itsdisposition to cooperate with theimplementation of the Climate ChangeConvention.
These efforts were made in spite ofvery limited human and economicresources, and restricted scientific, andtechnological means, to show to theinternational community that Boliviameets its commitments. In this sense, itwould be appropriate that Annex Icountries set also an example inmeeting with their commitments underthe UNFCCC, and reduce their GHGemissions.
It is here acknowledged the valuablesupport and cooperation received incarrying out national studies on climatechange from the GEF; UNITAR – UNDP;the Netherlands Government, throughthe Netherlands Climate Change Studies
Assistance Program, the NetherlandsDevelopment Assistance (NEDA) and theInstitute for Environmental Studies ofthe Free University of Amsterdam andthe U.S. Country Studies Program.
2. NATIONALCIRCUMSTANCES
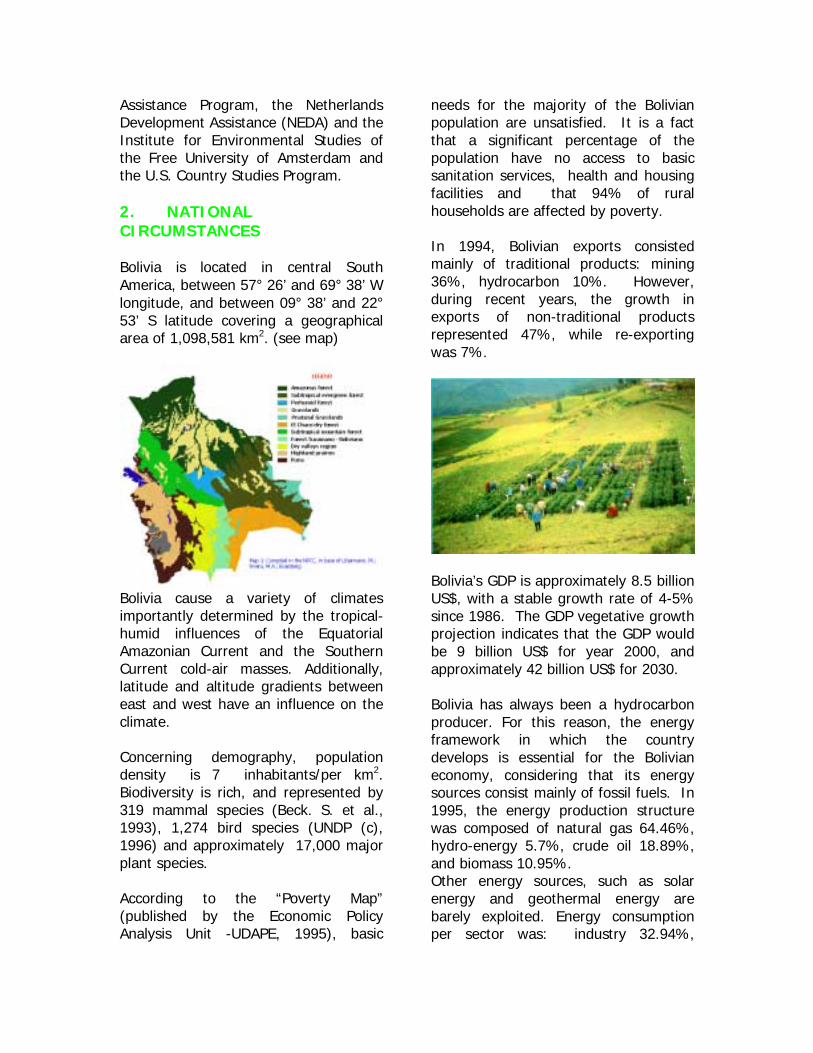
Bolivia is located in central SouthAmerica, between 57° 26’ and 69° 38’ Wlongitude, and between 09° 38’ and 22°53’ S latitude covering a geographicalarea of 1,098,581 km2. (see map)
Bolivia cause a variety of climatesimportantly determined by the tropical-humid influences of the EquatorialAmazonian Current and the SouthernCurrent cold-air masses. Additionally,latitude and altitude gradients betweeneast and west have an influence on theclimate.
Concerning demography, populationdensity is 7 inhabitants/per km2.Biodiversity is rich, and represented by319 mammal species (Beck. S. et al.,1993), 1,274 bird species (UNDP (c),1996) and approximately 17,000 majorplant species.
According to the “Poverty Map”(published by the Economic PolicyAnalysis Unit -UDAPE, 1995), basic
needs for the majority of the Bolivianpopulation are unsatisfied. It is a factthat a significant percentage of thepopulation have no access to basicsanitation services, health and housingfacilities and that 94% of ruralhouseholds are affected by poverty.
In 1994, Bolivian exports consistedmainly of traditional products: mining36%, hydrocarbon 10%. However,during recent years, the growth inexports of non-traditional productsrepresented 47%, while re-exportingwas 7%.
Bolivia’s GDP is approximately 8.5 billionUS$, with a stable growth rate of 4-5%since 1986. The GDP vegetative growthprojection indicates that the GDP wouldbe 9 billion US$ for year 2000, andapproximately 42 billion US$ for 2030.
Bolivia has always been a hydrocarbonproducer. For this reason, the energyframework in which the countrydevelops is essential for the Bolivianeconomy, considering that its energysources consist mainly of fossil fuels. In1995, the energy production structurewas composed of natural gas 64.46%,hydro-energy 5.7%, crude oil 18.89%,and biomass 10.95%.Other energy sources, such as solarenergy and geothermal energy arebarely exploited. Energy consumptionper sector was: industry 32.94%,
transport 32.41%, residential 27.41%,commercial 7.03%, and agriculture0.21%.
Bolivia has 18 managed naturalprotected areas (within the NationalProtected Areas System, under theIUCN: I and V categories) comprising13.71% of the national total area.
Within this Protected Areas System,435,000 ha of land are considered asbiosphere reserves, 15 million ha weredeclared as protected areas, 15 millionha were declared as reserve lands andimmobilization reserves set aside forprotection under the Agrarian ReformLaw (INRA Law, 1997) and 53.45 millionha of land are covered by forests,representing 48.7% of the national totalarea. Most of these areas are in thenorthern and eastern plains of Bolivia.
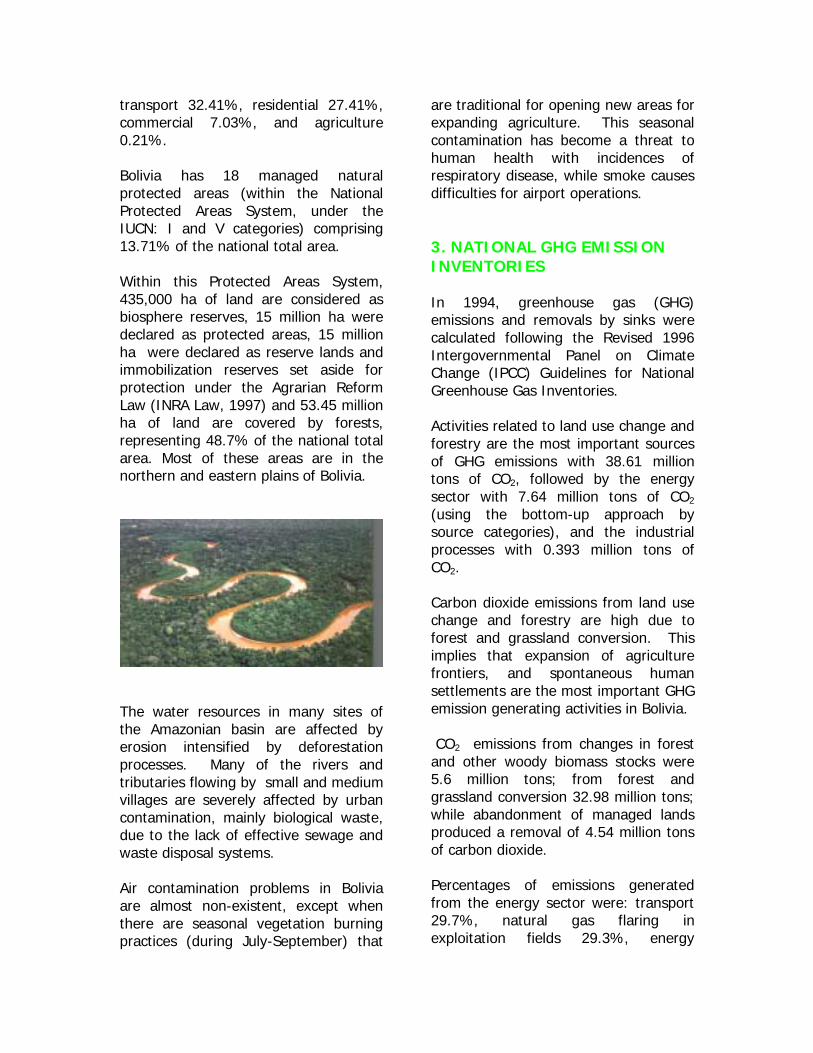
The water resources in many sites ofthe Amazonian basin are affected byerosion intensified by deforestationprocesses. Many of the rivers andtributaries flowing by small and mediumvillages are severely affected by urbancontamination, mainly biological waste,due to the lack of effective sewage andwaste disposal systems.
Air contamination problems in Boliviaare almost non-existent, except whenthere are seasonal vegetation burningpractices (during July-September) that
are traditional for opening new areas forexpanding agriculture. This seasonalcontamination has become a threat tohuman health with incidences ofrespiratory disease, while smoke causesdifficulties for airport operations.
3. NATIONAL GHG EMISSIONINVENTORIES
In 1994, greenhouse gas (GHG)emissions and removals by sinks werecalculated following the Revised 1996Intergovernmental Panel on ClimateChange (IPCC) Guidelines for NationalGreenhouse Gas Inventories.
Activities related to land use change andforestry are the most important sourcesof GHG emissions with 38.61 milliontons of CO2, followed by the energysector with 7.64 million tons of CO2
(using the bottom-up approach bysource categories), and the industrialprocesses with 0.393 million tons ofCO2.
Carbon dioxide emissions from land usechange and forestry are high due toforest and grassland conversion. Thisimplies that expansion of agriculturefrontiers, and spontaneous humansettlements are the most important GHGemission generating activities in Bolivia.
CO2 emissions from changes in forestand other woody biomass stocks were5.6 million tons; from forest andgrassland conversion 32.98 million tons;while abandonment of managed landsproduced a removal of 4.54 million tonsof carbon dioxide.
Percentages of emissions generatedfrom the energy sector were: transport29.7%, natural gas flaring inexploitation fields 29.3%, energy
industries 18%, manufacturingindustries and construction 10.7%, andresidential consumption of energy 9.1%.
Methane (CH4) emissions were 0.653million tons. This total comprises:energy sector 0.089 million tons,agriculture 0.485 million tons and landuse change 0.054 million tons.Other GHG emission totals were:nitrous oxide (N2O) 0.0025 million tons,
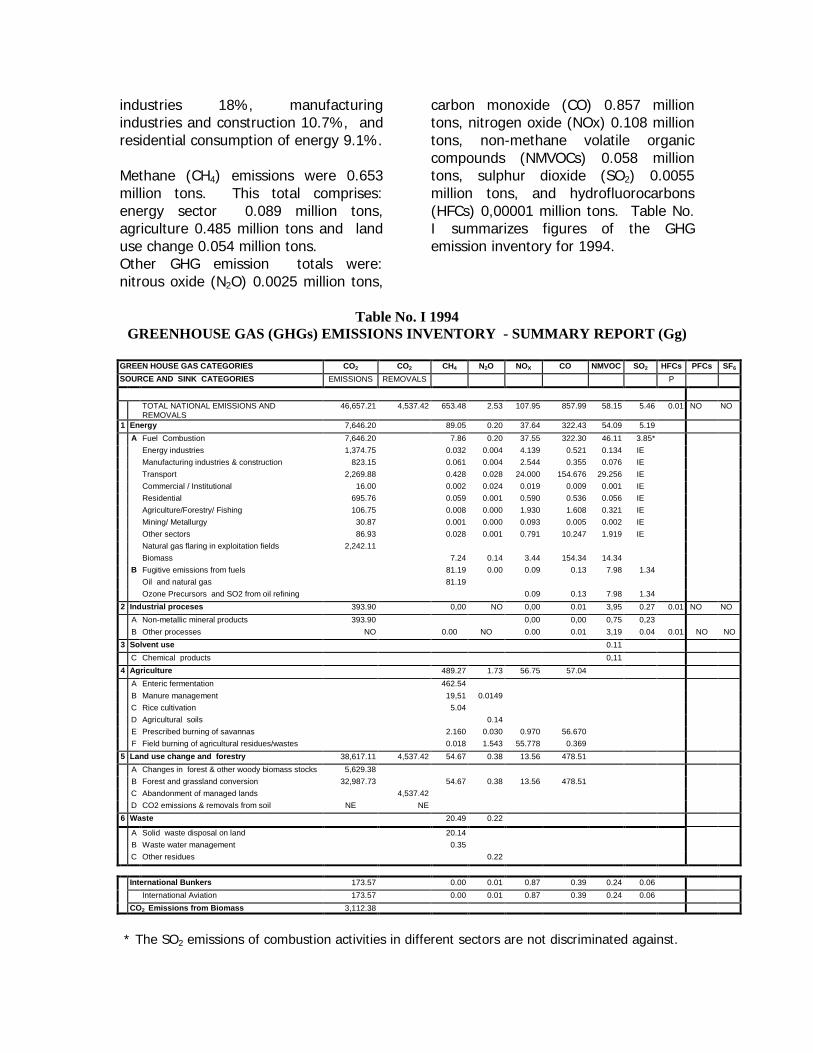
carbon monoxide (CO) 0.857 milliontons, nitrogen oxide (NOx) 0.108 milliontons, non-methane volatile organiccompounds (NMVOCs) 0.058 milliontons, sulphur dioxide (SO2) 0.0055million tons, and hydrofluorocarbons(HFCs) 0,00001 million tons. Table No.I summarizes figures of the GHGemission inventory for 1994.
Table No. I 1994GREENHOUSE GAS (GHGs) EMISSIONS INVENTORY - SUMMARY REPORT (Gg)
GREEN HOUSE GAS CATEGORIES CO2 CO2 CH4 N2O NOX CO NMVOC SO2 HFCs PFCs SF6
SOURCE AND SINK CATEGORIES EMISSIONS REMOVALS P
TOTAL NATIONAL EMISSIONS ANDREMOVALS
46,657.21 4,537.42 653.48 2.53 107.95 857.99 58.15 5.46 0.01 NO NO
1 Energy 7,646.20 89.05 0.20 37.64 322.43 54.09 5.19A Fuel Combustion 7,646.20 7.86 0.20 37.55 322.30 46.11 3.85*
Energy industries 1,374.75 0.032 0.004 4.139 0.521 0.134 IEManufacturing industries & construction 823.15 0.061 0.004 2.544 0.355 0.076 IETransport 2,269.88 0.428 0.028 24.000 154.676 29.256 IECommercial / Institutional 16.00 0.002 0.024 0.019 0.009 0.001 IEResidential 695.76 0.059 0.001 0.590 0.536 0.056 IEAgriculture/Forestry/ Fishing 106.75 0.008 0.000 1.930 1.608 0.321 IEMining/ Metallurgy 30.87 0.001 0.000 0.093 0.005 0.002 IEOther sectors 86.93 0.028 0.001 0.791 10.247 1.919 IENatural gas flaring in exploitation fields 2,242.11Biomass 7.24 0.14 3.44 154.34 14.34
B Fugitive emissions from fuels 81.19 0.00 0.09 0.13 7.98 1.34Oil and natural gas 81.19Ozone Precursors and SO2 from oil refining 0.09 0.13 7.98 1.34
2 Industrial proceses 393.90 0,00 NO 0,00 0.01 3,95 0.27 0.01 NO NOA Non-metallic mineral products 393.90 0,00 0,00 0,75 0,23B Other processes NO 0.00 NO 0.00 0.01 3,19 0.04 0.01 NO NO
3 Solvent use 0.11C Chemical products 0,11
4 Agriculture 489.27 1.73 56.75 57.04A Enteric fermentation 462.54B Manure management 19,51 0.0149C Rice cultivation 5.04D Agricultural soils 0.14E Prescribed burning of savannas 2.160 0.030 0.970 56.670F Field burning of agricultural residues/wastes 0.018 1.543 55.778 0.369
5 Land use change and forestry 38,617.11 4,537.42 54.67 0.38 13.56 478.51A Changes in forest & other woody biomass stocks 5,629.38B Forest and grassland conversion 32,987.73 54.67 0.38 13.56 478.51C Abandonment of managed lands 4,537.42D CO2 emissions & removals from soil NE NE
6 Waste 20.49 0.22
A Solid waste disposal on land 20.14B Waste water management 0.35C Other residues 0.22
International Bunkers 173.57 0.00 0.01 0.87 0.39 0.24 0.06International Aviation 173.57 0.00 0.01 0.87 0.39 0.24 0.06
CO2 Emissions from Biomass 3,112.38
* The SO2 emissions of combustion activities in different sectors are not discriminated against.
P = Potential emissions with method tier I.NE = Not EstimatedNO = Not OccurringIE = Estimated, but included elsewhere
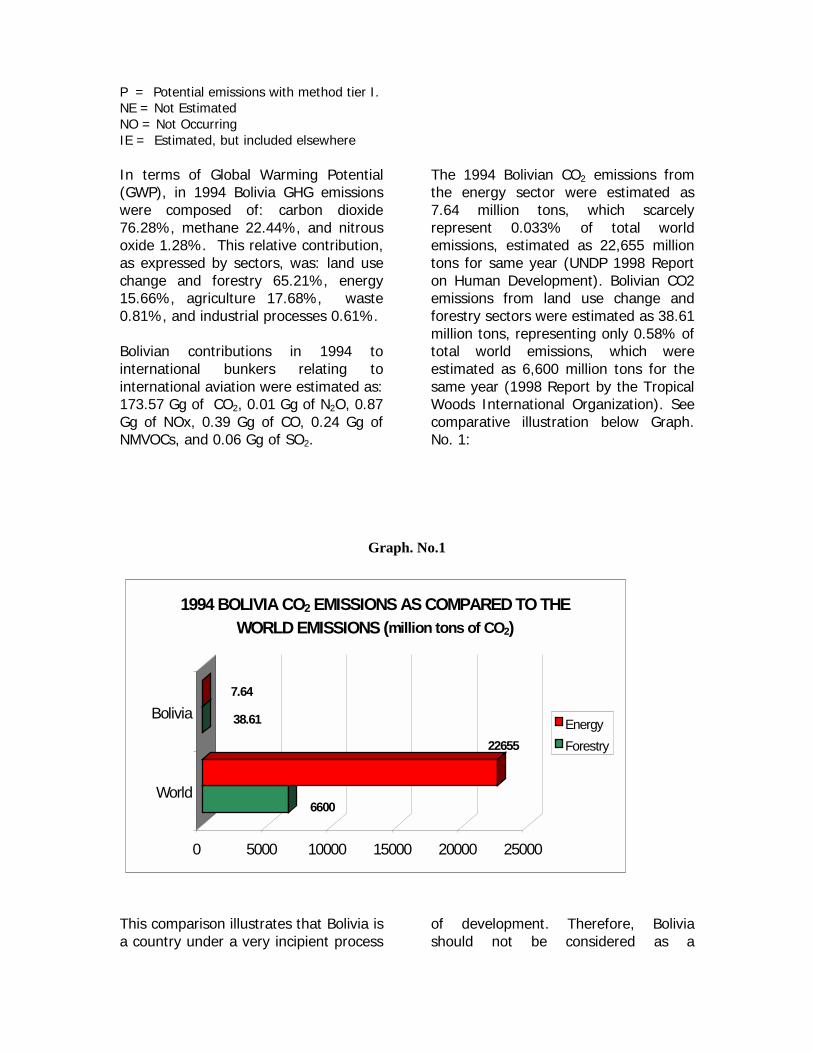
In terms of Global Warming Potential(GWP), in 1994 Bolivia GHG emissionswere composed of: carbon dioxide76.28%, methane 22.44%, and nitrousoxide 1.28%. This relative contribution,as expressed by sectors, was: land usechange and forestry 65.21%, energy15.66%, agriculture 17.68%, waste0.81%, and industrial processes 0.61%.
Bolivian contributions in 1994 tointernational bunkers relating tointernational aviation were estimated as:173.57 Gg of CO2, 0.01 Gg of N2O, 0.87Gg of NOx, 0.39 Gg of CO, 0.24 Gg ofNMVOCs, and 0.06 Gg of SO2.
The 1994 Bolivian CO2 emissions fromthe energy sector were estimated as7.64 million tons, which scarcelyrepresent 0.033% of total worldemissions, estimated as 22,655 milliontons for same year (UNDP 1998 Reporton Human Development). Bolivian CO2emissions from land use change andforestry sectors were estimated as 38.61million tons, representing only 0.58% oftotal world emissions, which wereestimated as 6,600 million tons for thesame year (1998 Report by the TropicalWoods International Organization). Seecomparative illustration below Graph.No. 1:
Graph. No.1
6600
22655
38.61
7.64
0 5000 10000 15000 20000 25000
World
Bolivia
1994 BOLIVIA CO2 EMISSIONS AS COMPARED TO THE WORLD EMISSIONS (million tons of CO2)
EnergyForestry
This comparison illustrates that Bolivia isa country under a very incipient process
of development. Therefore, Boliviashould not be considered as a
“pollutant” country; much less acontributor to the greenhouse effect.
4. VULNERABILITY ANDADAPTATION
Climate Change Scenarios
The analysis done by theNational Meteorology andHydrology Service (SENAMHI,1998) considered three globalclimate change scenarios,developed by the IPCC: theIS92a, considered as a referencescenario for the UNFCCCIntergovernmental NegotiatingCommittee, which estimates amedium range of futureemissions by assuming amoderate intervention leveltowards reducing GHGemissions; the IS92c consideredas an optimistic scenario; andthe IS92e as a pessimisticscenario.
On the basis of these globalscenarios and otherassumptions, climate scenariosdefined for Bolivia on an analysistime horizon until year 2100,show: a) all scenarios indicatethe same temperature increasetrends, b) the temperatureincrease line is almost parallel tothe normal curve and c) in somecases models indicated higher
temperature increases during therainy season.
Concerning precipitation,absolute precipitation increase ishigher during the rainy season(September to February), whileprecipitation variation during thedry-season (May to August) islow in absolute terms.Precipitation trends for thenorth, east, and south-east areasof the country indicate decreasesfor the dry season.
For the three above mentionedscenarios, national scenariosindicate precipitation decreasesfor June and July (winter seasonin Bolivia), which becomescritical as temperature increases.Moreover, these scenariosindicate slight seasonal rainfallextension trends, even untilMay, and a slight extension ofdry season until September andOctober.
Impacts
As reported in studies developedby the National Climate ChangeProgram (MDSMA,1997), climatechanges will cause variedimpacts to ecosystems in Bolivia:i.e. 2° C temperature increaseand 10% precipitation increasemay cause an area increase oftropical moist forest of 65.27%,to the detriment of subtropicalmoist forest areas up to 59.72%.
This scenario shows an increasein subtropical dry forest of3.79% (MDSMA, 1997, 1998).In contrast, the area ofsubtropical moist forest woulddecrease by 81% under a 2°C
temperature increase and a 10%precipitation decrease scenario;while tropical moist forest wouldremain unchanged, and tropicaldry forest area would increaseby more than 300%.
Under the scenario IS92c(optimistic scenario), nationalscenarios show that until year2010 changes would occur incool temperate desert zones,cool temperate thorn steppe,and tropical wet forests; in 2050,no high vulnerable zones areenvisaged.
Under the scenario IS92econditions (pessimistic scenario)national scenarios show that alllife zones would be vulnerable toclimate changes; zones sufferingimpacts would be tropical moistforest, warm temperate dryforest, subtropical rain forest,tropical wet forest, subtropicalthorn woodland, and cool-temperate desert areas. Changeswould oscillate within a range of100%.
It can be assessed that overall,agricultural regions would beaffected by probable climatechange. Some zones would bemore vulnerable than others; forinstance, trends in the inter-Andean valleys indicatedecreases in rainfall andincreases in the minimum andmaximum temperatures, whichwould affect the crops vegetativelife cycle. On the other hand, inhigh plain or “Altiplano” novariation in rainfall precipitationis envisaged, but there would bean evident increase in minimumtemperatures. Similar trends are
forecasted for the tropicaleastern zones of Bolivia, such asSanta Cruz and Trinidad.However, there might be sometrends towards a constantmaximum temperature or a veryslight decrease.
As regards agriculturalecosystems, studies onvulnerability to climate changeindicate that a probable 2° Ctemperature increase would notseriously damage cultivatedareas if this increase goestogether with precipitationincreases.
In the high plains, theseconditions would be favorable forgrowing crops if provided withadaptation measures such asirrigation systems and improvedcultural practices. However, Ifprecipitation decreases occur,even under no temperatureincrease conditions, negativeeffects would be critical, not onlydirectly and immediately foragricultural production, butwould also cause long termnegative consequences, such asirreversible damages to theecosystem.
Studies on vulnerability of waterresources to climate change(NCCP, 1997; San AndresUniversity of La Paz - Hydraulicand Hydrology Institute, 1999),show important variations in the
runoff levels, depending on theconsidered global and nationalclimate scenario (Incrementalscenarios, IS92a, IS92c, andIS92e), and studied basins andtheir location.
This would cause an impact onwater resources by affectingforestry, agriculture andconsumption systems.
Climate change in Bolivia affectshuman health directly andindirectly. The most frequentdirect effects are: floods (SantaCruz), landslides (La Paz), forestfires (Guarayos - Santa Cruz)and storms (Cochabamba), all ofthem increasing populationmortality.
Regarding indirect effects, thehuman health vulnerability studyof malaria and leishmaniasis,showed that malaria is sensitiveto climate variation and changes(IS92a scenario). Trends show avery high increase betweenbaseline period (1960-1990) andcurrent situation (1991-1999).The biggest incidence (growth)has occurred since March 1993for P. Falciparum cases and fromApril 1994 for Plasmodium Vivaxcases.
Regarding leishmaniasis, resultsshow a very high vulnerability toclimate change which would beaccentuated by humidity, andtemperature. Leishmaniasisincidence will increaseparticularly from July toSeptember and the highesteffects will be registered inAugust, according to projectionsmade for 2010.
ADAPTATION
The following adaptationstrategies were identified for theforestry sector by the NationalClimate Change Program(MDSMA,1997):
* Sustainable forestmanagement and use
* Enhancing efficiency ofindustrialization processes
* Identifying forest treespecies that are resistantto climate change
* Reducing habitatfragmentation
Damages by probable climatechange in the agriculture sectormight become critical ifeconomically important basiccrops are negatively affected.The national food security couldrun the risk of being affected.In 1998, and to prevent sucheffects, the following adaptationmeasures were proposed (PNCC,1998):
• Improvement of soil andwater resources management
• Agriculture research• Interactive technology
transfer
Adaptation options for livestockbreeding, and pastures areaddressed to:
• Identify pastures resistant toclimate change
• Introduce improved pastures• Introduce improved livestock
species
• Make changes in thelivestock grazing seasons
• Introduce supplementarydiets for livestock
Adaptation options for waterresources are addressed to:
* Plan and coordinate theuse of water resources bybasin
* Construct works toarrange water regulation,irrigation and storage.
* Adopt water conservationpolicies
* Control quality of water* Implement systems for a
controlled and paid watersupply
* Adopt contingency plans* Construct work for inter-
basin water transfers* Forecast systems for
flood and droughts* Educate and train people
on water resourcemanagement and use.
In the health sector the followingadaptation strategies wereidentified :
- Environmental Care- Sanitary Education- Reservoirs Control - Decreasing vector/human
contact- Epidemic and climate
vigilance- Biological Control- Chemical Control
5. PROJECTIONS, PLANS ANDMEASURES
Energy Sector - MitigationOptions and Costs
GHG emission mitigationmeasures for the energy sectorwould be addressed to enhancethe energy supply and useimproving effectiveness in theenergy consumption, usingenergy sources that are lesscarbon-intensive and increasingthe use of renewable energy. The mitigation measuresidentified for the energy sector,in order to contribute thereduction of GHG emissionlevels, are detailed below: * Efficiency in the
illumination of theresidential sector
* Efficiency in biomass usefor household stoves
* Efficiency in theresidential sectorrefrigeration
* Increase of natural gasuse in the residentialsector
* Increase of solar energyuse for water heatingpurposes
* Rural electrification basedon renewable energysources
* Efficiency of publiccommercial sectorillumination
* Efficiency in commercialuse of biomass
* Conservation of electricenergy in commercialuses
* Conservation of energy inthe industrial sector
* Increase of natural gasuse in road transport
* Reduction of natural gasflaring in exploitationfields
* Redistribution ofexpansion options in theelectric power generationsector
The implementation of the mentionedmeasures necessarily requires financialand technical support internationally. If these mitigation measures areapplied, in a modest scenario, non-biogenic CO2 emissions, as compared tobaseline, could be reduced by: 7.03%for year 2005, 5.81% for 2010, 12.75%for 2020, and 15.07% for 2030. In the same scenario, biogenic CO2
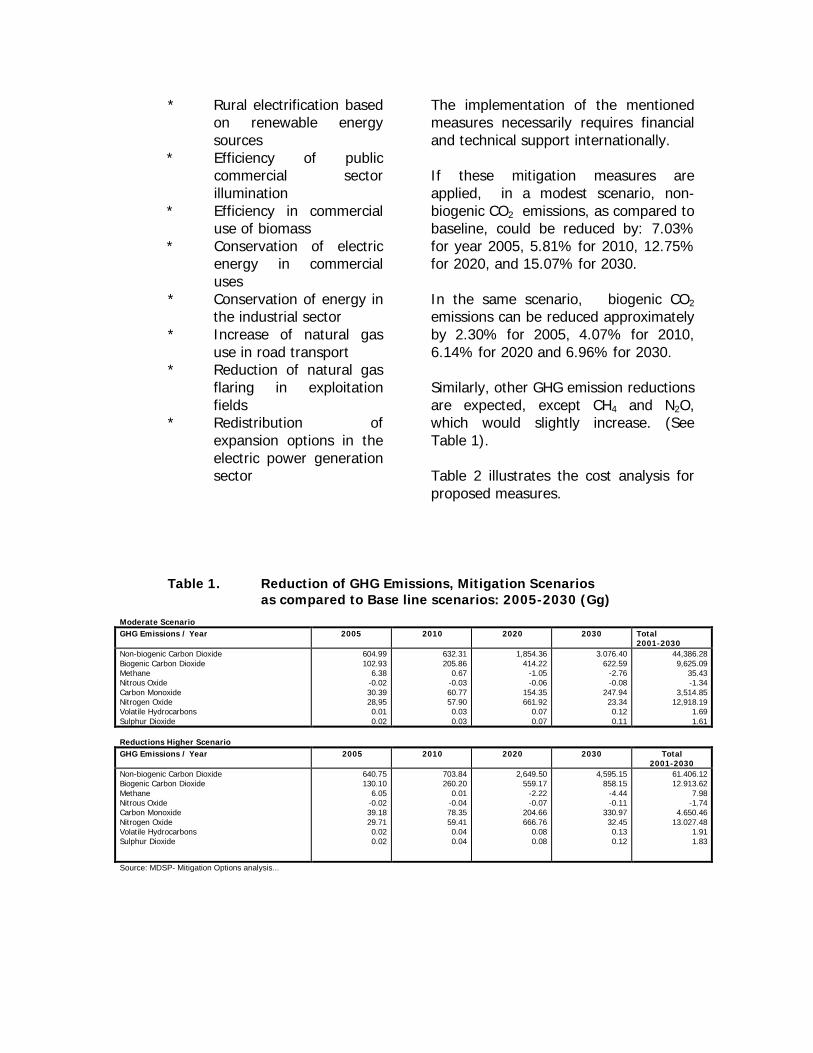
emissions can be reduced approximatelyby 2.30% for 2005, 4.07% for 2010,6.14% for 2020 and 6.96% for 2030. Similarly, other GHG emission reductionsare expected, except CH4 and N2O,which would slightly increase. (SeeTable 1). Table 2 illustrates the cost analysis forproposed measures.
Table 1. Reduction of GHG Emissions, Mitigation Scenarios as compared to Base line scenarios: 2005-2030 (Gg)
Moderate Scenario GHG Emissions / Year 2005 2010 2020 2030 Total
2001-2030 Non-biogenic Carbon Dioxide Biogenic Carbon Dioxide Methane Nitrous Oxide Carbon Monoxide Nitrogen Oxide Volatile Hydrocarbons Sulphur Dioxide
604.99102.93
6.38-0.0230.3928,950.010.02
632.31205.86
0.67-0.0360.7757.900.030.03
1,854.36414.22
-1.05-0.06
154.35661.92
0.070.07
3.076.40 622.59 -2.76 -0.08
247.94 23.34 0.12 0.11
44,386.289,625.09
35.43-1.34
3,514.8512,918.19
1.691.61
Reductions Higher Scenario GHG Emissions / Year 2005 2010 2020 2030 Total
2001-2030 Non-biogenic Carbon Dioxide Biogenic Carbon Dioxide Methane Nitrous Oxide Carbon Monoxide Nitrogen Oxide Volatile Hydrocarbons Sulphur Dioxide
640.75130.10
6.05-0.0239.1829.710.020.02
703.84260.20
0.01-0.0478.3559.410.040.04
2,649.50559.17
-2.22-0.07
204.66666.76
0.080.08
4,595.15 858.15 -4.44 -0.11
330.97 32.45 0.13 0.12
61.406.1212.913.62
7.98-1.74
4.650.4613.027.48
1.911.83
Source: MDSP- Mitigation Options analysis...

Table 2 - Cost Analysis of CO2 Emissions Reduction: Moderate Scenario Mitigation Measure
BalancedEnergySavings Cost, US$1990/G/J
1990 TotalCostmillion US$(1990)
1990 Benefits million US$ (1990)
Net PresentValue, to 2030 million US$
Benefit/ Cost Ratio
Balanced Cost per EmissionReductionUS$1990/ t CO2
BalancedAnnual Cost US$/yr
AverageEmission Reductions 2001-2030 Gg CO2/yr
Efficiency in theillumination of residentialsector
14.101 2.90 1.45 1.45 0.5003 5.09 157,540 42.27
Efficiency in biomass usefor household stoves
0.197 0.45 9.02 -8.57 19.9790 -5.52* -931,520 230.43*
Efficiency in the residential sectorrefrigeration
62.267 51.45 4.81 46.64 0.0935 150.00 5,070,160 4.76
Increase of natural gas usein the residential sector
-
9.00 2.74 6.26 0.3042 20.00 680,600 46.89
Increase of solar energyuse for water heating
-
12.06 1.86 10.20 0.1542 70.00
190.00*
1,108,870 22.33
8.18* Rural electrification basedon renewable energy
- 14.96 6.93 8.03 0.4632 100.00 873,130 12.24
Efficiency in publiccommercial illumination
1.39 0.29 1.35 -1.06 4.6619 -1.00 -115,160 52.01
Efficiency in commercialuse of Biomass
0.259 w. 0.389 d
0.22 3.03 -2.80 23.6199 -6.48* -304,840 64.315*
Conservation of electricenergy in commercial uses
13.238 14.06 6.37 7.69 0.4531 5.17 836,700 220.98
Conservation of energy inthe industrial sector
4.420 ep 0.518 thp
2.80 4.69 -1.89 1.6750 -1.90
-3.18*
-205,420 147.65
87.74* Increase of natural gas usein transport
- 59.28 119.06 -59.78 2.0084 -70.00 -6,480,000 120.34
Reduction of natural gasflaring in exploitation fields
- 0.00 18.34 -18.34 -
-9.48 -1,990,000 286.88
Redistribution ofExpansion Options of theelectric power generationsector
- 19.42 68.38 -48.96 3.5211 -10.00
110.00
-5,320,000 550.60
-67.99*
Notes: * Biogenic CO2 d: dung ep: electric processes thp: thermal processes w : wood
Forestry and Agriculture SectorMitigation Measures and Cost
The proposed mitigationmeasures selected for the non-energy sector are addressed toface a process of environmentaldeterioration, extension ofagriculture frontiers anddeforestation, as shown in thefollowing:
* Development of tree
growing areas * Natural regeneration of
forests * Alternative options to
replace felling andburning practices inagriculture
* Support to implement thenew Forestry Law
* Strengthening capacity ofPlanning
* Protection and monitoringof protected areas
The mitigation measures for theagriculture and livestock sectorsare addressed not to reduce themain GHG emissions (CO2 andCH4) but to improve agricultureand livestock practices. * Prevention and control of
land degradation * implementation of agro-
forestry systems * Natural regeneration of
pastures * Improvement of animal
breeding techniques
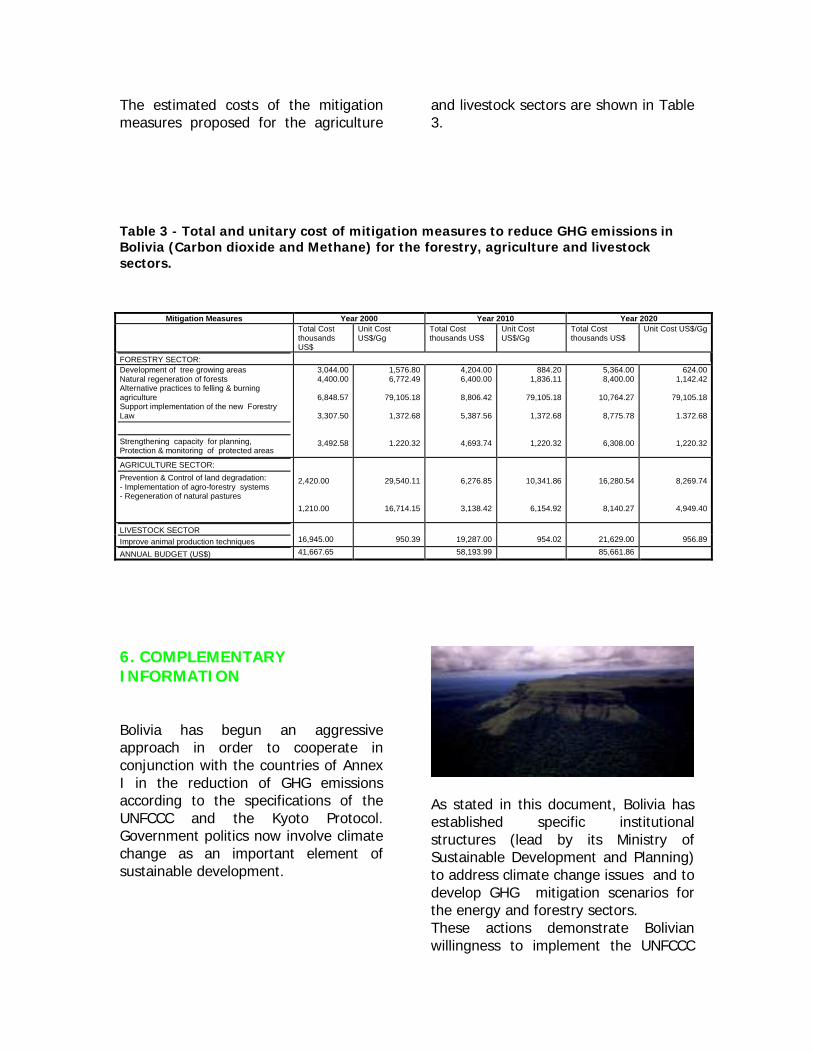
The estimated costs of the mitigationmeasures proposed for the agriculture
and livestock sectors are shown in Table3.
Table 3 - Total and unitary cost of mitigation measures to reduce GHG emissions inBolivia (Carbon dioxide and Methane) for the forestry, agriculture and livestocksectors.
Mitigation Measures Year 2000 Year 2010 Year 2020 Total Cost
thousandsUS$
Unit CostUS$/Gg
Total Costthousands US$
Unit CostUS$/Gg
Total Costthousands US$
Unit Cost US$/Gg
FORESTRY SECTOR: Development of tree growing areas Natural regeneration of forests Alternative practices to felling & burningagriculture Support implementation of the new ForestryLaw Strengthening capacity for planning,Protection & monitoring of protected areas
3,044.00 4,400.00
6,848.57
3,307.50
3,492.58
1,576.806,772.49
79,105.18
1,372.68
1.220.32
4,204.00 6,400.00
8,806.42
5,387.56
4,693.74
884.201,836.11
79,105.18
1,372.68
1,220.32
5,364.00 8,400.00
10,764.27
8,775.78
6,308.00
624.001,142.42
79,105.18
1.372.68
1,220.32
AGRICULTURE SECTOR: Prevention & Control of land degradation:- Implementation of agro-forestry systems- Regeneration of natural pastures
2,420.00 1,210.00
29,540.11
16,714.15
6,276.85
3,138.42
10,341.86
6,154.92
16,280.54
8,140.27
8,269.74
4,949.40
LIVESTOCK SECTOR Improve animal production techniques 16,945.00 950.39 19,287.00 954.02 21,629.00 956.89
ANNUAL BUDGET (US$) 41,667.65 58,193.99 85,661.86
6. COMPLEMENTARYINFORMATION Bolivia has begun an aggressiveapproach in order to cooperate inconjunction with the countries of AnnexI in the reduction of GHG emissionsaccording to the specifications of theUNFCCC and the Kyoto Protocol.Government politics now involve climatechange as an important element ofsustainable development.
As stated in this document, Bolivia hasestablished specific institutionalstructures (lead by its Ministry ofSustainable Development and Planning)to address climate change issues and todevelop GHG mitigation scenarios forthe energy and forestry sectors. These actions demonstrate Bolivianwillingness to implement the UNFCCC
13
suggestions and it is expected that theinternational community willacknowledge accordingly. Based on inter-sectors discussions andachieved consensus on feasible actionsand national priorities, a “NationalAction Plan on Climate Change” wasdeveloped to address climate changeissues and to contribute to reduction ofGHG emissions through internationalfunding. Under the joint implementationpilot phase, some projects weredeveloped in cooperation with UNFCCCAnnex I countries investors. These projects will help to obtain moreexperience on procedures, monitoring,methodologies, certification anddistribution systems regarding certifiedemission reductions. These experienceswill also serve to implement futureprojects. Developed countries have the historicalobligation to support vulnerablecountries like Bolivia to improve climateobservation infrastructure (dataprocessing to measure climate changeimpacts and continued research relatedto GHG emissions) and to strengthennational capacity building for individualsand institutions. Such support should serve to implementadaptation projects in the agriculturesector. NATIONAL STRATEGY The Government of Bolivia is developinga National Implementation Strategy ofthe UNFCCC, which is intended toestablish a shared outlook among allstake-holders involved inimplementation to attain a missionawareness at leading institutional levelsand involved partners.
The Bolivian Strategy on ClimateChange will be based on the followingfour areas, designed to follow action -lines within an economic and socialdevelopment framework: • Promoting clean development in
Bolivia by introducing technologicalchanges in the agriculture, forestry,and industrial sectors, aimed toreduce GHG emissions with apositive impact on development.
• Contributing to carbon managementin forests, wetlands and othermanaged natural ecosystems.
• Increasing effectiveness in energysupply and use to mitigate effects ofGHG emissions and risk ofcontingencies.
• Focus on increased and efficientobservations, and understanding ofenvironmental changes in Bolivia todevelop effective and timelyresponses.
Main objectives for the above actionareas are:
1. Collaborate in implementingadaptation policies to face climatechange impacts, and help fortechnological and productivetransformation of sectors throughclean technologies.
2. Increase human security levelsregarding human vulnerability, risksand contingencies.
3. Integrate climate change issues intoeducational systems of society tofoster awareness of adaptation.
4. Generate strategic alliances toimplement the NationalImplementation Strategy.
7. FINANCIAL AND TECHNICALNEEDS
14
Financial and technological requirementsare critical not only for Bolivia, but alsofor the Latin American region as awhole. Such requirements must beadhered to, to implement strategies andaction - lines to face climate change, itscauses and implications.
Specific resources are needed togenerate small scale climate scenariosto reduce uncertainties originating fromclimate variations in different regions ofLatin America, and particularly Bolivia.Similar requirements are also needed forthe studying and assessment of GHGemissions from land use change andforestry, and some areas in the energysector.
The Clean Development Mechanismrepresents an important challenge andopportunity for developing countries.However, access to funding for projectsrelated to climate change is still subjectto inequalities based on nationalcapacities. Such access needs to befacilitated under the equity and fairmanagement principles within theUNFCCC; and a true and decisivesupport commitment would be desirableby the international community forstrengthening human resources and
institutional capacity, development ofproject portfolios, construction of baseline scenarios, certification guidelines,etc.
Finally, an effective support from theUNFCCC Secretariat is essential toprovide institutional strengthening of theBolivian National Climate ChangeProgram. Such support will ensure andconsolidate the UNFCCC implementationprocess in Bolivia.
CHAPTER I
NATIONAL CIRCUMSTANCES
This chapter provides a general vision of the information used in this report, from thefundamental characteristics of Bolivia to the basic data related to its geographical,climatic, economic (energy sources), social (population) and environmentalcharacteristics. We also provide a section associated to development plans, existingpolitics in the environmental field and to legislatives processes which are currently valid.
Geographical and climatic characteristics
Bolivia is located in central South America, between 57º26 ' and 69º38 ' west longitudeand between 9º38 ' and 22º53 ' south latitude. It covers a geographical surface of1.098.000 Km²
The physical characteristic of this country means a variety of climates, determined bythe tropical humid influence of the Amazon Equatorial Current and the Southern Currentcold air masses. Additionally, latitudinal and altitudinal gradients between east and westalso influence this issue.
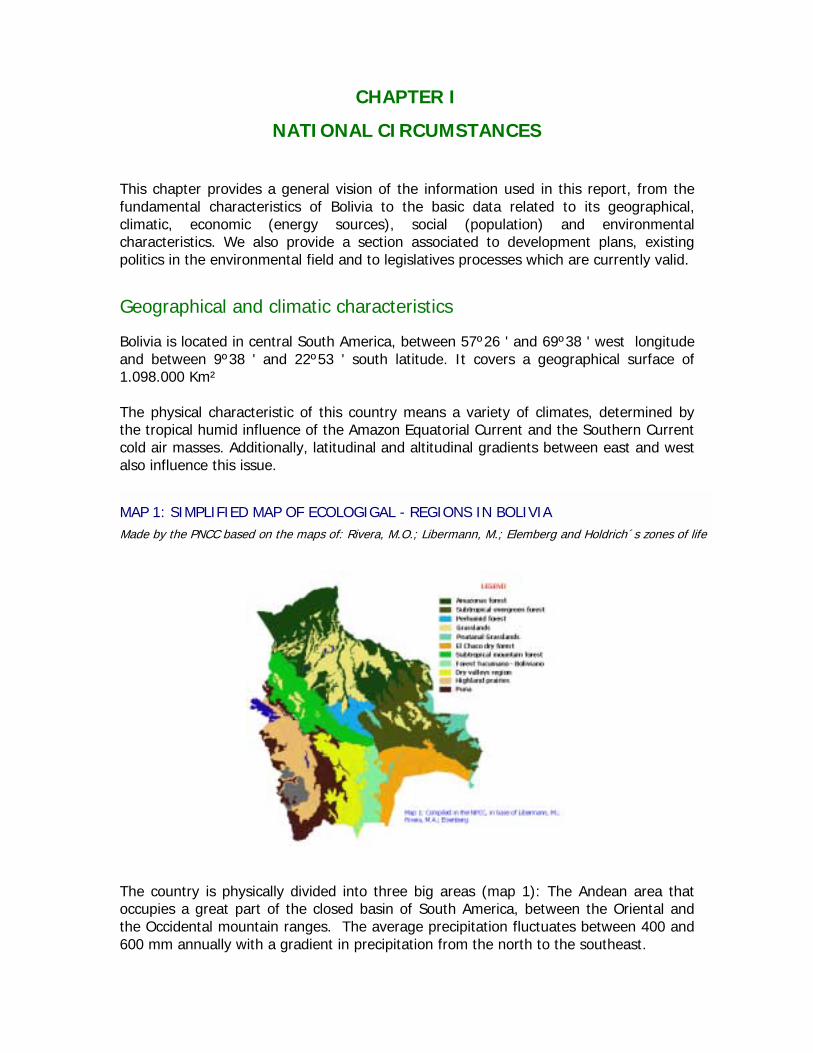
MAP 1: SIMPLIFIED MAP OF ECOLOGIGAL - REGIONS IN BOLIVIA Made by the PNCC based on the maps of: Rivera, M.O.; Libermann, M.; Elemberg and Holdrich´s zones of life
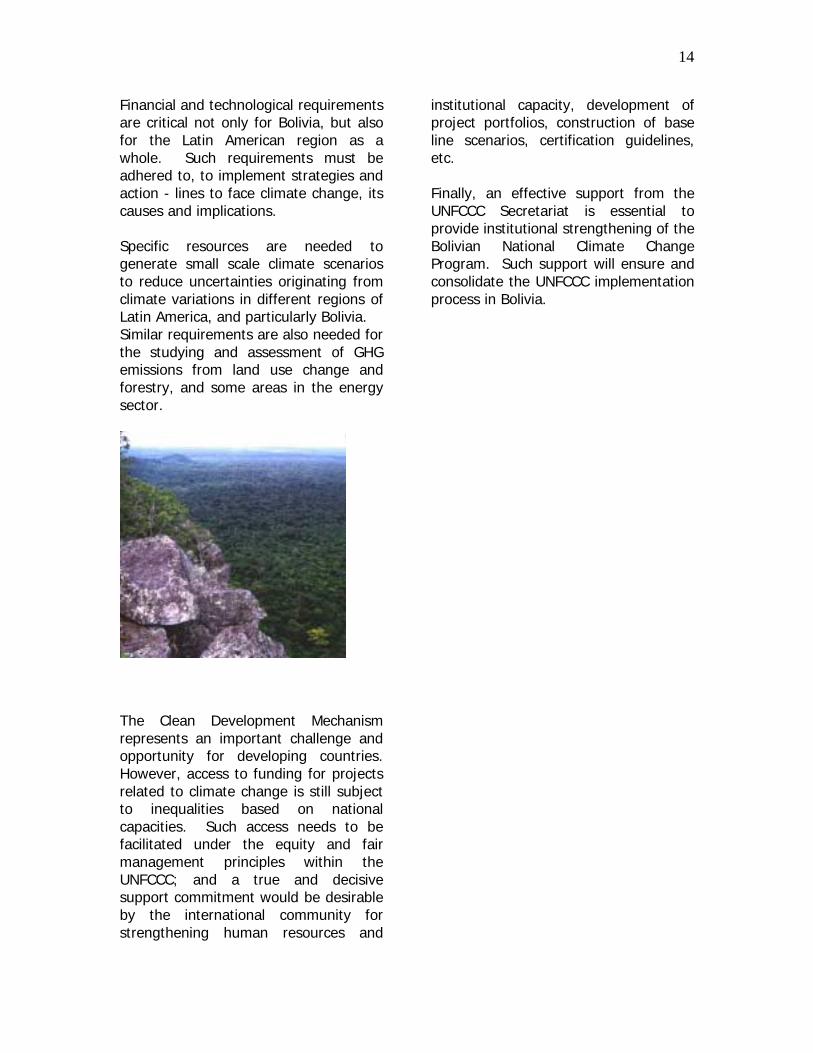
The country is physically divided into three big areas (map 1): The Andean area thatoccupies a great part of the closed basin of South America, between the Oriental andthe Occidental mountain ranges. The average precipitation fluctuates between 400 and600 mm annually with a gradient in precipitation from the north to the southeast.
The annual average temperature varies from 7 to 10ºC with a gradient in thetemperature towards the south. The gradient in precipitation and temperature generatesa cold damp climate in the northern high plains and a cold arid climate in the south.Likewise, the gradient of dampness leads to the formation of the big lakes in the northand the salt lakes in the south.
The sub-Andean area includes the geographical regions of Yungas, the Bolivian sub-Andean border, and the dry inter- Andeans valleys; the first one is composed of thehumid Yungas [between 700 and 2.000 meters above sea level (m.a.s.l)], the Yungas`cloud forests (between 2.000 and 3.600 m.a.s.l.) and finally, the Tucumano-Bolivianformation, a continuation of the Yungas forests, in the south of the country. The annualaverage precipitation in this area ranges from 1.200 to 1.700 mm and from 10 to 20ºC.in temperature.
The Bolivian sub- Andean border belongs to the lower part of the Oriental mountainrange and reach to the last foothills of the Andean mountain range (between 300 and2.000 m.a.s.l.). The precipitation level is higher on the eastern side, in the cities of LaPaz, Cochabamba and Santa Cruz where it exceeds 3.000 mm, reaching 5.000 mm inexposed areas of humid air masses of the Northeast. In the southern area, thatcorresponds to the lower ground of the Tucumano-Bolivian forest, precipitation is less(700 to 1500 mm) and the average annual temperature varies from 19ºC to 26ºC,depending on altitude and latitude.
The dry inter- Andean valleys occupy intermediate regions of the Andean mountainrange. They are not connected in the north but in the south, they become bigger andmore connected. The average annual precipitation range in this area is from 400 to 600mm with five dry months and an average annual temperature from 15 to 18ºC(SENAHMI. 1998).
The area of the plains involves the big zone of flat and not very bumpy areas to the eastof the country. The largest forests and natural savannas belong to this region in whichthe average annual precipitation ranges from 400 to 2.000 mm. In this area the gradientof precipitation goes towards the south and the average annual temperature reaches 24and 26ºC.
Seasons are drastically marked by a dry period between May and September whentemperatures go down because of the influence of cold winds from the south. Due togeological and hydrological characteristics and to the latitudinal climatic gradient, thisregion contains different types of forest, from tropical and always green subtropicalforests to the dry deciduous forests in the Chaco, the big areas of natural savanna, thepampas created by seasonal flooding, the savannas of flooded systems and the marshyareas.
Macroeconomic aspects
The economic model which has been applied to this country since 1982 responds to themarket economy. The new vision of the Bolivian government describes this economicpattern as a Social Economy of Market that makes an effort to improve the distributionmechanisms in order to reverse the conditions of poverty and existing inequality in thecountry.
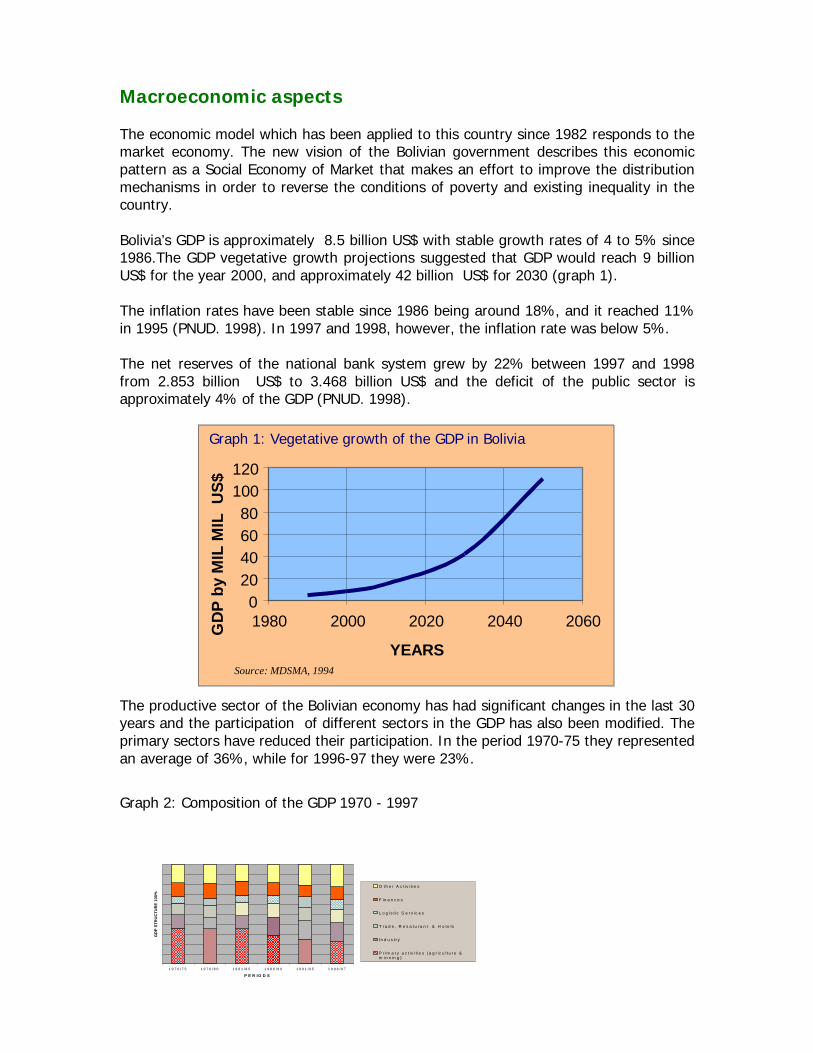
Bolivia’s GDP is approximately 8.5 billion US$ with stable growth rates of 4 to 5% since1986.The GDP vegetative growth projections suggested that GDP would reach 9 billionUS$ for the year 2000, and approximately 42 billion US$ for 2030 (graph 1).
The inflation rates have been stable since 1986 being around 18%, and it reached 11%in 1995 (PNUD. 1998). In 1997 and 1998, however, the inflation rate was below 5%.
The net reserves of the national bank system grew by 22% between 1997 and 1998from 2.853 billion US$ to 3.468 billion US$ and the deficit of the public sector isapproximately 4% of the GDP (PNUD. 1998).
0 20 40 60 80
100 120
1980 2000 2020 2040 2060
YEARS
GDP
by
MIL
MIL
US$
Graph 1: Vegetative growth of the GDP in Bolivia
Source: MDSMA, 1994
The productive sector of the Bolivian economy has had significant changes in the last 30years and the participation of different sectors in the GDP has also been modified. Theprimary sectors have reduced their participation. In the period 1970-75 they representedan average of 36%, while for 1996-97 they were 23%.
Graph 2: Composition of the GDP 1970 - 1997
1 9 7 0 / 7 5 1 9 7 6 / 8 0 1 9 8 1 / 8 5 1 9 8 6 / 9 0 1 9 9 1 / 9 5 1 9 9 6 / 9 7
P E R IO D S
GD
P ST
RU
CTU
RE
100%
O t h e r A c t iv i t i e s
F in a n c e s
L o g is t ic S e r v ic e s
T r a d e , R e s a t u r a n t & H o t e ls
In d u s t r y
P r im a r y a c t iv i t ie s ( a g r i c u lt u r e &m in n in g )
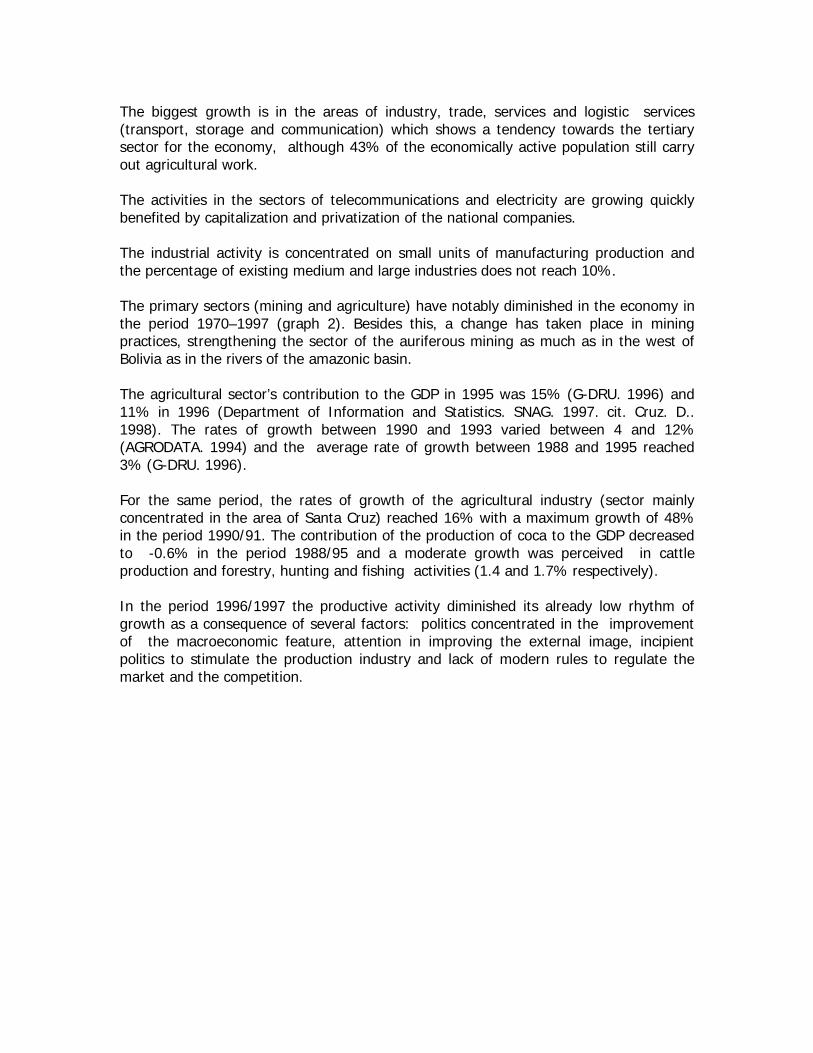
The biggest growth is in the areas of industry, trade, services and logistic services(transport, storage and communication) which shows a tendency towards the tertiarysector for the economy, although 43% of the economically active population still carryout agricultural work.
The activities in the sectors of telecommunications and electricity are growing quicklybenefited by capitalization and privatization of the national companies.
The industrial activity is concentrated on small units of manufacturing production andthe percentage of existing medium and large industries does not reach 10%.
The primary sectors (mining and agriculture) have notably diminished in the economy inthe period 1970–1997 (graph 2). Besides this, a change has taken place in miningpractices, strengthening the sector of the auriferous mining as much as in the west ofBolivia as in the rivers of the amazonic basin.
The agricultural sector’s contribution to the GDP in 1995 was 15% (G-DRU. 1996) and11% in 1996 (Department of Information and Statistics. SNAG. 1997. cit. Cruz. D..1998). The rates of growth between 1990 and 1993 varied between 4 and 12%(AGRODATA. 1994) and the average rate of growth between 1988 and 1995 reached3% (G-DRU. 1996).
For the same period, the rates of growth of the agricultural industry (sector mainlyconcentrated in the area of Santa Cruz) reached 16% with a maximum growth of 48%in the period 1990/91. The contribution of the production of coca to the GDP decreasedto -0.6% in the period 1988/95 and a moderate growth was perceived in cattleproduction and forestry, hunting and fishing activities (1.4 and 1.7% respectively).
In the period 1996/1997 the productive activity diminished its already low rhythm ofgrowth as a consequence of several factors: politics concentrated in the improvementof the macroeconomic feature, attention in improving the external image, incipientpolitics to stimulate the production industry and lack of modern rules to regulate themarket and the competition.
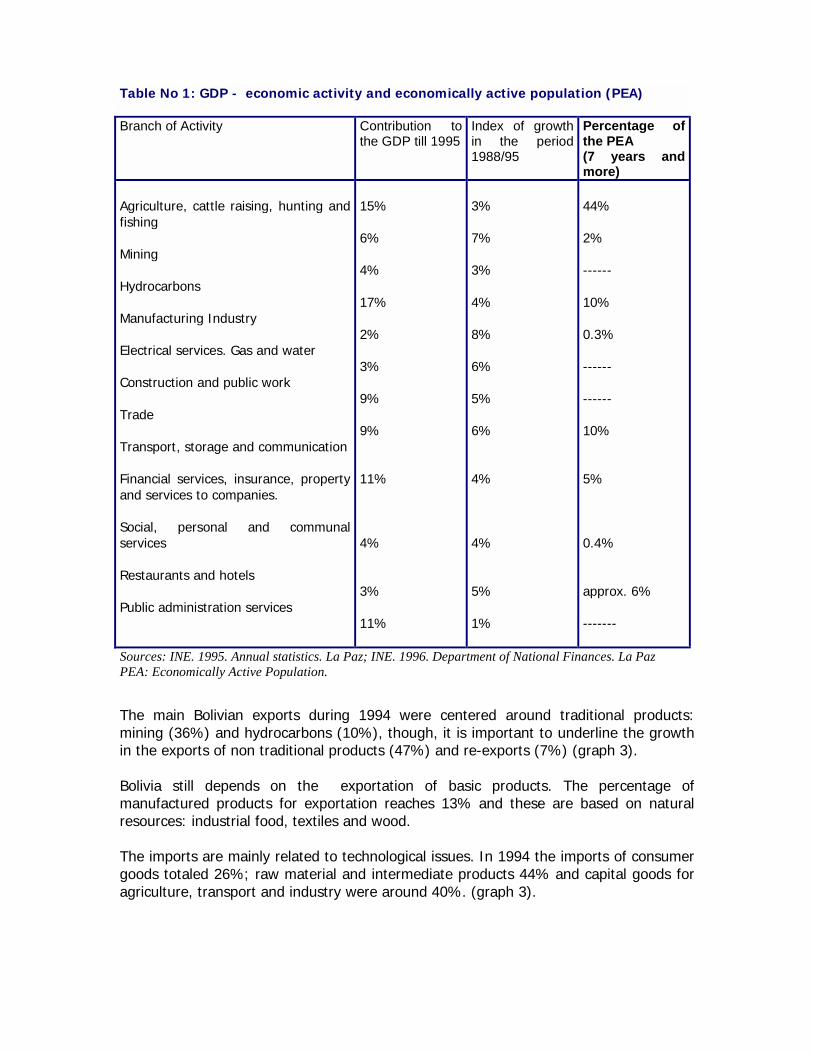
Table No 1: GDP - economic activity and economically active population (PEA)
Branch of Activity Contribution tothe GDP till 1995
Index of growthin the period1988/95
Percentage ofthe PEA(7 years andmore)
Agriculture, cattle raising, hunting andfishing
Mining
Hydrocarbons
Manufacturing Industry
Electrical services. Gas and water
Construction and public work
Trade
Transport, storage and communication
Financial services, insurance, propertyand services to companies.
Social, personal and communalservices
Restaurants and hotels
Public administration services
15%
6%
4%
17%
2%
3%
9%
9%
11%
4%
3%
11%
3%
7%
3%
4%
8%
6%
5%
6%
4%
4%
5%
1%
44%
2%
------
10%
0.3%
------
------
10%
5%
0.4%
approx. 6%
-------
Sources: INE. 1995. Annual statistics. La Paz; INE. 1996. Department of National Finances. La PazPEA: Economically Active Population.
The main Bolivian exports during 1994 were centered around traditional products:mining (36%) and hydrocarbons (10%), though, it is important to underline the growthin the exports of non traditional products (47%) and re-exports (7%) (graph 3).
Bolivia still depends on the exportation of basic products. The percentage ofmanufactured products for exportation reaches 13% and these are based on naturalresources: industrial food, textiles and wood.
The imports are mainly related to technological issues. In 1994 the imports of consumergoods totaled 26%; raw material and intermediate products 44% and capital goods foragriculture, transport and industry were around 40%. (graph 3).
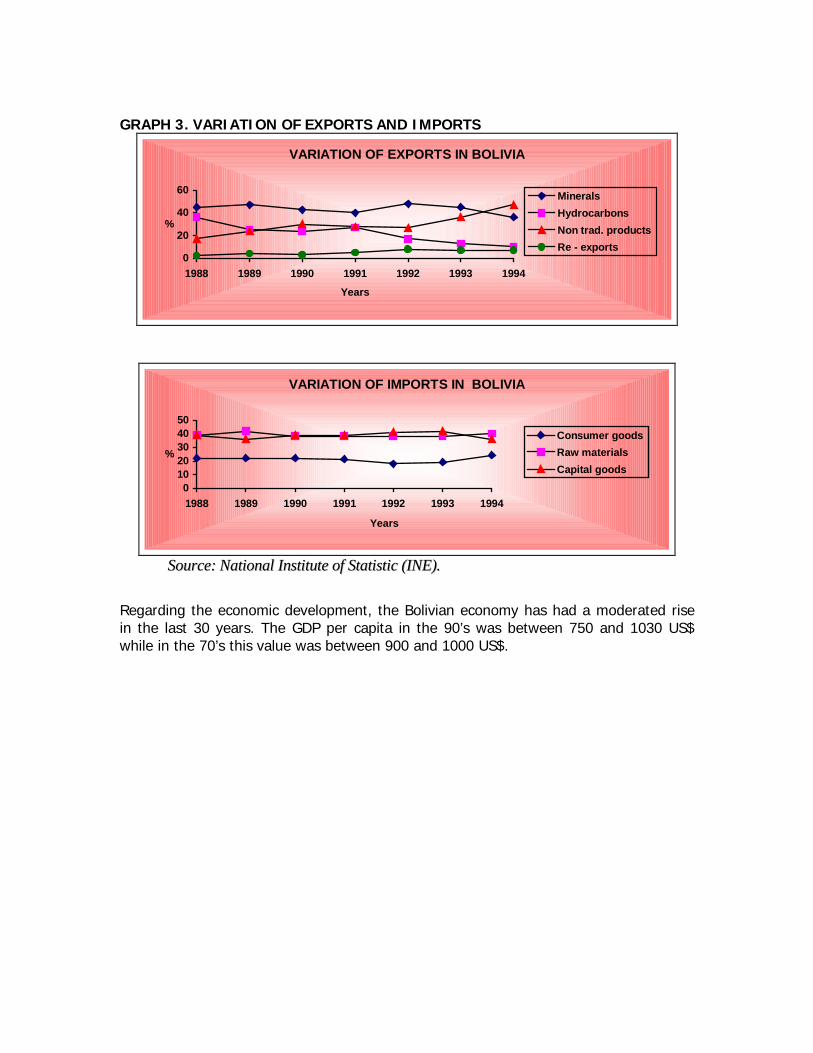
GRAPH 3. VARIATION OF EXPORTS AND IMPORTS
VARIATION OF EXPORTS IN BOLIVIA
0
20
40
60
1988 1989 1990 1991 1992 1993 1994Years
%
MineralsHydrocarbonsNon trad. productsRe - exports
VARIATION OF IMPORTS IN BOLIVIA
01020304050
1988 1989 1990 1991 1992 1993 1994
Years
%Consumer goodsRaw materialsCapital goods
SSoouurrccee:: NNaattiioonnaall IInnssttiittuuttee ooff SSttaattiissttiicc ((IINNEE))..
Regarding the economic development, the Bolivian economy has had a moderated risein the last 30 years. The GDP per capita in the 90’s was between 750 and 1030 US$while in the 70’s this value was between 900 and 1000 US$.
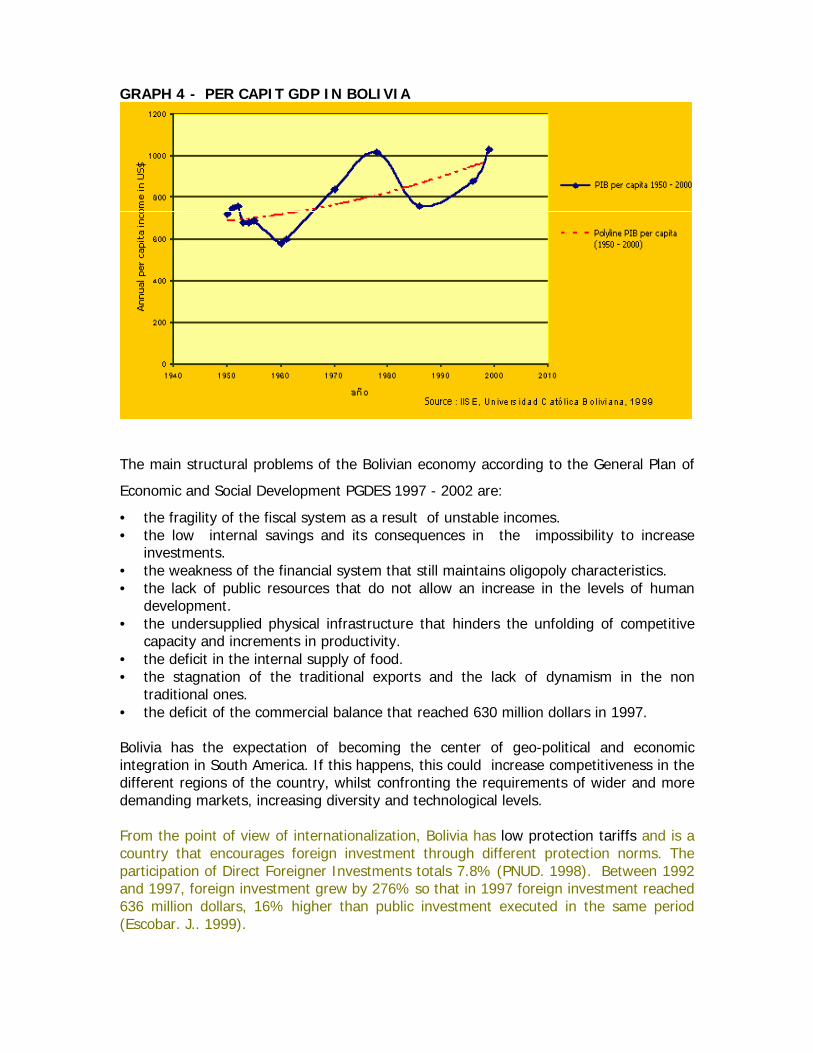
GRAPH 4 - PER CAPIT GDP IN BOLIVIA
The main structural problems of the Bolivian economy according to the General Plan of
Economic and Social Development PGDES 1997 - 2002 are:
• the fragility of the fiscal system as a result of unstable incomes.• the low internal savings and its consequences in the impossibility to increase
investments.• the weakness of the financial system that still maintains oligopoly characteristics.• the lack of public resources that do not allow an increase in the levels of human
development.• the undersupplied physical infrastructure that hinders the unfolding of competitive
capacity and increments in productivity.• the deficit in the internal supply of food.• the stagnation of the traditional exports and the lack of dynamism in the non
traditional ones.• the deficit of the commercial balance that reached 630 million dollars in 1997.
Bolivia has the expectation of becoming the center of geo-political and economicintegration in South America. If this happens, this could increase competitiveness in thedifferent regions of the country, whilst confronting the requirements of wider and moredemanding markets, increasing diversity and technological levels.
From the point of view of internationalization, Bolivia has low protection tariffs and is acountry that encourages foreign investment through different protection norms. Theparticipation of Direct Foreigner Investments totals 7.8% (PNUD. 1998). Between 1992and 1997, foreign investment grew by 276% so that in 1997 foreign investment reached636 million dollars, 16% higher than public investment executed in the same period(Escobar. J.. 1999).
On the other hand, Bolivia still has a series of difficulties on international scene. Thedeficits in the current account exceeds 5% of the GDP and the foreign debt totals 338%of exports and 61.4% of GDP (PNUD. 1998).
The Bolivian government has promoted, during the last 13 years, different measures inorder to increase its competitiveness in the South American context, to raise productivityand to improve the image of Bolivia internationally. Through capitalization, thegovernment has acquired strategic partners to facilitate progression in state companieswhich is used to assist the social sector, to maintain the natural resources and to makeits fiscal duties more effective.
Complementary to these measures, the Bolivian government is taking steps to improvethe stock market and to give more security to its operations. Bases to control thefunctioning of these markets through the Super-Intendancy of banks, pensions, valuesand insurance are also being established
Demographic transition and human development
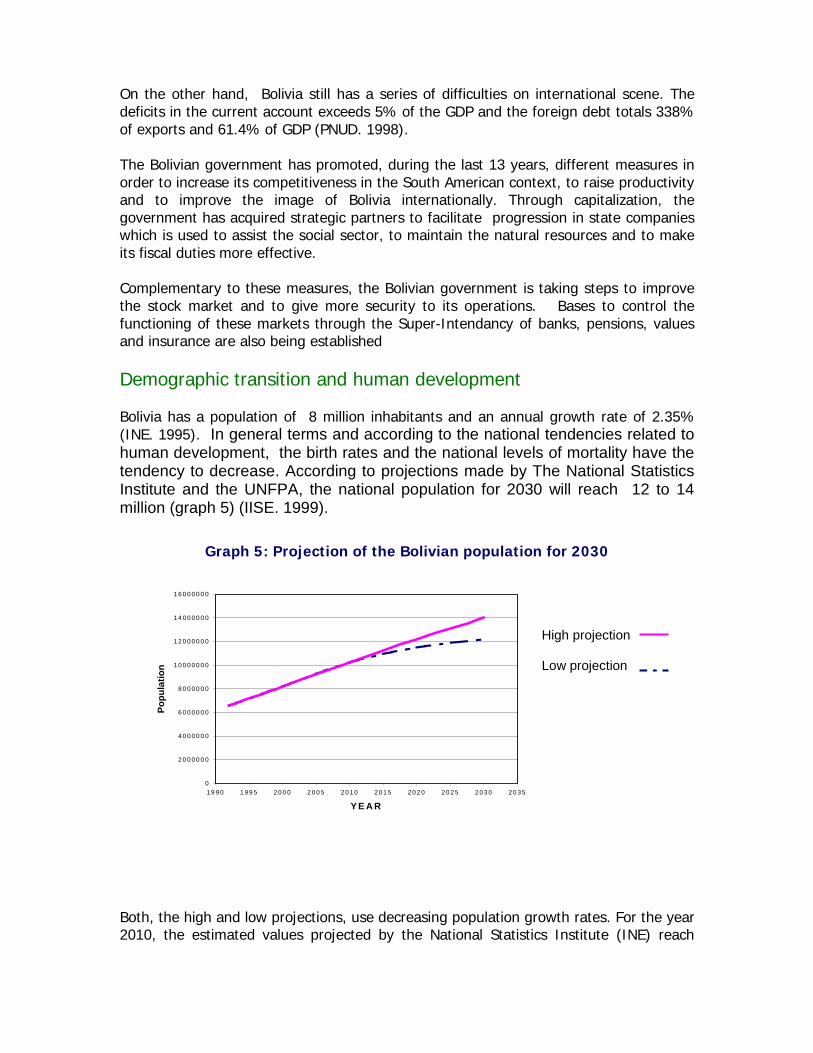
Bolivia has a population of 8 million inhabitants and an annual growth rate of 2.35%(INE. 1995). In general terms and according to the national tendencies related tohuman development, the birth rates and the national levels of mortality have thetendency to decrease. According to projections made by The National StatisticsInstitute and the UNFPA, the national population for 2030 will reach 12 to 14million (graph 5) (IISE. 1999).
Graph 5: Projection of the Bolivian population for 2030
Both, the high and low projections, use decreasing population growth rates. For the year2010, the estimated values projected by the National Statistics Institute (INE) reach
High projection
Low projection
0
2 0 0 0 0 0 0
4 0 0 0 0 0 0
6 0 0 0 0 0 0
8 0 0 0 0 0 0
1 0 0 0 0 0 0 0
1 2 0 0 0 0 0 0
1 4 0 0 0 0 0 0
1 6 0 0 0 0 0 0
1 9 9 0 1 9 9 5 2 0 0 0 2 0 0 5 2 0 1 0 2 0 1 5 2 0 2 0 2 0 2 5 2 0 3 0 2 0 3 5
Y E A R
Popu
latio
n

between 2.18%, and 1.98% between the years 2005 - 2010 and almost 1.29%between the years 2025 - 2030. The birth rate also decreased to around 4% for theperiod 1995 - 2000 and around 2.5% for the period 2025 - 2030 (IISE. 1999).
Urbanization process
Bolivia still has low levels of urbanization in comparison with other countries of SouthAmerica where urbanization levels reach 78%. According to the Population and HousingCensus of 1992 (INE), the urban population is 57.5% while the rural population is42.5% . (It is actually assumed that urbanization levels are higher but there are noofficial statistics). On the other hand, levels of urban growth in Bolivia are the highestin South America and reach an average of 4% while the average regional growthreaches 2.5% (PNUD (c). 1996).
According to several sources, population projections estimate that Bolivia’s urbanpopulation will reach 75% to 80% by the year 2025 which also means a clear tendencytowards urbanization of the economy. The Housing Population's Censuses of 1976 and1992 show a clear process of urbanization and concentration of population in big andintermediate cities.
The population of the biggest cities of Bolivia (La Paz, Cochabamba and Santa Cruz)surpasses 500.000 inhabitants. These cities belong to the denominated “Main Axis” inwhich two thirds of the urban population of the country are firmly settled and wherefour fifths are economically active.
Other 16 intermediate towns of more than 20.000 inhabitants make up 30% of thecountry’s urban population. These towns have trebled their population in the last 15years and they show a strong gravitation towards the east of the country. In the valleysthe average rates of growth reach 9% while in the high plain the rates of growth arebelow 3% (PNUD (a). 1998. 159). (Map 2).
Other 104 villages and communities of more than 2.000 inhabitants are distributed allalong the national territory in a dispersed way, with a strong gravitation towards theplains. In general, the growth levels are quite low in the valleys and the high plain.
Between 1950 and 1992, 23 towns with more than 5.000 inhabitants were founded inthe east, while in the west, including the valleys, just 6 urban centers have beenestablished (Bairon. 1996).
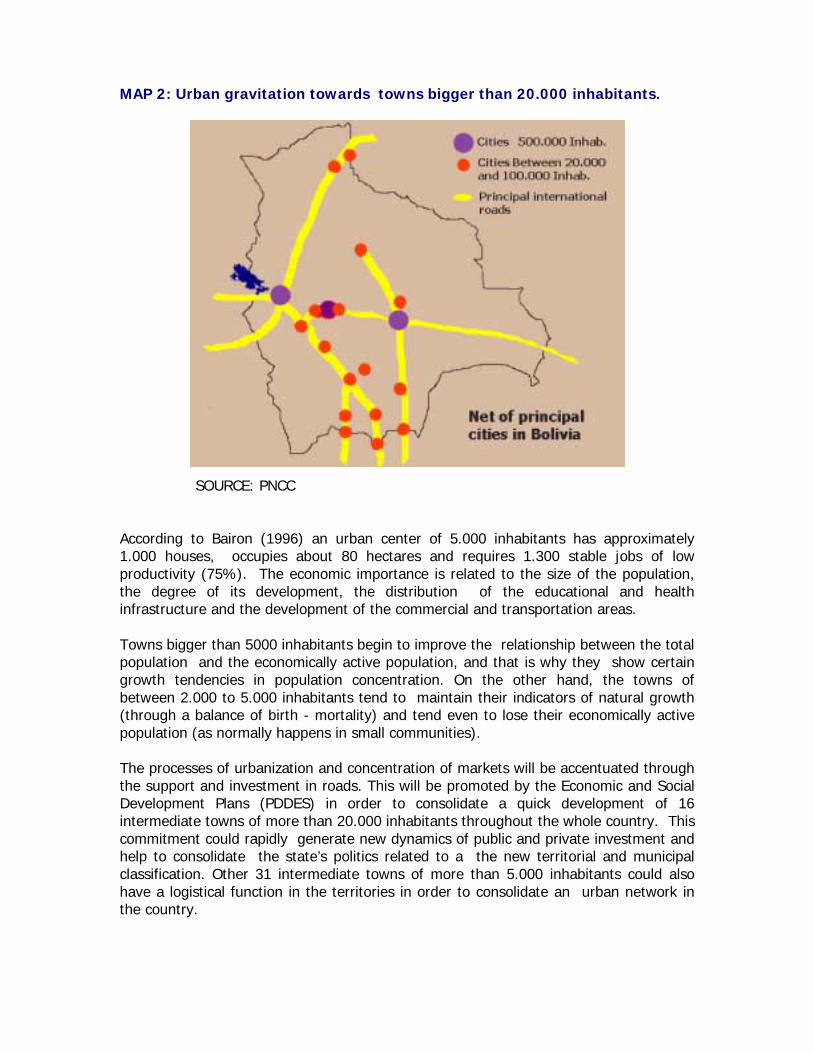
MAP 2: Urban gravitation towards towns bigger than 20.000 inhabitants.
SOURCE: PNCC
According to Bairon (1996) an urban center of 5.000 inhabitants has approximately1.000 houses, occupies about 80 hectares and requires 1.300 stable jobs of lowproductivity (75%). The economic importance is related to the size of the population,the degree of its development, the distribution of the educational and healthinfrastructure and the development of the commercial and transportation areas.
Towns bigger than 5000 inhabitants begin to improve the relationship between the totalpopulation and the economically active population, and that is why they show certaingrowth tendencies in population concentration. On the other hand, the towns ofbetween 2.000 to 5.000 inhabitants tend to maintain their indicators of natural growth(through a balance of birth - mortality) and tend even to lose their economically activepopulation (as normally happens in small communities).
The processes of urbanization and concentration of markets will be accentuated throughthe support and investment in roads. This will be promoted by the Economic and SocialDevelopment Plans (PDDES) in order to consolidate a quick development of 16intermediate towns of more than 20.000 inhabitants throughout the whole country. Thiscommitment could rapidly generate new dynamics of public and private investment andhelp to consolidate the state’s politics related to a the new territorial and municipalclassification. Other 31 intermediate towns of more than 5.000 inhabitants could alsohave a logistical function in the territories in order to consolidate an urban network inthe country.
Human Development
According to Index of Human Development, Bolivia occupies the 116th position with aGDP per capita of 2.612 dollars (PNUD (a). 1998).
This classification confers Bolivia a place between the countries with a medium level ofHuman Development. The social indicators, however, describe a dramatic situation inthe levels of the human development (Bolivia is, in Latin America, the fifth country withthe smallest level of human development).
In addition, there is a huge gap between the levels of human development in the citiesand in the country. This relation is directly proportional to the number of inhabitants ofthe cities and villages. The bigger cities are precisely those that have a bigger diversityof markets, infrastructure, transport, communication, energy consumption, a higher percapita consumption and, of course, higher levels of human development.
Since the 70’s, cities have obtained evident improvements in their indexes of humandevelopment, while in the rural areas the rhythms of change have been slower. Thelevels of mortality and birth are a good example in making this comparison. In the urbanareas the total birth rate is 3.8 children per woman, while in the rural areas it is 6.3children. Furthermore, the infant mortality rates in the cities is 58 per one thousand,while in the rural areas this index is 98 (Human Develop in Bolivia - 1998).
According to the Map of Poverty (1995), a big part of the population has a lack ofessential necessities (appropriate access to basic services, housing and health). In ruralareas, poverty affects 94% of the inhabitants.
The same disparities between cities and the countryside can be observed in educationallevels. The literacy indexes of children older than 15 in the cities is between 96% and97% in men and 85% to 92% in women. In the countryside, the indexes of literacy in asimilar group (15 years or more) ranges between 72% and 83% for men and 44% to65% for women (Human Development in Bolivia - 1998).
The global rate of attendance to schools (TBE) totals 83% in the cities while in ruralareas barely totals 63%. Likewise, from each 10 youths that have access to thesecondary level in the whole country only 5.5% belong to the rural area (Poverty Map.1995).
The scarce attendance in schools in the rural areas is related to different problems, butthe most critical ones are mainly associated to the economic situation of the family(working children) and the deficiencies in the conception of the educational sector. Inthe whole department of Pando for example, there are 14 secondary schools from which11 belong to the capital (ZONISIG. 1997).The concentration of the educational infrastructure in urban areas is similar in the maintowns of the country and the same pattern can be detected in the distribution of otherservices (health, for example).
The places with a big population density have a bigger demographic pressure thatoptimizes the productive processes through the use of new technologies. This has as aresult a much more productive infrastructure, higher levels of technology, better levelsof organization and, of course, bigger levels of governmental attendance and support.
In this sense, the development of intermediate cities and towns in the whole countrycould bring improvements in the distribution of population and could help in reducingthe existing inequalities.
Energy profile
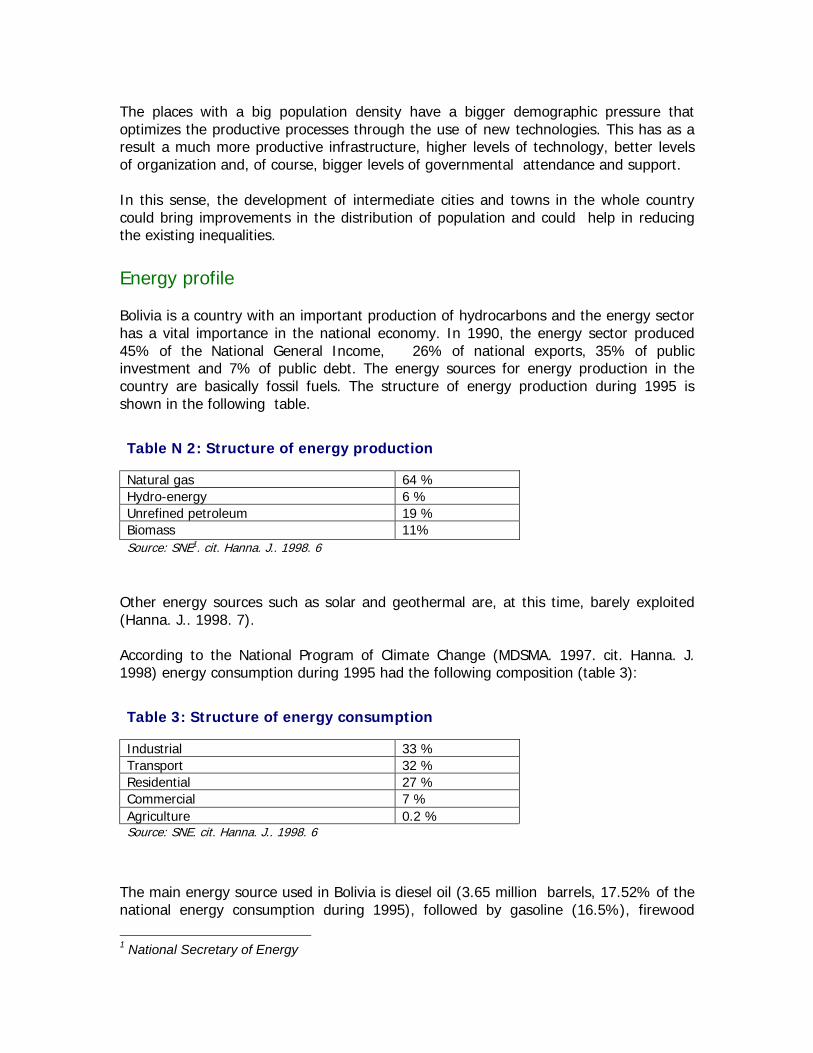
Bolivia is a country with an important production of hydrocarbons and the energy sectorhas a vital importance in the national economy. In 1990, the energy sector produced45% of the National General Income, 26% of national exports, 35% of publicinvestment and 7% of public debt. The energy sources for energy production in thecountry are basically fossil fuels. The structure of energy production during 1995 isshown in the following table.
Table N 2: Structure of energy production
Natural gas 64 %Hydro-energy 6 %Unrefined petroleum 19 %Biomass 11%Source: SNE1. cit. Hanna. J.. 1998. 6
Other energy sources such as solar and geothermal are, at this time, barely exploited(Hanna. J.. 1998. 7).
According to the National Program of Climate Change (MDSMA. 1997. cit. Hanna. J.1998) energy consumption during 1995 had the following composition (table 3):
Table 3: Structure of energy consumption
Industrial 33 %Transport 32 %Residential 27 %Commercial 7 %Agriculture 0.2 %Source: SNE. cit. Hanna. J.. 1998. 6
The main energy source used in Bolivia is diesel oil (3.65 million barrels, 17.52% of thenational energy consumption during 1995), followed by gasoline (16.5%), firewood
1 National Secretary of Energy

(16%), natural gas (15%), bagasse (9 %), LGP (9 %) and electricity (8 %) (MDSMA.1998. cit. Hanna. J.. 1998. 7).
There is an important lack of demand of energy mainly in rural areas (small villages of2.000 inhabitants). In the countryside, the percentage of people with access to electricenergy totals 9% in the high plains (Altiplano), 29% in the valleys and 0.02% in thelowlands (INE. 1996).
In towns with more than 20.000 inhabitants this percentage increases to 60% onaverage, totaling 90% in the most important cities and in the big mining centers withmore than 5.000 inhabitants which are benefited by the National InterconnectedSystem (ibid).
During 1995, the installed capacity for electric generation (in equipments basically) was802.2 MW (National Secretary of Energy. cit. Hanna. J.. 1998. 7) and an amplification ofthis capacity to 547.4 MW was projected until the year 2005 through the NationalInterconnected System (MDSMA. 1997. cit. Hanna. J.. 1998).
The Program of Rural Electrification (preliminary version) contemplates for the nextyears approximately 500 projects of rural electrification that would benefit 100.000homes (20% of the rural population). From this total, 52% of the projects would workwith renewable energy sources (hydroelectric and wind); 36% with the amplification ofelectricity networks and finally, 12% with biomass, generation of diesel and generationof natural gas.
The projection of energy demand for fossil fuels, use of biomass and renewable energyis shown in the graph 6. It is possible to appreciate that the demand process throughrenewable energy is very small compared to fossil energy.
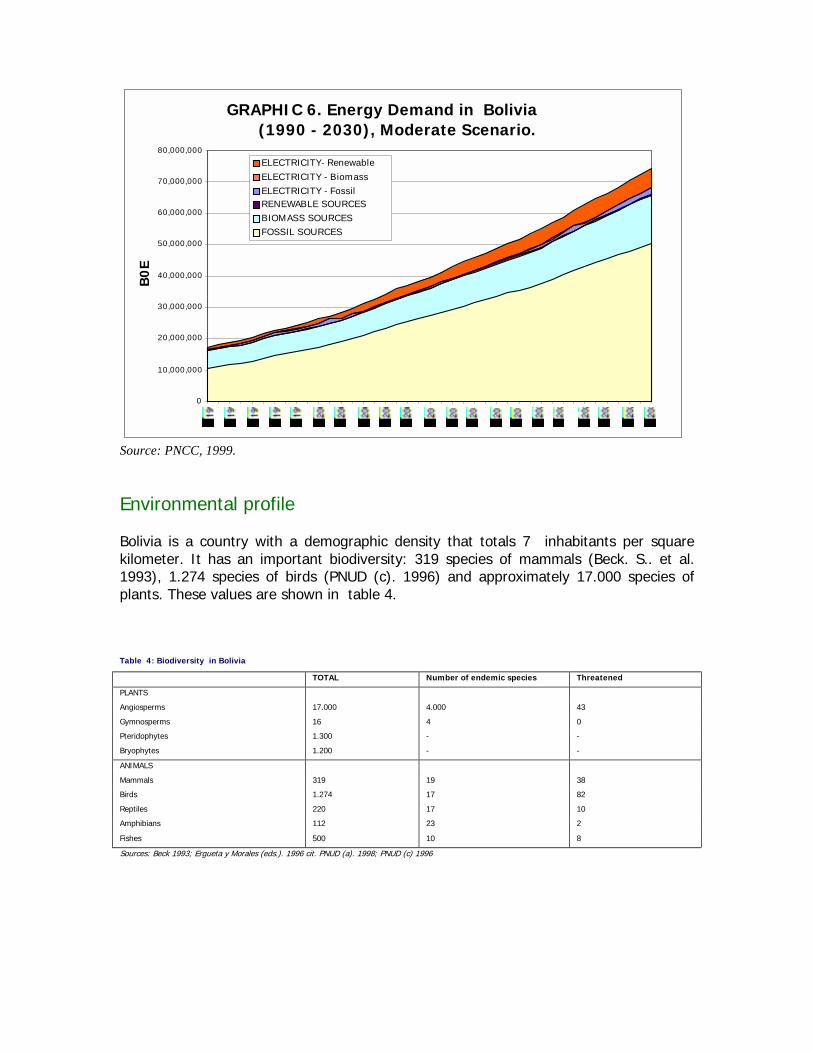
Source: PNCC, 1999.
Environmental profile
Bolivia is a country with a demographic density that totals 7 inhabitants per squarekilometer. It has an important biodiversity: 319 species of mammals (Beck. S.. et al.1993), 1.274 species of birds (PNUD (c). 1996) and approximately 17.000 species ofplants. These values are shown in table 4.
Table 4: Biodiversity in Bolivia
TOTAL Number of endemic species Threatened
PLANTS
Angiosperms 17.000 4.000 43
Gymnosperms 16 4 0
Pteridophytes 1.300 - -
Bryophytes 1.200 - -
ANIMALS
Mammals 319 19 38
Birds 1.274 17 82
Reptiles 220 17 10
Amphibians 112 23 2
Fishes 500 10 8
Sources: Beck 1993; Ergueta y Morales (eds.). 1996 cit. PNUD (a). 1998; PNUD (c) 1996
GRAPHIC 6. Energy Demand in Bolivia
(1990 - 2030), Moderate Scenario.
0
10,000,000
20,000,000
30,000,000
40,000,000
50,000,000
60,000,000
70,000,000
80,000,000 B
0E
ELECTRICITY- Renewable ELECTRICITY - BiomassELECTRICITY - FossilRENEWABLE SOURCESBIOMASS SOURCESFOSSIL SOURCES
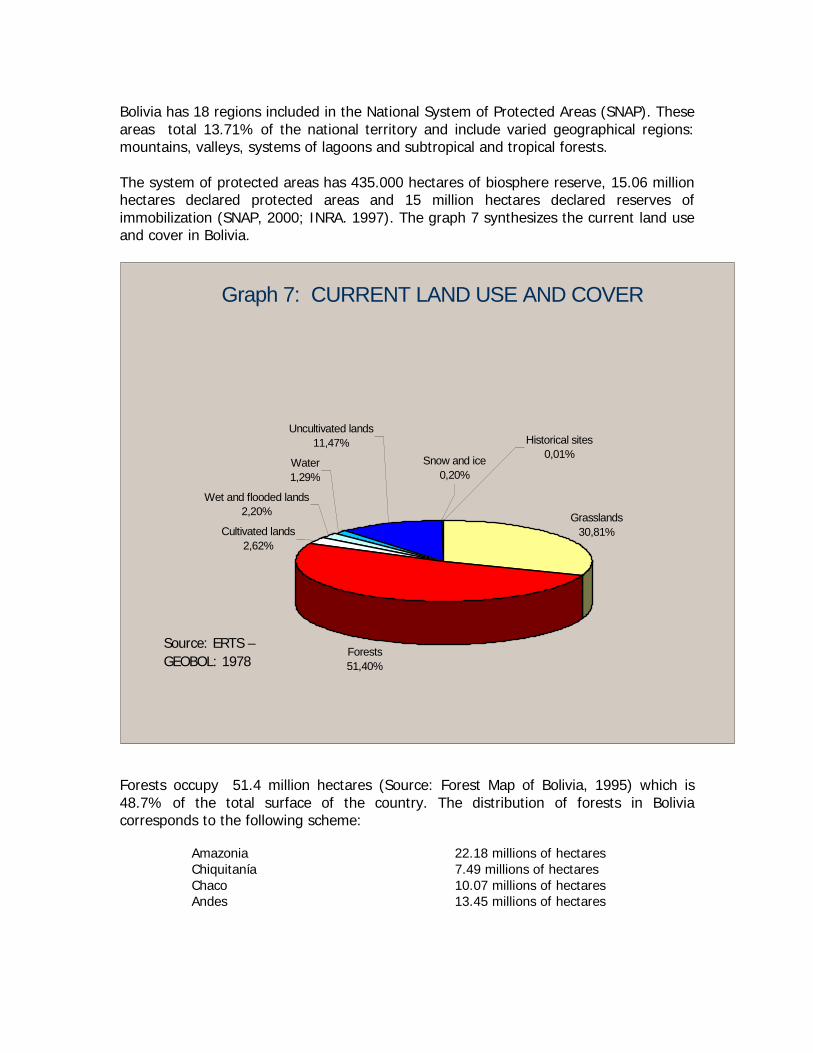
Bolivia has 18 regions included in the National System of Protected Areas (SNAP). Theseareas total 13.71% of the national territory and include varied geographical regions:mountains, valleys, systems of lagoons and subtropical and tropical forests.
The system of protected areas has 435.000 hectares of biosphere reserve, 15.06 millionhectares declared protected areas and 15 million hectares declared reserves ofimmobilization (SNAP, 2000; INRA. 1997). The graph 7 synthesizes the current land useand cover in Bolivia.
Forests occupy 51.4 million hectares (Source: Forest Map of Bolivia, 1995) which is48.7% of the total surface of the country. The distribution of forests in Boliviacorresponds to the following scheme:
Amazonia 22.18 millions of hectaresChiquitanía 7.49 millions of hectaresChaco 10.07 millions of hectaresAndes 13.45 millions of hectares
Graph 7: CURRENT LAND USE AND COVER
Grasslands30,81%
Forests51,40%
Cultivated lands2,62%
Water1,29%
Uncultivated lands11,47%
Wet and flooded lands2,20%
Snow and ice0,20%
Historical sites0,01%
Source: ERTS – GEOBOL: 1978
The average deforestation rate between 1971 and 1987 was 140,000 hectares per year.According to the “FAO Production Yearbook” 21.2 million hectares of forest weredevastated in this period. The current deforestation rate is 150,000 hectares per yearwhile other sources mention an annual growth of 6% in agricultural activities thatdeteriorate the forest.
During 1994/95, the cultivated surface in Bolivia was 1,646,691, 1.65% of the totalsurface of the country (INE. 1995). This percentage increased to 1.82% in the period1996/97 (Cruz. D.. 1998. 10) and decreased to 1.67% in 1997/1998. The biggestincrease was registered in the sector of industrial cultivation where an average growthof 16.47% was estimated between 1988 and 1995 GDP (G-DRU. 1994).
According to the National Institute of Agrarian Reform (INRA), between 1953 and 199344 million hectares were distributed for agricultural uses (42% of the total surface of thecountry). Apparently, these lands are not completely cultivated.
The Ministry of Sustainable Development (MDSMA. 1997) has the following proposal forland use:
Intensive agriculture 3.7%Extensive agriculture 22.7%Extensive cattle raising 25.8%Pasturing 2.8%Forest 21.9%Restricted areas 12.4%Protected areas 8.7%Bodies of water 1.0%
This distribution would allow to dedicate 52.8% of the surface of the country toagricultural uses. From this percentage, 25.8% would be dedicated to livestock, mainlyin the natural savannas (which should be managed appropriately), 3.7% to intensiveagricultural uses, 8% to protected areas (National System of Protected Areas) and 12%to restricted areas (protection of forests and basins) (INRA 1997. MDSMA 1997).
In Bolivia, according to the second National Agricultural Census, there are 314,600agricultural units with 22.6 million available hectares. On the other hand, sources likeCEDLA (cit. Peace. D.. 1998) estimate the existence of 550,000 peasants dedicated toagriculture, 50,000 agricultural companies and 45,000 families that belong to ethnicgroups with specific knowledge of forest management (Peace. D.. 1998). These groupsare mainly set down in the high plains, the valleys and the colonized lands of La Paz,Cochabamba, Santa Cruz and Tarija.
The expansion of the agricultural frontier (strongly concentrated in the department ofSanta Cruz and associated to the transformation of forests) is mostly related to theindustrial cultivation of soya, rice, wheat, maize and sugar cane.
The emergence of new development points in the departments of Beni, Pando, thenorth of La Paz and in the area of the Chaco (Chuquisaca and Tarija) have also as aresult transformed forests in order to use them for cultivation and cattle raising.
Similarly, this typical pattern of agricultural use can be seen in the east of the countrywhere it is difficult to adapt this type of extensive agriculture to land use plans (PLUS).
A third area of expansion in the agricultural frontier is the zone of Chapare where,through the denominated “alternative development”, the plantations of coca leaves arebeen substituted by the production of banana, pineapples and other crops.
In the western part of the country, agriculture is characterized by the work of smallunits of producers. In most of the cases, this is a subsistence agriculture withinsufficient produce to be exchanged in the markets.
Fortunately, in many cases, the productive capacities in the high plains and in thevalleys are being increased through the implementation of irrigated areas, the geneticimprovement of seeds, the improvement of animal health and the implementation ofsystems of productive complementarities developed among regions. These projectswere, till now, in an experimental phase (studies and isolated experiences) and that iswhy they do not currently reach the size to assure the feeding of the population and toincrease competitiveness in markets.
59.2% of the land in the country is affected by water erosion (SNRNMA. 1995). In theAndean region, particularly in the inter-Andean dry valleys, 4.6% of the territory isconstituted of sandbanks with strong desertification tendencies by wind erosion. In theregion of the Chaco, the influence of the wind usually transforms million of hectares intodunes (Bojanic. 1997).
In the high plains and the valleys, the intense use of the land and its inappropriatemanagement and conservation, is responsible for the loss of fertility and intense erosionprocesses.
Land erosion is one of the main ecological problems of Bolivia and it has been estimatedthat 275,544 km2 of the total surface of the country suffers from strong problems oferosion. This quantity is equivalent to 61% of the arid, semi-arid and dry sub tropicalregions of Bolivia) (Source : Land Conservation Office, 1996).
In the subtropical regions and in the plains of the east and the south of the country, theinadequate administration of the natural resources (flora and fauna) is also causingland erosion, mainly in areas affected by spontaneous colonization.
The excessive pressure on the ground, its salination through watering practices(Gandarillas. H.. 1997) and the inadequate ways of land use (mainly in the integratedareas of Santa Cruz but also in other colonization areas) is deteriorating large extensionsof agriculture areas. The maintaining of this tendency would rapidly decrease the areasfor agricultural potential (2.6% according to ERTS–GEOBOL. 1978) (Bojanic. 1997).The water resources in several points of the Amazon are also affected by erosion,intensified by the effects of deforestation.
On the other hand, many streams and rivers crossing small and medium populatedcenters (which do not have effective sewer system and collect waste) suffer the resultsof urban contamination (mainly biological).
In this sense, the INRA law determines protective basins for preserving against watererosion. Similarly, the Bolivian government is working on a legislation that couldimplement the application of environment laws and water laws in small townsconsidering, at the same time, the basic necessities of these settlements.
However, the contamination of water resources is even worse in the big cities and inplaces of agricultural and mining production. In this sense, independent studies havebeen carried out for the water resources of the Altiplanic basin, for rivers of the La Platabasin (strongly polluted by mining activity), for some Amazon rivers that suffer strongcontamination caused by agriculture (sugar cane, especially) and for the basin of the LaPaz River, where different mining areas are established. Fast flowing rivers such as thePilcomayo and the Desaguadero have also suffered the effects of mining activities, orthe effects of harvest, as is the case of the Piraí river, in Santa Cruz.
Referring to the air, it is possible to say that Bolivia does not suffer huge problems ofair contamination. There are, in certain moths of the year, cultural practices orfestivities (San Juan's date especially) when the permissible limit of pollution in thecities is exceeded (Pinto. M.R.; Zaballa. M. com. per.).
Another source of air contamination is the burning of vegetation (chaqueo) betweenJuly and September, when smoke hinders airplanes from landing and constitutes ahealth threat, causing breathing diseases.
Contamination caused by the sublimation of heavy metals happens mainly in places ofmining exploitation (the exploitation of gold causes mercury sublimations, for example).Considerable concentrations of heavy metals have also been reported in some urbanplaces, lead and cadmium mainly.
Environmental legislation
During the last 10 years, the Bolivian government has been promulgating different lawsin order to control the use of natural resources and to promote the environmentaldefense. At the moment, the major part of this legislation is still being discussed. TheEnvironmental Law (Law 1333. of April 27 1992) is the first legal referenceregarding the environment and its protection.
This law was finally approved in December 1995 and has been lately complemented bylaws like the Water Law, the Forest Law, the Law of Biological Diversity and the Law ofLand and Land Use. The points developed by the Environmental Law refer to renewableand non-renewable resources, health and environment, environmental education,science and technology. The functions and responsibilities of ministries, prefectures andmunicipalities are also delineated in their regulations. The Environmental Law takes intoaccount the following components:
Prevention and environmental controlThe procedures regarding the evaluation of environmental impact are delineated by theNational Evaluation System of Environmental Impact (SNEIA) and by the NationalSystem of Environmental Control and Quality (SNCCCA). Their functions are related toenvironmental protection and surveillance, environmental audits and administrativesanctions.
Atmospheric contaminationParameters for the administration of air quality and the environmental regulation forenterprises are established in this area. Topics regarding the control of atmosphericcontamination (noise, polluting emissions and quality of fuels), urban and industrialplanning and surveillance mechanisms (sanctions and others) are also delineated.
Water contaminationThis area includes topics like: regulation parameters for potable water supply (municipaland cooperative); regulations for waste water, permissible parameters and concepts forthe legislation of water discharges, regulations for the control and evaluation of waterquality, surveillance mechanisms and sanctions, evaluation of water treatment,conservation of underground water and contamination of basins.
Activities regarding dangerous substancesThis area, created as part of the Program of Inter-sector Action against dangeroussubstances, includes different topics related to this issue: registration, licensing,handling, generation, treatment, selection, gathering, transport, storage andconfiscation.
Complementary legal references
The Forest Law (Law 1700. of December 21 1996) has the objectives ofregulating the sustainable use and the protection of forests and land.Besides, it guarantees the conservation of the ecosystem in facilitating theaccess for the population to natural resources.
The following are some of the forest law regulations:
• Regulations regarding forest concessions.• Regulations regarding management plans.• Regulations regarding land use• Incentives for the rehabilitation of degraded lands.
The National Law of Agrarian Reforms (Law INRA 1715 of October, 18, 1996) hasthe following functions: to establish the organic structure and attributions ofthe Service of Agrarian Reform; to define the distribution of land; toguarantee the land ownership, to regulate the reparation of agrarianproperty, to regulate the executive and judicial instances in agrarianmatters.
The Law of Wild Life in National Parks, Hunting and Fishing (Law 12301. of March 141975) and the Law of Biological Diversity Conservation have the objective of
regulating the protection of wild flora and fauna inside protected areas. Thislaw will be soon substitute by the Law of Biological Diversity Conservation.
Finally, the Law of Popular Participation (Law Not. 1551. of April 20 1994) promotesthe strengthening of small towns and municipalities in order to increase theparticipation of people in the taking of decisions. It promotes, on one hand, anatural administrative division inside the municipalities through the formation of theTerritorial Organizations of Base (popular organizations that have the right to controland supervise the municipal administration). On the other hand, it countersigns thefunctions and municipal rights settled by the Organic Law of Municipalities.
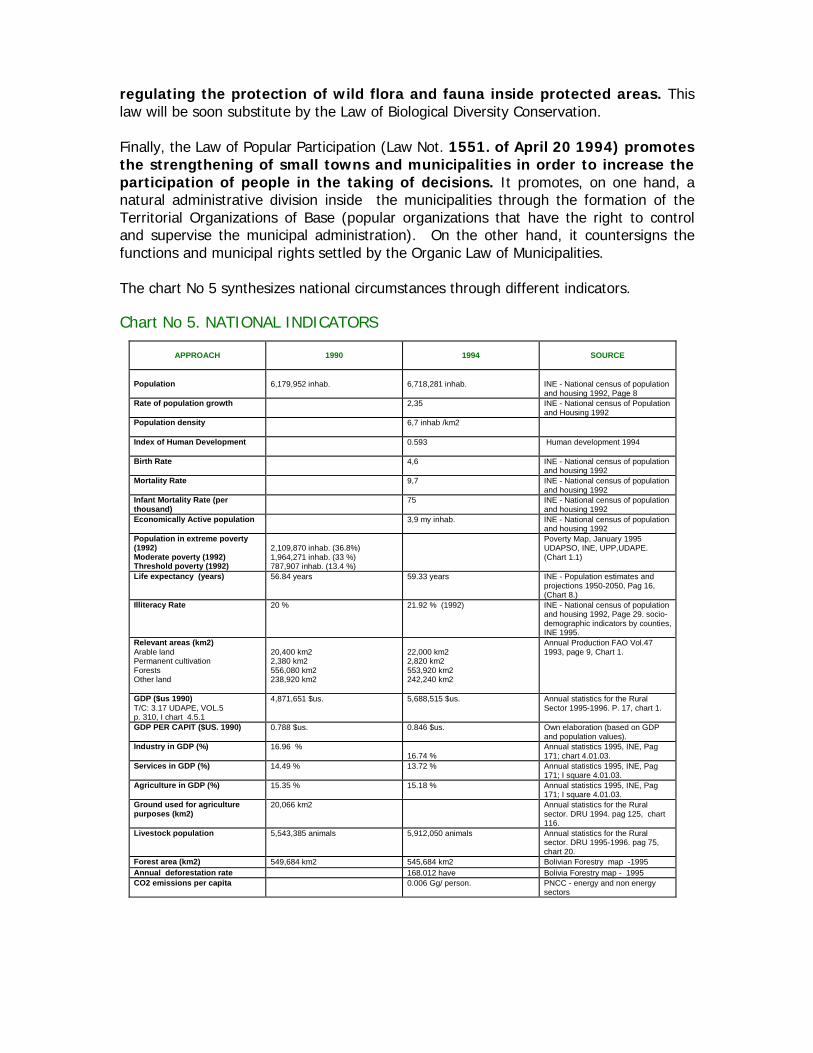
The chart No 5 synthesizes national circumstances through different indicators.
Chart No 5. NATIONAL INDICATORS
APPROACH 1990 1994 SOURCE
Population 6,179,952 inhab. 6,718,281 inhab. INE - National census of populationand housing 1992, Page 8
Rate of population growth 2,35 INE - National census of Populationand Housing 1992
Population density 6,7 inhab /km2
Index of Human Development 0.593 Human development 1994
Birth Rate 4,6 INE - National census of populationand housing 1992
Mortality Rate 9,7 INE - National census of populationand housing 1992
Infant Mortality Rate (perthousand)
75 INE - National census of populationand housing 1992
Economically Active population 3,9 my inhab. INE - National census of populationand housing 1992
Population in extreme poverty(1992)Moderate poverty (1992)Threshold poverty (1992)
2,109,870 inhab. (36.8%)1,964,271 inhab. (33 %)787,907 inhab. (13.4 %)
Poverty Map, January 1995UDAPSO, INE, UPP,UDAPE.(Chart 1.1)
Life expectancy (years) 56.84 years 59.33 years INE - Population estimates andprojections 1950-2050, Pag 16,(Chart 8.)
Illiteracy Rate 20 % 21.92 % (1992) INE - National census of populationand housing 1992, Page 29. socio-demographic indicators by counties,INE 1995.
Relevant areas (km2)Arable landPermanent cultivationForestsOther land
20,400 km22,380 km2556,080 km2238,920 km2
22,000 km22,820 km2553,920 km2242,240 km2
Annual Production FAO Vol.471993, page 9, Chart 1.
GDP ($us 1990)T/C: 3.17 UDAPE, VOL.5p. 310, I chart 4.5.1
4,871,651 $us. 5,688,515 $us. Annual statistics for the RuralSector 1995-1996. P. 17, chart 1.
GDP PER CAPIT ($US. 1990) 0.788 $us. 0.846 $us. Own elaboration (based on GDPand population values).
Industry in GDP (%) 16.96 %16.74 %
Annual statistics 1995, INE, Pag171; chart 4.01.03.
Services in GDP (%) 14.49 % 13.72 % Annual statistics 1995, INE, Pag171; I square 4.01.03.
Agriculture in GDP (%) 15.35 % 15.18 % Annual statistics 1995, INE, Pag171; I square 4.01.03.
Ground used for agriculturepurposes (km2)
20,066 km2 Annual statistics for the Ruralsector. DRU 1994. pag 125, chart116.
Livestock population 5,543,385 animals 5,912,050 animals Annual statistics for the Ruralsector. DRU 1995-1996. pag 75,chart 20.
Forest area (km2) 549,684 km2 545,684 km2 Bolivian Forestry map -1995Annual deforestation rate 168.012 have Bolivia Forestry map - 1995CO2 emissions per capita 0.006 Gg/ person. PNCC - energy and non energy
sectors

CHAPTER II
NATIONAL GREENHOUSE GAS INVENTORY
SUMMARY
The greenhouse gas emissions and their removal for the year 1994 have beencalculated using the methodology published in 1996 by the Intergovernmental Panel ofClimate Change (IPCC) for the elaboration of GHG National Inventories.
The activities related to land use change and forestry, are the most important source ofgreenhouse gas emissions, contributing to the total CO2 emissions with 38.61 millions oftons. This is followed by the energy sector with 7.64 millions of tons of CO2 and theindustrial sector with 0.393 millions of tons of CO2.
Land use change and forestry are the major producers of carbon dioxide in Bolivia.These activities are mostly related to the transformation of forests and prairies and withthe increase of agricultural frontiers caused by spontaneous colonization. The CO2emissions related to the change in forests and other tree growing areas are 5.6 milliontons; the ones related to the transformation of forests and prairies to 32.98 million tonsand the emissions related to the abandonment of cultivated lands are 4.54 million tons.
In the energy sector, transport contributes to GHG emissions with 29.7% of the totalfollowed by the burning of gas in the exploitation fields (29.3%), the energy industries(18%), the manufacturing industry (10.7%) and the residential use of energy (9.1%).
The methane (CH4) emissions stands at a total of 0.653 million tons from which 0.089million tons correspond to the energy sector, 0.5 million to the agriculture sector(basically to the area of enteric fermentation) and 0.05 million tons to land use change.The nitrous oxide (N2O) emitted stands at 0.003 million tons, the carbon monoxide (CO)at 0.86 million tons, the nitrogen oxide (NOX) at 0.11 million tons and the volatileorganic compounds different from the methane (COVNM) at 0.06 million tons. Thesulphur dioxide (SO2) emitted reaches to 0.005 million tons and the hydro-fluorocarbonates (HFCs) to 0.00001 million tons.
C a r b o n D io x id e e m is s io n s ( G g ) - 1 9 9 4
- 5 .0 0 0 0 5 .0 0 0 1 0 .0 0 0 1 5 .0 0 0 2 0 .0 0 0 2 5 .0 0 0 3 0 .0 0 0 3 5 .0 0 0
C o m b u s t io n
E n e r g y In d ru s t r ie s
M a n u f a c t u r in g a n d c o n s t r u c t io n in d u s t r ie s
T r a n s p o r t
C o m m e r c ia l - I n s t it u t io n a l
R e s id e n t ia l
A g r ic u lt u re / F o r e s t r y / F is h in g
M in in g - M e ta r lu r g y
O th e rs
B u r n in g o f g a s in t h e e x p lo it a t io n f ie ld s
C h a n g e s in t r e e g r o w in g a r e a s
T r a n s f o r m a t io n o f fo r e s t a n d g r a s s la n d s
A b a n d o n m e n t o f c u lt iv a t e d f ie ld s
SECTORS

It is important to point out that the emissions related to international aviation are 0.17million tons of CO2. (international bunkers).
The following diagram summarizes all the components of the GHG emissions inventoryfor 1994.

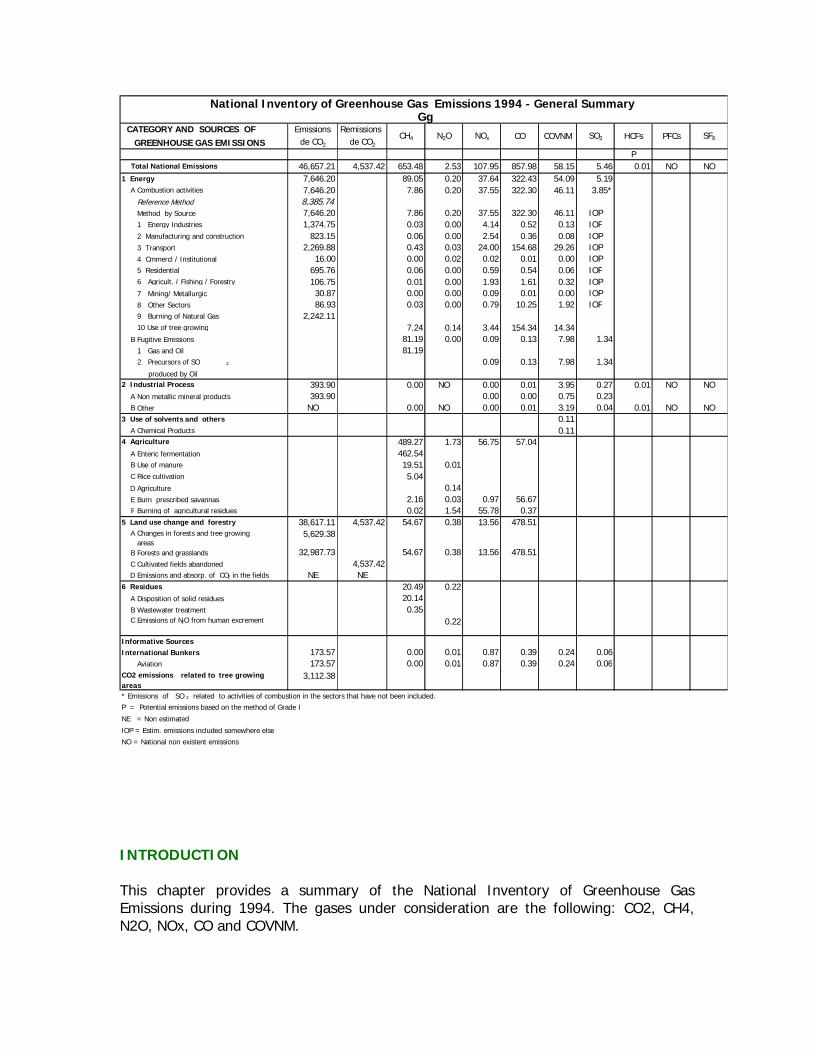
Emissions
de CO 2 Remissions
de CO2CH4 N2O NOx CO COVNM SO 2 HCFs PFCs SF6
P 46,657.21 4,537.42 653.48 2.53 107.95 857.98 58.15 5.46 0.01 NO NO7,646.20 89.05 0.20 37.64 322.43 54.09 5.19
A Combustion activities 7,646.20 7.86 0.20 37.55 322.30 46.11 3.85* Reference Method 8,385.74Method by Source 7,646.20 7.86 0.20 37.55 322.30 46.11 IOP 1 Energy Industries 1,374.75 0.03 0.00 4.14 0.52 0.13 IOP 2 Manufacturing and construction 823.15 0.06 0.00 2.54 0.36 0.08 IOP 3 Transport 2,269.88 0.43 0.03 24.00 154.68 29.26 IOP 4 Cmmercl / Institutional 16.00 0.00 0.02 0.02 0.01 0.00 IOP 5 Residential 695.76 0.06 0.00 0.59 0.54 0.06 IOP 6 Agricult. / Fishing / Forestry 106.75 0.01 0.00 1.93 1.61 0.32 IOP 7 Mining/ Metallurgic 30.87 0.00 0.00 0.09 0.01 0.00 IOP 8 Other Sectors 86.93 0.03 0.00 0.79 10.25 1.92 IOP 9 Burning of Natural Gas 2,242.1110 Use of tree growing 7.24 0.14 3.44 154.34 14.34
B Fugitive Emissions 81.19 0.00 0.09 0.13 7.98 1.34 1 Gas and Oil 81.192 Precursors of SO 2 0.09 0.13 7.98 1.34 produced by Oil
393.90 0.00 NO 0.00 0.01 3.95 0.27 0.01 NO NOA Non metallic mineral products 393.90 0.00 0.00 0.75 0.23 B Other NO 0.00 NO 0.00 0.01 3.19 0.04 0.01 NO NO
0.11 A Chemical Products 0.11
489.27 1.73 56.75 57.04A Enteric fermentation 462.54B Use of manure 19.51 0.01C Rice cultivation 5.04D Agriculture 0.14E Burn prescribed savannas 2.16 0.03 0.97 56.67F Burning of agricultural residues 0.02 1.54 55.78 0.37
38,617.11 4,537.42 54.67 0.38 13.56 478.51A Changes in forests and tree growing
areas 5,629.38
B Forests and grasslands 32,987.73 54.67 0.38 13.56 478.51C Cultivated fields abandoned 4,537.42D Emissions and absorp. of CO 2 in the fields NE NE
20.49 0.22A Disposition of solid residues 20.14B Wastewater treatment 0.35C Emissions of N 2 O from human excrement 0.22
Informative Sources International Bunkers 173.57 0.00 0.01 0.87 0.39 0.24 0.06
Aviation 173.57 0.00 0.01 0.87 0.39 0.24 0.06 3,112.38
* Emissions of SO 2 related to activities of combustion in the sectors that have not been included. P = Potential emissions based on the method of Grade I NE = Non estimated
IOP = Estim. emissions included somewhere else NO = National non existent emissions
National Inventory of Greenhouse Gas Emissions 1994 - General Summary Gg
2 Industrial Process
3 Use of solvents and others
Total National Emissions 1 Energy
CATEGORY AND SOURCES OF GREENHOUSE GAS EMISSIONS
6 Residues
CO2 emissions related to tree growing areas
4 Agriculture
5 Land use change and forestry
INTRODUCTION
This chapter provides a summary of the National Inventory of Greenhouse GasEmissions during 1994. The gases under consideration are the following: CO2, CH4,N2O, NOx, CO and COVNM.
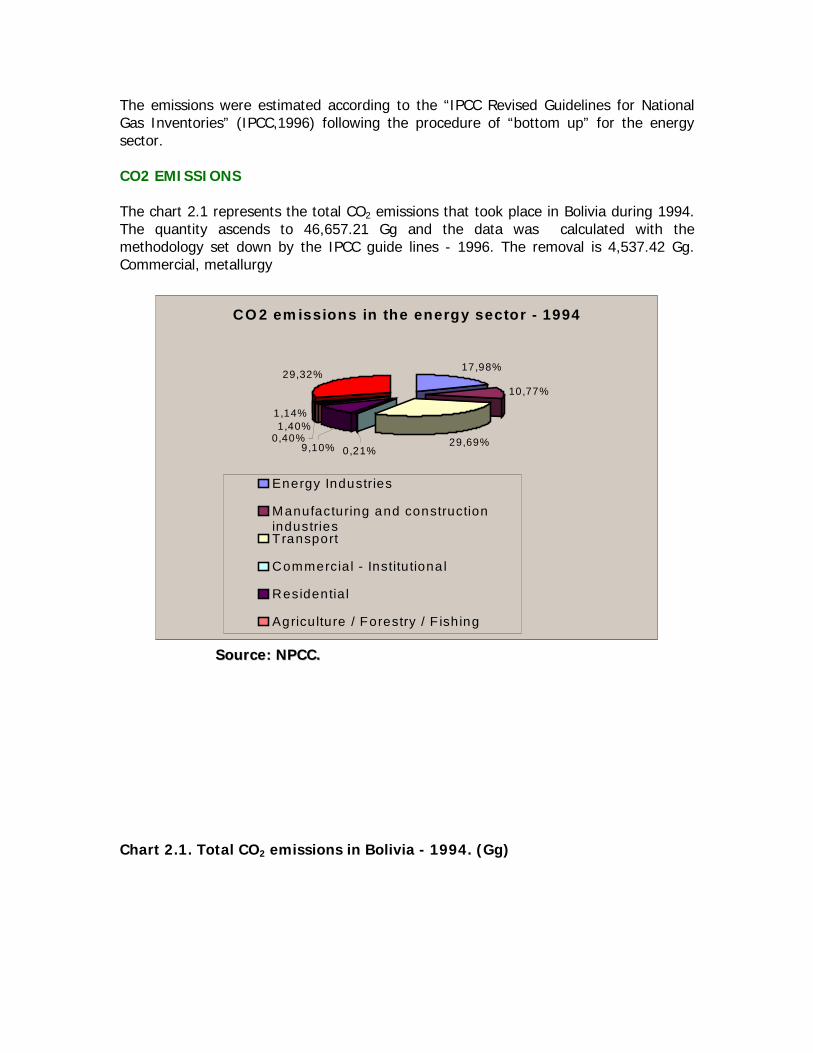
The emissions were estimated according to the “IPCC Revised Guidelines for NationalGas Inventories” (IPCC,1996) following the procedure of “bottom up” for the energysector.
CO2 EMISSIONS
The chart 2.1 represents the total CO2 emissions that took place in Bolivia during 1994.The quantity ascends to 46,657.21 Gg and the data was calculated with themethodology set down by the IPCC guide lines - 1996. The removal is 4,537.42 Gg.Commercial, metallurgy
CO 2 em issions in the energy sector - 1994
17,98%
10,77%
29,69%1,40%
29,32%
0,21%
1,14%
9,10%0,40%
Energy Industries
Manufacturing and constructionindustriesTransport
Commercia l - Institu tiona l
Residentia l
Agriculture / Forestry / F ishing
SSoouurrccee:: NNPPCCCC..
Chart 2.1. Total CO2 emissions in Bolivia - 1994. (Gg)

Sources CO21994
TOTAL ENERGY 7646,19Combustion Activities 7646,19Energy Industries 1374,75Manufacturing and construction industries 823,15Transport 2269,87Commercial - Institutional 16,00Residential 695,76Agriculture / forestry / fishing 106,75Mining / metalurgy 30,87Others 86,93Gas burning in the oil fields 2242,11Fugitive emissions 0,00Gas and oil 0,00Products used in the oil refining 0,00Mineral Carbon 0,00Industrial Process 393,90Mineral non metallic products 393,90Land use changes 38617,11Changes in the forest and other woody biomass 5629,38Conversion of forests and grasslands 32987,73Cultivated fields that are abandoned -4537,43TOTAL CO2 EMISSIONS 46657,20
CO2 emissions in the energy sector
The combustion of fossil fuels isthe second source of CO2
emissions in Bolivia. Theestimated emissions are based onthe energy balance provided bythe Vice-Ministry of Energy andHydrocarbons. The statisticalinformation has been provided bythe National Oil Company (YPFB)and by the National Company ofElectricity. Complementaryinformation has been supplied by
the Ministry of Economic Development, the National Police, General Customs, privateimport companies and the Air Administration Services (AASANA). The chart 2.2represents a summary of the energy balance for 1994 and the corresponding level ofcarbon dioxide emissions.
The chart 2.3 represents the emission factors (which were based on the IPCCrecommendations and in values which are characteristic of the country) used in the
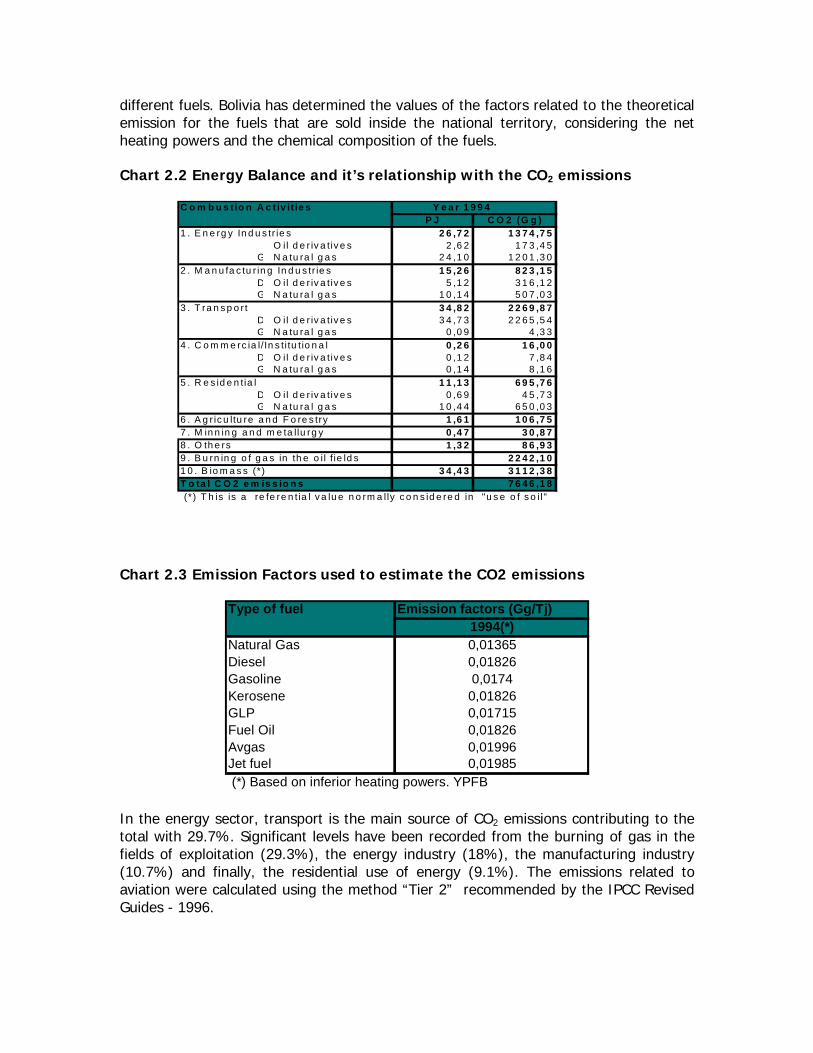
different fuels. Bolivia has determined the values of the factors related to the theoreticalemission for the fuels that are sold inside the national territory, considering the netheating powers and the chemical composition of the fuels.
Chart 2.2 Energy Balance and it’s relationship with the CO2 emissions
C o m b u s t io n A c t iv it ie s Y e a r 1 9 9 4P J C O 2 (G g )
1 . E n e rg y In d u s tr ie s 2 6 ,7 2 1 3 7 4 ,7 5 O i l d e r iv a tiv e s 2 ,6 2 1 7 3 ,4 5 G N a tu ra l g a s 2 4 ,1 0 1 2 0 1 ,3 02 . M a n u fa c tu r in g In d u s tr ie s 1 5 ,2 6 8 2 3 ,1 5 D O i l d e r iv a tiv e s 5 ,1 2 3 1 6 ,1 2 G N a tu ra l g a s 1 0 ,1 4 5 0 7 ,0 33 . T ra n s p o r t 3 4 ,8 2 2 2 6 9 ,8 7 D O i l d e r iv a tiv e s 3 4 ,7 3 2 2 6 5 ,5 4 G N a tu ra l g a s 0 ,0 9 4 ,3 34 . C o m m e rc ia l/ In s ti tu t io n a l 0 ,2 6 1 6 ,0 0 D O i l d e r iv a tiv e s 0 ,1 2 7 ,8 4 G N a tu ra l g a s 0 ,1 4 8 ,1 65 . R e s id e n tia l 1 1 ,1 3 6 9 5 ,7 6 D O i l d e r iv a tiv e s 0 ,6 9 4 5 ,7 3 G N a tu ra l g a s 1 0 ,4 4 6 5 0 ,0 36 . A g r ic u ltu re a n d F o re s try 1 ,6 1 1 0 6 ,7 57 . M in n in g a n d m e ta llu rg y 0 ,4 7 3 0 ,8 78 . O th e rs 1 ,3 2 8 6 ,9 39 . B u rn in g o f g a s in th e o i l f ie ld s 2 2 4 2 ,1 01 0 . B io m a s s (* ) 3 4 ,4 3 3 1 1 2 ,3 8T o ta l C O 2 e m is s io n s 7 6 4 6 ,1 8 (* ) T h is is a re fe re n tia l v a lu e n o rm a l ly c o n s id e re d in "u s e o f s o i l"
Chart 2.3 Emission Factors used to estimate the CO2 emissions
Type of fuel Emission factors (Gg/Tj)1994(*)
Natural Gas 0,01365Diesel 0,01826Gasoline 0,0174Kerosene 0,01826GLP 0,01715Fuel Oil 0,01826Avgas 0,01996Jet fuel 0,01985 (*) Based on inferior heating powers. YPFB
In the energy sector, transport is the main source of CO2 emissions contributing to thetotal with 29.7%. Significant levels have been recorded from the burning of gas in thefields of exploitation (29.3%), the energy industry (18%), the manufacturing industry(10.7%) and finally, the residential use of energy (9.1%). The emissions related toaviation were calculated using the method “Tier 2” recommended by the IPCC RevisedGuides - 1996.
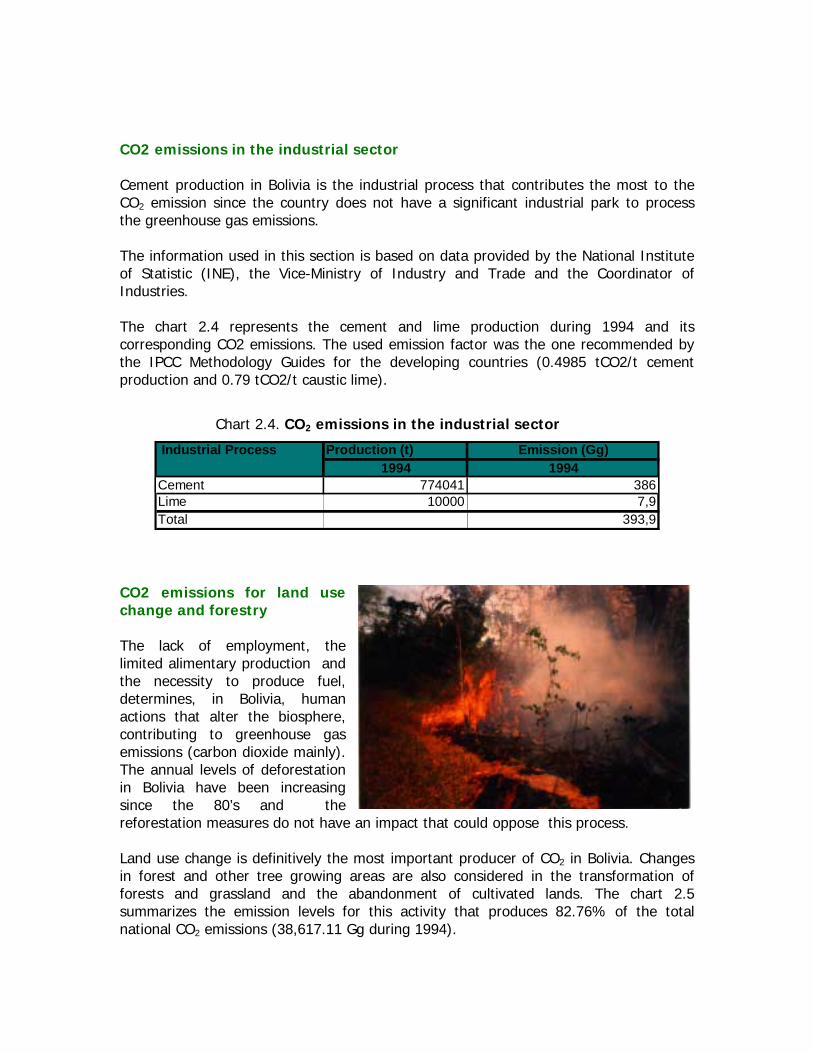
CO2 emissions in the industrial sector
Cement production in Bolivia is the industrial process that contributes the most to theCO2 emission since the country does not have a significant industrial park to processthe greenhouse gas emissions.
The information used in this section is based on data provided by the National Instituteof Statistic (INE), the Vice-Ministry of Industry and Trade and the Coordinator ofIndustries.
The chart 2.4 represents the cement and lime production during 1994 and itscorresponding CO2 emissions. The used emission factor was the one recommended bythe IPCC Methodology Guides for the developing countries (0.4985 tCO2/t cementproduction and 0.79 tCO2/t caustic lime).
Chart 2.4. CO2 emissions in the industrial sector
Industrial Process Production (t) Emission (Gg)1994 1994
Cement 774041 386Lime 10000 7,9Total 393,9
CO2 emissions for land usechange and forestry
The lack of employment, thelimited alimentary production andthe necessity to produce fuel,determines, in Bolivia, humanactions that alter the biosphere,contributing to greenhouse gasemissions (carbon dioxide mainly).The annual levels of deforestationin Bolivia have been increasingsince the 80’s and thereforestation measures do not have an impact that could oppose this process.
Land use change is definitively the most important producer of CO2 in Bolivia. Changesin forest and other tree growing areas are also considered in the transformation offorests and grassland and the abandonment of cultivated lands. The chart 2.5summarizes the emission levels for this activity that produces 82.76% of the totalnational CO2 emissions (38,617.11 Gg during 1994).
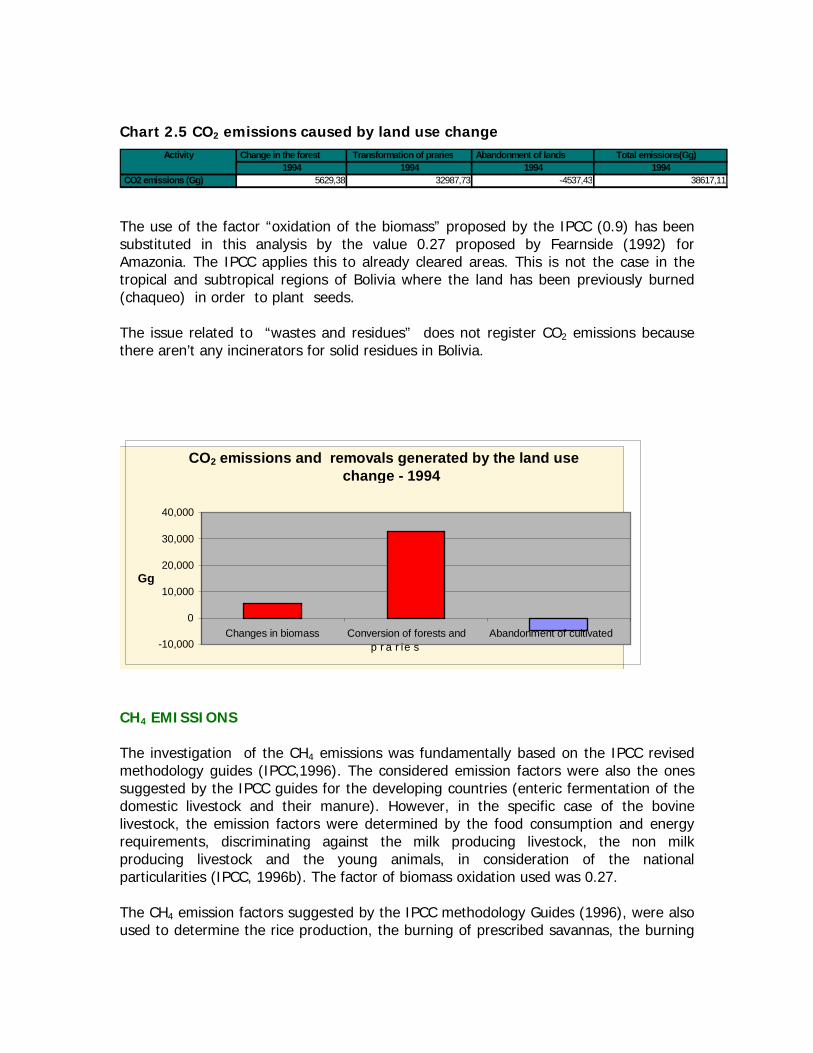
Chart 2.5 CO2 emissions caused by land use changeActivity Change in the forest Transformation of praries Abandonment of lands Total emissions(Gg)
1994 1994 1994 1994 CO2 emissions (Gg) 5629,38 32987,73 -4537,43 38617,11
The use of the factor “oxidation of the biomass” proposed by the IPCC (0.9) has beensubstituted in this analysis by the value 0.27 proposed by Fearnside (1992) forAmazonia. The IPCC applies this to already cleared areas. This is not the case in thetropical and subtropical regions of Bolivia where the land has been previously burned(chaqueo) in order to plant seeds.
The issue related to “wastes and residues” does not register CO2 emissions becausethere aren’t any incinerators for solid residues in Bolivia.
CH4 EMISSIONS
The investigation of the CH4 emissions was fundamentally based on the IPCC revisedmethodology guides (IPCC,1996). The considered emission factors were also the onessuggested by the IPCC guides for the developing countries (enteric fermentation of thedomestic livestock and their manure). However, in the specific case of the bovinelivestock, the emission factors were determined by the food consumption and energyrequirements, discriminating against the milk producing livestock, the non milkproducing livestock and the young animals, in consideration of the nationalparticularities (IPCC, 1996b). The factor of biomass oxidation used was 0.27.
The CH4 emission factors suggested by the IPCC methodology Guides (1996), were alsoused to determine the rice production, the burning of prescribed savannas, the burning
CO2 emissions and removals generated by the land use
change - 1994
-10,000
0
10,000
20,000
30,000
40,000
Changes in biomass Conversion of forests andp r a r ie s
Abandonment of cultivated
Gg
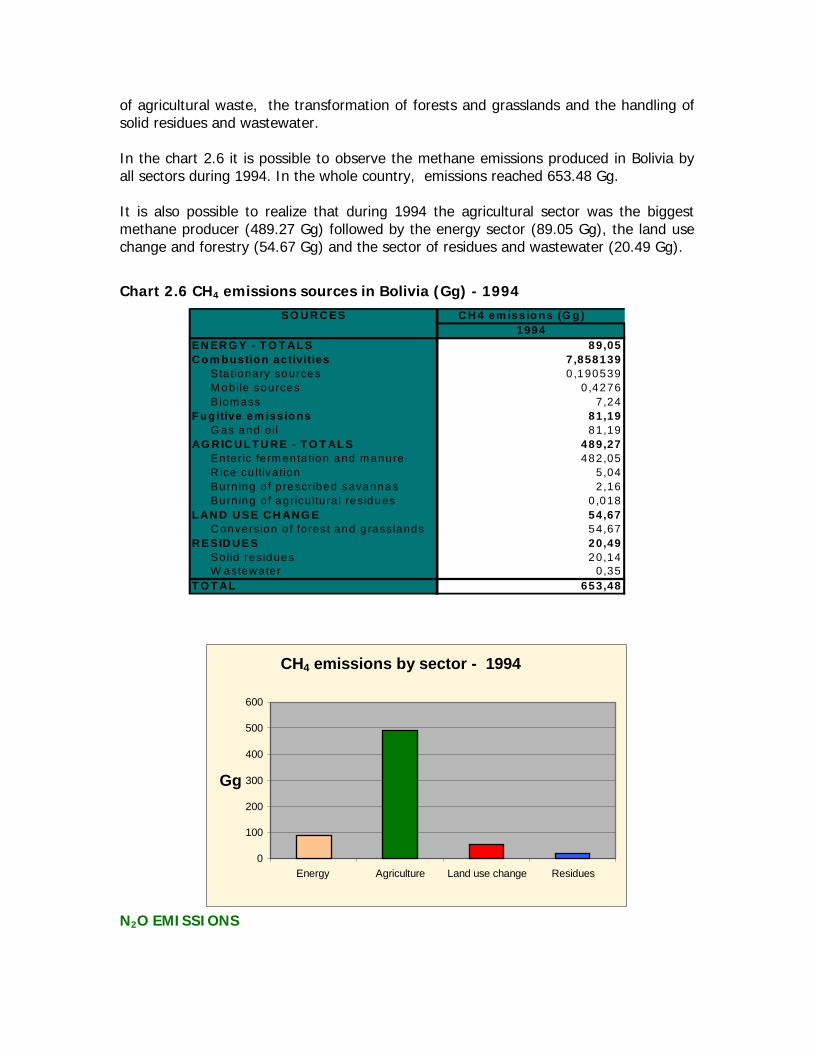
of agricultural waste, the transformation of forests and grasslands and the handling ofsolid residues and wastewater.
In the chart 2.6 it is possible to observe the methane emissions produced in Bolivia byall sectors during 1994. In the whole country, emissions reached 653.48 Gg.
It is also possible to realize that during 1994 the agricultural sector was the biggestmethane producer (489.27 Gg) followed by the energy sector (89.05 Gg), the land usechange and forestry (54.67 Gg) and the sector of residues and wastewater (20.49 Gg).
Chart 2.6 CH4 emissions sources in Bolivia (Gg) - 1994SO U R C ES C H 4 em iss io ns (G g )
1994EN ER G Y - T O T AL S 89,05C o m b ustio n activities 7 ,858139 S ta tionary sources 0 ,190539 M obile sources 0 ,4276 B iomass 7,24F ugitive em iss io ns 81,19 G as and o il 81,19AG R IC U L T U R E - T O T AL S 489,27 Enteric fe rmenta tion and manure 482,05 R ice cu ltivation 5,04 Burn ing o f p rescribed savannas 2,16 Burn ing o f agricu ltura l residues 0 ,018L AN D U SE C H AN G E 54,67 C onversion o f forest and g rasslands 54,67R ESID U ES 20,49 Solid res idues 20,14 W astewater 0,35T O T AL 653,48
N2O EMISSIONS
CH4 emissions by sector - 1994
0 100 200 300
400 500 600
Energy Agriculture Land use change Residues
Gg
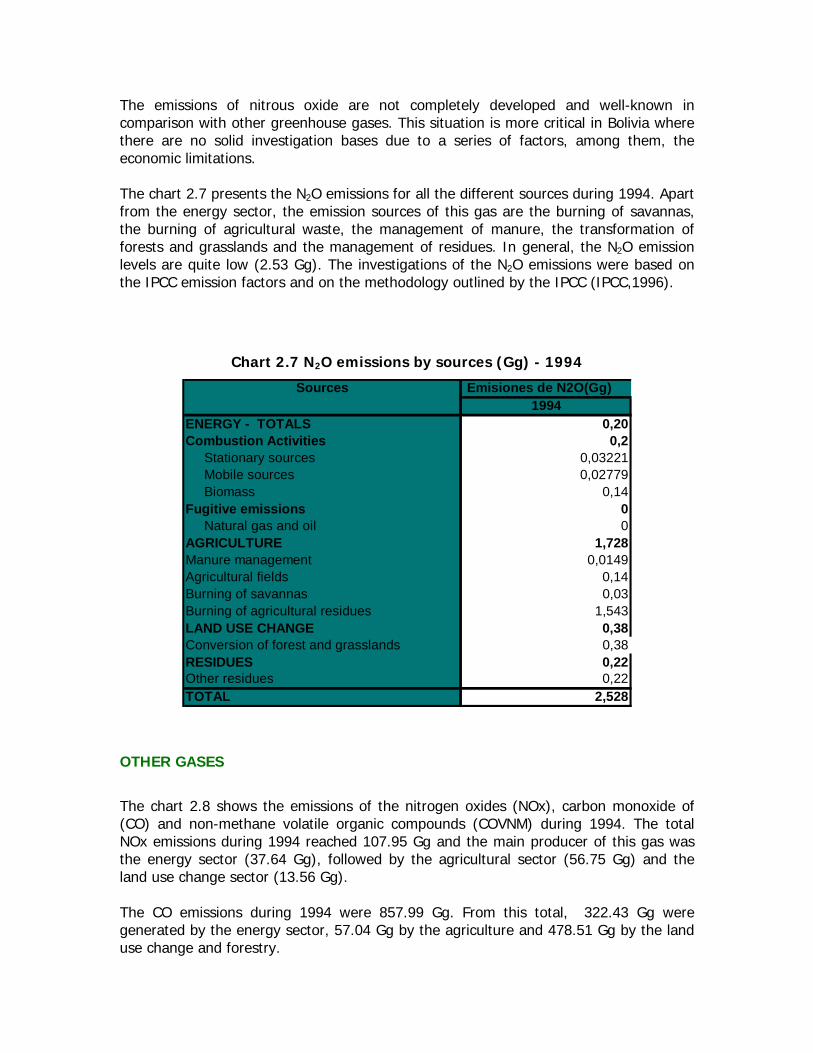
The emissions of nitrous oxide are not completely developed and well-known incomparison with other greenhouse gases. This situation is more critical in Bolivia wherethere are no solid investigation bases due to a series of factors, among them, theeconomic limitations.
The chart 2.7 presents the N2O emissions for all the different sources during 1994. Apartfrom the energy sector, the emission sources of this gas are the burning of savannas,the burning of agricultural waste, the management of manure, the transformation offorests and grasslands and the management of residues. In general, the N2O emissionlevels are quite low (2.53 Gg). The investigations of the N2O emissions were based onthe IPCC emission factors and on the methodology outlined by the IPCC (IPCC,1996).
Chart 2.7 N2O emissions by sources (Gg) - 1994
Sources Emisiones de N2O(Gg)1994
ENERGY - TOTALS 0,20Combustion Activities 0,2 Stationary sources 0,03221 Mobile sources 0,02779 Biomass 0,14Fugitive emissions 0 Natural gas and oil 0AGRICULTURE 1,728Manure management 0,0149Agricultural fields 0,14Burning of savannas 0,03Burning of agricultural residues 1,543LAND USE CHANGE 0,38Conversion of forest and grasslands 0,38RESIDUES 0,22Other residues 0,22TOTAL 2,528
OTHER GASES
The chart 2.8 shows the emissions of the nitrogen oxides (NOx), carbon monoxide of(CO) and non-methane volatile organic compounds (COVNM) during 1994. The totalNOx emissions during 1994 reached 107.95 Gg and the main producer of this gas wasthe energy sector (37.64 Gg), followed by the agricultural sector (56.75 Gg) and theland use change sector (13.56 Gg).
The CO emissions during 1994 were 857.99 Gg. From this total, 322.43 Gg weregenerated by the energy sector, 57.04 Gg by the agriculture and 478.51 Gg by the landuse change and forestry.
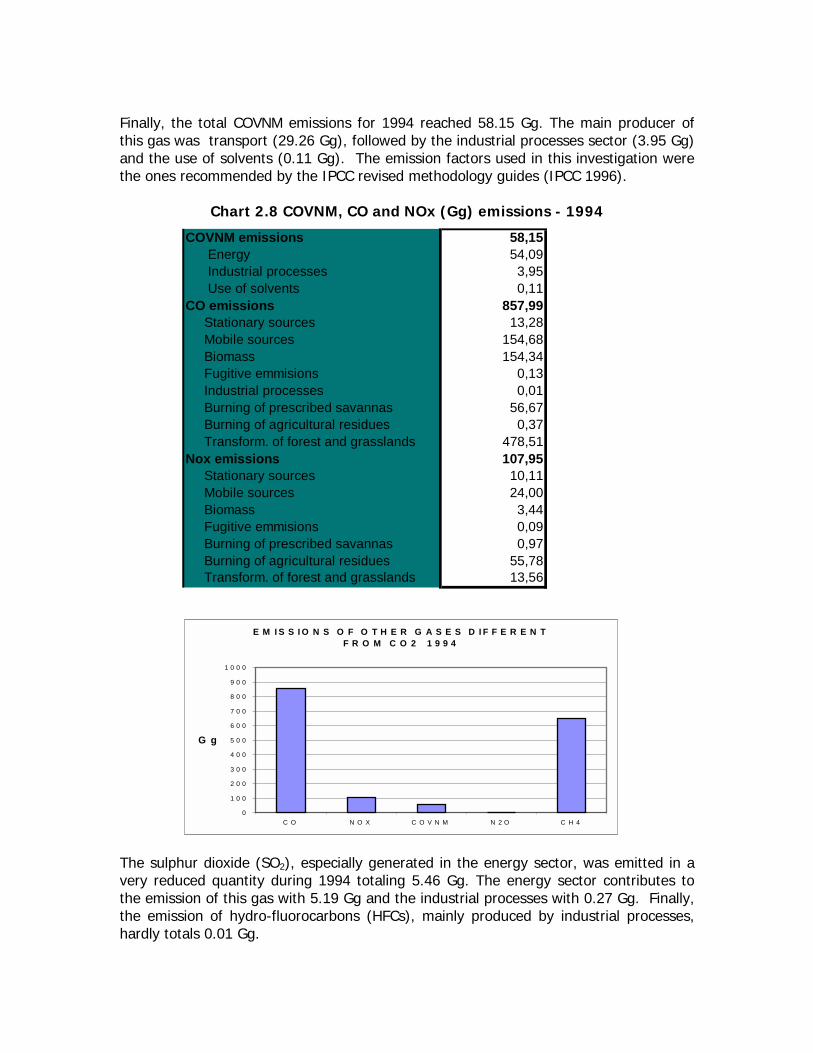
Finally, the total COVNM emissions for 1994 reached 58.15 Gg. The main producer ofthis gas was transport (29.26 Gg), followed by the industrial processes sector (3.95 Gg)and the use of solvents (0.11 Gg). The emission factors used in this investigation werethe ones recommended by the IPCC revised methodology guides (IPCC 1996).
Chart 2.8 COVNM, CO and NOx (Gg) emissions - 1994
COVNM emissions 58,15 Energy 54,09 Industrial processes 3,95 Use of solvents 0,11CO emissions 857,99 Stationary sources 13,28 Mobile sources 154,68 Biomass 154,34 Fugitive emmisions 0,13 Industrial processes 0,01 Burning of prescribed savannas 56,67 Burning of agricultural residues 0,37 Transform. of forest and grasslands 478,51Nox emissions 107,95 Stationary sources 10,11 Mobile sources 24,00 Biomass 3,44 Fugitive emmisions 0,09 Burning of prescribed savannas 0,97 Burning of agricultural residues 55,78 Transform. of forest and grasslands 13,56
The sulphur dioxide (SO2), especially generated in the energy sector, was emitted in avery reduced quantity during 1994 totaling 5.46 Gg. The energy sector contributes tothe emission of this gas with 5.19 Gg and the industrial processes with 0.27 Gg. Finally,the emission of hydro-fluorocarbons (HFCs), mainly produced by industrial processes,hardly totals 0.01 Gg.
E M I S S I O N S O F O T H E R G A S E S D I F F E R E N T F R O M C O 2 1 9 9 4
0
1 0 0
2 0 0
3 0 0
4 0 0
5 0 0
6 0 0
7 0 0
8 0 0
9 0 0
1 0 0 0
C O N O X C O V N M N 2 O C H 4
G g
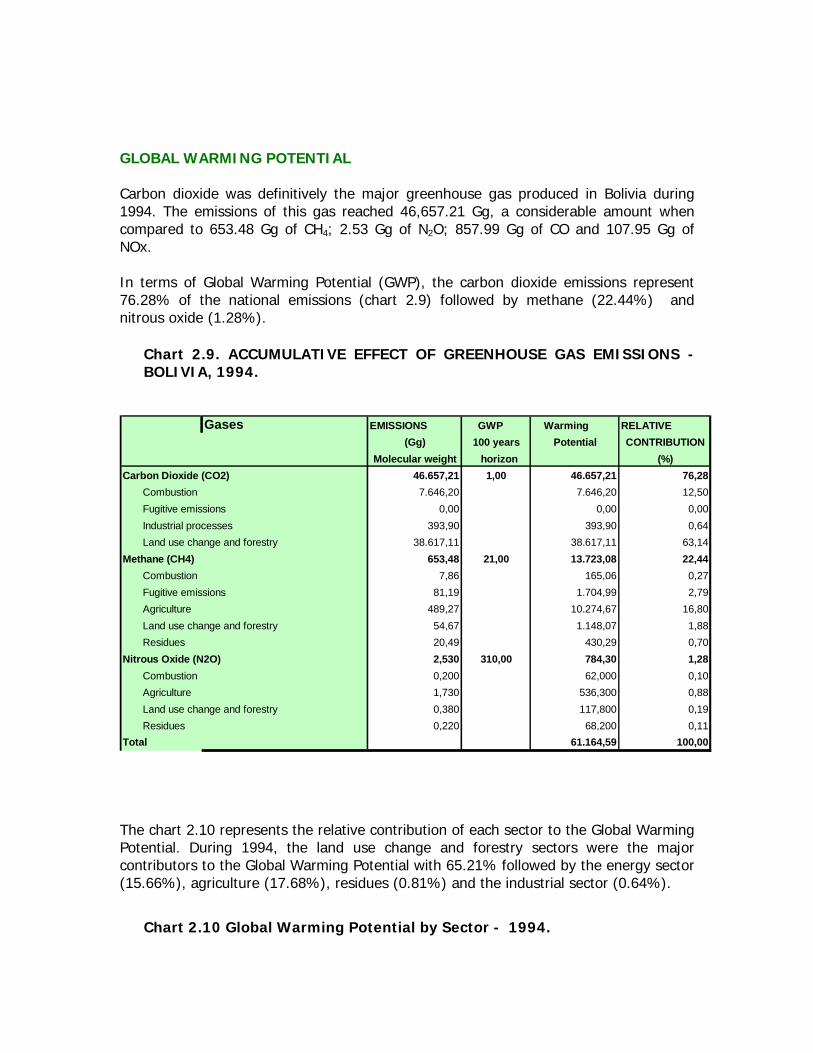
GLOBAL WARMING POTENTIAL
Carbon dioxide was definitively the major greenhouse gas produced in Bolivia during1994. The emissions of this gas reached 46,657.21 Gg, a considerable amount whencompared to 653.48 Gg of CH4; 2.53 Gg of N2O; 857.99 Gg of CO and 107.95 Gg ofNOx.
In terms of Global Warming Potential (GWP), the carbon dioxide emissions represent76.28% of the national emissions (chart 2.9) followed by methane (22.44%) andnitrous oxide (1.28%).
Chart 2.9. ACCUMULATIVE EFFECT OF GREENHOUSE GAS EMISSIONS -BOLIVIA, 1994.
Gases EMISSIONS GWP Warming RELATIVE(Gg) 100 years Potential CONTRIBUTION
Molecular weight horizon (%)Carbon Dioxide (CO2) 46.657,21 1,00 46.657,21 76,28 Combustion 7.646,20 7.646,20 12,50 Fugitive emissions 0,00 0,00 0,00 Industrial processes 393,90 393,90 0,64 Land use change and forestry 38.617,11 38.617,11 63,14Methane (CH4) 653,48 21,00 13.723,08 22,44 Combustion 7,86 165,06 0,27 Fugitive emissions 81,19 1.704,99 2,79 Agriculture 489,27 10.274,67 16,80 Land use change and forestry 54,67 1.148,07 1,88 Residues 20,49 430,29 0,70Nitrous Oxide (N2O) 2,530 310,00 784,30 1,28 Combustion 0,200 62,000 0,10 Agriculture 1,730 536,300 0,88 Land use change and forestry 0,380 117,800 0,19 Residues 0,220 68,200 0,11Total 61.164,59 100,00
The chart 2.10 represents the relative contribution of each sector to the Global WarmingPotential. During 1994, the land use change and forestry sectors were the majorcontributors to the Global Warming Potential with 65.21% followed by the energy sector(15.66%), agriculture (17.68%), residues (0.81%) and the industrial sector (0.64%).
Chart 2.10 Global Warming Potential by Sector - 1994.
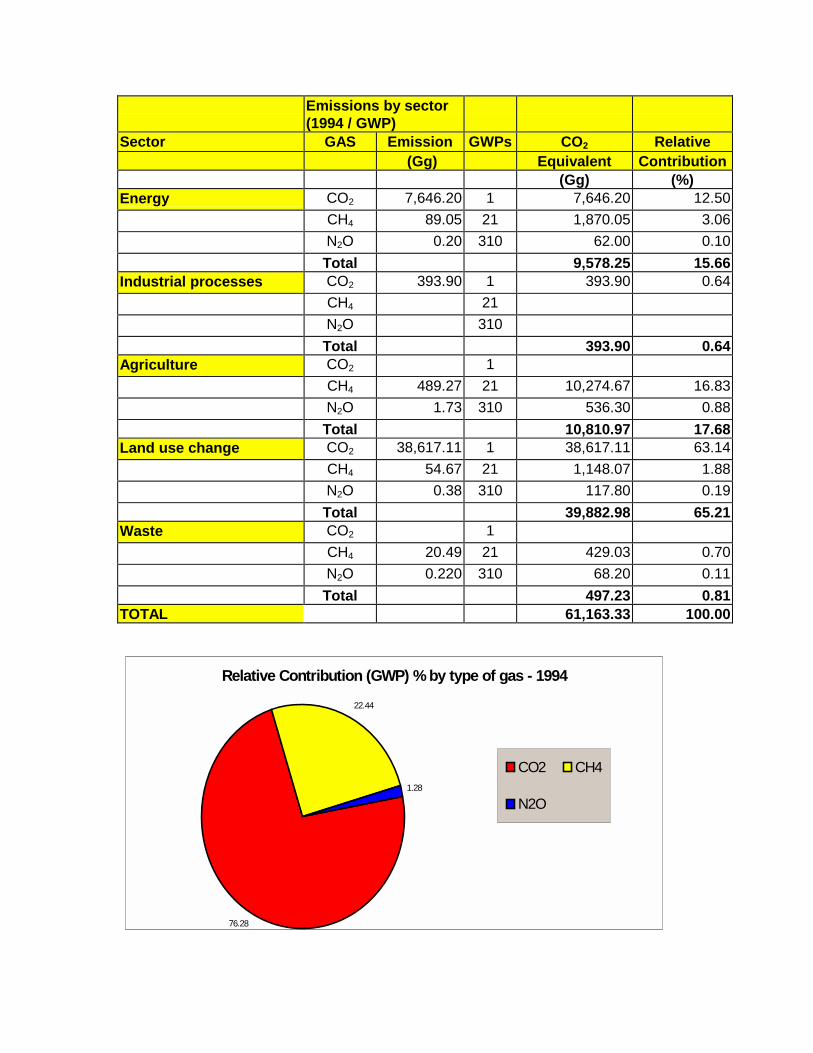
Emissions by sector(1994 / GWP)
Sector GAS Emission GWPs CO2 Relative (Gg) Equivalent Contribution
(Gg) (%)Energy CO2 7,646.20 1 7,646.20 12.50
CH4 89.05 21 1,870.05 3.06N2O 0.20 310 62.00 0.10Total 9,578.25 15.66
Industrial processes CO2 393.90 1 393.90 0.64CH4 21N2O 310Total 393.90 0.64
Agriculture CO2 1CH4 489.27 21 10,274.67 16.83N2O 1.73 310 536.30 0.88Total 10,810.97 17.68
Land use change CO2 38,617.11 1 38,617.11 63.14CH4 54.67 21 1,148.07 1.88N2O 0.38 310 117.80 0.19Total 39,882.98 65.21
Waste CO2 1CH4 20.49 21 429.03 0.70N2O 0.220 310 68.20 0.11Total 497.23 0.81
TOTAL 61,163.33 100.00
Relative Contribution (GWP) % by type of gas - 1994
76.28
1.28
22.44
CO2 CH4
N2O
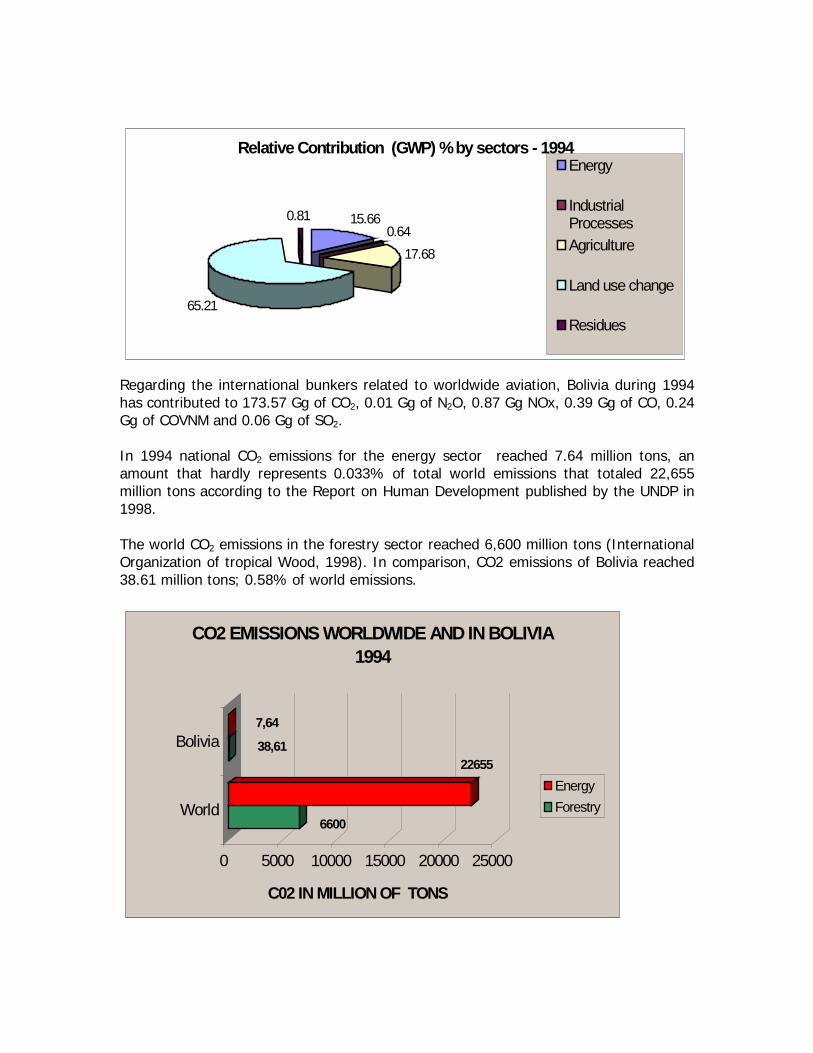
Relative Contribution (GWP) % by sectors - 1994
65.21
17.680.64
15.660.81
Energy
IndustrialProcessesAgriculture
Land use change
Residues
Regarding the international bunkers related to worldwide aviation, Bolivia during 1994has contributed to 173.57 Gg of CO2, 0.01 Gg of N2O, 0.87 Gg NOx, 0.39 Gg of CO, 0.24Gg of COVNM and 0.06 Gg of SO2.
In 1994 national CO2 emissions for the energy sector reached 7.64 million tons, anamount that hardly represents 0.033% of total world emissions that totaled 22,655million tons according to the Report on Human Development published by the UNDP in1998.
The world CO2 emissions in the forestry sector reached 6,600 million tons (InternationalOrganization of tropical Wood, 1998). In comparison, CO2 emissions of Bolivia reached38.61 million tons; 0.58% of world emissions.
6600
2265538,61
7,64
0 5000 10000 15000 20000 25000
C02 IN MILLION OF TONS
World
Bolivia
CO2 EMISSIONS WORLDWIDE AND IN BOLIVIA 1994
EnergyForestry
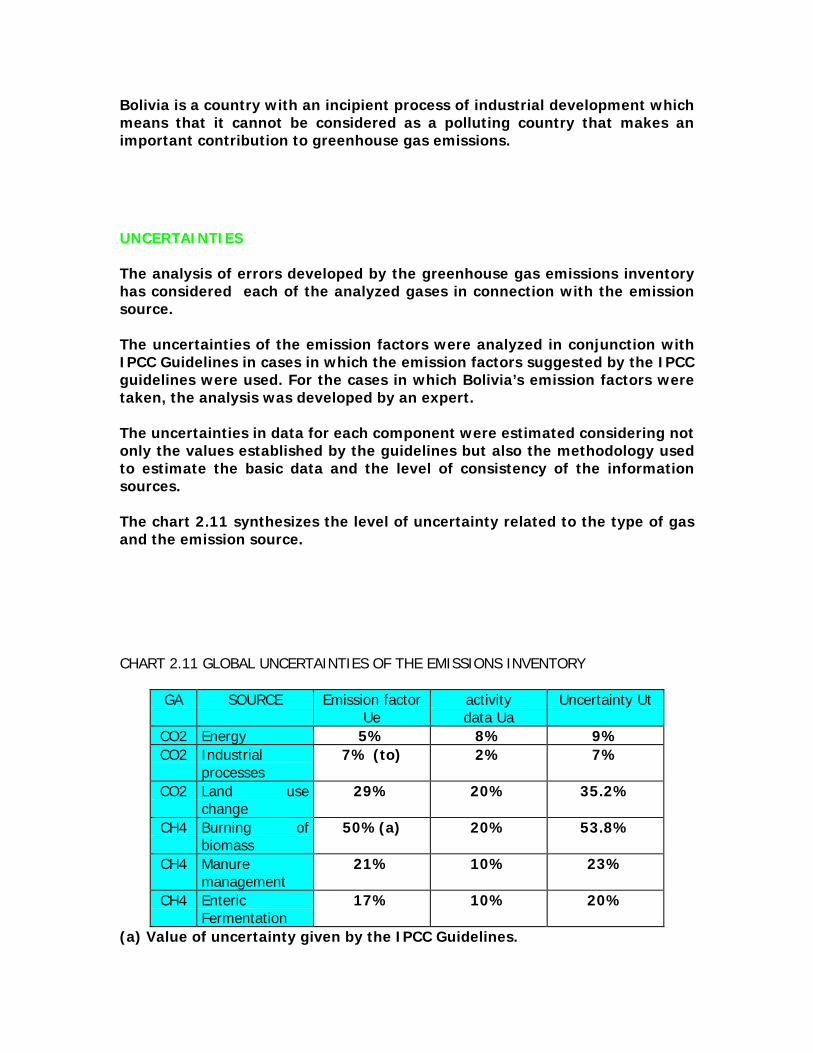
Bolivia is a country with an incipient process of industrial development whichmeans that it cannot be considered as a polluting country that makes animportant contribution to greenhouse gas emissions.
UNCERTAINTIES
The analysis of errors developed by the greenhouse gas emissions inventoryhas considered each of the analyzed gases in connection with the emissionsource.
The uncertainties of the emission factors were analyzed in conjunction withIPCC Guidelines in cases in which the emission factors suggested by the IPCCguidelines were used. For the cases in which Bolivia’s emission factors weretaken, the analysis was developed by an expert.
The uncertainties in data for each component were estimated considering notonly the values established by the guidelines but also the methodology usedto estimate the basic data and the level of consistency of the informationsources.
The chart 2.11 synthesizes the level of uncertainty related to the type of gasand the emission source.
CHART 2.11 GLOBAL UNCERTAINTIES OF THE EMISSIONS INVENTORY
GA SOURCE Emission factorUe
activitydata Ua
Uncertainty Ut
CO2 Energy 5% 8% 9%CO2 Industrial
processes7% (to) 2% 7%
CO2 Land usechange
29% 20% 35.2%
CH4 Burning ofbiomass
50%(a) 20% 53.8%
CH4 Manuremanagement
21% 10% 23%
CH4 EntericFermentation
17% 10% 20%
(a) Value of uncertainty given by the IPCC Guidelines.

CHAPTER III
VULNERABILITY AND ADAPTATION
The analysis of the ecosystem’s vulnerability to climate change is a very important issue,especially in highly exposed countries like Bolivia. The analysis of vulnerability andadaptation allows, amongst other things, to outline different options in order to face theimplications of climate change and to quantify them in investment terms.
The identification of adaptation measures also provides the possibility to categorize andto evaluate technologies, practices and politics in order to face climate change. Theintegration of climate changes in the socio-economic development and in the handling ofgovernmental and no-governmental programs is another advantage of this work.
During the last years, vulnerability studies were developed in Bolivia in different topics:agriculture, water resources, forests, cattle raising, pastures and human health. Theseanalyses were accomplished through the elaboration of regional climate and changescenarios based on economic tendencies.
Climate scenarios
The development of studies related to the impact of climate change makes it necessaryto create space and temporal representations of the future climate. Theserepresentations are the denominated climate change scenarios which should not beunderstood as a kind of weather forecast but as circumstances used to establishtendencies and approaches.
The use of General Circulation Models (GCM) have certain limitations basically related tothe space resolution of the grids on which the simulations are carried out.
A first study carried out in Bolivia (PNCC, 1997) analyzed the General Circulation Models(MGC) that could approach better climate conditions of the country. The data providedby the GCM (1xCO2) for the main hydrographic basins of the country (Amazon, del Plataand Altiplánica) was compared with a series of 20 to 30 years obtained in 28meteorological stations. The results showed that the GISS (Goddard Institute SpaceStudies) and to the UK89 (United Kingdom) were the General Circulation Models withthe best adaptation conditions (graphic 3.1).
The initial results showed, in average terms, that the future climate scenario, in theeventuality of a doubling of the carbonic anhydride (2xCO2) would produce increases inthe temperature of among 1 to 4ºC and precipitation changes that, in some cases,would imply a decrease of 15% and in others an increase of 20%.
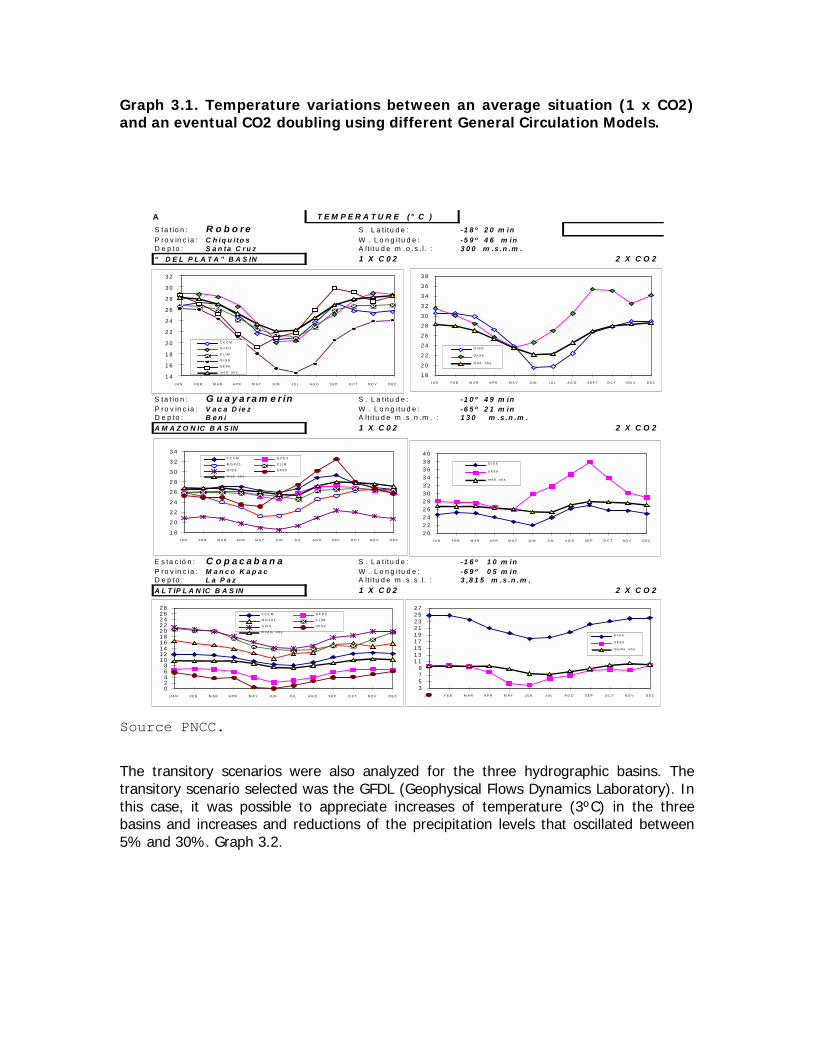
Graph 3.1. Temperature variations between an average situation (1 x CO2)and an eventual CO2 doubling using different General Circulation Models.
A T E M P E R A T U R E ( ° C ) S ta t io n : R o b o r e S . L a t itu d e : - 1 8 º 2 0 m in P ro v in c ia : C h iq u i to s W . L o n g itu d e : - 5 9 º 4 6 m inD e p to : S a n ta C r u z A lt i tu d e m .o .s . l . : 3 0 0 m .s .n .m .“ D E L P L A T A ” B A S IN 1 X C 0 2 2 X C O 2
S ta t io n : G u a y a r a m e r in S . L a t itu d e : - 1 0 º 4 9 m inP ro v in c ia : V a c a D ie z W . L o n g itu d e : - 6 5 º 2 1 m inD e p to : B e n i A lt i tu d e m .s .n .m . : 1 3 0 m .s .n .m .A M A Z O N IC B A S IN 1 X C 0 2 2 X C O 2
E s ta c ió n : C o p a c a b a n a S . L a t itu d e : - 1 6 º 1 0 m inP ro v in c ia : M a n c o K a p a c W . L o n g itu d e : - 6 9 º 0 5 m inD e p to : L a P a z A lt i tu d e m .s .s . l . : 3 ,8 1 5 m .s .n .m .A L T IP L A N IC B A S IN 1 X C 0 2 2 X C O 2
1 8
2 0
2 2
2 4
2 6
2 8
3 0
3 2
3 4
3 6
3 8
J A N F E B M A R A P R M A Y J UN J U L A G O S E P T O C T N O V D E C
G IS S
U K 8 9
m e d . o b s .
1 4 1 6 1 8 2 0 2 2 2 4 2 6 2 8 3 0 3 2
J A N F E B M A R A P R M A Y J U N J U L A G O S E P O C T N O V D E C
C C C M G F D 3 C L IM G I S S U K 8 9 m e d . o b s .
1 8 2 0 2 2 2 4 2 6 2 8 3 0 3 2 3 4
J A N F E B M A R A P R M A Y J U N J U L A G O S E P O C T N O V D E C
C C C M G F D 3 M G F 0 1 C L IM G IS S U K 8 9 m e d . o b s .
2 02 22 42 62 83 03 23 43 63 84 0
J A N F E B M A R A P R M A Y J U N J U L A G O S E P O C T N O V D E C
G IS S
U K 8 9
m e d . o b s .
3579
1 11 31 51 71 92 12 32 52 7
J A N F E B M A R A P R M A Y J U N J U L A G O S E P O C T N O V D E C
G IS S U K 8 9 m e d ia o b s .
0 2 4 6 8
1 0 1 2 1 4 1 6 1 8 2 0 2 2 2 4 2 6 2 8
jJ A N F E B M A R A P R M A Y J U N J U L A G O S E P O C T N O V D E C
C C C M G F D 3 M G F 0 1 C L IM G IS S U K 8 9 m e d ia o b s .
Source PNCC.
The transitory scenarios were also analyzed for the three hydrographic basins. Thetransitory scenario selected was the GFDL (Geophysical Flows Dynamics Laboratory). Inthis case, it was possible to appreciate increases of temperature (3ºC) in the threebasins and increases and reductions of the precipitation levels that oscillated between5% and 30%. Graph 3.2.
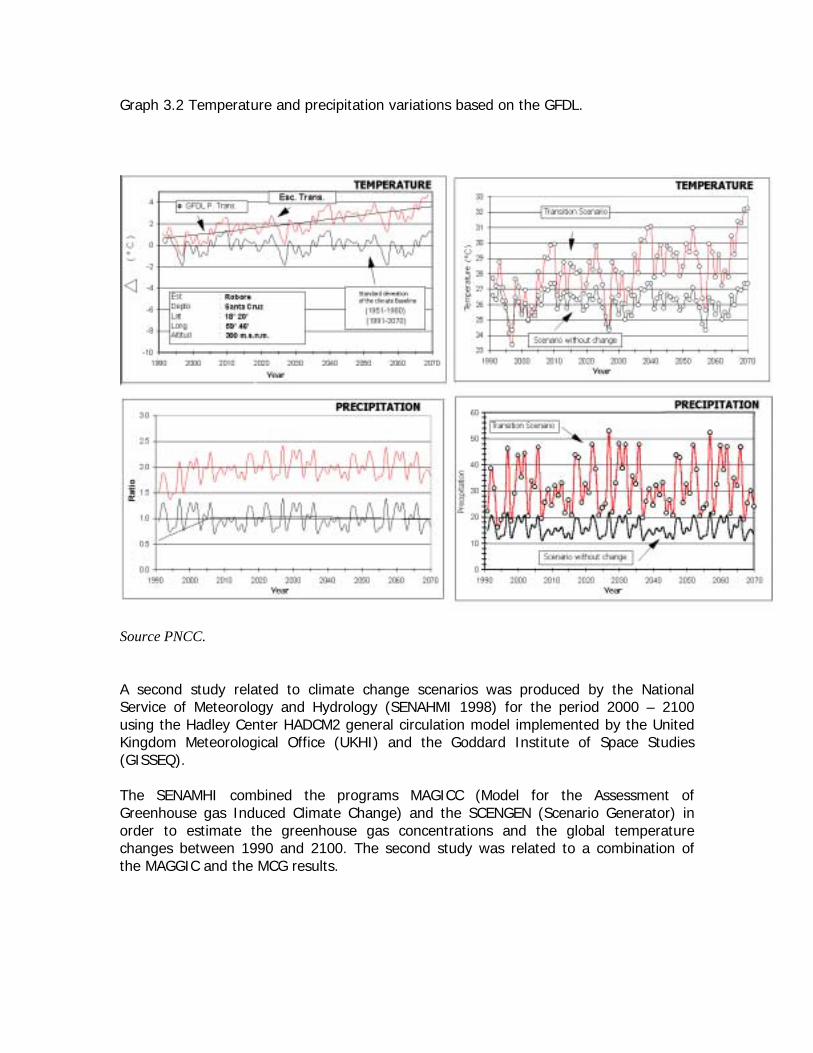
Graph 3.2 Temperature and precipitation variations based on the GFDL.
Source PNCC.
A second study related to climate change scenarios was produced by the NationalService of Meteorology and Hydrology (SENAHMI 1998) for the period 2000 – 2100using the Hadley Center HADCM2 general circulation model implemented by the UnitedKingdom Meteorological Office (UKHI) and the Goddard Institute of Space Studies(GISSEQ).
The SENAMHI combined the programs MAGICC (Model for the Assessment ofGreenhouse gas Induced Climate Change) and the SCENGEN (Scenario Generator) inorder to estimate the greenhouse gas concentrations and the global temperaturechanges between 1990 and 2100. The second study was related to a combination ofthe MAGGIC and the MCG results.
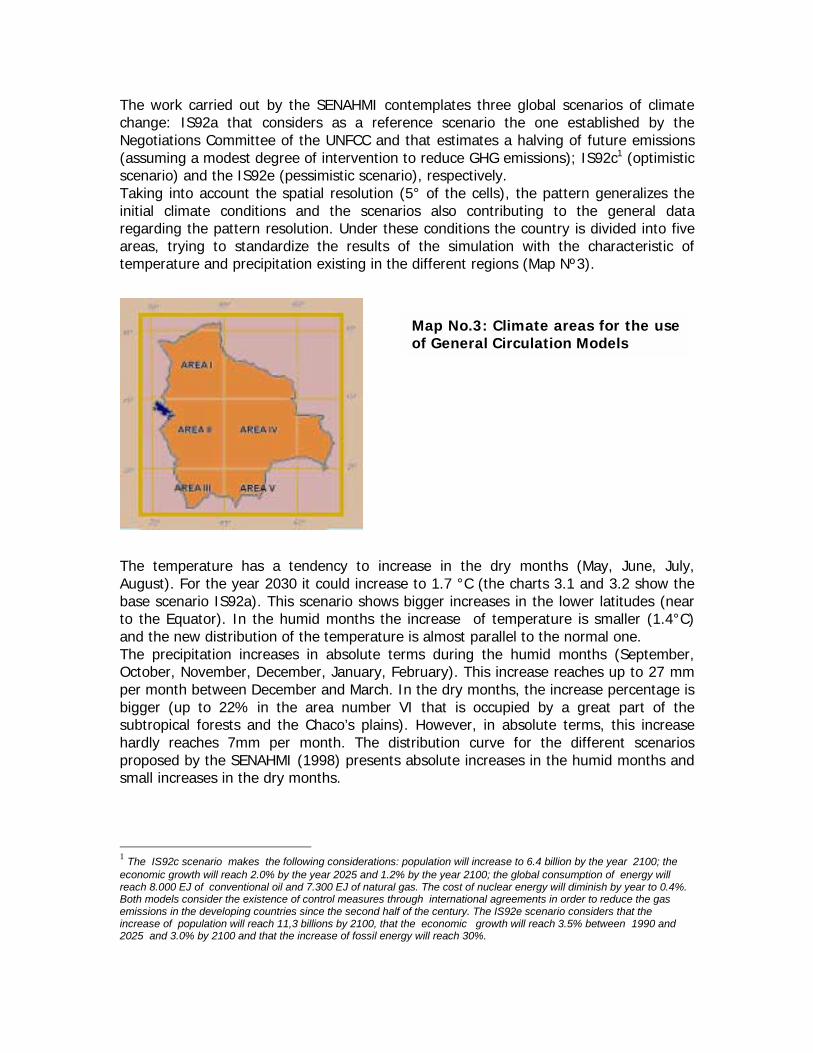
The work carried out by the SENAHMI contemplates three global scenarios of climatechange: IS92a that considers as a reference scenario the one established by theNegotiations Committee of the UNFCC and that estimates a halving of future emissions(assuming a modest degree of intervention to reduce GHG emissions); IS92c1 (optimisticscenario) and the IS92e (pessimistic scenario), respectively.Taking into account the spatial resolution (5° of the cells), the pattern generalizes theinitial climate conditions and the scenarios also contributing to the general dataregarding the pattern resolution. Under these conditions the country is divided into fiveareas, trying to standardize the results of the simulation with the characteristic oftemperature and precipitation existing in the different regions (Map Nº3).
The temperature has a tendency to increAugust). For the year 2030 it could increasebase scenario IS92a). This scenario shows to the Equator). In the humid months the and the new distribution of the temperatureThe precipitation increases in absolute terOctober, November, December, January, Feper month between December and March. Ibigger (up to 22% in the area number Vsubtropical forests and the Chaco’s plains)hardly reaches 7mm per month. The disproposed by the SENAHMI (1998) presents small increases in the dry months.
1 The IS92c scenario makes the following considerations: peconomic growth will reach 2.0% by the year 2025 and 1.2%reach 8.000 EJ of conventional oil and 7.300 EJ of natural gBoth models consider the existence of control measures throemissions in the developing countries since the second half oincrease of population will reach 11,3 billions by 2100, that t2025 and 3.0% by 2100 and that the increase of fossil energ
Map No.3: Climate areas for the useof General Circulation Models
ase in the dry months (May, June, July, to 1.7 °C (the charts 3.1 and 3.2 show thebigger increases in the lower latitudes (nearincrease of temperature is smaller (1.4°C) is almost parallel to the normal one.ms during the humid months (September,bruary). This increase reaches up to 27 mmn the dry months, the increase percentage isI that is occupied by a great part of the. However, in absolute terms, this increasetribution curve for the different scenariosabsolute increases in the humid months and
opulation will increase to 6.4 billion by the year 2100; the by the year 2100; the global consumption of energy willas. The cost of nuclear energy will diminish by year to 0.4%.ugh international agreements in order to reduce the gasf the century. The IS92e scenario considers that the
he economic growth will reach 3.5% between 1990 andy will reach 30%.
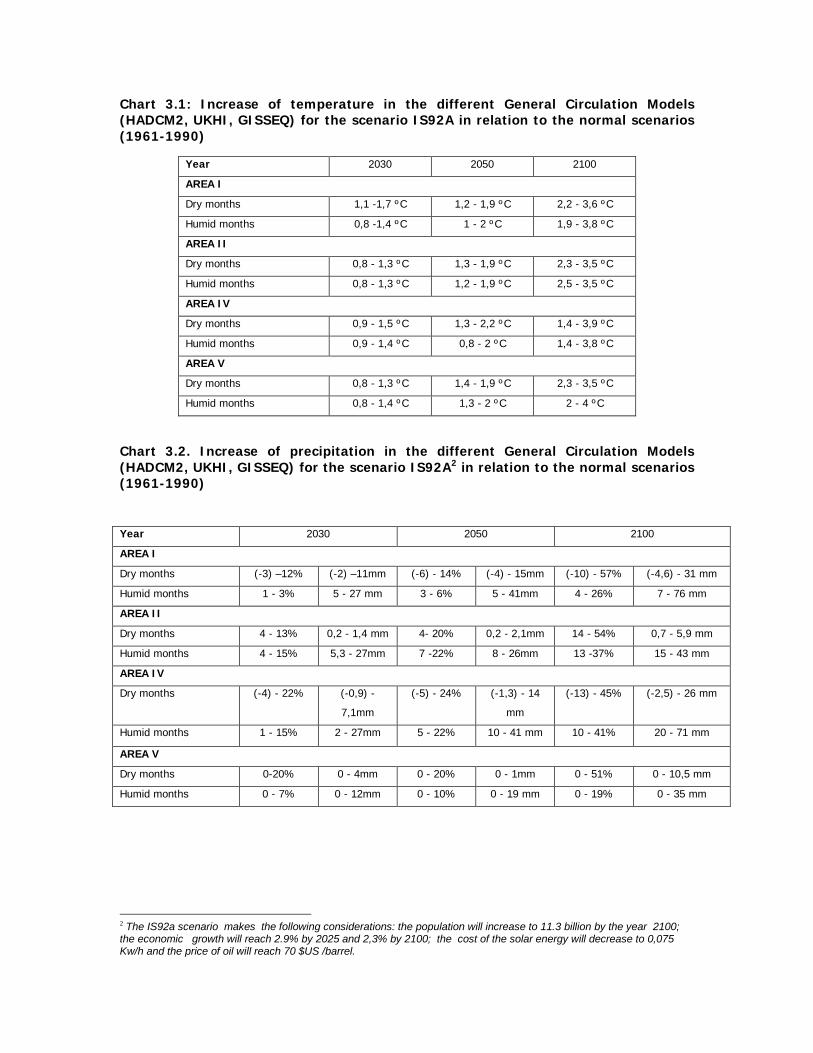
Chart 3.1: Increase of temperature in the different General Circulation Models(HADCM2, UKHI, GISSEQ) for the scenario IS92A in relation to the normal scenarios(1961-1990)
Year 2030 2050 2100
AREA I
Dry months 1,1 -1,7 ºC 1,2 - 1,9 ºC 2,2 - 3,6 ºC
Humid months 0,8 -1,4 ºC 1 - 2 ºC 1,9 - 3,8 ºC
AREA II
Dry months 0,8 - 1,3 ºC 1,3 - 1,9 ºC 2,3 - 3,5 ºC
Humid months 0,8 - 1,3 ºC 1,2 - 1,9 ºC 2,5 - 3,5 ºC
AREA IV
Dry months 0,9 - 1,5 ºC 1,3 - 2,2 ºC 1,4 - 3,9 ºC
Humid months 0,9 - 1,4 ºC 0,8 - 2 ºC 1,4 - 3,8 ºC
AREA V
Dry months 0,8 - 1,3 ºC 1,4 - 1,9 ºC 2,3 - 3,5 ºC
Humid months 0,8 - 1,4 ºC 1,3 - 2 ºC 2 - 4 ºC
Chart 3.2. Increase of precipitation in the different General Circulation Models(HADCM2, UKHI, GISSEQ) for the scenario IS92A2 in relation to the normal scenarios(1961-1990)
Year 2030 2050 2100
AREA I
Dry months (-3) –12% (-2) –11mm (-6) - 14% (-4) - 15mm (-10) - 57% (-4,6) - 31 mm
Humid months 1 - 3% 5 - 27 mm 3 - 6% 5 - 41mm 4 - 26% 7 - 76 mm
AREA II
Dry months 4 - 13% 0,2 - 1,4 mm 4- 20% 0,2 - 2,1mm 14 - 54% 0,7 - 5,9 mm
Humid months 4 - 15% 5,3 - 27mm 7 -22% 8 - 26mm 13 -37% 15 - 43 mm
AREA IV
Dry months (-4) - 22% (-0,9) -
7,1mm
(-5) - 24% (-1,3) - 14
mm
(-13) - 45% (-2,5) - 26 mm
Humid months 1 - 15% 2 - 27mm 5 - 22% 10 - 41 mm 10 - 41% 20 - 71 mm
AREA V
Dry months 0-20% 0 - 4mm 0 - 20% 0 - 1mm 0 - 51% 0 - 10,5 mm
Humid months 0 - 7% 0 - 12mm 0 - 10% 0 - 19 mm 0 - 19% 0 - 35 mm
2 The IS92a scenario makes the following considerations: the population will increase to 11.3 billion by the year 2100;the economic growth will reach 2.9% by 2025 and 2,3% by 2100; the cost of the solar energy will decrease to 0,075Kw/h and the price of oil will reach 70 $US /barrel.

The increase of precipitation will be bigger in the lower latitudes and this is whyprecipitation increases are expected in the Amazon region and in the northern part ofthe high plains. In other latitudes of the national territory the precipitation will alsoincrease but in a smaller quantity. For the region of the Bolivian Chaco, some modelsestimate an increase of up to 20% in the dry months and 12% in the humid months,which means increases from 4 to 12mm per month in absolute terms. Some othermodels used by the SENAHMI estimate, however, that the precipitation increases arenot very probable in this area.
Some of the models used by the SENAHMI estimate negative results in the precipitationpatterns in a big part of the Amazon and the subtropical plains of Santa Cruz (areas Iand IV), especially in the dry months (graphics 3.3 and 3.4).
Graph 3.3. Variations of temperature and precipitation in the scenario IS92aT E M P E R A T U R E IN C R E A S E S
A r e a I IS 9 2 a
0 ,0
0 ,2
0 ,4
0 ,6
0 ,8
1 ,0
1 ,2
1 ,4
1 ,6
2 0 0 0 2 0 0 5 2 0 1 0 2 0 1 5 2 0 2 0 2 0 2 5 2 0 3 0
TEM
PER
ATU
RE
°C
H A D C M 2 U K H I G IS S E Q
P R E C I P I T A T I O N A re a I IS 9 2 a
2 0 ,0
6 0 ,0
1 0 0 ,0
1 4 0 ,0
1 8 0 ,0
2 2 0 ,0
2 6 0 ,0
3 0 0 ,0
3 4 0 ,0
3 8 0 ,0
4 2 0 ,0
E N E F E B M A R A B R M A Y J U N J U L A G O S E P O C T N O V D IC
PREC
IPIT
ATIO
N (m
m)
H A D C M 2 U K H I G IS S E Q N O R M A L 6 1 - 9 0
Source: SENAMHI, 1999
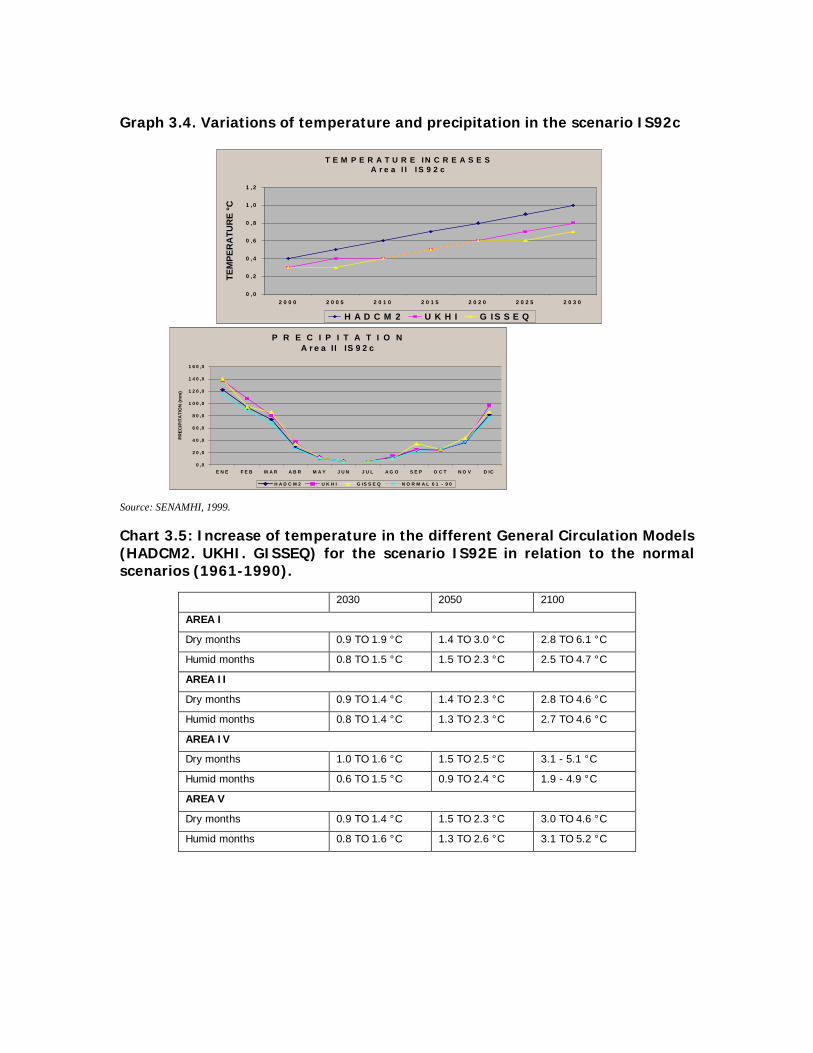
Graph 3.4. Variations of temperature and precipitation in the scenario IS92c
T E M P E R A T U R E I N C R E A S E SA r e a I I I S 9 2 c
0 , 0
0 , 2
0 , 4
0 , 6
0 , 8
1 , 0
1 , 2
2 0 0 0 2 0 0 5 2 0 1 0 2 0 1 5 2 0 2 0 2 0 2 5 2 0 3 0
TEM
PER
ATU
RE
°C
H A D C M 2 U K H I G I S S E Q
P R E C I P I T A T I O N A r e a I I IS 9 2 c
0 ,0
2 0 ,0
4 0 ,0
6 0 ,0
8 0 ,0
1 0 0 ,0
1 2 0 ,0
1 4 0 ,0
1 6 0 ,0
E N E F E B M A R A B R M A Y J U N J U L A G O S E P O C T N O V D IC
PREC
IPIT
ATI
ON
(mm
)
H A D C M 2 U K H I G IS S E Q N O R M A L 6 1 - 9 0
Source: SENAMHI, 1999.
Chart 3.5: Increase of temperature in the different General Circulation Models(HADCM2. UKHI. GISSEQ) for the scenario IS92E in relation to the normalscenarios (1961-1990).
2030 2050 2100
AREA I
Dry months 0.9 TO 1.9 °C 1.4 TO 3.0 °C 2.8 TO 6.1 °C
Humid months 0.8 TO 1.5 °C 1.5 TO 2.3 °C 2.5 TO 4.7 °C
AREA II
Dry months 0.9 TO 1.4 °C 1.4 TO 2.3 °C 2.8 TO 4.6 °C
Humid months 0.8 TO 1.4 °C 1.3 TO 2.3 °C 2.7 TO 4.6 °C
AREA IV
Dry months 1.0 TO 1.6 °C 1.5 TO 2.5 °C 3.1 - 5.1 °C
Humid months 0.6 TO 1.5 °C 0.9 TO 2.4 °C 1.9 - 4.9 °C
AREA V
Dry months 0.9 TO 1.4 °C 1.5 TO 2.3 °C 3.0 TO 4.6 °C
Humid months 0.8 TO 1.6 °C 1.3 TO 2.6 °C 3.1 TO 5.2 °C
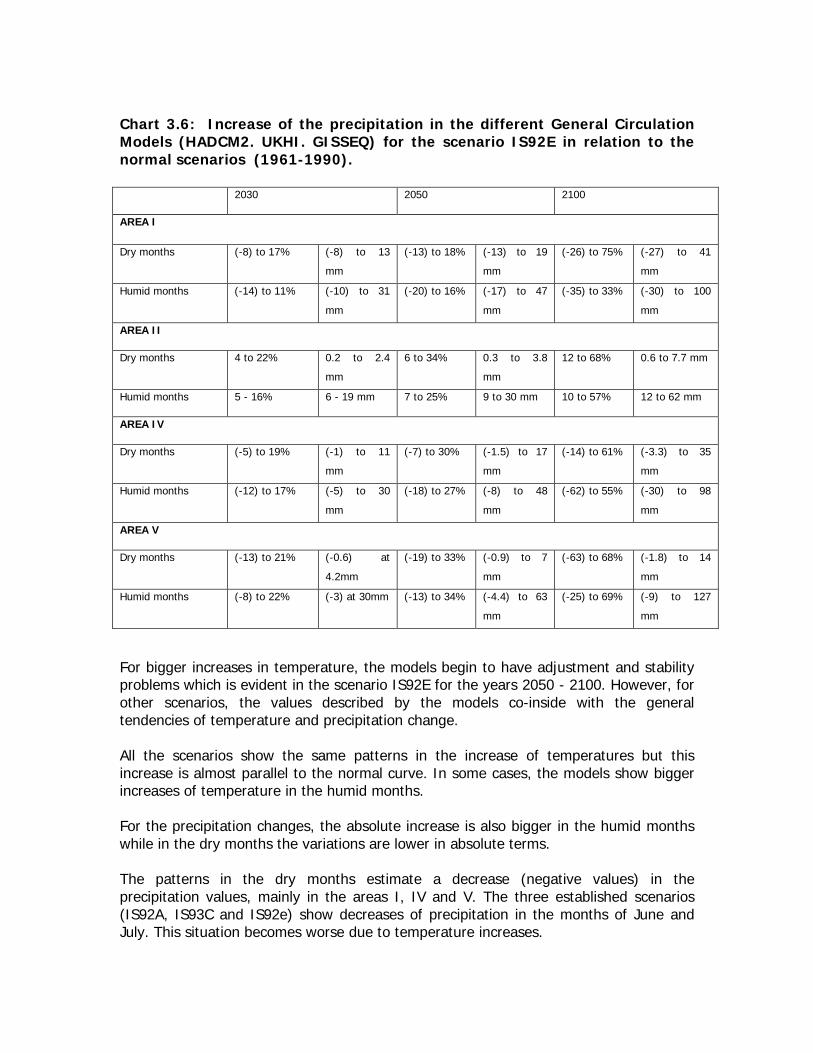
Chart 3.6: Increase of the precipitation in the different General CirculationModels (HADCM2. UKHI. GISSEQ) for the scenario IS92E in relation to thenormal scenarios (1961-1990).
2030 2050 2100
AREA I
Dry months (-8) to 17% (-8) to 13
mm
(-13) to 18% (-13) to 19
mm
(-26) to 75% (-27) to 41
mm
Humid months (-14) to 11% (-10) to 31
mm
(-20) to 16% (-17) to 47
mm
(-35) to 33% (-30) to 100
mm
AREA II
Dry months 4 to 22% 0.2 to 2.4
mm
6 to 34% 0.3 to 3.8
mm
12 to 68% 0.6 to 7.7 mm
Humid months 5 - 16% 6 - 19 mm 7 to 25% 9 to 30 mm 10 to 57% 12 to 62 mm
AREA IV
Dry months (-5) to 19% (-1) to 11
mm
(-7) to 30% (-1.5) to 17
mm
(-14) to 61% (-3.3) to 35
mm
Humid months (-12) to 17% (-5) to 30
mm
(-18) to 27% (-8) to 48
mm
(-62) to 55% (-30) to 98
mm
AREA V
Dry months (-13) to 21% (-0.6) at
4.2mm
(-19) to 33% (-0.9) to 7
mm
(-63) to 68% (-1.8) to 14
mm
Humid months (-8) to 22% (-3) at 30mm (-13) to 34% (-4.4) to 63
mm
(-25) to 69% (-9) to 127
mm
For bigger increases in temperature, the models begin to have adjustment and stabilityproblems which is evident in the scenario IS92E for the years 2050 - 2100. However, forother scenarios, the values described by the models co-inside with the generaltendencies of temperature and precipitation change.
All the scenarios show the same patterns in the increase of temperatures but thisincrease is almost parallel to the normal curve. In some cases, the models show biggerincreases of temperature in the humid months.
For the precipitation changes, the absolute increase is also bigger in the humid monthswhile in the dry months the variations are lower in absolute terms.
The patterns in the dry months estimate a decrease (negative values) in theprecipitation values, mainly in the areas I, IV and V. The three established scenarios(IS92A, IS93C and IS92e) show decreases of precipitation in the months of June andJuly. This situation becomes worse due to temperature increases.
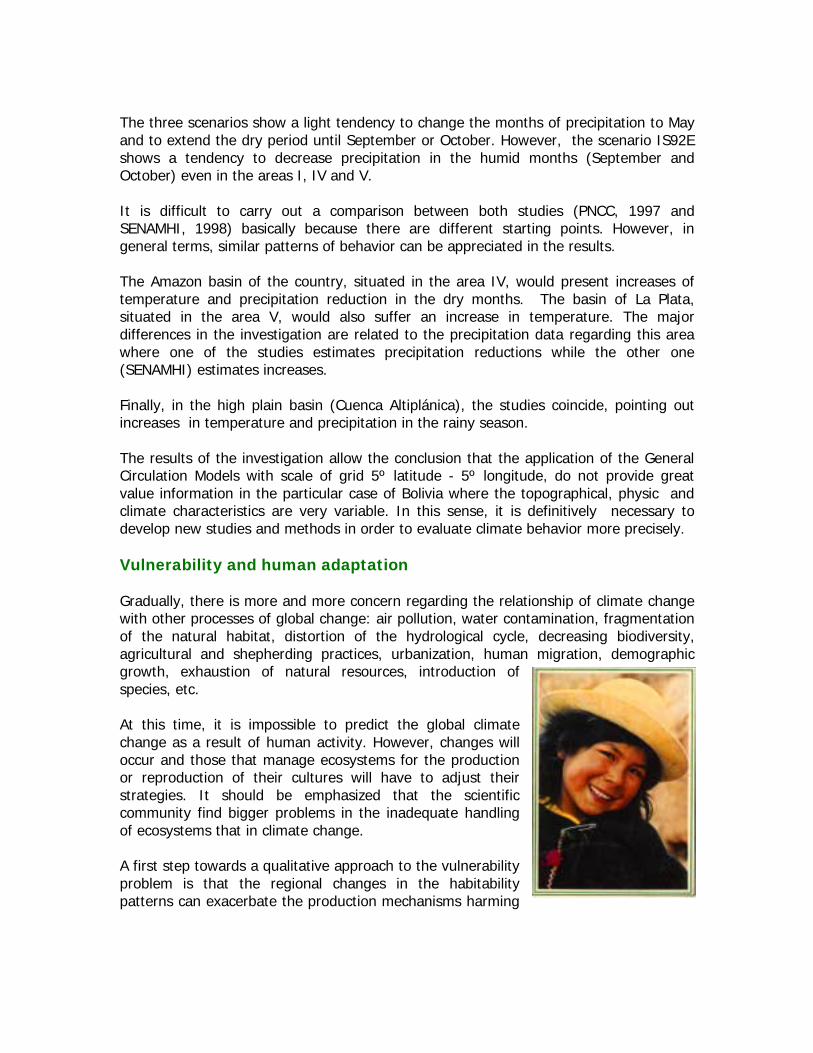
The three scenarios show a light tendency to change the months of precipitation to Mayand to extend the dry period until September or October. However, the scenario IS92Eshows a tendency to decrease precipitation in the humid months (September andOctober) even in the areas I, IV and V.
It is difficult to carry out a comparison between both studies (PNCC, 1997 andSENAMHI, 1998) basically because there are different starting points. However, ingeneral terms, similar patterns of behavior can be appreciated in the results.
The Amazon basin of the country, situated in the area IV, would present increases oftemperature and precipitation reduction in the dry months. The basin of La Plata,situated in the area V, would also suffer an increase in temperature. The majordifferences in the investigation are related to the precipitation data regarding this areawhere one of the studies estimates precipitation reductions while the other one(SENAMHI) estimates increases.
Finally, in the high plain basin (Cuenca Altiplánica), the studies coincide, pointing outincreases in temperature and precipitation in the rainy season.
The results of the investigation allow the conclusion that the application of the GeneralCirculation Models with scale of grid 5º latitude - 5º longitude, do not provide greatvalue information in the particular case of Bolivia where the topographical, physic andclimate characteristics are very variable. In this sense, it is definitively necessary todevelop new studies and methods in order to evaluate climate behavior more precisely.
Vulnerability and human adaptation
Gradually, there is more and more concern regarding the relationship of climate changewith other processes of global change: air pollution, water contamination, fragmentationof the natural habitat, distortion of the hydrological cycle, decreasing biodiversity,agricultural and shepherding practices, urbanization, human migration, demographicgrowth, exhaustion of natural resources, introduction ofspecies, etc.
At this time, it is impossible to predict the global climatechange as a result of human activity. However, changes willoccur and those that manage ecosystems for the productionor reproduction of their cultures will have to adjust theirstrategies. It should be emphasized that the scientificcommunity find bigger problems in the inadequate handlingof ecosystems that in climate change.
A first step towards a qualitative approach to the vulnerabilityproblem is that the regional changes in the habitabilitypatterns can exacerbate the production mechanisms harming
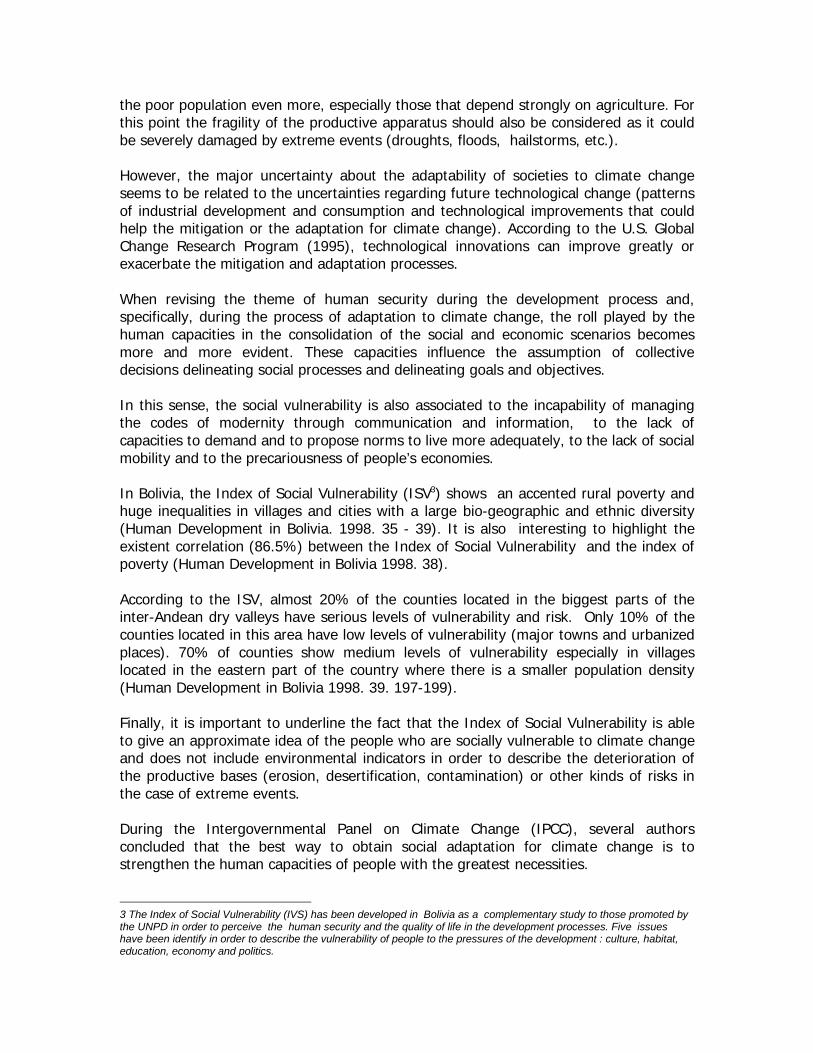
the poor population even more, especially those that depend strongly on agriculture. Forthis point the fragility of the productive apparatus should also be considered as it couldbe severely damaged by extreme events (droughts, floods, hailstorms, etc.).
However, the major uncertainty about the adaptability of societies to climate changeseems to be related to the uncertainties regarding future technological change (patternsof industrial development and consumption and technological improvements that couldhelp the mitigation or the adaptation for climate change). According to the U.S. GlobalChange Research Program (1995), technological innovations can improve greatly orexacerbate the mitigation and adaptation processes.
When revising the theme of human security during the development process and,specifically, during the process of adaptation to climate change, the roll played by thehuman capacities in the consolidation of the social and economic scenarios becomesmore and more evident. These capacities influence the assumption of collectivedecisions delineating social processes and delineating goals and objectives.
In this sense, the social vulnerability is also associated to the incapability of managingthe codes of modernity through communication and information, to the lack ofcapacities to demand and to propose norms to live more adequately, to the lack of socialmobility and to the precariousness of people’s economies.
In Bolivia, the Index of Social Vulnerability (ISV3) shows an accented rural poverty andhuge inequalities in villages and cities with a large bio-geographic and ethnic diversity(Human Development in Bolivia. 1998. 35 - 39). It is also interesting to highlight theexistent correlation (86.5%) between the Index of Social Vulnerability and the index ofpoverty (Human Development in Bolivia 1998. 38).
According to the ISV, almost 20% of the counties located in the biggest parts of theinter-Andean dry valleys have serious levels of vulnerability and risk. Only 10% of thecounties located in this area have low levels of vulnerability (major towns and urbanizedplaces). 70% of counties show medium levels of vulnerability especially in villageslocated in the eastern part of the country where there is a smaller population density(Human Development in Bolivia 1998. 39. 197-199).
Finally, it is important to underline the fact that the Index of Social Vulnerability is ableto give an approximate idea of the people who are socially vulnerable to climate changeand does not include environmental indicators in order to describe the deterioration ofthe productive bases (erosion, desertification, contamination) or other kinds of risks inthe case of extreme events.
During the Intergovernmental Panel on Climate Change (IPCC), several authorsconcluded that the best way to obtain social adaptation for climate change is tostrengthen the human capacities of people with the greatest necessities.
3 The Index of Social Vulnerability (IVS) has been developed in Bolivia as a complementary study to those promoted bythe UNPD in order to perceive the human security and the quality of life in the development processes. Five issueshave been identify in order to describe the vulnerability of people to the pressures of the development : culture, habitat,education, economy and politics.

The urbanized areas are also an issue of interest when talking about vulnerability inregard to climate change, basically because there is a big dependence on resourcesregarding the productive periphery. Climate change could not only affect the provision ofwater and agricultural products, but collapse the markets and affect human migration.
The government of Bolivia outlines inside it’s socio-economic politics the “fight againstthe poverty”, as part of a strategy that points to the generation of social participation inorder to produce economic resources that would be re-invested in human development.
The decentralization process is an important part of this strategy, basically because it isaccompanied by mechanisms that tend to invigorate the municipal initiatives and toprovide to the local authorities with the possibility of deciding the route of their selfdevelopment, and to react with their own resources to emergencies and eventualities.
This process must be accompanied, anyway, by central mechanisms that could supporttechnological changes through the investigation and the extension of technologies. Thecentral systems should also promote surveillance mechanisms in order to maintainthrough different components an inter-connected system of civil defense.
Vulnerability of ecosystems
Bolivia is a country with a huge geographic diversity which is also expressed in thevariety of climates and in it’s orographic, geologic and hydrologic characteristics. Theeastern side of the country is covered by big extensions of forests; from humid tropicalin the north (among the parallel 9º and 12º of south latitude) to the subtropical dryforests in the Chaco (southeast of the country).
The forests are partially fragmented with big savannas and pampas that cover theentirety of the department of Beni, the northern side of the department of La Paz andthe northern area of the department of Santa Cruz. In these areas there is also animportant concentration of agricultural and cattle raising activities and humanestablishments distributed in an homogeneous way in the whole plain area of thecountry and especially concentrated in the area of Santa Cruz.
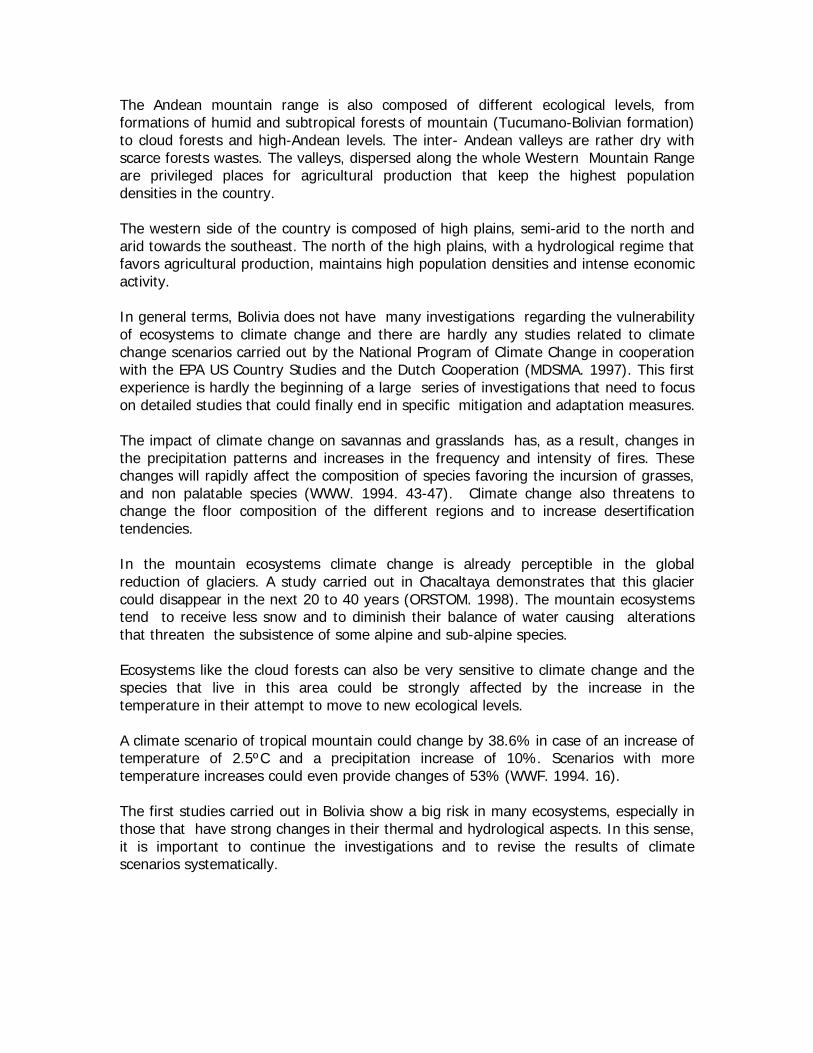
The Andean mountain range is also composed of different ecological levels, fromformations of humid and subtropical forests of mountain (Tucumano-Bolivian formation)to cloud forests and high-Andean levels. The inter- Andean valleys are rather dry withscarce forests wastes. The valleys, dispersed along the whole Western Mountain Rangeare privileged places for agricultural production that keep the highest populationdensities in the country.
The western side of the country is composed of high plains, semi-arid to the north andarid towards the southeast. The north of the high plains, with a hydrological regime thatfavors agricultural production, maintains high population densities and intense economicactivity.
In general terms, Bolivia does not have many investigations regarding the vulnerabilityof ecosystems to climate change and there are hardly any studies related to climatechange scenarios carried out by the National Program of Climate Change in cooperationwith the EPA US Country Studies and the Dutch Cooperation (MDSMA. 1997). This firstexperience is hardly the beginning of a large series of investigations that need to focuson detailed studies that could finally end in specific mitigation and adaptation measures.
The impact of climate change on savannas and grasslands has, as a result, changes inthe precipitation patterns and increases in the frequency and intensity of fires. Thesechanges will rapidly affect the composition of species favoring the incursion of grasses,and non palatable species (WWW. 1994. 43-47). Climate change also threatens tochange the floor composition of the different regions and to increase desertificationtendencies.
In the mountain ecosystems climate change is already perceptible in the globalreduction of glaciers. A study carried out in Chacaltaya demonstrates that this glaciercould disappear in the next 20 to 40 years (ORSTOM. 1998). The mountain ecosystemstend to receive less snow and to diminish their balance of water causing alterationsthat threaten the subsistence of some alpine and sub-alpine species.
Ecosystems like the cloud forests can also be very sensitive to climate change and thespecies that live in this area could be strongly affected by the increase in thetemperature in their attempt to move to new ecological levels.
A climate scenario of tropical mountain could change by 38.6% in case of an increase oftemperature of 2.5ºC and a precipitation increase of 10%. Scenarios with moretemperature increases could even provide changes of 53% (WWF. 1994. 16).
The first studies carried out in Bolivia show a big risk in many ecosystems, especially inthose that have strong changes in their thermal and hydrological aspects. In this sense,it is important to continue the investigations and to revise the results of climatescenarios systematically.

Vulnerability of forests
The strong fragmentation of tropical forest generates “islands” with dissimilar types offloor and climate in which different species have difficulties in surviving emigration oradapting to new conditions of life (WWW. 1994. 49). In the scientific community, thereis a big concern regarding risks that climate change implies to these types ofecosystems.
The National Program of ClimateChange made an initial analysisregarding the impact of climatechanges on the forest (PNCC,1997). The study was based onincremental scenarios(simultaneous variation oftemperature and precipitation)and included a doubling of CO2
which applies to the Map of LifeZones of Holdrige4. (map No.4).
Map No 4 : Life Zones in the Holdrige Model
4 The Holdridge Model is a representation in which the length of vegetation is combined with different climate variables: bio-temperature, average precipitation per year and evapotranspiration potential; creating a triangular system of coordination in whichthe zones of life can be determined through a series of hexagons. The model uses conventional data related to temperature andprecipitation with a resolution of 0.5°x0.5° (longitude x latitude) for a normal situation of (1xCO2). Through this model and using theinformation provided by the different meteorological stations of the country, it was possible to obtain a precise distribution andclassification of the vegetation considering the correspondent longitude and latitude and specifying the new scenarios. Thisclassification has been translated into maps that allow the visualization of the kind of forests existent in different zones.
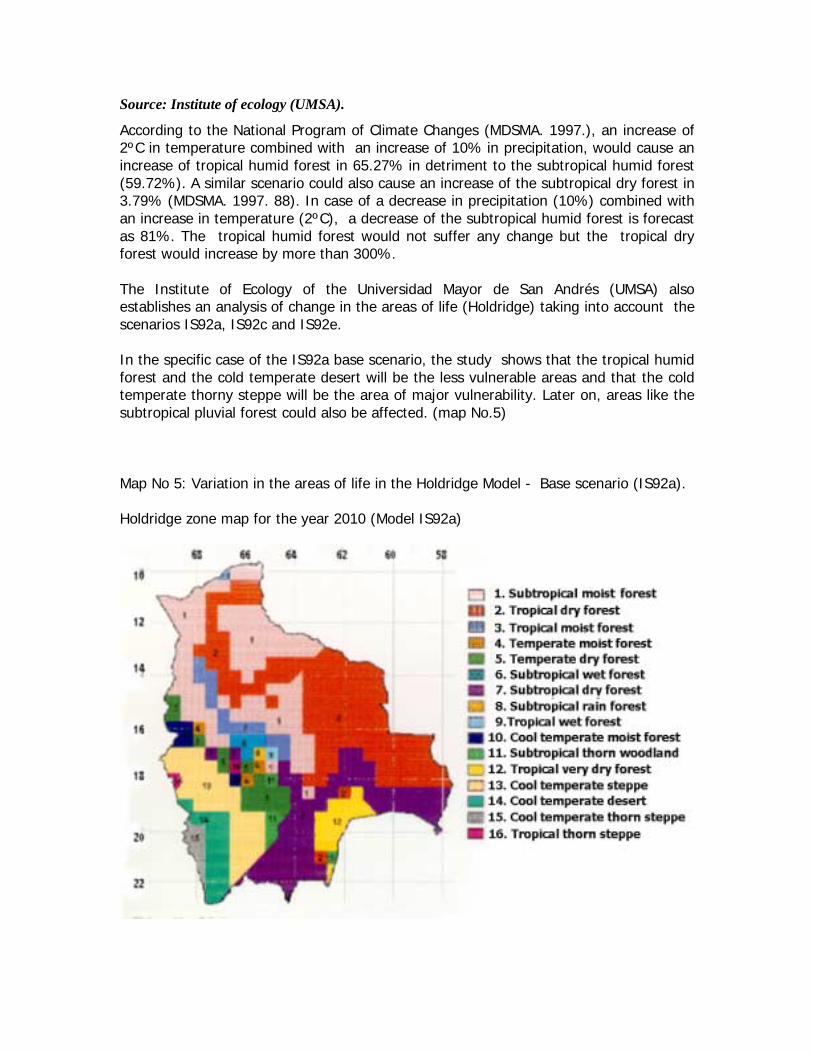
Source: Institute of ecology (UMSA).
According to the National Program of Climate Changes (MDSMA. 1997.), an increase of2ºC in temperature combined with an increase of 10% in precipitation, would cause anincrease of tropical humid forest in 65.27% in detriment to the subtropical humid forest(59.72%). A similar scenario could also cause an increase of the subtropical dry forest in3.79% (MDSMA. 1997. 88). In case of a decrease in precipitation (10%) combined withan increase in temperature (2ºC), a decrease of the subtropical humid forest is forecastas 81%. The tropical humid forest would not suffer any change but the tropical dryforest would increase by more than 300%.
The Institute of Ecology of the Universidad Mayor de San Andrés (UMSA) alsoestablishes an analysis of change in the areas of life (Holdridge) taking into account thescenarios IS92a, IS92c and IS92e.
In the specific case of the IS92a base scenario, the study shows that the tropical humidforest and the cold temperate desert will be the less vulnerable areas and that the coldtemperate thorny steppe will be the area of major vulnerability. Later on, areas like thesubtropical pluvial forest could also be affected. (map No.5)
Map No 5: Variation in the areas of life in the Holdridge Model - Base scenario (IS92a).
Holdridge zone map for the year 2010 (Model IS92a)
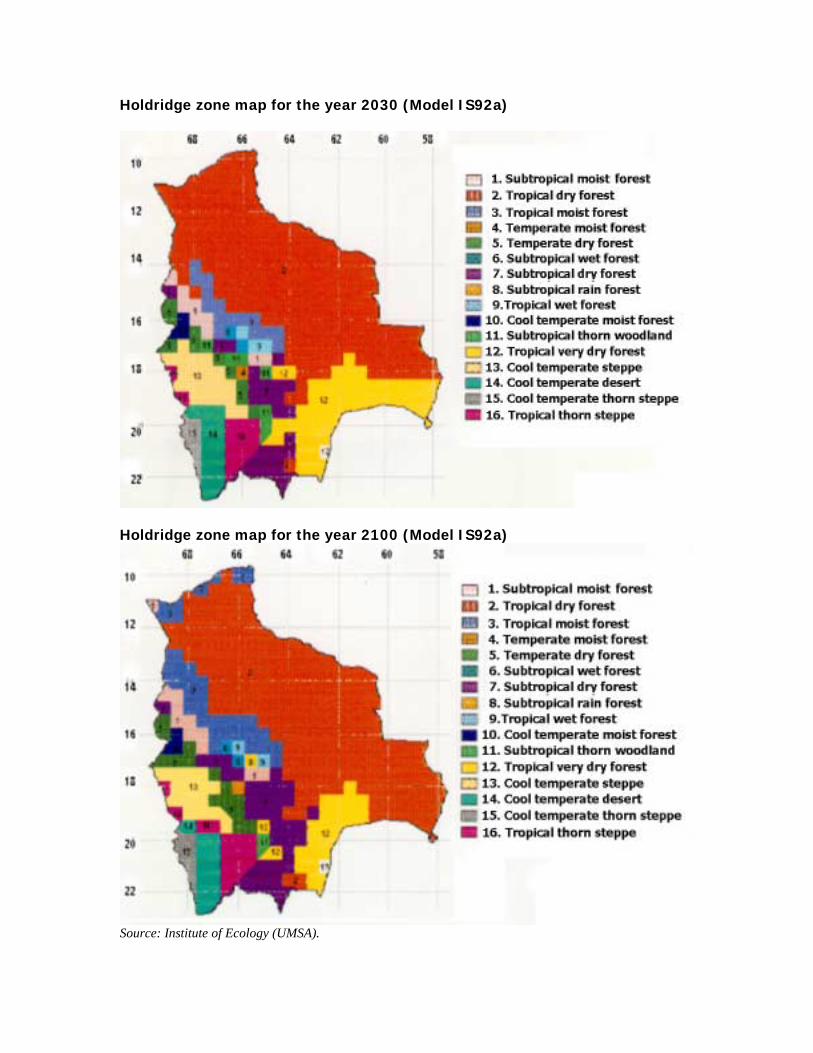
Holdridge zone map for the year 2030 (Model IS92a)
Holdridge zone map for the year 2100 (Model IS92a)
Source: Institute of Ecology (UMSA).
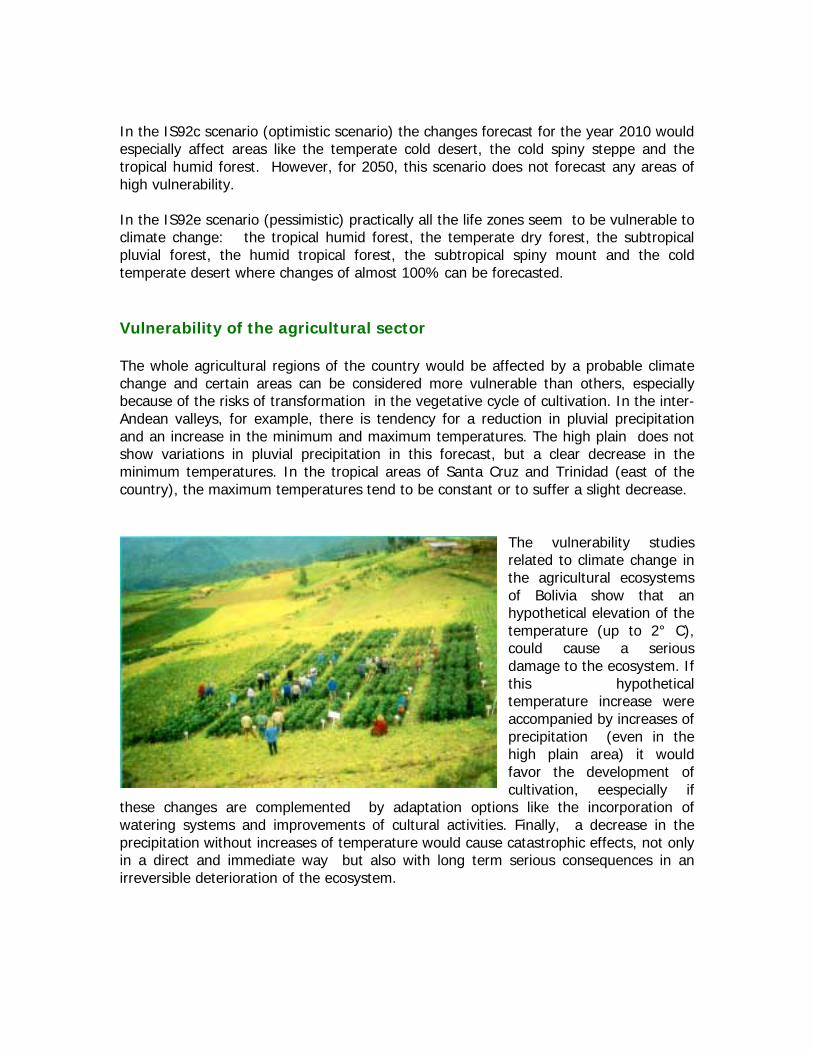
In the IS92c scenario (optimistic scenario) the changes forecast for the year 2010 wouldespecially affect areas like the temperate cold desert, the cold spiny steppe and thetropical humid forest. However, for 2050, this scenario does not forecast any areas ofhigh vulnerability.
In the IS92e scenario (pessimistic) practically all the life zones seem to be vulnerable toclimate change: the tropical humid forest, the temperate dry forest, the subtropicalpluvial forest, the humid tropical forest, the subtropical spiny mount and the coldtemperate desert where changes of almost 100% can be forecasted.
Vulnerability of the agricultural sector
The whole agricultural regions of the country would be affected by a probable climatechange and certain areas can be considered more vulnerable than others, especiallybecause of the risks of transformation in the vegetative cycle of cultivation. In the inter-Andean valleys, for example, there is tendency for a reduction in pluvial precipitationand an increase in the minimum and maximum temperatures. The high plain does notshow variations in pluvial precipitation in this forecast, but a clear decrease in theminimum temperatures. In the tropical areas of Santa Cruz and Trinidad (east of thecountry), the maximum temperatures tend to be constant or to suffer a slight decrease.
The vulnerability studiesrelated to climate change inthe agricultural ecosystemsof Bolivia show that anhypothetical elevation of thetemperature (up to 2° C),could cause a seriousdamage to the ecosystem. Ifthis hypotheticaltemperature increase wereaccompanied by increases ofprecipitation (even in thehigh plain area) it wouldfavor the development ofcultivation, eespecially if
these changes are complemented by adaptation options like the incorporation ofwatering systems and improvements of cultural activities. Finally, a decrease in theprecipitation without increases of temperature would cause catastrophic effects, not onlyin a direct and immediate way but also with long term serious consequences in anirreversible deterioration of the ecosystem.

Source: National Program of Climate Change
Specific studies related to the vulnerability of certain cultivations regarding climatechange in Bolivia have been developed in the country by the National Program ofClimate Change (PNCC 1997) and the Institute of Agricultural Investigations (UMSA,1999).
The cultivation of irrigated maize (zea mays) in the valleys presents a high physiologicsensitivity to climate change. A clear decrease in the production is forecast under 14climate scenarios using different General Circulation Models. In the GISS and the UK89the decrease was estimated as being 25% in spite of an increase of carbon dioxide. Thecultivation of non-irrigated maize showed different results. In this case the productionincreases up to 50% in all climate scenarios in which an augment of temperature,precipitation and doubling of carbon dioxide was shown.
Map No 6 : Map of the different cultivations by region: potatoes,maize, soya and rice.
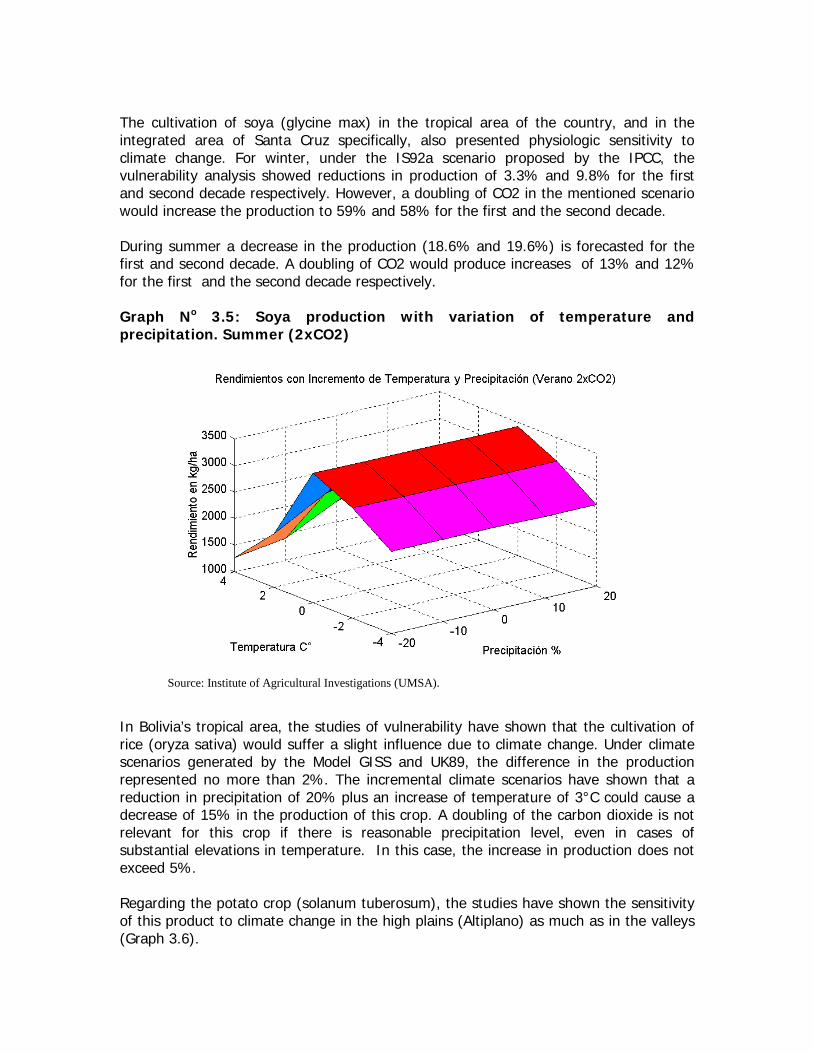
The cultivation of soya (glycine max) in the tropical area of the country, and in theintegrated area of Santa Cruz specifically, also presented physiologic sensitivity toclimate change. For winter, under the IS92a scenario proposed by the IPCC, thevulnerability analysis showed reductions in production of 3.3% and 9.8% for the firstand second decade respectively. However, a doubling of CO2 in the mentioned scenariowould increase the production to 59% and 58% for the first and the second decade.
During summer a decrease in the production (18.6% and 19.6%) is forecasted for thefirst and second decade. A doubling of CO2 would produce increases of 13% and 12%for the first and the second decade respectively.
Graph No 3.5: Soya production with variation of temperature andprecipitation. Summer (2xCO2)
Source: Institute of Agricultural Investigations (UMSA).
In Bolivia’s tropical area, the studies of vulnerability have shown that the cultivation ofrice (oryza sativa) would suffer a slight influence due to climate change. Under climatescenarios generated by the Model GISS and UK89, the difference in the productionrepresented no more than 2%. The incremental climate scenarios have shown that areduction in precipitation of 20% plus an increase of temperature of 3°C could cause adecrease of 15% in the production of this crop. A doubling of the carbon dioxide is notrelevant for this crop if there is reasonable precipitation level, even in cases ofsubstantial elevations in temperature. In this case, the increase in production does notexceed 5%.
Regarding the potato crop (solanum tuberosum), the studies have shown the sensitivityof this product to climate change in the high plains (Altiplano) as much as in the valleys(Graph 3.6).
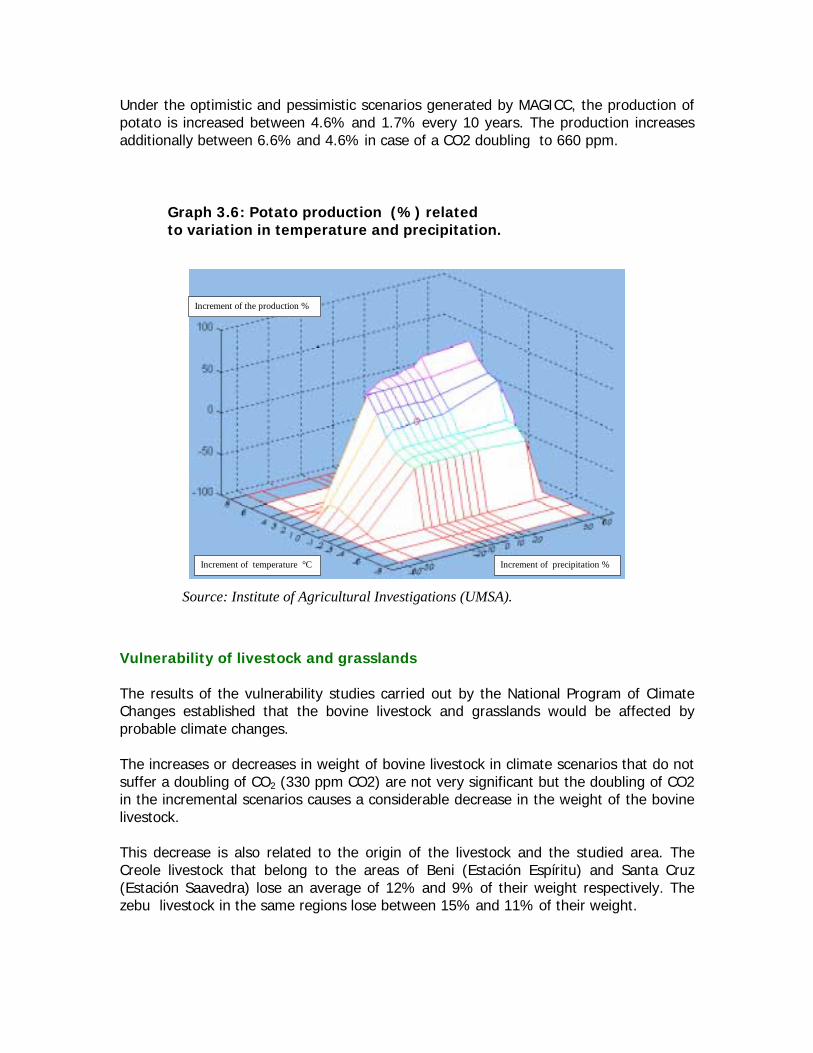
Under the optimistic and pessimistic scenarios generated by MAGICC, the production ofpotato is increased between 4.6% and 1.7% every 10 years. The production increasesadditionally between 6.6% and 4.6% in case of a CO2 doubling to 660 ppm.
Graph 3.6: Potato production (%) relatedto variation in temperature and precipitation.
Increment of precipitation % Increment of temperature °C
Increment of the production %
Source: Institute of Agricultural Investigations (UMSA).
Vulnerability of livestock and grasslands
The results of the vulnerability studies carried out by the National Program of ClimateChanges established that the bovine livestock and grasslands would be affected byprobable climate changes.
The increases or decreases in weight of bovine livestock in climate scenarios that do notsuffer a doubling of CO2 (330 ppm CO2) are not very significant but the doubling of CO2in the incremental scenarios causes a considerable decrease in the weight of the bovinelivestock.
This decrease is also related to the origin of the livestock and the studied area. TheCreole livestock that belong to the areas of Beni (Estación Espíritu) and Santa Cruz(Estación Saavedra) lose an average of 12% and 9% of their weight respectively. Thezebu livestock in the same regions lose between 15% and 11% of their weight.
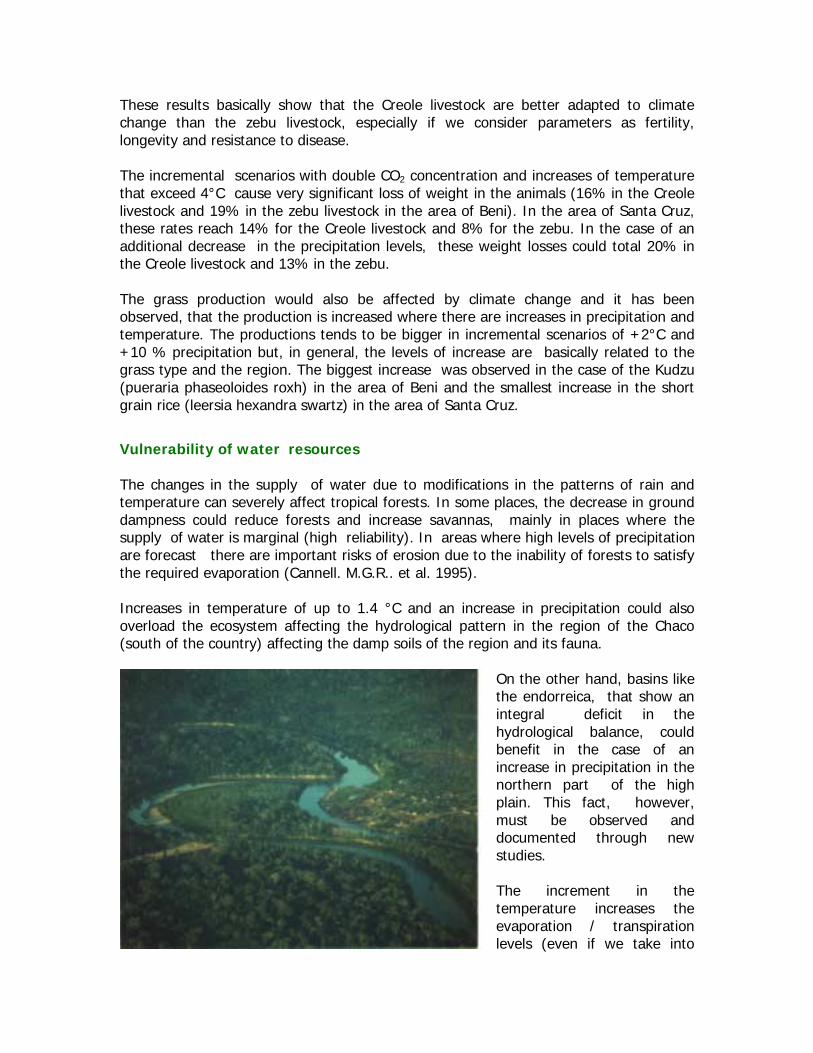
These results basically show that the Creole livestock are better adapted to climatechange than the zebu livestock, especially if we consider parameters as fertility,longevity and resistance to disease.
The incremental scenarios with double CO2 concentration and increases of temperaturethat exceed 4°C cause very significant loss of weight in the animals (16% in the Creolelivestock and 19% in the zebu livestock in the area of Beni). In the area of Santa Cruz,these rates reach 14% for the Creole livestock and 8% for the zebu. In the case of anadditional decrease in the precipitation levels, these weight losses could total 20% inthe Creole livestock and 13% in the zebu.
The grass production would also be affected by climate change and it has beenobserved, that the production is increased where there are increases in precipitation andtemperature. The productions tends to be bigger in incremental scenarios of +2°C and+10 % precipitation but, in general, the levels of increase are basically related to thegrass type and the region. The biggest increase was observed in the case of the Kudzu(pueraria phaseoloides roxh) in the area of Beni and the smallest increase in the shortgrain rice (leersia hexandra swartz) in the area of Santa Cruz.
Vulnerability of water resources
The changes in the supply of water due to modifications in the patterns of rain andtemperature can severely affect tropical forests. In some places, the decrease in grounddampness could reduce forests and increase savannas, mainly in places where thesupply of water is marginal (high reliability). In areas where high levels of precipitationare forecast there are important risks of erosion due to the inability of forests to satisfythe required evaporation (Cannell. M.G.R.. et al. 1995).
Increases in temperature of up to 1.4 °C and an increase in precipitation could alsooverload the ecosystem affecting the hydrological pattern in the region of the Chaco(south of the country) affecting the damp soils of the region and its fauna.
On the other hand, basins likethe endorreica, that show anintegral deficit in thehydrological balance, couldbenefit in the case of anincrease in precipitation in thenorthern part of the highplain. This fact, however,must be observed anddocumented through newstudies.
The increment in thetemperature increases theevaporation / transpirationlevels (even if we take into
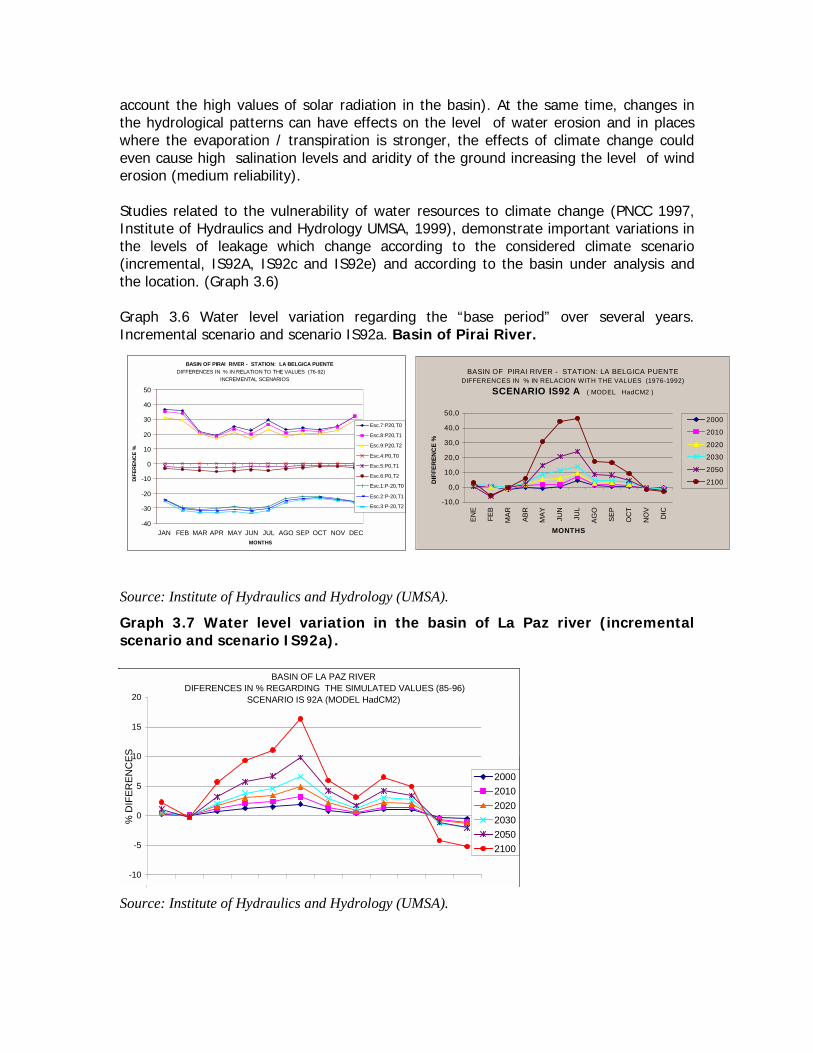
account the high values of solar radiation in the basin). At the same time, changes inthe hydrological patterns can have effects on the level of water erosion and in placeswhere the evaporation / transpiration is stronger, the effects of climate change couldeven cause high salination levels and aridity of the ground increasing the level of winderosion (medium reliability).
Studies related to the vulnerability of water resources to climate change (PNCC 1997,Institute of Hydraulics and Hydrology UMSA, 1999), demonstrate important variations inthe levels of leakage which change according to the considered climate scenario(incremental, IS92A, IS92c and IS92e) and according to the basin under analysis andthe location. (Graph 3.6)
Graph 3.6 Water level variation regarding the “base period” over several years.Incremental scenario and scenario IS92a. Basin of Pirai River.
Source: Institute of Hydraulics and Hydrology (UMSA).
Graph 3.7 Water level variation in the basin of La Paz river (incrementalscenario and scenario IS92a).
CUENCA RIO LA PAZ DIFERENCIAS EN % RESPECTO DE VALORES SIMULADOS (85-96)
ESCENARIO IS 92A (MODELO HadCM2)
0
0,1
0,2
0,3
0,4
0,5
0,6
0,7
0,8
0,9
1
% D
IFER
ENC
IAS 2000
20102020203020502100
BASIN OF LA PAZ RIVER DIFERENCES IN % REGARDING THE SIMULATED VALUES (85-96)
SCENARIO IS 92A (MODEL HadCM2)
-10
-5
0
5
10
15
20
ENE FEB MAR ABR MAY JUN JUL AGO SEP OCT NOV DIC
% D
IFER
ENC
ES
200020102020203020502100
Source: Institute of Hydraulics and Hydrology (UMSA).
BASIN OF PIRAI RIVER - STATION: LA BELGICA PUENTE DIFFERENCES IN % IN RELACION WITH THE VALUES (1976-1992)
SCENARIO IS92 A ( MODEL HadCM2 )
-10,0
0,0
10,0
20,0
30,0
40,0
50,0
ENE
FEB
MAR AB
R
MAY JU
N
JUL
AGO
SEP
OC
T
NO
V
DIC
MONTHS
DIF
FER
ENC
E %
2000
2010
2020
2030
2050
2100
BASIN OF PIRAI RIVER - STATION: LA BELGICA PUENTEDIFFERENCES IN % IN RELATION TO THE VALUES (76-92)
INCREMENTAL SCENARIOS
-40 -30 -20 -10
0 10 20 30 40 50
JAN FEB MAR APR MAY JUN JUL AGO SEP OCT NOV DECMONTHS
DIFE
RENC
E %
Esc.7:P20,T0
Esc.8:P20,T1
Esc.9:P20,T2
Esc.4:P0,T0
Esc.5:P0,T1
Esc.6:P0,T2
Esc.1:P-20,T0
Esc.2:P-20,T1
Esc.3:P-20,T2
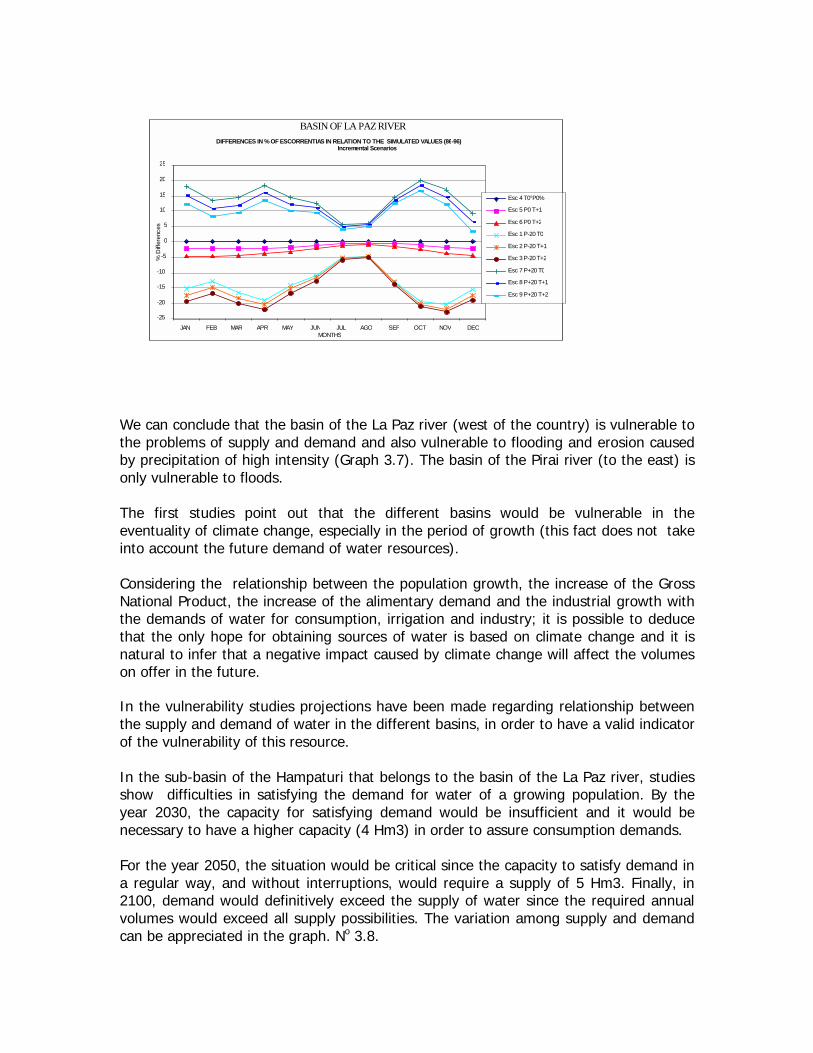
We can conclude that the basin of the La Paz river (west of the country) is vulnerable tothe problems of supply and demand and also vulnerable to flooding and erosion causedby precipitation of high intensity (Graph 3.7). The basin of the Pirai river (to the east) isonly vulnerable to floods.
The first studies point out that the different basins would be vulnerable in theeventuality of climate change, especially in the period of growth (this fact does not takeinto account the future demand of water resources).
Considering the relationship between the population growth, the increase of the GrossNational Product, the increase of the alimentary demand and the industrial growth withthe demands of water for consumption, irrigation and industry; it is possible to deducethat the only hope for obtaining sources of water is based on climate change and it isnatural to infer that a negative impact caused by climate change will affect the volumeson offer in the future.
In the vulnerability studies projections have been made regarding relationship betweenthe supply and demand of water in the different basins, in order to have a valid indicatorof the vulnerability of this resource.
In the sub-basin of the Hampaturi that belongs to the basin of the La Paz river, studiesshow difficulties in satisfying the demand for water of a growing population. By theyear 2030, the capacity for satisfying demand would be insufficient and it would benecessary to have a higher capacity (4 Hm3) in order to assure consumption demands.
For the year 2050, the situation would be critical since the capacity to satisfy demand ina regular way, and without interruptions, would require a supply of 5 Hm3. Finally, in2100, demand would definitively exceed the supply of water since the required annualvolumes would exceed all supply possibilities. The variation among supply and demandcan be appreciated in the graph. No 3.8.
BASIN OF LA PAZ RIVER DIFFERENCES IN % OF ESCORRENTIAS IN RELATION TO THE SIMULATED VALUES (86-96)
Incremental Scenarios
-25 -20 -15 -10 -5 0 5 10 15 20 25
JAN FEB MAR APR MAY JUN JUL AGO SEP OCT NOV DECMONTHS
% D
iffer
ence
s
Esc 4 T0°P0%
Esc 5 P0 T+1
Esc 6 P0 T+2
Esc 1 P-20 T0
Esc 2 P-20 T+1
Esc 3 P-20 T+2
Esc 7 P+20 T0
Esc 8 P+20 T+1
Esc 9 P+20 T+2
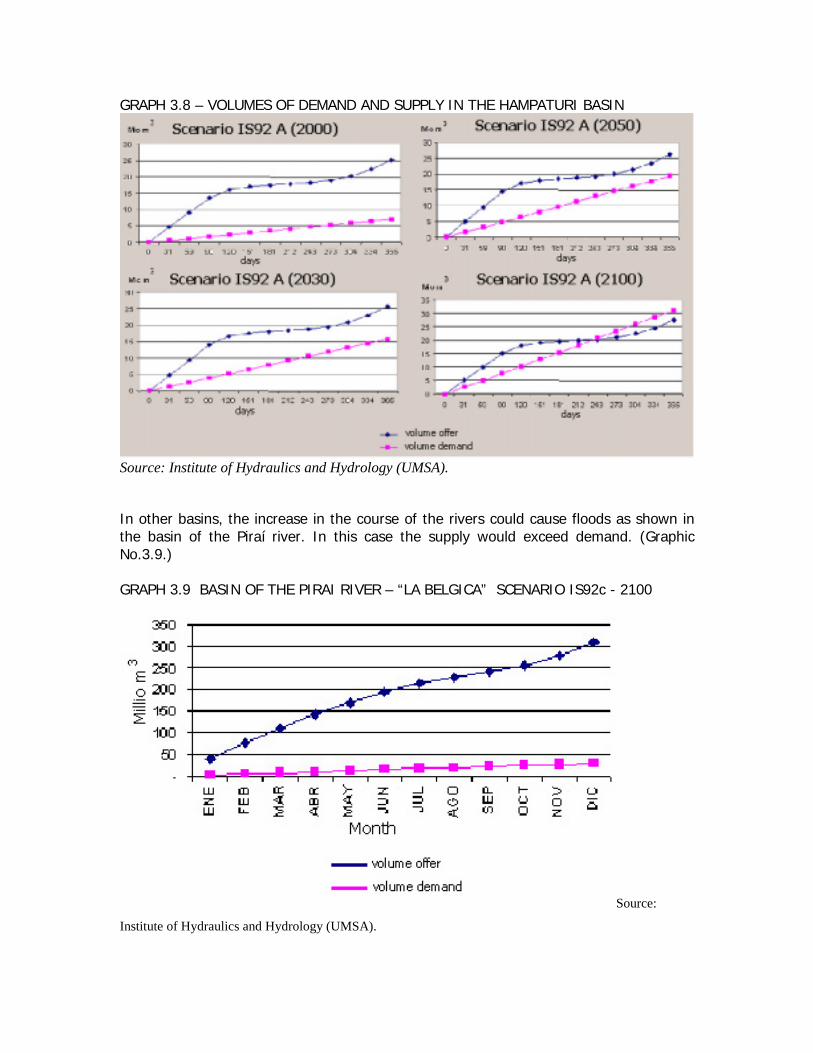
GRAPH 3.8 – VOLUMES OF DEMAND AND SUPPLY IN THE HAMPATURI BASIN
Source: Institute of Hydraulics and Hydrology (UMSA).
In other basins, the increase in the course of the rivers could cause floods as shown inthe basin of the Piraí river. In this case the supply would exceed demand. (GraphicNo.3.9.)
GRAPH 3.9 BASIN OF THE PIRAI RIVER – “LA BELGICA” SCENARIO IS92c - 2100
Source:
Institute of Hydraulics and Hydrology (UMSA).
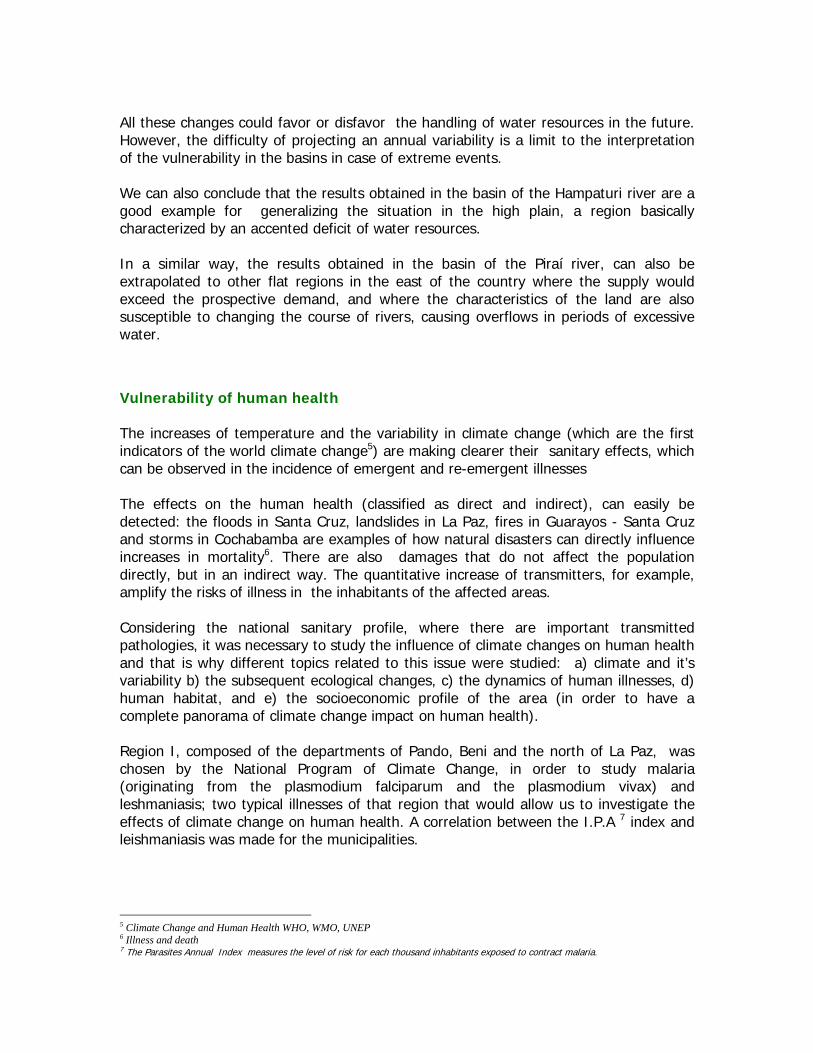
All these changes could favor or disfavor the handling of water resources in the future.However, the difficulty of projecting an annual variability is a limit to the interpretationof the vulnerability in the basins in case of extreme events.
We can also conclude that the results obtained in the basin of the Hampaturi river are agood example for generalizing the situation in the high plain, a region basicallycharacterized by an accented deficit of water resources.
In a similar way, the results obtained in the basin of the Piraí river, can also beextrapolated to other flat regions in the east of the country where the supply wouldexceed the prospective demand, and where the characteristics of the land are alsosusceptible to changing the course of rivers, causing overflows in periods of excessivewater.
Vulnerability of human health
The increases of temperature and the variability in climate change (which are the firstindicators of the world climate change5) are making clearer their sanitary effects, whichcan be observed in the incidence of emergent and re-emergent illnesses
The effects on the human health (classified as direct and indirect), can easily bedetected: the floods in Santa Cruz, landslides in La Paz, fires in Guarayos - Santa Cruzand storms in Cochabamba are examples of how natural disasters can directly influenceincreases in mortality6. There are also damages that do not affect the populationdirectly, but in an indirect way. The quantitative increase of transmitters, for example,amplify the risks of illness in the inhabitants of the affected areas.
Considering the national sanitary profile, where there are important transmittedpathologies, it was necessary to study the influence of climate changes on human healthand that is why different topics related to this issue were studied: a) climate and it’svariability b) the subsequent ecological changes, c) the dynamics of human illnesses, d)human habitat, and e) the socioeconomic profile of the area (in order to have acomplete panorama of climate change impact on human health).
Region I, composed of the departments of Pando, Beni and the north of La Paz, waschosen by the National Program of Climate Change, in order to study malaria(originating from the plasmodium falciparum and the plasmodium vivax) andleshmaniasis; two typical illnesses of that region that would allow us to investigate theeffects of climate change on human health. A correlation between the I.P.A 7 index andleishmaniasis was made for the municipalities.
5 Climate Change and Human Health WHO, WMO, UNEP6 Illness and death7 The Parasites Annual Index measures the level of risk for each thousand inhabitants exposed to contract malaria.
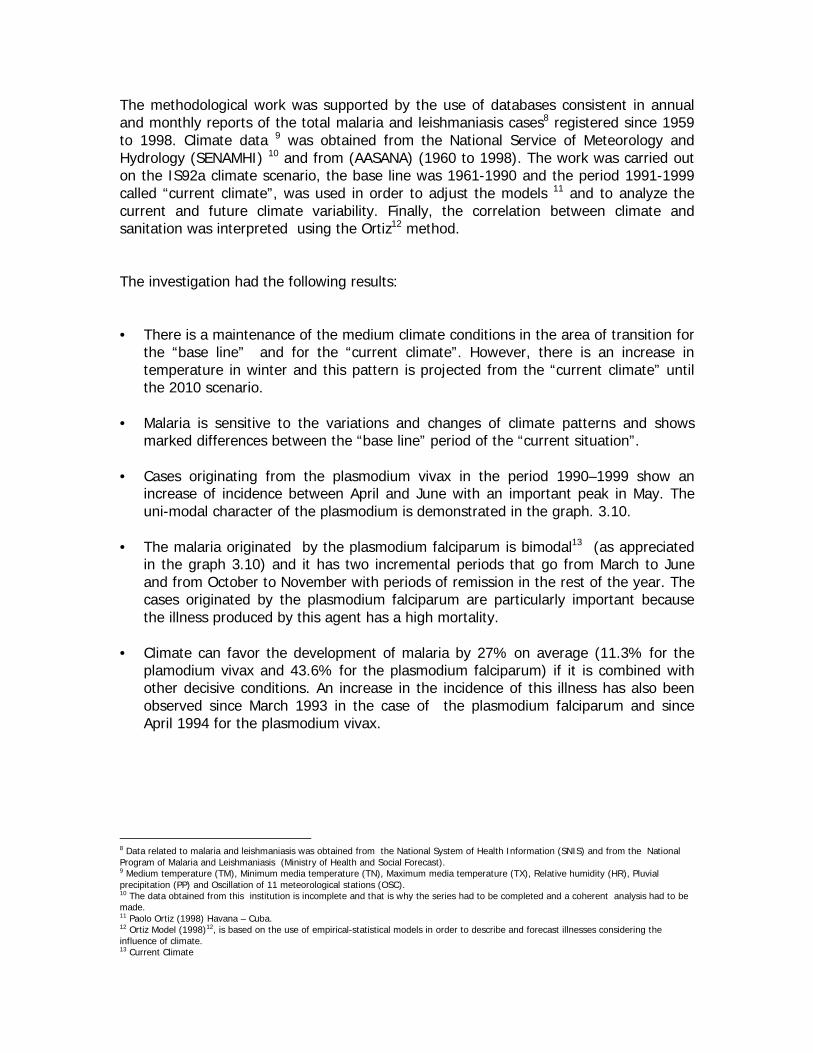
The methodological work was supported by the use of databases consistent in annualand monthly reports of the total malaria and leishmaniasis cases8 registered since 1959to 1998. Climate data 9 was obtained from the National Service of Meteorology andHydrology (SENAMHI) 10 and from (AASANA) (1960 to 1998). The work was carried outon the IS92a climate scenario, the base line was 1961-1990 and the period 1991-1999called “current climate”, was used in order to adjust the models 11 and to analyze thecurrent and future climate variability. Finally, the correlation between climate andsanitation was interpreted using the Ortiz12 method.
The investigation had the following results:
• There is a maintenance of the medium climate conditions in the area of transition forthe “base line” and for the “current climate”. However, there is an increase intemperature in winter and this pattern is projected from the “current climate” untilthe 2010 scenario.
• Malaria is sensitive to the variations and changes of climate patterns and showsmarked differences between the “base line” period of the “current situation”.
• Cases originating from the plasmodium vivax in the period 1990–1999 show anincrease of incidence between April and June with an important peak in May. Theuni-modal character of the plasmodium is demonstrated in the graph. 3.10.
• The malaria originated by the plasmodium falciparum is bimodal13 (as appreciatedin the graph 3.10) and it has two incremental periods that go from March to Juneand from October to November with periods of remission in the rest of the year. Thecases originated by the plasmodium falciparum are particularly important becausethe illness produced by this agent has a high mortality.
• Climate can favor the development of malaria by 27% on average (11.3% for theplamodium vivax and 43.6% for the plasmodium falciparum) if it is combined withother decisive conditions. An increase in the incidence of this illness has also beenobserved since March 1993 in the case of the plasmodium falciparum and sinceApril 1994 for the plasmodium vivax.
8 Data related to malaria and leishmaniasis was obtained from the National System of Health Information (SNIS) and from the NationalProgram of Malaria and Leishmaniasis (Ministry of Health and Social Forecast).9 Medium temperature (TM), Minimum media temperature (TN), Maximum media temperature (TX), Relative humidity (HR), Pluvialprecipitation (PP) and Oscillation of 11 meteorological stations (OSC).10 The data obtained from this institution is incomplete and that is why the series had to be completed and a coherent analysis had to bemade.11 Paolo Ortiz (1998) Havana – Cuba.12 Ortiz Model (1998)12, is based on the use of empirical-statistical models in order to describe and forecast illnesses considering theinfluence of climate.13 Current Climate
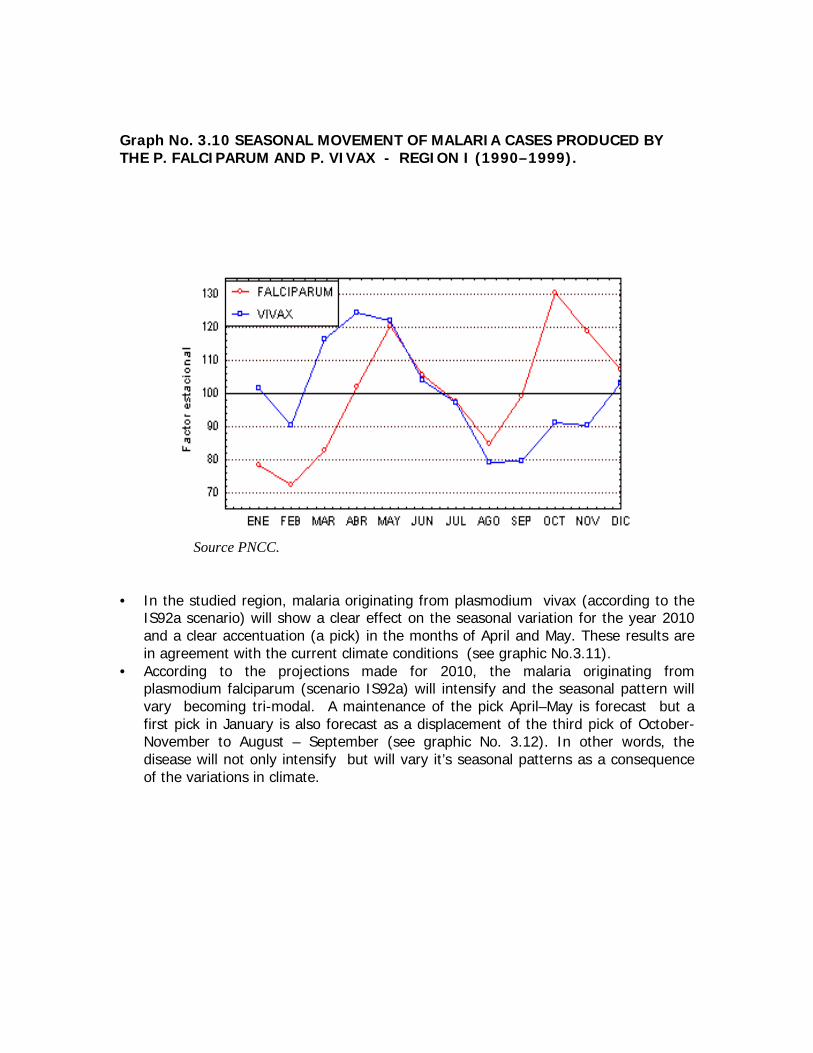
Graph No. 3.10 SEASONAL MOVEMENT OF MALARIA CASES PRODUCED BYTHE P. FALCIPARUM AND P. VIVAX - REGION I (1990–1999).
Source PNCC.
• In the studied region, malaria originating from plasmodium vivax (according to theIS92a scenario) will show a clear effect on the seasonal variation for the year 2010and a clear accentuation (a pick) in the months of April and May. These results arein agreement with the current climate conditions (see graphic No.3.11).
• According to the projections made for 2010, the malaria originating fromplasmodium falciparum (scenario IS92a) will intensify and the seasonal pattern willvary becoming tri-modal. A maintenance of the pick April–May is forecast but afirst pick in January is also forecast as a displacement of the third pick of October-November to August – September (see graphic No. 3.12). In other words, thedisease will not only intensify but will vary it’s seasonal patterns as a consequenceof the variations in climate.
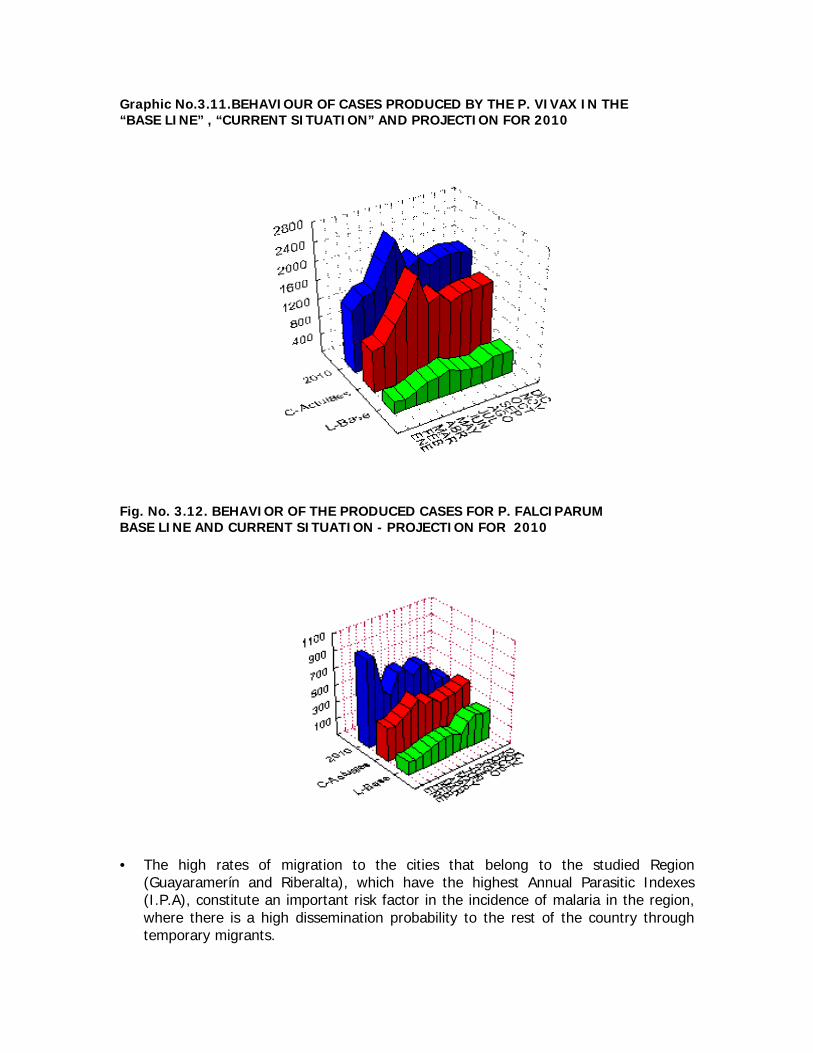
Graphic No.3.11.BEHAVIOUR OF CASES PRODUCED BY THE P. VIVAX IN THE“BASE LINE” , “CURRENT SITUATION” AND PROJECTION FOR 2010
Fig. No. 3.12. BEHAVIOR OF THE PRODUCED CASES FOR P. FALCIPARUMBASE LINE AND CURRENT SITUATION - PROJECTION FOR 2010
• The high rates of migration to the cities that belong to the studied Region(Guayaramerín and Riberalta), which have the highest Annual Parasitic Indexes(I.P.A), constitute an important risk factor in the incidence of malaria in the region,where there is a high dissemination probability to the rest of the country throughtemporary migrants.

• The analysis of the endemic and the hyper-endemic malaria is a problem relating toalmost 100% of the municipalities of the 7 departments of Bolivia, especially tothose regions characterized by high humidity. This can happen even when thetemperatures are not too high, as in the case of the sub-Andean area of Boliviawhere hyper-endemic municipalities have been discovered (map No.7).
Map No.7 PARASITE ANNUAL INDEX FOR MALARIA IN THE DIFFERENTMUNICIPALITIES - BOLIVIA 1998
Source: PNCC - Elaboration based on data provided by the MSPPS
• One of the most astonishing results of this investigation was being able to find ahyper-endemic region at 4000 meters above sea level of the sea. Puerto Pérez,situated in the Department of La Paz, has a Parasite Annual Index of 152.94 /1000inhabitants. This is a topic that should be deeply investigated in the future.
• The regions with high incidence of malaria (hyper-endemic) are characterized byhigh humidity, important pluvial precipitations, existence of different sources ofstagnant water that favor the development of malaria and a temperature that doesnot have to be necessarily high14. This result is correlated to climate variablesestablished in the Index of Bultó.
14 It is important to notice that the minimum temperature in which the parasites and vectors can survive are as low as20º C. This data is supported by the temperatures registered all along the sub-Andean zone of Bolivia where hyper-endemic zones have been found.
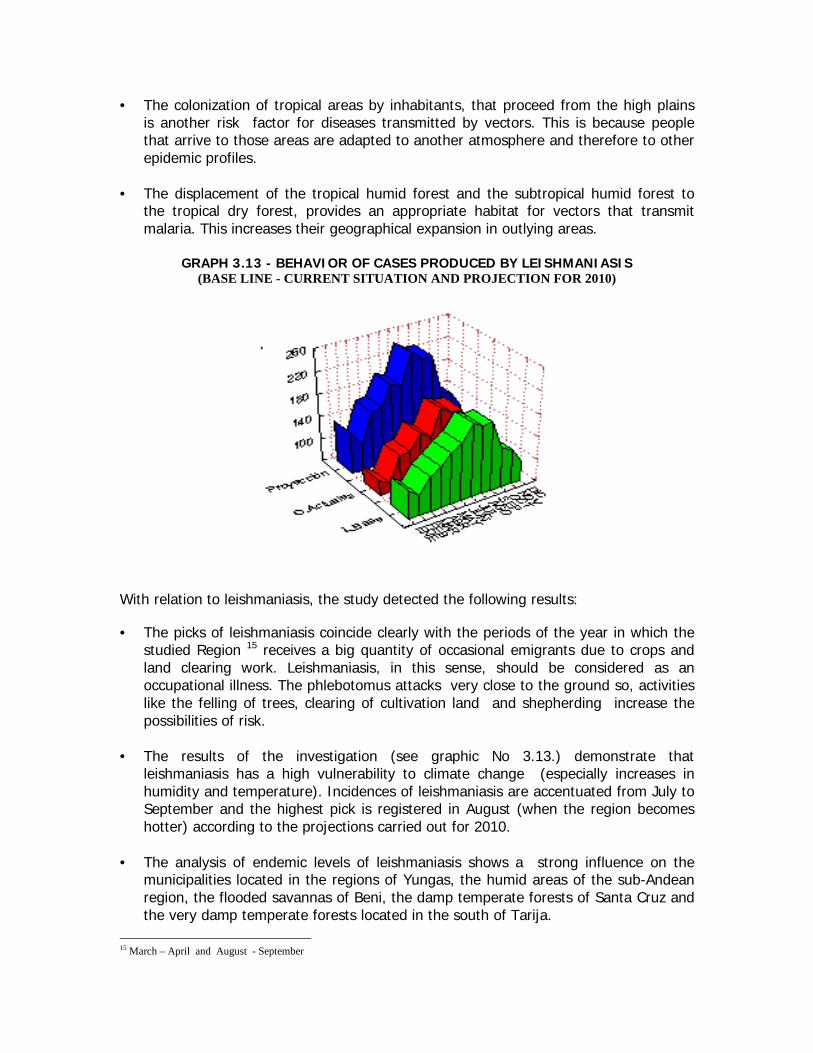
• The colonization of tropical areas by inhabitants, that proceed from the high plainsis another risk factor for diseases transmitted by vectors. This is because peoplethat arrive to those areas are adapted to another atmosphere and therefore to otherepidemic profiles.
• The displacement of the tropical humid forest and the subtropical humid forest tothe tropical dry forest, provides an appropriate habitat for vectors that transmitmalaria. This increases their geographical expansion in outlying areas.
GRAPH 3.13 - BEHAVIOR OF CASES PRODUCED BY LEISHMANIASIS(BASE LINE - CURRENT SITUATION AND PROJECTION FOR 2010)
With relation to leishmaniasis, the study detected the following results:
• The picks of leishmaniasis coincide clearly with the periods of the year in which thestudied Region 15 receives a big quantity of occasional emigrants due to crops andland clearing work. Leishmaniasis, in this sense, should be considered as anoccupational illness. The phlebotomus attacks very close to the ground so, activitieslike the felling of trees, clearing of cultivation land and shepherding increase thepossibilities of risk.
• The results of the investigation (see graphic No 3.13.) demonstrate thatleishmaniasis has a high vulnerability to climate change (especially increases inhumidity and temperature). Incidences of leishmaniasis are accentuated from July toSeptember and the highest pick is registered in August (when the region becomeshotter) according to the projections carried out for 2010.
• The analysis of endemic levels of leishmaniasis shows a strong influence on themunicipalities located in the regions of Yungas, the humid areas of the sub-Andeanregion, the flooded savannas of Beni, the damp temperate forests of Santa Cruz andthe very damp temperate forests located in the south of Tarija.
15 March – April and August - September
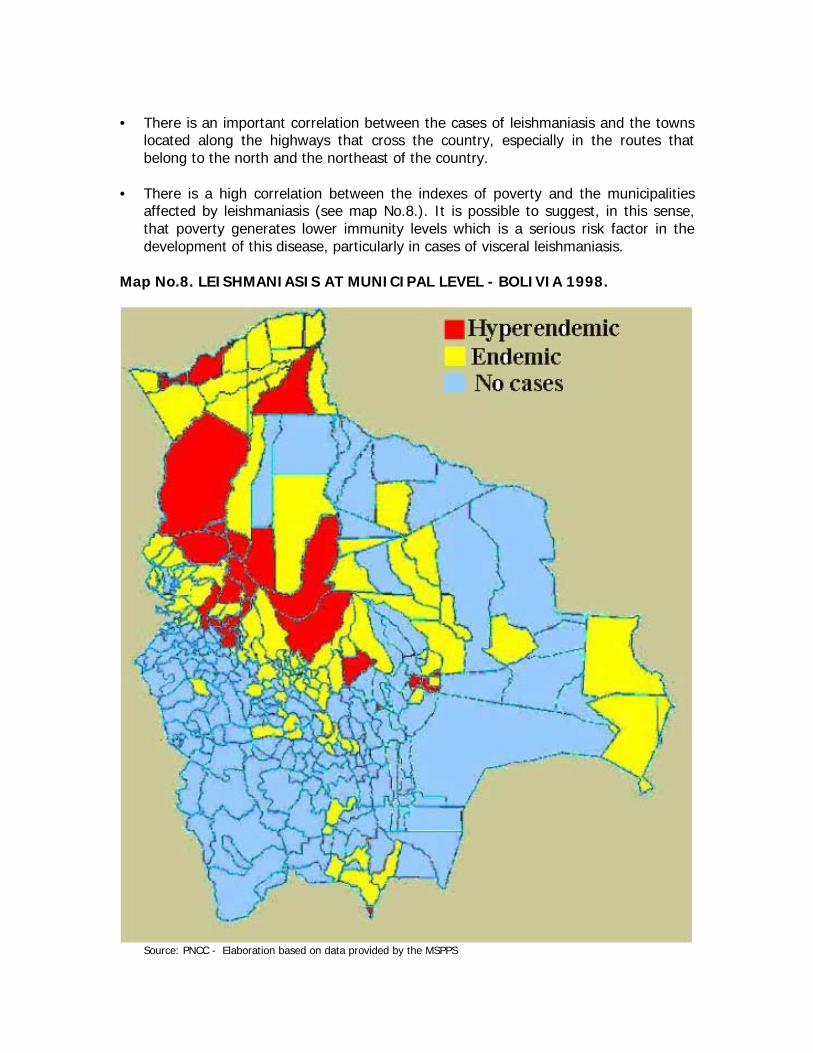
• There is an important correlation between the cases of leishmaniasis and the townslocated along the highways that cross the country, especially in the routes thatbelong to the north and the northeast of the country.
• There is a high correlation between the indexes of poverty and the municipalitiesaffected by leishmaniasis (see map No.8.). It is possible to suggest, in this sense,that poverty generates lower immunity levels which is a serious risk factor in thedevelopment of this disease, particularly in cases of visceral leishmaniasis.
Map No.8. LEISHMANIASIS AT MUNICIPAL LEVEL - BOLIVIA 1998.
Source: PNCC - Elaboration based on data provided by the MSPPS
• The increase in temperature and pluvial precipitation (damp) in the studied regiontends to increase the number of vectors, the geographical extension of their habitatand, of course, the cases of malaria and leishmaniasis. This occurs in traditional andnew areas of vector occupation, where the incidence of cases will be particularlyimportant due to the low immunity developed by the inhabitants.
• Even when climate must be considered as a whole, it is important to say that thepluvial precipitation, followed by the relative dampness and the minimumtemperature, are climate factors with high influence on the vulnerability of humanhealth (as in malaria cases).
“El Niño” Southern Oscillation
Like many other countries, Bolivia has also experienced the effects produced by “ElNiño” . Since 1983, the country has suffered increases in drought and floods. In thissense, it is possible to affirm that climate change is causing an important incidence inthe effects of “El Niño” since it has been occurring with more frequency and higherincidence in the last years.
In the last decade, extensive areas of valleys and high plains in Bolivia have suffereddroughts that have caused the loss of enormous resources (crops and livestock). At thesame time, the regions that belong to the east of the country have suffered floods withthe consequent loss of crops, livestock and inhabitants' forced migration.
It was also shown that “El Niño” was accompanied by increases in precipitation in theeast and droughts in the west. In some cases, “El Niño” also was responsible forescalation in hailstorms in the inter-Andean valleys.
Other marginal effects of this phenomenon are related to extreme winds (that, in somecases, do not belong to the circle of the tropical hurricanes) and fires in places with atendency to droughts which cause serious damages in the forests (medium reliability).The cyclonal season of the eastern Pacific (from June to November) must also bementioned as a threat affecting the heating of the sea, the pockets of air and the actionof “El Niño”. The cycle is extended from January to May, generating a cyclonal seasonof 12 months.
ADAPTATIONAdaptation measures for the forest sector
The National Program of Climate Change, that belongs to the Environment, NaturalResources and Forestry Development Vice-ministry (MDSMA. 1997, MDSP.2000) has setdown, in it’s initial studies, the following strategic features in the forest sector:
- Sustainable use of forest- Improvement in the inhabitant's quality of life

- Elevation of efficiency in the industrialization processes- Development and growth of the sector
The mentioned features need the following adaptation measures:
- To identify species that can tolerate climate change.- To reduce fragmentation of habitat.
The National Program of Climate Change (MDSP. 1998) also includes the possibility ofimproving forest use as a measure of adaptation to climate change.
Other specific measures relating to the reduction of emissions have been considered asmitigation measures. Some of these measures include technological changes ormodifications of cultural practices.
Adaptation measures in the agricultural sector
Different adaptation measures have been outlined by the National Program of ClimateChange (PNCC,1998) in order to prevent and reduce the negative effects of probableclimate change, especially on crops which have economic importance and relate to thepopulation's alimentary security.
- Management of land and water- Agricultural investigation- Interactive transfer of technology
These measures maintain a narrow relationship with the government's Economic andSocial Development General Plan, where it has been written that “preservation of thenational dignity and sovereignty relates to consolidation of alimentary security throughthe development of an agricultural-alimentary system that could become a fundamentalaxis in the fight against poverty".
In the grassland and livestock sectors, the following adaptation measures wereproposed:
- identification of resistant grassland- introduction of native grassland- introduction of new livestock- migration- changes in the shepherding cycles- supplementary diets.
Adaptation measures for water resources
The studies of sensitivity carried out by the National Program of Climate Change(MDSMA. 1997) do not only propose different measures of adaptation but they also
revise the effectiveness of them. The following is a list of adaptation measures proposedin this area:
- Coordinated planning of the use of water in the different basins- Construction of regulation, irrigation and storage works- Adoption of conservation politics- Control of water quality- Systems of controlled and remunerated supplies- Adoption of contingency plans- Operations that could allow the transfer of water to intermediate basins- Systems for forecasting floods and droughts- Training and education in the management and consumption of water.
Measures of prevention and adaptation for human health
Different adaptation measures were identified in order to tackle the impacts of climatechange on human health:
� Care of the environment� Chemical control� Reservoir control� Biological control� Reduction of the vector contact� Community participation� Epidemiological / climate surveillance� Sanitary education
The implementation of these measures require the fulfillment of the following lines ofaction:
• To deepen the knowledge regarding the impact of climate change on humanhealth.
• To carry out studies on human health vulnerability to climate change.• To spread the knowledge of different sanitary projections in relation to climate
scenarios proposed for the Region I.• To study the application of new control measures and vectoral elimination (the
biological control, for example).• To incorporate in the Health Subsystem Information the monitoring of certain
environmental parameters (climatological and entomological)• To set down a system of epidemic surveillance that incorporates vectoral and
climatological parameters.• To motivate the varied groups related to health (municipal and departmental
health organizations), to incorporate aspects of the impact of climate change onhuman health, to their politics, strategies, operative plans and activities.
• To develop plans and actions between all the groups suggested in order to allowthe Ministries of Sustainable Development and the Ministry of Health and SocialForecast, to develop programs of prevention in endemic areas, regions
dedicated to colonization and in places where development projects are beingheld.
• To carry out studies of cost-efficiency and cost-benefit for each method ofvectoral control
• To prioritize the areas of malaria and leishmaniasis, identifying the predominantvectoral species.
• To prioritize community participation in the control of malaria and leishmaniasisat municipal level.
• To carry out entomological studies in the vectoral habitat in order tocharacterize and identify these areas, to determine the best biological agent fortheir control.
• To improve the level of education (especially for operative personnel) insubjects related to climate influence, the vector’s behavior and the population'sdynamics.
• To strengthen local and departmental health networks in order to carry outunited actions, to respond with efficiency to the direct (droughts, floods,storms, etc.) and indirect ( increase in health service demand) effects of climatechange.
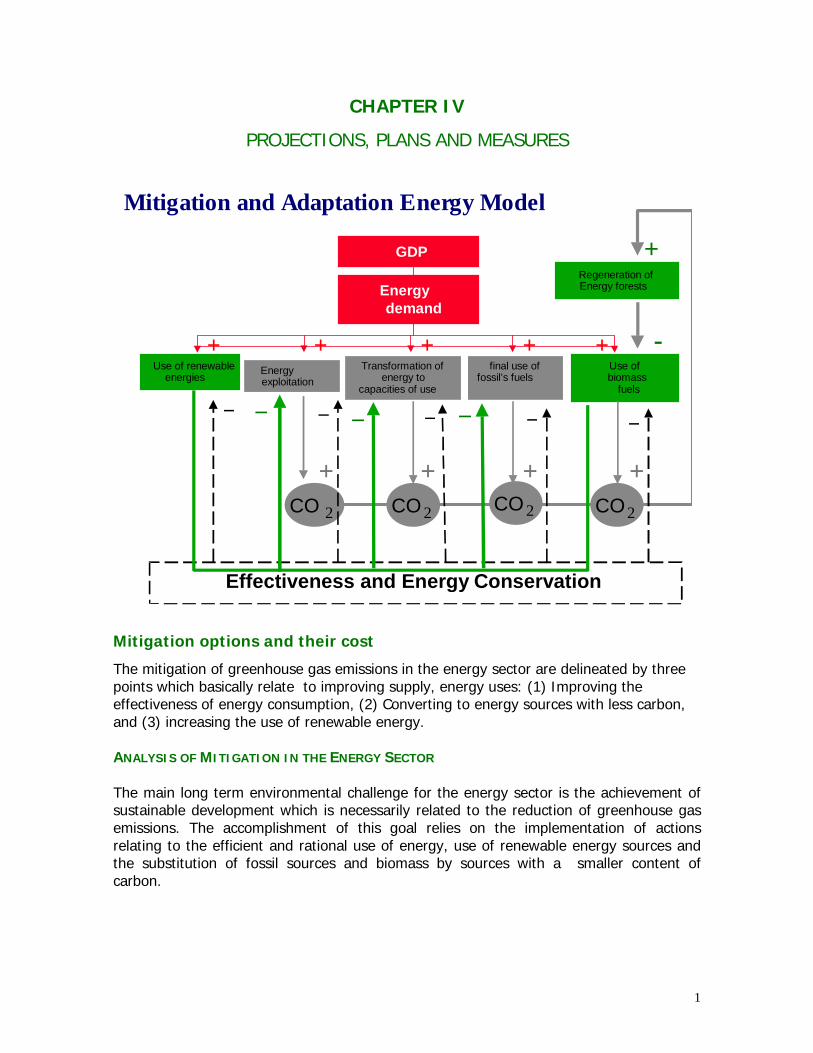
1
CHAPTER IV
PROJECTIONS, PLANS AND MEASURES
Mitigation options and their cost
The mitigation of greenhouse gas emissions in the energy sector are delineated by threepoints which basically relate to improving supply, energy uses: (1) Improving theeffectiveness of energy consumption, (2) Converting to energy sources with less carbon,and (3) increasing the use of renewable energy.
ANALYSIS OF MITIGATION IN THE ENERGY SECTOR
The main long term environmental challenge for the energy sector is the achievement ofsustainable development which is necessarily related to the reduction of greenhouse gasemissions. The accomplishment of this goal relies on the implementation of actionsrelating to the efficient and rational use of energy, use of renewable energy sources andthe substitution of fossil sources and biomass by sources with a smaller content ofcarbon.
CO 2
Energy demand
Use of renewable energies Energy
exploitation Transformation of
energy tocapacities of use
final use offossil’s fuels
Use of biomass fuels
CO 2
Regeneration of Energy forests
CO 2 CO 2
Effectiveness and Energy Conservation
GDP
+ + + +
_ _ _ _ _ _ _
-
+
+ + + + +
Mitigation and Adaptation Energy Model
_
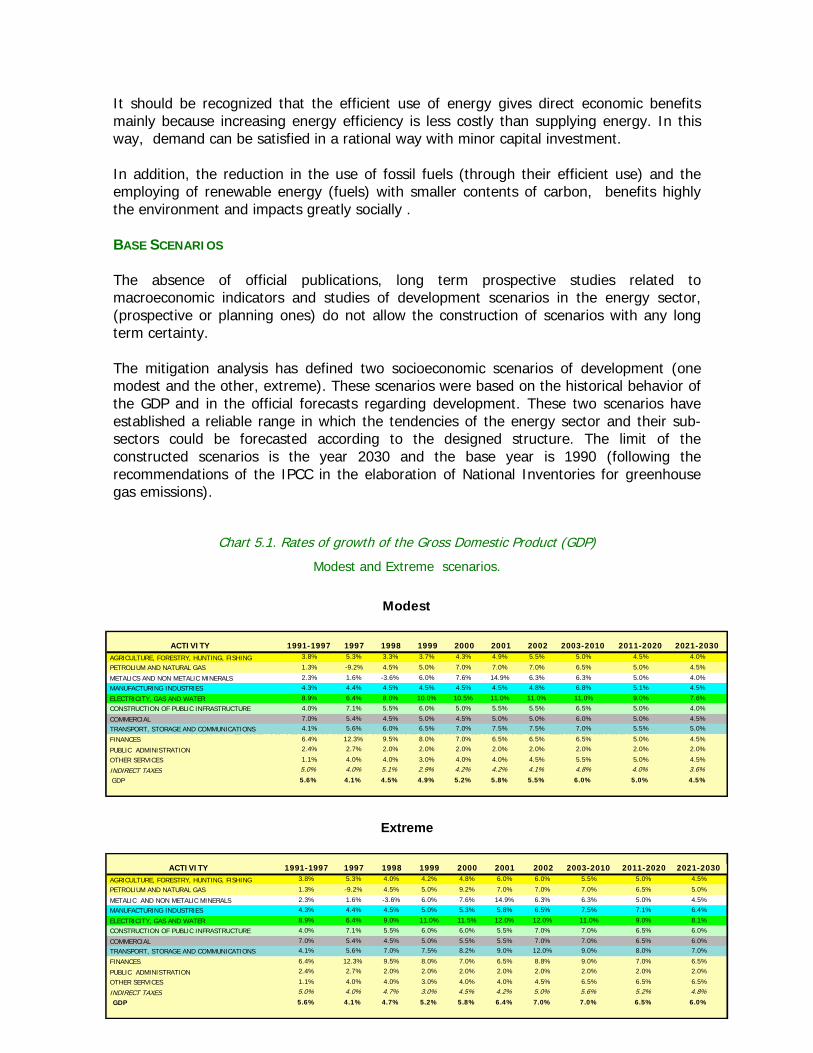
2
It should be recognized that the efficient use of energy gives direct economic benefitsmainly because increasing energy efficiency is less costly than supplying energy. In thisway, demand can be satisfied in a rational way with minor capital investment.
In addition, the reduction in the use of fossil fuels (through their efficient use) and theemploying of renewable energy (fuels) with smaller contents of carbon, benefits highlythe environment and impacts greatly socially .
BASE SCENARIOS
The absence of official publications, long term prospective studies related tomacroeconomic indicators and studies of development scenarios in the energy sector,(prospective or planning ones) do not allow the construction of scenarios with any longterm certainty.
The mitigation analysis has defined two socioeconomic scenarios of development (onemodest and the other, extreme). These scenarios were based on the historical behavior ofthe GDP and in the official forecasts regarding development. These two scenarios haveestablished a reliable range in which the tendencies of the energy sector and their sub-sectors could be forecasted according to the designed structure. The limit of theconstructed scenarios is the year 2030 and the base year is 1990 (following therecommendations of the IPCC in the elaboration of National Inventories for greenhousegas emissions).
Chart 5.1. Rates of growth of the Gross Domestic Product (GDP)
Modest and Extreme scenarios.
Modest
Chart 2. Rates of Growth of the Internal Product Bruto (GDP)–High Scenario.
Extreme
ACTIVITY 1991-1997 1997 1998 1999 2000 2001 2002 2003-2010 2011-2020 2021-2030
AGRICULTURE, FORESTRY, HUNTING, FISHING 3.8% 5.3% 3.3% 3.7% 4.3% 4.9% 5.5% 5.0% 4.5% 4.0%
PETROLIUM AND NATURAL GAS 1.3% -9.2% 4.5% 5.0% 7.0% 7.0% 7.0% 6.5% 5.0% 4.5%
METALICS AND NON METALIC MINERALS 2.3% 1.6% -3.6% 6.0% 7.6% 14.9% 6.3% 6.3% 5.0% 4.0%
MANUFACTURING INDUSTRIES 4.3% 4.4% 4.5% 4.5% 4.5% 4.5% 4.8% 6.8% 5.1% 4.5%
ELECTRICITY, GAS AND WATER 8.9% 6.4% 8.0% 10.0% 10.5% 11.0% 11.0% 11.0% 9.0% 7.6%
CONSTRUCTION OF PUBLIC INFRASTRUCTURE 4.0% 7.1% 5.5% 6.0% 5.0% 5.5% 5.5% 6.5% 5.0% 4.0%
COMMERCIAL 7.0% 5.4% 4.5% 5.0% 4.5% 5.0% 5.0% 6.0% 5.0% 4.5%
TRANSPORT, STORAGE AND COMMUNICATIONS 4.1% 5.6% 6.0% 6.5% 7.0% 7.5% 7.5% 7.0% 5.5% 5.0%
FINANCES 6.4% 12.3% 9.5% 8.0% 7.0% 6.5% 6.5% 6.5% 5.0% 4.5%
PUBLIC ADMINISTRATION 2.4% 2.7% 2.0% 2.0% 2.0% 2.0% 2.0% 2.0% 2.0% 2.0%
OTHER SERVICES 1.1% 4.0% 4.0% 3.0% 4.0% 4.0% 4.5% 5.5% 5.0% 4.5%
INDIRECT TAXES 5.0% 4.0% 5.1% 2.9% 4.2% 4.2% 4.1% 4.8% 4.0% 3.6%
GDP 5.6% 4.1% 4.5% 4.9% 5.2% 5.8% 5.5% 6.0% 5.0% 4.5%
ACTIVITY 1991-1997 1997 1998 1999 2000 2001 2002 2003-2010 2011-2020 2021-2030
AGRICULTURE, FORESTRY, HUNTING, FISHING 3.8% 5.3% 4.0% 4.2% 4.8% 6.0% 6.0% 5.5% 5.0% 4.5%
PETROLIUM AND NATURAL GAS 1.3% -9.2% 4.5% 5.0% 9.2% 7.0% 7.0% 7.0% 6.5% 5.0%
METALIC AND NON METALIC MINERALS 2.3% 1.6% -3.6% 6.0% 7.6% 14.9% 6.3% 6.3% 5.0% 4.5%
MANUFACTURING INDUSTRIES 4.3% 4.4% 4.5% 5.0% 5.3% 5.8% 6.5% 7.5% 7.1% 6.4%
ELECTRICITY, GAS AND WATER 8.9% 6.4% 9.0% 11.0% 11.5% 12.0% 12.0% 11.0% 9.0% 8.1%
CONSTRUCTION OF PUBLIC INFRASTRUCTURE 4.0% 7.1% 5.5% 6.0% 6.0% 5.5% 7.0% 7.0% 6.5% 6.0%
COMMERCIAL 7.0% 5.4% 4.5% 5.0% 5.5% 5.5% 7.0% 7.0% 6.5% 6.0%
TRANSPORT, STORAGE AND COMMUNICATIONS 4.1% 5.6% 7.0% 7.5% 8.2% 9.0% 12.0% 9.0% 8.0% 7.0%
FINANCES 6.4% 12.3% 9.5% 8.0% 7.0% 6.5% 8.8% 9.0% 7.0% 6.5%
PUBLIC ADMINISTRATION 2.4% 2.7% 2.0% 2.0% 2.0% 2.0% 2.0% 2.0% 2.0% 2.0%
OTHER SERVICES 1.1% 4.0% 4.0% 3.0% 4.0% 4.0% 4.5% 6.5% 6.5% 6.5%
INDIRECT TAXES 5.0% 4.0% 4.7% 3.0% 4.5% 4.2% 5.0% 5.6% 5.2% 4.8%
GDP 5.6% 4.1% 4.7% 5.2% 5.8% 6.4% 7.0% 7.0% 6.5% 6.0%
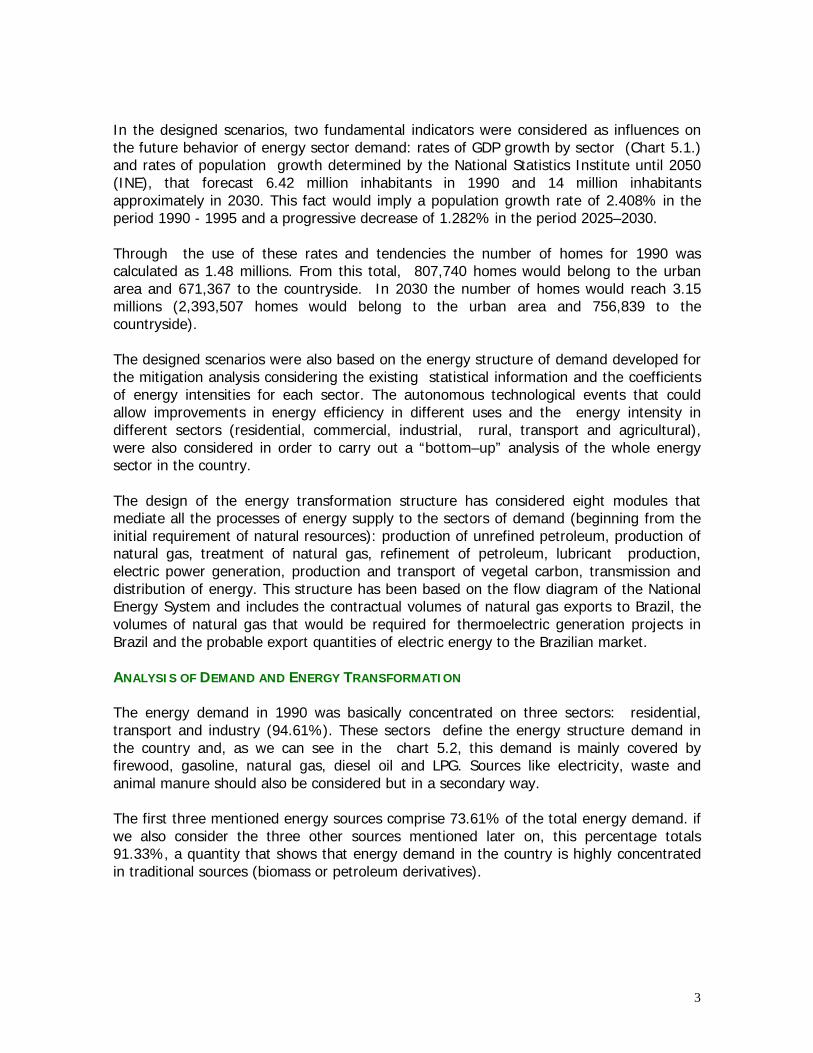
3
In the designed scenarios, two fundamental indicators were considered as influences onthe future behavior of energy sector demand: rates of GDP growth by sector (Chart 5.1.)and rates of population growth determined by the National Statistics Institute until 2050(INE), that forecast 6.42 million inhabitants in 1990 and 14 million inhabitantsapproximately in 2030. This fact would imply a population growth rate of 2.408% in theperiod 1990 - 1995 and a progressive decrease of 1.282% in the period 2025–2030.
Through the use of these rates and tendencies the number of homes for 1990 wascalculated as 1.48 millions. From this total, 807,740 homes would belong to the urbanarea and 671,367 to the countryside. In 2030 the number of homes would reach 3.15millions (2,393,507 homes would belong to the urban area and 756,839 to thecountryside).
The designed scenarios were also based on the energy structure of demand developed forthe mitigation analysis considering the existing statistical information and the coefficientsof energy intensities for each sector. The autonomous technological events that couldallow improvements in energy efficiency in different uses and the energy intensity indifferent sectors (residential, commercial, industrial, rural, transport and agricultural),were also considered in order to carry out a “bottom–up” analysis of the whole energysector in the country.
The design of the energy transformation structure has considered eight modules thatmediate all the processes of energy supply to the sectors of demand (beginning from theinitial requirement of natural resources): production of unrefined petroleum, production ofnatural gas, treatment of natural gas, refinement of petroleum, lubricant production,electric power generation, production and transport of vegetal carbon, transmission anddistribution of energy. This structure has been based on the flow diagram of the NationalEnergy System and includes the contractual volumes of natural gas exports to Brazil, thevolumes of natural gas that would be required for thermoelectric generation projects inBrazil and the probable export quantities of electric energy to the Brazilian market.
ANALYSIS OF DEMAND AND ENERGY TRANSFORMATION
The energy demand in 1990 was basically concentrated on three sectors: residential,transport and industry (94.61%). These sectors define the energy structure demand inthe country and, as we can see in the chart 5.2, this demand is mainly covered byfirewood, gasoline, natural gas, diesel oil and LPG. Sources like electricity, waste andanimal manure should also be considered but in a secondary way.
The first three mentioned energy sources comprise 73.61% of the total energy demand. ifwe also consider the three other sources mentioned later on, this percentage totals91.33%, a quantity that shows that energy demand in the country is highly concentratedin traditional sources (biomass or petroleum derivatives).
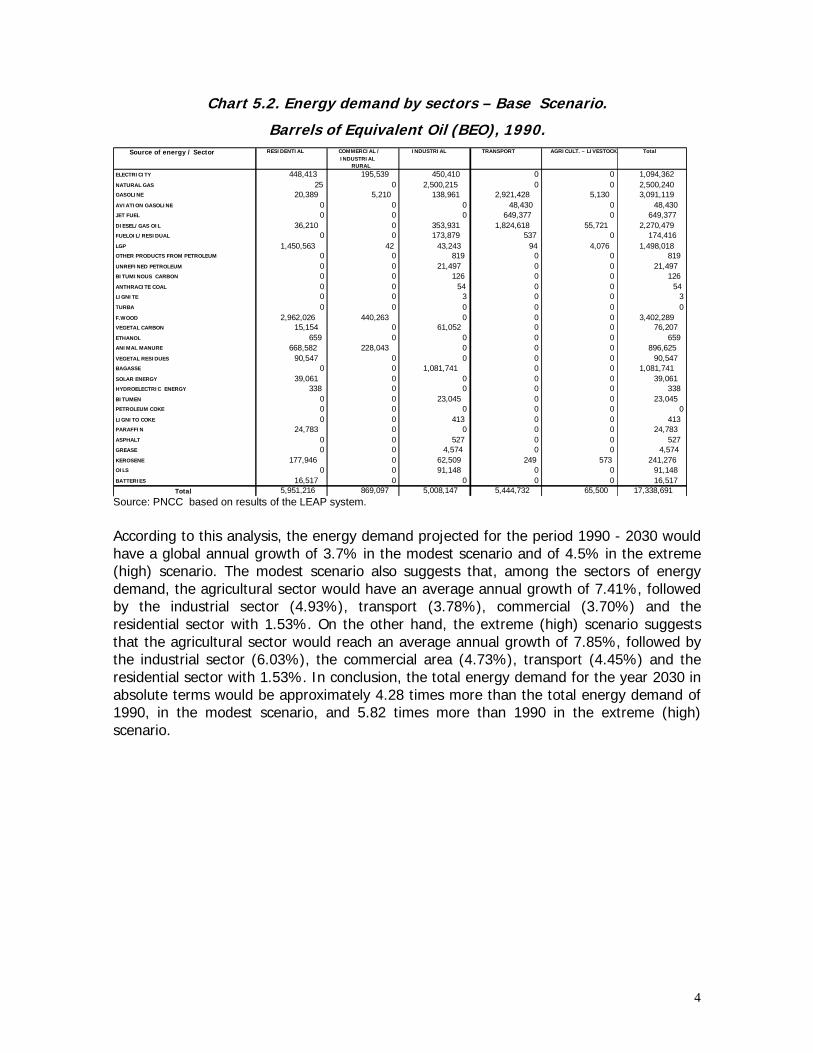
4
Chart 5.2. Energy demand by sectors – Base Scenario.
Barrels of Equivalent Oil (BEO), 1990.
Source of energy / Sector RESIDENTIAL COMMERCIAL / INDUSTRIAL
RURAL
INDUSTRIAL TRANSPORT AGRICULT. – LIVESTOCK Total
ELECTRICITY 448,413 195,539 450,410 0 0 1,094,362NATURAL GAS 25 0 2,500,215 0 0 2,500,240GASOLINE 20,389 5,210 138,961 2,921,428 5,130 3,091,119AVIATION GASOLINE 0 0 0 48,430 0 48,430JET FUEL 0 0 0 649,377 0 649,377DIESEL/GAS OIL 36,210 0 353,931 1,824,618 55,721 2,270,479FUELOIL/RESIDUAL 0 0 173,879 537 0 174,416LGP 1,450,563 42 43,243 94 4,076 1,498,018OTHER PRODUCTS FROM PETROLEUM 0 0 819 0 0 819UNREFINED PETROLEUM 0 0 21,497 0 0 21,497BITUMINOUS CARBON 0 0 126 0 0 126ANTHRACITE COAL 0 0 54 0 0 54LIGNITE 0 0 3 0 0 3TURBA 0 0 0 0 0 0F.WOOD 2,962,026 440,263 0 0 0 3,402,289VEGETAL CARBON 15,154 0 61,052 0 0 76,207ETHANOL 659 0 0 0 0 659ANIMAL MANURE 668,582 228,043 0 0 0 896,625VEGETAL RESIDUES 90,547 0 0 0 0 90,547BAGASSE 0 0 1,081,741 0 0 1,081,741SOLAR ENERGY 39,061 0 0 0 0 39,061HYDROELECTRIC ENERGY 338 0 0 0 0 338BITUMEN 0 0 23,045 0 0 23,045PETROLEUM COKE 0 0 0 0 0 0LIGNITO COKE 0 0 413 0 0 413PARAFFIN 24,783 0 0 0 0 24,783ASPHALT 0 0 527 0 0 527GREASE 0 0 4,574 0 0 4,574KEROSENE 177,946 0 62,509 249 573 241,276OILS 0 0 91,148 0 0 91,148BATTERIES 16,517 0 0 0 0 16,517
Total 5,951,216 869,097 5,008,147 5,444,732 65,500 17,338,691
Source: PNCC based on results of the LEAP system.
According to this analysis, the energy demand projected for the period 1990 - 2030 wouldhave a global annual growth of 3.7% in the modest scenario and of 4.5% in the extreme(high) scenario. The modest scenario also suggests that, among the sectors of energydemand, the agricultural sector would have an average annual growth of 7.41%, followedby the industrial sector (4.93%), transport (3.78%), commercial (3.70%) and theresidential sector with 1.53%. On the other hand, the extreme (high) scenario suggeststhat the agricultural sector would reach an average annual growth of 7.85%, followed bythe industrial sector (6.03%), the commercial area (4.73%), transport (4.45%) and theresidential sector with 1.53%. In conclusion, the total energy demand for the year 2030 inabsolute terms would be approximately 4.28 times more than the total energy demand of1990, in the modest scenario, and 5.82 times more than 1990 in the extreme (high)scenario.
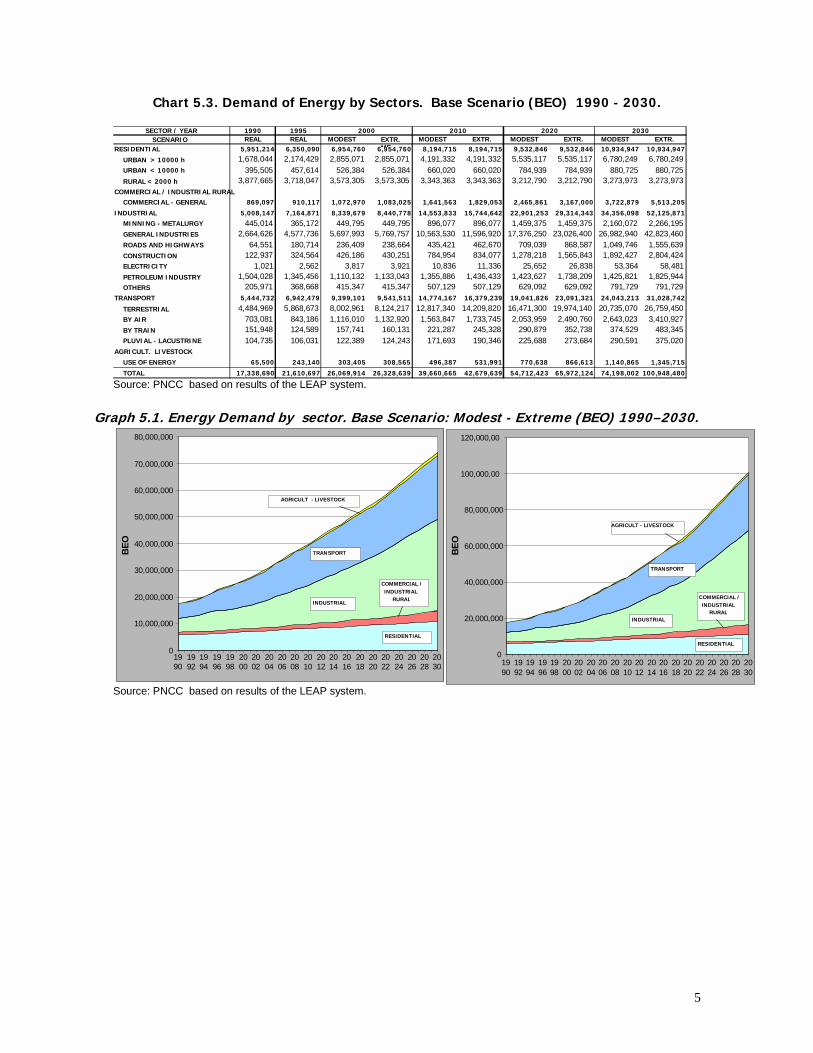
5
Chart 5.3. Demand of Energy by Sectors. Base Scenario (BEO) 1990 - 2030.
1990 1995 REAL REAL MODEST EXTR.
MEMODEST EXTR. MODEST EXTR. MODEST EXTR.
RESIDENTIAL 5,951,214 6,350,090 6,954,760 6,954,760 8,194,715 8,194,715 9,532,846 9,532,846 10,934,947 10,934,947
URBAN > 10000 h 1,678,044 2,174,429 2,855,071 2,855,071 4,191,332 4,191,332 5,535,117 5,535,117 6,780,249 6,780,249URBAN < 10000 h 395,505 457,614 526,384 526,384 660,020 660,020 784,939 784,939 880,725 880,725RURAL < 2000 h 3,877,665 3,718,047 3,573,305 3,573,305 3,343,363 3,343,363 3,212,790 3,212,790 3,273,973 3,273,973
COMMERCIAL / INDUSTRIAL RURAL COMMERCIAL - GENERAL 869,097 910,117 1,072,970 1,083,025 1,641,563 1,829,053 2,465,861 3,167,000 3,722,879 5,513,205
INDUSTRIAL 5,008,147 7,164,871 8,339,679 8,440,778 14,553,833 15,744,642 22,901,253 29,314,343 34,356,098 52,125,871MINNING - METALURGY 445,014 365,172 449,795 449,795 896,077 896,077 1,459,375 1,459,375 2,160,072 2,266,195GENERAL INDUSTRIES 2,664,626 4,577,736 5,697,993 5,769,757 10,563,530 11,596,920 17,376,250 23,026,400 26,982,940 42,823,460ROADS AND HIGHWAYS 64,551 180,714 236,409 238,664 435,421 462,670 709,039 868,587 1,049,746 1,555,639CONSTRUCTION 122,937 324,564 426,186 430,251 784,954 834,077 1,278,218 1,565,843 1,892,427 2,804,424ELECTRICITY 1,021 2,562 3,817 3,921 10,836 11,336 25,652 26,838 53,364 58,481PETROLEUM INDUSTRY 1,504,028 1,345,456 1,110,132 1,133,043 1,355,886 1,436,433 1,423,627 1,738,209 1,425,821 1,825,944OTHERS 205,971 368,668 415,347 415,347 507,129 507,129 629,092 629,092 791,729 791,729
TRANSPORT 5,444,732 6,942,479 9,399,101 9,541,511 14,774,167 16,379,239 19,041,826 23,091,321 24,043,213 31,028,742
TERRESTRIAL 4,484,969 5,868,673 8,002,961 8,124,217 12,817,340 14,209,820 16,471,300 19,974,140 20,735,070 26,759,450BY AIR 703,081 843,186 1,116,010 1,132,920 1,563,847 1,733,745 2,053,959 2,490,760 2,643,023 3,410,927BY TRAIN 151,948 124,589 157,741 160,131 221,287 245,328 290,879 352,738 374,529 483,345PLUVIAL - LACUSTRINE 104,735 106,031 122,389 124,243 171,693 190,346 225,688 273,684 290,591 375,020
AGRICULT. LIVESTOCK USE OF ENERGY 65,500 243,140 303,405 308,565 496,387 531,991 770,638 866,613 1,140,865 1,345,715
TOTAL 17,338,690 21,610,697 26,069,914 26,328,639 39,660,665 42,679,639 54,712,423 65,972,124 74,198,002 100,948,480
2020 2030 SECTOR / YEAR SCENARIO 2000 2010
Source: PNCC based on results of the LEAP system.
Graph 5.1. Energy Demand by sector. Base Scenario: Modest - Extreme (BEO) 1990–2030.
RESIDENTIAL
COMMERCIAL / INDUSTRIAL
RURALINDUSTRIAL
TRANSPORT
AGRICULT - LIVESTOCK
0
10,000,000
20,000,000
30,000,000
40,000,000
50,000,000
60,000,000
70,000,000
80,000,000
1990 19
92 1994 19
96 1998 20
00 2002 20
04 2006 20
08 2010 20
12 2014
2016
2018
2020
2022
2024
2026
2028
2030
BEO
Source: PNCC based on results of the LEAP system.
RESIDENTIAL
COMMERCIAL / INDUSTRIAL
RURALINDUSTRIAL
TRANSPORT
AGRICULT - LIVESTOCK
0
20,000,000
40,000,000
60,000,000
80,000,000
100,000,00
120,000,00
1990
1992
1994
1996
1998
2000 20
02 2004 20
06 2008 20
10 2012 20
142016
2018
2020
2022
2024
2026
2028
2030
BEO
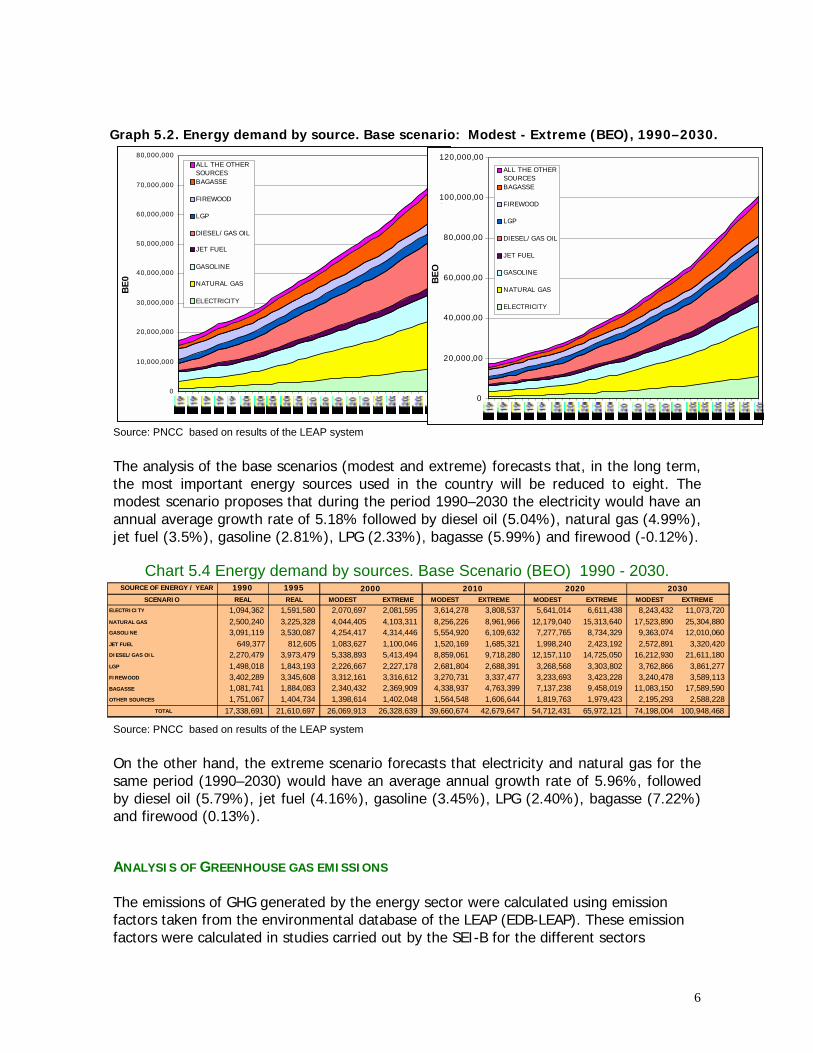
6
Graph 5.2. Energy demand by source. Base scenario: Modest - Extreme (BEO), 1990–2030.
0
10,000,000
20,000,000
30,000,000
40,000,000
50,000,000
60,000,000
70,000,000
80,000,000
BE0
ALL THE OTHER SOURCES BAGASSE FIREWOOD LGP DIESEL/ GAS OIL JET FUEL GASOLINE NATURAL GAS ELECTRICITY
Source: PNCC based on results of the LEAP system
The analysis of the base scenarios (modest and extreme) forecasts that, in the long term,the most important energy sources used in the country will be reduced to eight. Themodest scenario proposes that during the period 1990–2030 the electricity would have anannual average growth rate of 5.18% followed by diesel oil (5.04%), natural gas (4.99%),jet fuel (3.5%), gasoline (2.81%), LPG (2.33%), bagasse (5.99%) and firewood (-0.12%).
Chart 5.4 Energy demand by sources. Base Scenario (BEO) 1990 - 2030.
Source: PNCC based on results of the LEAP system
On the other hand, the extreme scenario forecasts that electricity and natural gas for thesame period (1990–2030) would have an average annual growth rate of 5.96%, followedby diesel oil (5.79%), jet fuel (4.16%), gasoline (3.45%), LPG (2.40%), bagasse (7.22%)and firewood (0.13%).
ANALYSIS OF GREENHOUSE GAS EMISSIONS
The emissions of GHG generated by the energy sector were calculated using emissionfactors taken from the environmental database of the LEAP (EDB-LEAP). These emissionfactors were calculated in studies carried out by the SEI-B for the different sectors
0
20,000,00
40,000,00
60,000,00
80,000,00
100,000,000
120,000,000
BEO
ALL THE OTHERSOURCESBAGASSE
FIREWOOD
LGP
DIESEL/ GAS OIL
JET FUEL
GASOLINE
NATURAL GAS
ELECTRICITY
SOURCE OF ENERGY / YEAR 1990 1995 SCENARIO REAL REAL MODEST EXTREME MODEST EXTREME MODEST EXTREME MODEST EXTREME
ELECTRICITY 1,094,362 1,591,580 2,070,697 2,081,595 3,614,278 3,808,537 5,641,014 6,611,438 8,243,432 11,073,720NATURAL GAS 2,500,240 3,225,328 4,044,405 4,103,311 8,256,226 8,961,966 12,179,040 15,313,640 17,523,890 25,304,880GASOLINE 3,091,119 3,530,087 4,254,417 4,314,446 5,554,920 6,109,632 7,277,765 8,734,329 9,363,074 12,010,060JET FUEL 649,377 812,605 1,083,627 1,100,046 1,520,169 1,685,321 1,998,240 2,423,192 2,572,891 3,320,420DIESEL/GAS OIL 2,270,479 3,973,479 5,338,893 5,413,494 8,859,061 9,718,280 12,157,110 14,725,050 16,212,930 21,611,180LGP 1,498,018 1,843,193 2,226,667 2,227,178 2,681,804 2,688,391 3,268,568 3,303,802 3,762,866 3,861,277FIREWOOD 3,402,289 3,345,608 3,312,161 3,316,612 3,270,731 3,337,477 3,233,693 3,423,228 3,240,478 3,589,113BAGASSE 1,081,741 1,884,083 2,340,432 2,369,909 4,338,937 4,763,399 7,137,238 9,458,019 11,083,150 17,589,590OTHER SOURCES 1,751,067 1,404,734 1,398,614 1,402,048 1,564,548 1,606,644 1,819,763 1,979,423 2,195,293 2,588,228
TOTAL 17,338,691 21,610,697 26,069,913 26,328,639 39,660,674 42,679,647 54,712,431 65,972,121 74,198,004 100,948,468
20302020 20102000
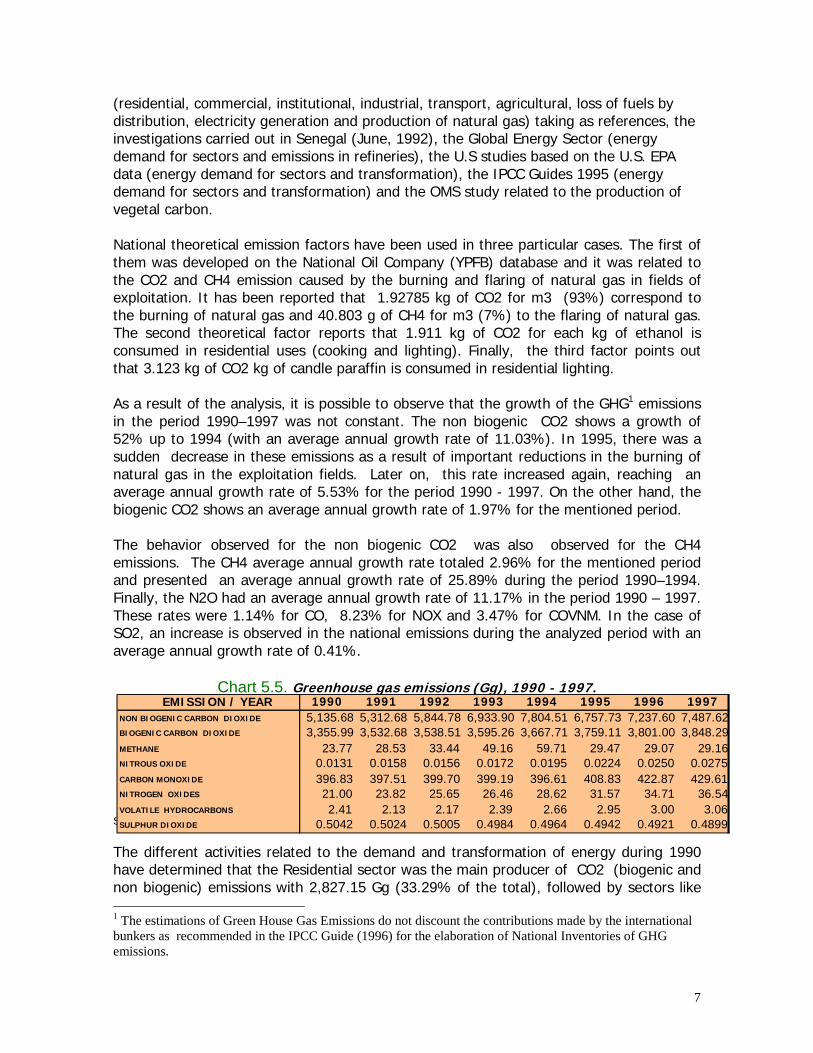
7
(residential, commercial, institutional, industrial, transport, agricultural, loss of fuels bydistribution, electricity generation and production of natural gas) taking as references, theinvestigations carried out in Senegal (June, 1992), the Global Energy Sector (energydemand for sectors and emissions in refineries), the U.S studies based on the U.S. EPAdata (energy demand for sectors and transformation), the IPCC Guides 1995 (energydemand for sectors and transformation) and the OMS study related to the production ofvegetal carbon.
National theoretical emission factors have been used in three particular cases. The first ofthem was developed on the National Oil Company (YPFB) database and it was related tothe CO2 and CH4 emission caused by the burning and flaring of natural gas in fields ofexploitation. It has been reported that 1.92785 kg of CO2 for m3 (93%) correspond tothe burning of natural gas and 40.803 g of CH4 for m3 (7%) to the flaring of natural gas.The second theoretical factor reports that 1.911 kg of CO2 for each kg of ethanol isconsumed in residential uses (cooking and lighting). Finally, the third factor points outthat 3.123 kg of CO2 kg of candle paraffin is consumed in residential lighting.
As a result of the analysis, it is possible to observe that the growth of the GHG1 emissionsin the period 1990–1997 was not constant. The non biogenic CO2 shows a growth of52% up to 1994 (with an average annual growth rate of 11.03%). In 1995, there was asudden decrease in these emissions as a result of important reductions in the burning ofnatural gas in the exploitation fields. Later on, this rate increased again, reaching anaverage annual growth rate of 5.53% for the period 1990 - 1997. On the other hand, thebiogenic CO2 shows an average annual growth rate of 1.97% for the mentioned period.
The behavior observed for the non biogenic CO2 was also observed for the CH4emissions. The CH4 average annual growth rate totaled 2.96% for the mentioned periodand presented an average annual growth rate of 25.89% during the period 1990–1994.Finally, the N2O had an average annual growth rate of 11.17% in the period 1990 – 1997.These rates were 1.14% for CO, 8.23% for NOX and 3.47% for COVNM. In the case ofSO2, an increase is observed in the national emissions during the analyzed period with anaverage annual growth rate of 0.41%.
Chart 5.5. Greenhouse gas emissions (Gg), 1990 - 1997.
Source: PNCC based on results of the LEAP system
The different activities related to the demand and transformation of energy during 1990have determined that the Residential sector was the main producer of CO2 (biogenic andnon biogenic) emissions with 2,827.15 Gg (33.29% of the total), followed by sectors like 1 The estimations of Green House Gas Emissions do not discount the contributions made by the internationalbunkers as recommended in the IPCC Guide (1996) for the elaboration of National Inventories of GHGemissions.
EMISSION / YEAR 1990 1991 1992 1993 1994 1995 1996 1997NON BIOGENIC CARBON DIOXIDE 5,135.68 5,312.68 5,844.78 6,933.90 7,804.51 6,757.73 7,237.60 7,487.62BIOGENIC CARBON DIOXIDE 3,355.99 3,532.68 3,538.51 3,595.26 3,667.71 3,759.11 3,801.00 3,848.29METHANE 23.77 28.53 33.44 49.16 59.71 29.47 29.07 29.16NITROUS OXIDE 0.0131 0.0158 0.0156 0.0172 0.0195 0.0224 0.0250 0.0275CARBON MONOXIDE 396.83 397.51 399.70 399.19 396.61 408.83 422.87 429.61NITROGEN OXIDES 21.00 23.82 25.65 26.46 28.62 31.57 34.71 36.54VOLATILE HYDROCARBONS 2.41 2.13 2.17 2.39 2.66 2.95 3.00 3.06SULPHUR DIOXIDE 0.5042 0.5024 0.5005 0.4984 0.4964 0.4942 0.4921 0.4899
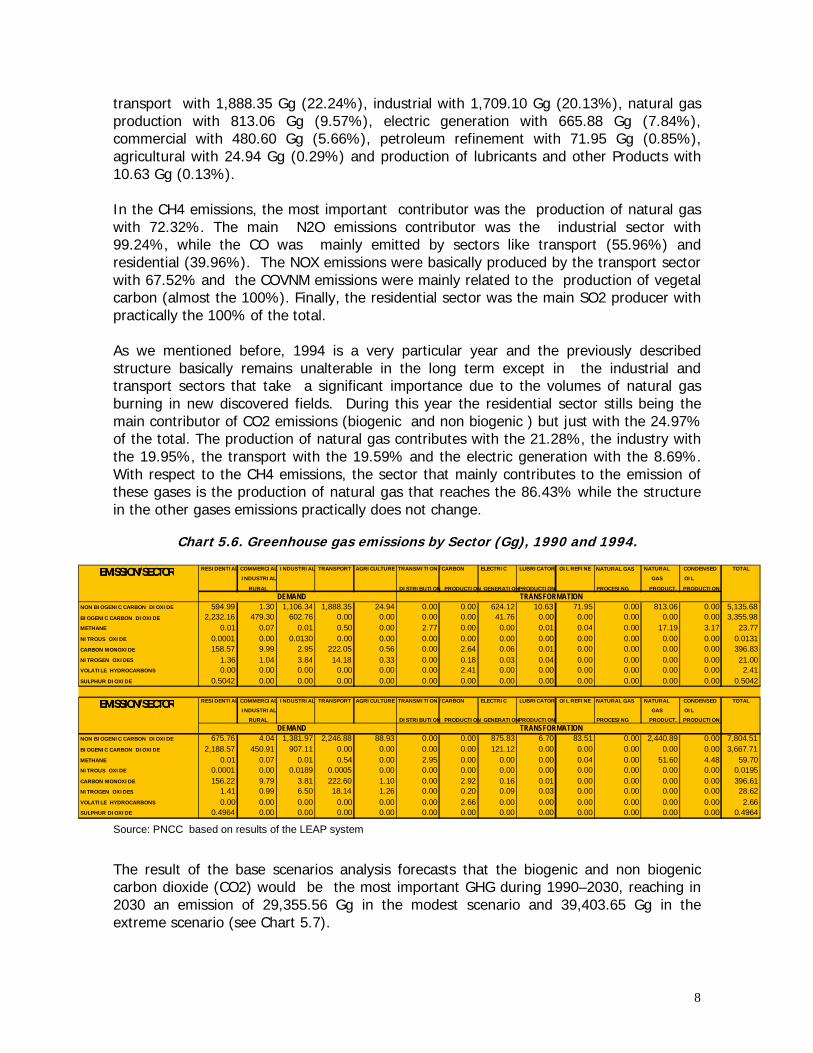
8
transport with 1,888.35 Gg (22.24%), industrial with 1,709.10 Gg (20.13%), natural gasproduction with 813.06 Gg (9.57%), electric generation with 665.88 Gg (7.84%),commercial with 480.60 Gg (5.66%), petroleum refinement with 71.95 Gg (0.85%),agricultural with 24.94 Gg (0.29%) and production of lubricants and other Products with10.63 Gg (0.13%).
In the CH4 emissions, the most important contributor was the production of natural gaswith 72.32%. The main N2O emissions contributor was the industrial sector with99.24%, while the CO was mainly emitted by sectors like transport (55.96%) andresidential (39.96%). The NOX emissions were basically produced by the transport sectorwith 67.52% and the COVNM emissions were mainly related to the production of vegetalcarbon (almost the 100%). Finally, the residential sector was the main SO2 producer withpractically the 100% of the total.
As we mentioned before, 1994 is a very particular year and the previously describedstructure basically remains unalterable in the long term except in the industrial andtransport sectors that take a significant importance due to the volumes of natural gasburning in new discovered fields. During this year the residential sector stills being themain contributor of CO2 emissions (biogenic and non biogenic ) but just with the 24.97%of the total. The production of natural gas contributes with the 21.28%, the industry withthe 19.95%, the transport with the 19.59% and the electric generation with the 8.69%.With respect to the CH4 emissions, the sector that mainly contributes to the emission ofthese gases is the production of natural gas that reaches the 86.43% while the structurein the other gases emissions practically does not change.
Chart 5.6. Greenhouse gas emissions by Sector (Gg), 1990 and 1994.
Source: PNCC based on results of the LEAP system
The result of the base scenarios analysis forecasts that the biogenic and non biogeniccarbon dioxide (CO2) would be the most important GHG during 1990–2030, reaching in2030 an emission of 29,355.56 Gg in the modest scenario and 39,403.65 Gg in theextreme scenario (see Chart 5.7).
EMISSION/SECTOREMISSION/SECTOREMISSION/SECTOREMISSION/SECTOR RESIDENTIAL COMMERCIAL INDUSTRIAL
RURAL INDUSTRIAL TRANSPORT AGRICULTURE TRANSMITION /
DISTRIBUTION
CARBON
PRODUCTION
ELECTRIC
GENERATION
LUBRICATOR
PRODUCTION
OIL REFINE NATURAL GAS PROCESING
NATURAL
GAS
PRODUCT.
CONDENSED
OIL
PRODUCTION
TOTAL
NON BIOGENIC CARBON DIOXIDE 594.99 1.30 1,106.34 1,888.35 24.94 0.00 0.00 624.12 10.63 71.95 0.00 813.06 0.00 5,135.68BIOGENIC CARBON DIOXIDE 2,232.16 479.30 602.76 0.00 0.00 0.00 0.00 41.76 0.00 0.00 0.00 0.00 0.00 3,355.98METHANE 0.01 0.07 0.01 0.50 0.00 2.77 0.00 0.00 0.01 0.04 0.00 17.19 3.17 23.77NITROUS OXIDE 0.0001 0.00 0.0130 0.00 0.00 0.00 0.00 0.00 0.00 0.00 0.00 0.00 0.00 0.0131CARBON MONOXIDE 158.57 9.99 2.95 222.05 0.56 0.00 2.64 0.06 0.01 0.00 0.00 0.00 0.00 396.83NITROGEN OXIDES 1.36 1.04 3.84 14.18 0.33 0.00 0.18 0.03 0.04 0.00 0.00 0.00 0.00 21.00VOLATILE HYDROCARBONS 0.00 0.00 0.00 0.00 0.00 0.00 2.41 0.00 0.00 0.00 0.00 0.00 0.00 2.41SULPHUR DIOXIDE 0.5042 0.00 0.00 0.00 0.00 0.00 0.00 0.00 0.00 0.00 0.00 0.00 0.00 0.5042
EMISSION/SECTOREMISSION/SECTOREMISSION/SECTOREMISSION/SECTOR RESIDENTIAL COMMERCIAL INDUSTRIAL
RURAL INDUSTRIAL TRANSPORT AGRICULTURE TRANSMITION /
DISTRIBUTION
CARBON
PRODUCTION
ELECTRIC
GENERATION
LUBRICATOR
PRODUCTION
OIL REFINE NATURAL GAS PROCESING
NATURAL
GAS
PRODUCT.
CONDENSED
OIL
PRODUCTION
TOTAL
NON BIOGENIC CARBON DIOXIDE 675.76 4.04 1,381.97 2,246.88 88.93 0.00 0.00 875.83 6.70 83.51 0.00 2,440.89 0.00 7,804.51BIOGENIC CARBON DIOXIDE 2,188.57 450.91 907.11 0.00 0.00 0.00 0.00 121.12 0.00 0.00 0.00 0.00 0.00 3,667.71METHANE 0.01 0.07 0.01 0.54 0.00 2.95 0.00 0.00 0.00 0.04 0.00 51.60 4.48 59.70NITROUS OXIDE 0.0001 0.00 0.0189 0.0005 0.00 0.00 0.00 0.00 0.00 0.00 0.00 0.00 0.00 0.0195CARBON MONOXIDE 156.22 9.79 3.81 222.60 1.10 0.00 2.92 0.16 0.01 0.00 0.00 0.00 0.00 396.61NITROGEN OXIDES 1.41 0.99 6.50 18.14 1.26 0.00 0.20 0.09 0.03 0.00 0.00 0.00 0.00 28.62VOLATILE HYDROCARBONS 0.00 0.00 0.00 0.00 0.00 0.00 2.66 0.00 0.00 0.00 0.00 0.00 0.00 2.66SULPHUR DIOXIDE 0.4964 0.00 0.00 0.00 0.00 0.00 0.00 0.00 0.00 0.00 0.00 0.00 0.00 0.4964
DEMAND TRANSFORMATION
DEMAND TRANSFORMATION
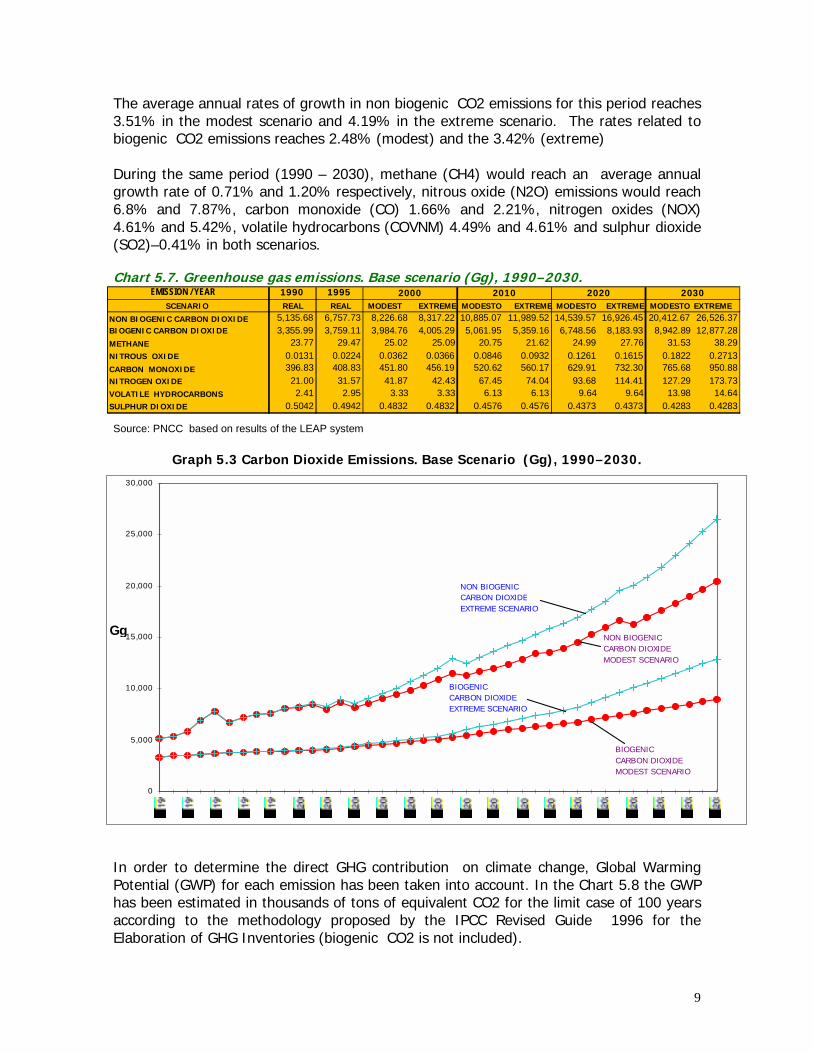
9
The average annual rates of growth in non biogenic CO2 emissions for this period reaches3.51% in the modest scenario and 4.19% in the extreme scenario. The rates related tobiogenic CO2 emissions reaches 2.48% (modest) and the 3.42% (extreme)
During the same period (1990 – 2030), methane (CH4) would reach an average annualgrowth rate of 0.71% and 1.20% respectively, nitrous oxide (N2O) emissions would reach6.8% and 7.87%, carbon monoxide (CO) 1.66% and 2.21%, nitrogen oxides (NOX)4.61% and 5.42%, volatile hydrocarbons (COVNM) 4.49% and 4.61% and sulphur dioxide(SO2)–0.41% in both scenarios.
Chart 5.7. Greenhouse gas emissions. Base scenario (Gg), 1990–2030.
Source: PNCC based on results of the LEAP system
Graph 5.3 Carbon Dioxide Emissions. Base Scenario (Gg), 1990–2030.
Source: Elaboration own envelope the base of results of the system LEAP.
In order to determine the direct GHG contribution on climate change, Global WarmingPotential (GWP) for each emission has been taken into account. In the Chart 5.8 the GWPhas been estimated in thousands of tons of equivalent CO2 for the limit case of 100 yearsaccording to the methodology proposed by the IPCC Revised Guide 1996 for theElaboration of GHG Inventories (biogenic CO2 is not included).
0
5,000
10,000
15,000
20,000
25,000
30,000
Gg NON BIOGENICCARBON DIOXIDEMODEST SCENARIO
NON BIOGENICCARBON DIOXIDEEXTREME SCENARIO
BIOGENICCARBON DIOXIDEEXTREME SCENARIO
BIOGENIC CARBON DIOXIDEMODEST SCENARIO
EMISSION / YEAR 1990 1995SCENARIO REAL REAL MODEST EXTREME MODESTO EXTREME MODESTO EXTREME MODESTO EXTREME
NON BIOGENIC CARBON DIOXIDE 5,135.68 6,757.73 8,226.68 8,317.22 10,885.07 11,989.52 14,539.57 16,926.45 20,412.67 26,526.37BIOGENIC CARBON DIOXIDE 3,355.99 3,759.11 3,984.76 4,005.29 5,061.95 5,359.16 6,748.56 8,183.93 8,942.89 12,877.28METHANE 23.77 29.47 25.02 25.09 20.75 21.62 24.99 27.76 31.53 38.29NITROUS OXIDE 0.0131 0.0224 0.0362 0.0366 0.0846 0.0932 0.1261 0.1615 0.1822 0.2713CARBON MONOXIDE 396.83 408.83 451.80 456.19 520.62 560.17 629.91 732.30 765.68 950.88NITROGEN OXIDE 21.00 31.57 41.87 42.43 67.45 74.04 93.68 114.41 127.29 173.73VOLATILE HYDROCARBONS 2.41 2.95 3.33 3.33 6.13 6.13 9.64 9.64 13.98 14.64SULPHUR DIOXIDE 0.5042 0.4942 0.4832 0.4832 0.4576 0.4576 0.4373 0.4373 0.4283 0.4283
2000 2010 2020 2030

10
Chart 5.8. Global Warming Potential of the direct GHG - Case 100 years IPCC/1996,Base Scenarios (thousands of tons of equivalent CO2), 1990 - 2030.
Source: PNCC based on results of the LEAP system
In terms of GWP, CO2 has contributed to 91.08% in 1990 for the total emissions of thesector. This contribution would reach 96.6% in 2030 in a modest scenario and 96.76% ina extreme scenario. The CH4 contributions reached 8.85% in 1990 and would reach3.13% in 2030 in a modest scenario and 2.93% in an extreme scenario. Finally, N2Ocontribution reached 0.07% in 1990 and should reach 0.27% in 2030 (modest scenario)and 0.31% in an extreme scenario.
Chart 5.9. Greenhouse gas emissions by Sector. Base Scenario (Gg), 2030.
Source: PNCC based on results of the LEAP system.
According to the modest scenario, during 2030, the industrial sector will be the main CO2(non biogenic and biogenic ) contributor with 12,485.1 Gg (42.53% of the total) in theemissions generated by demand and energy transformation. These contributions will befollowed by transport with 9,057.01 Gg (30.85%), residential with 3,803.75 Gg (12.96%),electric generation with 2455.32 Gg (8.36%), commercial / industrial / rural with 702.25Gg (2.39%), agricultural with 444.28 Gg (1.51%), production of natural gas with 248.04Gg (0.85%), refinement of petroleum with 152.58 Gg (0.52%) and production oflubricants and other products with 7.21 Gg (0.02%).
Graph 5.3 Carbon Dioxide Emissions by sector . Base scenario (Modest and Extreme) (Gg), 1990 - 2030.
EMISSION / YEAR GWP 1990 1995SCENARIO 100 Years REAL REAL MODEST EXTREME MODEST EXTREME MODEST EXTREME MODEST EXTREME
NON BIOGENIC CARBON DIOXIDE 1.00 5,135.68 6,757.74 8,226.68 8,317.22 10,885.07 11,989.53 14,539.57 16,926.45 20,412.66 26,526.38METHANE 21.00 499.12 618.95 525.41 526.87 435.70 454.01 524.74 582.96 662.21 804.17NITROUS OXIDE 310.00 4.06 6.95 11.21 11.36 26.23 28.89 39.08 50.07 56.48 84.12
5,638.86 7,383.64 8,763.31 8,855.45 11,347.00 12,472.42 15,103.39 17,559.49 21,131.35 27,414.67
2030
Total
2000 2010 2020
MODEST SCENARIO EMISSION / SECTOR
RESIDENTIAL COMMERCIAL / INDUSTRIAL
RURAL INDUSTRIAL TRANSPORT AGRICULTURE TRANSMITION /
DISTRIBUTION
CARBON
PRODUCTION
ELECTRIC
GENERATION
LUBRICANTS
PRODUCTION
PETROLEUM REFINING
NATURAL GAS PROCESING
NATURAL GAS
PRODUCTION
CONDENSED
PETROLEUM
PRODUCTION
TOTAL
NON BIOGENIC CARBON DIOXIDE 1,966.46 59.90 6,309.39 9,057.01 444.28 0.00 0.00 2,167.79 7.21 152.58 0.00 248.04 0.00 20,412.66BIOGENIC CARBON DIOXIDE 1,837.29 642.35 6,175.71 0.00 0.00 0.00 0.00 287.53 0.00 0.00 0.00 0.00 0.00 8,942.88METHANE 0.03 0.10 0.11 4.93 0.00 11.38 0.00 0.96 0.00 0.08 0.00 5.24 8.70 31.53NITROUS OXIDE 0.0002 0.00 0.1277 0.0543 0.00 0.00 0.00 0.00 0.00 0.00 0.00 0.00 0.00 0.1822CARBON MONOXIDE 140.00 23.04 25.37 555.03 5.52 0.00 15.32 1.39 0.01 0.00 0.00 0.00 0.00 765.68NITROGEN OXIDE 1.88 1.66 43.88 71.11 6.30 0.00 1.07 1.35 0.03 0.00 0.00 0.00 0.00 127.28VOLATILE HYDROCARBONS 0.00 0.00 0.00 0.00 0.00 0.00 13.98 0.00 0.00 0.00 0.00 0.00 0.00 13.98SULPHUR DIOXIDE 0.4283 0.00 0.00 0.00 0.00 0.00 0.00 0.00 0.00 0.00 0.00 0.00 0.00 0.4283
EXTREME SCENARIO EMISSION / SECTOR
RESIDENTIAL COMMERCIAL / INDUSTRIAL
RURAL INDUSTRIAL TRANSPORT AGRICULTURE TRANSMITION /
DISTRIBUTION
CARBON
PRODUCTION
ELECTRIC
GENERATION
LUBRICANTS
DE
PRODUCTION
PETROLEUM REFINING
NATURAL GAS PROCESING
NATURAL GAS
PRODUCTION
CONDENSED
PETROLEUM
PRODUCTION
TOTAL
NON BIOGENIC CARBON DIOXIDE 1,966.46 88.71 9,493.26 11,688.45 524.05 0.00 0.00 2,330.27 7.31 179.82 0.00 248.04 0.00 26,526.37BIOGENIC CARBON DIOXIDE 1,837.29 951.26 9,801.21 0.00 0.00 0.00 0.00 287.53 0.00 0.00 0.00 0.00 0.00 12,877.29METHANE 0.03 0.14 0.16 6.36 0.00 16.40 0.00 1.15 0.00 0.10 0.00 5.24 8.70 38.28NITROUS OXIDE 0.0002 0.00 0.2011 0.0701 0.00 0.00 0.00 0.00 0.00 0.00 0.00 0.00 0.00 0.2714CARBON MONOXIDE 140.00 34.12 36.35 716.29 6.51 0.00 16.04 1.57 0.01 0.00 0.00 0.00 0.00 950.89NITROGEN OXIDE 1.88 2.46 67.50 91.77 7.44 0.00 1.12 1.54 0.03 0.00 0.00 0.00 0.00 173.74VOLATILE HYDROCARBONS 0.00 0.00 0.00 0.00 0.00 0.00 14.64 0.00 0.00 0.00 0.00 0.00 0.00 14.64SULPHUR DIOXIDE 0.4283 0.00 0.00 0.00 0.00 0.00 0.00 0.00 0.00 0.00 0.00 0.00 0.00 0.4283
DEMAND TRANSFORMATION
DEMAND TRANSFORMACION
0.00
5,000.00
10,000.00
15,000.00
20,000.00
25,000.00
30,000.00
35,000.00
Gg
NATURAL GAS PRODUCTION PETROLEUM REFINING LUBRICANTS PRODUCTION ELECTRIC GENERATION AGRICULTURE - CATTLE TRANSPORT INDUSTRIAL COMMERCIAL / INDUSTRIAL / RURAL RESIDENTIAL
0.00
5,000.00
10,000.00
15,000.00
20,000.00
25,000.00
30,000.00
35,000.00
40,000.00
45,000.00
Gg
NATURAL GAS PRODUCTION
PETROLEUM REFINING
LUBRICANTS PRODUCTION
ELECTRIC GENERATION
AGRICULTURE / CATTLE
TRANSPORT
INDUSTRIAL
COMMERCIAL / INDUSTRIAL / RURAL RESIDENTIAL
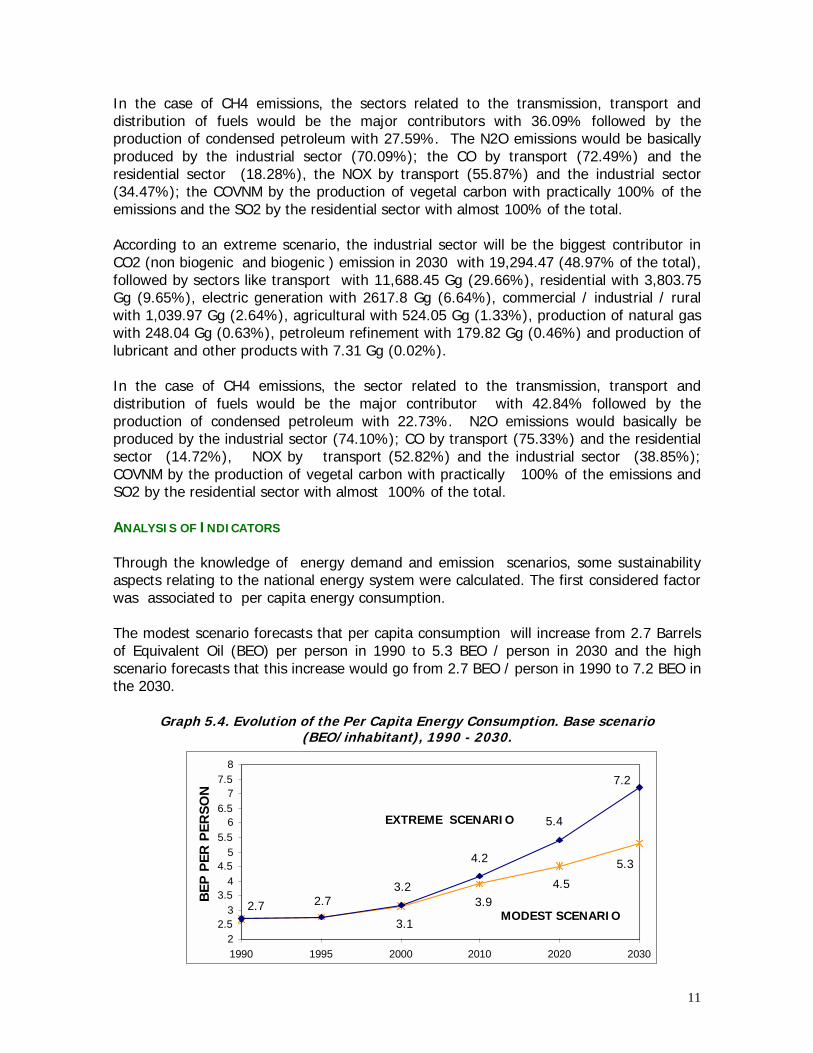
11
In the case of CH4 emissions, the sectors related to the transmission, transport anddistribution of fuels would be the major contributors with 36.09% followed by theproduction of condensed petroleum with 27.59%. The N2O emissions would be basicallyproduced by the industrial sector (70.09%); the CO by transport (72.49%) and theresidential sector (18.28%), the NOX by transport (55.87%) and the industrial sector(34.47%); the COVNM by the production of vegetal carbon with practically 100% of theemissions and the SO2 by the residential sector with almost 100% of the total.
According to an extreme scenario, the industrial sector will be the biggest contributor inCO2 (non biogenic and biogenic ) emission in 2030 with 19,294.47 (48.97% of the total),followed by sectors like transport with 11,688.45 Gg (29.66%), residential with 3,803.75Gg (9.65%), electric generation with 2617.8 Gg (6.64%), commercial / industrial / ruralwith 1,039.97 Gg (2.64%), agricultural with 524.05 Gg (1.33%), production of natural gaswith 248.04 Gg (0.63%), petroleum refinement with 179.82 Gg (0.46%) and production oflubricant and other products with 7.31 Gg (0.02%).
In the case of CH4 emissions, the sector related to the transmission, transport anddistribution of fuels would be the major contributor with 42.84% followed by theproduction of condensed petroleum with 22.73%. N2O emissions would basically beproduced by the industrial sector (74.10%); CO by transport (75.33%) and the residentialsector (14.72%), NOX by transport (52.82%) and the industrial sector (38.85%);COVNM by the production of vegetal carbon with practically 100% of the emissions andSO2 by the residential sector with almost 100% of the total.
ANALYSIS OF INDICATORS
Through the knowledge of energy demand and emission scenarios, some sustainabilityaspects relating to the national energy system were calculated. The first considered factorwas associated to per capita energy consumption.
The modest scenario forecasts that per capita consumption will increase from 2.7 Barrelsof Equivalent Oil (BEO) per person in 1990 to 5.3 BEO / person in 2030 and the highscenario forecasts that this increase would go from 2.7 BEO / person in 1990 to 7.2 BEO inthe 2030.
Graph 5.4. Evolution of the Per Capita Energy Consumption. Base scenario(BEO/inhabitant), 1990 - 2030.
3.1
3.94.5
2.72.7
5.3
7.2
5.4
4.2
3.2
2 2.5
3 3.5
4 4.5
5 5.5
6 6.5
7 7.5
8
1990 1995 2000 2010 2020 2030
BEP
PER
PER
SON
MODEST SCENARIO
EXTREME SCENARIO
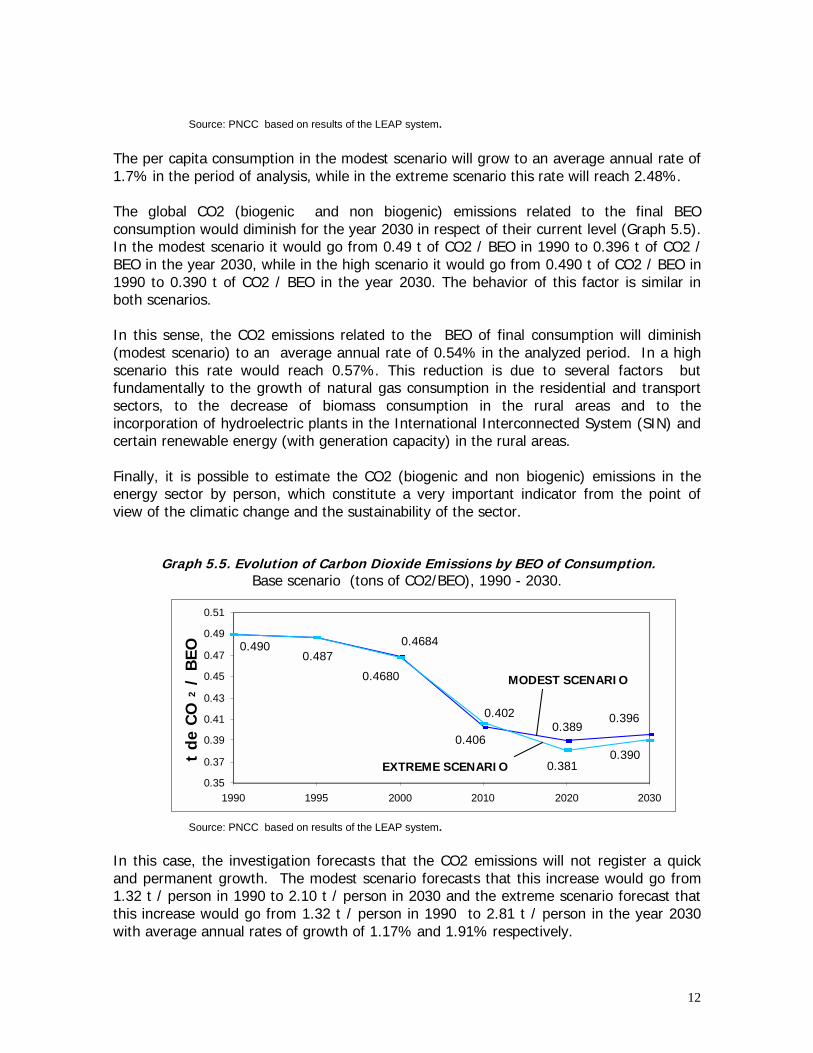
12
Source: PNCC based on results of the LEAP system.
The per capita consumption in the modest scenario will grow to an average annual rate of1.7% in the period of analysis, while in the extreme scenario this rate will reach 2.48%.
The global CO2 (biogenic and non biogenic) emissions related to the final BEOconsumption would diminish for the year 2030 in respect of their current level (Graph 5.5).In the modest scenario it would go from 0.49 t of CO2 / BEO in 1990 to 0.396 t of CO2 /BEO in the year 2030, while in the high scenario it would go from 0.490 t of CO2 / BEO in1990 to 0.390 t of CO2 / BEO in the year 2030. The behavior of this factor is similar inboth scenarios.
In this sense, the CO2 emissions related to the BEO of final consumption will diminish(modest scenario) to an average annual rate of 0.54% in the analyzed period. In a highscenario this rate would reach 0.57%. This reduction is due to several factors butfundamentally to the growth of natural gas consumption in the residential and transportsectors, to the decrease of biomass consumption in the rural areas and to theincorporation of hydroelectric plants in the International Interconnected System (SIN) andcertain renewable energy (with generation capacity) in the rural areas.
Finally, it is possible to estimate the CO2 (biogenic and non biogenic) emissions in theenergy sector by person, which constitute a very important indicator from the point ofview of the climatic change and the sustainability of the sector.
Graph 5.5. Evolution of Carbon Dioxide Emissions by BEO of Consumption.Base scenario (tons of CO2/BEO), 1990 - 2030.
Source: PNCC based on results of the LEAP system.
In this case, the investigation forecasts that the CO2 emissions will not register a quickand permanent growth. The modest scenario forecasts that this increase would go from1.32 t / person in 1990 to 2.10 t / person in 2030 and the extreme scenario forecast thatthis increase would go from 1.32 t / person in 1990 to 2.81 t / person in the year 2030with average annual rates of growth of 1.17% and 1.91% respectively.
0.396 0.389
0.402
0.46840.487
0.390 0.381
0.406
0.490
0.4680
0.35 0.37 0.39 0.41 0.43 0.45 0.47 0.49 0.51
1990 1995 2000 2010 2020 2030
t de
CO
2 /
BEO
MODEST SCENARIO
EXTREME SCENARIO
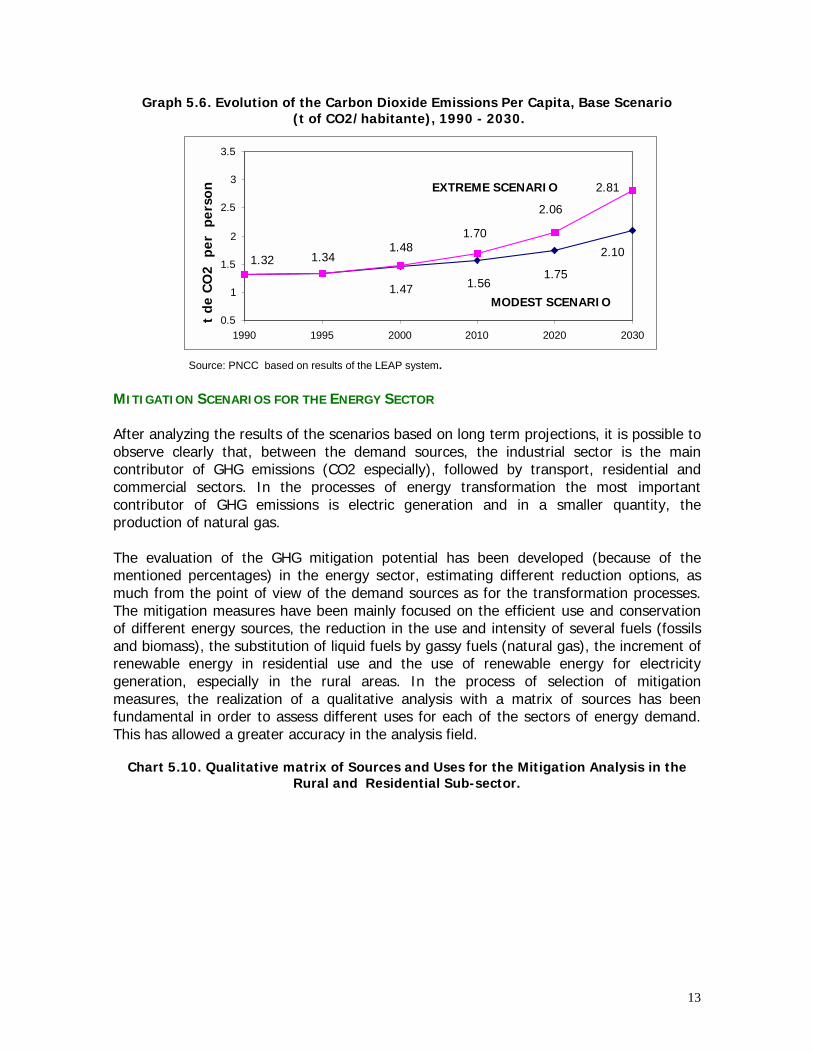
13
Graph 5.6. Evolution of the Carbon Dioxide Emissions Per Capita, Base Scenario (t of CO2/habitante), 1990 - 2030.
Source: PNCC based on results of the LEAP system.
MITIGATION SCENARIOS FOR THE ENERGY SECTOR
After analyzing the results of the scenarios based on long term projections, it is possible toobserve clearly that, between the demand sources, the industrial sector is the maincontributor of GHG emissions (CO2 especially), followed by transport, residential andcommercial sectors. In the processes of energy transformation the most importantcontributor of GHG emissions is electric generation and in a smaller quantity, theproduction of natural gas.
The evaluation of the GHG mitigation potential has been developed (because of thementioned percentages) in the energy sector, estimating different reduction options, asmuch from the point of view of the demand sources as for the transformation processes.The mitigation measures have been mainly focused on the efficient use and conservationof different energy sources, the reduction in the use and intensity of several fuels (fossilsand biomass), the substitution of liquid fuels by gassy fuels (natural gas), the increment ofrenewable energy in residential use and the use of renewable energy for electricitygeneration, especially in the rural areas. In the process of selection of mitigationmeasures, the realization of a qualitative analysis with a matrix of sources has beenfundamental in order to assess different uses for each of the sectors of energy demand.This has allowed a greater accuracy in the analysis field.
Chart 5.10. Qualitative matrix of Sources and Uses for the Mitigation Analysis in theRural and Residential Sub-sector.
2.10 1.75
1.561.47
2.81 2.06
1.701.48
1.341.32
0.5
1
1.5
2
2.5
3
3.5
1990 1995 2000 2010 2020 2030
t de
CO
2 p
er p
erso
n
MODEST SCENARIO
EXTREME SCENARIO

14
SOURCE USES ELC LGP KER GLN DIE ALC F.W CBV RSV EST BAT PIL VEL SOL otras 1. Lighting X X X X X X 2. Cooking X X X X X X X X
3. Water heating X X X X X X X
4. Heating X X X X X X
5. House conditioning X 6. Food refrigeration X X X 7. Audio-Vision X X X
8. Domestic supplies X 9. Water distribut. X X X
10. Battery recharging X 11. Electricity generation X X
X Usual employment of sources in the different base scenarios.
Reduction in consumption of the specific sources (three levels).
Increase in the use of alternative and substitutive sources (three levels).
USUAL ALTERNAT
The selection of mitigation measures was mainly based on the guidelines of the General Planof Economic and Social Development (Bolivia 1997 – 2002) as a possibility to include theseoptions in the politics, plans and programs derived from this national strategy ofdevelopment. The selection of these measures also considered some fundamentalapproaches that arose from the analysis of the demand and transformation base scenarios:the importance of each sector (not only in the demand of energy but in their contribution toGHG emissions), the importance of each energy source, the global demand and contributionof these sources to GHG emissions, the use of energy by sector, etc.
SOURCE USES ELC LGP KER GLN DIE ALC FWO CBV RSV EST BAT PIL VEL SOL otras 1. Lighting 1,2,31,61 2,33,5 2,33 2,33 5 2,31,33 31
62 5 2. Cooking 5 4 4 1,2,4,64 1,2,4,64 1,2,4,64 1,2,4,64
3. Water heating 2,32 2,32 4 2,32,4,642,32,4,642,32,4,64 2,32,4,64 32 4. Heating 11,31,32 11,31,32 11,31,32 11,31,32 11,31,32 11,31,32 32 5. House conditioning 11 6. Food refrigeration 1,61,62 5,61,62 5,61,62 7. Audio-Vision 33,5 33,5
8. Domestic supplies 61,62,63 9. Water distribution 33 33,5 33,5 33 10. Batteries recharging 33 11. Electricity generation 33,5 33,5 33 Mitigation Measures: 1 Improvements in energy conversion of electric supplies 4 Expansion of LGP provisions. 11 Energy conservation through the use of thermal isolators. 5 Expansion of the electricity network 2 Substitution of technologies and supplies. 6 Projects related to mitigation. 3 Use of renewable sources 61 Demand Side Management, Sucre. 31 Solar energy: Extension in the uses of natural lighting. 62 Demand Side Management, La Paz y Santa Cruz. 32 Solar - thermal energy. 63 ESMAP 2 33 Photovoltaic conversion 64 National Biomass Program.
USUAL ALTERNAT
Source: Andrés Trepp del Carpio
15
Naturally, these approaches are intimately associated to the theme of climate change andthat is why the selected options are related to the economic, political, social andenvironmental context in Bolivia. MITIGATION MEASURES
The evaluations carried out have allowed the establishing of different mitigation measuresin the energy sector, that could help in reducing the levels of GHG emissions and thatcould be applied in Bolivia through technical and economic support internationally.
• To achieve efficiency in the lighting of the residential sector• To achieve efficiency in biomass cookers• To achieve efficiency in refrigeration (residential sector)• To increase the residential use of natural gas• To increase the use of solar energy in the heating of water• To provide electricity with renewable energy to rural areas• To achieve efficiency in the commercial sector• To achieve efficiency of the commercial use of biomass• To improve the use of electrical energy in commercial use• To save energy in the industry sector• To increase the use of natural gas in the transport sector• To reduce the burning of natural gas in fields of exploitation• To redistribute expansion options in the electrical generation sector
Through the comparison of the base and mitigation scenarios it is possible to forecast areduction in global demand for energy in the whole energy sector. In the modest scenariothe reduction would reach 0.36 million BEO for the year 2005 (1.1% reduction), 1.33million BEO for the year 2010 (3.35 %), 2.87 million BEO for the year 2020 (5.25 %) and5.14 million BEO for the year 2030 (6.93 %). In the high scenario the reduction wouldreach 0.44 million BEO for the year 2005 (1.28 %), 1.58 million BEO for the year 2010(3.70 %), 3.63 million BEO for the year 2020 (5.50 %) and 7.12 million BEO for the year2030 (7.05 %).
The emissions of non biogenic CO2 could also be reduced. In a modest scenario thisreduction would total 7.03% for the year 2005, 5.81% for 2010, 12.75% for 2020 and15.07% for 2030. The emissions of biogenic CO2 could be reduced to 2.3% for 2005,4.07% for 2010, 6.14% for 2020 and 6.96% for 2030.
In a high scenario, the emissions of non biogenic CO2 could be reduced by 7.07% for2005, 5.87% for 2010, 15.65% for 2020 and 17.32% for 2030. Biogenic CO2 emissionscould decrease by 2.81% for 2005, 4.86% for 2010, 6.83% for 2020 and 6.66% for2030. Similarly, all the other emissions (except the CH4 and N2O emanations that wouldregister non significant increases in their emissions) would also register reductions in theiremissions in both scenarios (extreme and modest).

16
Chart 5.11. Reduction of the GHG emissions to the atmosphereMitigation Scenarios Vs Base Scenarios (Gg), 2005 -2030.
Reduction in a modest scenario EMISSION / YEAR 2005 2010 2020 2030 TOTAL
2001 - 2030NON BIOGENIC CARBON DIOXIDE 604.99 632.31 1,854.36 3,076.40 44,386.28BIOGENIC CARBON DIOXIDE 102.93 205.86 414.22 622.59 9,625.09METHANE 6.38 0.67 -1.05 -2.76 35.43NITROUS OXIDE -0.02 -0.03 -0.06 -0.08 -1.34CARBON MONOXIDE 30.39 60.77 154.35 247.94 3,514.85NITROGEN OXIDES 28.95 57.90 661.92 23.34 12,918.19VOLATILE HYDROCARBONS 0.01 0.03 0.07 0.12 1.69SULPHUR DIOXIDE 0.02 0.03 0.07 0.11 1.61Reduction in an extreme scenario
EMISSION / YEAR 2005 2010 2020 2030 TOTAL 2001 - 2030
NON BIOGENIC CARBON DIOXIDE 640.75 703.84 2,649.50 4,595.15 61,406.12BIOGENIC CARBON DIOXIDE 130.10 260.20 559.17 858.15 12,913.62METHANE 6.05 0.01 -2.22 -4.44 7.98NITROUS OXIDE -0.02 -0.04 -0.07 -0.11 -1.74CARBON MONOXIDE 39.18 78.35 204.66 330.97 4,650.46NITROGEN OXIDES 29.71 59.41 666.76 32.45 13,027.48VOLATILE HYDROCARBONS 0.02 0.04 0.08 0.13 1.91SULPHUR DIOXIDE 0.02 0.04 0.08 0.12 1.83
Source: PNCC based on results of the LEAP system The results of the Cost - Benefit Analysis, (which is based on a global and integrated socialCost - Benefit analysis in the energy and environmental system of the country) was carriedout with the pattern of Energy Planning (LEAP) and with the methodology developed bythe National Program of Climate Change to calculate the annual costs of energy saving. This social Cost - Benefit analysis is centered on the denominated “opportunity costs”which is basically referred to a group of actions in the energy system and not to theenergy consumer. The inflation rate considered for the analysis is 5.56% for the wholeperiod of and a rate of real discount of 12.07% (a social rate of discount adopted inDecember 1998 by the National Government).
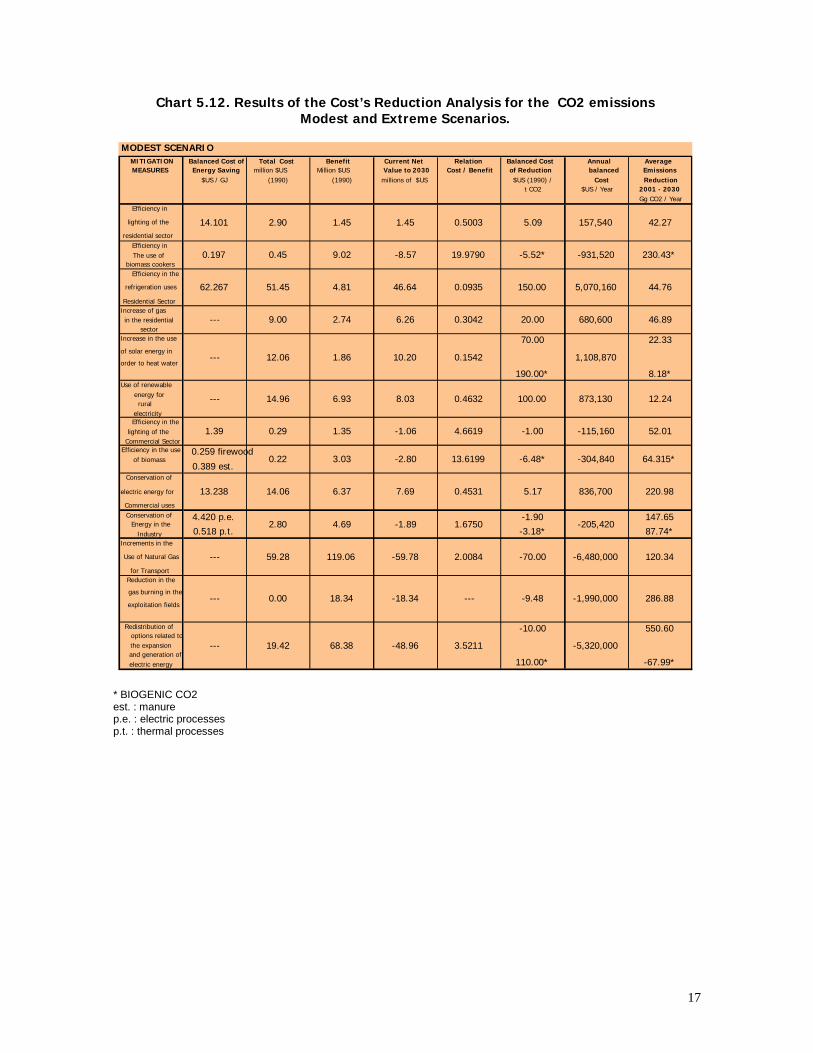
17
Chart 5.12. Results of the Cost’s Reduction Analysis for the CO2 emissions Modest and Extreme Scenarios.
MODEST SCENARIO MITIGATION
MEASURES Balanced Cost ofEnergy Saving
$US / GJ Total Cost
million $US (1990)
Benefit Million $US
(1990)
Current NetValue to 2030 millions of $US
Relation Cost / Benefit
Balanced Costof Reduction $US (1990) /
t CO2
Annual balanced Cost $US / Year
Average Emissions Reduction
2001 - 2030 Gg CO2 / Year
Efficiency in lighting of the
residential sector 14.101 2.90 1.45 1.45 0.5003 5.09 157,540 42.27
Efficiency in The use of
biomass cookers 0.197 0.45 9.02 -8.57 19.9790 -5.52* -931,520 230.43*
Efficiency in the refrigeration uses
Residential Sector 62.267 51.45 4.81 46.64 0.0935 150.00 5,070,160 44.76
Increase of gas in the residential
sector --- 9.00 2.74 6.26 0.3042 20.00 680,600 46.89
Increase in the use of solar energy in order to heat water --- 12.06 1.86 10.20 0.1542
70.00
190.00*
1,108,870 22.33
8.18*Use of renewable
energy for rural
electricity --- 14.96 6.93 8.03 0.4632 100.00 873,130 12.24
Efficiency in the lighting of the
Commercial Sector 1.39 0.29 1.35 -1.06 4.6619 -1.00 -115,160 52.01
Efficiency in the use of biomass 0.259 firewood
0.389 est. 0.22 3.03 -2.80 13.6199 -6.48* -304,840 64.315*
Conservation of electric energy for Commercial uses
13.238 14.06 6.37 7.69 0.4531 5.17 836,700 220.98
Conservation of Energy in the
Industry 4.420 p.e. 0.518 p.t. 2.80 4.69 -1.89 1.6750
-1.90 -3.18*
-205,420 147.65 87.74*
Increments in the Use of Natural Gas
for Transport --- 59.28 119.06 -59.78 2.0084 -70.00 -6,480,000 120.34
Reduction in the gas burning in the
exploitation fields --- 0.00 18.34 -18.34 --- -9.48 -1,990,000 286.88
Redistribution of options related to the expansion and generation of
electric energy --- 19.42 68.38 -48.96 3.5211
-10.00
110.00*
-5,320,000 550.60
-67.99*
* BIOGENIC CO2 est. : manure p.e. : electric processes p.t. : thermal processes
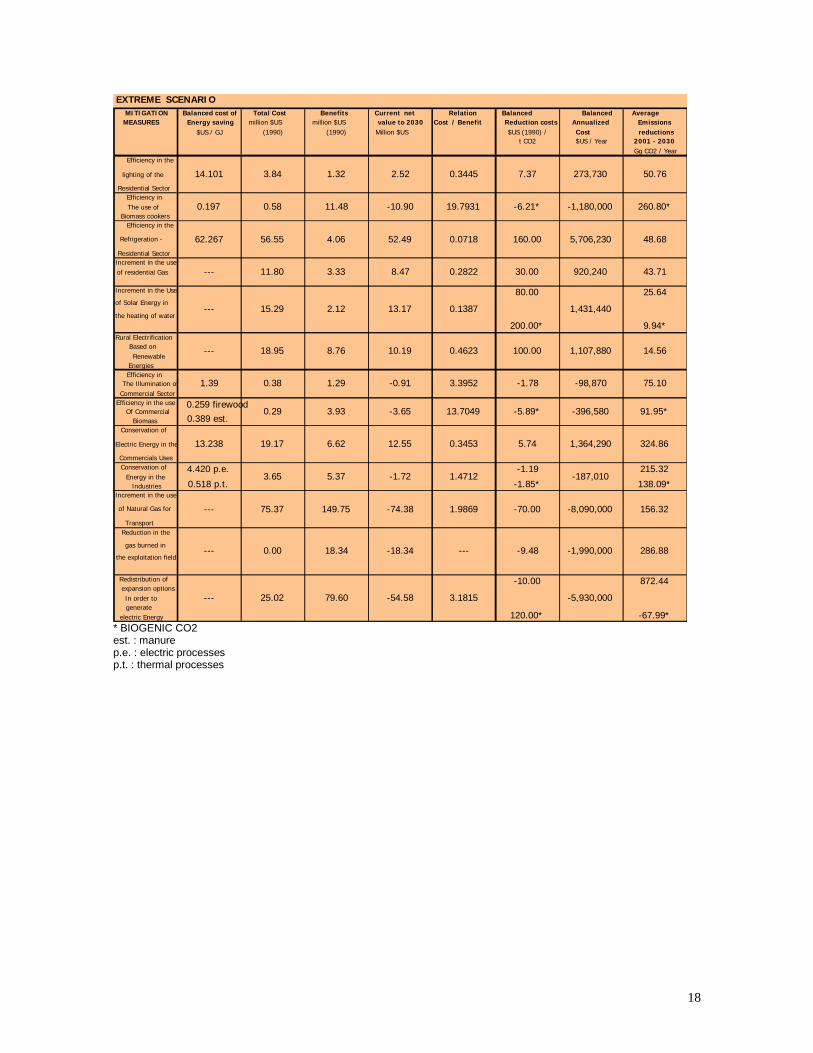
18
EXTREME SCENARIO MITIGATION
MEASURES Balanced cost of Energy saving
$US / GJ Total Cost
million $US (1990)
Benefits million $US
(1990)
Current net value to 2030
Million $US
Relation Cost / Benefit
Balanced Reduction costs$US (1990) /
t CO2
Balanced Annualized Cost $US / Year
Average Emissions reductions
2001 - 2030 Gg CO2 / Year
Efficiency in the lighting of the
Residential Sector 14.101 3.84 1.32 2.52 0.3445 7.37 273,730 50.76
Efficiency in The use of
Biomass cookers 0.197 0.58 11.48 -10.90 19.7931 -6.21* -1,180,000 260.80*
Efficiency in the Refrigeration -
Residential Sector 62.267 56.55 4.06 52.49 0.0718 160.00 5,706,230 48.68
Increment in the use of residential Gas --- 11.80 3.33 8.47 0.2822 30.00 920,240 43.71
Increment in the Use of Solar Energy in the heating of water --- 15.29 2.12 13.17 0.1387
80.00
200.00*
1,431,440 25.64
9.94*Rural Electrification
Based on Renewable
Energies --- 18.95 8.76 10.19 0.4623 100.00 1,107,880 14.56
Efficiency in The Illumination of
Commercial Sector 1.39 0.38 1.29 -0.91 3.3952 -1.78 -98,870 75.10
Efficiency in the use Of Commercial
Biomass 0.259 firewood 0.389 est. 0.29 3.93 -3.65 13.7049 -5.89* -396,580 91.95*
Conservation of Electric Energy in the Commercials Uses
13.238 19.17 6.62 12.55 0.3453 5.74 1,364,290 324.86
Conservation of Energy in the
Industries 4.420 p.e. 0.518 p.t. 3.65 5.37 -1.72 1.4712
-1.19 -1.85*
-187,010 215.32
138.09*Increment in the use of Natural Gas for
Transport --- 75.37 149.75 -74.38 1.9869 -70.00 -8,090,000 156.32
Reduction in the gas burned in
the exploitation field --- 0.00 18.34 -18.34 --- -9.48 -1,990,000 286.88
Redistribution of expansion options In order to generate
electric Energy --- 25.02 79.60 -54.58 3.1815
-10.00
120.00*
-5,930,000 872.44
-67.99* * BIOGENIC CO2 est. : manure p.e. : electric processes p.t. : thermal processes
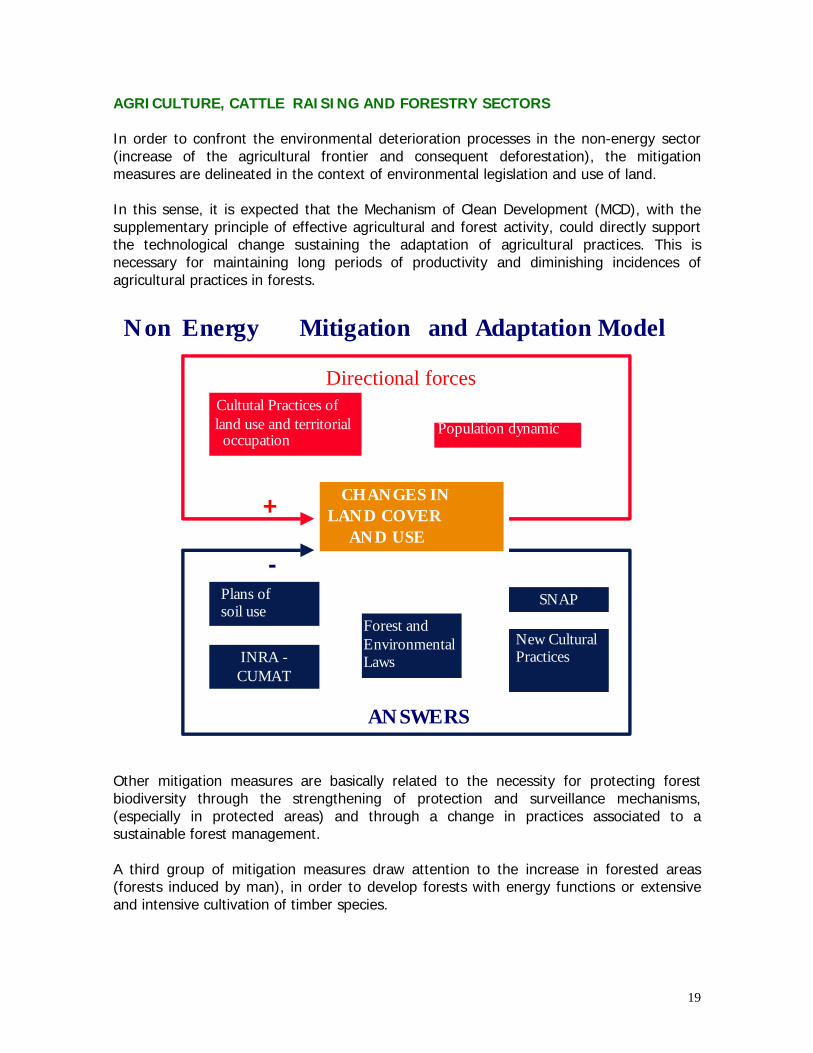
19
AGRICULTURE, CATTLE RAISING AND FORESTRY SECTORS In order to confront the environmental deterioration processes in the non-energy sector(increase of the agricultural frontier and consequent deforestation), the mitigationmeasures are delineated in the context of environmental legislation and use of land. In this sense, it is expected that the Mechanism of Clean Development (MCD), with thesupplementary principle of effective agricultural and forest activity, could directly supportthe technological change sustaining the adaptation of agricultural practices. This isnecessary for maintaining long periods of productivity and diminishing incidences ofagricultural practices in forests.
Model Mitigation and Adaptation Non Energy
CHANGES IN LAND COVER
AND USE
Population dynamic
Cultutal Practices of land use and territorial
occupation
Plans of soil use
Forest and EnvironmentalLaws
SNAP
INRA - CUMAT
ANSWERS
+
-
New Cultural Practices
Directional forces
Other mitigation measures are basically related to the necessity for protecting forestbiodiversity through the strengthening of protection and surveillance mechanisms,(especially in protected areas) and through a change in practices associated to asustainable forest management. A third group of mitigation measures draw attention to the increase in forested areas(forests induced by man), in order to develop forests with energy functions or extensiveand intensive cultivation of timber species.
20
In the agricultural and cattle raising sectors, the mitigation measures point to theimprovement of soil and water resource use, the implementation of agro-forestry systems,the natural regeneration of pastures and the improvement in animal breeding techniquesin order to lessen methane emissions.
The selected measures maintain a close relationship with the strategic guidelinesdetermined by the General Plan of Economic and Social Development of Bolivia (1997 –2002) in order to integrate the program specified by the National Development Strategy.
The implementation of the selected measures will require technical and economic supportfrom the international community. In this respect, Article 4, paragraph 3, of the UnitedNations Framework Convention on Climate Change states that “The developed countriesand the other members of Annex II will provide new and additional financial resources tocover the entirety of the usual expenses made by the developing countries in order tocomplete their commitments.”
In a similar way, Article 12, paragraph 6, of the Kyoto Protocol points out that one of thefunctions of the Mechanism of Clean Development is “to help, as necessary, the financingof projects with certified activities.”
All the mitigation measures related to the GHG emissions in agriculture, cattle raising andforest sectors, have been discussed and have found a consensus based on consultationsbetween all the interested sectors.
These measures use as evaluation approaches for project priority: their consistency withnational politics, programs and development plans; the opportunity of reaching theproposed objectives, the mitigation potential of emissions; the existence of barriers fortheir implementation and the benefits (cost and effectiveness) of the mentionedmeasures.
BASE SCENARIO EMISSIONS (1990)
The activities related to land use change and the burning of forestry biomass are the mainsources of carbon dioxide emissions in Bolivia. According to the National Inventory ofEmissions (1990 and 1994) based on the IPCC Guide lines (1995 - 1996), the quantity ofGHG emitted by agriculture, cattle raising and forest sectors was even superior to theemissions generated by the energy sector.
CO2 emissions related to land use change and forestry reached 38,617.11 Gg in 1994 andwith increases to (according to COPATH) 51,772.46 Gg in 2000; 54,476.00 Gg in 2010;59,600 Gg in 2020 and 69,161.00 Gg in 2030 (Graph 5.7)
The deforestation rate and the percentage of the deforested area dedicated to agriculture,pastures, timber extraction, fire and other land use were also calculated for each type offorest. The estimates were carried out using the rate of deforestation of 100,000.00ha/year for the whole national territory (CUMAT, 1992 and Plan of National Forest Action,MACA/FAO, 1993).
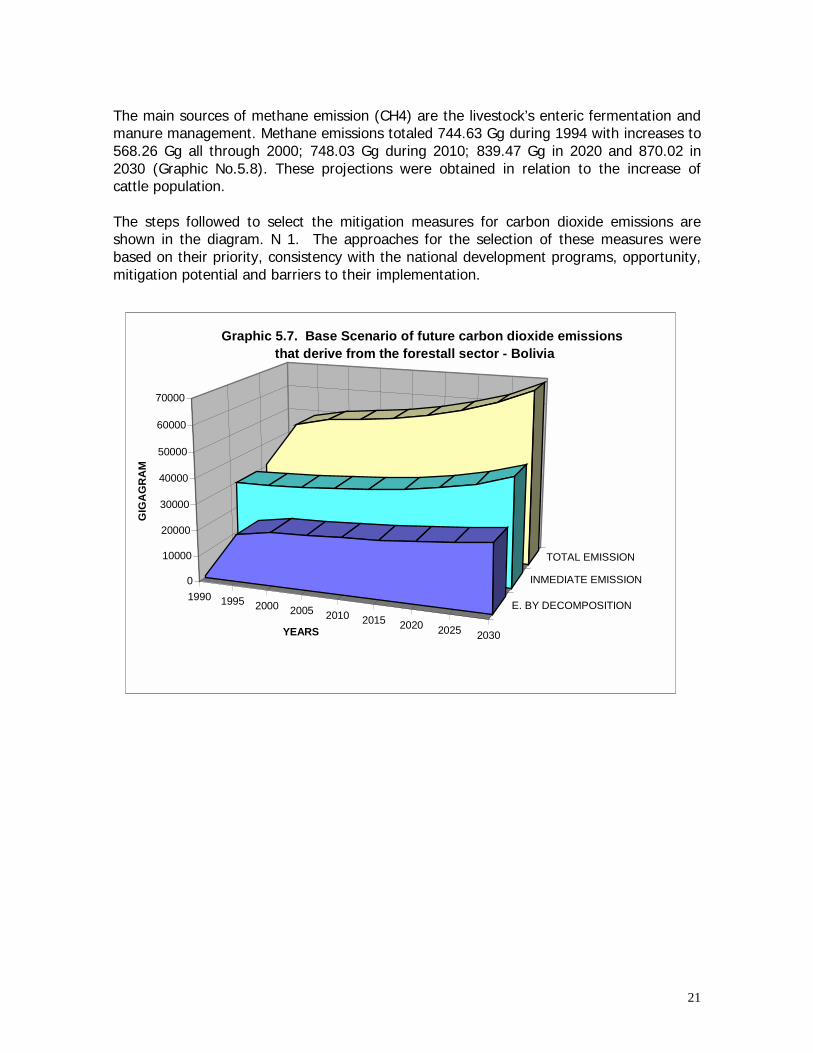
21
The main sources of methane emission (CH4) are the livestock’s enteric fermentation andmanure management. Methane emissions totaled 744.63 Gg during 1994 with increases to568.26 Gg all through 2000; 748.03 Gg during 2010; 839.47 Gg in 2020 and 870.02 in2030 (Graphic No.5.8). These projections were obtained in relation to the increase ofcattle population.
The steps followed to select the mitigation measures for carbon dioxide emissions areshown in the diagram. N 1. The approaches for the selection of these measures werebased on their priority, consistency with the national development programs, opportunity,mitigation potential and barriers to their implementation.
1990 1995 2000 2005 2010 2015 2020 2025 2030
E. BY DECOMPOSITION
INMEDIATE EMISSION
TOTAL EMISSION
0
10000
20000
30000
40000
50000
60000
70000
GIG
AG
RA
M
YEARS
Graphic 5.7. Base Scenario of future carbon dioxide emissions that derive from the forestall sector - Bolivia
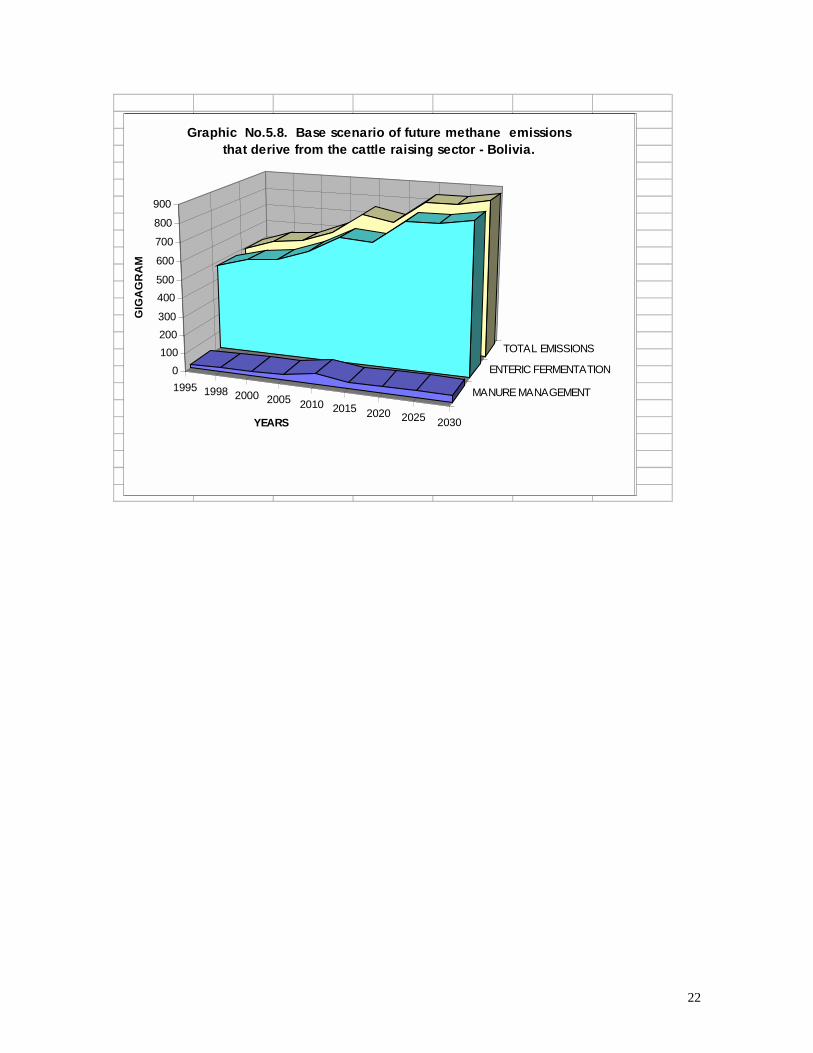
22
1995 1998 2000 2005 2010 2015 2020 2025 2030
MANURE MANAGEMENT
ENTERIC FERMENTATION
TOTAL EMISSIONS
0100200300400500
600700
800
900
GIG
AG
RA
M
ANOS
FIGURA No. 2. Escenario base de emisiones futuras de Metano provenientes de sector Ganadería de Bolivia.
1995 1998 2000 2005 2010 2015 2020 2025 2030
MANURE MANAGEMENT
ENTERIC FERMENTATION
TOTAL EMISSIONS
0100200300
400500
600
700
800
900
GIG
AG
RA
M
YEARS
Graphic No.5.8. Base scenario of future methane emissions that derive from the cattle raising sector - Bolivia.
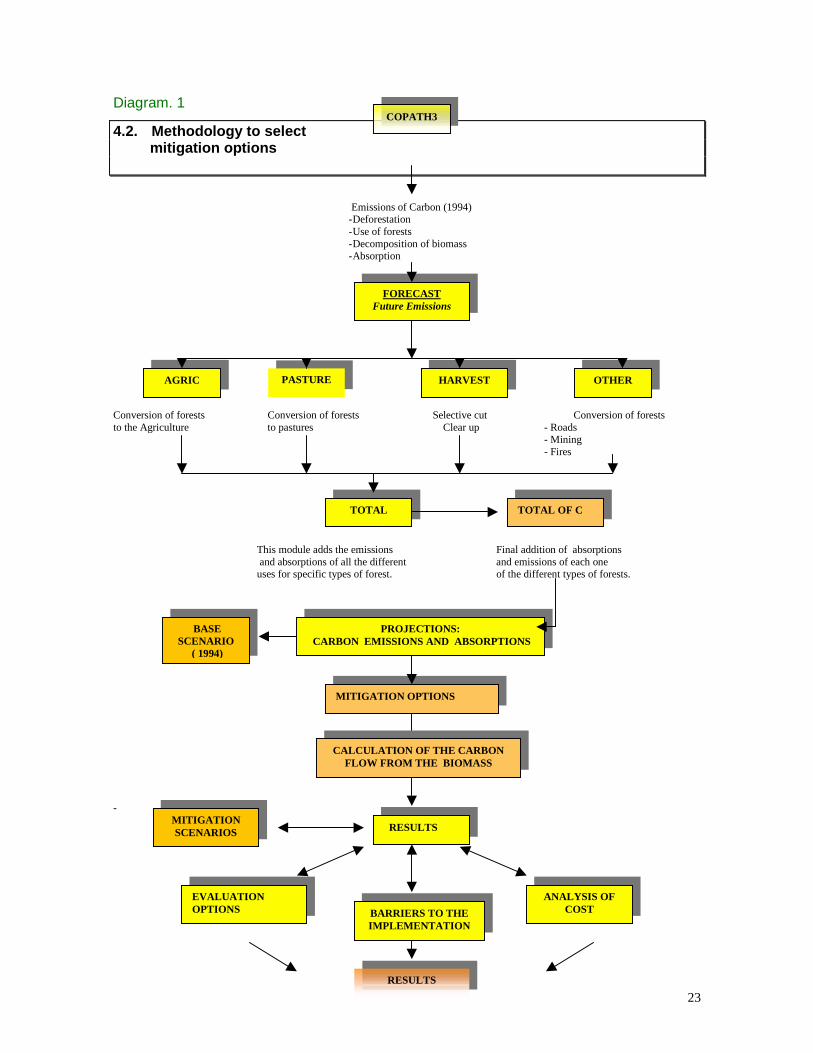
Diagram. 1
4.2. Methodology to select mitigation options
Emissions of Carbon (1994)- Deforestation- Use of forests- Decomposition of biomass- Absorption
Conversion of forests Conversion of foreststo the Agriculture to pastures
This module adds the emiss and absorptions of all the duses for specific types of fo
-
COPATH3
F
AGRIC PASTURE
TOTA
CARBON EM
MITIGA
S
MITIGATIONSCENARIOS
EVALUATIONOPTIONS B
IM
CALCULFLOW
FORECASTuture Emissions
Selective cut Conversion of forests Clear up - Roads
- Mining- Fires
ions Final addition of absorptionsifferent and emissions of each onerest. of the different types of forests.
HARVEST OTHER
L TOTAL OF C
PROJECTIONS:ISSIONS AND ABSORPTIONS
BASECENARIO ( 1994)
23
TION OPTIONS
RESULTS
ARRIERS TO THEPLEMENTATION
ANALYSIS OFCOST
RESULTS
ATION OF THE CARBON FROM THE BIOMASS
24
Measures to mitigate GHG Emissions
It is difficult to choose the most appropriate mitigation measures for the forestry sectorsince this issue is closely related to other economic, social and cultural problems in thecountry: land tenancy, expansion of the agricultural frontier, traditional cultivationmethods, extensive cattle raising, traditional breeding of animals and the selective andindustrial exploitation of tropical forests. We should also add the big discrepanciesregarding the size of existing forest cover and the current deforestation indexes in thecountry.
The mitigation measures in the forestry sector are mainly related to the changes in theland use which normally vary with the environmental and ecological conditions of eachregion. The major part of the proposed mitigation measures are directed at the Amazonbasin of the country where the highest rates of deforestation are registered. Themitigation measures are conceived to promote the sustainable use of renewableresources and to encourage the appropriate use of these resources.
Framed inside the politics of Sustainable Development promoted by the Government(New Forestry Law No. 1700 and the Law INRA No. 1715), the mitigation measuresoutlined for the forestry and agricultural sector plan to reduce the carbon emissions intwo ways:• Increasing the storage of carbon.• Avoiding carbon emissions and encouraging forest conservation controlling the
deforestation process.
The selected mitigation measures, taking into account previous approaches, are thefollowing:
- Formation of tree growing areas; that could increase the drains of carbondioxide. These plantations (native and exotic species), could also benefit the regionswith a high desertification process (high plains, inter-Andean valleys and the Chacoplains).
- Natural regeneration of forests through the implementation of projects thatpromote the natural regeneration of native arboreal species in deforested areaswhich were once covered by primary forests. This measure is also contemplated inthe New Forest Law (Art. 69).
- Proposition of new alternatives to the traditional agriculture which is basedin the burning of fields and in the felling of trees. These alternatives will be directedto the reduction of greenhouse gas emissions (CO2, CO, NOx, N2O, and CH4) and tothe encouragement of sustainable land use in order to diminish impacts on theenvironment.
- Implementation of the New Forestry Law in order to establish mechanisms tofulfill the reduction of greenhouse gas emissions. The application of this law shouldbe presided by an information campaign in order to generate a growing socialsupport.
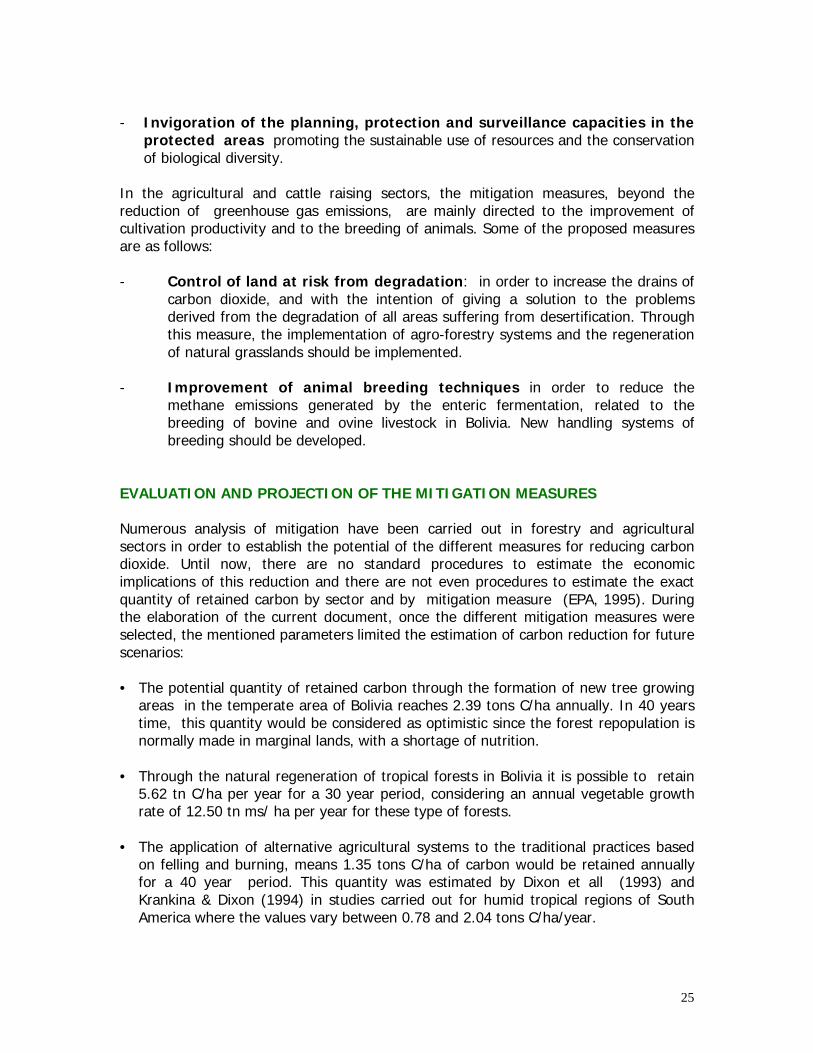
25
- Invigoration of the planning, protection and surveillance capacities in theprotected areas promoting the sustainable use of resources and the conservationof biological diversity.
In the agricultural and cattle raising sectors, the mitigation measures, beyond thereduction of greenhouse gas emissions, are mainly directed to the improvement ofcultivation productivity and to the breeding of animals. Some of the proposed measuresare as follows:
- Control of land at risk from degradation: in order to increase the drains ofcarbon dioxide, and with the intention of giving a solution to the problemsderived from the degradation of all areas suffering from desertification. Throughthis measure, the implementation of agro-forestry systems and the regenerationof natural grasslands should be implemented.
- Improvement of animal breeding techniques in order to reduce themethane emissions generated by the enteric fermentation, related to thebreeding of bovine and ovine livestock in Bolivia. New handling systems ofbreeding should be developed.
EVALUATION AND PROJECTION OF THE MITIGATION MEASURES
Numerous analysis of mitigation have been carried out in forestry and agriculturalsectors in order to establish the potential of the different measures for reducing carbondioxide. Until now, there are no standard procedures to estimate the economicimplications of this reduction and there are not even procedures to estimate the exactquantity of retained carbon by sector and by mitigation measure (EPA, 1995). Duringthe elaboration of the current document, once the different mitigation measures wereselected, the mentioned parameters limited the estimation of carbon reduction for futurescenarios:
• The potential quantity of retained carbon through the formation of new tree growingareas in the temperate area of Bolivia reaches 2.39 tons C/ha annually. In 40 yearstime, this quantity would be considered as optimistic since the forest repopulation isnormally made in marginal lands, with a shortage of nutrition.
• Through the natural regeneration of tropical forests in Bolivia it is possible to retain
5.62 tn C/ha per year for a 30 year period, considering an annual vegetable growthrate of 12.50 tn ms/ ha per year for these type of forests.
• The application of alternative agricultural systems to the traditional practices based
on felling and burning, means 1.35 tons C/ha of carbon would be retained annuallyfor a 40 year period. This quantity was estimated by Dixon et all (1993) andKrankina & Dixon (1994) in studies carried out for humid tropical regions of SouthAmerica where the values vary between 0.78 and 2.04 tons C/ha/year.

26
• Carbon emissions retained through the implementation of the New Forest Law, plusthe invigoration of the planning and protection capacities in protected areas totals119.21 tons C/ha in humid tropical forests. Considering that the average biomass ofthese forests are 238.42 tons/ha, the retained carbon could total 300 tons ms/ha inthe primary forests of the Amazon area of Bolivia.
• The control of land at risk from degradation could allow the retention of 1.35 tonsC/ha/ year for a 40 year period with the application of agricultural systems. Theretained carbon could total 1.12 tons C/ha/ year, for a 25 year period through thenatural regeneration of grasslands.
Regarding the reduction of methane emissions, the application of mitigation measures,referring to the improvement of techniques for animal breeding, would increase theproductivity indexes of the bovine and ovine livestock by 10%. This represents areduction of 3.8% annually in methane, generated by enteric fermentation assumingthe measure is applied to 5% of bovine and ovine livestock existing in the country.
The total reduction of greenhouse gas emissions, resulting from the mitigation measuresdescribed previously, are shown in the Chart. 5.13. According to this chart aconsiderable reduction would be accomplished if the Bolivian government executes atleast seven of the measures. In this case, CO2 emissions would be reduced by 15.63%for the year 2000, 23.01% for 2005 and 31.63% for 2010 (Graph 5.9).
2000 2005 2010 2015 2020
MITIGATION SCENARIO
BASE SCENARIO
0 10000 20000 30000 40000 50000 60000
GIGAGRAMS
YEARS
Graphic.5.9. Carbon Dioxide Emissions in the base and mitigation scenarios for the agricultural, cattle raising and forestall sectors of Bolivia
It can also be noticed that the mitigation measures that contribute better in reducingcarbon dioxide, are those referring to the formation of new tree growing areas, theregeneration of natural forests, the implementation of the New Forest Law and theprotection and surveillance of the protected areas. (Graph 5.10).
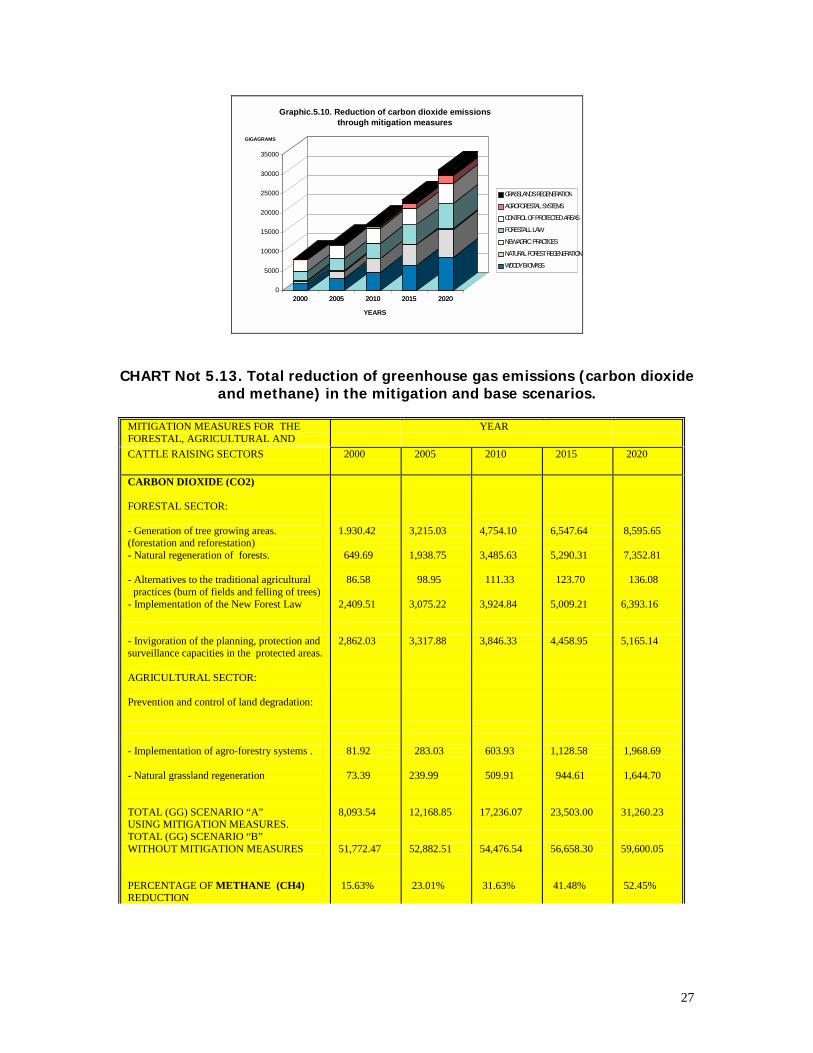
27
2000 2005 2010 2015 20200
5000
10000
15000
20000
25000
30000
35000
GIGAGRAMS
2000 2005 2010 2015 2020
YEARS
Graphic.5.10. Reduction of carbon dioxide emissions through mitigation measures
GRASSLANDS REGENERATION AGROFORESTAL SYSTEMS
CONTROL OF PROTECTED AREAS FORESTALL LAW
NEW AGRIC. PRACTICES
NATURAL FOREST REGENERATION WOODY BIOMASS
CHART Not 5.13. Total reduction of greenhouse gas emissions (carbon dioxideand methane) in the mitigation and base scenarios.
MITIGATION MEASURES FOR THEFORESTAL, AGRICULTURAL AND
YEAR
CATTLE RAISING SECTORS 2000 2005 2010 2015 2020
CARBON DIOXIDE (CO2)
FORESTAL SECTOR:
- Generation of tree growing areas.(forestation and reforestation)- Natural regeneration of forests.
- Alternatives to the traditional agricultural practices (burn of fields and felling of trees)- Implementation of the New Forest Law
- Invigoration of the planning, protection andsurveillance capacities in the protected areas.
AGRICULTURAL SECTOR:
Prevention and control of land degradation:
- Implementation of agro-forestry systems .
- Natural grassland regeneration
TOTAL (GG) SCENARIO “A”USING MITIGATION MEASURES.TOTAL (GG) SCENARIO “B”WITHOUT MITIGATION MEASURES
PERCENTAGE OF METHANE (CH4)REDUCTION
1.930.42
649.69
86.58
2,409.51
2,862.03
81.92
73.39
8,093.54
51,772.47
15.63%
3,215.03
1,938.75
98.95
3,075.22
3,317.88
283.03
239.99
12,168.85
52,882.51
23.01%
4,754.10
3,485.63
111.33
3,924.84
3,846.33
603.93
509.91
17,236.07
54,476.54
31.63%
6,547.64
5,290.31
123.70
5,009.21
4,458.95
1,128.58
944.61
23,503.00
56,658.30
41.48%
8,595.65
7,352.81
136.08
6,393.16
5,165.14
1,968.69
1,644.70
31,260.23
59,600.05
52.45%
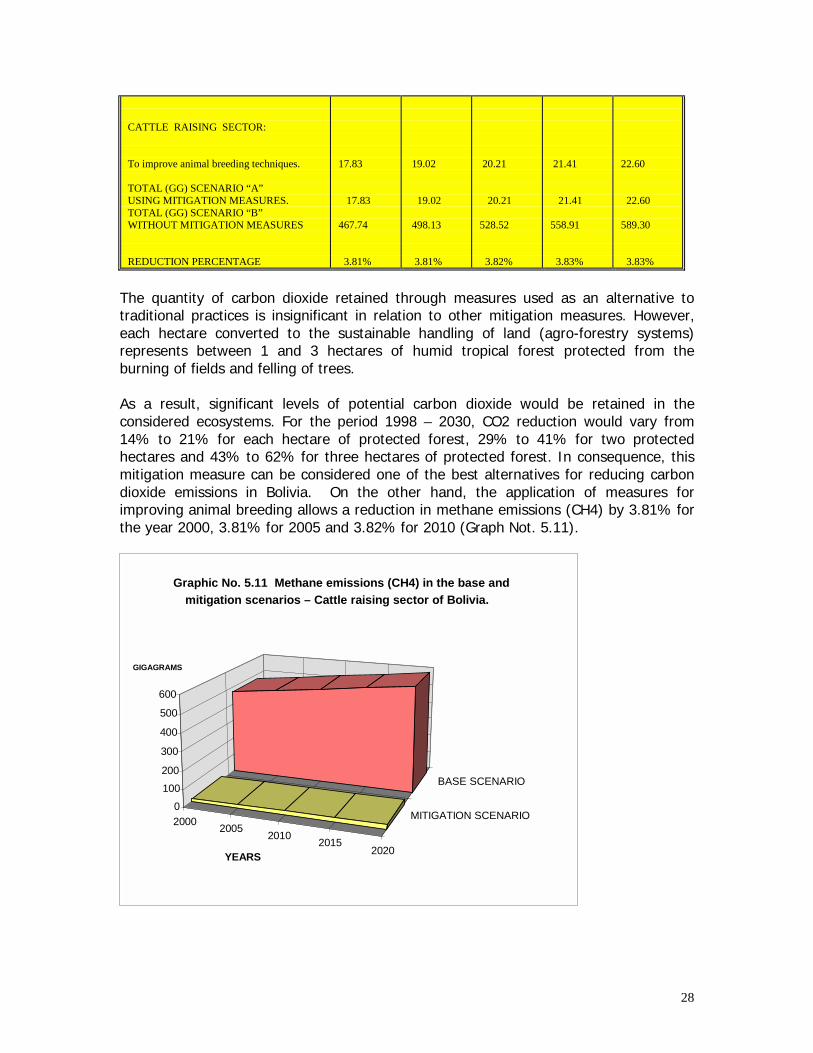
28
CATTLE RAISING SECTOR:
To improve animal breeding techniques.
TOTAL (GG) SCENARIO “A”USING MITIGATION MEASURES.TOTAL (GG) SCENARIO “B”WITHOUT MITIGATION MEASURES
REDUCTION PERCENTAGE
17.83
17.83
467.74
3.81%
19.02
19.02
498.13
3.81%
20.21
20.21
528.52
3.82%
21.41
21.41
558.91
3.83%
22.60
22.60
589.30
3.83%
The quantity of carbon dioxide retained through measures used as an alternative totraditional practices is insignificant in relation to other mitigation measures. However,each hectare converted to the sustainable handling of land (agro-forestry systems)represents between 1 and 3 hectares of humid tropical forest protected from theburning of fields and felling of trees.
As a result, significant levels of potential carbon dioxide would be retained in theconsidered ecosystems. For the period 1998 – 2030, CO2 reduction would vary from14% to 21% for each hectare of protected forest, 29% to 41% for two protectedhectares and 43% to 62% for three hectares of protected forest. In consequence, thismitigation measure can be considered one of the best alternatives for reducing carbondioxide emissions in Bolivia. On the other hand, the application of measures forimproving animal breeding allows a reduction in methane emissions (CH4) by 3.81% forthe year 2000, 3.81% for 2005 and 3.82% for 2010 (Graph Not. 5.11).
2000 2005 2010 2015 2020
MITIGATION SCENARIO
BASE SCENARIO
0 100 200
300
400
500
600
GIGAGRAMS
YEARS
Graphic No. 5.11 Methane emissions (CH4) in the base and mitigation scenarios – Cattle raising sector of Bolivia.
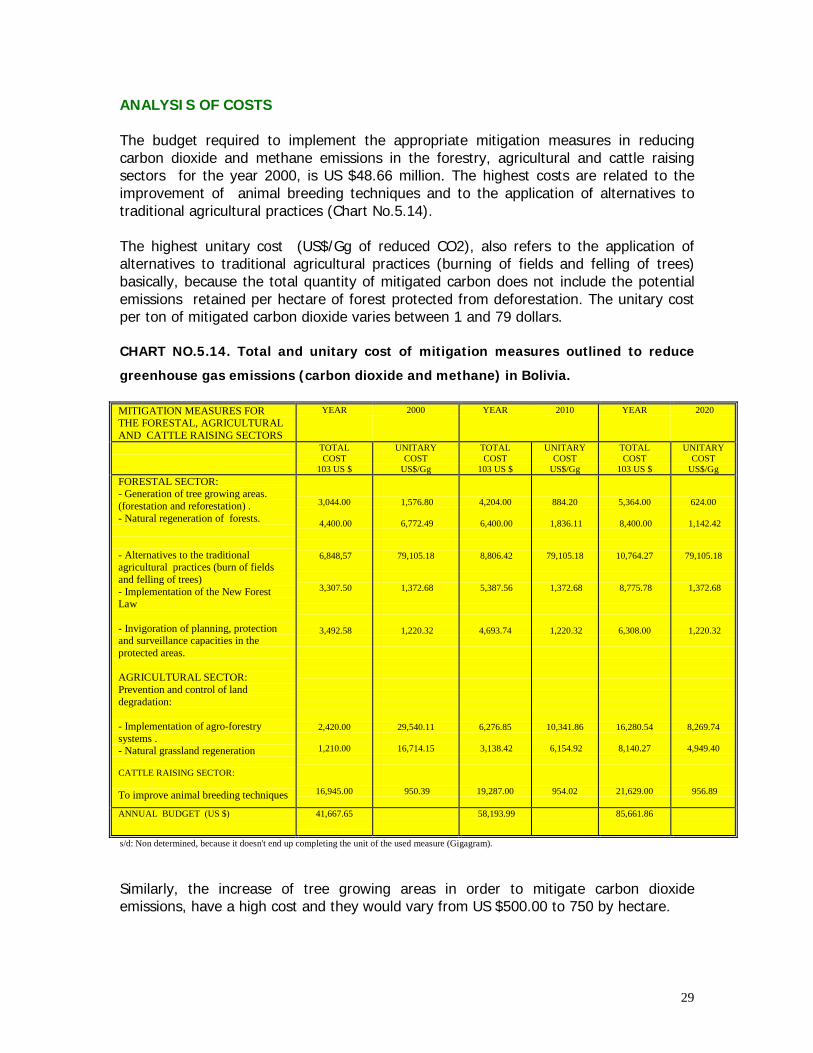
29
ANALYSIS OF COSTS
The budget required to implement the appropriate mitigation measures in reducingcarbon dioxide and methane emissions in the forestry, agricultural and cattle raisingsectors for the year 2000, is US $48.66 million. The highest costs are related to theimprovement of animal breeding techniques and to the application of alternatives totraditional agricultural practices (Chart No.5.14).
The highest unitary cost (US$/Gg of reduced CO2), also refers to the application ofalternatives to traditional agricultural practices (burning of fields and felling of trees)basically, because the total quantity of mitigated carbon does not include the potentialemissions retained per hectare of forest protected from deforestation. The unitary costper ton of mitigated carbon dioxide varies between 1 and 79 dollars.
CHART NO.5.14. Total and unitary cost of mitigation measures outlined to reduce
greenhouse gas emissions (carbon dioxide and methane) in Bolivia.
MITIGATION MEASURES FORTHE FORESTAL, AGRICULTURALAND CATTLE RAISING SECTORS
YEAR 2000 YEAR 2010 YEAR 2020
TOTALCOST
103 US $
UNITARYCOST
US$/Gg
TOTALCOST
103 US $
UNITARYCOST
US$/Gg
TOTALCOST
103 US $
UNITARYCOST
US$/GgFORESTAL SECTOR:- Generation of tree growing areas.(forestation and reforestation) .- Natural regeneration of forests.
- Alternatives to the traditionalagricultural practices (burn of fieldsand felling of trees)- Implementation of the New ForestLaw
- Invigoration of planning, protectionand surveillance capacities in theprotected areas.
AGRICULTURAL SECTOR:Prevention and control of landdegradation:
- Implementation of agro-forestrysystems .- Natural grassland regeneration
CATTLE RAISING SECTOR:
To improve animal breeding techniques
3,044.00
4,400.00
6,848,57
3,307.50
3,492.58
2,420.00
1,210.00
16,945.00
1,576.80
6,772.49
79,105.18
1,372.68
1,220.32
29,540.11
16,714.15
950.39
4,204.00
6,400.00
8,806.42
5,387.56
4,693.74
6,276.85
3,138.42
19,287.00
884.20
1,836.11
79,105.18
1,372.68
1,220.32
10,341.86
6,154.92
954.02
5,364.00
8,400.00
10,764.27
8,775.78
6,308.00
16,280.54
8,140.27
21,629.00
624.00
1,142.42
79,105.18
1,372.68
1,220.32
8,269.74
4,949.40
956.89
ANNUAL BUDGET (US $) 41,667.65 58,193.99 85,661.86
s/d: Non determined, because it doesn't end up completing the unit of the used measure (Gigagram).
Similarly, the increase of tree growing areas in order to mitigate carbon dioxideemissions, have a high cost and they would vary from US $500.00 to 750 by hectare.

30
For the next ten years, the budget required to implement new mitigation measures willbe increased, especially if bigger reductions of carbon dioxide and methane emissionsare planned. The budget would rise to US $58.19 millions for the year 2010 and to US$85.66 millions for the following decade.
The sustained international cooperation from the countries of Annex I, supported bygovernment national politics, is the only way to fulfill the implementation of mitigationmeasures in the forest and agricultural sectors of Bolivia.

CHAPTER V
SYSTEMATIC OBSERVATION, EDUCATION, AND PUBLIC
AWARENESS
OBSERVATION
Global systems of observation for land with regional and international
investigation initiatives
The international scientific community is carrying out efforts to define groups of work inthe area of “global change." Four aspects of environmental change in global scales arerecognized (I) changes in land cover and usage, (II) a decrease in biodiversity in aglobal scale, (III) changes in the atmospheric composition, especially the increase ofCO2 concentration, and (IV) climate change taken as a central topic in theinvestigation of global changes.
The investigations related to global changes highlight the relationship between changesin land cover and usage and changes in atmospheric composition, especially theincrease in CO2 concentration.
In this sense, there are different initiatives at global level: the IGBP (InternationalGeosphere Biosphere Program) dedicated to the investigation of the environmentalchanges of global character and the IHDP (International Human Dimensions Program)orientated to investigating the human dimension for global environmental changes.These programs, jointly with ICSU, SCOPE (Scientific Committee on the Problems of theEnvironment) and IPCC (Intergovernmental Panel on Climate Change) constitute thescientific reference for the investigation of global change, in cooperation with the UnitedNations programs.
There are also, inside the United Nations Programs, initiatives of global observation likethe G3OS, composed of three systems for earth observation: the GCOS (Global Systemof Climate Observation), the GOOS (Global System of Oceanic Observation) and theGTOS (Global System of Terrestrial Observation). These observation systems should findsimilar systems on a national stage.
In this side of the world, the IAI (Inter-American Institute for Global Change Research)is constituted as the regional organization that assumes the investigation of globalchange in Latin America. Bolivia will soon be a member of this organization.
Data Exchange and accessibilityBolivia is working right now to have access to mechanisms of information exchange,which is one of the reasons for promoting a closer cooperation with the differentparticipants of the investigation process. We need cooperation networks that will allowthe exchange of data and results through varying publications.

The Government is trying to promote the access to public data, integrating itsinstitutions with the cooperation networks and facilitating a process of informationexchange. The implementation of an informative bulletin and/or a scientific magazinecould support this process.
Bolivia is a highly vulnerable country because of climate change that affects agriculturalproduction, forests and water resources and human health. However, it does not have ahydro-meteorological network that might cover the whole territory.
In order to adapt the different productive sectors to the needs of climatic change and toincrease the levels of human security, Bolivia has the important task to improve itsobservation capacities and monitor climate change. Part of its priorities are to increasethe levels of knowledge regarding the directional forces that produce a deterioration inthe productive bases of society (natural and human resources), to control the increaseof GHG emissions and to promote strategic alliances of work between the scientificcommunity and the political and social participants.
At present, this network is being managed by the National Service of Meteorology andHydrology (SENAMHI), an entity that belongs to the Ministry of SustainableDevelopment and Planning, which participates as a member of the World MeteorologicalOrganization.
The SENAMHI has the following objectives: to centralize the meteorological information,to operate and to maintain the national network of stations, to study the climate and toprovide information about weather and water resources, and to provide the necessaryinformation for institutions that work with the use of non renewable natural resources.However, limitations of infrastructure are a constant obstacle for making a scientificstudy of the existing climate variations and changes.
In spite of these limitations, Bolivia participates in the meetings of theIntergovernmental Panel of Climatic Change (IPCC), in the meetings of the UNFCCC andin the different Programs promoted by the United Nations related to biodiversity,desertification and natural resources.
Resulting from this, the Vice-ministry of Environment, Natural Resources and ForestDevelopment has created the National Program of Climatic Changes (PNCC) with theobjective of facing the commitments contracted in the United Nations FrameworkConvention on Climate Change and in the Kyoto Protocol.
Similarly, the creation of the Inter-institutional Climatic Change Council (CICC) respondsto the necessity for coordinating environmental actions between the government andprivate and scientific institutions, with the purpose of suggesting political actions relatingto climate change and its implications. The CICC is composed of the followinginstitutions:
• Ministry of Sustainable Development and Planning• Vice-ministry of Environment, Natural Resources and Forest Development• Vice-ministry of Foreign Policy
• Vice-ministry of Energy• Vice-ministry of Agriculture and Cattle Raising• Vice-ministry of Public Investment and External Financing• National academy of Sciences• Confederation of Private Investors• Non - governmental organizations
In recent years, different institutes and universities have joined in their efforts toinvestigate green house gas emissions and analyze vulnerability and mitigationmeasures.
EDUCATION
The increase in scientific capacities related to climate change constitutes atranscendental element in accomplishing the following strategic objectives:
� To improve the method of acquiring data and information;� To increase the understanding of global change and its repercussions for society;
In the way this process is carried out nationally, regionally and internationally, bothobjectives crisscross, which is why better methods of observation and measuring arebasic conditions for improving understanding.
Improvement in infrastructure can not be seen as a purely institutional development.The main goal should be to find strengths in the existing infrastructure nationally, andits diversity.
In this sense, it is important to define the high-priority topics in the field of climatechange, to generate groups of work and cooperation networks that could have accessto eventual beneficial projects.
These networks will be composed according to the high priorities of the society and inagreement with the global tendencies, to facilitate international cooperation.
Meteorology and environmental qualityThe meteorological capacities of the country must be improved in order to have agreater understanding of climate variability. Increases in agricultural productivity dependstrongly on the availability of reliable climatic and meteorological data. In this sense, theexpansion of the meteorological network of measurements is a significant requirement.
The SENAHMI must be strengthened in its capacities of information treatment. Thepossibility of working together with the municipalities must be evaluated, with theintention of fulfilling the acquisition of municipal meteorological data, and theenlargement of the measurement network to a bigger number of stations.
The SENAHMI should also be integrated in regional initiatives for the monitoring of “ElNiño” and other initiatives for measuring GHG emissions.
The meteorological investigation must reach levels of systematic work predicting riskslike droughts and floods and becoming one of the constituent elements of the civildefense system. The construction of general circulation models of regional scale isindispensable and international support for the construction of these models is highlyrequired.
The laboratories of environmental quality must support the monitoring of GHGemissions, putting a special emphasis on the monitoring of environmental quality inurban centers
Ecosystem Vulnerability
Climate change will produce modifications in the patterns of habitability for differentflora and fauna species. There are medium levels of certainty that different productiveecosystems (savannas and forests) would be affected by changes in the supply of waterand increases in temperature. In addition, there are high levels of certainty that thewater deficit of some ecosystems will become worse, increasing erosion anddesertification levels in a country that is already vulnerable from the point of view of itsecosystem.
The theme of climatic change must be divulged in ecological investigation centers in thewhole country, in order to initiate further investigations related to this issue.
On the other hand, the international community should increase the communicationlevels among the different investigation centers, through the organization of nationalmeetings and symposiums orientated to the training of specialists in ecosystemvulnerability.
diseases and illnesses
The monitoring of diseases and illnesses that could be exacerbated by climate change isof extreme importance. There are medium levels of certainty that this can occur. Levelsof illness incidence transmitted by vectors not only expand or change the habitat ofsome vectors, but also generates new species of vectors that could increase illnessesrelated to air and water quality or to the availability of food.
The Bolivian government, with international cooperation, must strengthen theinvestigation centers that work on tropical diseases supporting, at the same time, thedecentralization process of the system of basic health care and prevention.
There is a high certainty that illnesses and diseases which affect crops could changetheir patterns of incidence. A permanent observation in this field is highlyrecommended.
Special emphasis must be put on the development of technologies dedicated to thebiological control of diseases and vectors.

Changes in the land use and coverThe use of technologies such as GIS and Tele-detection since the 70´s, have enabledthe big gap in information to be overcome in areas related to the elaboration of mapsand processing of territorial classifications.
The plans regarding land use, elaborated by the ZONISIG and PLUS (Santa Cruz)contemplate an environmental and socioeconomic profile that allow reliable bases to beestablished, for further development of colonization (points of development andinfrastructure). The territorial classification will also assure the fulfillment of plans linkedwith the sustainable handling of forests and biodiversity protection.
Clean DevelopmentThe paradigm of clean development must be studied under the conditions and prioritiesof the country: industrial development, generation and use of energy, forestmanagement, consolidation of small and medium companies, investigation of cleantechnologies, incentives, credits, etc.
Human vulnerability, alimentary security, handling of water resources and“environmental refugees”Indicators for monitoring human development must be carried out in the country. TheSocial Index of Vulnerability, the Index of Human Development and the Index of HumanPoverty could be effective parameters, but they must be revised continually in anisolated way and in their relationship with climate change.
In the scientific discussion on vulnerability and human adaptation it is possible toestablish a clear incidence of poverty in vulnerability levels. Poor people are mostvulnerable to climate change.
Topics like alimentary security, access to water resources and the problem of thedenominated “environmental refugees” (people that has to leave their homes because ofclimate changes) are important publicly. From the view of climate change, these topicsare highly relevant.
Finally, the government of Bolivia will make efforts to increase communication levelsbetween different individuals, investigation centers, programs and institutions, throughworkshops and national symposiums in order to contribute to the training of humanresources in human vulnerability.
� FORMAL AND NON FORMAL EDUCATIONEducation must support the strategic lines of productive transformation and humansecurity. The international community is elaborating curriculums on formal educationregarding global environmental change. These curriculums could be nationally reappliedin different spheres.
On the other hand, cultural changes emerging from this adaptation process, will beintroduced by parallel processes of non formal education in all spheres of society.
The characteristics of the education curriculum in climate change will be analyzed anddiscussed in the context of sustainable development and educational reforms.
Non-formal education will be carried out to support already existing programs related toenvironmental education, in order to strengthen adaptation measures. The prioritiesare:
� Education for technology introduction� Education for cultural changes in production� Education for health
The implementation of adaptation measures in the country will be realizable if it isstrongly supported by an educational component. The communities, municipalities andregions will implement the adaptation measures if they are aware of the benefits of thischange. Education processes must be applied together with other training processes inorder to reach regional development.
Rejection to change is basically explained by a lack of awareness on repercussions thatthese changes can have on their way of life, individually and collectively.
In this sense, education is a tool that could help in diminishing uncertainty and assureparticipation of communities, municipalities and regions in projects of mitigation andadaptation regarding the impact of climate change.
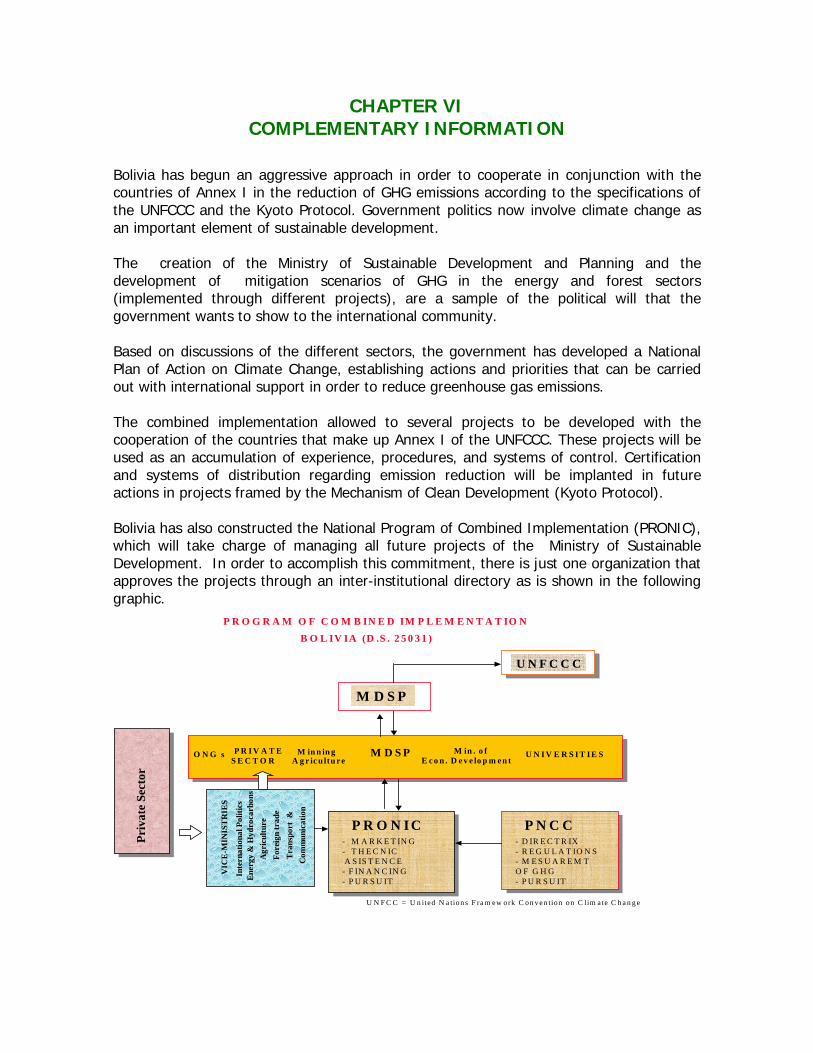
CHAPTER VICOMPLEMENTARY INFORMATION
Bolivia has begun an aggressive approach in order to cooperate in conjunction with thecountries of Annex I in the reduction of GHG emissions according to the specifications ofthe UNFCCC and the Kyoto Protocol. Government politics now involve climate change asan important element of sustainable development.
The creation of the Ministry of Sustainable Development and Planning and thedevelopment of mitigation scenarios of GHG in the energy and forest sectors(implemented through different projects), are a sample of the political will that thegovernment wants to show to the international community.
Based on discussions of the different sectors, the government has developed a NationalPlan of Action on Climate Change, establishing actions and priorities that can be carriedout with international support in order to reduce greenhouse gas emissions.
The combined implementation allowed to several projects to be developed with thecooperation of the countries that make up Annex I of the UNFCCC. These projects will beused as an accumulation of experience, procedures, and systems of control. Certificationand systems of distribution regarding emission reduction will be implanted in futureactions in projects framed by the Mechanism of Clean Development (Kyoto Protocol).
Bolivia has also constructed the National Program of Combined Implementation (PRONIC),which will take charge of managing all future projects of the Ministry of SustainableDevelopment. In order to accomplish this commitment, there is just one organization thatapproves the projects through an inter-institutional directory as is shown in the followinggraphic.
P R O G R A M O F C O M B IN E D IM P L E M E N T A T IO NB O L IV IA (D .S . 2 5 0 3 1 )
M D S P
U N F C C C
M D S PO N G s P R I V A T E S E C T O R
M in . o fE c o n . D e v e lo p m en t
M in n in g.A g r ic u ltu re
Priv
ate
Sect
or
P R O N IC P N C C - M A R K E T IN G- T H E C N ICA S IS T E N C E
- F IN A N C IN G- P U R S U IT
- D IR E C T R IX - R E G U L A T IO N S - M E S U A R E M T O F G H G- P U R S U IT
VIC
E-M
INIS
TRIE
S In
tern
atio
nal P
oliti
cs
Ener
gy &
Hyd
roca
rbon
s A
gric
ultu
re
Fore
ign
trad
e Tr
ansp
ort
&
Com
mun
icat
ion
U N F C C = U n ited N a tion s F ra m ew ork C on ven tion on C lim a te C h a n g e
U N I V E R S I T IE S
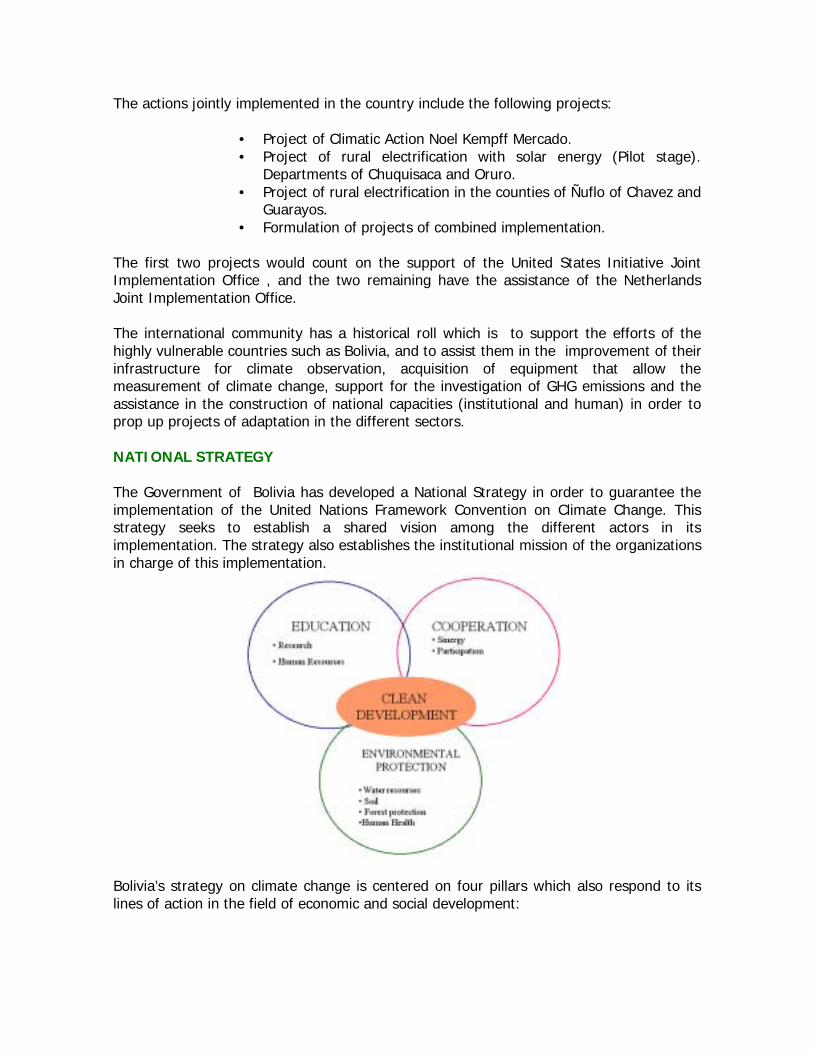
The actions jointly implemented in the country include the following projects:
• Project of Climatic Action Noel Kempff Mercado.• Project of rural electrification with solar energy (Pilot stage).
Departments of Chuquisaca and Oruro.• Project of rural electrification in the counties of Ñuflo of Chavez and
Guarayos.• Formulation of projects of combined implementation.
The first two projects would count on the support of the United States Initiative JointImplementation Office , and the two remaining have the assistance of the NetherlandsJoint Implementation Office.
The international community has a historical roll which is to support the efforts of thehighly vulnerable countries such as Bolivia, and to assist them in the improvement of theirinfrastructure for climate observation, acquisition of equipment that allow themeasurement of climate change, support for the investigation of GHG emissions and theassistance in the construction of national capacities (institutional and human) in order toprop up projects of adaptation in the different sectors.
NATIONAL STRATEGY
The Government of Bolivia has developed a National Strategy in order to guarantee theimplementation of the United Nations Framework Convention on Climate Change. Thisstrategy seeks to establish a shared vision among the different actors in itsimplementation. The strategy also establishes the institutional mission of the organizationsin charge of this implementation.
Bolivia’s strategy on climate change is centered on four pillars which also respond to itslines of action in the field of economic and social development:
• To promote clean development through the inclusion of technological changes inagricultural, forest and industrial practices, to reduce emissions and to make a positiveimpact on the country’s development.
• To cooperate on the reduction of carbon in forests, tropical areas and other naturalecosystems.
• To increase the effectiveness of infrastructure and energy use, to diminish risks ofcontingencies and to mitigate the effects of GHG emissions.
• To increase the observation and the investigation of climate and environmentalchanges in order to develop effective answers.
The implementation of this strategy also responds to the following objectives:
• To promote adaptation politics to climate change in order to obtain technologicaltransformation in the different productive sectors, introducing clean technologythat could similarly help the development of this sector.
• To increase levels of human security considering issues like contingency andhuman vulnerability.
• To integrate the theme of climate change into society through different educationalprocesses.
• To generate strategic alliances in order to achieve the implementation of theNational Strategy.
The strategic lines to follow are :
• To fortify and transform the productive sector;• To increase human security;• To use education and communication in order to achieve adaptation to climate
change; and• To make strategic alliances in order to achieve the implementation of the National
Strategy.
Similarly, Bolivia has begun, with the support of the Switzerland Cooperation and theWorld Bank, the study of the participation strategy in the mechanism of CleanDevelopment proposed by the Kyoto Protocol, as an immediate action to the ratification ofthis protocol carried out in November 1999.
REQUIREMENTS
Financial and technological support to tackle the causes and implications of climate changeis urgently needed not only in Bolivia but in the whole region.
The considerable climate variations in Latin America and, particularly in Bolivia make itnecessary for different resources to improve the construction of climate scenarios and toreduce levels of uncertainty.
Similar support is also needed to combat GHG emissions provoked by changes in land use,forestry and some energy sectors.
The mechanism of Clean Development represents a very important challenge for thedeveloping countries, however, the inequalities between the national capacities lead toinequalities in the access of projects and economical support. It becomes indispensable, inthis sense, to demand a fair treatment from the UNFCCC in this matter through a decisivesupport that could benefit the training of human resources and the consolidation ofinstitutions working on climate change.
Finally, the decisive support of the UNFCCC to the National Program of Climate Change inBolivia is indispensable in order to guarantee and consolidate the process ofimplementation of the UNFCCC.

REFERENCES
ASOCIACIÓN INTERINSTITUCIONAL FORESTAL ANDINA. 1995. Plan quinquenal 1995 - 2000. Ed. AIFOR ANDINA. La Paz(Bolivia). 103 pp.
Analysis for Version 95.0 - Overview for Version 94.0. Boston, MA, USA: Stockholm Environment Institute - Boston, TellusInstitute.
Anuario Estadístico del Sector Eléctrico Boliviano 1995 y 1996, 1996, 1997. La Paz, Bolivia: Ministerio de Desarrollo deEconómico – Viceministerio de Energía e Hidrocarburos.
Balance Energético, 1983 - 1995. Sistema de Información en Energía, 1995. La Paz, Bolivia: Ministerio de Desarrollo deEconómico - Secretaría Nacional de Energía.
Banco Mundial - METMIN. Diálogos ambientales (en prensa)
BAIRON. M.. 1996. Propuesta para el desarrollo regional urbano de La Paz. La Paz
BROCKMAN. C.. 1978. Mapa De Cobertura Y Uso Actual De La Tierra. La Paz: ERTS-GEOBOL
BANDY, D.; GARRITY, D.P.; SÁNCHEZ, A.P. 1994. El problema mundial de la agricultura de tala y quema. In Agroforesteriaen las Américas: Julio-septiembre, 1995. CATIE. Turrialba (Costa Rica). Año 2, No. 7:7 pp.
BELLON, R.M.; MASERA, O.; SEGURA, G. 1994. Response options for sequestering carbon in Mexico`s forest. Centro deEcología, Universidad Nacional Autónoma de México. Ciudad de México D.F. (México). 29 pp.
BRACK, W. 1994. Experiencias agroforestales exitosas en la Cuenca Amazónica. Tratado de Cooperación Amazónica. Lima(Perú).
BRAATZ, V.B. 1995. Overview of greenhouse gas emissions inventory methods and their limitations: Land-Use change,Forestry, and Biomass burning. Latin American Greenhouse Gas Emissions and Mitigation Options. Universidad Central deVenezuela 10(1-2):109-118.
BROWN, S.; LUGO, A.E. 1992. Aboveground biomass estimates for tropical moist forest of the Brazilian Amazon.Interciencia 17:8-18.
CANNEL. M.G.R.. 1995. Climate Change Impacts on Forests. en Climate Change 1995. Impacts Adaptation and Mitigation ofClimate Change: Scientific - Technical Analyses. UNEP - WMO. IPCC. Cambridge University Press. Melbourne
CARDENAS. V.H.. 1994. Reflexión sobre la Ley de Reforma Educativa. en Foro Económico. La Paz. ILDIS
CHIPANA. R.; SEJAS. K.. 1999. Vulnerabilidad y opciones de adaptación del cultivo de soya al posible cambio climático.utilizando escenarios climáticos y modelos de simulación. documento no publicado.
Compañía Boliviana de Energía Eléctrica S.A., 1995. Información del Sistema Eléctrico de COBEE para el Centro de Despachode Cargas. La Paz, Bolivia: COBEE.
Centro de Información para el Desarrollo. 1994. Anuario estadístico del sector rural de Bolivia, Año 1994. Ed. CID. La Paz(Bolivia). 331 pp.
Centro de Información para el Desarrollo. 1996. Anuario estadístico del sector rural de Bolivia, Año 1995-1996. Ed. CID. LaPaz (Bolivia). 297 pp.
Centro Internacional de Agricultura y Pesca. 1991. Annual Report of 1990. Cali (Colombia).
CORNEJO, G.J. 1994. Estudio preliminar del recurso forestal en la zona de colonización Yucumo-Rurrenabaque. CEATA.Santa Cruz (Bolivia). 75 pp.
CHANDRASEKHARAN, C. 1996. Costos, incentivos y obstáculos para la práctica de la ordenación forestal sostenible. UnitedNations Development, Programme Sustainable Energy and Environment División. New York (U.S.A.). 65 pp.
DIXON, R.K. 1995. Sistemas agroforestales y gases de efecto invernadero. In Agroforesteria en las Américas: Julio-septiembre, 1995. CATIE. Turrialba (Costa Rica). Año 2, No. 7:7 pp.
Energy in Bolivia – Information Bulletin of the Viceministry of Energy and Hydrocarbons, Winter 1999 Year 2 Nº 2, 1999. LaPaz, Bolivia: Viceministerio de Energía e Hidrocarburos – Unidad de Promoción de Inversiones.
U.S.EPA 1990. Greenhouse gas emissions from agricultural systems. Enviromental Protection Agency. Washington, D.C.(U.S.A.). 1(2).
Empresa Nacional de Electricidad S.A. - ENDE, 1995. Plan de Expansión del Sistema Interconectado Nacional Período 1995 -2005. Cochabamba, Bolivia: ENDE. 26 p.
Empresa Nacional de Electricidad S.A. - ENDE, 1990 - 1994. Resultados Técnicos de Explotación 1990, 1991, 1992, 1993,1994. Cochabamba, Bolivia: ENDE.
Empresa Nacional de Electricidad S.A. - ENDE, 1990 - 1994. Memoria Anual 1990, 1991, 1992, 1993, 1994. Cochabamba,Bolivia: ENDE.
ESQUINAS ALCÁZAR, J.T. 1981. Los recursos fitogenéticos una inversión segura para el futuro. Instituto Nacional deInvestigaciones Agrarias. Madrid (España). 31 pp.
FASSBENDER, H.W. 1987. Modelos edafológicos de sistemas agroforestales. Ed. CATIE y GTZ. Turrialba (Costa Rica).475 pp.
FEARNSIDE, P.M. 1992. Greenhouse gas emission from deforestation in the Brazilian amazon. Ed. Willy Makundi & JayantSathaye, EPA and Lawrence Berkeley Laboratory. Berkeley (USA). 73 pp.
FISCHERMAN, B. 1996. Las congruencias y diferencias entre la Nueva Ley Forestal y uso tradicional Chiquitano del Bosque.Boletín BOLFOR, No. 7. Santa Cruz (Bolivia). 7:11-15.
ESCOBAR. J..1998. Políticas Doblemente Ganadoras para el cambio climático en Bolivia. documento no publicado.
ETARE (a)(Equipo Técnico de Apoyo a la Reforma Educativa). 1993. “Reforma Educativa: Propuesta. “Cuadernos de laReforma. La Paz
_____(b). 1993. Educación es participación. Memoria Seminario Taller: La Educación Intelectual Bilingue. Cuadernos de laReforma. La Paz
FNUAP (Fondo de Población de las Naciones Unidas). 1993. La población del siglo XXI
G-DRU (Grupo de Desarrollo Rural). 1994. Anuario Estadístico del Sector Rural 1994. CID. La Paz
_____, 1996. Anuario Estadístico del Sector Rural 1995 - 1996. CID. La Paz
Gobierno de Bolivia. 1997. Plan Operativo de Acción 1997 - 2002 "Para vivir mejor". La Paz
_____, 1998b. Plan General de Desarrollo Económico y Social "BOLIVIA XXI. país socialmente solidario". La Paz
_____, 1994. Plan General de Desarrollo Económico y Social "El cambio para todos". La Paz
Gobierno de Bolivia y Cooperación Internacional, 1998, Bolivia towards the 21st Cetury, 11th Consultive Group, Paris
GARCÍA, C.M. 1996. Evaluación de la vulnerabilidad de los cultivos al cambio climático en Bolivia: Serie documentos sobreGases de efecto invernadero, cambio climático y vulnerabilidad de ecosistemas. PNCC, MDSMA. La Paz (Bolivia). pp. 1-8.
GOITIA, A.L.; GÓMEZ, G.J.; TAKASHI, S. 1996. El sector forestal en Bolivia. In. Actas del Seminario sobre manejo forestalde bosques nativos y plantaciones forestales, Santiago (Chile), marzo, 1996. Ed. INFOR-AGCI-JICA. Santiago (Chile).
HOLDRIDGE, L. 1970. Forest environment in tropical life zones a pilot study. Oxford: Pergamon Press Inc. 736 pp.
Instituto Nacional de Estadística. 1994. Boletín de Estadísticas Agrícolas 1992-1993. INE. La Paz (Bolivia). 53 pp.
INTERGOVERNMENTAL PANEL ON CLIMATE CHANGE. 1995. IPCC Guidelines for Greenhouse Gas Inventory: ReferenceManual. Ed. IPCC. Washington (USA). 3(5)1-57.
INTERGOVERNMENTAL PANEL ON CLIMATE CHANGE. 1990. Climate Change, The IPCC Scientific Assessment. Ed. J.THoughton, G.J. Jenkins and J.J. Ephraums, Cambridge University Press. Cambridge, U.K.
INTERGOVERNMENTAL PANEL ON CLIMATE CHANGE. 1992. Cambio climático, Evaluación Científica del IPCC. GrupoIntergubernamental de expertos sobre el cambio climático. Madrid (España).
International Energy Initiative, 1995. Estudio Sobre los Usos Finales de la Energía Eléctrica en el Sector Residencial delDepartamento de La Paz - Bolivia. Sao Paulo, Brasil - La Paz,Bolivia: International Energy Initiative. 19 p.
INE. 1995. Anuario Estadístico. La Paz
INE. 1996. Cuentas Nacionales. La Paz
INEb. 1996. Encuesta Nacional de Consumos de Energía en el Área Rural de Bolivia. La Paz
International Bahá’í Community . 1998. Valuing Spirituality in Development; Initial Consideration Regarding the Creation ofSpiritually Based Indicators for Development.
IPCC (Intergovernmental Panel on Climate Change). 1997. IPCC Special Report. The regional impacts of climate change: Anassessment of vulnerability
_____. 1995. Climate Change 1995. Impacts. Adaptation. Contribution of Working Group II to the Second AssessmentReport of the IPCC. Candbridge University Press
IUCN (International Union for the Conservation of Nature). 1997. Participatory and Reflective Analytical Mapping (PRAM)
_____. 1997. Performance Assessment for Human and Ecosystem Wellbeing and Sustainable Development: A SystemAssessment Method
Intergovernmental Panel on Climate Change, 1996. Methods for Assessment of Mitigation Options. Technical Appendix toClimate Change 1995: Impacts, Adaptations, and Mitigation of Climate Change: Scientific-Technical Analyses. Contribution ofWorking Group II to the Second Assessment Report of the Intergovernmental Panel on Climate Change. New York, USA:Cambridge University Press.
Instituto Nacional de Estadística - Cuentas Nacionales, 1996. Bolivia: Estimación del PIB, Niveles y Proyecciones deCrecimiento. Bolivia: Estimaciones y Proyecciones de la Población 1950 - 2050. La Paz, Bolivia: Instituto Nacional deEstadística.
JARVIS, P.G. 1989. Atmospheric carbon dioxide and forest. Phil. Trans. R. Soc. London. B324:369-392.
KRANKINA, O.N.; DIXON, R.K. 1994. Forest management options to conserve and sequester terrestrial carbon un theRussian Federation. World Resources Review. 6:88-101.
LIGA DE DEFENSA DEL MEDIO AMBIENTE. 1992. De la conciencia a la acción, El estado del medio ambiente en Bolivia.Ed. LIDEMA. La Paz (Bolivia).
LITSINGER, J.A. 1993. Evaluación del potencial de incremento de la producción de arroz en la región del Chapáre en eltrópico boliviano. Development Alternatives Inc, USAID. Cochabamba (Bolivia). 54 pp.
MAKUNDI, W.; SATHAYE, J.; KETOFF, A. 1991. A Spreadsheet Model for Estimating Carbon Flows Associated with the Useof Forest Resources (COPATH3). Lawrence Berkeley Laboratory, University of California & U.S. Environmetal ProtectionAgency. Berkeley CA. (U.S.A.). 19 PP.
MASERA, C.O.; ORDOÑES, J.M.; DIRZO, M.R. 1992. Carbon emissions from deforestration in Mexico: Current situation andlong-term scenarios. Ed. Willy Makundi & Jayant Sathaye, EPA and Lawrence Berkeley Laboratory. Berkeley (USA). 49 pp.
MANCILLA, T.R.; ANDALUZ, A. 1996. Cambios sustanciales en la Legislación Forestal Nacional. Boletín BOLFOR, ED. No. 7.Santa Cruz (Bolivia). 7:6-7
MANCILLA, T.R. 1996. Estados de Conservación de los bosques en Bolivia: Hacia el Manejo Forestal Sostenible. Ed.BOLFOR, MDSMA. Santa Cruz (Bolivia). pp. 111-125.
MINISTERIO DE DESARROLLO SOSTENIBLE Y MEDIO AMBIENTE, SECRETARIA NACIONAL DE RECURSOS NATURALES YMEDIO AMBIENTE, SUBSECRETARIA DE RECURSOS NATURALES. 1995a. Mapa forestal de Bolivia. La Paz (Bolivia). 43 pp.
MINISTERIO DE DESARROLLO SOSTENIBLE Y MEDIO AMBIENTE, SECRETARIA NACIONAL DE RECURSOS NATURALES YMEDIO AMBIENTE, SUBSECRETARIA DE MEDIO AMBIENTE. 1995b. Marco referencial para la acción ambiental en Bolivia.La Paz (Bolivia). 217 pp.
MINISTERIO DE DESARROLLO SOSTENIBLE Y PLANIFICACION, VICEMINISTRO DE PLANIFICACION Y ORDENAMIENTOTERRITORIAL. 1998. Plan General de Desarrollo Económico y Social 1997 - 2002. La Paz (Bolivia). 112 pp.
MINISTERIO DE DESARROLLO SOTENIBLE Y PLANIFICACION, VICEMINISTRO DE PLANIFICACION Y ORDENAMIENTOTERRITORIAL. 1997. Marco Conceptual Estratégico del Nuevo Plan General de Desarrollo Económico y Social. La Paz
(Bolivia). 46 pp.
MINISTERIO DE DESARROLLO ECONOMICO - Viceministerio de Energía e Hidrocarburos, 1998. Estrategia de Energía Rural.La Paz, Bolivia: Ministerio de Desarrollo Económico - Viceministerio de Energía e Hidrocarburos. 39 p.
MARCONI, M. 1991. Conservación de la Biodiversidad en Bolivia. Ed. Centro de Documentación de la Conservación,CDC/USAID. La Paz (Bolivia).
MELILLO, J.; CALLAGHAN, T.V.; WOODWARD, F.I.; SALATI, E.; SINHA, S.K. 1992. Cambio Climático: Efectos sobre losecosistemas. IPCC. Trad. Instituto Nacional de Meteorología. Madrid (España). pp. 313-340
MINISTERIO DE ASUNTOS CAMPESINOS Y AGROPECUARIOS. 1993. Plan de acción forestal nacional. Ed. MACA-CDF-SENMA. La Paz (Bolivia). 76 pp.
MINISTERIO DE DESARROLLO SOSTENIBLE Y MEDIO AMBIENTE, SECRETARIA NACIONAL DE RECURSOS NATURALES YMEDIO AMBIENTE, SUBSECRETARIA DE MEDIO AMBIENTE, PROGRAMA NACIONAL DE CAMBIOS CLIMATICOS. 1997a.Bolivia: Plan Nacional de Acción para el Cambio Climático. La Paz (Bolivia). 14 pp.
MINISTERIO DE DESARROLLO SOSTENIBLE Y MEDIO AMBIENTE, SECRETARIA NACIONAL DE RECURSOS NATURALES YMEDIO AMBIENTE, SUBSECRETARIA DE MEDIO AMBIENTE, PROGRAMA NACIONAL DE CAMBIOS CLIMATICOS. 1997b.Inventariación de Emisiones de Gases de Efecto Invernadero, Bolivia, 1990. La Paz (Bolivia). 43 pp.
MINISTERIO DE DESARROLLO SOSTENIBLE Y MEDIO AMBIENTE, SECRETARIA NACIONAL DE RECURSOS NATURALES YMEDIO AMBIENTE, SUBSECRETARIA DE MEDIO AMBIENTE, PROGRAMA NACIONAL DE CAMBIOS CLIMATICOS. 1997c.Vulnerabilidad de los Ecosistemas al posible Cambio Climático y Análisis de Mitigación de Gases de Efecto Invernadero. LaPaz (Bolivia). 257 pp.
MINISTERIO DE DESARROLLO SOSTENIBLE Y MEDIO AMBIENTE, SECRETARIA NACIONAL DE RECURSOS NATURALES YMEDIO AMBIENTE, SUBSECRETARIA DE MEDIO DE RECURSOS NATURALES, DIRECCIÓN DE CONSERVACIÓN DE TIERRAS.1996. Programa Nacional de Lucha Contra la Desertificación y la Sequía. Ed. Centro de Información para el Desarrollo. LaPaz (Bolivia). 164 pp.
MINISTERIO DE DESARROLLO SOSTENIBLE Y MEDIO AMBIENTE, SECRETARIA NACIONAL DE RECURSOS NATURALES YMEDIO AMBIENTE, SUBSECRETARIA DE MEDIO DE RECURSOS NATURALES, DIRECCIÓN DE CONSERVACIÓN DE TIERRAS.1996. Mapa preliminar de erosión de suelos : Región árida, semiárida y subhúmeda seca de Bolivia. La Paz (Bolivia). 56 pp.
MINISTERIOS DE ENERGIA E HIDROCARBUROS - Plan Nacional de Energía, 1993. Balance Energético 1992. Boletin 2/93. LaPaz, Bolivia: Ministerio de Energía e Hidrocarburos. 50 p.
MINISTERIO DE HACIENDA - INE / DEE / DI - ESMAP - Banco Mundial, 1996. Encuesta Nacional de Consumos de Energía enel Area Rural de Bolivia - Sector Doméstico Rural. La Paz, Bolivia: Instituto Nacional de Estadística. 250 p.
MINISTERIO DE DESARROLLO ECONOMICO - Secretaria Nacional de Energía, 1996. Plan Indicativo de Electrificación Ruralde Bolivia. La Paz, Bolivia: Ministerio de Desarrollo Económico - Secretaria Nacional de Energía. 37 p.
MINISTERIO DE DESARROLLO ECONOMICO - Secretaria Nacional de Energía, 1996. Programa de Inversiones enElectrificación Rural - Bolivia - (1996 -2001). La Paz, Bolivia: Ministerio de Desarrollo Económico - Secretaria Nacional deEnergía. 19 p.
MINISTERIO DE DESARROLLO SOSTENIBLE Y MEDIO AMBIENTE - Secretaría Nacional de Recursos Naturales y MedioAmbiente - Subsecretaría de Medio Ambiente - Programa Nacional de Cambios Climáticos, 1996. Inventario de Emisiones deGases de Efecto Invernadero de Origen Antropogénico de Bolivia para el año 1990. La Paz, Bolivia: Programa Nacional deCambios Climáticos. 32 p.
MINISTERIO DE DESARROLLO ECONOMICO. 1998. Estrategia de Electrificación Rural. La Paz
_____. 1998. Tabla no publicada
MINISTERIO DE DESARROLLO HUMANO. 1996. Distritación Municipal. La Paz
_____. 1997. Mujer Territorio y Participación Popular. La Paz
_____.1995. Mapa de la Pobreza; una guia para la acción social. La Paz. UDAPSO-INE-UPP-UDAPE
MINISTERIO DE HACIENDA. 1996. Estrategia de transformación productiva del agro. La Paz
MDSMA. 1997b. Inventario de Emisiones de Gases de Efecto Invernadero. Bolivia - 1990. La Paz
_____. 1996. Agenda Bolivia 21. La Paz
_____. 1995. Estrategia Nacional de Desarrollo Sostenible. (esquemas no publicados). La Paz
MDSP .1999. Plan Nacional de Acción sobre el Cambio Climático - Sector No Energético. La Paz
_____. 1998. Plan Nacional de Acción sobre el Cambio Climatico - Sector Energético. La Paz
ONU (Organización de las Naciones Unidas). CMNUCC Convención sobre el cambio climático
_____. Protocolo de Kyoto de la Convención Marco de las Naciones Unidas sobre el Cambio Climático
_____. 1974. Conferencia Mundial de Población. Bucarest
_____. 1989. Foro Internacional sobre la Población en el siglo XXI. Amsterdam
_____. 1992. Conferencia de las Naciones Unidas sobre el Medio Ambiente y el Desarrollo. “Adopción de acuerdos sobre elmedio ambiente y el desarrollo. Programa 21”. A/CONF.151/4
PAZ, O., ROMERO, S., TEJADA, F., GARCIA, M., HANNA, J. y otros, 1997. Vulnerabilidad y Adaptación de los Ecosistemas alPosible Cambio Climático y Análisis de Mitigación de Gases de Efecto Invernadero. La Paz, Bolivia: Ministerio de DesarrolloSostenible y Medio Ambiente - Programa Nacional de Cambios Climáticos.
PAZ, O., ROMERO, S., TEJADA, F., GARCIA, M., HANNA, J. y otros, 1997. Inventariación de Emisiones de Gases de EfectoInvernadero Bolivia - 1990. La Paz, Bolivia: Ministerio de Desarrollo Sostenible y Medio Ambiente - Programa Nacional deCambios Climáticos.Yacimientos Petrolíferos Fiscales Bolivianos - Gerencia de Planificación, División de Estadística, 1996. Informe Estadístico1996. La Paz, Bolivia: Yacimientos Petrolíferos Fiscales Bolivianos. 17 p.
REYES, G.; BROWN, S.; CHAPMAN, J.; LUGO, A.E. 1992. Wood densities of tropical tree species. USDA Forest Service,General Technical Report S0-88, Souther Forest Experiment Station. New Orleans, Louisiana (USA).
ROMERO, C.S. 1996. Emisiones de gases de efecto invernadero del sector cambio en el usos de la tierra y silvicultura deBolivia: Serie documentos sobre Gases de efecto invernadero, cambio climático y vulnerabilidad de ecosistemas. PNCC,MDSMA. La Paz (Bolivia). pp. 1-9.
RUSSELL, E.C. 1994. An environmental assessment of the National Programme for the Sustainable Use of Bolivian ForestResources and Increase in Exports. ONU, ONUDI. La Paz (Bolivia).
ORGANIZACIÓN DE ESTADOS AMERICANOS. 1986. Programa Regional Energético Boliviano. OEA. La Paz (Bolivia).
Perspective: Creating sustainable communities. One country. Volume 7. 1998
Prefectura de La Paz - Secretaría Departamental de Participación Popular. 1997. Administración Departamental y Legislación.La Paz
PNUD (Programa de las Naciones Unidas para el Desarrollo). 1998. DESARROLLO HUMANO EN BOLIVIA 1998
_____(a). 1998. INFORME SOBRE DESARROLLO HUMANO 1998.
_____(b). 1998. Issues & Options. The Clean Development Mechanism.
_____. 1997. Energy after Rio - Prospects and Challenges. Executive Summary.
_____(a). 1996. Poverty Eradication. A Policy Paper for Country Strategies.
_____(b). 1996. Progress Against poverty. A Report on Activities Since Copenhagen.
_____(c). 1996. World Resources. WRI-UNEP-UNDP-WB
_____. 1994. INFORME SOBRE DESARROLLO HUMANO 1994
Presidencia de la República de Bolivia, 1998. Plan General de Desarrollo Económico y Social 1997 – 2002. La Paz, Bolivia:Ministerio de Desarrollo Sostenible y Planificación. 136 p.
PLAN DE ACCIÓN FORESTAL. 1997. Guía para inversión forestal en Bolivia: Versión preliminar. FAO, CGP. Santa Cruz(Bolivia). 67 pp.
RIOS, C., FERNANDEZ, M., 1997. Energía y Desarrollo Sustentable en América Latina y El Caribe – Estudio de Caso deBolivia (primera versión sujeta a revisión). La Paz, Bolivia: Proyecto OLADE/CEPAL/GTZ “Energía y Desarrollo Sustentable enAmérica Latina y El Caribe”.
REYNER. S.. MOLONE. E.. 1998. Human Choice & Climate Change. Ten Suggestions for Policymakers. Battelle MemorialInstitute. Ohio
RIVERA. M.O.. 1992. Regiones Ecológicas. en Marconi. M. Editora. Conservación de la Diversidad Biológica en Bolivia. CDC-USAID
SENAHMI. 1998. Estudio de escenarios climáticos. La Paz
SNPP (Secretaría Nacional de Participación Popular). 1996. informe de actividades. La Paz
Sustainable communities in an integrating world. One country. Volume 8. 1998
SÁNCHEZ, A.P.; SALINAS, G.J. 1990. Suelos ácidos: Estrategias para su manejo con bajos insumos en América tropical. 85pp.
SÁNCHEZ, A.P.; PALM, C.A.; SMYTH, T.J. 1990. Approaches to mitigate tropical deforestation by sustainable soilsmanagement practices. In Soils on a warmer earth, developments in soles science. Ed. H.W. Scharpenseel, M. Schomakerand A. Ayoub. Amsterdam (Holanda). 20:211-220.
SECRETARIA NACIONAL DE AGRICULTURA Y GANADERÍA. 1993. Estrategia de Desarrollo Agropecuario 1994-2003. Ed.SNAG. La Paz (Bolivia). 160 pp.
SECRETARIA NACIONAL DE AGRICULTURA Y GANADERÍA: SUBSECRETARIA, PRODUCCIÓN VEGETAL. 1997. Situación delsector agropecuario en Bolivia. Seminario Taller: Vulnerabilidad de los ecosistemas agrícolas al cambio climático, La Paz, 30julio - 1 agosto 1997. La Paz (Bolivia).
SHORT, W., PACKEY, D.J., y HOLT, T., 1995. A Manual for the Economic Evaluation of Energy Efficiency and RenewableEnergy Technologies. Golden, Colorado, Estados Unidos: National Renewable Energy Laboratory. 96 p.
Stockholm Environment Institute - Boston, 1995. Long-range Energy Alternatives Planning System - User Guide for Version95.0 - Training Exercises for Greenhouse Gas Mitigation
SERVICIO GEOLÓGICO DE BOLIVIA. 1978. Mapa de cobertura y Uso Actual de la Tierra: Programa del Satélite Tecnológicode Recursos Naturales (ERTS). [Memoria Explicativa serie Sensores Remotos 2]. Ed. GEBOL-YPFB. La Paz (Bolivia). 116 pp.
TEJADA, M.F. 1997. Complementación a la Evaluación de Vulnerabilidad y Adaptación al Cambio Climático - Sector Forestal.PNCC. La Paz (Bolivia). 9 pp.
TORRICO. A.; CHIPANA. R.. 1999. Vulnerabilidad y opciones de adaptación del cultivo de papa (Solanum Tuberosum) alcambio climático para condiciones de altiplano y valles. docimento no publicado.
UNEP Collaborating Centre on Energy and Environment - Risø National Laboratory, 1994.
UNEP Greenhouse Gas Abatement Costing Studies. Analysis of Abatement Costing Issues and Preparation of a Methodologyto Undertake national Greenhouse Gas Abatement Costing Studies. Phase Two – Part One: Main Report, Part Two: CountrySummaries. Roskilde, Denmark: UNEP Collaborating Centre on Energy and Environment - Risø National Laboratory. 128 p.,170 p.
UDAPE. 1997. Dosier de información de estadísticas económicas de Bolivia. La PazUnidad de Análisis de Políticas Sociales y Económicas, 1998. Dossier de Estadísticas Sociales y Económicas de Bolivia –Volumen No. 8. La Paz, Bolivia: Unidad de Análisis de Políticas Sociales y Económicas. 421 p.
UNITED STATES ENVIRONMENTAL PROTECTION AGENCY. 1994. Inventory of U.S. Greenhouse Gas Emissions and Sinks1990-1993. U.S. EPA. Washington, D.C., U.S.A. 58 pp.
Universidad Mayor de San Simón - GTZ - Universidad Mayor de San Andrés, 1992. II Seminario Nacional de Energía Solar. LaPaz, Bolivia: Universidad Mayor de San Simón. 396 p.
WENNERGREN, E.B.; WHITAKER, M.D. 1975. The Status of Bolivian Agriculture. Praeger Special Studies in InternationalEconomics and Development. New York (USA). 308 pp.
WORLD RESOURCES INSTITUTE. 1990. World Resources Report 1990-91. World Resouces Institute. Washington, DC(U.S.A.).
WORLD RESOURCES INSTITUTE. 1997. Linking Biodiversity and Agriculture: Challenges and Opportunities for SustainableFood Security. Washington
Yacimientos Petrolíferos Fiscales Bolivianos – Unidad de Negociaciones y Contratos, Control Area de Producción, 1998.Resumen Mensual Nacional de Producción de Hidrocarburos. Santa Cruz, Bolivia: Yacimientos Petrolíferos Fiscales Bolivianos.26 p.
Yacimientos Petrolíferos Fiscales Bolivianos - GID Oriente, 1995. Ahorro de Energía y Control de CO2 a la Atmósfera -Refinería “Guillermo Elder”. Santa Cruz, Bolivia: Yacimientos Petrolíferos Fiscales Bolivianos.
Yacimientos Petrolíferos Fiscales Bolivianos - Gerencia Comercial, 1993 - 1997. Gerencia Comercial - Informe AnualGestiones 1992, 1993, 1994, 1995, 1996. La Paz, Bolivia: Yacimientos Petrolíferos Fiscales Bolivianos.
Yacimientos Petrolíferos Fiscales Bolivianos - Gerencia de Planificación – División de Estadística, 1996. Actividad Petrolera enCifras 1986 - 1995. La Paz, Bolivia: Yacimientos Petrolíferos Fiscales Bolivianos. 60 p.
ZAMBRANA. F.. 1998. Tecnología y Comunicación Agropecuaria. en Paz. D. (Editor) Cuestión Agraria Boliviana. Presente yFuturo. La Paz
ZEBALLOS. H.. 1998. Producción Agropecuaria Nacional. en Paz. D. (Editor) Cuestión Agraria Boliviana. Presente y Futuro. LaPaz
ZONISIG (Zonificación y SIG). 1997. Zonificación Agroecológica y Socioeconómica y Perfil Ambiental del Departamento dePando. La Paz