Embed Size (px)
Citation preview
First national VOICES survey of bereaved people: key findings report
‘How people die remains in the memory of those who live on’
Dame Cicely Saunders
Founder of the Modern Hospice Movement
July 2012
National VOICES survey key findings report
2
You may re-use the text of this document (not including logos) free of charge in any format or medium, under the terms of the Open Government Licence. To view this licence, visit www.nationalarchives.gov.uk/doc/open-government-licence/
© Crown copyright 2012 First published July 2012 Published to DH website, in electronic PDF format only. www.dh.gov.uk/publications
DH INFORMATION READER BOX
Policy Clinical EstatesHR / Workforce Commissioner Development IM & TManagement Provider Development FinancePlanning / Performance Improvement and Efficiency Social Care / Partnership Working
Document Purpose
Gateway ReferenceTitle
Author
Publication DateTarget Audience
Circulation List
Description
Cross Ref
Superseded Docs
Action Required
TimingContact Details
133-155 Waterloo Road
This report summarises the main findings from the first national VOICES survey of the bereaved. The survey was run by the Office for National Statistics (ONS), on behalf of the DH, and the full data are available on the ONS website.
N/A
DH / NHS Medical Directorate / End of Life Care
03 July 2012PCT Cluster CEs, NHS Trust CEs, SHA Cluster CEs, Care Trust CEs, Foundation Trust CEs , Medical Directors, Directors of Nursing, Local Authority CEs, Directors of Adult SSs, PCT Cluster Chairs, NHS Trust Board Chairs, Allied Health Professionals, GPs, Voluntary sector organisations
#VALUE!
End of Life Care Strategy (2008)
N/A
N/A
www.dh.gov.uk
17865
For Information
For Recipient's Use
First national VOICES survey of bereaved people
London SE1 8UG020 797 24967
End of Life Care TeamDepartment of HealthRoom 402, Wellington House
National VOICES survey key findings report
3
First national VOICES survey of bereaved people: key findings report
This report highlights the key findings from the first national VOICES survey of bereaved people, which was undertaken by the Office for National Statistics (ONS) on behalf of the Department of Health. The report was developed with support from the ONS, and complements the survey data the ONS published on 3 July.
National VOICES survey key findings report
4
Contents Introduction ................................................................................................................................ 5
Methods ..................................................................................................................................... 5
Results ....................................................................................................................................... 7
Overall quality of care in the last three months of life ................................................................. 8
Coordination of care ................................................................................................................... 9
Relief of pain and of suffering in the last three months of life ..................................................... 9
Care and support in the last two days of life............................................................................... 9
Decision making, communication, preferences and choice at the end of life ........................... 10
Support for relatives, friends or carers at the end of life ........................................................... 11
Variations by PCT cluster ......................................................................................................... 12
Quality of care for people with dementia .................................................................................. 13
Discussion ................................................................................................................................ 13
Tables ...................................................................................................................................... 17
References ............................................................................................................................... 50
National VOICES survey key findings report
5
Introduction 1.1 This report provides an overview of the findings from the first ever national
survey of bereaved relatives in England. The overall aims of the survey were to assess the quality of care delivered to people in the last three months of their lives in this country and to assess variations in the quality of care delivered in different parts of the country and to different groups of patients.
1.2 The survey was commissioned by the Department of Health in line with a commitment made in the End of Life Care Strategy (2008)1 to carry out surveys of bereaved relatives. Until now very little systematic information has been available about the quality of care delivered to people approaching the end of life, though reports from the Healthcare Commission and others have highlighted deficiencies in care.
1.3 The approach adopted for this survey was to send a questionnaire by post to the person who had informed the registrar of deaths about the death; this was usually a relative or friend of the deceased. The informant was asked to pass the questionnaire on to another family member or friend of the deceased if appropriate. The questionnaires were sent out between four and eleven months after the patient had died.
1.4 This approach is based on extensive research by Professor Julia Addington-Hall and colleagues2, asking bereaved relatives about their perceptions of the care given to recently deceased persons. The Views of Informal Carers for the Evaluation of Services (VOICES) approach has been successfully used to assess the quality of care given to patients dying from a range of conditions (e.g. cancer, stroke and chronic obstructive pulmonary disease) and in different locations(3-7). This approach is now well established and has been shown to be valid in relation to evaluation of services(8-12).
1.5 Following publication of the End of Life Care Strategy, Professor Addington-Hall was commissioned by the Department of Health to modify the VOICES questionnaire in order to measure key aspects of the quality of care identified in the strategy. The resulting short form of the VOICES questionnaire (VOICES-SF) was subsequently piloted in two Primary Care Trusts13 (East Berkshire and the Isle of Wight) in 2010/11. These pilots demonstrated the feasibility of the approach and the acceptability of the new survey tool. The findings from the pilots also showed that the survey could detect differences in the quality of care provided in different settings (e.g. hospitals versus hospices). Minor modifications were made to the survey tool following the pilots. In particular an item regarding overall quality of care in the last three months of life was added.
Methods 2.1 The national survey was conducted by the Office for National Statistics (ONS)
on behalf of the Department of Health. The study was designed to enable
National VOICES survey key findings report
6
comparisons to be made between the quality of care given to people dying at different ages (e.g. less than 65 years, 65-79 years or 80 years or more) and different causes of death (cardiovascular, cancer or other) and for people receiving care in different settings in the last three months of life (e.g. home, hospital, care home and/or hospice). Importantly the sample size was chosen in order to enable comparisons to be made in the delivery of care between the 51 Primary Care Trust (PCT) clusters in England in 2010/11. On average these clusters have populations of around more than 800,000 adults (range 383,000 to 2,080,000), of whom between 3,300 and 23,700 adults die in a year.
2.2 The sample of informants of death to whom the questionnaire survey was sent was drawn from the 306,409 deaths among adults which occurred between 1st November 2010 and 30th June 2011. A total of 16,264 (5.3%) people who had died were excluded because the death was due to accident, suicide or homicide (7,228), had occurred ‘elsewhere’ than the designated locations (3,491) or because address details of the informant were missing (5,545). All of the latter group were deaths which had been referred to a coroner. Of the remaining 290,145 with informant details around one third (35.2%) were deaths which had been referred to a coroner and two thirds (64.8%) were not.
2.3 From the 290,145 eligible for the survey a sample of 1 in 6 (around 49,000) was drawn for the actual survey. Sampling methods were implemented to ensure the sample represented deaths in England by sex of the deceased, cause of death, place of death, age and region.
2.4 As is standard in most surveys there were three mail outs to informants. The first comprised the mail-merged personalised questionnaire, a prepaid return envelope, an information leaflet and a reply slip [see web appendix B]. A reminder letter was sent three weeks after the mail-out to non-responders. A final invitation to take part was sent after the reminder letter together with a further questionnaire, envelope, leaflet and reply slip. An online version of the questionnaire was also provided, with information about this given in the letter.
2.5 It was recognised that the survey contained questions of a sensitive nature and was addressed to people who had been bereaved within the previous year. A free national telephone number was provided for the ONS Survey Enquiry Line, which is open for extended hours Monday to Friday and on Saturday mornings. The survey team worked closely with Cruse Bereavement Care, with information being provided in the letter and information leaflet and from the Survey Enquiry Line team.
2.6 The version of the VOICES-SF questionnaire used in the survey has 59 questions [70 items]. These cover:
• details about the respondent (e.g. age, sex and relationship to the deceased)
National VOICES survey key findings report
7
• details about the deceased (e.g. duration of final illness and settings where the deceased had received care in the last three months of life and ethnicity and religion of the deceased)
• perceptions of the quality of care delivered in each care setting
including overall quality of care and dignity and respect given to the deceased person by staff
• coordination of care within the community and between hospitals and
community services
• quality of care given in the last two days of life
• decision making toward the end of life
• awareness of likely death and preferences and choice about where to die
• respondents’ views on ultimate place of death
• support provided to family/friends in the last three months of the
person’s life and after the death.
2.7 The information provided by the respondents was combined with information known to ONS from the death certification process. This included age, gender, place of death, cause of death and country of birth of the deceased, together with their postcode which was used to assess level of deprivation.
2.8 For clarity in this short report almost all percentages in the Tables are rounded to the nearest whole number. Full details with confidence intervals are available in the set of tables published on the Office for National Statistics website (www.ons.gov.uk).
Results 3.1 The VOICES-SF questionnaire was sent out in November 2011 to 48,766 adults
who had registered a death 4 to 11 months earlier. A total of 22,292 people responded giving a response rate of 45.7%. No response was received from 29.7%; 21.7% sent the reply slip choosing to opt out and 2.9% did not reach the respondent and were returned to sender.
3.2 A full comparison of responders and non responders is shown in the web appendix. Response rates were significantly higher (p<0.001) when the deceased was female, aged 80 or over, died in a care home or hospice, died from cancer, was in the least deprived quintile and was born in the UK.
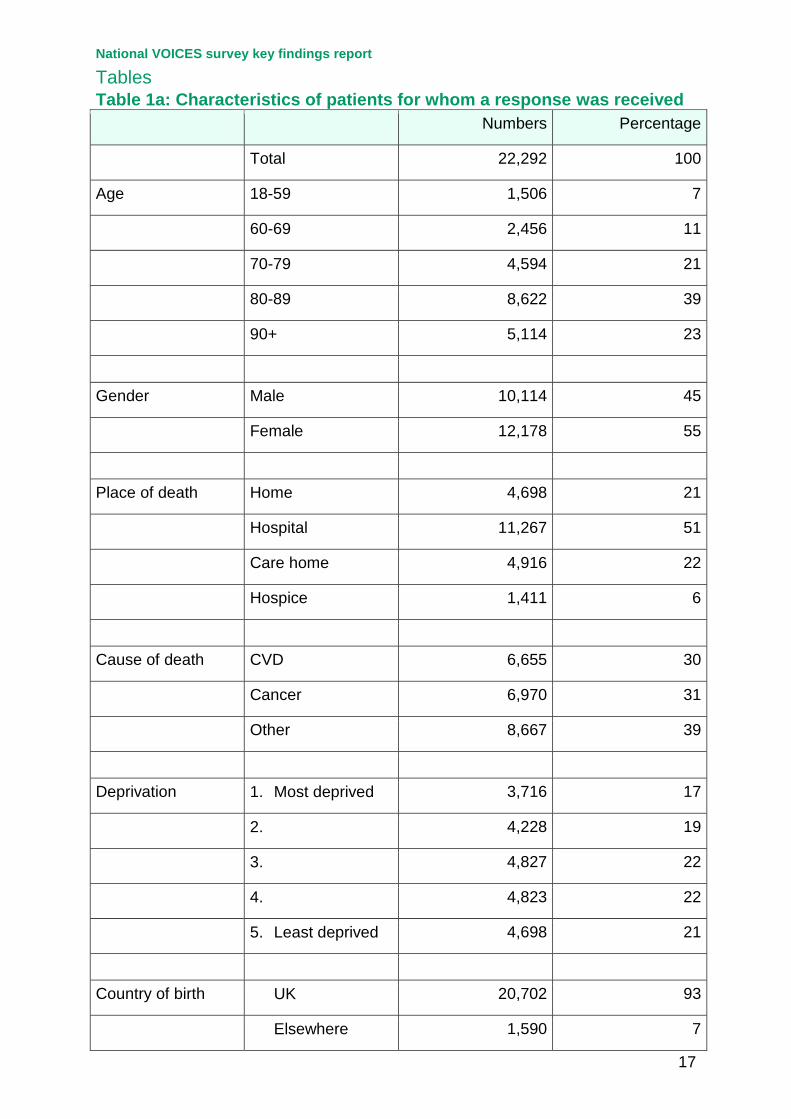
3.3 The characteristics of the patients for whom a response was received are shown in Table 1. Over 60% of the patients were aged 80 years or more at the time of death with nearly a quarter (23%) being aged 90 or more. Around one
National VOICES survey key findings report
8
half (51%) died in hospital, with 21% dying at home, 22% in a care home and 6% in a hospice. Around 93% had been born in the UK.
3.4 Around 90% of respondents were able to provide information on duration of illness. Among those with known duration of illness over 40% had the illness for a year or more and a further 13% for 6-12 months. In contrast, around 10% had a sudden death or died within 24 hours and around 15% were ill for between 1 day and 1 month (Table 1b).
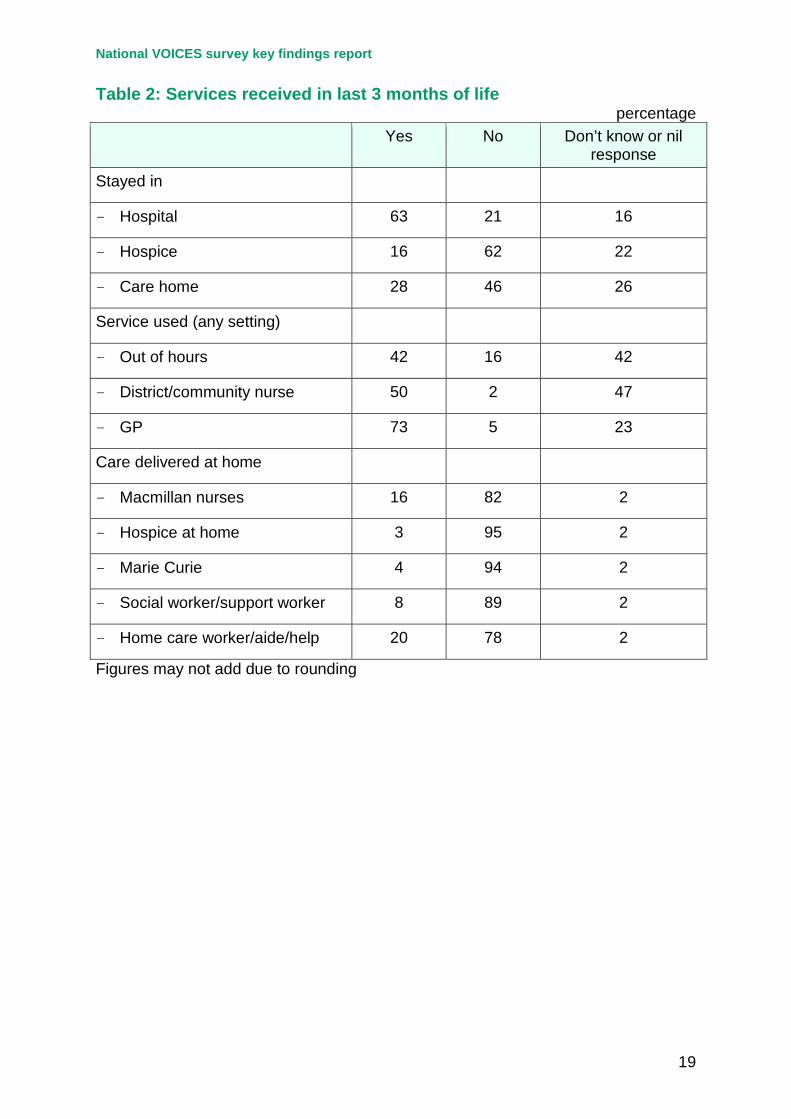
3.5 Respondents were generally much more able to answer questions about services delivered at home than in other settings. There were high levels of nil responses or ‘don’t knows’ for use of district/community services or out of hours services. These questions were only asked where the patient had been at home for some or all of the last three months of life and where the death had not been sudden. Despite this the most highly used services reported were GP services (73%), hospital services (63%) and district/community nurses (50%) – Table 2.
Overall quality of care in the last three months of life 4.1 Overall quality of care across all services and settings was reported for around
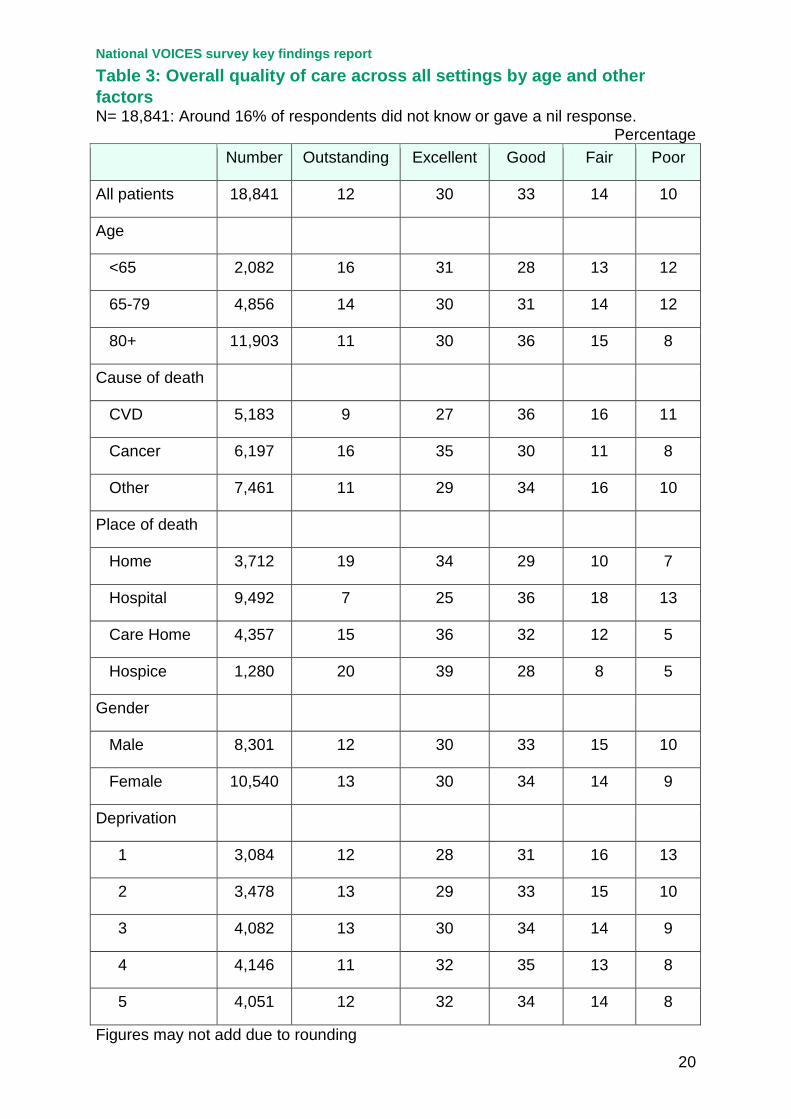
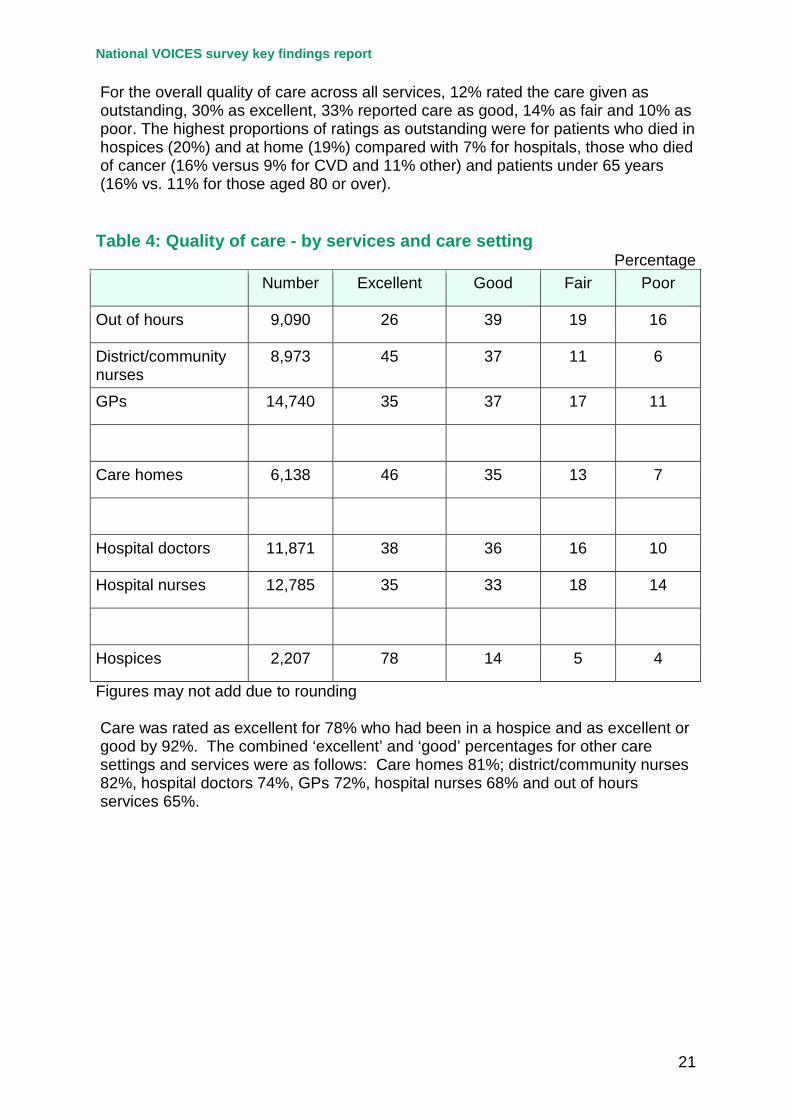
84% of patients. Of these 12% rated the care given as outstanding, 30% as excellent, 33% reported care as good, 14% as fair and 10% as poor – Table 3. The highest proportions of ratings as outstanding were for patients who died in hospices (20%) and at home (19%) compared with 7% for hospitals, those who died of cancer (16% versus 9% for CVD and 11% other) and patients under 65 years (16% vs. 11% for those aged 80 or over).
4.2 Ratings of quality of care by care setting are shown in Table 4. Care was rated as excellent for 78% who had been in a hospice and as excellent or good by 92%. The combined ‘excellent’ and ‘good’ percentages for other care settings and services were as follows: Care homes 81%; district/community nurses 82%, hospital doctors 74%, GPs 72%, hospital nurses 68% and out of hours services 65%.
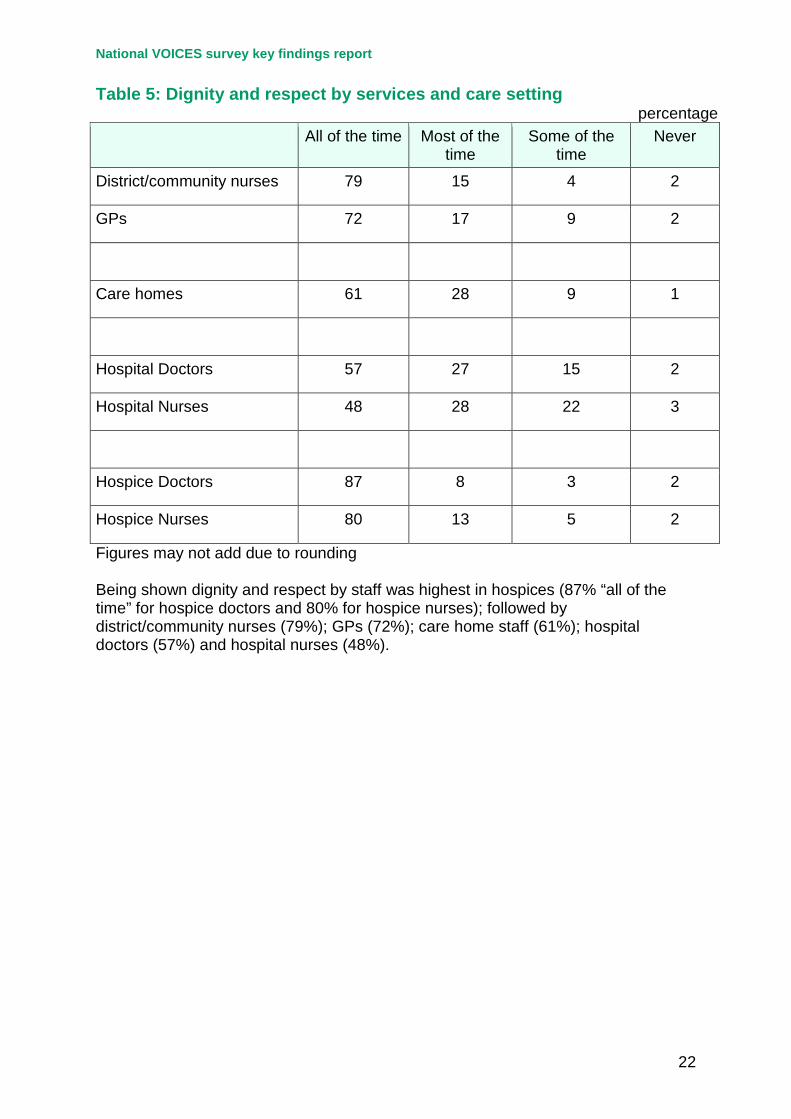
4.3 Being shown dignity and respect by staff was highest in hospices (87% “all of the time” for hospice doctors and 80% for hospice nurses); followed by district/community nurses (79%); GPs (72%); care home staff (61%); hospital doctors (57%) and hospital nurses (48%) – Table 5. Dignity and respect ratings were generally highest for patients with cancer as the cause of death, though no significant difference by cause of death was observed among hospital doctors – Table 6. In care homes, dignity and respect ratings were highest for patients aged under 65 years compared with the older age groups. In the hospital setting, patients who died at 80 years or older were rated lowest compared with both the under 65 and 65 to 79 year age groups – Table 7.
National VOICES survey key findings report
9
Coordination of care 5.1 Only around 40% of respondents completed the question asking whether
community services worked well together as this question was only asked where the patient had been at home for some or all of the last three months of life and where the death had not been sudden. In addition some reported no community care had been received. Among those who responded to this item, 45% reported ‘yes – definitely’ and a further 42% ‘yes – to some extent’. Community services working well together was highest for patients who died at home (58% yes definitely), cancer patients (50%) and for younger patients (for those under 80 years) – Table 8.
5.2 Around 40% responded to the question asking whether hospital services worked well together with GP and other services outside hospital – Table 9. The ratings were lower than for the previous item, with only 33% responding ‘yes-definitely’. Significantly higher ratings were reported for cancer patients (36%) and for those who died at home (39%). No difference was observed according to the age of the patient at death.
Relief of pain and of suffering in the last three months of life 6.1 Pain relief was reported as being provided ‘completely, all of the time’ most
frequently among those in hospices (62%) and least frequently among those at home (17%) – Table 10a. In hospices and at home relief of pain was reported to be highest for those who died of cancer. In hospitals and care homes relief of pain was similar across cancer, CVD and other causes – Table 10b.
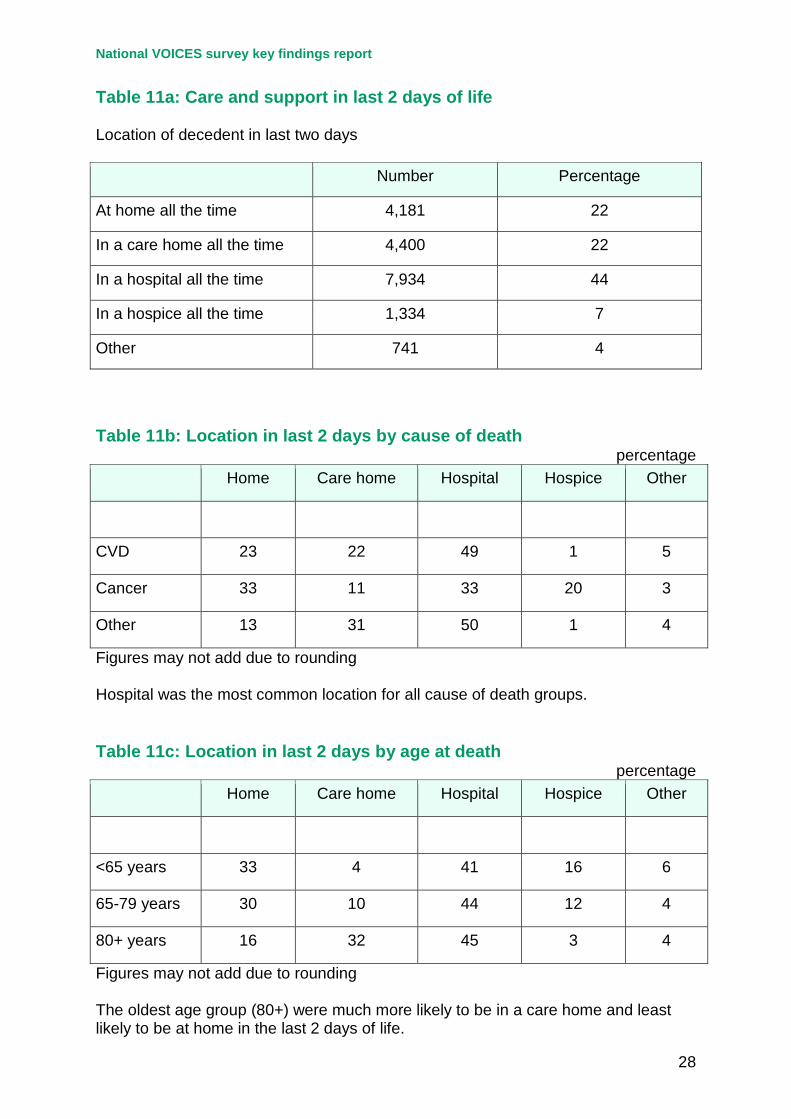
Care and support in the last two days of life 7.1 The overwhelming majority of patients were in a single location for the last two
days of life (Table 11a), with hospital (44%) being the most common location. Cancer patients were more likely to be at home or in a hospital and least likely to be in a care home. One–fifth were in a hospice in the last 2 days of life (Table 11b). The oldest age group (80+) were much more likely to be in a care home and least likely to be at home in the last 2 days of life (Table 11c).
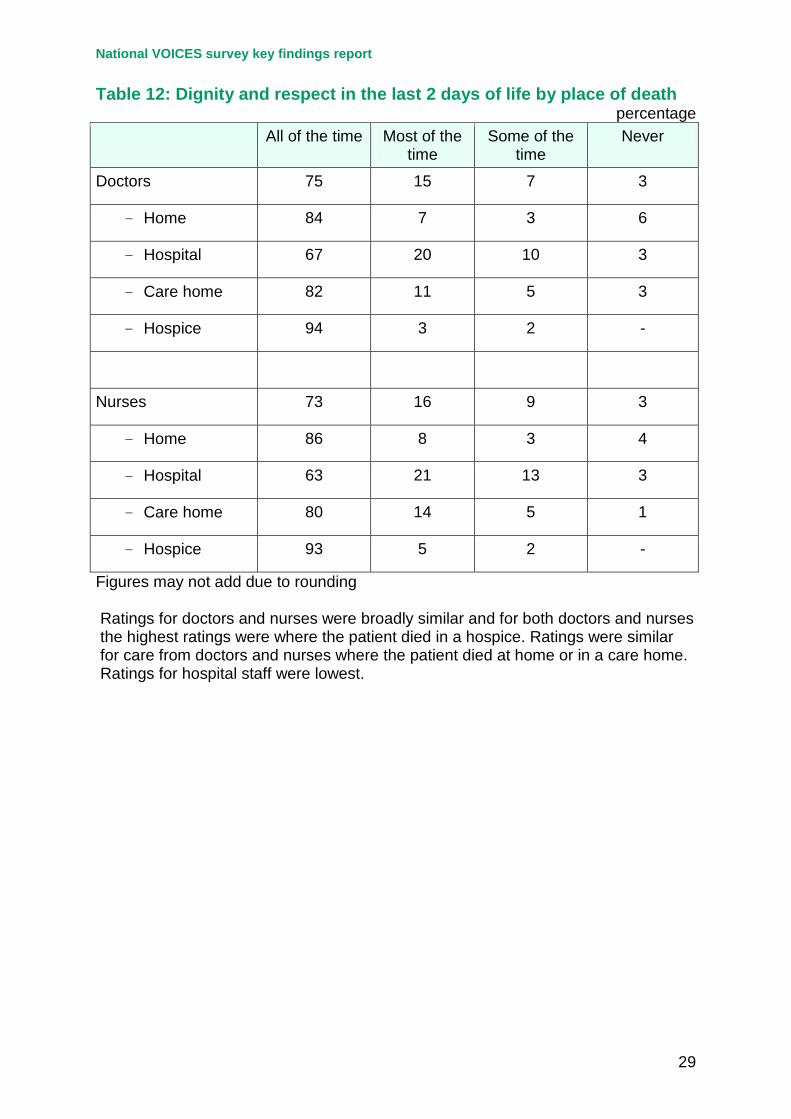
7.2 Ratings for dignity and respect shown by different staff groups were higher for the last two days of life (Table 12) than for the last 3 months of life (Table 5). Ratings for doctors and nurses were broadly similar and for both doctors and nurses the highest ratings were where the patient died in a hospice. Ratings were similar for care from doctors and nurses where the patient died at home or in a care home. Ratings for hospital staff were lowest (Table 12).
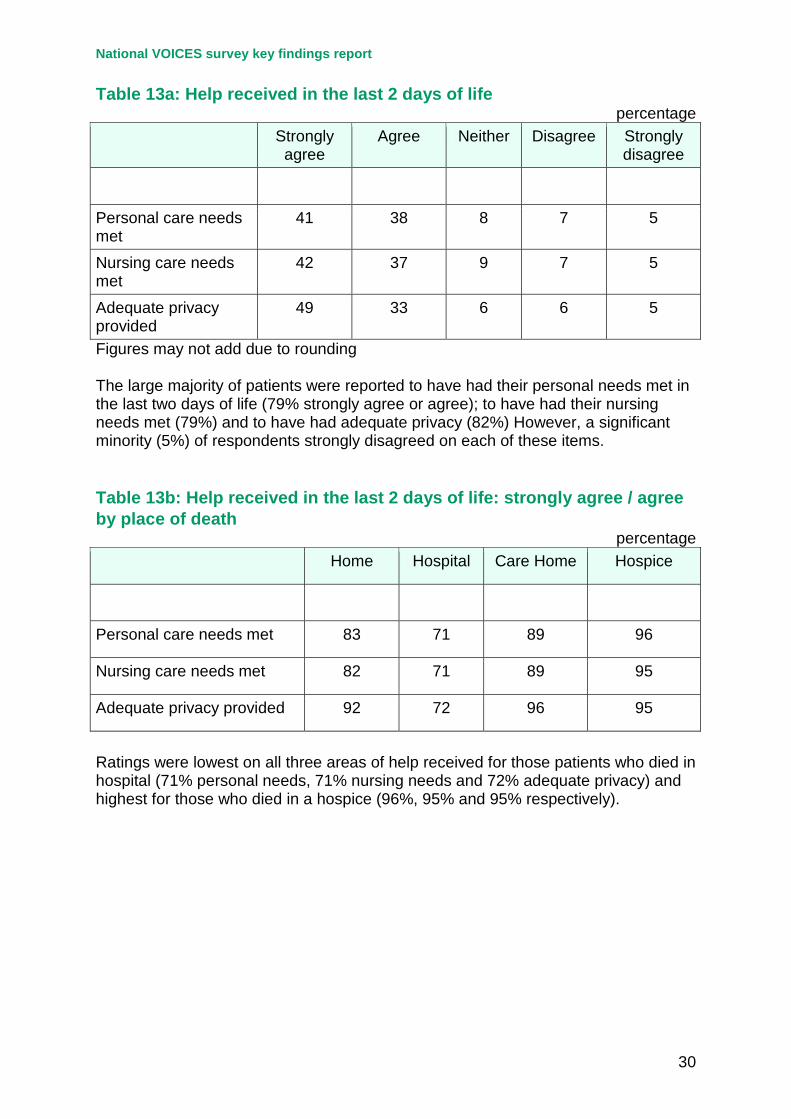
7.3 The large majority of patients were reported to have had their personal needs met in the last two days of life (79% strongly agree or agree); to have had their nursing needs met (79%) and to have had adequate privacy (82%) However, a significant minority (5%) of respondents strongly disagreed on each of these
National VOICES survey key findings report
10
items (Table 13a). Ratings were lowest on all three areas of help received for those patients who died in hospital (71% personal needs, 71% nursing needs and 72% adequate privacy) and highest for those who died in a hospice (96%, 95% and 95% respectively) – Table 13b.
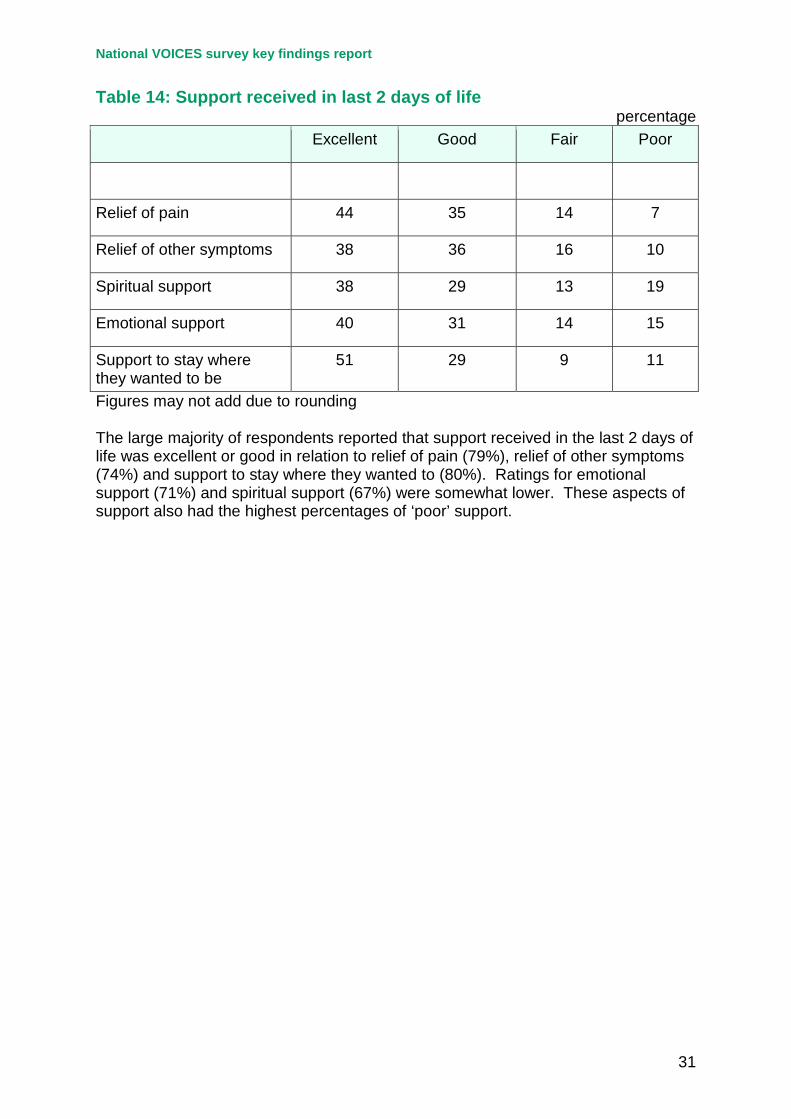
7.4 The large majority of respondents reported that support received in the last 2 days of life was excellent or good in relation to relief of pain (79%), relief of other symptoms (74%) and support to stay where they wanted to (80%). Ratings for emotional support (71%) and spiritual support (67%) were somewhat lower. These aspects of support also had the highest percentages of ‘poor’ support – Table 14.
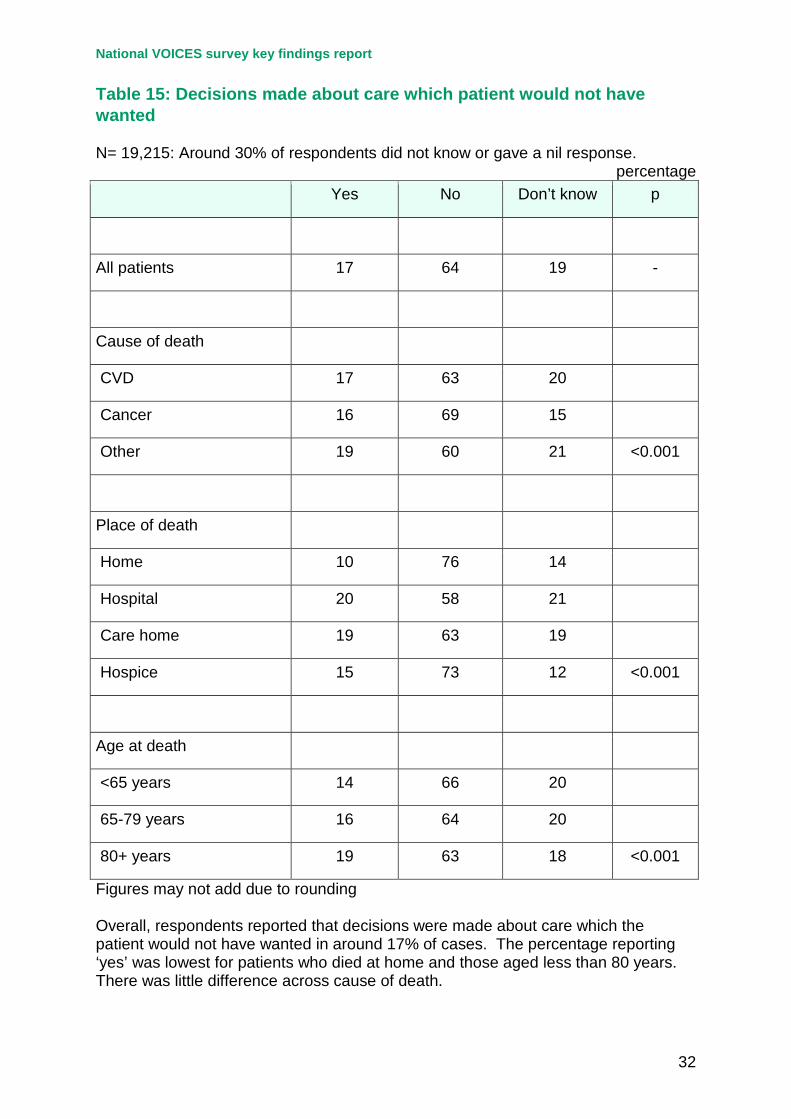
Decision making, communication, preferences and choice at the end of life 8.1 Around two thirds of respondents reported that no decisions had been made
about care which the patient would not have wanted (Table 15). However 17% said yes to this question, with 19% reporting ‘don’t know’. The percentage reporting ‘yes’ was lowest for patients who died at home and those aged less than 80 years. There was little difference across cause of death.
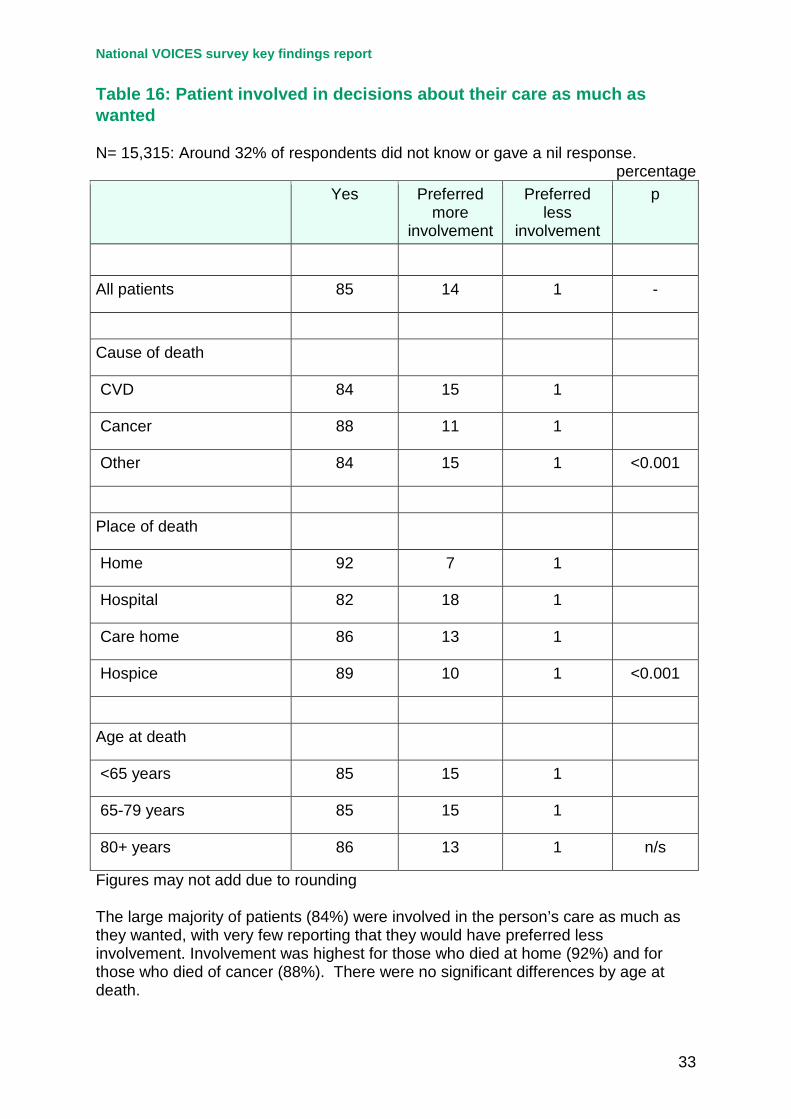
8.2 The large majority of patients (85%) were involved in decisions about their care as much as they wanted, with very few reporting that they would have preferred less involvement. Involvement was highest for those who died at home (92%) and for those who died of cancer (88%). There were no significant differences by age at death (Table 16).
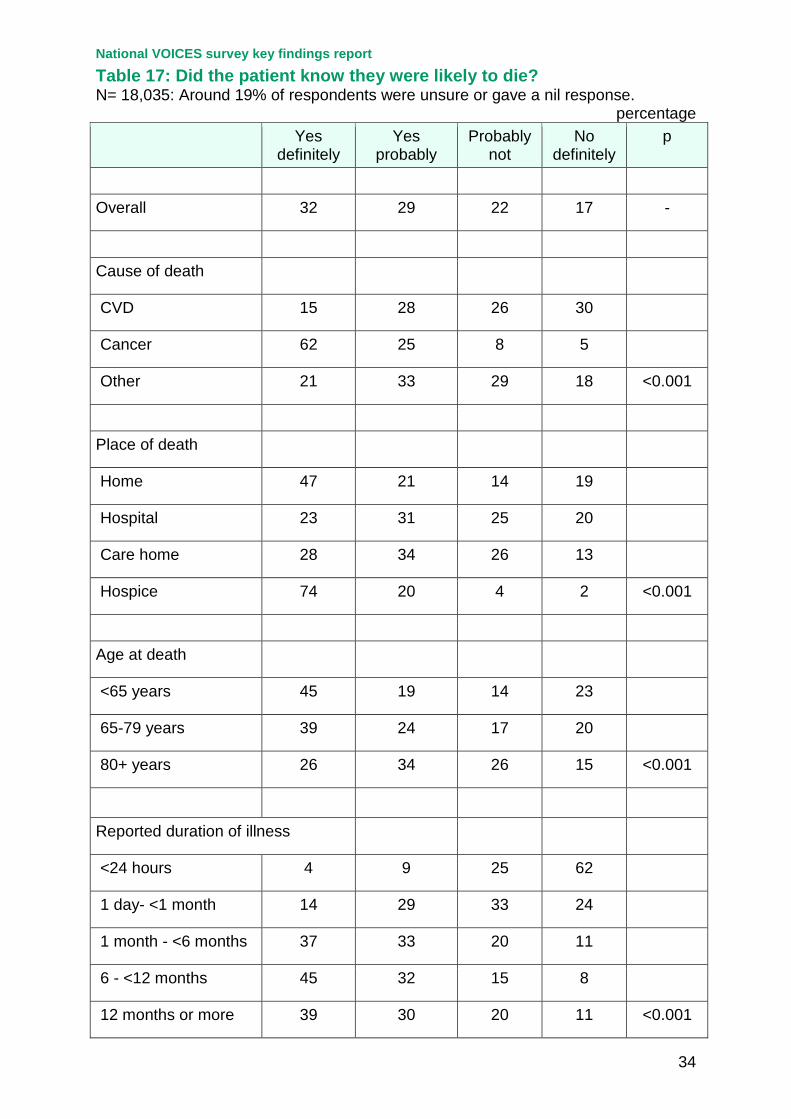
8.3 Overall, a minority of patients knew they were going to die (32%). The proportion of patients who were reported as definitely knowing they were likely to die was much higher for cancer patients (Table 17). Only around one quarter of respondents responded to the question about whether patients were told they were likely to die in a sensitive way. Among those who did respond to this item nearly 3 in 5 (59%) reported ‘yes, definitely’; but 12% reported ‘no, not at all’. Older people (over 80 years) were most likely to have been told in a sensitive way. There were no significant differences between those who died in their own home, a care home or in a hospice. (Table 18).
8.4 Almost 90% of respondents answered the question ‘had the patient expressed a preference of where they wanted to die?’ (Table 19). Overall, less than half of all patients were reported to have expressed a preference for where they would like to die (44%). The proportion was highest for cancer patients and those who died at home. The proportion was reported to be lowest among people aged 80 or over. For those who had expressed a preference the majority (71%) preferred to die at home.
8.5 Around 58% of respondents answered the question “did the patient have enough choice about where they might die?” A nil response was given by 16%
National VOICES survey key findings report
11
and 26% said the patient died suddenly (Table 20). Of those who did respond over half (51%) said that the patient did have enough choice about where they might die, but nearly a quarter (23%) did not. The remainder (26%) were unsure (Table 20). Patients dying from cancer, those who died at home or in a hospice and those who were younger (<80 years) at death were more likely to be reported as having had enough choice of where they might die.
8.6 The large majority of respondents (82%) thought that the patient had died in the right place (Table 21). Cancer patients, those who died at home or in a hospice and those aged 80 years or more were more likely to be reported to have died in the right place by respondents.
Support for relatives, friends or carers at the end of life 9.1 This section of the survey focused on the relatives, friends or carers themselves
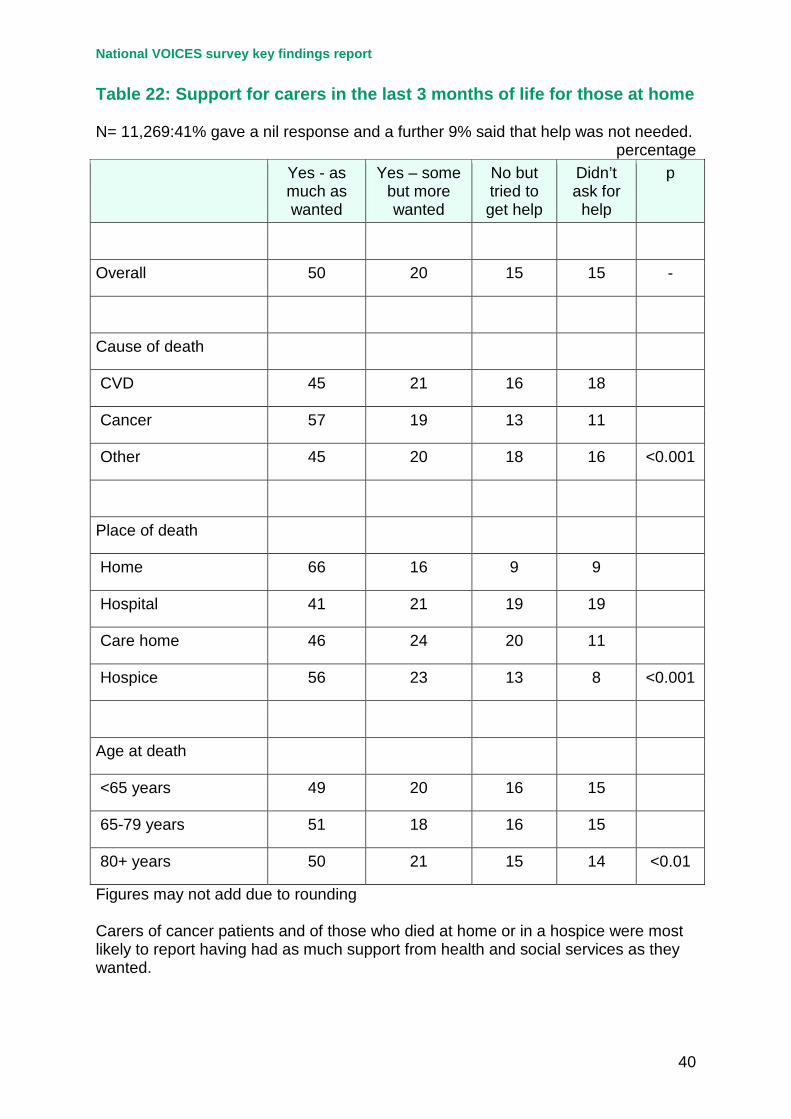
as opposed to obtaining their views on the care delivered to the deceased. Only half of respondents answered the global question about support for carers in the last three months of life. This question was only asked where the patient had been at home for some or all of the last three months of life and where the death had not been sudden. A nil response was given by 41% and 9% said that help was not needed.
9.2 Half of those who responded to this item said that they had received as much support as they wanted and 20% did receive support but wanted more. In contrast 15% did not get enough support despite trying and 15% would have liked support but didn’t ask (Table 22). Relatives of cancer patients and those who died at home or in a hospice were more likely to get as much support as they wanted.
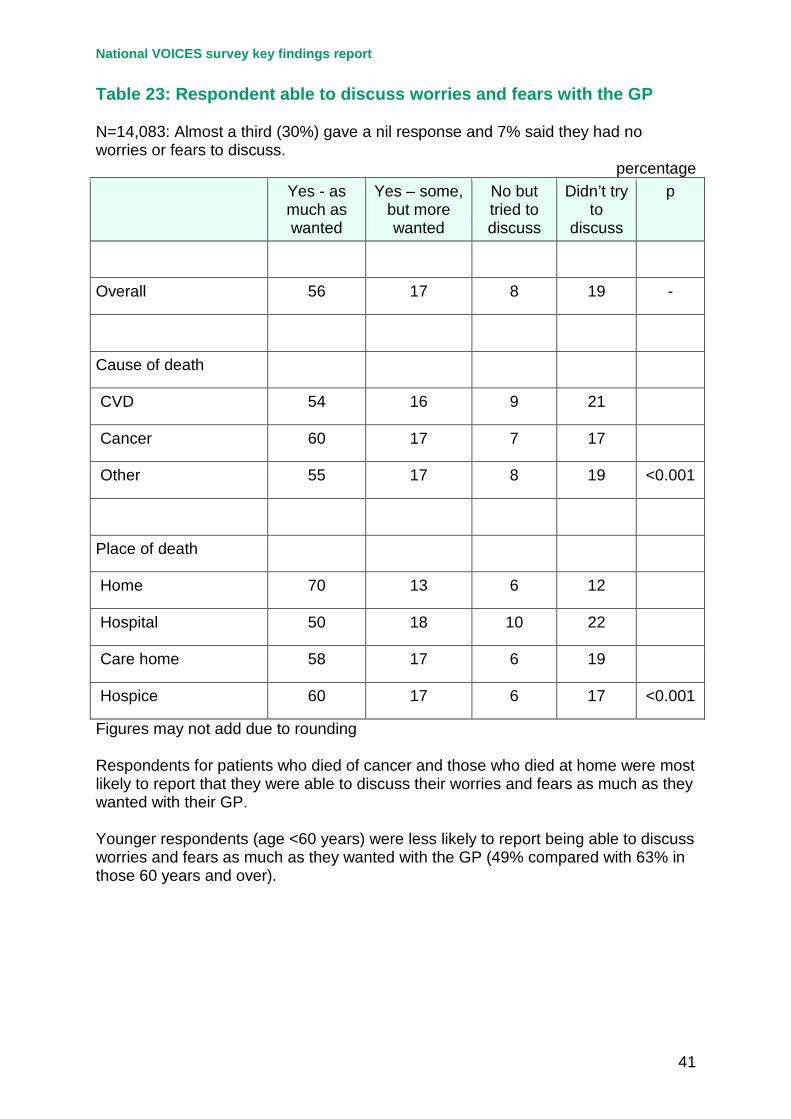
9.3 Around 60% of respondents answered the question about whether they were able to discuss worries and fears with their GP. A nil response was given by 30% and 7% reported that they had no worries or fears to discuss (Table 23). Of those who answered the question, 56% reported that they were able to discuss worries and fears as much as they wanted. A further 17% were able to discuss worries or fears but wanted more and 8% tried to discuss fears or worries but were not able to. Relatives of cancer patients and those who died at home were most likely to be able to discuss fears and worries as much as they wanted with their GP. Younger respondents (age <60 years) were less likely to report being able to discuss worries and fears as much as they wanted (49% compared with 63% in those aged 60 years and over).
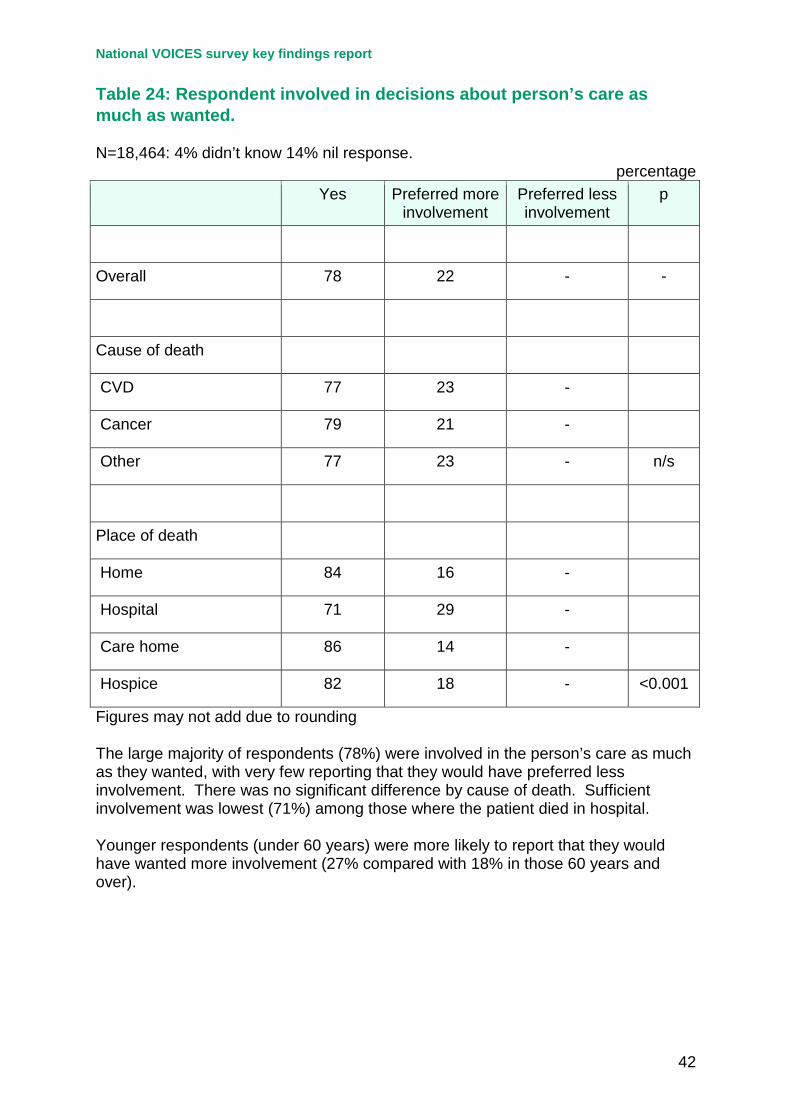
9.4 Over 80% of respondents answered the question asking whether they were involved as much as they wanted in decisions about the patients’ care. Of these the large majority (78%) reported that they were involved as much as they wanted. Only a very small number (0.3%) would have preferred less involvement (Table 24). Relatives of patients who died in hospital were least likely to report being involved as much as they wanted in decisions. There was
National VOICES survey key findings report
12
no significant difference by cause of death. Younger respondents (under 60 years) were more likely to report that they would have wanted more involvement (27% compared with 18% in those aged 60 years and over).
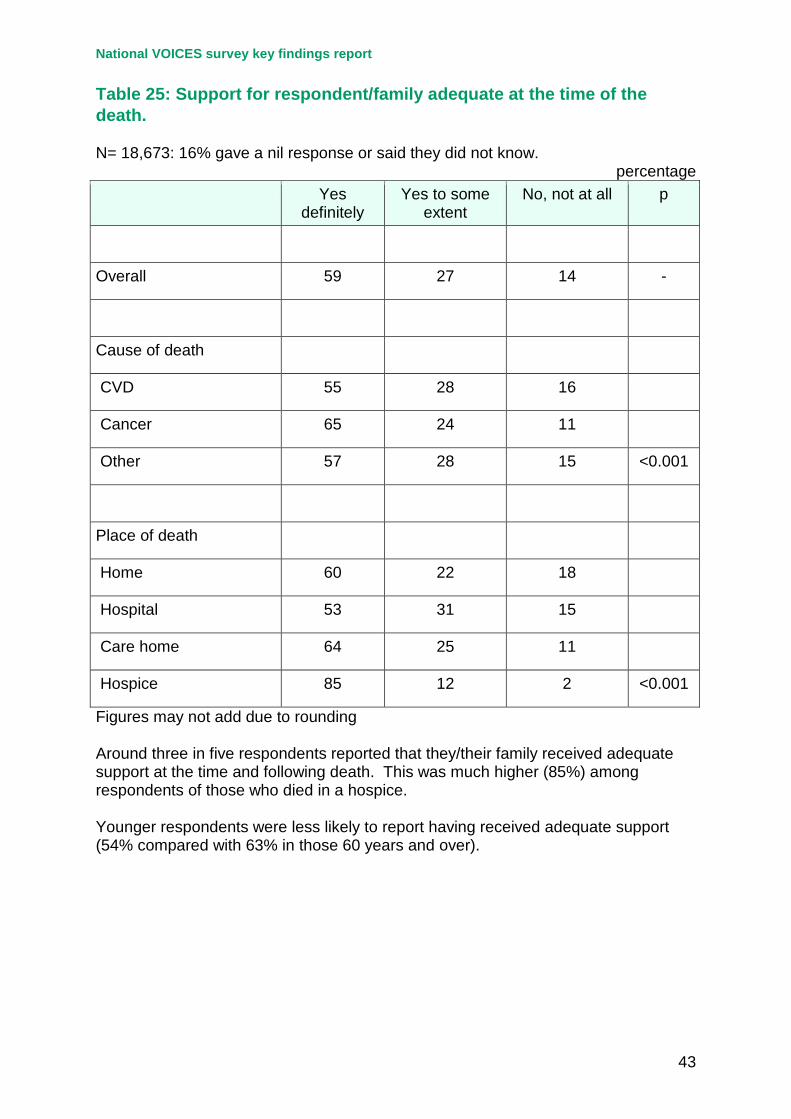
9.5 More than 80% of respondents answered the question asking whether support for the respondent/family was adequate at the time of the death (Table 25). Over half (59%) said they and/or their family definitely had received adequate support, but in contrast 14% reported that they had not at all. Relatives of patients who had died in a hospice were most likely to report adequate support (85%). Younger respondents (under 60 years) were less likely to report having received adequate support (54% compared with 63% in those aged 60 years and over).
9.6 Around 80% of respondents answered the question “after the patient died did the staff deal with you or the family in a sensitive manner?” More than 9 out of 10 (93%) reported being dealt with sensitively after the death. The proportion was particularly high among respondents of those who died in a hospice (99%), but was over 90% in each care setting and for all causes of death (Table 26).
9.7 Around two thirds of respondents did not want to talk to anyone from health or other services after the death (Table 27). Respondents of those who died in a hospice were the most likely to have talked to someone after the death. Younger respondents and female respondents were more likely to have wanted to talk to someone after the death.
Variations by PCT cluster 10.1 Variations in responses to 11 key items by PCT cluster are shown in Table 28
and in the summary table (Table 29). On each item substantial variations are evident between the PCT cluster with the highest and lowest score. In relation to overall quality of care in the last three months of life a difference of nearly 20% was observed between the highest and lowest PCT cluster (51% to 32%). Similar magnitudes of difference between highest and lowest were observed for coordination of care, dignity and respect and relief of pain in the last 2 days of life. Somewhat smaller differences were observed for coordination of care, dignity and respect and relief of pain in the last 2 days of life. Somewhat smaller differences were observed in relation to the questions about preferences, choice, decision making and choice. Larger differences between highest and lowest were observed in relation to the items about support for carers.
10.2 Further details on these key 11 questions can be found in web Appendix A. Full details of all the comparisons for all PCT Clusters will be published as a separate report in the autumn.
National VOICES survey key findings report
13
Quality of care for people with dementia 11.1 Around one–fifth of patients had dementia or senility mentioned on their death
certificate. This varied across the cause of deaths groups: 15% of cardiovascular deaths, 4% of cancer deaths and 37% of ‘other’ deaths had dementia mentioned. More than half of deaths in care homes had dementia mentioned (56%), as did 13% of hospital deaths, 10% of deaths at home and 1% of hospice deaths. Almost a third of patients aged 80 years or over had dementia mentioned (32%), 7% of those aged 65-79 and 1% of those aged under 65 years.
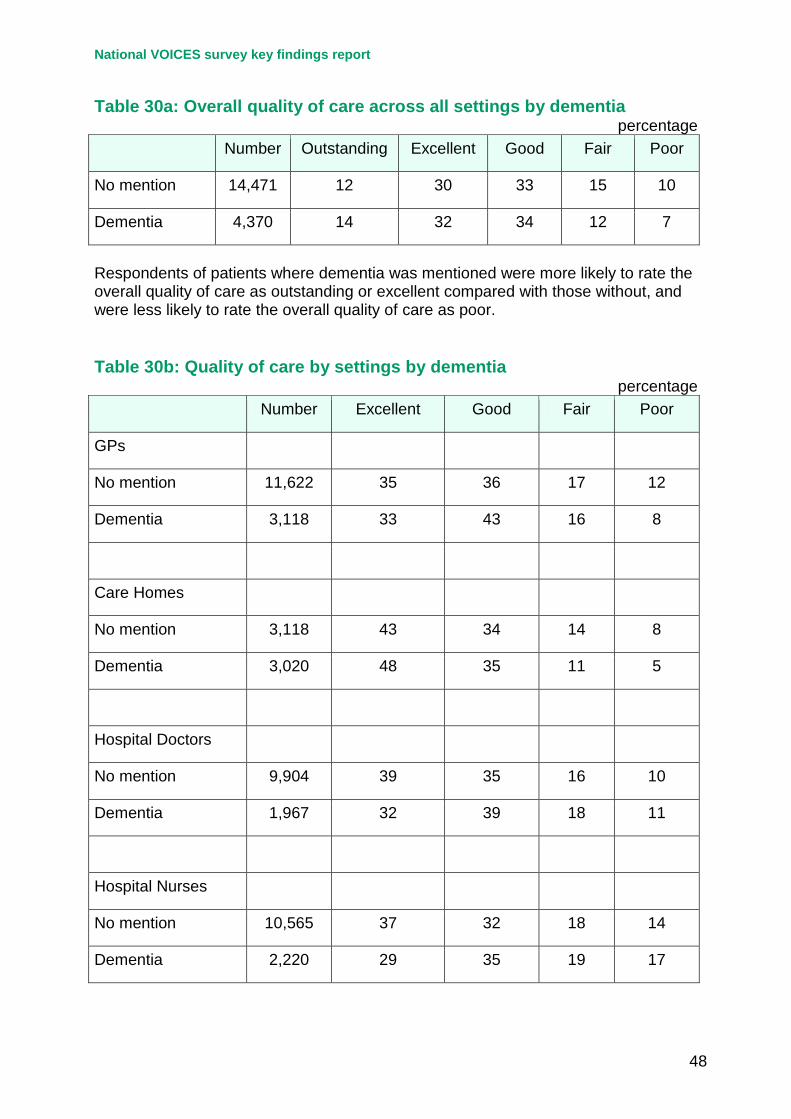
11.2 Respondents of patients where dementia was mentioned were more likely to rate the overall quality of care as outstanding or excellent (46%) compared with those without (42%), and were less likely to rate the overall quality of care as poor (7% versus 10%) – Table 30a.
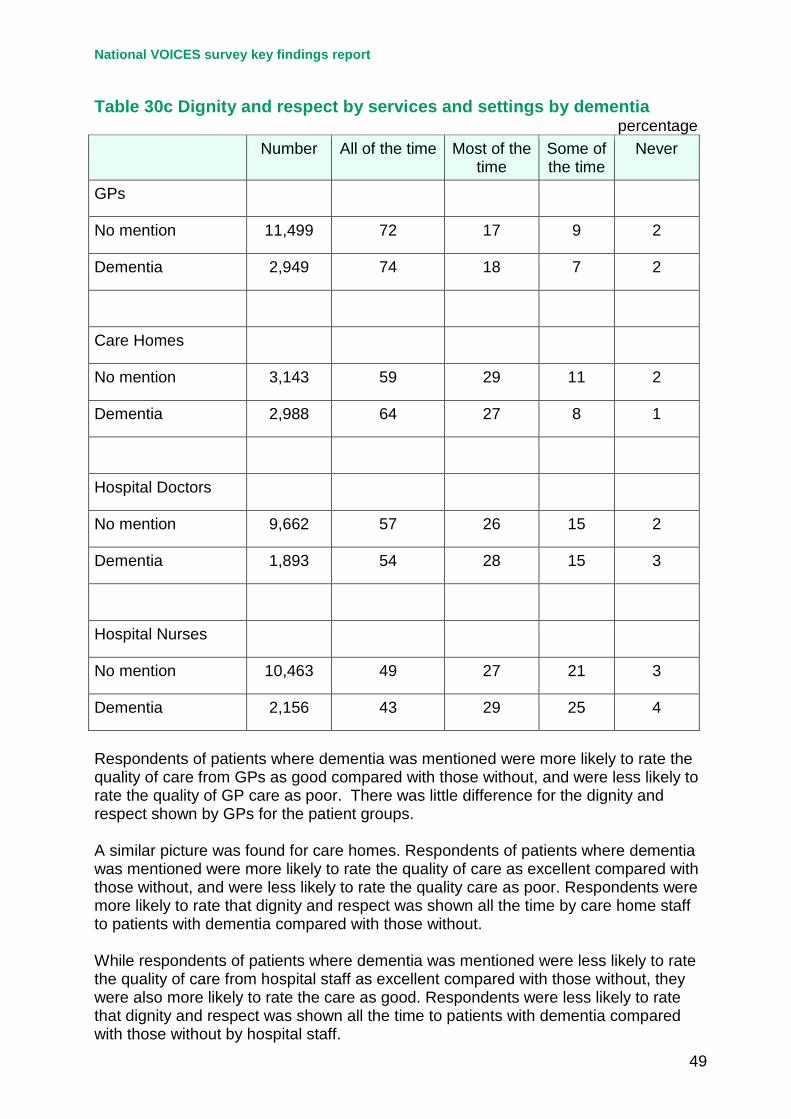
11.3 Respondents of patients where dementia was mentioned were more likely to rate the quality of care from GPs as good compared with those without, and were less likely to rate the quality of GP care as poor. A similar picture was found for care homes. Respondents of patients where dementia was mentioned were more likely to rate the quality of care as excellent compared with those without, and were less likely to rate the quality of care as poor (Table 30b). While respondents of patients where dementia was mentioned were less likely to rate the quality of care from hospital staff as excellent compared with those without, they were also more likely to rate the care as good.
11.4 There was little difference across the patient groups for the dignity and respect shown by GPs. Respondents were more likely to rate that dignity and respect was shown all the time by care home staff to patients with dementia compared with those without. Respondents were less likely to rate that dignity and respect was shown all the time to patients with dementia compared with those without by hospital staff (Table 30c).
Discussion 12.1 This is the first ever large scale survey which has assessed the quality of
support and care given to people approaching the end of life in England and to their relatives/friends. The feasibility of the approach has been demonstrated. The support of the ONS Survey Enquiry Line team was important and they reported receiving fewer calls than for other surveys of this size. A small minority of calls of a particularly sensitive nature or expressing a serious complaint were sent through to the Survey Manager who dealt with them personally. Contact details for the national charitable organisation Cruse Bereavement Care were included in leaflets, letters and in the questionnaire to respondents, and passed on by the Survey Enquiry Line team where appropriate.
National VOICES survey key findings report
14
12.2 The use of bereaved relatives as a proxy for the views of people approaching the end of life has been extensively tested in research settings. The validity of this approach has been well established especially for questions on service provision and use and evaluation of care, though less robust for subjective symptoms such as pain12. The response rate of 45.7% is comparable with that obtained in previous surveys of bereaved relatives and was higher than that observed in the two pilot PCTs (40.0%) which used the same questionnaire and ‘three mailing’ method. It was also higher than the GP Patient Survey: Year 2011/2012 which obtained a response rate of 38%.
12.3 As expected, there was some response bias with higher response rates relating to patients in the least deprived quintile and who were born in the UK. However, the size of the survey means that meaningful comparisons could be made between groups. The survey size also allowed for meaningful comparisons at the PCT cluster level.
12.4 Information on duration of illness prior to death is not available from routinely collected datasets. The findings suggested that around 10% die suddenly or within 24 hours. This excludes the relatively small number who died from accidents, suicide or homicide that were excluded from this study, but who constituted about 2.4% of all deaths in the study period. In contrast over half of the patients had been ill for 6 months or more prior to death.
12.5 Reported figures on sudden death vary quite widely. In the current study in answer to the question about duration of illness 8% responded “sudden death”, whereas in answer to the question about enough choice where they might die, 26% responded “died suddenly”. An explanation for this is likely to be that for a considerable proportion of patients with known illnesses their ultimate death is perceived as sudden and/or unexpected by relatives. Of those where the respondent answered “died suddenly”, this was higher where the patient died of cardiovascular disease compared to cancer (40% versus 12%) and higher for hospital deaths than hospice deaths (33% versus 6%).
12.6 The overall quality of care across all settings was higher for cancer deaths, for deaths occurring in hospices and for younger deaths (under 65 years) although these three groups strongly overlap. The ratings of outstanding and excellent were lowest for patients who died in hospital. This pattern was confirmed by the quality of care questions which related specifically to each care setting, irrespective of where the patient died. Hospital doctors and nurses continued to be rated lowest for excellent quality of care and hospices were rated highest.
12.7 This survey has highlighted significant differences in quality of care according to the age of the patient at death, cause of death and place of death. It is, of course, important to note that age at death, cause of death and place of death are interrelated. For example, 92% of hospice deaths are due to cancer and 83% of care home deaths were in those aged 80 years or older at death. Two–thirds of cardiovascular deaths and deaths due to other causes were in the 80
National VOICES survey key findings report
15
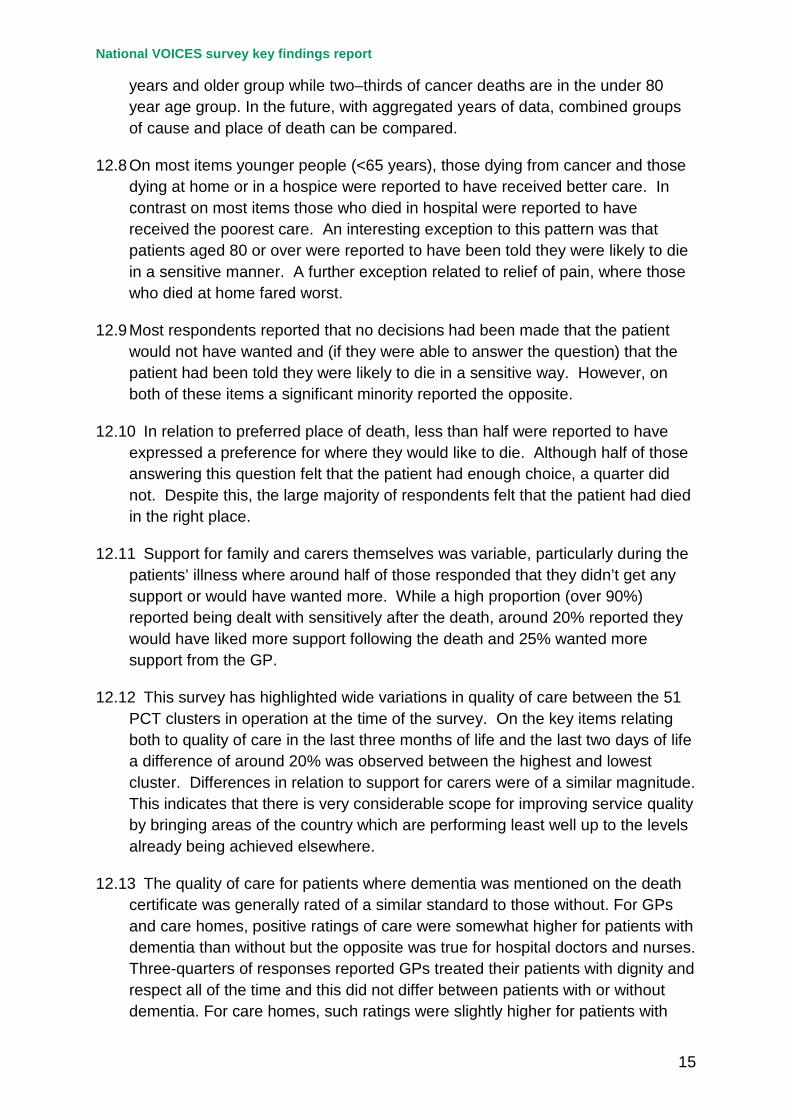
years and older group while two–thirds of cancer deaths are in the under 80 year age group. In the future, with aggregated years of data, combined groups of cause and place of death can be compared.
12.8 On most items younger people (<65 years), those dying from cancer and those dying at home or in a hospice were reported to have received better care. In contrast on most items those who died in hospital were reported to have received the poorest care. An interesting exception to this pattern was that patients aged 80 or over were reported to have been told they were likely to die in a sensitive manner. A further exception related to relief of pain, where those who died at home fared worst.
12.9 Most respondents reported that no decisions had been made that the patient would not have wanted and (if they were able to answer the question) that the patient had been told they were likely to die in a sensitive way. However, on both of these items a significant minority reported the opposite.
12.10 In relation to preferred place of death, less than half were reported to have expressed a preference for where they would like to die. Although half of those answering this question felt that the patient had enough choice, a quarter did not. Despite this, the large majority of respondents felt that the patient had died in the right place.
12.11 Support for family and carers themselves was variable, particularly during the patients’ illness where around half of those responded that they didn’t get any support or would have wanted more. While a high proportion (over 90%) reported being dealt with sensitively after the death, around 20% reported they would have liked more support following the death and 25% wanted more support from the GP.
12.12 This survey has highlighted wide variations in quality of care between the 51 PCT clusters in operation at the time of the survey. On the key items relating both to quality of care in the last three months of life and the last two days of life a difference of around 20% was observed between the highest and lowest cluster. Differences in relation to support for carers were of a similar magnitude. This indicates that there is very considerable scope for improving service quality by bringing areas of the country which are performing least well up to the levels already being achieved elsewhere.
12.13 The quality of care for patients where dementia was mentioned on the death certificate was generally rated of a similar standard to those without. For GPs and care homes, positive ratings of care were somewhat higher for patients with dementia than without but the opposite was true for hospital doctors and nurses. Three-quarters of responses reported GPs treated their patients with dignity and respect all of the time and this did not differ between patients with or without dementia. For care homes, such ratings were slightly higher for patients with
National VOICES survey key findings report
16
dementia than without. Again, respondents were less likely to rate that dignity and respect were shown all the time by hospital staff.
12.14 In conclusion, this survey has demonstrated that some patients receive high quality care, irrespective of age, cause of death or care setting. However, it has also revealed wide differences between patient groups and between care settings. This survey can be used as a baseline against which to measure progress on improving end of life care both at the national and local levels.
National VOICES survey key findings report
17
Tables Table 1a: Characteristics of patients for whom a response was received Numbers Percentage
Total 22,292 100
Age 18-59 1,506 7
60-69 2,456 11
70-79 4,594 21
80-89 8,622 39
90+ 5,114 23
Gender Male 10,114 45
Female 12,178 55
Place of death Home 4,698 21
Hospital 11,267 51
Care home 4,916 22
Hospice 1,411 6
Cause of death CVD 6,655 30
Cancer 6,970 31
Other 8,667 39
Deprivation 1. Most deprived 3,716 17
2. 4,228 19
3. 4,827 22
4. 4,823 22
5. Least deprived 4,698 21
Country of birth UK 20,702 93
Elsewhere 1,590 7

National VOICES survey key findings report
18
Table 1b: Characteristics of patients for whom a response was received (continued) Reported duration of illness % % of known
Sudden death 7 8
Less than 24 hours 2 2
1 day to 1 week 4 5
1 week to 1 month 9 10
1-6 months 18 19
6-12 months 11 13
1 year or more 39 44
Duration not reported 10 -
Figures may not add due to rounding Among those with known duration of illness over 40% had the illness for a year or more and a further 13% for 6-12 months. In contrast, around 10% had a sudden death or died within 24 hours and around 15% were ill for between 1 day and 1 month.
National VOICES survey key findings report
19
Table 2: Services received in last 3 months of life
percentage Yes No Don’t know or nil
response Stayed in
- Hospital 63 21 16
- Hospice 16 62 22
- Care home 28 46 26
Service used (any setting)
- Out of hours 42 16 42
- District/community nurse 50 2 47
- GP 73 5 23
Care delivered at home
- Macmillan nurses 16 82 2
- Hospice at home 3 95 2
- Marie Curie 4 94 2
- Social worker/support worker 8 89 2
- Home care worker/aide/help 20 78 2
Figures may not add due to rounding
National VOICES survey key findings report
20
Table 3: Overall quality of care across all settings by age and other factors N= 18,841: Around 16% of respondents did not know or gave a nil response.
Percentage Number Outstanding Excellent Good Fair Poor
All patients 18,841 12 30 33 14 10
Age
<65 2,082 16 31 28 13 12
65-79 4,856 14 30 31 14 12
80+ 11,903 11 30 36 15 8
Cause of death
CVD 5,183 9 27 36 16 11
Cancer 6,197 16 35 30 11 8
Other 7,461 11 29 34 16 10
Place of death
Home 3,712 19 34 29 10 7
Hospital 9,492 7 25 36 18 13
Care Home 4,357 15 36 32 12 5
Hospice 1,280 20 39 28 8 5
Gender
Male 8,301 12 30 33 15 10
Female 10,540 13 30 34 14 9
Deprivation
1 3,084 12 28 31 16 13
2 3,478 13 29 33 15 10
3 4,082 13 30 34 14 9
4 4,146 11 32 35 13 8
5 4,051 12 32 34 14 8
Figures may not add due to rounding
National VOICES survey key findings report
21
For the overall quality of care across all services, 12% rated the care given as outstanding, 30% as excellent, 33% reported care as good, 14% as fair and 10% as poor. The highest proportions of ratings as outstanding were for patients who died in hospices (20%) and at home (19%) compared with 7% for hospitals, those who died of cancer (16% versus 9% for CVD and 11% other) and patients under 65 years (16% vs. 11% for those aged 80 or over).
Table 4: Quality of care - by services and care setting
Percentage Number Excellent Good Fair Poor
Out of hours 9,090 26 39 19 16
District/community nurses
8,973 45 37 11 6
GPs 14,740 35 37 17 11
Care homes 6,138 46 35 13 7
Hospital doctors 11,871 38 36 16 10
Hospital nurses 12,785 35 33 18 14
Hospices 2,207 78 14 5 4
Figures may not add due to rounding Care was rated as excellent for 78% who had been in a hospice and as excellent or good by 92%. The combined ‘excellent’ and ‘good’ percentages for other care settings and services were as follows: Care homes 81%; district/community nurses 82%, hospital doctors 74%, GPs 72%, hospital nurses 68% and out of hours services 65%.
National VOICES survey key findings report
22
Table 5: Dignity and respect by services and care setting
percentage All of the time Most of the
time Some of the
time Never
District/community nurses 79 15 4 2
GPs 72 17 9 2
Care homes 61 28 9 1
Hospital Doctors 57 27 15 2
Hospital Nurses 48 28 22 3
Hospice Doctors 87 8 3 2
Hospice Nurses 80 13 5 2
Figures may not add due to rounding Being shown dignity and respect by staff was highest in hospices (87% “all of the time” for hospice doctors and 80% for hospice nurses); followed by district/community nurses (79%); GPs (72%); care home staff (61%); hospital doctors (57%) and hospital nurses (48%).
National VOICES survey key findings report
23
Table 6: Dignity and respect “all of the time” by services and care setting and by cause of death
percentage Cardiovascular Cancer Other p
DNs/Community nurses 74 83 75 <0.001
GPs 71 75 70 <0.001
Care homes 59 66 61 0.001
Hospital Doctors 56 58 56 n/s
Hospital Nurses 47 49 47 <0.01
Hospice Doctors 74 90 74 <0.001
Hospice Nurses 59 87 58 <0.001
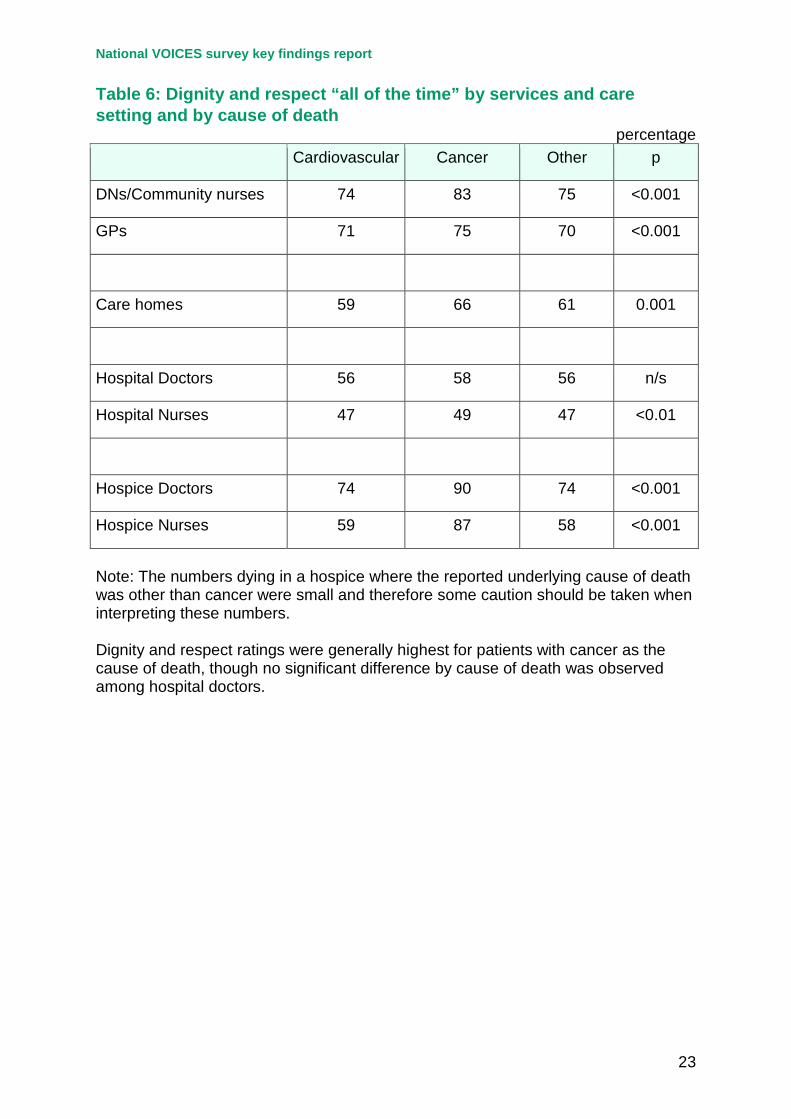
Note: The numbers dying in a hospice where the reported underlying cause of death was other than cancer were small and therefore some caution should be taken when interpreting these numbers. Dignity and respect ratings were generally highest for patients with cancer as the cause of death, though no significant difference by cause of death was observed among hospital doctors.
National VOICES survey key findings report
24
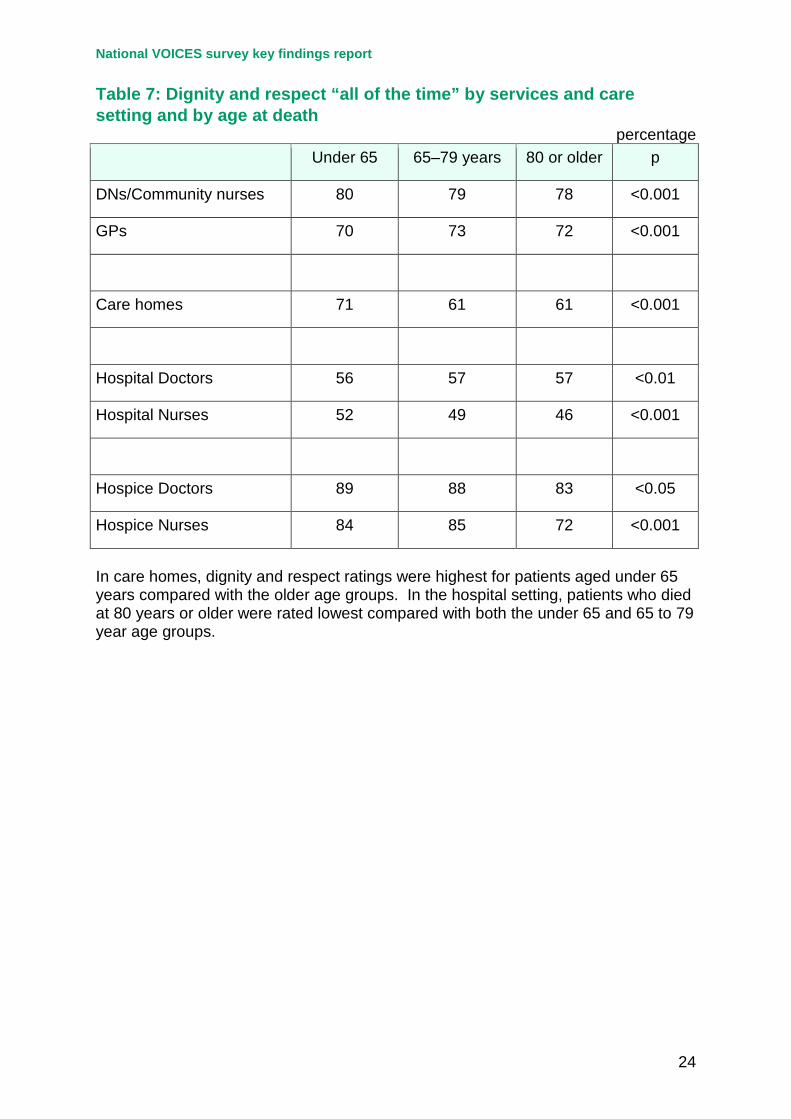
Table 7: Dignity and respect “all of the time” by services and care setting and by age at death
percentage Under 65 65–79 years 80 or older p
DNs/Community nurses 80 79 78 <0.001
GPs 70 73 72 <0.001
Care homes 71 61 61 <0.001
Hospital Doctors 56 57 57 <0.01
Hospital Nurses 52 49 46 <0.001
Hospice Doctors 89 88 83 <0.05
Hospice Nurses 84 85 72 <0.001
In care homes, dignity and respect ratings were highest for patients aged under 65 years compared with the older age groups. In the hospital setting, patients who died at 80 years or older were rated lowest compared with both the under 65 and 65 to 79 year age groups.
National VOICES survey key findings report
25
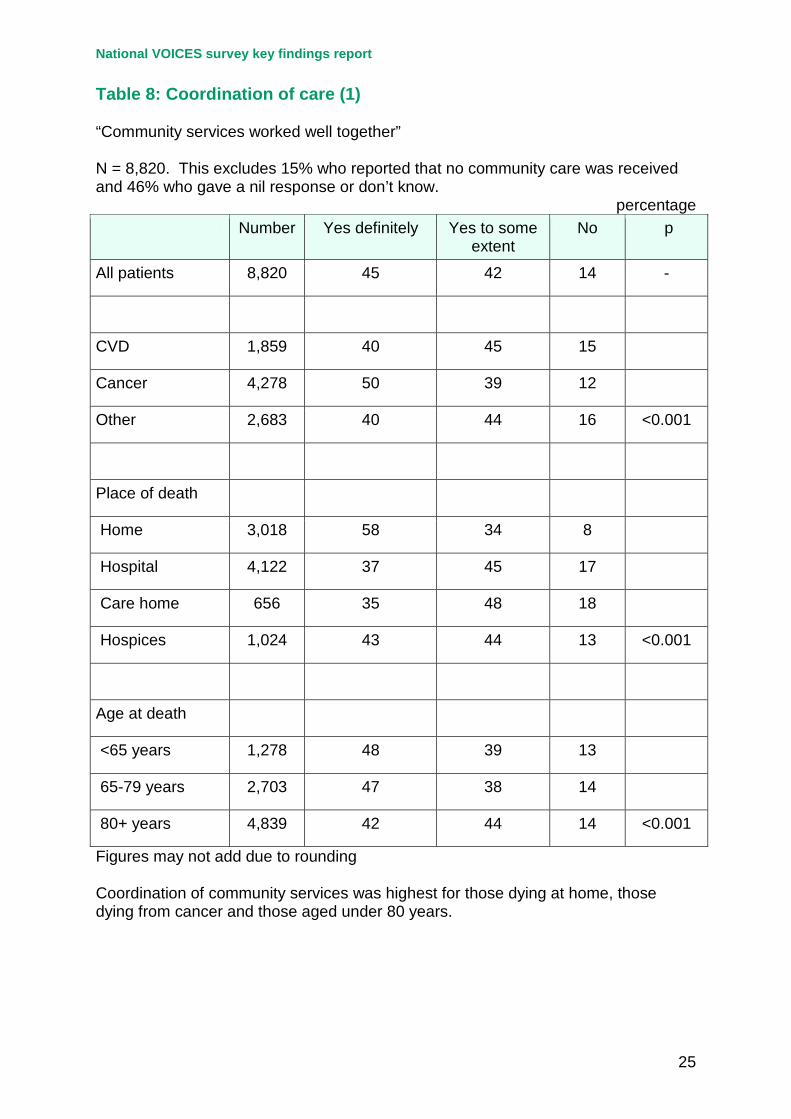
Table 8: Coordination of care (1) “Community services worked well together” N = 8,820. This excludes 15% who reported that no community care was received and 46% who gave a nil response or don’t know.
percentage Number Yes definitely Yes to some
extent No p
All patients 8,820 45 42 14 -
CVD 1,859 40 45 15
Cancer 4,278 50 39 12
Other 2,683 40 44 16 <0.001
Place of death
Home 3,018 58 34 8
Hospital 4,122 37 45 17
Care home 656 35 48 18
Hospices 1,024 43 44 13 <0.001
Age at death
<65 years 1,278 48 39 13
65-79 years 2,703 47 38 14
80+ years 4,839 42 44 14 <0.001
Figures may not add due to rounding Coordination of community services was highest for those dying at home, those dying from cancer and those aged under 80 years.
National VOICES survey key findings report
26
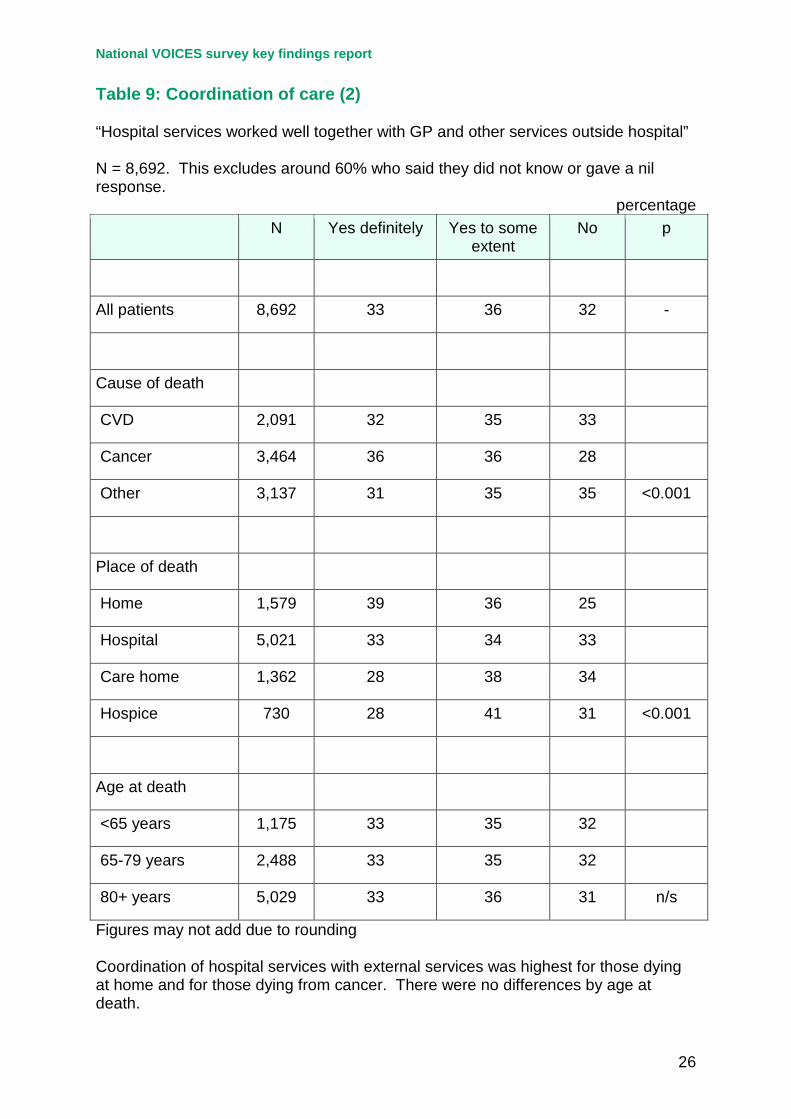
Table 9: Coordination of care (2) “Hospital services worked well together with GP and other services outside hospital” N = 8,692. This excludes around 60% who said they did not know or gave a nil response.
percentage N Yes definitely Yes to some
extent No p
All patients 8,692 33 36 32 -
Cause of death
CVD 2,091 32 35 33
Cancer 3,464 36 36 28
Other 3,137 31 35 35 <0.001
Place of death
Home 1,579 39 36 25
Hospital 5,021 33 34 33
Care home 1,362 28 38 34
Hospice 730 28 41 31 <0.001
Age at death
<65 years 1,175 33 35 32
65-79 years 2,488 33 35 32
80+ years 5,029 33 36 31 n/s
Figures may not add due to rounding Coordination of hospital services with external services was highest for those dying at home and for those dying from cancer. There were no differences by age at death.
National VOICES survey key findings report
27
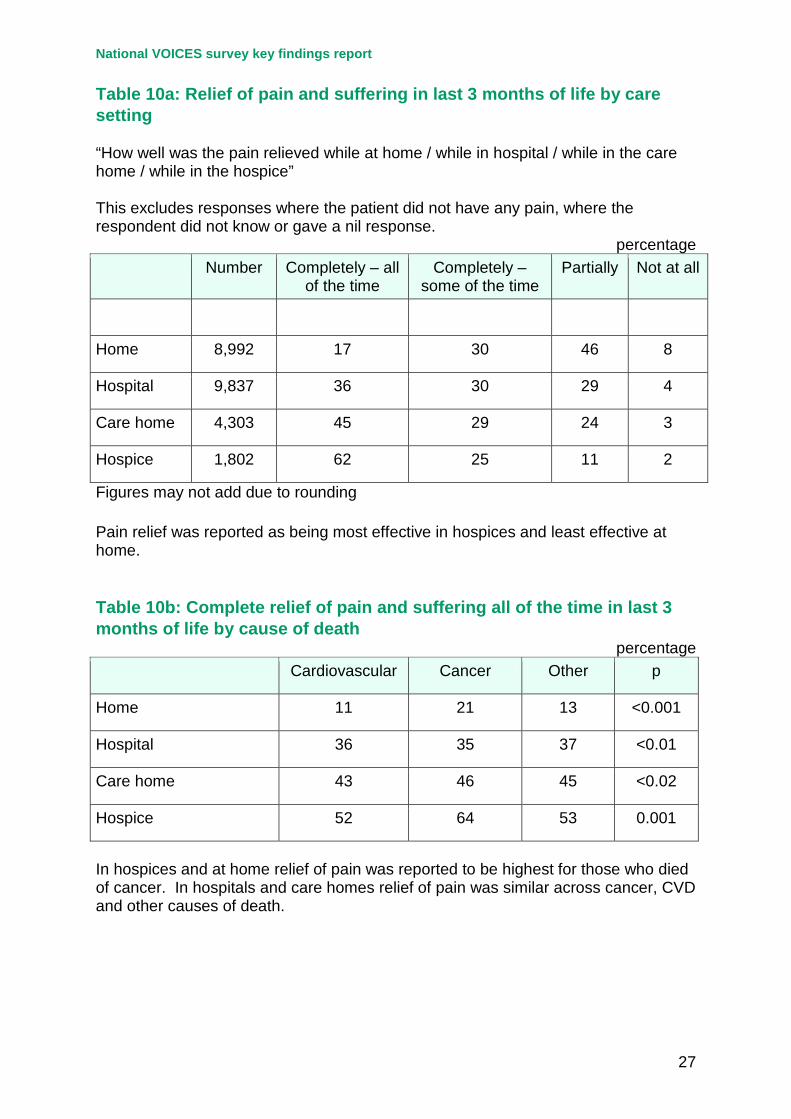
Table 10a: Relief of pain and suffering in last 3 months of life by care setting “How well was the pain relieved while at home / while in hospital / while in the care home / while in the hospice” This excludes responses where the patient did not have any pain, where the respondent did not know or gave a nil response.
percentage Number Completely – all
of the time Completely –
some of the time Partially Not at all
Home 8,992 17 30 46 8
Hospital 9,837 36 30 29 4
Care home 4,303 45 29 24 3
Hospice 1,802 62 25 11 2
Figures may not add due to rounding Pain relief was reported as being most effective in hospices and least effective at home. Table 10b: Complete relief of pain and suffering all of the time in last 3 months of life by cause of death
percentage Cardiovascular Cancer Other p
Home 11 21 13 <0.001
Hospital 36 35 37 <0.01
Care home 43 46 45 <0.02
Hospice 52 64 53 0.001
In hospices and at home relief of pain was reported to be highest for those who died of cancer. In hospitals and care homes relief of pain was similar across cancer, CVD and other causes of death.
National VOICES survey key findings report
28
Table 11a: Care and support in last 2 days of life Location of decedent in last two days Number Percentage
At home all the time 4,181 22
In a care home all the time 4,400 22
In a hospital all the time 7,934 44
In a hospice all the time 1,334 7
Other 741 4
Table 11b: Location in last 2 days by cause of death
percentage Home Care home Hospital Hospice Other
CVD 23 22 49 1 5
Cancer 33 11 33 20 3
Other 13 31 50 1 4
Figures may not add due to rounding Hospital was the most common location for all cause of death groups. Table 11c: Location in last 2 days by age at death
percentage Home Care home Hospital Hospice Other
<65 years 33 4 41 16 6
65-79 years 30 10 44 12 4
80+ years 16 32 45 3 4
Figures may not add due to rounding The oldest age group (80+) were much more likely to be in a care home and least likely to be at home in the last 2 days of life.
National VOICES survey key findings report
29
Table 12: Dignity and respect in the last 2 days of life by place of death
percentage All of the time Most of the
time Some of the
time Never
Doctors 75 15 7 3
- Home 84 7 3 6
- Hospital 67 20 10 3
- Care home 82 11 5 3
- Hospice 94 3 2 -
Nurses 73 16 9 3
- Home 86 8 3 4
- Hospital 63 21 13 3
- Care home 80 14 5 1
- Hospice 93 5 2 -
Figures may not add due to rounding Ratings for doctors and nurses were broadly similar and for both doctors and nurses the highest ratings were where the patient died in a hospice. Ratings were similar for care from doctors and nurses where the patient died at home or in a care home. Ratings for hospital staff were lowest.
National VOICES survey key findings report
30
Table 13a: Help received in the last 2 days of life
percentage Strongly
agree Agree Neither Disagree Strongly
disagree
Personal care needs met
41 38 8 7 5
Nursing care needs met
42 37 9 7 5
Adequate privacy provided
49 33 6 6 5
Figures may not add due to rounding The large majority of patients were reported to have had their personal needs met in the last two days of life (79% strongly agree or agree); to have had their nursing needs met (79%) and to have had adequate privacy (82%) However, a significant minority (5%) of respondents strongly disagreed on each of these items. Table 13b: Help received in the last 2 days of life: strongly agree / agree by place of death
percentage Home Hospital Care Home Hospice
Personal care needs met 83 71 89 96
Nursing care needs met 82 71 89 95
Adequate privacy provided 92 72 96 95
Ratings were lowest on all three areas of help received for those patients who died in hospital (71% personal needs, 71% nursing needs and 72% adequate privacy) and highest for those who died in a hospice (96%, 95% and 95% respectively).
National VOICES survey key findings report
31
Table 14: Support received in last 2 days of life
percentage Excellent Good Fair Poor
Relief of pain 44 35 14 7
Relief of other symptoms 38 36 16 10
Spiritual support 38 29 13 19
Emotional support 40 31 14 15
Support to stay where they wanted to be
51 29 9 11
Figures may not add due to rounding The large majority of respondents reported that support received in the last 2 days of life was excellent or good in relation to relief of pain (79%), relief of other symptoms (74%) and support to stay where they wanted to (80%). Ratings for emotional support (71%) and spiritual support (67%) were somewhat lower. These aspects of support also had the highest percentages of ‘poor’ support.
National VOICES survey key findings report
32
Table 15: Decisions made about care which patient would not have wanted N= 19,215: Around 30% of respondents did not know or gave a nil response.
percentage Yes No Don’t know p
All patients 17 64 19 -
Cause of death
CVD 17 63 20
Cancer 16 69 15
Other 19 60 21 <0.001
Place of death
Home 10 76 14
Hospital 20 58 21
Care home 19 63 19
Hospice 15 73 12 <0.001
Age at death
<65 years 14 66 20
65-79 years 16 64 20
80+ years 19 63 18 <0.001
Figures may not add due to rounding Overall, respondents reported that decisions were made about care which the patient would not have wanted in around 17% of cases. The percentage reporting ‘yes’ was lowest for patients who died at home and those aged less than 80 years. There was little difference across cause of death.
National VOICES survey key findings report
33
Table 16: Patient involved in decisions about their care as much as wanted N= 15,315: Around 32% of respondents did not know or gave a nil response.
percentage Yes Preferred
more involvement
Preferred less
involvement
p
All patients 85 14 1 -
Cause of death
CVD 84 15 1
Cancer 88 11 1
Other 84 15 1 <0.001
Place of death
Home 92 7 1
Hospital 82 18 1
Care home 86 13 1
Hospice 89 10 1 <0.001
Age at death
<65 years 85 15 1
65-79 years 85 15 1
80+ years 86 13 1 n/s
Figures may not add due to rounding The large majority of patients (84%) were involved in the person’s care as much as they wanted, with very few reporting that they would have preferred less involvement. Involvement was highest for those who died at home (92%) and for those who died of cancer (88%). There were no significant differences by age at death.
National VOICES survey key findings report
34
Table 17: Did the patient know they were likely to die? N= 18,035: Around 19% of respondents were unsure or gave a nil response.
percentage Yes
definitely Yes
probably Probably
not No
definitely p
Overall 32 29 22 17 -
Cause of death
CVD 15 28 26 30
Cancer 62 25 8 5
Other 21 33 29 18 <0.001
Place of death
Home 47 21 14 19
Hospital 23 31 25 20
Care home 28 34 26 13
Hospice 74 20 4 2 <0.001
Age at death
<65 years 45 19 14 23
65-79 years 39 24 17 20
80+ years 26 34 26 15 <0.001
Reported duration of illness
<24 hours 4 9 25 62
1 day- <1 month 14 29 33 24
1 month - <6 months 37 33 20 11
6 - <12 months 45 32 15 8
12 months or more 39 30 20 11 <0.001
National VOICES survey key findings report
35
Overall, a minority of patients knew they were going to die (32%). The proportion of patients who were reported as definitely knowing they were likely to die was much higher for cancer patients.
National VOICES survey key findings report
36
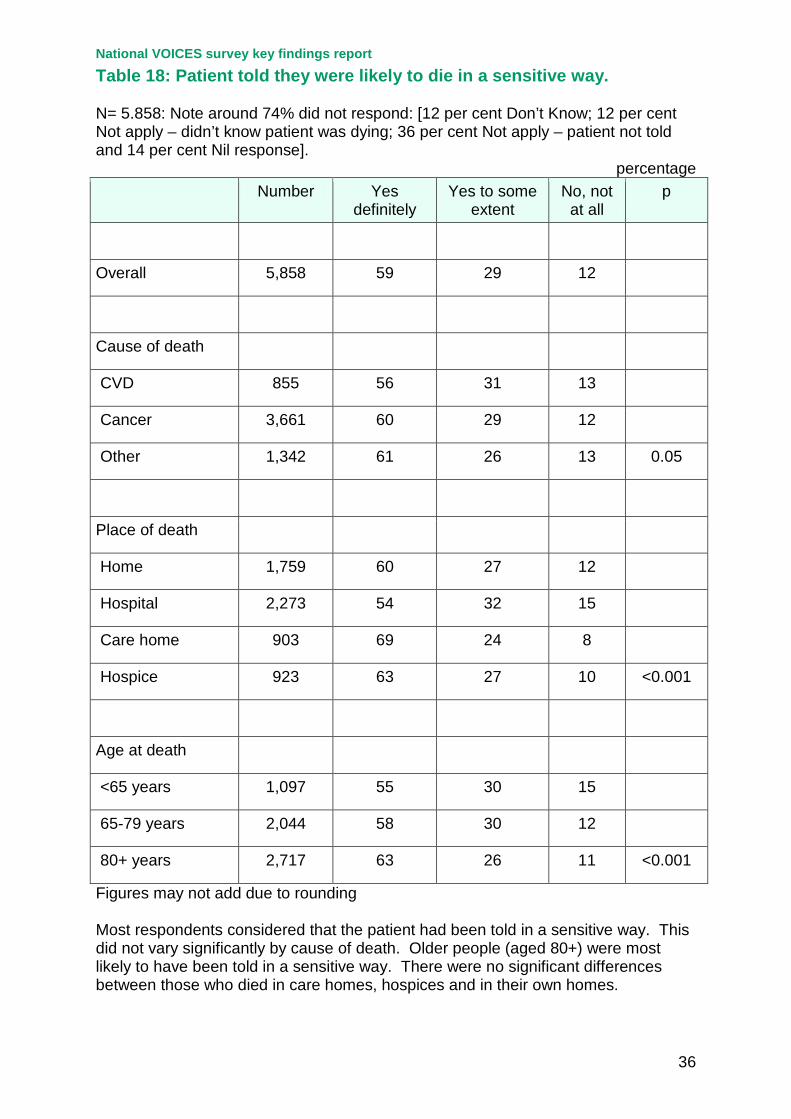
Table 18: Patient told they were likely to die in a sensitive way. N= 5.858: Note around 74% did not respond: [12 per cent Don’t Know; 12 per cent Not apply – didn’t know patient was dying; 36 per cent Not apply – patient not told and 14 per cent Nil response].
percentage Number Yes
definitely Yes to some
extent No, not
at all p
Overall 5,858 59 29 12
Cause of death
CVD 855 56 31 13
Cancer 3,661 60 29 12
Other 1,342 61 26 13 0.05
Place of death
Home 1,759 60 27 12
Hospital 2,273 54 32 15
Care home 903 69 24 8
Hospice 923 63 27 10 <0.001
Age at death
<65 years 1,097 55 30 15
65-79 years 2,044 58 30 12
80+ years 2,717 63 26 11 <0.001
Figures may not add due to rounding Most respondents considered that the patient had been told in a sensitive way. This did not vary significantly by cause of death. Older people (aged 80+) were most likely to have been told in a sensitive way. There were no significant differences between those who died in care homes, hospices and in their own homes.
National VOICES survey key findings report
37
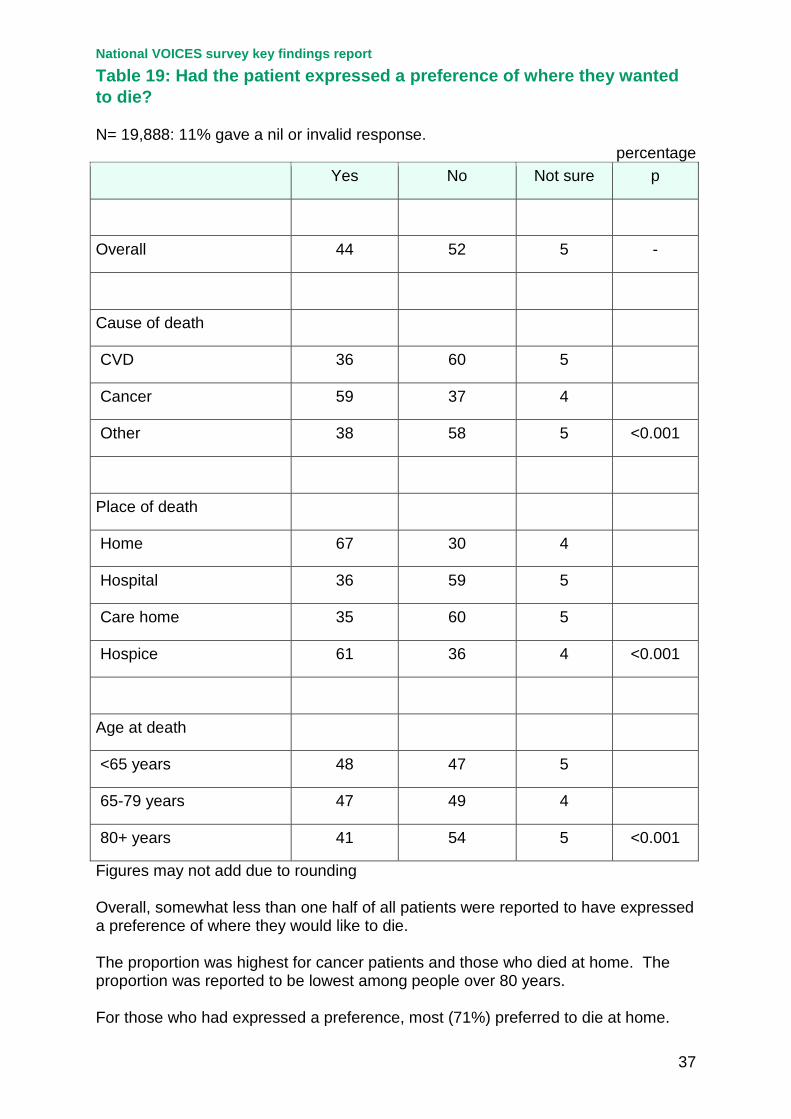
Table 19: Had the patient expressed a preference of where they wanted to die? N= 19,888: 11% gave a nil or invalid response.
percentage Yes No Not sure p
Overall 44 52 5 -
Cause of death
CVD 36 60 5
Cancer 59 37 4
Other 38 58 5 <0.001
Place of death
Home 67 30 4
Hospital 36 59 5
Care home 35 60 5
Hospice 61 36 4 <0.001
Age at death
<65 years 48 47 5
65-79 years 47 49 4
80+ years 41 54 5 <0.001
Figures may not add due to rounding Overall, somewhat less than one half of all patients were reported to have expressed a preference of where they would like to die. The proportion was highest for cancer patients and those who died at home. The proportion was reported to be lowest among people over 80 years. For those who had expressed a preference, most (71%) preferred to die at home.
National VOICES survey key findings report
38
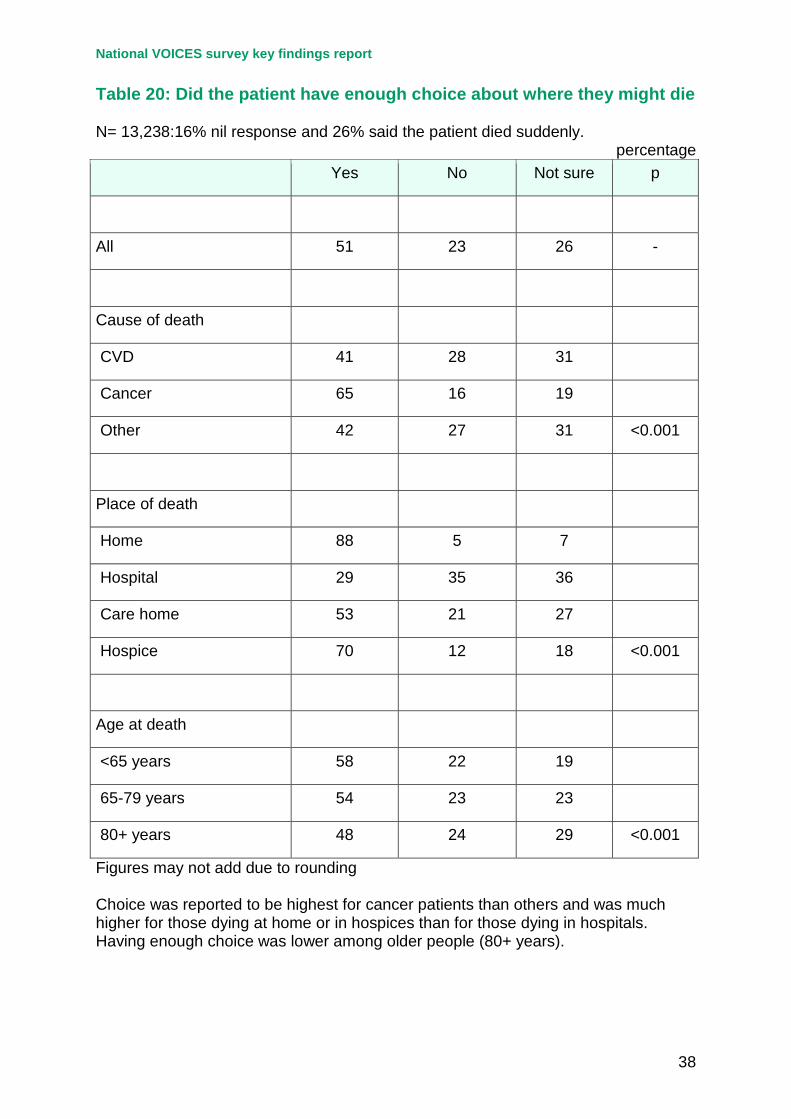
Table 20: Did the patient have enough choice about where they might die N= 13,238:16% nil response and 26% said the patient died suddenly.
percentage Yes No Not sure p
All 51 23 26 -
Cause of death
CVD 41 28 31
Cancer 65 16 19
Other 42 27 31 <0.001
Place of death
Home 88 5 7
Hospital 29 35 36
Care home 53 21 27
Hospice 70 12 18 <0.001
Age at death
<65 years 58 22 19
65-79 years 54 23 23
80+ years 48 24 29 <0.001
Figures may not add due to rounding Choice was reported to be highest for cancer patients than others and was much higher for those dying at home or in hospices than for those dying in hospitals. Having enough choice was lower among older people (80+ years).
National VOICES survey key findings report
39
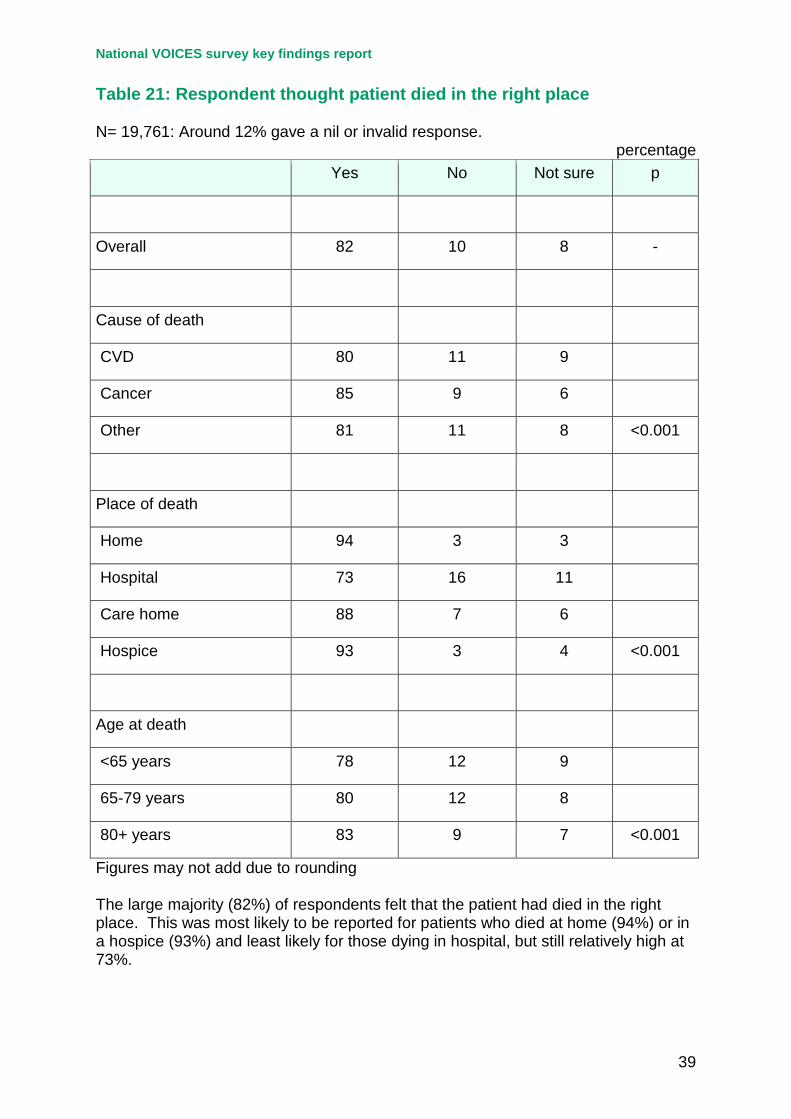
Table 21: Respondent thought patient died in the right place N= 19,761: Around 12% gave a nil or invalid response.
percentage Yes No Not sure p
Overall 82 10 8 -
Cause of death
CVD 80 11 9
Cancer 85 9 6
Other 81 11 8 <0.001
Place of death
Home 94 3 3
Hospital 73 16 11
Care home 88 7 6
Hospice 93 3 4 <0.001
Age at death
<65 years 78 12 9
65-79 years 80 12 8
80+ years 83 9 7 <0.001
Figures may not add due to rounding The large majority (82%) of respondents felt that the patient had died in the right place. This was most likely to be reported for patients who died at home (94%) or in a hospice (93%) and least likely for those dying in hospital, but still relatively high at 73%.
National VOICES survey key findings report
40
Table 22: Support for carers in the last 3 months of life for those at home N= 11,269:41% gave a nil response and a further 9% said that help was not needed.
percentage Yes - as
much as wanted
Yes – some but more wanted
No but tried to get help
Didn’t ask for
help
p
Overall 50 20 15 15 -
Cause of death
CVD 45 21 16 18
Cancer 57 19 13 11
Other 45 20 18 16 <0.001
Place of death
Home 66 16 9 9
Hospital 41 21 19 19
Care home 46 24 20 11
Hospice 56 23 13 8 <0.001
Age at death
<65 years 49 20 16 15
65-79 years 51 18 16 15
80+ years 50 21 15 14 <0.01
Figures may not add due to rounding Carers of cancer patients and of those who died at home or in a hospice were most likely to report having had as much support from health and social services as they wanted.
National VOICES survey key findings report
41
Table 23: Respondent able to discuss worries and fears with the GP N=14,083: Almost a third (30%) gave a nil response and 7% said they had no worries or fears to discuss.
percentage Yes - as
much as wanted
Yes – some, but more wanted
No but tried to discuss
Didn’t try to
discuss
p
Overall 56 17 8 19 -
Cause of death
CVD 54 16 9 21
Cancer 60 17 7 17
Other 55 17 8 19 <0.001
Place of death
Home 70 13 6 12
Hospital 50 18 10 22
Care home 58 17 6 19
Hospice 60 17 6 17 <0.001
Figures may not add due to rounding Respondents for patients who died of cancer and those who died at home were most likely to report that they were able to discuss their worries and fears as much as they wanted with their GP. Younger respondents (age <60 years) were less likely to report being able to discuss worries and fears as much as they wanted with the GP (49% compared with 63% in those 60 years and over).
National VOICES survey key findings report
42
Table 24: Respondent involved in decisions about person’s care as much as wanted. N=18,464: 4% didn’t know 14% nil response.
percentage Yes Preferred more
involvement Preferred less involvement
p
Overall 78 22 - -
Cause of death
CVD 77 23 -
Cancer 79 21 -
Other 77 23 - n/s
Place of death
Home 84 16 -
Hospital 71 29 -
Care home 86 14 -
Hospice 82 18 - <0.001
Figures may not add due to rounding The large majority of respondents (78%) were involved in the person’s care as much as they wanted, with very few reporting that they would have preferred less involvement. There was no significant difference by cause of death. Sufficient involvement was lowest (71%) among those where the patient died in hospital. Younger respondents (under 60 years) were more likely to report that they would have wanted more involvement (27% compared with 18% in those 60 years and over).
National VOICES survey key findings report
43
Table 25: Support for respondent/family adequate at the time of the death. N= 18,673: 16% gave a nil response or said they did not know.
percentage Yes
definitely Yes to some
extent No, not at all p
Overall 59 27 14 -
Cause of death
CVD 55 28 16
Cancer 65 24 11
Other 57 28 15 <0.001
Place of death
Home 60 22 18
Hospital 53 31 15
Care home 64 25 11
Hospice 85 12 2 <0.001
Figures may not add due to rounding Around three in five respondents reported that they/their family received adequate support at the time and following death. This was much higher (85%) among respondents of those who died in a hospice. Younger respondents were less likely to report having received adequate support (54% compared with 63% in those 60 years and over).
National VOICES survey key findings report
44
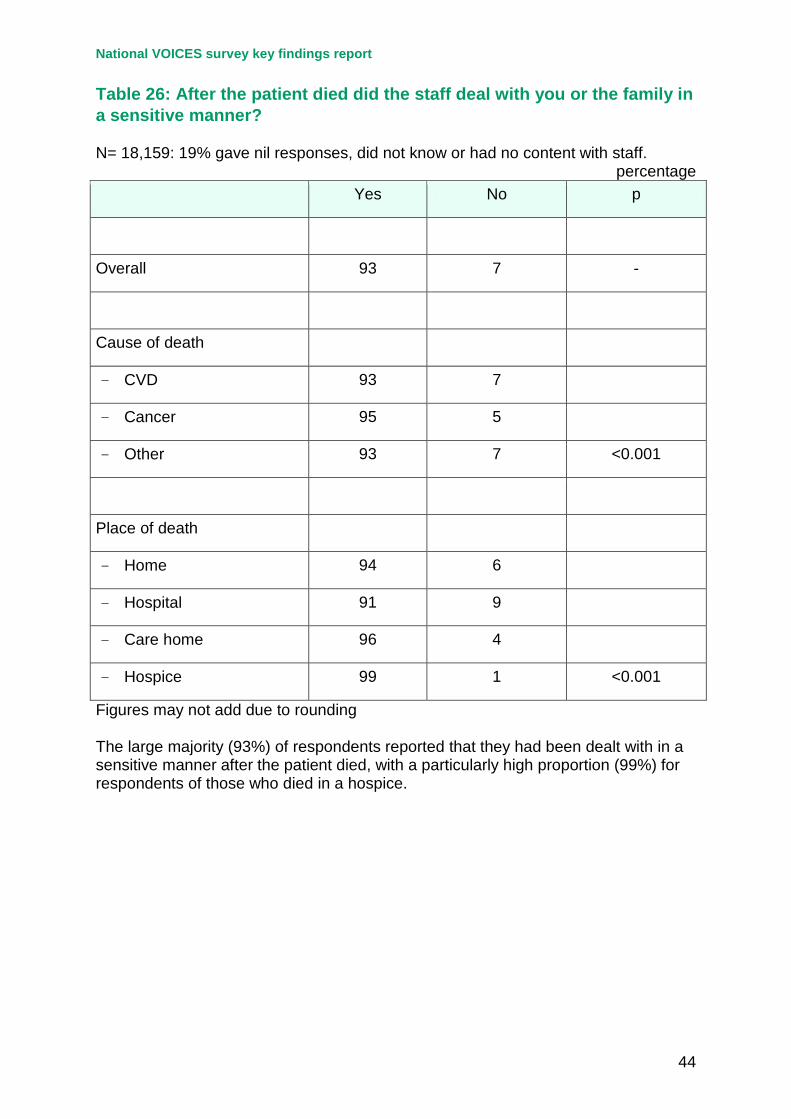
Table 26: After the patient died did the staff deal with you or the family in a sensitive manner? N= 18,159: 19% gave nil responses, did not know or had no content with staff.
percentage Yes No p
Overall 93 7 -
Cause of death
- CVD 93 7
- Cancer 95 5
- Other 93 7 <0.001
Place of death
- Home 94 6
- Hospital 91 9
- Care home 96 4
- Hospice 99 1 <0.001
Figures may not add due to rounding The large majority (93%) of respondents reported that they had been dealt with in a sensitive manner after the patient died, with a particularly high proportion (99%) for respondents of those who died in a hospice.
National VOICES survey key findings report
45
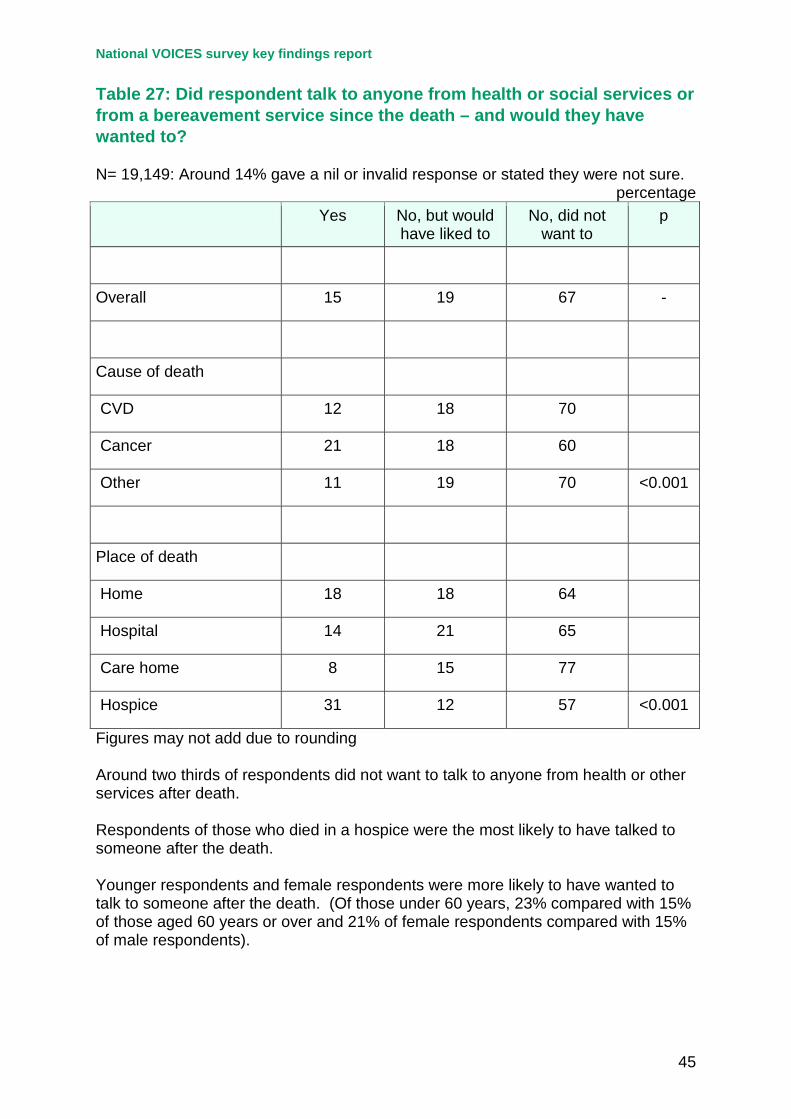
Table 27: Did respondent talk to anyone from health or social services or from a bereavement service since the death – and would they have wanted to? N= 19,149: Around 14% gave a nil or invalid response or stated they were not sure.
percentage Yes No, but would
have liked to No, did not
want to p
Overall 15 19 67 -
Cause of death
CVD 12 18 70
Cancer 21 18 60
Other 11 19 70 <0.001
Place of death
Home 18 18 64
Hospital 14 21 65
Care home 8 15 77
Hospice 31 12 57 <0.001
Figures may not add due to rounding Around two thirds of respondents did not want to talk to anyone from health or other services after death. Respondents of those who died in a hospice were the most likely to have talked to someone after the death. Younger respondents and female respondents were more likely to have wanted to talk to someone after the death. (Of those under 60 years, 23% compared with 15% of those aged 60 years or over and 21% of female respondents compared with 15% of male respondents).
National VOICES survey key findings report
46
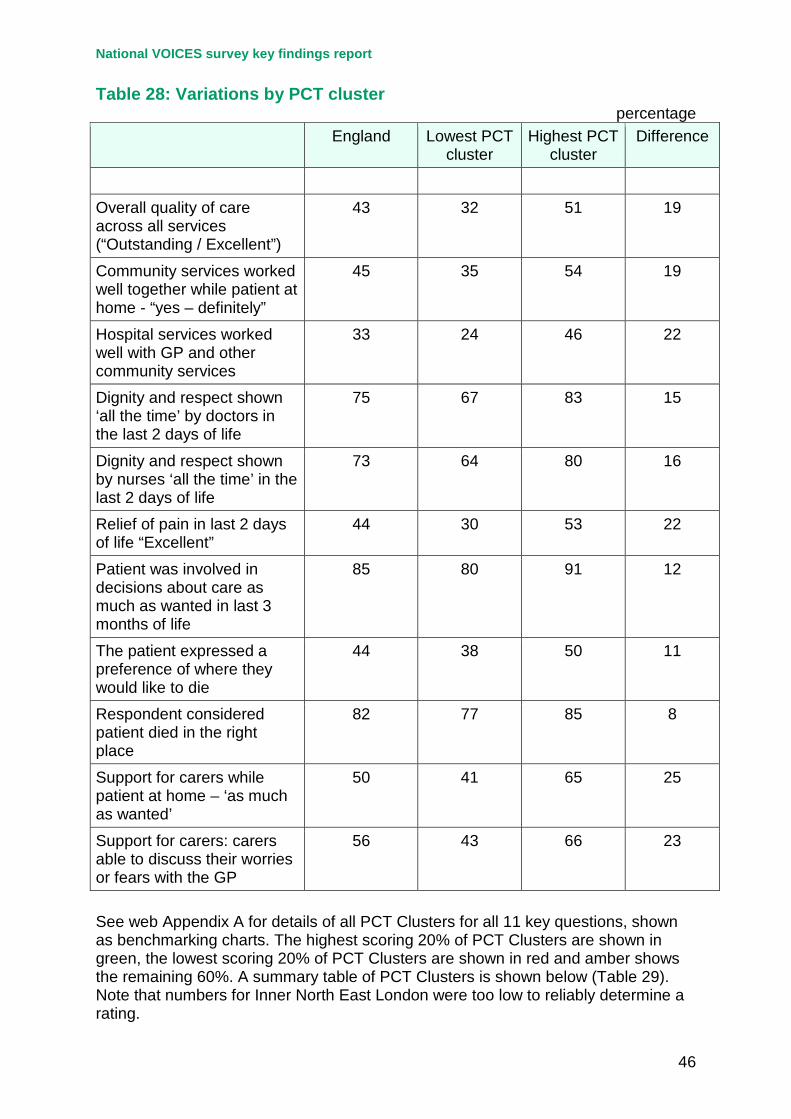
Table 28: Variations by PCT cluster
percentage England Lowest PCT
cluster Highest PCT
cluster Difference
Overall quality of care across all services (“Outstanding / Excellent”)
43 32 51 19
Community services worked well together while patient at home - “yes – definitely”
45 35 54 19
Hospital services worked well with GP and other community services
33 24 46 22
Dignity and respect shown ‘all the time’ by doctors in the last 2 days of life
75 67 83 15
Dignity and respect shown by nurses ‘all the time’ in the last 2 days of life
73 64 80 16
Relief of pain in last 2 days of life “Excellent”
44 30 53 22
Patient was involved in decisions about care as much as wanted in last 3 months of life
85 80 91 12
The patient expressed a preference of where they would like to die
44 38 50 11
Respondent considered patient died in the right place
82 77 85 8
Support for carers while patient at home – ‘as much as wanted’
50 41 65 25
Support for carers: carers able to discuss their worries or fears with the GP
56 43 66 23
See web Appendix A for details of all PCT Clusters for all 11 key questions, shown as benchmarking charts. The highest scoring 20% of PCT Clusters are shown in green, the lowest scoring 20% of PCT Clusters are shown in red and amber shows the remaining 60%. A summary table of PCT Clusters is shown below (Table 29). Note that numbers for Inner North East London were too low to reliably determine a rating.
47
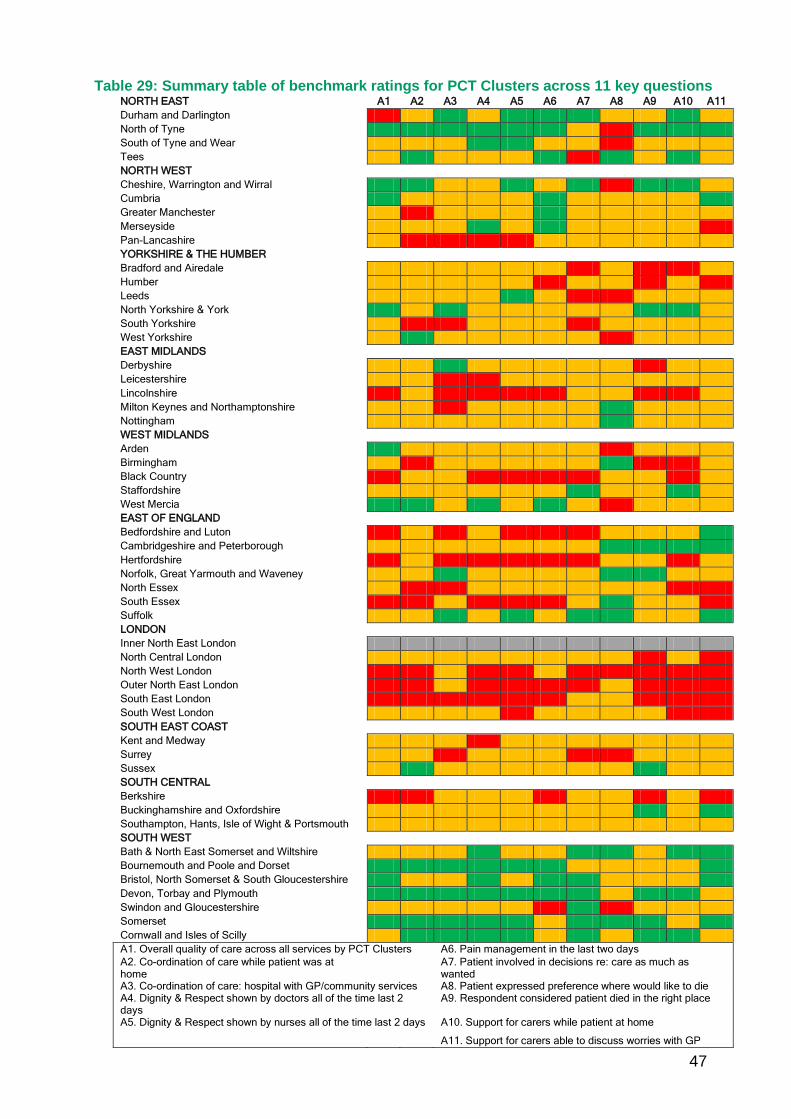
Table 29: Summary table of benchmark ratings for PCT Clusters across 11 key questions NORTH EAST A1 A2 A3 A4 A5 A6 A7 A8 A9 A10 A11 Durham and Darlington North of Tyne South of Tyne and Wear Tees NORTH WEST Cheshire, Warrington and Wirral Cumbria Greater Manchester Merseyside Pan-Lancashire YORKSHIRE & THE HUMBER Bradford and Airedale Humber Leeds North Yorkshire & York South Yorkshire West Yorkshire EAST MIDLANDS Derbyshire Leicestershire Lincolnshire Milton Keynes and Northamptonshire Nottingham WEST MIDLANDS Arden Birmingham Black Country Staffordshire West Mercia EAST OF ENGLAND Bedfordshire and Luton Cambridgeshire and Peterborough Hertfordshire Norfolk, Great Yarmouth and Waveney North Essex South Essex Suffolk LONDON Inner North East London North Central London North West London Outer North East London South East London South West London SOUTH EAST COAST Kent and Medway Surrey Sussex SOUTH CENTRAL Berkshire Buckinghamshire and Oxfordshire Southampton, Hants, Isle of Wight & Portsmouth SOUTH WEST Bath & North East Somerset and Wiltshire Bournemouth and Poole and Dorset Bristol, North Somerset & South Gloucestershire Devon, Torbay and Plymouth Swindon and Gloucestershire Somerset Cornwall and Isles of Scilly A1. Overall quality of care across all services by PCT Clusters A6. Pain management in the last two days A2. Co-ordination of care while patient was at home
A7. Patient involved in decisions re: care as much as wanted
A3. Co-ordination of care: hospital with GP/community services A8. Patient expressed preference where would like to die A4. Dignity & Respect shown by doctors all of the time last 2 days
A9. Respondent considered patient died in the right place
A5. Dignity & Respect shown by nurses all of the time last 2 days A10. Support for carers while patient at home
A11. Support for carers able to discuss worries with GP
National VOICES survey key findings report
48
Table 30a: Overall quality of care across all settings by dementia
percentage Number Outstanding Excellent Good Fair Poor
No mention 14,471 12 30 33 15 10
Dementia 4,370 14 32 34 12 7
Respondents of patients where dementia was mentioned were more likely to rate the overall quality of care as outstanding or excellent compared with those without, and were less likely to rate the overall quality of care as poor. Table 30b: Quality of care by settings by dementia
percentage Number Excellent Good Fair Poor
GPs
No mention 11,622 35 36 17 12
Dementia 3,118 33 43 16 8
Care Homes
No mention 3,118 43 34 14 8
Dementia 3,020 48 35 11 5
Hospital Doctors
No mention 9,904 39 35 16 10
Dementia 1,967 32 39 18 11
Hospital Nurses
No mention 10,565 37 32 18 14
Dementia 2,220 29 35 19 17
National VOICES survey key findings report
49
Table 30c Dignity and respect by services and settings by dementia
percentage Number All of the time Most of the
time Some of the time
Never
GPs
No mention 11,499 72 17 9 2
Dementia 2,949 74 18 7 2
Care Homes
No mention 3,143 59 29 11 2
Dementia 2,988 64 27 8 1
Hospital Doctors
No mention 9,662 57 26 15 2
Dementia 1,893 54 28 15 3
Hospital Nurses
No mention 10,463 49 27 21 3
Dementia 2,156 43 29 25 4
Respondents of patients where dementia was mentioned were more likely to rate the quality of care from GPs as good compared with those without, and were less likely to rate the quality of GP care as poor. There was little difference for the dignity and respect shown by GPs for the patient groups. A similar picture was found for care homes. Respondents of patients where dementia was mentioned were more likely to rate the quality of care as excellent compared with those without, and were less likely to rate the quality care as poor. Respondents were more likely to rate that dignity and respect was shown all the time by care home staff to patients with dementia compared with those without. While respondents of patients where dementia was mentioned were less likely to rate the quality of care from hospital staff as excellent compared with those without, they were also more likely to rate the care as good. Respondents were less likely to rate that dignity and respect was shown all the time to patients with dementia compared with those without by hospital staff.
National VOICES survey key findings report
50
References 1. Department of Health (2008) End of Life Care Strategy - promoting high quality
care for all adults at the end of life. London: HMSO 2. Addington–Hall J, McCarthy M. Regional Study of Care for the Dying: methods and
sample characteristics. Palliative Medicine 1995; 9: 27–35 3. Burt J, Shipman C, Richardson A, Ream E, Addington-Hall,J. The experiences of
older adults in the community dying from cancer and non-cancer causes: a national survey of bereaved relatives. Age and Ageing 2010; 39: 86–91
4. Young AJ, Rogers A, Addington-Hall JM. The quality and adequacy of care received at home in the last 3 months of life by people who died following a stroke: a retrospective survey of surviving family and friends using the Views of Informal Carers Evaluation of Services questionnaire. Health and Social Care in the Community 2008; 16(4), 419-428.
5. Elkington H, White P, Addington-Hall J, Higgs R, Edmonds P. The healthcare
needs of chronic obstructive pulmonary disease patients in the last year of life. Palliative Medicine 2005; 19, 485-491
6. Ingleton C, Morgan J, Hughes P, Noble B, Evans A, Clark D. Carer satisfaction with
end of life care in Powys, Wales: a cross-sectional survey. Health and Social Care in the Community 2004; 12, 43-52.
7. Addington-Hall JM, O'Callaghan AC. A comparison of the quality of care provided
to cancer patients in the UK in the last three months of life in in-patient hospices compared with hospitals, from the perspective of bereaved relatives: results from a survey using the VOICES questionnaire. Palliative Medicine 2009; 23: 190-197
8. Addington-Hall J, Walker L, Jones, C, Karlsen S, McCarthy M. A randomised
controlled trial of postal versus interviewer administration of a questionnaire measuring satisfaction with, and use of, services received in the year before death. Journal of Epidemiology and Community Health 1998; 52: 802–807
9. Fakhoury WKH, McCarthy M, Addington-Hall JM. Which informal carers are most
satisfied with services for dying cancer patients? European Journal of Public Health 1996; 6: 181-187
10. McPherson CJ, Addington-Hall JM. How do proxies’ perception of patients’ pain,
anxiety and depression change during the bereavement period? Journal of Palliative Care 2002; 20(1): 12-19
11. Lloyd L, White K, Sutton E. Researching the end-of-life in old age: cultural, ethical
and methodological issues. Ageing and Society 2011; 31: 386-407 12. Addington-Hall J, McPherson C. After-death interviews with surrogates / bereaved
family members: some issues of validity. Journal of Pain and Symptom Management 2001: 22(3): 784-790

National VOICES survey key findings report
51
13. Hunt KJ, Shlomo N, Richardson A, Addington–Hall JM. VOICES Redesign and Testing to Inform a National End of Life Care Survey. Southampton: University of Southampton. 2011


![Guide for Bereaved People During a Pandemic · the deceased, personal characteristics of the bereaved person, the support network and ritual support. Grieving, a healing journey [Translation]](https://img.pdfslide.net/doc/110x75/5f9552f904615118ad2d90db/guide-for-bereaved-people-during-a-pandemic-the-deceased-personal-characteristics.jpg)