Embed Size (px)
Citation preview
FIRST-PRINCIPLES INVESTIGATION OF THERMODYNAMIC AND KINETIC PROPERTIES IN TI-H SYSTEM AND B2-NIAL COMPOUND: PHASE STABILITY,
POINT DEFECT COMPLEXES AND DIFFUSION
By
Qingchuan Xu
A dissertation submitted in partial fulfillment of the requirements for the degree of
Doctor of Philosophy (Materials Science and Engineering)
in The University of Michigan 2009
Doctoral Committee:
Assistant Professor Anton Van Der Ven, Chair Professor Tresa M. Pollock Assistant Professor Katsuyo Thornton Assistant Professor Suljo Linic
© Qingchuan Xu
All rights reserved
2009
ii
Acknowledgements
I would like to extend my deepest gratitude to my thesis advisor, Prof. Anton Van Der
Ven, for his mentoring, support, encouragement and patience throughout my graduate study. The
guidance of this gentleman has been outstanding. Further appreciation is due to the members of
the dissertation committee, Prof. Pollock, Prof. Thornton and Prof. Linic, for their guidance and
suggestions.
I gratefully acknowledge financial support from NSF, Grant No DMR-0605700 and
DMR-0748516.
I would like to thank my fellow graduate students and research group members: Jishnu
Bhattacharya, Jessica Bickel, and John C. Thomas, who have assisted in this work and created an
enjoyable atmosphere within which to work. Also, I would like to thank Kevin Worth who has
helped me solving many technical computer problems. Thanks are also extended to the staff of
the Center for Advanced Computing in the university of Michigan for their valuable help and
advice in parallel computing.
I also wish to thank my friends, who have been part of my life throughout graduate
school, for their friendship and help whenever needed.
Thanks to my parents in law, Zhiru Hu (胡稚如) and Zhiming Chen (陈志铭) for their
support and lavish gifts.
I thank my parents and sister, Chengqing Li (李承青), Zude Xu (许祖德), and Lichuan

iii
Xu (许丽川) for their unwavering support throughout my life and graduate career.
Most of all, I express my deepest appreciation to my wife, Xingzhi Chen (陈幸之) whose
understanding, unconditional support and love was crucial to make this all possible. Special
thank goes to my daughter, Louisa (许葭轩), who made my graduate career more delightful and
productive.
iv
Table of Contents
Acknowledgements ii List of Figures vi List of Appendices x Chapter 1 Introduction 1
1.1 Thermodynamics in Ti-H system 2 1.2 Diffusion in Ni-Al system 4
Chapter 2 Thermodynamics and kinetics from first-principles 10 2.1 The general procedure to predict thermodynamic and kinetic properties 10 2.2 First principle total energies. 13 2.2.1 The pseudopotential method 15 2.3 Cluster expansion 16 2.3.1 Conventional cluster expansion. 17 2.3.2 Determination of ECI 19 2.3.3 Local cluster expansion 21 2.4 Monte Carlo method 23 2.4.1 Conventional Monte Carlo simulation 23 2.4.2 Free energy integration 25 2.4.3 Kinetic Monte Carlo (KMC) simulation 26 2.5 Vibrational free energy 28
Chapter 3 First-principles investigation of phase stability in interstitial metal-hydride: The Ti-H system 31
3.1 Configurational degrees of freedom 32 3.1.1 Formation energies and relative stability of host structures 32 3.1.2 Cluster expansion and statistical mechanics for the fcc and hcp hosts 35 3.1.3 Phase diagram 38 3.1.4 Site occupancy 40
3.2 Vibrational degrees of freedom 41 3.3 The cubic to tetragonal phase transformation of TiH2 43 3.4 The role of stress and coherency strains 47 3.5 Summary 51
Chapter 4 First-principles investigation of migration barriers and point defect complexes in a substitution solid: B2-NiAl 67
4.1 Important hop mechanisms in B2-NiAl 67 4.1.1 Nearest-neighbor hops 69 4.1.2 Second nearest neighbor hops 70
v
4.1.3 Migration barriers for six-jump-cycles (6JC) migration sequence 71 4.1.4 Migration barriers for the triple defect migration sequence 74 4.1.5 Migration barriers for the anti-structural bridge (ASB) migration sequence 76
4.2 Defect concentration at finite temperature 77 4.2.1 First-principles configurational energies 77 4.2.2 Cluster expansions 79 4.2.3 Monte Carlo simulations 80
4.3 Discussion 83 4.4 Summary 89
Chapter 5 Tracer diffusion and diffusion mechanisms in B2-NiAl compound 111 5.1 Simple structure and complicated diffusion mechanisms 111 5.2 Tracer diffusion in B2-NiAl compound 114 5.3 Relative importance of various diffusion mechanisms in B2-NiAl compound 120 5.4 Summary 123
Chapter 6 Intrinsic diffusion and interdiffusion in B2-NiAl compound 128 6.1 Violation of one thermodynamic factor assumption 129 6.2 Intrinsic diffusion coefficients in B2-NiAl compound 130 6.3 Two thermodynamic factors in B2-NiAl compound 135 6.4 Two interdiffusion coefficients in B2-NiAl compound 137 6.5 Summary 142
Chapter 7 Conclusion 149 Appendices 153 References 159
vi
List of Figures
Figure 2-1 Crystal structure of B2-NiAl compound 30 Figure 3-1 Interstitial sites in Ti host: (a) octahedral sites in fcc Ti host, (b) tetrahedral sites in
fcc Ti host, (c) octahedral sites in hcp Ti host, and (d) tetrahedral sites in hcp Ti host. 53
Figure 3-2 Calculated formation energies of TiH3x for fcc and hcp based hydrogen-vacancy configurations with respect to fcc Ti and δ-TiH2. 54
Figure 3-3 Calculated variation of the energy of TiH2-z with c/a ratio (at constant volume) for (a) TiH2, (b) TiH1.75, and (c) TiH1.5. A c/a = 1 corresponds to the cubic phase. 55
Figure 3-4 Effective cluster interactions for the cluster expansion of the hydrogen-vacancy configurational energies over the interstitial sites of fcc Ti. The clusters include an empty and two point clusters (not shown), six pairs, four triplets, and five quadruplets. 56
Figure 3-5 Calculated phase diagram of TiH3x: (a) considering relative stability over the fcc-Ti host only and (b) considering relative stability over both the hcp and fcc hosts. 57
Figure 3-6 Calculated free energy of fcc Ti, α-Ti (hcp), γ-TiH, and δ-TiH2 at (a) 300K, (b) 450K, and (c) 600K. 58
Figure 3-7 Calculated hydrogen concentrations within tetrahedral (solid line) and octahedral (dashed line) sites of the fcc-Ti host at (a) 300K and (b) 600K. 59
Figure 3-8 Calculated formation energies of various configurations of TiH3x with (squares) and without (circles) zero-point vibrational energies. Reference states are fcc Ti and δ-TiH2. The circled energies correspond to configurations with exclusively octahedral occupancy. All other energies in the enlarged plot (bottom) correspond to configurations with exclusively tetrahedral occupancy. 60
Figure 3-9 Free energies of TiH2 as a function of c/a ratio, calculated with Fermi broadening of the electron distribution at various temperatures. 61
Figure 3-10 Constrained free energies of TiH2 as a function of c/a ratio, calculated within the harmonic approximation using a first-principles parameterized spring model. The free energies at finite temperature are shifted to fit in one plot. 62
Figure 3-11 (a) the experimentally observed (Ref. 35) habit plane between α-Ti (hcp) and coherent γ-TiH precipitates. Empty and black circles are Ti atoms of successive (0001) and (001) planes of hcp and fcc hosts and green circles are tetrahedrally coordinated hydrogen atoms. (b) Schematic illustration of the orientation of the axis of tension relative to the hcp and fcc hosts used to investigate the role of stress on hydride phase stability. 63
Table 3-1 Comparison of calculated lattice parameters with experimental results (Ref. 35, 37, and 118). 66
vii
Figure 3-12 (a) the energy as a function of excess elongation along [0 1 10] direction for hcp-Ti. (b) The traction curve for hcp-Ti obtained as the derivative of the plot in (a). (c) Free energies for hcp-Ti, TiH and TiH2 as a function of stress for μH = -5meV without coherency strains. 64
Figure 3-13 Calculated 0 K phase diagrams as a function of hydrogen chemical potential and stress. (See Fig. 3-11 for the orientation of the applied stress relative to the various crystals). (a) Phase diagram in the absence of coherency strains (i.e. equilibrium lattice parameters perpendicular to the axis of tension). (b) Phase diagram accounting for coherency strains that exist across the habit plane of Fig. 3-11(b). 65
Figure 4-1 Energy along the diffusion path for Ni nearest neighbor hops (NiNi-VAl exchange) under various local environments in the B2-NiAl based compound. (a) Without any additional defects. (b) With a neighboring Ni vacancy and (c) with a neighboring Al vacancy. 91
Figure 4-2 Calculated migration barriers for the next nearest neighbor hops of Ni and Al atoms under various local environments in B2-NiAl. (a) An Al atom hops to an Al vacancy without any additional defects, (b) a Ni atom hops to a Ni vacancy without any additional defects. (c) An Al atom hops to an Al vacancy with an adjacent Ni vacancy and (d) failure of a Ni second nearest neighbor hop to a Ni vacancy due to the presence of an adjacent Al vacancy, (e) an antisite Al atom hops to a Ni vacancy without any additional defects, (f) an antisite Ni atom hops to an Al vacancy without any additional defects, (g) failure of an antisite Al second nearest neighbor hop to a Ni vacancy due to the presence of an adjacent Al vacancy, (h) failure of an antisite Ni second nearest neighbor hop to an Al vacancy due to the presence of an adjacent Ni vacancy. 92
Figure 4-3 (a) The [110] six-jump-cycle sequences (a1)-(a4) in B2-NiAl, (b) variation of the energy along the [110] six-jump-cycle migration paths. The energy is relative to the initial configuration a1. The migration barriers were calculated with the nudged elastic band method. 93
Figure 4-4 (a) The straight [100] six-jump-cycle sequences (a1)-(a5) in B2-NiAl In (a2), the antisite Al atom does second nearest neighbor hop (red line) instead of doing 2 nearest neighbor hops (green lines), so (a3) does not exist. (b) Calculated variation of the energy along the straight [100] six-jump-cycle migration paths. The energy is relative to the initial configuration (a1). 94
Figure 4-5 (a) The bent [100] six-jump-cycle sequences (a1)-(a5) in B2-NiAl In (a2), the antisite Al atom does second nearest neighbor hop (red line) instead of doing 2 nearest neighbor hops (green lines), so (a3) does not exist. (b) Calculated variation of the energy along the bent [110] six-jump-cycle migration paths. The energy is relative to the initial configuration (a1). 95
Figure 4-6 (a) The [100] triple-defect migration sequence (a1)-(a4) in B2-NiAl, and (b) The calculated variation of the energy along the [100] triple defect migration paths. The energy is relative to the initial configuration of a [100] triple defect (a1). 96
Figure 4-7 (a) The [110] triple-defect migration sequence (a1)-(a5) in B2-NiAl, and (b) The calculated variation of the energy along the [110] triple defect migration paths. The energy is relative to the initial configuration of a [110] triple defect (a1). 97
viii
Figure 4-8 (a) The [111] triple-defect migration sequence (a1)-(a5) in B2-NiAl, and (b) The calculated variation of the energy along the [111] triple defect migration paths. The energy is relative to the initial configuration of a [111] triple defect (a1). 98
Figure 4-9 (a) The [100] anti-structural-bridge migration sequence for Al atoms in B2-NiAl, and (b) The calculated variation of the energy along the [100] anti-structural-bridge migration paths for Al atoms in B2-NiAl. The energy is relative to the initial configuration (a1). 99
Figure 4-10 (a) The [110] anti-structural-bridge migration sequence for Al atoms in B2-NiAl, and (b) The calculated variation of the energy along the [110] anti-structural-bridge migration paths for Al atoms in B2-NiAl. The energy is relative to the initial configuration (a1). 100
Figure 4-11 (a) The [100] anti-structural-bridge migration sequence for Ni atoms in B2-NiAl, and (b) The calculated variation of the energy along the [100] anti-structural-bridge migration paths for Ni atoms in B2-NiAl. The energy is relative to the configuration (a2). 101
Figure 4-12 (a) The [110] anti-structural-bridge migration sequence for Ni atoms in B2-NiAl, and (b) The calculated variation of the energy along the [110] anti-structural-bridge migration paths for Ni atoms in B2-NiAl. The energy is relative to the configuration (a2). 102
Figure 4-13 the experimental phase diagram of Ni-Al system (See Ref. 131). 103 Figure 4-14 Formation energies (relative to fcc Ni and fcc Al) of various Ni-Al-vacancy
arrangements in B2-NiAl based compound (green circles). Also shown are formation energies of experimentally observed compounds in the Ni-Al system. 104
Figure 4-15 Effective cluster interactions of the coupled-sublattice cluster expansion describing the configurational energy of the dominant components on the two sublattices of B2-NiAl. The cluster expansion includes 1 empty cluster, 2 points (for the Al and Ni sublattice sites), [not shown in the figure], 14 pairs, 8 triplets and 1 quadruplet. 105
Figure 4-16 Effective cluster interactions for local cluster expansion for (a) anti-site Al, including the empty cluster (not shown in the figure) along with 5 point and 3 pair clusters, and (b) Al vacancy, including the empty cluster (not shown in the figure) and one point cluster. 106
Figure 4-17 Calculated equilibrium point defect concentrations (per sublattice site) in B2-NiAl as a function of composition at 1300K. Green squares are the Ni antisite concentrations, red diamonds are Ni-vacancy concentrations, filled circles are Al vacancies and yellow triangles are Al antisite concentrations. 107
Figure 4-18 Calculated equilibrium triple-defect probabilities as a function of composition in B2-NiAl compound at 1300K. 108
Figure 4-19 Calculated equilibrium defect complex probabilities as a function of composition in B2-NiAl compound at 1300K. (a) Intermediate state of the triple defect migration mechanism consisting of a VNi-AlAl-VAl cluster, (b) AlNi-VNi second nearest neighbor pair and third nearest neighbor pair, (c) NiAl-VAl second nearest neighbor pair and third nearest neighbor pair. 109
Figure 4-20 Calculated energy as a function of distance between an antisite Ni and an antisite Al. The energy is relative to that of the configuration with a nearest NiAl – AlNi pair and the distance is relative to the nearest pair distance, a is the lattice parameter. 110
Figure 5-1 Calculated attempt frequencies for various diffusion hops in B2-NiAl compound. 125
ix
Figure 5-2 (a) Calculated tracer diffusion coefficients for Ni and Al at 1300K. Solid blue circles are Ni tracer diffusion coefficients and solid red squares are Al tracer diffusion coefficients. (b) Comparison of calculated Ni tracer diffusion coefficient (blue circles) at 1300K with experimental measurements of Ni tracer diffusion coefficients by Frank et al. (at 1300K, white circle) [49] and Hancock et al. (at ~1273K, white square) [50]. 126
Figure 5-3 Calculated relative percentages of various diffusion hops in B2 NiAl compound as a function of composition at 1300K. Solid blue diamonds are percentages of Ni next-nearest-neighbor (NNN) hops; solid red squares are percentages of triple-defect (TD) hops; solid gray triangles are percentages of six-jump-cycle (6jc) hops; solid green circles are percentages of anti-bridge-structure hops for Al (ASB_Al); purple circles are percentages of anti-bridge-structure hops for Ni (ASB_Ni) and solid orange circles are percentages of back-and-forth hops involving Ni antisite (NiAl) and Ni vacancy (VNi). Brown diamonds are for back forth 6JC 1st and 3rd sub hops. 127
Figure 6-1 Calculated intrinsic diffusion coefficients for Ni (blue empty circles) and Al (red solid circles) in B2-NiAl at 1300K. 144
Figure 6-2 Calculated thermodynamic factors for Ni (green solid circles) and Al (red solid squares) in B2-NiAl at 1300K. 145
Figure 6-3. Relationship obtained from Monte Carlo simulation between Ni concentration, xNi, and Al concentration, xAl, in B2-NiAl at 1300K. 146
Figure 6-4 Interdiffusion coefficients calculated for Ni (blue squares), Al (red diamonds) and Wagner’s definition (green circles) in B2-NiAl at 1300K. 147
Figure 6-5. Experimental interdiffusion coefficients for B2-NiAl: (a) 1273K, (b) 1323K and 1423K. Data reported by Paul, Shankar, Kim, and Watanabe (See Ref. 59, 60, 53, and 147). 148
x
List of Appendices
Appendix A 153 Appendix B 156
1
Chapter 1
Introduction
Understanding the thermodynamic and kinetic properties of most materials of
technological importance is of critical importance in both theoretical and applied research. The
conventional approaches to investigating the thermodynamic and kinetic properties are through
experiments or empirical simulations that are based on experimental results. Although
experiment is the most reliable and direct method to obtain thermodynamic and kinetic
properties, it is sometimes difficult to conduct or time consuming. Fortunately, the developments
in statistical mechanics and density functional theory (DFT) have made it possible to predict
thermodynamic and kinetic properties from first-principles electronic structure calculations. It is
now possible to calculate multi-component phase diagrams and finite temperature phase stability
to a high degree of accuracy without any experimental results [1-12].
This thesis will demonstrate how macroscopic thermodynamic and kinetic properties of
real materials at finite temperature can be predicted from first principles and obtain a deep
microscopic insight into the macroscopic thermodynamic and kinetic properties. The approach
relies on statistical mechanical techniques that link electronic structure calculations to relevant
free energies and phenomenological kinetic constants such as diffusion coefficients. The two
systems we are interested in are the Ti-H system, which is a representative of interstitial solids,
and the Ni-Al system, which is a representative of substitutional solids; both play very important
roles in industrial applications.
2
1.1 Thermodynamics in Ti-H system
The tendency of a solid to form hydrides makes it a potential hydrogen storage material.
This tendency also makes structural materials susceptible to hydrogen embrittlement. An
understanding of the thermodynamics and kinetics of hydride formation is therefore required in
the design of new hydrogen storage materials as well as alloys that are resistant to hydrogen
embrittlement.
The insertion of hydrogen into a host material for storage purposes is often accompanied
by phase transformations, whereby a hydride phase consumes the original host phase [13]. In a
good hydrogen storage material, these phase transformations proceed reversibly and with
minimal mechanical damage that may arise from differences in volume between the various
phases participating in the transformation.
Hydrogen embrittlement has several origins depending on the environment and loading
conditions. These include: (i) the formation of brittle hydrides [14-16], (ii) a hydrogen induced
reduction in cohesive strength of the solid [17-20], and (iii) hydrogen enhanced local plasticity
(HELP) whereby the presence of hydrogen atoms lubricate dislocation glide [21-23]. In a
particular alloy, all three mechanisms may play a role, with hydride formation followed by
hydride cleavage typically dominating under slow loading rates and the HELP mechanism
dominating at high strain rates [15]. The change in mechanism with loading rate arises from
kinetic factors that prevent the rapid formation of brittle hydride phases as the solid is strained.
A first step to understanding hydride formation in hydrogen storage materials or during
mechanical loading in structural materials is a determination of hydride phase stability. Often
hydrides are compounds in which hydrogen orders over interstitial sites of the host material. Not
all hydrides are stoichiometric, though, and can exhibit considerable configurational disorder.
3
Since hydrogen is the lightest element, zero-point vibrational energy is potentially also important
in determining hydride phase stability. Finally, hydrides often form in the solid state, where
coherency strains and internal stresses may alter relative stabilities of various hydride phases.
This thesis investigates different factors that determine hydride phase stability from first
principles. We focus on hydride formation in Ti, an important structural material that is well
known to be susceptible to hydrogen embrittlement [15, 24-26]. Ti based alloys are used as
structural components in aircraft and exhibit exceptional mechanical properties as well as
corrosion resistance. Nevertheless, the unique bonding properties between Ti and hydrogen make
Ti-alloys susceptible to hydrogen embrittlement. The mechanisms of hydrogen embrittlement in
Ti have their origin in the interaction between Ti and hydrogen at the electronic and atomic
scale, making their study ideally suited for a first-pinciples investigation.
While Ti in and of itself is currently not considered a viable hydrogen storage material,
the thermodynamic and kinetic principles that dominate hydride formation in this metal are
similar to those occurring in well-known hydrogen storage materials such as Ni-based alloys
(with rare-earth elements [27] or with transition metal ions [28]). Furthermore, Ti can serve as
an alloying element in Ni and Fe based metal hydride storage materials [29,30], while the
addition of TiCl3 to NaAlH4, a promising hydrogen storage material, has been shown to
significantly enhance its hydrogen (de)-sorption reactions [31].
The hydrides that form in Ti are crystallographically identical to those that form in Zr
[32,33], an important component in nuclear fuel rod cladding. In pure α-Ti (hcp), three hydride
phases can form [34-37]: (i) δ-TiH2-z (where z ranges between 0 and 0.5), (ii) ε-TiH2, which is a
tetragonally distorted form of δ and (iii) γ-TiH. We explore the role of configurational degrees of
freedom, vibrational degrees of freedom and coherency strains in affecting hydride phase
4
stability with a particular focus on the relative stability of γ-TiH, as this hydride is believed to be
metastable but is nevertheless observed experimentally in the form of coherent precipitates [35-
37]. We also explore the nature of the cubic to tetragonal phase transformation of TiH2 that
occurs around room temperature [34].
1.2 Diffusion in Ni-Al system
NiAl based alloys are of importance in aircraft industry. The gas turbine blades are
coated with the functional layers that protect the structural component (Ni-based superalloy)
from the combustion environment. This protection consists of a chemical barrier made of a thin
layer of Al2O3 and outer thermal barrier made of a thicker layer of yttria-doped ZrO2 [150]. The
chemical barrier protects the core against in –diffusion of deleterious elements from the
combustion environment, while the thermal barrier keeps the structural core within an acceptable
temperature range. In addition to the chemical and thermal barriers, a bondcoat is also required
to both form and subsequently adhere the Al2O3 thermally grown oxide (TGO) chemical barrier
to the super-alloy structural core. An important class of bond coats is made of B2-NiAl based
alloys. The bond coat is expected to withstand creep and to serve as a diffusion barrier or sink to
refractory elements such as Mo, Re, Ta and W from the superalloy core [38].
Since the B2-NiAl based bond coat is between a Ni-rich superalloy substrate and the Al-
rich TGO chemical barrier, large concentration gradient are present, and the system becomes
susceptible to interdiffusion, which can lead to functional degradation. Often a thin layer of Pt is
placed between the nickel aluminide and the TGO adding to the complexity of interdiffusion
phenomena [39,40]. In fact, net fluxes of vacancies due to the Kirkendall effect associated with
interdiffusion in substitutional solids can lead to local swelling. Interdiffusion also affects the
5
superalloy substrate, producing a diffusion-affected zone there that locally degrades its
mechanical properties [38].
This thesis tries to understand the interdiffusion phenomena within the B2-NiAl
compound from first-principles and these insights will form a solid basis from which to
investigate ternary-alloying elements that suppress local swelling due to net fluxes of vacancies
in the future.
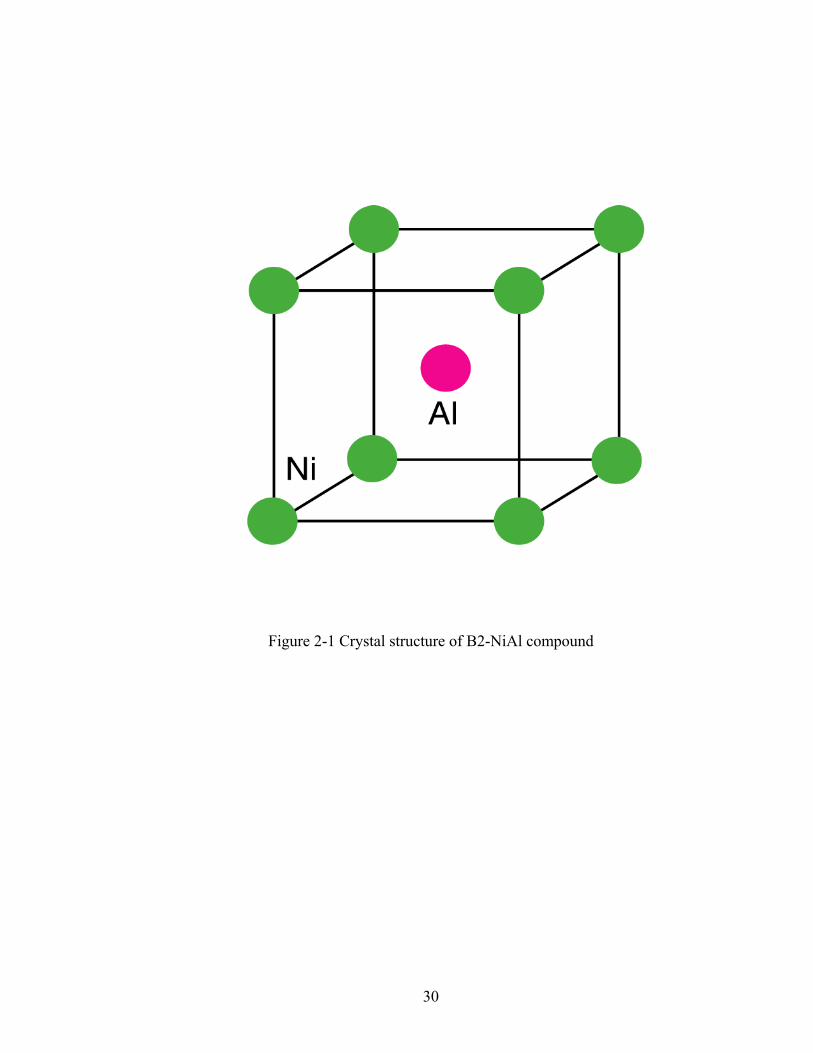
B2 NiAl is a unique intermetallic in that it can accommodate remarkably high
concentrations of vacancies and anti-site defects. Its crystal structure is isomorphic to CsCl,
which is a bcc based ordered compound consisting of two cubic sublattices, with Ni occupying
one cubic sublattice and Al the other (Figure 2-1). While B2 NiAl has a simple crystal structure,
the defects that accommodate off-stoichiometry in B2-NiAl can be quite complex [41-44]. At
finite temperature and for off-stoichiometric compositions, intrinsic defects are created that
include anti-site disorder (Ni on the Al sublattice and vice-versa) as well as vacancies. Excess Ni
is realized with Ni anti-site defects on the Al sublattice while excess Al is achieved through the
creation of vacancies on the Ni sublattice [41-44]. Experiment [41] and mean field predictions
[42-44] have indicated a strong asymmetry in the dominant defects as a function of the alloy
composition relative to the stoichiometric NiAl composition. Although Al atoms can occupy the
Ni sublattice, they do so very rarely and the overwhelming majority of defects on this sublattice
are vacancies, which can reach concentrations of several percent in Al-rich B2 compounds [41-
43]. The Al sublattice, in contrast, only accommodates vacancies at very low concentrations
while its Ni concentration can be substantial [41-43]. The high concentrations of point defects in
B2-NiAl can lead to the formation of a variety of long-lived defect clusters, including the triple
6
defect, which consists of a pair of vacancies on the Ni-sublattice next to a Ni antisite on the Al
sublattice.
Point defects and defect clusters often play an important role in mediating atomic
diffusion [45,46]. However, the complexity of the defect structure of B2-NiAl as a function of
alloy concentration has made a comprehensive understanding of atomic transport in this
compound very difficult. A variety of atomic hop mechanisms have been proposed and studied
in B2-NiAl, ranging from simple atom-vacancy exchanges to complex hop sequences that
involve defect clusters [42,43,47-67]. As any nearest neighbor hop in B2-NiAl results in a local
disordering of the compound, complicated hop sequences have been proposed that result in the
net migration of atoms and vacancies without disrupting the B2-ordering. Several candidate
diffusion mechanisms in this system include next-nearest-neighbor (NNN) vacancy jumps, six-
jump-cycle (6JC) [47,63,66] that is also called Huntington-McCombie-Elcock (HME)
mechanism, the anti-structural-bridge (ASB) mechanism [52], and the triple-defect mechanism
[49,67].
Under the NNN vacancy mechanism a vacancy is jumping along one specific sublattice by
exchanging with NNN atoms. This mechanism is equivalent to a normal vacancy mechanism on
the simple cubic lattice formed by Ni or Al atoms. In contrast to the NNN mechanism, the six-
jump cycle mechanism involves only nearest neighbor (NN) jumps of vacancies. It includes six
successive cycle displacements of a vacancy between the two sublattices [47,66]. After
completing the six-jump cycle, a vacancy on Ni sublattice site exchanges its position with a Ni
atom also on an Ni-sublattice site; at the same time two Al atoms on the Al sublattice sites
exchange positions with each other. The degree of order in the initial and final states of the lattice
does not change. Kao et al proposed another important diffusion mechanism, referred to as the
7
anti-structural bridge mechanism (ASM) [52], which involves the migration of a vacancy along a
percolating network of anti-site atoms, thereby avoiding any increase in local disorder. This
mechanism requires sufficient anti-site atoms and is only expected to become viable for alloy
concentrations that deviate from the NiAl stoichiometry. Frank et al proposed a mechanism that
relies on the net migration of a triple defect, causing a direct exchange of a Ni atom and an Al
atom [49,67]. Combining with the ASB mechanism, Frank used the triple-defect mechanism to
explain the experimental observation of Ni diffusion behavior and he also excluded the NNN
jump from the dominant diffusion mechanism [49]. However, in a recent embedded atomic model
(EAM) study of diffusion mechanism in NiAl, Mishin questioned Frank’s exclusion of NNN
mechanism and pointed out that NNN jumps of a Ni vacancy have a low enough energy barrier
and high enough rate constant to be considered as a plausible mechanism of Ni diffusion that can
operate concurrently with other mechanisms [58]. From the above brief summary of the diffusion
mechanisms in the NiAl system we can see that the diffusion process in this system is very
complex and several atomic mechanisms can operate in NiAl concurrently and may depend on the
temperature and composition.
A first step to understanding diffusion in B2-NiAl is a characterization of the dominant
hop mechanisms that enable atomic transport. The importance of a particular hop mechanism is
determined by (i) its migration barrier and (ii) the concentration of point defects and defect
complexes that are needed to mediate the hop. Previous theoretical investigations of defects in
B2-NiAl, while using a variety of methods to calculate defect formation energies (ranging from
empirical potential methods to first-principles methods) always relied on a mean field
approximation to estimate finite temperature defect concentrations [42,43,44,58]. This approach
neglects interactions among defects, and is therefore valid only when defect concentrations are
8
very low. Furthermore, it cannot provide accurate predictions for the concentration of important
diffusion mediating defect complexes, whose existence is a result of interactions between point
defects.
In this thesis, we expand on previous studies of defects and atomic diffusion in B2-NiAl
[42-44,47-67] and systematically analyze hop mechanisms from first principles to identify those
with low migration barriers. This analysis will provide a deep understanding of proposed
diffusion mechanism, lead to corrections of hop sequences and find possible new hop sequences.
We have calculated the concentrations of point defects and defect complexes in B2-NiAl
compounds at finite temperature by rigorously accounting for interactions among point defects
with a cluster expansion in Monte Carlo simulations. The explicit inclusion of interactions
among point defects enabled an accurate first-principles prediction of the concentrations of
diffusion mediating complexes as a function of alloy concentration and sheds light on the relative
importance of viable atomic hop mechanisms in B2-NiAl. Our calculations of defect cluster
concentrations suggest the importance of different diffusion hops that are mediated by these
defect clusters. Based on this information, we conducted kinetic Monte Carlo simulations to
obtain the tracer diffusion coefficients, and further to calculate intrinsic diffusion coefficients
and inter-diffusion coefficients for B2-NiAl compound.
The thesis is structured as follows. In chapter 2, we describe the first-principles
methodology to investigate the thermodynamic and kinetic properties of Ti-H and Ni-Al
systems. We will describe a cluster expansion approach to rigorously account for interactions
among point defects within Monte Carlo simulations and show how thermodynamic and kinetic
properties can be determined with grand canonical Monte Carlo simulations and kinetic Monte
Carlo simulation. After chapter 2, we investigate in chapter 3 the thermodynamic properties of
9
the Ti-H system, such as phase stability, the effect of vibrational degrees of freedom, the effect
of strain on the phase stability and the site preference of hydrogen atoms within Ti host. After
investigating an interstitial solid, we will investigate a substitutional solid, B2-NiAl in chapter 4.
There we systematically analyze migration barriers of important atomic hop mechanisms in B2-
NiAl from first principles and conduct a comprehensive analysis of point defects and defect
cluster concentrations at finite temperature using Monte Carlo simulations applied to a cluster
expansion for B2-NiAl. All this information was used to conduct kinetic Monte Carlo
simulations (chapter 5), which incorporated all well-known diffusion mechanisms, to obtain the
tracer diffusion coefficients for B2-NiAl compound and to compare the relative importance of
various diffusion mechanisms. Finally, in chapter 6 the calculations of self-diffusion coefficients
and interdiffusion coefficients are presented and the link between these diffusion coefficients and
the specific defect characteristic of B2-NiAl compound are investigated. Chapter 7 concludes the
thesis.
10
Chapter 2
Thermodynamics and kinetics from first-principles
Thermodynamic and kinetic properties of solids are macroscopic properties that are
collectively determined by the underlying atomic interactions. An ultimate understanding of
these macroscopic properties should theoretically come from the understanding of the behavior
of elementary atoms that form the solids. This means that in theory we should solve the quantum
mechanical equations that govern the behavior of these elementary particles in the solids to
understand the thermodynamic and kinetic properties. However, this is extremely difficult in
practice. Fortunately, statistical mechanics serves as a bridge between the atomic-scale
description of solids and macroscopic thermodynamic and kinetic properties and makes it
possible to predict thermodynamic and kinetic properties from first principle. Over the past two
decades some approaches have been developed to qualitatively or quantitatively predict
thermodynamic and kinetic properties from first principle. This chapter will describe the
methods and procedures employed to predict thermodynamic and kinetic properties.
2.1 The general procedure to predict thermodynamic and kinetic properties.
It is well known from statistical mechanics that the macroscopic thermodynamic and
kinetic properties of a solid are the weighted average of values of the specific property within
each microstate that the solid samples. Each microstate s has an energy Es associated with it
which is an eigenvalue of the Schrodinger equation of the solid. The weight, according to
11
statistical mechanics then, is the probability that a system is in a particular state s, and is given by
[68,69]
Ps =exp(−Es /kBT)
Z, (2.1)
where kB is the Boltzmann’s constant, T is the absolute temperature and Z is the partition
function defined as
Z = exp(−Es /kBT)s
∑ . (2.2)
Equation (2.1) represents a distribution function that assigns the relative importance of different
microstates in determining thermodynamic averages and reflects the fraction of time that a solid
resides in each microstate s. In this way, average thermodynamic properties can be evaluated as
A = AsPss
∑ , (2.3)
where A is a macroscopic thermodynamic quantity and As is the value of that quantity when the
solid is in microstate s. Also, a prediction of phase stability requires a comparison of free
energies of different phases at finite temperature. The free energy G of a system for example is
formally related to the partition function Z according to [69]
G = −kBT lnZ (2.4)
The full evaluation of Eq. (2.1) – (2.4) require the knowledge of Es for all excited states s
of the solid, which includes configurational, vibrational, and electronic excitations. [First-
principles energies are usually calculated at zero pressure p, and the pVs term that should appear
in the exponential of Eq. (2.1) and (2.2), where Vs is the volume of excited state s, can then be
ignored.] In the system studied in this thesis, configurational degrees of freedom arise from all
the possible ways of distributing hydrogen over the interstitial sites of the metal hosts in Ti-H
system and all possible arrangements of Ni atoms, Al atoms and vacancies in Ni-Al system.
12
Often, vibrational and electronic excitations are neglected in first-principles investigations of
thermodynamic and kinetic properties in multicomponent solids [2,4,6,7,11,95-98]; however,
due to the low mass of hydrogen atoms in Ti-H system, zero-point vibrational energy can be
important [99]. Thus, in this thesis we will neglect electronic excitations for both Ti-H system
and investigate thermodynamic properties with and without vibration. For Ni-Al system, only
configurational degrees of freedom are considered when evaluating thermodynamic and kinetic
properties.
The excitation energies Es should be calculated from first principles, but since the number
of excitations is astronomically large, it is necessary to resort to a model that extrapolates first
principle energies to allow the calculation of energies for any configuration. Once we can
calculate the energies for arbitrary configurations, a statistical mechanical technique such as
Monte Carlo simulations can be used to evaluate the thermodynamic and kinetic properties at
finite temperature. Hence the methods used in this thesis to calculate first principles
thermodynamic and kinetic properties in Ti-H and Ni-Al systems can be divided into three steps
[2,70] that will be described in more detail in the next three sections and can be summarized as
follows.
(i) First a variety of first principles total energies are calculated for various
arrangements of H atoms within Ti hosts and various arrangements of Ni atom, Al
atom and vacancies in Ni-Al system.
(ii) These energies are then used to parameterize a cluster expansion. An optimized
cluster expansion enables an accurate and efficient calculation of the total energy of
any configuration.
13
(iii) The cluster expansion is then used in Monte Carlo simulation to calculate
thermodynamic and kinetic properties.
In section 2.2 we will briefly describe density functional theory [71] used to calculate the energy
of the solid from first-principles. These energies were then used to determine the coefficients of a
cluster expansion [1] for a particular system, as will be reviewed in section 2.3. Once the cluster
expansions were constructed, thermodynamic and kinetic properties were calculated with Monte
Carlo simulations [72] that will be described in section 2.4. Finally, due to the importance of
vibrational degree of freedom in Ti-H system, a short description of the approach to calculate
vibrational free energy is present in section 2.5.
2.2 First principle total energies
Total energies are essential inputs for any analysis of phase stability and diffusion. These
energies must be calculated from first principles, that is, at 0K by solving the many-body time-
independent Schrodinger equation:
) H Ψ = EΨ, (2.5)
where Ψ is the many-body wavefunction for the electrons, E is the total energy for the solid, and
) H is the Hamiltonian operator for the system of electrons and nuclei, which is defined as:
) H = −
h2
2me
∇ i2
i∑ +
ZIe2
r r i −
r R Ii,I
∑ +12
e2
r r i −
r r j
−h2
2MI
∇ I2 +
12I
∑i≠ j∑ ZI ZJe
2
r R I −
r R JI ≠J
∑ , (2.6)
where e and me are the charge and mass of electrons respectively, ZI and MI are the charge and
mass of nuclei respectively, r r i is the position of electron i and
r R I is the position of nuclei I, h is
the Plank constant/(2π)[73-75]. The first term in Eq (2.6) is the kinetic energy operator for the
electrons, the second term is the potential energy due to the interaction between electrons and
14
nuclei, the third term is the electron-electron interaction, the fourth term is the kinetic energy
operator for the nuclei and the final term is the classical nuclei-nuclei interaction. The fourth
term is typically neglected according to the Born-Oppenheimer adiabatic approximation [76]
since the inverse mass of the nuclei 1/MI is very small. The total energy then is the expectation
value of the Hamiltonian [75],
E =
Ψ) H Ψ
Ψ Ψ (2.7)
This many-body problem is impossible to solve for realistic solids [75,78]. Many
approximations have been proposed to solve this problem, for example the Hartree [77] and the
Hartree-Fock approaches [79]. However, the Hatree approach ignores both exchange and
correlation effects [78], while the Hatree-Fock approach ignores the correlation effect [75]. The
exchange effect is due to the Pauli exclusion principle, which indicates that around a spin-up
(down) electron other nearby spin-up (down) electrons will be repelled. The correlation effect is
caused simply by electrostatic repulsion between electrons [78]. In order to tackle this difficulty,
Kohn and Sham [75,80] replaced the interacting many-body system with an independent-particle
system where all many-body effects arising from exchange and correlation are grouped into an
unknown exchange-correlation energy Exc. This approach leads to Kohn-Sham Schrodinger-like
equations [75,84]:
−
h2
2me
∇2 + Vext (r r ) + VHartree (
r r ) + Vxc (
r r )
⎛
⎝ ⎜
⎞
⎠ ⎟ ψ i(
r r ) = εiψi(
r r ) (2.9)
where ψi is the wave function of electronic state i, εi is the eigenvalue, Vext is the external
potential due to the nuclei and any other external fields, VHatree is the Hartree potential of the
electrons given by e2 n(
r r )
r r −
r ′ r
d3r∫ [84], where n( r r ) is the electronic density given by
2 ψi(
r r ) 2
i∑
15
[84]. The exchange-correlation potential, Vxc, is given by the functional derivative
δExc
δn(r r )
[84].
Vxc contains all quantum mechanical effects of the many-body problem and several well-known
approximations for Vxc exist. Equation (2.9) has the form of independent-particle equations with
a potential that must be found self-consistently with the resulting density. Equation (2.9) are
independent of any approximation to the exchange-correlation functional Exc, and would result in
the exact ground state energy and density for the interacting system provided the exact exchange-
correlation functional Exc were known.
Although the exact form of exchange-correlation functional is unknown, it can be
approximated as a local or nearly local functional of the electron density. Two well-known
approximations for the exchange-correlation functional are the local density approximation
(LDA) [80] and the generalized-gradient approximation (GGA) [80-83]. There are several
different parameterizations of the GGA. Two widely used are the form of Perdew and Wang
(PW91) [85] and the form of Perdew, Burke, and Enzerhof (PBE) [86]. In this thesis, we used
PBE for Ti-H system and PW91 for Ni-Al system.
2.2.1 The pseudopotential method
The Kohn-Sham approach transfers the many-body problems into an equivalent single-
particle problem. In general, there are many approaches to solving Kohn-Sham equations. The
most common today are linearized augmented plane wave (LAPW) [87] method and the
pseudopotential method [84,88]. The LAPW method is the most accurate and general method for
electronic structure calculations but it is computationally demanding. It combines localized and
delocalized basis sets for the electronic wavefunction. In this thesis we used a pseudopotential
16
method based on the projector augmented wave (PAW) method [89], which is fast and relatively
accurate compared to the LAPW approach.
The pseudopotential method typically uses a plane wave basis set for the electronic
wavefunctions and is based on the fact that physical properties of solids depend on the valence
electrons to a much greater extent than on the core electrons [75,84,88]. Thus, the
pseudopotential approach replaces the wavefunction near nuclei region with a smoother pseudo-
wavefunction in such a way that the valence states are reproduced, but the core states with rapid
variations are removed. This means that ionic potential and pseudopential are identical only
outside the core electron region [75,84,88]. This way, a much smaller number of plane-wave
basis functions are needed to expand the electronic wave function. As a variation based on the
pseudopotential approach, the projector augmented wave (PAW) approach retains the entire set
of all-electron core functions along with smooth parts of the valence functions. As a result the
PAW approach has the advantage of both pseudopotential method (fast) and full-electron method
(accurate) [75,89].
In this thesis, we perform the first-principle total energy calculations with the Vienna ab
initio simulation package (VASP) [90,91]. This code implements the PAW pseudopotentials
[89,92], which allows for plane wave expansions with significantly lower energy cutoffs than
traditional pseudopotentials meanwhile achieving a relatively high accuracy, making it possible
to investigate large and complicated systems.
2.3 Cluster expansion
As we have mentioned in section 2.1, in theory the energies of all possible microstates
should be calculated from first principle in order to obtain the thermodynamic properties of a
17
system. However, it is impossible to calculate all these energies from first principle due to the
huge number of them. So, we first calculated the energies of some configurations from first
principle using the method described in section 2.2, then using these energies to fit a model that
in turn can be used to calculate the energy of any configuration. This model is called cluster
expansion [1]. Furthermore, cluster expansion can capture the interaction among point defects
and atoms. This is very important for a system like B2-NiAl [93], which can accommodate high
concentration of many types of point defects and consequently the interaction among these point
defects cannot be neglected. Previous theoretical investigations of thermodynamic properties
such as equilibrium point defect concentration in B2-NiAl compound, while using a variety of
methods to calculate defect formation energies (ranging from empirical potential methods to
first-principles methods) always relied on a mean field approximation to estimate finite
temperature defect concentrations [42-44]. This approach neglects interactions among defects,
and is therefore valid only when defect concentrations are very low. Furthermore, it cannot
provide accurate predictions for the concentration of important diffusion mediating defect
complexes, whose existence is a result of interactions among point defects. Consequently, a
cluster expansion is needed to efficiently calculate energies of any configurations and to capture
interactions among atoms and defects.
2.3.1 Conventional cluster expansion.
We will use Ti-H system as an example to explain binary cluster expansion formalism
[94]. Assigning H atoms to interstitial sites in Ti host forms Ti-H hydrides. This means that an
interstitial site can be occupied by either H atom or a vacancy. It is useful to introduce the
occupation variable σi to each interstitial site that is +1(-1) if the interstitial site is occupied by H
18
atom (a vacancy). Consequently, by assigning an occupation variable σi to each interstitial
hydrogen site i within the Ti host, it is possible to uniquely specify a particular hydrogen-
vacancy configuration with the collection of occupation variable r σ = {σ i}. Although the
hydrogen atoms rarely reside exactly at these rigorously defined crystallographic sites, there is a
one-to-one correspondence between each hydrogen atom and a crystallographic site. Sanchez et
al. [1] showed that any property that depends on configuration could be expanded in terms of
polynomials of the discrete occupation variables σi. The dependence of the fully relaxed energy
on configuration, for example, then takes the form [1,93,94,106,107]
E(r σ ) = V0 + Viσ i + Vijσ iσ j + Vijkσ iσ jσ k +L
i, j ,k∑
i, j∑
i∑ , (2.10)
where the indices i, j, k… correspond to a collection of interstitial sites that form a cluster such as
a pair cluster, a triplet cluster, etc. The coefficients V0, Vij, and Vijk are called effective cluster
interactions (ECI) and are constants. Equation (2.10) is referred to as a cluster expansion.
Equation (2.10) can be viewed as a generalized Ising model Hamiltonian including not
only nearest neighbor pair interactions, but also all other pair and multibody interactions beyond
the nearest neighbors. Equation (2.10) extends over all possible clusters of sites. From a practical
point of view, however, it must be truncated after some maximal sized cluster, i.e. (2.10) is
useful if it converges rapidly and there exists a maximal cluster such that all ECI corresponding
to clusters larger than the maximal cluster are negligibly small. Experience indicates that
convergence depends on the particular system and in general, the lower order clusters such as
points or pairs within a limited range will have larger contribution than higher order clusters.
Although Ti host, which is fixed, does not contribute to the configurational degrees of freedom
and consequently there is no explicit reference to them in the cluster expansion, the cluster
expansion describes the energy of the whole crystal since in Eq. (2.10) E(r σ ) is the fully relaxed
19
energy of the whole crystal. The ECIs are simply linear expansion coefficients, which implicitly
incorporates complicated interactions among atoms and vacancies and it is difficult to give them
a simple physical interpretation.
2.3.2 Determination of ECI
The ECI of a cluster expansion of the configurational total energy E(r σ ) need be
determined from first principles. This then enables the calculation of thermodynamic properties
with, for example, Monte Carlo simulations. Several techniques have been used to determine
ECI from first principles, and most are based on a least squares fit of a truncated cluster
expansion to the first-principles energies of different configurations [2,70]. The ECI obtained
with this approach depends both on the truncation of Eq. (2.32) and on the selection of
configurations used in the fit.
The cross-validation (CV) score is a useful criterion in selecting an optimal set of clusters
[6]. The CV score is a measure of the ability of the cluster expansion to predict energies not
included in the fit. There are different definitions of the CV score: the leave-one-out CV (LOO-
CV) and the leave many out in which Monte Carlo sampling is used, which is called Monte
Carlo CV (MCCV) [100,101]. Many investigations have shown that the performance of MCCV
is better than LOO-CV in general. Especially, Shao pointed out that LOO-CV is too conservative
in the sense that it tends to select unnecessarily large model and the performance of Monte Carlo
Leave-Many-Out CV (MCCV) is stable and much better than LOO-CV [101]. This indicates that
LOO-CV tends to select much more clusters many of which are not necessary than MCCV does.
In this thesis, we will use the Monte Carlo CV to select the optimal cluster model unless it is
impossible to explore it in the case where we have few energies to fit the model and LOO-CV is
20
used under this situation.
Suppose the energies of n configurations have been calculated from first principles. The
algorithm involves the random removal of nv configurations from the sample followed by a fit of
the ECI to the remaining nc structures. This procedure is repeated b times. The definition of the
MCCV score is
(MCCV)2 =
1nvb
ˆ E r σ ( )− E
r σ ( )( )2
r σ
nc
∑ , (2.11)
where Er σ ( ) is the calculated first-principles energy of a structure having a configuration
r σ , and
ˆ E
r σ ( ) is the cluster expansion predicted energy of
r σ . Since it is impossible to enumerate all
possible combinations of clusters, we search for an optimal set by using a genetic algorithm
[102]. In this algorithm, a bunch of combinations of clusters were initially randomly generated to
form a pool (parents pool). Then the MCCV score was evaluated for each combination in the
pool. Based on these MCCV scores, a fraction of combinations that have best MCCV were
retained to the next generation and the rest were replaced by the same number of new
combinations (children), which were formed by the mating of parents. In the mating process, the
parent with better MCCV score has the higher probability of passing its gene bit (inclusion of a
specific cluster or not) on to the child than the parent with worse MCCV score. In this way, the
preferred transfer of better genetic information is ensured. Once the new parent pool was formed,
the same procedure was repeated.
The algorithm implemented in this work uses a slightly different criterion to pick clusters
than that of Hart et al [102]: pairs are chosen in the order of their length while only triplet,
quadruplet and larger clusters are chosen if their largest inter-site distance is less than the largest
pair already included in the expansion. Once the optimal set of clusters is obtained, we use the
21
energies of all n structures to obtain the values for the optimal ECI. The resultant ECI can then
be implemented in Monte Carlo simulations to calculate finite temperature free energies.
2.3.3 Local cluster expansion
Although in theory we can use conventional cluster expansion to evaluate the
configurational total energy for any configuration of a multi-component solid such as ternary
system, it sometimes becomes intractable and unnecessary. For example, While B2 NiAl is a
binary alloy; the presence of large vacancy concentrations on the Ni sublattice suggests that it
should be treated as a ternary system to accurately account for all relevant configurational
degrees of freedom [103]. However, a ternary cluster expansion means we will encounter a large
number of configurations (if there are M crystal sites, then each site can be occupied by 3
possible elements so there are 3M possible configurations) and most of them are unnecessary for
the B2-NiAl compound given its specific defect character (e.g. the configurations with large
concentration of aluminum vacancies are unnecessary since aluminum vacancies are very dilute
in B2-NiAl alloy).
We can avoid an explicit ternary cluster expansion of the configurational energy of B2-
NiAl by taking advantage of available insight about the dominant defects of this compound. As
we have mentioned in the chapter 1, although Al atoms can occupy the Ni sublattice, they do so
very rarely and the overwhelming majority of defects on this sublattice are vacancies, which can
reach concentrations of several percent in Al-rich B2 compounds [41-43]. The Al sublattice, in
contrast, only accommodates vacancies at very low concentrations while its Ni concentration can
be substantial [41-43]. On each sublattice, we can therefore distinguish between dominant
components (Ni and vacancies on the Ni-sublattice, Al and Ni on the Al-sublattice) and minor
22
defects (Al on the Ni sublattice, vacancies on the Al sublattice). The interactions among the
dominant components are conveniently captured with a binary cluster expansion Eq. (2.10), in
which to each Ni-sublattice site i, we assign the occupation variable τi, which is +1 if the site is
occupied by Ni and -1 if it is vacant; to each Al-sublattice site j, we assign the occupation
variable δj, which is +1 if it is occupied by Ni and -1. If the concentrations of the minor defects
are sufficiently low that they rarely if ever interact with each other, we can account for their
configuration dependent formation energies with a local cluster expansion [97,104,105].
Local cluster expansions can supplement the binary coupled-sublattice cluster expansion
to describe the configurational energy of B2-NiAl in the presence of minor defects [93]. While
interactions among minor defects do not need to be accounted for, interactions between a minor
defect and the dominant components of both sublattices of B2-NiAl are important, as the minor
defect will energetically prefer particular local arrangements and concentrations of the dominant
components over others. Consider, for example, the presence of an isolated vacancy on the Al
sublattice [93]. A convenient quantity to parameterize with a local cluster expansion is an
effective minor-defect formation energy [93,97]:
ΔEi
VAl = EiVAl (
r σ ) −
12
[EiAlAl (
r σ ) + Ei
NiAl (r σ )] (2.12)
where EiVAl (
r σ ) is the energy of the crystal with configuration
r σ but with a vacancy, VAl,
occupying site i of the Al sublattice. The energies EiAlAl (
r σ ) and Ei
NiAl (r σ ) are of the crystal with
configuration r σ but with site i of the Al sublattice occupied by Al and Ni respectively. Both
EiAlAl (
r σ ) and Ei
NiAl (r σ ) can be calculated with the binary coupled-sublattice cluster expansion,
Eq. (2.10). The effective minor-defect formation energy ΔEiVAl depends only on the arrangement
23
of Ni, Al and vacancies around site i and can therefore be parameterized with a local cluster
expansion according to
ΔEiVAl (
r σ ) = Lo + L jσ j
j
∑ + L jkσ jσ k
j,k
∑ + ... (2.13)
where the sum over j, k, … extends over sites of clusters of B2-NiAl that do not include site i
occupied by the minor defect. To calculate the energy of the B2-NiAl crystal with a vacancy on
the Al sublattice, we can rearrange Eq. (2.12) to isolate EiVAl (
r σ ) and evaluate ΔEi
VAlv σ ( ) with the
local cluster expansion, Eq. (2.13), and
12
[EiAlAl (
r σ ) + Ei
NiAl (r σ )] with the binary coupled-sublattice
cluster expansion, Eq. (2.10). A similar approach applies to the minor defect, Al, on the Ni-
sublattice.
It should be noted that the cluster expansion technique is likely to fail if the magnitude of
relaxation of many configurations is large, that is, the relaxed configuration is significantly
deviated from the original unrelaxed structure. If this happens, the error of the fitting tends to be
large and the cluster expansion loses its predictive ability.
2.4 Monte Carlo method
2.4.1 Conventional Monte Carlo simulation
The first-principles parameterized cluster expansion can be used in grand canonical
Monte Carlo simulation to predict finite temperature thermodynamic properties, including the
phase diagram, the equilibrium concentration of point defects as well as the concentration and
nature of defect clusters. A Monte Carlo simulation samples various configurations with
probability given by the Eq. (2.1). However, it is not computationally feasible to sum the
exp(−Es /kBT) so as to determine Z. Fortunately, by using the Hastings-Metropolis algorithm we
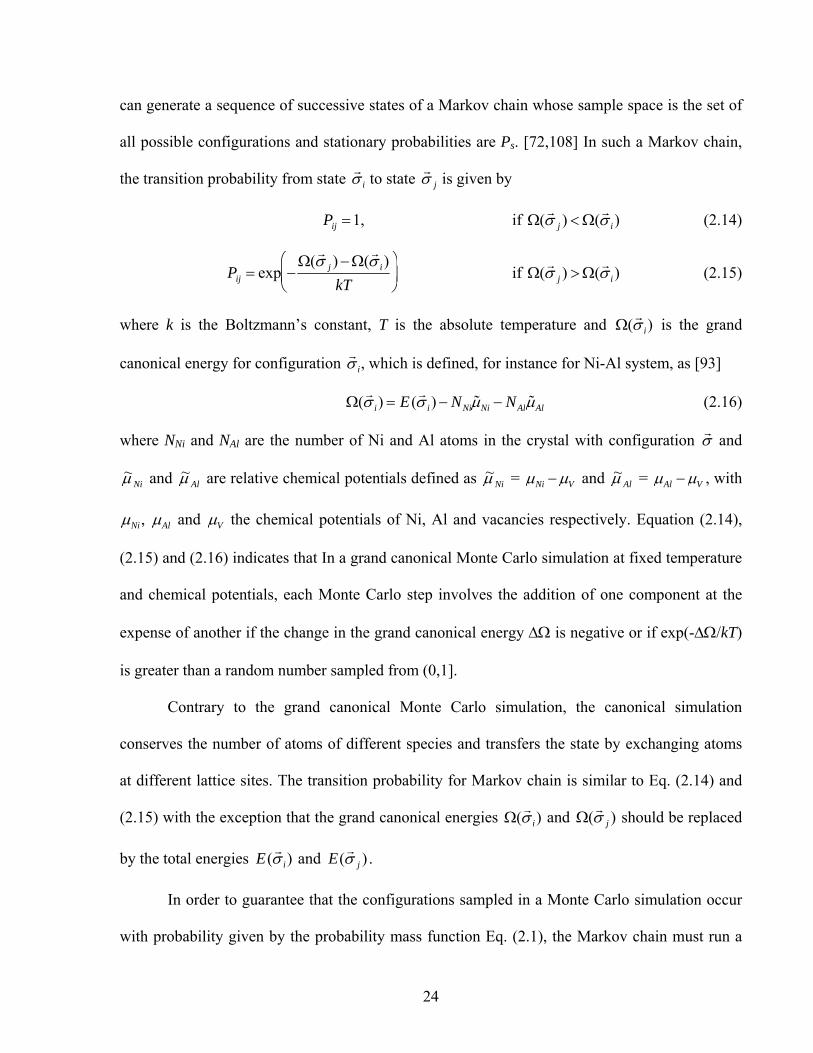
24
can generate a sequence of successive states of a Markov chain whose sample space is the set of
all possible configurations and stationary probabilities are Ps. [72,108] In such a Markov chain,
the transition probability from state r σ i to state
r σ j is given by
Pij =1, if Ω(r σ j ) < Ω(
r σ i) (2.14)
Pij = exp −
Ω(r σ j ) − Ω(
r σ i)
kT⎛
⎝ ⎜
⎞
⎠ ⎟ if Ω(
r σ j ) > Ω(
r σ i) (2.15)
where k is the Boltzmann’s constant, T is the absolute temperature and Ω(r σ i) is the grand
canonical energy for configuration r σ i, which is defined, for instance for Ni-Al system, as [93]
Ω(r σ i) = E (
r σ i) − NNi ˜ μ Ni − NAl ˜ μ Al (2.16)
where NNi and NAl are the number of Ni and Al atoms in the crystal with configuration r σ and
Niμ~ and Alμ~ are relative chemical potentials defined as Niμ~ = μNi − μV and Alμ~ = μAl − μV , with
μNi, μAl and μV the chemical potentials of Ni, Al and vacancies respectively. Equation (2.14),
(2.15) and (2.16) indicates that In a grand canonical Monte Carlo simulation at fixed temperature
and chemical potentials, each Monte Carlo step involves the addition of one component at the
expense of another if the change in the grand canonical energy ΔΩ is negative or if exp(-ΔΩ/kT)
is greater than a random number sampled from (0,1].
Contrary to the grand canonical Monte Carlo simulation, the canonical simulation
conserves the number of atoms of different species and transfers the state by exchanging atoms
at different lattice sites. The transition probability for Markov chain is similar to Eq. (2.14) and
(2.15) with the exception that the grand canonical energies Ω(r σ i) and Ω(
r σ j ) should be replaced
by the total energies E(r σ i) and E(
r σ j ) .
In order to guarantee that the configurations sampled in a Monte Carlo simulation occur
with probability given by the probability mass function Eq. (2.1), the Markov chain must run a
25
relatively long time before entering stationary state. Once it enters the stationary state, the
metropolis algorithm guarantees that the configurations sampled occur with a probability given
by the probability mass function (2.1), which is just the limit probability of the corresponding
Markov chain. Hence thermodynamic properties such as the equilibrium point defect
concentration can be obtained as simple arithmetic averages over the sampled configurations. In
practice, in order to guarantee the Markov chain enters stationary state, several thousand MC
steps are performed before the averaging.
The relative chemical potentials ˜ μ i in Eq. (2.16) arise from the constraint in grand
canonical Monte Carlo simulations that the number of crystal sites, M, remains fixed (i.e. NV=M-
NNi-NAl). The relative chemical potentials Niμ~ and Alμ~ serve as thermodynamic boundary
conditions and are explicitly controlled in grand canonical Monte Carlo simulations.
When relating results from grand canonical Monte Carlo simulations to experiment, it is
necessary to use thermodynamic boundary conditions that are consistent with experiment. In
actual samples of B2-NixAl1-x alloys, with x= NNi NNi + NAl( ), the experimentally controlled
variables are usually NNi and NAl as opposed to fixed number of crystal sites, M and fixed Ni and
Al chemical potentials. Under experimental conditions, the number of crystal sites is not fixed
and can vary through the creation or annihilation of vacancies at climbing dislocations, grain
boundaries and surfaces. As a vacancy is a non-conserved species in a fully equilibrated solid, its
chemical potential μV must be zero (provided vacuum is used as the vacancy reference state).
The concentration of defects in B2-NiAl using grand canonical Monte Carlo simulations must
therefore be calculated under the constraint that μV=0. Appendix A shows how values for Niμ~
and Alμ~ can be determined consistent with the constraint that μV=0.
26
2.4.2 Free energy integration
A prediction of phase stability and the construction of phase diagram require a
comparison of free energies of different phases at finite temperature. Free energies can be
obtained from the results of Monte Carlo simulations by integrating the chemical potential. We
will take the example of Ni-Al system to describe the procedure, which is contained in the
Appendix A.
2.4.3 Kinetic Monte Carlo (KMC) simulation
The Monte Carlo simulation mentioned above is used to predict the equilibrium
thermodynamic properties. In order to investigate the kinetic properties such as tracer diffusion
coefficient for a crystal, kinetic Monte Carlo simulation is a powerful tool.
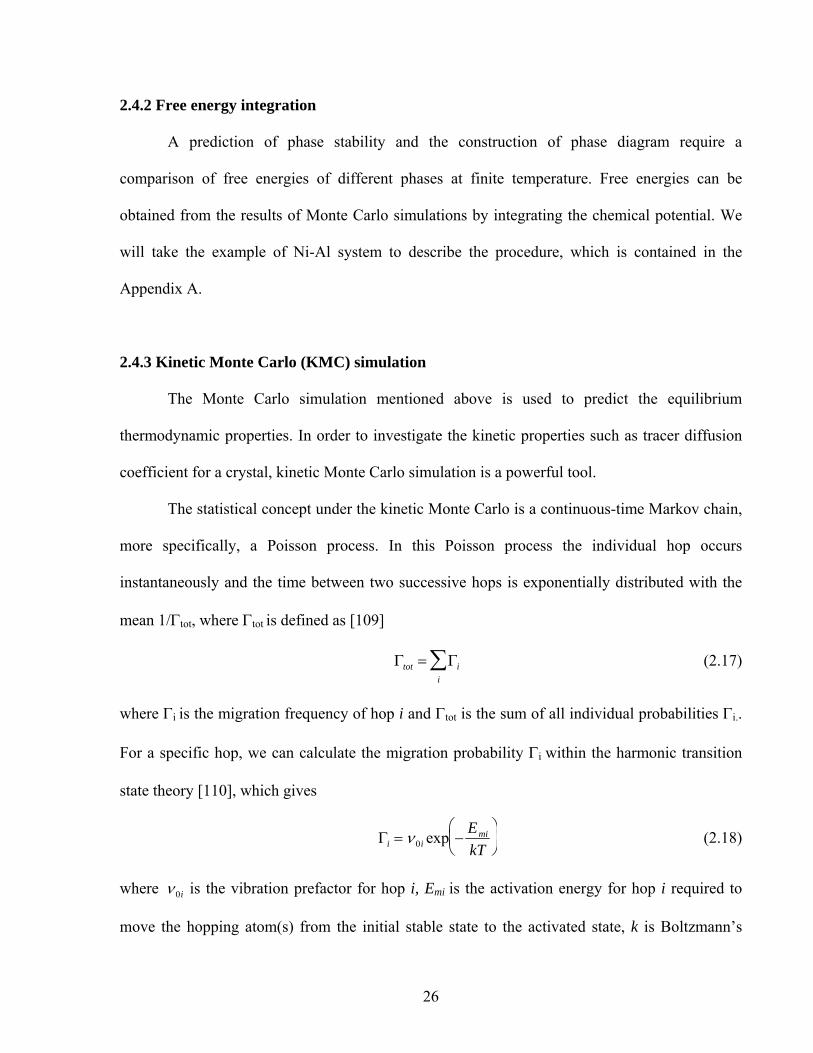
The statistical concept under the kinetic Monte Carlo is a continuous-time Markov chain,
more specifically, a Poisson process. In this Poisson process the individual hop occurs
instantaneously and the time between two successive hops is exponentially distributed with the
mean 1/Γtot, where Γtot is defined as [109]
Γtot = Γii
∑ (2.17)
where Γi is the migration frequency of hop i and Γtot is the sum of all individual probabilities Γi..
For a specific hop, we can calculate the migration probability Γi within the harmonic transition
state theory [110], which gives
Γi = ν 0i exp −Emi
kT⎛ ⎝ ⎜
⎞ ⎠ ⎟ (2.18)
where ν 0i is the vibration prefactor for hop i, Emi is the activation energy for hop i required to
move the hopping atom(s) from the initial stable state to the activated state, k is Boltzmann’s
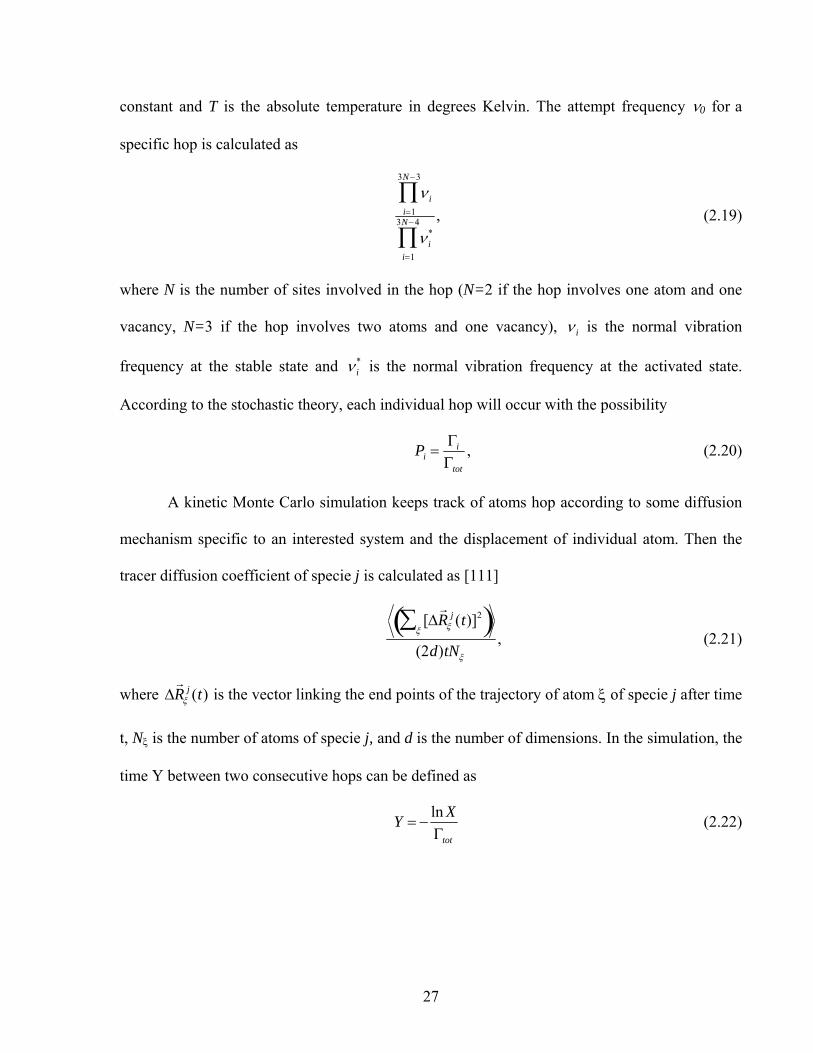
27
constant and T is the absolute temperature in degrees Kelvin. The attempt frequency ν0 for a
specific hop is calculated as
ν ii=1
3N−3
∏
ν i*
i=1
3N−4
∏, (2.19)
where N is the number of sites involved in the hop (N=2 if the hop involves one atom and one
vacancy, N=3 if the hop involves two atoms and one vacancy), ν i is the normal vibration
frequency at the stable state and ν i* is the normal vibration frequency at the activated state.
According to the stochastic theory, each individual hop will occur with the possibility
Pi =Γi
Γtot
, (2.20)
A kinetic Monte Carlo simulation keeps track of atoms hop according to some diffusion
mechanism specific to an interested system and the displacement of individual atom. Then the
tracer diffusion coefficient of specie j is calculated as [111]
[Δr R ξ
j (t)]2
ξ∑( )(2d)tNξ
, (2.21)
where Δr R ξ
j (t) is the vector linking the end points of the trajectory of atom ξ of specie j after time
t, Nξ is the number of atoms of specie j, and d is the number of dimensions. In the simulation, the
time Y between two consecutive hops can be defined as
Y = −ln XΓtot
(2.22)
28
where X is a uniformly distributed random variable between (0,1]. It ban be easily proved that Y,
which is defined by Eq. (2.22), is an exponentially distributed random variable with the mean
1/Γtot .
2.5 Vibrational free energy
As we have mentioned in section 2.1, due to the low mass of hydrogen atoms, zero-point
vibrational energy can be important in Ti-H system. The simultaneous treatment of
configurational and vibrational degrees of freedom is possible with a coarse graining procedure
[112,113], where instead of cluster expanding the fully relaxed configurational energy Er σ ( ), a
coarse grained free energy, Gr σ ,T( ), is cluster expanded. G
r σ ,T( ) accounts for vibrational and
possibly electronic excitations, but is constrained to a fixed hydrogen-vacancy configuration r σ .
Neglecting electronic excitations. Gr σ ,T( ) can be calculated within the quasi-harmonic
approximation using first-principles phonon densities of states for the solid having a configuration
r σ [113]. Phonon densities of states are accessible from first principles either with a linear
response method [114] or a frozen phonon approach in which force constants are extracted from
calculations of restoring forces on perturbed atoms within supercells [113,115]. The vibrational
free energy at fixed volume, V, is related within the harmonic approximation to the vibrational
density of states, g ν,r σ ,V( ), according to [113]:
Fvib (
r σ ,T,V ) = kBT ln 2sinh hv
2kBT⎛ ⎝ ⎜
⎞ ⎠ ⎟
⎡
⎣ ⎢ ⎤
⎦ ⎥ ∫ g(v,r σ ,V )dv (2.23)
where ν is a vibrational frequency. Within the quasi-harmonic approximation, the coarse-grained
free energy Gr σ ,T( ) is set equal to the minimum of Fvib
r σ ,T,V( ) with respect to V (i.e. the pressure
is assumed to be zero). The ability to perform this coarse graining procedure, however, rests on
the assumption that each arrangement of atoms is mechanically stable and exhibits minimal
29
anharmonicity with respect to vibrational degrees of freedom. It will emerge that fcc based TiH2-z
exhibits important anharmonicity with respect to homogeneous tetragonal strain, indicating that a
standard coarse graining scheme may not be sufficient to capture all relevant degrees of freedom
in this system. We will argue that additional thermal excitations involving local strain fluctuations
are likely to also contribute to the thermodynamic properties of TiH2-z.
In this thesis, the vibrational free energies were calculated with a force-constant spring
model. The force constants were extracted from first-principles GGA calculations of the restoring
forces due to atomic perturbations within supercells using the FITFC code of the Alloy Theoretic
Automated Toolkit.
30
Figure 2-1 Crystal structure of B2-NiAl compound
31
Chapter 3
First-principles investigation of phase stability in interstitial metal-hydride: The Ti-H system
In this chapter, we will investigate various factors that affect metal-hydride phase
stability from first principles. As a particular example, we consider hydride stability in the Ti-H
system, exploring the role of configurational degrees of freedom, zero-point vibrational energy
as well as coherency strains. We will show that the tetragonal γ-TiH phase is predicted (within
GGA) to be unstable relative to hcp Ti (α phase) and the fcc based δ-TiH2. Due to the light mass
of hydrogen atom, zero point vibrational energy significantly affects the formation energies in
this system and makes the γ phase even less stable relative to hcp Ti and δ-TiH2. The effect of
stress and strain on the stability of the γ phase is also investigated showing that coherency strains
between hydride precipitates and the hcp Ti matrix stabilize γ-TiH relative to α-Ti and δ-TiH2,
explaining why it is observed experimentally. We also find that hydrogen prefers octahedral sites
at low hydrogen concentration and tetrahedral sites at high concentration. Both harmonic
vibrational as well as electronic origins for the cubic to tetragonal phase transformation of TiH2
are investigated and we argue that anharmonic vibrational degrees of freedom are likely to play
an important role in stabilizing cubic TiH2.
A simultaneous treatment of configurational degrees of freedom and vibrational
excitations is computationally very demanding, as it would require the first-principles calculation
32
of phonon densities of states of many different hydrogen-vacancy configurations over the
interstitial sites of Ti to determine the coarse grained free energies Gr σ ,T( ) for each
configuration. Furthermore, as will be illustrated, the Ti-H system exhibits strong anharmonicity
with respect to homogeneous strain indicating that long wavelength strain fluctuations may
contribute to the thermodynamic properties of this system. Such excitations cannot be accounted
for with the coarse graining scheme described above [112], which treats vibrational excitations
within the quasi-harmonic approximation. We therefore investigate configurational and
vibrational degrees of freedom independent of each other to derive qualitative insight about the
importance of configurational entropy, zero-point vibrational energy and coherency strain on the
stability of γ-TiH relative to hcp Ti and TiH2.
3.1 Configurational degrees of freedom
3.1.1 Formation energies and relative stability of host structures
An investigation of phase stability in the Ti-H system must start with a consideration of
the likely host structures that can accommodate hydrogen insertion. In this thesis, we focused on
the hcp and fcc Ti hosts. While bcc Ti is observed at high temperature, it is predicted to be
mechanically unstable from first-principles, raising fundamental questions about the true nature
of this high-temperature phase [1]. Within the hcp and fcc hosts, hydrogen can reside in either
octahedral or tetrahedral sites. For each Ti atom in the hcp and fcc structures, there are two four-
coordinated tetrahedral sites and one six-coordinated octahedral site (see Fig. 3-1).
We calculated the energy of a variety of different hydrogen-vacancy configurations
over the interstitial sites of both hcp Ti and fcc Ti using density functional theory within the
generalized gradient approximation (Perdew-Burke-Ernzerhof parameterization of the exchange

33
correlation potential) as implemented in the VASP plane-wave pseudopotential code [90,91].
The core-electron interactions were treated with the projector augmented wave (PAW) method
[89,92] and a plane-wave basis set cutoff energy of 400eV was used. The k point-grids were
sampled with the Monkhorst and Pack method [116] and partial occupancy at the Fermi level
was treated with the method of Methfessel and Paxton [117]. The ionic positions and the lattice
parameters of each structure were fully relaxed. Convergence tests of the energy with respect to k
point grids indicated that k-point sampling errors are less than 5 meV per TiH3x formula unit.
Formation energies of the low energy configurations are illustrated in Fig. 3-2 in which
fcc Ti and δ-TiH2 (all tetrahedral sites filled with hydrogen) are used as reference states and each
formation energy, ΔE x( ), for a particular configuration having formula TiH3x is defined as
ΔE x( )= E x( )−32
x • ETiH2
δ − 1−32
x⎛ ⎝ ⎜
⎞ ⎠ ⎟ • ETi
fcc (3-1)
where E x( ) is the total energy per crystal site for the same configurations of TiH3x calculated
from first-principles (with DFT-GGA using VASP) while ETiH2
δ and ETifcc are the first-principles
energies per atom of δ-TiH2 and fcc Ti crystal.
For pure Ti, we find that hcp Ti is more stable than fcc Ti by 55 meV/atom and more
stable than bcc by 109 meV/per atom. This result is consistent with the experimental observation
that hcp α-Ti is observed at room temperature. Hydrogen insertion, though, leads to a
stabilization of fcc relative to hcp. At the stoichiometric TiH2 composition the lowest energy
configuration is one in which hydrogen fills all tetrahedral sites (a CaF2 structure). This structure
corresponds to the experimentally observed δ-TiH2. The cubic TiH2 structure can further lower
its energy by 6 meV per Ti through a tetragonal distortion, which corresponds to the
experimentally observed low temperature ε-TiH2 phase. At intermediate concentration, an
34
ordered phase with composition TiH is energetically favored relative to fcc Ti and δ-TiH2,
however, not stable enough to make it a ground state relative to hcp α-Ti and δ-TiH2 (i.e. its
energy is above the dashed line in Fig. 3-2) or hcp α-Ti and ε-TiH2 (i.e. its energy is above the
solid line in Fig. 3-2). In this low energy TiH phase, the H atoms occupy half the tetrahedral sites
as illustrated in Fig. 3-2. This H-ordering is the same as that reported for the γ-TiH phase
observed experimentally but believed to be metastable [35]. The particular H-ordering within γ-
TiH leads to a face center tetragonal (fct) unit cell with a calculated c/a ratio of 1.1. The
experimental c/a ratio is 1.093 [35]. A summary of calculated lattice parameters for several
phases is presented in Table 3-1. The consistency with experiment is satisfactory [35,37,118].
Several TiH3x structures with compositions close to stoichiometric TiH2 exhibit
peculiar mechanical instabilities and a strong degree of anharmonicity with respect to
homogeneous strains. The energy of TiH2 as a function of the c/a ratio, for example, is illustrated
in Fig. 3-3(a). The energy curve displays two local minima, one with c/a>1 and the other with
c/a<1. The minimum at c/a<1 has the lowest energy and corresponds to the ε phase observed
experimentally below room temperature [34]. The difference in energy between cubic TiH2 and
tetragonal TiH2 is predicted within GGA to be ~6meV per Ti atom. Surprisingly, the cubic form
of TiH2 (c/a=1), which appears experimentally above ~300 K [34], is predicted to be
mechanically unstable at zero Kelvin. Similar curves were predicted by Wolf and Herzig for
TiH2 and ZrH2 and by Ackland for ZrH2 [119]. The calculations of Wolf and Herzig [120],
performed with FLAPW using LDA with the Hedin and Lundquist parameterization, however,
predicted the tetragonal variant with c/a>1 to be more stable than the c/a<1 variant. The
discrepancy between their results and those predicted here can likely be attributed to a difference
in the parameterization of the exchange correlation potential. Indeed, we recalculated the energy
35
versus c/a with a variety of k-point meshes ranging from 8x8x8 to 24x24x24 for the non-
primitive cubic TiH2 unit cell to rule out errors due to poor k-point sampling. For all k-point
meshes, the c/a <1 tetragonal variant has the lowest energy. We also found that LDA based on
the Perdew-Zunger parameterization of the exchange correlation predicts the tetragonal variant
with c/a <1 to have the lowest energy.
Similar mechanical instabilities with respect to a homogeneous tetragonal distortion
were found for other H-vacancy configurations in fcc Ti with compositions close to TiH2.
Figures 3-3(b) and 3-3(c) illustrate the energy for two off-stoichiometric compounds as a
function of the c/a ratio. The difference between the mechanically unstable cubic form and a
stable tetragonal variant as hydrogen vacancies are added to TiH2 was always found to be less
than 3 meV per Ti. The mechanical instabilities of hydrogen rich cubic TiH2-z configurations
complicate a rigorous description of the finite temperature excitations that determine the
thermodynamic properties of this system. The strong anharmonicity with respect to
homogeneous strain indicates that long wavelength strain fluctuations are easily excited, thereby
contributing to finite temperature free energies that determine phase stability. Such excitations
were not explicitly investigated in this thesis.
3.1.2 Cluster expansion and statistical mechanics for the fcc and hcp hosts
The formation energies in Fig. 3-2 show that the hcp Ti host rapidly becomes unstable
relative to the fcc Ti host as hydrogen is inserted. This indicates that the hydrogen solubility
within α-Ti (hcp) will be dilute and that the relevant thermodynamic properties of this phase can
be treated with an ideal solution model in which interactions between different hydrogen atoms
are neglected. For fcc Ti, however, non-dilute hydrogen interactions are important and a cluster
36
expansion is necessary to parameterize the formation energies for the different hydrogen-
vacancy configurations in this host.
A cluster expansion for the fcc host structure was constructed by fitting Eq. 2.10 to
formation energies of 65 different H-vacancy configurations within the fcc host with the largest
supercell containing four TiH3x. By minimizing the MCCV using a genetic algorithm, an optimal
set of clusters was selected from a total of 79 candidates. The set includes 1 empty cluster, 2
points (for the tetrahedral and octahedral sites), 6 pairs, 4 triplets and 5 quadruplets and the
values of their ECI are illustrated in Fig. 3-4. The root-mean-square (rms) error with respect to
the structures used in the fit is 8 meV per TiH3x formula unit and the Leave-One-Out CV (LOO-
CV) is 16 meV per TiH3x formula unit. The cluster expansion correctly predicts γ−TiH and δ-
TiH2 to be ground states when considering only hydrogen-vacancy configurations over the
interstitial sites of fcc Ti.
It should be noted that the use of a cluster expansion for the cubic fcc based TiH3x is not
strictly rigorous, as this phase is mechanically unstable with respect to a tetragonal distortion for
hydrogen compositions close TiH2 (see Fig. 3-3 and section 3.1.1). However, as noted above, the
difference in energy between the cubic phase and the mechanically stable tetragonal variants in
TiH2-z was found to be less than 3 meV per Ti, except for TiH2, for which the difference is 6 meV
per Ti. As these differences in energy are very small and are of the order of typical numerical
errors due to k-point sampling, we believe that the cluster expansion of Fig. 3-4 should provide a
sufficiently accurate description of the configurational energy of cubic TiH2-z observed
experimentally above 300 K [34].
In the parameterization of the cluster expansion for fcc TiH3x, we used fully relaxed
energies for each of the 65 H-vacancy configurations. The relaxed energies were determined
37
with an automated relaxation procedure (i.e. conjugate gradient method within VASP). We point
out, though, that this approach is not always guaranteed to find the lowest energy (mechanically
stable) distortion due to symmetry constraints of the prerelaxed structure. In this work, for
example, we relaxed each configuration starting with a cubic Ti-fcc host. If the H-vacancy
arrangement preserves this symmetry, the relaxed structure will also be cubic and will not
spontaneously relax to a mechanically stable tetragonal variant. The H-vacancy configurations
that do not preserve cubic symmetry will spontaneously distort, however, the relaxed distortion
may not correspond to the lowest energy tetragonal variant for that configuration. An analysis of
the vibrational degrees of freedom (section 3.2) of a subset of the 65 relaxed H-vacancy
configurations used in the fit of the cluster expansion showed that several of these configurations
are mechanically unstable with respect to a tetragonal distortion. The use of relaxed input
energies that do not always correspond to the lowest energy distortion can contaminate the fit of
a cluster expansion, leading to a reduction in its ability to predict the energies of configurations
not included in the fit. However, since the difference between stable tetragonal distortions and
cubic TiH2-z ranges between 3-6 meV per Ti, we expect only a marginal increase in accuracy if a
more consistent set of input energies were used in the fit of the cluster expansion (obtained e.g.
by manual relaxation of each of the 65 configurations to find the lowest energy distortion).
The cluster expansion of the H-vacancy configurational energy in fcc Ti was
implemented in Monte Carlo simulations in the grand canonical ensemble. A Monte Carlo cell
containing 512 unit cells (1536 interstitial sites as there are two tetrahedral sites and one
octahedral site per unit cell) was used. At each temperature and chemical potential, 1000 Monte
Carlo passes per site were performed after which averaging occurred over 2000 Monte Carlo
passes. The relative stability between fcc and hcp hosts as a function of hydrogen concentration
38
can be determined by a comparison of their free energies. For the fcc host, the free energies were
calculated by integrating the chemical potential obtained from Monte Carlo simulations, starting
from reference states where the free energy is known (e.g., at x=0 in TiH3x for which the
configurational entropy is zero [4] or in ordered phases at low temperature where the free energy
can be calculated with a low-temperature expansion [10].)
Due to the low hydrogen solubility in hcp Ti, we can accurately describe the free energy
of α-TiH3x with an ideal solution model (in which interactions among hydrogen atoms are
neglected). The details can be found in Appendix B of this thesis. The change in energy upon
adding an isolated hydrogen to either a tetrahedral or octahedral site in hcp Ti was calculated in a
36 atom supercell (comparisons with similar calculations in a 96 atom supercell showed that the
36 atom supercell is sufficiently large to approximate the dilute limit). The ideal solution free
energy for interstitial occupancy in hcp Ti has one internal degree of freedom at fixed hydrogen
concentration with respect to octahedral versus tetrahedral site occupancy. The relative hydrogen
occupancy between octahedral and tetrahedral sites as a function of T and hydrogen
concentration was determined by minimizing the ideal solution free energy with respect to this
internal degree of freedom.
3.1.3 Phase diagram
Two calculated phase diagrams are illustrated in Fig. 3-5. Fig. 3-5(a) shows a metastable
phase diagram of TiH3x over the fcc host only. Figure 3-5(b) shows the phase diagram of TiH3x
calculated by comparing free energies over both the fcc and hcp hosts, with the vertical dash line
representing the stoicheometric TiH2. Considering only the fcc host structure, Fig. 3-5(a) shows
that two hydrides are stable: the γ hydride (TiH) and the δ hydride (TiH2). The γ hydride is
39
predicted to be stable only at low temperature, decomposing through a peritectoid reaction at
around 450K. This γ hydride corresponds to the face centered tetragonal TiH phase observed
experimentally [35]. The δ-TiH2 hydride, in which H occupies the tetrahedral interstitial sites of
the fcc Ti host, can tolerate a large degree of off-stoichiometry, accommodated by H-vacancies.
When considering relative stability over both the fcc and hcp host structures (below
~700K), as illustrated in Fig. 3-5(b), only the δ-TiH2 hydride remains stable. A large two-phase
coexistence region exists between δ-TiH2 and α hcp Ti, the latter characterized by a very dilute
H solubility limit. Not included in the calculated phase diagrams is the cubic to tetragonal
transition that occurs upon cooling TiH2 to low temperatures. This transition will be discussed in
section 3.3.
Experiments by Numakura and Koiwa [35] demonstrated the existence of γ-TiH
precipitates within the α phase matrix in a Ti-3 at. % H specimen. The calculated phase diagram,
however, predicts that γ-TiH is metastable with respect to α-Ti and δ-TiH2. Figure 3-2 shows
that the formation energy of γ-TiH lies above the common tangent to the formation energies of α
hcp Ti and δ-TiH2. The Monte Carlo simulations show that the degree with which γ-TiH is
unstable relative to α hcp Ti and δ TiH2 increases substantially with temperature. As the
temperature is raised, the free energy of δ-TiH2 decreases more rapidly than that of γ-TiH as a
result of the additional configurational entropy arising from vacancy disorder in off-
stoichiometric δ-TiH2-z. This is clearly illustrated by the calculated free energy curves of the α,
δ, and γ phases as a function of H concentration at various temperatures (Fig. 3-6). While the
free energy of γ at low temperature lies below the common tangent to fcc Ti and δ-TiH2, it is
well above the common tangent to the free energies of α hcp Ti and δ-TiH2. Above 450K (the
40
peritectoid temperature in Fig. 3-5(a)), the γ-TiH phase disappears altogether. These results show
that when considering only configurational degrees of freedom, the γ-TiH hydride is predicted
(within the first-principles GGA approach) to be unstable at finite temperature. Other factors,
including vibrational degrees of freedom or coherency strain may alter the stability of γ-TiH
relative to α hcp Ti and δ-TiH2 and thus show that the observations of γ-TiH by Numakura and
Koiwa [35] is thermodynamically driven and not due to kinetic factors. This will be explored in
subsequent sections.
3.1.4 Site occupancy
Both the fcc and hcp hosts offer tetrahedral and octahedral interstitial sites for H-
occupancy. The first-principles GGA calculations of formation energies of the different H-
vacancy arrangements over the interstitial sites of fcc and hcp show that the preference for
tetrahedral and octahedral sites depends on the overall hydrogen concentration. At low H
concentration, H prefers octahedral interstitial sites in both hcp Ti and fcc Ti, while at high
concentration, H prefers the tetrahedral interstitial sites in the fcc host. This result persists at
finite temperature as predicted both by the dilute solution model for the hcp host and the Monte
Carlo simulations for the fcc host. For the hcp host with dilute H, the octahedral site is more
stable than the tetrahedral site by 76 meV. For the fcc Ti host, the site occupancy, which is
defined as the number of H in a particular type of interstitial site divided by the total number of
that type of interstitial site, can be extracted from the Monte Carlo simulations. Figure 3-7
illustrates the site occupancy as a function of H concentration at 300K and 600K for the fcc Ti
host. As is evident from Fig. 3-7, H prefers the octahedral sites at low concentration, while it
prefers the tetrahedral sites at high H concentration, although at 600K some octahedral
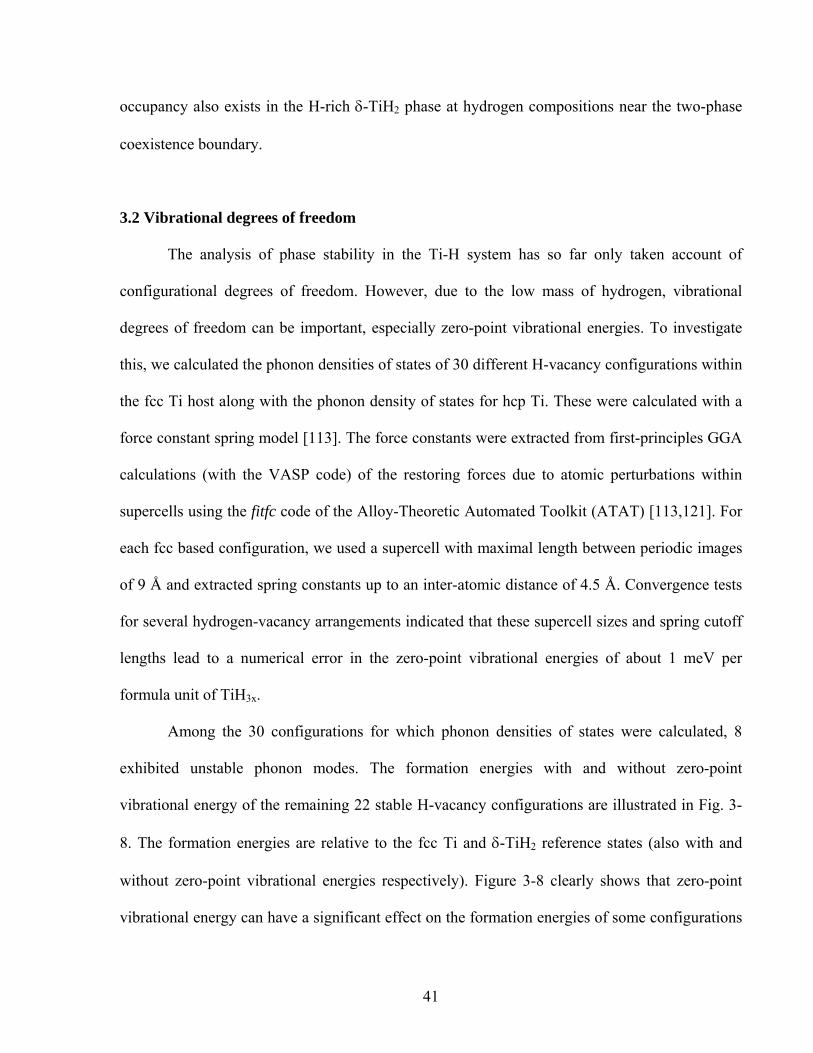
41
occupancy also exists in the H-rich δ-TiH2 phase at hydrogen compositions near the two-phase
coexistence boundary.
3.2 Vibrational degrees of freedom
The analysis of phase stability in the Ti-H system has so far only taken account of
configurational degrees of freedom. However, due to the low mass of hydrogen, vibrational
degrees of freedom can be important, especially zero-point vibrational energies. To investigate
this, we calculated the phonon densities of states of 30 different H-vacancy configurations within
the fcc Ti host along with the phonon density of states for hcp Ti. These were calculated with a
force constant spring model [113]. The force constants were extracted from first-principles GGA
calculations (with the VASP code) of the restoring forces due to atomic perturbations within
supercells using the fitfc code of the Alloy-Theoretic Automated Toolkit (ATAT) [113,121]. For
each fcc based configuration, we used a supercell with maximal length between periodic images
of 9 Å and extracted spring constants up to an inter-atomic distance of 4.5 Å. Convergence tests
for several hydrogen-vacancy arrangements indicated that these supercell sizes and spring cutoff
lengths lead to a numerical error in the zero-point vibrational energies of about 1 meV per
formula unit of TiH3x.
Among the 30 configurations for which phonon densities of states were calculated, 8
exhibited unstable phonon modes. The formation energies with and without zero-point
vibrational energy of the remaining 22 stable H-vacancy configurations are illustrated in Fig. 3-
8. The formation energies are relative to the fcc Ti and δ-TiH2 reference states (also with and
without zero-point vibrational energies respectively). Figure 3-8 clearly shows that zero-point
vibrational energy can have a significant effect on the formation energies of some configurations
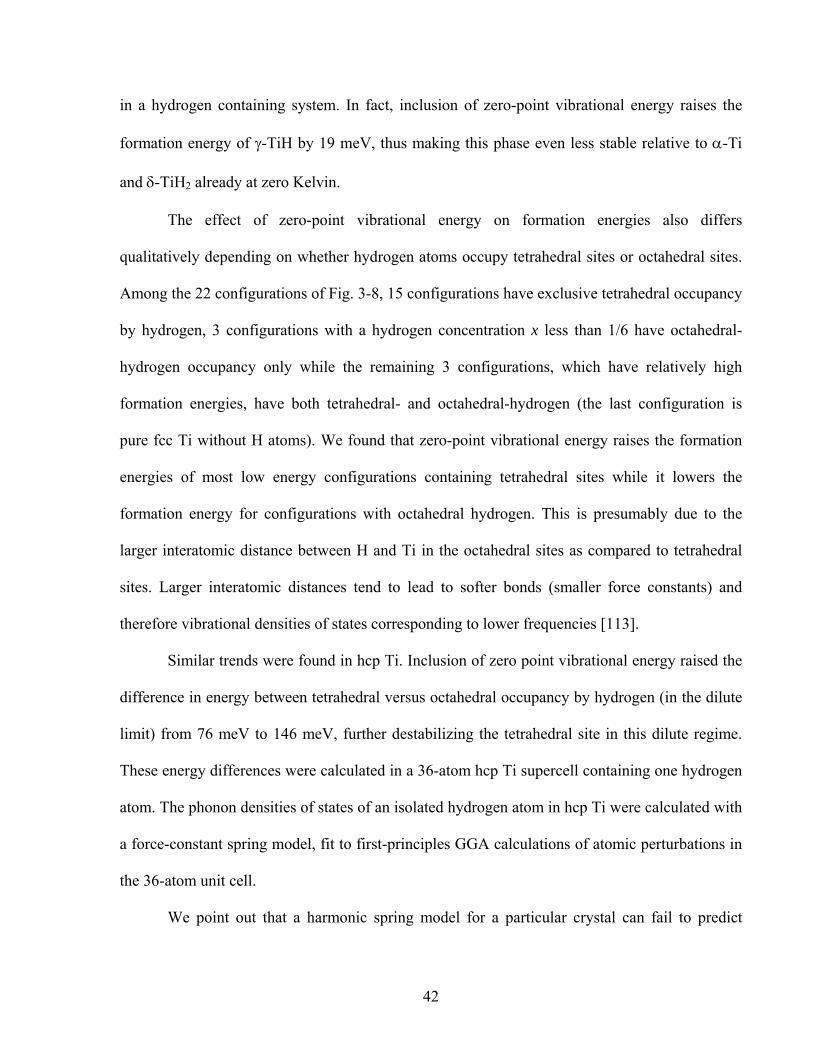
42
in a hydrogen containing system. In fact, inclusion of zero-point vibrational energy raises the
formation energy of γ-TiH by 19 meV, thus making this phase even less stable relative to α-Ti
and δ-TiH2 already at zero Kelvin.
The effect of zero-point vibrational energy on formation energies also differs
qualitatively depending on whether hydrogen atoms occupy tetrahedral sites or octahedral sites.
Among the 22 configurations of Fig. 3-8, 15 configurations have exclusive tetrahedral occupancy
by hydrogen, 3 configurations with a hydrogen concentration x less than 1/6 have octahedral-
hydrogen occupancy only while the remaining 3 configurations, which have relatively high
formation energies, have both tetrahedral- and octahedral-hydrogen (the last configuration is
pure fcc Ti without H atoms). We found that zero-point vibrational energy raises the formation
energies of most low energy configurations containing tetrahedral sites while it lowers the
formation energy for configurations with octahedral hydrogen. This is presumably due to the
larger interatomic distance between H and Ti in the octahedral sites as compared to tetrahedral
sites. Larger interatomic distances tend to lead to softer bonds (smaller force constants) and
therefore vibrational densities of states corresponding to lower frequencies [113].
Similar trends were found in hcp Ti. Inclusion of zero point vibrational energy raised the
difference in energy between tetrahedral versus octahedral occupancy by hydrogen (in the dilute
limit) from 76 meV to 146 meV, further destabilizing the tetrahedral site in this dilute regime.
These energy differences were calculated in a 36-atom hcp Ti supercell containing one hydrogen
atom. The phonon densities of states of an isolated hydrogen atom in hcp Ti were calculated with
a force-constant spring model, fit to first-principles GGA calculations of atomic perturbations in
the 36-atom unit cell.
We point out that a harmonic spring model for a particular crystal can fail to predict
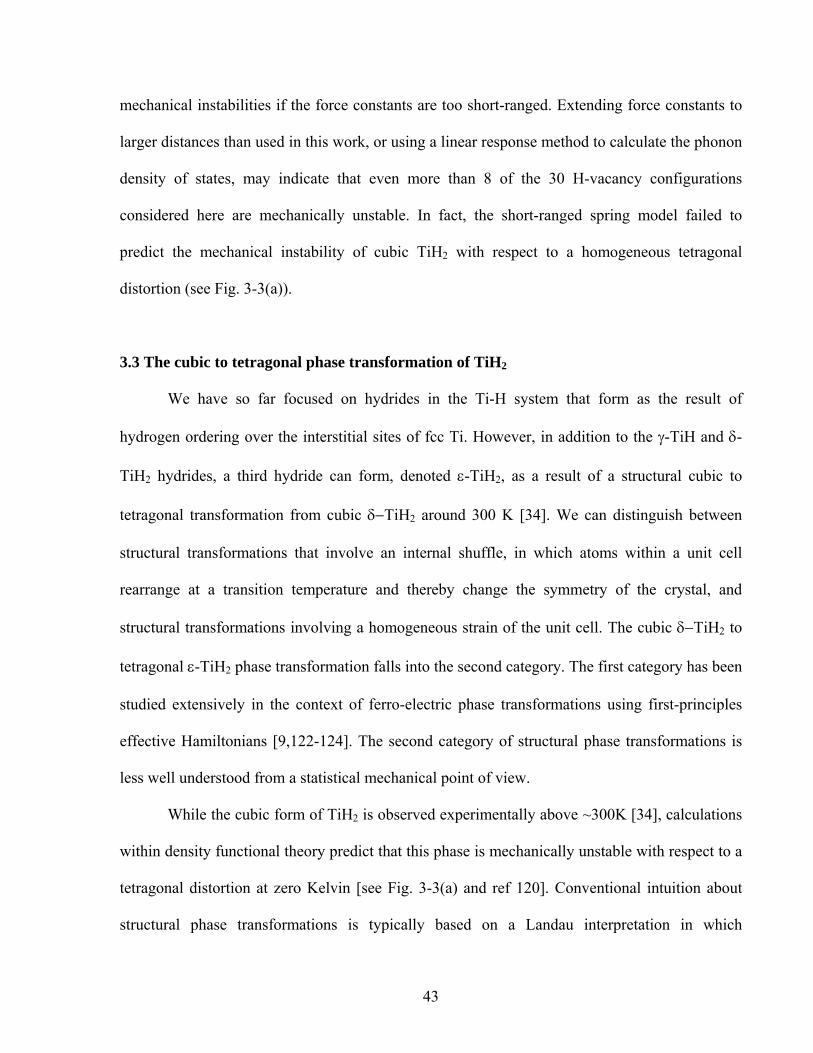
43
mechanical instabilities if the force constants are too short-ranged. Extending force constants to
larger distances than used in this work, or using a linear response method to calculate the phonon
density of states, may indicate that even more than 8 of the 30 H-vacancy configurations
considered here are mechanically unstable. In fact, the short-ranged spring model failed to
predict the mechanical instability of cubic TiH2 with respect to a homogeneous tetragonal
distortion (see Fig. 3-3(a)).
3.3 The cubic to tetragonal phase transformation of TiH2
We have so far focused on hydrides in the Ti-H system that form as the result of
hydrogen ordering over the interstitial sites of fcc Ti. However, in addition to the γ-TiH and δ-
TiH2 hydrides, a third hydride can form, denoted ε-TiH2, as a result of a structural cubic to
tetragonal transformation from cubic δ−TiH2 around 300 K [34]. We can distinguish between
structural transformations that involve an internal shuffle, in which atoms within a unit cell
rearrange at a transition temperature and thereby change the symmetry of the crystal, and
structural transformations involving a homogeneous strain of the unit cell. The cubic δ−TiH2 to
tetragonal ε-TiH2 phase transformation falls into the second category. The first category has been
studied extensively in the context of ferro-electric phase transformations using first-principles
effective Hamiltonians [9,122-124]. The second category of structural phase transformations is
less well understood from a statistical mechanical point of view.
While the cubic form of TiH2 is observed experimentally above ~300K [34], calculations
within density functional theory predict that this phase is mechanically unstable with respect to a
tetragonal distortion at zero Kelvin [see Fig. 3-3(a) and ref 120]. Conventional intuition about
structural phase transformations is typically based on a Landau interpretation in which
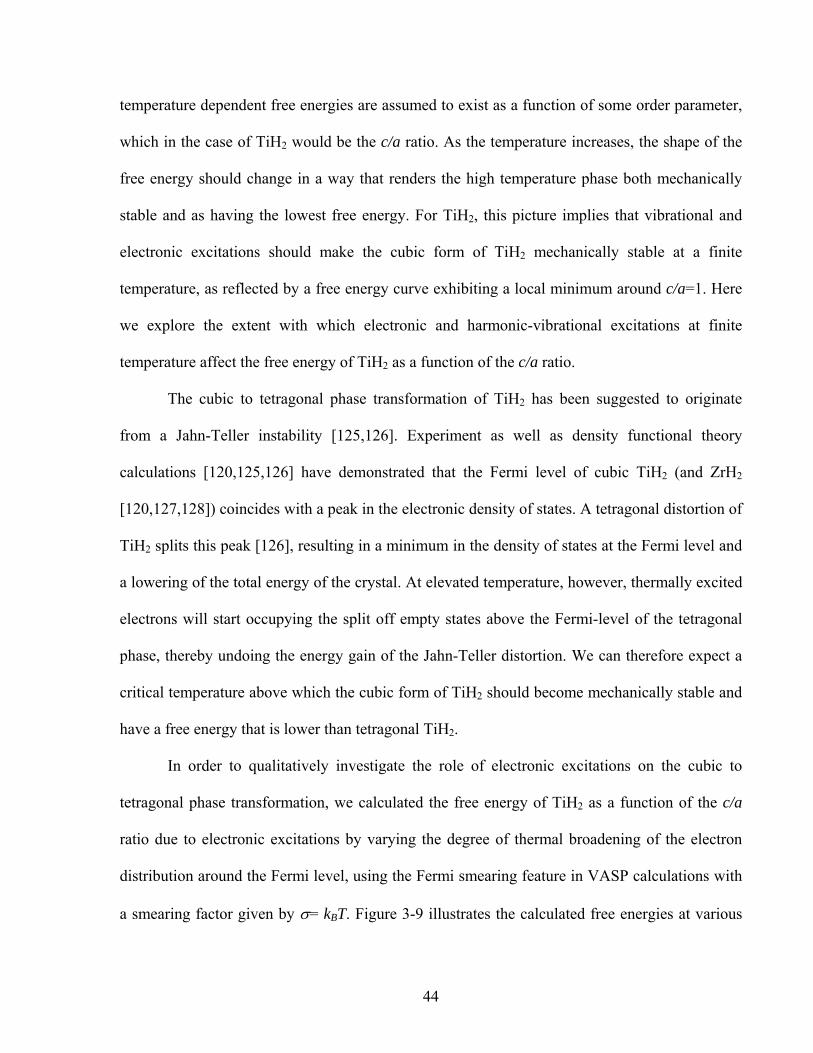
44
temperature dependent free energies are assumed to exist as a function of some order parameter,
which in the case of TiH2 would be the c/a ratio. As the temperature increases, the shape of the
free energy should change in a way that renders the high temperature phase both mechanically
stable and as having the lowest free energy. For TiH2, this picture implies that vibrational and
electronic excitations should make the cubic form of TiH2 mechanically stable at a finite
temperature, as reflected by a free energy curve exhibiting a local minimum around c/a=1. Here
we explore the extent with which electronic and harmonic-vibrational excitations at finite
temperature affect the free energy of TiH2 as a function of the c/a ratio.
The cubic to tetragonal phase transformation of TiH2 has been suggested to originate
from a Jahn-Teller instability [125,126]. Experiment as well as density functional theory
calculations [120,125,126] have demonstrated that the Fermi level of cubic TiH2 (and ZrH2
[120,127,128]) coincides with a peak in the electronic density of states. A tetragonal distortion of
TiH2 splits this peak [126], resulting in a minimum in the density of states at the Fermi level and
a lowering of the total energy of the crystal. At elevated temperature, however, thermally excited
electrons will start occupying the split off empty states above the Fermi-level of the tetragonal
phase, thereby undoing the energy gain of the Jahn-Teller distortion. We can therefore expect a
critical temperature above which the cubic form of TiH2 should become mechanically stable and
have a free energy that is lower than tetragonal TiH2.
In order to qualitatively investigate the role of electronic excitations on the cubic to
tetragonal phase transformation, we calculated the free energy of TiH2 as a function of the c/a
ratio due to electronic excitations by varying the degree of thermal broadening of the electron
distribution around the Fermi level, using the Fermi smearing feature in VASP calculations with
a smearing factor given by σ= kBT. Figure 3-9 illustrates the calculated free energies at various
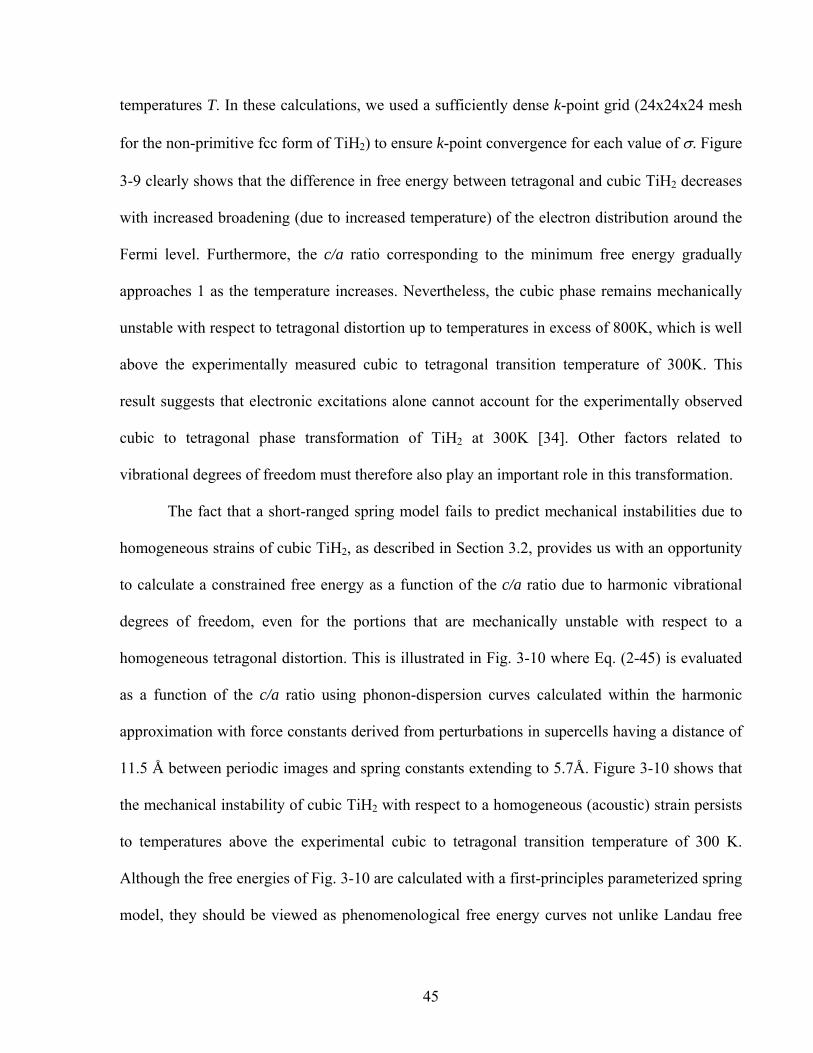
45
temperatures T. In these calculations, we used a sufficiently dense k-point grid (24x24x24 mesh
for the non-primitive fcc form of TiH2) to ensure k-point convergence for each value of σ. Figure
3-9 clearly shows that the difference in free energy between tetragonal and cubic TiH2 decreases
with increased broadening (due to increased temperature) of the electron distribution around the
Fermi level. Furthermore, the c/a ratio corresponding to the minimum free energy gradually
approaches 1 as the temperature increases. Nevertheless, the cubic phase remains mechanically
unstable with respect to tetragonal distortion up to temperatures in excess of 800K, which is well
above the experimentally measured cubic to tetragonal transition temperature of 300K. This
result suggests that electronic excitations alone cannot account for the experimentally observed
cubic to tetragonal phase transformation of TiH2 at 300K [34]. Other factors related to
vibrational degrees of freedom must therefore also play an important role in this transformation.
The fact that a short-ranged spring model fails to predict mechanical instabilities due to
homogeneous strains of cubic TiH2, as described in Section 3.2, provides us with an opportunity
to calculate a constrained free energy as a function of the c/a ratio due to harmonic vibrational
degrees of freedom, even for the portions that are mechanically unstable with respect to a
homogeneous tetragonal distortion. This is illustrated in Fig. 3-10 where Eq. (2-45) is evaluated
as a function of the c/a ratio using phonon-dispersion curves calculated within the harmonic
approximation with force constants derived from perturbations in supercells having a distance of
11.5 Å between periodic images and spring constants extending to 5.7Å. Figure 3-10 shows that
the mechanical instability of cubic TiH2 with respect to a homogeneous (acoustic) strain persists
to temperatures above the experimental cubic to tetragonal transition temperature of 300 K.
Although the free energies of Fig. 3-10 are calculated with a first-principles parameterized spring
model, they should be viewed as phenomenological free energy curves not unlike Landau free
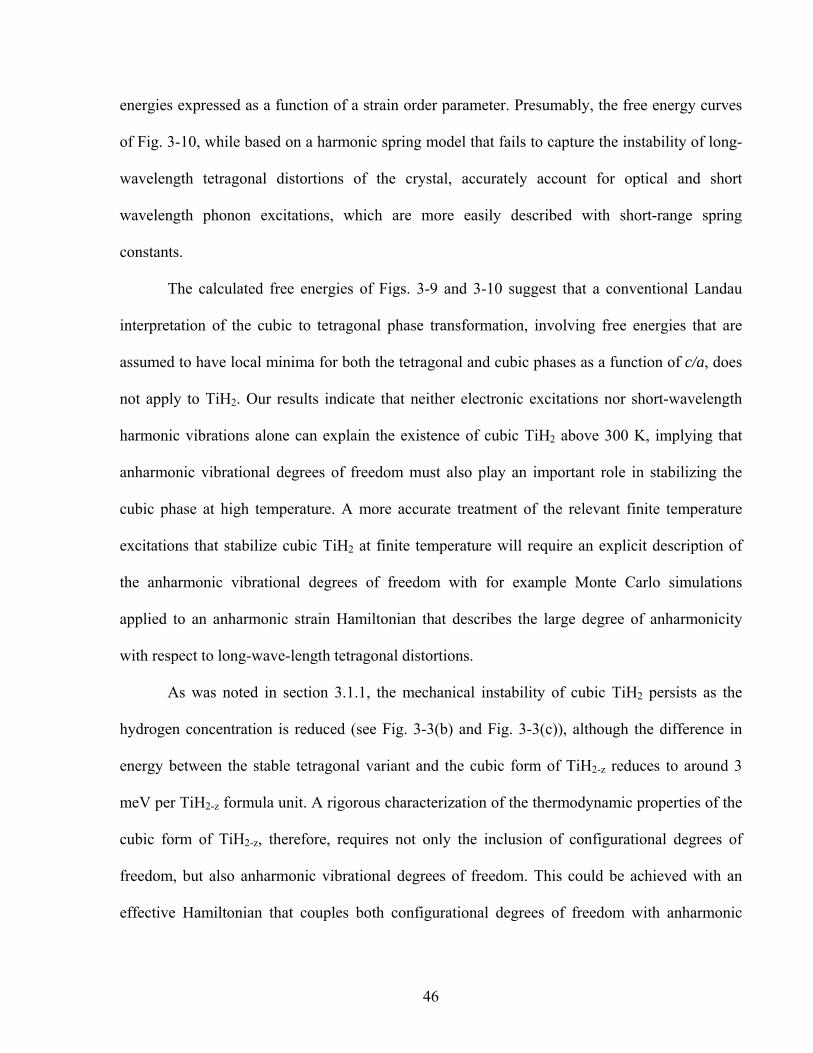
46
energies expressed as a function of a strain order parameter. Presumably, the free energy curves
of Fig. 3-10, while based on a harmonic spring model that fails to capture the instability of long-
wavelength tetragonal distortions of the crystal, accurately account for optical and short
wavelength phonon excitations, which are more easily described with short-range spring
constants.
The calculated free energies of Figs. 3-9 and 3-10 suggest that a conventional Landau
interpretation of the cubic to tetragonal phase transformation, involving free energies that are
assumed to have local minima for both the tetragonal and cubic phases as a function of c/a, does
not apply to TiH2. Our results indicate that neither electronic excitations nor short-wavelength
harmonic vibrations alone can explain the existence of cubic TiH2 above 300 K, implying that
anharmonic vibrational degrees of freedom must also play an important role in stabilizing the
cubic phase at high temperature. A more accurate treatment of the relevant finite temperature
excitations that stabilize cubic TiH2 at finite temperature will require an explicit description of
the anharmonic vibrational degrees of freedom with for example Monte Carlo simulations
applied to an anharmonic strain Hamiltonian that describes the large degree of anharmonicity
with respect to long-wave-length tetragonal distortions.
As was noted in section 3.1.1, the mechanical instability of cubic TiH2 persists as the
hydrogen concentration is reduced (see Fig. 3-3(b) and Fig. 3-3(c)), although the difference in
energy between the stable tetragonal variant and the cubic form of TiH2-z reduces to around 3
meV per TiH2-z formula unit. A rigorous characterization of the thermodynamic properties of the
cubic form of TiH2-z, therefore, requires not only the inclusion of configurational degrees of
freedom, but also anharmonic vibrational degrees of freedom. This could be achieved with an
effective Hamiltonian that couples both configurational degrees of freedom with anharmonic
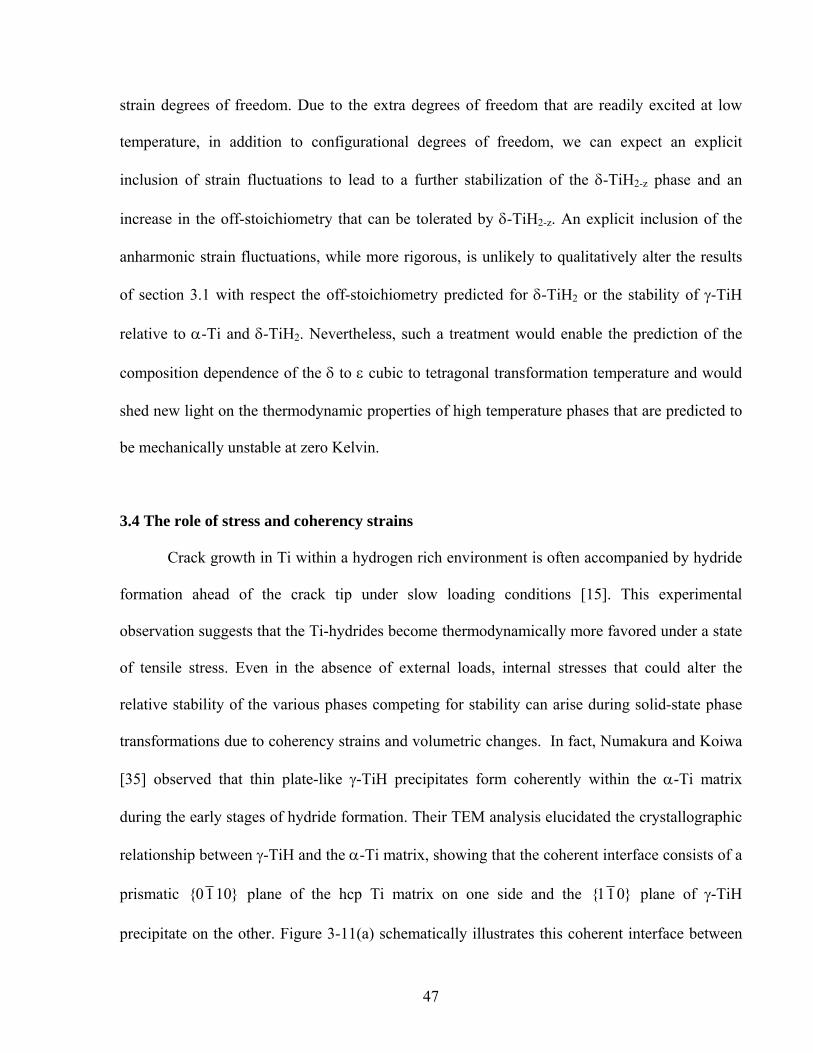
47
strain degrees of freedom. Due to the extra degrees of freedom that are readily excited at low
temperature, in addition to configurational degrees of freedom, we can expect an explicit
inclusion of strain fluctuations to lead to a further stabilization of the δ-TiH2-z phase and an
increase in the off-stoichiometry that can be tolerated by δ-TiH2-z. An explicit inclusion of the
anharmonic strain fluctuations, while more rigorous, is unlikely to qualitatively alter the results
of section 3.1 with respect the off-stoichiometry predicted for δ-TiH2 or the stability of γ-TiH
relative to α-Ti and δ-TiH2. Nevertheless, such a treatment would enable the prediction of the
composition dependence of the δ to ε cubic to tetragonal transformation temperature and would
shed new light on the thermodynamic properties of high temperature phases that are predicted to
be mechanically unstable at zero Kelvin.
3.4 The role of stress and coherency strains
Crack growth in Ti within a hydrogen rich environment is often accompanied by hydride
formation ahead of the crack tip under slow loading conditions [15]. This experimental
observation suggests that the Ti-hydrides become thermodynamically more favored under a state
of tensile stress. Even in the absence of external loads, internal stresses that could alter the
relative stability of the various phases competing for stability can arise during solid-state phase
transformations due to coherency strains and volumetric changes. In fact, Numakura and Koiwa
[35] observed that thin plate-like γ-TiH precipitates form coherently within the α-Ti matrix
during the early stages of hydride formation. Their TEM analysis elucidated the crystallographic
relationship between γ-TiH and the α-Ti matrix, showing that the coherent interface consists of a
prismatic {01 10} plane of the hcp Ti matrix on one side and the {11 0} plane of γ-TiH
precipitate on the other. Figure 3-11(a) schematically illustrates this coherent interface between
48
α-Ti and γ-TiH, reproduced from Numakura and Koiwa [35].
When a thin, extended γ-TiH plate forms coherently within the α-Ti matrix, its lattice
parameters parallel to the coherent interface will be constrained by those of the matrix phase,
thereby leading to a state of internal stress within the precipitate. To ensure coherency between
α-Ti and γ-TiH along the interface illustrated in Fig. 3-11(a), d220 must equal d2 1 1 0 and d002 must
equal d0002, where dhkl and dhklm are interplanar spacings of atomic planes in the precipitate and
matrix, respectively. The lattice parameter of γ-TiH perpendicular to the coherent interface, i.e.
the [1 1 0] direction, can potentially relax. The degree to which this lattice parameter relaxes
depends on the overall geometry of the specimen as well as the elastic stiffness of the matrix
phase. Due to a volumetric increase upon hydride formation, it is likely that the precipitate will
experience some degree of compressive stress perpendicular to the interface.
A phase diagram can be constructed displaying the relative stability between α-Ti, γ-TiH
and δ-TiH2 as a function of stress. While equilibrium at constant temperature, pressure and
concentration is determined by a minimum of the Gibbs free energy, a different characteristic
thermodynamic potential must be minimized to determine phase equilibrium if the system is
subjected to an anisotropic state of stress resulting from an external load or from internal
coherency strains. In its most general form, a particular state of stress can be represented with a
stress tensor. For simplicity and for the purpose of revealing general trends, we consider only
uniaxial stress states, represented by the scalar σ. Other external thermodynamic boundary
conditions that are often imposed on a stressed metal susceptible to hydride formation is a
constant temperature, T, and a constant hydrogen chemical potential, μH, which can be controlled
experimentally by fixing the hydrogen partial pressure of the environment. At fixed T, μH and σ,
49
the characteristic thermodynamic potential to be minimized to determine phase equilibrium takes
the form
Φ = E − TS − μH N H −Voσε (3-2)
where E is the internal energy, S the entropy, NH the number of hydrogen atoms, ε the strain and
Vo a reference volume of the solid with respect to which the strain is measured (here we set it to
the initial cell volume). When the above quantities are normalized per Ti atom, then NH becomes
0 for pure Ti, 1 for TiH and 2 for TiH2. The thermodynamically stable phase at a particular T, μH
and σ will have the lowest value for Φ among all the phases competing for stability.
For a fixed hydrogen chemical potential μH, we can obtain from Eq. (3-2) (at 0 Kelvin) a
free energy curve of Φ as a function of stress level σ, where the stress level as well as the stress-
strain curve (e.g. Fig. 3-12 (b) is for hcp-Ti) can be obtained from the derivative of first-principle
energy per unit cross section area with respect to the excess elongation (difference between the
final length and initial length) (e.g. Fig. 3-12 (a) is for hcp-Ti). Hence, under a fixed hydrogen
chemical potential μH, we can calculate such free energy curves for α-Ti, γ-TiH and δ-TiH2
respectively, put these three Φ-σ curves in a single plot (e.g. Fig. 3-12(c) shows free energy
curves as a function of stress for μH = -5meV without coherency strains) and determine the stress
region that favors a specific phase, that is find the stress region where a specific phase has the
lowest free energy Φ. In this way we can determine the phase boundary for a fixed hydrogen
chemical potential μH and furthermore obtain the phase boundary for the whole hydrogen
chemical potential region we are interested in.
Figure 3-13 illustrates two such phase diagrams showing relative stability as a function of
μH and a uniaxial stress σ calculated by minimizing the grand force potential Φ. These phase
diagrams were calculated at zero Kelvin, where the entropy is zero and only stoichiometric
50
compounds exist. Hence the internal energy E appearing in Eq. (3-2) is then simply equal to the
first-principles energy (GGA) of either α-Ti, γ-TiH or δ-TiH2 as a function of the stress σ. In Eq.
(3-2), the strain ε is also a function of the stress σ and this dependence is particular to each
phase. Practically determining the grand force potential Φ at zero Kelvin can proceed by
calculating E versus the strain ε and then extracting the stress σ by taking the derivative of E
with respect to ε and dividing by Vo.
The phase diagrams in Fig. 3-13 correspond to two particular states of lateral strain
perpendicular to the axis of tension. The axis of tension is along the [0 1 10] direction of the hcp
crystal and the [1 1 0] direction of the Ti fcc sublattice of γ-TiH or δ-TiH2 (Fig. 3-11(b)). If
hydrides form coherently within the α-Ti matrix according to the crystallographic orientations
reported by Numakura and Kaiwa [35], the tension along the [0 1 10] axis of hcp Ti would
coincide with tension along the [11 0] direction of the fcc sublattice of γ and δ-hydrides and
would be perpendicular to the coherent interface. The phase diagram of Fig. 3-13(a) was
calculated for crystals in the absence of coherency strains. The phase diagram of Fig. 3-13(b)
was calculated by fixing the hydride lattice parameters perpendicular to the axis of tension to
coincide with those of hcp Ti in the {01 10} plane. Figure 3-13(b) is therefore a phase diagram
describing coherent hydride phase stability. The phase diagrams neglect zero-point energies and
therefore only provide general trends as to how hydride phase stability evolves with increasing
stress.
Figure 3-13(a) shows that at low hydrogen chemical potential α-Ti is stable, while at high
chemical potential δ-TiH2 is stable. The reference state of the hydrogen chemical potential is
arbitrarily set to the value corresponding to the transition between α-Ti and δ-TiH2 at zero stress.
As already mentioned in section 3.1.3, bulk γ-TiH is not stable at zero pressure and therefore
51
does not appear in the phase diagram of Fig. 3-13(a) at σ=0. As stress is imposed, however, γ-
TiH becomes stable within a limited range of hydrogen chemical potential and stress. The phase
diagram of Fig. 3-13(a) also illustrates that stress along the [0 1 10] direction of α-Ti and the
[11 0] of the δ-TiH2 favors hydride formation as manifested by the negative slope of the phase
boundary between α-Ti and δ-TiH2: As the tensile stress, σ, is increased, the transition from α-Ti
to δ-TiH2 occurs at a lower hydrogen chemical potential. This result is consistent with
experimental observations of hydride formation ahead of a crack tip [15].
The stability of the γ-TiH phase relative to α-Ti and δ-TiH2 is significantly enhanced
when a strain perpendicular to the axis of tension is imposed on the hydrides to enable the
formation of coherent interfaces with the α-Ti matrix along the (0 1 10) habit plane, as illustrated
in Fig. 3-11(b). When coherency strains are imposed, γ-TiH even becomes stable for
compressive stresses σ within a limited chemical potential range. For a coherent γ-TiH hydride,
the chemical potential interval, where γ-TiH is stable, increases with increasing tensile stress
perpendicular to the (0 1 10) habit plane.
3.5 Summary
In this chapter we investigated the thermodynamic properties of the Ti-H system from
first-principle and it has revealed the importance of configurational and vibrational degrees of
freedom in determining hydride phase stability. Configurational excitations are important in δ-
TiH2-x as this phase can tolerate large vacancy concentrations, while they do not contribute
significantly to the free energy of the γ-TiH phase, which remains a stoichiometric compound at
finite temperature. The inclusion of zero-point vibrational energy penalizes tetrahedral site
occupancy more than octahedral site occupancy and increases the degree with which γ-TiH is
52
unstable relative to α-Ti and δ-TiH2-z. This is presumably due to the larger interatomic distance
between H and Ti in the octahedral sites as compared to tetrahedral sites. Larger interatomic
distances tend to lead to softer bonds (smaller force constants) and therefore vibrational densities
of states corresponding to lower frequencies.38 This favoring of octahedral sites over tetrahedral
sites by vibrational degrees of freedom is likely a general trend in all metallic hydrides. An
analysis of relative stability under anisotropic stress states shows that hydrides of the Ti-H
system are thermodynamically favored under tensile stress. Furthermore, when the hydrides are
subjected to coherency strains, γ-TiH is predicted to be stable at zero stress as well as under
compressive stresses. The predicted mechanical instability of cubic δ-TiH2 with respect to a
homogeneous tetragonal distortion to ε-TiH2 raises fundamental questions about the relevant
excitations that stabilize cubic TiH2 above 300 K and suggests the importance of anharmonic
strain fluctuations in determining the thermodynamic properties of this phase.
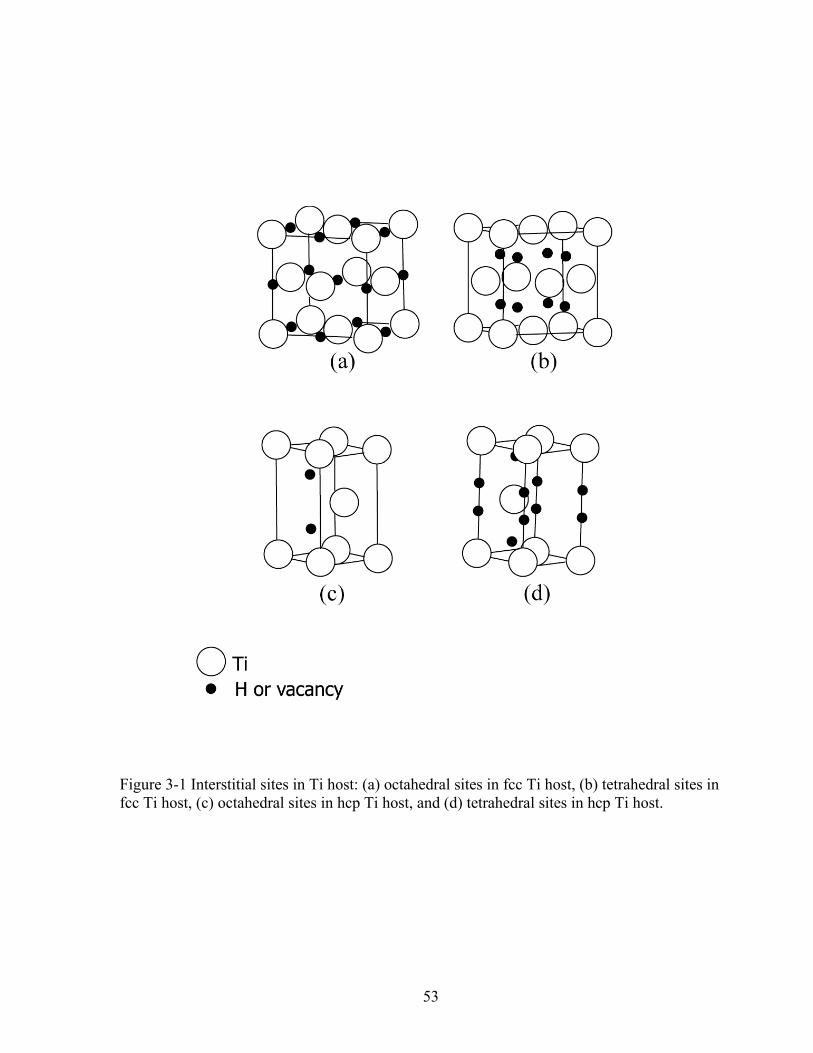
53
Figure 3-1 Interstitial sites in Ti host: (a) octahedral sites in fcc Ti host, (b) tetrahedral sites in fcc Ti host, (c) octahedral sites in hcp Ti host, and (d) tetrahedral sites in hcp Ti host.
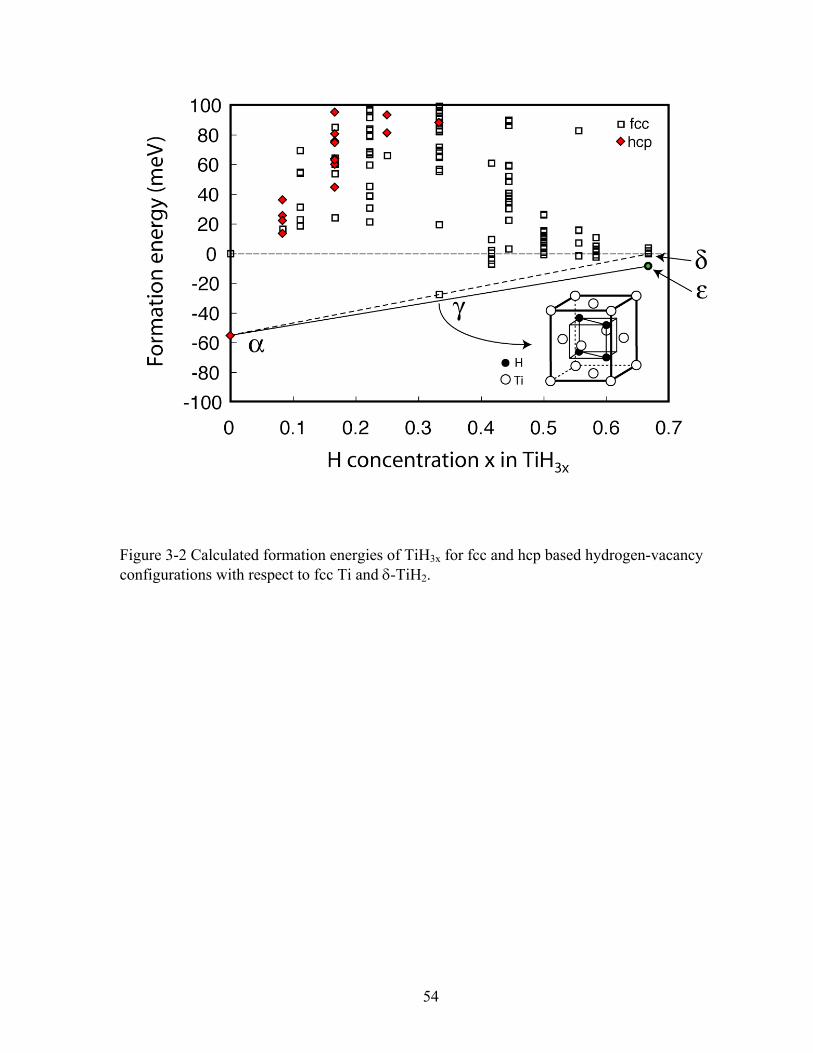
54
Figure 3-2 Calculated formation energies of TiH3x for fcc and hcp based hydrogen-vacancy configurations with respect to fcc Ti and δ-TiH2.
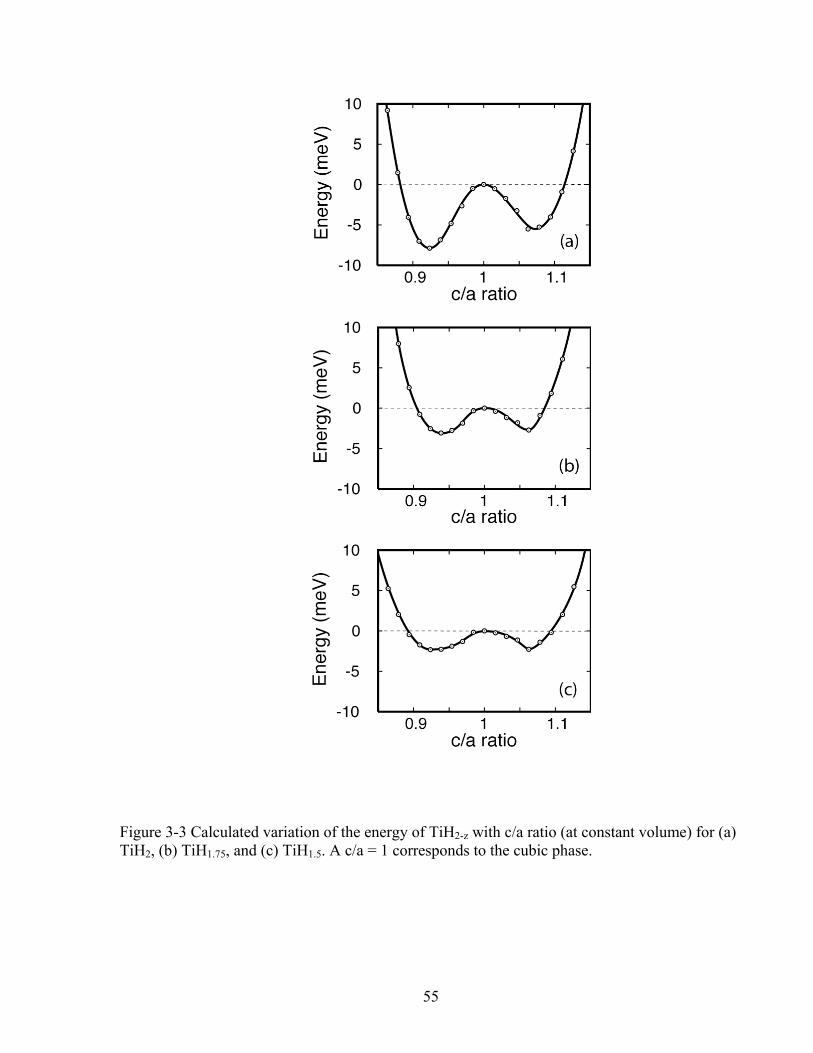
55
Figure 3-3 Calculated variation of the energy of TiH2-z with c/a ratio (at constant volume) for (a) TiH2, (b) TiH1.75, and (c) TiH1.5. A c/a = 1 corresponds to the cubic phase.
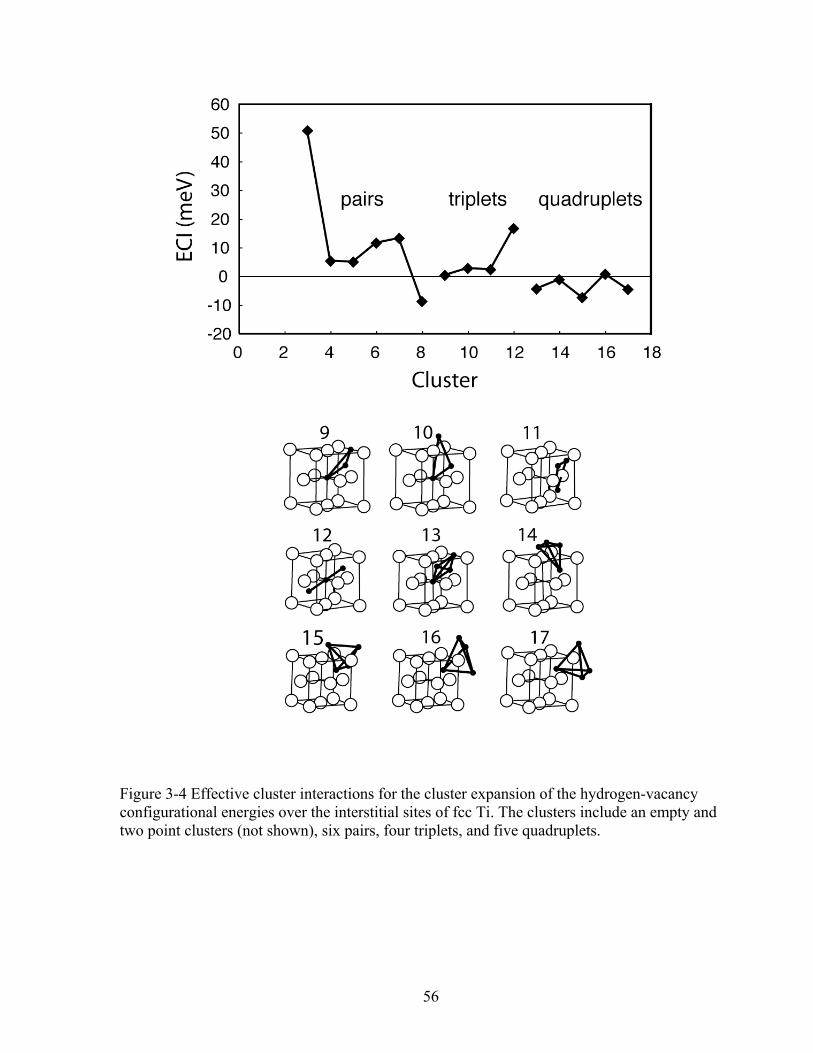
56
Figure 3-4 Effective cluster interactions for the cluster expansion of the hydrogen-vacancy configurational energies over the interstitial sites of fcc Ti. The clusters include an empty and two point clusters (not shown), six pairs, four triplets, and five quadruplets.
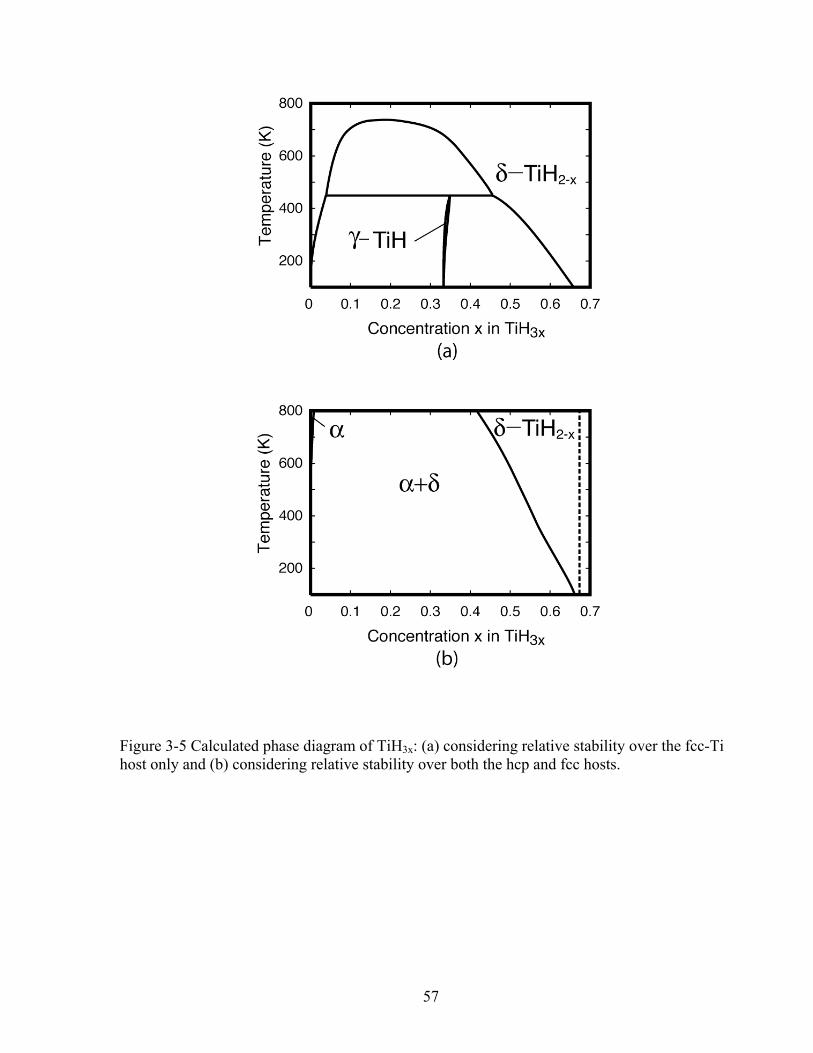
57
Figure 3-5 Calculated phase diagram of TiH3x: (a) considering relative stability over the fcc-Ti host only and (b) considering relative stability over both the hcp and fcc hosts.
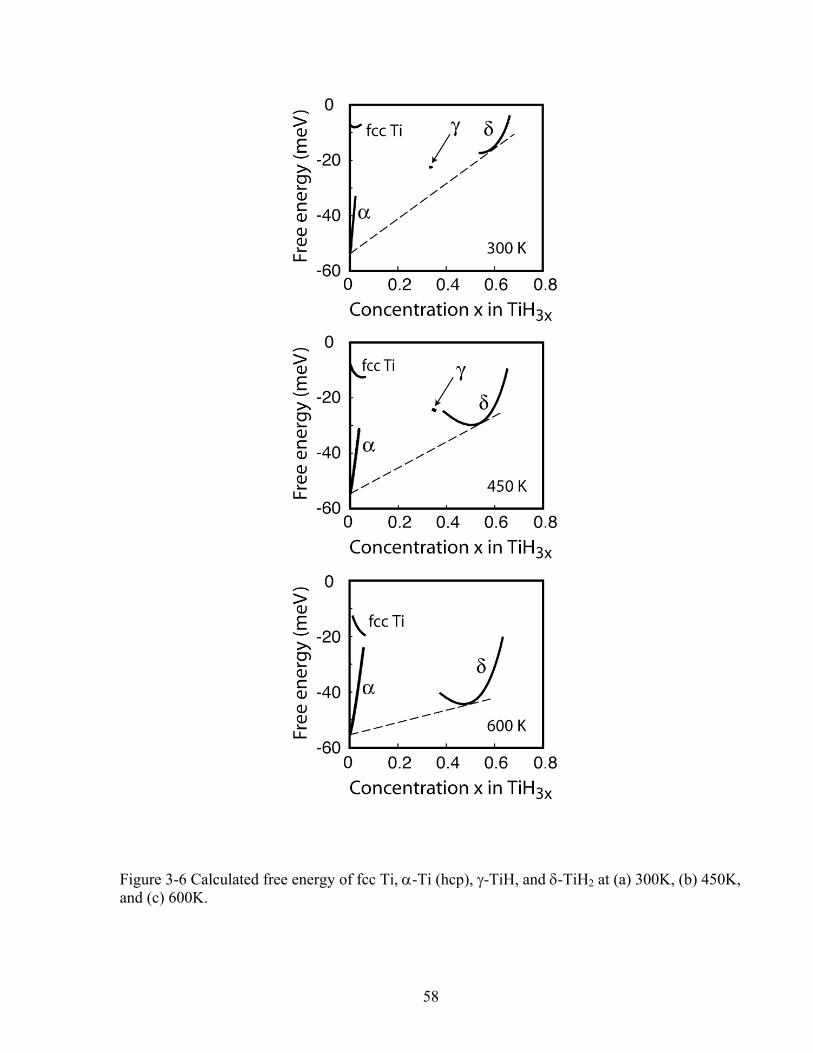
58
Figure 3-6 Calculated free energy of fcc Ti, α-Ti (hcp), γ-TiH, and δ-TiH2 at (a) 300K, (b) 450K, and (c) 600K.
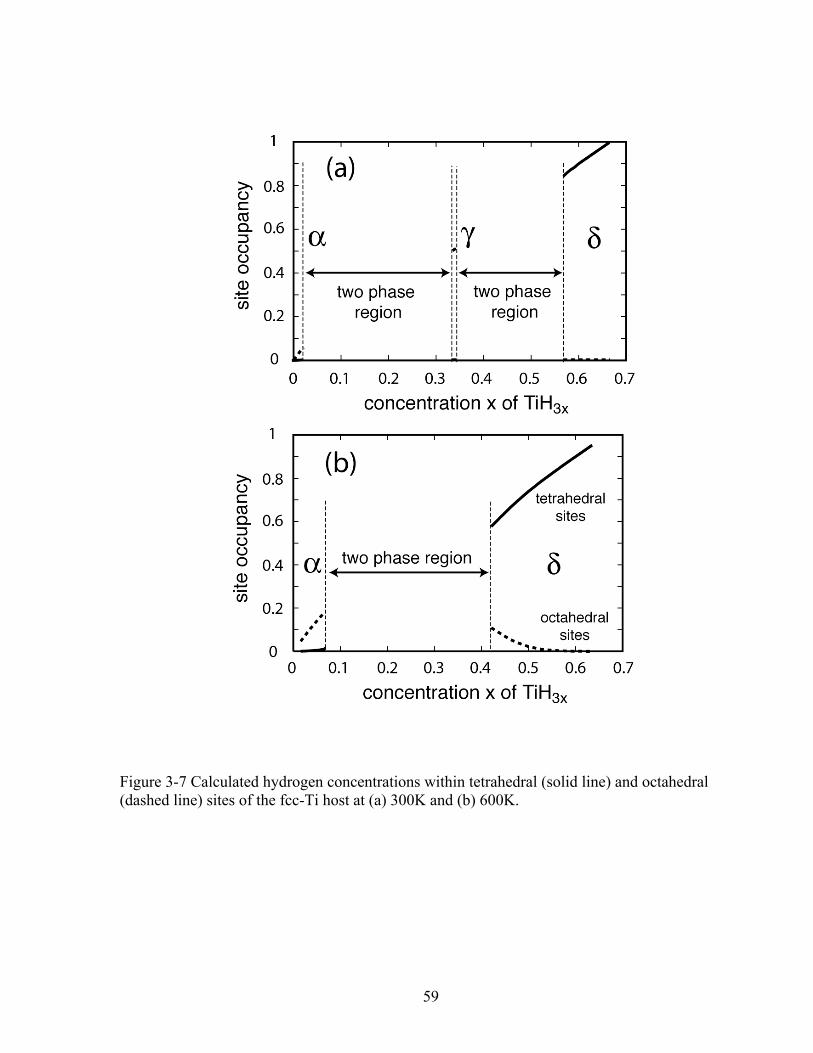
59
Figure 3-7 Calculated hydrogen concentrations within tetrahedral (solid line) and octahedral (dashed line) sites of the fcc-Ti host at (a) 300K and (b) 600K.
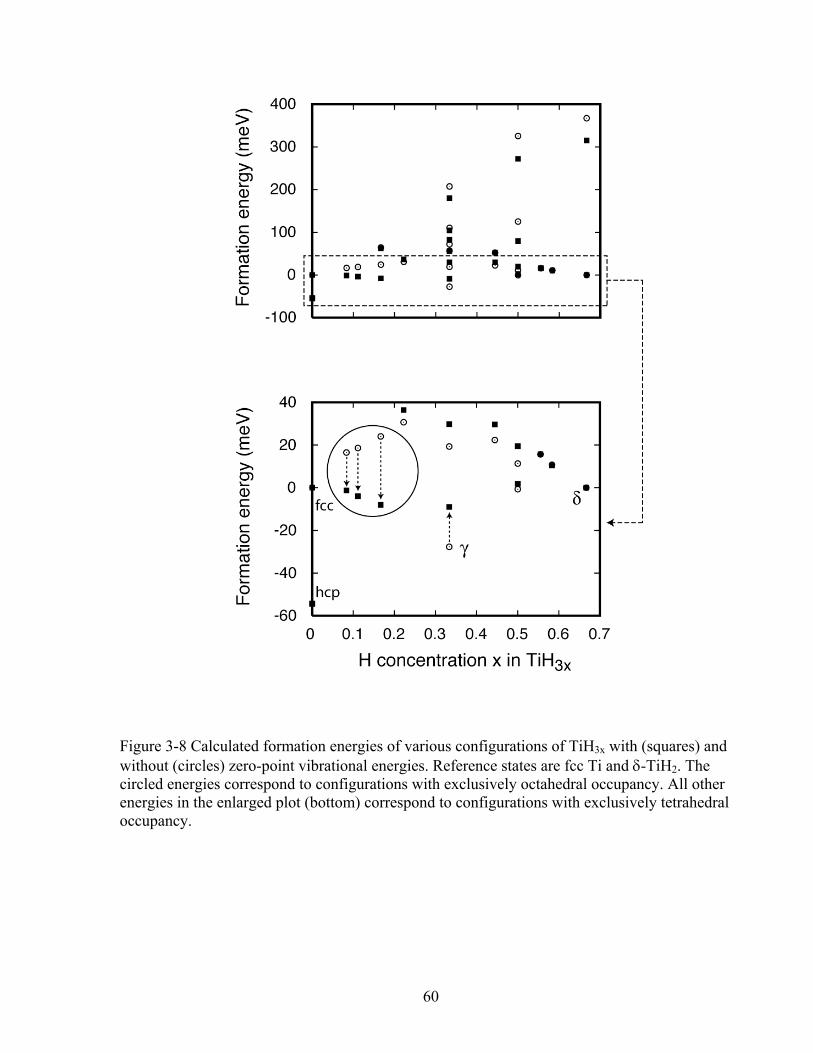
60
Figure 3-8 Calculated formation energies of various configurations of TiH3x with (squares) and without (circles) zero-point vibrational energies. Reference states are fcc Ti and δ-TiH2. The circled energies correspond to configurations with exclusively octahedral occupancy. All other energies in the enlarged plot (bottom) correspond to configurations with exclusively tetrahedral occupancy.
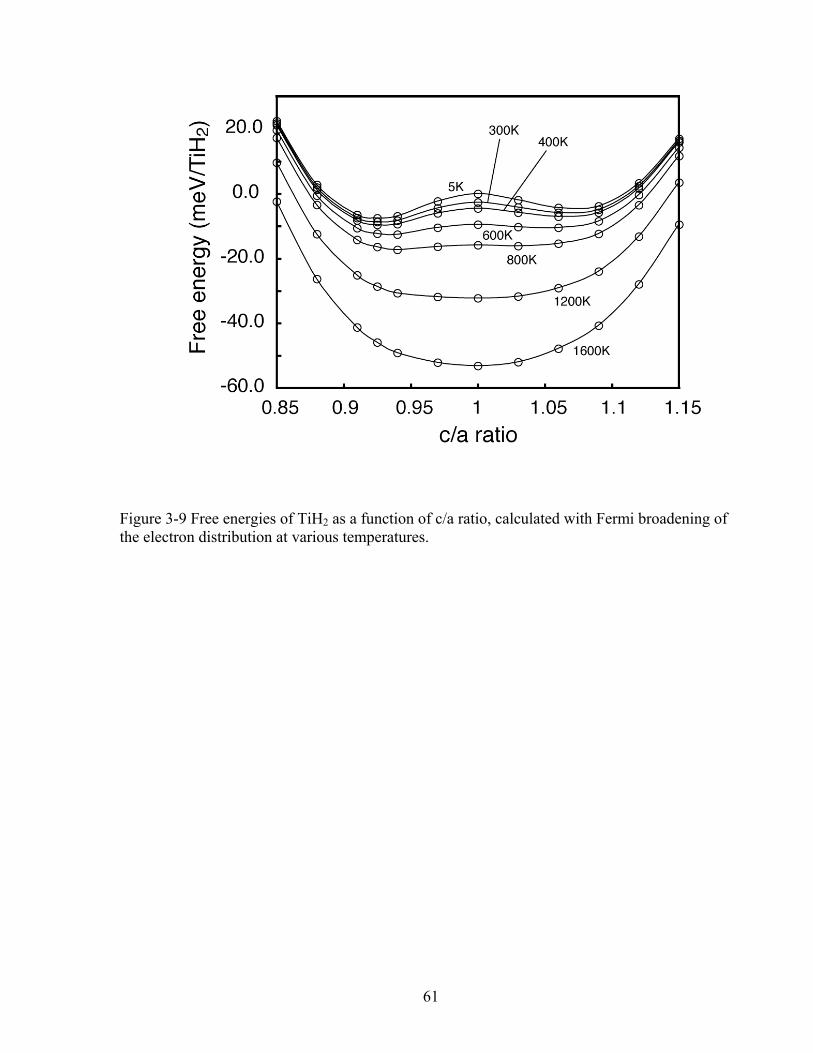
61
Figure 3-9 Free energies of TiH2 as a function of c/a ratio, calculated with Fermi broadening of the electron distribution at various temperatures.
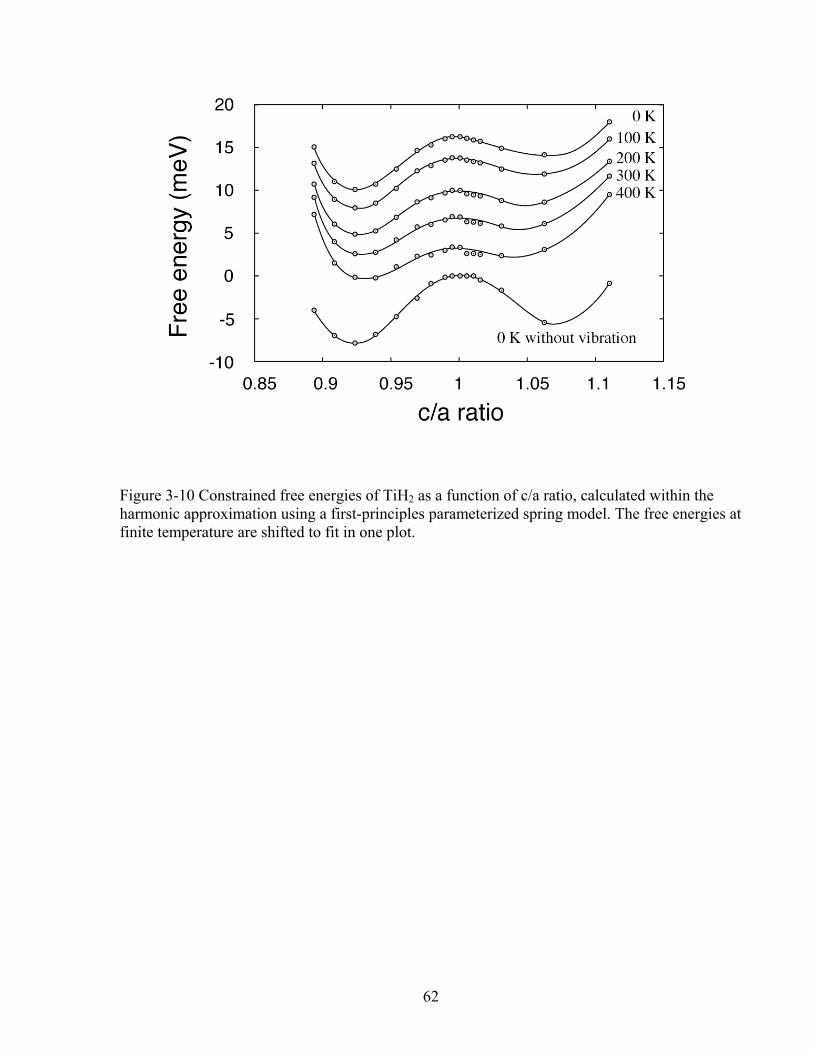
62
Figure 3-10 Constrained free energies of TiH2 as a function of c/a ratio, calculated within the harmonic approximation using a first-principles parameterized spring model. The free energies at finite temperature are shifted to fit in one plot.
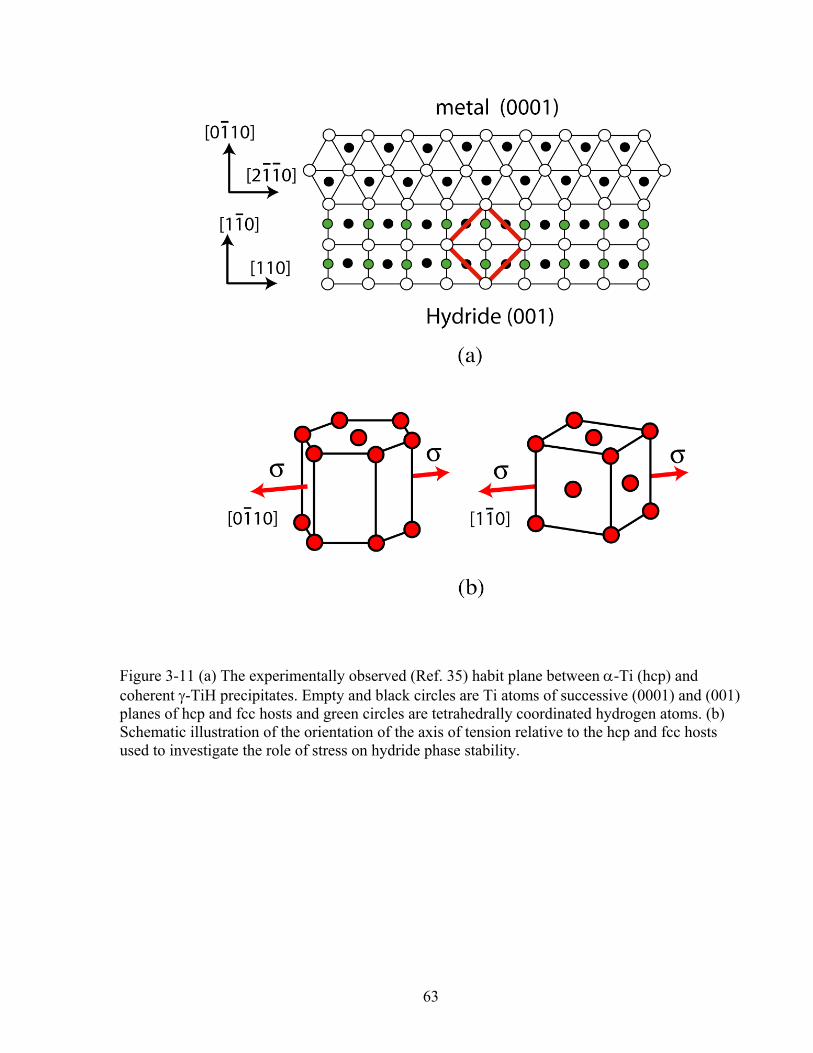
63
Figure 3-11 (a) The experimentally observed (Ref. 35) habit plane between α-Ti (hcp) and coherent γ-TiH precipitates. Empty and black circles are Ti atoms of successive (0001) and (001) planes of hcp and fcc hosts and green circles are tetrahedrally coordinated hydrogen atoms. (b) Schematic illustration of the orientation of the axis of tension relative to the hcp and fcc hosts used to investigate the role of stress on hydride phase stability.
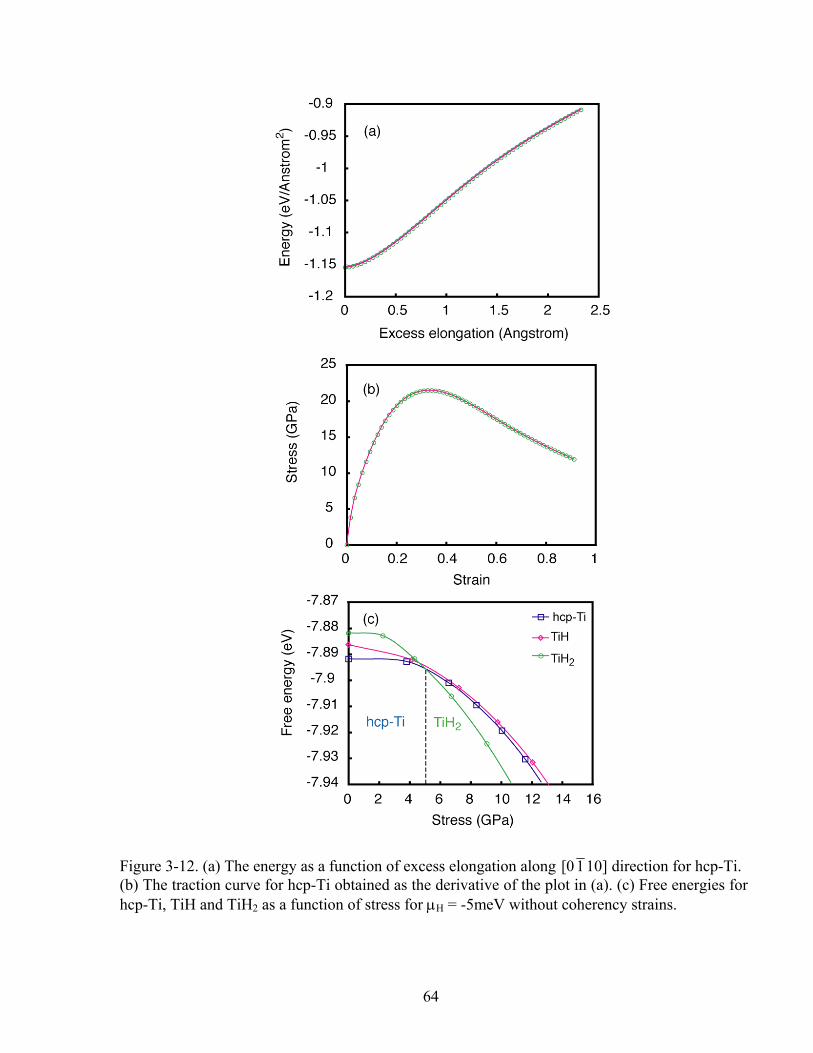
64
Figure 3-12. (a) The energy as a function of excess elongation along [0 1 10] direction for hcp-Ti. (b) The traction curve for hcp-Ti obtained as the derivative of the plot in (a). (c) Free energies for hcp-Ti, TiH and TiH2 as a function of stress for μH = -5meV without coherency strains.
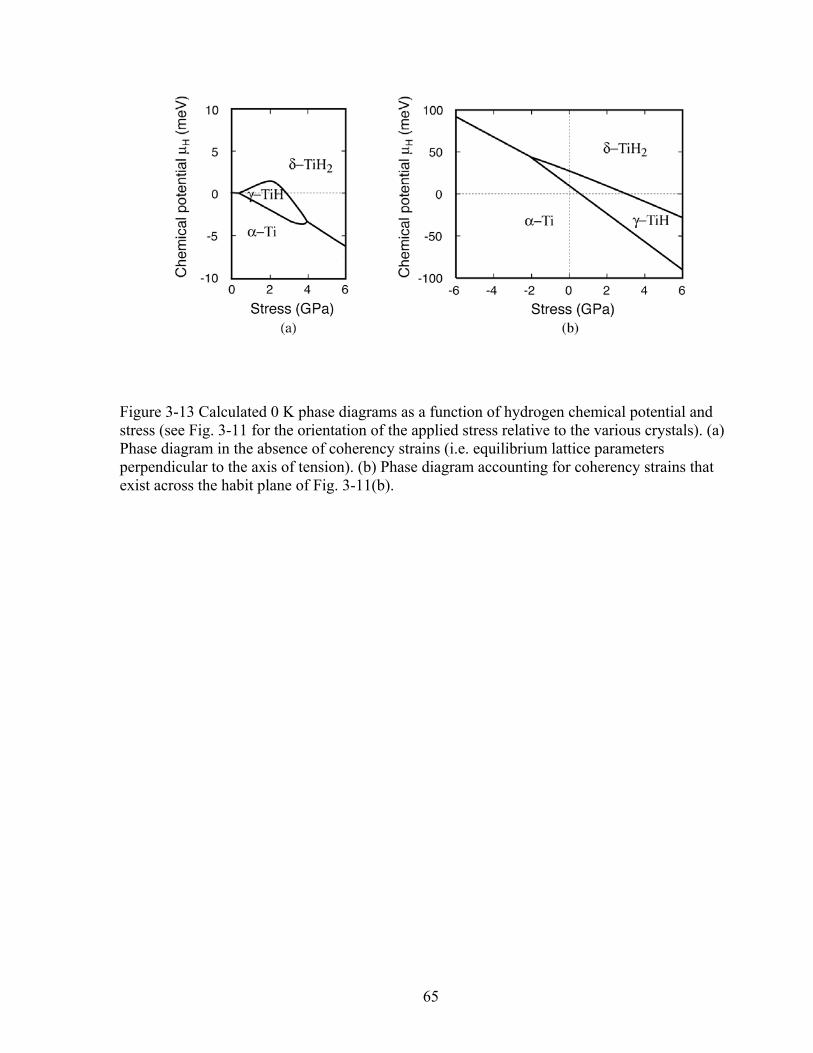
65
Figure 3-13 Calculated 0 K phase diagrams as a function of hydrogen chemical potential and stress (see Fig. 3-11 for the orientation of the applied stress relative to the various crystals). (a) Phase diagram in the absence of coherency strains (i.e. equilibrium lattice parameters perpendicular to the axis of tension). (b) Phase diagram accounting for coherency strains that exist across the habit plane of Fig. 3-11(b).
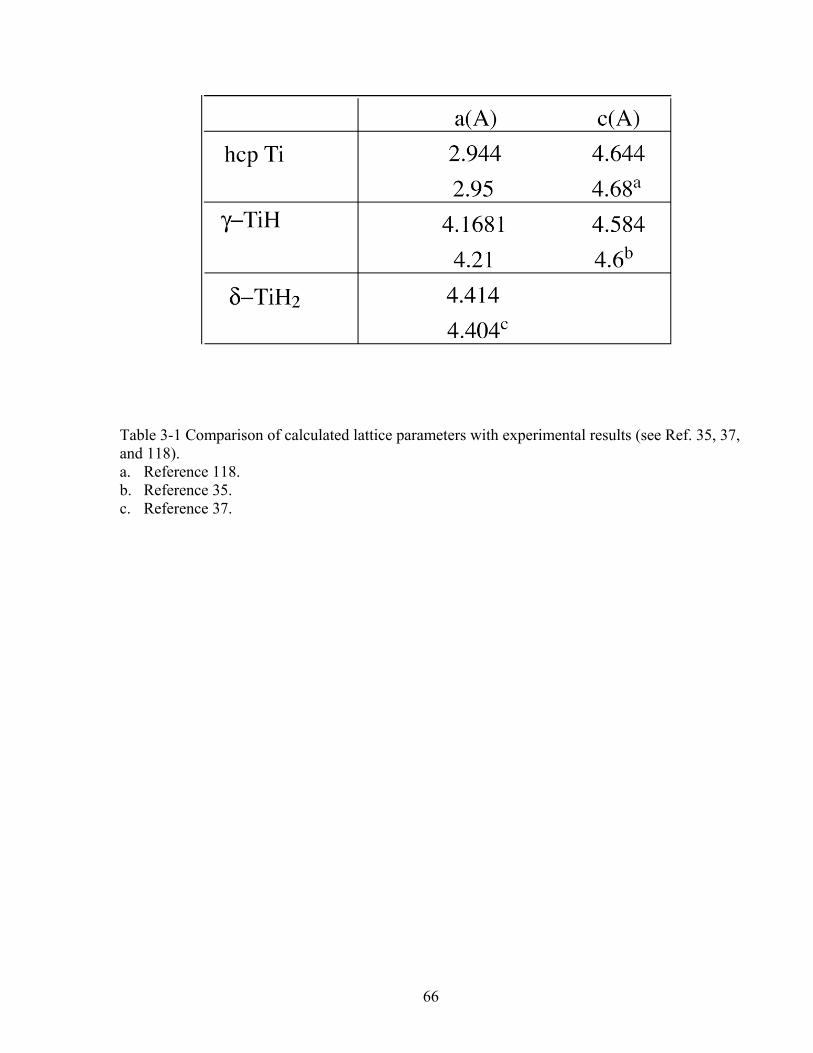
66
Table 3-1 Comparison of calculated lattice parameters with experimental results (see Ref. 35, 37, and 118). a. Reference 118. b. Reference 35. c. Reference 37.
67
Chapter 4
First-principles investigation of migration barriers and point defect complexes in a substitution solid: B2-NiAl
In chapter 3, we investigated the thermodynamics in an interstitial solid: Ti hydride. In
this and the following chapters, we will apply the similar first-principle approaches to a
substitution solid: B2-NiAl compound; the emphasis will be put on the kinetic properties in this
compound.
4.1 Important hop mechanisms in B2-NiAl
In this chapter, we survey important hop mechanisms that have been proposed for B2-
NiAl and calculate their migration barriers from first principles. We also explore new hop
mechanisms and further show that the migration barriers for a variety of hop mechanisms are
sensitive to the local environment. As any nearest neighbor hop in B2-NiAl leads to a disruption
of long-range order, several migration sequences involving a succession of hops have been
proposed, including the various six jump cycle mechanisms (6JC) [47,63,66], the migration of
triple defect complexes [49,67] and the anti-structural bridge mechanism (ASB) [52]. These hop
sequences involve a combination of nearest neighbor and second nearest neighbor atom-vacancy
exchanges as well as two atom-vacancy exchanges [58]. As the concentration and nature of point
defects changes with alloy composition, we pay special attention to the effect of local short-range
order on migration barriers for various hop mechanisms.
68
We used first-principles electronic structure methods based on density functional theory
(DFT) within the generalized gradient approximation (Perdew-Wang 91 parameterization of the
exchange correlation potential) to estimate migration barriers and to calculate defect formation
energies in B2-NiAl. To this end, we used the VASP plane-wave pseudopotential code [90,91]
and treated the core-electron interactions with the projector augmented wave (PAW) method
[89,92]. For the Ni atoms, the 3p semi-core states were treated as valence states. The k point-
grids were sampled with the Monkhorst and Pack method [116] and partial occupancy at the
Fermi level was treated with the method of Methfessel and Paxton [117]. A plane-wave basis set
cutoff energy of 500eV was used. The ionic positions and the lattice parameters of each structure
were fully relaxed. Convergence tests of the energy with respect to k point grids indicated that k-
point sampling errors are less than 5 meV per Ni xNiAl xAl ∅ xV formula unit, where ∅ stands for
a vacancy.
As magnetism can play a role in affecting total energies of alloys containing Ni, we
compared energies of the experimentally observed compounds in the Ni-Al system calculated
with and without spin-polarization (ferromagnetic ordering). While spin-polarization affects the
energies of pure Ni and L12 Ni3Al, the maximum difference between the spin-polarized and non-
spin-polarized total energies was found to be less than 0.5 meV/site for fcc Al, D011 NiAl3, D519
Ni2Al3 and “Pt5Ga3” type Ni5Al3. No difference was found between spin polarized and non-spin
polarized energies for B2 NiAl. We therefore neglected spin polarization in the calculation of
migration barriers and the energies of different point defect configurations in B2-NiAl.
We used the nudged elastic band method to calculate migration barriers. For some atomic
hop mechanisms, though, the activated state is at a high symmetry point and there is no need to
use the nudged elastic band method to calculate the barrier height. In these cases, we directly
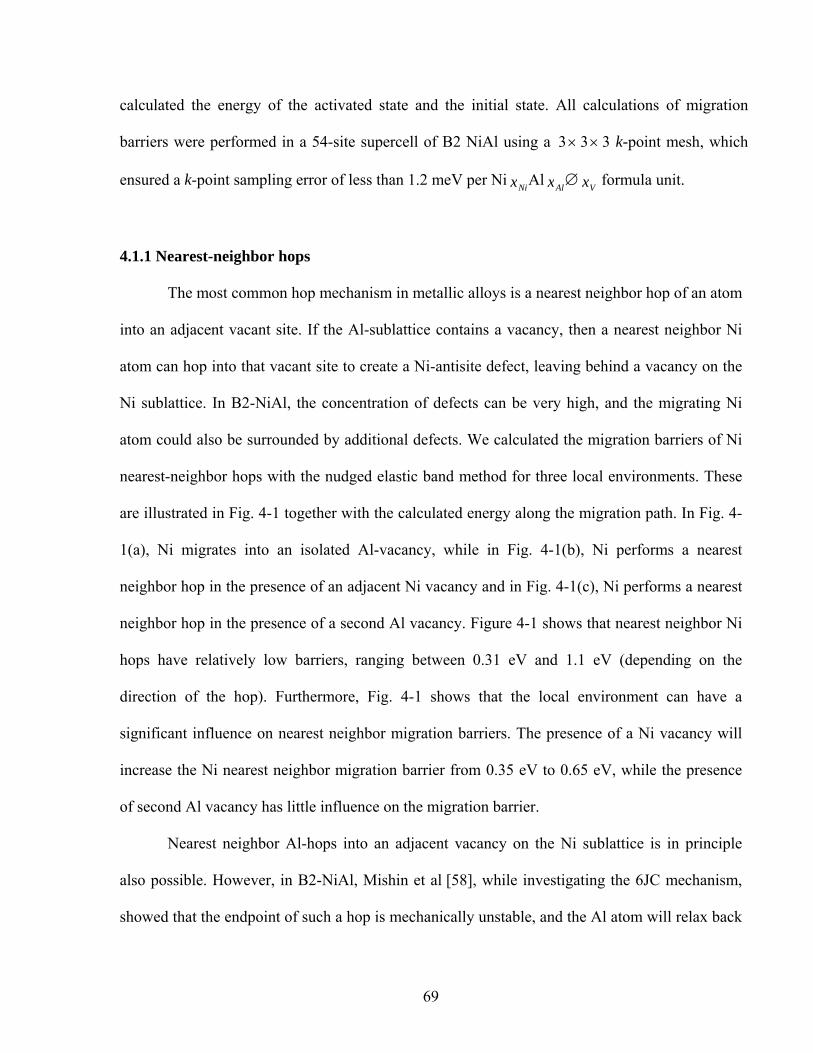
69
calculated the energy of the activated state and the initial state. All calculations of migration
barriers were performed in a 54-site supercell of B2 NiAl using a 3× 3× 3 k-point mesh, which
ensured a k-point sampling error of less than 1.2 meV per Ni xNiAl xAl ∅ xV formula unit.
4.1.1 Nearest-neighbor hops
The most common hop mechanism in metallic alloys is a nearest neighbor hop of an atom
into an adjacent vacant site. If the Al-sublattice contains a vacancy, then a nearest neighbor Ni
atom can hop into that vacant site to create a Ni-antisite defect, leaving behind a vacancy on the
Ni sublattice. In B2-NiAl, the concentration of defects can be very high, and the migrating Ni
atom could also be surrounded by additional defects. We calculated the migration barriers of Ni
nearest-neighbor hops with the nudged elastic band method for three local environments. These
are illustrated in Fig. 4-1 together with the calculated energy along the migration path. In Fig. 4-
1(a), Ni migrates into an isolated Al-vacancy, while in Fig. 4-1(b), Ni performs a nearest
neighbor hop in the presence of an adjacent Ni vacancy and in Fig. 4-1(c), Ni performs a nearest
neighbor hop in the presence of a second Al vacancy. Figure 4-1 shows that nearest neighbor Ni
hops have relatively low barriers, ranging between 0.31 eV and 1.1 eV (depending on the
direction of the hop). Furthermore, Fig. 4-1 shows that the local environment can have a
significant influence on nearest neighbor migration barriers. The presence of a Ni vacancy will
increase the Ni nearest neighbor migration barrier from 0.35 eV to 0.65 eV, while the presence
of second Al vacancy has little influence on the migration barrier.
Nearest neighbor Al-hops into an adjacent vacancy on the Ni sublattice is in principle
also possible. However, in B2-NiAl, Mishin et al [58], while investigating the 6JC mechanism,
showed that the endpoint of such a hop is mechanically unstable, and the Al atom will relax back
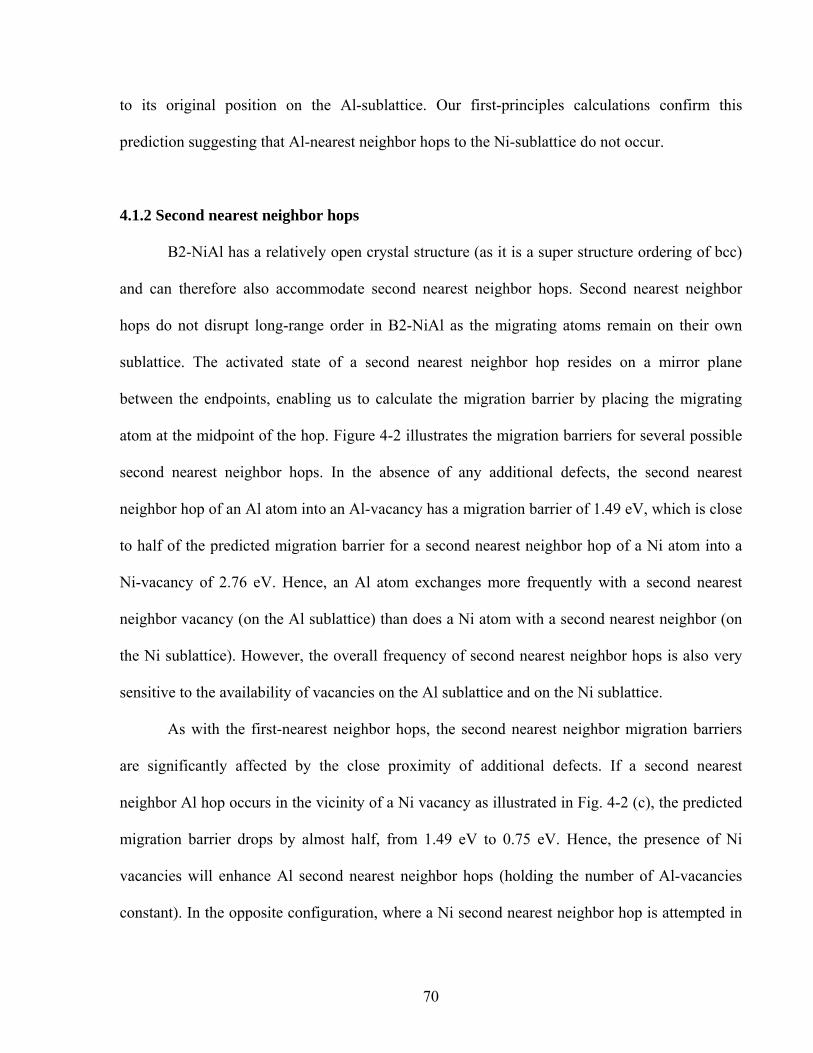
70
to its original position on the Al-sublattice. Our first-principles calculations confirm this
prediction suggesting that Al-nearest neighbor hops to the Ni-sublattice do not occur.
4.1.2 Second nearest neighbor hops
B2-NiAl has a relatively open crystal structure (as it is a super structure ordering of bcc)
and can therefore also accommodate second nearest neighbor hops. Second nearest neighbor
hops do not disrupt long-range order in B2-NiAl as the migrating atoms remain on their own
sublattice. The activated state of a second nearest neighbor hop resides on a mirror plane
between the endpoints, enabling us to calculate the migration barrier by placing the migrating
atom at the midpoint of the hop. Figure 4-2 illustrates the migration barriers for several possible
second nearest neighbor hops. In the absence of any additional defects, the second nearest
neighbor hop of an Al atom into an Al-vacancy has a migration barrier of 1.49 eV, which is close
to half of the predicted migration barrier for a second nearest neighbor hop of a Ni atom into a
Ni-vacancy of 2.76 eV. Hence, an Al atom exchanges more frequently with a second nearest
neighbor vacancy (on the Al sublattice) than does a Ni atom with a second nearest neighbor (on
the Ni sublattice). However, the overall frequency of second nearest neighbor hops is also very
sensitive to the availability of vacancies on the Al sublattice and on the Ni sublattice.
As with the first-nearest neighbor hops, the second nearest neighbor migration barriers
are significantly affected by the close proximity of additional defects. If a second nearest
neighbor Al hop occurs in the vicinity of a Ni vacancy as illustrated in Fig. 4-2 (c), the predicted
migration barrier drops by almost half, from 1.49 eV to 0.75 eV. Hence, the presence of Ni
vacancies will enhance Al second nearest neighbor hops (holding the number of Al-vacancies
constant). In the opposite configuration, where a Ni second nearest neighbor hop is attempted in
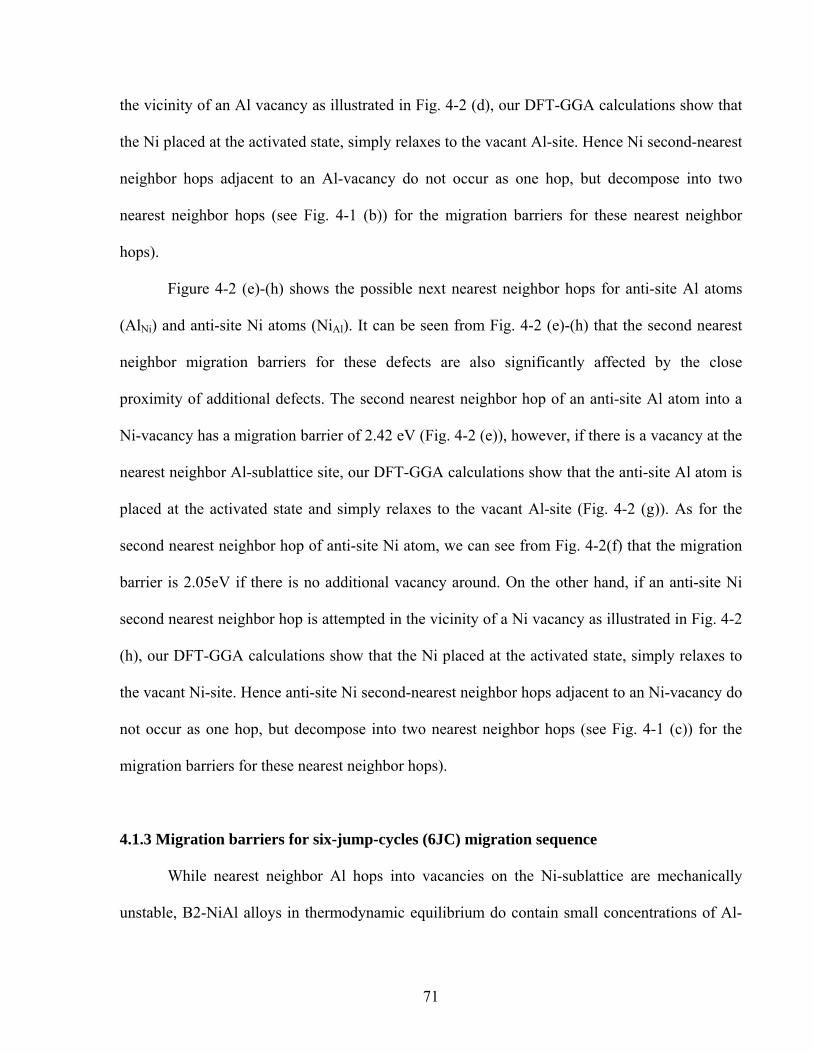
71
the vicinity of an Al vacancy as illustrated in Fig. 4-2 (d), our DFT-GGA calculations show that
the Ni placed at the activated state, simply relaxes to the vacant Al-site. Hence Ni second-nearest
neighbor hops adjacent to an Al-vacancy do not occur as one hop, but decompose into two
nearest neighbor hops (see Fig. 4-1 (b)) for the migration barriers for these nearest neighbor
hops).
Figure 4-2 (e)-(h) shows the possible next nearest neighbor hops for anti-site Al atoms
(AlNi) and anti-site Ni atoms (NiAl). It can be seen from Fig. 4-2 (e)-(h) that the second nearest
neighbor migration barriers for these defects are also significantly affected by the close
proximity of additional defects. The second nearest neighbor hop of an anti-site Al atom into a
Ni-vacancy has a migration barrier of 2.42 eV (Fig. 4-2 (e)), however, if there is a vacancy at the
nearest neighbor Al-sublattice site, our DFT-GGA calculations show that the anti-site Al atom is
placed at the activated state and simply relaxes to the vacant Al-site (Fig. 4-2 (g)). As for the
second nearest neighbor hop of anti-site Ni atom, we can see from Fig. 4-2(f) that the migration
barrier is 2.05eV if there is no additional vacancy around. On the other hand, if an anti-site Ni
second nearest neighbor hop is attempted in the vicinity of a Ni vacancy as illustrated in Fig. 4-2
(h), our DFT-GGA calculations show that the Ni placed at the activated state, simply relaxes to
the vacant Ni-site. Hence anti-site Ni second-nearest neighbor hops adjacent to an Ni-vacancy do
not occur as one hop, but decompose into two nearest neighbor hops (see Fig. 4-1 (c)) for the
migration barriers for these nearest neighbor hops).
4.1.3 Migration barriers for six-jump-cycles (6JC) migration sequence
While nearest neighbor Al hops into vacancies on the Ni-sublattice are mechanically
unstable, B2-NiAl alloys in thermodynamic equilibrium do contain small concentrations of Al-
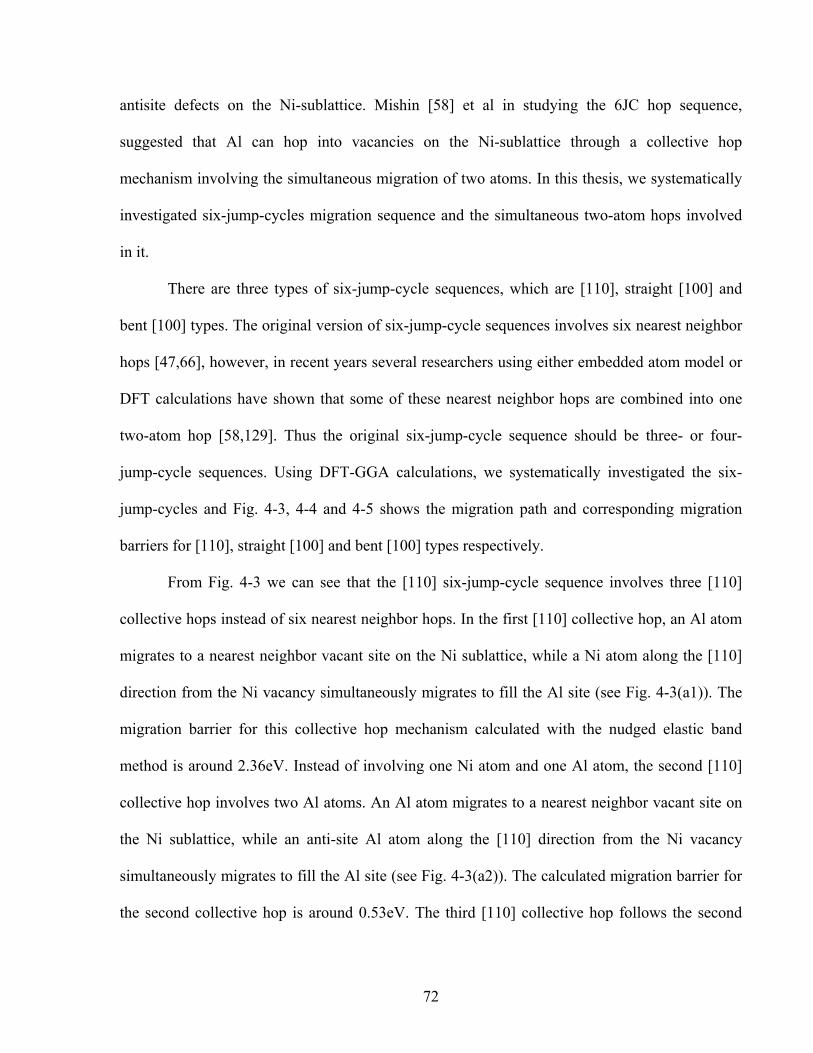
72
antisite defects on the Ni-sublattice. Mishin [58] et al in studying the 6JC hop sequence,
suggested that Al can hop into vacancies on the Ni-sublattice through a collective hop
mechanism involving the simultaneous migration of two atoms. In this thesis, we systematically
investigated six-jump-cycles migration sequence and the simultaneous two-atom hops involved
in it.
There are three types of six-jump-cycle sequences, which are [110], straight [100] and
bent [100] types. The original version of six-jump-cycle sequences involves six nearest neighbor
hops [47,66], however, in recent years several researchers using either embedded atom model or
DFT calculations have shown that some of these nearest neighbor hops are combined into one
two-atom hop [58,129]. Thus the original six-jump-cycle sequence should be three- or four-
jump-cycle sequences. Using DFT-GGA calculations, we systematically investigated the six-
jump-cycles and Fig. 4-3, 4-4 and 4-5 shows the migration path and corresponding migration
barriers for [110], straight [100] and bent [100] types respectively.
From Fig. 4-3 we can see that the [110] six-jump-cycle sequence involves three [110]
collective hops instead of six nearest neighbor hops. In the first [110] collective hop, an Al atom
migrates to a nearest neighbor vacant site on the Ni sublattice, while a Ni atom along the [110]
direction from the Ni vacancy simultaneously migrates to fill the Al site (see Fig. 4-3(a1)). The
migration barrier for this collective hop mechanism calculated with the nudged elastic band
method is around 2.36eV. Instead of involving one Ni atom and one Al atom, the second [110]
collective hop involves two Al atoms. An Al atom migrates to a nearest neighbor vacant site on
the Ni sublattice, while an anti-site Al atom along the [110] direction from the Ni vacancy
simultaneously migrates to fill the Al site (see Fig. 4-3(a2)). The calculated migration barrier for
the second collective hop is around 0.53eV. The third [110] collective hop follows the second
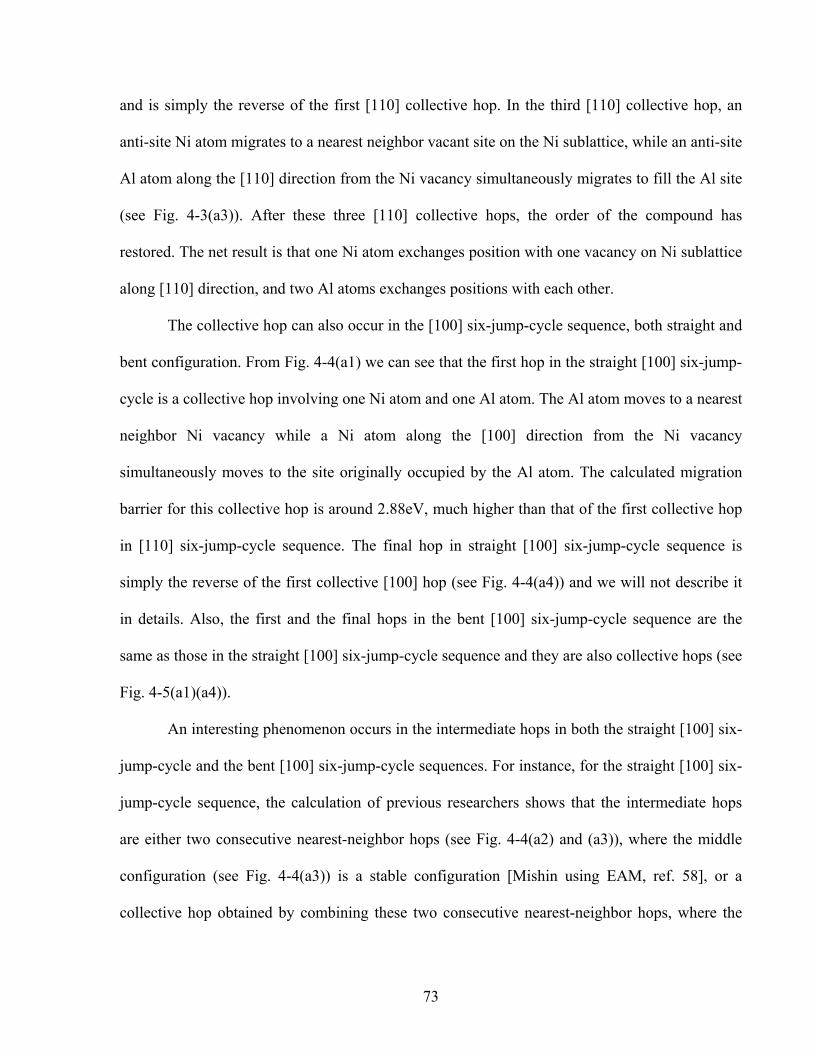
73
and is simply the reverse of the first [110] collective hop. In the third [110] collective hop, an
anti-site Ni atom migrates to a nearest neighbor vacant site on the Ni sublattice, while an anti-site
Al atom along the [110] direction from the Ni vacancy simultaneously migrates to fill the Al site
(see Fig. 4-3(a3)). After these three [110] collective hops, the order of the compound has
restored. The net result is that one Ni atom exchanges position with one vacancy on Ni sublattice
along [110] direction, and two Al atoms exchanges positions with each other.
The collective hop can also occur in the [100] six-jump-cycle sequence, both straight and
bent configuration. From Fig. 4-4(a1) we can see that the first hop in the straight [100] six-jump-
cycle is a collective hop involving one Ni atom and one Al atom. The Al atom moves to a nearest
neighbor Ni vacancy while a Ni atom along the [100] direction from the Ni vacancy
simultaneously moves to the site originally occupied by the Al atom. The calculated migration
barrier for this collective hop is around 2.88eV, much higher than that of the first collective hop
in [110] six-jump-cycle sequence. The final hop in straight [100] six-jump-cycle sequence is
simply the reverse of the first collective [100] hop (see Fig. 4-4(a4)) and we will not describe it
in details. Also, the first and the final hops in the bent [100] six-jump-cycle sequence are the
same as those in the straight [100] six-jump-cycle sequence and they are also collective hops (see
Fig. 4-5(a1)(a4)).
An interesting phenomenon occurs in the intermediate hops in both the straight [100] six-
jump-cycle and the bent [100] six-jump-cycle sequences. For instance, for the straight [100] six-
jump-cycle sequence, the calculation of previous researchers shows that the intermediate hops
are either two consecutive nearest-neighbor hops (see Fig. 4-4(a2) and (a3)), where the middle
configuration (see Fig. 4-4(a3)) is a stable configuration [Mishin using EAM, ref. 58], or a
collective hop obtained by combining these two consecutive nearest-neighbor hops, where the
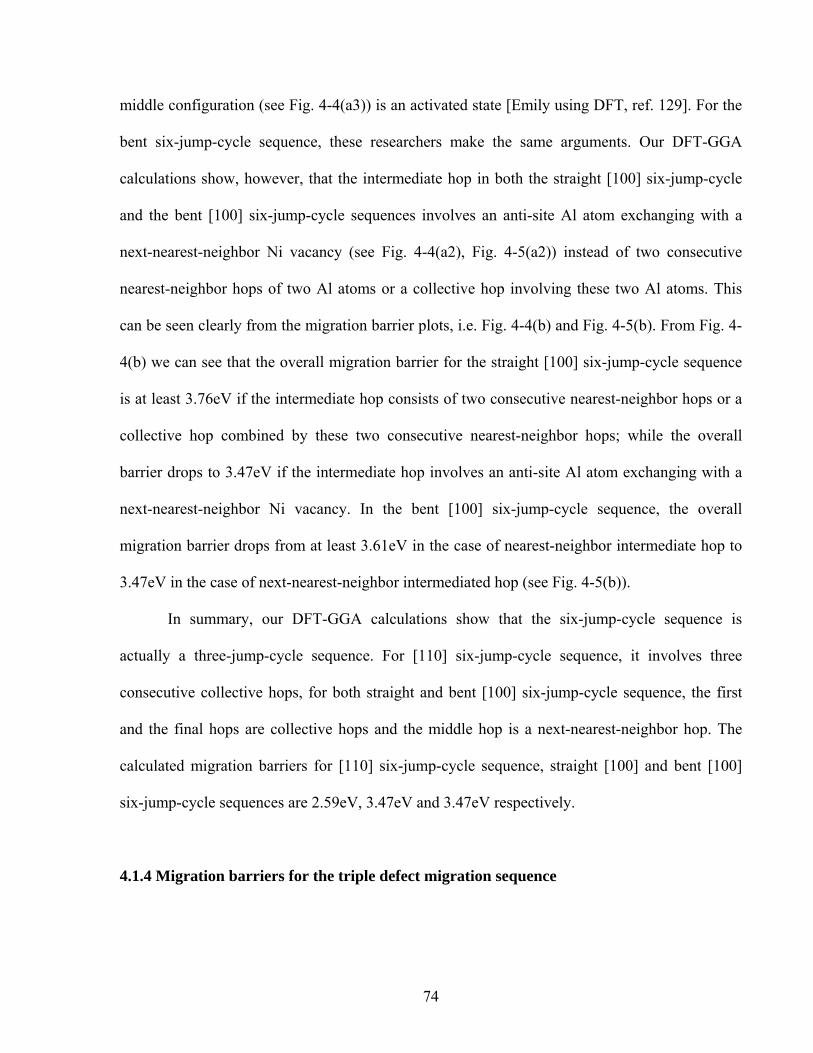
74
middle configuration (see Fig. 4-4(a3)) is an activated state [Emily using DFT, ref. 129]. For the
bent six-jump-cycle sequence, these researchers make the same arguments. Our DFT-GGA
calculations show, however, that the intermediate hop in both the straight [100] six-jump-cycle
and the bent [100] six-jump-cycle sequences involves an anti-site Al atom exchanging with a
next-nearest-neighbor Ni vacancy (see Fig. 4-4(a2), Fig. 4-5(a2)) instead of two consecutive
nearest-neighbor hops of two Al atoms or a collective hop involving these two Al atoms. This
can be seen clearly from the migration barrier plots, i.e. Fig. 4-4(b) and Fig. 4-5(b). From Fig. 4-
4(b) we can see that the overall migration barrier for the straight [100] six-jump-cycle sequence
is at least 3.76eV if the intermediate hop consists of two consecutive nearest-neighbor hops or a
collective hop combined by these two consecutive nearest-neighbor hops; while the overall
barrier drops to 3.47eV if the intermediate hop involves an anti-site Al atom exchanging with a
next-nearest-neighbor Ni vacancy. In the bent [100] six-jump-cycle sequence, the overall
migration barrier drops from at least 3.61eV in the case of nearest-neighbor intermediate hop to
3.47eV in the case of next-nearest-neighbor intermediated hop (see Fig. 4-5(b)).
In summary, our DFT-GGA calculations show that the six-jump-cycle sequence is
actually a three-jump-cycle sequence. For [110] six-jump-cycle sequence, it involves three
consecutive collective hops, for both straight and bent [100] six-jump-cycle sequence, the first
and the final hops are collective hops and the middle hop is a next-nearest-neighbor hop. The
calculated migration barriers for [110] six-jump-cycle sequence, straight [100] and bent [100]
six-jump-cycle sequences are 2.59eV, 3.47eV and 3.47eV respectively.
4.1.4 Migration barriers for the triple defect migration sequence
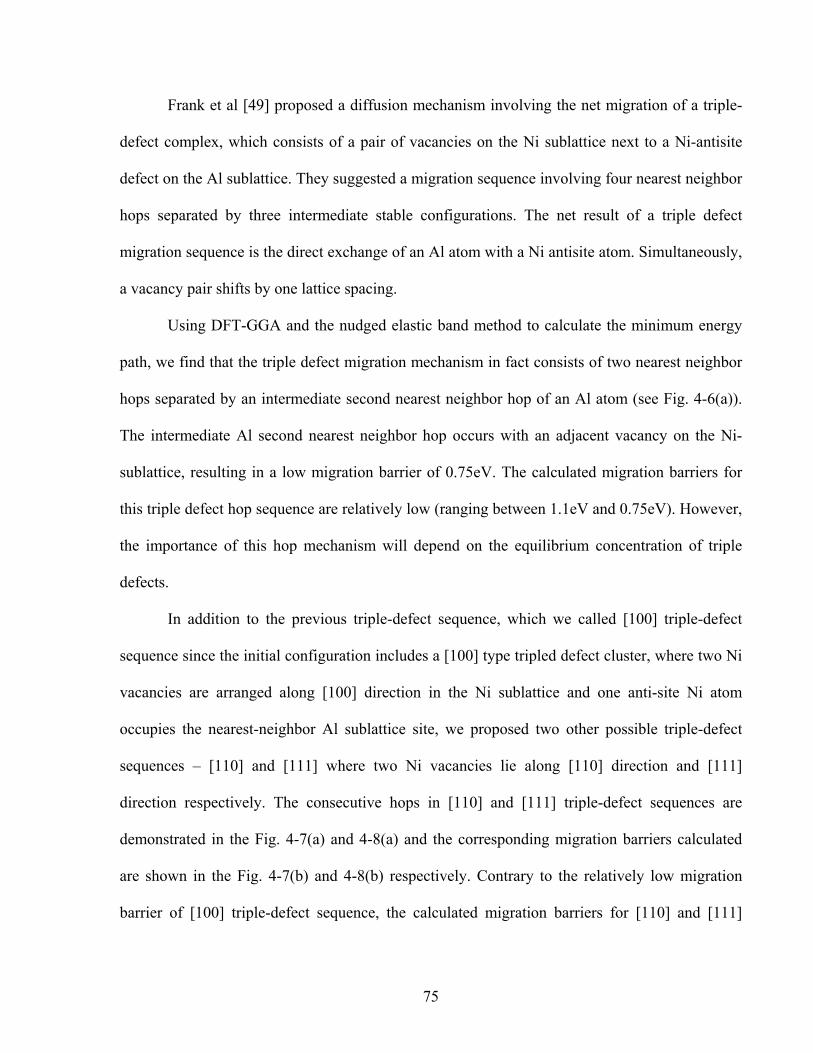
75
Frank et al [49] proposed a diffusion mechanism involving the net migration of a triple-
defect complex, which consists of a pair of vacancies on the Ni sublattice next to a Ni-antisite
defect on the Al sublattice. They suggested a migration sequence involving four nearest neighbor
hops separated by three intermediate stable configurations. The net result of a triple defect
migration sequence is the direct exchange of an Al atom with a Ni antisite atom. Simultaneously,
a vacancy pair shifts by one lattice spacing.
Using DFT-GGA and the nudged elastic band method to calculate the minimum energy
path, we find that the triple defect migration mechanism in fact consists of two nearest neighbor
hops separated by an intermediate second nearest neighbor hop of an Al atom (see Fig. 4-6(a)).
The intermediate Al second nearest neighbor hop occurs with an adjacent vacancy on the Ni-
sublattice, resulting in a low migration barrier of 0.75eV. The calculated migration barriers for
this triple defect hop sequence are relatively low (ranging between 1.1eV and 0.75eV). However,
the importance of this hop mechanism will depend on the equilibrium concentration of triple
defects.
In addition to the previous triple-defect sequence, which we called [100] triple-defect
sequence since the initial configuration includes a [100] type tripled defect cluster, where two Ni
vacancies are arranged along [100] direction in the Ni sublattice and one anti-site Ni atom
occupies the nearest-neighbor Al sublattice site, we proposed two other possible triple-defect
sequences – [110] and [111] where two Ni vacancies lie along [110] direction and [111]
direction respectively. The consecutive hops in [110] and [111] triple-defect sequences are
demonstrated in the Fig. 4-7(a) and 4-8(a) and the corresponding migration barriers calculated
are shown in the Fig. 4-7(b) and 4-8(b) respectively. Contrary to the relatively low migration
barrier of [100] triple-defect sequence, the calculated migration barriers for [110] and [111]
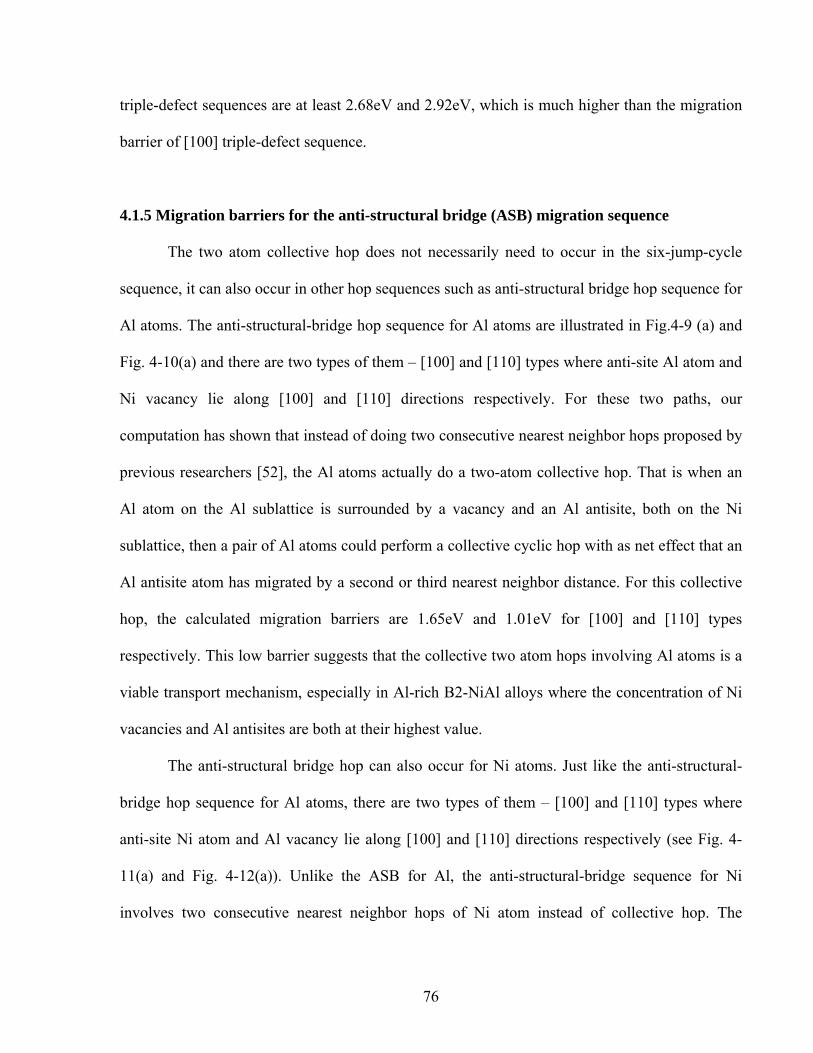
76
triple-defect sequences are at least 2.68eV and 2.92eV, which is much higher than the migration
barrier of [100] triple-defect sequence.
4.1.5 Migration barriers for the anti-structural bridge (ASB) migration sequence
The two atom collective hop does not necessarily need to occur in the six-jump-cycle
sequence, it can also occur in other hop sequences such as anti-structural bridge hop sequence for
Al atoms. The anti-structural-bridge hop sequence for Al atoms are illustrated in Fig.4-9 (a) and
Fig. 4-10(a) and there are two types of them – [100] and [110] types where anti-site Al atom and
Ni vacancy lie along [100] and [110] directions respectively. For these two paths, our
computation has shown that instead of doing two consecutive nearest neighbor hops proposed by
previous researchers [52], the Al atoms actually do a two-atom collective hop. That is when an
Al atom on the Al sublattice is surrounded by a vacancy and an Al antisite, both on the Ni
sublattice, then a pair of Al atoms could perform a collective cyclic hop with as net effect that an
Al antisite atom has migrated by a second or third nearest neighbor distance. For this collective
hop, the calculated migration barriers are 1.65eV and 1.01eV for [100] and [110] types
respectively. This low barrier suggests that the collective two atom hops involving Al atoms is a
viable transport mechanism, especially in Al-rich B2-NiAl alloys where the concentration of Ni
vacancies and Al antisites are both at their highest value.
The anti-structural bridge hop can also occur for Ni atoms. Just like the anti-structural-
bridge hop sequence for Al atoms, there are two types of them – [100] and [110] types where
anti-site Ni atom and Al vacancy lie along [100] and [110] directions respectively (see Fig. 4-
11(a) and Fig. 4-12(a)). Unlike the ASB for Al, the anti-structural-bridge sequence for Ni
involves two consecutive nearest neighbor hops of Ni atom instead of collective hop. The
77
calculated corresponding migration barriers are 0.71eV and 1.01eV (see Fig. 4-11(b) and Fig. 4-
12(b)) for [100] and [110] type respectively. This low barrier suggests that the anti-structural
bridge hop involving Ni atoms is a viable transport mechanism for Ni atoms, especially in Ni-
rich B2-NiAl alloys where the concentration of Ni antisites is relatively high.
4.2 Defect concentration at finite temperature
B2-NiAl offers a variety of viable atomic transport mechanisms that include nearest
neighbor hops, second nearest neighbor hops, collective two atom hops as well as complex hop
sequences. However, the importance of these hop mechanisms is not only determined by low
migration barriers but also by the availability of particular defects or defect complexes. In this
section, we investigate the concentration of relevant defects and defect complexes in B2-NiAl at
finite temperature as a function of alloy concentration using grand canonical Monte Carlo
simulations applied to a cluster expansion. The parameters of the cluster expansion are fit to the
first-principles energies of different defect arrangements in B2-NiAl.
4.2.1 First-principles configurational energies
Ni-Al system is a complicated system and it has many order phases, which can be seen
from its experiment phase diagram (Fig. 4-13) [131]. From the phase diagram we can see that as
the concentration of Ni atom is increasing, many ordered phases are present. Also, many of the
ordered phases cannot accommodate large off-stoichiometry and some of them are even line
compounds. However, B2-NiAl, which we are interested in, can accommodate large off-
stoichiometry. The reason for this phenomenon will be clear after we calculate the formation
energies of various configurations in Ni-Al system.
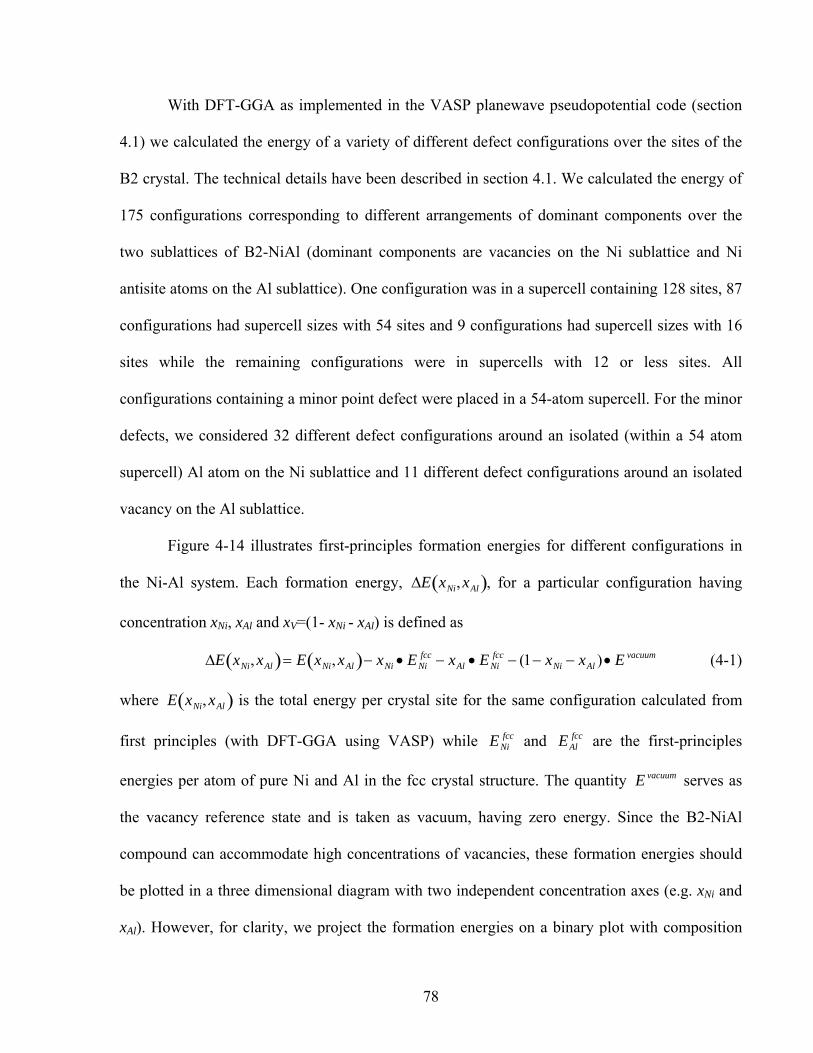
78
With DFT-GGA as implemented in the VASP planewave pseudopotential code (section
4.1) we calculated the energy of a variety of different defect configurations over the sites of the
B2 crystal. The technical details have been described in section 4.1. We calculated the energy of
175 configurations corresponding to different arrangements of dominant components over the
two sublattices of B2-NiAl (dominant components are vacancies on the Ni sublattice and Ni
antisite atoms on the Al sublattice). One configuration was in a supercell containing 128 sites, 87
configurations had supercell sizes with 54 sites and 9 configurations had supercell sizes with 16
sites while the remaining configurations were in supercells with 12 or less sites. All
configurations containing a minor point defect were placed in a 54-atom supercell. For the minor
defects, we considered 32 different defect configurations around an isolated (within a 54 atom
supercell) Al atom on the Ni sublattice and 11 different defect configurations around an isolated
vacancy on the Al sublattice.
Figure 4-14 illustrates first-principles formation energies for different configurations in
the Ni-Al system. Each formation energy, ΔE xNi,xAl( ), for a particular configuration having
concentration xNi, xAl and xV=(1- xNi - xAl) is defined as
ΔE xNi, xAl( )= E xNi, xAl( )− xNi • ENifcc − xAl • ENi
fcc − (1− xNi − xAl ) • E vacuum (4-1)
where E xNi,xAl( ) is the total energy per crystal site for the same configuration calculated from
first principles (with DFT-GGA using VASP) while ENifcc and EAl
fcc are the first-principles
energies per atom of pure Ni and Al in the fcc crystal structure. The quantity E vacuum serves as
the vacancy reference state and is taken as vacuum, having zero energy. Since the B2-NiAl
compound can accommodate high concentrations of vacancies, these formation energies should
be plotted in a three dimensional diagram with two independent concentration axes (e.g. xNi and
xAl). However, for clarity, we project the formation energies on a binary plot with composition
79
axis x = xNi xAl + xNi( ). Also plotted in Fig. 4-14 are formation energies for other compounds
observed experimentally in the Ni-Al system (see Fig. 4-13) [130,131]. These include D011
NiAl3, D519 Ni2Al3, “Pt5Ga3” type Ni5Al3 and L12 Ni3Al. The formation energies of these
experimentally observed compounds together with that of B2-NiAl form a convex hull,
illustrating that DFT within the generalized gradient approximation correctly predicts the relative
stability of the intermetallic compounds in the Ni-Al system at zero Kelvin. In addition, we
found that the “Ni3Ga4” type Ni3Al4 (this is also a B2 based configuration with ordered Ni
vacancies in a 128 site supercell with stoichiometric formula Ni48Al64∅16) also resides on the
ternary convex hull in xNi, xAl and xV=(1- xNi - xAl) composition space, consistent with the
experimental observations of this structure [130]. As is clear in Fig. 4-14, many of the B2-NiAl
based configurations are close to the convex hull, suggesting that configurational disorder within
this compound can be easily excited at finite temperature.
4.2.2 Cluster expansions
A cluster expansion for the dominant components of B2-NiAl (Ni and vacancies on the
Ni sublattice and Ni and Al on the Al sublattice) was constructed by fitting to the first principles
formation energies of 175 fully relaxed Ni-Al-vacancy configurations. By minimizing a leave-
many-out cross-validation score using a genetic algorithm [94,102], an optimal set of clusters
was selected from a total of 47 candidates. The cluster expansion includes 1 empty cluster, 2
points (for the Al and Ni sublattice sites), 14 pairs, 8 triplets and 1 quadruplet (see Fig. 4-15). As
a measure of the accuracy of the cluster expansion, the root-mean-square (rms) error between
first-principles energies and the cluster-expanded energies for all the structures used in the fit is 3
80
meV per site. Furthermore, as a measure of its ability to predict energies of configurations not
included in the fit, the leave-one-out cross validation score is 4 meV per site.
We determined the local ECI (LECI) of the local cluster expansions for minor point
defects in B2-NiAl (Al on the Ni sublattice and V on the Al sublattice) by fitting to the effective
minor point defect formation energies (ΔEiVAl for VAl and ΔE j
AlNi for AlNi, see section 2.3.3) for
different configurations around an isolated minor point defect within B2 (32 configurations for
AlNi and 11 configurations for VAl, all calculated in 54 atom supercells). Due to the small number
of configurations, a leave-one-out cross validation score was minimized using a genetic
algorithm to select an optimal set of clusters from 42 candidates. For AlNi the optimal set
includes the empty cluster along with 5 point and 3 pair clusters (Fig. 4-16(a)) and for VAl the
optimal set includes the empty cluster and one point cluster (Fig. 4-16(b)).
By combining the local cluster expansions for ΔEiVAl and ΔE j
AlNi with the binary coupled-
sublattice cluster expansion as described in section 2.3, it is possible to calculate the energy of
any configuration of Ni, Al and vacancies within the B2 compound, provided the minor defects
are separated far enough not to interact with each other (as measured by the largest pair cluster of
the binary coupled-sublattice cluster expansion). The accuracy of the combined cluster
expansions is reflected by a 2 meV per site root mean square error between the cluster expanded
and first-principles energies of 43 configurations with one minor defect.
4.2.3 Monte Carlo simulations
The coupled-sublattice cluster expansion and local cluster expansions were implemented
in grand canonical Monte Carlo simulations. A Monte Carlo supercell containing 12x12x12 B2-
NiAl unit cells (M=3456 sites) was used with as thermodynamic boundary conditions the
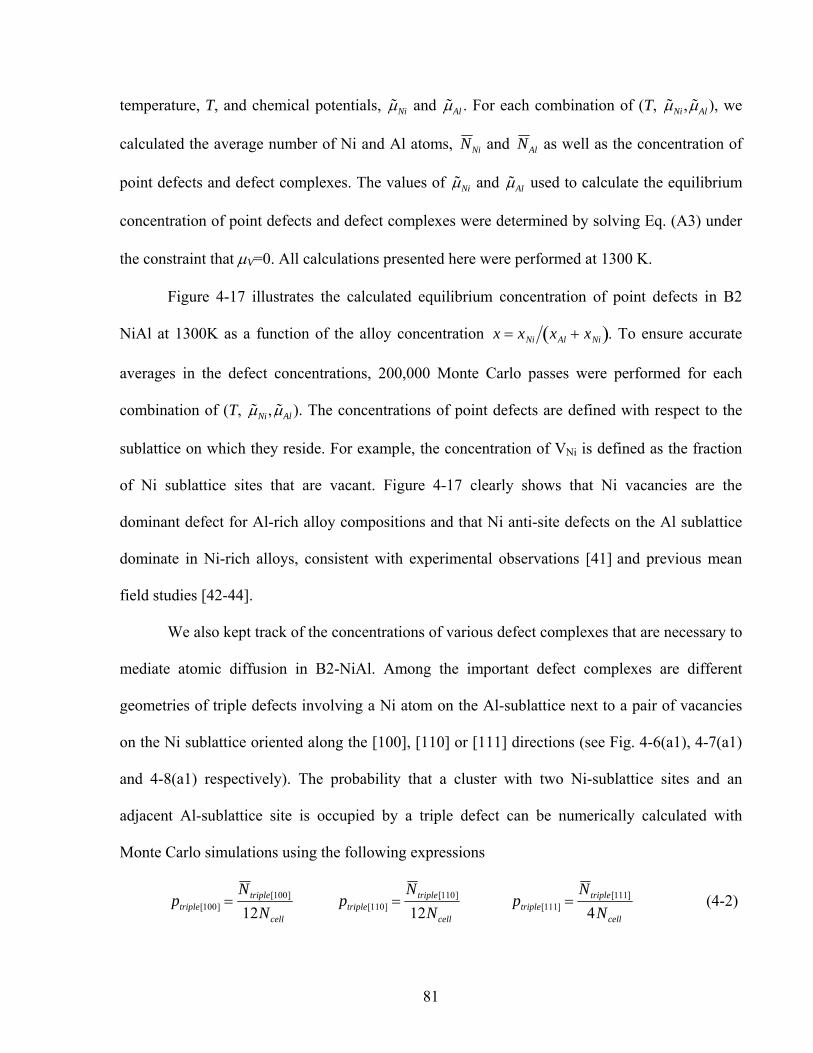
81
temperature, T, and chemical potentials, ˜ μ Ni and ˜ μ Al . For each combination of (T, ˜ μ Ni , ˜ μ Al ), we
calculated the average number of Ni and Al atoms, N Ni and N Al as well as the concentration of
point defects and defect complexes. The values of ˜ μ Ni and ˜ μ Al used to calculate the equilibrium
concentration of point defects and defect complexes were determined by solving Eq. (A3) under
the constraint that μV=0. All calculations presented here were performed at 1300 K.
Figure 4-17 illustrates the calculated equilibrium concentration of point defects in B2
NiAl at 1300K as a function of the alloy concentration x = xNi xAl + xNi( ). To ensure accurate
averages in the defect concentrations, 200,000 Monte Carlo passes were performed for each
combination of (T, ˜ μ Ni , ˜ μ Al ). The concentrations of point defects are defined with respect to the
sublattice on which they reside. For example, the concentration of VNi is defined as the fraction
of Ni sublattice sites that are vacant. Figure 4-17 clearly shows that Ni vacancies are the
dominant defect for Al-rich alloy compositions and that Ni anti-site defects on the Al sublattice
dominate in Ni-rich alloys, consistent with experimental observations [41] and previous mean
field studies [42-44].
We also kept track of the concentrations of various defect complexes that are necessary to
mediate atomic diffusion in B2-NiAl. Among the important defect complexes are different
geometries of triple defects involving a Ni atom on the Al-sublattice next to a pair of vacancies
on the Ni sublattice oriented along the [100], [110] or [111] directions (see Fig. 4-6(a1), 4-7(a1)
and 4-8(a1) respectively). The probability that a cluster with two Ni-sublattice sites and an
adjacent Al-sublattice site is occupied by a triple defect can be numerically calculated with
Monte Carlo simulations using the following expressions
ptriple[100] =N triple[100]
12Ncell
ptriple[110] =N triple[110]
12Ncell
ptriple[111] =N triple[111]
4Ncell
(4-2)
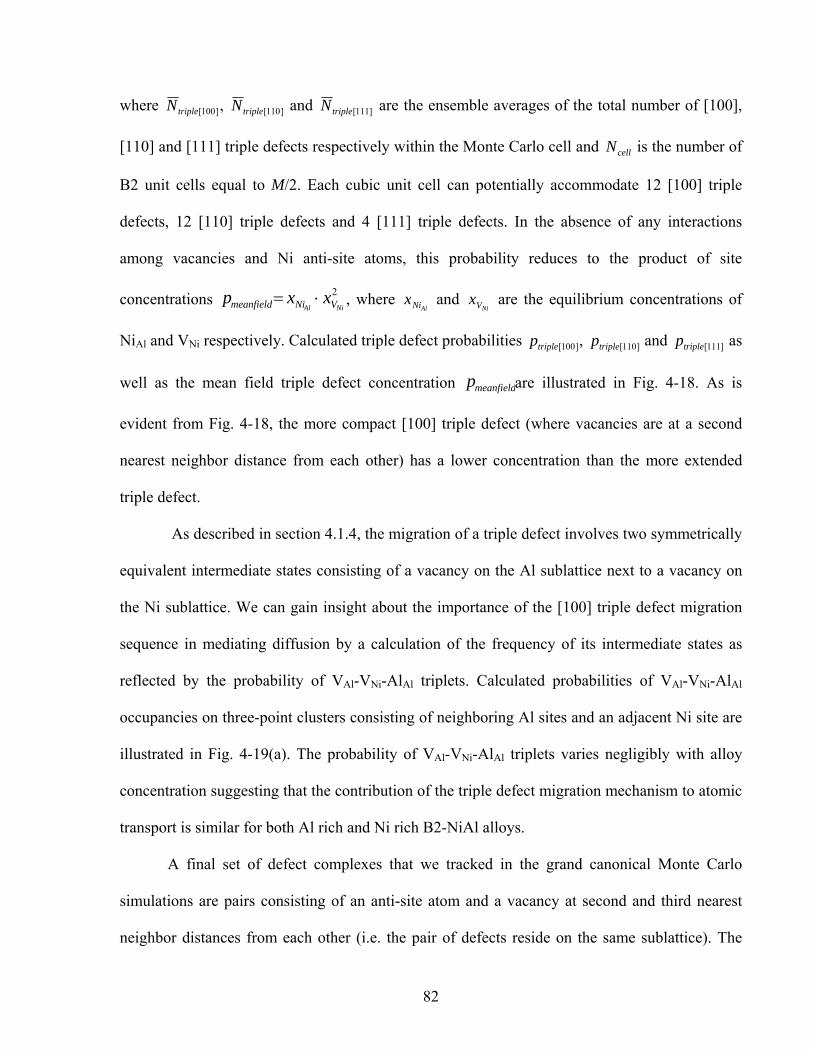
82
where N triple[100], N triple[110] and N triple[111] are the ensemble averages of the total number of [100],
[110] and [111] triple defects respectively within the Monte Carlo cell and Ncell is the number of
B2 unit cells equal to M/2. Each cubic unit cell can potentially accommodate 12 [100] triple
defects, 12 [110] triple defects and 4 [111] triple defects. In the absence of any interactions
among vacancies and Ni anti-site atoms, this probability reduces to the product of site
concentrations pmeanfield= xNiAl⋅ xVNi
2 , where xNiAl and xVNi
are the equilibrium concentrations of
NiAl and VNi respectively. Calculated triple defect probabilities ptriple[100], ptriple[110] and ptriple[111] as
well as the mean field triple defect concentration pmeanfieldare illustrated in Fig. 4-18. As is
evident from Fig. 4-18, the more compact [100] triple defect (where vacancies are at a second
nearest neighbor distance from each other) has a lower concentration than the more extended
triple defect.
As described in section 4.1.4, the migration of a triple defect involves two symmetrically
equivalent intermediate states consisting of a vacancy on the Al sublattice next to a vacancy on
the Ni sublattice. We can gain insight about the importance of the [100] triple defect migration
sequence in mediating diffusion by a calculation of the frequency of its intermediate states as
reflected by the probability of VAl-VNi-AlAl triplets. Calculated probabilities of VAl-VNi-AlAl
occupancies on three-point clusters consisting of neighboring Al sites and an adjacent Ni site are
illustrated in Fig. 4-19(a). The probability of VAl-VNi-AlAl triplets varies negligibly with alloy
concentration suggesting that the contribution of the triple defect migration mechanism to atomic
transport is similar for both Al rich and Ni rich B2-NiAl alloys.
A final set of defect complexes that we tracked in the grand canonical Monte Carlo
simulations are pairs consisting of an anti-site atom and a vacancy at second and third nearest
neighbor distances from each other (i.e. the pair of defects reside on the same sublattice). The
83
existence of these pairs is of importance in mediating the anti-structural bridge mechanisms of
diffusion in off-stoichiometric alloys in which vacancies diffuse along percolating networks of
anti-site atoms. Figure 4-19(b) illustrates probabilities that second nearest and third nearest
neighbor clusters are occupied by a Ni-vacancy and an Al anti site, while Fig. 4-19(c) illustrates
the probabilities that such clusters are occupied by an Al vacancy and a Ni anti-site atom. The
higher these probabilities, the more likely an anti-structural bridge diffusion mechanism can
contribute to atomic transport. As is clear from Fig. 4-19(c), the probability that a pair
connecting Al-sublattice sites is occupied by a Ni anti-site atom and an Al vacancy increases as
B2-NiAl becomes more Ni rich. The probability that a pair connecting Ni-sublattice sites is
occupied by an Al anti-site atom and a Ni-vacancy has a more complex dependence on alloy
concentration, Fig. 4-19(b), showing a minimum at the stoichiometric composition and increase
both for Al-rich and Ni-rich alloys.
4.3 Discussion
Measured interdiffusion coefficients in B2-NiAl show a strong dependence on alloy
concentration, exhibiting a minimum around the NiAl stoichiometry [49,50,59,62,132]. This
dependence on concentration is undoubtedly due to a variation in the equilibrium concentration
of the different point defects and defect clusters that mediate atomic diffusion. Recent
measurements of Paul et al [59] showed that the mobility of Al and Ni, as reflected by self-
diffusion coefficients, are similar around the stoichiometric composition but differ substantially
away from stoichiometry. In Al-rich alloys of B2-NiAl, the Al self-diffusion coefficient is
significantly larger than the Ni self-diffusion coefficient, while in Ni-rich alloys the trend is
reversed, albeit that the Ni self-diffusion coefficient is only slightly larger than that of Al [59].
84
Our first-principles analysis of atomic hop mechanisms in B2-NiAl of section 4.1 sheds
light on those mechanisms that are likely to contribute significantly to macroscopic transport. We
find for example that nearest neighbor Ni-vacancy exchanges have relatively low migration
barriers (ranging from 0.31-1.1 eV, see Fig. 4-1) and confirm that nearest neighbor Al-vacancy
exchanges cannot occur in B2-NiAl as was first discovered by Mishin et al [58]. We also predict
that the migration barrier for Al second nearest neighbor hops (1.49 eV) is about half that for Ni
second nearest neighbor hops (2.76 eV, see Fig. 4-2). As Al cannot perform nearest neighbor
hops in B2-NiAl, Mishin et al [58] proposed a collective two-atom hop mechanism to enable Al
atoms to migrate from the Al-sublattice to the Ni-sublattice. This mechanism, involving an Al
and a Ni atom, has a relatively high migration barrier (~2.5eV, see Fig. 4-3). In the present work,
however, we found that if the collective two-atom hop involves a pair of Al atoms, one from the
Al sublattice and the other an Al anti-site atom on the Ni sublattice, the migration barrier is
significantly lower, having a value of approximately 1eV (see Fig. 4-10). This result suggests
that the anti-structural bridge mechanism is likely to be very important in mediating diffusion in
Al-rich alloys.
We also showed in section 4-1 that the presence of additional defects in the vicinity of the
hopping atom can have a significant influence on migration barriers. For example, the Ni nearest
neighbor hop barrier is almost doubled in the presence of an adjacent Ni-vacancy (compare Fig.
4-1(a) with Fig. 4-1(b)). The Al second nearest neighbor hop barrier, on the other hand, is
reduced from 1.49 eV to 0.75 eV when it occurs next to a Ni-vacancy (Fig. 4-2). The low nearest
neighbor Ni migration barriers coupled with the low Al second nearest neighbor barrier in the
presence of Ni vacancies renders the triple defect migration sequence of Fig. 4-6 quite favorable
from an energetic point of view. The triple defect migration mechanism predicted in section 4-1
85
(Fig. 4-6) differs from that proposed by Frank et al in that it occurs with only two intermediate
states instead of three and proceeds with a combination of nearest and second nearest neighbor
hops instead of only nearest neighbor hops.
The predicted migration barriers show that there are a variety of migration mechanisms
with relatively low barriers (ranging around 1 eV) and a subset characterized by high migration
barriers (exceeding 2 eV). The migration mechanisms with low barriers, such as the Ni nearest
neighbor hop, the Al second nearest neighbor hop in the presence of a Ni vacancy and the
collective hop involving a pair of Al atoms are likely to dominate in mediating transport,
provided the concentration of defects necessary for these mechanisms are sufficiently high. We
point out that the use of a finite sized supercell for the calculation of migration barriers from first
principles introduces numerical uncertainty on predicted barriers. To estimate the accuracy of
our calculated migration barriers, we calculated the barrier for the Ni-vacancy next-nearest
neighbor hop in both a 3 x 3 x 3 supercell (containing 54 sites) and a 4 x 4 x 4 supercell
containing (128 sites). The predicted barriers are 2.76 eV and 2.53 eV respectively, suggesting a
numerical error of approximately 0.25 eV. While this error is not negligible, it is sufficiently
small to allow us to distinguish between low barrier hop mechanisms (~1 eV) and high barrier
hop mechanisms (~2.5 eV).
Whether or not any of the low barrier migration mechanisms dominate in mediating
atomic diffusion in B2–NiAl depends on the concentration of defects and defect complexes
needed to facilitate those migration mechanisms. To this end, we also investigated the
equilibrium defect concentrations in B2–NiAl by applying Monte Carlo simulations to first-
principles parameterized cluster expansions, thereby rigorously accounting for important
interactions among the various defects in B2–NiAl. Previous investigations of defect
86
concentrations in B2–NiAl relied on a mean field approximation in which interactions among
different defects were neglected [42-44].
A comparison of the defect concentrations calculated in this work (Fig. 4-17) with mean
field predictions [42,43] shows that while the concentrations of NiAl, VNi and VAl are
qualitatively similar in both approaches, they differ for the predicted concentration of AlNi
defects in Ni rich B2-NixAl1-x compounds. For the AlNi defects, our results show an increase in
the AlNi concentration with alloy concentration x above 0.5, while previous mean field analyses
predicted a decrease in the AlNi concentration [42,43]. The increase in the AlNi concentration in
Fig. 4-17 arises from a local attraction between AlNi and NiAl defect pairs. Figure 4-20 shows the
change in energy of a B2-NiAl crystal containing a NiAl – AlNi pair at increasing distance from
each other. The configuration with a first nearest neighbor NiAl – AlNi pair is used as reference
(its energy is arbitrarily set to zero). The solid line shows the energies calculated with GGA in a
3x3x3 B2 NiAl supercell (54 sites) using an energy cutoff of 500 eV and fully relaxing all atoms,
while the dashed line shows the energy of a NiAl – AlNi pair as a function of increasing distance
as calculated with the cluster expansions. Figure 4-20 shows an energetic attraction between NiAl
and AlNi point defects. To ensure that the predicted attraction is not an artifact of the supercell
size, we also calculated the energy dependence on the NiAl – AlNi pair distance in a 4x4x4 B2
NiAl supercell (128 sites) using an energy cutoff of 375 eV and allowing only internal
relaxations (dotted line in Fig. 4-20). The larger supercell calculations predict the same attraction
between a NiAl – AlNi pair. While the formation energy of an Al anti-site defect on the Ni
sublattice is energetically very costly, the results of Fig. 4-20 clearly show that it is reduced in
the immediate vicinity of a NiAl defect. Hence, any increase in the fraction of NiAl defects will
lead to an increase in the fraction of AlNi defects due to short-range attractive interactions, as is
87
predicted with Monte Carlo simulations applied to cluster expansions that accurately capture
these short-range interactions.
The inclusion of interactions among defects in B2-NiAl is also essential to accurately
predict the concentration of defect complexes. Important defect complexes include various triple
defects as illustrated in Fig. 4-18, which clearly illustrates a large difference between the
probability of occurrence of [100] triple defects and [110] and [111] triple defects, with the
former much less probable than the two triple defects having the vacancy pair aligned along
[110] and [111] directions. While vacancies on the Ni sublattice are attracted to a Ni anti-site
defect on the Al-sublattice, the vacancies themselves repel each other. Hence the more extended
[110] and [111] triple defects are energetically favored over the [100] triple defect in which
vacancies occupy nearest neighbor sites on the cubic Ni-sublattice. The probabilities of
occurrence of the various triple defects also differ significantly from the mean field estimate
pmeanfield= xNiAl⋅ xVNi
2 , which neglects interactions. Figure 4-18 shows that the more compact [100]
triple defect has a lower probability of occurrence than pmeanfield while the more extended [110]
and [111] triple defects have a higher probability of occurrence than pmeanfield.
The net migration of a triple defect results in the direct exchange between a Ni and an Al
atom. Hence diffusion mediated exclusively by the triple defect mechanism will lead to identical
mobilities for both Al and Ni atoms. Although the [110] and [111] triple defects are predicted to
be more numerous than the [100] triple defects (Fig. 4-18), we found that their migration
requires significantly higher energy intermediate states. In fact, DFT-GGA calculations predict
the intermediate states of the [110] and [111] triple defect migration mechanism to have an
energy that is more than 2.5 eV above that of the initial triple defect arrangement, while the
maximum barrier along the [100] triple defect migration mechanism is not more than 1.2 eV (see
88
Fig. 4-6). This suggests that the [100] triple defect is more important than the [110] and [111]
triple defects in mediating diffusion. While the number of triple defects diminishes slightly as
B2-NiAl becomes Al-rich (Fig. 4-18), the concentration of the intermediate states of the triple
defect migration mechanism remains essentially constant with alloy concentration (Fig. 4-19(a)),
suggesting that the contribution of triple defects to atomic diffusion should be more or less
independent of alloy concentration, diminishing somewhat in Al-rich B2-NiAl.
The anti-structural bridge diffusion mechanism becomes viable for alloy concentrations
that are sufficiently off-stoichiometric to enable percolating networks of antisite atoms to form.
This allows vacancies to migrate along the percolating networks without introducing additional
disorder within the compound. In Ni-rich alloys, vacancies can migrate through the crystal by
performing nearest-neighbor hops along chains consisting of Ni atoms on the Ni sublattice and
Ni antisite atoms on the Al sublattice. As found in Section 4.1.1, these nearest neighbor Ni-
vacancy exchanges have relatively low migration barriers. Furthermore, the Monte Carlo
simulations indicate a high concentration of Ni antisite atoms (see Fig. 4-17) in Ni-rich alloys. A
prerequisite for the anti-structural bridge mechanism for Ni-diffusion is the existence of
sufficient second and third nearest neighbor pairs occupied by a Ni antisite atom and an Al-
vacancy. Figure 4-19(c) shows that the concentration of NiAl–VAl increases rapidly as B2–NiAl
becomes Ni rich, suggesting that the anti-structural bridge mechanism should be important in
mediating Ni diffusion in Ni-rich alloys.
In Al rich alloys, interconnected networks of Al-anti-site atoms are also possible,
however, the concentration of Al anti-sites is significantly lower than that of Ni anti-site atoms in
Ni rich alloys (see Fig. 4-17). Nevertheless, the concentration of vacancies on the Ni sublattice
achieves very large values and percolating networks of Al atoms and Ni vacancies are possible.
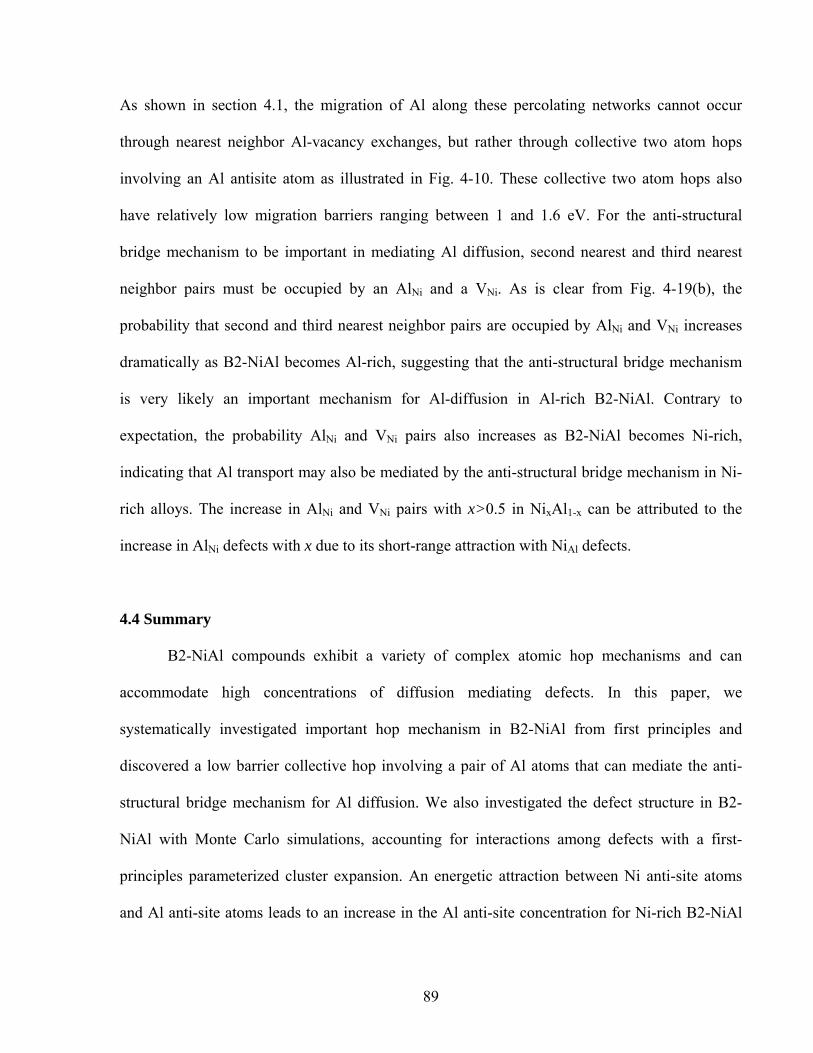
89
As shown in section 4.1, the migration of Al along these percolating networks cannot occur
through nearest neighbor Al-vacancy exchanges, but rather through collective two atom hops
involving an Al antisite atom as illustrated in Fig. 4-10. These collective two atom hops also
have relatively low migration barriers ranging between 1 and 1.6 eV. For the anti-structural
bridge mechanism to be important in mediating Al diffusion, second nearest and third nearest
neighbor pairs must be occupied by an AlNi and a VNi. As is clear from Fig. 4-19(b), the
probability that second and third nearest neighbor pairs are occupied by AlNi and VNi increases
dramatically as B2-NiAl becomes Al-rich, suggesting that the anti-structural bridge mechanism
is very likely an important mechanism for Al-diffusion in Al-rich B2-NiAl. Contrary to
expectation, the probability AlNi and VNi pairs also increases as B2-NiAl becomes Ni-rich,
indicating that Al transport may also be mediated by the anti-structural bridge mechanism in Ni-
rich alloys. The increase in AlNi and VNi pairs with x>0.5 in NixAl1-x can be attributed to the
increase in AlNi defects with x due to its short-range attraction with NiAl defects.
4.4 Summary
B2-NiAl compounds exhibit a variety of complex atomic hop mechanisms and can
accommodate high concentrations of diffusion mediating defects. In this paper, we
systematically investigated important hop mechanism in B2-NiAl from first principles and
discovered a low barrier collective hop involving a pair of Al atoms that can mediate the anti-
structural bridge mechanism for Al diffusion. We also investigated the defect structure in B2-
NiAl with Monte Carlo simulations, accounting for interactions among defects with a first-
principles parameterized cluster expansion. An energetic attraction between Ni anti-site atoms
and Al anti-site atoms leads to an increase in the Al anti-site concentration for Ni-rich B2-NiAl
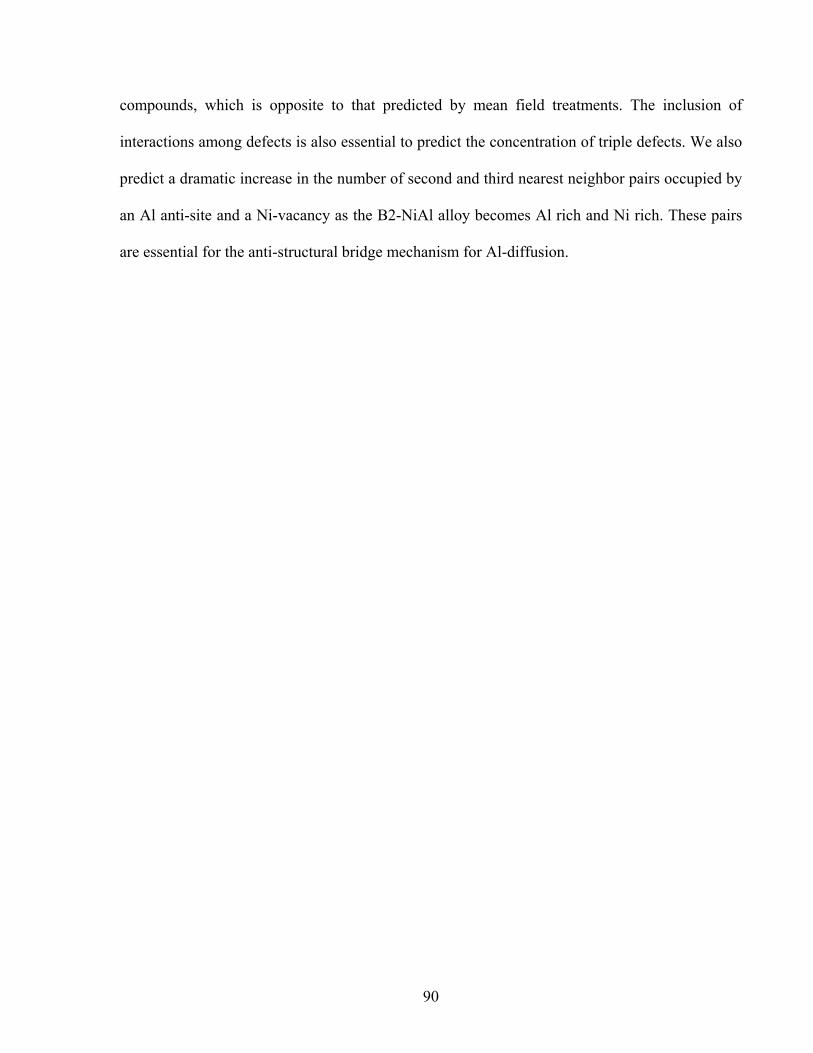
90
compounds, which is opposite to that predicted by mean field treatments. The inclusion of
interactions among defects is also essential to predict the concentration of triple defects. We also
predict a dramatic increase in the number of second and third nearest neighbor pairs occupied by
an Al anti-site and a Ni-vacancy as the B2-NiAl alloy becomes Al rich and Ni rich. These pairs
are essential for the anti-structural bridge mechanism for Al-diffusion.
91
Figure 4-1 Energy along the diffusion path for Ni nearest neighbor hops (NiNi-VAl exchange) under various local environments in the B2-NiAl based compound. (a) without any additional defects. (b) with a neighboring Ni vacancy and (c) with a neighboring Al vacancy.
92
Figure 4-2 Calculated migration barriers for the next nearest neighbor hops of Ni and Al atoms under various local environments in B2-NiAl. (a) An Al atom hops to an Al vacancy without any additional defects, (b) a Ni atom hops to a Ni vacancy without any additional defects, (c) an Al atom hops to an Al vacancy with an adjacent Ni vacancy and (d) failure of a Ni second nearest neighbor hop to a Ni vacancy due to the presence of an adjacent Al vacancy, (e) an antisite Al atom hops to a Ni vacancy without any additional defects, (f) an antisite Ni atom hops to an Al vacancy without any additional defects, (g) failure of an antisite Al second nearest neighbor hop to a Ni vacancy due to the presence of an adjacent Al vacancy, (h) failure of an antisite Ni second nearest neighbor hop to an Al vacancy due to the presence of an adjacent Ni vacancy.
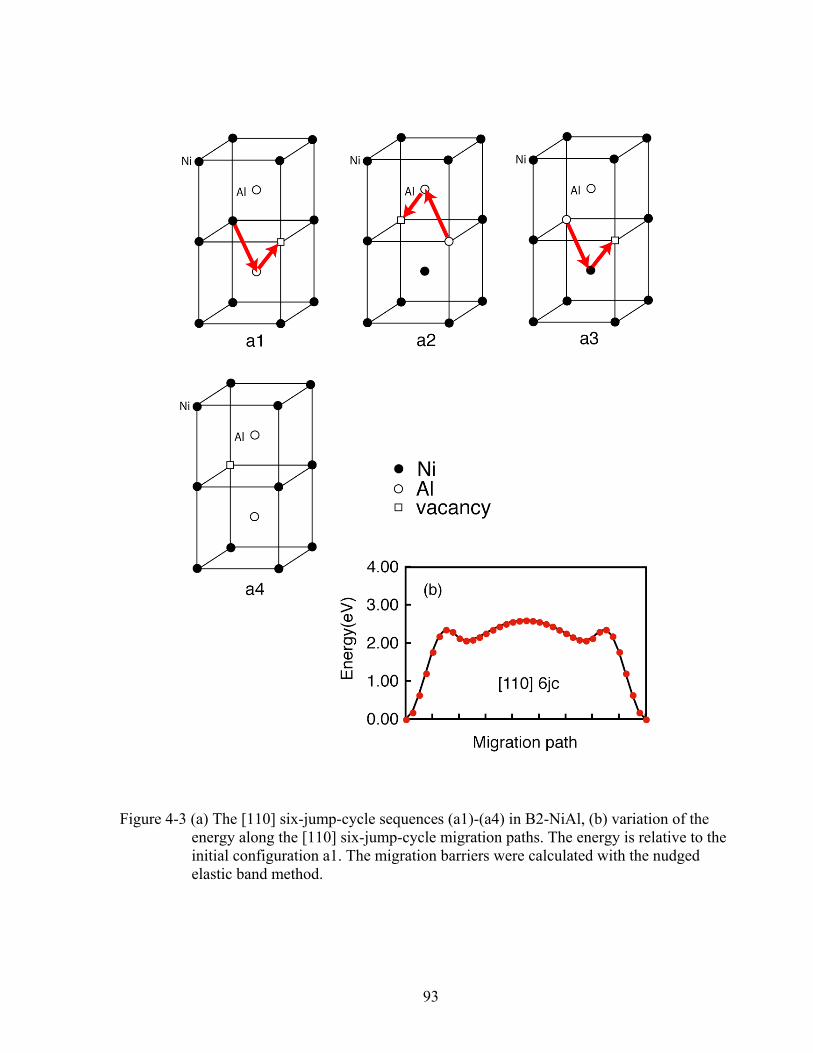
93
Figure 4-3 (a) The [110] six-jump-cycle sequences (a1)-(a4) in B2-NiAl, (b) variation of the energy along the [110] six-jump-cycle migration paths. The energy is relative to the initial configuration a1. The migration barriers were calculated with the nudged elastic band method.
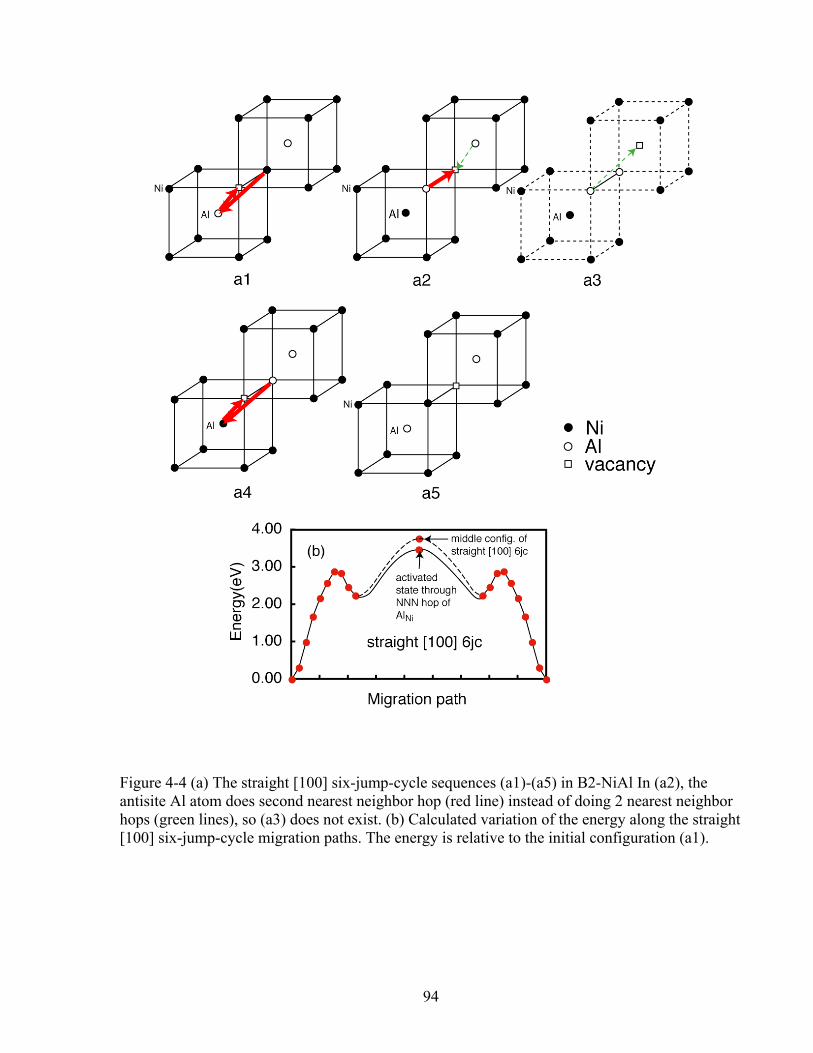
94
Figure 4-4 (a) The straight [100] six-jump-cycle sequences (a1)-(a5) in B2-NiAl In (a2), the antisite Al atom does second nearest neighbor hop (red line) instead of doing 2 nearest neighbor hops (green lines), so (a3) does not exist. (b) Calculated variation of the energy along the straight [100] six-jump-cycle migration paths. The energy is relative to the initial configuration (a1).
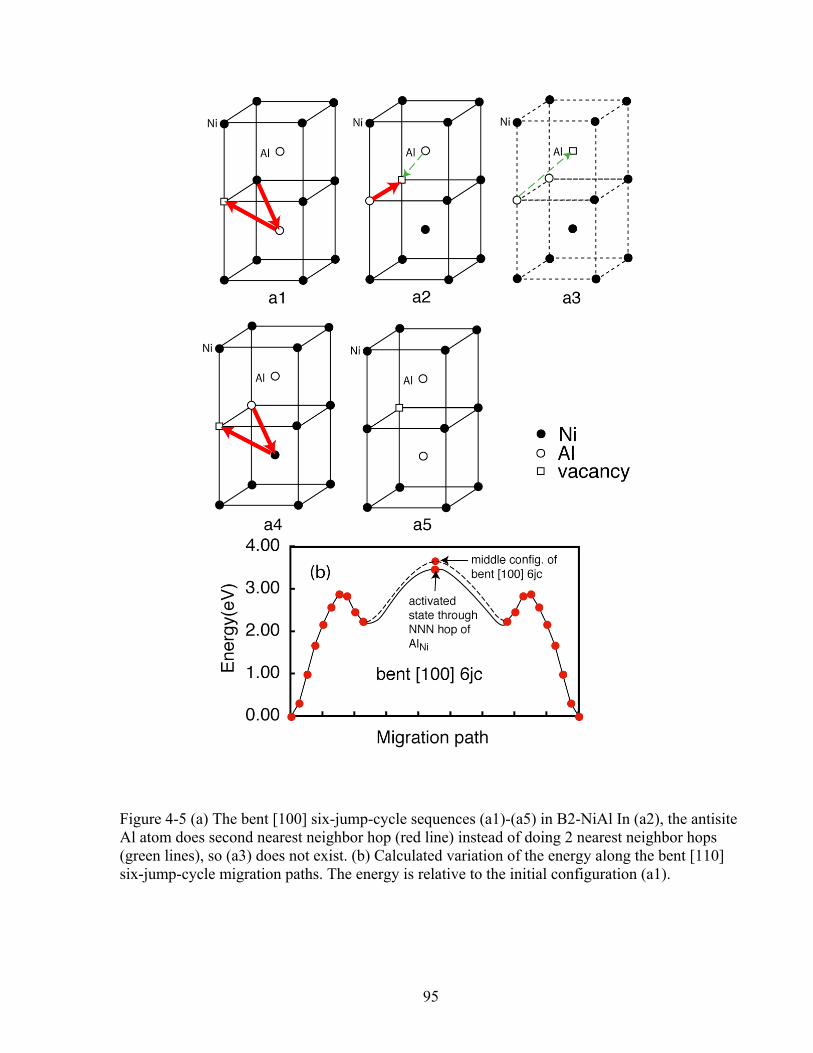
95
Figure 4-5 (a) The bent [100] six-jump-cycle sequences (a1)-(a5) in B2-NiAl In (a2), the antisite Al atom does second nearest neighbor hop (red line) instead of doing 2 nearest neighbor hops (green lines), so (a3) does not exist. (b) Calculated variation of the energy along the bent [110] six-jump-cycle migration paths. The energy is relative to the initial configuration (a1).
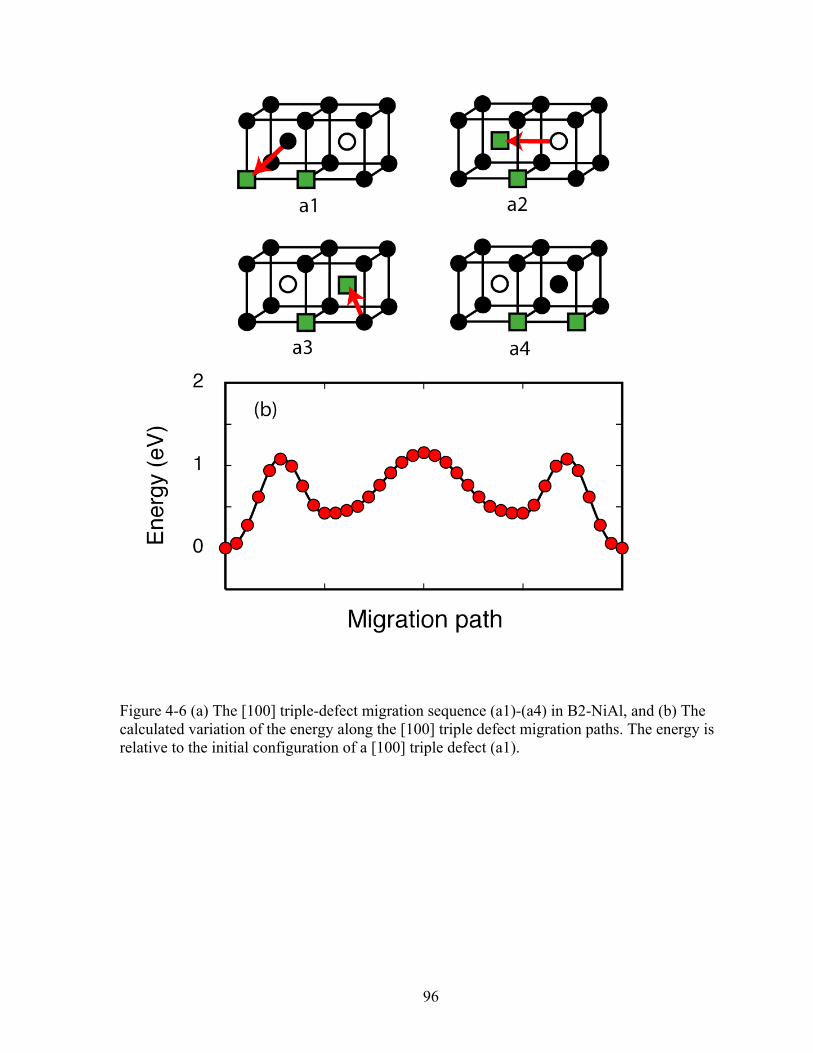
96
Figure 4-6 (a) The [100] triple-defect migration sequence (a1)-(a4) in B2-NiAl, and (b) The calculated variation of the energy along the [100] triple defect migration paths. The energy is relative to the initial configuration of a [100] triple defect (a1).
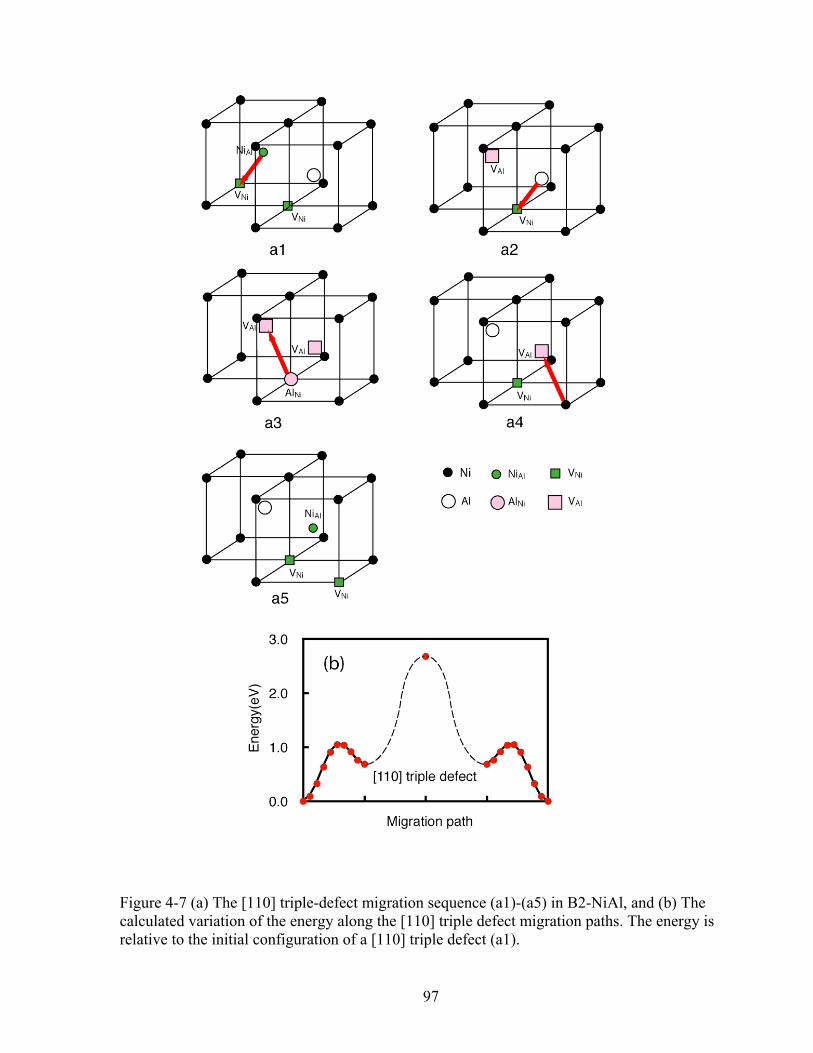
97
Figure 4-7 (a) The [110] triple-defect migration sequence (a1)-(a5) in B2-NiAl, and (b) The calculated variation of the energy along the [110] triple defect migration paths. The energy is relative to the initial configuration of a [110] triple defect (a1).
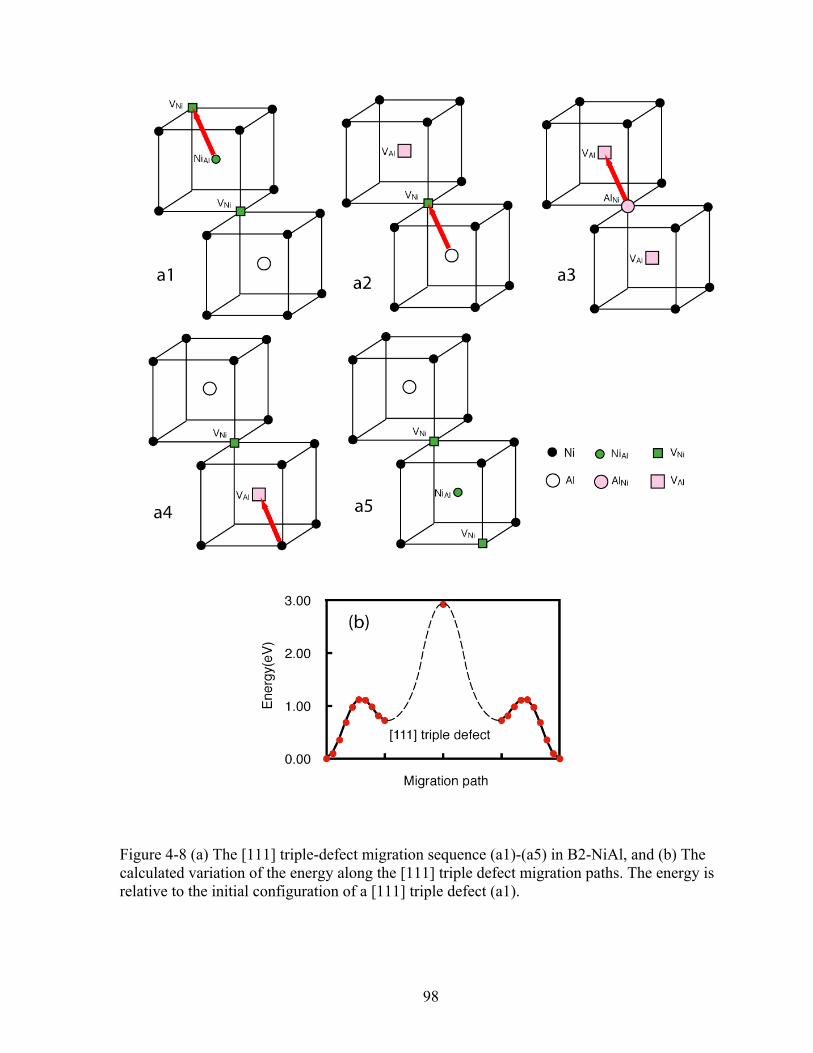
98
Figure 4-8 (a) The [111] triple-defect migration sequence (a1)-(a5) in B2-NiAl, and (b) The calculated variation of the energy along the [111] triple defect migration paths. The energy is relative to the initial configuration of a [111] triple defect (a1).
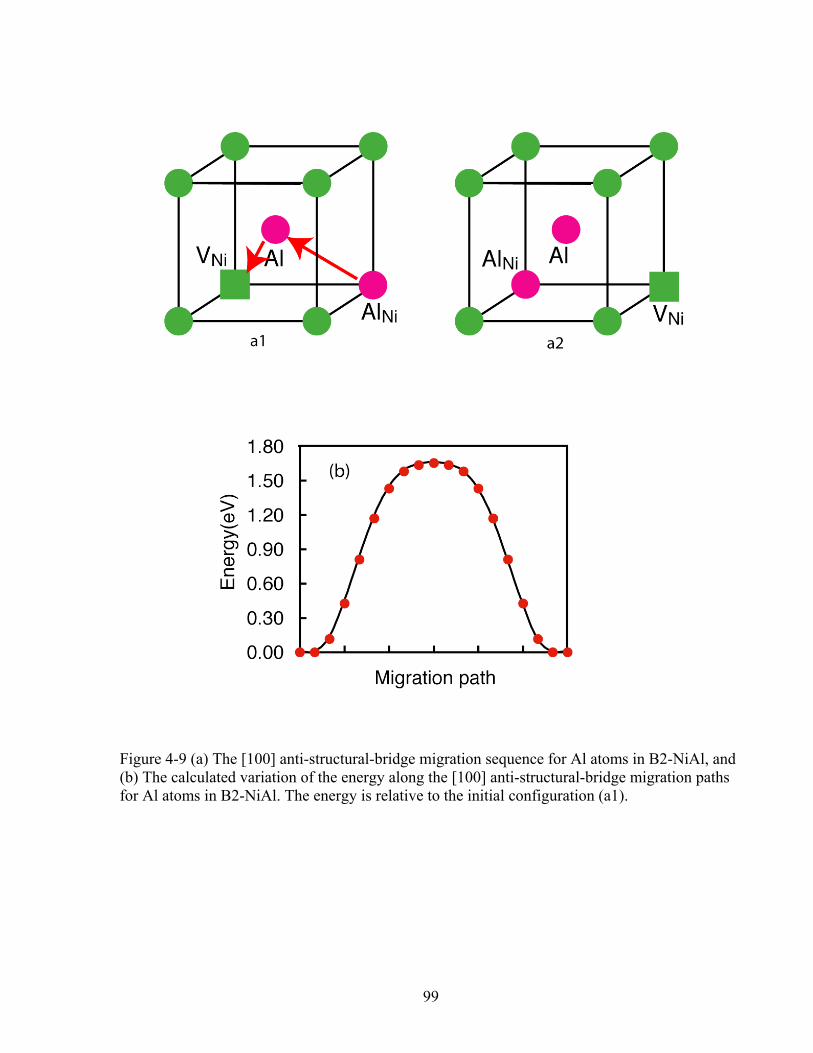
99
Figure 4-9 (a) The [100] anti-structural-bridge migration sequence for Al atoms in B2-NiAl, and (b) The calculated variation of the energy along the [100] anti-structural-bridge migration paths for Al atoms in B2-NiAl. The energy is relative to the initial configuration (a1).
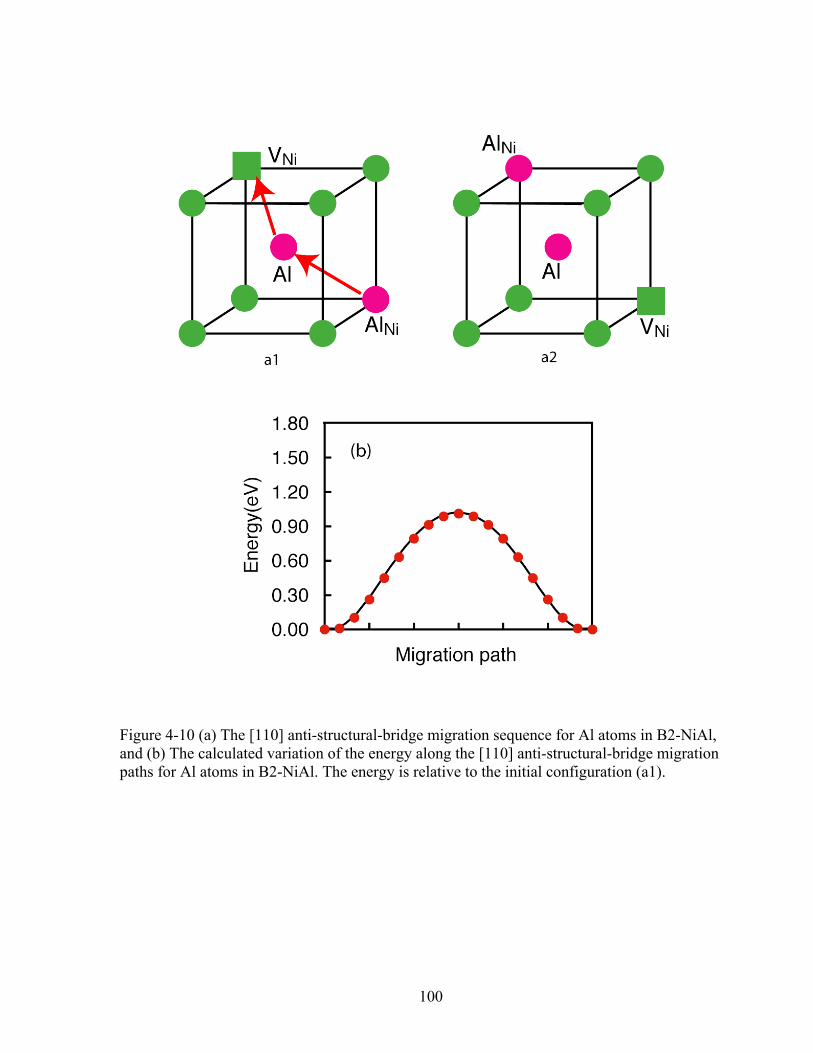
100
Figure 4-10 (a) The [110] anti-structural-bridge migration sequence for Al atoms in B2-NiAl, and (b) The calculated variation of the energy along the [110] anti-structural-bridge migration paths for Al atoms in B2-NiAl. The energy is relative to the initial configuration (a1).
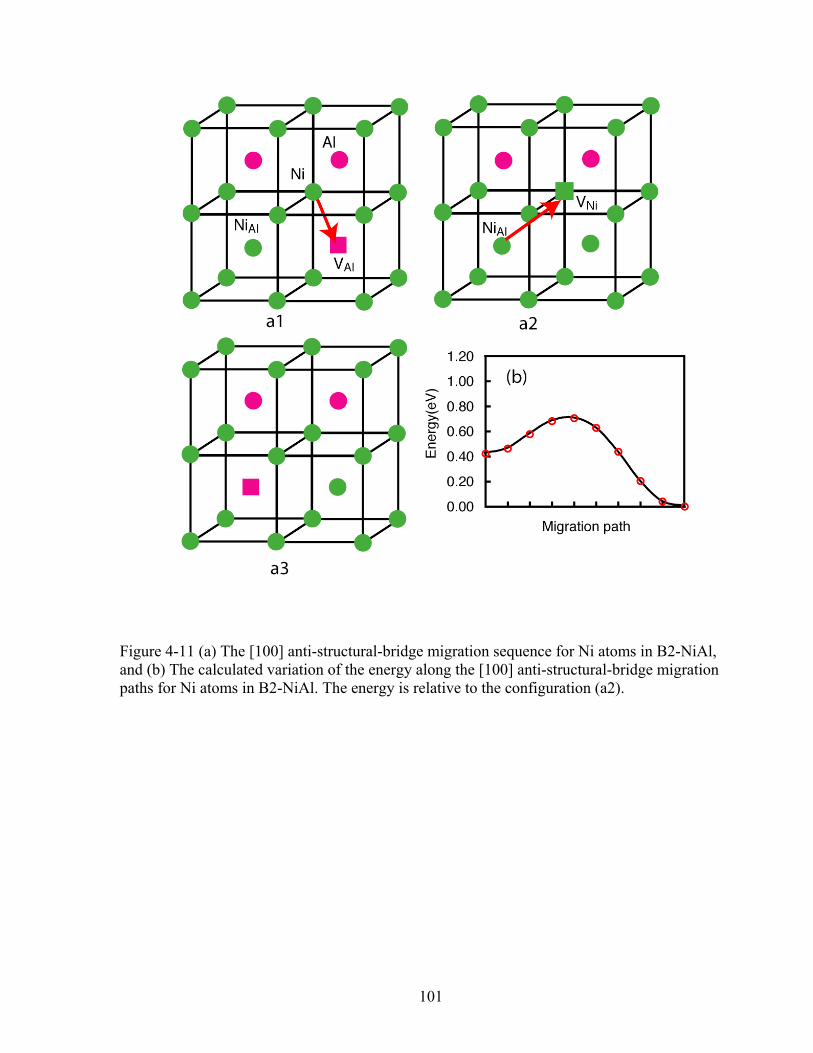
101
Figure 4-11 (a) The [100] anti-structural-bridge migration sequence for Ni atoms in B2-NiAl, and (b) The calculated variation of the energy along the [100] anti-structural-bridge migration paths for Ni atoms in B2-NiAl. The energy is relative to the configuration (a2).
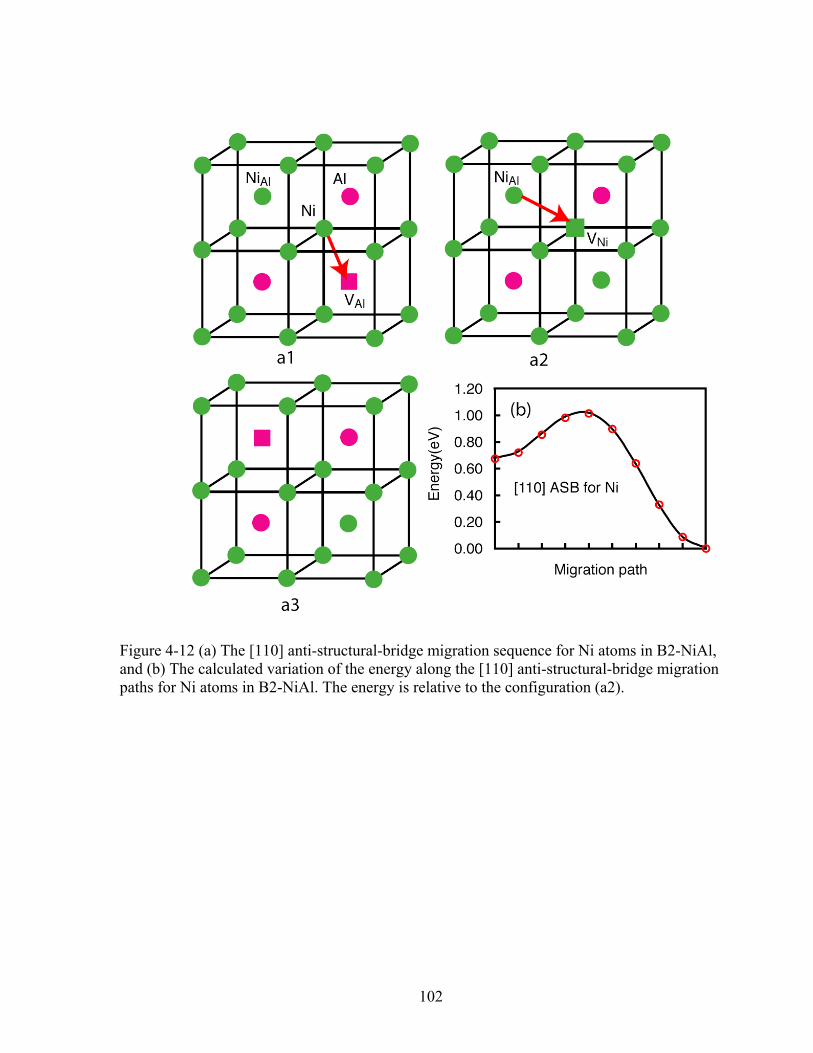
102
Figure 4-12 (a) The [110] anti-structural-bridge migration sequence for Ni atoms in B2-NiAl, and (b) The calculated variation of the energy along the [110] anti-structural-bridge migration paths for Ni atoms in B2-NiAl. The energy is relative to the configuration (a2).
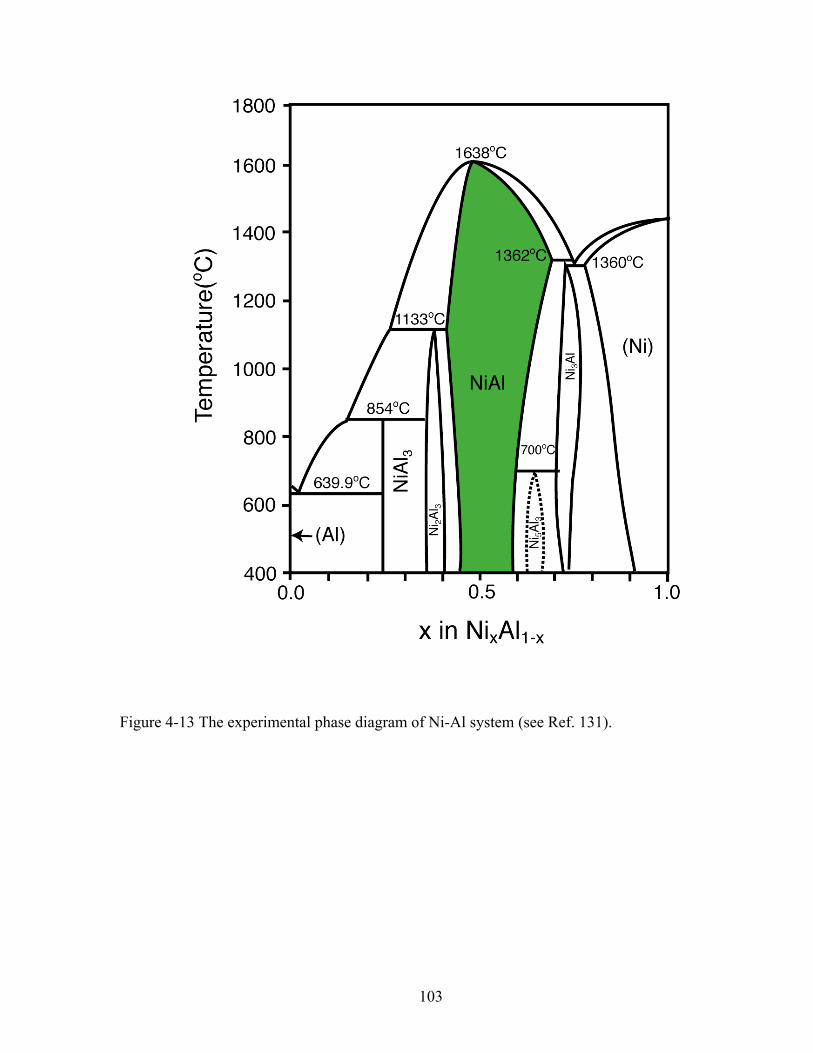
103
Figure 4-13 The experimental phase diagram of Ni-Al system (see Ref. 131).
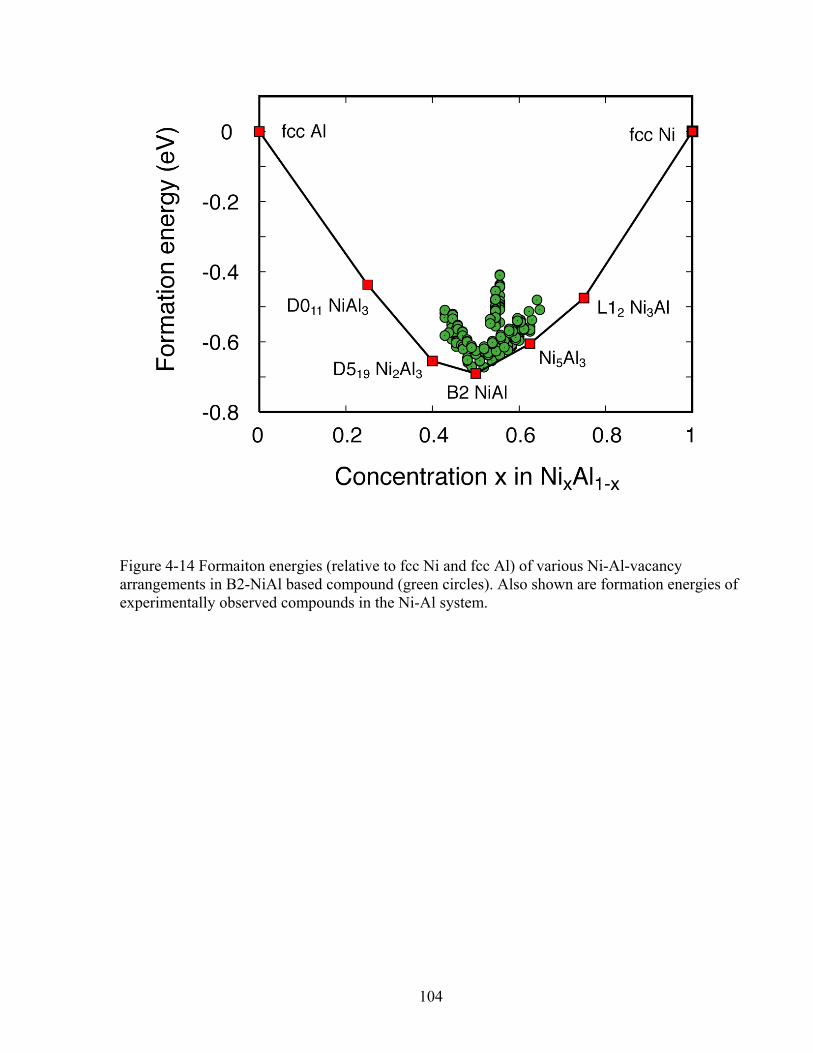
104
Figure 4-14 Formaiton energies (relative to fcc Ni and fcc Al) of various Ni-Al-vacancy arrangements in B2-NiAl based compound (green circles). Also shown are formation energies of experimentally observed compounds in the Ni-Al system.
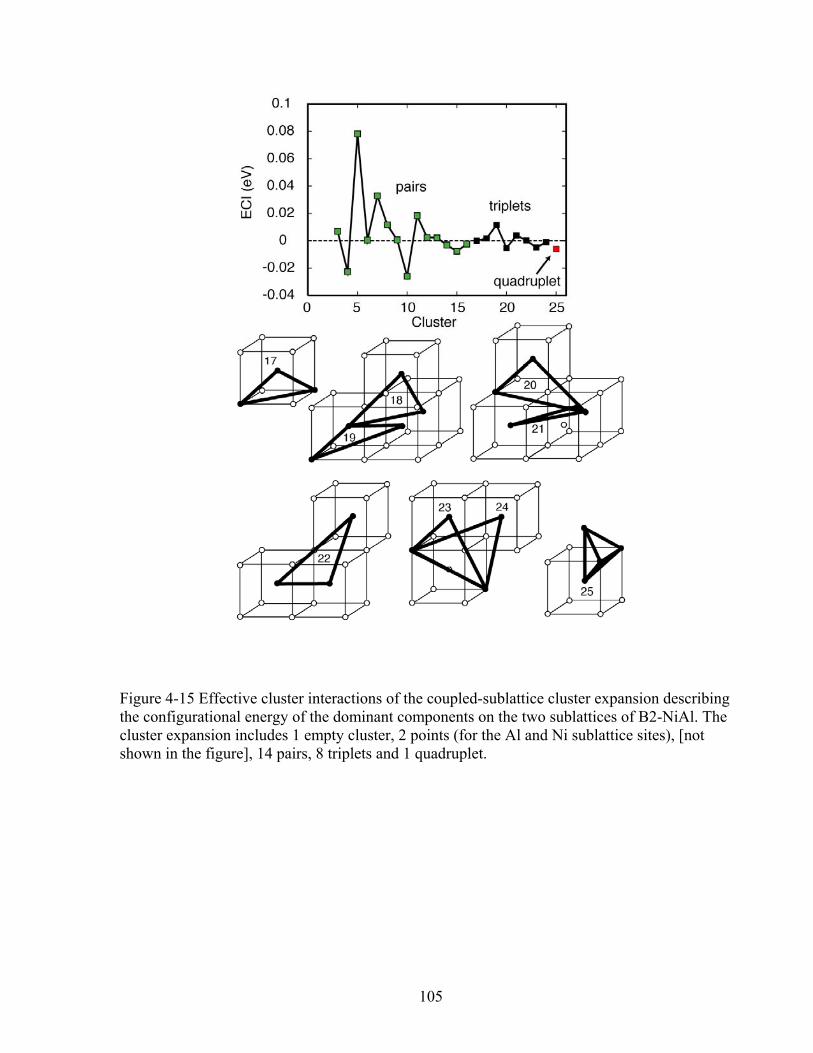
105
Figure 4-15 Effective cluster interactions of the coupled-sublattice cluster expansion describing the configurational energy of the dominant components on the two sublattices of B2-NiAl. The cluster expansion includes 1 empty cluster, 2 points (for the Al and Ni sublattice sites), [not shown in the figure], 14 pairs, 8 triplets and 1 quadruplet.
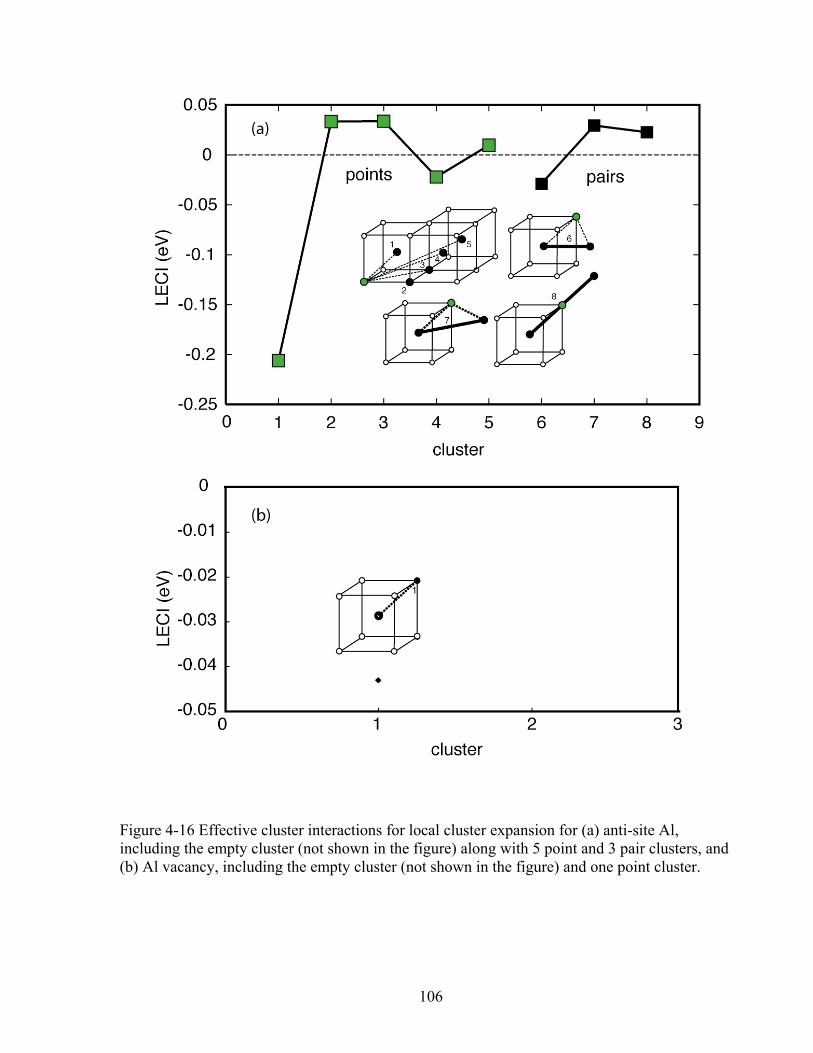
106
Figure 4-16 Effective cluster interactions for local cluster expansion for (a) anti-site Al, including the empty cluster (not shown in the figure) along with 5 point and 3 pair clusters, and (b) Al vacancy, including the empty cluster (not shown in the figure) and one point cluster.
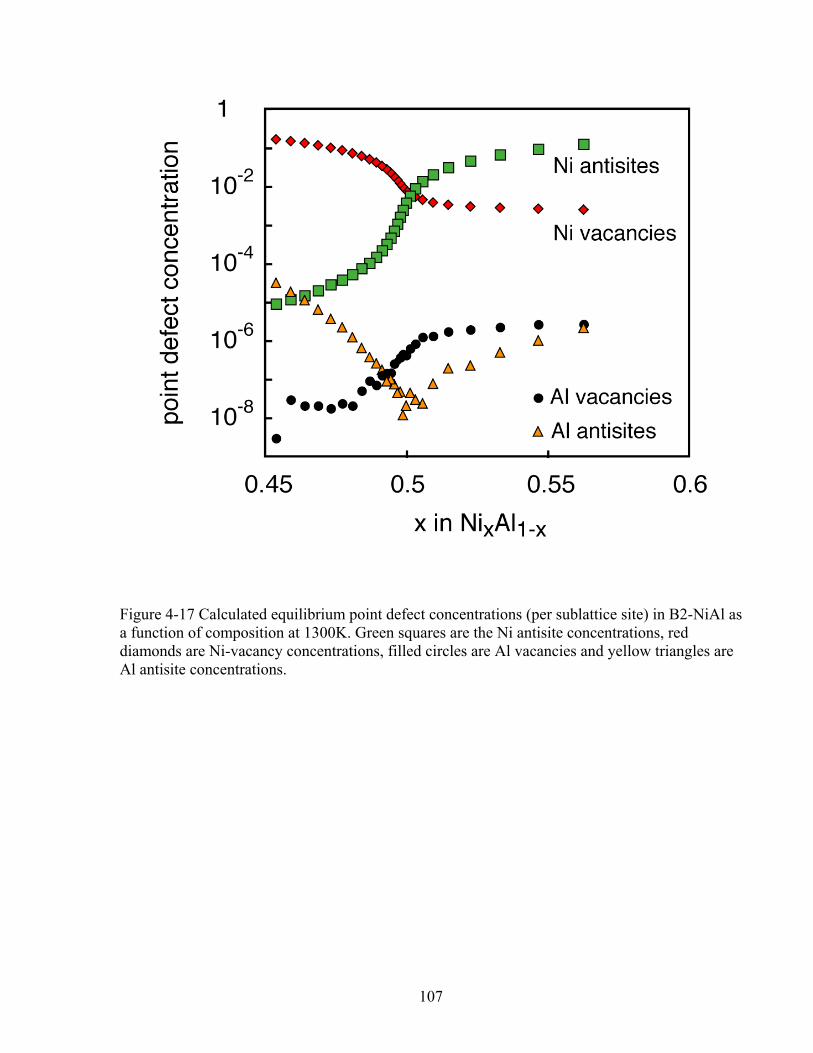
107
Figure 4-17 Calculated equilibrium point defect concentrations (per sublattice site) in B2-NiAl as a function of composition at 1300K. Green squares are the Ni antisite concentrations, red diamonds are Ni-vacancy concentrations, filled circles are Al vacancies and yellow triangles are Al antisite concentrations.
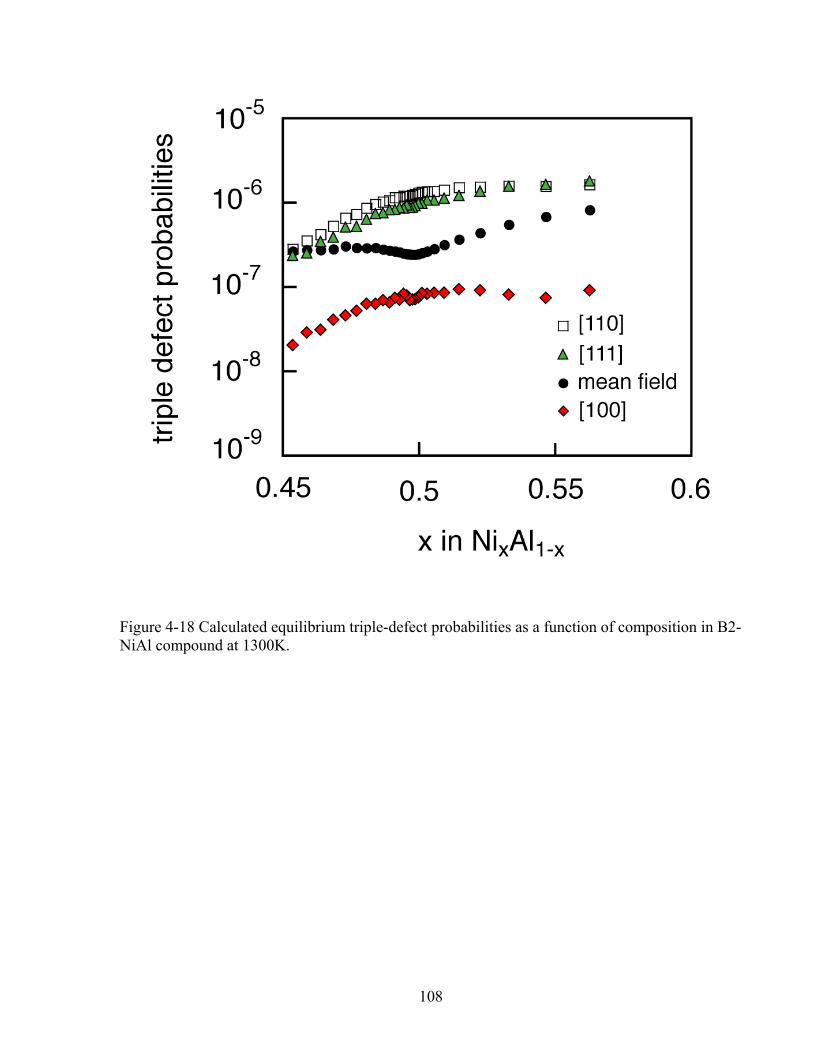
108
Figure 4-18 Calculated equilibrium triple-defect probabilities as a function of composition in B2-NiAl compound at 1300K.
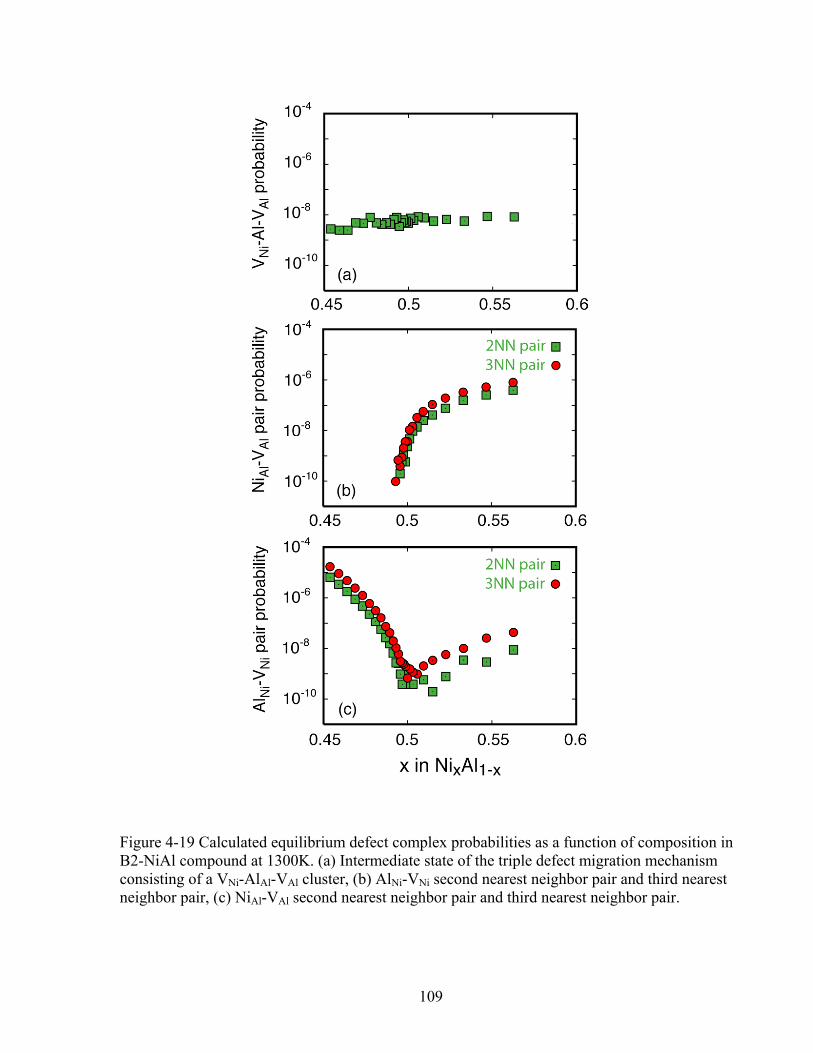
109
Figure 4-19 Calculated equilibrium defect complex probabilities as a function of composition in B2-NiAl compound at 1300K. (a) Intermediate state of the triple defect migration mechanism consisting of a VNi-AlAl-VAl cluster, (b) AlNi-VNi second nearest neighbor pair and third nearest neighbor pair, (c) NiAl-VAl second nearest neighbor pair and third nearest neighbor pair.
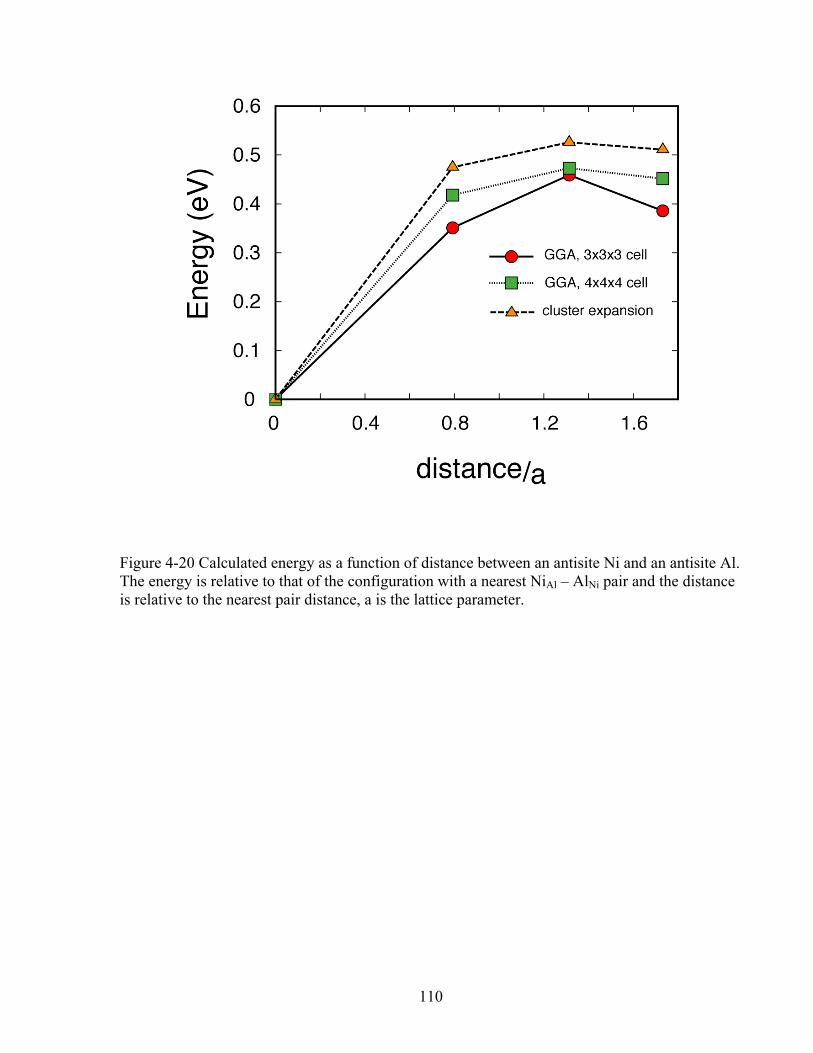
110
Figure 4-20 Calculated energy as a function of distance between an antisite Ni and an antisite Al. The energy is relative to that of the configuration with a nearest NiAl – AlNi pair and the distance is relative to the nearest pair distance, a is the lattice parameter.
111
Chapter 5
Tracer diffusion and diffusion mechanisms in B2-NiAl compound
In chapter 4, we investigated the migration barriers for various diffusion paths and the
point defect complexes that are important to mediate these hops in B2-NiAl compound. Based on
these information we will further investigate the tracer diffusion and relative importance of
various diffusion mechanism for B2-NiAl compound from first-principles in this chapter.
Diffusion in alloys can be a complex kinetic process that depends on the nature of
intrinsic point defects, the energy barriers of different hop mechanisms and the degree of short
and long-range order among the constituents of the alloy. B2-NiAl, in spite of its simple CsCl
crystal structure, epitomizes this complexity. While many hop mechanisms and intricate hop
cycles have been proposed, no comprehensive picture of the dominant atomic transport
mechanisms in B2-NiAl has been established. Here we perform a first-principles study of
diffusion in B2-NiAl, simultaneously considering all relevant hop mechanisms. The approach
couples a first-principles cluster expansion description of the configurational energy with kinetic
Monte Carlo simulations to predict tracer diffusion coefficients in B2-NiAl and rigorously
accounts for the equilibrium degree of short-range order among point defects as a function of
alloy concentration. We find that the dominant transport mechanisms are very sensitive to the
bulk alloy concentration.
5.1 Simple structure and complicated diffusion mechanisms
112
Diffusion in typical metallic alloys is mediated by a dilute concentration of vacancies that
stochastically wander through the crystal, in the process rearranging the various components of
the alloy. B2-NiAl, however, is an ordered compound, deviating far from thermodynamic
ideality and exhibiting an unusually high concentration of vacancies. In fact, the high vacancy
concentration on the Ni-sublattice of Al-rich B2-NiAl is reminiscent of intercalation compounds
used as electrodes in Li-ion batteries, whereby Li can fill interstitial sites of a crystalline host
during discharge of the battery. Li diffusion in these compounds occurs in the non-dilute regime
by exchanging with neighboring vacant interstitial sites and is restricted to exchanges on the
same sublattice. Although Ni second nearest neighbor hops restrict Ni diffusion to the Ni-
sublattice, several viable hop-cycles proposed in past decades involve exchanges between Al and
Ni of the two sublattices. Furthermore, experiment indicates that Al mobility is also sizable in B2
NiAl in spite of the fact that the concentration of vacancies on the Al sublattice is very low.
Diffusion in B2-NiAl, is therefore quite distinct from what is known to occur in metallic solid
solutions and in more complex systems such as intercalation compounds.
The NiAl intermetallic compound has B2 structure shown in the Fig. 2-1. This is a very
simple structure with Al atom at the center and Ni atom at the corner of a cubic cell. Even in a
system with such a simple structure, the diffusion process could be very complicated due to the
complex defects. As we have mentioned in chapter 4 compared to other compounds in Ni-Al
system, which cannot sustain large off-stoichiometry, the B2 NiAl compound can accommodate
large off-stoichiometry at finite temperature because it can contain high concentration of point
defects. The well-known point defects in this compound are Ni vacancies (vacancy at Ni
sublattice, denoted by VNi), anti-site Ni (Ni atom at Al sublattice, denoted by NiAl), Al vacancies
(vacancy at Al sublattice, denoted by VAl) and anti-site Al (Al atom at Ni sublattice, denoted by
113
AlNi). The calculated equilibrium concentrations of these point defects at 1300K are shown in
Fig. 4-17. Consistent with experiment results [41,134] Figure 4-17 shows that antisite Ni and Ni
vacancies are dominant point defects in Ni-rich side and Al-rich side respectively, while antisite
Al and Al vacancy are minor point defects. From Figure 4-17 we can see how complicated point
defects could be in a multi-component compound with nevertheless simple structure such as B2
NiAl. First, several types of point defects could be present simultaneously. Second, the defect
concentrations could depend on the bulk composition of the compound instead of being constant.
Finally, the concentration of vacancies could be non-dilute. For example, the Ni vacancy
concentration in B2 NiAl could be as high as around 15% in Al-rich side. The complex point
defects in real material systems make the diffusion process complicated and make the classic
assumptions such as dilute and uniform vacancy concentration invalid. These point defects can
also form various defect clusters such as triple-defects, Al anti-site clusters and Ni anti-site
clusters shown in the Fig. 4-6 to Fig. 4-10, which makes the situation more complicated.
Over the past several decades, many diffusion mechanisms have been proposed through
experimental and theoretical researches, however, no consensus has been reached as to the
dominant hop mechanisms responsible for atomic transport in B2 NiAl. One impediment to
achieving a fundamental understanding of diffusion in this compound is the fact that no Al
isotopes are readily available, preventing a direct measurement of Al tracer diffusion coefficients
in B2-NiAl. In chapter 4, we have investigated the migration barriers for the nearest neighbor
(NN) hop, the next nearest neighbor hop (NNN), the six-jump-cycle (6JC) sequence [47,63,66],
the triple-defect (TD) sequence [49,67], and the anti-structural bridge (ASB) sequence [52].
Our DFT calculations have shown that Al atom cannot perform nearest-neighbor hops
because it will disrupt the order of the configuration and the resulting structure is mechanically
114
unstable; instead, they do two-atom collective hops. For example, for the anti-structural-bridge
hop for Al demonstrated in Fig. 4-10, instead of doing two consecutive nearest neighbor hops
proposed by previous researchers [52], the Al atoms actually perform a two-atom simultaneous
hop. For the triple-defect sequence, DFT computation by us and other researchers shows that it is
a three-step sequence [129] instead of four-step sequence proposed by S. Frank et al [49]. The
first and third sub-hops of triple-defect hops involve Ni atom hopping into the nearest neighbor
vacancy, while the second sub-hop involves Al atom hopping into the second nearest neighbor
vacancy (Fig. 4-6) instead of two consecutive nearest-neighbor hops. For the six-jump-cycle
sequence, the DFT computations by us and previous researchers shows that instead of involving
six consecutive nearest neighbor hops, it does three two-atom simultaneous hops (Fig. 4-
3)[58,129].
While the classic treatment in diffusion simulation makes assumption that only single
atom nearest neighbor hops and second nearest neighbor hops are allowed, B2-NiAl compound
exhibits more diffusion paths other than nearest neighbor and next nearest neighbor hops. It is
not surprising that many other real materials, which have more complex structures than B2
structure, could have much more complicated diffusion paths than sequence of single atom
nearest neighbor and second nearest neighbor hops. Due to the complexity of the diffusion paths
in B2 NiAl compound, no one has ever systematically investigated and incorporated all these
diffusion paths mentioned above in a kinetic Monte Carlo simulation. In this thesis, we will
simultaneously incorporate the most important hop mechanisms of B2-NiAl within a kinetic
Monte Carlo framework and predict tracer diffusion coefficients from first principles.
5.2 Tracer diffusion in B2-NiAl compound
115
To thoroughly investigate the diffusion in multi-component solids with significant
configurational disorder as exhibited by B2-NiAl from first-principle, we use cluster expansion
techniques described in section 2.3 combined with grand canonical Monte Carlo and kinetic
Monte Carlo simulations described in section 2.4. Compared to the mean field techniques that
neglect the interactions among various defects and atoms [42-44], the cluster expansion of the
configurational energy can rigorously account for interactions among defects through an accurate
description of the energy of the compound as a function of the arrangement of Ni, Al and
vacancies over the two cubic sublattices. As common prerequisite steps for both grand canonical
or kinetic Monte Carlo simulations, the energies of a number of various Ni-Al-vacancy
configurations were firstly calculated from first-principle, then, these energies were used to fit a
cluster expansion (see chapter 4). Finally, the first-principles parameterized cluster expansions
can be used in grand canonical Monte Carlo and kinetic Monte Carlo simulations to predict finite
temperature thermodynamic properties and kinetic properties, such as tracer diffusion
coefficients.
In section 2.4 we have described the kinetic Monte Carlo framework and here we will
recall some key points of our kinetic Monte Carlo simulation procedure. The KMC algorithm is
based on the n-fold way method in which each hop is picked with the possibility Γi / Γtot, where
Γi is the migration frequency of hop i and Γtot is the sum of all individual probabilities Γi. [109]
The time is updated after each hop by –lnρ/Γtot, where ρ is a random number between (0,1]
[109]. For each Ni vacancy, there are 86 possible hops and for each Al vacancy there are 38
possible hops. For a specific hop, we calculated the migration probability Γ within the harmonic
transition state theory with local harmonic approximation [110], which gives Γ = ν0 exp (-Em /
kT), where ν0 is a vibration prefactor, Em is the activation energy required to move the hopping
116
atom(s) from the initial stable state to the activated state, k is Boltzmann’s constant and T is the
absolute temperature in degrees Kelvin. The attempt frequency ν0 for a specific hop is calculated
as ν ii=1
3N
∏ / ν i*
i=1
3N−1
∏ , where N is the total number of atoms, the ν i’s are normal mode vibrational
frequencies at the stable state and the ν i*’s are normal mode vibrational frequencies at the
activated state. The numerator in the above expression for ν0 has one frequency more than the
denominator. Instead of calculating normal vibration frequencies for all atoms, we calculate the
prefactor within the local harmonic approximation to get an order of magnitude estimate of the
prefactor. That is we calculate the normal vibration frequencies for atoms involved in the hop
assuming that all other frequencies cancel out. For example, if the hop involves two atoms then
the numerator (corresponding to stable state) has 6 real frequencies while the denominator
(corresponding to saddle point) has 5 real frequencies and 1 imaginary frequency; if the hop
involves one atom then the numerator has 3 real frequencies while the denominator has 2 real
frequencies and 1 imaginary frequency. All the calculations for vibrational frequencies of stable
state and saddle point of a specific hop are conducted from first-principles by using the VASP
software package within a 3x3x3 superecell that contains 27 B2-NiAl cells, i.e., 54 crystal sites.
In the calculation, the atoms involved in the hop are displaced in the direction of each Cartesian
coordinate, and the Hessian matrix consisting of second derivatives of the energy with respect to
atom displacement, is determined from the forces. The eigenvalues of the Hessian matrix are the
squares of the normal vibration angular frequencies ω (ν = ω / 2π). If the Hessian matrix has one
negative eigenvalue, then the corresponding structure is an activated state [153]. Figure 5-1
shows the calculated attempt frequency ν0 for various diffusion paths, which shows that there is
117
no big difference among attempt frequencies for various diffusion paths and all of them are of
1012 Hz degree of magnitude.
To account for the environment dependence of the migration barriers, we used an
approach described in ref [148], in which a kinetically resolved activation (KRA) barrier is
introduced for each hop, defined as an averaged barrier over a back and forth hop. The actual
barrier for a particular hop can then be reconstructed by adding the KRA barrier to the average
energy of the end states of the hop, calculated with the cluster expansion, minus the energy of the
initial state [148]. The KRA barriers are sensitive to any local disorder that may be present. For
example, a NNN Al hop has a migration barrier of 1.5 eV, which is reduced to 0.75 eV if the hop
occurs in the immediate vicinity of a Ni vacancy. Within our kinetic Monte Carlo simulations we
tabulated KRA barriers for each elementary hop and for different local environments
(determined by the occupancy in the nearest neighbor shell). This approach ensures that the
concentrations of point defects and defect clusters within the kinetic Monte Carlo simulations are
representative of those in thermal equilibrium (since the energies of the end states of the hop are
calculated with the cluster expansion) and that the effect of any variations in composition and
order on hop mechanisms and barriers are accurately accounted for. If important, cyclic hops,
which are made up of sequences of elementary hops, will therefore spontaneously occur within
the kinetic Monte Carlo simulations.
Having incorporated all possible diffusion hops in B2 NiAl compound, our kinetic Monte
Carlo program will calculate the tracer diffusion coefficients for Ni and Al atoms since the tracer
diffusion coefficients provides us with the most direct way to understand the physical
mechanism under diffusion in multi-component compounds. The tracer diffusion coefficient of
specie j is calculated as
[Δr R ξ
j (t)]2
ξ∑( ) / (2d)tNξ [111] at each composition within KMC
118
simulations by averaging over trajectories, Δr R ξ
j (t) (the vector linking the end points of the
trajectory of atom ξ of specie j after time t, Nξ is the number of atoms of specie j, and d is the
number of dimensions), at different times and over simulations that started from different initial
configurations (obtained with canonical Monte Carlo.
A variety of alloy compositions were determined with grand canonical Monte Carlo
simulations corresponding to an equilibrium vacancy concentration [93]. In the Ni-rich alloys,
the Monte Carlo (MC) cell contained 123 B2-NiAl unit cells (3456 sites) and 1000 kMC passes
were performed (one kMC pass corresponds to each atom on average having performed a hop),
starting from 100 initial configurations. In the Al-rich alloy an MC cell with 443 B2-NiAl unit
cells (170,368 sites) was used and 60 kMC passes were performed starting from 8 initial
configurations. A significantly larger MC cell was required in the Al-rich alloy to obtain the
correct equilibrium concentrations for antisite Al atoms, antisite Ni atoms and Al vacancies.
Figure 5-2 illustrates predicted tracer diffusion coefficients for both Ni and Al as a
function of bulk alloy concentration (defined as xNi xNi + xAl( ) where xi refers to the fraction of
bcc sites occupied by specie i) calculated at 1300 K. As is clearly evident from Fig. 5-2(a), the
predicted tracer diffusion coefficients depend strongly on composition, exhibiting a minimum at
stoichiometric NiAl. In Ni-rich alloys, the Ni tracer diffusion coefficient is larger than that of Al
indicating a higher Ni mobility there. In Al-rich alloys, however, the tracer diffusion coefficients
of Ni and Al are very similar, in spite of the fact that the Ni sublattice consists of a very high
concentration of vacancies. While experimental measurements of Al tracer diffusion coefficients
in B2-NiAl are not available, several measurements of Ni tracer diffusion coefficients have been
performed [49,50]. The measurements of Hancock et al. [50] and Frank et al. [49] qualitatively
exhibit similar trends with alloy composition as predicted here, however, quantitatively differ
119
from each other by as much as an order of magnitude in Al and Ni rich alloys (see Fig. 5-2b).
Both measured an increase in the Ni tracer diffusion coefficient with increasing Ni concentration
above stoichiometric NiAl. The Ni tracer diffusion coefficient measured by Hancock et al [50]
exhibits a pronounced minimum at stoichiometric NiAl composition, while that measured by
Frank [49] remains constant, as the alloy becomes Al rich. We emphasize that our predicted
tracer diffusion coefficients are for a perfect crystal without dislocations and grain boundaries,
while experimentally measured tracer diffusion coefficients are always performed on samples
that will contain some extended defects that can act as short-circuit diffusion paths. The samples
of Frank et al [49] were performed on single crystals such that grain boundary diffusion did not
play a role in their measurements.
There are several sources of inaccuracies in the calculated tracer diffusion coefficients,
which arise from the first-principle calculations, from the cluster expansion and from the kinetic
Monte Carlo simulations.
First, there is an error due to the use of the generalized-gradient approximation in density
functional theory, which is difficult to quantify and requires experimental information about a
particular hop mechanism to enable a direct comparison with a calculated migration barrier.
In DFT calculations the energy cutoff, the k-point sampling and the size of the supercell
are also sources of inaccuracies. In this thesis, a plane-wave basis set cutoff energy of 500eV was
used, which is much higher than the required value for the Ni and Al. Convergence tests of the
energy with respect to k-point grids indicated that k-point sampling errors are less than 5meV per
Ni xNiAl xAl ∅ xV formula unit, where ∅ stands for a vacancy. In section 4.3 we have shown that
the estimated numerical error in calculated activation barriers due to the supercell size is of the
order of 100-200meV.
120
In addition to the errors arising from first-principle calculations, an error can also come
from the cluster expansion. We have checked the difference in activation energy between first-
principles calculation and cluster expansion prediction for some of hops and found an error of
the order of 40meV.
Finally, kinetic Monte Carlo will also introduce inaccuracies due to the averaging over a
finite number of atomic trajectories. From Fig. 5-2 illustrates scatters in the calculated tracer
diffusion coefficients. This scatter comes from kinetic Monte Carlo simulations and is of the
order of a factor of 2.5. The scatter will decrease if averaging were performed aver more kinetic
Monte Carlo runs starting from different initial states. However, to do this is not feasible based
on our calculation capacity.
Although there are many types of numerical errors in the calculated migration barriers,
they are unlikely to be completely correlated in a positive sense. Some error cancellation can be
expected. Furthermore, systematic errors in the calculated activation barrier of 150meV will
produce an error of factor three in the diffusion coefficient at 1300K since hopping rates depend
exponentially on the activation barrier. This error in tracer diffusion coefficient is comparable to
the magnitude of the scatter in calculated results from kinetic Monte Carlo and within the scatter
in the experimental results. Furthermore, because these are systematic errors, they will not
change the trend of the tracer diffusion coefficients over the bulk composition range.
5.3 Relative importance of various diffusion mechanisms in B2-NiAl compound
A unique advantage of the kinetic Monte Carlo simulations is that it allows us to track the
frequency with which the various hops occur as a function of alloy composition, thereby
providing insight about the dominant diffusion mechanisms responsible for atomic transport in
121
B2-NiAl. These relative frequencies are illustrated in Figure 5-3. It should be noted that the
fractions for the cyclic hop mechanisms (i.e. 6JC, triple-defect) and hop sequences plotted in Fig.
5-3 do not correspond to the frequency with which the sequence itself occurs, but rather to the
sum of the total number of sub-hops making up the sequence. Furthermore the plotted
frequencies are upper bounds for the various hop sequences, as not all hop sequences come to
completion, retracing steps before reaching the end of a sequence.
Around stoichiometry, the most frequent hop sequence is Ni-anti-site/Ni-vacancy back
and forth hops, due to its relatively low migration barrier (~0.7 eV averaged over the back and
forth hop directions [93]). These hops, however, do not contribute to macroscopic transport (and
therefore the tracer diffusion coefficient) since a back and forth hop restores the Ni atom to its
initial position. The next most frequent hop mechanism at stoichiometry is the triple-defect hop
sequence in which a Ni anti-site next to a pair of Ni-vacancies perform a sequence of three hops
that results in a net migration of the triple defect by a cubic lattice parameter. As the Ni
concentration of the alloy is increased above stoichiometry, the dominant hop mechanism
changes to the anti-structure-bridge (ASB) mechanism [52], whereby vacancies, which
energetically prefer the Ni-sublattice, can migrate along percolating networks of nearest neighbor
Ni-chains connected by Ni-anti-site atoms. Since the existence of the percolating networks
requires Ni-anti-site atoms, the ASB sequence is only viable in Ni-rich alloys where off-
stoichiometry is accommodated by Ni-anti-site atoms [52]. The average migration barrier for Ni-
NN hops is comparatively low (~0.7 eV) and the migration of a vacancy along a percolating
network of Ni-anti-site atoms does not result in any increased disorder, thereby making the ASB
sequence a very effective mechanism to transport Ni ions. As a result, while Al predominantly
migrates by means of the triple-defect mechanism, the Ni atoms can migrate via both the triple-
122
defect and the ASB mechanisms resulting in a Ni tracer diffusion coefficient exceeding that of
Al above a threshold composition upon which the percolating NN Ni-pairs consisting of Ni anti-
site atoms are formed.
In Al-rich alloys (only one concentration was considered in Al-rich B2-NiAl as very
large Monte Carlo cells are required to ensure that equilibrium concentration for Al antisite, Ni
antisite and Al vacancies present), the dominant diffusion mechanisms change again, with the
triple-defect mechanism becoming less important and the ASB sequence involving Ni no longer
viable. Instead Ni and Al transport is mediated by the 6JC (which as described above is in fact a
sequence of three pair-atom hops) and what we will refer to as the Al-ASB sequence. The 6JC,
while having high migration barriers for the first hop (above 2.3 eV) [93,58,129], become a
dominant mechanism in Al-rich alloys due to the large concentration of Ni-vacancies. Its high
frequency has an entropic origin since for a given Ni-vacancy there are 48 symmetrically
equivalent pair-atom hops that can initiate the 6JC sequence. An important result in Fig. 5-3 is
that Ni NNN hops are not significant at any composition, even in Al-rich alloys where the Ni
vacancy concentration is very high, in large part due to its high migration barrier (~2.7eV) and
since only six NNN hops are possible for a Ni vacancy.
The other dominant diffusion mechanism in Al-rich alloys involves pair-atom hops in
which an Al on the Al sublattice and an anti-site Al simultaneously hop into a Ni vacancy. This
hop mechanism, which is characterized by a low migration barrier (~1 eV) [93], can be
compared to the Ni-ASB mechanism in that Al transport by this mechanism is greatly enhanced
once a percolating network of Ni vacancies is established. We, therefore, refer to it as an Al ASB
mechanism. While the kinetic Monte Carlo simulations predict a high frequency for this
mechanism, the alloy composition is likely not Al-rich enough to result in a sufficiently high Ni-
123
vacancy concentration to form percolating networks [149]. Most of the pair-atom hops involving
two Al atoms are therefore back and forth hops and do not contribute much to macroscopic Al
transport. Hence at the Al-rich composition considered here, the Ni and Al tracer diffusion
coefficients are similar in magnitude, relying for the most part on the 6JC mechanism for long-
range transport [63].
5.4 Summary
In this chapter we have shown the technique and complexity of investigating diffusion
mechanisms and predicting diffusion coefficients in a real material system – B2 NiAl compound.
Combining diffusion theory, cluster expansion and kinetic Monte Carlo simulation, we
systematically investigated various diffusion mechanisms and the calculated tracer diffusion
coefficients for Ni and Al are in good agreement with the experiment results. For the first time,
the relevant importance of various diffusion mechanisms is revealed in B2 NiAl. The above
results clearly demonstrate a remarkable complexity of atomic diffusion in metallic alloys even
for compounds such as B2-NiAl with its simple crystal structure. The decomposition of atomic
transport into various hop mechanisms, as illustrated in Fig. 5-3, shows the tremendous
sensitivity of the dominant diffusion mechanism to small changes in bulk alloy concentration.
This understanding is not only intriguing from a scientific point of view, but is also of great
relevance from an engineering standpoint as strategies to alter diffusion behavior in B2-NiAl
through alloying will depend sensitively on composition. A ternary alloying addition that may,
for example, have a tendency to pin down triple defects will only suppress diffusion in
stoichiometric alloys, but will be less effective in diminishing transport in Ni-rich alloys where
diffusion is dominated by the ASB-Ni mechanism. This has important implications in graded
124
multi-layer structures such as bond coats on turbine blades where interdiffusion can result in a
change of the alloy composition. The approach used here, combining first-principles cluster
expansion techniques with kinetic Monte Carlo simulations, will enable the study of diffusion in
other complex alloys, oxides and semiconductors, unraveling unexpected atomic transport
mechanisms that arise from varying degrees of short and long-range order at non-dilute
concentrations.
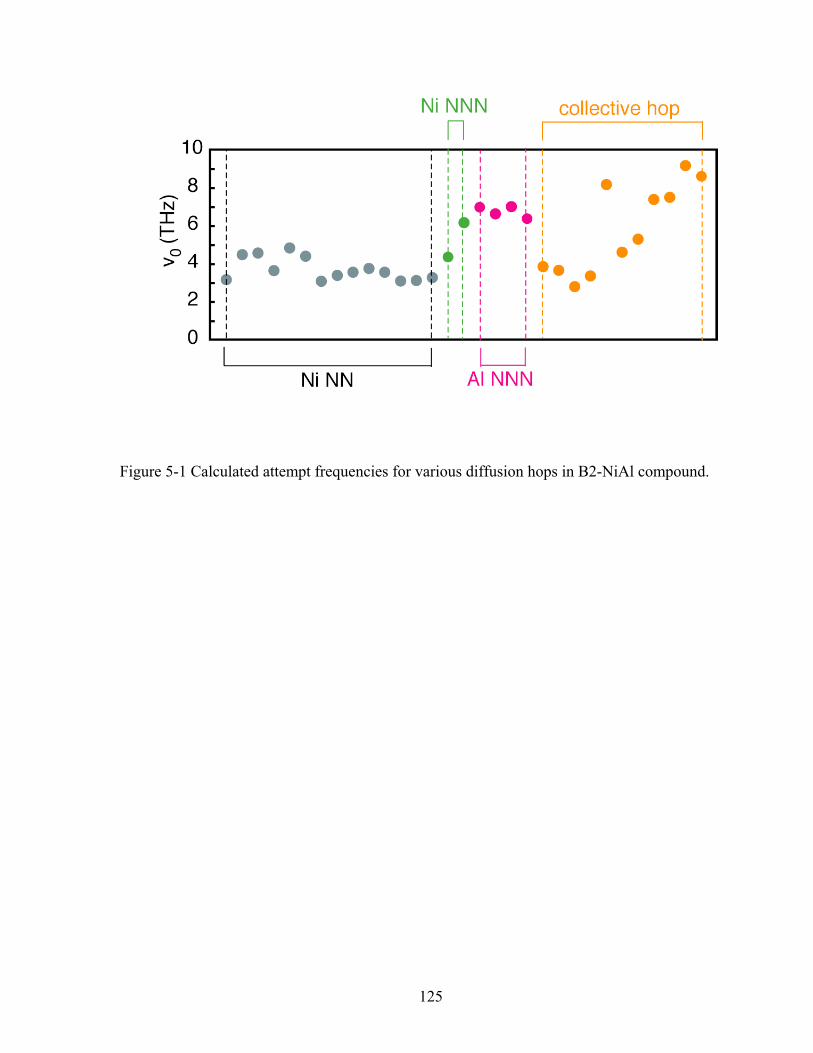
125
Figure 5-1 Calculated attempt frequencies for various diffusion hops in B2-NiAl compound.
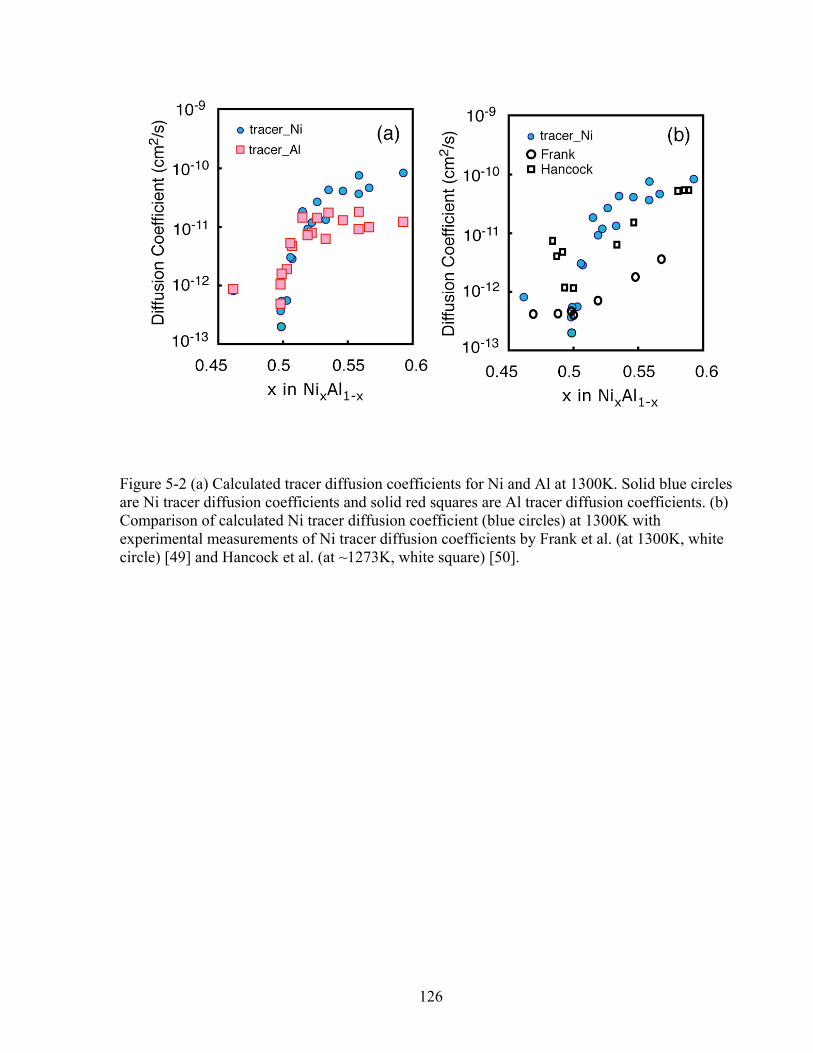
126
Figure 5-2 (a) Calculated tracer diffusion coefficients for Ni and Al at 1300K. Solid blue circles are Ni tracer diffusion coefficients and solid red squares are Al tracer diffusion coefficients. (b) Comparison of calculated Ni tracer diffusion coefficient (blue circles) at 1300K with experimental measurements of Ni tracer diffusion coefficients by Frank et al. (at 1300K, white circle) [49] and Hancock et al. (at ~1273K, white square) [50].
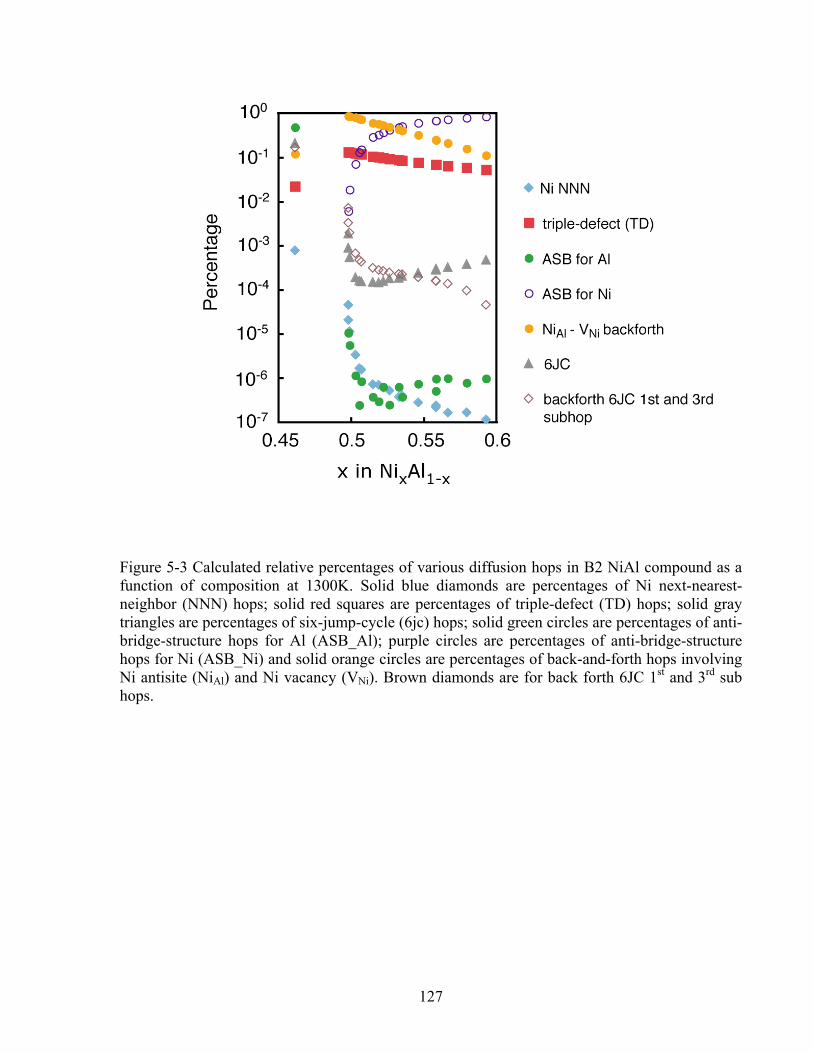
127
Figure 5-3 Calculated relative percentages of various diffusion hops in B2 NiAl compound as a function of composition at 1300K. Solid blue diamonds are percentages of Ni next-nearest-neighbor (NNN) hops; solid red squares are percentages of triple-defect (TD) hops; solid gray triangles are percentages of six-jump-cycle (6jc) hops; solid green circles are percentages of anti-bridge-structure hops for Al (ASB_Al); purple circles are percentages of anti-bridge-structure hops for Ni (ASB_Ni) and solid orange circles are percentages of back-and-forth hops involving Ni antisite (NiAl) and Ni vacancy (VNi). Brown diamonds are for back forth 6JC 1st and 3rd sub hops.
128
Chapter 6
Self-diffusion and interdiffusion in B2-NiAl compound
In chapter 5, we investigated the tracer diffusion coefficients for Ni and Al atoms in B2-
NiAl compound. Based on the results we obtained from chapter 5, in this chapter we will further
investigate self-diffusion and interdiffusion in the B2-NiAl compound at high temperature.
Going beyond the mean field approximation, we investigated the system with a cluster expansion
model to capture interactions among various defects. All well-known diffusion mechanisms and
new mechanisms discovered from first principles were incorporated in the kinetic Monte Carlo
simulation.
In this chapter we also investigate the thermodynamic factors in B2-NiAl compound and
show that in Al-rich alloys the thermodynamic factor of Al is much greater than that of Ni while
in Ni-rich alloys they are similar. This difference in thermodynamic factors results in a much
higher self-diffusion coefficient of Al compared to that of Ni in Al-rich alloys given similar
kinetic factors calculated in this region. This difference also results in two different interdiffusion
coefficients depending on whether Ni or Al concentration gradient is used in Fick’s first law. We
will demonstrate that this difference in thermodynamic factors has its root in the specific
characteristic of defects in B2 NiAl, i.e., the high vacancy concentration and asymmetric
distribution of vacancies, between the Ni sublattice and Al sublattice.
129
6.1 Violation of one thermodynamic factor assumption
Interdiffusion is a very important phenomenon in solids and attracts attentions from both
application area and theoretical research. For instance, as we have mentioned in chapter 1, the
interdiffusion can lead to functional degradation in B2-NiAl compound, which serves as a bond
coat between the Ni-rich superalloy substrate and the Al-rich TGO chemical barrier in gas
turbine blades [38]. Although the crystal structure of B2-NiAl compound is simple, this
compound has very complex defect type and structure [41], making it challenging to investigate
interdiffusion in this system. There are many types of point defects and defect clusters that
simultaneously exist in the B2-NiAl compound at finite temperature and the interaction among
them cannot be simply ignored.
Due to the complex defects in B2-NiAl compound, the diffusion mechanism is not clear
although many diffusion mechanisms have been proposed in last several decades [42,43,47-67],
including nearest neighbor hop, next nearest neighbor hop, six-jump-cycle hop [47,63,66], anti-
structural-bridge hop [52] and triple defect hop [49,67]. In chapter 5, we evaluated all these
possible mechanisms as well as new mechanisms and our kinetic Monte Carlo simulations
showed that Ni anti-structural bridge hop is the dominant hop in Ni-rich region and Al anti-
structural hop is the dominant one in Al-rich region. Despite this clear understanding of diffusion
hops in B2-NiAl compound, the effect of specific defect characteristic on the self-diffusion and
interdiffusion coefficients of B2-NiAl at high temperature is not clear because the self-diffusion
and interdiffusion coefficients depend on not only kinetic factors but also thermodynamic factors
[135].
In previous analyses of self-diffusion and interdiffusion in most solids, equations derived
within the assumption of a small vacancy concentration have always been used, which leads to a
130
single thermodynamic factor for both Ni and Al. This assumption is not appropriate for B2-NiAl
compound because (i) the vacancy concentration can be as high as 15% in Al rich region; (ii)
vacancies do not randomly distributed among the Ni sublattice and Al sublattice (most vacancies
are on the Ni sublattice) and (iii) the concentration of vacancy depends on the bulk concentration
of the compound [41-43]. All these specific characteristic of defects in B2-NiAl compound
invalidate the conventional assumptions concerning vacancies and thermodynamic factors and
have significant effects on self-diffusion and interdiffusion coefficients in B2-NiAl compound.
Some researchers have questioned this conventional assumption when studying chemical
diffusion in alloys that have high vacancy concentration. For instance, using an model Ising
binary ordered alloy Qin [136] argued from computer simulation that whenever the vacancy
concentration is greater than 1%, the thermodynamic factors for chemical diffusion of the
component A and B are different. Without knowing the vacancy concentration as a function of
alloy composition, Bencze [137] roughly evaluated two different thermodynamic factors for Ni
and Al in B2-NiAl compound from activity measurements while he admitted that there are
problems in obtaining the thermodynamic factors from activity measurements in B2-NiAl
compound due to the high vacancy concentration and the absence of the vacancy concentration
profile as a function of bulk alloy composition. Thus, we will abandon the conventional
assumption regarding vacancy concentration and thermodynamic factor in the present thesis and
investigate the effect of specific defect characteristic on the intrinsic diffusion and interdiffusion
in B2-NiAl compound from first-principle taking account of the defect concentration as a
function of bulk alloy composition.
6.2. Self-diffusion coefficients in B2-NiAl compound
131
In a system such as B2-NiAl where the crystal sites are conserved, the atomic fluxes for
substitutional diffusion mediated by vacancies can be written as the following phenomenological
equations [138,139]:
JNi = −LNiNi∇μNi −LNiAl∇μAl −LNiV∇μV (6-1a)
JAl = −LAlNii∇μNi −LAlAl∇μAl −LAlV∇μV (6-1b)
where Ji(i = Ni, Al or vacancy) is the fluxes of component i that is defined as the number of
atoms crossing a unit area per unit time, Lij’s are kinetic coefficients and ∇μi(i = Ni, Al or
vacancy) is the chemical potential gradient of component i, As we have mentioned in section 2.4
that we take μV= 0 in our simulation since a vacancy is a non-conserved species in a fully
equilibrated solid, its chemical potential μV must be zero, equations (6-1a) and (6-1b) becomes
JNi = −LNiNi∇μNi −LNiAl∇μAl (6-2a)
JAl = −LAlNii∇μNi −LAlAl∇μAl (6-2b)
The atomic fluxes can also be expressed as the following equations according to Fick’s first law
within the assumption that μV = 0 (μV is the chemical potential of vacancy, see Chapter 4 for
explaination):
JNi = −DNi∇CNi (6-3a)
JAl = −DAl∇CAl (6-3b)
where Di (i=Ni, Al or vacancy) is the self-diffusion coefficient and ∇Ci (i =Ni, Al or vacancy
and CNi + CAl + CV = 1) is the gradient of volume based concentration of component i. The
volume-based concentration can be converted to crystal site based concentration according
xi=CiΩ, (6-4)
where Ω is the volume per crystal site and xi is the site based concentration of component i (i=Ni,
Al or vacancy) defined as the number of sites occupied by component i as a fraction of total
132
crystal sites M, that is xi = Ni/M, where Ni is the number of sites occupied by component i and M
is the total number of crystal sites. It should be noted that xNi + xAl + xV = 1. The concentration
and chemical potential of Ni, Al and vacancy V satisfy the Gibbs-Duhem relation,
namely, xNidμNi + xAldμAl + xV dμV = 0. Since μV=0, the relation becomes
xNidμNi + xAldμAl = 0 (6-5)
Combining equations (6-2) through (6-5) we can get the following well-known equations for
self-diffusion coefficients [135,138]:
DNi =˜ L NiNi
xNi
−˜ L NiAl
xAl
⎛
⎝ ⎜
⎞
⎠ ⎟
xNi
kBTdμNi
dxNi
⎛
⎝ ⎜
⎞
⎠ ⎟
μV = 0
(6-6a)
DAl =˜ L AlAl
xAl
−˜ L AlNi
xNi
⎛
⎝ ⎜
⎞
⎠ ⎟
xAl
kBTdμAl
dxAl
⎛
⎝ ⎜
⎞
⎠ ⎟
μV = 0
(6-6b)
where ˜ L ij = ΩkBTLij , kB is the Boltzmann constant and T is the absolute temperature. It can be
seen from equations (6-6) that the self-diffusion coefficient depends on two parts, one,
˜ L NiNi
xNi
−˜ L NiAl
xAl
⎛
⎝ ⎜
⎞
⎠ ⎟ for DNi, is related to kinetic coefficients and the other, xNi
kBTdμNi
dxNi
⎛
⎝ ⎜
⎞
⎠ ⎟
μV = 0
for DNi, is
related to thermodynamic factor. We will define thermodynamic factors φ for Ni and Al by the
following two equations:
φNi = xNi
kBTdμNi
dxNi
⎛
⎝ ⎜
⎞
⎠ ⎟
μV = 0
(6-7a)
φAl = xAl
kBTdμAl
dxAl
⎛
⎝ ⎜
⎞
⎠ ⎟
μV = 0
(6-7b)
Allnatt has shown that the kinetic coefficients can be expressed as the following equation
[140,141]:
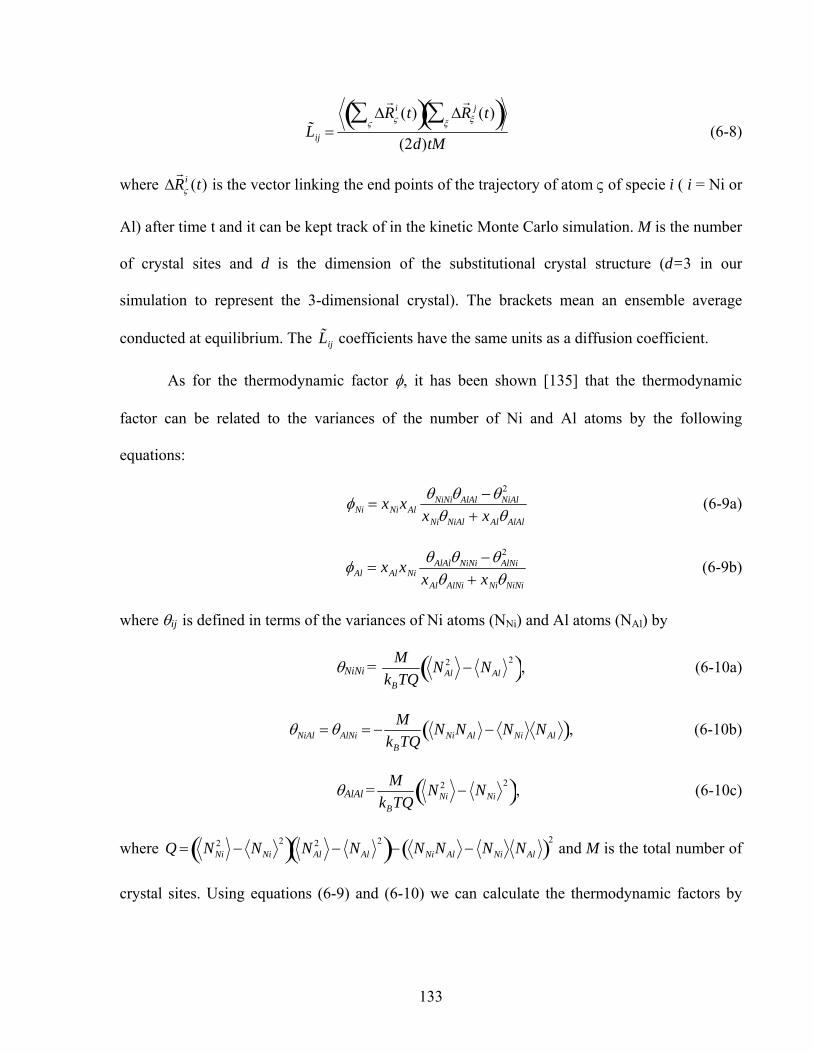
133
˜ L ij =Δ
r R ς
i (t)ς∑( ) Δ
r R ξ
j (t)ξ∑( )
(2d)tM (6-8)
where Δr R ς
i (t) is the vector linking the end points of the trajectory of atom ς of specie i ( i = Ni or
Al) after time t and it can be kept track of in the kinetic Monte Carlo simulation. M is the number
of crystal sites and d is the dimension of the substitutional crystal structure (d=3 in our
simulation to represent the 3-dimensional crystal). The brackets mean an ensemble average
conducted at equilibrium. The ˜ L ij coefficients have the same units as a diffusion coefficient.
As for the thermodynamic factor φ, it has been shown [135] that the thermodynamic
factor can be related to the variances of the number of Ni and Al atoms by the following
equations:
φNi = xNixAlθNiNiθAlAl −θNiAl
2
xNiθNiAl + xAlθAlAl
(6-9a)
φAl = xAl xNiθAlAlθNiNi −θAlNi
2
xAlθAlNi + xNiθNiNi
(6-9b)
where θij is defined in terms of the variances of Ni atoms (NNi) and Al atoms (NAl) by
θNiNi = MkBTQ
NAl2 − NAl
2( ), (6-10a)
θNiAl = θAlNi = −M
kBTQNNiNAl − NNi NAl( ), (6-10b)
θAlAl =M
kBTQNNi
2 − NNi2( ), (6-10c)
where Q = NNi2 − NNi
2( ) NAl2 − NAl
2( )− NNiNAl − NNi NAl( )2 and M is the total number of
crystal sites. Using equations (6-9) and (6-10) we can calculate the thermodynamic factors by
134
keeping track of the number of Ni and Al atoms in the grand canonical Monte Carlo simulation
[135,142].
Based on Monte Carlo simulation data we calculated the self-diffusion coefficients as a
function of bulk composition of B2-NiAl. Figure 6-1 shows the calculated self-diffusion
coefficients for Ni and Al atoms in B2-NiAl at 1300K. In Al-rich region, only one composition
was investigated, as it is extremely difficult to get good statistics in reasonable time period in this
region. A primary reason is that the concentration of point defects or defect clusters necessary to
mediate diffusion hops are very dilute in this region so requiring large Monte Carlo supercells to
reproduce the equilibrium defect concentration in the kinetic Monte Carlo simulation.
Furthermore, the concentration of vacancies is very high in the Al-rich region so the number of
hops is much larger than that in Ni-rich region. In a kinetic Monte Carlo simulation, all hops
must be considered simultaneously during each hop event.
From Fig. 6-1 we can see that the Ni has a higher self-diffusion coefficient than Al in the
Ni-rich region while Al has a higher self-diffusion coefficient than Ni in the Al-rich region with
the cross at the composition of around 52%. As we have demonstrated in chapter 5 Ni has a
higher tracer diffusion coefficient than Al in the Ni-rich region due to the anti-structural bridge
mechanism while Al and Ni atom have similar tracer diffusion coefficients in Al-rich region.
Compared with the tracer diffusion coefficients the self-diffusion coefficients exhibit a very
different profile in the Al-rich region. This is a result of a difference in thermodynamic factors
between Ni and Al.
As we have mentioned above in equation (6-6), the intrinsic diffusion coefficient depends
on two parts, one is related to kinetic coefficients and the other is related to thermodynamic
factor. We calculated the thermodynamic factors (Eq. (6-7a) and (6-7b)) using Monte Carlo
135
simulations. Figure 6-2 shows the results for Ni and Al at 1300K in B2-NiAl. From Fig. 6-2 we
can see that Ni and Al have identical thermodynamic factors in Ni-rich region while they have
very different values in the Al-rich region. In the Al-rich region, the thermodynamic factor of Al
is much larger than that of Ni by several orders of magnitude. It is this large difference in
thermodynamic factors that results in self-diffusion coefficients that differ qualitively from the
tracer diffusion coefficients in Al-rich region. While Ni and Al have similar tracer diffusion
coefficients, Al has a much larger self-diffusion coefficient than Ni in the Al-rich region.
6.3 Two thermodynamic factors in B2-NiAl compound
The reason for two thermodynamic factors in B2-NiAl compound can be shown as
follows. The Gibbs-Duhem equation (6-5), which is under the restriction that μV = 0, can be
rewritten as
xNidμNi
kBTdxNi
+xAldμAl
kBTdxAl
dxAl
dxNi
= 0. (6-11)
According to the definition of thermodynamic factors for Ni and Al (equation (6-7a) and (6-7b)),
equation (6-11) is equivalent to φNi + φAldxAl
dxNi
= 0, which indicates that
φAl
φNi
= −dxNi
dxAl
. (6-12)
In a binary system where vacancies are so dilute that their composition can be neglected, 1 = xNi
+ xAl + xV ≈ xNi + xAl. This indicates that as the bulk composition changes, the increase of one
component is achieved by the decrease of the other component and consequently, dxA
dxB
= −1,
leading to φA = φB by equation (6-12). In such a system, the thermodynamic factors of the two
components are equal. However, in the B2-NiAl compound this is not the case. Our previous
136
investigation has shown that the equilibrium concentration of vacancy in B2-NiAl can reach up
to 15% in Al-rich region at 1300K and as the bulk composition of B2-NiAl changes, the decrease
in Ni concentration, xNi, is not achieved by the means of an increase in the Al concentration, xAl.
As a result, dxA
dxB
= −1 does not hold any longer in the B2-NiAl compound and two different
thermodynamic factors are necessary for calculating intrinsic diffusion coefficients.
A detailed analysis can be achieved by keeping track of the Ni concentration xNi and Al
concentration xAl in the Monte Carlo simulation and Fig. 6-3 shows the relationship between the
Ni concentration xNi and the Al concentration xAl as the bulk composition of B2-NiAl changes at
1300K. From Fig. 6-3 we can see that in the Ni-rich region dxNi
dxAl
is almost -1 indicating that φNi
is almost identical to φAl. The reason for this is that in Ni-rich region (as demonstrated in our
previous investigation) the major point defects are antisite Ni atoms and vacancies are dilute (Ni
vacancy is at the 10-3 level and Al vacancy is at the 10-7~10-6 level). Consequently as the bulk
composition changes in the Ni-rich region the increase (decrease) in xNi is achieved by a decrease
(increase) in xAl, causing dxNi
dxAl
equal to -1. We can also see from Fig. 6-3 that in the Al-rich
region the absolute value of dxNi
dxAl
is very large, indicating that φAl is much larger than φNi. This is
because in the Al-rich region (see chapter 4) the major point defect are Ni vacancies and its
concentration is too high to be neglected (10-2 ~ 10-1 level). Consequently as the bulk
composition changes in the Al-rich region the increase (decrease) in xNi is achieved by the
decrease (increase) in the concentration of Ni vacancies while xAl remains almost constant. This
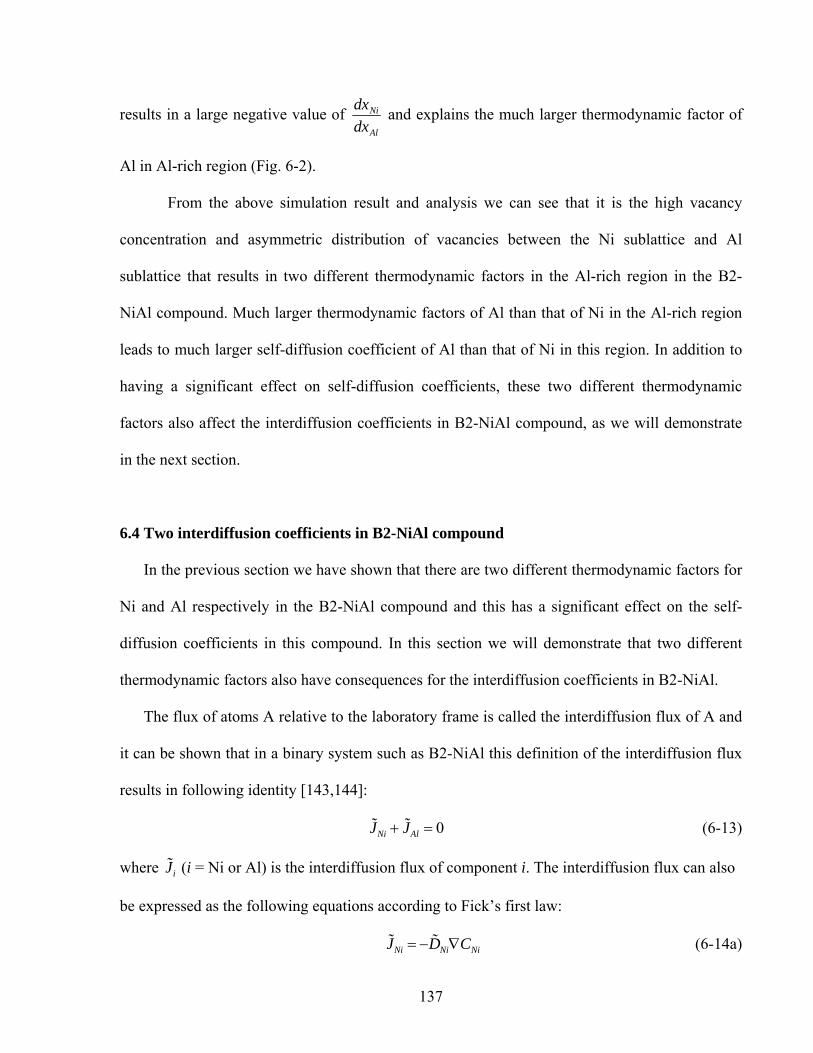
137
results in a large negative value of dxNi
dxAl
and explains the much larger thermodynamic factor of
Al in Al-rich region (Fig. 6-2).
From the above simulation result and analysis we can see that it is the high vacancy
concentration and asymmetric distribution of vacancies between the Ni sublattice and Al
sublattice that results in two different thermodynamic factors in the Al-rich region in the B2-
NiAl compound. Much larger thermodynamic factors of Al than that of Ni in the Al-rich region
leads to much larger self-diffusion coefficient of Al than that of Ni in this region. In addition to
having a significant effect on self-diffusion coefficients, these two different thermodynamic
factors also affect the interdiffusion coefficients in B2-NiAl compound, as we will demonstrate
in the next section.
6.4 Two interdiffusion coefficients in B2-NiAl compound
In the previous section we have shown that there are two different thermodynamic factors for
Ni and Al respectively in the B2-NiAl compound and this has a significant effect on the self-
diffusion coefficients in this compound. In this section we will demonstrate that two different
thermodynamic factors also have consequences for the interdiffusion coefficients in B2-NiAl.
The flux of atoms A relative to the laboratory frame is called the interdiffusion flux of A and
it can be shown that in a binary system such as B2-NiAl this definition of the interdiffusion flux
results in following identity [143,144]:
˜ J Ni + ˜ J Al = 0 (6-13)
where ˜ J i (i = Ni or Al) is the interdiffusion flux of component i. The interdiffusion flux can also
be expressed as the following equations according to Fick’s first law:
˜ J Ni = − ˜ D Ni∇CNi (6-14a)
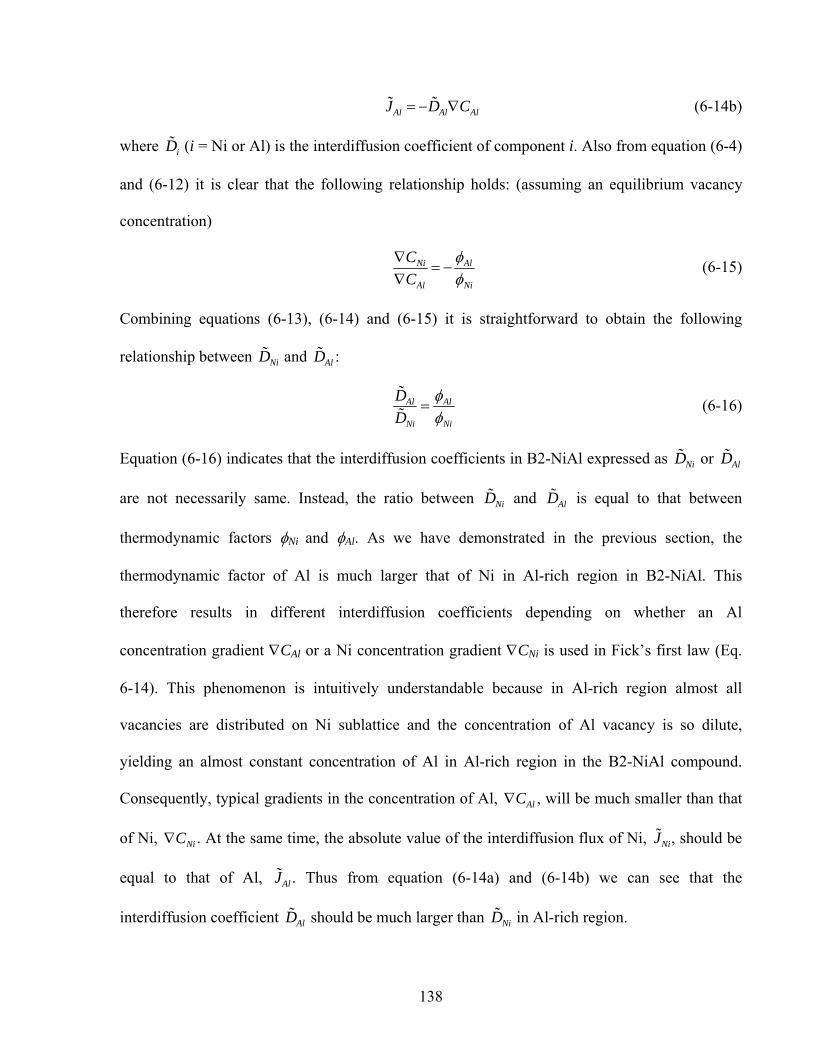
138
˜ J Al = − ˜ D Al∇CAl (6-14b)
where ˜ D i (i = Ni or Al) is the interdiffusion coefficient of component i. Also from equation (6-4)
and (6-12) it is clear that the following relationship holds: (assuming an equilibrium vacancy
concentration)
∇CNi
∇CAl
= −φAl
φNi
(6-15)
Combining equations (6-13), (6-14) and (6-15) it is straightforward to obtain the following
relationship between ˜ D Ni and ˜ D Al :
˜ D Al˜ D Ni
=φAl
φNi
(6-16)
Equation (6-16) indicates that the interdiffusion coefficients in B2-NiAl expressed as ˜ D Ni or ˜ D Al
are not necessarily same. Instead, the ratio between ˜ D Ni and ˜ D Al is equal to that between
thermodynamic factors φNi and φAl. As we have demonstrated in the previous section, the
thermodynamic factor of Al is much larger that of Ni in Al-rich region in B2-NiAl. This
therefore results in different interdiffusion coefficients depending on whether an Al
concentration gradient ∇CAl or a Ni concentration gradient ∇CNi is used in Fick’s first law (Eq.
6-14). This phenomenon is intuitively understandable because in Al-rich region almost all
vacancies are distributed on Ni sublattice and the concentration of Al vacancy is so dilute,
yielding an almost constant concentration of Al in Al-rich region in the B2-NiAl compound.
Consequently, typical gradients in the concentration of Al, ∇CAl , will be much smaller than that
of Ni, ∇CNi . At the same time, the absolute value of the interdiffusion flux of Ni, ˜ J Ni, should be
equal to that of Al, ˜ J Al . Thus from equation (6-14a) and (6-14b) we can see that the
interdiffusion coefficient ˜ D Al should be much larger than ˜ D Ni in Al-rich region.
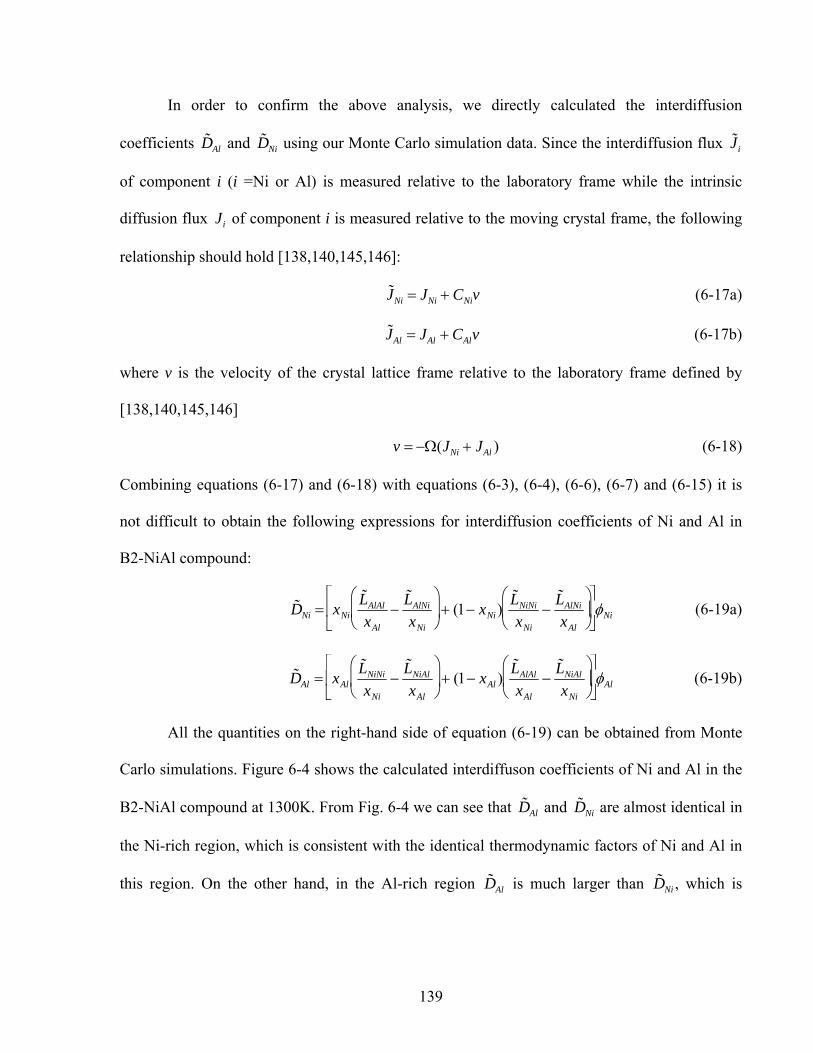
139
In order to confirm the above analysis, we directly calculated the interdiffusion
coefficients ˜ D Al and ˜ D Ni using our Monte Carlo simulation data. Since the interdiffusion flux ˜ J i
of component i (i =Ni or Al) is measured relative to the laboratory frame while the intrinsic
diffusion flux Ji of component i is measured relative to the moving crystal frame, the following
relationship should hold [138,140,145,146]:
˜ J Ni = JNi + CNiv (6-17a)
˜ J Al = JAl + CAlv (6-17b)
where v is the velocity of the crystal lattice frame relative to the laboratory frame defined by
[138,140,145,146]
v = −Ω(JNi + JAl ) (6-18)
Combining equations (6-17) and (6-18) with equations (6-3), (6-4), (6-6), (6-7) and (6-15) it is
not difficult to obtain the following expressions for interdiffusion coefficients of Ni and Al in
B2-NiAl compound:
˜ D Ni = xNi
˜ L AlAl
xAl
−˜ L AlNi
xNi
⎛
⎝ ⎜
⎞
⎠ ⎟ + (1− xNi)
˜ L NiNi
xNi
−˜ L AlNi
xAl
⎛
⎝ ⎜
⎞
⎠ ⎟
⎡
⎣ ⎢
⎤
⎦ ⎥ φNi (6-19a)
˜ D Al = xAl
˜ L NiNi
xNi
−˜ L NiAl
xAl
⎛
⎝ ⎜
⎞
⎠ ⎟ + (1− xAl )
˜ L AlAl
xAl
−˜ L NiAl
xNi
⎛
⎝ ⎜
⎞
⎠ ⎟
⎡
⎣ ⎢
⎤
⎦ ⎥ φAl (6-19b)
All the quantities on the right-hand side of equation (6-19) can be obtained from Monte
Carlo simulations. Figure 6-4 shows the calculated interdiffuson coefficients of Ni and Al in the
B2-NiAl compound at 1300K. From Fig. 6-4 we can see that ˜ D Al and ˜ D Ni are almost identical in
the Ni-rich region, which is consistent with the identical thermodynamic factors of Ni and Al in
this region. On the other hand, in the Al-rich region ˜ D Al is much larger than ˜ D Ni , which is
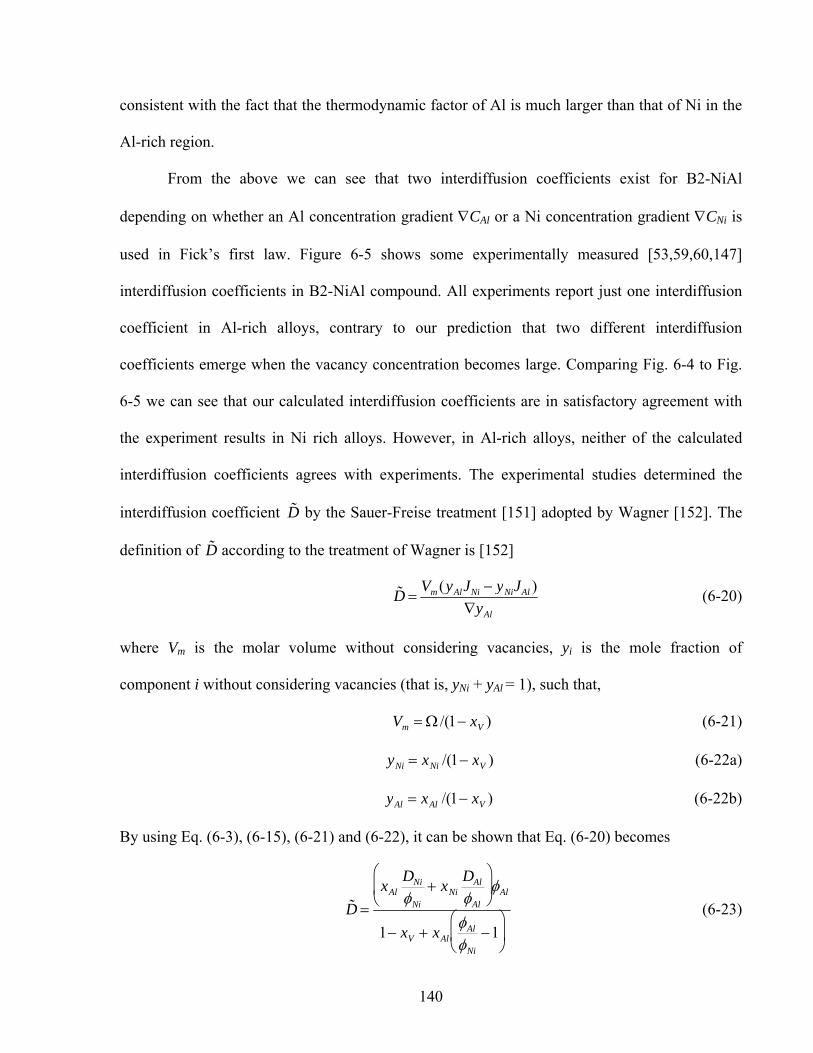
140
consistent with the fact that the thermodynamic factor of Al is much larger than that of Ni in the
Al-rich region.
From the above we can see that two interdiffusion coefficients exist for B2-NiAl
depending on whether an Al concentration gradient ∇CAl or a Ni concentration gradient ∇CNi is
used in Fick’s first law. Figure 6-5 shows some experimentally measured [53,59,60,147]
interdiffusion coefficients in B2-NiAl compound. All experiments report just one interdiffusion
coefficient in Al-rich alloys, contrary to our prediction that two different interdiffusion
coefficients emerge when the vacancy concentration becomes large. Comparing Fig. 6-4 to Fig.
6-5 we can see that our calculated interdiffusion coefficients are in satisfactory agreement with
the experiment results in Ni rich alloys. However, in Al-rich alloys, neither of the calculated
interdiffusion coefficients agrees with experiments. The experimental studies determined the
interdiffusion coefficient ˜ D by the Sauer-Freise treatment [151] adopted by Wagner [152]. The
definition of ˜ D according to the treatment of Wagner is [152]
˜ D = Vm (yAlJNi − yNiJAl )∇yAl
(6-20)
where Vm is the molar volume without considering vacancies, yi is the mole fraction of
component i without considering vacancies (that is, yNi + yAl = 1), such that,
Vm = Ω /(1− xV ) (6-21)
yNi = xNi /(1− xV ) (6-22a)
yAl = xAl /(1− xV ) (6-22b)
By using Eq. (6-3), (6-15), (6-21) and (6-22), it can be shown that Eq. (6-20) becomes
˜ D =xAl
DNi
φNi
+ xNiDAl
φAl
⎛
⎝ ⎜
⎞
⎠ ⎟ φAl
1− xV + xAlφAl
φNi
−1⎛
⎝ ⎜
⎞
⎠ ⎟
(6-23)
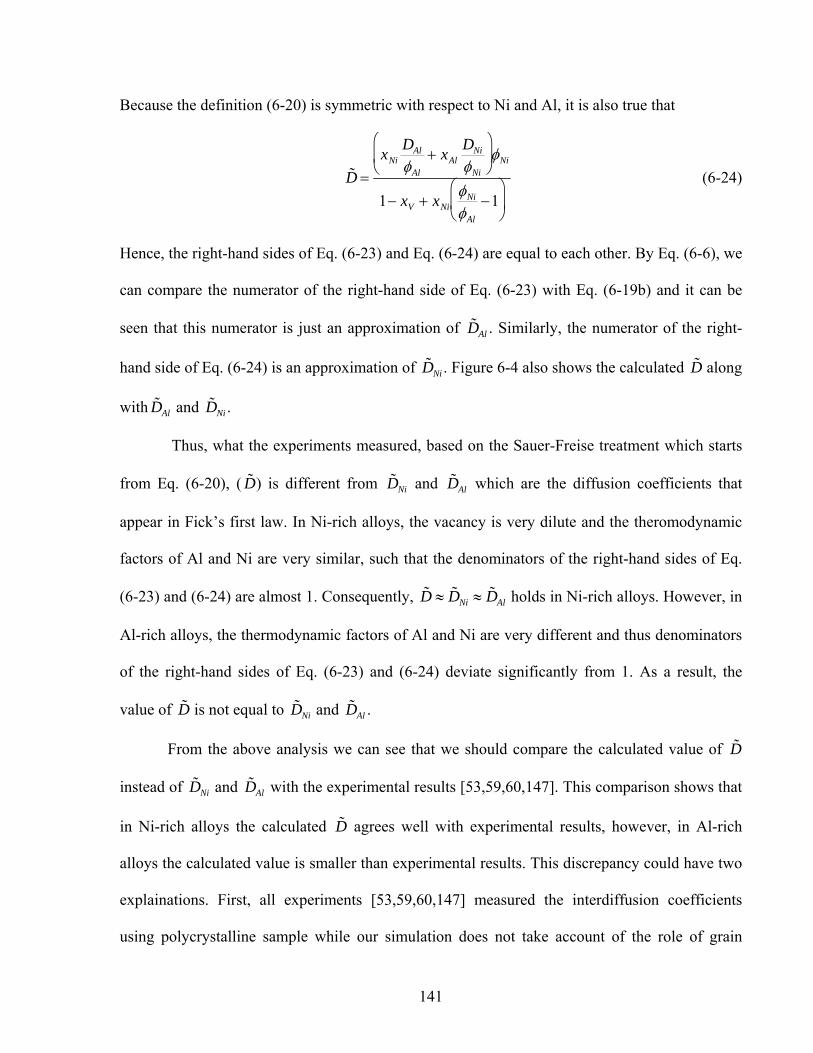
141
Because the definition (6-20) is symmetric with respect to Ni and Al, it is also true that
˜ D =xNi
DAl
φAl
+ xAlDNi
φNi
⎛
⎝ ⎜
⎞
⎠ ⎟ φNi
1− xV + xNiφNi
φAl
−1⎛
⎝ ⎜
⎞
⎠ ⎟
(6-24)
Hence, the right-hand sides of Eq. (6-23) and Eq. (6-24) are equal to each other. By Eq. (6-6), we
can compare the numerator of the right-hand side of Eq. (6-23) with Eq. (6-19b) and it can be
seen that this numerator is just an approximation of ˜ D Al . Similarly, the numerator of the right-
hand side of Eq. (6-24) is an approximation of ˜ D Ni . Figure 6-4 also shows the calculated ˜ D along
with ˜ D Al and ˜ D Ni .
Thus, what the experiments measured, based on the Sauer-Freise treatment which starts
from Eq. (6-20), ( ˜ D ) is different from ˜ D Ni and ˜ D Al which are the diffusion coefficients that
appear in Fick’s first law. In Ni-rich alloys, the vacancy is very dilute and the theromodynamic
factors of Al and Ni are very similar, such that the denominators of the right-hand sides of Eq.
(6-23) and (6-24) are almost 1. Consequently, ˜ D ≈ ˜ D Ni ≈ ˜ D Al holds in Ni-rich alloys. However, in
Al-rich alloys, the thermodynamic factors of Al and Ni are very different and thus denominators
of the right-hand sides of Eq. (6-23) and (6-24) deviate significantly from 1. As a result, the
value of ˜ D is not equal to ˜ D Ni and ˜ D Al .
From the above analysis we can see that we should compare the calculated value of ˜ D
instead of ˜ D Ni and ˜ D Al with the experimental results [53,59,60,147]. This comparison shows that
in Ni-rich alloys the calculated ˜ D agrees well with experimental results, however, in Al-rich
alloys the calculated value is smaller than experimental results. This discrepancy could have two
explainations. First, all experiments [53,59,60,147] measured the interdiffusion coefficients
using polycrystalline sample while our simulation does not take account of the role of grain
142
boundary diffusion. It has been shown by the experiments that the tracer diffusion coefficient of
Ni in polycrystalline B2-NiAl [50] is much larger than that in single crystal samples [49] (Fig. 5-
2(b)). Another possible explanation for this disagreement may have its origin in the standard
textbook assumption that the chemical potential of vacancies is zero since the dislocations and
grain boundaries act as vacancy sources and sinks. However, in Al-rich B2-NiAl compound the
concentration of vacancies is so high that it may locally deviate from its equilibrium value
because insufficient dislocation and grain boundaries cannot effectively regulate an equilibrium
concentration, leading to a vacancy chemical potential that is not zero.
6.5 Summary
In this chapter we have systematically investigated the self-diffusion and interdiffusion
coefficients in the B2-NiAl compound from first-principles
Our investigation has shown that there are two different thermodynamic factors for Ni
and Al in the Al-rich region while they are almost identical in Ni-rich region. In the Al-rich
region the thermodynamic factor of Al is much larger than that of Ni resulting in a much larger
self-diffusion coefficient for Al than for Ni. We have also shown that, due to the high vacancy
concentration in Al rich B2-NiAl, there are two interdiffusion coefficients depending on whether
interdiffusion is treated in terms of Al concentration gradients or Ni concentration gradients.
However, the definition of interdiffusion coefficient measured from experiments is different
from those in Fick’s first law; these two types of definitions give similar values of interdiffusion
coefficients in compounds with dilute vacancy while very different values in materials with high
vacancy concentration.
143
Our investigation also shows that the specific characteristic of defect in B2-NiAl
compounds, i.e. the high vacancy concentration and asymmetric distribution of vacancies
between Ni sublattice and Al sublattice, is the reason for two different thermodynamic factors in
Al-rich region and the resulting self-diffusion and interdiffusion coefficients in this composition
region of B2-NiAl compound.
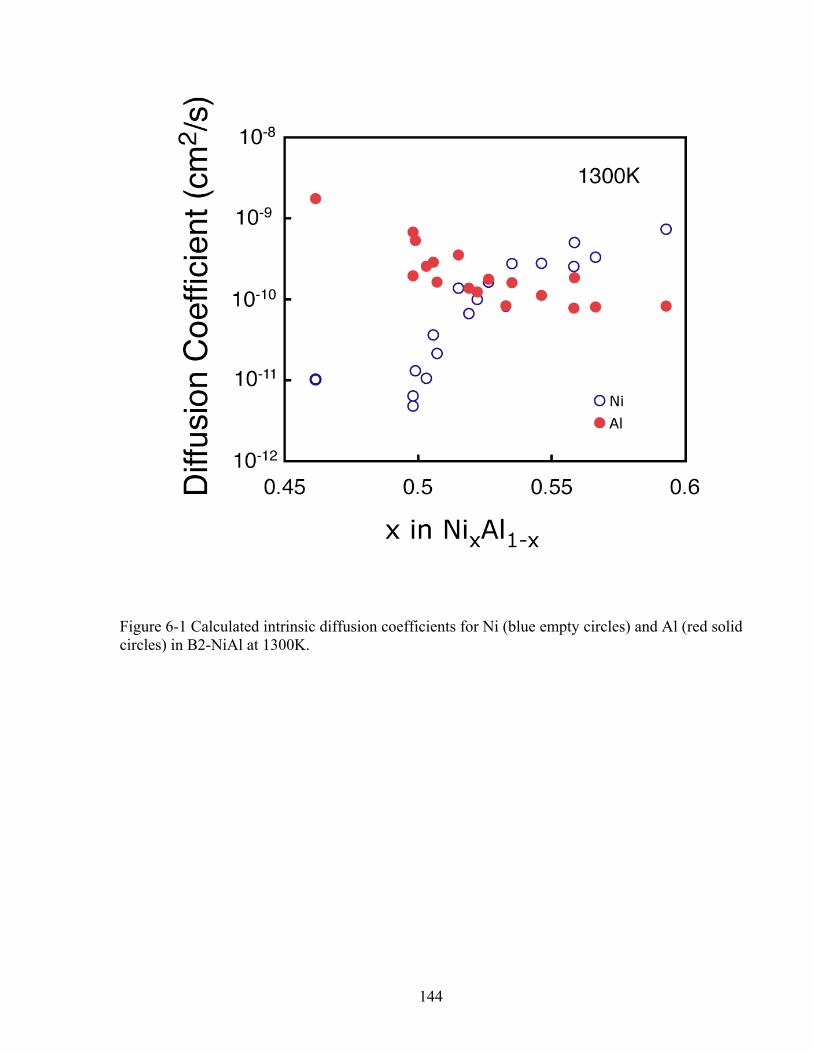
144
Figure 6-1 Calculated intrinsic diffusion coefficients for Ni (blue empty circles) and Al (red solid circles) in B2-NiAl at 1300K.
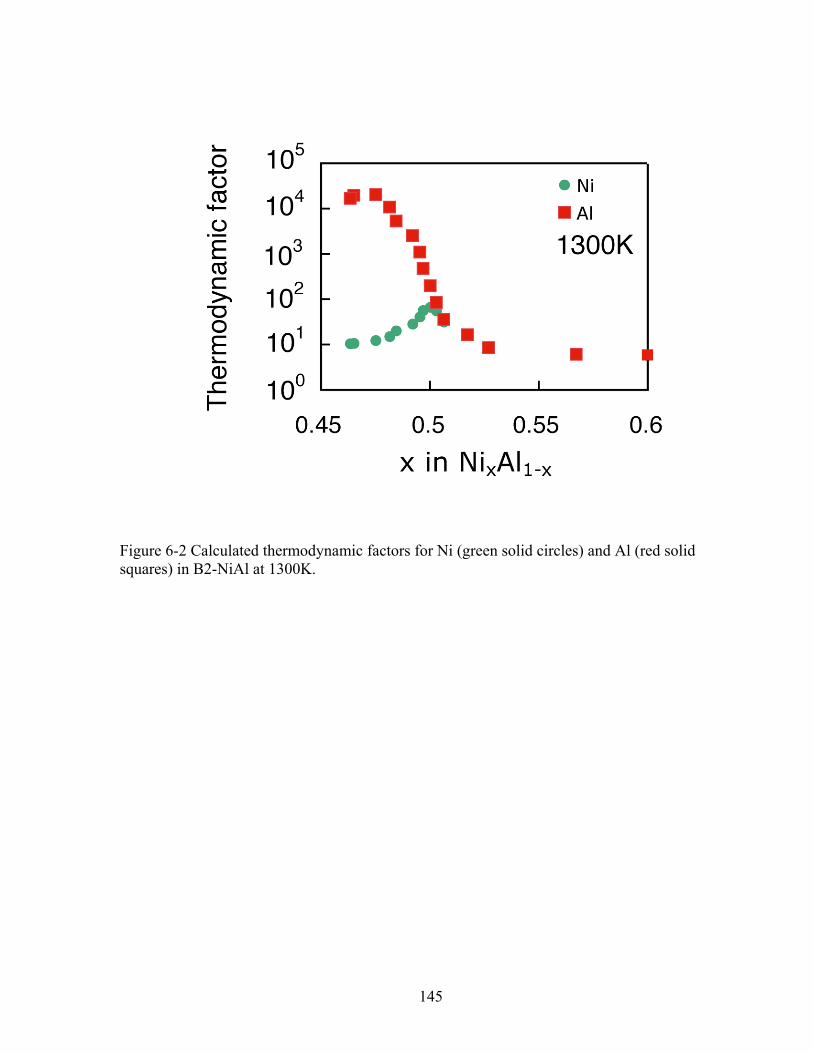
145
Figure 6-2 Calculated thermodynamic factors for Ni (green solid circles) and Al (red solid squares) in B2-NiAl at 1300K.
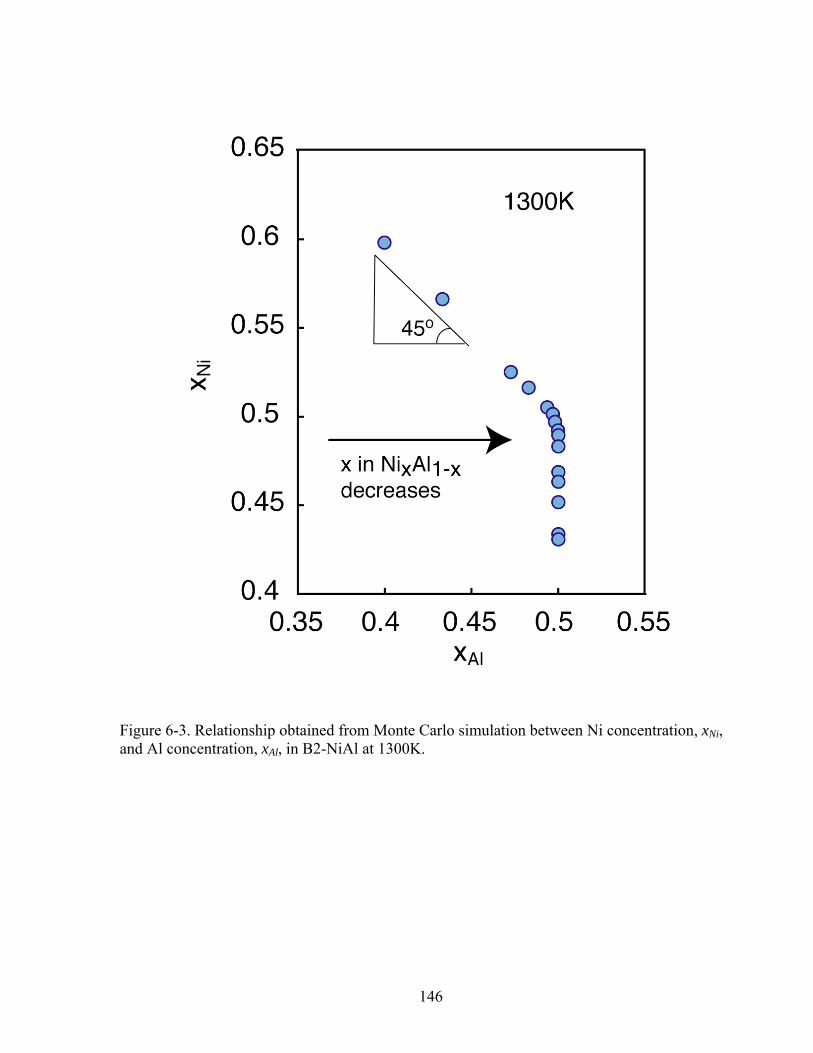
146
Figure 6-3. Relationship obtained from Monte Carlo simulation between Ni concentration, xNi, and Al concentration, xAl, in B2-NiAl at 1300K.
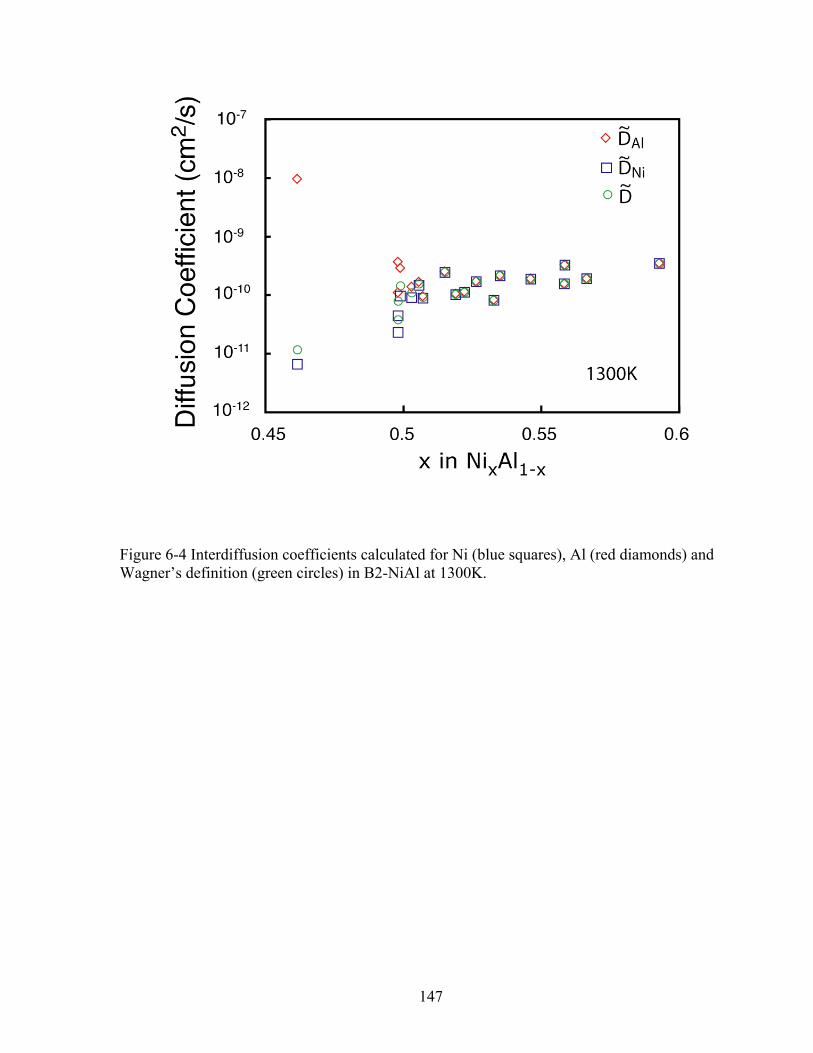
147
Figure 6-4 Interdiffusion coefficients calculated for Ni (blue squares), Al (red diamonds) and Wagner’s definition (green circles) in B2-NiAl at 1300K.
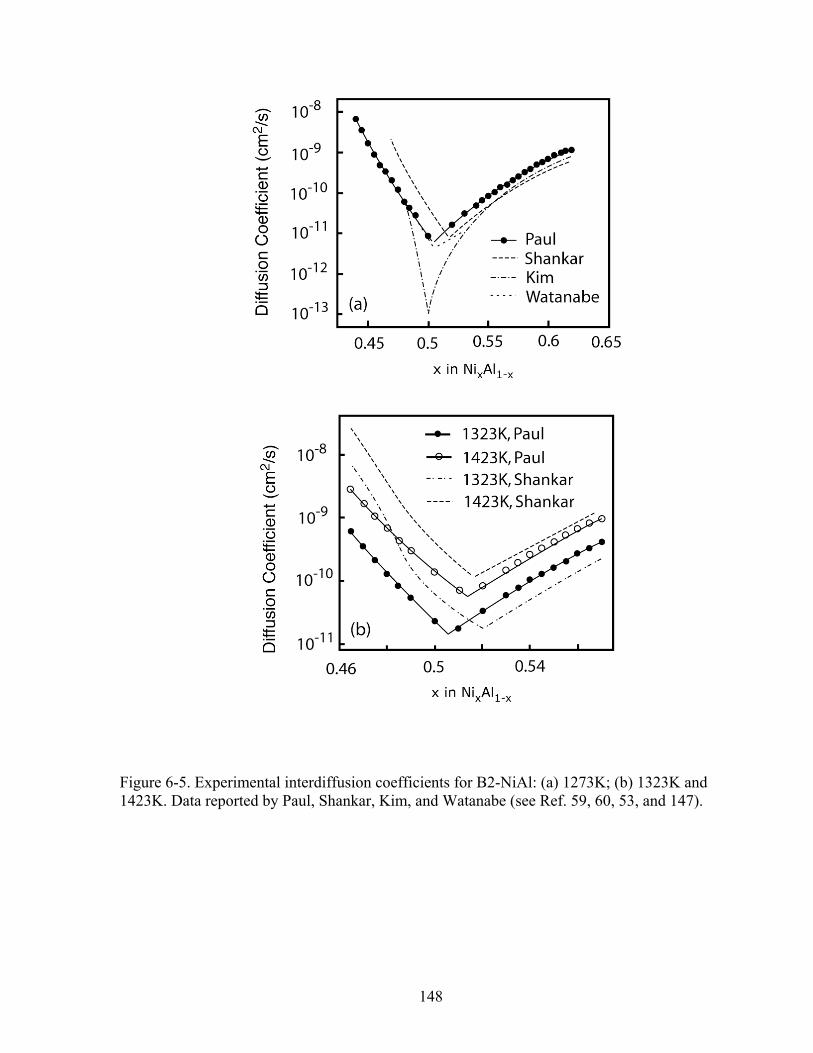
148
Figure 6-5. Experimental interdiffusion coefficients for B2-NiAl: (a) 1273K; (b) 1323K and 1423K. Data reported by Paul, Shankar, Kim, and Watanabe (see Ref. 59, 60, 53, and 147).
149
Chapter 7
Conclusion
In this thesis, we systematically investigated the thermodynamic and kinetic properties in
an interstitial solid, the Ti-H system, and a substitutional solid, the Ni-Al system, from first-
principles.
For the Ti-H system, the phase stability was investigated by accounting for the
configurational degree of freedom, vibrational degrees of freedom and anisotropic states of
stress. We find that:
(1) The tetragonal γ-TiH phase is predicted (within GGA) to be unstable relative to hcp
Ti (α phase) and the fcc based δ-TiH2. Zero point vibrational energy significantly affects the
formation energies in this system and makes the γ phase even less stable relative to hcp Ti and δ-
TiH2. The coherency strains between hydride precipitates and the hcp Ti matrix stabilize γ-TiH
relative to α-Ti and δ-TiH2, explaining why it is observed experimentally. We also find that
hydrogen prefers octahedral sites at low hydrogen concentration and tetrahedral sites at high
concentration. Both harmonic vibrational as well as electronic origins for the cubic to tetragonal
phase transformation of TiH2 were investigated and we argue that anharmonic vibrational
degrees of freedom are likely to play an important role in stabilizing cubic TiH2.
For the Ni-Al system, we investigated the equilibrium defect concentration, interaction
among defects, migration barriers for various diffusion mechanisms. We find that:
150
(2) The B2-NiAl compounds exhibits a variety of complex atomic hop mechanisms and
can accommodate high concentrations of diffusion mediating defects. In this thesis, we
systematically investigated important hop mechanism in B2-NiAl from first principles and
discovered a low barrier collective hop involving a pair of Al atoms that can mediate the anti-
structural bridge mechanism for Al diffusion. We also investigated the defect structure in B2-
NiAl with Monte Carlo simulations, accounting for interactions among defects with a first-
principles parameterized cluster expansion. An energetic attraction between Ni anti-site atoms
and Al anti-site atoms leads to an increase in the Al anti-site concentration for Ni-rich B2-NiAl
compounds, which is opposite to that predicted by mean field treatments. The inclusion of
interactions among defects is also essential to predict the concentration of triple defects. We also
predict a dramatic increase in the number of second and third nearest neighbor pairs occupied by
an Al anti-site and a Ni-vacancy as the B2-NiAl alloy becomes Al rich and Ni rich. These pairs
are essential for the anti-structural bridge mechanism for Al-diffusion.
To reveal the relative importance of various diffusion mechanisms for B2-NiAl, we
performed a comprehensive kinetic Monte Carlo simulation of diffusion in B2-NiAl. Our model
avoids the simple assumptions such as only allowing single atom nearest- and next-nearest-
neighbor hops, non-interaction among defects, dilute vacancy and uniform vacancy
concentration. These assumptions do not hold in B2 NiAl in which the vacancy concentration
can reach 15%. From our simulations we find that:
(3) The Ni-anti-structural-bridge hop is the dominant hop for Ni diffusion in Ni-rich
alloys and the Al-anti-structural-bridge hop is the dominant hop for Al diffusion in Al-rich
alloys. Combined with ASB-Al, the six-jump-cycle is also a major type of hop in Al-rich side
due to the relative high concentration of Ni vacancies in spite of the high migration barrier.
151
Compared to the hops mentioned above, the triple-defect hop mechanism has a relatively
constant effect over the whole composition range contributing to both Ni and Al diffusion.
Furthermore, we have demonstrated the importance of simultaneous multi-atom hops in
mediating atomic transport. These are very important in understanding the diffusion phenomenon
in a compound with such a simple structure – B2 NiAl. It can be reasonably thought that in a real
material system having a much more complicated structure than B2, the simplified textbook
assumptions about diffusion are also likely to break down. In such a system, collective hops
involving many atoms are likely to happen; vacancy concentrations may depend strongly on bulk
composition and might not be dilute. Furthermore, interactions among defects are complicated
and too important to neglect. Our model provides a tool to study diffusion process with much
more realistic assumptions and lays a solid foundation for further investigation.
In analyzing macroscopic metrics of diffusion in B2-NiAl, we find that:
(4) There are two different thermodynamic factors for Ni and Al in Al-rich alloys while
they are almost identical in Ni-rich alloys. In Al-rich alloys the thermodynamic factor of Al is
much larger than that of Ni causing the self-diffusion coefficient and interdiffusion coefficient of
Al to be much larger than those of Ni. On the other hand, in Ni-rich region the interdiffusion
coefficients of Al and Ni are identical and the self-diffusion coefficient of Ni is higher than that
of Al due to the kinetic factors. The definition of interdiffusion coefficient measured from
experiments is different from those in Fick’s first law; these two types of definitions give similar
values of interdiffusion coefficients in compounds with dilute vacancy while very different
values in materials with high vacancy concentration. Our investigation also shows that the
specific characteristic of defects in the B2-NiAl compound, i.e. the high vacancy concentration
and asymmetric distribution of vacancies between Ni sublattice and Al sublattice, is the reason
152
for two different thermodynamic factors in Al-rich region and the resulting self-diffusion and
interdiffusion coefficients in this composition region of B2-NiAl compound.
153
Appendix A
Here we describe a method to determine values for the relative chemical potentials, Niμ~
and Alμ~ , corresponding to an equilibrium vacancy concentration determined by μV=0. The
chemical potentials, μi (i=Ni, Al or vacancies), are related to the Gibbs free energy of the solid at
fixed temperature T according to
μi = g(T, xNi, xAl ) + (δiNi − xNi)∂g
∂xNi
+ (δiAl − xAl )∂g
∂xAl
(A1)
where g(T, xNi, xAl ) is the free energy of a B2 NiAl crystal normalized by the number of crystal
sites, xi=Ni/M is the fraction of crystal sites occupied by component i (Ni, Al or vacancies) and
δij is the Kronecker delta (the free energy per crystal site depends only on xNi and xAl since xNi +
xAl + xV = 1). Using Eq. (A1), it is possible to write the relative chemical potentials ˜ μ i as the
partial derivative of g with respect to xi according to
˜ μ i = μi − μV =∂g∂xi
(A2)
showing that this quantity is a measure of the change in free energy as component i is added at
the expense of a vacancy (keeping the number of crystal sites constant). Combining Eq. (A1) for
the vacancy chemical potential μV and Eq. (A2) for i=Ni and Al, yields
μV = g(T, xNi, xAl ) − xNi ˜ μ Ni − xAl ˜ μ Al (A3)
By setting μV=0, we obtain a constraint between Niμ~ and Alμ~ that defines a path in chemical
potential space corresponding to an equilibrium vacancy concentration. It is along this path in
154
Niμ~ and Alμ~ space for which μV=0 that we must calculate the equilibrium concentrations
xNi ˜ μ Ni, ˜ μ Al( ) and xAl ˜ μ Ni, ˜ μ Al( ) as well as the equilibrium defect concentrations for the B2 NiAl
compound within grand canonical Monte Carlo simulations.
Before we can determine the path in Niμ~ and Alμ~ space satisfying μV=0, we must know
g(T, xNi, xAl ) . This crystal free energy is accessible with free energy integration of grand
canonical Monte Carlo results. To this end, we introduce a grand canonical free energy of a B2-
NiAl crystal with M sites as
Φ T, ˜ μ Ni, ˜ μ Al( )= G T,N Ni,N Al( )− N Ni ˜ μ Ni − N Al ˜ μ Al (A4)
where N Ni and N Al are average concentrations calculated within the grand canonical ensemble
(fixed M, T, Niμ~ and Alμ~ ) and G T,N Ni,N Al( ) is the total free energy of the crystal with M sites
(i.e., G T,N Ni,N Al( )= M ⋅ g(T,xNi,xAl ) ). The differential of Φ can be conveniently written as
d(βΦ) = Ω dβ − βN Nid ˜ μ Ni − βN Ald ˜ μ Al (A5)
where β=1/kBT and Ω is the average grand canonical energy. By numerically integrating Eq.
(A5) along a particular trajectory in β, ˜ μ Ni, ˜ μ Al space, it is possible to relate the grand canonical
free energy at one set of thermodynamic boundary conditions (To, 0
~Niμ ,
0
~Alμ ) to another (T, ˜ μ Ni ,
˜ μ Al ). At various increments along the trajectory, values for Ω , N Ni and N Al of Eq. (A5) can be
calculated with grand canonical Monte Carlo simulations. A convenient reference state to use as
starting point for the integration of Eq. (A5) is one in which the grand canonical free energy can
easily be calculated. For B2-NiAl such a reference state could correspond to the perfectly
ordered alloy at a temperature close to zero Kelvin where Φ can be calculated with a low
temperature expansion [10,133]. The free energy G T,N Ni,N Al( ) can then be calculated using Eq.
155
(A4), which when normalized by M yields g(T, xNi, xAl ) = G(T,NNi,NAl ) / M , to be used in Eq.
(A3) to determine the path in Niμ~ and Alμ~ space for which μV=0.
156
Appendix B
Here we describe an ideal solution model to calculate the free energy of dilute hcp Ti-H
system. Due to the fact that the hcp host is stable only at very dilute hydrogen concentration, we
applied an ideal dilute solution model to the hcp host structures. Energy for adding an isolated H
atom in either a tetrahedral interstitial site or an octahedral interstitial site within hcp Ti host was
calculated in a 36-atoms unit cell. Comparison with the calculations within a 96-atoms cell
indicates that this is well converged with supercell size.
Suppose that our hcp Ti host has M Ti atoms, so this crystal will have Nt = 2M tetrahedral
interstitial sites and No = M octahedral interstitial sites. If we insert n H atoms into interstitial
sites of hcp Ti, with nt H atoms at the tetrahedral interstitial sites and no H atoms at the
octahedral interstitial sites (the dilute concentration of H atoms insures that nt+ no = n << M),
then the formation energy of this resulting dilute solution is
E = E~
+ ntΔEt + noΔEo, (B1)
where E~
is the formation energy of hcp Ti (with reference state of fcc Ti and δ-TiH2). ΔEt, the
energy change due to inserting one H atom into a tetrahedral interstitial site in hcp Ti host, is
defined as
ΔEt =Et - E~
, (B2)
where Et is the formation energy of hcp Ti with one H atom inserted into a tetrahedral interstitial
site; similarly, ΔEo, the energy change due to inserting one H atom into an octahedral interstitial
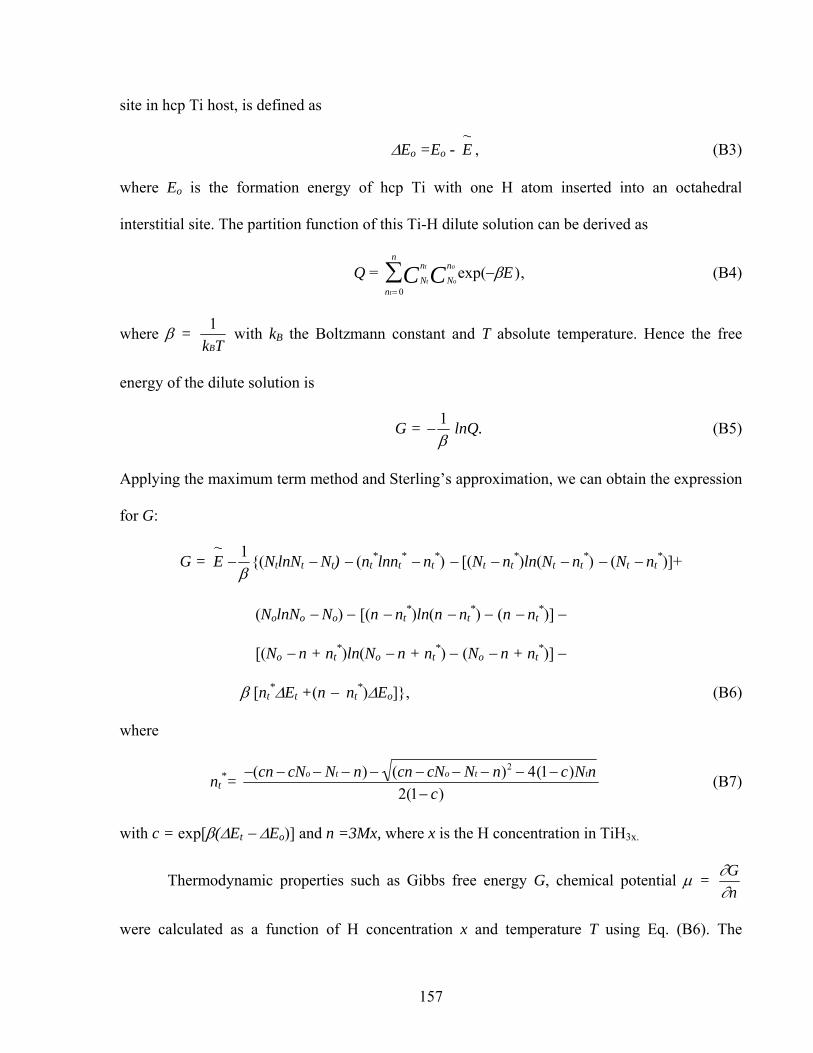
157
site in hcp Ti host, is defined as
ΔEo =Eo - E~
, (B3)
where Eo is the formation energy of hcp Ti with one H atom inserted into an octahedral
interstitial site. The partition function of this Ti-H dilute solution can be derived as
Q = Nt
ntC No
noC exp(−βE)nt= 0
n
∑ , (B4)
where β = 1kBT
with kB the Boltzmann constant and T absolute temperature. Hence the free
energy of the dilute solution is
G = − 1β
lnQ. (B5)
Applying the maximum term method and Sterling’s approximation, we can obtain the expression
for G:
G = E~
−1β
{(NtlnNt − Nt) − (nt*lnnt
* − nt*) − [(Nt − nt
*)ln(Nt − nt*) − (Nt − nt
*)]+
(NolnNo − No) − [(n − nt*)ln(n − nt
*) − (n − nt*)] −
[(No − n + nt*)ln(No − n + nt
*) − (No − n + nt*)] −
β [nt*ΔEt +(n − nt
*)ΔEo]}, (B6)
where
nt*= −(cn − cNo − Nt − n) − (cn − cNo − Nt − n)2 − 4(1− c)Ntn
2(1− c) (B7)
with c = exp[β(ΔEt − ΔEo)] and n =3Mx, where x is the H concentration in TiH3x.
Thermodynamic properties such as Gibbs free energy G, chemical potential μ = ∂G∂n
were calculated as a function of H concentration x and temperature T using Eq. (B6). The

158
calculated free energies were used to compete with those of fcc host structures to construct the
whole phase diagram of TiH3x system.
159
References
1. J. M. Sanchez, F. Ducastelle, D. Gratias, Physica A 128, 334 (1984). 2. D. de Fontaine, in Solid State Physics, edited by H. Ehrenreich (Academic Press, NY,
1994), p. 33. 3. M. H. F. Sluiter, Y. Watanabe, D. de Fontaine, Y. Kazazoe, Phys. Rev. B 53, 6136 (1996). 4. A. Van der Ven, M. K. Aydinol, G. Ceder, G. Kresse, J. Hafner, Phys. Rev. B 58, 2975
(1998). 5. D. Carlier, A. Van der Ven, C. Delmas, G. Ceder, Chem. Mater. 15, 2651 (2003). 6. A. Van de Walle, G. Ceder, J. Phase Eq. 23, 348 (2002). 7. C. Wolverton, V. Ozolins, A. Zunger, Phys. Rev. B 57, 4332 (1998). 8. K. M. Rabe, J. D. Joannopoulos, Phys. Rev. Lett. 59, 570 (1987). 9. W. Zhong, D. Vanderbilt, K. M. Rabe, Phys. Rev. Lett. 73, 1861 (1994). 10. A. Van de Walle, M. Asta, Model. Simul. Mater. Sci. and Eng. 10, 521 (2002). 11. M. E. Arroy, Yi de Dompablo, A. Van der Ven, G. Ceder, Phys. Rev. B 66, 064112 (2002). 12. P. D. Tepesch et al. J. Am. Cer. Soc. 79, 2033 (1996). 13. L. Schlapbach and A. Zuttel, Nature (London) 414, 353 (2001). 14. H. K. Birnbaum, M. L. Grossbeck, and M. Amano, J. Less-Common Met. 49, 357 (1976). 15. D. S. Shih, I. M. Robertson, and H. K. Birnbaum, Acta Metall. 36, 111 (1988). 16. S. Takano and T. Suzuki, Acta Metall. 22, 265 (1974). 17. J. P. Hirth and J. R. Rice, Metall. Trans. A 11, 1501 (1980). 18. R. A. Oriani and P. H. Josephic, Acta Metall. 22, 1065 (1974). 19. A. Van der Ven and G. Ceder, Acta Mater. 52, 1223 (2004). 20. A. Van der Ven and G. Ceder, Phys. Rev. B 67, 060101(R) (2003). 21. C. D. Beachem, Metall. Trans. 3, 437 (1972). 22. H. K. Birnbaum and P. Sofronis, Mater. Sci. Eng., A 176, 191 (1994). 23. G. Lu, Q. Zhang, N. Kioussis, and E. Kaxiras, Phys. Rev. Lett. 87, 095501 (2001). 24. C. Q. Chen, S. X. Li, and K. Lu, Acta Mater. 51, 931 (2003). 25. C. Q. Chen, S. X. Li, H. Zheng, L. B. Wang, and K. Lu, Acta Mater. 52, 3697 (2004). 26. D. F. Teter, I. M. Robertson, and H. K. Birnbaum, Acta Mater. 49, 4313 (2001). 27. G. H. Kim, C. H. Chun, S. G. Lee, and J. Y. Lee, Acta Metall. Mater. 42, 3157 (1994). 28. N. Michel et al., J. Alloys Compd. 330, 280 (2002). 29. H. H. Lee, K. Y. Lee, and J. Y. Lee, J. Alloys Compd. 239, 63 (1996). 30. T. Schober and W. Schafer, J. Less-Common Met. 74, 23 (1980). 31. B. Bogdanovic and M. Schwickardi, J. Alloys Compd. 253, 1 (1997). 32. J. E. Bailey, Acta Metall. 11, 267 (1963). 33. G. J. C. Carpenter, Acta Metall. 26, 1225 (1978). 34. H. L. Yakel, Acta Crystallogr. 11, 46 (1958). 35. H. Numakura and M. Koiwa, Acta Metall. 32, 1799 (1984).
160
36. H. Numakura, M. Koiwa, H. Asano, and F. Izumi, Acta Metall. 36, 2267 (1988). 37. H. Numakura, M. Koiwa, H. Asano, and F. Izumi, Scr. Metall. 20, 213 (1986). 38. J. R. Nicholls, Advances in Coating Design for High Performance Gas Turbines. MRS
Bulletin 659 (2003). 39. V. K. Tolpygo and D. R. Clarke, Acta Mater. 52, 5115 (2004). 40. V. K. Tolpygo and D. R. Clarke, Acta Mater. 52, 5129 (2004). 41. J. Bradley and A. Taylor, Proceedings of the Royal Society of London A159, 56 (1937). 42. P. A. Korzhavyi, A. V. Ruban, A. Y. Lozovoi, Y. Vekilov, I. A. Abrikosov, B. Johansson,
Phys. Rev. B 61, 6003 (1999). 43. Y. Mishin, M. J. Mehl, D. A. Papaconstantopoulos, Phys. Rev. B 65, 224114 (2002). 44. M. P. Gururajan and T. A. Abinandanan, Intermetallics 8, 759 (2000). 45. A. Van der Ven, J. C. Thomas, Q. Xu, B. Swoboda and D. Morgan, Physical Review B 78,
104306 (2008). 46. A. Van der Ven and G. Ceder, Physical Review Letters 94, 045901 (2005). 47. S. Divinski and C. Herzig, Intermetallics 8, 1357 (2000). 48. S. Divinski, Y.S. Kang, W. Loser and C. Herzig, Intermetallics 12, 511 (2004). 49. S. Frank, S. Divinski, U. Sodervall and C. Herzig, Acta Materialia 49, 1399 (2001). 50. G.F. Hancock and B. Mcdonnel, Physical Status Solidi A: Applied Research 4, 143 (1971). 51. Herzig and S. Divinski, Intermetallics 12, 993 (2004). 52. R. Kao and Y.A. Chang, Intermetallics 1, 237 (1993). 53. S. Kim and Y.A. Chang, Metallurgical and Materials Transactions A: Physical Metallurgy
and Materials Science 31, 1519 (2000). 54. Y. Mishin and D. Farkas, Scripta Materialia 39, 625 (1998). 55. Y. Mishin and D. Farkas, Defect and Diffusion Forum 143, 303 (1997). 56. Y. Mishin and D. Farkas, Philosophical Magazine A-Physics of Condensed Matter
Structure Defects and Mechanical Properties 75, 169 (1997). 57. Y. Mishin and D. Farkas, Philosophical Magazine A-Physics of Condensed Matter
Structure Defects and Mechanical Properties 75, 187 (1997). 58. Y. Mishin, A.Y. Lozovoi and A. Alavi, Physical Review B 67, 014201 (2003). 59. A. A. Paul, Kodentsov and F.J.J. van Loo, Journal of Alloys and Compounds 403, 147
(2005). 60. S. Shankar and L.L. Seigle, Metallurgical Transactions A Physical Metallurgy and
Materials Science 9, 1467 (1978). 61. Meyer and M. Fahnle, Physical Review B 59, 6072 (1999). 62. Y. Minamino, Y. Koizumi and Y. Inui, Defect and Diffusion Forum 194–199, 517 (2001). 63. M. Arita, M. Koiwa and S. Ishioka, Acta Metallurgica 37, 1363 (1989). 64. S. Divinski and C. Herzig, Defect and Diffusion Forum 203–205, 177 (2002). 65. S. Divinski, S. Frank, U. Sodervall and C. Herzig, Defect and Diffusion Forum 194–199,
487 (2001). 66. W. Elcock and C.W. McCombie, Physical Review 109, 6 (1958). 67. N.A. Stolwijk, M. Van Gend and H. Bakker, Philosophical Magazine A42, 783 (1980). 68. R. K. Pathria. Statistical Mechanics, second edition. Butterworth Heinemann. (1996). 69. D. A. McQuarrie. Statistical Thermodynamics. University Science Books, (1973). 70. A. Zunger. In P. E. A. Turchi and A. Gonis, editors, Statics and Dynamics of Alloy Phase
Transformations, p. 361. Plenum, New York, (1994). 71. P. Hohenberg and W. Kohn. Phys. Rev., 136, B864 (1964)
161
72. K. Binder and D. W. Heermann. Monte Carlo Simulation in Statistical Physics. Springer Verlag, (1988).
73. N. W. Ashcroft and N. D. Mermin. Solid State Physics. Saunders College Publishing, (1976).
74. O. Madelung. Introduction to Solid State Theory. Springer Verlag, (1978). 75. R. M. Martin, Electronic Structure. Cambridge Unversity Press, (2004). 76. M. Born and J. R. Oppenheimer, Ann. Physik 84, 457 (1927). 77. D. R. Hartree, Proc. Cambridge Phil. Soc. 24, 89 (1928). 78. S. Jenkins, An Introduction to Solid State Many-Body Theory, University of Exeter, (1997). 79. V. Fock, Z. Phys. 61, 126 (1930). 80. W. Kohn and L. J. Sham, Phys. Rev. 140, A1133 (1965). 81. J. P. Perdew and K. Burke, Int. J. Quant. Chem. 57, 309 (1996). 82. F. Herman, J. P. Van Dyke, and I. P. Ortenburger, Phys. Rev. Lett. 22, 807 (1969). 83. P. S. Svendsen and U. von Barth, Phys. Rev. B 54, 17402 (1996). 84. M. C. Payne, M. P. Ter, d. C. Allan, T. A. Arias and J. D. Joannopoulos, Reviews of
Modern Physics, 64,1045 (1992). 85. J. P. Perdew and Y. Wang, Phys. Rev. B 45, 13244 (1992). 86. J. P. Perdew, K. Burke, and M. Ernzerhof, Phys. Rev. Lett. 77, 3865 (1996). 87. D. J. Singh. Planewaves, Pseudopotentials and the LAPW Method. Kluwer Academic
Publishers, (1994). 88. J. C. Phillips and L. Kleinman. Phys. Rev. 116, 287 (1959). 89. P. E. Blochl, Phys. Rev. B 50, 17953 (1994). 90. G. Kresse and J. Furthmuller, Phys. Rev. B 54, 11169 (1996). 91. G. Kresse and J. Furthmuller, Comput. Mater. Sci. 6, 15 (1996). 92. G. Kresse and D. Joubert, Phys. Rev. B 59, 1758 (1999). 93. Q. Xu and A. Van der Ven, Intermetallics, 17, 319 (2009). 94. Q. Xu and A. Van der Ven, Phys. Rev. B 76, 064207 (2007). 95. V. Ozolins, C. Wolverton, and A. Zunger, Phys. Rev. B 57, 6427 (1998). 96. A. Seko, K. Yuge, F. Oba, A. Kuwabara, I. Tanaka, and T. Yamamoto, Phys. Rev. B 73,
094116 (2006). 97. A. Van der Ven and G. Cedar, Phys. Rev. B 71, 054102 (2005). 98. H. R. Tang, A. Van der Ven, and B. L. Trout, Phys. Rev. B 70, 045420 (2004). 99. D. J. Siegel, C. Wolverton, and V. Ozolins, Phys. Rev B 75, 014101 (2007). 100. R. R. Picard and R. D. Cook, J. Am. Stat. Assoc. 79, 575 (1984). 101. J. Shao, J. Am. Stat. Assoc. 88, 486 (1993). 102. G. L. W. Hart, V. Blum, M. J. Walorski, and A. Zunger, Nat. Mater. 4, 391 (2005). 103. F. Lechermann and M. Fahnle, Physical Review B 63, 012104 (2000). 104. D. D. Morgan. Computational Studies of Alloy Phase Stability. PhD dissertation,
University of California, Berkeley, Department of Physics, (1998). 105. V. Ozolins. Structural and Vibrational Properties of Transition Metal Systems from Ab
initio Electronic-Structure Calculations. PhD dissertation, Royal Institute of Technology, Stockholm, Sweden, Department of Physics, (1996).
106. P.D. Tepesch, G.D. Garbulsky and G. Ceder, Physical Review Letters 74, 2272 (1995). 107. C. Han, A. Van der Ven, G. Ceder and B.J. Hwang, Physical Review B 72, 205409 (2005). 108. S. Ross, Introduction to Probability Models, 7th ed., Academic Press (2000).
162
109. F. M. Bulnes, V. D. Pereyra, and J. L. Riccardo, Collective surface diffusion: n-fold way kinetic Monte Carlo simulation, Phys. Rev. E 58, 86 (1998).
110. G. H. Vineyard, Frequency factors and isotope effects in solid-state rate processes, J. Phys. Chem. Solids 3, 121 (1957).
111. R. Gomer, Diffusion of adsorbates on metal surfaces, Reports on Progress in Physics 53, 917 (1990).
112. G. Ceder, Comput. Mater. Sci. 1, 144 (1993). 113. A, Van de Walle and G, Ceder, Rev. Mod. Phys. 74, 11 (2002). 114. S. Baroni, S. de Gironcoli, A. Dal Corso, and P. Giannozzi, Rev. Mod. Phys. 73, 515
(2001). 115. S. Wei and M. Y. Chou, Phys. Rev. Lett. 69, 2799 (1992). 116. H. J. Monkhorst and J. D. Pack, Phys. Rev. B 13, 5188 (1976). 117. M. Methfessel and A. T. Paxton, Phys. Rev. B 40, 3616 (1989). 118. C. Kittel, Introduction to Solid State Physics, 6th ed. (Wiley, New York, 1986). 119. G. J. Ackland, Phys. Rev. Lett. 80, 2233 (1998). 120. W. Wolf and P. Herzig, J. Phys.: Condens. Matter 12, 4535 (2000). 121. A. Van de Walle, M. Asta, and G. Ceder, CALPHAD: Comput. Coupling Phase Diagrams
Thermochem. 26, 539 (2002). 122. K. M. Rabe and U. V. Waghmare, Phys. Rev. B 52, 13236 (1995). 123. U. V. Waghmare and K. M. Rabe, Phys. Rev. B 55, 6161 (1997). 124. W. Zhong, D. Vanderbilt, and K. M. Rabe, Phys. Rev. B 52, 6301 (1995). 125. F. Ducastelle, R. Candron, and P. Costa, J. Phys. (paris) 31, 57 (1970). 126. M. Gupta, Solid State Commun. 29, 47 (1979). 127. R. C. Bowman, E. L. Venturini, B. D. Craft, A. Attalla, and D. B. Sullenger, Phys. Rev. B
27, 1474 (1983). 128. M. Gupta, Phys. Rev. B 25, 1027 (1982). 129. K. A. Marino and E. A. Carter, Phys. Rev. B 78, 184105 (2008). 130. M. Ellner, S. Kek and B. Predel, Journal of the Less Common Metals 154, 207 (1989). 131. P. Nash, M.F. Singleton and J.L. Murray, Phase diagrams of binary nickel alloys, ASM
International, Materials Park, OH (1991). 132. A. Lutze-Birk and H. Jacobi, Scripta Meterialia 9, 761 (1975). 133. F. Kohan, P.D. Tepesch, G. Ceder and C. Wolverton, Computational Materials Science 9,
389 (1998). 134. M. Kogachi, T. Tanahashi, Y. Shirai, and M. Yamaguchi, Determination of vacancy
concentration and defect structure in the B2 type NiAl β-phase alloys, Scripta Materialia 34, 243 (1996).
135. A. Van der Ven, H. Yu, K. Thornton and G. Ceder, Progress in Materials Science. In press. 136. Z. Qin and G. E. Murch, Philosophical Magazine A 71, 323 (1995). 137. L. Bencze, D. D. Raj, D. Kath, W. A. Oates, L. Singheiser and K. Hilpert, Metallurgical
and Materials Transactions B 35B, 867 (2004). 138. R. E. Howard, A. B. Lidiard, Rep. Prog. Phys. 27, 161(1964). 139. K. W. Kehr, K. Binder, S. M. Reulein, Phys. Rev. B 39, 4891 (1989). 140. A. R. Allnatt, A. B. Lidiard, Atomic Transport in Solids (Cambridge University Press,
Cambridge, 1993). 141. A. R. Allnatt, J. Chem. Phys. 43, 1855 (1965). 142. T. L. Hill, Statistical Mechanics, (Dover Publications, New York, 1987).
163
143. R. Haase, Thermodynamics of Irreversible Processes (Addison Wesley, Reading, MA, 1969).
144. J. S. Kirkaldy and D. J. Young, Diffusion in the Condensed State (Institute of Metals, London, 1987).
145. R. W. Balluffi, S. M. Allen, W. C. Carter, Kinetics of Materials, (Hoboken, N. J.:Wiley-Interscience, 2005).
146. M. E. Glicksman, Diffusion in Solids (Wiley-Interscience, 2000). 147. M. Watanabe, Z. Horita, M. Nemoto, Defect Diffus. Forum 143-147, 345 (1997). 148. A. Van der Ven, G. Ceder, M. Asta, and P. D. Tepesch, Physical Review B 64,
184307(2001). 149. I. V. Belova, G. E. Murch, Intermetallics 6, 115-119 (1998). 150. J. R. Nicholls, MRS bulletin 28, 659 (2003). 151. F. Sauer, V. Freise, Z. Electrochem 66, 353 (1962). 152. C. Wagner, Acta Met. 17, 99 (1969). 153. J. Simons, An Introduction to Theoretical Chemistry (Cambridge University Press, 2003).