Embed Size (px)
Citation preview

May 6, 2011
First Quarter 2011 Results and 2011 Guidance
Safe Harbor Statement Under the Private Securities Litigation Reform Act of 1995:
2
All information set forth in this presentation, except historical and factual information, represents forward-looking statements. This includes all statements about the company’s plans, beliefs, estimates and expectations. These statements are based on current estimates, projections and assumptions, which involve certain risks and uncertainties that could cause actual results to differ materially from those in the forward-looking statements. Important factors that may affect these forward-looking statements include, but are not limited to: the ability of U.S. Cellular to successfully grow its markets; the overall economy; competition; the access to and pricing of unbundled network elements; the state and federal telecommunications regulatory environment; the value of assets and investments; adverse changes in the ratings afforded TDS and U.S. Cellular debt securities by accredited ratings organizations; industry consolidation; advances in telecommunications technology; uncertainty of access to the capital markets; risks and uncertainties relating to possible future restatements; pending and future litigation; changes in income tax rates, laws, regulations or rulings; acquisitions/divestitures of properties and/or licenses; and changes in customer growth rates, average monthly revenue per unit, churn rates, roaming revenue and terms, the availability of handset devices, or the mix of products and services offered by U.S. Cellular and TDS Telecom. Investors are encouraged to consider these and other risks and uncertainties that are discussed in documents furnished to the SEC.

Upcoming Conferences
3
• 5/16/11 – J.P. Morgan Global Technology, Technology, Media and Telecom (Boston)
• 5/24/11 – Barclays Capital 2011 Global Communications, Media and Technology (New York)
• 6/8/11 – Raymond James Spring Investor Conference (Boston)

First Quarter 2011
4
• Ongoing efforts to reduce interest expense• Issued $300 M of 49‐year debt at 7%• Redeemed $282.5 M of 7.6% debt on May 2, 2011
• Stock repurchases• TDS Special common – 407,281 shares for $11.6 M• U.S. Cellular common – 357,021 shares for $17.4 M
• Bonus depreciation• Industry developments
Regulatory Developments
5
• Data Roaming Order• Spectrum availability• Universal Service Fund / Intercarrier Compensation


Q1 2011 Highlights
• Smartphone growth driving ARPU growth• Belief Plan customers of more than 1.8 million• Postpaid churn keeps improving
7

Attracting New Customers
• New advertising campaign• Added smartphones and wireless modems to prepaid offering• Launching 8 new smartphones over next 2 quarters• Appointed Chief Strategy and Brand Officer and hired EVP Sales
and Customer Service and VP Marketing
8
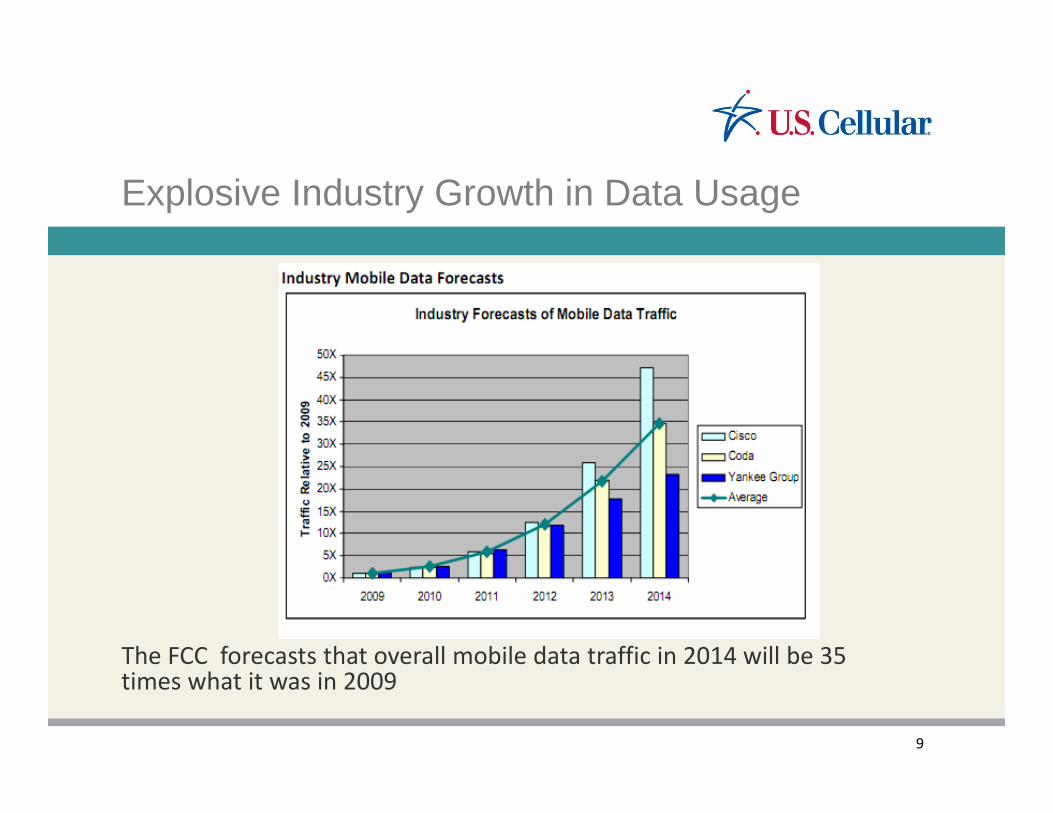
Explosive Industry Growth in Data Usage
The FCC forecasts that overall mobile data traffic in 2014 will be 35 times what it was in 2009
9
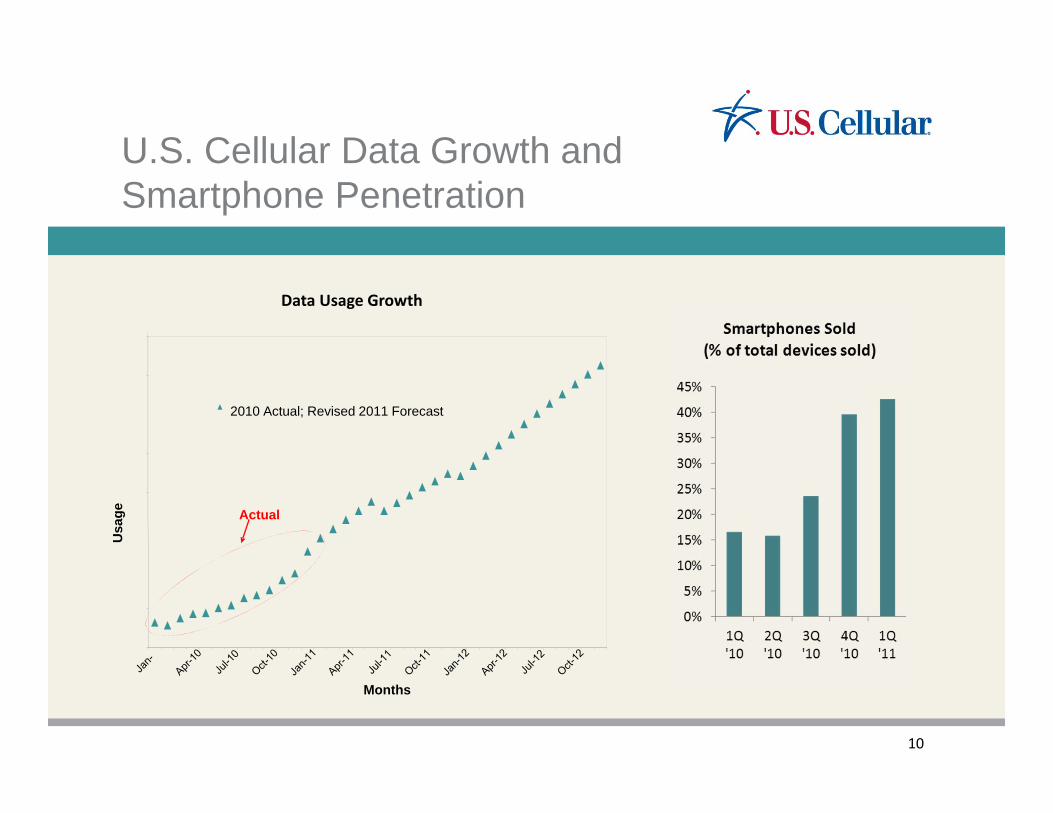
U.S. Cellular Data Growth and Smartphone Penetration
10
Months
Usa
ge
2010 Actual; Revised 2011 Forecast
Actual
Data Usage Growth

Managing the Data User Experience
• Add EvDO capacity • Move forward with LTE deployment
• Competitive “table stakes”• Cost savings from sooner LTE data off‐load (vs. adding EvDO
capacity) are significant• LTE capital expenditures in 2011 viewed as a “pull‐forward”
from future years
11

LTE Deployment Plan for 2011
• First roll out planned for 24 markets by November 2011• Covers 25‐30% of total subs
• Approximately 1,250 cell sites• All using 700 MHz spectrum • Target a full suite of devices at roll‐out
12
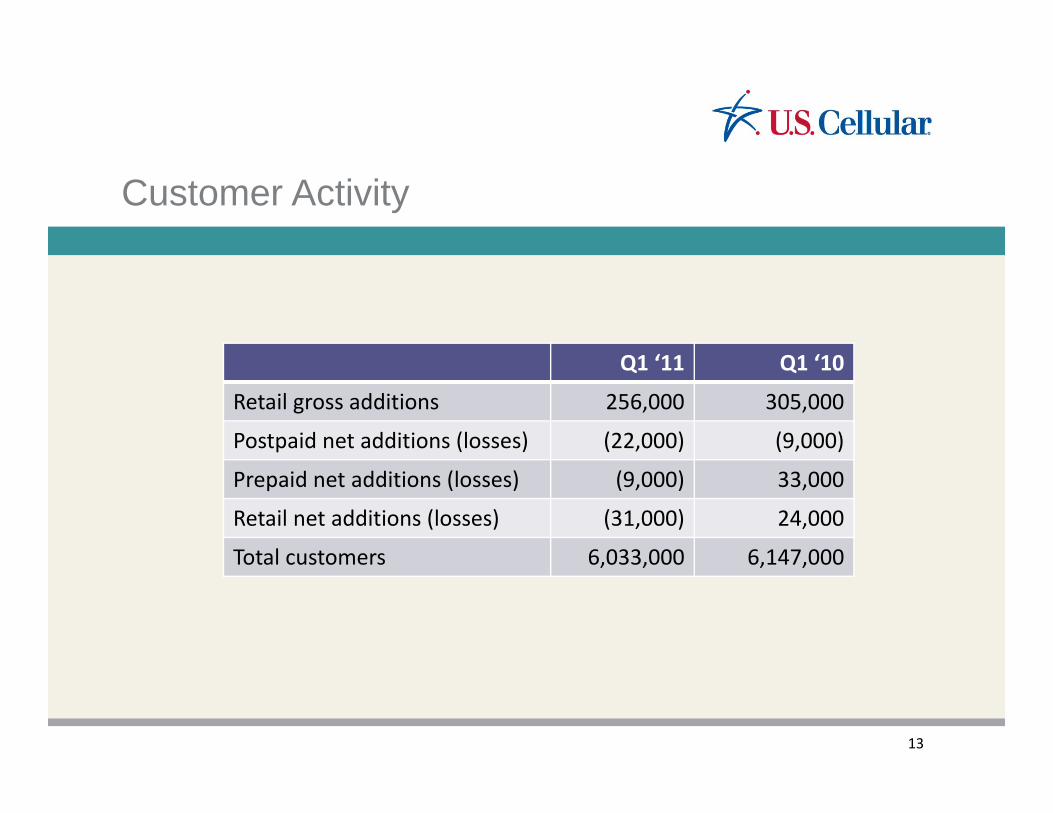
Customer Activity
13
Q1 ‘11 Q1 ‘10
Retail gross additions 256,000 305,000
Postpaid net additions (losses) (22,000) (9,000)
Prepaid net additions (losses) (9,000) 33,000
Retail net additions (losses) (31,000) 24,000
Total customers 6,033,000 6,147,000

Postpaid Churn Rate
14
0.0%0.2%0.4%0.6%0.8%1.0%1.2%1.4%1.6%1.8%
Q1 Q2 Q3 Q42009 2010 2011

Growing Smartphone Penetration
15

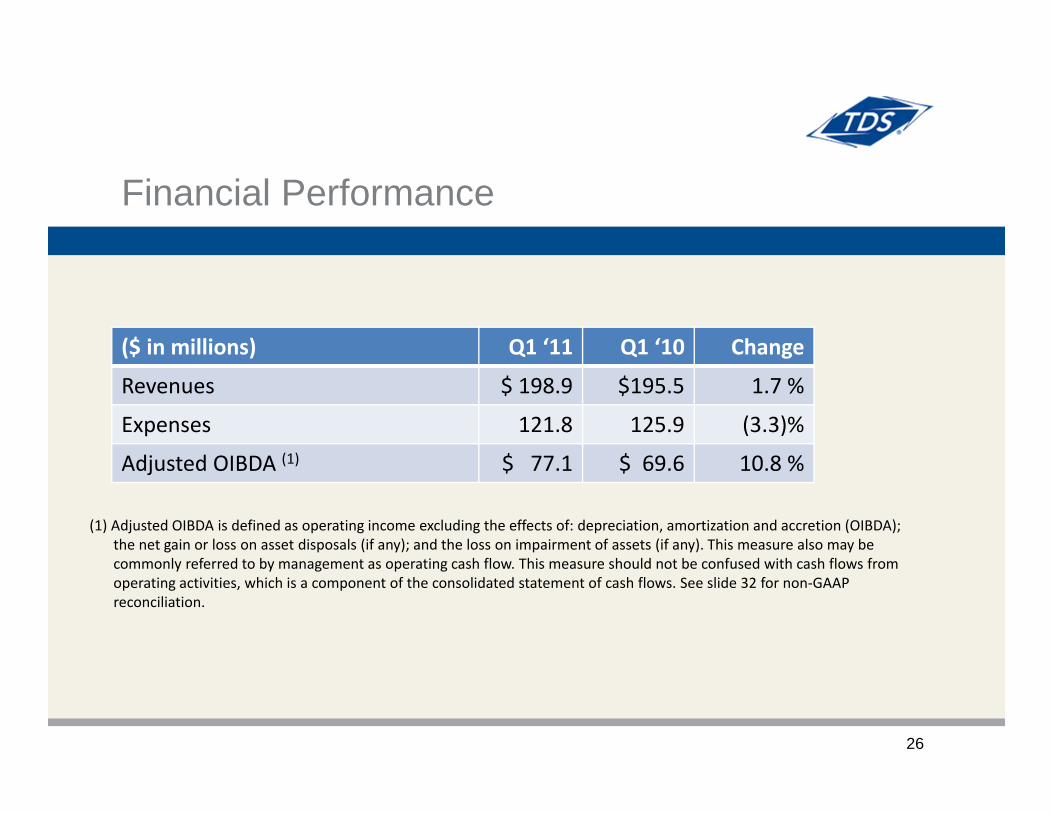
Financial Performance
16
($ in millions) Q1 ‘11 Q1 ‘10
Service revenues $ 985.1 $ 965.0
Roaming 64.4 51.9
ETC 41.8 34.8
System operations expense 217.6 207.1
Loss on equipment 122.4 102.3
SG&A expenses 442.0 429.6
Adjusted OIBDA (1) $ 203.1 $ 226.0
(1) Adjusted OIBDA is defined as operating income excluding the effects of: depreciation, amortization and accretion (OIBDA); the net gain or loss on asset disposals (if any); and the loss on impairment of assets (if any). This measure also may be commonly referred to by management as operating cash flow. This measure should not be confused with cash flows from operating activities, which is a component of the consolidated statement of cash flows. See slide 32 for non‐GAAP reconciliation.

Postpaid Average Monthly Revenue Per Customer
17

Financial Performance - continued
18
($ in millions, except per share amounts Q1 ‘11 Q1 ‘10
Total investment and other income (expense) $ 6.4 $ 9.1
Net income attributable to U.S. Cellular shareholders 34.1 47.4
Diluted earnings per share attributable to U.S. Cellular shareholders
0.40 0.54
Cash flow from operating activities 201.8 152.3
Capital expenditures 95.9 121.5
Free cash flow* $ 105.9 $ 30.8
* Free cash flow is defined as cash flows from operating activities minus capital expenditures. Free cash flow is a non‐GAAP financial measure. TDS believes that free cash flow as reported by TDS is useful to investors and other users of its financial information in evaluating the amount of cash generated by business operations, after consideration of capital expenditures. See slide 33 for reconciliation.

2011 Guidance – as of 5/6/11
19
Service revenues $4,000 ‐ $4,100 million
Adjusted OIBDA (1)(3) $775 ‐ $875 million
Operating income (2)(3) $185 ‐ $285 million
Depreciation, amortization and accretion expenses, and losses on asset disposals and impairment of assets (2) Approx. $590 million
Capital expenditures (3) $750 ‐ $800 million
(1) Adjusted OIBDA is defined as operating income excluding the effects of: depreciation, amortization and accretion (OIBDA); the net gain or loss on asset disposals (if any); and the loss on impairment of assets (if any). This measure also may be commonly referred to by management as operating cash flow. This measure should not be confused with cash flows from operating activities, which is a component of the consolidated statement of cash flows.
(2) The 2011 estimated results do not include any estimate for losses on impairment of assets since these cannot be predicted.(3) This guidance is based on U.S. Cellular’s current plans, which include a multi‐year deployment of Long‐term Evolution (“LTE”) technology
commencing in 2011. As customer demand for data services increases, and competitive conditions in the wireless industry evolve, such as the rate of deployment of LTE technology by other carriers, the timing of U.S. Cellular’s deployment of LTE and the timing of other capital expenditures could change. These factors could affect U.S. Cellular’s estimated capital expenditures and operating expenses in 2011.


TDS Telecom Revenues
21
($ in millions) Q1 ‘11 Q1 ‘10 Change
ILEC $ 155.8 $ 150.2 3.8 %
CLEC 45.3 47.7 (5.1) %
Total * $ 198.9 $ 195.5 1.7 %
* Reflects intercompany eliminations

ILEC Data Growth
Revenues Penetration
22
Millions
$

Customer Activity: Voice
23

Penetration of Bundled Plans
24

managedIP Growth
25
Financial Performance
26
($ in millions) Q1 ‘11 Q1 ‘10 Change
Revenues $ 198.9 $195.5 1.7 %
Expenses 121.8 125.9 (3.3)%
Adjusted OIBDA (1) $ 77.1 $ 69.6 10.8 %
(1) Adjusted OIBDA is defined as operating income excluding the effects of: depreciation, amortization and accretion (OIBDA); the net gain or loss on asset disposals (if any); and the loss on impairment of assets (if any). This measure also may be commonly referred to by management as operating cash flow. This measure should not be confused with cash flows from operating activities, which is a component of the consolidated statement of cash flows. See slide 32 for non‐GAAPreconciliation.

2011 Guidance (ILEC/CLEC) – 5/6/11
27
Operating revenues $780 ‐ $810 million
Adjusted OIBDA (1) $260 ‐ $290 million
Depreciation, amortization and accretion expenses, and losses on asset disposals and impairment of assets (2)
Approx. $185 million
Operating income (2) $75 ‐ $105 million
Capital expenditures (3) $175 ‐ $200 million
(1) Adjusted OIBDA is defined as operating income excluding the effects of: depreciation, amortization and accretion (OIBDA); the net gain or loss on asset disposals (if any); and the loss on impairment of assets (if any). This measure also may be commonly referred to by management as operating cash flow. This measure should not be confused with cash flows from operating activities, which is a component of the consolidated statement of cash flows.
(2) The 2011 Estimated Results do not include any estimate for losses on impairment of assets since these cannot be predicted.(3) The capital expenditure guidance does not include federal grants of $105.1 million awarded to TDS Telecom through the Broadband
Stimulus program under the American Recovery and Reinvestment Act for 44 projects to be completed between 2011 to 2013.

TDS Telecom Network Strategy
28
• Network transformation to a highly‐reliable, next generation IP‐based network to enable:
• Flexibility in product offerings• Ability to economically grow capacity
Meet our customers growing customer bandwidth requirements

Transformation of the Data Network
29
• Core 10 Gig network• Completed at the inter‐
regional level• Eight regional hubs • Carrier hotels in Chicago and
New York• Expected to reach 80% of
access lines by year‐end• Services enabled for select markets
• managedIP• Least Cost Routing• IPTV

Transformation of the Middle Mile Access Infrastructure
30
• Conversion into 10G Ethernet‐based transport to enable:• IPTV deployments• Commercial Ethernet‐transport products and on‐net
customer builds• Bandwidth growth in DSL services• Cost reductions in provisioning IP‐based services

Transformation of the Last Mile Infrastructure
31
• Copper, Fiber and Technology• Super high speed data• IPTV• Broadband Stimulus

OIBDA Reconciliation
32
Three Months Ended March 31, 2011 U.S. Cellular TDS Telecom (1) All Other (2) Consolidated
Total Operating revenues $ 1,057,092 $ 198,916 $ 2,673 $ 1,258,681 Deduct: U.S. Cellular equipment sales revenue 71,979 Service revenues 985,113
Operating income (loss) 57,043 32,206 (2,081) 87,168 Add (Deduct): Depreciation, amortization and accretion 145,045 44,837 2,636 192,518 Loss on impairment of intangible assets — — — — (Gain) Loss on asset disposals 1,037 104 2 1,143
Adjusted OIBDA (3) $ 203,125 $ 77,147 $ 557 $ 280,829
Three Months Ended March 31, 2010 U.S. Cellular TDS Telecom (1) All Other (2) Consolidated
Total Operating revenues $ 1,023,857 $ 195,505 $ 3,073 $ 1,222,435 Deduct: U.S. Cellular equipment sales revenue 58,849 Service revenues 965,008 Operating income 77,624 25,872 (1,500) 101,996 Add: Depreciation, amortization and accretion 143,233 43,423 2,733 189,389 Loss on impairment of intangible assets — — — — Loss on asset disposals 5,176 345 (90) 5,431
Adjusted OIBDA (3) $ 226,033 $ 69,640 $ 1,143 $ 296,816
(1) Includes ILEC and CLEC intercompany eliminations. (2) Consists of a non-reportable segment (Suttle-Straus), corporate operations and, intercompany eliminations between U.S. Cellular, TDS Telecom and corporate
investments. Amounts in this column are presented only to reconcile to consolidated totals and may not otherwise be meaningful. (3) Adjusted OIBDA is a segment measure reported to the chief operating decision maker for purposes of making decisions about allocating resources to the segments and
assessing their performance. Adjusted OIBDA is defined as operating income excluding the effects of: depreciation, amortization and accretion (OIBDA); the net gain or loss on asset disposals (if any); and the loss on impairment of assets (if any). This measure also may be commonly referred to by management as operating cash flow. This measure should not be confused with Cash flows from operating activities, which is a component of the Consolidated Statement of Cash flows. Adjusted OIBDA excludes the net gain or loss on asset disposals and loss on impairment of assets, if any, in order to show operating results on a more comparable basis from period to period. TDS does not intend to imply that any of such amounts that are excluded are non-recurring, infrequent or unusual, and accordingly, they may be incurred in the future.

U.S. Cellular Free Cash Flow Reconciliation
33
Free cash flow is defined as cash flows from operating activities minus capital expenditures. Free cash flow is a non‐GAAP financial measure. U.S. Cellular believes that free cash flow as reported by U.S. Cellular is useful to investors and other users of its financial information in evaluating the amount of cash generated by business operations, after consideration of capital expenditures.
2011 2010 Cash flows from operating activities $ 201,822 $ 152,252 Deduct: Capital expenditures 95,933 121,514 Free cash flow $ 105,889 $ 30,738

May 6, 2011
First Quarter 2011 Results and 2011 Guidance