Embed Size (px)
Citation preview
FIRST QUARTER 2017 RESULTS
Integrated Management Discussion & Analysis,And Financials
For the three months ended March 31, 2017 and 2016
(Expressed in Thousands of United States Dollars)
SECTION 1: MANAGEMENT DISCUSSION & ANALYSIS
For the three months ended March 31, 2017 and 2016 Expressed in Thousands of United States Dollars
TABLE OF CONTENTS
1. BUSINESS OVERVIEW .................................................................................................................. 1
1.1. OPERATIONS DESCRIPTION ...................................................................................................... 1
1.2. STRATEGY SUMMARY ............................................................................................................... 2
2. HIGHLIGHTS FOR THE THREE MONTHS ENDED MARCH 31, 2017 .............................................. 3
2.1. RECENT CORPORATE DEVELOPMENTS ..................................................................................... 3
2.2. HIGHLIGHTS FOR THE THREE MONTHS ENDED MARCH 31, 2017. ........................................... 3
3. GUIDANCE ................................................................................................................................... 6
3.1. 2017 OUTLOOK: FURTHER PRODUCTION GROWTH AND AISC REDUCTION............................. 6
4. OPERATIONS REVIEW .................................................................................................................. 9
4.1. HEATH, SAFETY, ENVIRONMENT AND CORPORATE RESPONSIBILITY ....................................... 9
4.2. CONSOLIDATED RESERVES AND RESOURCES ........................................................................... 9
4.3. CONTINUING OPERATIONS .................................................................................................... 11
4.4. DEVELOPMENT PROJECTS REVIEW ........................................................................................ 21
5. RESULTS FOR THE PERIOD ......................................................................................................... 22
5.1. STATEMENT OF COMPREHENSIVE INCOME ........................................................................... 22
5.2. CASH FLOW ............................................................................................................................ 24
5.3. BALANCE SHEET...................................................................................................................... 26
5.4. ACCOUNTING POLICIES .......................................................................................................... 28
6. NON-GAAP MEASURES ............................................................................................................. 29
6.1. ALL-IN SUSTAINING MARGIN AND OEBITDA .......................................................................... 29
6.2. CASH AND ALL-IN SUSTAINING COST PER OUNCE OF GOLD SOLD ......................................... 30
6.3. ADJUSTED NET EARNINGS AND ADJUSTED NET EARNINGS PER SHARE ................................. 32
6.4. FREE CASH FLOW.................................................................................................................... 32
6.5. NET DEBT AND NET DEBT/OEBITDA RATIO ............................................................................ 32
7. QUARTERLY AND ANNUAL FINANCIAL AND OPERATING RESULTS .......................................... 33
8. RISK FACTORS ............................................................................................................................ 35
8.1. OPERATIONAL RISKS ............................................................................................................... 35
8.2. FINANCIAL RISKS ..................................................................................................................... 36
9. CONTROLS AND PROCEDURES .................................................................................................. 37
9.1. DISCLOSURE CONTROLS AND PROCEDURES .......................................................................... 37
9.2. INTERNAL CONTROLS OVER FINANCIAL REPORTING .............................................................. 38
9.3. LIMITATIONS OF CONTROLS AND PROCEDURES .................................................................... 38
10. APPENDIX A : DETAILED RESERVES AND RESOURCES ......................................................... 39
1
This Management’s Discussion and Analysis (“MD&A”) should be read in conjunction with Endeavour Mining Corporation’s (“Endeavour Mining” or the “Corporation”) condensed interim consolidated financial statements for the three months ended March 31, 2017, as well as the audited consolidated financial statements for the years ended December 31, 2016 and 2015, and notes thereto which have been prepared in accordance with International Financial Reporting Standards (“IFRS”) or (“GAAP”). This Management’s Discussion and Analysis contains “forward-looking statements” that are subject to risk factors set out in a cautionary note contained herein. The reader is cautioned not to place undue reliance on forward-looking statements. All figures are in United States Dollars, unless otherwise indicated. Tabular amounts are in thousands of United States Dollars, except per share amounts and where otherwise indicated. This Management’s Discussion and Analysis is prepared as of May 9, 2017. Additional information relating to the Corporation, including the Corporation’s Annual Information Form, is available on SEDAR at www.sedar.com.
1. BUSINESS OVERVIEW
1.1. OPERATIONS DESCRIPTION
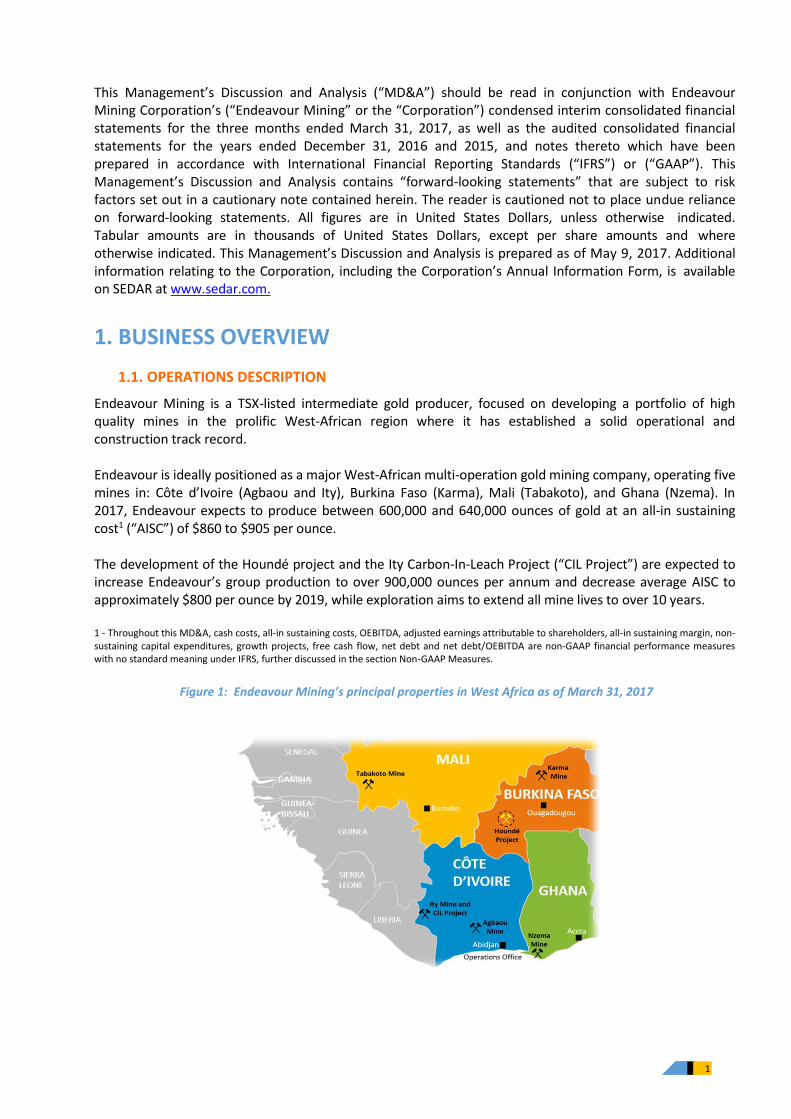
Endeavour Mining is a TSX-listed intermediate gold producer, focused on developing a portfolio of high quality mines in the prolific West-African region where it has established a solid operational and construction track record. Endeavour is ideally positioned as a major West-African multi-operation gold mining company, operating five mines in: Côte d’Ivoire (Agbaou and Ity), Burkina Faso (Karma), Mali (Tabakoto), and Ghana (Nzema). In 2017, Endeavour expects to produce between 600,000 and 640,000 ounces of gold at an all-in sustaining cost1 (“AISC”) of $860 to $905 per ounce. The development of the Houndé project and the Ity Carbon-In-Leach Project (“CIL Project”) are expected to increase Endeavour’s group production to over 900,000 ounces per annum and decrease average AISC to approximately $800 per ounce by 2019, while exploration aims to extend all mine lives to over 10 years. 1 - Throughout this MD&A, cash costs, all-in sustaining costs, OEBITDA, adjusted earnings attributable to shareholders, all-in sustaining margin, non-sustaining capital expenditures, growth projects, free cash flow, net debt and net debt/OEBITDA are non-GAAP financial performance measures with no standard meaning under IFRS, further discussed in the section Non-GAAP Measures.
Figure 1: Endeavour Mining’s principal properties in West Africa as of March 31, 2017
2
1.2. STRATEGY SUMMARY
Endeavour’s strategy is focused on increasing the quality of its portfolio to create a leading African gold producer with low AISC and long-life mines. This will be achieved through:
› An unrelenting focus on operational excellence;
› Developing projects on-time and on-budget;
› Unlocking value through exploration, and;
› Maintaining a healthy balance sheet and actively managing the portfolio.
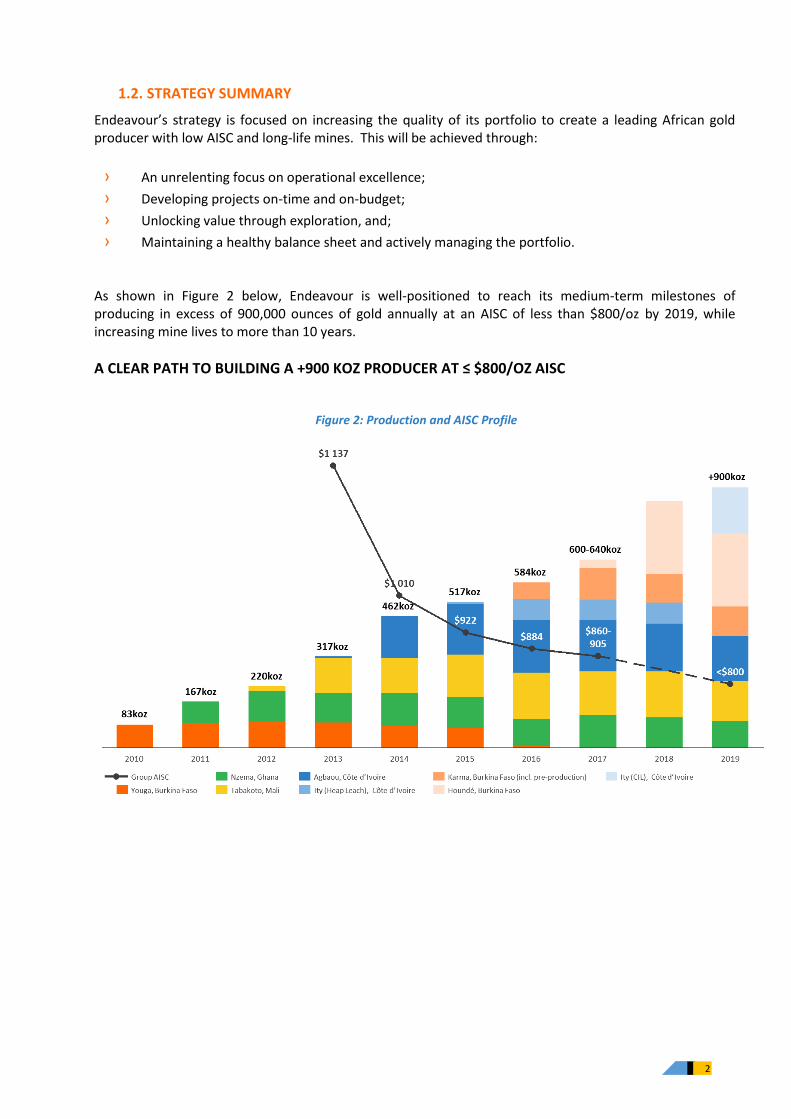
As shown in Figure 2 below, Endeavour is well-positioned to reach its medium-term milestones of producing in excess of 900,000 ounces of gold annually at an AISC of less than $800/oz by 2019, while increasing mine lives to more than 10 years.
A CLEAR PATH TO BUILDING A +900 KOZ PRODUCER AT ≤ $800/OZ AISC
Figure 2: Production and AISC Profile
3
2. HIGHLIGHTS FOR THE THREE MONTHS ENDED MARCH 31, 2017
2.1. RECENT CORPORATE DEVELOPMENTS
› On January 13, 2017, Endeavour responded to media speculation regarding a potential corporate transaction between Endeavour and Acacia Mining plc. Endeavour reiterated that it routinely evaluates business development opportunities, but remains focused on the organic prospects in its existing asset portfolio.
› On February 23, 2017, Endeavour announced the extension of Karma life of mine to +10 years. The infill drill program at the North Kao deposit has confirmed the continuity of the previous inferred resource, resulting in a maiden indicated resource of 314,000oz amenable to heap leaching and a subsequent conversion of 262,000oz to reserves. Following the success at North Kao, the exploration campaign will focus on other near-mill targets, such as Rambo West and Yabonsgo.
› On March 21, 2017, Endeavour announced it had terminated discussions with Acacia Mining plc regarding a potential corporate transaction. Endeavour was unable to reach an agreement that would create adequate value for the shareholders of the Corporation, as management remains focused on creating long-term value by advancing strong organic growth opportunities within our portfolio.
› On March 22, 2017, Endeavour announced it had received an in-principle agreement from the government of Côte d’Ivoire to increase its ownership in the Ity mine to 80%. The in-principle agreement was approved for SODEMI to sell a 25% shareholding in the Ity mine to Endeavour. Following the transaction, the Ity mine would be 80% owned by Endeavour, 10% by the Drogba group and 10% by the government of Côte d’Ivoire.
2.2. HIGHLIGHTS FOR THE THREE MONTHS ENDED MARCH 31, 2017.
› Quarterly gold production of 158,640 ounces was in line with expectations after a record quarterly production of 175,411 achieved in the fourth quarter of 2016.
› Revenues of $193.1 million produced at an average realised gold price of $1,190 (inclusive of Karma stream) per ounce generated $27.1 million in earnings from mine operations.
› All-in sustaining costs totaled $905 per gold ounce sold, on track to meet the FY-2017 guidance of $860-905/oz as all-in sustaining costs are expected to trend lower throughout the year with increased production from Agbaou, better grades at Ity, and lower sustaining exploration spend per ounce.
› Free cash flow (before working capital, tax, and growth projects) for the three months ending March 31, 2017 was $32.1 million, continuing the trend from the fourth quarter of 2016 of healthy internal cash flow generation. Endeavour continues to be well positioned to finance growth projects in 2017 and beyond with $297 million available sources of financing and liquidity ($87 million in of cash and $210 million of undrawn revolving credit facility (“RCF”).
› Basic loss per share of $0.08 was incurred in the first quarter, a $0.10 per share decrease over the comparative period of 2016. Adjusted net earnings attributable to shareholders was $0.10, which is equivalent to the comparative period in 2016.
› Net debt increased to $61.9 million from $25.7 million in the previous quarter. The increase in net debt is due to the spend on growth projects.
4
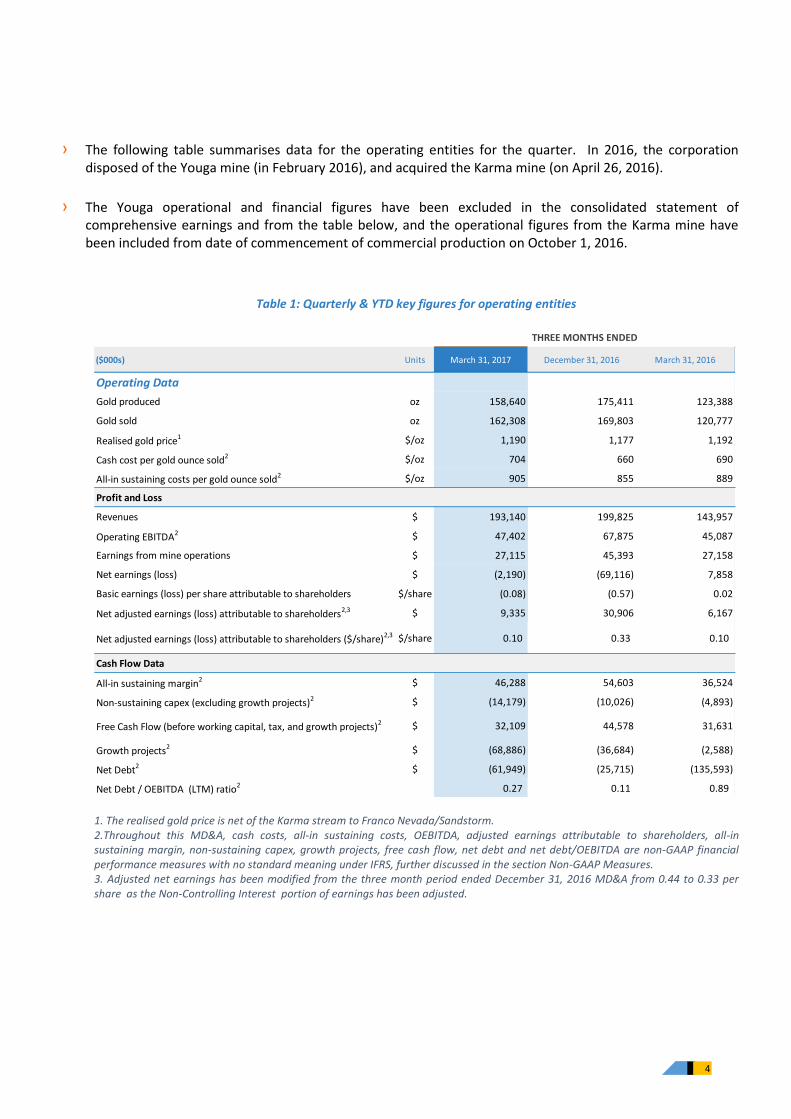
› The following table summarises data for the operating entities for the quarter. In 2016, the corporation disposed of the Youga mine (in February 2016), and acquired the Karma mine (on April 26, 2016).
› The Youga operational and financial figures have been excluded in the consolidated statement of comprehensive earnings and from the table below, and the operational figures from the Karma mine have been included from date of commencement of commercial production on October 1, 2016.
Table 1: Quarterly & YTD key figures for operating entities
1. The realised gold price is net of the Karma stream to Franco Nevada/Sandstorm. 2.Throughout this MD&A, cash costs, all-in sustaining costs, OEBITDA, adjusted earnings attributable to shareholders, all-in sustaining margin, non-sustaining capex, growth projects, free cash flow, net debt and net debt/OEBITDA are non-GAAP financial performance measures with no standard meaning under IFRS, further discussed in the section Non-GAAP Measures. 3. Adjusted net earnings has been modified from the three month period ended December 31, 2016 MD&A from 0.44 to 0.33 per share as the Non-Controlling Interest portion of earnings has been adjusted.
($000s) Units March 31, 2017 December 31, 2016 March 31, 2016
Operating Data
Gold produced oz 158,640 175,411 123,388
Gold sold oz 162,308 169,803 120,777
Realised gold price1 $/oz 1,190 1,177 1,192
Cash cost per gold ounce sold2 $/oz 704 660 690
All-in sustaining costs per gold ounce sold2 $/oz 905 855 889
Profit and Loss
Revenues $ 193,140 199,825 143,957
Operating EBITDA2 $ 47,402 67,875 45,087
Earnings from mine operations $ 27,115 45,393 27,158
Net earnings (loss) $ (2,190) (69,116) 7,858
Basic earnings (loss) per share attributable to shareholders $/share (0.08) (0.57) 0.02
Net adjusted earnings (loss) attributable to shareholders2,3 $ 9,335 30,906 6,167
Net adjusted earnings (loss) attributable to shareholders ($/share)2,3 $/share 0.10 0.33 0.10
Cash Flow Data
All-in sustaining margin2 $ 46,288 54,603 36,524
Non-sustaining capex (excluding growth projects)2 $ (14,179) (10,026) (4,893)
Free Cash Flow (before working capital, tax, and growth projects)2 $ 32,109 44,578 31,631
Growth projects2 $ (68,886) (36,684) (2,588)
Net Debt2 $ (61,949) (25,715) (135,593)
Net Debt / OEBITDA (LTM) ratio2 0.27 0.11 0.89
THREE MONTHS ENDED
5
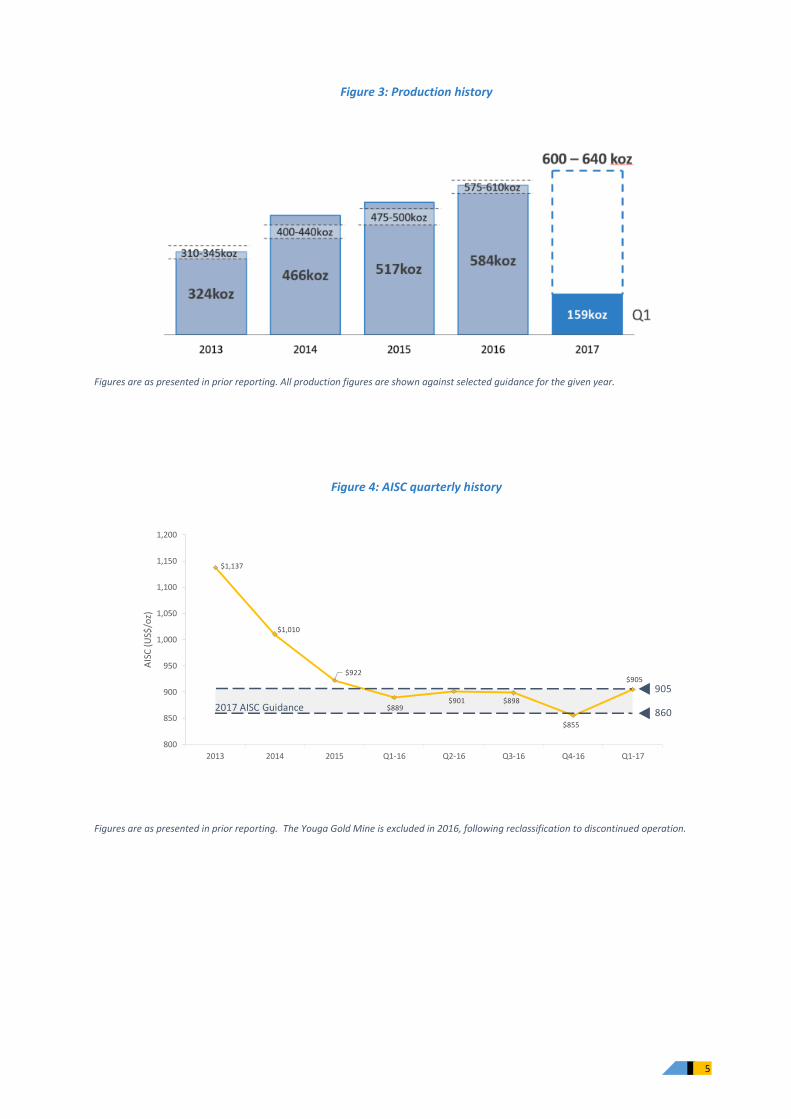
Figure 3: Production history
Figures are as presented in prior reporting. All production figures are shown against selected guidance for the given year.
Figure 4: AISC quarterly history
Figures are as presented in prior reporting. The Youga Gold Mine is excluded in 2016, following reclassification to discontinued operation.
$1,137
$1,010
$922
$889$901 $898
$855
$905
800
850
900
950
1,000
1,050
1,100
1,150
1,200
2013 2014 2015 Q1-16 Q2-16 Q3-16 Q4-16 Q1-17
AIS
C (
US$
/oz)
905
8602017 AISC Guidance
6
3. GUIDANCE
3.1. 2017 OUTLOOK: FURTHER PRODUCTION GROWTH AND AISC REDUCTION
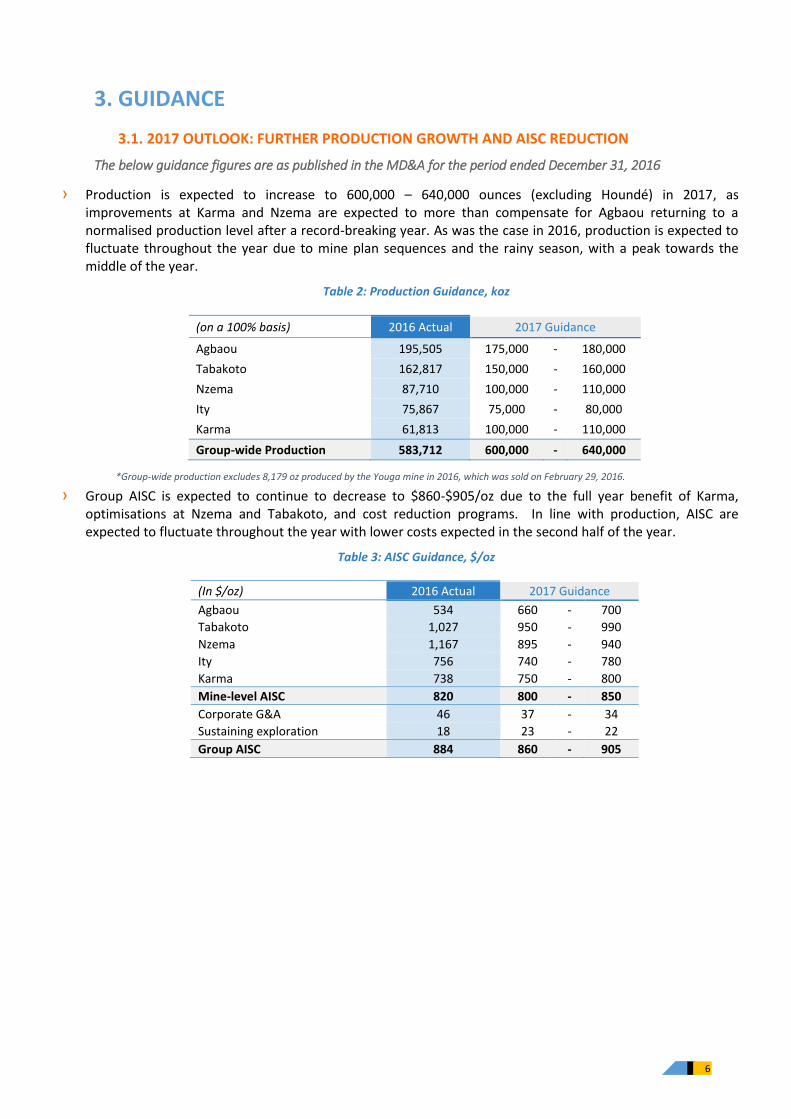
The below guidance figures are as published in the MD&A for the period ended December 31, 2016
› Production is expected to increase to 600,000 – 640,000 ounces (excluding Houndé) in 2017, as improvements at Karma and Nzema are expected to more than compensate for Agbaou returning to a normalised production level after a record-breaking year. As was the case in 2016, production is expected to fluctuate throughout the year due to mine plan sequences and the rainy season, with a peak towards the middle of the year.
Table 2: Production Guidance, koz
(on a 100% basis) 2016 Actual 2017 Guidance
Agbaou 195,505 175,000 - 180,000
Tabakoto 162,817 150,000 - 160,000
Nzema 87,710 100,000 - 110,000
Ity 75,867 75,000 - 80,000
Karma 61,813 100,000 - 110,000
Group-wide Production 583,712 600,000 - 640,000
*Group-wide production excludes 8,179 oz produced by the Youga mine in 2016, which was sold on February 29, 2016.
› Group AISC is expected to continue to decrease to $860-$905/oz due to the full year benefit of Karma, optimisations at Nzema and Tabakoto, and cost reduction programs. In line with production, AISC are expected to fluctuate throughout the year with lower costs expected in the second half of the year.
Table 3: AISC Guidance, $/oz
(In $/oz) 2016 Actual 2017 Guidance
Agbaou 534 660 - 700
Tabakoto 1,027 950 - 990
Nzema 1,167 895 - 940
Ity 756 740 - 780
Karma 738 750 - 800
Mine-level AISC 820 800 - 850
Corporate G&A 46 37 - 34
Sustaining exploration 18 23 - 22
Group AISC 884 860 - 905
7
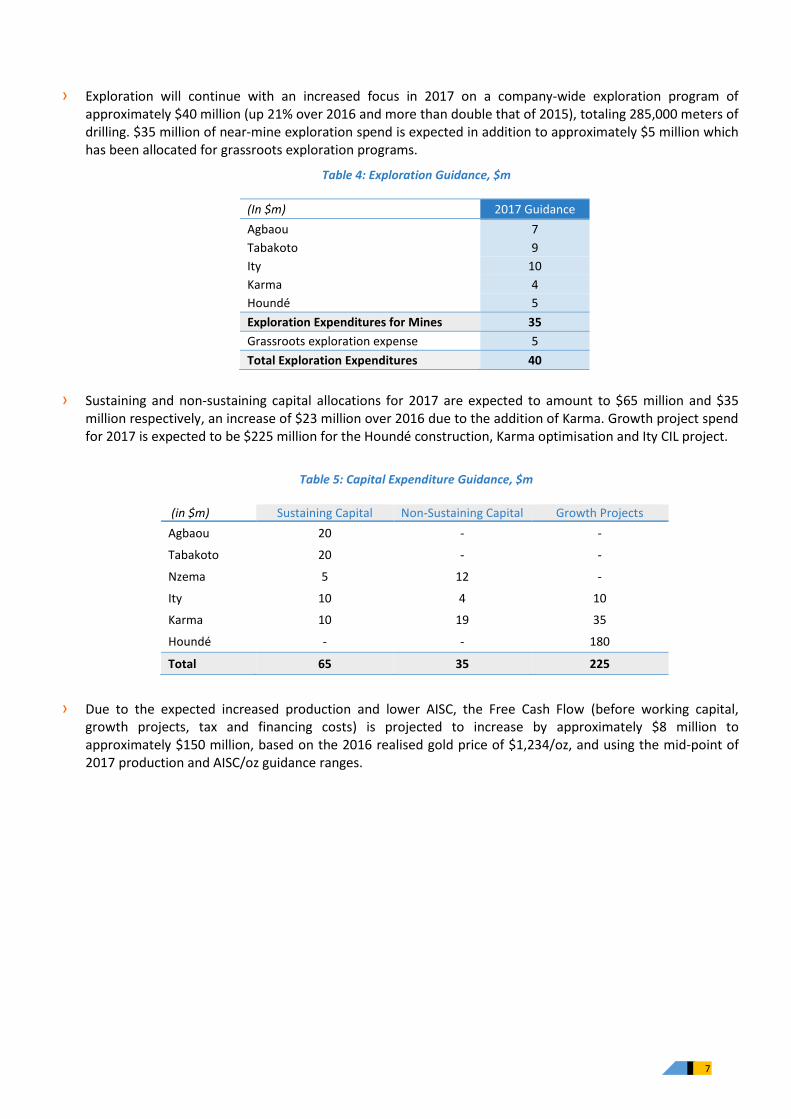
› Exploration will continue with an increased focus in 2017 on a company-wide exploration program of approximately $40 million (up 21% over 2016 and more than double that of 2015), totaling 285,000 meters of drilling. $35 million of near-mine exploration spend is expected in addition to approximately $5 million which has been allocated for grassroots exploration programs.
Table 4: Exploration Guidance, $m
(In $m) 2017 Guidance
Agbaou 7
Tabakoto 9
Ity 10
Karma 4
Houndé 5
Exploration Expenditures for Mines 35
Grassroots exploration expense 5
Total Exploration Expenditures 40
› Sustaining and non-sustaining capital allocations for 2017 are expected to amount to $65 million and $35 million respectively, an increase of $23 million over 2016 due to the addition of Karma. Growth project spend for 2017 is expected to be $225 million for the Houndé construction, Karma optimisation and Ity CIL project.
Table 5: Capital Expenditure Guidance, $m
(in $m) Sustaining Capital Non-Sustaining Capital Growth Projects
Agbaou 20 - -
Tabakoto 20 - -
Nzema 5 12 -
Ity 10 4 10
Karma 10 19 35
Houndé - - 180
Total 65 35 225
› Due to the expected increased production and lower AISC, the Free Cash Flow (before working capital, growth projects, tax and financing costs) is projected to increase by approximately $8 million to approximately $150 million, based on the 2016 realised gold price of $1,234/oz, and using the mid-point of 2017 production and AISC/oz guidance ranges.
8
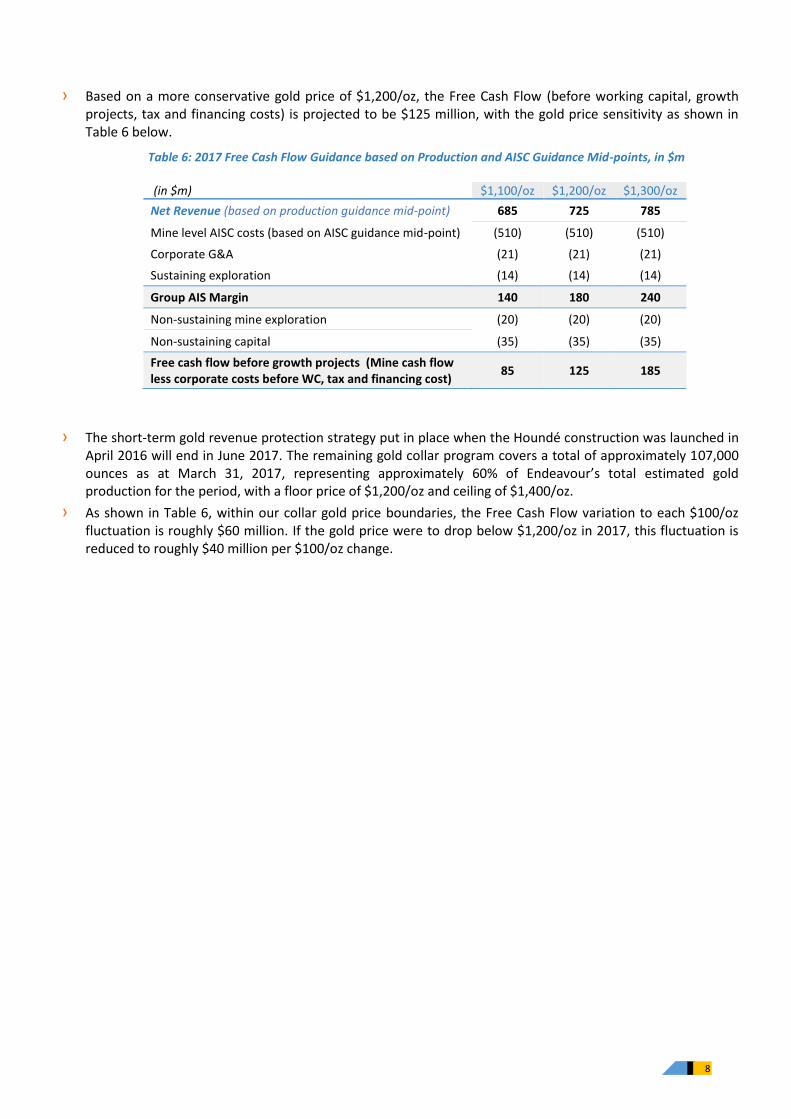
› Based on a more conservative gold price of $1,200/oz, the Free Cash Flow (before working capital, growth projects, tax and financing costs) is projected to be $125 million, with the gold price sensitivity as shown in Table 6 below.
Table 6: 2017 Free Cash Flow Guidance based on Production and AISC Guidance Mid-points, in $m
(in $m) $1,100/oz $1,200/oz $1,300/oz
Net Revenue (based on production guidance mid-point) 685 725 785
Mine level AISC costs (based on AISC guidance mid-point) (510) (510) (510)
Corporate G&A (21) (21) (21)
Sustaining exploration (14) (14) (14)
Group AIS Margin 140 180 240
Non-sustaining mine exploration (20) (20) (20)
Non-sustaining capital (35) (35) (35)
Free cash flow before growth projects (Mine cash flow less corporate costs before WC, tax and financing cost)
85 125 185
› The short-term gold revenue protection strategy put in place when the Houndé construction was launched in April 2016 will end in June 2017. The remaining gold collar program covers a total of approximately 107,000 ounces as at March 31, 2017, representing approximately 60% of Endeavour’s total estimated gold production for the period, with a floor price of $1,200/oz and ceiling of $1,400/oz.
› As shown in Table 6, within our collar gold price boundaries, the Free Cash Flow variation to each $100/oz fluctuation is roughly $60 million. If the gold price were to drop below $1,200/oz in 2017, this fluctuation is reduced to roughly $40 million per $100/oz change.
9
4. OPERATIONS REVIEW
4.1. HEATH, SAFETY, ENVIRONMENT AND CORPORATE RESPONSIBILITY
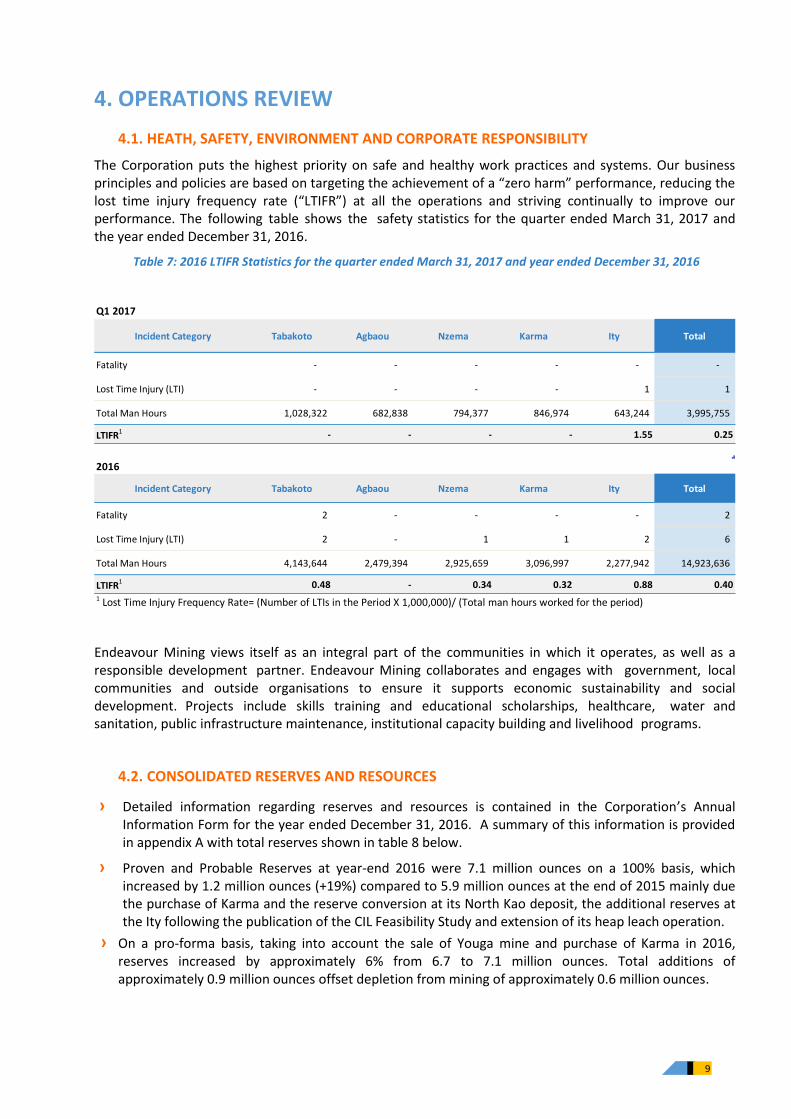
The Corporation puts the highest priority on safe and healthy work practices and systems. Our business principles and policies are based on targeting the achievement of a “zero harm” performance, reducing the lost time injury frequency rate (“LTIFR”) at all the operations and striving continually to improve our performance. The following table shows the safety statistics for the quarter ended March 31, 2017 and the year ended December 31, 2016.
Table 7: 2016 LTIFR Statistics for the quarter ended March 31, 2017 and year ended December 31, 2016
Endeavour Mining views itself as an integral part of the communities in which it operates, as well as a responsible development partner. Endeavour Mining collaborates and engages with government, local communities and outside organisations to ensure it supports economic sustainability and social development. Projects include skills training and educational scholarships, healthcare, water and sanitation, public infrastructure maintenance, institutional capacity building and livelihood programs.
4.2. CONSOLIDATED RESERVES AND RESOURCES
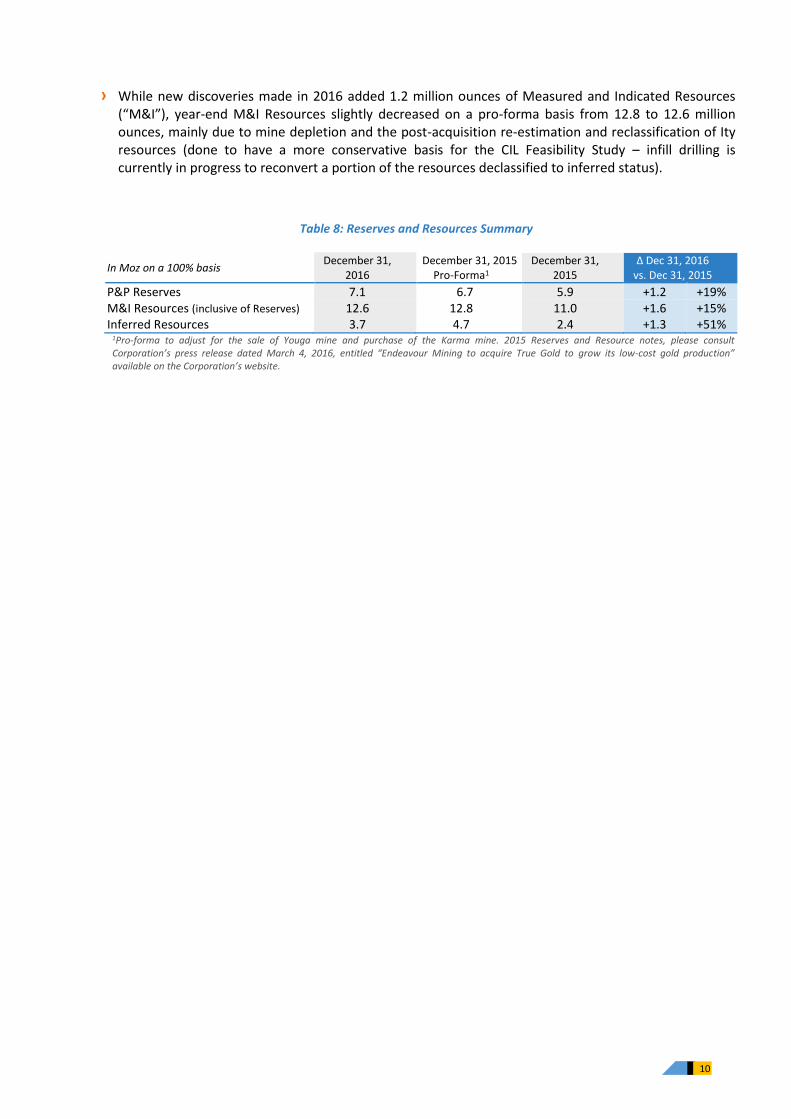
› Detailed information regarding reserves and resources is contained in the Corporation’s Annual Information Form for the year ended December 31, 2016. A summary of this information is provided in appendix A with total reserves shown in table 8 below.
› Proven and Probable Reserves at year-end 2016 were 7.1 million ounces on a 100% basis, which increased by 1.2 million ounces (+19%) compared to 5.9 million ounces at the end of 2015 mainly due the purchase of Karma and the reserve conversion at its North Kao deposit, the additional reserves at the Ity following the publication of the CIL Feasibility Study and extension of its heap leach operation.
› On a pro-forma basis, taking into account the sale of Youga mine and purchase of Karma in 2016, reserves increased by approximately 6% from 6.7 to 7.1 million ounces. Total additions of approximately 0.9 million ounces offset depletion from mining of approximately 0.6 million ounces.
Q1 2017
Incident Category Tabakoto Agbaou Nzema Karma Ity Total
Fatality - - - - - -
Lost Time Injury (LTI) - - - - 1 1
Total Man Hours 1,028,322 682,838 794,377 846,974 643,244 3,995,755
LTIFR1 - - - - 1.55 0.25
2016
Incident Category Tabakoto Agbaou Nzema Karma Ity Total
Fatality 2 - - - - 2
Lost Time Injury (LTI) 2 - 1 1 2 6
Total Man Hours 4,143,644 2,479,394 2,925,659 3,096,997 2,277,942 14,923,636
LTIFR1 0.48 - 0.34 0.32 0.88 0.401 Lost Time Injury Frequency Rate= (Number of LTIs in the Period X 1,000,000)/ (Total man hours worked for the period)
10
› While new discoveries made in 2016 added 1.2 million ounces of Measured and Indicated Resources (“M&I”), year-end M&I Resources slightly decreased on a pro-forma basis from 12.8 to 12.6 million ounces, mainly due to mine depletion and the post-acquisition re-estimation and reclassification of Ity resources (done to have a more conservative basis for the CIL Feasibility Study – infill drilling is currently in progress to reconvert a portion of the resources declassified to inferred status).
Table 8: Reserves and Resources Summary
In Moz on a 100% basis December 31,
2016 December 31, 2015
Pro-Forma1 December 31,
2015 Δ Dec 31, 2016
vs. Dec 31, 2015
P&P Reserves 7.1 6.7 5.9 +1.2 +19% M&I Resources (inclusive of Reserves) 12.6 12.8 11.0 +1.6 +15% Inferred Resources 3.7 4.7 2.4 +1.3 +51%
1Pro-forma to adjust for the sale of Youga mine and purchase of the Karma mine. 2015 Reserves and Resource notes, please consult Corporation’s press release dated March 4, 2016, entitled “Endeavour Mining to acquire True Gold to grow its low-cost gold production” available on the Corporation’s website.
11
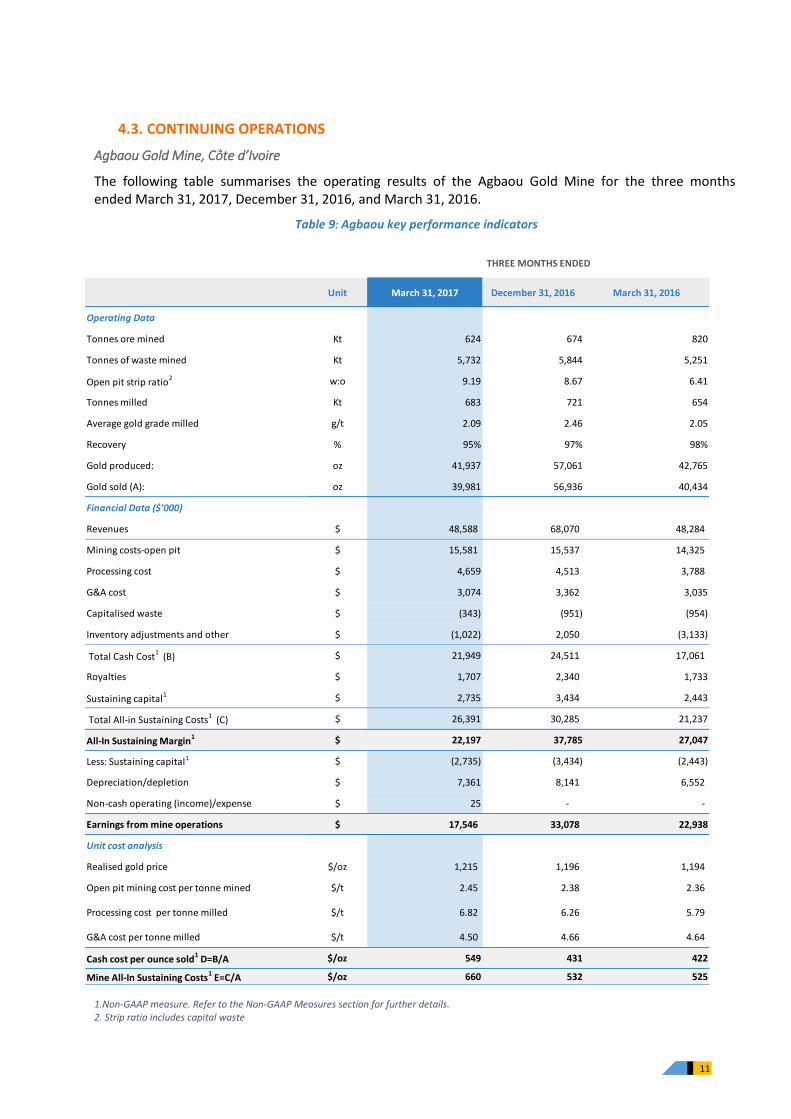
4.3. CONTINUING OPERATIONS
Agbaou Gold Mine, Côte d’Ivoire
The following table summarises the operating results of the Agbaou Gold Mine for the three months ended March 31, 2017, December 31, 2016, and March 31, 2016.
Table 9: Agbaou key performance indicators
1.Non-GAAP measure. Refer to the Non-GAAP Measures section for further details. 2. Strip ratio includes capital waste
Unit March 31, 2017 December 31, 2016 March 31, 2016
Operating Data
Tonnes ore mined Kt 624 674 820
Tonnes of waste mined Kt 5,732 5,844 5,251
Open pit strip ratio2 w:o 9.19 8.67 6.41
Tonnes milled Kt 683 721 654
Average gold grade milled g/t 2.09 2.46 2.05
Recovery % 95% 97% 98%
Gold produced: oz 41,937 57,061 42,765
Gold sold (A): oz 39,981 56,936 40,434
Financial Data ($'000)
Revenues $ 48,588 68,070 48,284
Mining costs-open pit $ 15,581 15,537 14,325
Processing cost $ 4,659 4,513 3,788
G&A cost $ 3,074 3,362 3,035
Capitalised waste $ (343) (951) (954)
Inventory adjustments and other $ (1,022) 2,050 (3,133)
Total Cash Cost1 (B) $ 21,949 24,511 17,061
Royalties $ 1,707 2,340 1,733
Sustaining capital1 $ 2,735 3,434 2,443
Total All-in Sustaining Costs1 (C) $ 26,391 30,285 21,237
All-In Sustaining Margin1 $ 22,197 37,785 27,047
Less: Sustaining capital1 $ (2,735) (3,434) (2,443)
Depreciation/depletion $ 7,361 8,141 6,552
Non-cash operating (income)/expense $ 25 - -
Earnings from mine operations $ 17,546 33,078 22,938
Unit cost analysis
Realised gold price $/oz 1,215 1,196 1,194
Open pit mining cost per tonne mined $/t 2.45 2.38 2.36
Processing cost per tonne milled $/t 6.82 6.26 5.79
G&A cost per tonne milled $/t 4.50 4.66 4.64
Cash cost per ounce sold1 D=B/A $/oz 549 431 422
Mine All-In Sustaining Costs1 E=C/A $/oz 660 532 525
THREE MONTHS ENDED

12
Q1 2017 Insights
› Agbaou performed in line with expectations in Q1-2017 and remains on track to meet the FY-2017 guidance.
As planned in the mining sequence, production decreased over the previous record-breaking Q4-2016 as oxide mining temporarily shifted from a high grade zone to a lower grade zone, resulting in the head grade decreasing by 18%.
Processing throughput continues to perform well, achieving an annualized throughput rate of 2.7 million tonnes despite increases in the fresh ore blend from 8% to 30% over the previous quarter.
› All-in sustaining costs increased over Q4-2016 to be in line with the FY-2017 guidance of $660-700/oz, as a result of:
Temporary mining of a lower grade oxide ore area.
Increased mining costs due to more drill and blast activity necessary for the harder ore, as well as deeper elevations mined.
Processing costs increased due to harder fresh ore resulting in increased mill power, higher grinding media and reagent consumption, and higher general wear and tear on mill liners.
Q1 2017 Exploration Activities
› Exploration progressed well during the first quarter, with a total of approximately 10,000 meters drilled out of the 45,000 meters planned for the year.
› The drill program is based on previous geophysics and soil geochemistry result and is focused on the MPN extension, Agbaou south, Niafouta, and Beta extension targets.
› An update to the reserves and resources is expected to be made following the completion of the program in H2-2017.
2017 Outlook
› Improved grades and increased production are expected over the coming quarters, while AISC are expected to remain within the guided $660-700/oz range.
› Continuing to progress toward 50% fresh ore blend in Q2-2017.
› Sustaining capital spending is expected to increase in upcoming quarters with increased waste capitalisation.
› FY 2017 guidance remains unchanged. As guided, after achieving an exceptional 2016, Agbaou is expected to return to a more normalised and sustainable annual production rate of 175,000-180,000 ounces in 2017, with fresh ore representing up to 50% of tonnes processed.
13
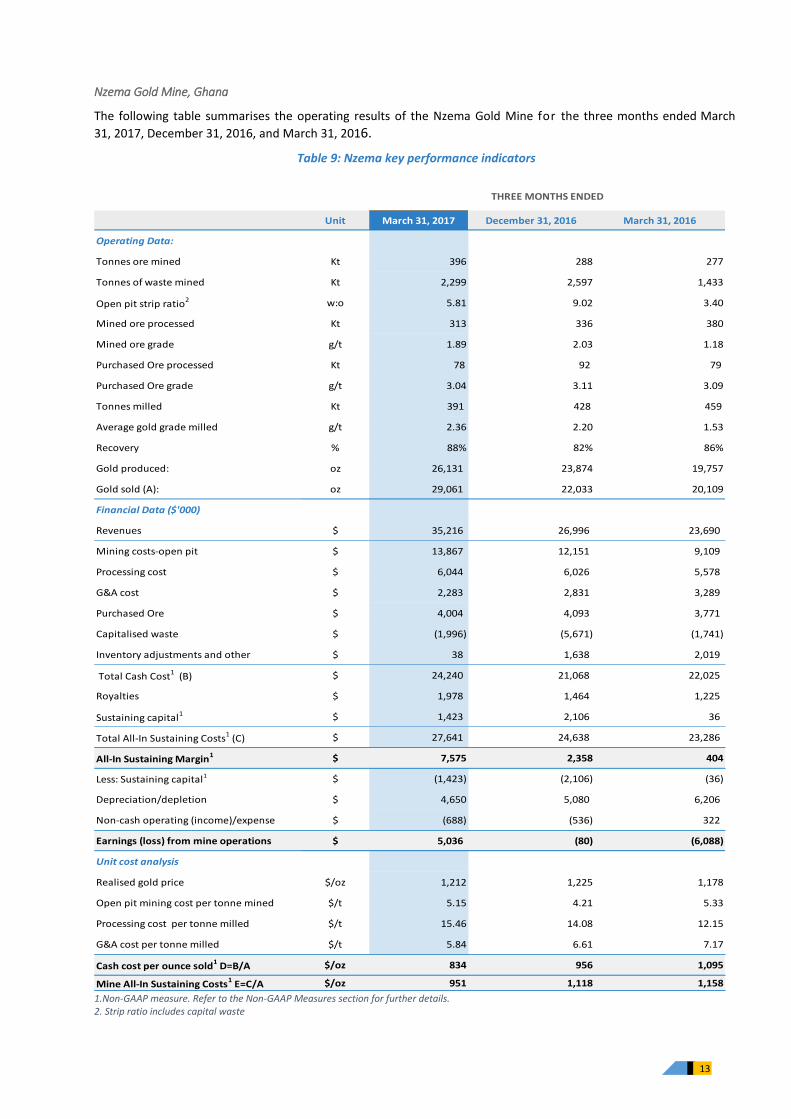
Nzema Gold Mine, Ghana
The following table summarises the operating results of the Nzema Gold Mine for the three months ended March
31, 2017, December 31, 2016, and March 31, 2016.
Table 9: Nzema key performance indicators
1.Non-GAAP measure. Refer to the Non-GAAP Measures section for further details. 2. Strip ratio includes capital waste
Unit March 31, 2017 December 31, 2016 March 31, 2016
Operating Data:
Tonnes ore mined Kt 396 288 277
Tonnes of waste mined Kt 2,299 2,597 1,433
Open pit strip ratio2 w:o 5.81 9.02 3.40
Mined ore processed Kt 313 336 380
Mined ore grade g/t 1.89 2.03 1.18
Purchased Ore processed Kt 78 92 79
Purchased Ore grade g/t 3.04 3.11 3.09
Tonnes milled Kt 391 428 459
Average gold grade milled g/t 2.36 2.20 1.53
Recovery % 88% 82% 86%
Gold produced: oz 26,131 23,874 19,757
Gold sold (A): oz 29,061 22,033 20,109
Financial Data ($'000)
Revenues $ 35,216 26,996 23,690
Mining costs-open pit $ 13,867 12,151 9,109
Processing cost $ 6,044 6,026 5,578
G&A cost $ 2,283 2,831 3,289
Purchased Ore $ 4,004 4,093 3,771
Capitalised waste $ (1,996) (5,671) (1,741)
Inventory adjustments and other $ 38 1,638 2,019
Total Cash Cost1 (B) $ 24,240 21,068 22,025
Royalties $ 1,978 1,464 1,225
Sustaining capital1 $ 1,423 2,106 36
Total All-In Sustaining Costs1 (C) $ 27,641 24,638 23,286
All-In Sustaining Margin1 $ 7,575 2,358 404
Less: Sustaining capital1 $ (1,423) (2,106) (36)
Depreciation/depletion $ 4,650 5,080 6,206
Non-cash operating (income)/expense $ (688) (536) 322
Earnings (loss) from mine operations $ 5,036 (80) (6,088)
Unit cost analysis
Realised gold price $/oz 1,212 1,225 1,178
Open pit mining cost per tonne mined $/t 5.15 4.21 5.33
Processing cost per tonne milled $/t 15.46 14.08 12.15
G&A cost per tonne milled $/t 5.84 6.61 7.17
Cash cost per ounce sold1 D=B/A $/oz 834 956 1,095
Mine All-In Sustaining Costs1 E=C/A $/oz 951 1,118 1,158
THREE MONTHS ENDED
14
Q1 2017 Insights
› Nzema performed in line with expectations in Q1-2017, on track to meet FY-2017 guidance, with production up 9% over Q4-2016.
Production benefited from the completion of the Adamus push-back project in Q1-2017 which started to improve grades mined.
Ore mine extraction successfully increased in the first quarter in order to build up the stockpile in anticipation of the upcoming rainy season.
Total mill throughput decreased by 15% to reflect the increased proportion of fresh ore processed during the quarter.
With decreased dependency on purchased ore due to higher grades coming from our own mining activities, a more selective quality control process was established to focus on purchasing ore that is of higher grade and with high recovery rate characteristics. Toll purchasing is however expected to increase in the coming quarters.
› As expected, All-in Sustaining Costs decreased by 15% over Q4-2016 and are expected to continue to trend lower to fall within the FY-2017 guidance of $895-940/oz.
Significant decrease in AISC due to increased production and reduction of sustaining waste capital.
Mining unit costs are higher versus Q4-2016 due to mining at deeper depth, longer haul distances, and higher drill and blast activity.
Processing unit costs increased due to the 10% increase in SAG mill power used, driven by higher primary ore feed.
Non-sustaining expenditures for the Adamus push-back project and Bokrobo resettlement remained in line with expectations.
Q1 2017 Exploration Activities
› No significant exploration activities occured during Q1-2017.
2017 Outlook
› Following the completion of the push-back, Nzema returned to profitability in Q1-2017 and is expected to continue to produce positive all-in sustaining margin and earnings from mine operations.
› FY-2017 guidance remains unchanged with 100-110koz planned at an AISC of $895-940/oz, as AISC are expected to continue to decline throughout the year.
› To complement production from the Adamus pit, pre-stripping at the Bokrobo deposit is expected to start in the second half of the year.
15
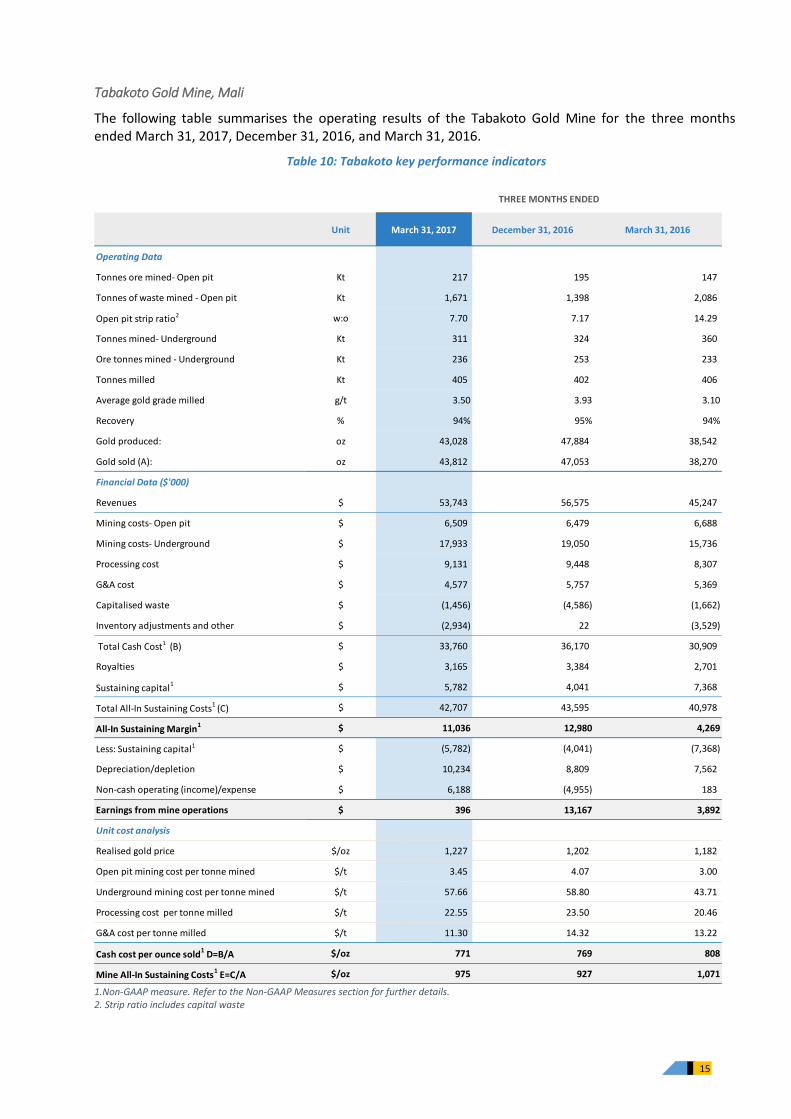
Tabakoto Gold Mine, Mali
The following table summarises the operating results of the Tabakoto Gold Mine for the three months ended March 31, 2017, December 31, 2016, and March 31, 2016.
Table 10: Tabakoto key performance indicators
1.Non-GAAP measure. Refer to the Non-GAAP Measures section for further details. 2. Strip ratio includes capital waste
Unit March 31, 2017 December 31, 2016 March 31, 2016
Operating Data
Tonnes ore mined- Open pit Kt 217 195 147
Tonnes of waste mined - Open pit Kt 1,671 1,398 2,086
Open pit strip ratio2 w:o 7.70 7.17 14.29
Tonnes mined- Underground Kt 311 324 360
Ore tonnes mined - Underground Kt 236 253 233
Tonnes milled Kt 405 402 406
Average gold grade milled g/t 3.50 3.93 3.10
Recovery % 94% 95% 94%
Gold produced: oz 43,028 47,884 38,542
Gold sold (A): oz 43,812 47,053 38,270
Financial Data ($'000)
Revenues $ 53,743 56,575 45,247
Mining costs- Open pit $ 6,509 6,479 6,688
Mining costs- Underground $ 17,933 19,050 15,736
Processing cost $ 9,131 9,448 8,307
G&A cost $ 4,577 5,757 5,369
Capitalised waste $ (1,456) (4,586) (1,662)
Inventory adjustments and other $ (2,934) 22 (3,529)
Total Cash Cost1 (B) $ 33,760 36,170 30,909
Royalties $ 3,165 3,384 2,701
Sustaining capital1 $ 5,782 4,041 7,368
Total All-In Sustaining Costs1 (C) $ 42,707 43,595 40,978
All-In Sustaining Margin1 $ 11,036 12,980 4,269
Less: Sustaining capital1 $ (5,782) (4,041) (7,368)
Depreciation/depletion $ 10,234 8,809 7,562
Non-cash operating (income)/expense $ 6,188 (4,955) 183
Earnings from mine operations $ 396 13,167 3,892
Unit cost analysis
Realised gold price $/oz 1,227 1,202 1,182
Open pit mining cost per tonne mined $/t 3.45 4.07 3.00
Underground mining cost per tonne mined $/t 57.66 58.80 43.71
Processing cost per tonne milled $/t 22.55 23.50 20.46
G&A cost per tonne milled $/t 11.30 14.32 13.22
Cash cost per ounce sold1 D=B/A $/oz 771 769 808
Mine All-In Sustaining Costs1 E=C/A $/oz 975 927 1,071
THREE MONTHS ENDED
16
Q1 2017 Insights
› Tabakoto performed in line with expectations in Q1-2017 and remains on track to meet the FY-2017 guidance.
› As anticipated, production decreased over the previous record Q4-2016 mainly due to:
Lower open pit grade from Kofi C which is approaching the end of its high grade mine life.
First contribution from Kofi B which has a lower grade than Kofi C.
Underground mining efficiency remained at a good level, however the mine sequence at Segala resulted in mining a lower grade zone.
Processing activities continued to perform well, maintaining a stable throughput.
› As expected, all-in sustaining costs increased over Q4-2016 to fall within the FY-2017 guidance of $950-990/oz
While the AISC were impacted by the aforementioned lower grades and lower production, the cash cost remained fairly stable as the mine benefited from improved unit costs (on a $/t basis) reflecting the efforts and continuous focus on cost reduction which is expected to continue throughout 2017.
Sustaining capital increased mainly as a result of new equipment purchases.
› A $5.2 million non-cash inventory write-down was incurred in the first quarter for obsolete consumables inventory.
Q1 2017 Exploration Activities
› As set out in Endeavour’s five year exploration strategy, published in November 2016, Tabakoto is a top exploration priority in 2017 given its relatively short proven mine life and significant potential.
› As such, a $9 million exploration program totaling approximately 72,000 meters of drilling has been planned for 2017, with 21,000 meters drilled in Q1-2017.
› During the quarter open pit drilling focused mainly on infill drilling at Kreko and Fougala, for which a maiden resource is expected in Q3-2017, and testing the area between Fougala and Djambaye.
› During the quarter underground drilling focused on testing the eastern side extensions at Segala and North-East extensions at Tabakoto.
2017 Outlook
› Ongoing cost saving and optimization programs are underway which include overhead reduction, centralizing procurement, fleet replacement, and improvement of equipment availability and mining efficiency.
› Production is expected to be lower in the second half of the year with the end of Kofi C mining and full transition to Kofi B.
› FY-2017 guidance remains unchanged with expected production of 150,000 - 160,000 ounces at AISC of $950-990/oz.
17
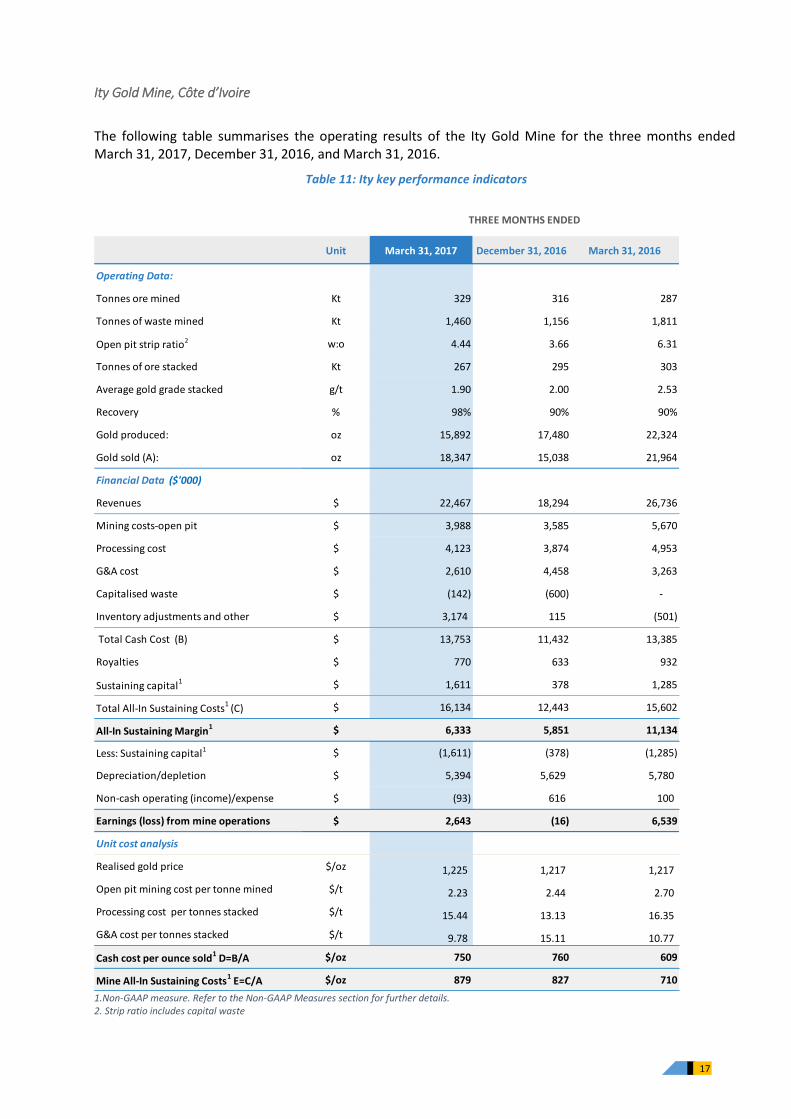
Ity Gold Mine, Côte d’Ivoire
The following table summarises the operating results of the Ity Gold Mine for the three months ended March 31, 2017, December 31, 2016, and March 31, 2016.
Table 11: Ity key performance indicators
1.Non-GAAP measure. Refer to the Non-GAAP Measures section for further details. 2. Strip ratio includes capital waste
Unit March 31, 2017 December 31, 2016 March 31, 2016
Operating Data:
Tonnes ore mined Kt 329 316 287
Tonnes of waste mined Kt 1,460 1,156 1,811
Open pit strip ratio2 w:o 4.44 3.66 6.31
Tonnes of ore stacked Kt 267 295 303
Average gold grade stacked g/t 1.90 2.00 2.53
Recovery % 98% 90% 90%
Gold produced: oz 15,892 17,480 22,324
Gold sold (A): oz 18,347 15,038 21,964
Financial Data ($'000)
Revenues $ 22,467 18,294 26,736
Mining costs-open pit $ 3,988 3,585 5,670
Processing cost $ 4,123 3,874 4,953
G&A cost $ 2,610 4,458 3,263
Capitalised waste $ (142) (600) -
Inventory adjustments and other $ 3,174 115 (501)
Total Cash Cost (B) $ 13,753 11,432 13,385
Royalties $ 770 633 932
Sustaining capital1 $ 1,611 378 1,285
Total All-In Sustaining Costs1
(C) $ 16,134 12,443 15,602
All-In Sustaining Margin1 $ 6,333 5,851 11,134
Less: Sustaining capital1 $ (1,611) (378) (1,285)
Depreciation/depletion $ 5,394 5,629 5,780
Non-cash operating (income)/expense $ (93) 616 100
Earnings (loss) from mine operations $ 2,643 (16) 6,539
Unit cost analysis
Realised gold price $/oz 1,225 1,217 1,217
Open pit mining cost per tonne mined $/t 2.23 2.44 2.70
Processing cost per tonnes stacked $/t 15.44 13.13 16.35
G&A cost per tonnes stacked $/t 9.78 15.11 10.77
Cash cost per ounce sold1 D=B/A $/oz 750 760 609
Mine All-In Sustaining Costs1 E=C/A $/oz 879 827 710
THREE MONTHS ENDED

18
Q1 2017 Insights
› Ity production remains on track to finish within its FY-2017 production guidance (with details provided in the “2017 outlook” section), despite production decreasing by 10% over Q4-2016.
Mining activities improved over the previous quarter, due to higher equipment availability, resulting in 23% more tonnes mined than stacked during the quarter.
Production decreased mainly due to a 5% drop in grade, down-time related to work stoppages, and by a longer leach cycle of stacked ore.
The timing of the stacking has caused the recovery rate to temporarily increase to 98% in Q1-2017. This is expected to return to a normalised rate over the course of the year.
› Ity remains on track to finish within its FY-2017 AISC guidance (with details provided in the “2017 outlook” section), despite production decreasing by 6% over Q4-2016.
AISC increased mainly due to planned sustaining capital spend and lower grades.
Cash costs decreased compared to Q4-2016 due to lower mining costs per tonne as a result of increased volumes, and lower G&A costs.
Processing costs per tonne have increased due to the lower stacking volumes.
Q1 2017 Exploration Activities
› The largest portion of Endeavour’s 2017 exploration budget has been allocated to the Ity area in light of its strong prospectivity and potential to further extend the lives of the CIL project and heap leach operations.
› For 2017, a $10 million exploration program totaling approximately 50,000 meters has been planned, with approximately 25,000 meters completed in Q1-2017.
› During the first quarter drilling focused mainly at the Mont Ity Flat area, Daapleu, and Colline Sud.
› Drill results for the Le Plaque target are being analyzed.
› In addition, a Regional Airborne Geophysics program was completed.
2017 Outlook
› Production and cost profile is expected to improve over the remainder of 2017 due to:
Grade profile is expected to increase as a result of starting to mine Bakatouo at the end of Q2-2017.
Increased stacking and benefit of the lag between tonnes mined and tonnes stacked.
› FY-2017 guidance remains unchanged with 75,000 – 80,000 koz production expected at an AISC of $740-780/oz.
19
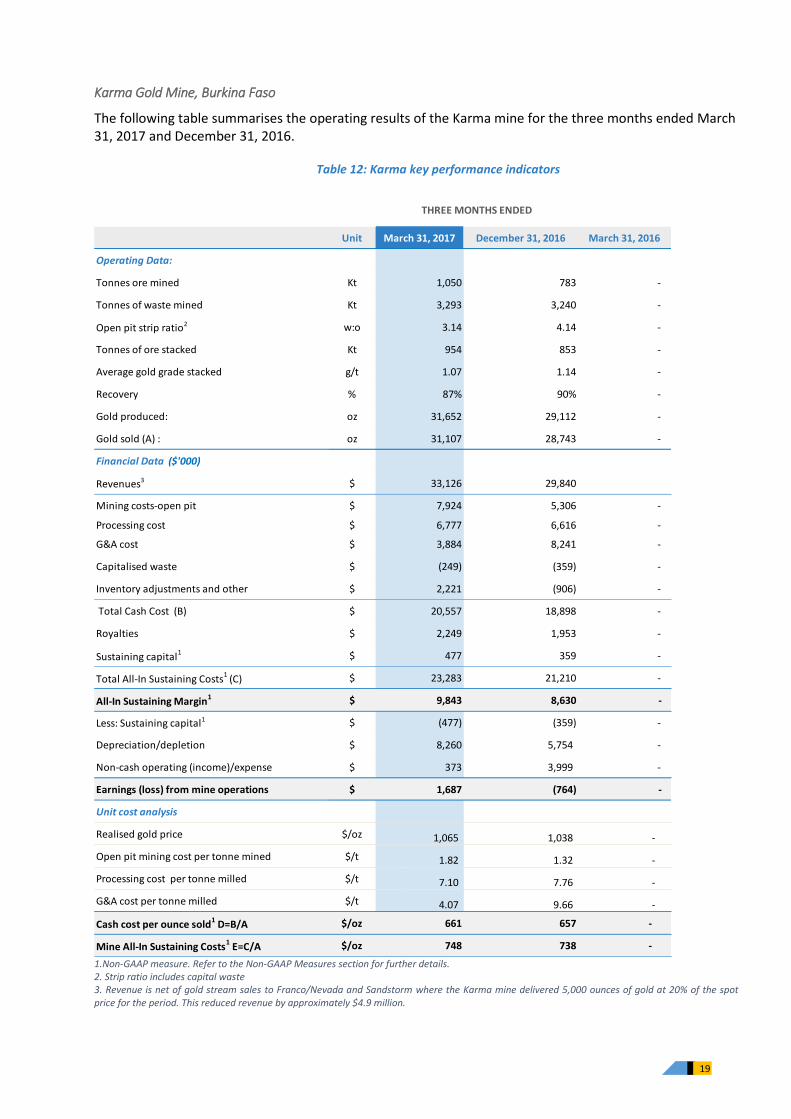
Karma Gold Mine, Burkina Faso
The following table summarises the operating results of the Karma mine for the three months ended March 31, 2017 and December 31, 2016.
Table 12: Karma key performance indicators
1.Non-GAAP measure. Refer to the Non-GAAP Measures section for further details. 2. Strip ratio includes capital waste 3. Revenue is net of gold stream sales to Franco/Nevada and Sandstorm where the Karma mine delivered 5,000 ounces of gold at 20% of the spot price for the period. This reduced revenue by approximately $4.9 million.
Unit March 31, 2017 December 31, 2016 March 31, 2016
Operating Data:
Tonnes ore mined Kt 1,050 783 -
Tonnes of waste mined Kt 3,293 3,240 -
Open pit strip ratio2 w:o 3.14 4.14 -
Tonnes of ore stacked Kt 954 853 -
Average gold grade stacked g/t 1.07 1.14 -
Recovery % 87% 90% -
Gold produced: oz 31,652 29,112 -
Gold sold (A) : oz 31,107 28,743 -
Financial Data ($'000)
Revenues3 $ 33,126 29,840
Mining costs-open pit $ 7,924 5,306 -
Processing cost $ 6,777 6,616 -
G&A cost $ 3,884 8,241 -
Capitalised waste $ (249) (359) -
Inventory adjustments and other $ 2,221 (906) -
Total Cash Cost (B) $ 20,557 18,898 -
Royalties $ 2,249 1,953 -
Sustaining capital1 $ 477 359 -
Total All-In Sustaining Costs1 (C) $ 23,283 21,210 -
All-In Sustaining Margin1 $ 9,843 8,630 -
Less: Sustaining capital1 $ (477) (359) -
Depreciation/depletion $ 8,260 5,754 -
Non-cash operating (income)/expense $ 373 3,999 -
Earnings (loss) from mine operations $ 1,687 (764) -
Unit cost analysis
Realised gold price $/oz 1,065 1,038 -
Open pit mining cost per tonne mined $/t 1.82 1.32 -
Processing cost per tonne milled $/t 7.10 7.76 -
G&A cost per tonne milled $/t 4.07 9.66 -
Cash cost per ounce sold1 D=B/A $/oz 661 657 -
Mine All-In Sustaining Costs1 E=C/A $/oz 748 738 -
THREE MONTHS ENDED
20
Q1 2017 Insights
› Karma continued to ramp-up in line with expectations in Q1-2017, on track to meet its FY-2017 guidance, with production up 9% over Q4-2016.
Mining activity increased by 34% in response to increased stacking capacity.
Stacking increased by 12% due to the optimized performance of the mobile power screen and crushing sections.
The grade decrease was offset by the aforementioned increased stacking.
› AISC are tracking in line with the FY-2017 guidance of $750-800/oz, remaining fairly flat over Q4-2016:
AISC benefited from increased production profile.
As expected, mining costs increased due to increased drill and blast requirements from hard rock in the mining sequence, as well as additional grade control. In addition, some G&A costs were reclassified to mining costs to conform to group standards.
G&A costs decreased by $1.30 per tonne as a result of cost saving actions, after taking into account the reclassifications made to conform to group standards.
Q1 2017 Exploration Activities
› In 2017 a $4 million exploration program totaling approximately 30,000 meters has been planned of which approximately 15,000 meters was completed in the first quarter.
› During Q1-2017 drilling focused on testing the extensions of the Rambo, Goulagou and North Kao deposits.
› Drilling on the Yabonsgo target drill is expected to start in Q2-2017.
2017 Outlook
› FY-2017 guidance remains unchanged with 100,000 - 100,000koz planned at an AISC of $750-800/oz.
› The higher-grade Rambo ore feed will continue to compliment that of the GG2 pit, with contribution from the Kao pit in the later portion of the year.
› Stacking capacity is expected to increase in the second half of the year following the completion of the plant optimisation project, which is progressing on-time.
› Sustaining capital is expected to increase later in the year due to stripping activities related to the Kao pit which is expected to be in operation by year-end 2017.
21
4.4. DEVELOPMENT PROJECTS REVIEW
Houndé Project, Burkina Faso
Endeavour’s 90%-owned Houndé project is an open pit mine with a 3.0 Mta gravity circuit and CIL plant. During 2015 and early 2016, a thorough review and optimisation of the Houndé Project was completed and an implementation plan was established, leading to the construction decision. The mining and ore processing schedules remain unchanged since February 2015, while the operating and capital costs were fully scoped and optimised. Construction began in April 2016 and is progressing on-time and on-budget with the first gold pour expected during the fourth quarter of 2017. The initial capital cost is estimated at $328 million, inclusive of $47 million for the owner-mining fleet. During the quarter ended March 31, 2017, $58 million was incurred on the project and work was focused on the following areas:
Achievements to date
› 90% of the capital has already been committed to date, reducing cost over-run risk.
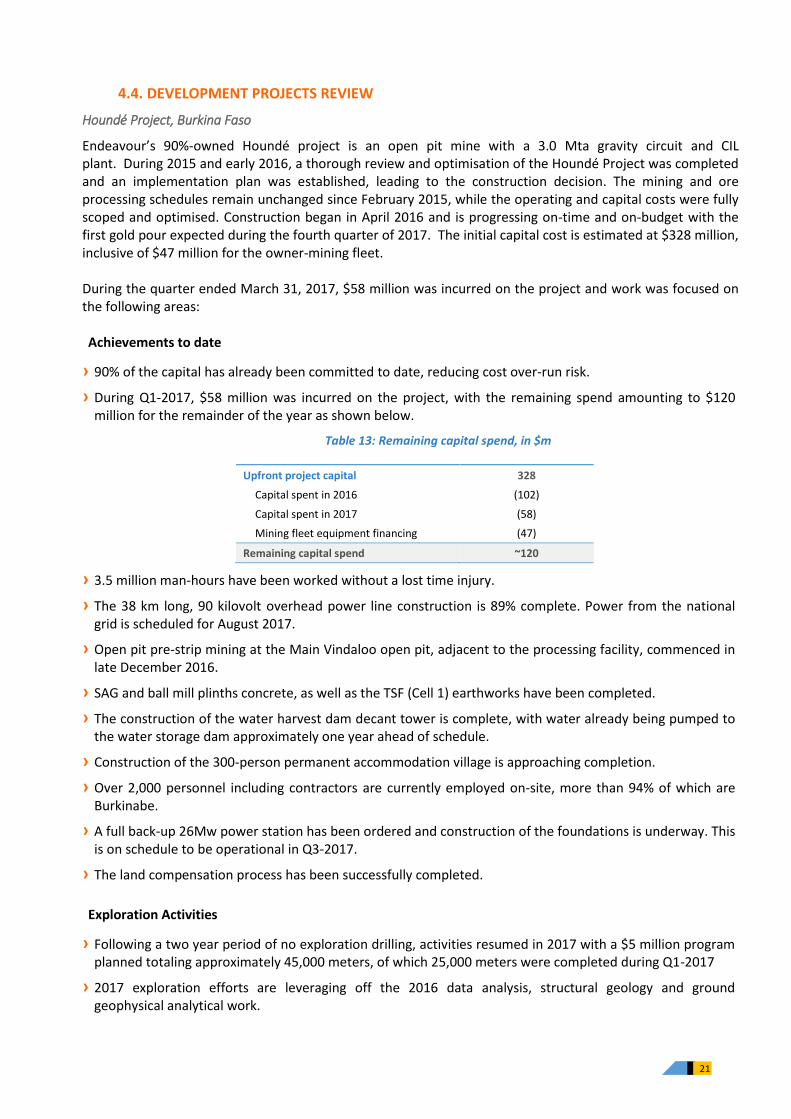
› During Q1-2017, $58 million was incurred on the project, with the remaining spend amounting to $120 million for the remainder of the year as shown below.
Table 13: Remaining capital spend, in $m
Upfront project capital 328
Capital spent in 2016 (102)
Capital spent in 2017 (58)
Mining fleet equipment financing (47)
Remaining capital spend ~120
› 3.5 million man-hours have been worked without a lost time injury.
› The 38 km long, 90 kilovolt overhead power line construction is 89% complete. Power from the national grid is scheduled for August 2017.
› Open pit pre-strip mining at the Main Vindaloo open pit, adjacent to the processing facility, commenced in late December 2016.
› SAG and ball mill plinths concrete, as well as the TSF (Cell 1) earthworks have been completed.
› The construction of the water harvest dam decant tower is complete, with water already being pumped to the water storage dam approximately one year ahead of schedule.
› Construction of the 300-person permanent accommodation village is approaching completion.
› Over 2,000 personnel including contractors are currently employed on-site, more than 94% of which are Burkinabe.
› A full back-up 26Mw power station has been ordered and construction of the foundations is underway. This is on schedule to be operational in Q3-2017.
› The land compensation process has been successfully completed.
Exploration Activities
› Following a two year period of no exploration drilling, activities resumed in 2017 with a $5 million program planned totaling approximately 45,000 meters, of which 25,000 meters were completed during Q1-2017
› 2017 exploration efforts are leveraging off the 2016 data analysis, structural geology and ground geophysical analytical work.
22
› Drilling activities during the quarter focused on delineating high-grade targets such as Bouere and Kari Pump, Sia, and Kari Fault, in addition to preforming reconnaissance drilling.
Ity CIL Project, Côte d’Ivoire
› The Ity CIL Project is progressing towards an investment decision with an in-principle agreement to increase our stake from 55% to 80%.
› The engineering optimisation study remains on track to be completed by mid-year, which will include additional resources based on the addition of the new discoveries made last year and the on-going in-fill drilling programs.
› Test work on Dapleau and Bakatouo is nearly complete, with positive results.
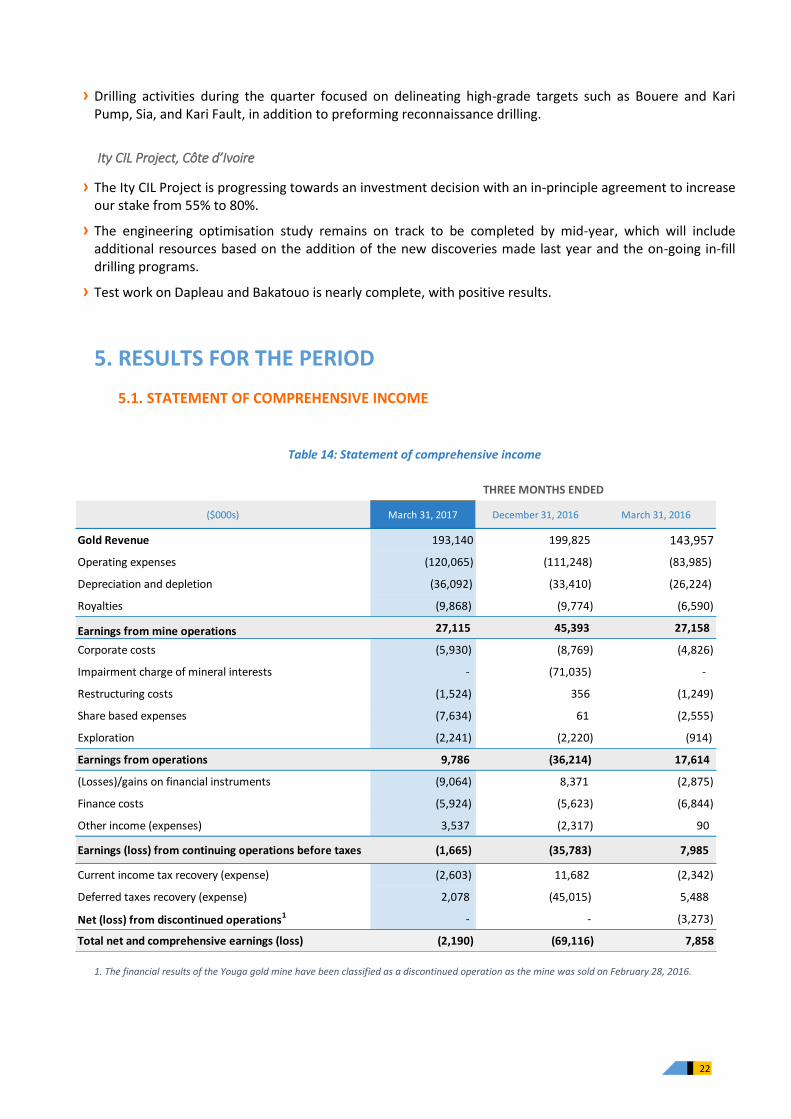
5. RESULTS FOR THE PERIOD
5.1. STATEMENT OF COMPREHENSIVE INCOME
Table 14: Statement of comprehensive income
1. The financial results of the Youga gold mine have been classified as a discontinued operation as the mine was sold on February 28, 2016.
($000s) March 31, 2017 December 31, 2016 March 31, 2016
Gold Revenue 193,140 199,825 143,957
Operating expenses (120,065) (111,248) (83,985)
Depreciation and depletion (36,092) (33,410) (26,224)
Royalties (9,868) (9,774) (6,590)
Earnings from mine operations 27,115 45,393 27,158
Corporate costs (5,930) (8,769) (4,826)
Impairment charge of mineral interests - (71,035) -
Restructuring costs (1,524) 356 (1,249)
Share based expenses (7,634) 61 (2,555)
Exploration (2,241) (2,220) (914)
Earnings from operations 9,786 (36,214) 17,614
(Losses)/gains on financial instruments (9,064) 8,371 (2,875)
Finance costs (5,924) (5,623) (6,844)
Other income (expenses) 3,537 (2,317) 90
Earnings (loss) from continuing operations before taxes (1,665) (35,783) 7,985
Current income tax recovery (expense) (2,603) 11,682 (2,342)
Deferred taxes recovery (expense) 2,078 (45,015) 5,488
Net (loss) from discontinued operations1 - - (3,273)
Total net and comprehensive earnings (loss) (2,190) (69,116) 7,858
THREE MONTHS ENDED
23
The explanations for the key variances are as follows:
› Revenues for the three months ended March 31, 2017 were $193.1 million, compared to $144.0 million in the same quarter of 2016. The increase is primarily due to the addition of the Karma mine, as well as an increase in production at Nzema and Tabakoto against the comparative period. Revenue in the first quarter was generated from gold sales of 162,308 ounces at a realised price of $1,190 (net of the impact of the Karma stream) per ounce compared to 120,777 ounces at a realised price of $1,192 per ounce in the same quarter of 2016.
› Operating expenses for the three months ended March 31, 2017 were $120.1 million, compared to $84.0 million in the same quarter of 2016. The upward trend since the first quarter of 2016 is due to the inclusion of the Karma mine, increased production at Nzema and Tabakoto, a $5.2 million write-down of obsolete inventory at Tabakoto, as well as an increase of costs at Agbaou due to increased drill and blast activity and deeper elevations mined.
› Depreciation and depletion for the first quarter was $36.1 million compared to $26.2 million in the comparative period in 2016. The increase is primarily due to the inclusion of an additional $8.3 million in depletion from the Karma mine, as well as additional depletion expensed at Tabakoto as the Kofi C pit nears the end of its life.
› Corporate costs for the three months ended March 31, 2017 were $5.9 million, compared to $4.8 million in the first quarter of 2016.
› Share based payments expense were $7.6 million in the first quarter of 2017 compared to $2.6 million in the same period in 2016. The increase in the change year-on-year is due to the implementation of a new management compensation structure at year-end 2016 as disclosed in the Management Information Circular, as well as an increase in share price.
› Exploration costs were $2.2 million for the first quarter of 2017 compared to $0.9 million in the first quarter of 2016. The increase from 2016 is due to increased exploration activities, that includes more greenfield work, as management continues to focus on unlocking exploration value within the portfolio.
› Losses on financial instruments were $9.0 million primarily due to the unrealised loss on the gold collar program.
› Restructuring costs of $1.5 million relate to costs incurred surrounding the corporate office relocation to London.
› Finance costs of $5.9 million are related to the RCF which has been drawn $140 million as at March 31, 2017.
24
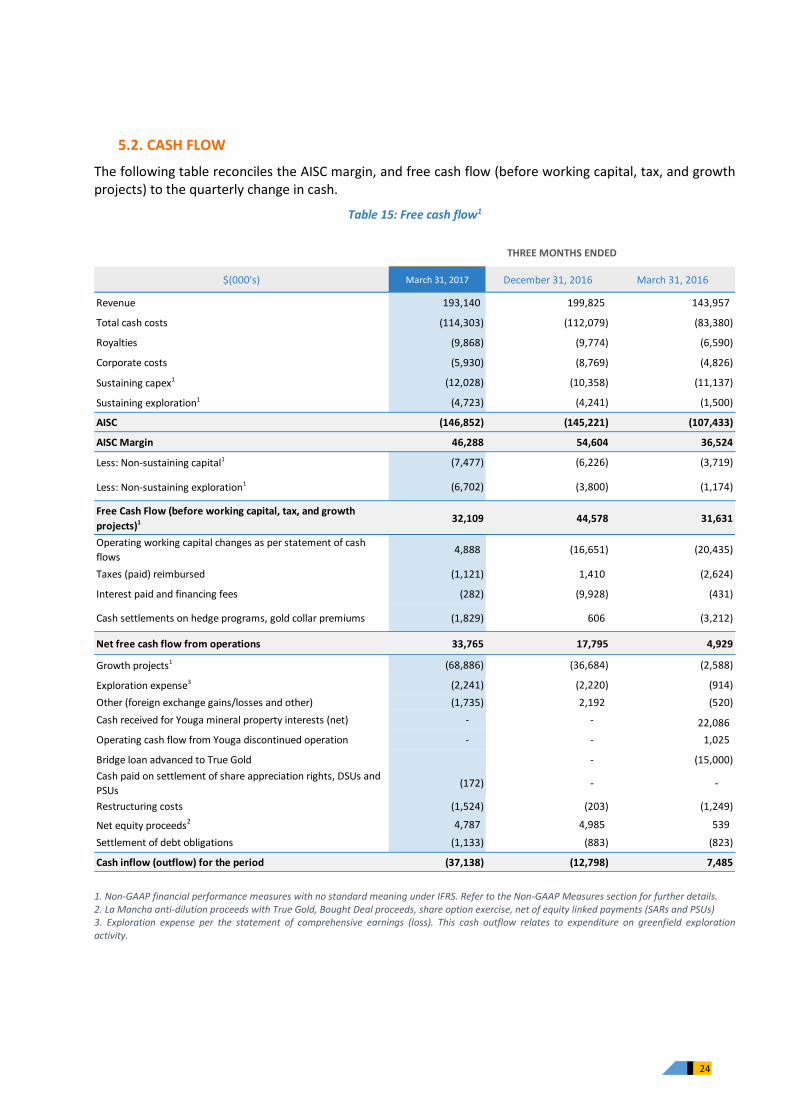
5.2. CASH FLOW
The following table reconciles the AISC margin, and free cash flow (before working capital, tax, and growth projects) to the quarterly change in cash.
Table 15: Free cash flow1
1. Non-GAAP financial performance measures with no standard meaning under IFRS. Refer to the Non-GAAP Measures section for further details. 2. La Mancha anti-dilution proceeds with True Gold, Bought Deal proceeds, share option exercise, net of equity linked payments (SARs and PSUs) 3. Exploration expense per the statement of comprehensive earnings (loss). This cash outflow relates to expenditure on greenfield exploration activity.
$(000's) March 31, 2017 December 31, 2016 March 31, 2016
Revenue 193,140 199,825 143,957
Total cash costs (114,303) (112,079) (83,380)
Royalties (9,868) (9,774) (6,590)
Corporate costs (5,930) (8,769) (4,826)
Sustaining capex1 (12,028) (10,358) (11,137)
Sustaining exploration1 (4,723) (4,241) (1,500)
AISC (146,852) (145,221) (107,433)
AISC Margin 46,288 54,604 36,524
Less: Non-sustaining capital1 (7,477) (6,226) (3,719)
Less: Non-sustaining exploration1 (6,702) (3,800) (1,174)
Free Cash Flow (before working capital, tax, and growth
projects)1 32,109 44,578 31,631
Operating working capital changes as per statement of cash
flows4,888 (16,651) (20,435)
Taxes (paid) reimbursed (1,121) 1,410 (2,624)
Interest paid and financing fees (282) (9,928) (431)
Cash settlements on hedge programs, gold collar premiums (1,829) 606 (3,212)
Net free cash flow from operations 33,765 17,795 4,929
Growth projects1 (68,886) (36,684) (2,588)
Exploration expense3 (2,241) (2,220) (914)
Other (foreign exchange gains/losses and other) (1,735) 2,192 (520)
Cash received for Youga mineral property interests (net) - - 22,086
Operating cash flow from Youga discontinued operation - - 1,025
Bridge loan advanced to True Gold - (15,000)
Cash paid on settlement of share appreciation rights, DSUs and
PSUs(172) - -
Restructuring costs (1,524) (203) (1,249)
Net equity proceeds2 4,787 4,985 539
Settlement of debt obligations (1,133) (883) (823)
Cash inflow (outflow) for the period (37,138) (12,798) 7,485
THREE MONTHS ENDED
25
› Free cash flow (before working capital, tax, and growth projects) for the three months ended March 31, 2017 was $32.1 million. The decrease from the three months ended December 31, 2016 is mainly due to the $6 million decrease in revenues related to lower production despite a higher gold price, along with a increase in cash costs and in the period after a record setting fourth quarter of 2016. Sustaining capital and exploration spend increased over the previous quarter. Non-sustaining capital increased due to planned capital purchases at Karma.
› Net free cash flow from current operations for the first quarter was $33.8 million compared to $17.8 million in the fourth quarter of 2016. The change is due to the operating working capital movements in the quarter, as well as a $9.7 million change in interest and financing fees and the $1.8 million cash settlement of gold collar premiums.
› Working Capital movements for the three months ending March 31, 2017 were positive $4.8 million mainly due to a $9.3 million increase in trade payables, offset by a $2.8 million increase in trade receivables.
› Cash settlements on hedge programs and gold collar programs were $1.8 million for the three months ending March 31, 2017. The decrease from the fourth quarter of 2016 is due to the change in gold price.
› Growth projects of $68.9 million consists of $58.6 million of Houndé construction costs, $8.1 million on Karma optimisation, and $2.2 million on the Ity CIL project.
› Restructuring costs of $1.5 million relate to costs incurred surrounding the corporate office relocation to London.
› Net cash outflow over the first quarter was $37.1 million compared to $12.8 million in the fourth quarter of 2016.
26
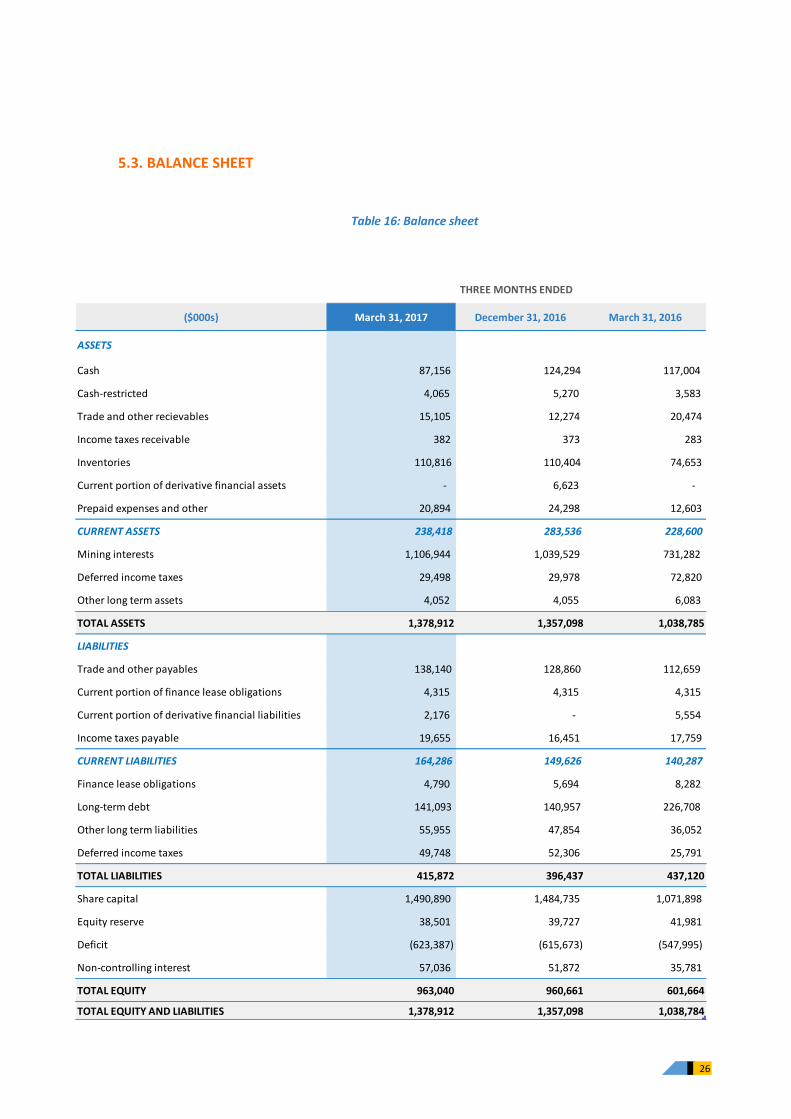
5.3. BALANCE SHEET
Table 16: Balance sheet
($000s) March 31, 2017 December 31, 2016 March 31, 2016
ASSETS
Cash 87,156 124,294 117,004
Cash-restricted 4,065 5,270 3,583
Trade and other recievables 15,105 12,274 20,474
Income taxes receivable 382 373 283
Inventories 110,816 110,404 74,653
Current portion of derivative financial assets - 6,623 -
Prepaid expenses and other 20,894 24,298 12,603
CURRENT ASSETS 238,418 283,536 228,600
Mining interests 1,106,944 1,039,529 731,282
Deferred income taxes 29,498 29,978 72,820
Other long term assets 4,052 4,055 6,083
TOTAL ASSETS 1,378,912 1,357,098 1,038,785
LIABILITIES
Trade and other payables 138,140 128,860 112,659
Current portion of finance lease obligations 4,315 4,315 4,315
Current portion of derivative financial liabilities 2,176 - 5,554
Income taxes payable 19,655 16,451 17,759
CURRENT LIABILITIES 164,286 149,626 140,287
Finance lease obligations 4,790 5,694 8,282
Long-term debt 141,093 140,957 226,708
Other long term liabilities 55,955 47,854 36,052
Deferred income taxes 49,748 52,306 25,791
TOTAL LIABILITIES 415,872 396,437 437,120
Share capital 1,490,890 1,484,735 1,071,898
Equity reserve 38,501 39,727 41,981
Deficit (623,387) (615,673) (547,995)
Non-controlling interest 57,036 51,872 35,781
TOTAL EQUITY 963,040 960,661 601,664
TOTAL EQUITY AND LIABILITIES 1,378,912 1,357,098 1,038,784
THREE MONTHS ENDED

27
Working Capital
The explanations for the key variances in working capital are as follows:
› Trade and other receivables were $15.1 million on March 31, 2017 compared to $12.3 million on December 31, 2016. The increase during the first quarter is due to the timing on VAT receivables, notably in Karma, expected to be recovered in the short term.
› Inventories were $110.8 million at March 31, 2017 which is consistent to $110.4 million at December 31, 2016.
› Prepaid expenses and other were $20.9 million at March 31, 2017 compared to $24.3 million at December 31, 2016. The $3.4 million decrease is expected as a fluctuation during the normal course of business.
› Trade and other payables were $138.1 million at March 31, 2017 compared to $128.9 million at December 31, 2016. The increase is mainly due to $14.2 million increase in payables at Karma, offset by a $5.1 million decrease in payables at the Houndé project.
Net Debt Position
The Corporation has a $350 million senior secured revolving corporate loan facility (the “Facility”) with a syndicate of leading international banks, which is scheduled to be repaid between September 2018 and March 2020. The interest rate is LIBOR plus a margin of between 3.75% and 5.75% per annum, based on the actual Net Debt to OEBITDA ratio. The Facility is secured by shares in the Corporation’s material gold mining subsidiaries and certain material assets and includes standard Interest Cover, Net Debt to OEBITDA and Minimum Tangible Net Worth covenants. The following table summarises the Corporation’s net debt position as at March 31, 2017, December 31, 2016, and at March 31, 2016.
Table 17: Net debt position
Equity and Capital
Endeavour Mining’s authorised capital is 200,000,000 shares divided into 100,000,000 ordinary shares with a par value of $0.10 each and 100,000,000 undesignated shares; no undesignated shares have been issued. The table below summarises Endeavour Mining’s share structure at March 31, 2017.
Table 18: Outstanding shares
As at May 8, 2017, the Corporation had 96,487,189 shares issued and outstanding, as well as 568,499 stock options outstanding.
$'(000's) March 31, 2017 December 31, 2016 March 31, 2016
Cash 87,156 124,294 117,004
Less: Equipment finance lease (9,105) (10,009) (12,597)
Less: Drawn portion of $350 million RCF (140,000) (140,000) (240,000)
Net Debt (61,949) (25,715) (135,593)
March 31, 2017 December 31, 2016 March 31, 2016
Shares issued and outstanding 93,879,706 93,546,349 59,122,842
Stock options 626,498 1,102,588 2,782,069

28
Project financing
Endeavour Mining announced in April that its 90%-owned Houndé Project in Burkina Faso has entered the construction phase of its development. This project is expected to require initial capital investment of $328 million, of which $154 million of cash costs were incurred up to March 31, 2017. The Corporation is financing the Houndé Project using a combination of existing cash balances, free cash flow generated from Endeavour’s existing operating mines and equipment financing arrangements. On June 9, 2016, the Corporation entered into a financing arrangement with the Komatsu Group to purchase mining fleet equipment for the Houndé project. The Corporation made an initial down-payment of $7.1 million on July 1, 2016. Delivery of the mining fleet commenced in the fourth quarter of 2016 with seventeen quarterly payments to be made between the first quarter of 2018 and the first quarter of 2022, totaling $46.9 million.
Financial instruments
In April 2016, the Corporation implemented a deferred premium collar strategy (“collar”) using written call options and bought put options for the 15-months period from April 2016 to June 2017. The program covers a total of 400,000 ounces, representing approximately 50% of Endeavour’s total estimated gold production for the period, with a floor price of $1,200 per ounce and ceiling price of $1,400 per ounce.
This derivative instrument was not designated as a hedge by the Corporation and is recorded at its fair value at the end of each reporting period with changes in fair value recorded in the consolidated comprehensive statement of earnings (loss).
As at March 31, 2017, 106,667 ounces remain outstanding under the Collar derivative liability which has a net fair value of $2.2 million (December 31, 2016 - $6.6 million net derivative asset). An unrealised loss of $8.8 million was recorded in the condensed interim consolidated statement of comprehensive (loss) earnings in the period ended March 31, 2017 on account of the gold price movement. The total premium payable for entering into the Collar was $9.2 million, and is included as part of the collar fair value, and is cash-settled on a net basis as monthly contracts mature. In the period ended March 31, 2017, the Corporation incurred $1.8 million in premium costs (Year-ended December 31, 2016 - $4.9 million), included in losses on derivative financial instruments in the condensed interim consolidated statements of comprehensive earnings. There have been no significant changes to the critical judgements and key sources of estimation uncertainty since December 31, 2016.
5.4. ACCOUNTING POLICIES
Accounting policies overview
These consolidated financial statements have been prepared in accordance with IFRS. The Corporation has evaluated the new and revised IFRS standards and determined there is no material impact on the condensed financial statements for the period ending March 31, 2017. These accounting standards are described in Note 2 of the condensed interim consolidated financial statements.
Critical judgements and key sources of estimation uncertainty
The Corporation’s management has made critical judgments and estimates in the process of applying the Corporation’s accounting policies to the consolidated financial statements that have significant effect on the amounts recognised in the Corporation’s condensed interim consolidated financial statements. These estimates include Value Added Tax, impairment of mining interests, mineral reserves, estimated recoverable ounces, environmental rehabilitation costs, deferred income taxes, share-based payments, and contingencies.
29
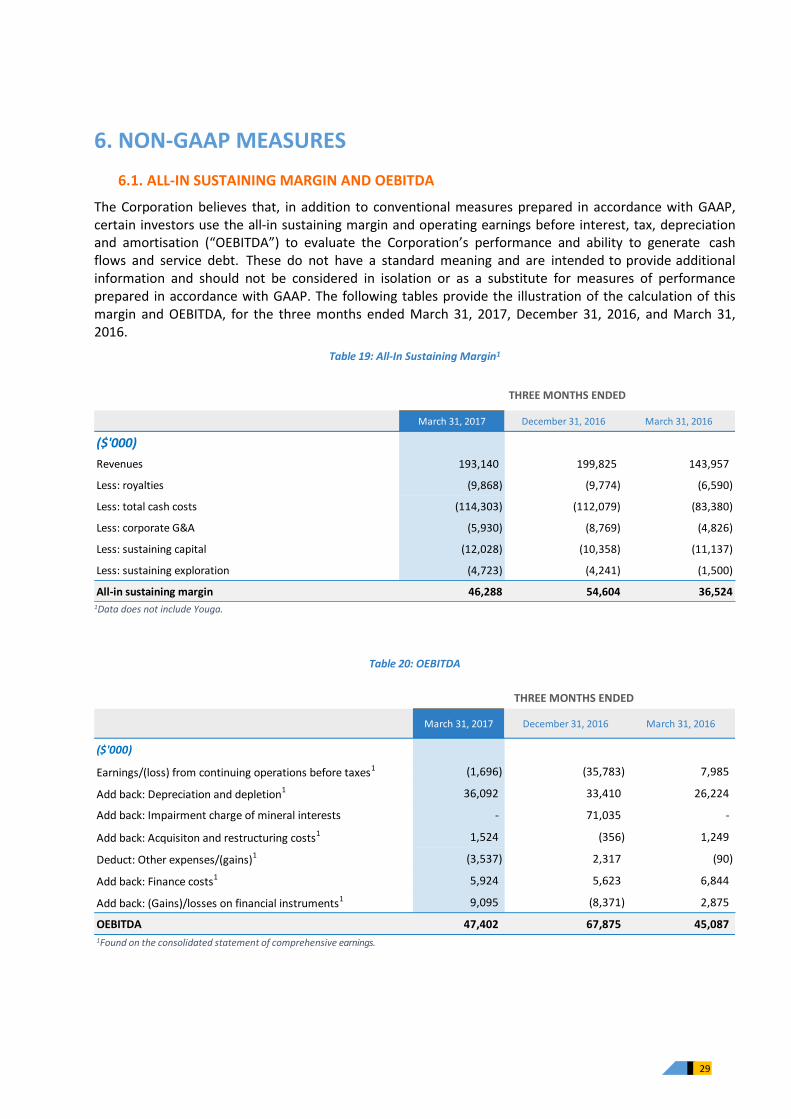
6. NON-GAAP MEASURES
6.1. ALL-IN SUSTAINING MARGIN AND OEBITDA
The Corporation believes that, in addition to conventional measures prepared in accordance with GAAP, certain investors use the all-in sustaining margin and operating earnings before interest, tax, depreciation and amortisation (“OEBITDA”) to evaluate the Corporation’s performance and ability to generate cash flows and service debt. These do not have a standard meaning and are intended to provide additional information and should not be considered in isolation or as a substitute for measures of performance prepared in accordance with GAAP. The following tables provide the illustration of the calculation of this margin and OEBITDA, for the three months ended March 31, 2017, December 31, 2016, and March 31, 2016.
Table 19: All-In Sustaining Margin1
1Data does not include Youga.
Table 20: OEBITDA
1Found on the consolidated statement of comprehensive earnings.
March 31, 2017 December 31, 2016 March 31, 2016
($'000)
Revenues 193,140 199,825 143,957
Less: royalties (9,868) (9,774) (6,590)
Less: total cash costs (114,303) (112,079) (83,380)
Less: corporate G&A (5,930) (8,769) (4,826)
Less: sustaining capital (12,028) (10,358) (11,137)
Less: sustaining exploration (4,723) (4,241) (1,500)
All-in sustaining margin 46,288 54,604 36,524
THREE MONTHS ENDED
March 31, 2017 December 31, 2016 March 31, 2016
($'000)
Earnings/(loss) from continuing operations before taxes1 (1,696) (35,783) 7,985
Add back: Depreciation and depletion1 36,092 33,410 26,224
Add back: Impairment charge of mineral interests - 71,035 -
Add back: Acquisiton and restructuring costs1 1,524 (356) 1,249
Deduct: Other expenses/(gains)1 (3,537) 2,317 (90)
Add back: Finance costs1 5,924 5,623 6,844
Add back: (Gains)/losses on financial instruments1 9,095 (8,371) 2,875
OEBITDA 47,402 67,875 45,087
THREE MONTHS ENDED
30
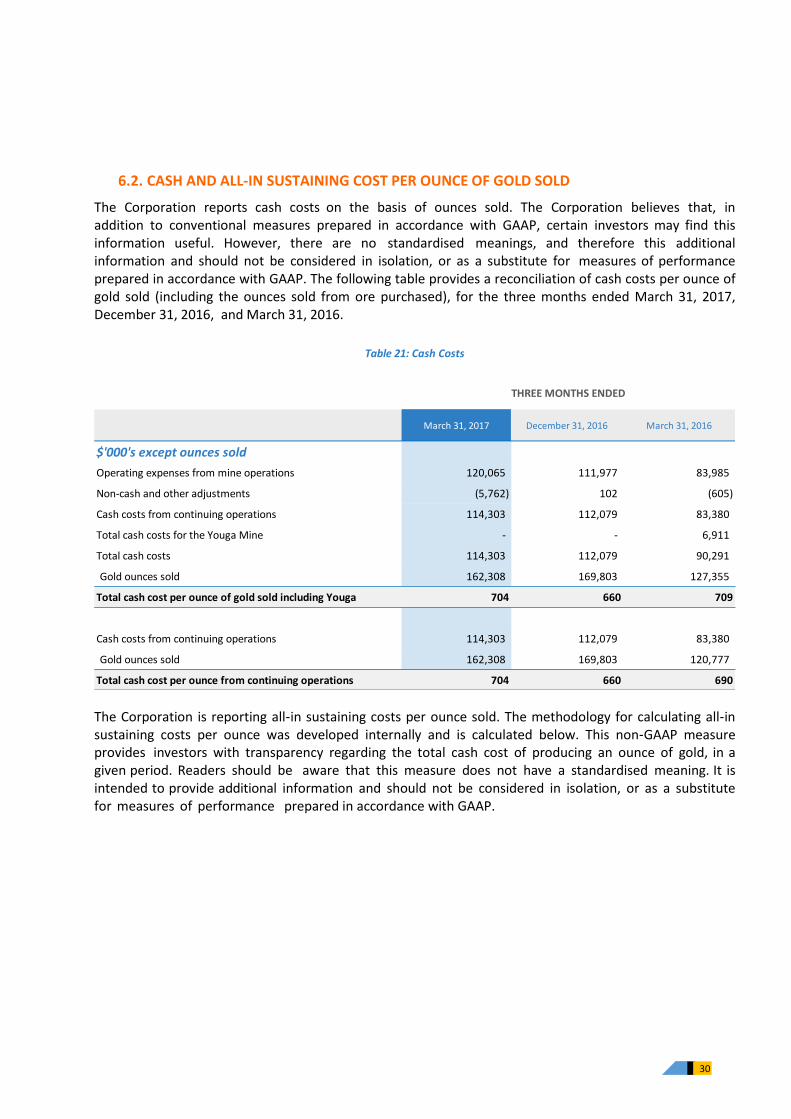
6.2. CASH AND ALL-IN SUSTAINING COST PER OUNCE OF GOLD SOLD
The Corporation reports cash costs on the basis of ounces sold. The Corporation believes that, in addition to conventional measures prepared in accordance with GAAP, certain investors may find this information useful. However, there are no standardised meanings, and therefore this additional information and should not be considered in isolation, or as a substitute for measures of performance prepared in accordance with GAAP. The following table provides a reconciliation of cash costs per ounce of gold sold (including the ounces sold from ore purchased), for the three months ended March 31, 2017, December 31, 2016, and March 31, 2016.
Table 21: Cash Costs
The Corporation is reporting all‐in sustaining costs per ounce sold. The methodology for calculating all‐in sustaining costs per ounce was developed internally and is calculated below. This non‐GAAP measure provides investors with transparency regarding the total cash cost of producing an ounce of gold, in a given period. Readers should be aware that this measure does not have a standardised meaning. It is intended to provide additional information and should not be considered in isolation, or as a substitute for measures of performance prepared in accordance with GAAP.
March 31, 2017 December 31, 2016 March 31, 2016
$'000's except ounces sold
Operating expenses from mine operations 120,065 111,977 83,985
Non-cash and other adjustments (5,762) 102 (605)
Cash costs from continuing operations 114,303 112,079 83,380
Total cash costs for the Youga Mine - - 6,911
Total cash costs 114,303 112,079 90,291
Gold ounces sold 162,308 169,803 127,355
Total cash cost per ounce of gold sold including Youga 704 660 709
Cash costs from continuing operations 114,303 112,079 83,380
Gold ounces sold 162,308 169,803 120,777
Total cash cost per ounce from continuing operations 704 660 690
THREE MONTHS ENDED
31
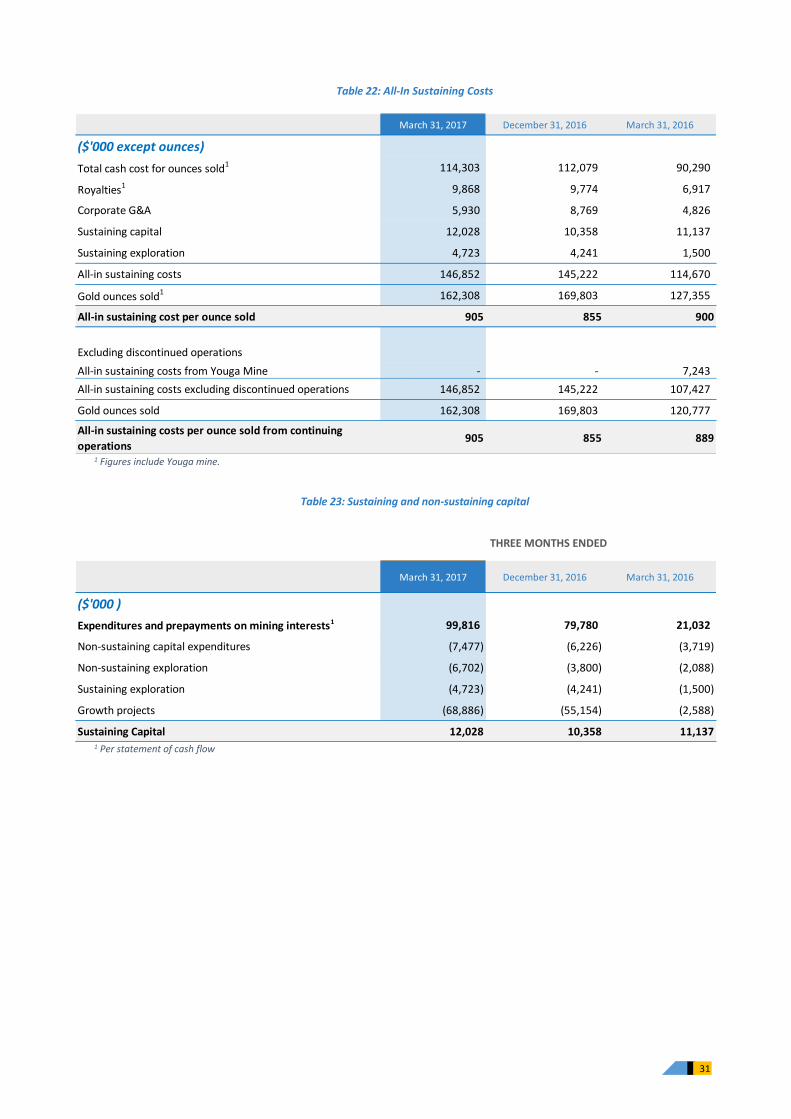
Table 22: All-In Sustaining Costs
1 Figures include Youga mine.
Table 23: Sustaining and non-sustaining capital
1 Per statement of cash flow
March 31, 2017 December 31, 2016 March 31, 2016
($'000 except ounces)
Total cash cost for ounces sold1 114,303 112,079 90,290
Royalties1 9,868 9,774 6,917
Corporate G&A 5,930 8,769 4,826
Sustaining capital 12,028 10,358 11,137
Sustaining exploration 4,723 4,241 1,500
All-in sustaining costs 146,852 145,222 114,670
Gold ounces sold1 162,308 169,803 127,355
All-in sustaining cost per ounce sold 905 855 900
Excluding discontinued operations
All-in sustaining costs from Youga Mine - - 7,243
All-in sustaining costs excluding discontinued operations 146,852 145,222 107,427
Gold ounces sold 162,308 169,803 120,777
All-in sustaining costs per ounce sold from continuing
operations905 855 889
March 31, 2017 December 31, 2016 March 31, 2016
($'000 )
Expenditures and prepayments on mining interests1 99,816 79,780 21,032
Non-sustaining capital expenditures (7,477) (6,226) (3,719)
Non-sustaining exploration (6,702) (3,800) (2,088)
Sustaining exploration (4,723) (4,241) (1,500)
Growth projects (68,886) (55,154) (2,588)
Sustaining Capital 12,028 10,358 11,137
THREE MONTHS ENDED
32
6.3. ADJUSTED NET EARNINGS AND ADJUSTED NET EARNINGS PER SHARE
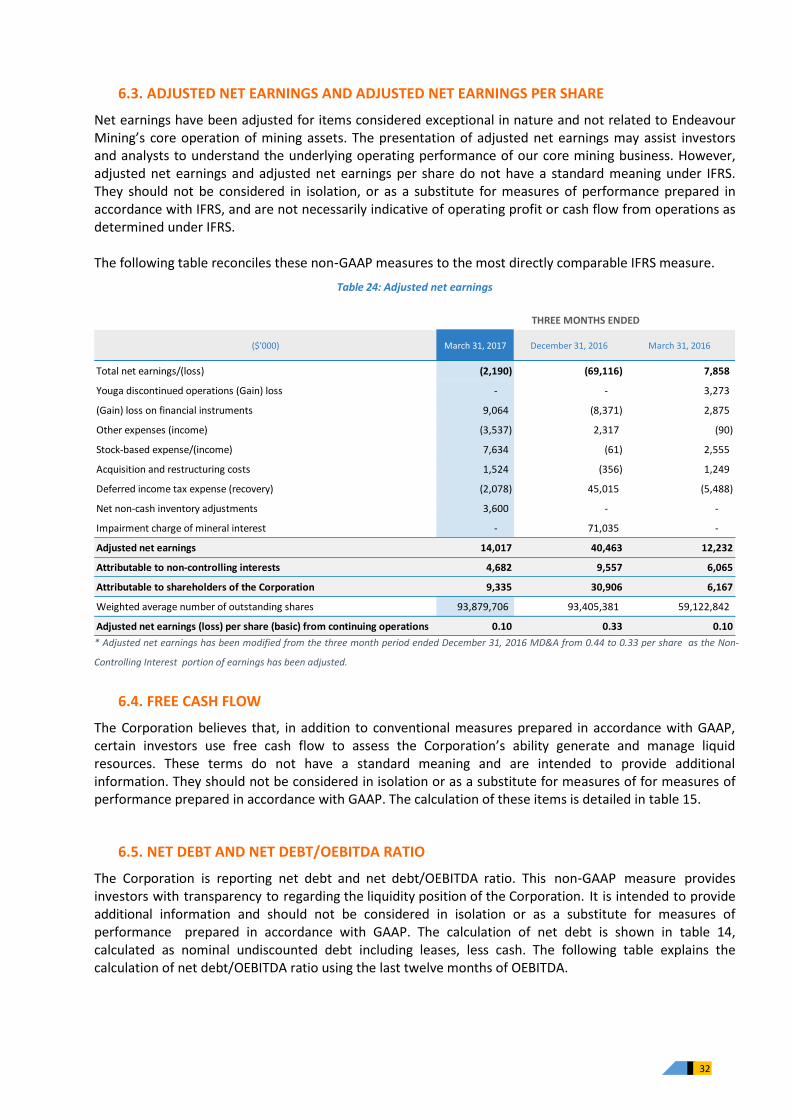
Net earnings have been adjusted for items considered exceptional in nature and not related to Endeavour Mining’s core operation of mining assets. The presentation of adjusted net earnings may assist investors and analysts to understand the underlying operating performance of our core mining business. However, adjusted net earnings and adjusted net earnings per share do not have a standard meaning under IFRS. They should not be considered in isolation, or as a substitute for measures of performance prepared in accordance with IFRS, and are not necessarily indicative of operating profit or cash flow from operations as determined under IFRS. The following table reconciles these non‐GAAP measures to the most directly comparable IFRS measure.
Table 24: Adjusted net earnings
* Adjusted net earnings has been modified from the three month period ended December 31, 2016 MD&A from 0.44 to 0.33 per share as the Non-
Controlling Interest portion of earnings has been adjusted.
6.4. FREE CASH FLOW
The Corporation believes that, in addition to conventional measures prepared in accordance with GAAP, certain investors use free cash flow to assess the Corporation’s ability generate and manage liquid resources. These terms do not have a standard meaning and are intended to provide additional information. They should not be considered in isolation or as a substitute for measures of for measures of performance prepared in accordance with GAAP. The calculation of these items is detailed in table 15.
6.5. NET DEBT AND NET DEBT/OEBITDA RATIO
The Corporation is reporting net debt and net debt/OEBITDA ratio. This non‐GAAP measure provides investors with transparency to regarding the liquidity position of the Corporation. It is intended to provide additional information and should not be considered in isolation or as a substitute for measures of performance prepared in accordance with GAAP. The calculation of net debt is shown in table 14, calculated as nominal undiscounted debt including leases, less cash. The following table explains the calculation of net debt/OEBITDA ratio using the last twelve months of OEBITDA.
($'000) March 31, 2017 December 31, 2016 March 31, 2016
Total net earnings/(loss) (2,190) (69,116) 7,858
Youga discontinued operations (Gain) loss - - 3,273
(Gain) loss on financial instruments 9,064 (8,371) 2,875
Other expenses (income) (3,537) 2,317 (90)
Stock-based expense/(income) 7,634 (61) 2,555
Acquisition and restructuring costs 1,524 (356) 1,249
Deferred income tax expense (recovery) (2,078) 45,015 (5,488)
Net non-cash inventory adjustments 3,600 - -
Impairment charge of mineral interest - 71,035 -
Adjusted net earnings 14,017 40,463 12,232
Attributable to non-controlling interests 4,682 9,557 6,065
Attributable to shareholders of the Corporation 9,335 30,906 6,167
Weighted average number of outstanding shares 93,879,706 93,405,381 59,122,842
Adjusted net earnings (loss) per share (basic) from continuing operations 0.10 0.33 0.10
THREE MONTHS ENDED
33
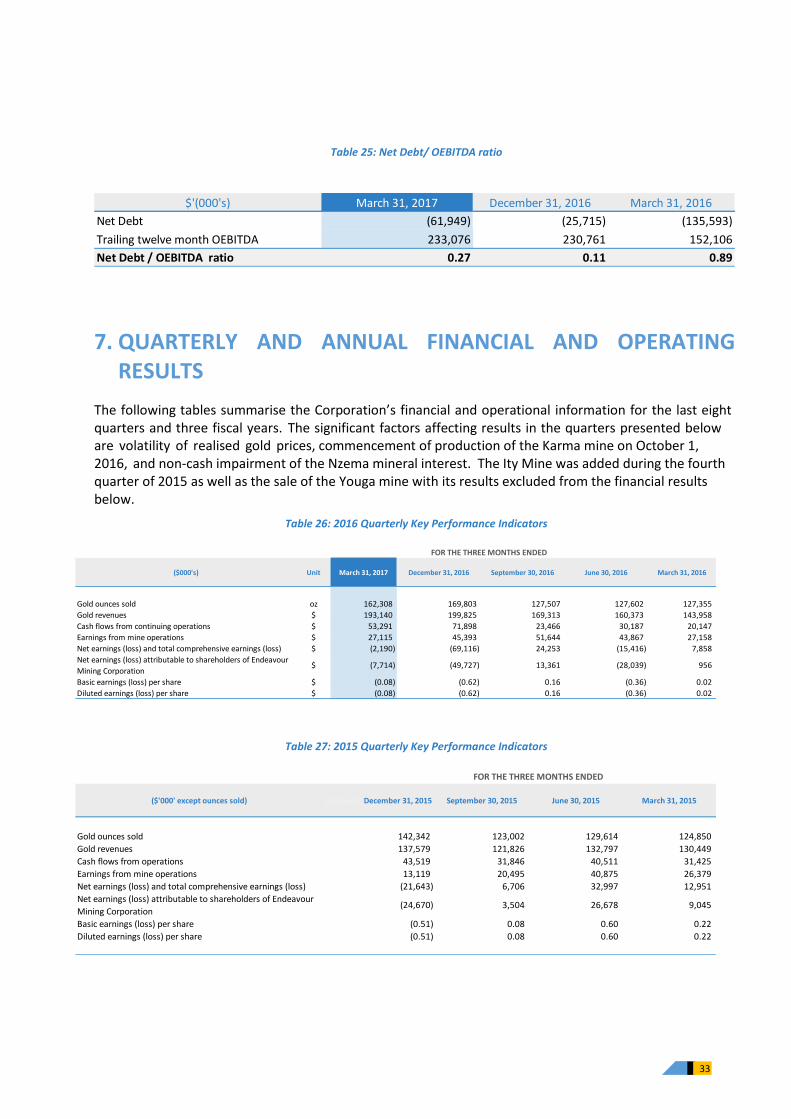
Table 25: Net Debt/ OEBITDA ratio
7. QUARTERLY AND ANNUAL FINANCIAL AND OPERATING RESULTS
The following tables summarise the Corporation’s financial and operational information for the last eight quarters and three fiscal years. The significant factors affecting results in the quarters presented below are volatility of realised gold prices, commencement of production of the Karma mine on October 1, 2016, and non-cash impairment of the Nzema mineral interest. The Ity Mine was added during the fourth quarter of 2015 as well as the sale of the Youga mine with its results excluded from the financial results below.
Table 26: 2016 Quarterly Key Performance Indicators
Table 27: 2015 Quarterly Key Performance Indicators
$'(000's) March 31, 2017 December 31, 2016 March 31, 2016
Net Debt (61,949) (25,715) (135,593)
Trailing twelve month OEBITDA 233,076 230,761 152,106
Net Debt / OEBITDA ratio 0.27 0.11 0.89
($000's) Unit March 31, 2017 December 31, 2016 September 30, 2016 June 30, 2016 March 31, 2016
Gold ounces sold oz 162,308 169,803 127,507 127,602 127,355
Gold revenues $ 193,140 199,825 169,313 160,373 143,958
Cash flows from continuing operations $ 53,291 71,898 23,466 30,187 20,147
Earnings from mine operations $ 27,115 45,393 51,644 43,867 27,158
Net earnings (loss) and total comprehensive earnings (loss) $ (2,190) (69,116) 24,253 (15,416) 7,858
Net earnings (loss) attributable to shareholders of Endeavour
Mining Corporation$ (7,714) (49,727) 13,361 (28,039) 956
Basic earnings (loss) per share $ (0.08) (0.62) 0.16 (0.36) 0.02
Diluted earnings (loss) per share $ (0.08) (0.62) 0.16 (0.36) 0.02
FOR THE THREE MONTHS ENDED
($'000' except ounces sold) Colonne2 December 31, 2015 September 30, 2015 June 30, 2015 March 31, 2015
Gold ounces sold 142,342 123,002 129,614 124,850
Gold revenues 137,579 121,826 132,797 130,449
Cash flows from operations 43,519 31,846 40,511 31,425
Earnings from mine operations 13,119 20,495 40,875 26,379
Net earnings (loss) and total comprehensive earnings (loss) (21,643) 6,706 32,997 12,951
Net earnings (loss) attributable to shareholders of Endeavour
Mining Corporation(24,670) 3,504 26,678 9,045
Basic earnings (loss) per share (0.51) 0.08 0.60 0.22
Diluted earnings (loss) per share (0.51) 0.08 0.60 0.22
FOR THE THREE MONTHS ENDED
34
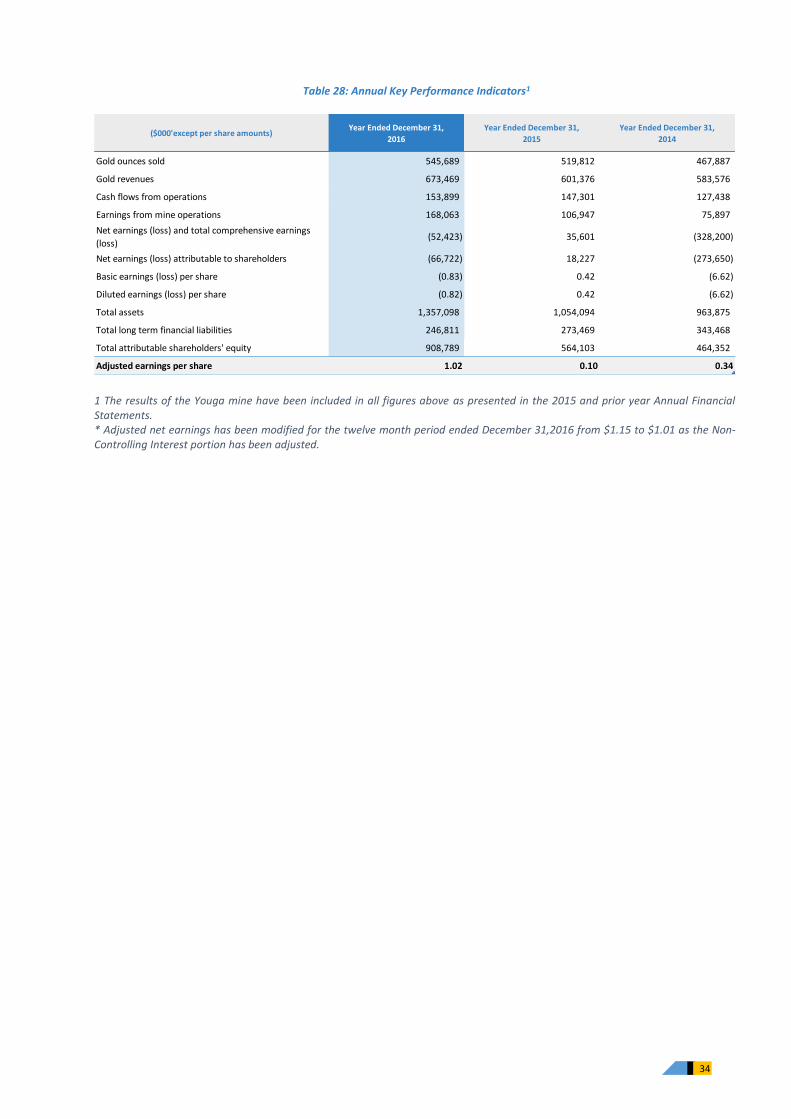
Table 28: Annual Key Performance Indicators1
1 The results of the Youga mine have been included in all figures above as presented in the 2015 and prior year Annual Financial Statements. * Adjusted net earnings has been modified for the twelve month period ended December 31,2016 from $1.15 to $1.01 as the Non-Controlling Interest portion has been adjusted.
($000'except per share amounts)Year Ended December 31,
2016
Year Ended December 31,
2015
Year Ended December 31,
2014
Gold ounces sold 545,689 519,812 467,887
Gold revenues 673,469 601,376 583,576
Cash flows from operations 153,899 147,301 127,438
Earnings from mine operations 168,063 106,947 75,897
Net earnings (loss) and total comprehensive earnings
(loss)(52,423) 35,601 (328,200)
Net earnings (loss) attributable to shareholders (66,722) 18,227 (273,650)
Basic earnings (loss) per share (0.83) 0.42 (6.62)
Diluted earnings (loss) per share (0.82) 0.42 (6.62)
Total assets 1,357,098 1,054,094 963,875
Total long term financial liabilities 246,811 273,469 343,468
Total attributable shareholders' equity 908,789 564,103 464,352
Adjusted earnings per share 1.02 0.10 0.34
35
8. RISK FACTORS
Readers of this Management’s Discussion and Analysis should give careful consideration to the information included or incorporated by reference in this document and the Corporation’s financial statements and related notes for the period ending March 31, 2017. Significant risk factors for the Corporation are metal prices, government regulations, foreign operations, environmental compliance, dependence on management, title to the Corporation’s mineral properties and litigation. For further details of risk factors, please refer to the most recent Annual Information Form filed on SEDAR at
http://www.sedar.com/, the 2016 year-end audited consolidated financial statements, and the below discussions.
8.1. OPERATIONAL RISKS
Political and Security Risks
The majority of Endeavour Mining's assets are located in West Africa. Endeavour Mining believes that the governments of the countries that the Corporation holds assets in support the development of their natural resources by foreign companies. There is no assurance however that future political and economic conditions of these countries will not result in their governments adopting different policies respecting foreign ownership of mineral resources, taxation, rates of exchange, environmental protection, labour relations, repatriation of income or return of capital, restrictions on production, price controls, export controls, local beneficiation of gold production, expropriation of property, foreign investment, maintenance of claims and mine safety. The possibility that a future government in any of these countries may adopt substantially different policies, which might include the expropriation of assets, cannot be ruled out. There is also a risk of limitations being placed on the ability to repatriate funds. The Corporation’s operating assets are well diversified across four West African jurisdictions. Following regional instability in recent years in several sub-Saharan countries, the prevailing security environment in the region deteriorated due to the influence of secessionist and Islamist groups; the Corporation has responded by enhancing its operating procedures for the security of its assets, personnel and contractors. The Corporation cooperates with regional governments, their security forces and third parties to manage the risks relating to the heightened security challenges. Despite its proactive approach to security and cooperation, and its enhanced operating procedures, there can be no certainty that these measures will be sufficient in all circumstances to guarantee the security of all assets, personnel and contractors from these types of risks.
Mineral Reserves and Resources
Mineral reserve and mineral resource estimates are imprecise and depend partially on statistical inference drawn from drilling and other data, which may prove to be unreliable. Estimates, which were valid when made, may change over the course of the mine life . Reserves should not be interpreted as assurances of mine life or of the profitability of current or future production. Furthermore there can be no assurance that those portions of such mineral resources that are not mineral reserves will ultimately be converted into mineral reserves. Mineral resources which are not mineral reserves do not have demonstrated economic viability. Mining reserves depleted by production must be continually replaced to maintain production levels over the long term. There is no assurance that current or future exploration programs will result in any new commercial mining operations or yield new reserves to replace or expand current reserves.
Outside contractor risks
It is common for certain aspects of mining operations, such as drilling, blasting and hauling to be conducted by an outside contractor. The mining operations at the Nzema Gold Mine and the Agbaou Gold Mine are undertaken by contactors and as a result, the Corporation is subject to a number of

36
risks, including reduced control over the aspects of the operations that are the responsibility of the contractor, failure of a contractor to perform under its agreement with the companies, inability to replace the contractor if either party terminates the contract, interruption of operations in the event the contractor ceases operations due to insolvency or other unforeseen events, failure of the contractor to comply with applicable legal and regulatory requirements and failure of the contractor to properly manage its workforce resulting in labour unrest or other employment issues.
8.2. FINANCIAL RISKS
The Corporation’s activities expose it to a variety of risks that may include currency risk, credit risk, liquidity risk, interest rate risk and other price risks, including equity price risk. The Corporation examines the various financial instrument risks to which it is exposed and assesses any impact and likelihood of those risks.
Credit risk
Credit risk is the risk that the counterparty to a financial instrument will cause a financial loss for the Corporation by failing to discharge its obligations. There has been no change in the Corporation’s objectives and policies for managing this risk in the quarter ended March 31, 2017. The Corporation’s maximum exposure to credit risk is as follows:
Table 29: Exposure to credit risk
Liquidity risk
Liquidity risk is the risk that the Corporation will encounter difficulty in meeting obligations associated with its financial liabilities that are settled by delivering cash or another financial asset. The Corporation has a planning and budgeting process in place to help determine the funds required to support the Corporation’s normal operating requirements.
Currency risk
Currency risk relates to the risk that the fair values or future cash flows of the Corporation’s financial instruments will fluctuate because of changes in foreign exchange rates. Exchange rate fluctuations may affect the costs that the Corporation incurs in its operations including its capital expenditures. Gold is sold in US dollars and the Corporation’s costs are incurred principally in CFA Franc, Canadian dollars, Euros, Ghana Cedi, and US dollars. The Corporation also holds cash and cash equivalents, marketable securities, and other receivables that are denominated in non-US dollar currencies which are subject to currency risk. The Corporation has not hedged its exposure to foreign currency exchange risk. The Corporation has not hedged its exposure to foreign currency exchange risk. The table below highlights the net assets (liabilities) held in foreign currencies:
March 31, 2017 December 31, 2016 March 31, 2016
($'000 )Cash and cash equivalents 87,156 124,294 117,004
Cash - restricted 4,065 5,270 3,583
Marketable securities 492 506 452
Trade and other receivables 15,105 12,274 5,474
Loan receivable - - 15,000
Working capital loan 1,025 1,012 1,025
Long-term receivable 262 278 293
108,105 143,634 142,831
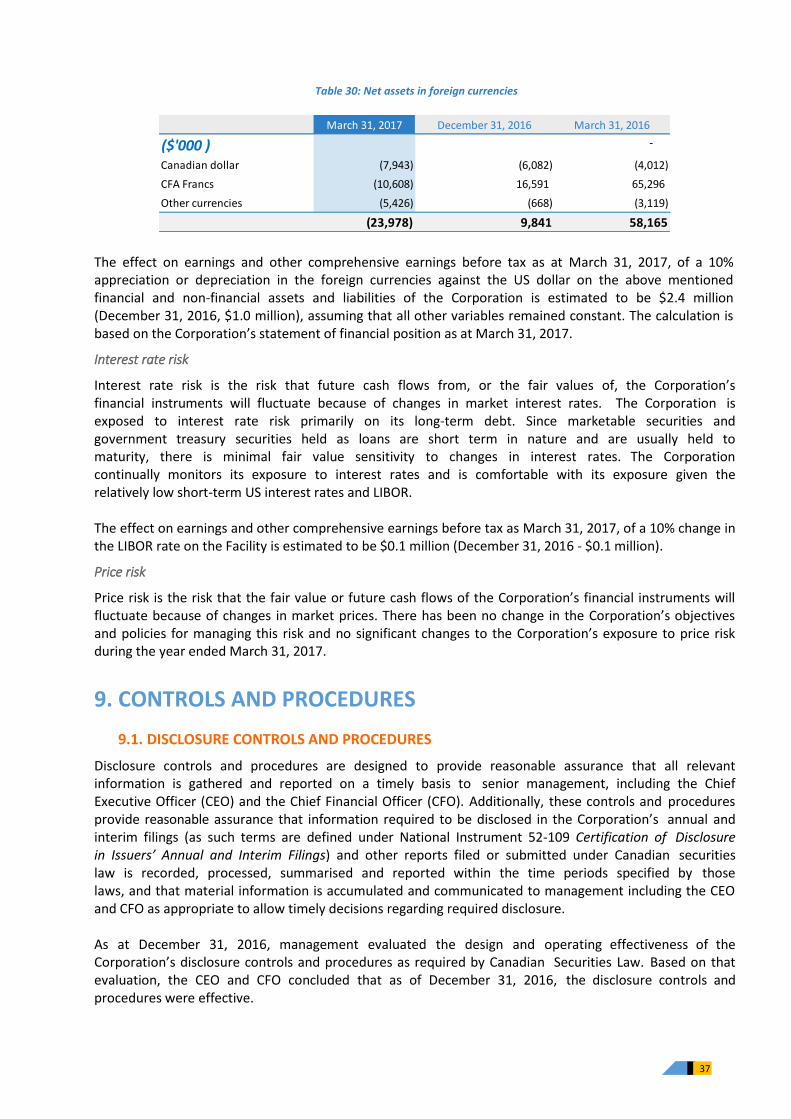
37
March 31, 2017 December 31, 2016 March 31, 2016
($'000 ) -
Canadian dollar (7,943) (6,082) (4,012)
CFA Francs (10,608) 16,591 65,296
Other currencies (5,426) (668) (3,119)
(23,978) 9,841 58,165
Table 30: Net assets in foreign currencies
The effect on earnings and other comprehensive earnings before tax as at March 31, 2017, of a 10% appreciation or depreciation in the foreign currencies against the US dollar on the above mentioned financial and non-financial assets and liabilities of the Corporation is estimated to be $2.4 million (December 31, 2016, $1.0 million), assuming that all other variables remained constant. The calculation is based on the Corporation’s statement of financial position as at March 31, 2017.
Interest rate risk
Interest rate risk is the risk that future cash flows from, or the fair values of, the Corporation’s financial instruments will fluctuate because of changes in market interest rates. The Corporation is exposed to interest rate risk primarily on its long-term debt. Since marketable securities and government treasury securities held as loans are short term in nature and are usually held to maturity, there is minimal fair value sensitivity to changes in interest rates. The Corporation continually monitors its exposure to interest rates and is comfortable with its exposure given the relatively low short-term US interest rates and LIBOR. The effect on earnings and other comprehensive earnings before tax as March 31, 2017, of a 10% change in the LIBOR rate on the Facility is estimated to be $0.1 million (December 31, 2016 - $0.1 million).
Price risk
Price risk is the risk that the fair value or future cash flows of the Corporation’s financial instruments will fluctuate because of changes in market prices. There has been no change in the Corporation’s objectives and policies for managing this risk and no significant changes to the Corporation’s exposure to price risk during the year ended March 31, 2017.
9. CONTROLS AND PROCEDURES
9.1. DISCLOSURE CONTROLS AND PROCEDURES
Disclosure controls and procedures are designed to provide reasonable assurance that all relevant information is gathered and reported on a timely basis to senior management, including the Chief Executive Officer (CEO) and the Chief Financial Officer (CFO). Additionally, these controls and procedures provide reasonable assurance that information required to be disclosed in the Corporation’s annual and interim filings (as such terms are defined under National Instrument 52-109 Certification of Disclosure in Issuers’ Annual and Interim Filings) and other reports filed or submitted under Canadian securities law is recorded, processed, summarised and reported within the time periods specified by those laws, and that material information is accumulated and communicated to management including the CEO and CFO as appropriate to allow timely decisions regarding required disclosure. As at December 31, 2016, management evaluated the design and operating effectiveness of the Corporation’s disclosure controls and procedures as required by Canadian Securities Law. Based on that evaluation, the CEO and CFO concluded that as of December 31, 2016, the disclosure controls and procedures were effective.
38
There have been no material changes in the Corporation’s disclosure controls and procedures since the year ended December 31, 2016 that have materially affected, or are reasonably likely to materially affect, the Corporation’s public disclosures.
9.2. INTERNAL CONTROLS OVER FINANCIAL REPORTING
The Corporation’s management, with the participation of its CEO and CFO, is responsible for establishing and maintaining adequate internal controls over financial reporting. Under the supervision of the CFO, the Corporation’s internal controls over financial reporting are designed to provide reasonable assurance regarding the reliability of financial reporting and the preparation of financial statements for external purposes in accordance with IFRS. As at December 31, 2016, management evaluated the effectiveness of the Corporation’s internal control over financial reporting as required by Canadian securities laws. Based on that evaluation of internal control over financial reporting, the CEO and CFO have concluded that, as at December 31, 2016, the internal controls over financial reporting were effective and able to provide reasonable assurance regarding the reliability of financial reporting and the preparation of financial statements for external purposes in accordance with IFRS. There have been no material changes in the Corporation’s internal controls over financial reporting since the year ended December 31, 2016 that have materially affected, or are reasonably likely to materially affect the Corporation’s internal controls over financial reporting.
9.3. LIMITATIONS OF CONTROLS AND PROCEDURES
The Corporation’s management, including the Chief Executive Officer and Chief Financial Officer believe that any disclosure controls and procedures or internal control over financial reporting, can provide only reasonable, but not absolute, assurance that the objectives of the control system are met. These inherent limitations include the realities that judgments in decision making can be faulty, and that breakdowns can occur because of simple error or mistake. Additionally, controls can be circumvented by the actions of one individual, by collusion of two or more people, or by unauthorised override of the control. Accordingly, because of the inherent limitations in a control system, misstatements due to error or fraud may occur and not be detected. The Corporation was unable to conduct an assessment of the Karma Gold Mine’s internal control over financial reporting in the period between the acquisition date and the date of management’s internal control assessment due to the timing of the acquisition. Accordingly, management excluded from its assessment the internal control over financial reporting of the Karma Gold Mine, which was acquired on April 26, 2016 as permitted under National Instrument 52-109 Certification of Disclosure. The Corporation will include its assessment of the Karma Gold Mine’s internal control over financial reporting in its 2017 annual management report on internal control.
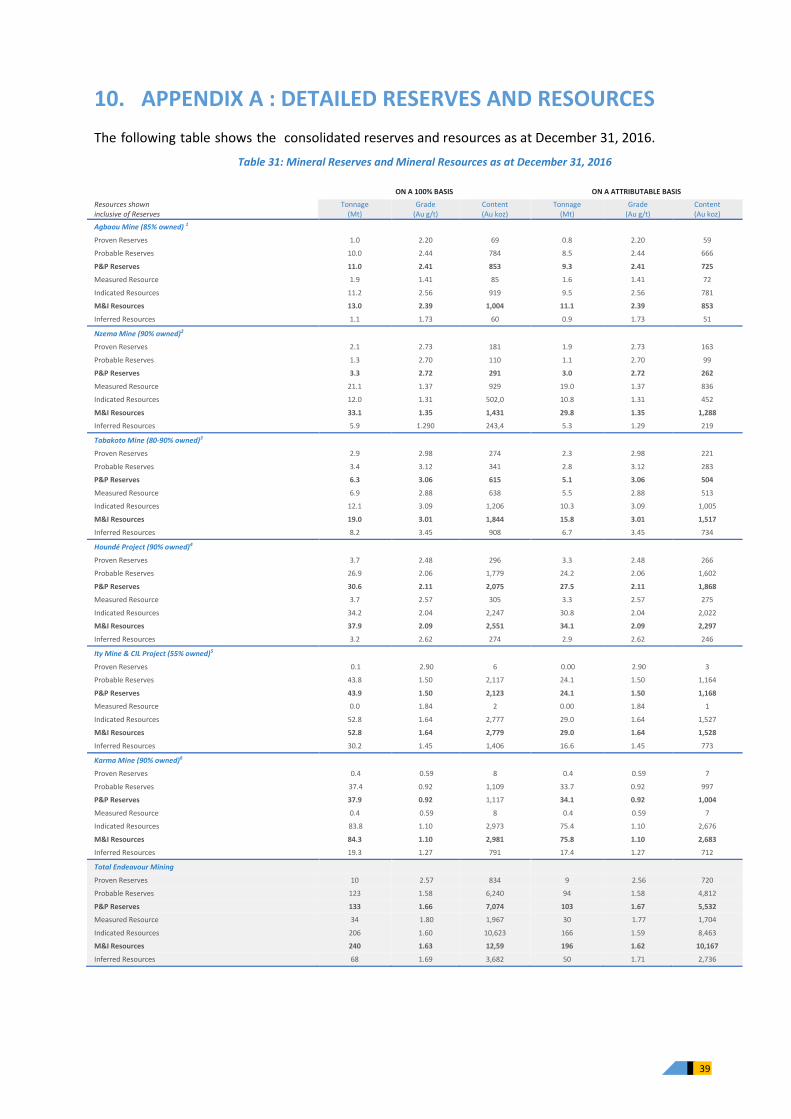
39
10. APPENDIX A : DETAILED RESERVES AND RESOURCES
The following table shows the consolidated reserves and resources as at December 31, 2016.
Table 31: Mineral Reserves and Mineral Resources as at December 31, 2016
ON A 100% BASIS ON A ATTRIBUTABLE BASIS
Resources shown inclusive of Reserves
Tonnage (Mt)
Grade (Au g/t)
Content (Au koz)
Tonnage (Mt)
Grade (Au g/t)
Content (Au koz)
Agbaou Mine (85% owned) 1
Proven Reserves 1.0 2.20 69 0.8 2.20 59
Probable Reserves 10.0 2.44 784 8.5 2.44 666
P&P Reserves 11.0 2.41 853 9.3 2.41 725
Measured Resource 1.9 1.41 85 1.6 1.41 72
Indicated Resources 11.2 2.56 919 9.5 2.56 781
M&I Resources 13.0 2.39 1,004 11.1 2.39 853
Inferred Resources 1.1 1.73 60 0.9 1.73 51
Nzema Mine (90% owned)2
Proven Reserves 2.1 2.73 181 1.9 2.73 163
Probable Reserves 1.3 2.70 110 1.1 2.70 99
P&P Reserves 3.3 2.72 291 3.0 2.72 262
Measured Resource 21.1 1.37 929 19.0 1.37 836
Indicated Resources 12.0 1.31 502,0 10.8 1.31 452
M&I Resources 33.1 1.35 1,431 29.8 1.35 1,288
Inferred Resources 5.9 1.290 243,4 5.3 1.29 219
Tabakoto Mine (80-90% owned)3
Proven Reserves 2.9 2.98 274 2.3 2.98 221
Probable Reserves 3.4 3.12 341 2.8 3.12 283
P&P Reserves 6.3 3.06 615 5.1 3.06 504
Measured Resource 6.9 2.88 638 5.5 2.88 513
Indicated Resources 12.1 3.09 1,206 10.3 3.09 1,005
M&I Resources 19.0 3.01 1,844 15.8 3.01 1,517
Inferred Resources 8.2 3.45 908 6.7 3.45 734
Houndé Project (90% owned)4
Proven Reserves 3.7 2.48 296 3.3 2.48 266
Probable Reserves 26.9 2.06 1,779 24.2 2.06 1,602
P&P Reserves 30.6 2.11 2,075 27.5 2.11 1,868
Measured Resource 3.7 2.57 305 3.3 2.57 275
Indicated Resources 34.2 2.04 2,247 30.8 2.04 2,022
M&I Resources 37.9 2.09 2,551 34.1 2.09 2,297
Inferred Resources 3.2 2.62 274 2.9 2.62 246
Ity Mine & CIL Project (55% owned)5
Proven Reserves 0.1 2.90 6 0.00 2.90 3
Probable Reserves 43.8 1.50 2,117 24.1 1.50 1,164
P&P Reserves 43.9 1.50 2,123 24.1 1.50 1,168
Measured Resource 0.0 1.84 2 0.00 1.84 1
Indicated Resources 52.8 1.64 2,777 29.0 1.64 1,527
M&I Resources 52.8 1.64 2,779 29.0 1.64 1,528
Inferred Resources 30.2 1.45 1,406 16.6 1.45 773
Karma Mine (90% owned)6
Proven Reserves 0.4 0.59 8 0.4 0.59 7
Probable Reserves 37.4 0.92 1,109 33.7 0.92 997
P&P Reserves 37.9 0.92 1,117 34.1 0.92 1,004
Measured Resource 0.4 0.59 8 0.4 0.59 7
Indicated Resources 83.8 1.10 2,973 75.4 1.10 2,676
M&I Resources 84.3 1.10 2,981 75.8 1.10 2,683
Inferred Resources 19.3 1.27 791 17.4 1.27 712
Total Endeavour Mining
Proven Reserves 10 2.57 834 9 2.56 720
Probable Reserves 123 1.58 6,240 94 1.58 4,812
P&P Reserves 133 1.66 7,074 103 1.67 5,532
Measured Resource 34 1.80 1,967 30 1.77 1,704
Indicated Resources 206 1.60 10,623 166 1.59 8,463
M&I Resources 240 1.63 12,59 196 1.62 10,167
Inferred Resources 68 1.69 3,682 50 1.71 2,736
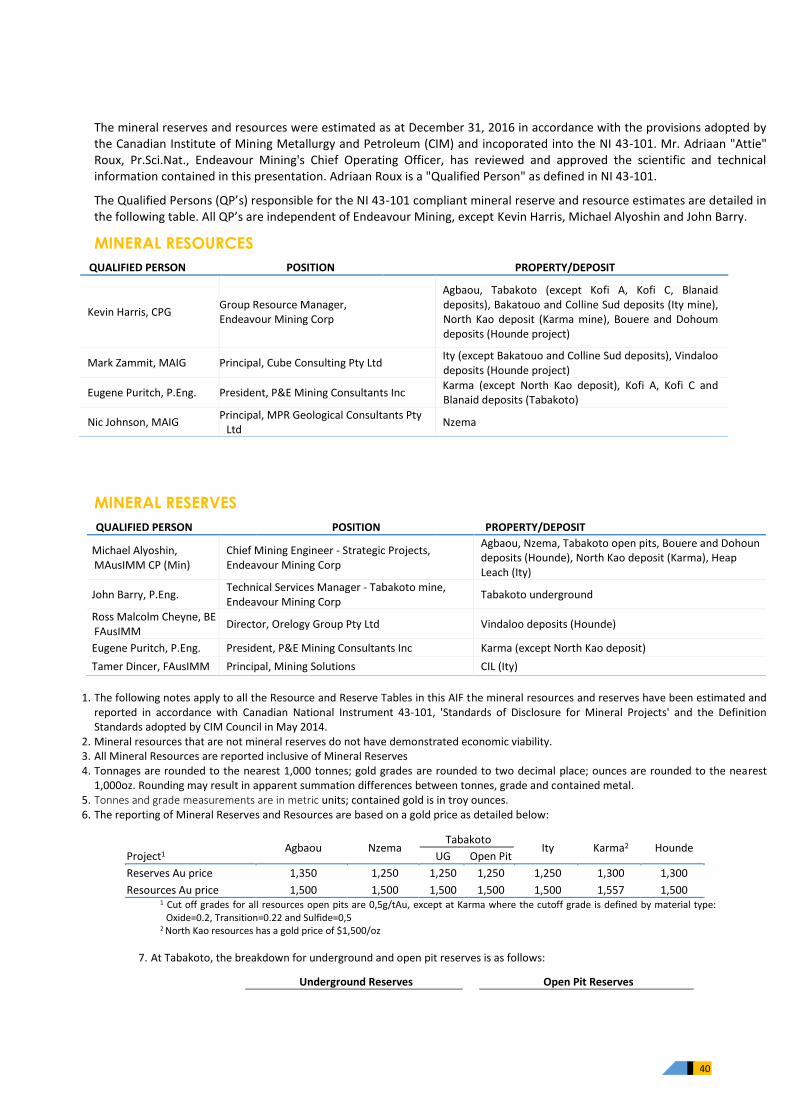
40
The mineral reserves and resources were estimated as at December 31, 2016 in accordance with the provisions adopted by the Canadian Institute of Mining Metallurgy and Petroleum (CIM) and incoporated into the NI 43-101. Mr. Adriaan "Attie" Roux, Pr.Sci.Nat., Endeavour Mining's Chief Operating Officer, has reviewed and approved the scientific and technical information contained in this presentation. Adriaan Roux is a "Qualified Person" as defined in NI 43-101.
The Qualified Persons (QP’s) responsible for the NI 43-101 compliant mineral reserve and resource estimates are detailed in the following table. All QP’s are independent of Endeavour Mining, except Kevin Harris, Michael Alyoshin and John Barry.
MINERAL RESOURCES
QUALIFIED PERSON POSITION PROPERTY/DEPOSIT
Kevin Harris, CPG Group Resource Manager, Endeavour Mining Corp
Agbaou, Tabakoto (except Kofi A, Kofi C, Blanaid deposits), Bakatouo and Colline Sud deposits (Ity mine), North Kao deposit (Karma mine), Bouere and Dohoum deposits (Hounde project)
Mark Zammit, MAIG Principal, Cube Consulting Pty Ltd Ity (except Bakatouo and Colline Sud deposits), Vindaloo deposits (Hounde project)
Eugene Puritch, P.Eng. President, P&E Mining Consultants Inc Karma (except North Kao deposit), Kofi A, Kofi C and Blanaid deposits (Tabakoto)
Nic Johnson, MAIG Principal, MPR Geological Consultants Pty
Ltd Nzema
MINERAL RESERVES
QUALIFIED PERSON POSITION PROPERTY/DEPOSIT
Michael Alyoshin, MAusIMM CP (Min)
Chief Mining Engineer - Strategic Projects, Endeavour Mining Corp
Agbaou, Nzema, Tabakoto open pits, Bouere and Dohoun deposits (Hounde), North Kao deposit (Karma), Heap Leach (Ity)
John Barry, P.Eng. Technical Services Manager - Tabakoto mine, Endeavour Mining Corp
Tabakoto underground
Ross Malcolm Cheyne, BE FAusIMM
Director, Orelogy Group Pty Ltd Vindaloo deposits (Hounde)
Eugene Puritch, P.Eng. President, P&E Mining Consultants Inc Karma (except North Kao deposit)
Tamer Dincer, FAusIMM Principal, Mining Solutions CIL (Ity)
1. The following notes apply to all the Resource and Reserve Tables in this AIF the mineral resources and reserves have been estimated and
reported in accordance with Canadian National Instrument 43-101, 'Standards of Disclosure for Mineral Projects' and the Definition Standards adopted by CIM Council in May 2014.
2. Mineral resources that are not mineral reserves do not have demonstrated economic viability. 3. All Mineral Resources are reported inclusive of Mineral Reserves 4. Tonnages are rounded to the nearest 1,000 tonnes; gold grades are rounded to two decimal place; ounces are rounded to the nearest
1,000oz. Rounding may result in apparent summation differences between tonnes, grade and contained metal. 5. Tonnes and grade measurements are in metric units; contained gold is in troy ounces. 6. The reporting of Mineral Reserves and Resources are based on a gold price as detailed below:
Project1 Agbaou Nzema
Tabakoto Ity Karma2 Hounde
UG Open Pit
Reserves Au price 1,350 1,250 1,250 1,250 1,250 1,300 1,300
Resources Au price 1,500 1,500 1,500 1,500 1,500 1,557 1,500 1 Cut off grades for all resources open pits are 0,5g/tAu, except at Karma where the cutoff grade is defined by material type:
Oxide=0.2, Transition=0.22 and Sulfide=0,5 2 North Kao resources has a gold price of $1,500/oz
7. At Tabakoto, the breakdown for underground and open pit reserves is as follows:
Underground Reserves Open Pit Reserves
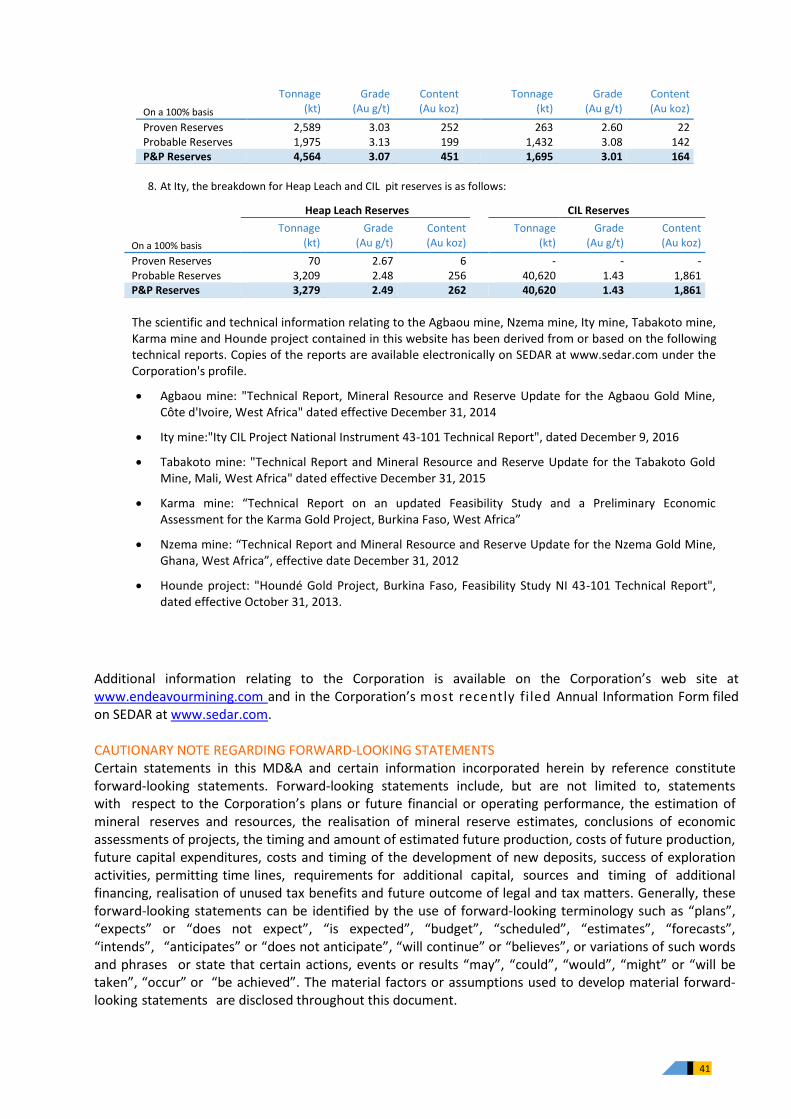
41
On a 100% basis
Tonnage (kt)
Grade (Au g/t)
Content (Au koz)
Tonnage
(kt) Grade
(Au g/t) Content (Au koz)
Proven Reserves 2,589 3.03 252
263 2.60 22 Probable Reserves 1,975 3.13 199
1,432 3.08 142
P&P Reserves 4,564 3.07 451
1,695 3.01 164
8. At Ity, the breakdown for Heap Leach and CIL pit reserves is as follows:
Heap Leach Reserves CIL Reserves
On a 100% basis
Tonnage (kt)
Grade (Au g/t)
Content (Au koz)
Tonnage
(kt) Grade
(Au g/t) Content (Au koz)
Proven Reserves 70 2.67 6
- - - Probable Reserves 3,209 2.48 256
40,620 1.43 1,861
P&P Reserves 3,279 2.49 262
40,620 1.43 1,861
The scientific and technical information relating to the Agbaou mine, Nzema mine, Ity mine, Tabakoto mine, Karma mine and Hounde project contained in this website has been derived from or based on the following technical reports. Copies of the reports are available electronically on SEDAR at www.sedar.com under the Corporation's profile.
• Agbaou mine: "Technical Report, Mineral Resource and Reserve Update for the Agbaou Gold Mine, Côte d'Ivoire, West Africa" dated effective December 31, 2014
• Ity mine:"Ity CIL Project National Instrument 43-101 Technical Report", dated December 9, 2016
• Tabakoto mine: "Technical Report and Mineral Resource and Reserve Update for the Tabakoto Gold Mine, Mali, West Africa" dated effective December 31, 2015
• Karma mine: “Technical Report on an updated Feasibility Study and a Preliminary Economic Assessment for the Karma Gold Project, Burkina Faso, West Africa”
• Nzema mine: “Technical Report and Mineral Resource and Reserve Update for the Nzema Gold Mine, Ghana, West Africa”, effective date December 31, 2012
• Hounde project: "Houndé Gold Project, Burkina Faso, Feasibility Study NI 43-101 Technical Report", dated effective October 31, 2013.
Additional information relating to the Corporation is available on the Corporation’s web site at www.endeavourmining.com and in the Corporation’s most recently filed Annual Information Form filed on SEDAR at www.sedar.com.
CAUTIONARY NOTE REGARDING FORWARD-LOOKING STATEMENTS
Certain statements in this MD&A and certain information incorporated herein by reference constitute forward-looking statements. Forward-looking statements include, but are not limited to, statements with respect to the Corporation’s plans or future financial or operating performance, the estimation of mineral reserves and resources, the realisation of mineral reserve estimates, conclusions of economic assessments of projects, the timing and amount of estimated future production, costs of future production, future capital expenditures, costs and timing of the development of new deposits, success of exploration activities, permitting time lines, requirements for additional capital, sources and timing of additional financing, realisation of unused tax benefits and future outcome of legal and tax matters. Generally, these forward-looking statements can be identified by the use of forward-looking terminology such as “plans”, “expects” or “does not expect”, “is expected”, “budget”, “scheduled”, “estimates”, “forecasts”, “intends”, “anticipates” or “does not anticipate”, “will continue” or “believes”, or variations of such words and phrases or state that certain actions, events or results “may”, “could”, “would”, “might” or “will be taken”, “occur” or “be achieved”. The material factors or assumptions used to develop material forward-looking statements are disclosed throughout this document.
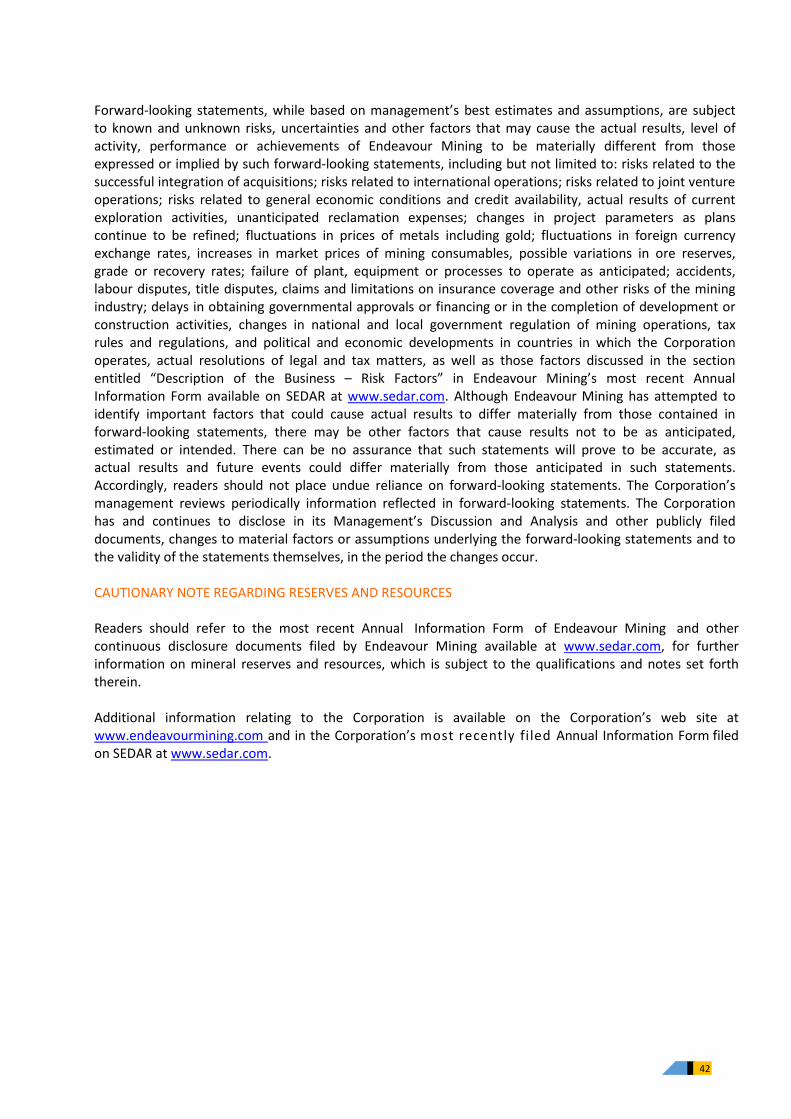
42
Forward-looking statements, while based on management’s best estimates and assumptions, are subject to known and unknown risks, uncertainties and other factors that may cause the actual results, level of activity, performance or achievements of Endeavour Mining to be materially different from those expressed or implied by such forward-looking statements, including but not limited to: risks related to the successful integration of acquisitions; risks related to international operations; risks related to joint venture operations; risks related to general economic conditions and credit availability, actual results of current exploration activities, unanticipated reclamation expenses; changes in project parameters as plans continue to be refined; fluctuations in prices of metals including gold; fluctuations in foreign currency exchange rates, increases in market prices of mining consumables, possible variations in ore reserves, grade or recovery rates; failure of plant, equipment or processes to operate as anticipated; accidents, labour disputes, title disputes, claims and limitations on insurance coverage and other risks of the mining industry; delays in obtaining governmental approvals or financing or in the completion of development or construction activities, changes in national and local government regulation of mining operations, tax rules and regulations, and political and economic developments in countries in which the Corporation operates, actual resolutions of legal and tax matters, as well as those factors discussed in the section entitled “Description of the Business – Risk Factors” in Endeavour Mining’s most recent Annual Information Form available on SEDAR at www.sedar.com. Although Endeavour Mining has attempted to identify important factors that could cause actual results to differ materially from those contained in forward-looking statements, there may be other factors that cause results not to be as anticipated, estimated or intended. There can be no assurance that such statements will prove to be accurate, as actual results and future events could differ materially from those anticipated in such statements. Accordingly, readers should not place undue reliance on forward-looking statements. The Corporation’s management reviews periodically information reflected in forward-looking statements. The Corporation has and continues to disclose in its Management’s Discussion and Analysis and other publicly filed documents, changes to material factors or assumptions underlying the forward-looking statements and to the validity of the statements themselves, in the period the changes occur. CAUTIONARY NOTE REGARDING RESERVES AND RESOURCES Readers should refer to the most recent Annual Information Form of Endeavour Mining and other continuous disclosure documents filed by Endeavour Mining available at www.sedar.com, for further information on mineral reserves and resources, which is subject to the qualifications and notes set forth therein. Additional information relating to the Corporation is available on the Corporation’s web site at www.endeavourmining.com and in the Corporation’s most recently filed Annual Information Form filed on SEDAR at www.sedar.com.

SECTION 2: FINANCIAL STATEMENTS
For the three months ended March 31, 2017 and 2016 Expressed in Thousands of United States Dollars
(Unaudited)
TABLE OF CONTENTS 1 DESCRIPTION OF BUSINESS AND NATURE OF OPERATIONS ...................................................................................... 5
2 BASIS OF PRESENTATION AND SIGNIFICANT ACCOUNTING POLICIES ........................................................................ 5
3 DISPOSALS OF MINING INTERESTS ............................................................................................................................. 6
3.1 DISPOSAL OF THE YOUGA MINE ............................................................................................................................. 6
4 INVENTORIES.............................................................................................................................................................. 7
5 MINING INTERESTS .................................................................................................................................................... 8
6 OTHER LONG TERM ASSETS ..................................................................................................................................... 10
7 TRADE AND OTHER PAYABLES .................................................................................................................................. 10
8 FINANCE LEASE OBLIGATIONS.................................................................................................................................. 11
9 LONG-TERM DEBT .................................................................................................................................................... 12
9.1 CORPORATE LOAN FACILITY ................................................................................................................................. 12
9.2 HOUNDÉ FINANCING ARRANGEMENT ................................................................................................................. 13
10 OTHER LONG TERM LIABILITIES ............................................................................................................................... 13
10.1 ENVIRONMENTAL REHABILITATION PROVISION .................................................................................................. 13
10.2 DEFERRED, PERFORMANCE AND RESTRICTED SHARE UNIT LIABILITY .................................................................. 13
10.3 PENSION OBLIGATION .......................................................................................................................................... 14
11 SHARE CAPITAL ........................................................................................................................................................ 14
12 NON-CONTROLLING INTERESTS ............................................................................................................................... 18
13 LOSSES ON FINANCIAL INSTRUMENTS ..................................................................................................................... 18
14 DERIVATIVE FINANCIAL INSTRUMENTS .................................................................................................................... 19
15 INCOME TAXES ......................................................................................................................................................... 20
16 SEGMENTED INFORMATION .................................................................................................................................... 20
17 CAPITAL MANAGEMENT .......................................................................................................................................... 22
18 FINANCIAL INSTRUMENTS ........................................................................................................................................ 22
18.1 FINANCIAL ASSETS AND LIABILITIES ..................................................................................................................... 22
18.2 FINANCIAL INSTRUMENT RISK EXPOSURE ............................................................................................................ 24
18.3 MARKET RISKS ...................................................................................................................................................... 25
19 COMMITMENTS AND CONTINGENCIES .................................................................................................................... 27
20 SUBSEQUENT EVENTS .............................................................................................................................................. 27
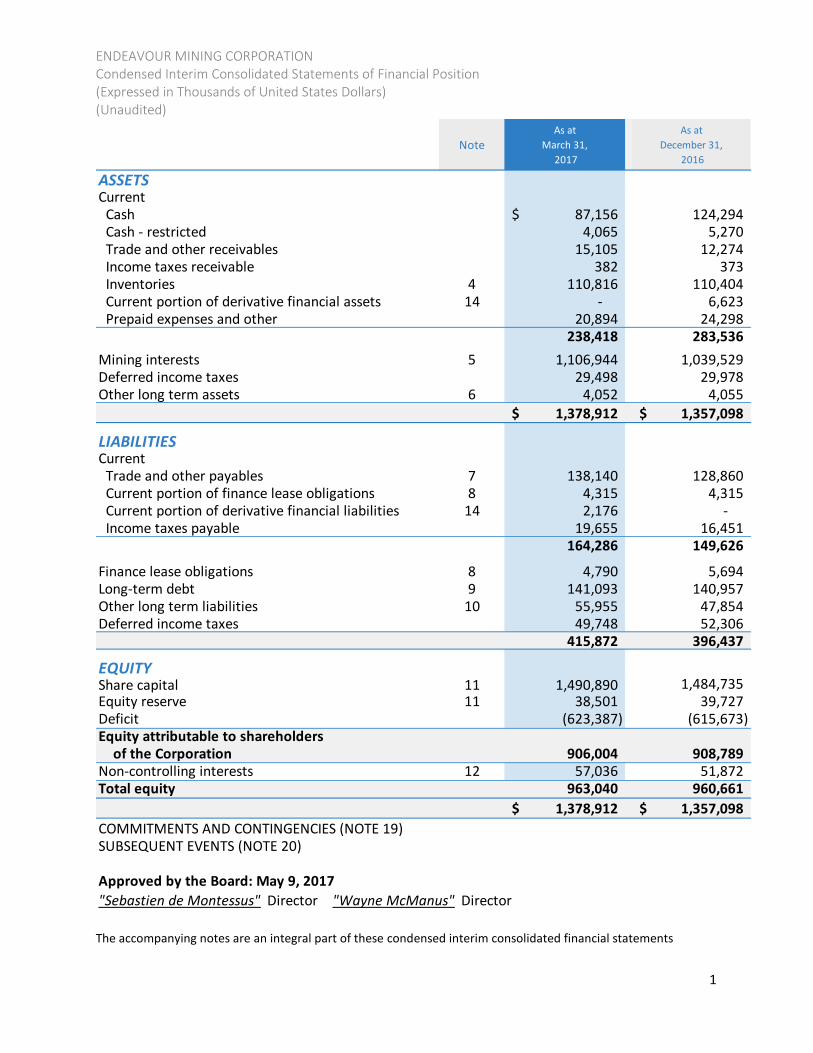
ENDEAVOUR MINING CORPORATION Condensed Interim Consolidated Statements of Financial Position (Expressed in Thousands of United States Dollars) (Unaudited)
1
NoteAs at
March 31,
2017
As at
December 31,
2016
ASSETSCurrent Cash 87,156$ 124,294 Cash - restricted 4,065 5,270 Trade and other receivables 15,105 12,274 Income taxes receivable 382 373 Inventories 4 110,816 110,404 Current portion of derivative financial assets 14 - 6,623 Prepaid expenses and other 20,894 24,298
238,418 283,536
Mining interests 5 1,106,944 1,039,529 Deferred income taxes 29,498 29,978 Other long term assets 6 4,052 4,055
1,378,912$ 1,357,098$
LIABILITIESCurrent Trade and other payables 7 138,140 128,860 Current portion of finance lease obligations 8 4,315 4,315 Current portion of derivative financial liabilities 14 2,176 - Income taxes payable 19,655 16,451
164,286 149,626
Finance lease obligations 8 4,790 5,694 Long-term debt 9 141,093 140,957 Other long term liabilities 10 55,955 47,854 Deferred income taxes 49,748 52,306
415,872 396,437
EQUITYShare capital 11 1,490,890 1,484,735 Equity reserve 11 38,501 39,727 Deficit (623,387) (615,673) Equity attributable to shareholders of the Corporation 906,004 908,789 Non-controlling interests 12 57,036 51,872 Total equity 963,040 960,661
1,378,912$ 1,357,098$
COMMITMENTS AND CONTINGENCIES (NOTE 19) SUBSEQUENT EVENTS (NOTE 20)
Approved by the Board: May 9, 2017
"Sebastien de Montessus" Director "Wayne McManus" Director
The accompanying notes are an integral part of these condensed interim consolidated financial statements
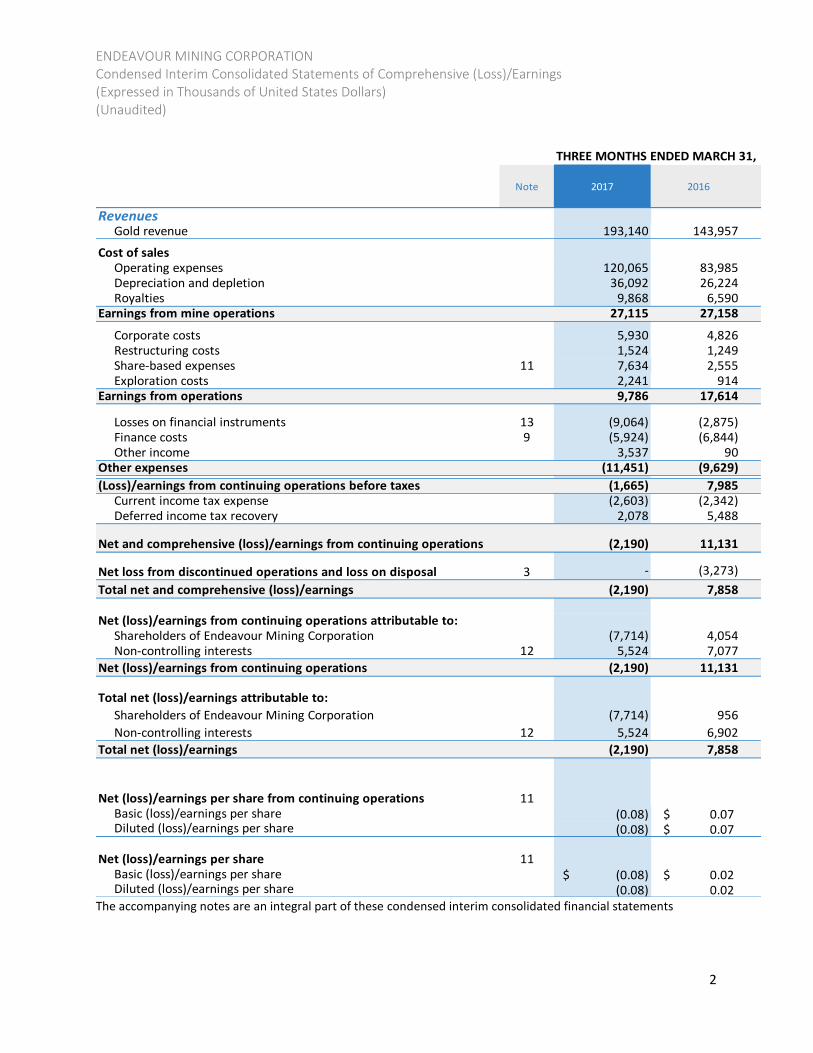
ENDEAVOUR MINING CORPORATION Condensed Interim Consolidated Statements of Comprehensive (Loss)/Earnings (Expressed in Thousands of United States Dollars) (Unaudited)
2
THREE MONTHS ENDED MARCH 31,
Note 2017 2016
Gold revenue 193,140 143,957
Cost of salesOperating expenses 120,065 83,985Depreciation and depletion 36,092 26,224Royalties 9,868 6,590
Earnings from mine operations 27,115 27,158
Corporate costs 5,930 4,826Restructuring costs 1,524 1,249Share-based expenses 11 7,634 2,555Exploration costs 2,241 914
Earnings from operations 9,786 17,614
Losses on financial instruments 13 (9,064) (2,875)Finance costs 9 (5,924) (6,844)Other income 3,537 90
Other expenses (11,451) (9,629)
(Loss)/earnings from continuing operations before taxes (1,665) 7,985 Current income tax expense (2,603) (2,342) Deferred income tax recovery 2,078 5,488
(2,190) 11,131
3 - (3,273)
Total net and comprehensive (loss)/earnings (2,190) 7,858
Net (loss)/earnings from continuing operations attributable to:Shareholders of Endeavour Mining Corporation (7,714) 4,054Non-controlling interests 12 5,524 7,077
Net (loss)/earnings from continuing operations (2,190) 11,131
Total net (loss)/earnings attributable to:
Shareholders of Endeavour Mining Corporation (7,714) 956
Non-controlling interests 12 5,524 6,902
Total net (loss)/earnings (2,190) 7,858
11 Basic (loss)/earnings per share (0.08) 0.07$ Diluted (loss)/earnings per share (0.08) 0.07$
Net (loss)/earnings per share 11 Basic (loss)/earnings per share (0.08)$ 0.02$ Diluted (loss)/earnings per share (0.08) 0.02
Net (loss)/earnings per share from continuing operations
Net loss from discontinued operations and loss on disposal
Net and comprehensive (loss)/earnings from continuing operations
Revenues
The accompanying notes are an integral part of these condensed interim consolidated financial statements
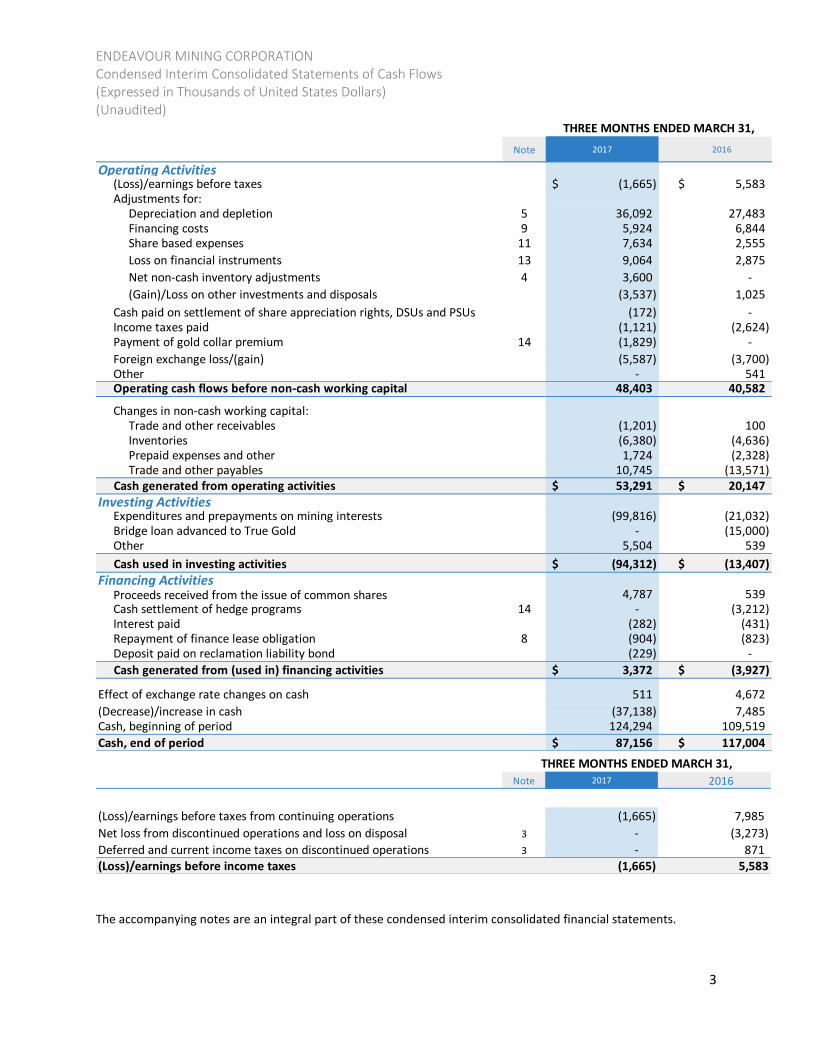
ENDEAVOUR MINING CORPORATION Condensed Interim Consolidated Statements of Cash Flows (Expressed in Thousands of United States Dollars) (Unaudited)
3
Note 2017 2016
(Loss)/earnings before taxes (1,665)$ 5,583$ Adjustments for:
Depreciation and depletion 5 36,092 27,483 Financing costs 9 5,924 6,844 Share based expenses 11 7,634 2,555
13 9,064 2,875
4 3,600 -
(Gain)/Loss on other investments and disposals (3,537) 1,025
Cash paid on settlement of share appreciation rights, DSUs and PSUs (172) - Income taxes paid (1,121) (2,624) Payment of gold collar premium 14 (1,829) -
Foreign exchange loss/(gain) (5,587) (3,700) Other - 541 Operating cash flows before non-cash working capital 48,403 40,582
Changes in non-cash working capital:Trade and other receivables (1,201) 100
Inventories (6,380) (4,636) Prepaid expenses and other 1,724 (2,328) Trade and other payables 10,745 (13,571)
Cash generated from operating activities 53,291$ 20,147$
Expenditures and prepayments on mining interests (99,816) (21,032) Bridge loan advanced to True Gold - (15,000) Other 5,504 539
Cash used in investing activities (94,312)$ (13,407)$
Proceeds received from the issue of common shares 4,787 539 Cash settlement of hedge programs 14 - (3,212) Interest paid (282) (431)
Repayment of finance lease obligation 8 (904) (823) Deposit paid on reclamation liability bond (229) -
Cash generated from (used in) financing activities 3,372$ (3,927)$
Effect of exchange rate changes on cash 511 4,672
(Decrease)/increase in cash (37,138) 7,485 Cash, beginning of period 124,294 109,519
Cash, end of period 87,156$ 117,004$
THREE MONTHS ENDED MARCH 31,
Loss on financial instruments
Operating Activities
Investing Activities
Financing Activities
Net non-cash inventory adjustments
Note 2017 2016
(Loss)/earnings before taxes from continuing operations (1,665) 7,985
3 - (3,273)
Deferred and current income taxes on discontinued operations 3 - 871 (Loss)/earnings before income taxes (1,665) 5,583
Net loss from discontinued operations and loss on disposal
THREE MONTHS ENDED MARCH 31,
The accompanying notes are an integral part of these condensed interim consolidated financial statements.
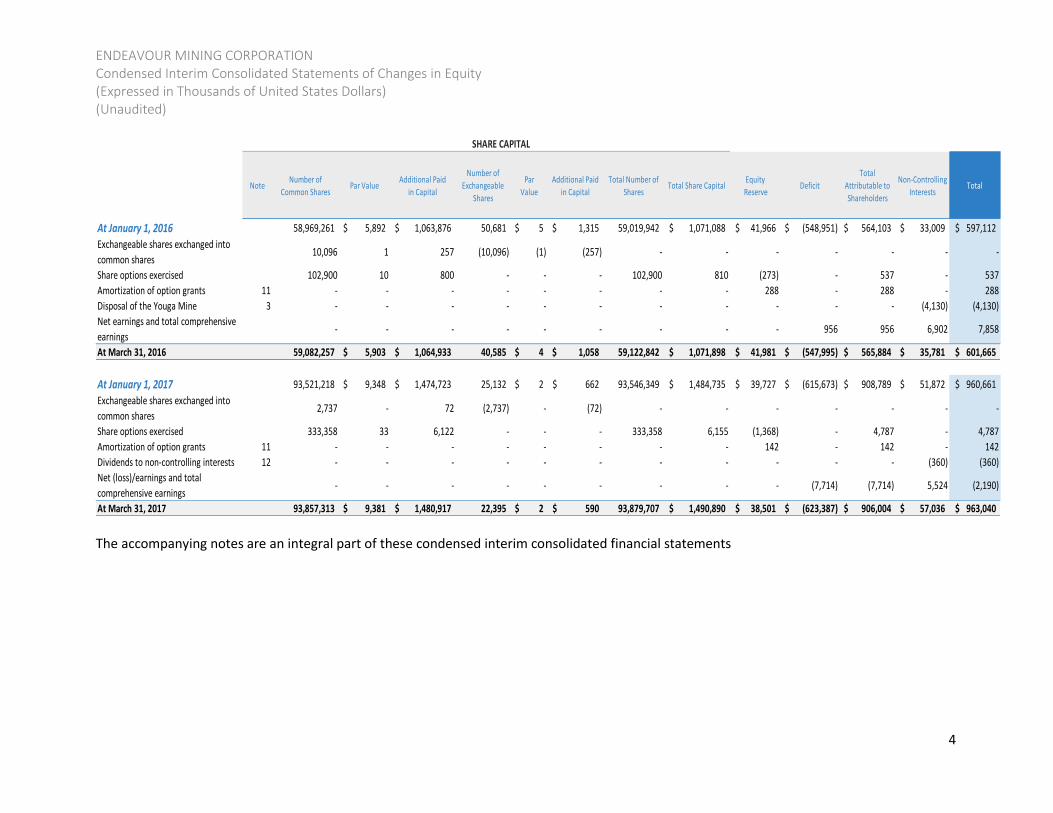
ENDEAVOUR MINING CORPORATION Condensed Interim Consolidated Statements of Changes in Equity (Expressed in Thousands of United States Dollars) (Unaudited)
4
NoteNumber of
Common SharesPar Value
Additional Paid
in Capital
Number of
Exchangeable
Shares
Par
Value
Additional Paid
in Capital
Total Number of
Shares Total Share Capital
Equity
ReserveDeficit
Total
Attributable to
Shareholders
Non-Controlling
InterestsTotal
At January 1, 2016 58,969,261 5,892$ 1,063,876$ 50,681 5$ 1,315$ 59,019,942 1,071,088$ 41,966$ (548,951)$ 564,103$ 33,009$ 597,112$
Exchangeable shares exchanged into
common shares10,096 1 257 (10,096) (1) (257) - - - - - - -
Share options exercised 102,900 10 800 - - - 102,900 810 (273) - 537 - 537
Amortization of option grants 11 - - - - - - - - 288 - 288 - 288
Disposal of the Youga Mine 3 - - - - - - - - - - - (4,130) (4,130)
Net earnings and total comprehensive
earnings- - - - - - - - - 956 956 6,902 7,858
At March 31, 2016 59,082,257 5,903$ 1,064,933$ 40,585 4$ 1,058$ 59,122,842 1,071,898$ 41,981$ (547,995)$ 565,884$ 35,781$ 601,665$
At January 1, 2017 93,521,218 9,348$ 1,474,723$ 25,132 2$ 662$ 93,546,349 1,484,735$ 39,727$ (615,673)$ 908,789$ 51,872$ 960,661$
Exchangeable shares exchanged into
common shares2,737 - 72 (2,737) - (72) - - - - - - -
Share options exercised 333,358 33 6,122 - - - 333,358 6,155 (1,368) - 4,787 - 4,787
Amortization of option grants 11 - - - - - - - - 142 - 142 - 142
Dividends to non-controlling interests 12 - - - - - - - - - - - (360) (360)
Net (loss)/earnings and total
comprehensive earnings- - - - - - - - - (7,714) (7,714) 5,524 (2,190)
At March 31, 2017 93,857,313 9,381$ 1,480,917$ 22,395 2$ 590$ 93,879,707 1,490,890$ 38,501$ (623,387)$ 906,004$ 57,036$ 963,040$
SHARE CAPITAL
The accompanying notes are an integral part of these condensed interim consolidated financial statements
ENDEAVOUR MINING CORPORATION Notes to the Unaudited Condensed Interim Consolidated Financial Statements (Expressed in Thousands of United States Dollars, except per share amounts) (Unaudited)
5
1 DESCRIPTION OF BUSINESS AND NATURE OF OPERATIONS
Endeavour Mining Corporation (“Endeavour” or the “Corporation”) is a publicly listed gold mining company that operates five mines in West Africa in addition to having project development and exploration assets. Endeavour is focused on effectively managing its existing assets to maximize cash flows as well as pursuing organic and strategic growth opportunities that benefit from its management and operational expertise. Endeavour’s corporate office is in London, England, and its shares are listed on the Toronto Stock Exchange (“TSX”) (symbol EDV) and quoted in the United States on the OTCQX International under the symbol ‘EDVMF’. The Corporation is incorporated in the Cayman Islands and its registered office is located at 27 Hospital Road, George Town, Grand Cayman KY1-9008, Cayman Islands.
2 BASIS OF PRESENTATION AND SIGNIFICANT ACCOUNTING POLICIES
STATEMENT OF COMPLIANCE
These condensed interim consolidated financial statements have been prepared in accordance with International Accounting Standard (“IAS”) 34, Interim Financial Reporting, using the accounting policies consistent with International Financial Reporting Standards (‘IFRS’). These condensed interim consolidated financial statements should be read in conjunction with the most recently issued annual consolidated financial statements of the Corporation, which include information necessary or useful to understanding the Corporation’s business and financial statement presentation. In particular, the Corporation’s significant accountant policies were presented as Note 2 to the consolidated financial statements for the year ended December 31, 2016, and have been consistently applied in the preparation of these condensed interim consolidated financial statements.
BASIS OF PREPARATION
These condensed interim consolidated financial statements have been prepared on the historical cost basis, except certain financial instruments that are measured at fair value at the end of each reporting period. The Corporation’s accounting policies have been applied consistently to all periods in the preparation of these condensed interim consolidated financial statements.
ENDEAVOUR MINING CORPORATION Notes to the Unaudited Condensed Interim Consolidated Financial Statements (Expressed in Thousands of United States Dollars, except per share amounts) (Unaudited)
6
ACCOUNTING STANDARDS RECENTLY ADOPTED
The Corporation has not applied the following revised or new IFRS that have been issued but were not yet effective at March 31, 2017. The Corporation is currently evaluating the impact these standards are expected to have on the Corporation’s accounting policies and financial statements:
› IFRS 7, Financial Instruments Disclosures: (effective January 1, 2018) the amendments require increased disclosure regarding derecognition of financial assets and the continuing involvement accounting in connection with servicing contracts for annual periods beginning on or after January 1, 2016.
› IRFS 9, Financial Instruments: (effective January 1, 2018) introduces new requirements for the classification and measurements of financial assets and liabilities.
› IFRS 15 Revenue: (Effective January 1, 2018) In May 2014, the International Accounting Standards Board issued IFRS 15 Revenue from Contracts with Customers ("IFRS 15") which supersedes IAS 11 Construction Contracts, IAS 18 Revenue, IFRS Interpretations Committee (“IFRIC”) 13 Customer Loyalty Programmes, IFRIC 15 Agreements for the Construction of Real Estate, IFRIC 18 Transfers of Assets from Customers, and SIC 31 Revenue Barter Transactions involving Advertising Services. IFRS 15 establishes a single five-step framework for determining the nature, amount, timing and uncertainty of revenue and cash flows arising from a contract with a customer. The standard is effective for annual periods beginning on or after January 1, 2018, with early adoption permitted.
› IFRS 16 Leases (effective January 1, 2019), was issued in January 2016 and provides a single lessee accounting model, requiring lessees to recognize assets and liabilities for all leases unless the lease term is 12 months or less or the underlying asset has a low value.
3 DISPOSALS OF MINING INTERESTS
3.1 DISPOSAL OF THE YOUGA MINE
On February 29, 2016, the Corporation announced and completed the sale of its non-core Youga Mine to MNG Gold for $25.3 million. The sale included the Youga Mine, Ouaré Project and the related exploration properties and is part of the Corporation’s plan to focus on its core mining operations and assets. The total cash consideration was comprised of $20 million for the asset and $5.3 million for the cash-on-hand and working capital adjustments. The Corporation recognized a loss of $1.0 million in the period ended March 31, 2016 and a loss from discontinued operations of $2.3 million. In addition, Endeavour retained a 1.8% Net Smelter Royalty ("NSR") on production realized beyond the current reserve from the property sold, with the inclusion of a buyback provision.
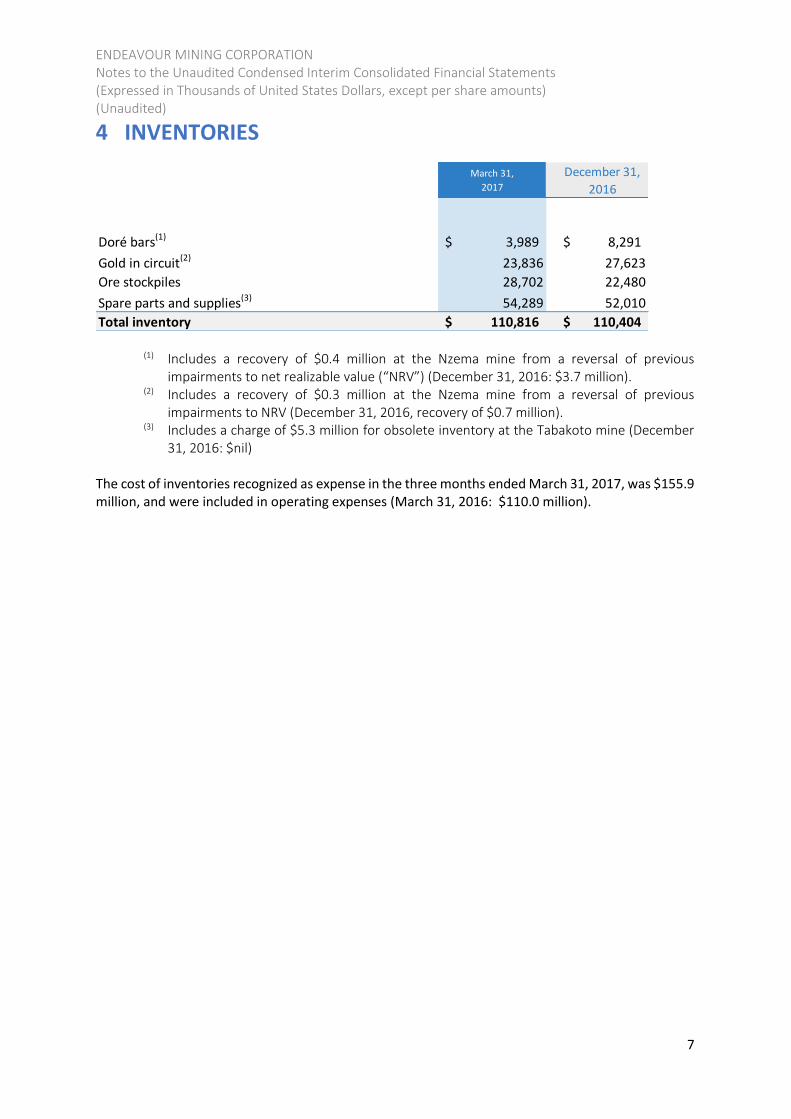
ENDEAVOUR MINING CORPORATION Notes to the Unaudited Condensed Interim Consolidated Financial Statements (Expressed in Thousands of United States Dollars, except per share amounts) (Unaudited)
7
4 INVENTORIES
March 31,
2017
December 31,
2016
Doré bars(1) 3,989$ 8,291$
Gold in circuit(2) 23,836 27,623
Ore stockpiles 28,702 22,480
Spare parts and supplies(3) 54,289 52,010
Total inventory 110,816$ 110,404$
(1) Includes a recovery of $0.4 million at the Nzema mine from a reversal of previous impairments to net realizable value (“NRV”) (December 31, 2016: $3.7 million).
(2) Includes a recovery of $0.3 million at the Nzema mine from a reversal of previous impairments to NRV (December 31, 2016, recovery of $0.7 million).
(3) Includes a charge of $5.3 million for obsolete inventory at the Tabakoto mine (December 31, 2016: $nil)
The cost of inventories recognized as expense in the three months ended March 31, 2017, was $155.9 million, and were included in operating expenses (March 31, 2016: $110.0 million).
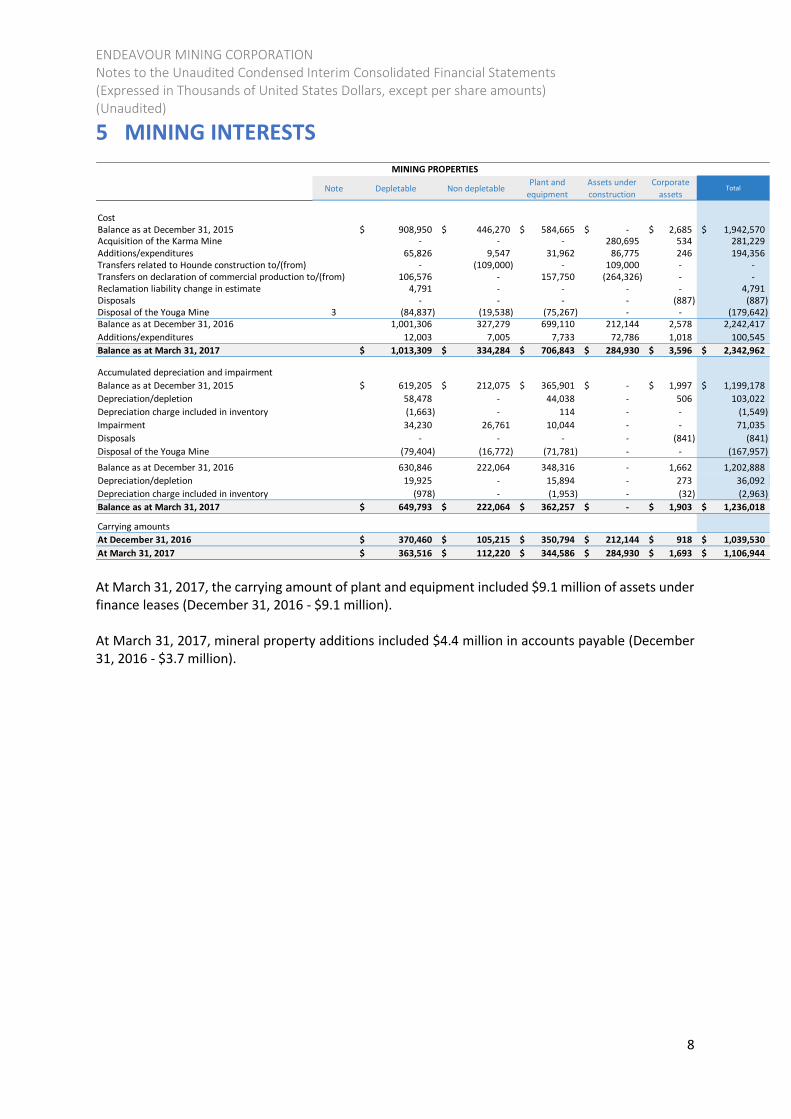
ENDEAVOUR MINING CORPORATION Notes to the Unaudited Condensed Interim Consolidated Financial Statements (Expressed in Thousands of United States Dollars, except per share amounts) (Unaudited)
8
5 MINING INTERESTS
Note Depletable Non depletablePlant and
equipment
Assets under
construction
Corporate
assetsTotal
CostBalance as at December 31, 2015 908,950$ 446,270$ 584,665$ -$ 2,685$ 1,942,570$ Acquisition of the Karma Mine - - - 280,695 534 281,229 Additions/expenditures 65,826 9,547 31,962 86,775 246 194,356 Transfers related to Hounde construction to/(from) - (109,000) - 109,000 - - Transfers on declaration of commercial production to/(from) 106,576 - 157,750 (264,326) - - Reclamation liability change in estimate 4,791 - - - - 4,791 Disposals - - - - (887) (887) Disposal of the Youga Mine 3 (84,837) (19,538) (75,267) - - (179,642) Balance as at December 31, 2016 1,001,306 327,279 699,110 212,144 2,578 2,242,417
Additions/expenditures 12,003 7,005 7,733 72,786 1,018 100,545
Balance as at March 31, 2017 1,013,309$ 334,284$ 706,843$ 284,930$ 3,596$ 2,342,962$
Accumulated depreciation and impairment
Balance as at December 31, 2015 619,205$ 212,075$ 365,901$ -$ 1,997$ 1,199,178$
Depreciation/depletion 58,478 - 44,038 - 506 103,022
Depreciation charge included in inventory (1,663) - 114 - - (1,549)
Impairment 34,230 26,761 10,044 - - 71,035
Disposals - - - - (841) (841)
Disposal of the Youga Mine (79,404) (16,772) (71,781) - - (167,957)
Balance as at December 31, 2016 630,846 222,064 348,316 - 1,662 1,202,888
Depreciation/depletion 19,925 - 15,894 - 273 36,092
Depreciation charge included in inventory (978) - (1,953) - (32) (2,963)
Balance as at March 31, 2017 649,793$ 222,064$ 362,257$ -$ 1,903$ 1,236,018$
Carrying amounts
At December 31, 2016 370,460$ 105,215$ 350,794$ 212,144$ 918$ 1,039,530$
At March 31, 2017 363,516$ 112,220$ 344,586$ 284,930$ 1,693$ 1,106,944$
MINING PROPERTIES
At March 31, 2017, the carrying amount of plant and equipment included $9.1 million of assets under finance leases (December 31, 2016 - $9.1 million). At March 31, 2017, mineral property additions included $4.4 million in accounts payable (December 31, 2016 - $3.7 million).
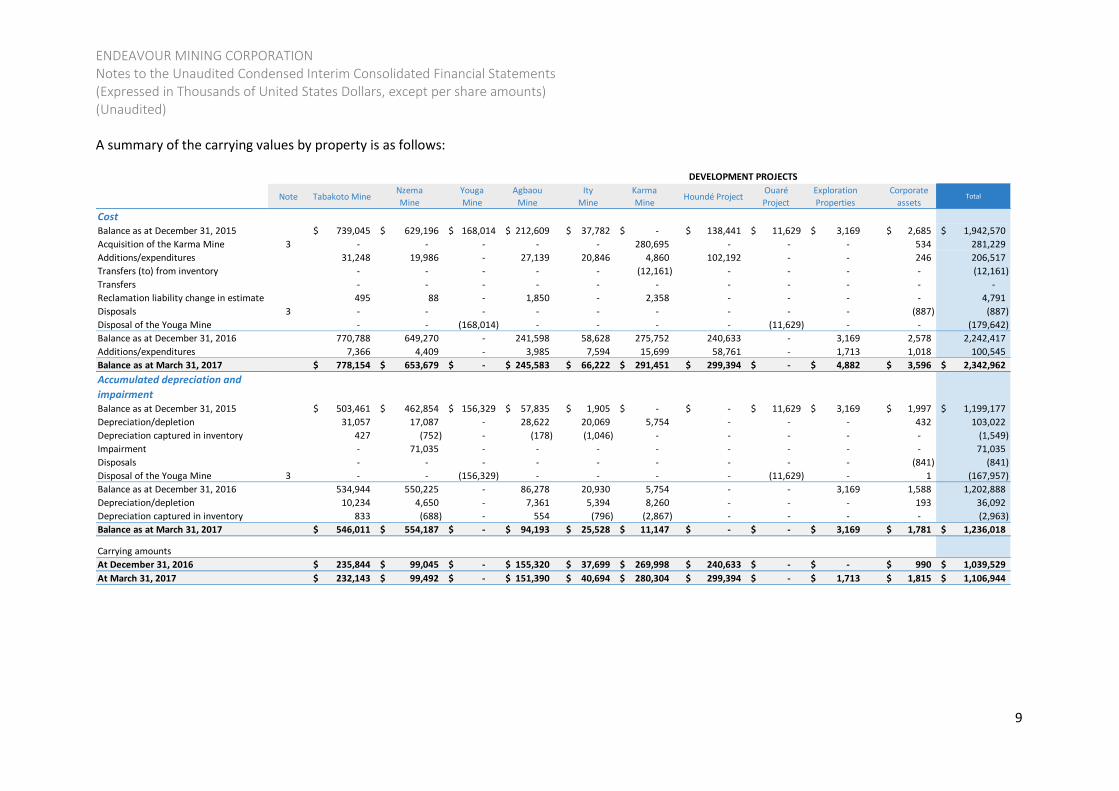
ENDEAVOUR MINING CORPORATION Notes to the Unaudited Condensed Interim Consolidated Financial Statements (Expressed in Thousands of United States Dollars, except per share amounts) (Unaudited)
9
A summary of the carrying values by property is as follows:
DEVELOPMENT PROJECTS
Note Tabakoto MineNzema
Mine
Youga
Mine
Agbaou
Mine
Ity
Mine
Karma
MineHoundé Project
Ouaré
Project
Exploration
Properties
Corporate
assetsTotal
Cost
Balance as at December 31, 2015 739,045$ 629,196$ 168,014$ 212,609$ 37,782$ -$ 138,441$ 11,629$ 3,169$ 2,685$ 1,942,570$
Acquisition of the Karma Mine 3 - - - - - 280,695 - - - 534 281,229
Additions/expenditures 31,248 19,986 - 27,139 20,846 4,860 102,192 - - 246 206,517
Transfers (to) from inventory - - - - - (12,161) - - - - (12,161)
Transfers - - - - - - - - - - -
Reclamation liability change in estimate 495 88 - 1,850 - 2,358 - - - - 4,791
Disposals 3 - - - - - - - - - (887) (887)
Disposal of the Youga Mine - - (168,014) - - - - (11,629) - - (179,642)
Balance as at December 31, 2016 770,788 649,270 - 241,598 58,628 275,752 240,633 - 3,169 2,578 2,242,417
Additions/expenditures 7,366 4,409 - 3,985 7,594 15,699 58,761 - 1,713 1,018 100,545
Balance as at March 31, 2017 778,154$ 653,679$ -$ 245,583$ 66,222$ 291,451$ 299,394$ -$ 4,882$ 3,596$ 2,342,962$
Accumulated depreciation and
impairmentBalance as at December 31, 2015 503,461$ 462,854$ 156,329$ 57,835$ 1,905$ -$ -$ 11,629$ 3,169$ 1,997$ 1,199,177$
Depreciation/depletion 31,057 17,087 - 28,622 20,069 5,754 - - - 432 103,022
Depreciation captured in inventory 427 (752) - (178) (1,046) - - - - - (1,549)
Impairment - 71,035 - - - - - - - - 71,035
Disposals - - - - - - - - - (841) (841)
Disposal of the Youga Mine 3 - - (156,329) - - - - (11,629) - 1 (167,957)
Balance as at December 31, 2016 534,944 550,225 - 86,278 20,930 5,754 - - 3,169 1,588 1,202,888
Depreciation/depletion 10,234 4,650 - 7,361 5,394 8,260 - - - 193 36,092
Depreciation captured in inventory 833 (688) - 554 (796) (2,867) - - - - (2,963)
Balance as at March 31, 2017 546,011$ 554,187$ -$ 94,193$ 25,528$ 11,147$ -$ -$ 3,169$ 1,781$ 1,236,018$
Carrying amounts
At December 31, 2016 235,844$ 99,045$ -$ 155,320$ 37,699$ 269,998$ 240,633$ -$ -$ 990$ 1,039,529$
At March 31, 2017 232,143$ 99,492$ -$ 151,390$ 40,694$ 280,304$ 299,394$ -$ 1,713$ 1,815$ 1,106,944$
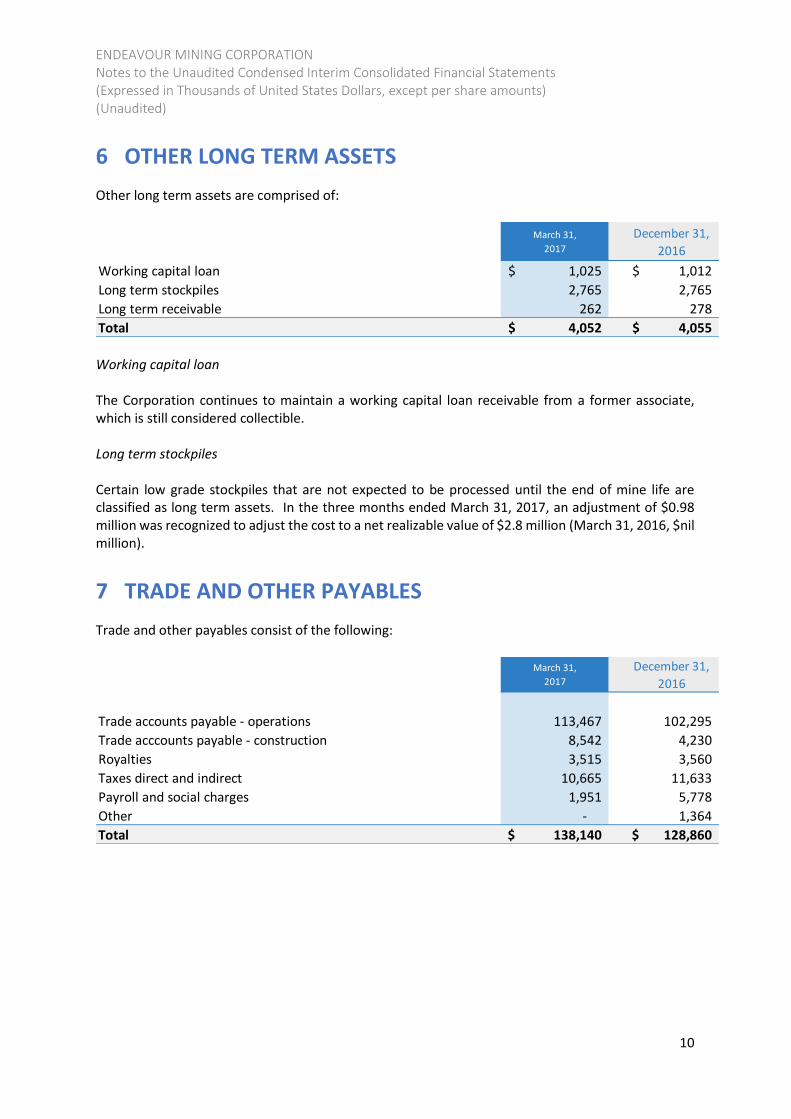
ENDEAVOUR MINING CORPORATION Notes to the Unaudited Condensed Interim Consolidated Financial Statements (Expressed in Thousands of United States Dollars, except per share amounts) (Unaudited)
10
6 OTHER LONG TERM ASSETS
Other long term assets are comprised of:
March 31,
2017
December 31,
2016
Working capital loan 1,025$ 1,012$
Long term stockpiles 2,765 2,765
Long term receivable 262 278
Total 4,052$ 4,055$ Working capital loan The Corporation continues to maintain a working capital loan receivable from a former associate, which is still considered collectible. Long term stockpiles Certain low grade stockpiles that are not expected to be processed until the end of mine life are classified as long term assets. In the three months ended March 31, 2017, an adjustment of $0.98 million was recognized to adjust the cost to a net realizable value of $2.8 million (March 31, 2016, $nil million).
7 TRADE AND OTHER PAYABLES
Trade and other payables consist of the following:
March 31,
2017
December 31,
2016
Trade accounts payable - operations 113,467 102,295
Trade acccounts payable - construction 8,542 4,230
Royalties 3,515 3,560
Taxes direct and indirect 10,665 11,633
Payroll and social charges 1,951 5,778
Other - 1,364
Total 138,140$ 128,860$
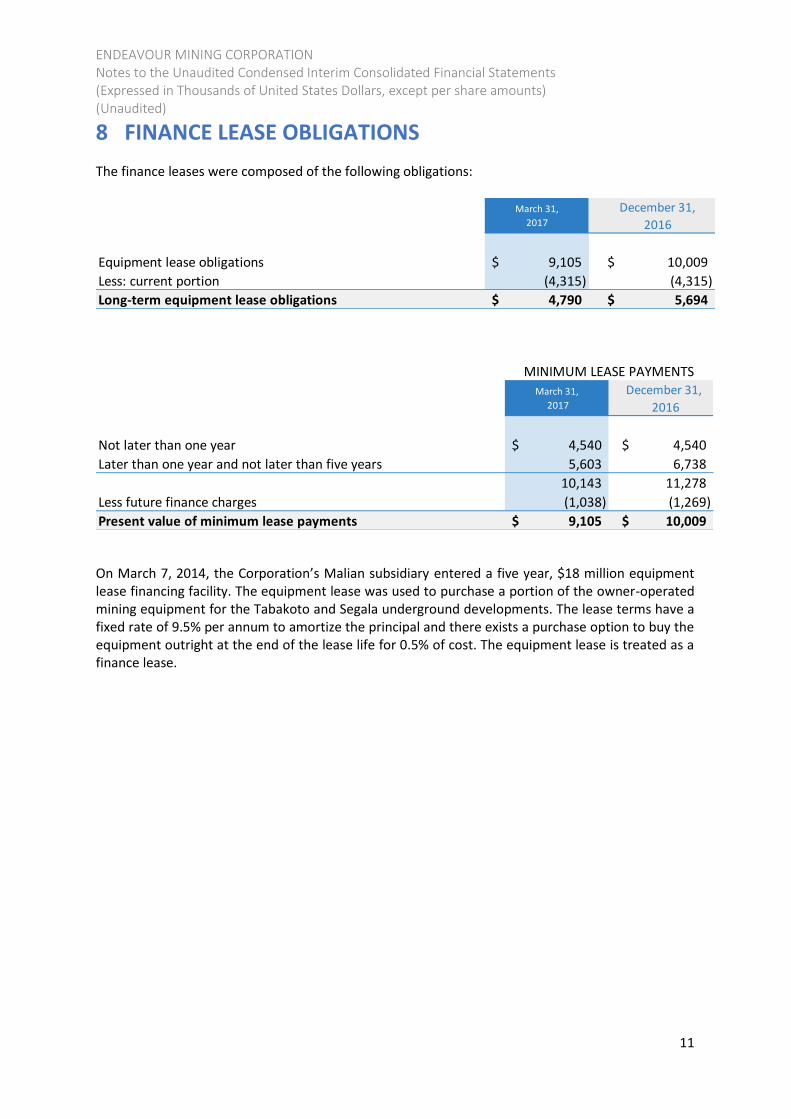
ENDEAVOUR MINING CORPORATION Notes to the Unaudited Condensed Interim Consolidated Financial Statements (Expressed in Thousands of United States Dollars, except per share amounts) (Unaudited)
11
8 FINANCE LEASE OBLIGATIONS
The finance leases were composed of the following obligations:
March 31,
2017
December 31,
2016
Equipment lease obligations 9,105$ 10,009$
Less: current portion (4,315) (4,315)
Long-term equipment lease obligations 4,790$ 5,694$
March 31,
2017
December 31,
2016
Not later than one year 4,540$ 4,540$
Later than one year and not later than five years 5,603 6,738
10,143 11,278
Less future finance charges (1,038) (1,269)
Present value of minimum lease payments 9,105$ 10,009$
MINIMUM LEASE PAYMENTS
On March 7, 2014, the Corporation’s Malian subsidiary entered a five year, $18 million equipment lease financing facility. The equipment lease was used to purchase a portion of the owner-operated mining equipment for the Tabakoto and Segala underground developments. The lease terms have a fixed rate of 9.5% per annum to amortize the principal and there exists a purchase option to buy the equipment outright at the end of the lease life for 0.5% of cost. The equipment lease is treated as a finance lease.
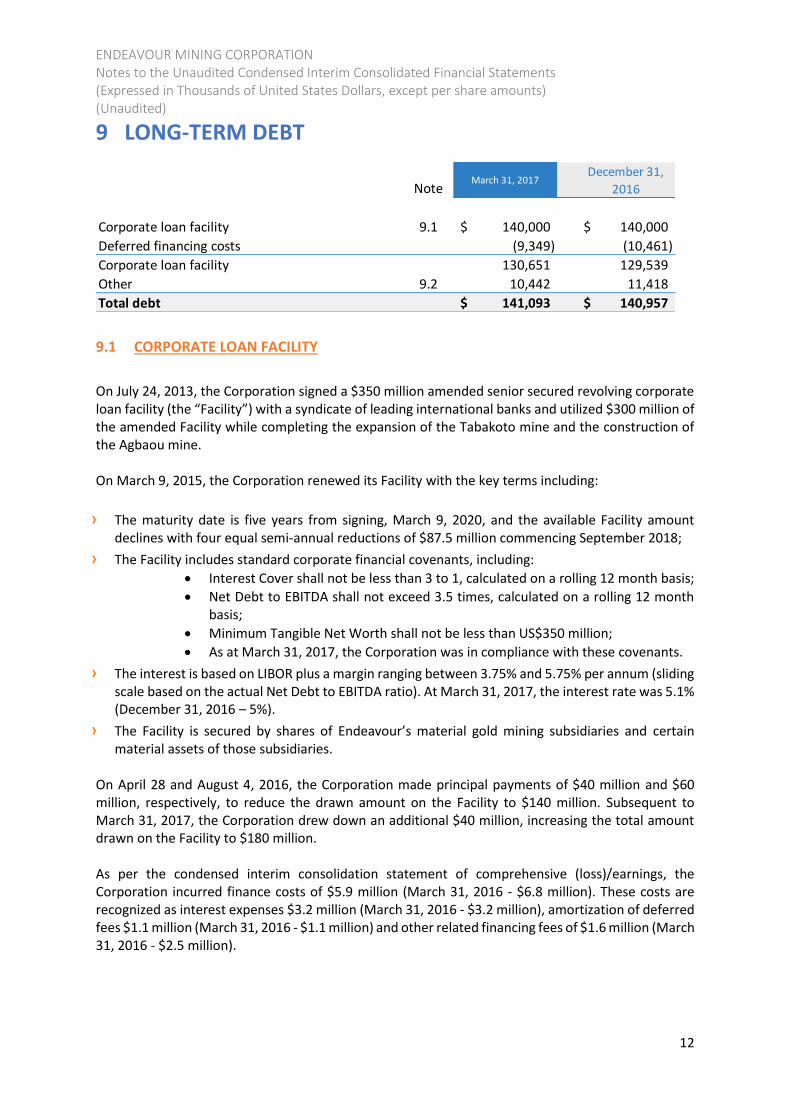
ENDEAVOUR MINING CORPORATION Notes to the Unaudited Condensed Interim Consolidated Financial Statements (Expressed in Thousands of United States Dollars, except per share amounts) (Unaudited)
12
9 LONG-TERM DEBT
NoteMarch 31, 2017
December 31,
2016
Corporate loan facility 9.1 140,000$ 140,000$
Deferred financing costs (9,349) (10,461)
Corporate loan facility 130,651 129,539
Other 9.2 10,442 11,418
Total debt 141,093$ 140,957$
9.1 CORPORATE LOAN FACILITY
On July 24, 2013, the Corporation signed a $350 million amended senior secured revolving corporate loan facility (the “Facility”) with a syndicate of leading international banks and utilized $300 million of the amended Facility while completing the expansion of the Tabakoto mine and the construction of the Agbaou mine. On March 9, 2015, the Corporation renewed its Facility with the key terms including:
› The maturity date is five years from signing, March 9, 2020, and the available Facility amount declines with four equal semi-annual reductions of $87.5 million commencing September 2018;
› The Facility includes standard corporate financial covenants, including:
• Interest Cover shall not be less than 3 to 1, calculated on a rolling 12 month basis;
• Net Debt to EBITDA shall not exceed 3.5 times, calculated on a rolling 12 month basis;
• Minimum Tangible Net Worth shall not be less than US$350 million;
• As at March 31, 2017, the Corporation was in compliance with these covenants.
› The interest is based on LIBOR plus a margin ranging between 3.75% and 5.75% per annum (sliding scale based on the actual Net Debt to EBITDA ratio). At March 31, 2017, the interest rate was 5.1% (December 31, 2016 – 5%).
› The Facility is secured by shares of Endeavour’s material gold mining subsidiaries and certain material assets of those subsidiaries.
On April 28 and August 4, 2016, the Corporation made principal payments of $40 million and $60 million, respectively, to reduce the drawn amount on the Facility to $140 million. Subsequent to March 31, 2017, the Corporation drew down an additional $40 million, increasing the total amount drawn on the Facility to $180 million. As per the condensed interim consolidation statement of comprehensive (loss)/earnings, the Corporation incurred finance costs of $5.9 million (March 31, 2016 - $6.8 million). These costs are recognized as interest expenses $3.2 million (March 31, 2016 - $3.2 million), amortization of deferred fees $1.1 million (March 31, 2016 - $1.1 million) and other related financing fees of $1.6 million (March 31, 2016 - $2.5 million).
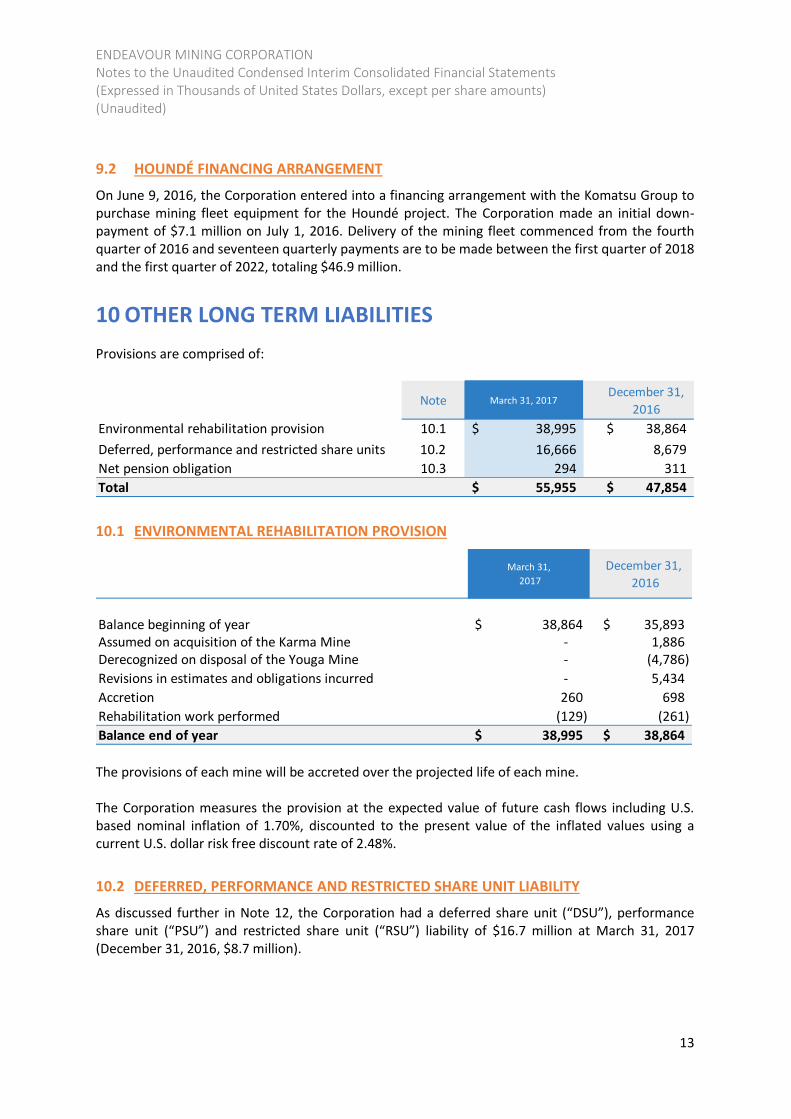
ENDEAVOUR MINING CORPORATION Notes to the Unaudited Condensed Interim Consolidated Financial Statements (Expressed in Thousands of United States Dollars, except per share amounts) (Unaudited)
13
9.2 HOUNDÉ FINANCING ARRANGEMENT
On June 9, 2016, the Corporation entered into a financing arrangement with the Komatsu Group to purchase mining fleet equipment for the Houndé project. The Corporation made an initial down-payment of $7.1 million on July 1, 2016. Delivery of the mining fleet commenced from the fourth quarter of 2016 and seventeen quarterly payments are to be made between the first quarter of 2018 and the first quarter of 2022, totaling $46.9 million.
10 OTHER LONG TERM LIABILITIES
Provisions are comprised of:
Note March 31, 2017December 31,
2016
Environmental rehabilitation provision 10.1 38,995$ 38,864$
10.2 16,666 8,679
Net pension obligation 10.3 294 311
Total 55,955$ 47,854$
Deferred, performance and restricted share units
10.1 ENVIRONMENTAL REHABILITATION PROVISION
March 31,
2017
December 31,
2016
Balance beginning of year 38,864$ 35,893$ Assumed on acquisition of the Karma Mine - 1,886 Derecognized on disposal of the Youga Mine - (4,786)
- 5,434
Accretion 260 698
Rehabilitation work performed (129) (261)
Balance end of year 38,995$ 38,864$
Revisions in estimates and obligations incurred
The provisions of each mine will be accreted over the projected life of each mine. The Corporation measures the provision at the expected value of future cash flows including U.S. based nominal inflation of 1.70%, discounted to the present value of the inflated values using a current U.S. dollar risk free discount rate of 2.48%.
10.2 DEFERRED, PERFORMANCE AND RESTRICTED SHARE UNIT LIABILITY
As discussed further in Note 12, the Corporation had a deferred share unit (“DSU”), performance share unit (“PSU”) and restricted share unit (“RSU”) liability of $16.7 million at March 31, 2017 (December 31, 2016, $8.7 million).
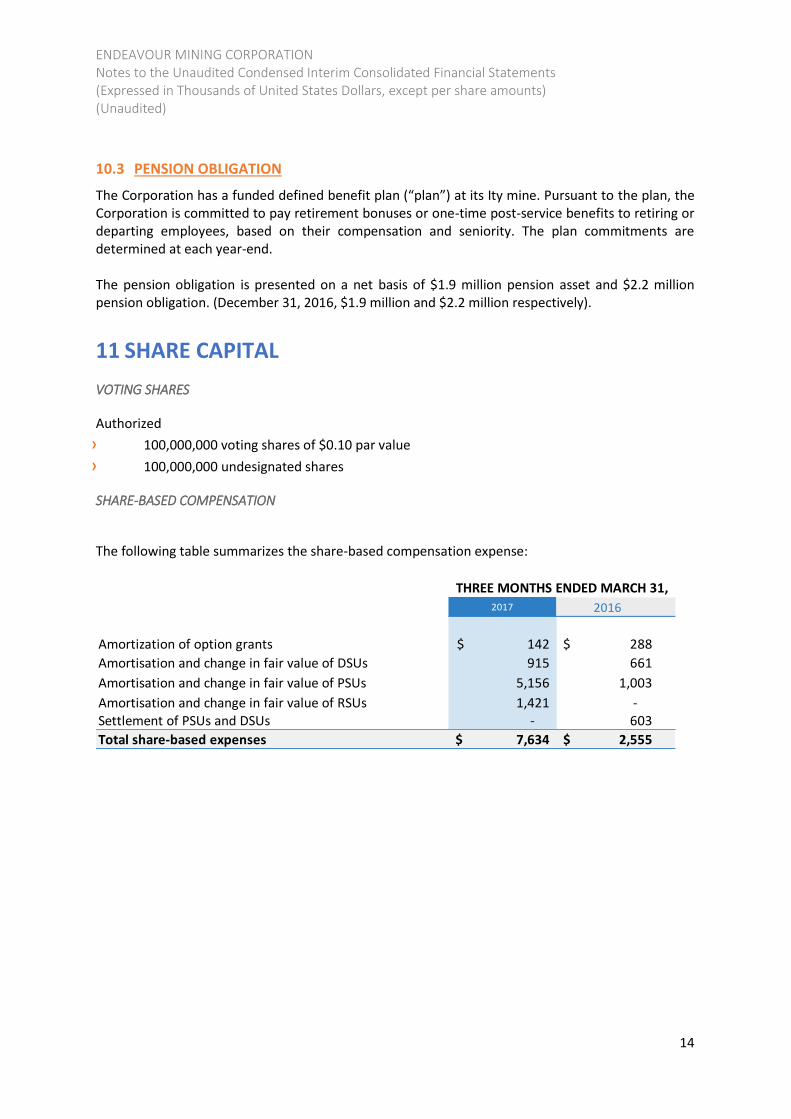
ENDEAVOUR MINING CORPORATION Notes to the Unaudited Condensed Interim Consolidated Financial Statements (Expressed in Thousands of United States Dollars, except per share amounts) (Unaudited)
14
10.3 PENSION OBLIGATION
The Corporation has a funded defined benefit plan (“plan”) at its Ity mine. Pursuant to the plan, the Corporation is committed to pay retirement bonuses or one-time post-service benefits to retiring or departing employees, based on their compensation and seniority. The plan commitments are determined at each year-end. The pension obligation is presented on a net basis of $1.9 million pension asset and $2.2 million pension obligation. (December 31, 2016, $1.9 million and $2.2 million respectively).
11 SHARE CAPITAL
VOTING SHARES
Authorized
› 100,000,000 voting shares of $0.10 par value
› 100,000,000 undesignated shares
SHARE-BASED COMPENSATION
The following table summarizes the share-based compensation expense:
2017 2016
Amortization of option grants 142$ 288$
Amortisation and change in fair value of DSUs 915 661
Amortisation and change in fair value of PSUs 5,156 1,003
Amortisation and change in fair value of RSUs 1,421 - Settlement of PSUs and DSUs - 603
Total share-based expenses 7,634$ 2,555$
THREE MONTHS ENDED MARCH 31,
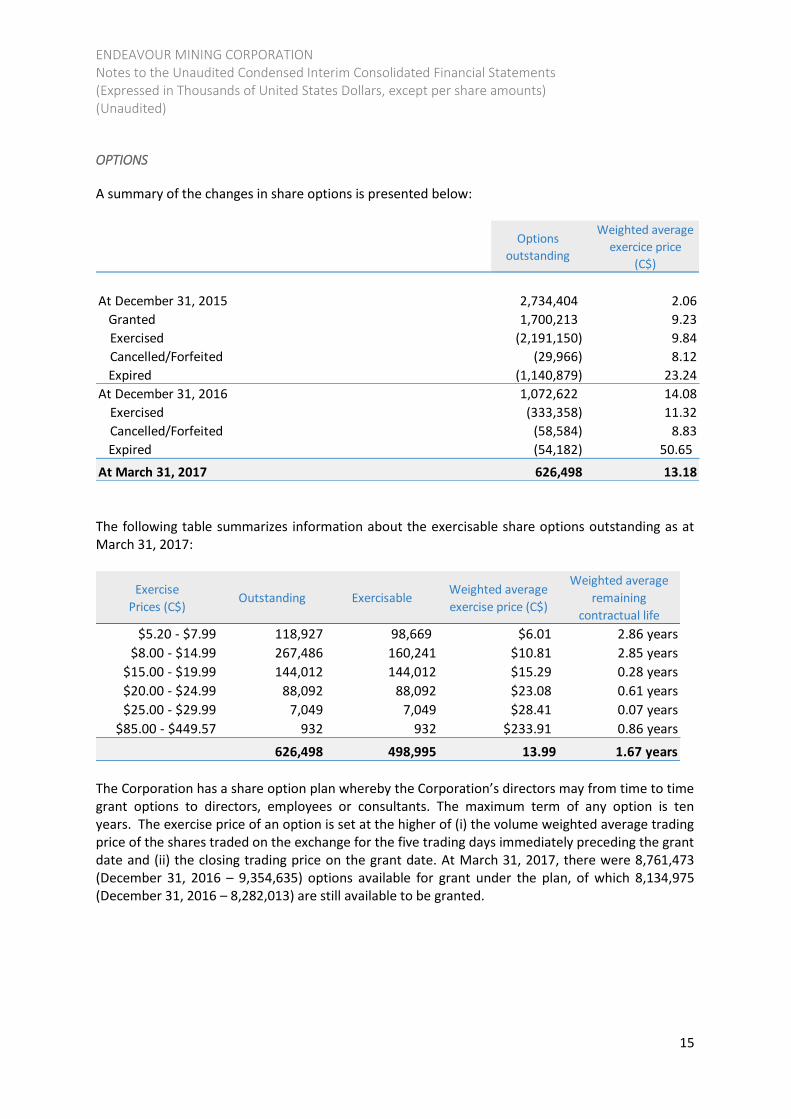
ENDEAVOUR MINING CORPORATION Notes to the Unaudited Condensed Interim Consolidated Financial Statements (Expressed in Thousands of United States Dollars, except per share amounts) (Unaudited)
15
OPTIONS
A summary of the changes in share options is presented below:
Options
outstanding
Weighted average
exercice price
(C$)
At December 31, 2015 2,734,404 2.06
Granted 1,700,213 9.23
Exercised (2,191,150) 9.84
Cancelled/Forfeited (29,966) 8.12
Expired (1,140,879) 23.24
At December 31, 2016 1,072,622 14.08
Exercised (333,358) 11.32
Cancelled/Forfeited (58,584) 8.83
Expired (54,182) 50.65
At March 31, 2017 626,498 13.18 The following table summarizes information about the exercisable share options outstanding as at March 31, 2017:
Exercise
Prices (C$)Outstanding Exercisable
Weighted average
exercise price (C$)
Weighted average
remaining
contractual life
$5.20 - $7.99 118,927 98,669 $6.01 2.86 years
$8.00 - $14.99 267,486 160,241 $10.81 2.85 years
$15.00 - $19.99 144,012 144,012 $15.29 0.28 years
$20.00 - $24.99 88,092 88,092 $23.08 0.61 years
$25.00 - $29.99 7,049 7,049 $28.41 0.07 years
$85.00 - $449.57 932 932 $233.91 0.86 years
626,498 498,995 13.99 1.67 years The Corporation has a share option plan whereby the Corporation’s directors may from time to time grant options to directors, employees or consultants. The maximum term of any option is ten years. The exercise price of an option is set at the higher of (i) the volume weighted average trading price of the shares traded on the exchange for the five trading days immediately preceding the grant date and (ii) the closing trading price on the grant date. At March 31, 2017, there were 8,761,473 (December 31, 2016 – 9,354,635) options available for grant under the plan, of which 8,134,975 (December 31, 2016 – 8,282,013) are still available to be granted.
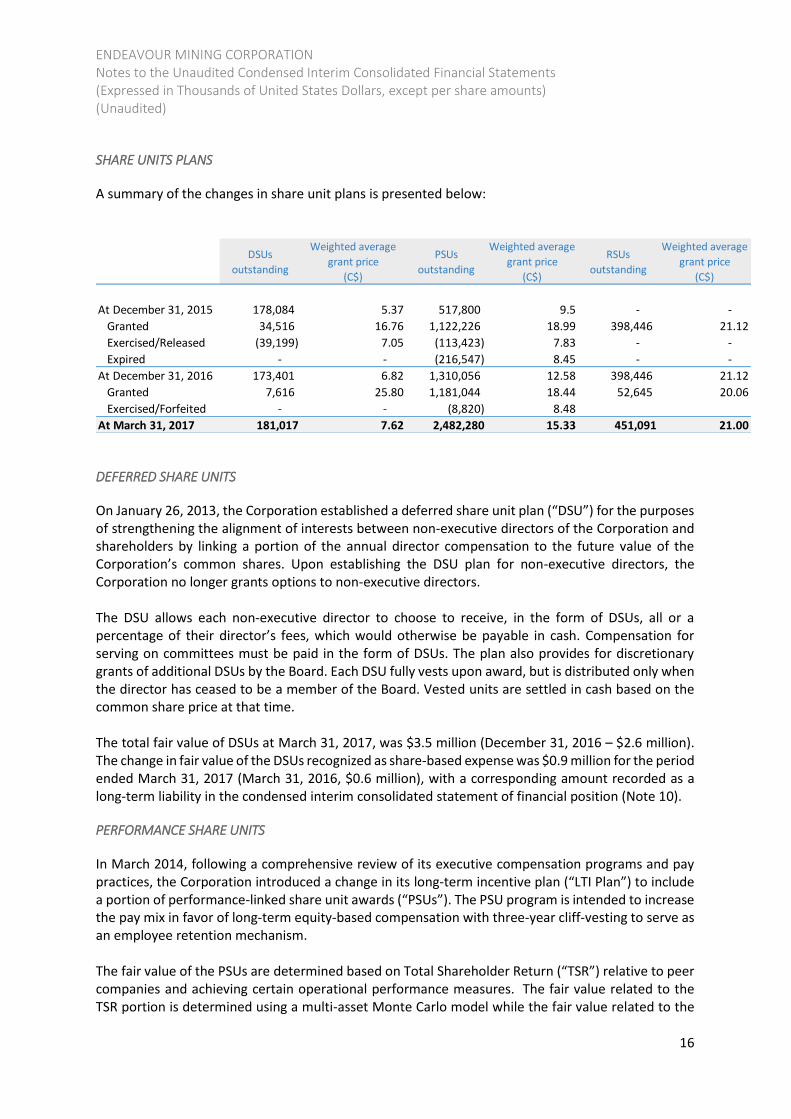
ENDEAVOUR MINING CORPORATION Notes to the Unaudited Condensed Interim Consolidated Financial Statements (Expressed in Thousands of United States Dollars, except per share amounts) (Unaudited)
16
SHARE UNITS PLANS
A summary of the changes in share unit plans is presented below:
DSUs
outstanding
Weighted average
grant price
(C$)
PSUs
outstanding
Weighted average
grant price
(C$)
RSUs
outstanding
Weighted average
grant price
(C$)
At December 31, 2015 178,084 5.37 517,800 9.5 - -
Granted 34,516 16.76 1,122,226 18.99 398,446 21.12
Exercised/Released (39,199) 7.05 (113,423) 7.83 - -
Expired - - (216,547) 8.45 - -
At December 31, 2016 173,401 6.82 1,310,056 12.58 398,446 21.12
Granted 7,616 25.80 1,181,044 18.44 52,645 20.06
Exercised/Forfeited - - (8,820) 8.48
At March 31, 2017 181,017 7.62 2,482,280 15.33 451,091 21.00
DEFERRED SHARE UNITS
On January 26, 2013, the Corporation established a deferred share unit plan (“DSU”) for the purposes of strengthening the alignment of interests between non-executive directors of the Corporation and shareholders by linking a portion of the annual director compensation to the future value of the Corporation’s common shares. Upon establishing the DSU plan for non-executive directors, the Corporation no longer grants options to non-executive directors. The DSU allows each non-executive director to choose to receive, in the form of DSUs, all or a percentage of their director’s fees, which would otherwise be payable in cash. Compensation for serving on committees must be paid in the form of DSUs. The plan also provides for discretionary grants of additional DSUs by the Board. Each DSU fully vests upon award, but is distributed only when the director has ceased to be a member of the Board. Vested units are settled in cash based on the common share price at that time. The total fair value of DSUs at March 31, 2017, was $3.5 million (December 31, 2016 – $2.6 million). The change in fair value of the DSUs recognized as share-based expense was $0.9 million for the period ended March 31, 2017 (March 31, 2016, $0.6 million), with a corresponding amount recorded as a long-term liability in the condensed interim consolidated statement of financial position (Note 10).
PERFORMANCE SHARE UNITS
In March 2014, following a comprehensive review of its executive compensation programs and pay practices, the Corporation introduced a change in its long-term incentive plan (“LTI Plan”) to include a portion of performance-linked share unit awards (“PSUs”). The PSU program is intended to increase the pay mix in favor of long-term equity-based compensation with three-year cliff-vesting to serve as an employee retention mechanism. The fair value of the PSUs are determined based on Total Shareholder Return (“TSR”) relative to peer companies and achieving certain operational performance measures. The fair value related to the TSR portion is determined using a multi-asset Monte Carlo model while the fair value related to the
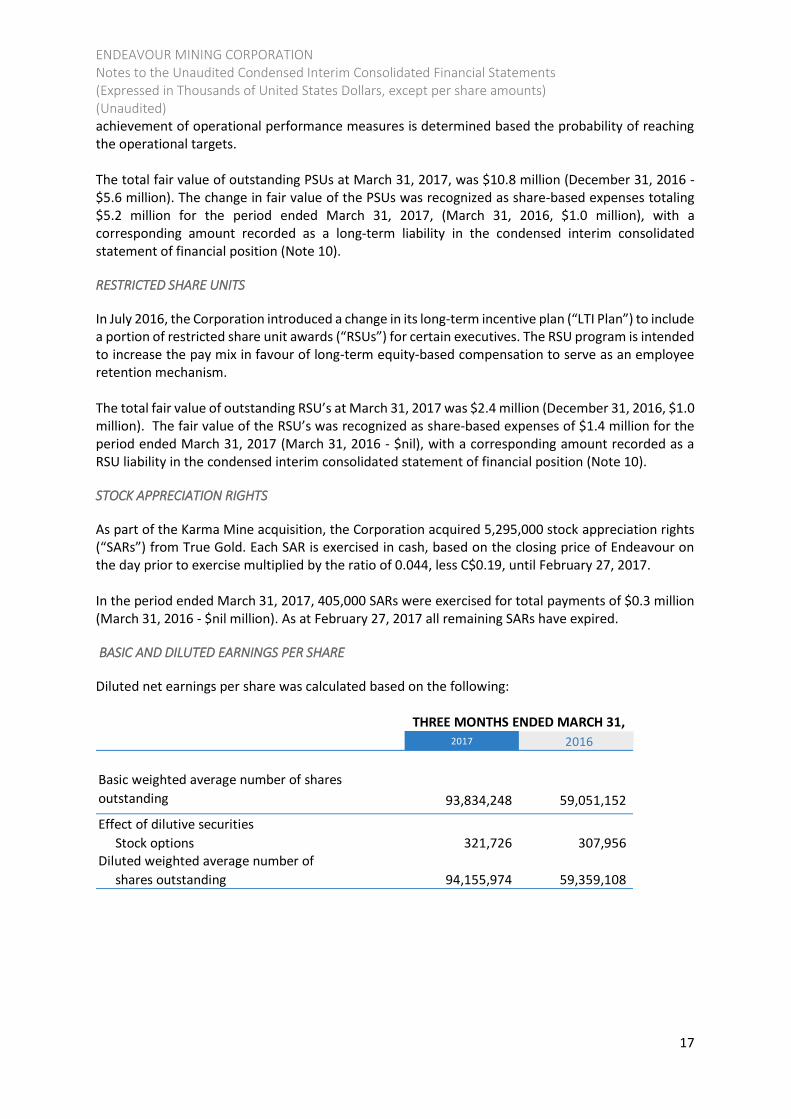
ENDEAVOUR MINING CORPORATION Notes to the Unaudited Condensed Interim Consolidated Financial Statements (Expressed in Thousands of United States Dollars, except per share amounts) (Unaudited)
17
achievement of operational performance measures is determined based the probability of reaching the operational targets. The total fair value of outstanding PSUs at March 31, 2017, was $10.8 million (December 31, 2016 - $5.6 million). The change in fair value of the PSUs was recognized as share-based expenses totaling $5.2 million for the period ended March 31, 2017, (March 31, 2016, $1.0 million), with a corresponding amount recorded as a long-term liability in the condensed interim consolidated statement of financial position (Note 10).
RESTRICTED SHARE UNITS
In July 2016, the Corporation introduced a change in its long-term incentive plan (“LTI Plan”) to include a portion of restricted share unit awards (“RSUs”) for certain executives. The RSU program is intended to increase the pay mix in favour of long-term equity-based compensation to serve as an employee retention mechanism. The total fair value of outstanding RSU’s at March 31, 2017 was $2.4 million (December 31, 2016, $1.0 million). The fair value of the RSU’s was recognized as share-based expenses of $1.4 million for the period ended March 31, 2017 (March 31, 2016 - $nil), with a corresponding amount recorded as a RSU liability in the condensed interim consolidated statement of financial position (Note 10).
STOCK APPRECIATION RIGHTS
As part of the Karma Mine acquisition, the Corporation acquired 5,295,000 stock appreciation rights (“SARs”) from True Gold. Each SAR is exercised in cash, based on the closing price of Endeavour on the day prior to exercise multiplied by the ratio of 0.044, less C$0.19, until February 27, 2017. In the period ended March 31, 2017, 405,000 SARs were exercised for total payments of $0.3 million (March 31, 2016 - $nil million). As at February 27, 2017 all remaining SARs have expired.
BASIC AND DILUTED EARNINGS PER SHARE
Diluted net earnings per share was calculated based on the following:
2017 2016
93,834,248 59,051,152
Effect of dilutive securities
Stock options 321,726 307,956 Diluted weighted average number of
shares outstanding 94,155,974 59,359,108
Basic weighted average number of shares
outstanding
THREE MONTHS ENDED MARCH 31,
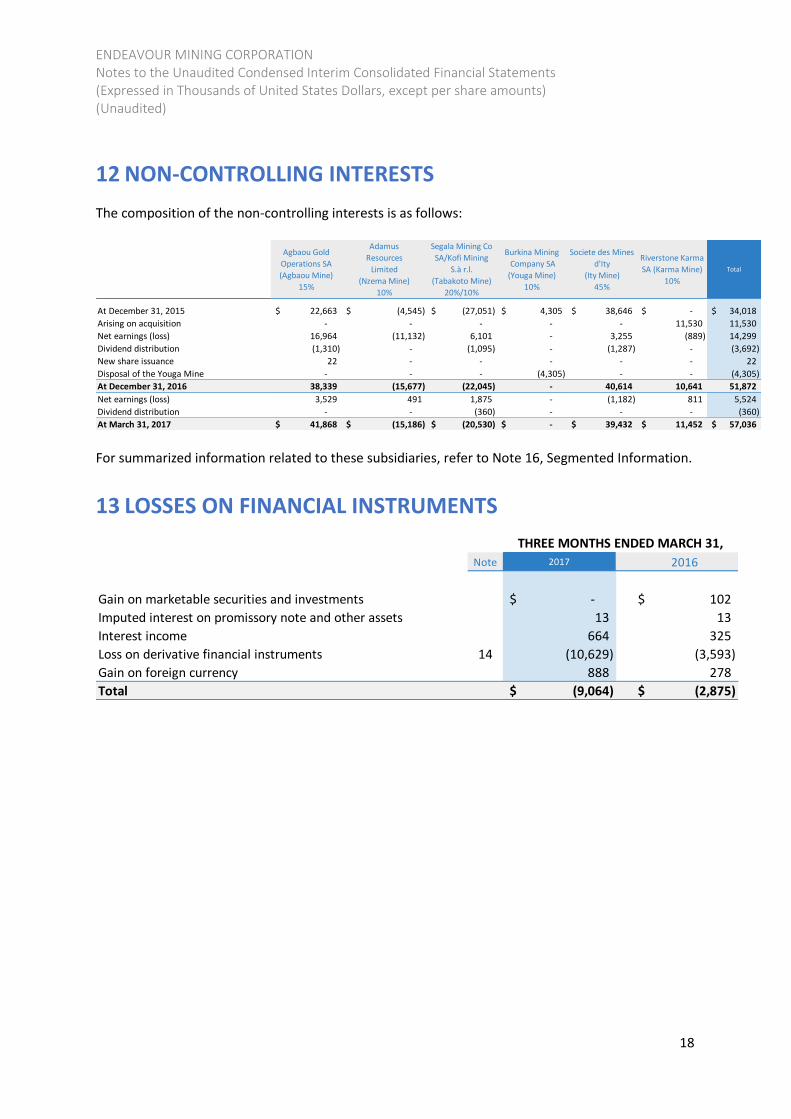
ENDEAVOUR MINING CORPORATION Notes to the Unaudited Condensed Interim Consolidated Financial Statements (Expressed in Thousands of United States Dollars, except per share amounts) (Unaudited)
18
12 NON-CONTROLLING INTERESTS
The composition of the non-controlling interests is as follows:
Agbaou Gold
Operations SA
(Agbaou Mine)
15%
Adamus
Resources
Limited
(Nzema Mine)
10%
Segala Mining Co
SA/Kofi Mining
S.à r.l.
(Tabakoto Mine)
20%/10%
Burkina Mining
Company SA
(Youga Mine)
10%
Societe des Mines
d'Ity
(Ity Mine)
45%
Riverstone Karma
SA (Karma Mine)
10%
Total
At December 31, 2015 22,663$ (4,545)$ (27,051)$ 4,305$ 38,646$ -$ 34,018$
Arising on acquisition - - - - - 11,530 11,530
Net earnings (loss) 16,964 (11,132) 6,101 - 3,255 (889) 14,299
Dividend distribution (1,310) - (1,095) - (1,287) - (3,692)
New share issuance 22 - - - - - 22
Disposal of the Youga Mine - - - (4,305) - - (4,305)
At December 31, 2016 38,339 (15,677) (22,045) - 40,614 10,641 51,872
Net earnings (loss) 3,529 491 1,875 - (1,182) 811 5,524
Dividend distribution - - (360) - - - (360)
At March 31, 2017 41,868$ (15,186)$ (20,530)$ -$ 39,432$ 11,452$ 57,036$ For summarized information related to these subsidiaries, refer to Note 16, Segmented Information.
13 LOSSES ON FINANCIAL INSTRUMENTS
Note 2017 2016
Gain on marketable securities and investments -$ 102$
Imputed interest on promissory note and other assets 13 13
Interest income 664 325
Loss on derivative financial instruments 14 (10,629) (3,593)
Gain on foreign currency 888 278
Total (9,064)$ (2,875)$
THREE MONTHS ENDED MARCH 31,
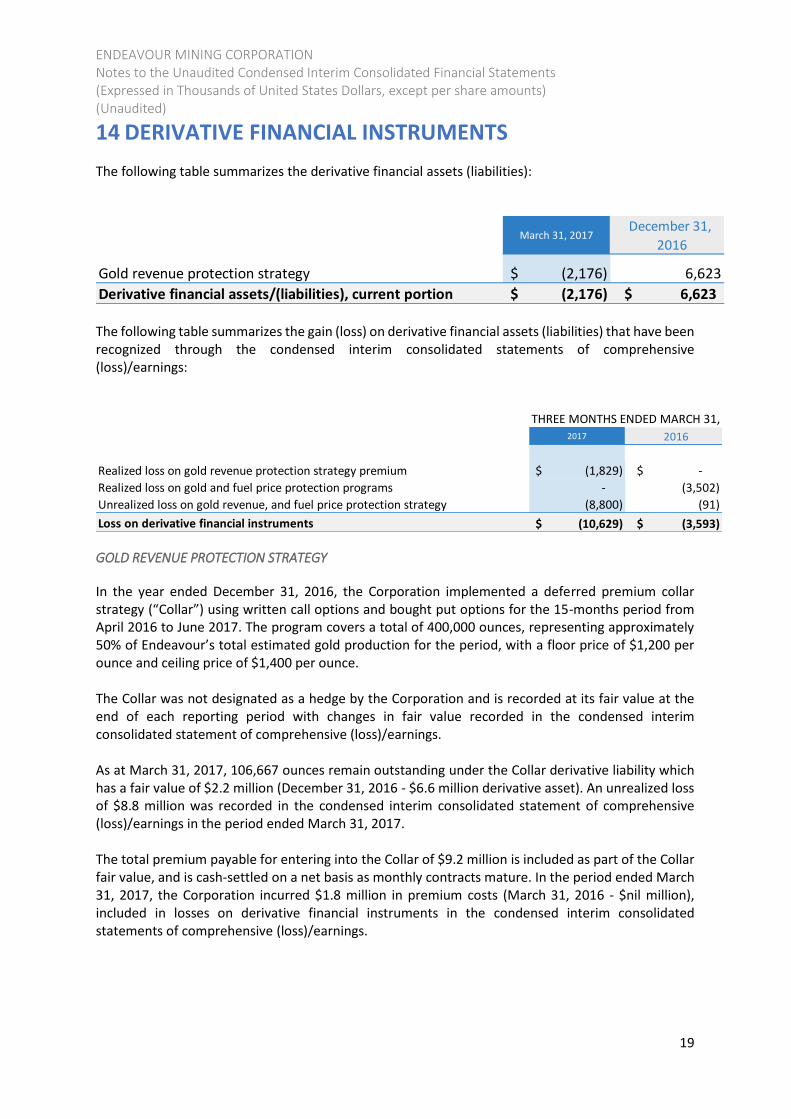
ENDEAVOUR MINING CORPORATION Notes to the Unaudited Condensed Interim Consolidated Financial Statements (Expressed in Thousands of United States Dollars, except per share amounts) (Unaudited)
19
14 DERIVATIVE FINANCIAL INSTRUMENTS
The following table summarizes the derivative financial assets (liabilities):
March 31, 2017December 31,
2016
Gold revenue protection strategy (2,176)$ 6,623
Derivative financial assets/(liabilities), current portion (2,176)$ 6,623$ The following table summarizes the gain (loss) on derivative financial assets (liabilities) that have been recognized through the condensed interim consolidated statements of comprehensive (loss)/earnings:
2017 2016
Realized loss on gold revenue protection strategy premium (1,829)$ -$
Realized loss on gold and fuel price protection programs - (3,502)
Unrealized loss on gold revenue, and fuel price protection strategy (8,800) (91)
Loss on derivative financial instruments (10,629)$ (3,593)$
THREE MONTHS ENDED MARCH 31,
GOLD REVENUE PROTECTION STRATEGY
In the year ended December 31, 2016, the Corporation implemented a deferred premium collar strategy (“Collar”) using written call options and bought put options for the 15-months period from April 2016 to June 2017. The program covers a total of 400,000 ounces, representing approximately 50% of Endeavour’s total estimated gold production for the period, with a floor price of $1,200 per ounce and ceiling price of $1,400 per ounce. The Collar was not designated as a hedge by the Corporation and is recorded at its fair value at the end of each reporting period with changes in fair value recorded in the condensed interim consolidated statement of comprehensive (loss)/earnings. As at March 31, 2017, 106,667 ounces remain outstanding under the Collar derivative liability which has a fair value of $2.2 million (December 31, 2016 - $6.6 million derivative asset). An unrealized loss of $8.8 million was recorded in the condensed interim consolidated statement of comprehensive (loss)/earnings in the period ended March 31, 2017. The total premium payable for entering into the Collar of $9.2 million is included as part of the Collar fair value, and is cash-settled on a net basis as monthly contracts mature. In the period ended March 31, 2017, the Corporation incurred $1.8 million in premium costs (March 31, 2016 - $nil million), included in losses on derivative financial instruments in the condensed interim consolidated statements of comprehensive (loss)/earnings.
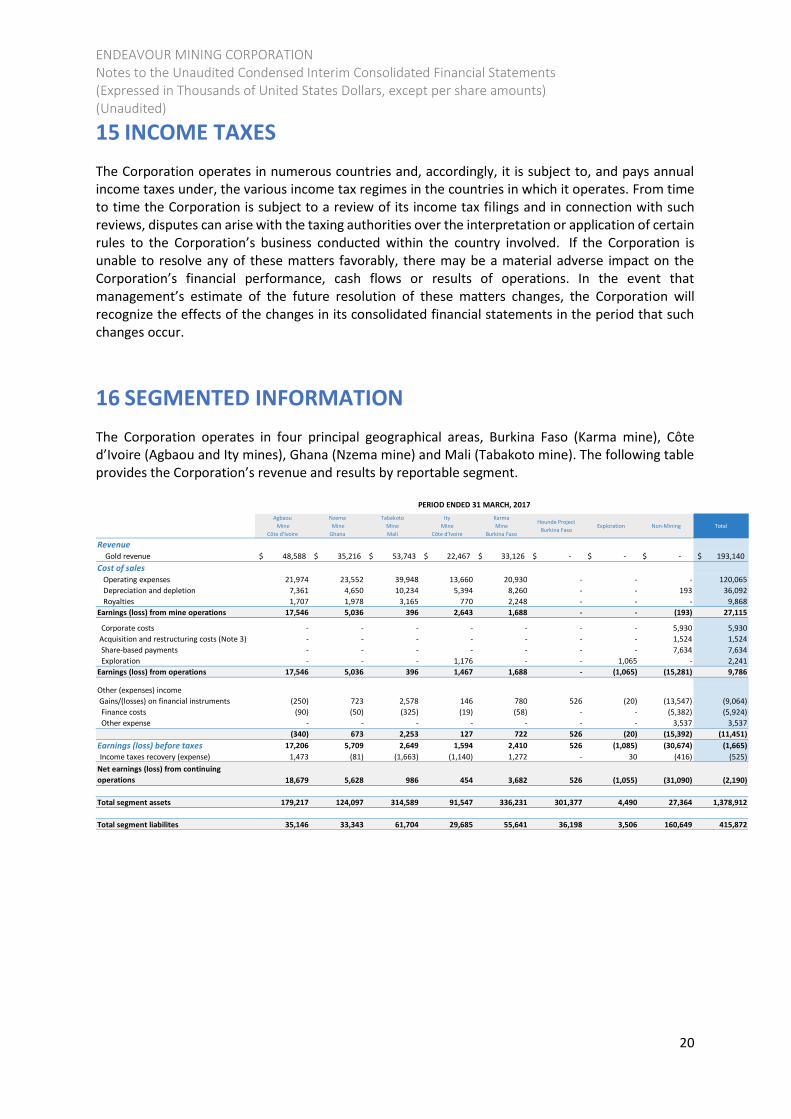
ENDEAVOUR MINING CORPORATION Notes to the Unaudited Condensed Interim Consolidated Financial Statements (Expressed in Thousands of United States Dollars, except per share amounts) (Unaudited)
20
15 INCOME TAXES
The Corporation operates in numerous countries and, accordingly, it is subject to, and pays annual income taxes under, the various income tax regimes in the countries in which it operates. From time to time the Corporation is subject to a review of its income tax filings and in connection with such reviews, disputes can arise with the taxing authorities over the interpretation or application of certain rules to the Corporation’s business conducted within the country involved. If the Corporation is unable to resolve any of these matters favorably, there may be a material adverse impact on the Corporation’s financial performance, cash flows or results of operations. In the event that management’s estimate of the future resolution of these matters changes, the Corporation will recognize the effects of the changes in its consolidated financial statements in the period that such changes occur.
16 SEGMENTED INFORMATION
The Corporation operates in four principal geographical areas, Burkina Faso (Karma mine), Côte d’Ivoire (Agbaou and Ity mines), Ghana (Nzema mine) and Mali (Tabakoto mine). The following table provides the Corporation’s revenue and results by reportable segment.
Agbaou
Mine
Côte d’Ivoire
Nzema
Mine
Ghana
Tabakoto
Mine
Mali
Ity
Mine
Côte d’Ivoire
Karma
Mine
Burkina Faso
Hounde Project
Burkina FasoExploration Non-Mining Total
Revenue Gold revenue 48,588$ 35,216$ 53,743$ 22,467$ 33,126$ -$ -$ -$ 193,140$
Cost of sales Operating expenses 21,974 23,552 39,948 13,660 20,930 - - - 120,065
Depreciation and depletion 7,361 4,650 10,234 5,394 8,260 - - 193 36,092
Royalties 1,707 1,978 3,165 770 2,248 - - - 9,868
Earnings (loss) from mine operations 17,546 5,036 396 2,643 1,688 - - (193) 27,115
Corporate costs - - - - - - - 5,930 5,930
Acquisition and restructuring costs (Note 3) - - - - - - - 1,524 1,524
Share-based payments - - - - - - - 7,634 7,634
Exploration - - - 1,176 - - 1,065 - 2,241
Earnings (loss) from operations 17,546 5,036 396 1,467 1,688 - (1,065) (15,281) 9,786
Other (expenses) income
Gains/(losses) on financial instruments (250) 723 2,578 146 780 526 (20) (13,547) (9,064)
Finance costs (90) (50) (325) (19) (58) - - (5,382) (5,924)
Other expense - - - - - - - 3,537 3,537
(340) 673 2,253 127 722 526 (20) (15,392) (11,451)
Earnings (loss) before taxes 17,206 5,709 2,649 1,594 2,410 526 (1,085) (30,674) (1,665)
Income taxes recovery (expense) 1,473 (81) (1,663) (1,140) 1,272 - 30 (416) (525)
Net earnings (loss) from continuing
operations 18,679 5,628 986 454 3,682 526 (1,055) (31,090) (2,190)
Total segment assets 179,217 124,097 314,589 91,547 336,231 301,377 4,490 27,364 1,378,912
Total segment liabilites 35,146 33,343 61,704 29,685 55,641 36,198 3,506 160,649 415,872
PERIOD ENDED 31 MARCH, 2017
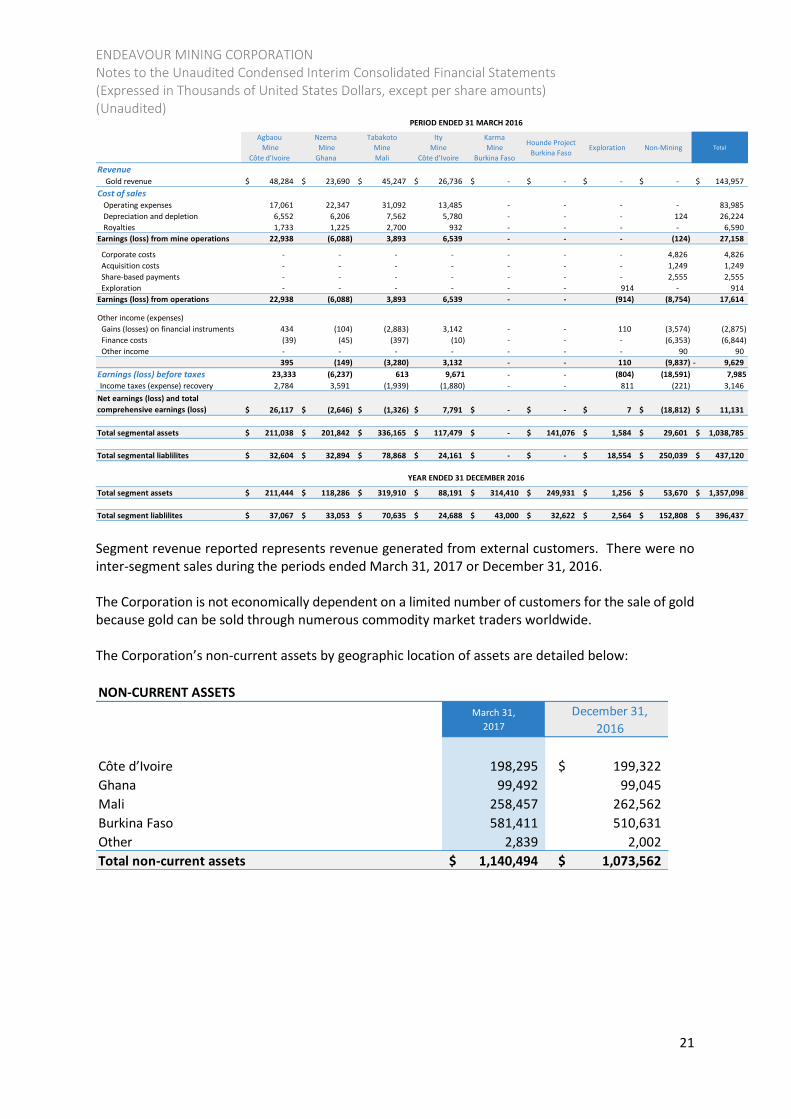
ENDEAVOUR MINING CORPORATION Notes to the Unaudited Condensed Interim Consolidated Financial Statements (Expressed in Thousands of United States Dollars, except per share amounts) (Unaudited)
21
Agbaou
Mine
Côte d’Ivoire
Nzema
Mine
Ghana
Tabakoto
Mine
Mali
Ity
Mine
Côte d’Ivoire
Karma
Mine
Burkina Faso
Hounde Project
Burkina FasoExploration Non-Mining Total
Revenue Gold revenue 48,284$ 23,690$ 45,247$ 26,736$ -$ -$ -$ -$ 143,957$
Cost of sales Operating expenses 17,061 22,347 31,092 13,485 - - - - 83,985
Depreciation and depletion 6,552 6,206 7,562 5,780 - - - 124 26,224
Royalties 1,733 1,225 2,700 932 - - - - 6,590
Earnings (loss) from mine operations 22,938 (6,088) 3,893 6,539 - - - (124) 27,158
Corporate costs - - - - - - - 4,826 4,826
Acquisition costs - - - - - - - 1,249 1,249
Share-based payments - - - - - - - 2,555 2,555
Exploration - - - - - - 914 - 914
Earnings (loss) from operations 22,938 (6,088) 3,893 6,539 - - (914) (8,754) 17,614
Other income (expenses)
Gains (losses) on financial instruments 434 (104) (2,883) 3,142 - - 110 (3,574) (2,875)
Finance costs (39) (45) (397) (10) - - - (6,353) (6,844)
Other income - - - - - - - 90 90
395 (149) (3,280) 3,132 - - 110 (9,837) 9,629-
Earnings (loss) before taxes 23,333 (6,237) 613 9,671 - - (804) (18,591) 7,985
Income taxes (expense) recovery 2,784 3,591 (1,939) (1,880) - - 811 (221) 3,146
Net earnings (loss) and total
comprehensive earnings (loss) 26,117$ (2,646)$ (1,326)$ 7,791$ -$ -$ 7$ (18,812)$ 11,131$
Total segmental assets 211,038$ 201,842$ 336,165$ 117,479$ -$ 141,076$ 1,584$ 29,601$ 1,038,785$
Total segmental liablilites 32,604$ 32,894$ 78,868$ 24,161$ -$ -$ 18,554$ 250,039$ 437,120$
Total segment assets 211,444$ 118,286$ 319,910$ 88,191$ 314,410$ 249,931$ 1,256$ 53,670$ 1,357,098$
Total segment liablilites 37,067$ 33,053$ 70,635$ 24,688$ 43,000$ 32,622$ 2,564$ 152,808$ 396,437$
PERIOD ENDED 31 MARCH 2016
YEAR ENDED 31 DECEMBER 2016
Segment revenue reported represents revenue generated from external customers. There were no inter-segment sales during the periods ended March 31, 2017 or December 31, 2016. The Corporation is not economically dependent on a limited number of customers for the sale of gold because gold can be sold through numerous commodity market traders worldwide. The Corporation’s non-current assets by geographic location of assets are detailed below:
NON-CURRENT ASSETS
March 31,
2017
December 31,
2016
Côte d’Ivoire 198,295 199,322$
Ghana 99,492 99,045
Mali 258,457 262,562
Burkina Faso 581,411 510,631
Other 2,839 2,002
Total non-current assets 1,140,494$ 1,073,562$
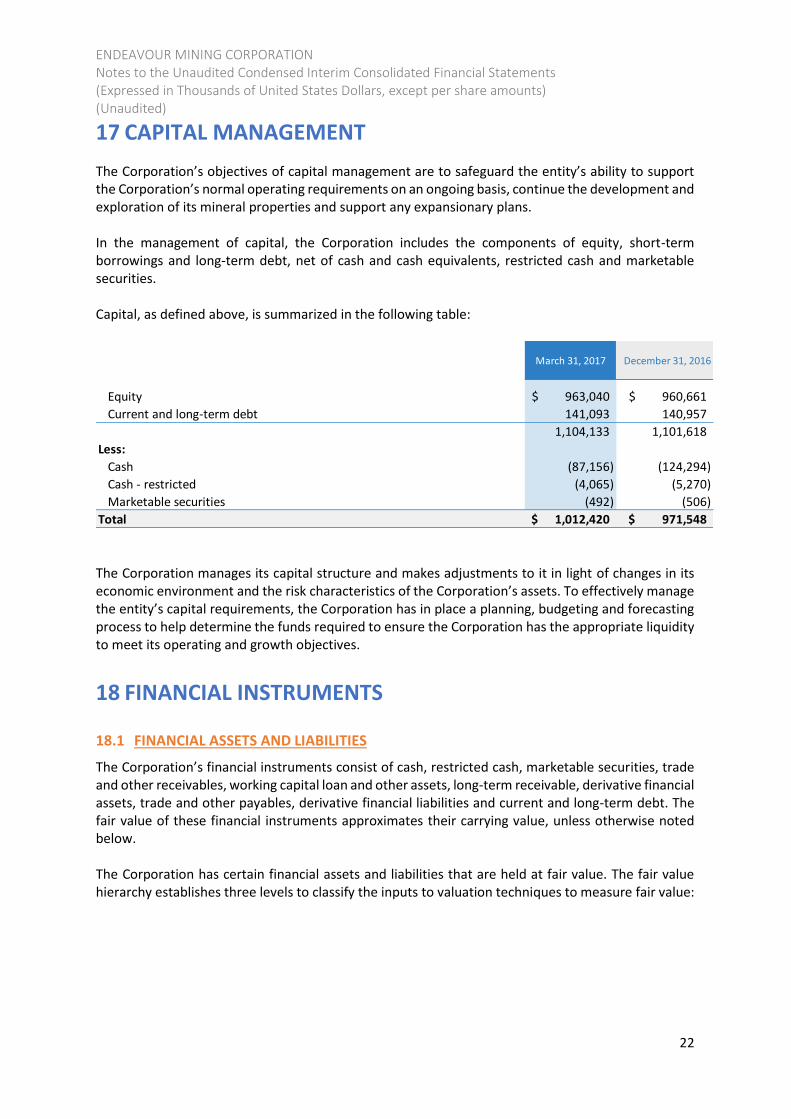
ENDEAVOUR MINING CORPORATION Notes to the Unaudited Condensed Interim Consolidated Financial Statements (Expressed in Thousands of United States Dollars, except per share amounts) (Unaudited)
22
17 CAPITAL MANAGEMENT
The Corporation’s objectives of capital management are to safeguard the entity’s ability to support the Corporation’s normal operating requirements on an ongoing basis, continue the development and exploration of its mineral properties and support any expansionary plans. In the management of capital, the Corporation includes the components of equity, short-term borrowings and long-term debt, net of cash and cash equivalents, restricted cash and marketable securities. Capital, as defined above, is summarized in the following table:
March 31, 2017 December 31, 2016
Equity 963,040$ 960,661$
Current and long-term debt 141,093 140,957
1,104,133 1,101,618
Less:
Cash (87,156) (124,294)
Cash - restricted (4,065) (5,270)
Marketable securities (492) (506)
Total 1,012,420$ 971,548$ The Corporation manages its capital structure and makes adjustments to it in light of changes in its economic environment and the risk characteristics of the Corporation’s assets. To effectively manage the entity’s capital requirements, the Corporation has in place a planning, budgeting and forecasting process to help determine the funds required to ensure the Corporation has the appropriate liquidity to meet its operating and growth objectives.
18 FINANCIAL INSTRUMENTS
18.1 FINANCIAL ASSETS AND LIABILITIES
The Corporation’s financial instruments consist of cash, restricted cash, marketable securities, trade and other receivables, working capital loan and other assets, long-term receivable, derivative financial assets, trade and other payables, derivative financial liabilities and current and long-term debt. The fair value of these financial instruments approximates their carrying value, unless otherwise noted below. The Corporation has certain financial assets and liabilities that are held at fair value. The fair value hierarchy establishes three levels to classify the inputs to valuation techniques to measure fair value:
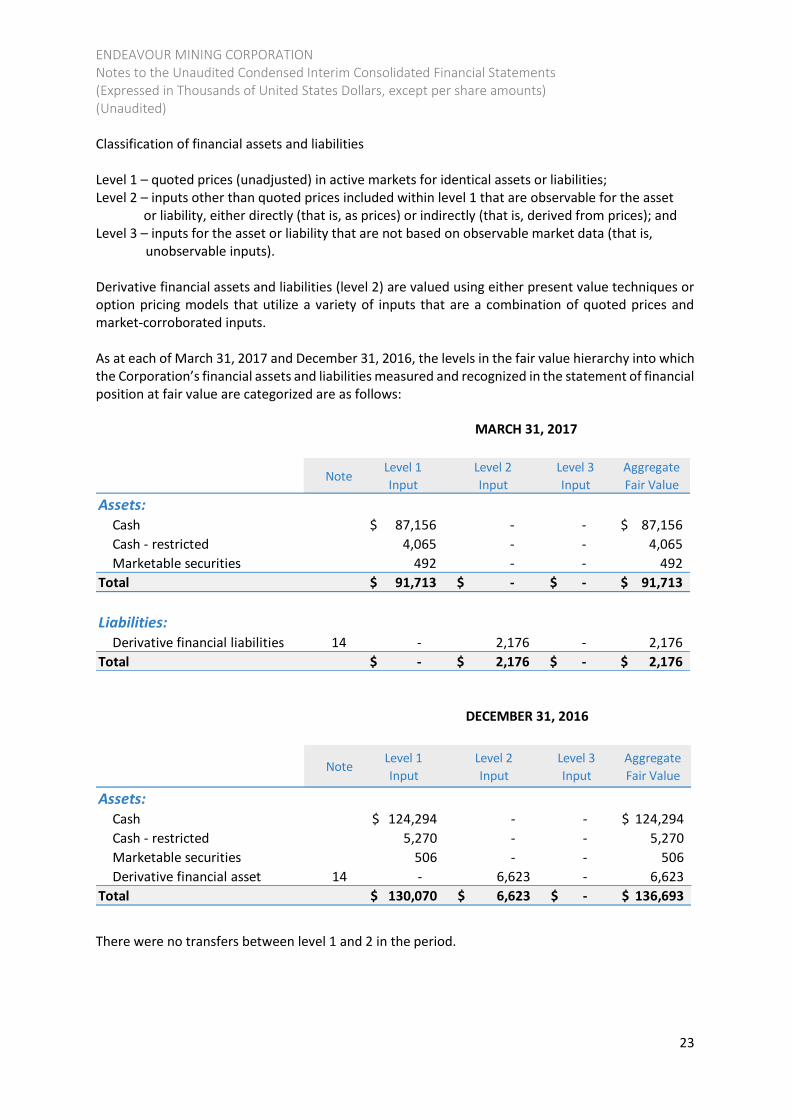
ENDEAVOUR MINING CORPORATION Notes to the Unaudited Condensed Interim Consolidated Financial Statements (Expressed in Thousands of United States Dollars, except per share amounts) (Unaudited)
23
Classification of financial assets and liabilities Level 1 – quoted prices (unadjusted) in active markets for identical assets or liabilities; Level 2 – inputs other than quoted prices included within level 1 that are observable for the asset or liability, either directly (that is, as prices) or indirectly (that is, derived from prices); and Level 3 – inputs for the asset or liability that are not based on observable market data (that is, unobservable inputs). Derivative financial assets and liabilities (level 2) are valued using either present value techniques or option pricing models that utilize a variety of inputs that are a combination of quoted prices and market-corroborated inputs. As at each of March 31, 2017 and December 31, 2016, the levels in the fair value hierarchy into which the Corporation’s financial assets and liabilities measured and recognized in the statement of financial position at fair value are categorized are as follows:
NoteLevel 1
Input
Level 2
Input
Level 3
Input
Aggregate
Fair Value
Assets: Cash 87,156$ - - 87,156$
Cash - restricted 4,065 - - 4,065
Marketable securities 492 - - 492
Total 91,713$ -$ -$ 91,713$
Liabilities:
Derivative financial liabilities 14 - 2,176 - 2,176
Total -$ 2,176$ -$ 2,176$
MARCH 31, 2017
NoteLevel 1
Input
Level 2
Input
Level 3
Input
Aggregate
Fair Value
Assets: Cash 124,294$ - - 124,294$
Cash - restricted 5,270 - - 5,270
Marketable securities 506 - - 506
Derivative financial asset 14 - 6,623 - 6,623
Total 130,070$ 6,623$ -$ 136,693$
DECEMBER 31, 2016
There were no transfers between level 1 and 2 in the period.
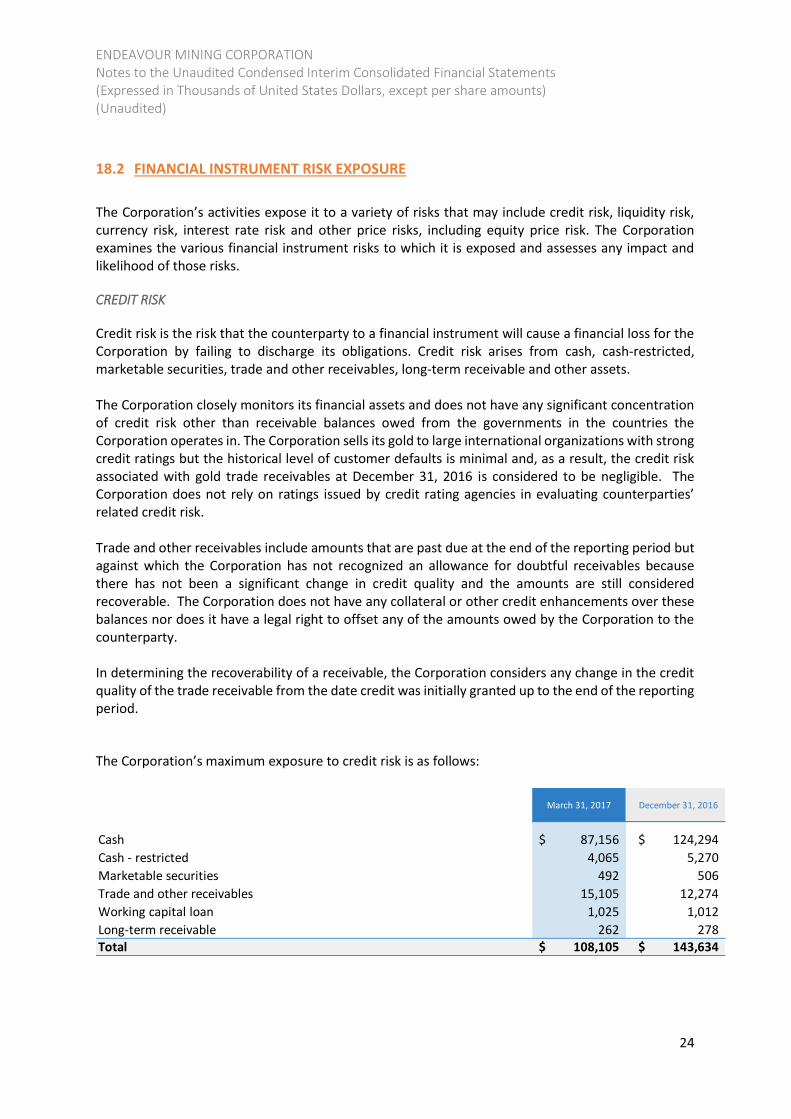
ENDEAVOUR MINING CORPORATION Notes to the Unaudited Condensed Interim Consolidated Financial Statements (Expressed in Thousands of United States Dollars, except per share amounts) (Unaudited)
24
18.2 FINANCIAL INSTRUMENT RISK EXPOSURE
The Corporation’s activities expose it to a variety of risks that may include credit risk, liquidity risk, currency risk, interest rate risk and other price risks, including equity price risk. The Corporation examines the various financial instrument risks to which it is exposed and assesses any impact and likelihood of those risks.
CREDIT RISK
Credit risk is the risk that the counterparty to a financial instrument will cause a financial loss for the Corporation by failing to discharge its obligations. Credit risk arises from cash, cash-restricted, marketable securities, trade and other receivables, long-term receivable and other assets. The Corporation closely monitors its financial assets and does not have any significant concentration of credit risk other than receivable balances owed from the governments in the countries the Corporation operates in. The Corporation sells its gold to large international organizations with strong credit ratings but the historical level of customer defaults is minimal and, as a result, the credit risk associated with gold trade receivables at December 31, 2016 is considered to be negligible. The Corporation does not rely on ratings issued by credit rating agencies in evaluating counterparties’ related credit risk. Trade and other receivables include amounts that are past due at the end of the reporting period but against which the Corporation has not recognized an allowance for doubtful receivables because there has not been a significant change in credit quality and the amounts are still considered recoverable. The Corporation does not have any collateral or other credit enhancements over these balances nor does it have a legal right to offset any of the amounts owed by the Corporation to the counterparty. In determining the recoverability of a receivable, the Corporation considers any change in the credit quality of the trade receivable from the date credit was initially granted up to the end of the reporting period.
The Corporation’s maximum exposure to credit risk is as follows:
March 31, 2017 December 31, 2016
Cash 87,156$ 124,294$
Cash - restricted 4,065 5,270
Marketable securities 492 506
Trade and other receivables 15,105 12,274
Working capital loan 1,025 1,012
Long-term receivable 262 278 Total 108,105$ 143,634$
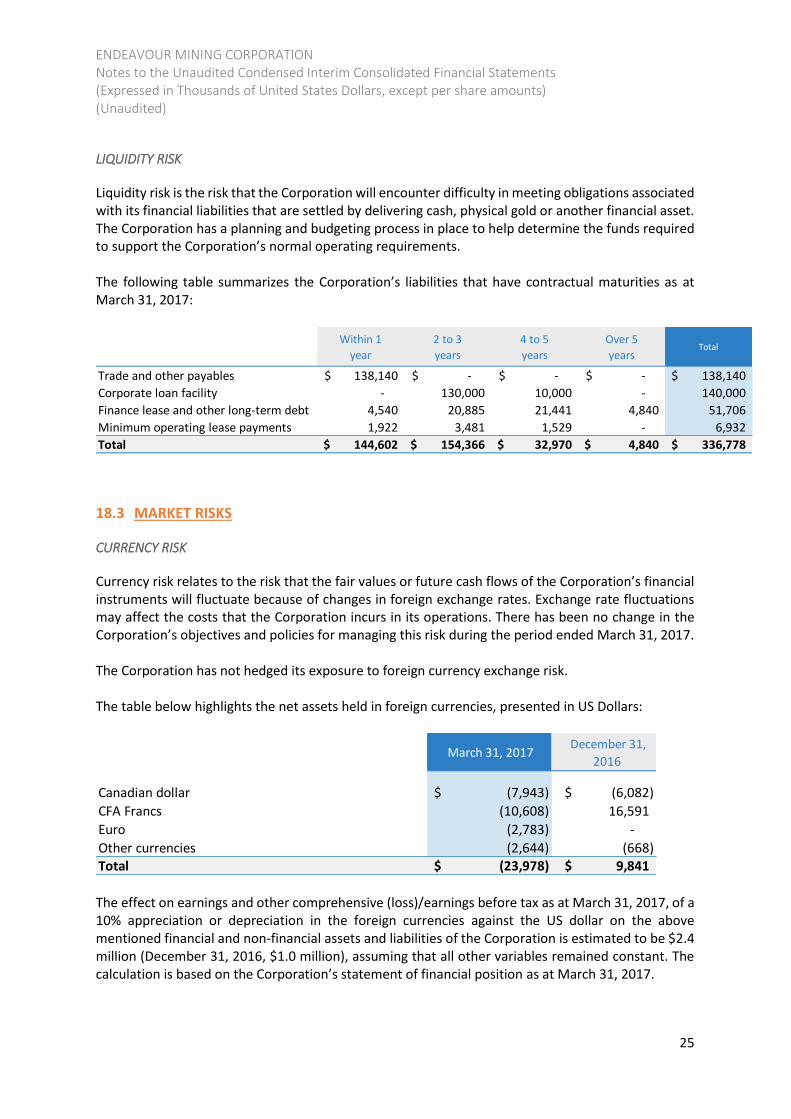
ENDEAVOUR MINING CORPORATION Notes to the Unaudited Condensed Interim Consolidated Financial Statements (Expressed in Thousands of United States Dollars, except per share amounts) (Unaudited)
25
LIQUIDITY RISK
Liquidity risk is the risk that the Corporation will encounter difficulty in meeting obligations associated with its financial liabilities that are settled by delivering cash, physical gold or another financial asset. The Corporation has a planning and budgeting process in place to help determine the funds required to support the Corporation’s normal operating requirements. The following table summarizes the Corporation’s liabilities that have contractual maturities as at March 31, 2017:
Within 1
year
2 to 3
years
4 to 5
years
Over 5
yearsTotal
Trade and other payables 138,140$ -$ -$ -$ 138,140$
Corporate loan facility - 130,000 10,000 - 140,000
Finance lease and other long-term debt 4,540 20,885 21,441 4,840 51,706
Minimum operating lease payments 1,922 3,481 1,529 - 6,932
Total 144,602$ 154,366$ 32,970$ 4,840$ 336,778$
18.3 MARKET RISKS
CURRENCY RISK
Currency risk relates to the risk that the fair values or future cash flows of the Corporation’s financial instruments will fluctuate because of changes in foreign exchange rates. Exchange rate fluctuations may affect the costs that the Corporation incurs in its operations. There has been no change in the Corporation’s objectives and policies for managing this risk during the period ended March 31, 2017. The Corporation has not hedged its exposure to foreign currency exchange risk. The table below highlights the net assets held in foreign currencies, presented in US Dollars:
March 31, 2017 December 31,
2016
Canadian dollar (7,943)$ (6,082)$
CFA Francs (10,608) 16,591
Euro (2,783) -
Other currencies (2,644) (668) Total (23,978)$ 9,841$ The effect on earnings and other comprehensive (loss)/earnings before tax as at March 31, 2017, of a 10% appreciation or depreciation in the foreign currencies against the US dollar on the above mentioned financial and non-financial assets and liabilities of the Corporation is estimated to be $2.4 million (December 31, 2016, $1.0 million), assuming that all other variables remained constant. The calculation is based on the Corporation’s statement of financial position as at March 31, 2017.
ENDEAVOUR MINING CORPORATION Notes to the Unaudited Condensed Interim Consolidated Financial Statements (Expressed in Thousands of United States Dollars, except per share amounts) (Unaudited)
26
INTEREST RATE RISK
Interest rate risk is the risk that future cash flows from, or the fair values of, the Corporation’s financial instruments will fluctuate because of changes in market interest rates. The Corporation is exposed to interest rate risk primarily on its long-term debt. Since marketable securities and government treasury securities held as loans are short term in nature and are usually held to maturity, there is minimal fair value sensitivity to changes in interest rates. The Corporation continually monitors its exposure to interest rates and is comfortable with its exposure given the relatively low short-term US interest rates and LIBOR. The effect on earnings and other comprehensive (loss)/earnings before tax as at March 31, 2017, of a 10% change in the LIBOR rate on the Facility is estimated to be $0.1 million (December 31, 2016 - $0.1 million).
PRICE RISK
Price risk is the risk that the fair value or future cash flows of the Corporation’s financial instruments will fluctuate because of changes in market prices. There has been no change in the Corporation’s objectives and policies for managing this risk and no significant changes to the Corporation’s exposure to price risk during the period ended March 31, 2017.
ENDEAVOUR MINING CORPORATION Notes to the Unaudited Condensed Interim Consolidated Financial Statements (Expressed in Thousands of United States Dollars, except per share amounts) (Unaudited)
27
19 COMMITMENTS AND CONTINGENCIES
› The Corporation has commitments in place at all six of its mines and other key projects for drill and blasting services, load and haul services, supply of explosives and supply of hydrocarbon services.
› The Corporation has various contracts in place at Nzema mine to purchase higher grade ore from third parties for processing that typically do not extend to more than one year.
› The Corporation is subject to operating and finance lease commitments in connection with the purchase of mining equipment, light duty vehicles and workshop and rented office premises.
› The Corporation is, from time to time, involved in various claims, legal proceedings, tax assessments and complaints arising in the ordinary course of business. The Corporation cannot reasonably predict the likelihood or outcome of these actions. The Corporation does not believe that adverse decisions in any other pending or threatened proceedings related to any matter, or any amount which may be required to be paid by reason thereof, will have a material effect on the financial condition or future results of operations.
› The Corporation’s mining and exploration activities are subject to various laws and regulations governing the protection of the environment. These laws and regulations are continually changing and are generally becoming more restrictive. The Corporation believes its operations are materially in compliance with all applicable laws and regulations. The Corporation has made, and expects to make in the future, expenditures to comply with such laws and regulations.
20 SUBSEQUENT EVENTS
› On April 17, 2017 the Corporation announced that its largest shareholder, La Mancha Holding S.A R.L (“La Mancha”) exercised its anti-dilution right to increase its stake from the current 28.1% interest to the initial 29.9% ownership position, by means of a CAD$63.4 million (US$47.5 million) private placement. Pursuant to the placement, La Mancha acquired 2,573,372 common shares of Endeavour Mining Corporation on April 25, 2017. Of the Corporations outstanding common shares, La Mancha holds 28,826,304 common shares, representing 29.99% of the Corporation’s common shares.