Embed Size (px)
Citation preview
May 7, 2019 Investor relations
First Quarter 2019 Results
Forenote
IFRS 16 has been implemented in the Group’s financial statements since January 1, 2019. Comparative information for the first quarter of
2018 in the business review is presented on an unaudited pro forma basis as if the implementation had taken place on January 1, 2018.
This information is labelled “pro forma” or “PF”. The balance sheet evolution is compared with January 1, 2019, which includes the IFRS
16 impact versus December 31, 2018.
Besides IFRS accounts, Solvay also presents underlying Income Statement performance indicators to provide a more consistent and
comparable indication of the Group’s financial performance. The underlying performance indicators adjust IFRS figures for the non-cash
Purchase Price Allocation (PPA) accounting impacts related to acquisitions, for the coupons of perpetual hybrid bonds, classified as equity
under IFRS but treated as debt in the underlying statements, and for other elements that would distort the analysis of the Group’s
underlying performance.
May 7, 2019
First Quarter Results 2

New Executive Committee
Simplified to 4 business leaders and the CEO
Human Resources Officer (to be hired)
New accountabilities & responsibilities
Portfolio P&L responsibility
Strategic transversal growth platforms
Value creation
Customer is the center of everything we do
Disciplined resource allocation for the enterprise
Innovation focused
Realigned executive committee
Built on extensive experience and business leadership
3 May 7, 2019
First Quarter Results
Ilham Kadri, CEO
Since March 1, 2019
Vincent
De Cuyper
Soda Ash & Derivatives,
Aroma Performance
and Peroxides
Augusto
Di Donfrancesco
Specialty Polymers,
Composite Materials
and Thermoplastic Composites
Hua
Du
Special Chem, Silica,
Novecare, Coatis
and Technology Solutions
Karim
Hajjar
CFO

Results in line with expectations
Amid challenging macro conditions
4 May 7, 2019
First Quarter Results
Volumes impacted by headwinds in automotive,
electronics and oil & gas, exacerbated by customer
destocking
Positive net pricing despite higher raw material and
energy prices
Working capital
needs up due to
phasing and higher
inventories in
subdued market
conditions
Net debt / EBITDA
leverage ratio
maintained at 2.1x
[1] Free cash flow after financing payments and minority interests
Margin EBITDA / net sales
EPS underlying
from cont. ops.
largely stable
+1.0%
EBITDA underlying
largely stable
organic growth
-0.6% maintained at
22%
FCF to Solvay shareholders[1]
from cont. ops.
€(91)m
Positive effect of
forex conversion
Total EPS up +18%,
including strong
contribution from
discontinued
operations
Q1 2019 RESULTS
FINANCIAL
HIGHLIGHTS
Automotive 29%
Aerospace 22%
6% 4%
9% 5%
13%
Electricals &
Electronics 12% Advanced
Materials
Automotive Aerospace & other
Resources & Environment Agro, Feed & Food
Consumers goods & Healthcare Building & Construction
Industrial Applications Electricals & Electronics
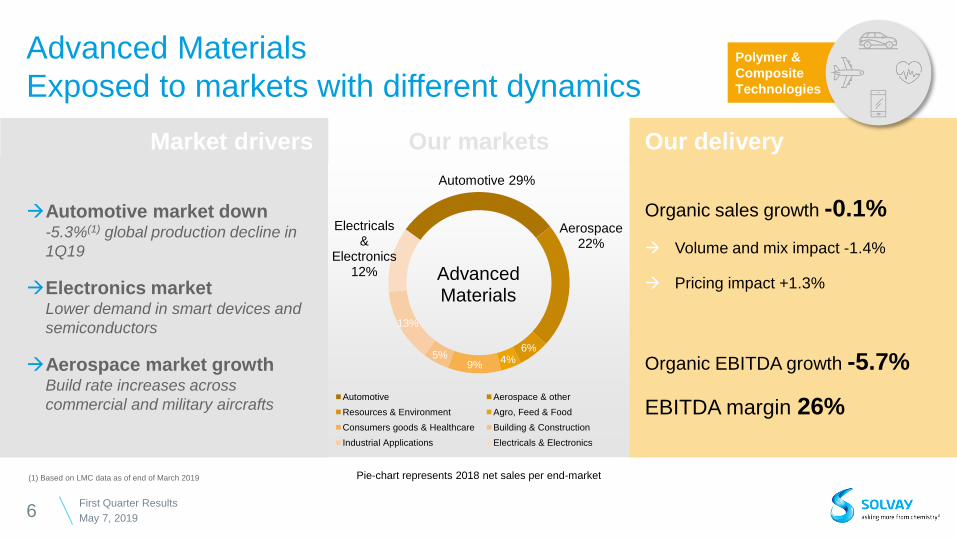
Advanced Materials
Exposed to markets with different dynamics
6 May 7, 2019
First Quarter Results
Organic sales growth -0.1%
Volume and mix impact -1.4%
Pricing impact +1.3%
Organic EBITDA growth -5.7%
EBITDA margin 26%
Automotive market down -5.3%(1) global production decline in
1Q19
Electronics market Lower demand in smart devices and
semiconductors
Aerospace market growth Build rate increases across
commercial and military aircrafts
(1) Based on LMC data as of end of March 2019 Pie-chart represents 2018 net sales per end-market
Market drivers Our delivery Our markets
Polymer &
Composite
Technologies
1%
Oil & gas 19%
Mining & Environmental 13%
Agro, Feed & Food
15%
19%
7%
24%
1% Advanced
Formulations
Automotive & Aerospace Oil & gas
Mining & Other Agro, Feed & Food
Consumers goods & Healthcare Building & Construction
Industrial Applications Electricals & Electronics
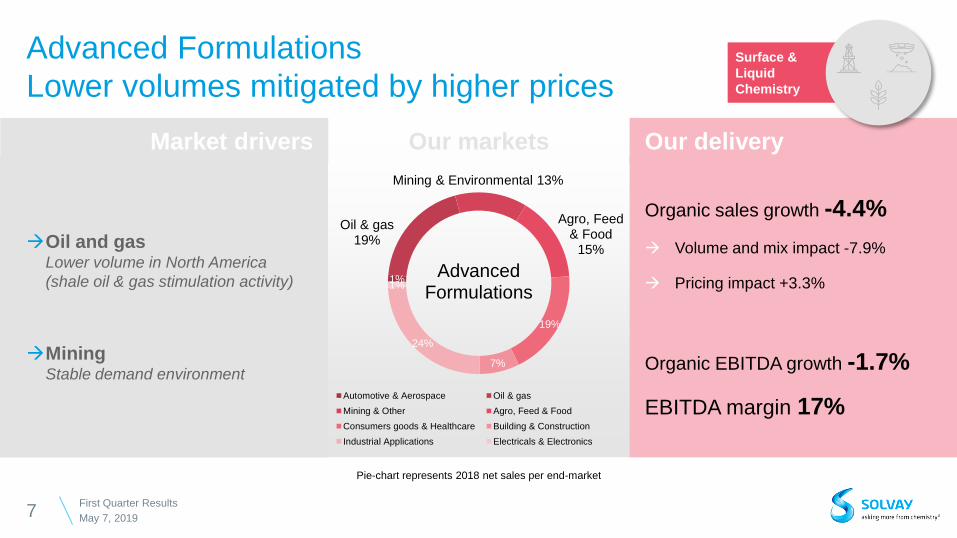
Advanced Formulations
Lower volumes mitigated by higher prices
7 May 7, 2019
First Quarter Results
Oil and gas Lower volume in North America
(shale oil & gas stimulation activity)
Mining Stable demand environment
Organic sales growth -4.4%
Volume and mix impact -7.9%
Pricing impact +3.3%
Organic EBITDA growth -1.7%
EBITDA margin 17%
Pie-chart represents 2018 net sales per end-market
Market drivers Our delivery Our markets
Surface &
Liquid
Chemistry
5%
9% 19%
Consumers goods &
Healthcare 27%
Building & Construction 13%
Industrial applications
27%
0%
Performance Chemicals
Automotive & Aerospace Resources & Environment
Agro, Feed & Food Consumers goods & Healthcare
Building & Construction Industrial Applications
Electricals & Electronics
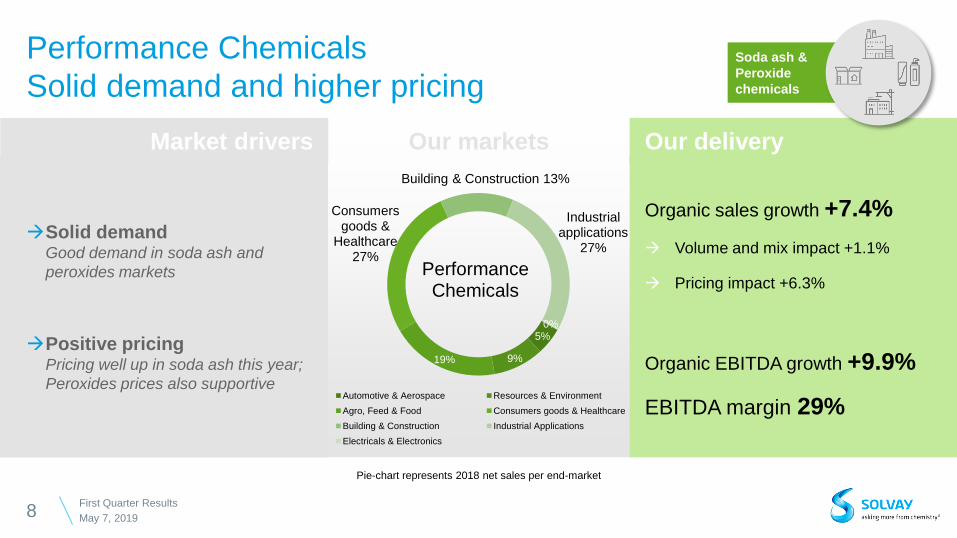
Performance Chemicals
Solid demand and higher pricing
8 May 7, 2019
First Quarter Results
Organic sales growth +7.4%
Volume and mix impact +1.1%
Pricing impact +6.3%
Organic EBITDA growth +9.9%
EBITDA margin 29%
Solid demand Good demand in soda ash and
peroxides markets
Positive pricing Pricing well up in soda ash this year;
Peroxides prices also supportive
Pie-chart represents 2018 net sales per end-market
Market drivers Our delivery Our markets
Soda ash &
Peroxide
chemicals

Positive net pricing offsets volume decline
Leading to sustained EBITDA margin
9 May 7, 2019
First Quarter Results
Underlying EBITDA largely stable organically
Lower volume in core markets including automotive,
electronics and oil & gas; strong performance in
aerospace
Positive net pricing offsets higher raw material and
energy prices
Fixed costs reflecting wage inflation and the expanded
production capabilities in Composite Materials
Underlying EPS +1%
from continuing operations
Positive effect of forex conversion
Total EPS up +18%, including strong contribution from
discontinued operations
Q1 2018 PF
Scope -0.6%
Forex conversion
+3.6%
Volume & mix -4.3%
Net pricing +5.0%
Fixed costs -1.8%
Equity earnings & other +0.5%
Q1 2019
558 (4) 20 (24) 28 (10) 3 571
+2.4%
Margin
22%
Underlying EBITDA (in € million)
Margin
22%
-0.6%
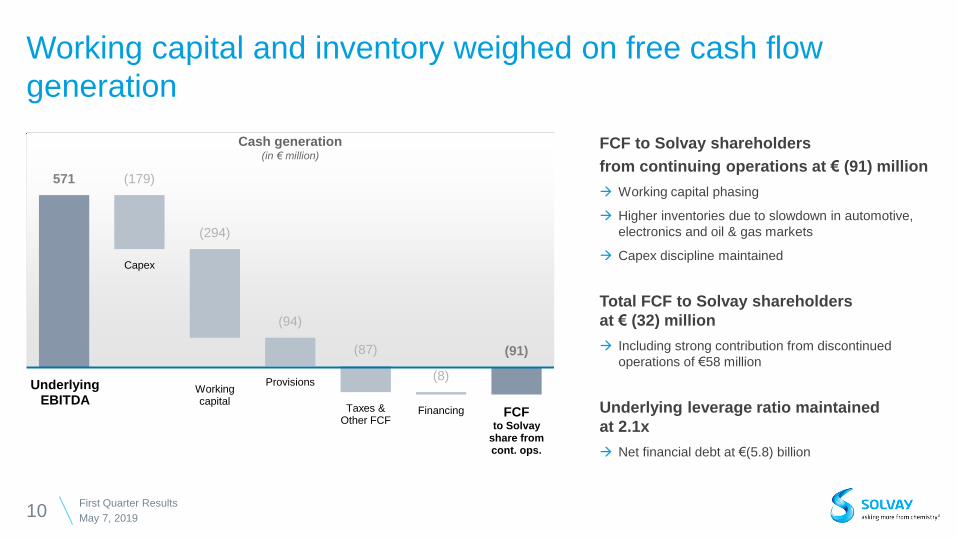
Working capital and inventory weighed on free cash flow
generation
10 May 7, 2019
First Quarter Results
Underlying EBITDA
Capex
Working capital
Provisions
Taxes & Other FCF
Financing FCF to Solvay
share from cont. ops.
571 (179)
(294)
(94)
(87)
(8)
(91)
FCF to Solvay shareholders
from continuing operations at € (91) million
Working capital phasing
Higher inventories due to slowdown in automotive,
electronics and oil & gas markets
Capex discipline maintained
Total FCF to Solvay shareholders
at € (32) million
Including strong contribution from discontinued
operations of €58 million
Underlying leverage ratio maintained
at 2.1x
Net financial debt at €(5.8) billion
Cash generation (in € million)

2019 outlook
adjusted to current market context
11 May 7, 2019
First Quarter Results
Organic growth [1]
flat to modest decline
Q2 down versus 2018
€490 million [2]
exceeding dividend pay-out
Allowing for debt deleveraging
of ~€100 million
[1] Organic growth, excluding scope & forex conversion effects and IFRS 16 effect, compared to 2018 pro forma of €2,330 million
[2] vs 2018 pro forma of €566 million, already including IFRS 16 effect
Free
Cash Flow to Solvay shareholders
from continuing operations
EBITDA
growth Underlying
excluding scope and forex conversion
Q1 2019 RESULTS
ADDITIONAL
INFORMATION
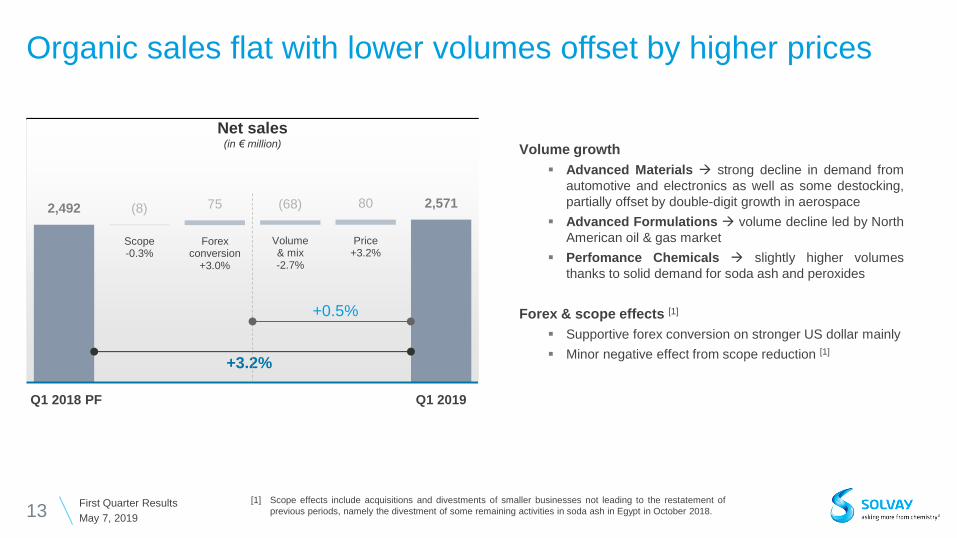
Organic sales flat with lower volumes offset by higher prices
13 May 7, 2019
First Quarter Results
Volume growth
Advanced Materials strong decline in demand from
automotive and electronics as well as some destocking,
partially offset by double-digit growth in aerospace
Advanced Formulations volume decline led by North
American oil & gas market
Perfomance Chemicals slightly higher volumes
thanks to solid demand for soda ash and peroxides
Forex & scope effects [1]
Supportive forex conversion on stronger US dollar mainly
Minor negative effect from scope reduction [1]
[1] Scope effects include acquisitions and divestments of smaller businesses not leading to the restatement of
previous periods, namely the divestment of some remaining activities in soda ash in Egypt in October 2018.
Q1 2018 PF
Scope -0.3%
Forex conversion
+3.0%
Volume & mix -2.7%
Price +3.2%
Q1 2019
2,492 (8) 75 (68) 80 2,571
+3.2%
+0.5%
Net sales (in € million)
Underlying EBITDA Positive net pricing offsets volume headwinds
14 May 7, 2019
First Quarter Results
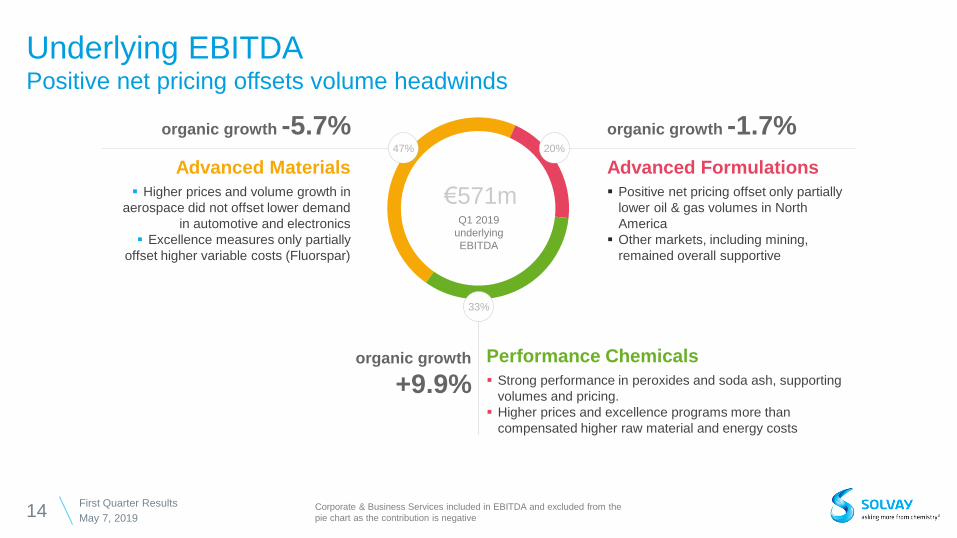
€571m
47%
Advanced Materials
Higher prices and volume growth in
aerospace did not offset lower demand
in automotive and electronics
Excellence measures only partially
offset higher variable costs (Fluorspar)
Performance Chemicals
Strong performance in peroxides and soda ash, supporting
volumes and pricing.
Higher prices and excellence programs more than
compensated higher raw material and energy costs
Advanced Formulations
Positive net pricing offset only partially
lower oil & gas volumes in North
America
Other markets, including mining,
remained overall supportive
Q1 2019
underlying
EBITDA
Corporate & Business Services included in EBITDA and excluded from the
pie chart as the contribution is negative
20%
33%
organic growth -5.7% organic growth -1.7%
organic growth
+9.9%
EPS supported by higher contribution from discontinued
operations
15 May 7, 2019
First Quarter Results
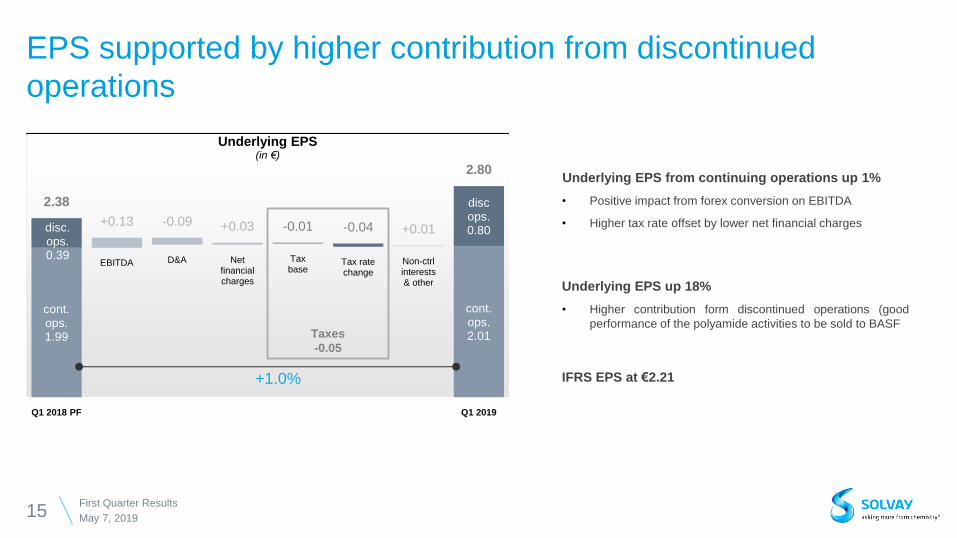
Underlying EPS from continuing operations up 1%
• Positive impact from forex conversion on EBITDA
• Higher tax rate offset by lower net financial charges
Underlying EPS up 18%
• Higher contribution form discontinued operations (good
performance of the polyamide activities to be sold to BASF
IFRS EPS at €2.21
cont. ops. 1.99
cont. ops. 2.01
disc. ops. 0.39
disc ops. 0.80
Q1 2018 PF
EBITDA D&A Net financial charges
Tax base
Tax rate change
Non-ctrl interests & other
Q1 2019
2.38
+0.13 -0.09 +0.03 -0.01 -0.04 +0.01
2.80
+1.0%
Taxes
-0.05
Underlying EPS (in €)
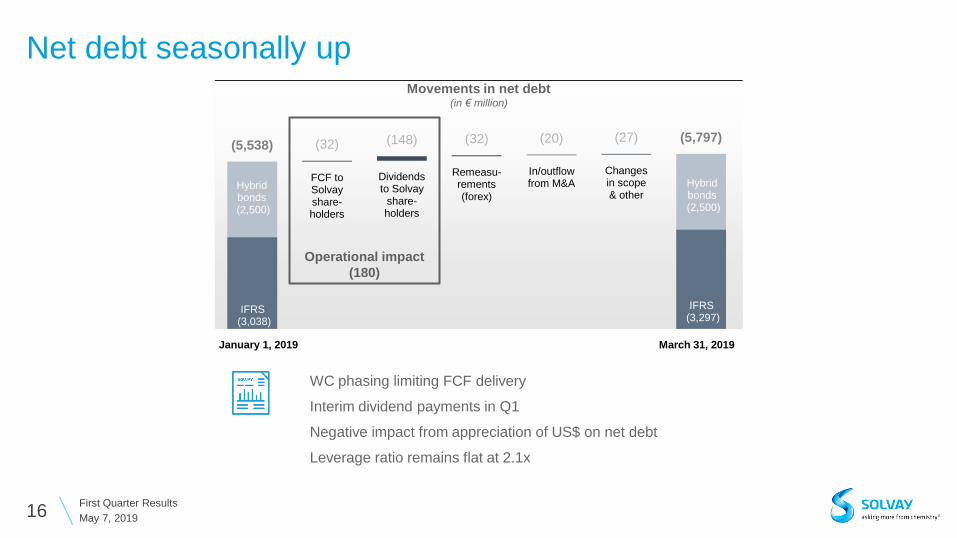
January 1, 2019
FCF to Solvay share- holders
Dividends to Solvay
share- holders
Remeasu- rements (forex)
In/outflow from M&A
Changes in scope & other
March 31, 2019
(5,538) (32) (148) (32) (20) (27) (5,797)
IFRS (3,297)
Hybrid bonds
(2,500)
Hybrid bonds
(2,500)
IFRS (3,038)
Operational impact
(180)
Net debt seasonally up
16 May 7, 2019
First Quarter Results
Movements in net debt (in € million)
WC phasing limiting FCF delivery
Interim dividend payments in Q1
Negative impact from appreciation of US$ on net debt
Leverage ratio remains flat at 2.1x
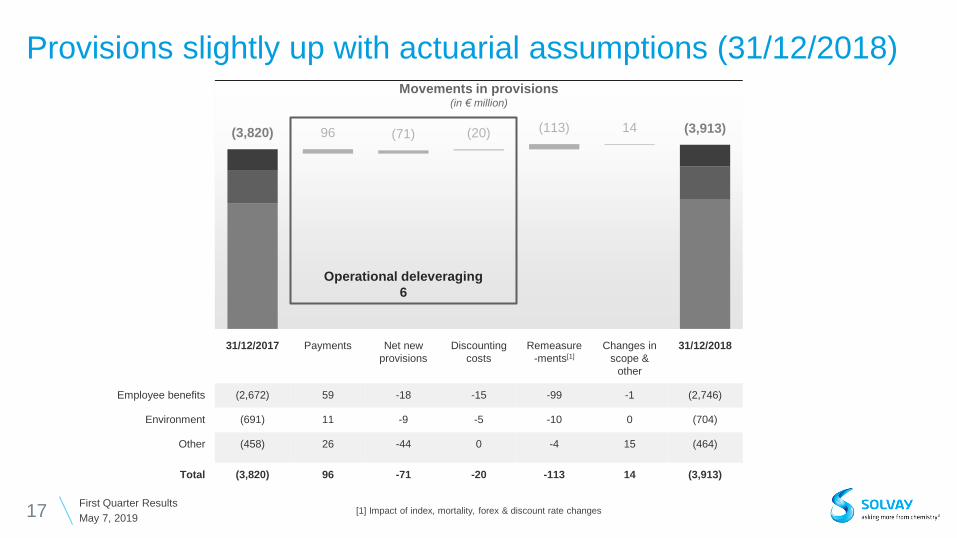
31/12/2017 Payments Net new
provisions
Discounting
costs
Remeasure
-ments[1]
Changes in
scope &
other
31/12/2018
Employee benefits (2,672) 59 -18 -15 -99 -1 (2,746)
Environment (691) 11 -9 -5 -10 0 (704)
Other (458) 26 -44 0 -4 15 (464)
Total (3,820) 96 -71 -20 -113 14 (3,913)
Provisions slightly up with actuarial assumptions (31/12/2018)
17 May 7, 2019
First Quarter Results [1] Impact of index, mortality, forex & discount rate changes
(3,820) 96 (71) (20) (113) 14 (3,913)
Operational deleveraging
6
Movements in provisions (in € million)
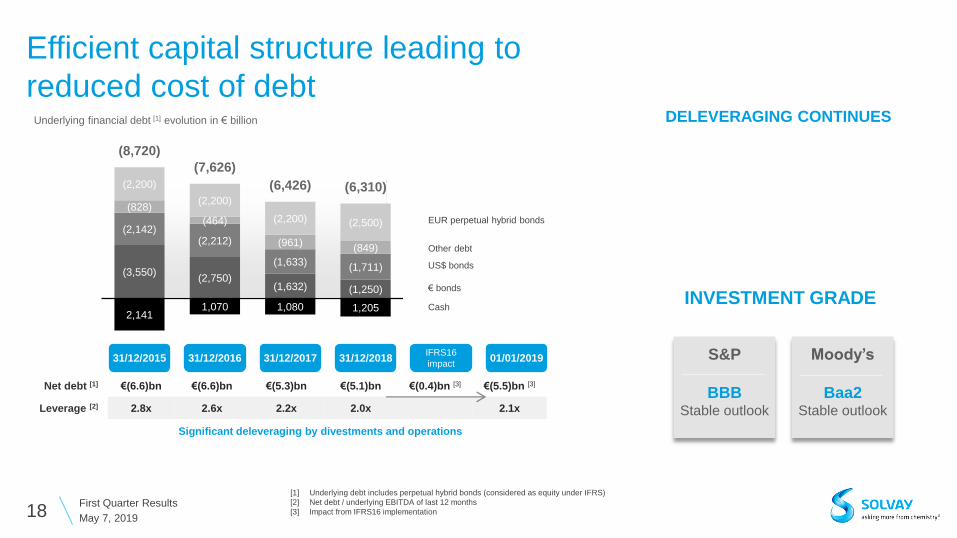
Efficient capital structure leading to
reduced cost of debt
18 May 7, 2019
First Quarter Results
S&P
BBB Stable outlook
[1] Underlying debt includes perpetual hybrid bonds (considered as equity under IFRS)
[2] Net debt / underlying EBITDA of last 12 months
[3] Impact from IFRS16 implementation
31/12/2016
Net debt [1] €(6.6)bn €(6.6)bn €(5.3)bn €(5.1)bn €(0.4)bn [3] €(5.5)bn [3]
Leverage [2] 2.8x 2.6x 2.2x 2.0x 2.1x
31/12/2017 31/12/2018
Significant deleveraging by divestments and operations
Moody’s
Baa2 Stable outlook
Underlying financial debt [1] evolution in € billion
31/12/2015
EUR perpetual hybrid bonds
€ bonds
Other debt
US$ bonds
Cash
DELEVERAGING CONTINUES
INVESTMENT GRADE
IFRS16
impact
(3,550) (2,750)
(1,632) (1,250)
(2,142) (2,212)
(1,633) (1,711)
(828)
(464)
(961) (849)
2,141 1,070 1,080 1,205
(2,200)
(2,200)
(2,200) (2,500)
(8,720)
(7,626)
(6,426) (6,310)
01/01/2019
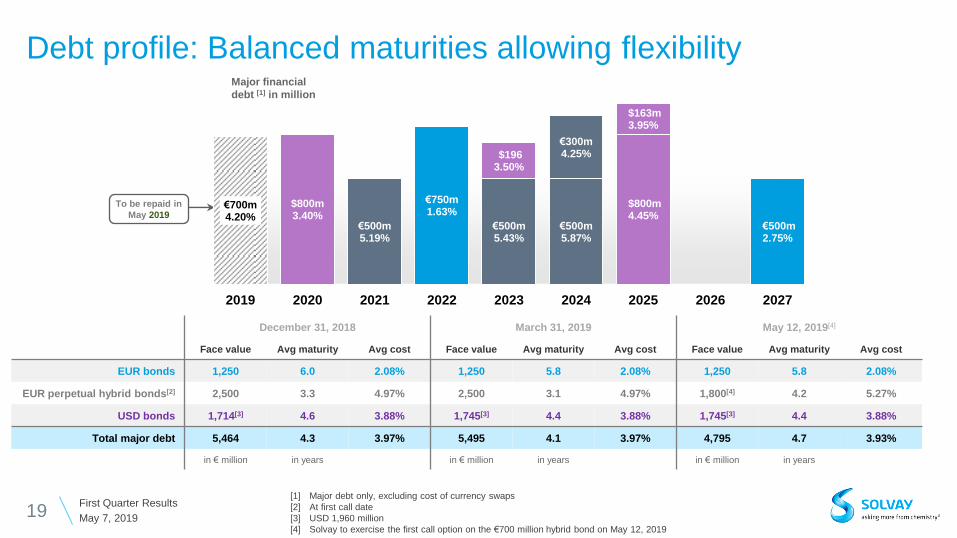
Debt profile: Balanced maturities allowing flexibility
19 May 7, 2019
First Quarter Results [1] Major debt only, excluding cost of currency swaps
[2] At first call date
[3] USD 1,960 million
[4] Solvay to exercise the first call option on the €700 million hybrid bond on May 12, 2019
To be repaid in
May 2019
December 31, 2018 March 31, 2019 May 12, 2019[4]
Face value Avg maturity Avg cost Face value Avg maturity Avg cost Face value Avg maturity Avg cost
EUR bonds 1,250 6.0 2.08% 1,250 5.8 2.08% 1,250 5.8 2.08%
EUR perpetual hybrid bonds[2] 2,500 3.3 4.97% 2,500 3.1 4.97% 1,800[4] 4.2 5.27%
USD bonds 1,714[3] 4.6 3.88% 1,745[3] 4.4 3.88% 1,745[3] 4.4 3.88%
Total major debt 5,464 4.3 3.97% 5,495 4.1 3.97% 4,795 4.7 3.93%
in € million in years in € million in years in € million in years
Major financial
debt [1] in million
€750m 1.63%
€500m 2.75%
€700m 4.20%
€500m 5.19%
€500m 5.43%
€500m 5.87%
$800m 3.40%
$800m 4.45%
$196 3.50%
$163m 3.95%
€300m 4.25%
2019 2020 2021 2022 2023 2024 2025 2026 2027

2019 P&L Considerations
20 May 7, 2019
First Quarter Results
EBITDA to be flat to modestly down
organically and to be back-ended compared
to €2,330 million pro forma in 2018
• Except for discontinued operations,
business scope effects are expected to be
small in 2019.
• One-time gains in 2018 consisted mainly
of €23 million synergies on Cytec post-
retirement benefits, booked in Q2 2018
(mostly in Advanced Materials).
• Organic growth in the second quarter is
expected down versus €643 million pro
forma in Q2 2018.
Mostly exposed to the U.S. dollar, with the
main sensitivities per US$/€0.10 change:
• EBITDA sensitivity of ~€(120) million
based on average 2018 rate in 2018 of
US$/€1.18
• ~2/3 on conversion
• ~1/3 on transaction, the latter being
mostly hedged.
• Net debt sensitivity of ~€120 million based
on the end 2018 rate of US$/€1.15
Deleveraging of the balance sheet with
continued solid operational free cash flow
delivery
• Capex discipline maintained, close to
depreciation;
• Cash-out for provisions are expected
temporarily higher than the €400 million
run rate, with higher restructuring cash-out
as the simplification plan unfolds.
Provisions cash-out includes continued
deleveraging of pension liabilities;
• Tax cash-out expected to increase, linked
to phasing;
• Cash financial expenses expected largely
flat;
• Working capital needs will depend on
demand conditions at year end 2019,
compared to a softer market conditions at
year end 2018.
UNDERLYING
EBITDA
FCF TO SOLVAY
SHAREHOLDERS FOREX
SENSITIVITY
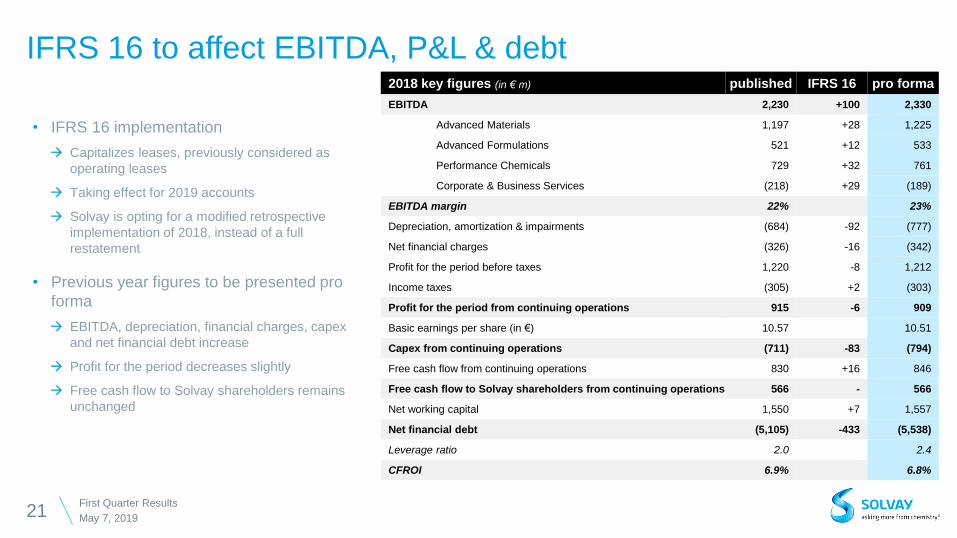
• IFRS 16 implementation
Capitalizes leases, previously considered as
operating leases
Taking effect for 2019 accounts
Solvay is opting for a modified retrospective
implementation of 2018, instead of a full
restatement
• Previous year figures to be presented pro
forma
EBITDA, depreciation, financial charges, capex
and net financial debt increase
Profit for the period decreases slightly
Free cash flow to Solvay shareholders remains
unchanged
21 May 7, 2019
First Quarter Results
2018 key figures (in € m) published IFRS 16 pro forma
EBITDA 2,230 +100 2,330
Advanced Materials 1,197 +28 1,225
Advanced Formulations 521 +12 533
Performance Chemicals 729 +32 761
Corporate & Business Services (218) +29 (189)
EBITDA margin 22% 23%
Depreciation, amortization & impairments (684) -92 (777)
Net financial charges (326) -16 (342)
Profit for the period before taxes 1,220 -8 1,212
Income taxes (305) +2 (303)
Profit for the period from continuing operations 915 -6 909
Basic earnings per share (in €) 10.57 10.51
Capex from continuing operations (711) -83 (794)
Free cash flow from continuing operations 830 +16 846
Free cash flow to Solvay shareholders from continuing operations 566 - 566
Net working capital 1,550 +7 1,557
Net financial debt (5,105) -433 (5,538)
Leverage ratio 2.0 2.4
CFROI 6.9% 6.8%
IFRS 16 to affect EBITDA, P&L & debt
SOLVAY
PROFILE
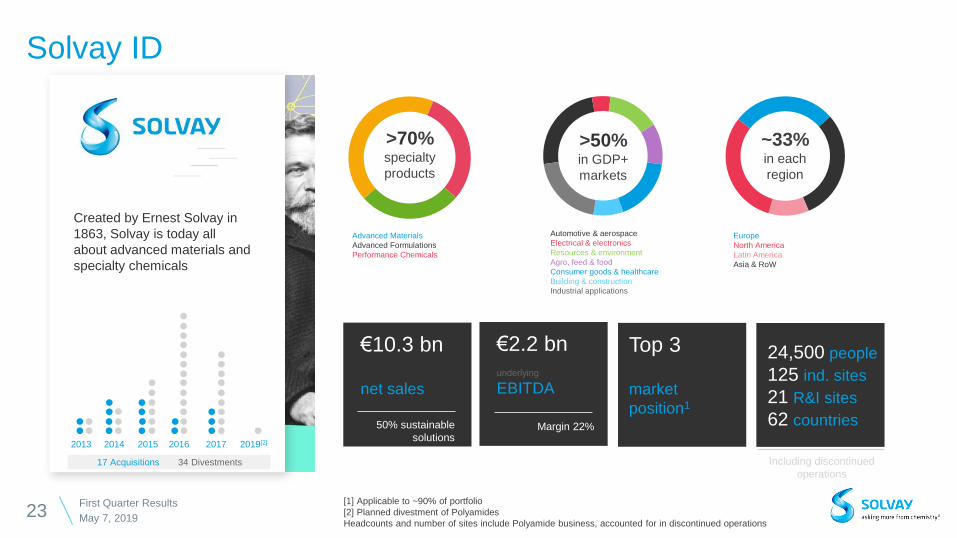
€10.3 bn
net sales
50% sustainable
solutions
Solvay ID
23 May 7, 2019
First Quarter Results [1] Applicable to ~90% of portfolio
[2] Planned divestment of Polyamides
Headcounts and number of sites include Polyamide business, accounted for in discontinued operations
€2.2 bn
underlying
EBITDA
Margin 22%
24,500 people
125 ind. sites
21 R&I sites
62 countries
Top 3
market
position1
>70% specialty
products
Advanced Materials
Advanced Formulations
Performance Chemicals
Europe
North America
Latin America
Asia & RoW
~33% in each
region
Automotive & aerospace
Electrical & electronics
Resources & environment
Agro, feed & food
Consumer goods & healthcare
Building & construction
Industrial applications
>50% in GDP+
markets
17 Acquisitions 34 Divestments
2013 2014 2015 2016 2017 2019[2]
Created by Ernest Solvay in
1863, Solvay is today all
about advanced materials and
specialty chemicals
Including discontinued
operations

Growth engines deliver 70% of EBITDA
24 May 7, 2019
First Quarter Results
Customized specialty
formulations for surface chemistry
& liquid behavior, maximizing
yield & efficiency & minimizing
eco-impact
Advanced Formulations
Technology Solutions
Novecare
Aroma Performance
Lead in chemical intermediates
through scale & technology,
developing applications &
industrial innovation for
optimized costs
Performance Chemicals
Soda Ash & Derivatives
Peroxides
Coatis
Functional Polymers
Providing solutions for sustainable
mobility, light weighting, CO2 and
energy efficiency
Advanced Materials
Silica
Specialty Polymers
Composite Materials
Special Chem
Net Sales €10,257m €4,385m €3,057m €2,808m
Underlying EBITDA €2,230m €1,197m €521m €729m
Organic EBITDA growth +5.3% +3.1% +8.1% +1.6%
EBITDA margin 22% 27% 17% 26%
CFROI [1] 6.9% 10% 6.9% 8.3%
Cash conversion 68% 70% 72% 80%
R&I intensity 3.4% 3.9% 3.2% 1.0%
[1] Cash Flow Return On Investment measures the cash returns of Solvay’s business activities. Movements in CFROI levels are relevant indicators for showing whether economic value is being added, though
it is accepted that this measure cannot be benchmarked or compared with industry peers. The definition uses a reasonable estimate of the replacement cost of assets and avoids accounting distortions, e.g. for
impairments. It is calculated as the ratio between recurring cash flow and invested capital, where: Recurring cash flow = Underlying EBITDA + Dividends from associates and JVs - Earnings from associates
and JVs + Recurring capex + Recurring income taxes ; Invested capital = Replacement value of goodwill & fixed assets + Net working capital + Carrying amount of associates and JVs ; Recurring capex is
normalized at 2% of the replacement value of fixed assets net of goodwill values ; Recurring income tax is normalized at 30% of (Underlying EBIT - Earnings from associates and JVs)
49%
21%
30%
EBITDA €2,230 million
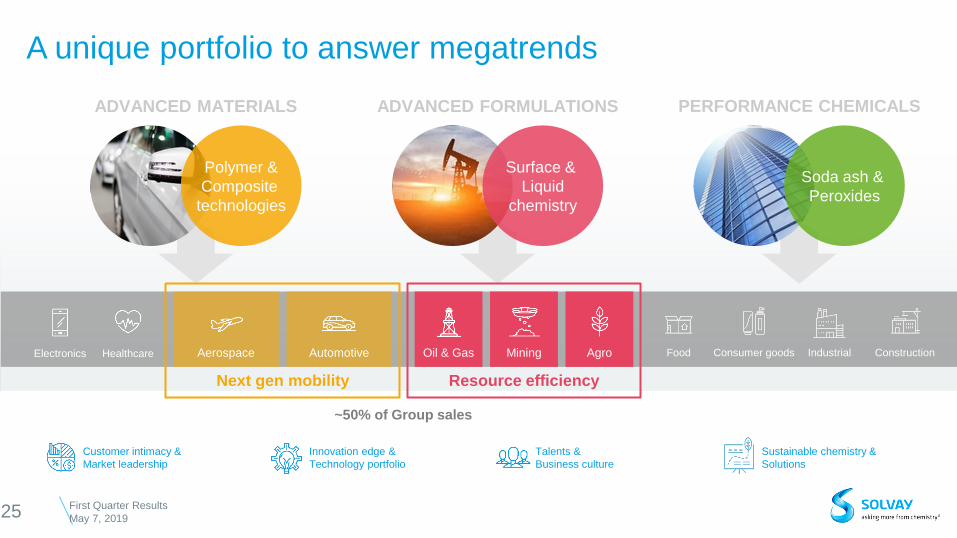
A unique portfolio to answer megatrends
25 May 7, 2019
First Quarter Results
Innovation edge &
Technology portfolio
ADVANCED MATERIALS ADVANCED FORMULATIONS
Electronics Healthcare Automotive Aerospace Mining Agro Oil & Gas
Surface &
Liquid
chemistry
Polymer &
Composite
technologies
Talents &
Business culture
Customer intimacy &
Market leadership
PERFORMANCE CHEMICALS
Soda ash &
Peroxides
Consumer goods Industrial Construction Food
Sustainable chemistry &
Solutions
~50% of Group sales
Next gen mobility Resource efficiency
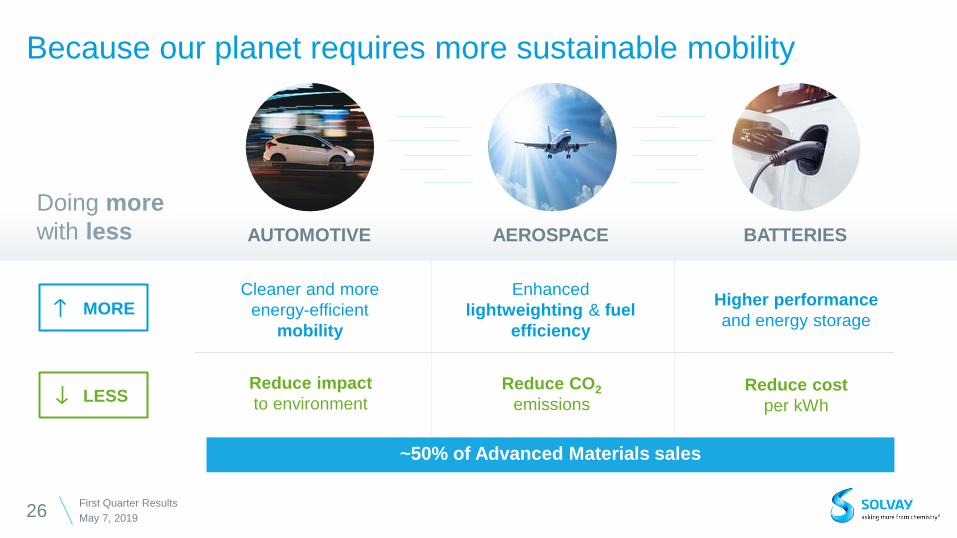
Because our planet requires more sustainable mobility
26 May 7, 2019
First Quarter Results
AUTOMOTIVE AEROSPACE BATTERIES
Doing more
with less
Cleaner and more
energy-efficient
mobility
Reduce impact
to environment
Higher performance
and energy storage
Enhanced
lightweighting & fuel
efficiency
Reduce CO2
emissions
Reduce cost
per kWh
MORE
LESS
~50% of Advanced Materials sales

Aircraft fundamentals support higher growth
in composites
27 May 7, 2019
First Quarter Results
PRIMARY
STRUCTURES
INTERIORS
& GALLEYS
SURFACE
COATINGS
BONDING &
MULTIFUNCTIONALITY
SECONDARY
STRUCTURES
ENGINES
4.5%
Annual growth
in passenger traffic
>8,000 Record high
order backlog
50% Weight of composites
on new aircrafts vs <15% on legacy
2X Number of aircrafts expected
to double in 20 years
AERO
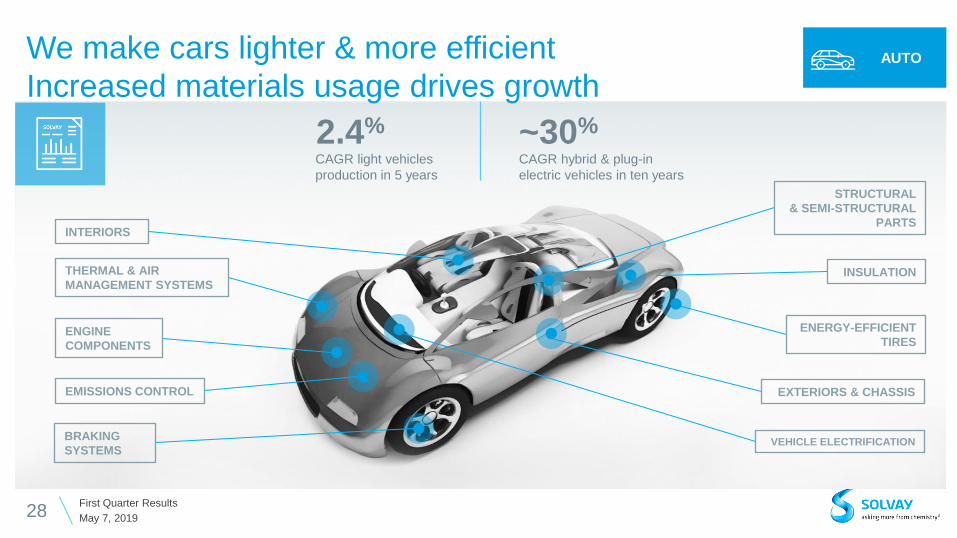
We make cars lighter & more efficient
Increased materials usage drives growth
28 May 7, 2019
First Quarter Results
2.4%
CAGR light vehicles
production in 5 years
~30%
CAGR hybrid & plug-in
electric vehicles in ten years
ENERGY-EFFICIENT
TIRES
INSULATION
INTERIORS
ENGINE
COMPONENTS
THERMAL & AIR
MANAGEMENT SYSTEMS
BRAKING
SYSTEMS
EXTERIORS & CHASSIS
VEHICLE ELECTRIFICATION
STRUCTURAL
& SEMI-STRUCTURAL
PARTS
EMISSIONS CONTROL
AUTO
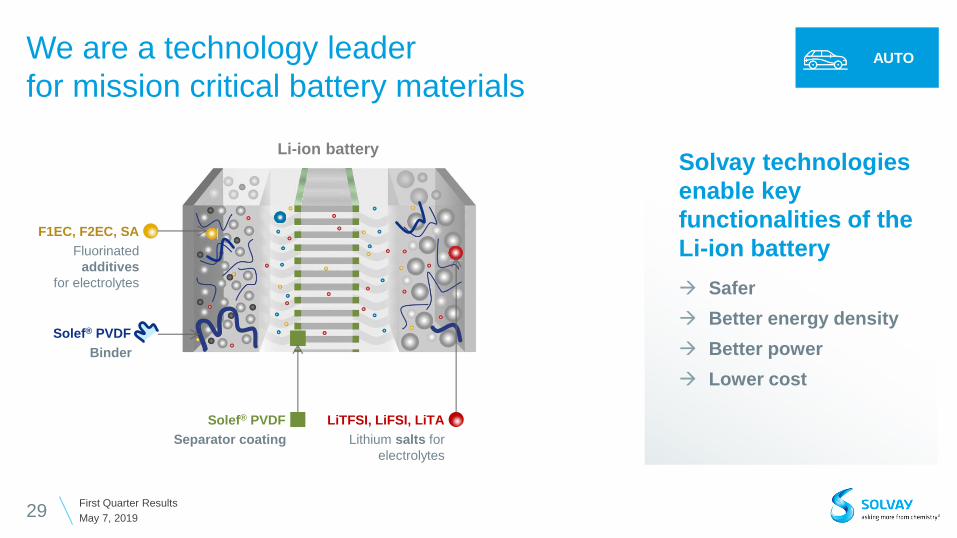
We are a technology leader
for mission critical battery materials
29 May 7, 2019
First Quarter Results
Separator coating
Solef® PVDF
Lithium salts for
electrolytes
LiTFSI, LiFSI, LiTA
Fluorinated
additives
for electrolytes
F1EC, F2EC, SA
Binder
Solef® PVDF
Safer
Better energy density
Better power
Lower cost
Solvay technologies
enable key
functionalities of the
Li-ion battery
Li-ion battery
AUTO
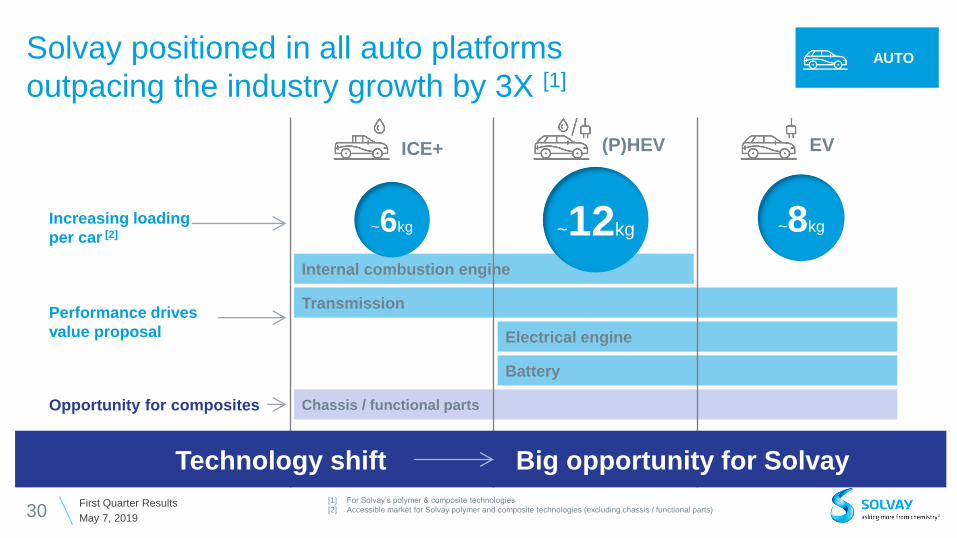
Internal combustion engine
Transmission
Electrical engine
Battery
Chassis / functional parts
Solvay positioned in all auto platforms
outpacing the industry growth by 3X [1]
30 May 7, 2019
First Quarter Results
(P)HEV EV
AUTO
Opportunity for composites
[1] For Solvay’s polymer & composite technologies
[2] Accessible market for Solvay polymer and composite technologies (excluding chassis / functional parts)
~6kg ~12kg ~8kg
ICE+
Big opportunity for Solvay Technology shift
Increasing loading
per car [2]
Performance drives
value proposal

Broadest portfolio of advanced materials
differentiating Solvay from competition
31 May 7, 2019
First Quarter Results
HPPA PPS PAEK PSU PTFE PVDF PFA FKM PFPE Carbon Fiber Thermoset
Prepreg
Resin
Infusion
Adhesives &
Surfacing
films
Thermo-
plastic
prepreg
Out-of-
Autoclave
prepreg
( )
Aromatics Fluoropolymers High Perf Composites
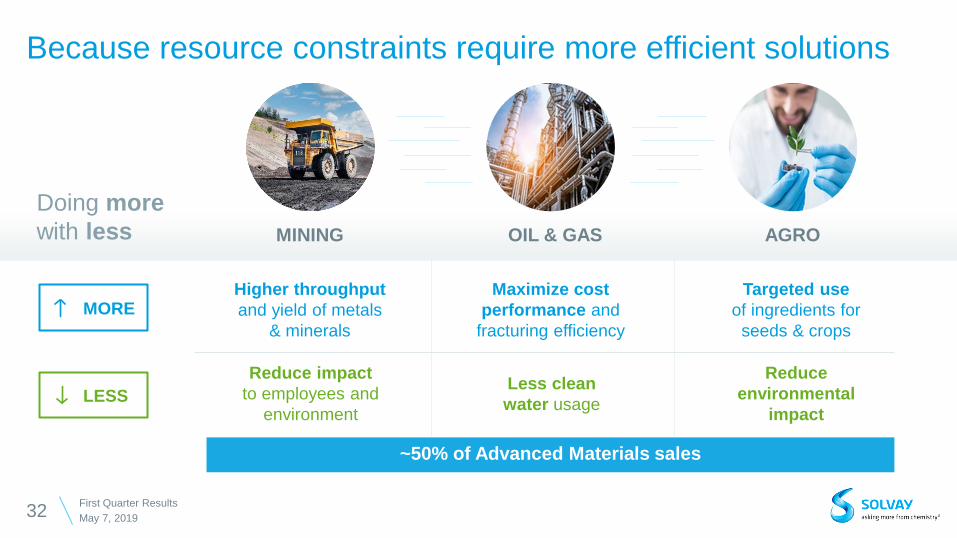
Because resource constraints require more efficient solutions
32 May 7, 2019
First Quarter Results
MINING OIL & GAS AGRO
Doing more
with less
Higher throughput
and yield of metals
& minerals
Reduce impact
to employees and
environment
Targeted use
of ingredients for
seeds & crops
Maximize cost
performance and
fracturing efficiency
Less clean
water usage
Reduce
environmental
impact
MORE
LESS
~50% of Advanced Materials sales

Innovation at our core with strong connections to advance
science
33 May 7, 2019
First Quarter Results * Standing left to right: Goldschmidt, Planck, Rubens, Sommerfeld, Lindemann, de Broglie, Knudsen, Hasenöhrl, Hostelet,
Herzen, Jeans, Rutherford, Onnes, Einstein, Langevin
Seated left to right: Nernst, Brillouin, Solvay, Lorentz, Warburg, Perrin, Wien, Curie, Poincaré
Ernest Solvay established first
prestigious meetings of top
scientists* 1911
Ben Feringa, 2015 Laureate Brussels Lyon
A worldwide
network
of researchers
connected
to academic
partners
3.4%
R&I intensity +100bp vs 2012
€352 m effort
2,200 talents
Yearly investing €80 m in funds and start ups
Steering open innovation & collaboration
264 patent applications
21 R&I sites
Establishing world class R&I centers
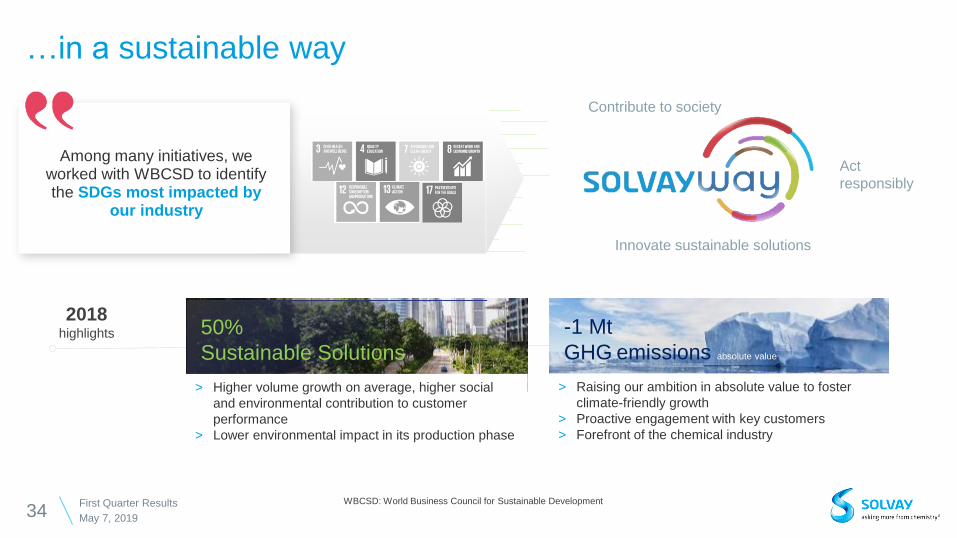
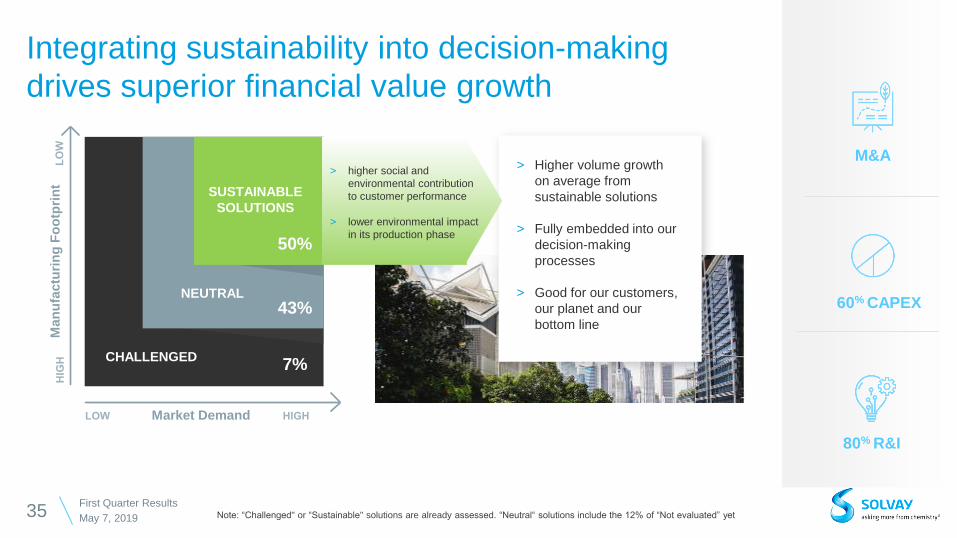
> Higher volume growth on average, higher social
and environmental contribution to customer
performance
> Lower environmental impact in its production phase
…in a sustainable way
34 May 7, 2019
First Quarter Results WBCSD: World Business Council for Sustainable Development
Act
responsibly
Innovate sustainable solutions
Contribute to society
Among many initiatives, we worked with WBCSD to identify the SDGs most impacted by
our industry
> Raising our ambition in absolute value to foster
climate-friendly growth
> Proactive engagement with key customers
> Forefront of the chemical industry
-1 Mt
GHG emissions absolute value
2018 highlights
50%
Sustainable Solutions
Man
ufa
ctu
rin
g F
oo
tpri
nt
Market Demand
CHALLENGED
NEUTRAL
SUSTAINABLE
SOLUTIONS
50%
43%
7%
M&A
80% R&I
Integrating sustainability into decision-making
drives superior financial value growth
35 May 7, 2019
First Quarter Results Note: “Challenged" or “Sustainable" solutions are already assessed. “Neutral“ solutions include the 12% of “Not evaluated” yet
> Higher volume growth
on average from
sustainable solutions
> Fully embedded into our
decision-making
processes
> Good for our customers,
our planet and our
bottom line
60% CAPEX
> higher social and
environmental contribution
to customer performance
> lower environmental impact
in its production phase
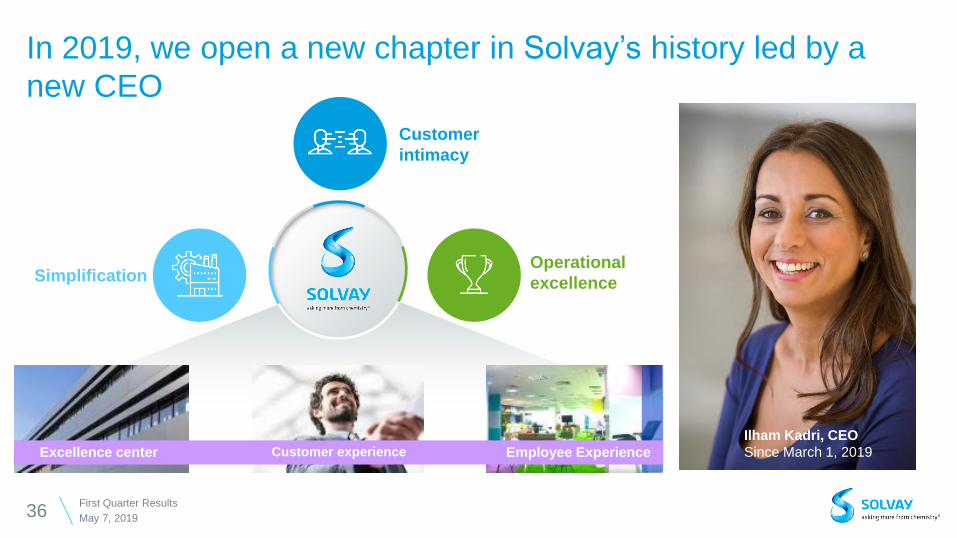
In 2019, we open a new chapter in Solvay’s history led by a
new CEO
36 May 7, 2019
First Quarter Results
Simplification
Customer
intimacy
Operational
excellence
Employee Experience Customer experience Excellence center
Ilham Kadri, CEO
Since March 1, 2019

Delivered solid organic growth in 2018
37 May 7, 2019
First Quarter Results
+ 5.7% Organic growth
Net Sales
+ 4.2%
Dividend
+ 6% Continuing operations
Free Cash
Flow
vs 2017
Underlying figures
+ 12% Continuing operations
Earnings
per share
+ 5.3% Organic growth
EBITDA

Not at the expense of the planet
38 May 7, 2019
First Quarter Results
-24% intensity
GHG
emissions
33% Employees involved in
Societal
actions
76%
Employee
engagement
vs 2015
-30%
Occupational
accidents
50%
Sustainable
solutions
What is beneficial for
business must also be
beneficial for our planet
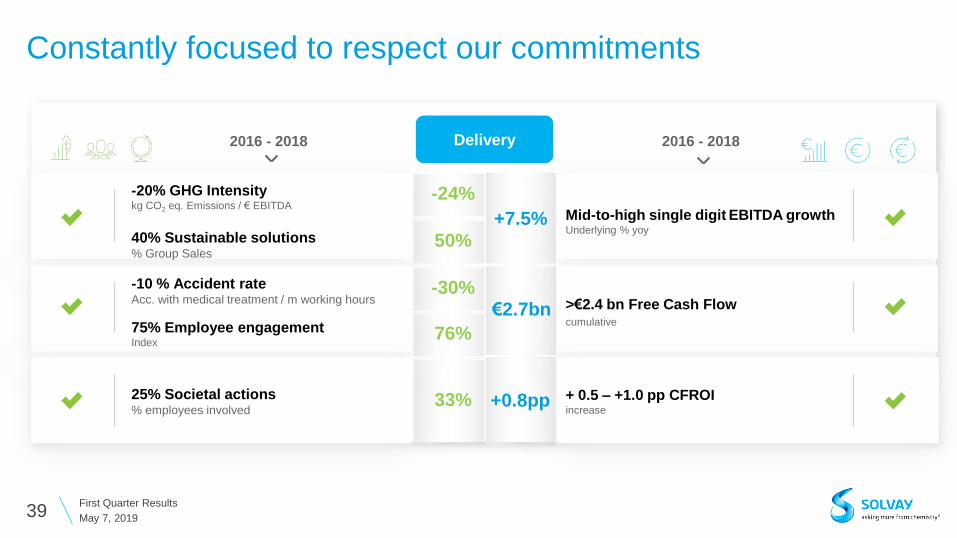
2016 - 2018 2016 - 2018
-20% GHG Intensity kg CO2 eq. Emissions / € EBITDA
Mid-to-high single digit EBITDA growth Underlying % yoy
40% Sustainable solutions
% Group Sales
-10 % Accident rate Acc. with medical treatment / m working hours >€2.4 bn Free Cash Flow
cumulative 75% Employee engagement Index
25% Societal actions % employees involved
+ 0.5 – +1.0 pp CFROI increase
Constantly focused to respect our commitments
39 May 7, 2019
First Quarter Results
Delivery
-24%
50%
-30%
76%
33%
€2.7bn
+0.8pp
+7.5%
February 27, 2019
2018 Results
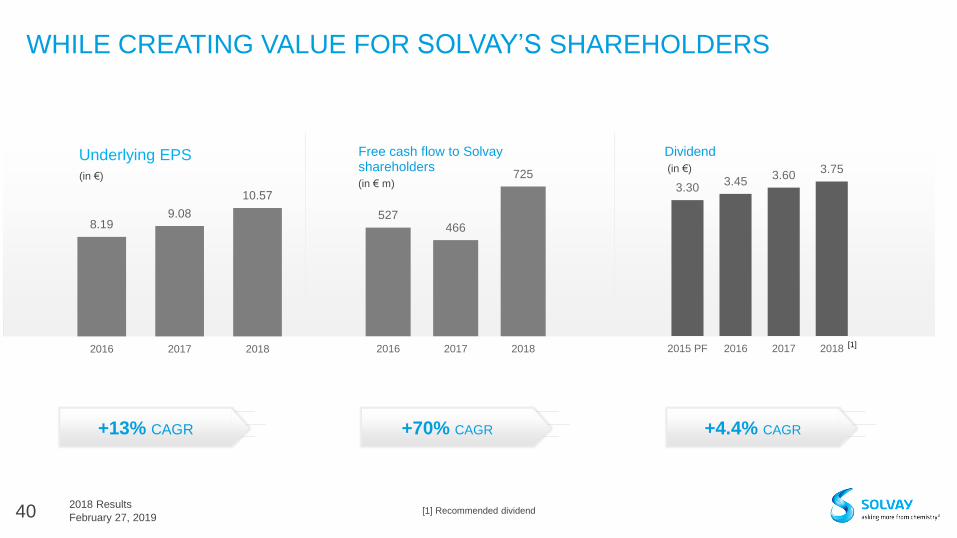
WHILE CREATING VALUE FOR SOLVAY’S SHAREHOLDERS
+13% CAGR
3.30 3.45
3.60 3.75
2015 PF 2016 2017 2018
Dividend
+4.4% CAGR
527 466
725
2016 2017 2018
Free cash flow to Solvay shareholders
+70% CAGR
40
[1]
[1] Recommended dividend
(in € m)
(in €) (in €)
8.19 9.08
10.57
2016 2017 2018
Underlying EPS

Interim €1.44 Payment Jan. 17 2019
Final[1] €2.31 Payment May 23 2019
Total[1] €3.75 + 4.2 %
Strong track record of continued
shareholders’ distribution
41 May 7, 2019
First Quarter Results
Gross dividend
in €/share[1]
[1] Dividend recommendation subject to approval of next AGM
2018 gross dividend per share
~5.5% CAGR
-
1.00
2.00
3.00
4.00
19
82
19
83
19
84
19
85
19
86
19
87
19
88
19
89
19
90
19
91
19
92
19
93
19
94
19
95
19
96
19
97
19
98
19
99
20
00
20
01
20
02
20
03
20
04
20
05
20
06
20
07
20
08
20
09
20
10
20
11
20
12
20
13
20
14
20
15
20
16
20
17
20
18
€3.75 Committed to
stable / growing
dividend
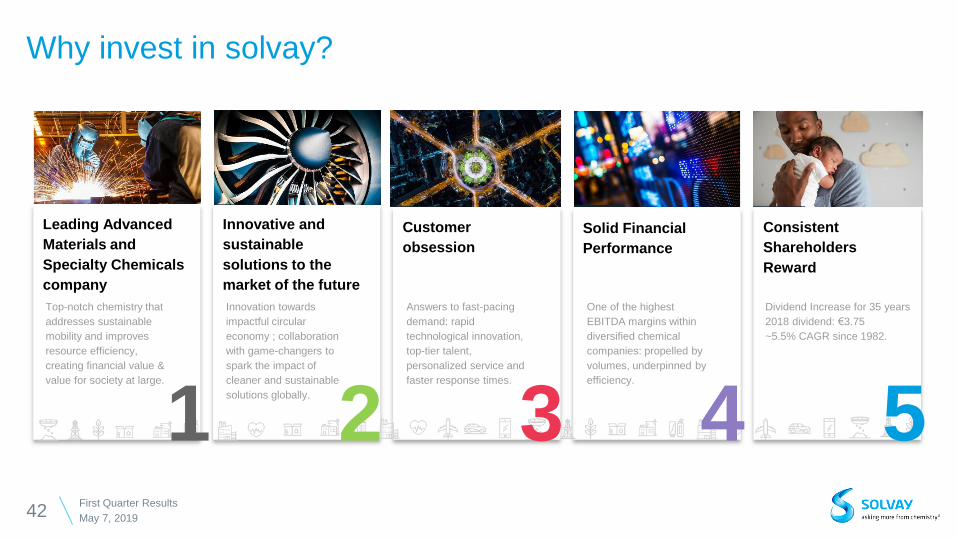
Why invest in solvay?
42 May 7, 2019
First Quarter Results
Innovative and
sustainable
solutions to the
market of the future
Customer
obsession
Solid Financial
Performance
Consistent
Shareholders
Reward
Leading Advanced
Materials and
Specialty Chemicals
company
1 2 3 4 5
Top-notch chemistry that
addresses sustainable
mobility and improves
resource efficiency,
creating financial value &
value for society at large.
Innovation towards
impactful circular
economy ; collaboration
with game-changers to
spark the impact of
cleaner and sustainable
solutions globally.
Answers to fast-pacing
demand: rapid
technological innovation,
top-tier talent,
personalized service and
faster response times.
One of the highest
EBITDA margins within
diversified chemical
companies: propelled by
volumes, underpinned by
efficiency.
Dividend Increase for 35 years
2018 dividend: €3.75
~5.5% CAGR since 1982.

SOLVAY
SHARE
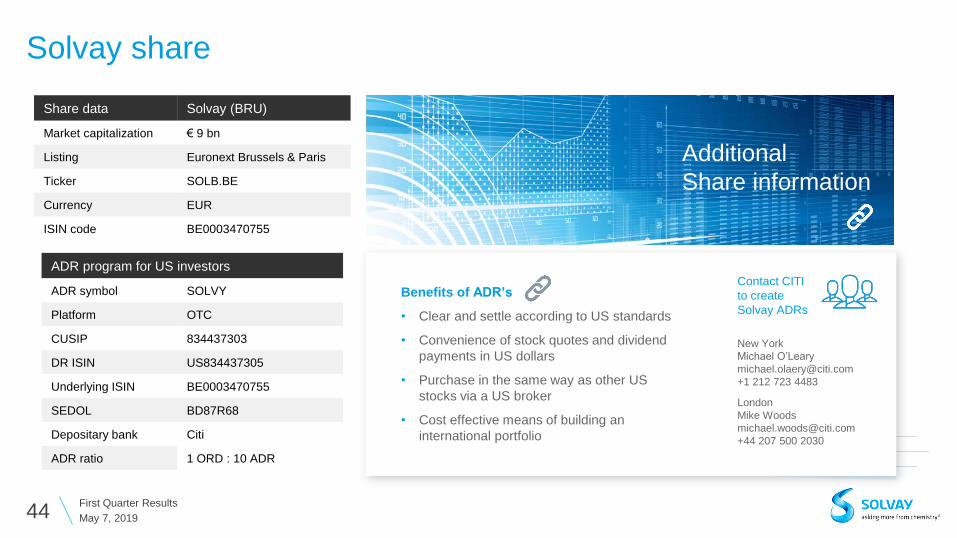
Solvay share
44 May 7, 2019
First Quarter Results
Share data Solvay (BRU)
Market capitalization € 9 bn
Listing Euronext Brussels & Paris
Ticker SOLB.BE
Currency EUR
ISIN code BE0003470755
ADR program for US investors
ADR symbol SOLVY
Platform OTC
CUSIP 834437303
DR ISIN US834437305
Underlying ISIN BE0003470755
SEDOL BD87R68
Depositary bank Citi
ADR ratio 1 ORD : 10 ADR
Benefits of ADR’s
• Clear and settle according to US standards
• Convenience of stock quotes and dividend
payments in US dollars
• Purchase in the same way as other US
stocks via a US broker
• Cost effective means of building an
international portfolio
Contact CITI
to create
Solvay ADRs
New York
Michael O’Leary
+1 212 723 4483
London
Mike Woods
+44 207 500 2030
Additional
Share information

Latest
news
Investor relations
45 May 7, 2019
First Quarter Results
Geoffroy Raskin
+32 2 264 1540
Bisser Alexandrov
+32 2 264 3687
Upcoming
events
Jodi Allen
+1 609 860 4608
Disclaimer
This presentation may contain forward-looking information. Forward-looking statements describe expectations, plans, strategies, goals,
future events or intentions. The achievement of forward-looking statements contained in this presentation is subject to risks and
uncertainties relating to a number of factors, including general economic factors, interest rate and foreign currency exchange rate
fluctuations, changing market conditions, product competition, the nature of product development, impact of acquisitions and divestitures,
restructurings, products withdrawals, regulatory approval processes, all-in scenario of R&D projects and other unusual items.
Consequently, actual results or future events may differ materially from those expressed or implied by such forward-looking statements.
Should known or unknown risks or uncertainties materialize, or should our assumptions prove inaccurate, actual results could vary
materially from those anticipated. The Company undertakes no obligation to publicly update or revise any forward-looking statements
This document does not constitute an offer to sell, or the solicitation of an offer to subscribe for or buy, any securities.
May 7, 2019
First Quarter Results 46
www.solvay.com
FOLLOW US ON QUESTIONS?
Contact us
Investor Relations
Rue De Ransbeek, 310
1120 Brussels, Belgium
T +32 2 264 3025
Shareholders Services
Rue des Champs Elysées, 43
1050 Brussels, Belgium
T +32 2 639 6630