Embed Size (px)
Citation preview
RETAIL INVESTOR PRESENTATIONFIRST QUARTER 2019
Contents
Company Overview 4
Dependable Dividends 9
Portfolio Diversification 13
Asset Management & Real Estate Operations 20
Investment Strategy 23
Capital Structure and Scalability 26
Business Plan 30
Appendix 31
All data as of March 31, 2019 unless otherwise specified2
Safe Harbor For Forward-Looking Statements
Statements in this investor presentation that are not strictly historical are "forward-looking"statements. Forward-looking statements involve known and unknown risks, which may cause thecompany‘s actual future results to differ materially from expected results. These risks include,among others, general economic conditions, domestic and foreign real estate conditions, tenantfinancial health, the availability of capital to finance planned growth, continued volatility anduncertainty in the credit markets and broader financial markets, property acquisitions and thetiming of these acquisitions, charges for property impairments, and the outcome of any legalproceedings to which the company is a party, as described in the company's filings with theSecurities and Exchange Commission. Consequently, forward-looking statements should beregarded solely as reflections of the company's current operating plans and estimates. Actualoperating results may differ materially from what is expressed or forecast in this investorpresentation. The company undertakes no obligation to publicly release the results of any revisionsto these forward-looking statements that may be made to reflect events or circumstances after thedate these statements were made.
3
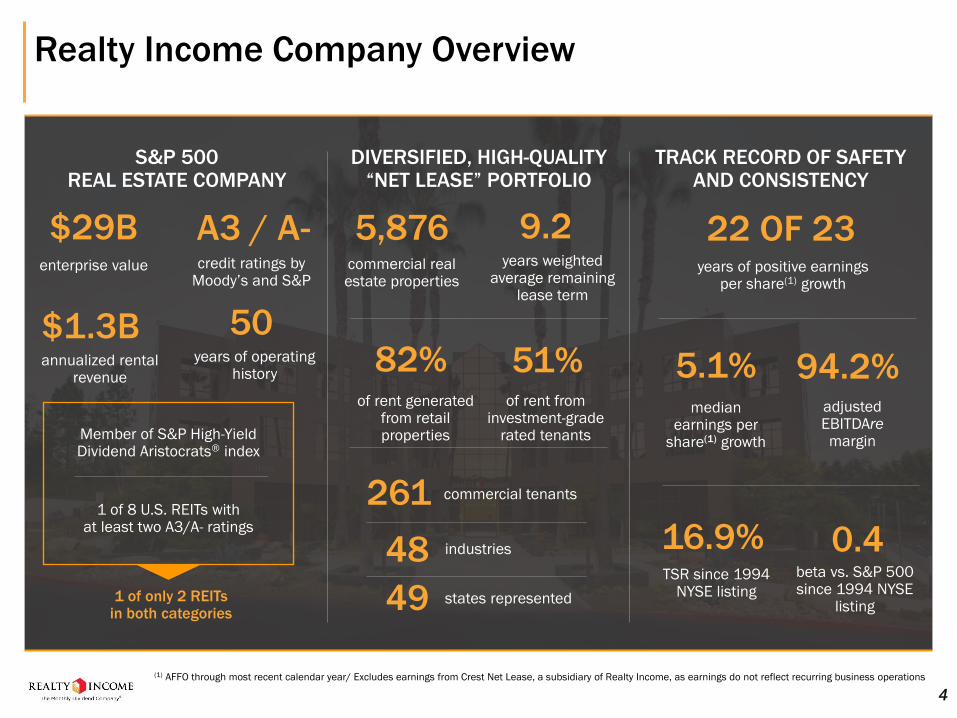
Realty Income Company Overview
4
S&P 500 REAL ESTATE COMPANY
DIVERSIFIED, HIGH-QUALITY“NET LEASE” PORTFOLIO
TRACK RECORD OF SAFETY AND CONSISTENCY
$29B enterprise value
1 of only 2 REITs in both categories
Member of S&P High-Yield Dividend Aristocrats® index
1 of 8 U.S. REITs with at least two A3/A- ratings
5,876commercial real estate properties
82% of rent generated
from retail properties
261 commercial tenants
48 industries
49 states represented
A3 / A-
(1) AFFO through most recent calendar year/ Excludes earnings from Crest Net Lease, a subsidiary of Realty Income, as earnings do not reflect recurring business operations
16.9%TSR since 1994
NYSE listing
$1.3B annualized rental
revenue
50years of operating
history
credit ratings by Moody’s and S&P
22 OF 23years of positive earnings
per share(1) growth
9.2years weighted
average remaining lease term
0.4beta vs. S&P 500 since 1994 NYSE
listing
5.1%median
earnings per share(1) growth
51%of rent from
investment-grade rated tenants
94.2%adjusted EBITDAremargin
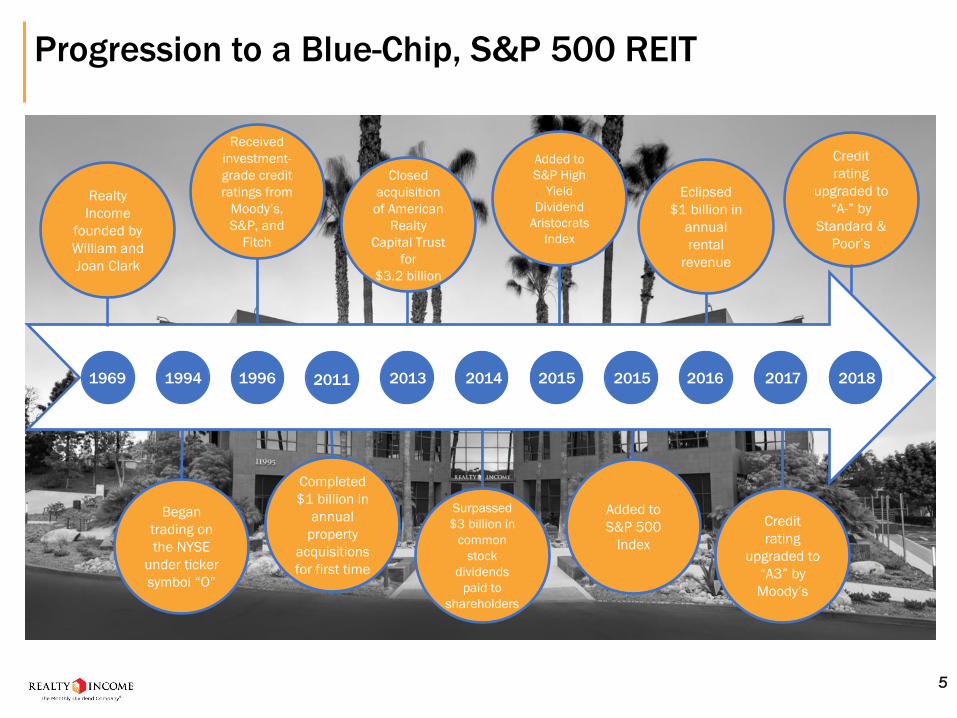
Progression to a Blue-Chip, S&P 500 REIT
1969 1994 1996 2011 2013 2014 2015 2015 2016 2017 2018
Realty
Income
founded by
William and
Joan Clark
Received
investment-
grade credit
ratings from
Moody’s,
S&P, and
Fitch
Began
trading on
the NYSE
under ticker
symbol “O”
Completed
$1 billion in
annual
property
acquisitions
for first time
Closed
acquisition
of American
Realty
Capital Trust
for
$3.2 billion
Surpassed
$3 billion in
common
stock
dividends
paid to
shareholders
Added to
S&P High
Yield
Dividend
Aristocrats
Index
Added to
S&P 500
Index
Eclipsed
$1 billion in
annual
rental
revenue
Credit
rating
upgraded to
“A3” by
Moody’s
Credit
rating
upgraded to
“A-” by
Standard &
Poor’s
5
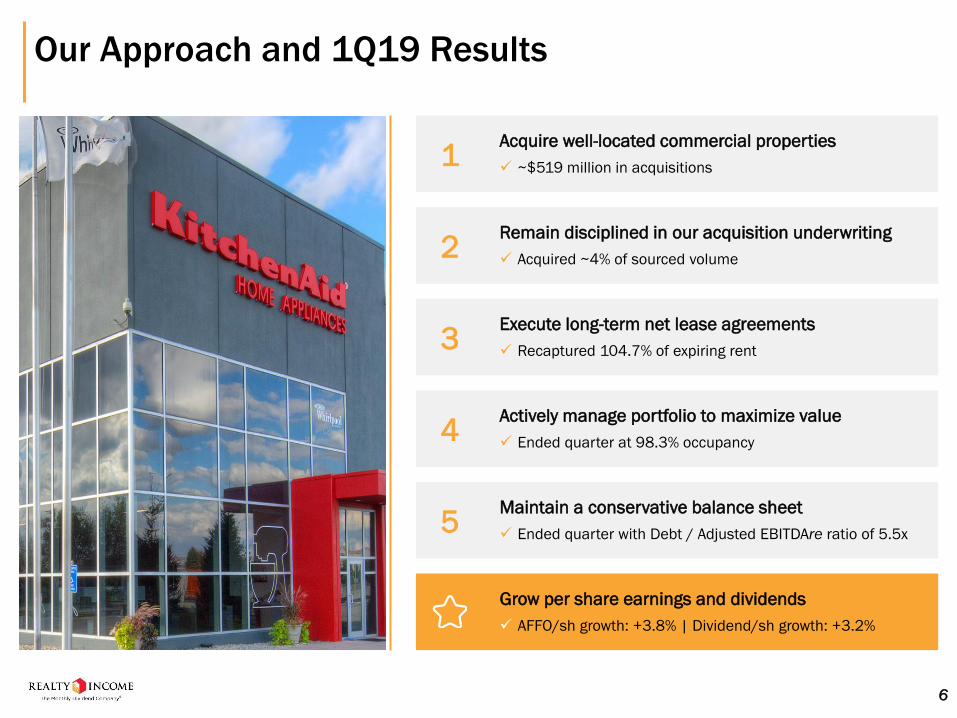
Our Approach and 1Q19 Results
6
Acquire well-located commercial properties
✓ ~$519 million in acquisitions1
Remain disciplined in our acquisition underwriting
✓ Acquired ~4% of sourced volume2
Execute long-term net lease agreements
✓ Recaptured 104.7% of expiring rent3
Actively manage portfolio to maximize value
✓ Ended quarter at 98.3% occupancy4
Maintain a conservative balance sheet
✓ Ended quarter with Debt / Adjusted EBITDAre ratio of 5.5x5
Grow per share earnings and dividends
✓ AFFO/sh growth: +3.8% | Dividend/sh growth: +3.2%
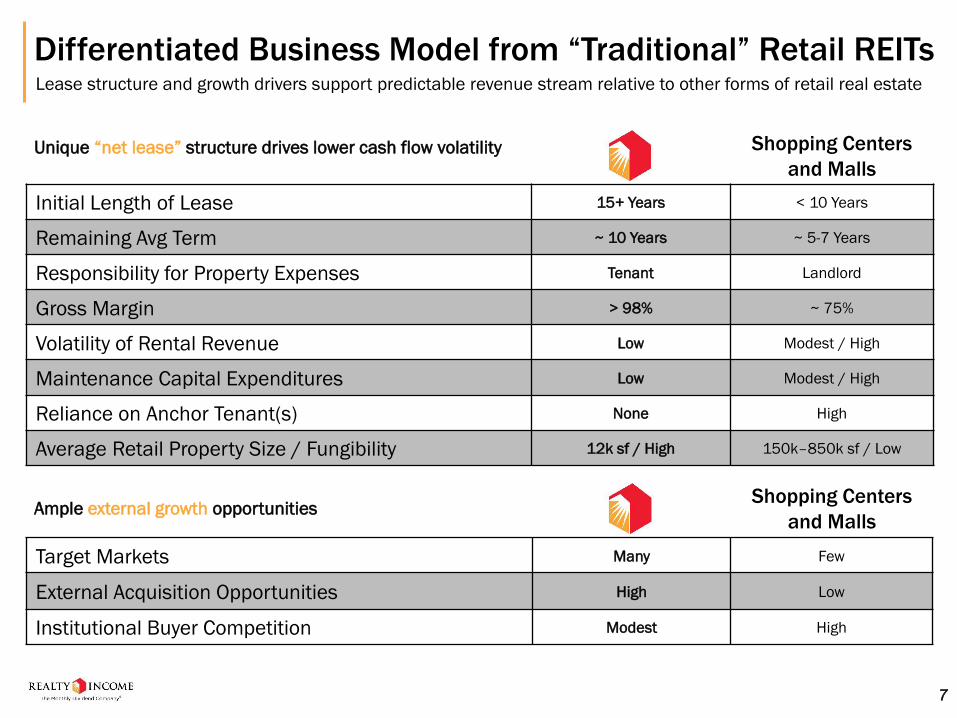
Differentiated Business Model from “Traditional” Retail REITsLease structure and growth drivers support predictable revenue stream relative to other forms of retail real estate
Initial Length of Lease 15+ Years < 10 Years
Remaining Avg Term ~ 10 Years ~ 5-7 Years
Responsibility for Property Expenses Tenant Landlord
Gross Margin > 98% ~ 75%
Volatility of Rental Revenue Low Modest / High
Maintenance Capital Expenditures Low Modest / High
Reliance on Anchor Tenant(s) None High
Average Retail Property Size / Fungibility 12k sf / High 150k–850k sf / Low
Target Markets Many Few
External Acquisition Opportunities High Low
Institutional Buyer Competition Modest High
Ample external growth opportunities
Unique “net lease” structure drives lower cash flow volatility Shopping Centers
and Malls
Shopping Centers
and Malls
7
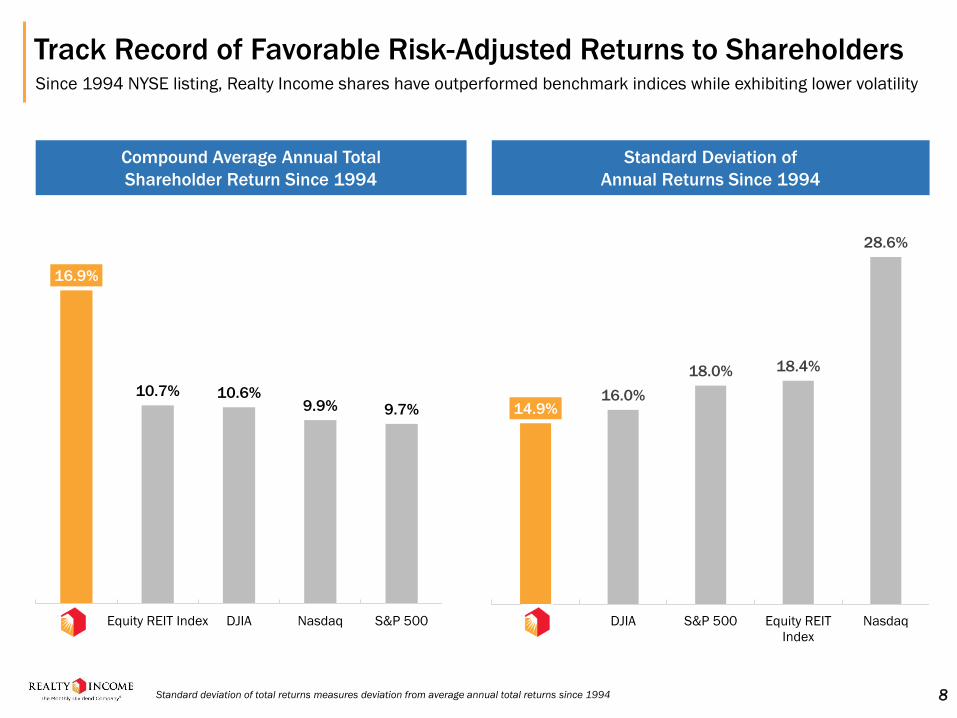
Track Record of Favorable Risk-Adjusted Returns to Shareholders Since 1994 NYSE listing, Realty Income shares have outperformed benchmark indices while exhibiting lower volatility
16.9%
10.7% 10.6%9.9% 9.7%
O Equity REIT Index DJIA Nasdaq S&P 500
14.9%16.0%
18.0% 18.4%
28.6%
O DJIA S&P 500 Equity REIT
Index
Nasdaq
Standard Deviation of
Annual Returns Since 1994
Compound Average Annual Total
Shareholder Return Since 1994
Standard deviation of total returns measures deviation from average annual total returns since 1994 8
DEPENDABLE DIVIDENDS
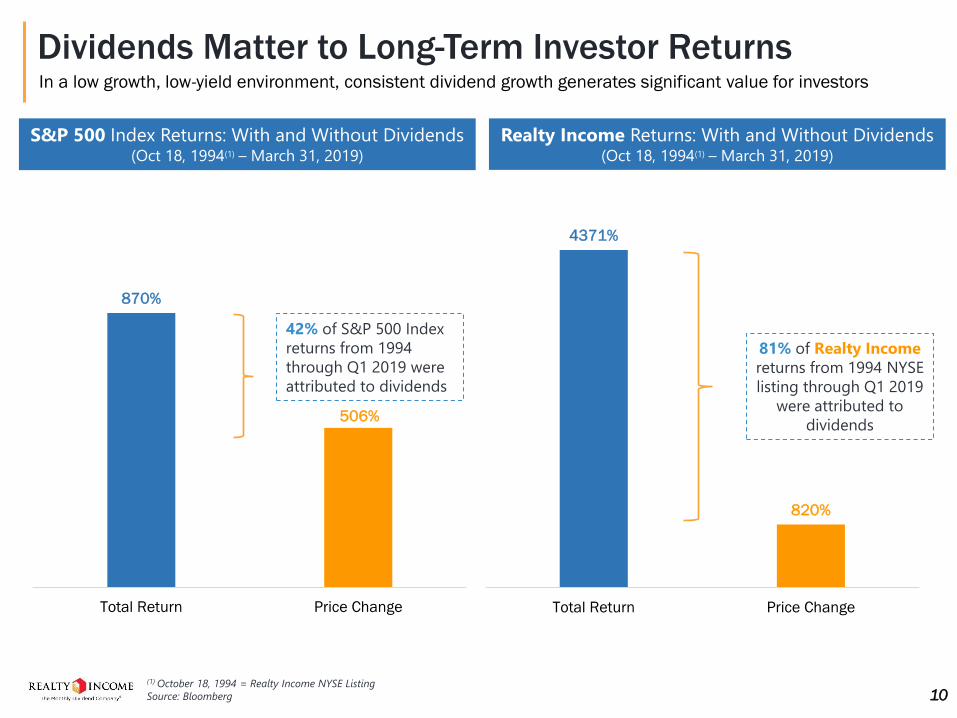
4371%
820%
Total Return Price Change
870%
506%
Total Return Price Change
10
Dividends Matter to Long-Term Investor Returns
42% of S&P 500 Index
returns from 1994
through Q1 2019 were
attributed to dividends
81% of Realty Income
returns from 1994 NYSE
listing through Q1 2019
were attributed to
dividends
S&P 500 Index Returns: With and Without Dividends (Oct 18, 1994(1) – March 31, 2019)
Realty Income Returns: With and Without Dividends (Oct 18, 1994(1) – March 31, 2019)
(1) October 18, 1994 = Realty Income NYSE Listing
Source: Bloomberg
In a low growth, low-yield environment, consistent dividend growth generates significant value for investors
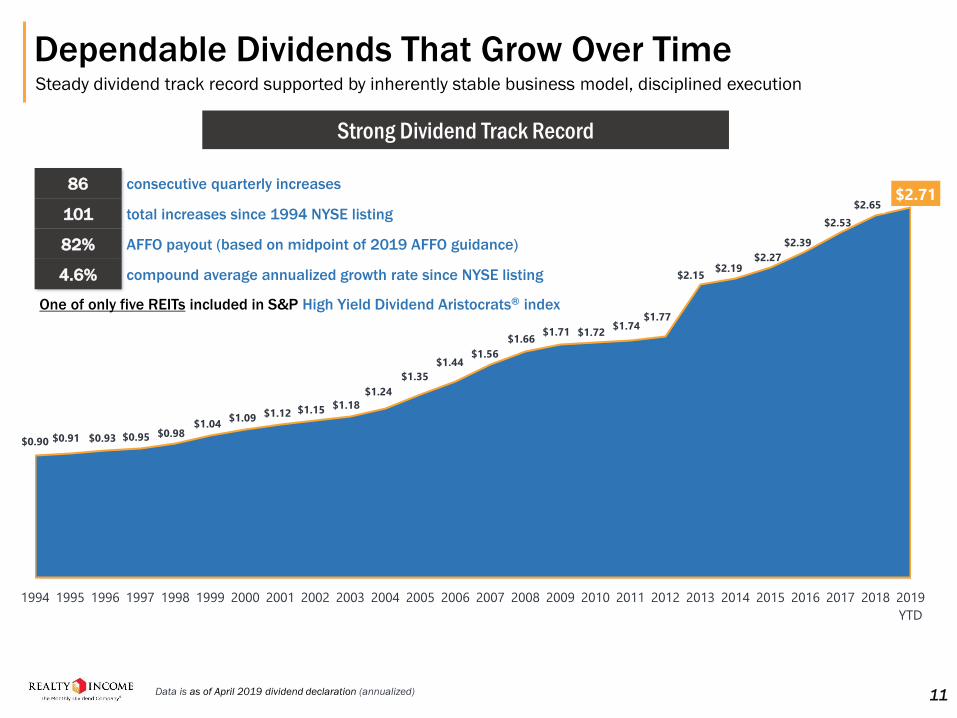
Dependable Dividends That Grow Over TimeSteady dividend track record supported by inherently stable business model, disciplined execution
$0.90 $0.91 $0.93 $0.95 $0.98 $1.04
$1.09 $1.12 $1.15 $1.18
$1.24
$1.35
$1.44 $1.56
$1.66 $1.71 $1.72
$1.74 $1.77
$2.15 $2.19
$2.27
$2.39
$2.53
$2.65 $2.71
1994 1995 1996 1997 1998 1999 2000 2001 2002 2003 2004 2005 2006 2007 2008 2009 2010 2011 2012 2013 2014 2015 2016 2017 2018 2019
YTD
Strong Dividend Track Record
86 consecutive quarterly increases
101 total increases since 1994 NYSE listing
82% AFFO payout (based on midpoint of 2019 AFFO guidance)
4.6% compound average annualized growth rate since NYSE listing
One of only five REITs included in S&P High Yield Dividend Aristocrats® index
Data is as of April 2019 dividend declaration (annualized) 11
12
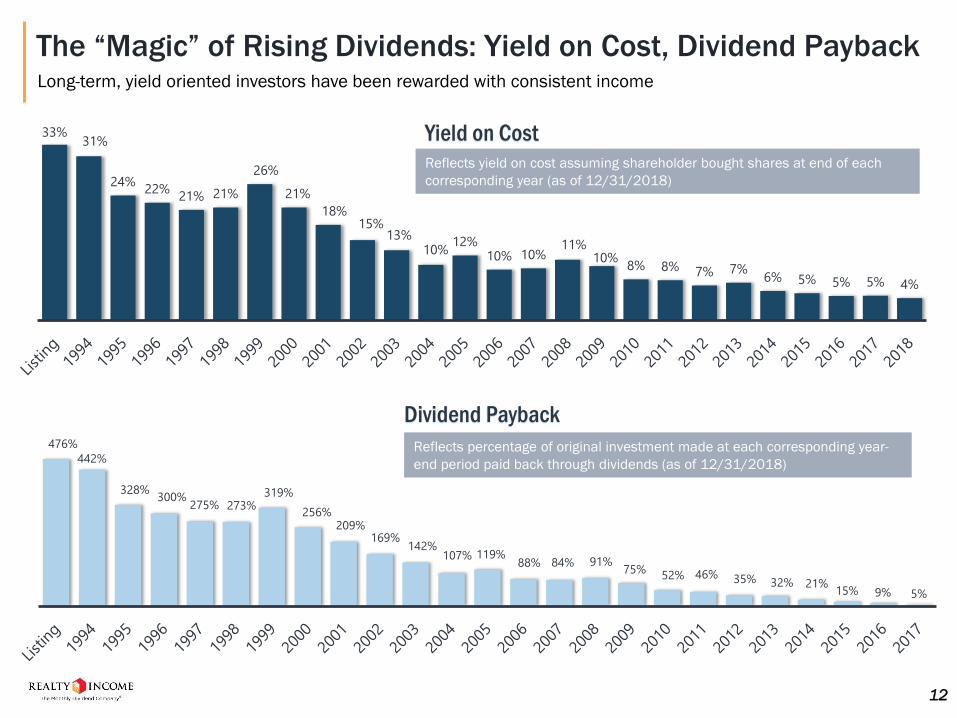
476%
442%
328%300%
275% 273%319%
256%209%
169%142%
107% 119%88% 84% 91%
75%52% 46% 35% 32% 21%
15% 9% 5%
Reflects percentage of original investment made at each corresponding year-
end period paid back through dividends (as of 12/31/2018)
Dividend Payback
33%31%
24%22%
21% 21%
26%
21%
18%15%
13%10%
12%10% 10%
11%10%
8% 8% 7% 7%6% 5% 5% 5% 4%
Reflects yield on cost assuming shareholder bought shares at end of each
corresponding year (as of 12/31/2018)
Yield on Cost
The “Magic” of Rising Dividends: Yield on Cost, Dividend PaybackLong-term, yield oriented investors have been rewarded with consistent income
PORTFOLIO DIVERSIFICATION
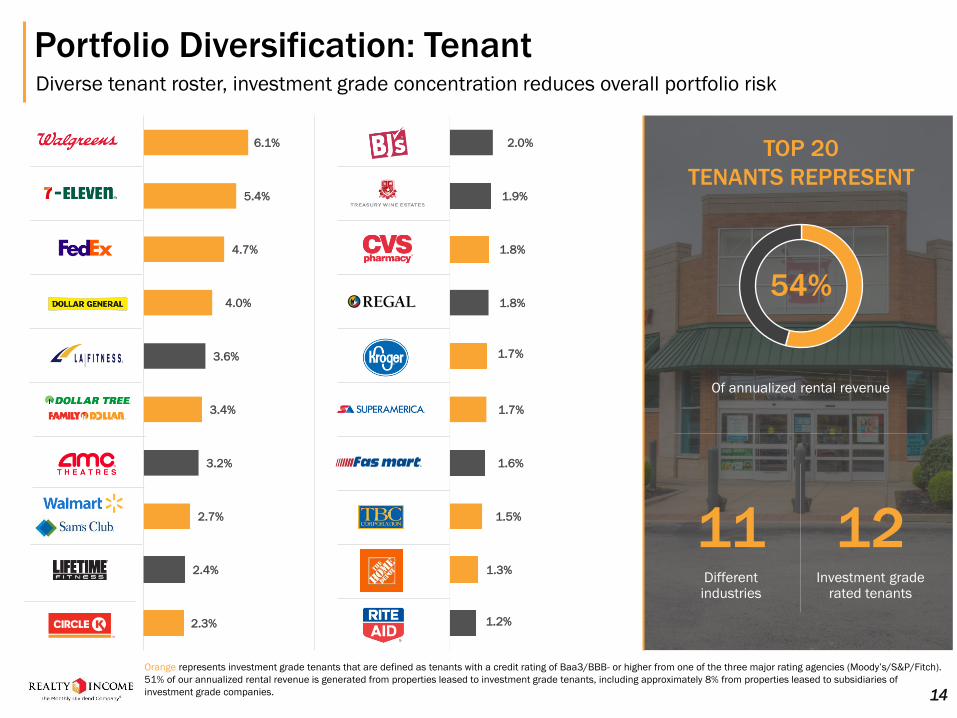
Portfolio Diversification: TenantDiverse tenant roster, investment grade concentration reduces overall portfolio risk
14
Orange represents investment grade tenants that are defined as tenants with a credit rating of Baa3/BBB- or higher from one of the three major rating agencies (Moody’s/S&P/Fitch).
51% of our annualized rental revenue is generated from properties leased to investment grade tenants, including approximately 8% from properties leased to subsidiaries of
investment grade companies.
TOP 20
TENANTS REPRESENT
54%
Of annualized rental revenue
11Different industries
Investment grade rated tenants
6.1%
5.4%
4.7%
4.0%
3.6%
3.4%
3.2%
2.7%
2.4%
2.3%
2.0%
1.9%
1.8%
1.8%
1.7%
1.7%
1.6%
1.5%
1.3%
1.2%
12
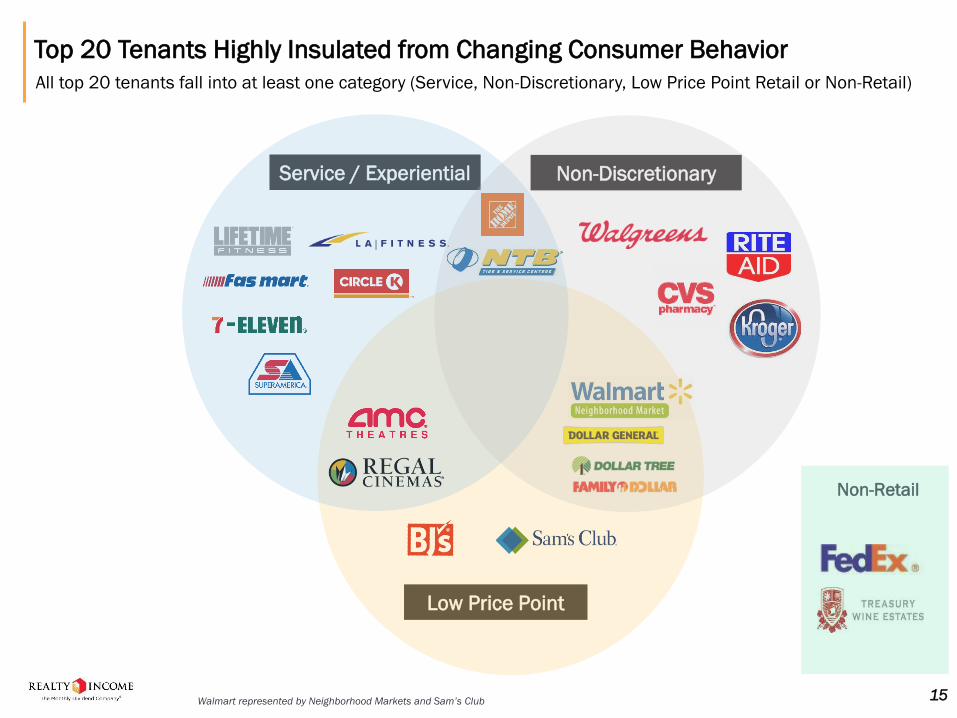
Low Price Point
Service / Experiential
Top 20 Tenants Highly Insulated from Changing Consumer Behavior
All top 20 tenants fall into at least one category (Service, Non-Discretionary, Low Price Point Retail or Non-Retail)
Non-Retail
Walmart represented by Neighborhood Markets and Sam’s Club 15
Non-Discretionary
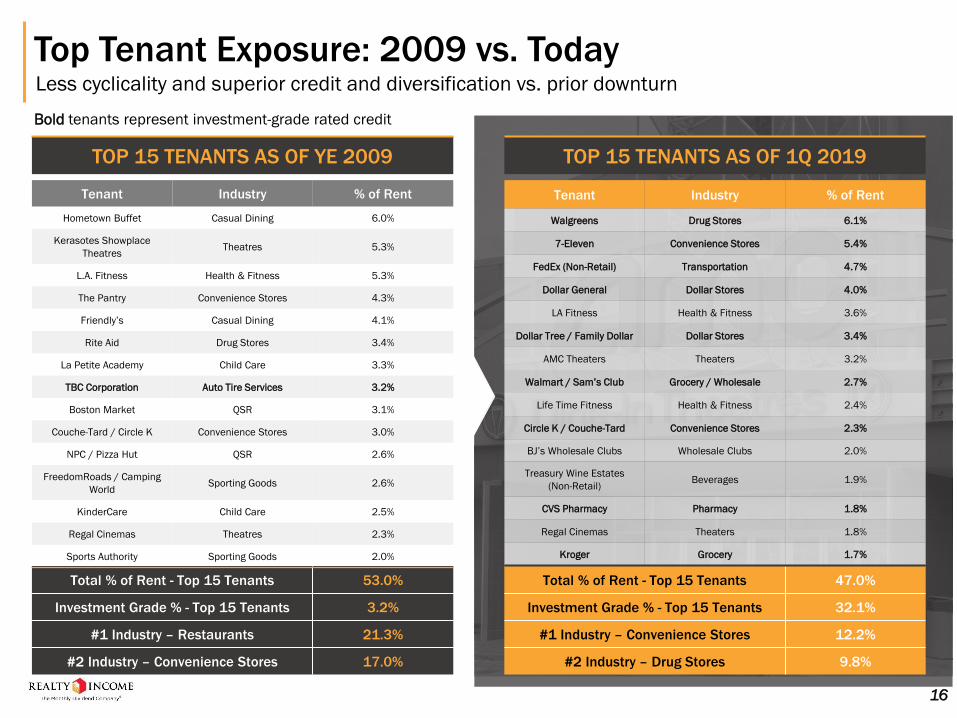
Total % of Rent - Top 15 Tenants 47.0%
Investment Grade % - Top 15 Tenants 32.1%
#1 Industry – Convenience Stores 12.2%
#2 Industry – Drug Stores 9.8%
Total % of Rent - Top 15 Tenants 53.0%
Investment Grade % - Top 15 Tenants 3.2%
#1 Industry – Restaurants 21.3%
#2 Industry – Convenience Stores 17.0%
Top Tenant Exposure: 2009 vs. TodayLess cyclicality and superior credit and diversification vs. prior downturn
16
TOP 15 TENANTS AS OF YE 2009 TOP 15 TENANTS AS OF 1Q 2019
Tenant Industry % of Rent
Hometown Buffet Casual Dining 6.0%
Kerasotes Showplace
TheatresTheatres 5.3%
L.A. Fitness Health & Fitness 5.3%
The Pantry Convenience Stores 4.3%
Friendly’s Casual Dining 4.1%
Rite Aid Drug Stores 3.4%
La Petite Academy Child Care 3.3%
TBC Corporation Auto Tire Services 3.2%
Boston Market QSR 3.1%
Couche-Tard / Circle K Convenience Stores 3.0%
NPC / Pizza Hut QSR 2.6%
FreedomRoads / Camping
WorldSporting Goods 2.6%
KinderCare Child Care 2.5%
Regal Cinemas Theatres 2.3%
Sports Authority Sporting Goods 2.0%
Tenant Industry % of Rent
Walgreens Drug Stores 6.1%
7-Eleven Convenience Stores 5.4%
FedEx (Non-Retail) Transportation 4.7%
Dollar General Dollar Stores 4.0%
LA Fitness Health & Fitness 3.6%
Dollar Tree / Family Dollar Dollar Stores 3.4%
AMC Theaters Theaters 3.2%
Walmart / Sam’s Club Grocery / Wholesale 2.7%
Life Time Fitness Health & Fitness 2.4%
Circle K / Couche-Tard Convenience Stores 2.3%
BJ’s Wholesale Clubs Wholesale Clubs 2.0%
Treasury Wine Estates
(Non-Retail)Beverages 1.9%
CVS Pharmacy Pharmacy 1.8%
Regal Cinemas Theaters 1.8%
Kroger Grocery 1.7%
Bold tenants represent investment-grade rated credit
Service-Oriented
Non-Discretionary
N/A (Non-Retail Exposure
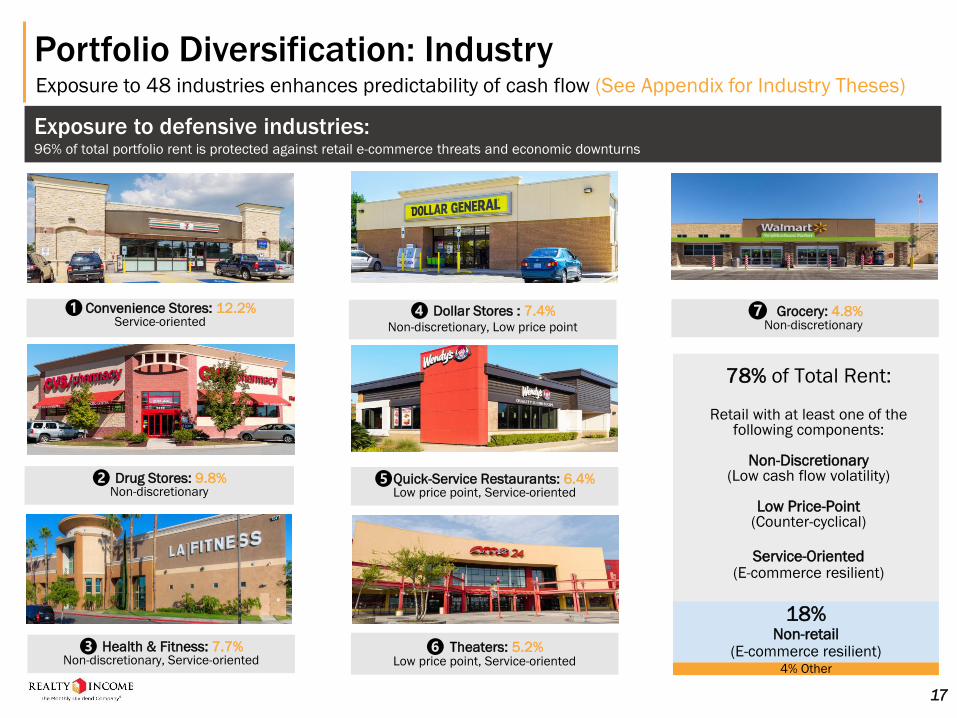
Portfolio Diversification: IndustryExposure to 48 industries enhances predictability of cash flow (See Appendix for Industry Theses)
Exposure to defensive industries:96% of total portfolio rent is protected against retail e-commerce threats and economic downturns
Non-Discretionary
Service-Oriented
Non-Discretionary, Low Price Point
Low Price Point
❶Convenience Stores: 12.2%Service-oriented
❷ Drug Stores: 9.8%Non-discretionary
❹ Dollar Stores : 7.4%Non-discretionary, Low price point
❸ Health & Fitness: 7.7%Non-discretionary, Service-oriented
❺Quick-Service Restaurants: 6.4%Low price point, Service-oriented
❻ Theaters: 5.2%Low price point, Service-oriented
❼ Grocery: 4.8%Non-discretionary
17
78% of Total Rent:
Retail with at least one of the following components:
Non-Discretionary(Low cash flow volatility)
Low Price-Point(Counter-cyclical)
Service-Oriented(E-commerce resilient)
18%Non-retail
(E-commerce resilient)4% Other
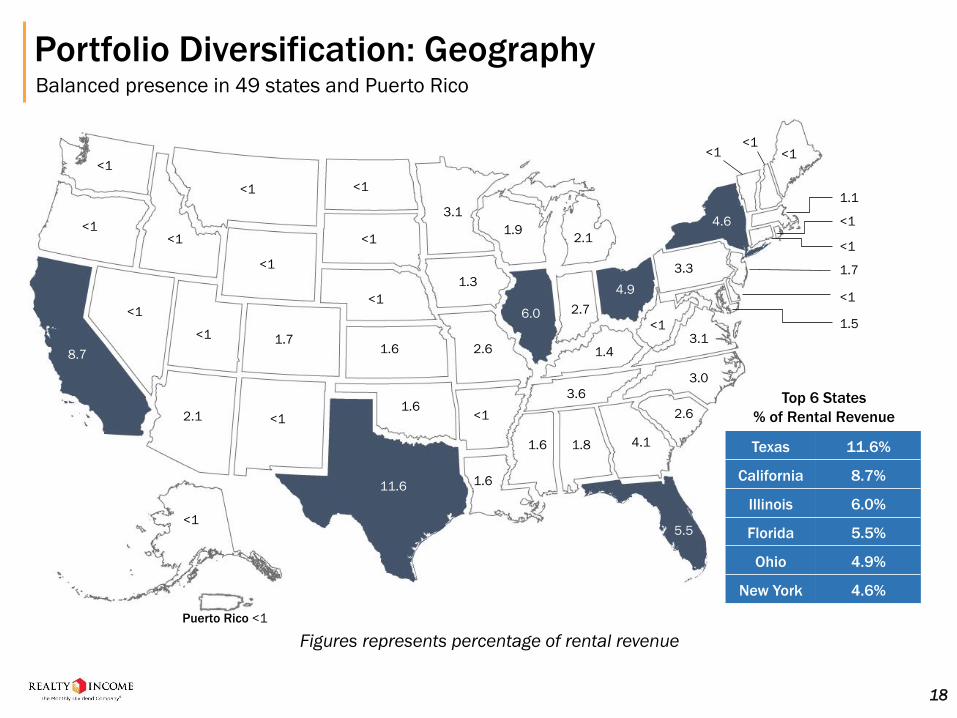
Portfolio Diversification: GeographyBalanced presence in 49 states and Puerto Rico
<1
<1
<1
<1
<1
<1
<1
2.1
<1
1.7
<1
<1
<1
1.6
1.6
3.1
1.3
2.6
<1
1.6
1.6 1.8 4.1
2.6
3.0
3.6
1.92.1
2.7
1.4
3.3
<13.1
<1
Puerto Rico <1
<1<1<1
1.1
<1
<1
1.7
<1
1.5
8.7
11.6
6.0
4.9
4.6
5.5
Texas 11.6%
California 8.7%
Illinois 6.0%
Florida 5.5%
Ohio 4.9%
New York 4.6%
Top 6 States
% of Rental Revenue
Figures represents percentage of rental revenue
18
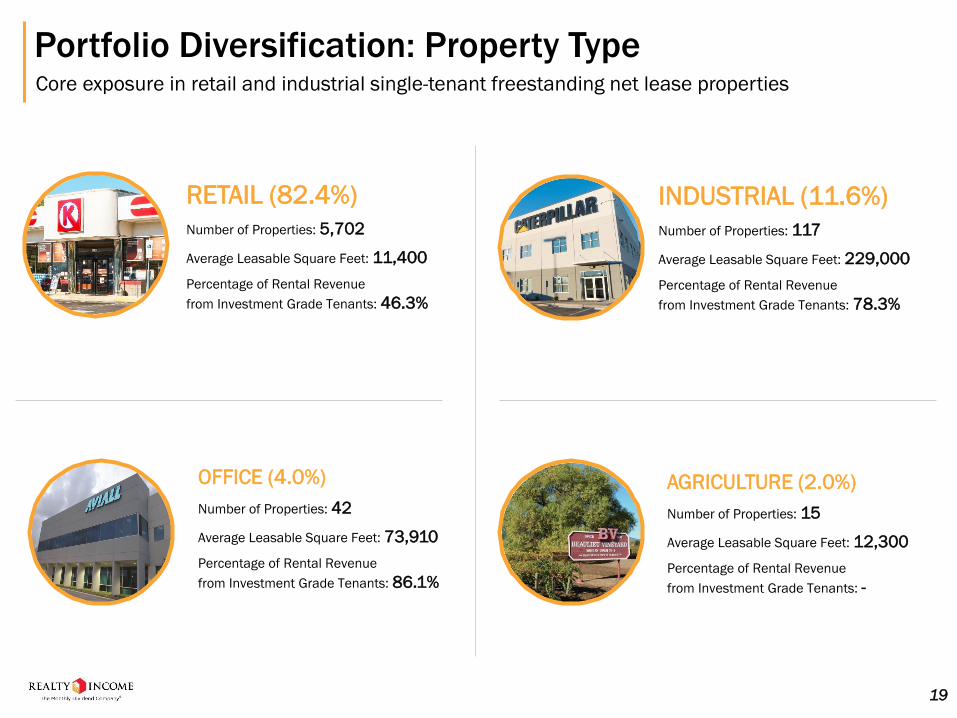
Portfolio Diversification: Property TypeCore exposure in retail and industrial single-tenant freestanding net lease properties
19
RETAIL (82.4%)
Number of Properties: 5,702
Average Leasable Square Feet: 11,400
Percentage of Rental Revenue
from Investment Grade Tenants: 46.3%
OFFICE (4.0%)
Number of Properties: 42
Average Leasable Square Feet: 73,910
Percentage of Rental Revenue
from Investment Grade Tenants: 86.1%
INDUSTRIAL (11.6%)
Number of Properties: 117
Average Leasable Square Feet: 229,000
Percentage of Rental Revenue
from Investment Grade Tenants: 78.3%
AGRICULTURE (2.0%)
Number of Properties: 15
Average Leasable Square Feet: 12,300
Percentage of Rental Revenue
from Investment Grade Tenants: -
ASSET MANAGEMENT &
REAL ESTATE OPERATIONS
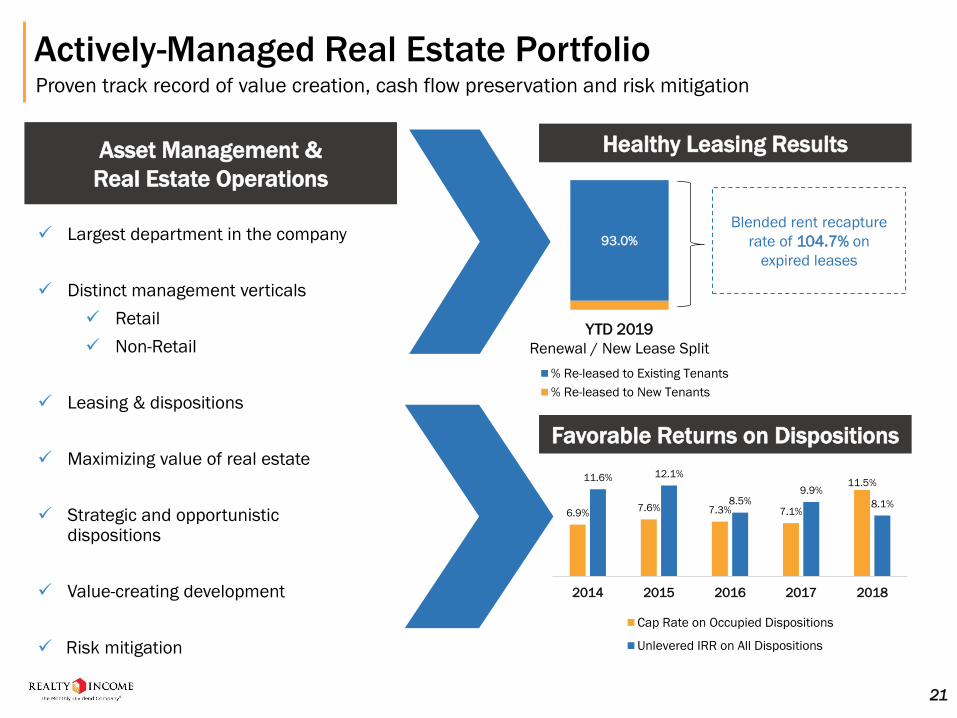
Actively-Managed Real Estate PortfolioProven track record of value creation, cash flow preservation and risk mitigation
✓ Largest department in the company
✓ Distinct management verticals
✓ Retail
✓ Non-Retail
✓ Leasing & dispositions
✓ Maximizing value of real estate
✓ Strategic and opportunistic dispositions
✓ Value-creating development
✓ Risk mitigation
Healthy Leasing Results
6.9%7.6% 7.3% 7.1%
11.5%11.6% 12.1%
8.5%9.9%
8.1%
2014 2015 2016 2017 2018
Cap Rate on Occupied Dispositions
Unlevered IRR on All Dispositions
21
93.0%
% Re-leased to Existing Tenants
% Re-leased to New Tenants
Blended rent recapture
rate of 104.7% on
expired leases
YTD 2019
Renewal / New Lease Split
Favorable Returns on Dispositions
Asset Management &
Real Estate Operations
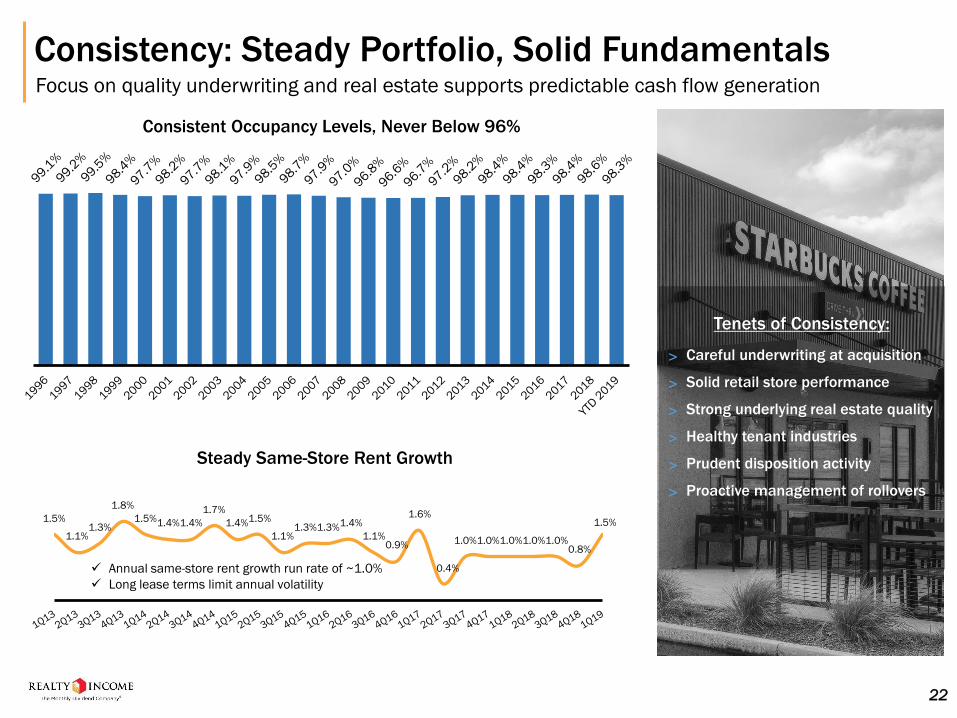
✓ Annual same-store rent growth run rate of ~1.0%
✓ Long lease terms limit annual volatility
1.5%
1.1%1.3%
1.8%
1.5%1.4%1.4%
1.7%
1.4%1.5%
1.1%1.3%1.3%1.4%
1.1%0.9%
1.6%
0.4%
1.0%1.0%1.0%1.0%1.0%0.8%
1.5%
Consistency: Steady Portfolio, Solid FundamentalsFocus on quality underwriting and real estate supports predictable cash flow generation
Consistent Occupancy Levels, Never Below 96%
Steady Same-Store Rent Growth
˃ Careful underwriting at acquisition
˃ Solid retail store performance
˃ Strong underlying real estate quality
˃ Healthy tenant industries
˃ Prudent disposition activity
˃ Proactive management of rollovers
Tenets of Consistency:
22
INVESTMENT STRATEGY
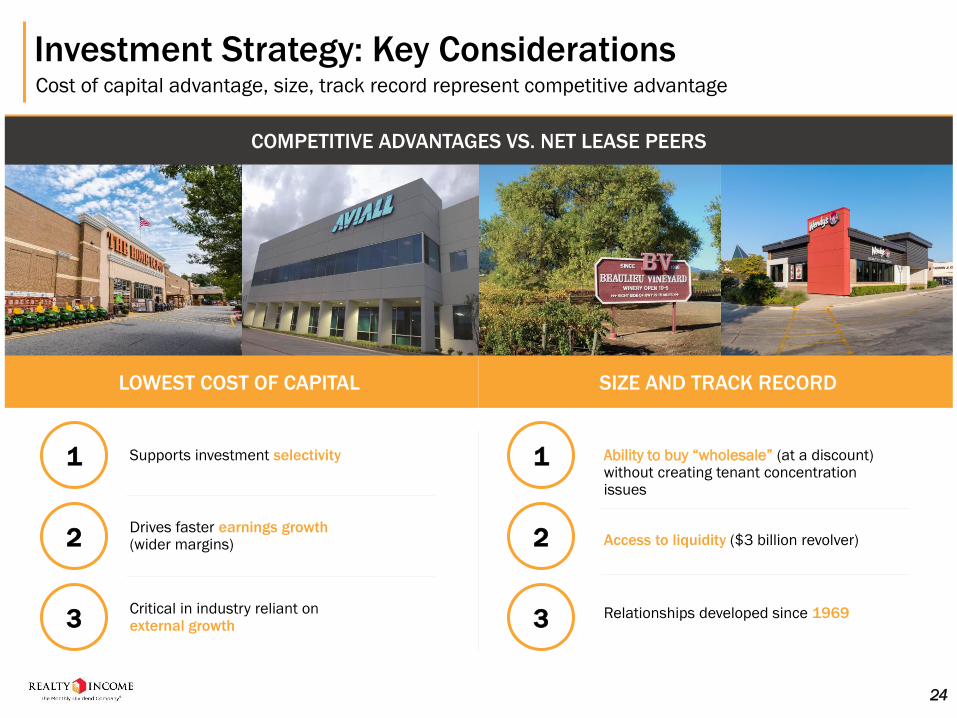
Investment Strategy: Key ConsiderationsCost of capital advantage, size, track record represent competitive advantage
24
COMPETITIVE ADVANTAGES VS. NET LEASE PEERS
Supports investment selectivity
Drives faster earnings growth (wider margins)
Critical in industry reliant on external growth
Ability to buy “wholesale” (at a discount) without creating tenant concentration issues
Access to liquidity ($3 billion revolver)
Relationships developed since 1969
1
2
3
1
2
3
SIZE AND TRACK RECORDLOWEST COST OF CAPITAL
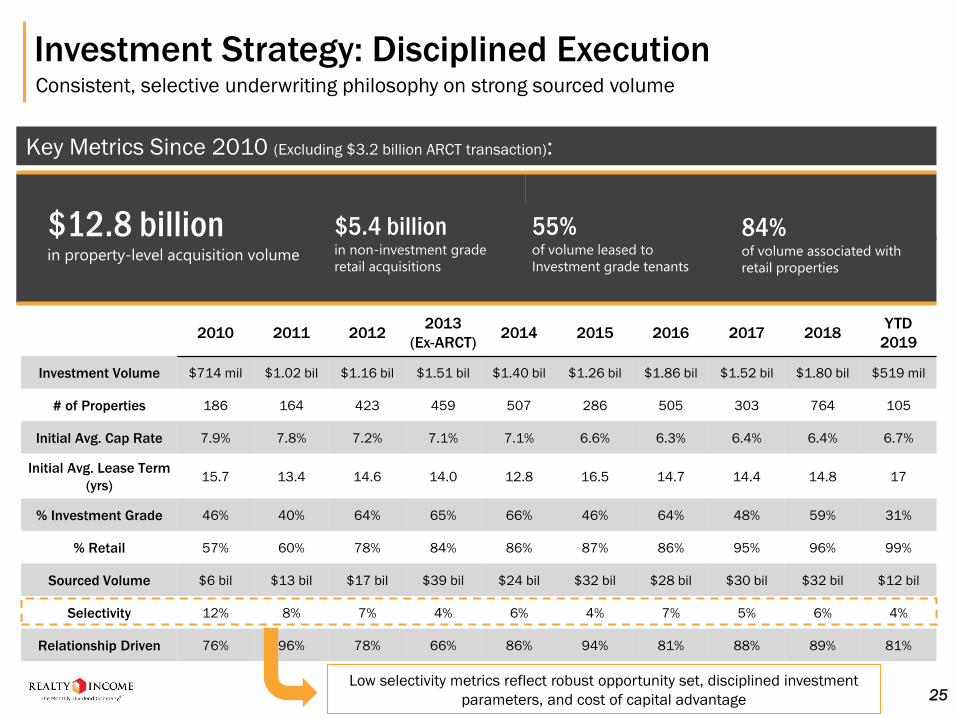
$12.8 billionin property-level acquisition volume
$5.4 billionin non-investment grade
retail acquisitions
84%of volume associated with
retail properties
55%of volume leased to
Investment grade tenants
Investment Strategy: Disciplined ExecutionConsistent, selective underwriting philosophy on strong sourced volume
2010 2011 20122013
(Ex-ARCT)2014 2015 2016 2017 2018
YTD
2019
Investment Volume $714 mil $1.02 bil $1.16 bil $1.51 bil $1.40 bil $1.26 bil $1.86 bil $1.52 bil $1.80 bil $519 mil
# of Properties 186 164 423 459 507 286 505 303 764 105
Initial Avg. Cap Rate 7.9% 7.8% 7.2% 7.1% 7.1% 6.6% 6.3% 6.4% 6.4% 6.7%
Initial Avg. Lease Term
(yrs)15.7 13.4 14.6 14.0 12.8 16.5 14.7 14.4 14.8 17
% Investment Grade 46% 40% 64% 65% 66% 46% 64% 48% 59% 31%
% Retail 57% 60% 78% 84% 86% 87% 86% 95% 96% 99%
Sourced Volume $6 bil $13 bil $17 bil $39 bil $24 bil $32 bil $28 bil $30 bil $32 bil $12 bil
Selectivity 12% 8% 7% 4% 6% 4% 7% 5% 6% 4%
Relationship Driven 76% 96% 78% 66% 86% 94% 81% 88% 89% 81%
Key Metrics Since 2010 (Excluding $3.2 billion ARCT transaction):
25Low selectivity metrics reflect robust opportunity set, disciplined investment
parameters, and cost of capital advantage
CAPITAL STRUCTURE AND SCALABILITY
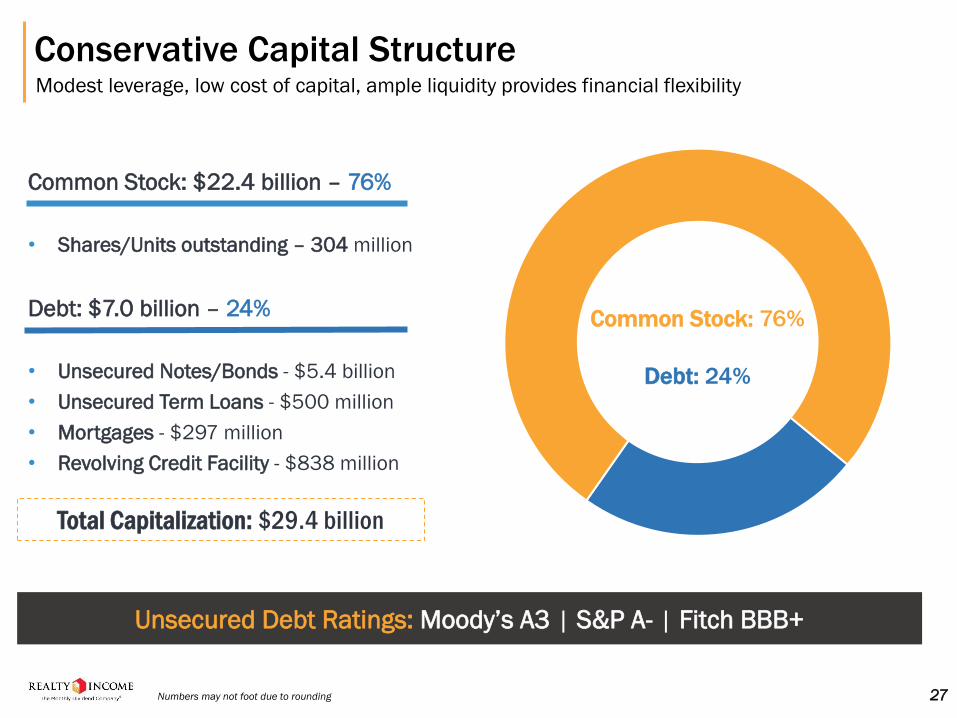
Conservative Capital StructureModest leverage, low cost of capital, ample liquidity provides financial flexibility
Common Stock: 76%
Debt: 24%
Common Stock: $22.4 billion – 76%
• Shares/Units outstanding – 304 million
Debt: $7.0 billion – 24%
• Unsecured Notes/Bonds - $5.4 billion
• Unsecured Term Loans - $500 million
• Mortgages - $297 million
• Revolving Credit Facility - $838 million
Total Capitalization: $29.4 billion
Unsecured Debt Ratings: Moody’s A3 | S&P A- | Fitch BBB+
27Numbers may not foot due to rounding
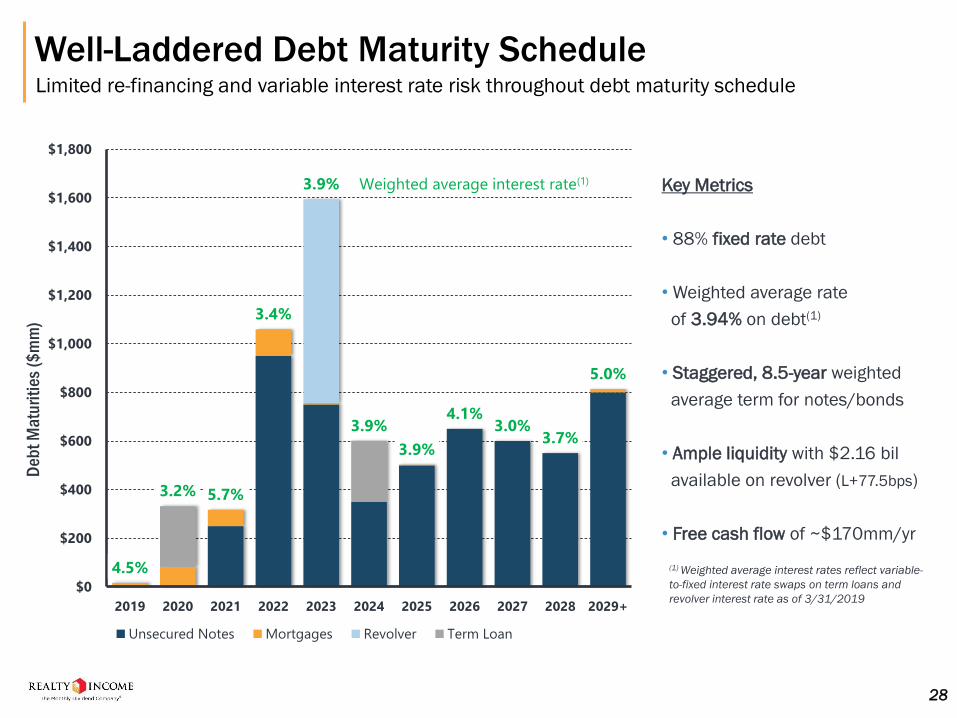
Well-Laddered Debt Maturity ScheduleLimited re-financing and variable interest rate risk throughout debt maturity schedule
Key Metrics
• 88% fixed rate debt
• Weighted average rate
of 3.94% on debt(1)
• Staggered, 8.5-year weighted
average term for notes/bonds
• Ample liquidity with $2.16 bil
available on revolver (L+77.5bps)
• Free cash flow of ~$170mm/yr
4.5%
3.2% 5.7%
3.4%
3.9%
3.9%
3.9%
4.1%3.0%
3.7%
5.0%
$0
$200
$400
$600
$800
$1,000
$1,200
$1,400
$1,600
$1,800
2019 2020 2021 2022 2023 2024 2025 2026 2027 2028 2029+
Unsecured Notes Mortgages Revolver Term Loan
Weighted average interest rate(1)
Deb
t M
atu
riti
es (
$m
m)
(1) Weighted average interest rates reflect variable-
to-fixed interest rate swaps on term loans and
revolver interest rate as of 3/31/2019
28
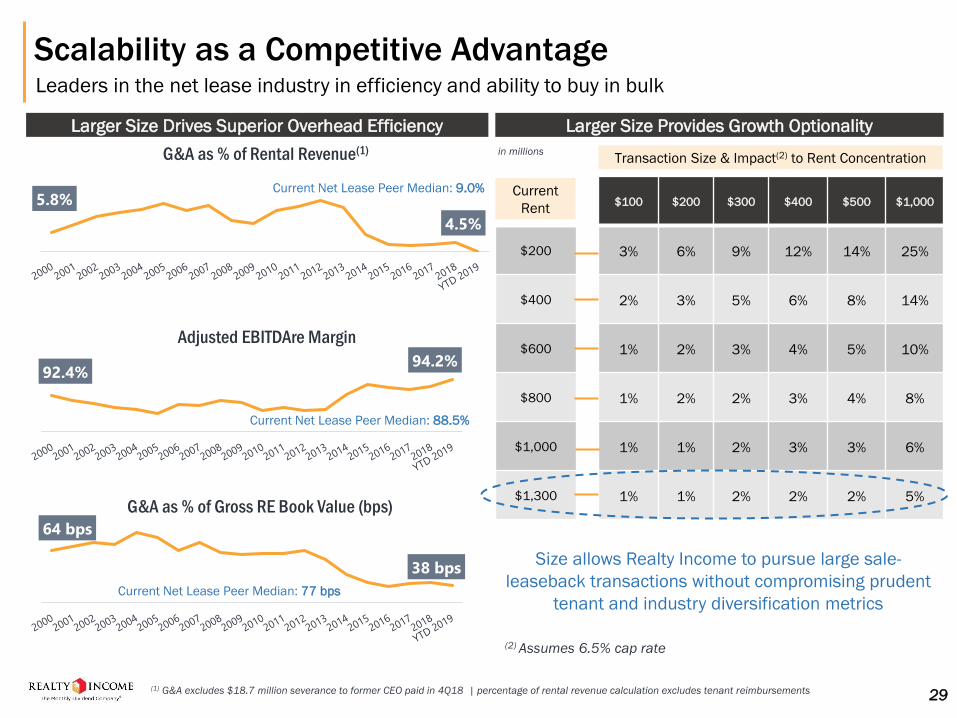
Scalability as a Competitive AdvantageLeaders in the net lease industry in efficiency and ability to buy in bulk
5.8%
4.5%
G&A as % of Rental Revenue(1)
(1) G&A excludes $18.7 million severance to former CEO paid in 4Q18 | percentage of rental revenue calculation excludes tenant reimbursements
64 bps
38 bps
G&A as % of Gross RE Book Value (bps)
92.4%94.2%
Adjusted EBITDAre Margin
Larger Size Drives Superior Overhead Efficiency
29
Larger Size Provides Growth Optionality
$100 $200 $300 $400 $500 $1,000
$200 3% 6% 9% 12% 14% 25%
$400 2% 3% 5% 6% 8% 14%
$600 1% 2% 3% 4% 5% 10%
$800 1% 2% 2% 3% 4% 8%
$1,000 1% 1% 2% 3% 3% 6%
$1,300 1% 1% 2% 2% 2% 5%
Transaction Size & Impact(2) to Rent Concentration
Current
Rent
Size allows Realty Income to pursue large sale-
leaseback transactions without compromising prudent
tenant and industry diversification metrics
(2) Assumes 6.5% cap rate
in millions
Current Net Lease Peer Median: 9.0%
Current Net Lease Peer Median: 88.5%
Current Net Lease Peer Median: 77 bps
Business Plan
• Pay 12 monthly dividends
• Raise the dividend
• Remain disciplined in our acquisitions underwriting approach
• Acquire additional properties according to our selective investment strategy
• Maintain high occupancy through active portfolio management
• Maintain a conservative balance sheet
• Continue to grow investor interest in The Monthly Dividend Company®
NYSE: “O”
APPENDIX
31
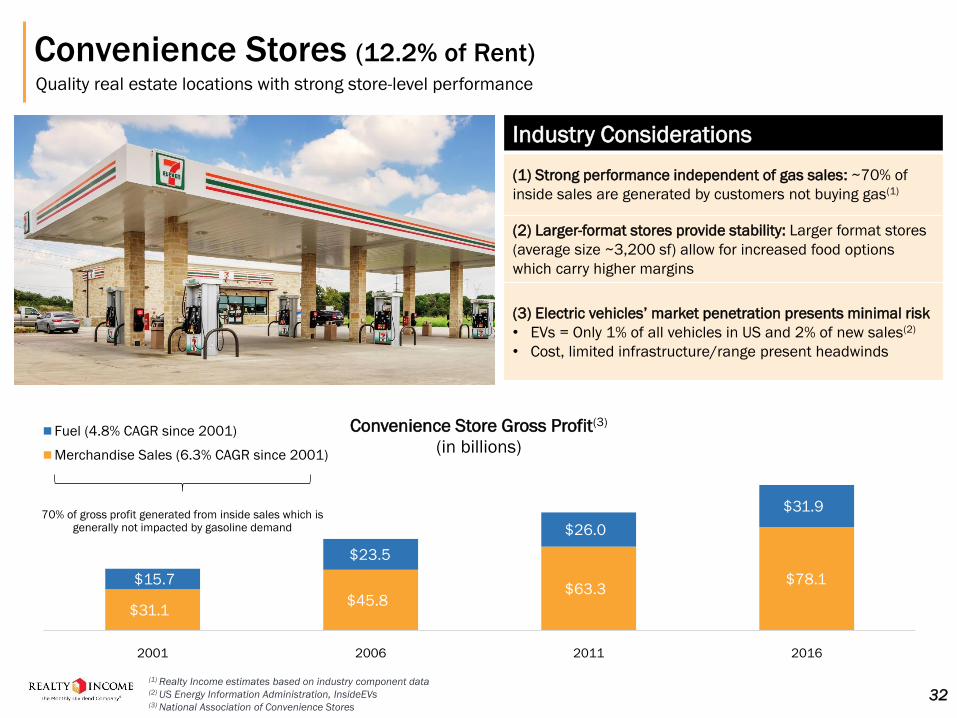
Convenience Stores (12.2% of Rent)Quality real estate locations with strong store-level performance
Industry Considerations
(1) Strong performance independent of gas sales: ~70% of
inside sales are generated by customers not buying gas(1)
(2) Larger-format stores provide stability: Larger format stores
(average size ~3,200 sf) allow for increased food options
which carry higher margins
(3) Electric vehicles’ market penetration presents minimal risk
• EVs = Only 1% of all vehicles in US and 2% of new sales(2)
• Cost, limited infrastructure/range present headwinds
$31.1 $45.8
$63.3 $78.1 $15.7
$23.5
$26.0
$31.9
2001 2006 2011 2016
Convenience Store Gross Profit(3)
(in billions)Fuel (4.8% CAGR since 2001)
Merchandise Sales (6.3% CAGR since 2001)
70% of gross profit generated from inside sales which is generally not impacted by gasoline demand
(1) Realty Income estimates based on industry component data(2) US Energy Information Administration, InsideEVs(3) National Association of Convenience Stores
32
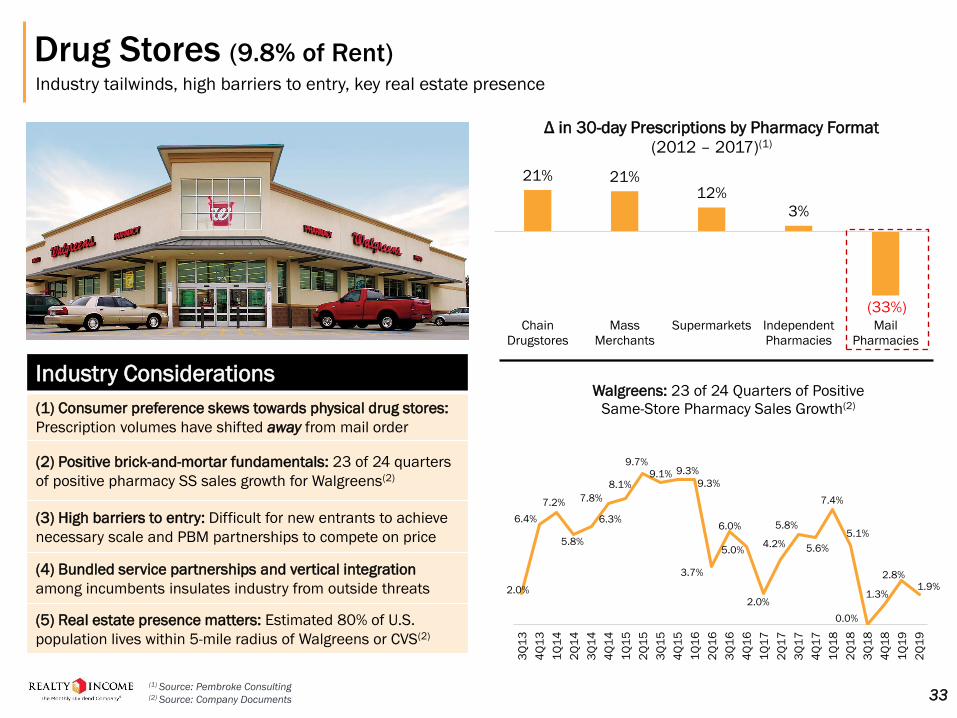
Drug Stores (9.8% of Rent)Industry tailwinds, high barriers to entry, key real estate presence
Industry Considerations
(1) Consumer preference skews towards physical drug stores:
Prescription volumes have shifted away from mail order
(2) Positive brick-and-mortar fundamentals: 23 of 24 quarters
of positive pharmacy SS sales growth for Walgreens(2)
(3) High barriers to entry: Difficult for new entrants to achieve
necessary scale and PBM partnerships to compete on price
(4) Bundled service partnerships and vertical integration
among incumbents insulates industry from outside threats
(5) Real estate presence matters: Estimated 80% of U.S.
population lives within 5-mile radius of Walgreens or CVS(2)
21% 21%12%
3%
(33%)Chain
Drugstores
Mass
Merchants
Supermarkets Independent
Pharmacies
Pharmacies
Δ in 30-day Prescriptions by Pharmacy Format
(2012 – 2017)(1)
(1) Source: Pembroke Consulting(2) Source: Company Documents
2.0%
6.4%
7.2%
5.8%
6.3%
7.8%
8.1%
9.7%
9.1% 9.3%
9.3%
3.7%
6.0%
5.0%
2.0%
4.2%
5.8%
5.6%
7.4%
5.1%
0.0%
1.3%
2.8%1.9%
3Q
13
4Q
13
1Q
14
2Q
14
3Q
14
4Q
14
1Q
15
2Q
15
3Q
15
4Q
15
1Q
16
2Q
16
3Q
16
4Q
16
1Q
17
2Q
17
3Q
17
4Q
17
1Q
18
2Q
18
3Q
18
4Q
18
1Q
19
2Q
19
Walgreens: 23 of 24 Quarters of Positive
Same-Store Pharmacy Sales Growth(2)
33
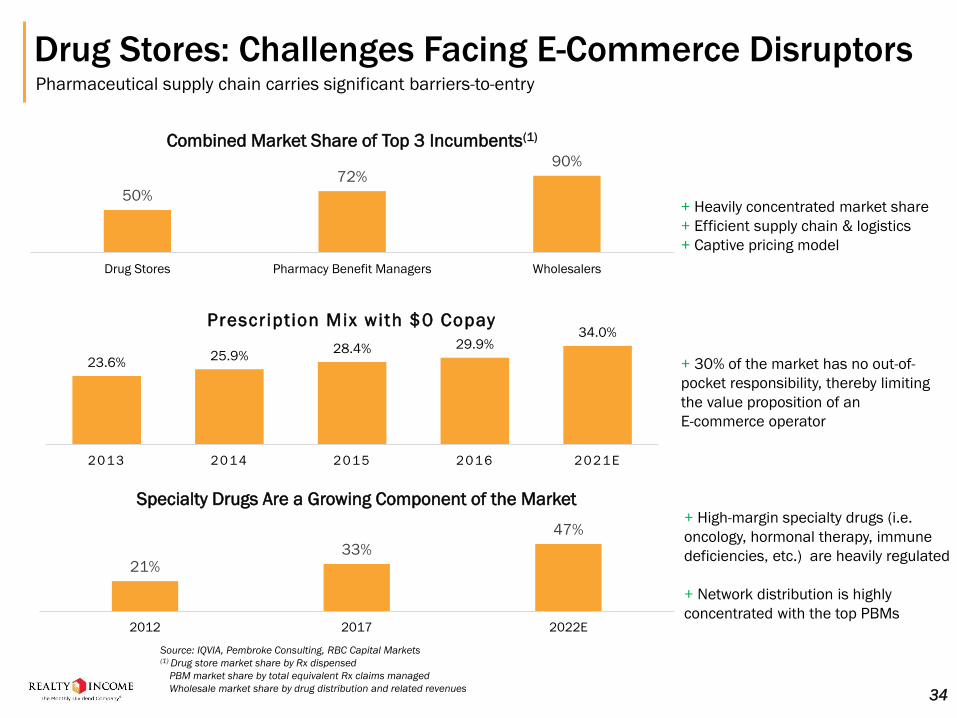
Drug Stores: Challenges Facing E-Commerce DisruptorsPharmaceutical supply chain carries significant barriers-to-entry
34
50%
72%90%
Drug Stores Pharmacy Benefit Managers Wholesalers
Combined Market Share of Top 3 Incumbents(1)
Source: IQVIA, Pembroke Consulting, RBC Capital Markets(1) Drug store market share by Rx dispensed
PBM market share by total equivalent Rx claims managed
Wholesale market share by drug distribution and related revenues
23.6%25.9%
28.4% 29.9%34.0%
2013 2014 2015 2016 2021E
Prescription Mix with $0 Copay
+ Heavily concentrated market share
+ Efficient supply chain & logistics
+ Captive pricing model
+ 30% of the market has no out-of-
pocket responsibility, thereby limiting
the value proposition of an
E-commerce operator
21%33%
47%
2012 2017 2022E
Specialty Drugs Are a Growing Component of the Market+ High-margin specialty drugs (i.e.
oncology, hormonal therapy, immune
deficiencies, etc.) are heavily regulated
+ Network distribution is highly
concentrated with the top PBMs
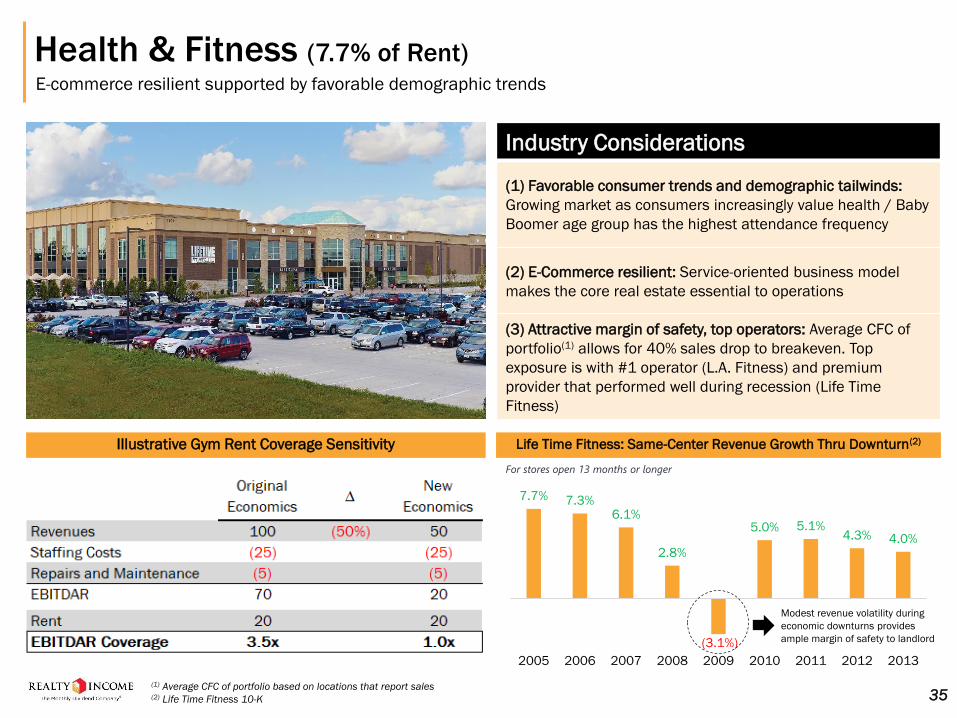
Health & Fitness (7.7% of Rent)E-commerce resilient supported by favorable demographic trends
Industry Considerations
(1) Favorable consumer trends and demographic tailwinds:
Growing market as consumers increasingly value health / Baby
Boomer age group has the highest attendance frequency
(2) E-Commerce resilient: Service-oriented business model
makes the core real estate essential to operations
(3) Attractive margin of safety, top operators: Average CFC of
portfolio(1) allows for 40% sales drop to breakeven. Top
exposure is with #1 operator (L.A. Fitness) and premium
provider that performed well during recession (Life Time
Fitness)
Illustrative Gym Rent Coverage Sensitivity Life Time Fitness: Same-Center Revenue Growth Thru Downturn(2)
7.7% 7.3%6.1%
2.8%
(3.1%)
5.0% 5.1%4.3% 4.0%
2005 2006 2007 2008 2009 2010 2011 2012 2013
For stores open 13 months or longer
Modest revenue volatility during
economic downturns provides
ample margin of safety to landlord
35(1) Average CFC of portfolio based on locations that report sales(2) Life Time Fitness 10-K
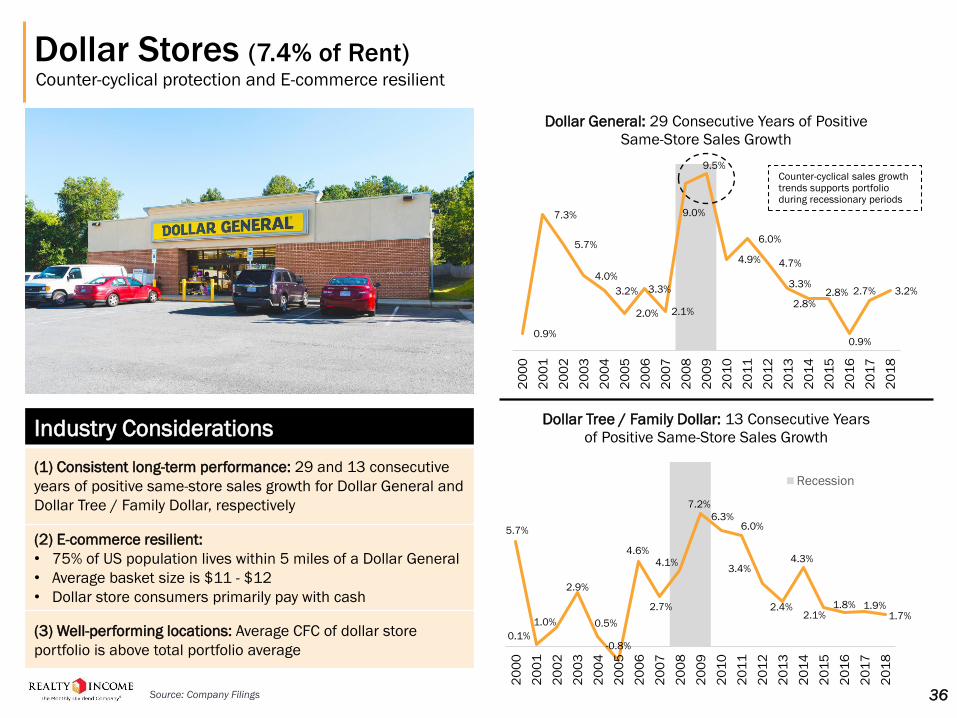
Dollar Stores (7.4% of Rent)Counter-cyclical protection and E-commerce resilient
Industry Considerations
(1) Consistent long-term performance: 29 and 13 consecutive
years of positive same-store sales growth for Dollar General and
Dollar Tree / Family Dollar, respectively
(2) E-commerce resilient:
• 75% of US population lives within 5 miles of a Dollar General
• Average basket size is $11 - $12
• Dollar store consumers primarily pay with cash
(3) Well-performing locations: Average CFC of dollar store
portfolio is above total portfolio average
0.9%
7.3%
5.7%
4.0%
3.2%
2.0%
3.3%
2.1%
9.0%
9.5%
4.9%
6.0%
4.7%
3.3%
2.8%2.8%
0.9%
2.7% 3.2%
20
00
20
01
20
02
20
03
20
04
20
05
20
06
20
07
20
08
20
09
20
10
20
11
20
12
20
13
20
14
20
15
20
16
20
17
20
18
Dollar General: 29 Consecutive Years of Positive
Same-Store Sales Growth
5.7%
0.1%
1.0%
2.9%
0.5%
-0.8%
4.6%
2.7%
4.1%
7.2%
6.3%6.0%
3.4%
2.4%
4.3%
2.1%1.8% 1.9%
1.7%
20
00
20
01
20
02
20
03
20
04
20
05
20
06
20
07
20
08
20
09
20
10
20
11
20
12
20
13
20
14
20
15
20
16
20
17
20
18
Dollar Tree / Family Dollar: 13 Consecutive Years
of Positive Same-Store Sales Growth
Recession
Counter-cyclical sales growth trends supports portfolio during recessionary periods
Source: Company Filings 36
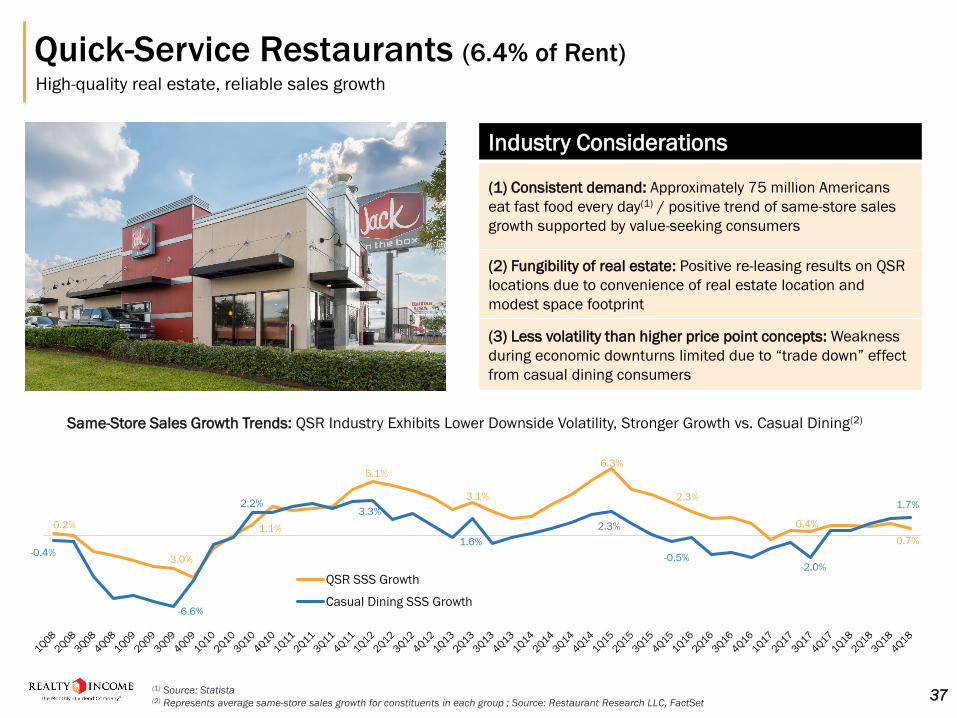
Quick-Service Restaurants (6.4% of Rent)High-quality real estate, reliable sales growth
Industry Considerations
(1) Consistent demand: Approximately 75 million Americans
eat fast food every day(1) / positive trend of same-store sales
growth supported by value-seeking consumers
(2) Fungibility of real estate: Positive re-leasing results on QSR
locations due to convenience of real estate location and
modest space footprint
(3) Less volatility than higher price point concepts: Weakness
during economic downturns limited due to “trade down” effect
from casual dining consumers
0.2%
-3.0%
1.1%
5.1%
3.1%
6.3%
2.3%
0.4%
0.7%
-0.4%
-6.6%
2.2%3.3%
1.6%
2.3%
-0.5%-2.0%
1.7%
QSR SSS Growth
Casual Dining SSS Growth
Same-Store Sales Growth Trends: QSR Industry Exhibits Lower Downside Volatility, Stronger Growth vs. Casual Dining(2)
(1) Source: Statista(2) Represents average same-store sales growth for constituents in each group ; Source: Restaurant Research LLC, FactSet
37
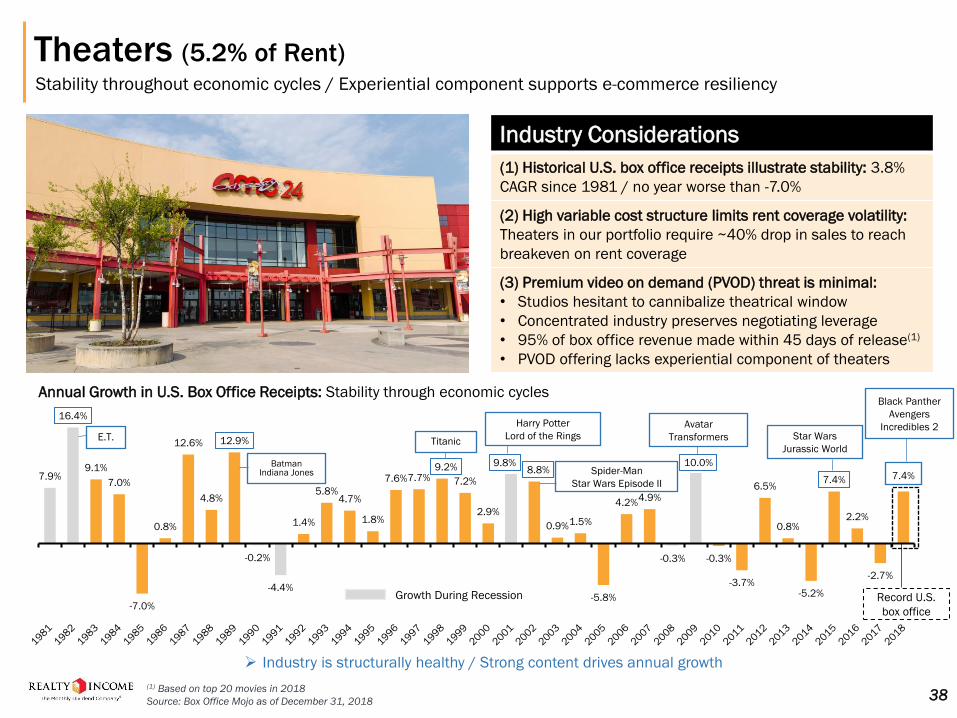
Theaters (5.2% of Rent)Stability throughout economic cycles / Experiential component supports e-commerce resiliency
Industry Considerations
(1) Historical U.S. box office receipts illustrate stability: 3.8%
CAGR since 1981 / no year worse than -7.0%
(2) High variable cost structure limits rent coverage volatility:
Theaters in our portfolio require ~40% drop in sales to reach
breakeven on rent coverage
(3) Premium video on demand (PVOD) threat is minimal:
• Studios hesitant to cannibalize theatrical window
• Concentrated industry preserves negotiating leverage
• 95% of box office revenue made within 45 days of release(1)
• PVOD offering lacks experiential component of theaters
7.9%
16.4%
9.1%
7.0%
-7.0%
0.8%
12.6%
4.8%
12.9%
-0.2%
-4.4%
1.4%
5.8%4.7%
1.8%
7.6%7.7%9.2%
7.2%
2.9%
9.8%8.8%
0.9%1.5%
-5.8%
4.2%4.9%
-0.3%
10.0%
-0.3%
-3.7%
6.5%
0.8%
-5.2%
7.4%
2.2%
-2.7%
7.4%
Annual Growth in U.S. Box Office Receipts: Stability through economic cycles
Growth During Recession Record U.S.
box office
(1) Based on top 20 movies in 2018
Source: Box Office Mojo as of December 31, 2018 38
E.T.
BatmanIndiana Jones
Titanic
Harry Potter
Lord of the Rings
Spider-Man
Star Wars Episode II
Avatar
Transformers Star Wars
Jurassic World
➢ Industry is structurally healthy / Strong content drives annual growth
Black Panther
Avengers
Incredibles 2
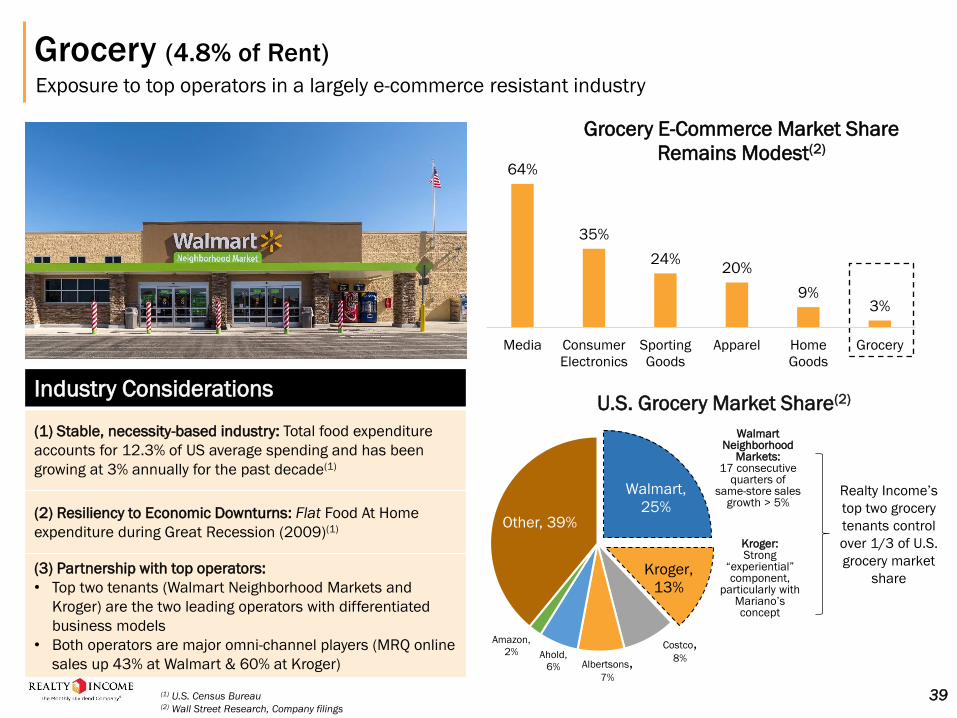
Grocery (4.8% of Rent)
Exposure to top operators in a largely e-commerce resistant industry
Industry Considerations
(1) Stable, necessity-based industry: Total food expenditure
accounts for 12.3% of US average spending and has been
growing at 3% annually for the past decade(1)
(2) Resiliency to Economic Downturns: Flat Food At Home
expenditure during Great Recession (2009)(1)
(3) Partnership with top operators:
• Top two tenants (Walmart Neighborhood Markets and
Kroger) are the two leading operators with differentiated
business models
• Both operators are major omni-channel players (MRQ online
sales up 43% at Walmart & 60% at Kroger)
Walmart,
25%
Kroger,
13%
Costco, 8%
Albertsons, 7%
Ahold,
6%
Amazon,
2%
Other, 39%
Walmart Neighborhood
Markets:17 consecutive
quarters of same-store sales
growth > 5%
Kroger:Strong
“experiential” component,
particularly with Mariano’s concept
U.S. Grocery Market Share(2)
Realty Income’s
top two grocery
tenants control
over 1/3 of U.S.
grocery market
share
(1) U.S. Census Bureau(2) Wall Street Research, Company filings
39
64%
35%
24%20%
9%3%
Media Consumer
Electronics
Sporting
Goods
Apparel Home
Goods
Grocery
Grocery E-Commerce Market Share
Remains Modest(2)