Embed Size (px)
Citation preview
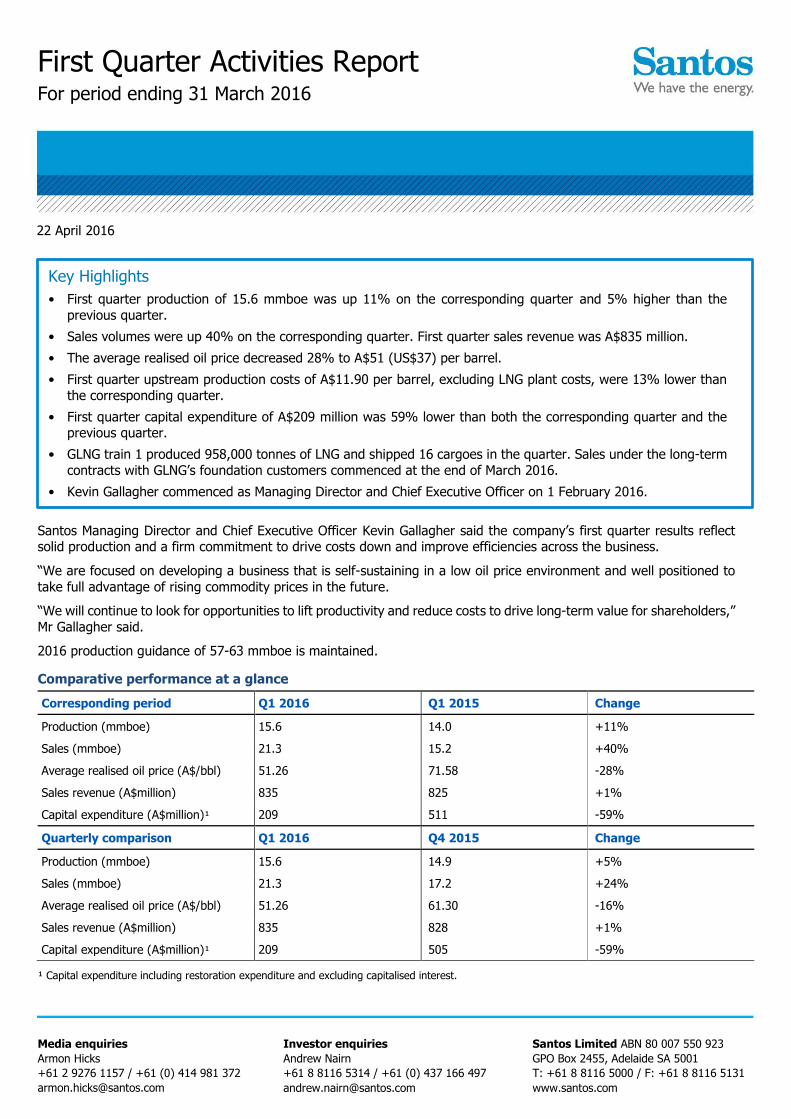
First Quarter Activities Report For period ending 31 March 2016
22 April 2016
Media enquiries
Armon Hicks
+61 2 9276 1157 / +61 (0) 414 981 372
Investor enquiries
Andrew Nairn
+61 8 8116 5314 / +61 (0) 437 166 497
Santos Limited ABN 80 007 550 923
GPO Box 2455, Adelaide SA 5001
T: +61 8 8116 5000 / F: +61 8 8116 5131
www.santos.com
Santos Managing Director and Chief Executive Officer Kevin Gallagher said the company’s first quarter results reflect solid production and a firm commitment to drive costs down and improve efficiencies across the business.
“We are focused on developing a business that is self-sustaining in a low oil price environment and well positioned to
take full advantage of rising commodity prices in the future.
“We will continue to look for opportunities to lift productivity and reduce costs to drive long-term value for shareholders,”
Mr Gallagher said.
2016 production guidance of 57-63 mmboe is maintained.
Comparative performance at a glance
Corresponding period Q1 2016 Q1 2015 Change
Production (mmboe) 15.6 14.0 +11%
Sales (mmboe) 21.3 15.2 +40%
Average realised oil price (A$/bbl) 51.26 71.58 -28%
Sales revenue (A$million) 835 825 +1%
Capital expenditure (A$million)¹ 209 511 -59%
Quarterly comparison Q1 2016 Q4 2015 Change
Production (mmboe) 15.6 14.9 +5%
Sales (mmboe) 21.3 17.2 +24%
Average realised oil price (A$/bbl) 51.26 61.30 -16%
Sales revenue (A$million) 835 828 +1%
Capital expenditure (A$million)¹ 209 505 -59%
¹ Capital expenditure including restoration expenditure and excluding capitalised interest.
Key Highlights
• First quarter production of 15.6 mmboe was up 11% on the corresponding quarter and 5% higher than the
previous quarter.
• Sales volumes were up 40% on the corresponding quarter. First quarter sales revenue was A$835 million.
• The average realised oil price decreased 28% to A$51 (US$37) per barrel.
• First quarter upstream production costs of A$11.90 per barrel, excluding LNG plant costs, were 13% lower than
the corresponding quarter.
• First quarter capital expenditure of A$209 million was 59% lower than both the corresponding quarter and the previous quarter.
• GLNG train 1 produced 958,000 tonnes of LNG and shipped 16 cargoes in the quarter. Sales under the long-term
contracts with GLNG’s foundation customers commenced at the end of March 2016.
• Kevin Gallagher commenced as Managing Director and Chief Executive Officer on 1 February 2016.
Santos Ltd l First Quarter Activities Report l 22 April 2016 Page 2 of 9
Sales gas, ethane and sales gas to LNG production of 72.2 PJ for the quarter was 14% higher than the corresponding quarter, reflecting a full quarter of GLNG train 1 production. Total sales gas, ethane and LNG sales revenue increased 16% to A$602 million for the quarter.
Quarterly crude oil production of 2.1 mmbbl was 5% lower than the previous quarter, primarily due to natural field decline. The average oil price for the quarter was A$51 per barrel, 16% lower than the previous quarter, reflecting lower global oil prices. Total crude oil sales revenue of A$180 million for the quarter was 17% lower than the previous quarter reflecting lower oil prices and flat sales volumes.
Corporate activities
Cash proceeds of A$520 million from the sale of the Kipper gas asset to Mitsui E&P Australia were received on 3 March 2016.
On 1 April 2016, Santos announced the establishment of the new Executive team (“Excom”) and the transition to a functional based organisational structure. This was a key step in establishing a new operating model for Santos that is focused on both lifting productivity and driving long-term value for shareholders in a low oil price environment.
The new organisational structure involves moving away from geographic based business units to an asset focused model with strong technical capabilities in the primary business areas of exploration, development, production and commercial. The transition to the new organisation is expected to take place over the next few months, consistent with the company’s commitment to safe, sustainable development and operations.
The 2016 Annual General Meeting will be held at the Adelaide Convention Centre on Wednesday 4 May 2016 at 10:00 am.
2016 Guidance
All 2016 guidance is maintained, as shown in the table below.
Item 2016 Guidance
Production 57-63 mmboe
Sales 76-83 mmboe
Upstream production costs (excluding LNG plant costs) A$13.5-14/boe produced
Depreciation, depletion & amortisation (DD&A) expense A$1.1 billion
Capital expenditure (incl. exploration, evaluation and restoration, excluding capitalised interest)1 A$1.1 billion
¹ Capital expenditure guidance excludes capitalised interest, which is forecast at approximately A$30 million.
Further detail of 2016 capital expenditure, including exploration and evaluation expenditure, is reported in the table on page 7 of this report.
Santos Ltd l First Quarter Activities Report l 22 April 2016 Page 3 of 9
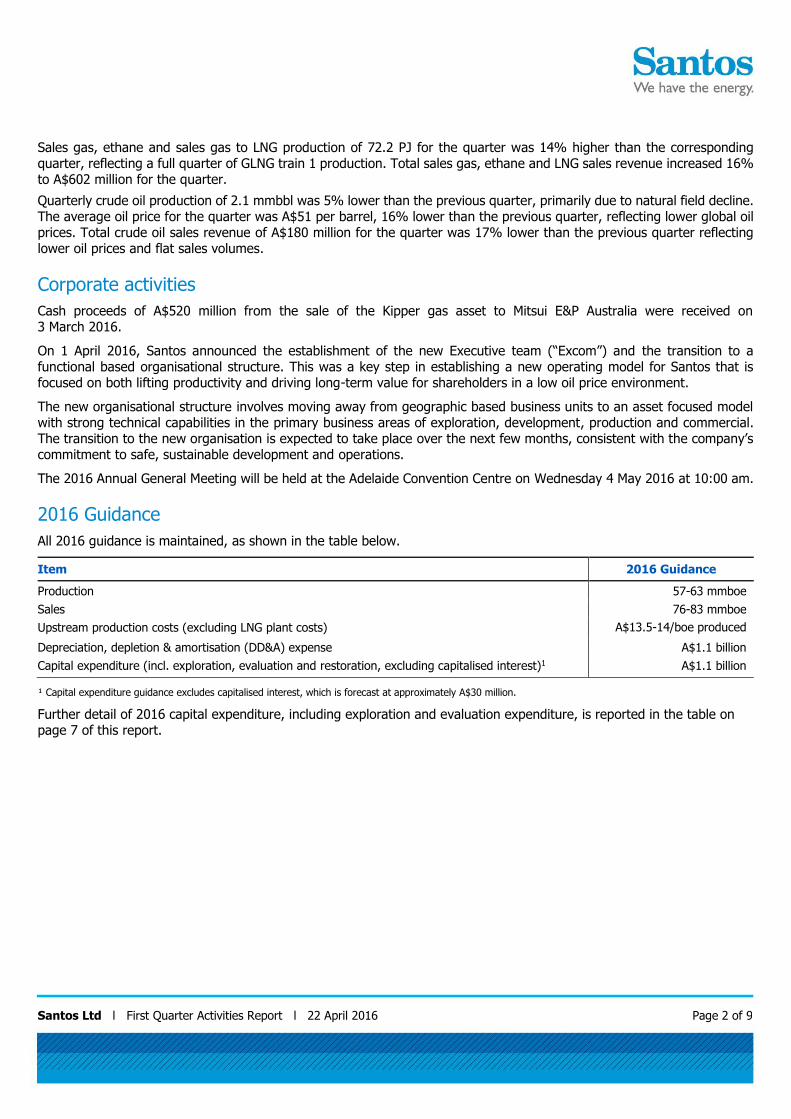
Production (Santos share)
Q1 2016 Q1 2015 Q4 2015 Full-year 2015
Sales gas and ethane (PJ)
Cooper 15.5 14.9 16.0 63.0
Carnarvon 12.7 13.8 11.1 51.6
Indonesia 6.0 5.6 6.2 23.8
Denison/Scotia/Spring Gully/Combabula 4.7 3.3 4.3 14.3
Otway 2.5 3.5 2.6 13.0
GLNG domestic 1.4 1.8 0.0 4.7
Other1 1.6 1.4 1.5 5.6
Total sales gas and ethane production (PJ) 44.4 44.3 41.7 176.0
Total sales gas and ethane production (mmboe) 7.6 7.6 7.1 30.2
Sales gas to LNG (PJ)
PNG LNG (incl. SE Gobe) 16.0 14.0 15.4 59.5
GLNG2 6.6 - 5.4 5.7
Darwin LNG 5.2 4.9 4.9 19.5
Total sales gas to LNG production (PJ) 27.8 18.9 25.7 84.7
Total sales gas to LNG production (mmboe) 4.8 3.2 4.5 14.6
Condensate (000 barrels)
PNG LNG 382.4 334.7 377.2 1,441.9
Cooper 243.5 243.7 251.9 943.9
Bayu-Undan 130.2 190.5 136.8 682.1
Carnarvon 120.9 136.6 98.4 511.8
Other3 8.7 13.7 10.3 54.6
Total condensate production (000 barrels) 885.7 919.2 874.6 3,634.3
Total condensate production (mmboe) 0.8 0.9 0.7 3.4
LPG (000 tonnes)
Cooper 29.0 25.8 29.6 114.2
Bayu-Undan 6.8 10.4 7.5 37.5
Total LPG production (000 tonnes) 35.8 36.2 37.1 151.7
Total LPG production (mmboe) 0.3 0.3 0.4 1.3
Crude oil (000 barrels)
Cooper 681.9 708.6 671.4 2,840.4
Vietnam 672.7 774.3 701.0 2,610.4
Mutineer-Exeter/Fletcher Finucane 348.6 85.8 394.7 972.0
Stag 185.6 180.1 227.9 817.1
Barrow 114.7 117.5 120.2 483.8
Other4 65.4 105.4 60.1 422.0
Total crude oil production (000 barrels) 2,068.9 1,971.7 2,175.3 8,145.7
Total crude oil production (mmboe) 2.1 2.0 2.2 8.2
Total
Production (mmboe) 15.6 14.0 14.9 57.7
1 Amadeus, Vietnam and Gunnedah. 2 GLNG production is Santos’ share of the sales gas to LNG produced from the GLNG upstream fields at Fairview and Roma. Santos portfolio gas produced
for the Horizon contract is attributed to the field of production. 3 Amadeus, Otway, Indonesia and Queensland. 4 Amadeus, Queensland, Indonesia and PNG.
Santos Ltd l First Quarter Activities Report l 22 April 2016 Page 4 of 9
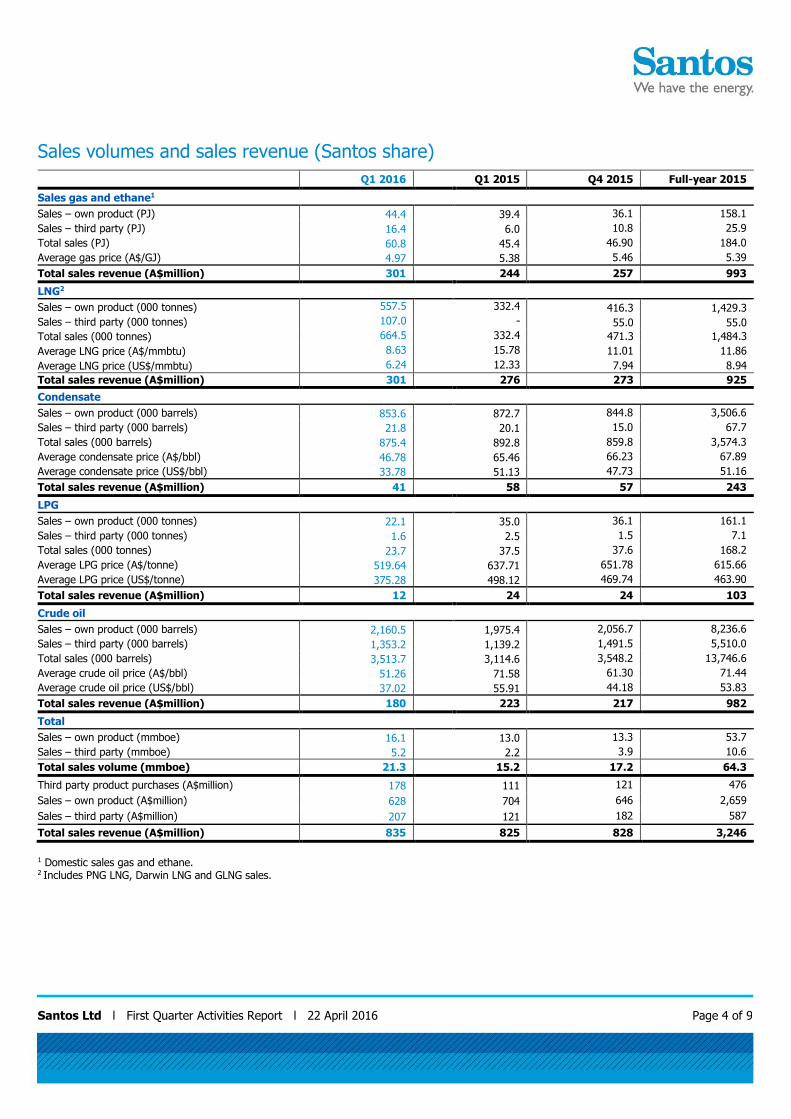
Sales volumes and sales revenue (Santos share)
Q1 2016 Q1 2015 Q4 2015 Full-year 2015
Sales gas and ethane1
Sales – own product (PJ) 44.4 39.4 36.1 158.1
Sales – third party (PJ) 16.4 6.0 10.8 25.9
Total sales (PJ) 60.8 45.4 46.90 184.0
Average gas price (A$/GJ) 4.97 5.38 5.46 5.39
Total sales revenue (A$million) 301 244 257 993
LNG2
Sales – own product (000 tonnes) 557.5 332.4 416.3 1,429.3
Sales – third party (000 tonnes) 107.0 - 55.0 55.0
Total sales (000 tonnes) 664.5 332.4 471.3 1,484.3
Average LNG price (A$/mmbtu) 8.63 15.78 11.01 11.86
Average LNG price (US$/mmbtu) 6.24 12.33 7.94 8.94
Total sales revenue (A$million) 301 276 273 925
Condensate
Sales – own product (000 barrels) 853.6 872.7 844.8 3,506.6
Sales – third party (000 barrels) 21.8 20.1 15.0 67.7
Total sales (000 barrels) 875.4 892.8 859.8 3,574.3
Average condensate price (A$/bbl) 46.78 65.46 66.23 67.89
Average condensate price (US$/bbl) 33.78 51.13 47.73 51.16
Total sales revenue (A$million) 41 58 57 243
LPG
Sales – own product (000 tonnes) 22.1 35.0 36.1 161.1
Sales – third party (000 tonnes) 1.6 2.5 1.5 7.1
Total sales (000 tonnes) 23.7 37.5 37.6 168.2
Average LPG price (A$/tonne) 519.64 637.71 651.78 615.66
Average LPG price (US$/tonne) 375.28 498.12 469.74 463.90
Total sales revenue (A$million) 12 24 24 103
Crude oil
Sales – own product (000 barrels) 2,160.5 1,975.4 2,056.7 8,236.6
Sales – third party (000 barrels) 1,353.2 1,139.2 1,491.5 5,510.0
Total sales (000 barrels) 3,513.7 3,114.6 3,548.2 13,746.6
Average crude oil price (A$/bbl) 51.26 71.58 61.30 71.44
Average crude oil price (US$/bbl) 37.02 55.91 44.18 53.83
Total sales revenue (A$million) 180 223 217 982
Total
Sales – own product (mmboe) 16.1 13.0 13.3 53.7
Sales – third party (mmboe) 5.2 2.2 3.9 10.6
Total sales volume (mmboe) 21.3 15.2 17.2 64.3
Third party product purchases (A$million) 178 111 121 476
Sales – own product (A$million) 628 704 646 2,659
Sales – third party (A$million) 207 121 182 587
Total sales revenue (A$million) 835 825 828 3,246
1 Domestic sales gas and ethane. 2 Includes PNG LNG, Darwin LNG and GLNG sales.
Santos Ltd l First Quarter Activities Report l 22 April 2016 Page 5 of 9
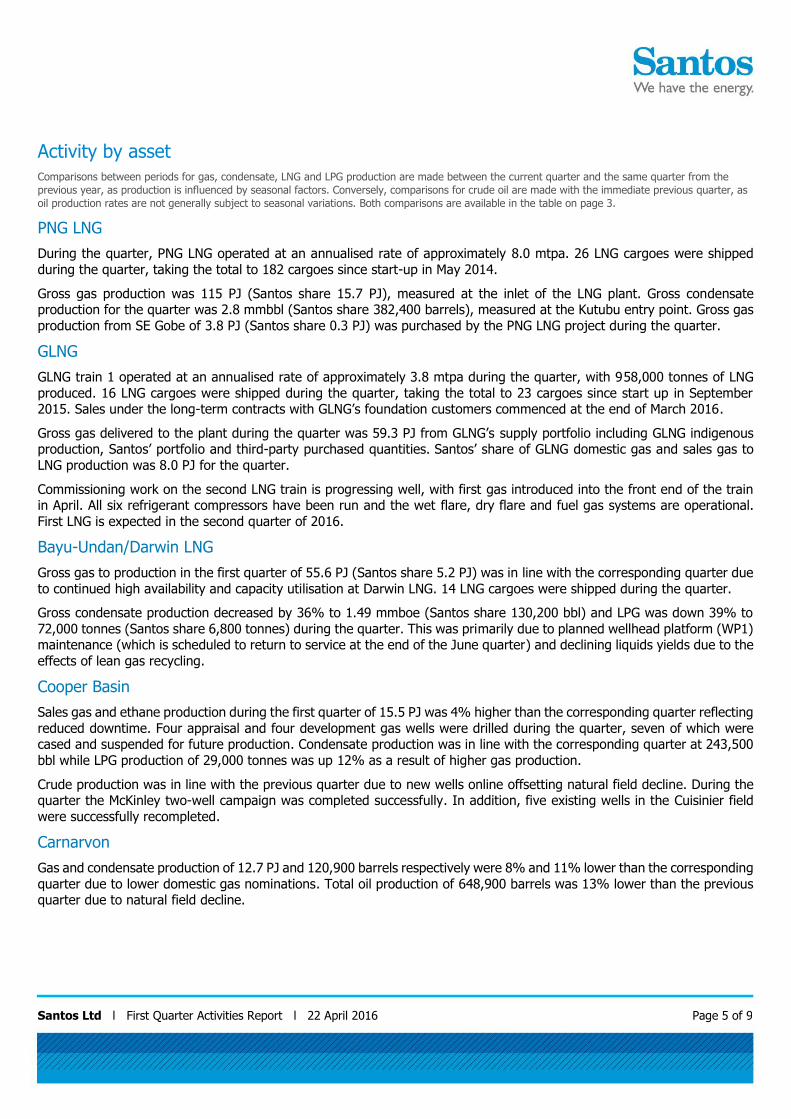
Activity by asset Comparisons between periods for gas, condensate, LNG and LPG production are made between the current quarter and the same quarter from the
previous year, as production is influenced by seasonal factors. Conversely, comparisons for crude oil are made with the immediate previous quarter, as
oil production rates are not generally subject to seasonal variations. Both comparisons are available in the table on page 3.
PNG LNG
During the quarter, PNG LNG operated at an annualised rate of approximately 8.0 mtpa. 26 LNG cargoes were shipped
during the quarter, taking the total to 182 cargoes since start-up in May 2014.
Gross gas production was 115 PJ (Santos share 15.7 PJ), measured at the inlet of the LNG plant. Gross condensate production for the quarter was 2.8 mmbbl (Santos share 382,400 barrels), measured at the Kutubu entry point. Gross gas
production from SE Gobe of 3.8 PJ (Santos share 0.3 PJ) was purchased by the PNG LNG project during the quarter.
GLNG
GLNG train 1 operated at an annualised rate of approximately 3.8 mtpa during the quarter, with 958,000 tonnes of LNG
produced. 16 LNG cargoes were shipped during the quarter, taking the total to 23 cargoes since start up in September 2015. Sales under the long-term contracts with GLNG’s foundation customers commenced at the end of March 2016.
Gross gas delivered to the plant during the quarter was 59.3 PJ from GLNG’s supply portfolio including GLNG indigenous production, Santos’ portfolio and third-party purchased quantities. Santos’ share of GLNG domestic gas and sales gas to
LNG production was 8.0 PJ for the quarter.
Commissioning work on the second LNG train is progressing well, with first gas introduced into the front end of the train in April. All six refrigerant compressors have been run and the wet flare, dry flare and fuel gas systems are operational.
First LNG is expected in the second quarter of 2016.
Bayu-Undan/Darwin LNG
Gross gas to production in the first quarter of 55.6 PJ (Santos share 5.2 PJ) was in line with the corresponding quarter due
to continued high availability and capacity utilisation at Darwin LNG. 14 LNG cargoes were shipped during the quarter.
Gross condensate production decreased by 36% to 1.49 mmboe (Santos share 130,200 bbl) and LPG was down 39% to
72,000 tonnes (Santos share 6,800 tonnes) during the quarter. This was primarily due to planned wellhead platform (WP1) maintenance (which is scheduled to return to service at the end of the June quarter) and declining liquids yields due to the
effects of lean gas recycling.
Cooper Basin
Sales gas and ethane production during the first quarter of 15.5 PJ was 4% higher than the corresponding quarter reflecting
reduced downtime. Four appraisal and four development gas wells were drilled during the quarter, seven of which were cased and suspended for future production. Condensate production was in line with the corresponding quarter at 243,500
bbl while LPG production of 29,000 tonnes was up 12% as a result of higher gas production.
Crude production was in line with the previous quarter due to new wells online offsetting natural field decline. During the quarter the McKinley two-well campaign was completed successfully. In addition, five existing wells in the Cuisinier field
were successfully recompleted.
Carnarvon
Gas and condensate production of 12.7 PJ and 120,900 barrels respectively were 8% and 11% lower than the corresponding
quarter due to lower domestic gas nominations. Total oil production of 648,900 barrels was 13% lower than the previous quarter due to natural field decline.

Santos Ltd l First Quarter Activities Report l 22 April 2016 Page 6 of 9
Indonesia
Santos’ net entitlement to gas production of 6.0 PJ was 7% higher than the corresponding period. Net entitlement gas production from the Madura PSC was in line with the corresponding quarter due to increased contractor entitlement in
Peluang and Maleo, offset by decreased gross production volumes which averaged 63 TJ/day for the quarter. Santos’ net entitlement to gas production from the Sampang PSC increased by 18% primarily due to planned shutdown activity at
Oyong for workover activities during the corresponding quarter.
Oyong net entitlement oil production for the quarter was 33,800 barrels.
Vietnam
Gross oil production from the Chim Sào and Dua fields was 24,500 barrels per day, 4% lower than the previous quarter due to natural field decline. Gross oil production since start-up from the Chim Sào and Dua fields passed 40 million barrels
during the quarter. Santos’ net entitlement to oil production during the first quarter from the combined fields was
672,700 barrels. Net entitlement gas production was 1.1 PJ.
Denison/Scotia/Spring Gully/Combabula
Sales gas production of 4.7 PJ was up 42% on the corresponding quarter. Production from Combabula continues to ramp up in line with APLNG nominations.
Otway
Sales gas production of 2.5 PJ was 29% lower than the corresponding quarter due to natural field decline. Production from the Casino hub was 2.2 PJ of sales gas and 1,400 barrels of condensate. Minerva production was 0.3 PJ of sales gas and
690 barrels of condensate.
Santos Ltd l First Quarter Activities Report l 22 April 2016 Page 7 of 9
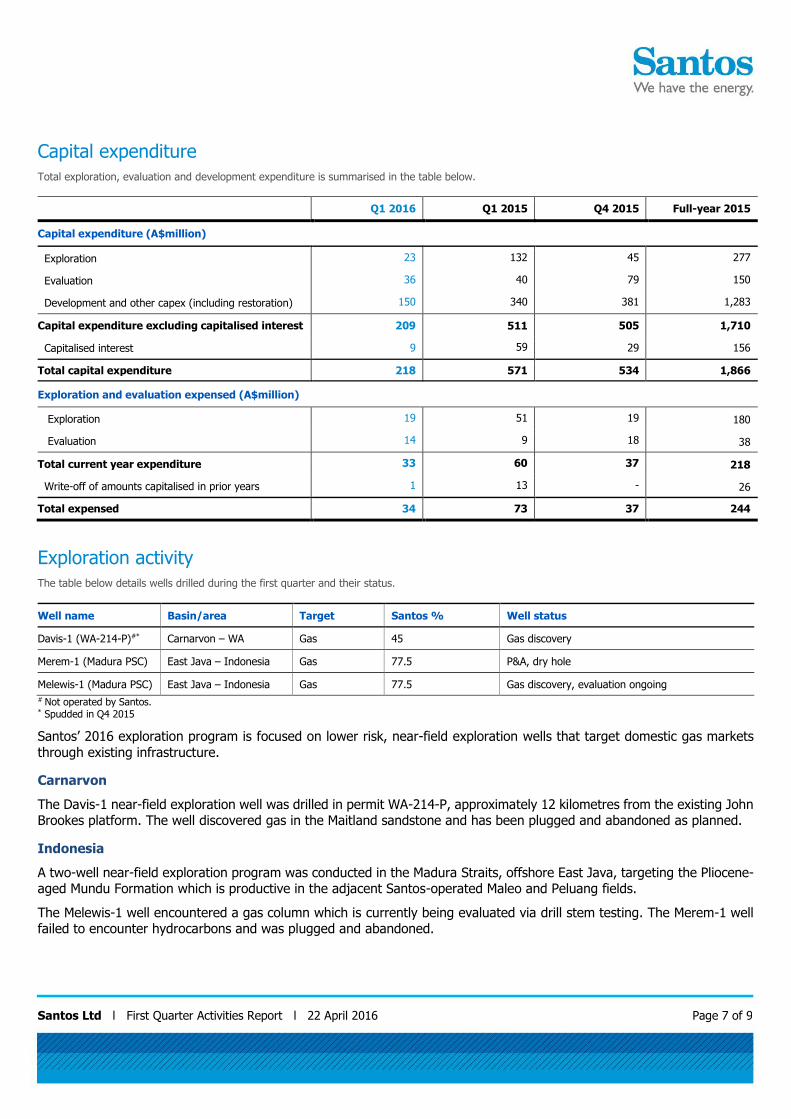
Capital expenditure Total exploration, evaluation and development expenditure is summarised in the table below.
Q1 2016 Q1 2015 Q4 2015 Full-year 2015
Capital expenditure (A$million)
Exploration 23 132 45 277
Evaluation 36 40 79 150
Development and other capex (including restoration) 150 340 381 1,283
Capital expenditure excluding capitalised interest 209 511 505 1,710
Capitalised interest 9 59 29 156
Total capital expenditure 218 571 534 1,866
Exploration and evaluation expensed (A$million)
Exploration 19 51 19 180
Evaluation 14 9 18 38
Total current year expenditure 33 60 37 218
Write-off of amounts capitalised in prior years 1 13 - 26
Total expensed 34 73 37 244
Exploration activity The table below details wells drilled during the first quarter and their status.
Well name Basin/area Target Santos % Well status
Davis-1 (WA-214-P)#* Carnarvon – WA Gas 45 Gas discovery
Merem-1 (Madura PSC) East Java – Indonesia Gas 77.5 P&A, dry hole
Melewis-1 (Madura PSC) East Java – Indonesia Gas 77.5 Gas discovery, evaluation ongoing
# Not operated by Santos. * Spudded in Q4 2015
Santos’ 2016 exploration program is focused on lower risk, near-field exploration wells that target domestic gas markets
through existing infrastructure.
Carnarvon
The Davis-1 near-field exploration well was drilled in permit WA-214-P, approximately 12 kilometres from the existing John Brookes platform. The well discovered gas in the Maitland sandstone and has been plugged and abandoned as planned.
Indonesia
A two-well near-field exploration program was conducted in the Madura Straits, offshore East Java, targeting the Pliocene-aged Mundu Formation which is productive in the adjacent Santos-operated Maleo and Peluang fields.
The Melewis-1 well encountered a gas column which is currently being evaluated via drill stem testing. The Merem-1 well failed to encounter hydrocarbons and was plugged and abandoned.

Santos Ltd l First Quarter Activities Report l 22 April 2016 Page 8 of 9
Seismic activity The table below details seismic activity during the first quarter and status
Permit Basin/area Survey Type km/km2 Status
PPLs 13, 23, 58, 92, 231 ATP 1189P PLs 34, 37, 63, 84, 110, 130, 134, 140, 186
Cooper Basin Snowball 3D Land 3D 1,698 km2 25% Complete (424 km2 of 1,698 km2)
Drilling summary
Appraisal/evaluation wells The table below details wells drilled during the first quarter and their status.
Well name Basin/area Target Santos % Well status
Berylium-1 Cooper - SA Gas (NFE) 60.00 C&S, successful gas
Moomba-212 Cooper - SA Gas 66.60 C&S, successful gas
Sphalerite-1 Cooper - SA Gas (NFE) 60.00 P&A, dry hole
Varanus South-2 Cooper - SA Gas (NFE) 60.00 C&S, successful gas
Development wells The table below details development wells drilled during the first quarter and their status.
Well name Basin/area Target Santos % Well status
Jack Lake-4 Cooper – SA Gas 86.81 C&S, successful gas
Jack Lake-5 Cooper – SA Gas 86.81 C&S, successful gas
McKinlay-10* Cooper – SA Oil 66.60 C&S, successful gas
McKinlay-11 Cooper – SA Oil 66.60 C&S, successful gas
Moomba-207* Cooper – SA Gas 66.60 C&S, successful gas
Moomba-208 Cooper – SA Gas 66.60 C&S, successful gas
RM02-11-1 Roma – QLD CSG 30.00 C&S, successful gas
RM02-18-1 Roma – QLD CSG 30.00 C&S, successful gas
RM02-19-1 Roma – QLD CSG 30.00 C&S, successful gas
RM02-25-1 Roma – QLD CSG 30.00 C&S, successful gas
RM02-26-1 Roma – QLD CSG 30.00 C&S, successful gas
RM02-32-1 Roma – QLD CSG 30.00 C&S, successful gas
RM03-44-1 Roma – QLD CSG 30.00 C&S, successful gas
RM03-48-1 Roma – QLD CSG 30.00 C&S, successful gas
RM03-49-1 Roma – QLD CSG 30.00 C&S, successful gas
RM03-58-1 Roma – QLD CSG 30.00 C&S, successful gas
Santos Ltd l First Quarter Activities Report l 22 April 2016 Page 9 of 9
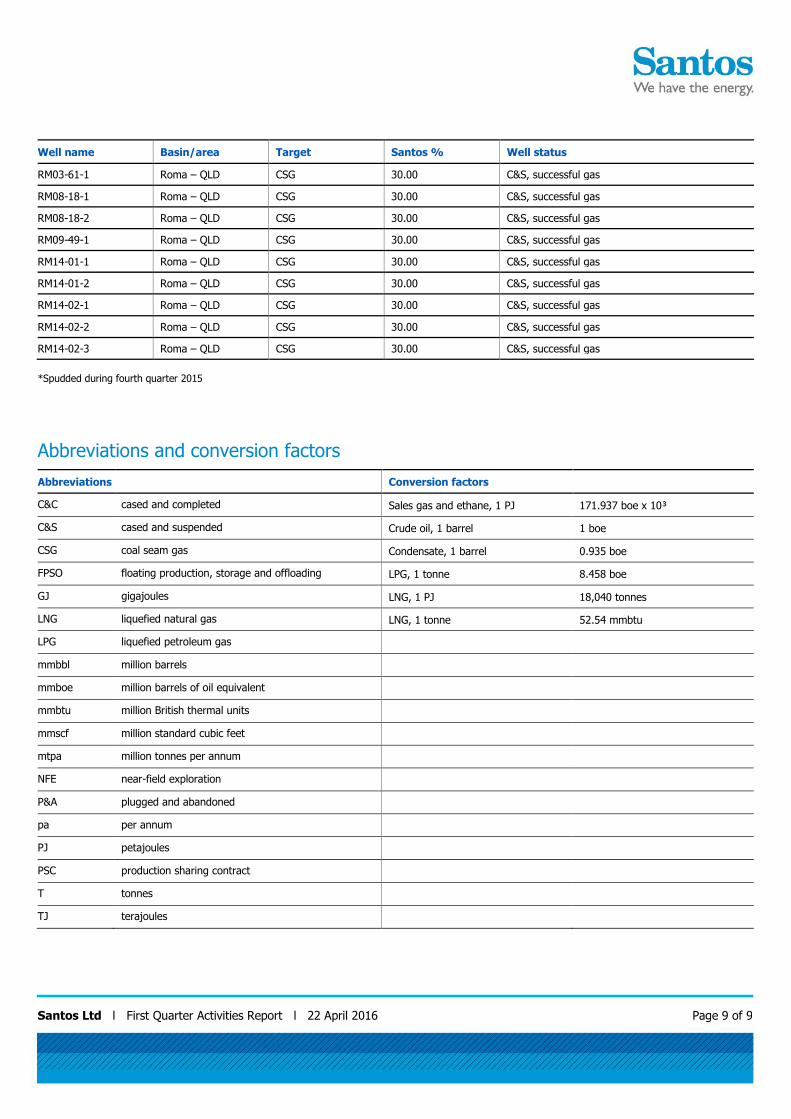
Well name Basin/area Target Santos % Well status
RM03-61-1 Roma – QLD CSG 30.00 C&S, successful gas
RM08-18-1 Roma – QLD CSG 30.00 C&S, successful gas
RM08-18-2 Roma – QLD CSG 30.00 C&S, successful gas
RM09-49-1 Roma – QLD CSG 30.00 C&S, successful gas
RM14-01-1 Roma – QLD CSG 30.00 C&S, successful gas
RM14-01-2 Roma – QLD CSG 30.00 C&S, successful gas
RM14-02-1 Roma – QLD CSG 30.00 C&S, successful gas
RM14-02-2 Roma – QLD CSG 30.00 C&S, successful gas
RM14-02-3 Roma – QLD CSG 30.00 C&S, successful gas *Spudded during fourth quarter 2015
Abbreviations and conversion factors
Abbreviations Conversion factors
C&C cased and completed Sales gas and ethane, 1 PJ 171.937 boe x 10³
C&S cased and suspended Crude oil, 1 barrel 1 boe
CSG coal seam gas Condensate, 1 barrel 0.935 boe
FPSO floating production, storage and offloading LPG, 1 tonne 8.458 boe
GJ gigajoules LNG, 1 PJ 18,040 tonnes
LNG liquefied natural gas LNG, 1 tonne 52.54 mmbtu
LPG liquefied petroleum gas
mmbbl million barrels
mmboe million barrels of oil equivalent
mmbtu million British thermal units
mmscf million standard cubic feet
mtpa million tonnes per annum
NFE near-field exploration
P&A plugged and abandoned
pa per annum
PJ petajoules
PSC production sharing contract
T tonnes
TJ terajoules