Embed Size (px)
Citation preview

First Quarter FY 2021
Quarterly Update
Infineon Technologies AG
Investor Relations
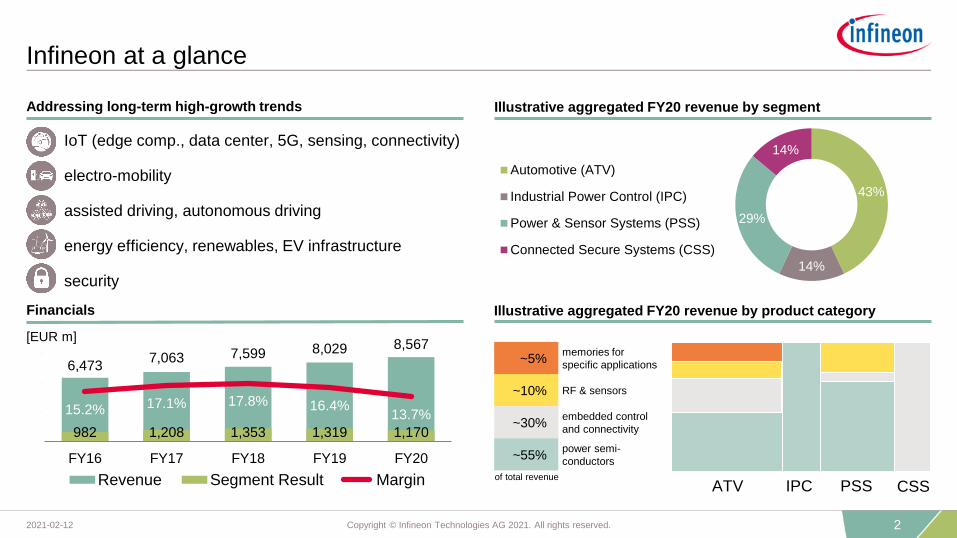
Infineon at a glance
› IoT (edge comp., data center, 5G, sensing, connectivity)
› electro-mobility
› assisted driving, autonomous driving
› energy efficiency, renewables, EV infrastructure
› security
Addressing long-term high-growth trends Illustrative aggregated FY20 revenue by segment
6,4737,063 7,599 8,029 8,567
982 1,208 1,353 1,319 1,170
15.2% 17.1% 17.8% 16.4%13.7%
0
3000
6000
9000
FY16 FY17 FY18 FY19 FY20
Revenue Segment Result Margin
[EUR m]
~5%memories for
specific applications
~10% RF & sensors
~30%embedded control
and connectivity
~55%power semi-
conductors
Illustrative aggregated FY20 revenue by product categoryFinancials
ATV IPC PSS CSS
43%
14%
29%
14%
Automotive (ATV)
Industrial Power Control (IPC)
Power & Sensor Systems (PSS)
Connected Secure Systems (CSS)
of total revenue
22021-02-12 Copyright © Infineon Technologies AG 2021. All rights reserved.
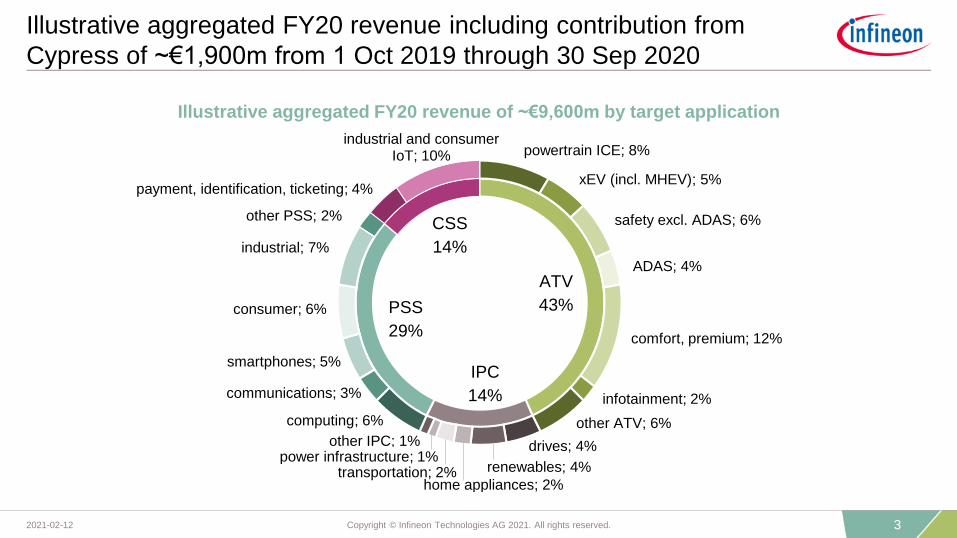
powertrain ICE; 8%
xEV (incl. MHEV); 5%
safety excl. ADAS; 6%
ADAS; 4%
comfort, premium; 12%
infotainment; 2%
other ATV; 6%
drives; 4%
renewables; 4%
home appliances; 2%transportation; 2%
power infrastructure; 1%other IPC; 1%
computing; 6%
communications; 3%
smartphones; 5%
consumer; 6%
industrial; 7%
other PSS; 2%
payment, identification, ticketing; 4%
industrial and consumer IoT; 10%
Illustrative aggregated FY20 revenue including contribution from
Cypress of ~€1,900m from 1 Oct 2019 through 30 Sep 2020
Illustrative aggregated FY20 revenue of ~€9,600m by target application
CSS
14%
ATV
43%
IPC
14%
PSS
29%
32021-02-12 Copyright © Infineon Technologies AG 2021. All rights reserved.

16.5%
12.3%
5.3%
4.7%
4.3%
3.4%
3.3%
2.6%*
2.2%
2.2%
2.0%
2.0%
Intel
Samsung
SK Hynix
Micron
Broadcom
Qualcomm
Texas Instr.
Infineon
STMicro
Nvidia
Kioxia
NXP
18.1%
17.6%
16.0%*
12.4%
12.0%
7.8%
1.5%
1.3%
1.3%
1.2%
1.1%
Renesas
NXP
Infineon
Microchip
STM
Texas Instr.
Samsung
Nuvoton
Silicon Labs
Toshiba
Huada
Infineon is a global top-10 player, #1 in power semiconductors,
and ranked #3 in the overall microcontroller market
* including contribution from Cypress** Renesas acquired Integrated Device Technology in March 2019. Both companies were combined as Renesas in the 2019 ranking.1) Based on or includes research from Omdia: Annual 2001-2019 Semiconductor Market Share Competitive Landscaping Tool – Q4 2019 v2. March 20202) Based on or includes research from Omdia: Power Semiconductor Market Share Database – 2020. September 2020
Results are not an endorsement of Infineon Technologies AG. Any reliance on these results is at the third party’s own risk.
Semiconductor suppliers2019 total market: $428bn1)
MCU suppliers2019 total market: $17.5bn1)
Power discretes and modules2019 total market: $21.0bn2)
2.4%
2.4%
2.8%
3.7%
3.8%
4.5%
5.5%
5.8%
8.4%
19.0%
Nexperia
ROHM
Renesas**
Fuji Electric
Vishay
Toshiba
Mitsubishi
STMicro
ON Semi
Infineon
42021-02-12 Copyright © Infineon Technologies AG 2021. All rights reserved.

Infineon offers a unique portfolio that links the real
and the digital world
Real-world
applications
Digital
world
Battery-powered devices
Consumer IoT
5G
Power supplies
Drives
Industrial IoT
Connectivity
Software
Ecosystem
Automotive
Sense: sensors Compute: microcontrollers, memories Actuate: power semiconductors Connectivity: Wi-Fi, Bluetooth, USB
Coin cell-powered devices
Smart Home
Information and data
about the real world
Value addition and
optimized use of resources
52021-02-12 Copyright © Infineon Technologies AG 2021. All rights reserved.

Outlook for Q2 FY21 and FY21
Segment Result Margin At the mid-point of the revenue guidance:
~16.5%
€2.5bn – €2.8bn
Investments in FY21 ~€1.6bn (prev.: €1.4bn – €1.5bn)
D&A in FY21 €1.5bn – €1.6bn**
Outlook FY21*
* Based on an assumed average exchange rate of $1.20 for €1.00; previously $1.15 for €1.00
** Including the effects of the purchase price allocation for Cypress and, to a lesser extent, International Rectifier
~ €10.8bn +/- 5%
(prev.: ~ €10.5bn +/- 5%)
At the mid-point of the revenue guidance:
~17.5% (prev.: ~16.5%)
Outlook Q2 FY21*
Revenue
Free cash flow in FY21 > €800m (prev.: > €700m)
62021-02-12 Copyright © Infineon Technologies AG 2021. All rights reserved.

Reaping of synergies on track
end FY20 mid FY21e mid FY22e mid FY23e*
COGS
S&M
R&D
G&A
€180m
Planned ramp-up of cost synergies
Expected integration and restructuring costs equivalent to ~1x cost synergies one-off over time.
* Expected cost synergies of €180m p.a. gradually ramping up over approximately three years after closing (16 April 2020).
Planned ramp-up of revenue synergies
FY22e FY25e FY28e
€1bn
€1.5bn
Near-term
revenue
synergies:
improved
customer
access,
cross-selling
opportunities
P2S for
long-term
revenue
synergies
72021-02-12 Copyright © Infineon Technologies AG 2021. All rights reserved.
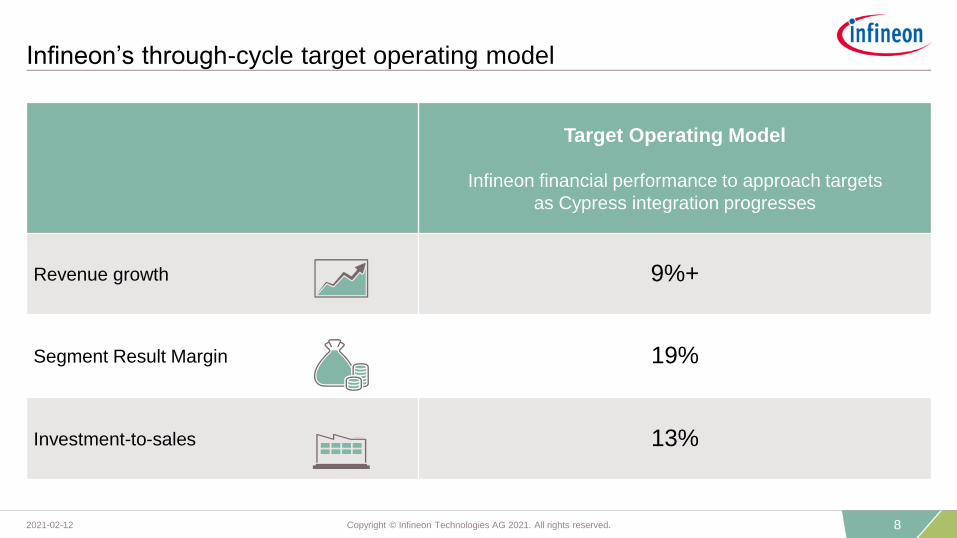
Infineon’s through-cycle target operating model
Target Operating Model
Infineon financial performance to approach targets
as Cypress integration progresses
Revenue growth 9%+
Segment Result Margin 19%
Investment-to-sales 13%
82021-02-12 Copyright © Infineon Technologies AG 2021. All rights reserved.
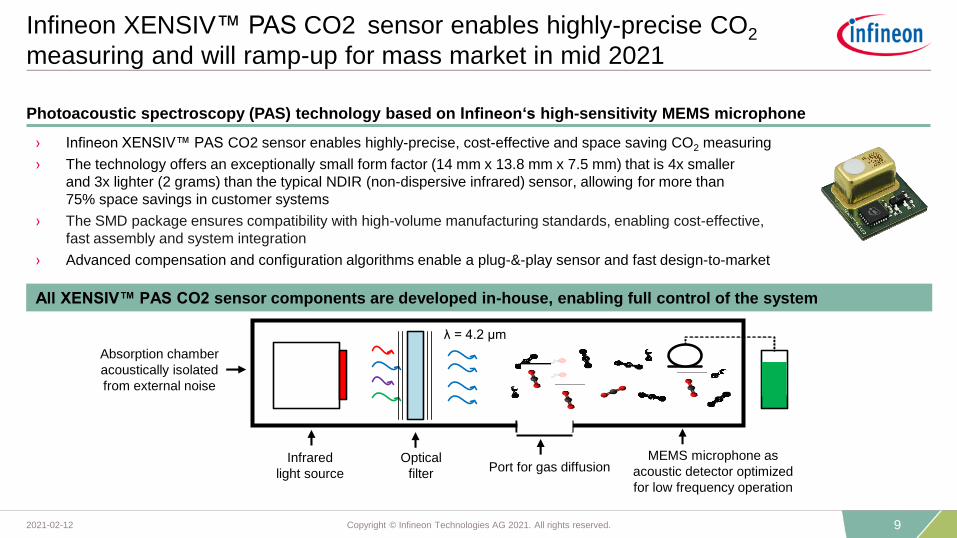
Infineon XENSIV™ PAS CO2 sensor enables highly-precise CO2
measuring and will ramp-up for mass market in mid 2021
(Emitter)IR Heater
(Gas)Absorption Path
(Detector)Reference Cell
(Filter)Gas Selection
(Emitter)IR Heater
(Gas)Absorption Path
(Detector)Reference Cell
(Filter)Gas Selection(Emitter)
IR Heater(Gas)
Absorption Path(Detector)
Reference Cell(Filter)
Gas Selection
Infrared
light source
Optical
filterPort for gas diffusion
MEMS microphone as
acoustic detector optimized
for low frequency operation
λ = 4.2 μm
Absorption chamber
acoustically isolated
from external noise
Photoacoustic spectroscopy (PAS) technology based on Infineon‘s high-sensitivity MEMS microphone
All XENSIV™ PAS CO2 sensor components are developed in-house, enabling full control of the system
› Infineon XENSIV™ PAS CO2 sensor enables highly-precise, cost-effective and space saving CO2 measuring
› The technology offers an exceptionally small form factor (14 mm x 13.8 mm x 7.5 mm) that is 4x smaller
and 3x lighter (2 grams) than the typical NDIR (non-dispersive infrared) sensor, allowing for more than
75% space savings in customer systems
› The SMD package ensures compatibility with high-volume manufacturing standards, enabling cost-effective,
fast assembly and system integration
› Advanced compensation and configuration algorithms enable a plug-&-play sensor and fast design-to-market
92021-02-12 Copyright © Infineon Technologies AG 2021. All rights reserved.

ESG: targets and achievements

Our products and innovations together with an efficient production
are key elements to deal with climate change
Our net ecologic CO2 benefit is equal to…
The savings of a 1,874 km ²
photovoltaic powerplant.3)
The average annual
electricity consumption of about
90 million people living in
Europe.4)
50,000 fully occupied flights of
an Airbus A380 from Munich to
Singapore.5)
We contribute a CO2 reduction of more than 54 million tons
For explanatory notes see appendix
* The increase in the burden of CO2 equivalents can mainly be explained by including manufacturing service providers for the first time into the calculation
*
112021-02-12 Copyright © Infineon Technologies AG 2021. All rights reserved.

Infineon will become carbon-neutral by 2030
1. Avoiding direct emissions and further reducing energy consumption
2. Purchasing green electricity with guarantees of origin for unavoidable emissions
3. Compensate the smallest part by certificates that combine development support and CO2 abatement
1) Namely perfluorinated and polyfluorinated carbon compounds, sulfur hexafluoride (SF6) and nitrogen trifluoride (NF3)
70% CO2 emissions reduction target in 2025
(Scope 1 and 2 emissions)
Abatement of Perfluorinated Compounds (PFC’s)1) is one of the most important measures avoiding
direct emissions.
Normalized PFC emissions rate in tons of CO2 equivalent per square meter wafer
Infineon
WSC 2020 target
Historically, Infineon's normalized emission rate has been below WSC 2020 target of 2.2 in tons of CO2 per
square wafer
2016 2017 2018 2019 2020
122021-02-12 Copyright © Infineon Technologies AG 2021. All rights reserved.

External recognitions confirm our engagement in contributing
to a sustainable society
Dow Jones Sustainability Index
Ethibel Sustainability Index
Excelence Europe”
ISS ESG Corporate Rating
Ecovadis
CDP
MSCI ESG
FTSE4Good Index
Euronext Vigeo Eurozone 120 Index
Euronext Vigeo Europe 120 Index
Sustainalytics
AACCC to
AAA02/2020
B climate scoring
B water scoringF to A 12/2020
98th percentile “Gold” award 0 to 100 11/2020
81 Dow Jones Sustain-
ability™ World and Europe Index listing0 to 100 11/2020
Index member - 05/2020
B-
Prime StatusD- to A+ 01/2021
Index member - 07/2020
Indices member - 06/2020
77 “Outperformer” level 0 to 100 06/2020
Rating/Score Scale Date
132021-02-12 Copyright © Infineon Technologies AG 2021. All rights reserved.

Automotive

ATV at a glance
FY20 revenue split by product groupATV revenue and Segment Result Margin
CAGR(FY16-FY20): 7.5%
[EUR m]
2.6562.989
3.284 3.503 3.542
14%16% 14%
12%
4%-5%
5%
15%
25%
0
500
1.000
1.500
2.000
2.500
3.000
3.500
4.000
FY16 FY17 FY18 FY19 FY20
ATV revenue ATV Segment Result Margin
Key customers
MCUs
sensors
power (incl. SiC)
memories
152021-02-12 Copyright © Infineon Technologies AG 2021. All rights reserved.

Market outlook for ATV division’s target applications
› Y-Y recovery with unit growth at mid-teens %
› Unit growth momentum could be limited near-term by shortage in semiconductors but could
be compensated in H2 CY21; however, further upside is limited
› Continued uncertainties related to market development mainly due to COVID-19 pandemic
› Further increase in L1 and L2 penetration expected
› L2+ shipments still at the inital phase
› Incentives and CO2 regulations should keep demand high; especially in Europe
› Improving consumer sentiment around sustainability theme
› Steady investments in EV charging infrastructure further lowers reservation towards EVs
Market Outlook for CY21Applications
162021-02-12 Copyright © Infineon Technologies AG 2021. All rights reserved.
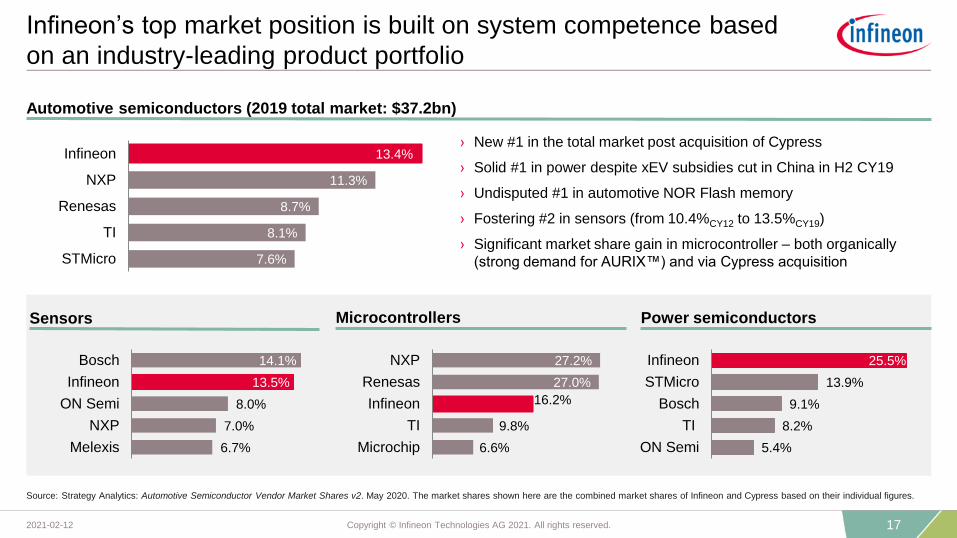
Infineon’s top market position is built on system competence based
on an industry-leading product portfolio
› New #1 in the total market post acquisition of Cypress
› Solid #1 in power despite xEV subsidies cut in China in H2 CY19
› Undisputed #1 in automotive NOR Flash memory
› Fostering #2 in sensors (from 10.4%CY12 to 13.5%CY19)
› Significant market share gain in microcontroller – both organically
(strong demand for AURIX™) and via Cypress acquisition
13.4%
11.3%
8.7%
8.1%
7.6%
Infineon
NXP
Renesas
TI
STMicro
Automotive semiconductors (2019 total market: $37.2bn)
6.7%
7.0%
8.0%
13.5%
14.1%
Melexis
NXP
ON Semi
Infineon
Bosch
Sensors
Source: Strategy Analytics: Automotive Semiconductor Vendor Market Shares v2. May 2020. The market shares shown here are the combined market shares of Infineon and Cypress based on their individual figures.
6.6%
9.8%
27.0%
27.2%
Microchip
TI
Infineon
Renesas
NXP
16.2%
Microcontrollers Power semiconductors
5.4%
8.2%
9.1%
13.9%
25.5%
ON Semi
TI
Bosch
STMicro
Infineon
172021-02-12 Copyright © Infineon Technologies AG 2021. All rights reserved.

Electro-mobility

Driven by triple-digit y-y growth in most countries, xEV penetration
rate tripled from 2019 to 2020 – years earlier than prev. expected
3,239,983
1,334,814
1,153,859
400,030
327,976
193,727
180,628
108,297
90,457
60,998
50,303
31,025
World
China
Europe
Germany
USA
France
UK
Norway
Netherlands
Italy
S. Korea
Japan
[car units]
+12%
+167%
+43%
+4%
+256%
+183%
+132%
+33%
+33%
+236%
+51%
-28%
xEV penetration rate change from 2019 to 2020 2020 xEV sales
World
China
Europe
Germany
USA
France
UK
Norway
Netherlands
Italy
S. Korea
Japan
Source: EV Volume: BEV & PHEV Final December Sales. January 2021. IHS Markit: LV Sales Base Global. January 2021.
4.2%2.5%
5.6%4.8%
0% 5% 10% 15% 20% 25%
2.9% 8.5%
2.9% 12.5%
1.8% 2.2%
2.5% 9.4%
2.9% 9.4%
44.6% 61.8%
13.0% 21.7%
0.9%
4.0%
0.7%
1.1%
0.9%
0.7%
growthy-y
192021-02-12 Copyright © Infineon Technologies AG 2021. All rights reserved.

Infineon provides leading-edge power module technology to
top-selling Chinese NEV models
› > 20 BEV platforms in production with
Infineon HybridPACK™ Drive
› > 1m pieces shipped with an unparalleled
quality performance
› Available with Si and SiC chips
› Scalable module portfolio meets cost-
performance sweet spots
between 120 kW and 250 kW
› Optimized versions for 400 V and 800V
battery voltage
Nio: ES8, ES6, EC6
XPeng: P7
Weltmeister: EX5
Scalable Infineon HybridPACK™ Drive
portfolioLi Auto: LiXiang One
202021-02-12 Copyright © Infineon Technologies AG 2021. All rights reserved.

The incremental content of power semiconductors in xEV is a
significant opportunity for Infineon
2020 average xEV semiconductor content by degree of electrification
48 V / Mild Hybrids Full & Plug-in Hybrids and Battery Electric Vehicles
* Non-Powertrain: average semiconductor content in body, chassis, safety and infotainment application segments
** "power" includes voltage regulators and ASIC; "others" include opto, small signal discretes, memory
Source: Infineon; based on or includes content supplied by IHS Markit, Automotive Group: Alternative Propulsion Forecast. July 2020;
Strategy Analytics: Automotive Semiconductor Demand Forecast 2018-2027 and Automotive Sensor Demand 2018-2027. July 2020
$7
$0
$396$61 $17
$90 $572
Non-
Power-
train*
ICE
Power-
train
xEV
Sensors
xEV
MCUs
xEV
Power**
xEV
Others**
Total
semi
BoM
$396 $38 $14 $23
$330 $32 $834
Non-
Power-
train*
ICE
Power-
train
xEV
Sensors
xEV
MCUs
xEV
Power**
xEV
Others**
Total
semi
BoM
2020 2.1m vehicles 5.8m vehicles
2022 5.8m vehicles 12.2m vehicles
2025 18.8m vehicles 21.0m vehicles
2030 27.3m vehicles 32.0m vehicles
212021-02-12 Copyright © Infineon Technologies AG 2021. All rights reserved.

Automated Driving

Radar/Lidar modules and sensor fusion will grab the lion’s share of
semiconductor BoM in ADAS/AD-equipped cars
Incremental average semiconductor content per car by level of automation at the given years
$160 - $180
Level 4/L5
L4/L5 vehicles in 2030: ~2.5m
Level 2
L2 vehicles in 2020: ~5m
Level 2+
L2+ in 2025: ~2.5m
$280 - $350 $1,150 - $1,250Bill-of-materials
Camera modules
Radar & Lidar modules
Sensor fusion
Others (e.g. actuators)
40 - 50% of BoM
~30%
20 - 30%
5 - 10%
40 - 50% of BoM
~30%
20 - 30%
5 - 10%
15 - 20% of BoM
30 - 45%
30 - 45%
5 - 10%
Source: Strategy Analytics: Automated Driving Semiconductor Market Estimate. August 2020; Infineon
BoM contains all type of semiconductors (e.g. radar modules include µC); sensor fusion does not include memory.
BoM are projected figures for the respective time frame.
232021-02-12 Copyright © Infineon Technologies AG 2021. All rights reserved.

The Infineon AURIX™ µC family has become the first-choice auto-
motive architecture for high-growth and safety-critical applications
FY10 FY20e FY25e
powertrain
› ICE engine management
› ICE transmission
› xEV motor control
classical safety
› power steering
› braking
› airbag
ADAS/AD
› camera host control
› sensor fusion host control
› radar signal pre-processing
domain and zone control
› drive domain
› body & convenience domain
› zone control
CAGR(FY10-FY25)= 11.5%CAGR(FY20-FY25)= 50%
CAGR(FY20-FY25)= 34%
[indexed:
FY10 = 100]
CAGR(FY10-FY25)= 5.7%
TAM:
€1.6bnTAM:
€4.8bn
Source: Infineon; Strategy Analytics: Automotive Semiconductor Demand Forecast. February 2020. Covering Infineon target markets; excl. body, comfort, infotainment.
Infineon AURIX™ revenue development over time
242021-02-12 Copyright © Infineon Technologies AG 2021. All rights reserved.

Strong microcontroller footprint in next-generation high-volume
platforms
› 14 MCUs (+ NOR Flash + Wi-Fi)
› start of production: end of CY20
› 20 MCUs
› start of production: CY22OEM platform #2:OEM platform #1:
Engine control
module
AURIX™ TC38x
Drivetrain control
module
AURIX™ TC23x
Transmission
control module
AURIX™ TC27x
Automatic gear
shifter module
AURIX™ TC23x
Electronic slip
differential
AURIX™ TC23x
Braking
AURIX™ TC39x
Airbag
AURIX™ TC23x
Electric power
steering
AURIX™ TC27x
Automatic sway
bar
AURIX™ TC23x
Map driver
assistance
AURIX™ TC39x
Secure gateway
module
AURIX™ TC39x
AD fusion
standard
AURIX™ TC39x
AD fusion
high-end
AURIX™ TC39x
Central AD
decision module
AURIX™ TC39x
Engine
management
AURIX™ TC38x
Diesel engine
management
AURIX™ TC39x
Transmission
control module
AURIX™ TC38x
Inverter PHEV
AURIX™ TC38x
Door module
FR MB91520
Braking
AURIX™ TC38x
Airbag
AURIX™ TC37x
Electric power
steering
AURIX™ TC36x
Suspension CVC
AURIX™ TC38x
Alarm system
module
FR MB91F520
Digital instrument
cluster
Traveo I S6J332
Front camera
AURIX™ TC37x
Radar domain
processing
AURIX™ TC39x
AD fusion
standard
AURIX™ TC39x
AD fusion
high-end
AURIX™ TC39x
Instrument
cluster
NOR Flash
S26KS512
Infotainment
module
89359
(Wi-Fi / Bluetooth)
Central AD
module
NOR Flash
S70FL01G
S25FL512
S25FS512
8” rear-seat
entertainment
TrueTouch TMA78
10” navigation
module
TrueTouch TMA1036
Cluster TFT
module
FCR4 MB9DF125
Climate,
gearshift MMI
FR CY91xxx
Head light
module
FR MB91F525
Infineon heritage Cypress heritage
252021-02-12 Copyright © Infineon Technologies AG 2021. All rights reserved.

Infineon's Power Strategy

Infineon's portfolio covers the entire range of power and frequency
When turned on
current flows
When turned off
current is blocked
What counts?
› Losses in on-state (R(DS)on)
› Heat dissipation
› Max. switching frequency
› Die size
› Package size (form factor)
Discrete
IGBT
MOSFET
100 W
1 kW
10 kW
10 Hz 1 kHz 1 MHz
power
100 kW
1 MW
10 MW
frequency
=IGBT
Module SiC Module
SiC MOSFET
GaN HEMT
What is a power switch? How are power switches categorized?
272021-02-12 Copyright © Infineon Technologies AG 2021. All rights reserved.

Infineon's discrete power portfolio* is basically separated by
voltage classes
6,500 V
4,500 V
3,300 V
1,700 V
1,200 V
IPC
te
rrito
ryP
SS
te
rrito
ry
discrete IGBTs
IGBT
modules
SiC MOSFET today
(CoolSiC™)
CoolSiC™ MOSFET
roadmap
GaN HEMT today
(CoolGaN™)
CoolGaN™ roadmap
900 V
600 V
400 V
150 V
100 V
80 V
40 V
20 V
high-voltage MOSFETs
(CoolMOS™)
mid-voltage MOSFETs
(OptiMOS™)
low-voltage MOSFETs
(OptiMOS™)
* excluding drivers and control ICs
MOSFETs
(OptiMOS™)
IGBTs(discretes, modules)
AT
V te
rrito
ry
Silicon-based power switches Compound semiconductors
282021-02-12 Copyright © Infineon Technologies AG 2021. All rights reserved.
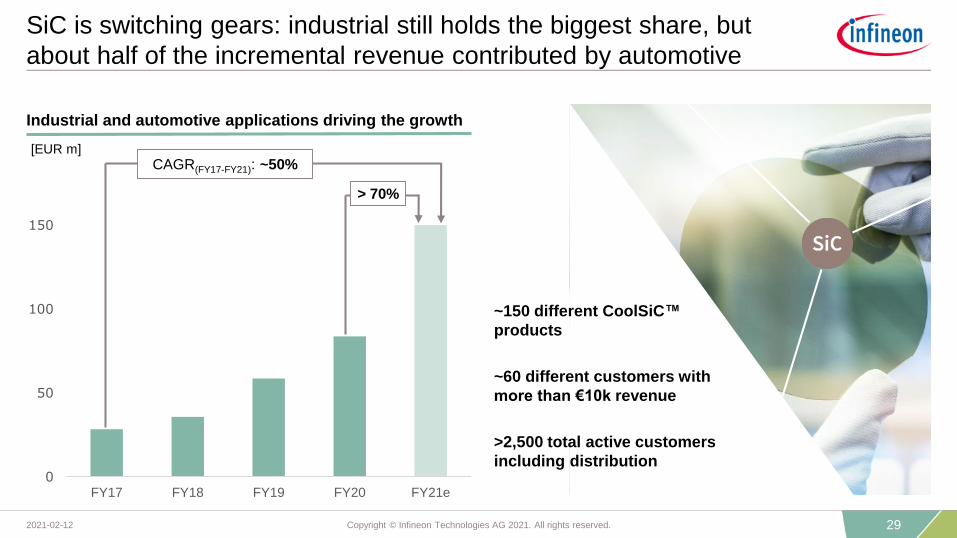
SiC is switching gears: industrial still holds the biggest share, but
about half of the incremental revenue contributed by automotive
Industrial and automotive applications driving the growth
0
50
100
150
FY17 FY18 FY19 FY20 FY21e
CAGR(FY17-FY21): ~50%
> 70%
[EUR m]
~150 different CoolSiC™
products
~60 different customers with
more than €10k revenue
>2,500 total active customers
including distribution
292021-02-12 Copyright © Infineon Technologies AG 2021. All rights reserved.

Strong CoolSiC™ portfolio expansion: by packages and by
voltages
Continuous expansion of portfolio
Broadest and best-in-class SiC portfolio
Expected
in 2021
Industrial Automotive grade
CoolSiC™
Diode
CoolSiC™
MOSFET
CoolSiC™
Diode
CoolSiC™
MOSFET
Discrete Module Discrete Module Discrete
CoolSiC™ Hybrid
ModuleDiscrete DiscreteIPM
600 V
650 V
1200 V
1700 V
Exp.
in 2021
voltages
CoolSiC™
Hybrid
Discrete
302021-02-12 Copyright © Infineon Technologies AG 2021. All rights reserved.

Boule-splitting
Device fabrication
Device fabrication
Wafer splitting
Upper half
Lower half
Wafer dicing
CrystX
Epitaxy
Epitaxy
Infineon expands supply base for SiC boules with
GT Advanced Technologies
› Based on GTAT’s high-quality
boules, Infineon is now enabling
an additional source for competitive
SiC wafers
› Supply agreement for 150 mm SiC boules
to secure growing base material demand
› Contract has an initial term of five years
Key facts of the deal
From boule to application: the main SiC process steps
Boule splitting
Testing and packaging
CrystXTM
312021-02-12 Copyright © Infineon Technologies AG 2021. All rights reserved.

Second generation (2nd Gen.) CoolSiC™ Trench MOSFET will
increase the addressable market
1st Gen. with lowest losses is the leading technology today
Infineon Gen 1 Trench
A Gen 1 Planar
A Gen 2 Planar
D Gen 1 Planar
E Planar
F Planar
B Gen 2 Planar
B Gen 3 Trench
C Gen 1 Planar
2
3
4
5
6
7
8
9
20 40 60 80 100
Fo
M=
RD
S(o
n)*
Qg
[Ω*n
C]
Current (A) at 25 °C
Planar
Trench
Source: SystemPlus Consulting: SiC Transistor Comparison 2020. November 2020
2nd Gen. will expand the lead
› 2nd Gen. CoolSiC™ Trench
MOSFET is in advanced
development phase
› Enhanced power handling capability
by 25% – 30%
› Enhanced safe operating area
without compromising quality
› Enabling SiC in further high volume
applications
2nd Gen. CoolSiC™ Trench MOSFET
will significantly enlarge the market
size for SiC MOSFETs
low
er
losses
322021-02-12 Copyright © Infineon Technologies AG 2021. All rights reserved.

Industrial Power Control

IPC at a glance
FY20 revenue split by product groupIPC revenue and Segment Result Margin
CAGR(FY16-FY20): 7.0%
[EUR m]
1.0721.206
1.323 1.418 1.406
12%15%
19% 18% 18%
-5%
5%
15%
25%
0
200
400
600
800
1.000
1.200
1.400
1.600
FY16 FY17 FY18 FY19 FY20
IPC revenue IPC Segment Result Margin
Key customers
discrete IGBTs
driver ICs
IPMs
IGBT modules
SiC
342021-02-12 Copyright © Infineon Technologies AG 2021. All rights reserved.

Market outlook for IPC division’s target applications
› Industrial Drives expected to recover in low-single-digits with some upside potential from pent-up
demand
› Growth driven by general market recovery
› Growing demand in EV charging infrastructure, Industrial UPS and energy storage systems
› Delays in Transmission & Distribution projects
› Catch-up of delayed purchases and energy efficiency incentive programs will drive growth
› Wind: installations forecasted to increase to all-time-high
› PV: installations to stabilize on high level
› Diminished COVID-related travel activities caused pushed-out of construction of passenger trains
and e-Busses
~30%
8%
~24%
~13%
~9%
~16%
Automation
and Drives
Renewables
Transportation
Power
Infrastructure
Others
Market Outlook for CY21Applications(% of FY20 segment revenue)
352021-02-12 Copyright © Infineon Technologies AG 2021. All rights reserved.

Discrete IGBTs2019 total market: $1.44bn
Clear leader in discrete IGBTs and IGBT modules;
fostering position in IPMs
1) Including standard (non-integrated) IGBT modules and power integrated modules (PIMs) / converter inverter brake (CIB) modules
Source: Based on or includes research from Omdia: Power Semiconductor Market Share Database 2020. September 2020
0.8%
1.1%
2.4%
2.9%
4.2%
7.0%
7.8%
11.5%
17.9%
32.7%
Jilin Sino-Micro
Hangzhou Silan
STMicro
Sanken Electric
ROHM Semi
Semikron
Fuji Electric
Infineon
ON Semi
Mitsubishi
2.2%
3.7%
4.5%
4.7%
5.4%
5.7%
6.1%
7.9%
11.7%
32.5%
Hangzhou Silan
MagnaChip
Renesas
Littelfuse
STMicro
Mitsubishi
Toshiba
ON Semi
Fuji Electric
Infineon
IGBT modules1)
2019 total market: $3.31bn
IPMs2019 total market: $1.59bn
1.8%
2.4%
2.5%
2.5%
3.1%
3.5%
7.3%
10.5%
11.9%
35.6%
ABB Semi
Toshiba
Starpower
Danfoss
Hitachi
Vincotech
Semikron
Fuji Electric
Mitsubishi
Infineon
362021-02-12 Copyright © Infineon Technologies AG 2021. All rights reserved.

Infineon serves all major players for PV inverters and wind turbines
* Infineon is serving the top-10 of each category but not necessarily as a sole supplier.
Source: 1) by shipped capacity in MW: based on or includes content supplied by IHS Markit, Technology Group: PV Inverter Market Tracker – Q3 2020. October 2020.
2) WoodmacKenzie: Wind Turbine OEM Market Share. November 2020.
3) International Energy Agency: World Energy Outlook 2020, p. 224.
232259
229269
337
FY16 FY17 FY18 FY19 FY20 FY25e
8 |Sineng Electric 8 |Mingyang
7 | TMEIC 7 |Envision
9 |Growatt 9 |United Power
10 | Ginlong 10 |Suzlon
6 |ABB 6 |Nordex Group
3 |SMA 3 |GE
2 |Sungrow 2 |SGRE
1 |Huawei 1 |Vestas
5 |Solar Edge 5 |Enercon
4 |Power Electr. 4 |Goldwind
PV inverter1) Wind2)[EUR m]
IPC revenue in renewablesInfineon is powering all leading
renewable energy players*
IEA expects twice
as much capacity
additions for wind
and solar than
coal, gas and
nuclear power
taken together for
the period
2020 – 20253)
CAGR(FY20-FY25): ~8-10%
372021-02-12 Copyright © Infineon Technologies AG 2021. All rights reserved.

Energy storage is essential to further deploy decentral and
renewable energy generation
› Decentralization of power
generation
› Peak shaving of energy
generation and energy
consumption
› Limited capacity and flexibility of
today's grids
› Reduction of standby cost of
fossil power plants
~€3,200 of power semiconductor
content per MW of installed energy
storage capacity2)
0
10
20
30
40
0% 10% 20% 30% 40%
Ba
tte
ry s
tora
ge
ca
pa
city (
GW
)
Share of variable renewables (PV and wind)
European Union
India
China
United States
2030
2025
2020
Source: 1) International Energy Agency: World Energy Outlook 2020, p. 248; variable renewables consist of solar and wind energy.
2) Infineon estimate
Battery storage capacity and share of variable renewables1) Key drivers
382021-02-12 Copyright © Infineon Technologies AG 2021. All rights reserved.

What comes next?
Mid- to long-term structural growth opportunities
new material solar pumps
collaborative robots eAviation
eMarine
fuel cell
eDelivery vehicles
Courtesy:
Siemens AG
Courtesy:
Lilium GmbH
Courtesy: AlstomCourtesy:
Shakti pumps
EV charging energy storage
Courtesy: McKinsey
Core New areaAdjacent
392021-02-12 Copyright © Infineon Technologies AG 2021. All rights reserved.

Power & Sensor Systems

PSS at a glance
FY20 revenue split by product groupPSS revenue and Segment Result Margin
CAGR(FY16-FY20): 6.7%
[EUR m]
2.041 2.148 2.318 2.4452.650
17%20%
23% 24% 24%
-5%
5%
15%
25%
0
500
1.000
1.500
2.000
2.500
3.000
FY16 FY17 FY18 FY19 FY20
PSS revenue PSS Segment Result Margin
Key customers
MOSFETs(incl. SiC, GaN)
power ICs
RF & sensors
other(incl. HiRel, ASICs)
412021-02-12 Copyright © Infineon Technologies AG 2021. All rights reserved.

Market outlook for PSS division’s target applications
› Acceleration towards cloud computing to continue
› Pandemic-driven stay-at-home and WFH effects continue to favor notebook sales
› Automotive and other industrial segments show signs of recovery
› Battery-powered tools continue to show strong momentum
› Catch-up of delayed purchases could lead to market pick-up
› However, new lock-downs could dampen consumer confidence
› Game consoles clear beneficiaries from stay-at-home
› Strong rebound expected driven mainly by economic recovery and migration towards 5G phones
› In general, long-term drivers due to 5G still intact
› However, trade tensions generate some uncertainty around speed of roll-out in China and other
regions
~20%
~23%
~9%
~19%
~20%
* does not sum up to 100% due to other applications not shown here
Computing
Communication
Industrial
Smartphones
Consumer
Market Outlook for CY21Applications(% of FY20 segment revenue)
422021-02-12 Copyright © Infineon Technologies AG 2021. All rights reserved.

PSS's growth is built on many applications from different sectors in
power and non-power
› data center
› enterprise server
› PC, notebook
› peripherals
› chargers and
adapters
Computing Communications IndustrialSmartphones Consumer
› power supplies
› EV on-board
charger
› charging
infrastructure
› PV inverter
› power tools
› lighting
› Industry 4.0
› space
› base stations
› backhaul cellular
infrastructure
› 5G massive MIMO
› telecommunication
servers
› smartphones
› mobile devices
› wearables
› USB Type-C,
USB Type-C PD
› eBikes, eScooter
› multicopter
› LSEV
› gaming
› TV sets
› smart home
432021-02-12 Copyright © Infineon Technologies AG 2021. All rights reserved.

PSS – Power

Infineon is the clear leader in MOSFETs;
growth potential in power ICs
* Renesas acquired Integrated Device Technology in March 2019. Both companies were combined as Renesas in 2019.
Discrete Power MOSFET market includes automotive MOSFETs, protected MOSFETs, SiC MOSFETs and GaN power transistors. Power IC market includes automotive power ICs.
Source: Based on or includes research from Omdia: Power Semiconductor Market Share Database 2020. September 2020.
Discrete Power MOSFETs2019 total market: $8.10bn
Power ICs2019 total market: $24.4bn
3.4%
3.5%
3.8%
3.9%
5.0%
5.6%
6.3%
7.2%
7.7%
16.0%
Maxim
Renesas*
NXP
Dialog
ON Semi
STMicro
Qualcomm
Analog Devices
Infineon
Texas Instruments
1.8%
3.0%
4.1%
4.5%
5.0%
5.6%
7.3%
9.5%
12.8%
24.6%
MagnaChip
China Resources
Nexperia
Alpha and Omega
Vishay
Renesas*
Toshiba
STMicro
ON Semi
Infineon
452021-02-12 Copyright © Infineon Technologies AG 2021. All rights reserved.
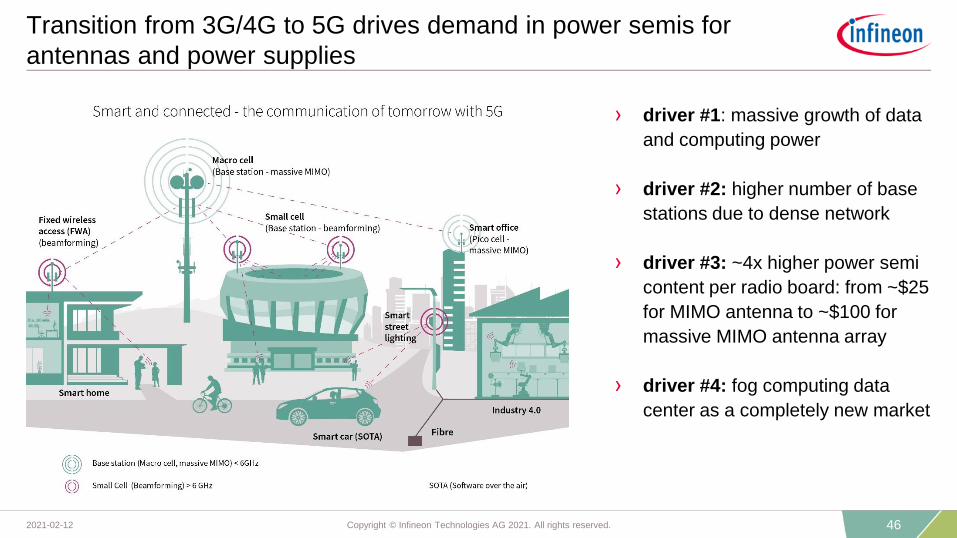
Transition from 3G/4G to 5G drives demand in power semis for
antennas and power supplies
5G base station
Massive MIMO
DC-DC (MOSFET, ICs)
Fog Computing
AC-DC, DC-DC (MOSFET, ICs)
Base station power supply
AC-DC, DC-DC (MOSFET, ICs)
› driver #1: massive growth of data
and computing power
› driver #2: higher number of base
stations due to dense network
› driver #3: ~4x higher power semi
content per radio board: from ~$25
for MIMO antenna to ~$100 for
massive MIMO antenna array
› driver #4: fog computing data
center as a completely new market
462021-02-12 Copyright © Infineon Technologies AG 2021. All rights reserved.

Infineon is well positioned to benefit from the conversion to the
de-facto standard USB Type-C
COGS
USB Type-C becomes de-facto interface form factor Infineon USB business split by appl.
Near-term
revenue
synergies:
improved
customer
access,
cross-selling
opportunities› Infineon USB business dominated by USB Type-C and USB Type-C PD
› USB Type-C PD in automotive is a nascent segment with good growth opportunities
› USB Type-C PD offers revenue synergies for Infineon in AC-DC chargers and adapters
Smartphone & tablet
PC, monitor, printer
Charger & adapter
Cables & dongles
Network & storage
Automotive
Others
[FY20]
472021-02-12 Copyright © Infineon Technologies AG 2021. All rights reserved.

What comes next?
Mid- to long-term structural growth opportunities
Core New areaAdjacent
wireless charging
on-board chargernew material
smart building smart speaker5G infrastructure
health & lifestyle
environmental sensor solutions
hyperscale AI data center
482021-02-12 Copyright © Infineon Technologies AG 2021. All rights reserved.

PSS – RF and Sensing

Main applications addressed by PSS sensors portfolio
Best audio
performance
Low power
consumption
MEMS microphone
› Smartphone
› True wireless stereo
headsets and earbuds
› Smart speaker
› Tablet
Main applications
High
precision and
small form
factor
Measure CO2
14.0 x 13.6 x 7.5 mm³
Environmental
› Heating, ventilation, air
conditioning (HVAC)
› Air purifier
› Smart thermostat
› CO2/virus detection
Best price /
performance
VR/AR,
biometrics
3D ToF image sensor
Ultra-low
power
consumption
Presence
detection
3D radar (24/60 GHz)
› Automotive
› Smart home
› TV
› Security camera
› Smart building
› Smartphone: world-
facing and user-facing
› Robotics
› Automotive in-cabin
sensing
› Payment terminals
502021-02-12 Copyright © Infineon Technologies AG 2021. All rights reserved.

224308
399509
628
2020 2021 2022 2023 2024
124154
219
347
467
2020 2021 2022 2023 2024
Environmental sensor market*3D ToF image sensor market
Radar IC market (24 GHz and 60 GHz only)MEMS microphone market
Sensor markets targeted by PSS
(+0.1-pt)
* Infineon is addressing smart building, smart home, smart appliances, consumer IoT
devices and automotive.
Source: Infineon estimates
[US$ m]
[US$ m]
[EUR m]
Source: Infineon estimates
Source: Infineon estimates
FY
[EUR m]
FY
Source: Infineon estimates
FY
FY
1.1801.491
1.816 1.940 2.055
2020 2021 2022 2023 2024
144 171
476
908
1282
2020 2021 2022 2023 2024
512021-02-12 Copyright © Infineon Technologies AG 2021. All rights reserved.

Environmental sensors
Radar ICs (24 GHz and 60 GHz only)
Different market dynamics of selected PSS sensors
MEMS microphone
3D ToF image sensor
› Home appliance will drive 60 GHz radar growth in the
consumer market (thermostats, speakers a.o.)
› 60 GHz radar successfully launched as replacement for
passive-infrared approach getting traction in the market
› New applications like In-cabin-monitoring systems and
smart trunk opener will fuel strong growth in auto
segment
› New headset features like active noise cancellation or
transparent hearing require 4 to 9 microphones.
Traditional wired headsets had only one microphone.
› Global smartphone MEMS microphone market
rebounded in Q3 CY20. Upward track expected to
maintain in coming quarters.
› Market entry in CO2 sensor market with first revenues
expected in FY21.
› XENSIV™ PAS CO2 sensors support reducing the risk
of virus transmission by enabling better and clean indoor
air quality.
› 3D ToF image sensor enables newest generation of
vacuum cleaning robots like Xiaomi Mijia 1T smart
vacuum cleaner with “smart eyes” capabilities to
accurately realize and avoid obstacles in all three
dimensions.
522021-02-12 Copyright © Infineon Technologies AG 2021. All rights reserved.

Sweeping success of our XENSIV™ MEMS microphones driven by
unparalleled audio characteristics catapulted Infineon to new #1
Infineon’s market share development in MEMS microphones (by units)
Based on or includes research from Omdia: MEMS Microphones Dice Market Shares 2020. October 2020
2.5%
4.1%
5.9%
39.8%
43.5%
NJRC
Omron
MEMSensing
Knowles
Infineon
2019 MEMS die market share
total market: 5.4bn units
Technological progression of Infineon XENSIV™ MEMS microphones
SNR = 62 – 65 dB(A)
Single-back plate1 Dual-back plate2
SNR = 65 – 69 dB(A)
Sealed dual-membrane3
SNR = 68 – 75 dB(A)
3.5% 5.2%8.8%
26.5%
34.7% 36.5%
43.5%
2006 2008 2010 2012 2014 2016 2018
532021-02-12 Copyright © Infineon Technologies AG 2021. All rights reserved.

5m 10m7m
40k 2.7k 0.6k depth points10k
New 3D ToF image sensor with improved long range to be
launched in Q3 FY21
Adaptive resolution depending on distance
Characteristics:
› Long range up to 10 meters
› High resolution up to 40k
depth points
› Lowest power, reduction of
40% at the imager
› Accurate and robust depth
data under all light conditions
› Smallest 3D camera; 35%
smaller footprint
› Lowest system BoM due to
high integrated CMOS image
sensor and Infineon VCSEL
driver component
› Enables functionalities like real-time augmented reality, long range
scanning, small object reconstruction, fast low-power autofocus and
picture segmentation.
› Serves applications like gaming, virtual e-Commerce, 3D online
education, facial recognition.
542021-02-12 Copyright © Infineon Technologies AG 2021. All rights reserved.

Connected Secure Systems

CSS at a glance
FY20 revenue split by product groupCSS revenue and Segment Result Margin
CAGR(FY16-FY20): 7.9%
[EUR m]
703 708 664 642
953
19% 18%16%
12%
13%
-5%
5%
15%
25%
0
200
400
600
800
1.000
1.200
FY16 FY17 FY18 FY19 FY20
CSS revenue CSS Segment Result Margin
Key customers
security ICs
connectivity
MCUs
562021-02-12 Copyright © Infineon Technologies AG 2021. All rights reserved.

Market outlook for CSS division’s target applications
Market Outlook for CY21Applications(% of FY20 segment revenue)
› High demand for contactless payment solutions expected to continue
› New product launches expected to boost demand
› Further implementation of low-power processing and connectivity technologies across new models
› Market growth driven by launch of new console models
› Return to growth, however lower level than previously expected
› New features and technologies enter production and proliferate across models
› Prolonged restrictions on international travel expected to further affect especially the issuance of
passports
~30%
~70%
› Increasing penetration rate of eSIM Automotive driven by increasing connectivity requirements
› Connectivity technologies to improve in-car user experience
Payment,
ID,
Ticketing
Industrial
and
Consumer
IoT
Wearables
Identification
Payment
Gaming
572021-02-12 Copyright © Infineon Technologies AG 2021. All rights reserved.

Infineon remains top player in its target markets:
security ICs, Wi-Fi standalone ICs
ABI Research: Smart Card and Embedded Security IC Technologies. October 2020
9.2%
12.7%
17.8%
21.5%
26.3%
CEC Huada
STMicro
Samsung
NXP
Infineon
(+0.1-pt)
Security ICs (excl. NFC controller; excl. NFC eSE)2019 total market: $2.8bn
ABI Research: Wireless Connectivity Technology Segmentation and Addressable Markets – Q3 2020 Update. July 2020
16.3%
15.9%
14.5%
10.0%
9.8%
Media Tek
NXP
Qualcomm
Broadcom
Infineon
Wi-Fi standalone ICs2019 total market: 978m units
Infineon is focusing on wearables and IoT but not addressing routers, PCs, notebooks, tablets.
582021-02-12 Copyright © Infineon Technologies AG 2021. All rights reserved.

Connected Secure Systems – comprehensive systems for a
secure, connected world
› Payment (credit and debit cards)
› Electronic passports & ID cards
› Transport tickets
› Access cards
› Industrial application
› Infrastructure
› Mobility and connected cars
› Home appliances
Top player in key marketsPositioned to benefit from major growth trends
Industrial and consumer IoTPayment, identification, ticketing
› Consumer electronics, e.g. games
consoles, audio entertainment
› Notebooks, PCs and servers
› Smartphones and accessories
› Security, connectivity and compute are the essential ingredients
for IoT
› Digitalization unlocks new opportunities
› CSS supports other divisions with the integration of security,
connectivity, and compute1) ABI Research: Smart Card and Embedded Security IC Technologies. October 2020.
2) excl. NFC Controllers; excl. NFC embedded Secure Element
3) ABI Research: Wireless Connectivity Technology Segmentation and Addressable Markets. November 2019.
# 1 in payment1 # 3 in Bluetooth Standalone3
# 5 in Wi-Fi standalone ICs3# 1 in security ICs1,2
592021-02-12 Copyright © Infineon Technologies AG 2021. All rights reserved.

CSS owns the key ingredients to address the high-growth IoT market:
security solutions, wireless connectivity and processing
Payment Identification Industrial IoT Consumer IoT Connected Cars Smart Watch
Security solutionsSECORA™ family, OPTIGA™ family, CL / DIF and embedded security controllers
Wireless ConnectivityWi-Fi / Bluetooth combos, Wi-Fi standalone, BT/BLE standalone
ProcessingPSoC™ family, XMC™ family, general-purpose MCUs
CS
S p
ort
folio
Ap
plic
ati
on
s
602021-02-12 Copyright © Infineon Technologies AG 2021. All rights reserved.

Infineon offers the entire system for IoT − unlocking new markets
and applications
air con
auto
telematics
auto
head unit
service
robot
cooking,
washing,
heating,
cooling
shaver,
epilator,
toothbrush
camera
personal
medical
device
smart watch
surveillance
camera
smart
door lock
lifestyle
wearables
smart
speaker
printer
game
console
powersensors
security hardware
security software
RF and
sensorspower
software and ecosystem
connectivity
MCU
motor
light
coil
AC-DC
microph.
pressure
radar
3D ToF
current
more ...
DC-DC
more ...
IoT control loop
cloud
612021-02-12 Copyright © Infineon Technologies AG 2021. All rights reserved.

Selected financial figures

Strong presence in all regions; well-balanced customer portfolio;
no customer represents more than 10% of total sales
Distribution and
EMS partners
EMEA (excl. Germany)15%
Germany12%
APAC (excl. GC,
Japan)15%
GC (excl. Mainland China, Hong Kong)
8%
Mainland China, Hong Kong
29%
Japan9%
Americas12%
Revenue by sales channel*FY20 revenue by region
Top-10 direct customers
other direct customers
Distribution and EMS partners
Top-10 direct customers
* assuming 12-months revenue contribution of Cypress
632021-02-12 Copyright © Infineon Technologies AG 2021. All rights reserved.

Group financial performance
297 274 220 379 489
1,916 1,9862,174
2,4902,631
37.0%
34.5%
27.0%
31.8%
37.4%
Q1FY20
Q2FY20
Q3FY20
Q4FY20
Q1FY21
Revenue Segment Result Gross Margin
[EUR m]› Strong start into FY21
› Demand in several areas, most notably microcontrollers
and IoT products, is outstripping supply
› Covid and trade tensions remain significant uncertainties
› Accelerating adoption rates for structural drivers like
electro-mobility and IoT
› Integration of Cypress is progressing
* Consolidation of Cypress revenue as of 16 April 2020. ** For definition see notes
1.0 0.9 0.71.2
1.6
Q1FY20
Q2FY20
Q3FY20
Q4FY20
Q1FY21
Book-to-bill**
Revenue* and gross margin development
642021-02-12 Copyright © Infineon Technologies AG 2021. All rights reserved.

Automotive (ATV)
824 842 810
1,0451,150
Q1FY20
Q2FY20
Q3FY20
Q4FY20
Q1FY21
0.9 0.8
0.2
1.31.5
Q1FY20
Q2FY20
Q3FY20
Q4FY20
Q1FY21
› Global car markets continue to rebound, particular strength in components for electric vehicles
› Current semiconductor shortage: foundry capacity, especially for microcontrollers is a limiting factor
› Significant reduction in underutilization charges and non-recurring effects drive strong margin improvement
Revenues* Segment Result* Book-to-bill
[EUR m] [EUR m]
* With effect from 1 Oct 2020, we transitioned a group of industrial microcontrollers with an annual sales volume of a low-double-digit million Euros from ATV to CSS. Historical figures have been retroactively adjusted.
6549
-26
59
185
7.9%5.8%
-3.2% 5.6%
16.1%
Q1FY20
Q2FY20
Q3FY20
Q4FY20
Q1FY21
Margin
652021-02-12 Copyright © Infineon Technologies AG 2021. All rights reserved.

Revenues Segment Result Book-to-bill
62 62 6369
61
18.6%17.3% 17.2%
19.8%
16.9%
Q1FY20
Q2FY20
Q3FY20
Q4FY20
Q1FY21
Margin
Industrial Power Control (IPC)
334 358 366 349 362
Q1FY20
Q2FY20
Q3FY20
Q4FY20
Q1FY21
1.1 1.00.7
1.11.4
Q1FY20
Q2FY20
Q3FY20
Q4FY20
Q1FY21
› Renewables - positive momentum continues
› Home appliances remain strong, driven by pent-up demand and energy-saving regulations
› Industrial drives moved sideways, transportation continues to be hampered by low travel activities
› Segment Result Margin decline reflects adverse currency movements and unfavorable product mix
[EUR m] [EUR m]
662021-02-12 Copyright © Infineon Technologies AG 2021. All rights reserved.

Power & Sensor Systems (PSS)
593 617681
759 779
Q1FY20
Q2FY20
Q3FY20
Q4FY20
Q1FY21
1.0 0.91.2 1.2
1.6
Q1FY20
Q2FY20
Q3FY20
Q4FY20
Q1FY21
› Remote workforce and stay-at-home regulations continue to boost demand
› Strong demand for low-voltage switches (power tools) and MEMS microphones (smartphones & accessories)
› Demand for the server components remains flat, but at high levels
Revenues Segment Result Book-to-bill
[EUR m] [EUR m]
146 138 143
209 197
24.6%
22.4% 21.0%
27.5%
25.3%
Q1FY20
Q2FY20
Q3FY20
Q4FY20
Q1FY21
Margin
672021-02-12 Copyright © Infineon Technologies AG 2021. All rights reserved.

Connected Secure Systems (CSS)
163 166
312333 335
Q1FY20
Q2FY20
Q3FY20
Q4FY20
Q1FY21
1.1 1.1
0.8
1.1
2.6
Q1FY20
Q2FY20
Q3FY20
Q4FY20
Q1FY21
Revenues* Segment Result* Book-to-bill
› CSS affected by supply constraints on the foundry side
› Vibrant demand especially for general-purpose microcontrollers and Wi-Fi components
› Secular trend towards connected devices continues to be unabated
[EUR m] [EUR m]
* With effect from 1 Oct 2020, we transitioned a group of industrial microcontrollers with an annual sales volume of a low-double-digit million Euros from ATV to CSS. Historical figures have been retroactively adjusted.
24 25
39 42 45
14.7% 15.1%12.5% 12.6% 13.4%
Q1FY20
Q2FY20
Q3FY20
Q4FY20
Q1FY21
Margin
682021-02-12 Copyright © Infineon Technologies AG 2021. All rights reserved.

RoCE and adjusted RoCE
-5%
5%
15%
25%
FY17 FY18 FY19 FY20 Q1 FY20 Q2 Q3 Q4 Q1 FY21
Adjusted RoCE (excl. effects from International Rectifier and Cypress acquisition, Deferred Tax Effects, RF Power sale) RoCE
692021-02-12 Copyright © Infineon Technologies AG 2021. All rights reserved.

Earnings-per-share and total cash return
16 13
-11
81917 13 13
2028
Q1 FY20 Q2 Q3 Q4 Q1 FY21
EPS basic
EPS adjusted
Total cash return to shareholders
[EUR m]
225 248283
305 336286
FY16 FY17 FY18 FY19 FY20 FY21e
dividends (payout year)
› Dividend proposal for FY20: €0.22 per
share
› Proposed total dividend payout of
€286m for FY20
[EUR cent]
Development of earnings-per-share (EPS) from continuing operations
702021-02-12 Copyright © Infineon Technologies AG 2021. All rights reserved.

5763
535877
157159151156239
10.6%10.8%10.6%10.8%14.5%
Q3 FY19Q4Q1 FY20Q2Q3
53 58 77 66 72
151 156
239
242 239
10.6%10.8%
14.5% 12.4%11.8%
Q1 FY20 Q2 Q3 Q4 Q1 FY21
General & Administration
Selling
% of sales
204
5763
5358 77
157 159 151 156
23910.6%10.8%10.6%10.8%14.5%
Q3 FY19Q4Q1 FY20Q2 Q3
R&D
% of sales
Opex development
243 241
321308
333
12.7%
12.1%
14.8%
12.4%
12.7%
Q1 FY20 Q2 Q3 Q4 Q1 FY21
[EUR m]
Selling, General & Administration Research & Development
[EUR m]
Therein non-segment result charges
[EUR m]
1 2 8 11 8
Therein non-segment result charges
[EUR m]
6013 18 79 68
214
316 308 311
712021-02-12 Copyright © Infineon Technologies AG 2021. All rights reserved.

Trade working capital components
Working capital* Inventories
Trade receivables Trade payables
923 8831,091 1,160 1,127
58 53 54 53 54
Q1 FY20 Q2 Q3 Q4 Q1 FY21Trade payables DPO*
1,583 1,762 1,5051,007 993
Q1 FY20 Q2 Q3 Q4 Q1 FY21
1,767 1,7362,215 2,052 1,955
132 120 126 109 107
Q1 FY20 Q2 Q3 Q4 Q1 FY21Inventories DIO*
952 1,047 1,114 1,196 1,155
38 40 36 34 31
Q1 FY20 Q2 Q3 Q4 Q1 FY21
Trade receivables** DSO*
* For definition please see page "Notes".
** Along with the integration of Cypress refund liabilities to customers are presented under “other current liabilities” instead of “trade receivables”.
Prior quarters’ figures were adjusted accordingly for better comparability.
[EUR m] [EUR m]
[EUR m] [EUR m][days] [days]
[days]
722021-02-12 Copyright © Infineon Technologies AG 2021. All rights reserved.

D&A impacted by Cypress consolidation and PPA
Investments* Depreciation & Amortization
693 683 758 858 945
140 129103
87
315
12.8% 14.5%16.5% 18.1%
12.8%~14.8% 12.9%
11.5% 11.3% 11.8% 14.0% ~14.8%
FY16 FY17 FY18 FY19 FY20 FY21e FY16 FY17 FY18 FY19 FY20 FY21e
Non-SR-related D&A Guidance % of revenue [rhs]
~500
[EUR m]
* For definition please see page "Notes".
826
1,022
1,254
1,099
833 812 861945
~1.6bn
1,451
[EUR m]
~1.6bn
1,260
732021-02-12 Copyright © Infineon Technologies AG 2021. All rights reserved.

4,8
59
4,5
88
3,4
50
3,2
27
3,3
34
-6,7
03
1,5
31
1,5
37
-7,7
46
-7,0
33
3,3
28
3,0
51
-4,2
96
-3,8
06
-3,3
69
Q1FY20
Q2 Q3 Q4 Q1FY21
Gross Cash Gross Debt Net Cash/Debt
Liquidity development
[EUR m]
› Q4 FY20: early repayment of one half of the first term loan (USD 555m).
› Q1 FY21: Gross debt – reduced by 174m EUR repayment and impact of weaker US-dollar on USD-denominated debt.
Net debt: improvement driven by strong free cash flow and, to some extent, currency effects.
742021-02-12 Copyright © Infineon Technologies AG 2021. All rights reserved.

Maturity profile
€750
€750
€750 €650
2021 2022 2023 2024 2025 2026 2027 2028 2029 2030 2031 2032
$350$235
$555
[EUR m; US$ m; nominal values]
€171
€500€600
€600
Eurobond (Mar 2022)
Term loans (Sep 2022, Sep 2023, Jun 2024)
Corporate bonds under the EMTN program
(Jun 2023, Jun 2026, Jun 2029, Jun 2032)
US PP Notes (Apr 2024, Apr 2026, Apr 2028)
Hybrid bonds* (Jan 2025, Jan 2028)
Note: Graph excludes pre-existing Cypress convertibles of ~$382m repayment value, maturing latest 2022, and additional debt with maturities between 2021 and 2023 totaling €9m.
* On 1 Oct 2019, Infineon issued a perpetual hybrid bond with two tranches: €600m with first call date in 2025 and €600m with first call date in 2028; both are accounted as equity under IFRS.
$1,110$1,110
$350
752021-02-12 Copyright © Infineon Technologies AG 2021. All rights reserved.


Glossary (1 of 2)
ABB accelerated book building
AC alternating current
AC-DC alternating current - direct current
AD automated driving
ADAS advanced driver assistance system
AEB automatic emergency braking
AFS advanced frontlight system
AI artificial intelligence
AR augmented reality
ASP average selling price
BEV battery electric vehicle
BGA ball grid array
BLE Bluetooth Low Energy
BoM bill of material
BT Bluetooth
CL contactless
CPU central processing unit
CRC cyclical redundancy check
DC direct current
DC-DC direct current - direct current
DIF dual-interface (contact-based and contactless)
DIY do it yourself
DPM digital power management
eCall emergency call
ECC error correction code
ECU electronic control unit
EPS electric power steering
eSIM embedded subscriber identity module
ESS energy storage system
EV electric vehicle
FHEV full hybrid electric vehicle
FPGA field programmable gate array
G2M go-to-market
GaN gallium nitride
GPS global positioning system
GPU graphics processing unit
HEV mild and full hybrid electric vehicle
HMI human machine interaction
HSM hardware security module
HST high-speed train
HVAC heating, ventilation, air conditioning
HW hardware
IC integrated circuit
ICE internal combustion engine
IGBT insulated gate biploar transistor
IoT Internet of Things
IPM intelligent power module
IVN in-vehicle networking
iPol image processing line
772021-02-12 Copyright © Infineon Technologies AG 2021. All rights reserved.

Glossary (2 of 2)
IRFPolP International Rectifier
IVN in-vehicle networking
LCD liquid crystal display
LDO low dropout voltage regulator
LED light-emitting diode
LSEV low-speed electric vehicle
LSPS LS Power Semitech Co. Ltd.
µC microcontroller
Mb megabit
MCU microcontroller unit
MEMS micro electro-mechanical systems
MHA major home appliances
MHEV mild hybrid electric vehicle
MIMO multiple input, multiple output
micro-hybrid vehicles using start-stop systems and limited recuperation
mild-hybrid vehicles using start-stop systems, recuperation, DC-DC conversion, e-motor
MOSFET metal-oxide silicon field-effect transistor
MPU microprocessor unit
OBC on-board charger
OEM original equipment manufacturer
P2S Infineon‘s strategic product-to-system approach
PAS photo-acoustic spectroscopy
PFC power factor correction
PHEV plug-in hybrid electric vehicle
PMIC power management IC
Pol point-of-load
PSoC programmable system-on-chip
PV photovoltaic
RF radio frequency
rhs right-hand scale
Si silicon
SiC silicon carbide
SiGe silicon germanium
SMD surface mounted device
SMPS switch-mode power supply
SNR signal-to-noise ratio
SoC system-on-chip
SOTA software over-the-air
SPI serial peripheral interface
SRAM static random access memory
SW software
TAM total addressable memory
TCO total cost of ownership
ToF time-of-flight
TPM trusted platform module
UPS uninterruptible power supply
USB universal serial bus
V2X vehicle-to-everything communication
VR virtual reality
VSD variable speed drive
Wi-Fi wireless fidelity
xEV all degrees of vehicle electrification (EV, HEV, PHEV)
782021-02-12 Copyright © Infineon Technologies AG 2021. All rights reserved.

Disclaimer
Disclaimer
This presentation contains forward-looking statements about the business, financial condition and earnings performance of the Infineon Group.
These statements are based on assumptions and projections resting upon currently available information and present estimates. They are subject to a multitude of uncertainties and risks.
Actual business development may therefore differ materially from what has been expected.
Beyond disclosure requirements stipulated by law, Infineon does not undertake any obligation to update forward-looking statements.
Specific disclaimer for Omdia – part of Informa Tech – reports, data and information referenced in this document:
The Omdia reports, data and information referenced herein (the “Omdia Materials – mostly former IHS Markit Technology Materials") are the copyrighted property of Informa Tech Research
Ltd. and its subsidiaries or affiliates (together "Informa Tech") and represent data, research, opinions or viewpoints published by Informa Tech, and are not representations of fact. The Omdia
Materials speak as of the original publication date thereof and not as of the date of this document. The information and opinions expressed in the Omdia Materials are subject to change
without notice and neither Informa Tech nor, as a consequence, Infineon have any duty or responsibility to update the Omdia Materials or this publication as a result. Omdia Materials are
delivered on an "as-is" and "as-available" basis. No representation or warranty, express or implied, is made as to the fairness, accuracy, completeness or correctness of the information,
opinions and conclusions contained in the Omdia Materials. To the maximum extent permitted by law, Informa Tech and its affiliates, IHS Markit and its Affiliates and their respective, officers,
directors, employees and agents, disclaim any liability (including, without limitation, any liability arising from fault or negligence) as to the accuracy or completeness or use of the Omdia
Materials. Informa Tech and/or IHS Markit will not, under any circumstance whatsoever, be liable for any trading, investment, commercial or other decisions based on or made in reliance of the
Omdia Materials. The "IHS Markit" brand and logo have been licensed for use by Informa Tech. The "IHS Markit" brand and logo and any third-party trademarks used in the IHS Markit
Technology Materials are the sole property of IHS Markit Group or their respective third-party owners.
Specific disclaimer for IHS Markit – reports, data and information referenced in this document:
The IHS Markit reports, data and information referenced herein (the "IHS Markit Materials") are the copyrighted property of IHS Markit Ltd. and its subsidiaries ("IHS Markit") and represent
data, research, opinions or viewpoints published by IHS Markit, and are not representations of fact. The IHS Markit Materials speak as of the original publication date thereof and not as of the
date of this document. The information and opinions expressed in the IHS Markit Materials are subject to change without notice and neither IHS Markit nor, as a consequence, Infineon have
any duty or responsibility to update the IHS Markit Materials or this publication. Moreover, while the IHS Markit Materials reproduced herein are from sources considered reliable, the accuracy
and completeness thereof are not warranted, nor are the opinions and analyses which are based upon it. IHS Markit and the trademarks used in the Data, if any, are trademarks of IHS Markit.
Other trademarks appearing in the IHS Markit Materials are the property of IHS Markit or their respective owners.
792021-02-12 Copyright © Infineon Technologies AG 2021. All rights reserved.

Financial calendar
Date Location Event
10 – 11 Feb 2021 New York virtual Goldman Sachs Technology & Internet Conference
25 Feb 2021 Neubiberg virtual Annual General Meeting
1 Mar 2021 virtual dbAccess Global ESG Conference
3 Mar 2021 Nuremberg virtual CSS Call along with embedded World trade show
9 – 10 Mar 2021 London virtual UBS Technology One-on-One Virtual Conference
11 Mar 2021 virtual ODDO BHF 5th Digital TMT Forum
24 Mar 2021 virtual JPMorgan Fireside Chat
4 May 2021* Q2 FY21 Results
6 May 2021 Nuremberg virtual IPC Call along with PCIM trade show
27 May 2021 London virtual JPMorgan European TMT Conference
8 – 9 Jun 2021 Paris virtual 23rd Exane BNP Paribas European CEO Conference
10 Jun 2021 San Francisco virtual Bank of America Global Technology Conference
17 Jun 2021 virtual GS European Digital Economy Conference
1 Jul 2021 Barcelona virtual PSS Call along with MWC trade show
3 Aug 2021* Q3 FY21 Results
4/5 Oct 2021 to be defined Infineon Capital Markets Day “IFX Day 2021”
* preliminary
802021-02-12 Copyright © Infineon Technologies AG 2021. All rights reserved.

ESG footnotes
1) This figure considers manufacturing, transportation, function cars, flights, materials, chemicals, water/waste water, direct
emissions, energy consumption, waste, etc. and is based on internally collected data and externally available conversion
factors. All data relate to the 2020 fiscal year. Manufacturing service providers are not included.
2) This figure is based on internally established criteria, which are explained in the explanatory notes. The figure relates to
the calendar year 2019 and considers the following fields of application: automotive, LED, induction cookers, server,
renewable energy (wind, photovoltaic), mobile phone chargers as well as drives. CO2 savings are calculated on the basis
of potential savings of technologies in which semiconductors are used. The CO2 savings are allocated on the basis of
Infineon market share, semiconductor content and lifetime of the technologies concerned, based on internal and external
experts' estimations.
3) Calculation based on average polycrystalline photovoltaic cells and the average yearly solar radiation of central Germany.
4) Based on the average electricity consumption of private households in Germany and official energy conversion factors.
5) Calculation based on average passenger capacity and direct flight route using externally available data and conversion
factors.
812021-02-12 Copyright © Infineon Technologies AG 2021. All rights reserved.

Notes
Investments = 'Purchase of property, plant and equipment' + 'Purchase of intangible assets and other assets' incl. capitalization of R&D expenses
Capital Employed = 'Total assets' – 'Cash and cash equivalents' – 'Financial investments' – 'Assets classified as held for sale
– ('Total Current liabilities' – 'Short-term debt and current maturities of long-term debt' – 'Liabilities classified as held for sale')
RoCE = NOPAT / Capital Employed
= ('Income from continuing operations' – 'financial income' – 'financial expense') / Capital Employed
Working Capital = ('Total current assets' – 'Cash and cash equivalents' – 'Financial investment' – 'Assets classified as held for sale') – ('Total
current liabilities' – 'Short term debt and current maturities of long-term debt' – 'Liabilities classified as held for sale')
DIO (days inventory outstanding; quarter-to-date) = ('Net Inventories' / 'Cost of goods sold') x 90
DPO (days payables outstanding; quarter-to-date) = ('Trade payables' / ['Cost of goods sold' + 'Purchase of property, plant and equipment']) x 90
DSO (days sales outstanding; quarter-to-date) = ('Trade receivables’ - ‘reimbursement obligations’)* / 'revenue'* x 90
*without debtors with credit balances
822021-02-12 Copyright © Infineon Technologies AG 2021. All rights reserved.

Notes
Book-to-bill ratio - Definition
Book-to-bill = Orders received / Revenue in Euro per quarter
› Orders received contains order backlog and external customer forecast
External customer forecast includes consignment stock forecast by customers
Not included are internal consignment replenishment orders
› Orders received does not include unconfirmed orders received
Unconfirmed demand will be reported as orders received and in book-to-bill when it gets
confirmed
› Orders received may not coincide with the IFRS 15 definition of a contract with a customer
832021-02-12 Copyright © Infineon Technologies AG 2021. All rights reserved.

For further reading
ATV Call
Peter Schiefer
5 October 2020
https://www.infineon.com/2020atvcall
Power Semiconductor Business Update Call
Dr. Peter Wawer, Andreas Urschitz
30 Nov 2020
https://www.infineon.com/2020powercall
Sustainability Report 2020
23 November 2020
https://www.infineon.com/sustainability_report
IFX Day 2018
Capital Markets Day
London, 12 June 2018
https://www.infineon.com/ifxday_2018
coming
soon
842021-02-12 Copyright © Infineon Technologies AG 2021. All rights reserved.

Institutional Investor Relations contacts
Alexander Foltin
Executive Vice President
Finance, Treasury & Investor Relations
+49 89 234-23766
Isabell Diel
Manager Investor Relations
+49 89 234-38297
Holger Schmidt
Director Investor Relations
+49 89 234-22332
Joachim Binder
Distinguished Engineer Investor Relations
+49 89 234-25649
Alexander Groschke
Director Investor Relations
+49 89 234-38348
852021-02-12 Copyright © Infineon Technologies AG 2021. All rights reserved.