Embed Size (px)
Citation preview
First Quarter of FY 2014 Consolidated Financial Results
Japan Display Inc.
August 7, 2014
2 Copyright © 2014 Japan Display Inc. All Rights Reserved.
1. Q1 FY 2014 Financial Results
2. Small- to Medium-Sized Display Market Environment and JDI’s Strategy
3 Copyright © 2014 Japan Display Inc. All Rights Reserved.
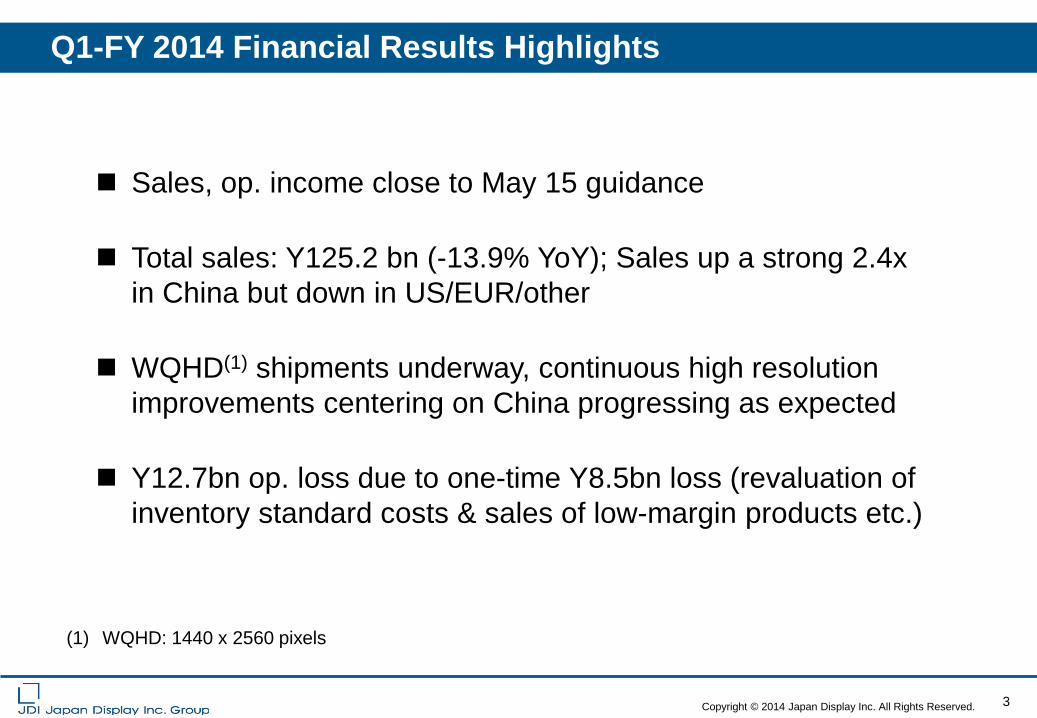
Q1-FY 2014 Financial Results Highlights
Sales, op. income close to May 15 guidance
Total sales: Y125.2 bn (-13.9% YoY); Sales up a strong 2.4x in China but down in US/EUR/other
WQHD(1) shipments underway, continuous high resolution improvements centering on China progressing as expected
Y12.7bn op. loss due to one-time Y8.5bn loss (revaluation of inventory standard costs & sales of low-margin products etc.)
(1) WQHD: 1440 x 2560 pixels
4 Copyright © 2014 Japan Display Inc. All Rights Reserved.
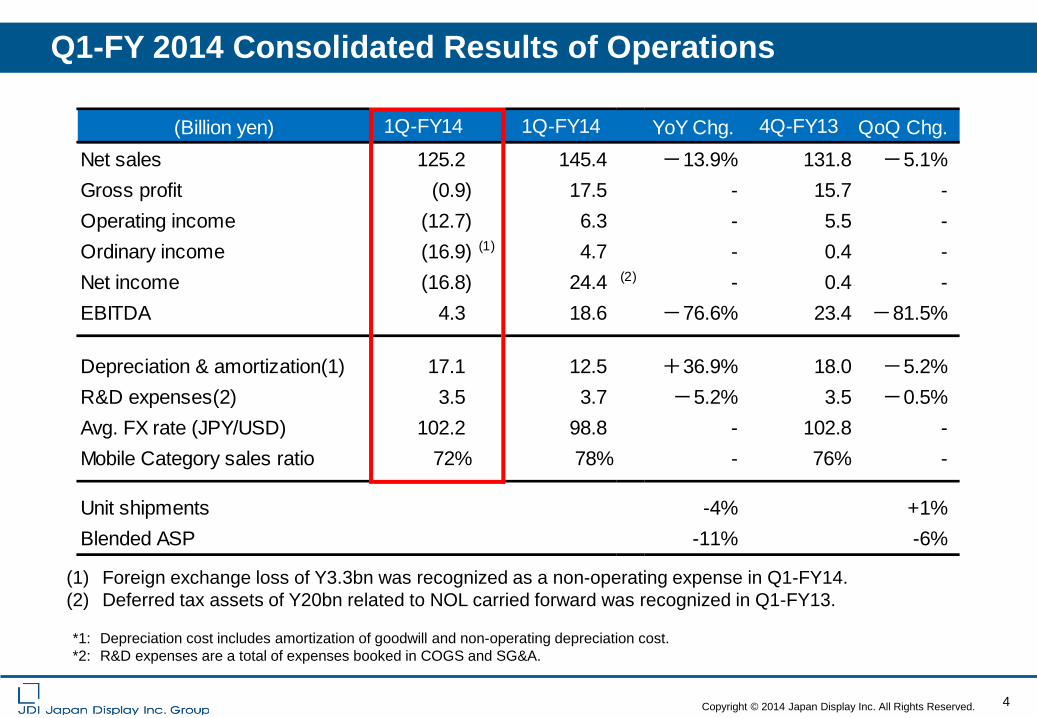
Q1-FY 2014 Consolidated Results of Operations
*1: Depreciation cost includes amortization of goodwill and non-operating depreciation cost. *2: R&D expenses are a total of expenses booked in COGS and SG&A.
(1) Foreign exchange loss of Y3.3bn was recognized as a non-operating expense in Q1-FY14. (2) Deferred tax assets of Y20bn related to NOL carried forward was recognized in Q1-FY13.
(Billion yen) YoY Chg. QoQ Chg.Net sales 125.2 145.4 -13.9% 131.8 -5.1%Gross profit (0.9) 17.5 - 15.7 -Operating income (12.7) 6.3 - 5.5 -Ordinary income (16.9) (1) 4.7 - 0.4 -Net income (16.8) 24.4 (2) - 0.4 -EBITDA 4.3 18.6 -76.6% 23.4 -81.5%
Depreciation & amortization(1) 17.1 12.5 +36.9% 18.0 -5.2%R&D expenses(2) 3.5 3.7 -5.2% 3.5 -0.5%Avg. FX rate (JPY/USD) 102.2 98.8 - 102.8 -Mobile Category sales ratio 72% 78% - 76% -
Unit shipments -4% +1%Blended ASP -11% -6%
4Q-FY131Q-FY14 1Q-FY14
5 Copyright © 2014 Japan Display Inc. All Rights Reserved.
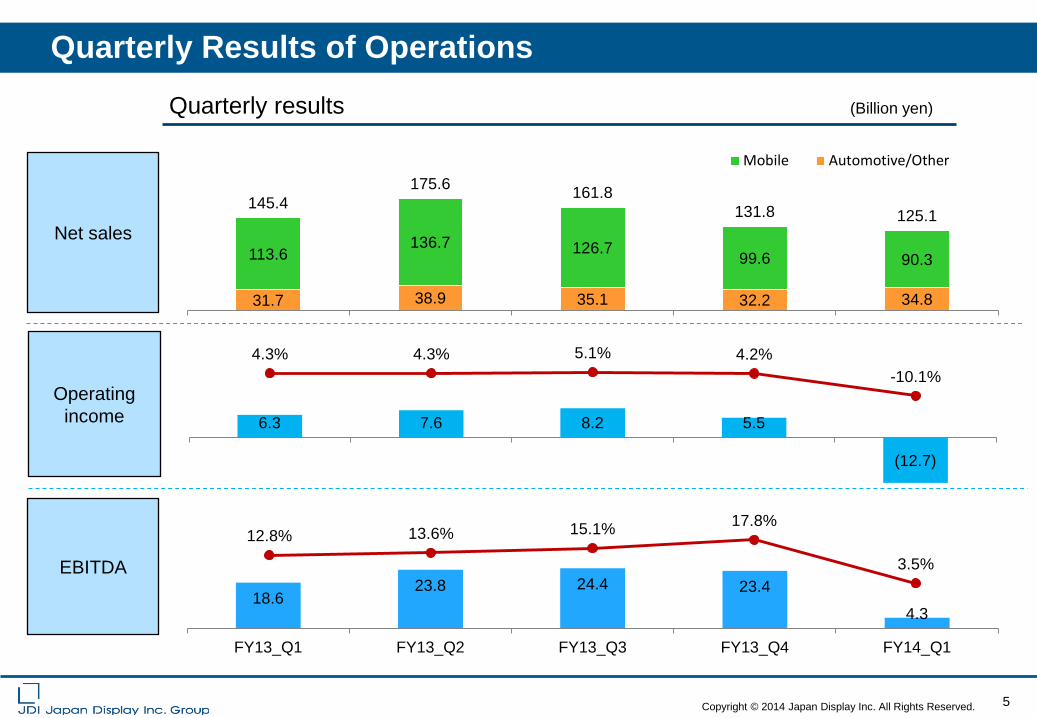
Quarterly Results of Operations
Quarterly results (Billion yen)
Net sales
EBITDA
Operating income
31.7 38.9 35.1 32.2 34.8
113.6 136.7 126.7 99.6 90.3
145.4 175.6 161.8
131.8 125.1
Mobile Automotive/Other
6.3 7.6 8.2 5.5
(12.7)
4.3% 4.3% 5.1% 4.2% -10.1%
18.6 23.8 24.4 23.4
4.3
FY13_Q1 FY13_Q2 FY13_Q3 FY13_Q4 FY14_Q1
12.8% 13.6% 15.1% 17.8%
3.5%
6 Copyright © 2014 Japan Display Inc. All Rights Reserved.
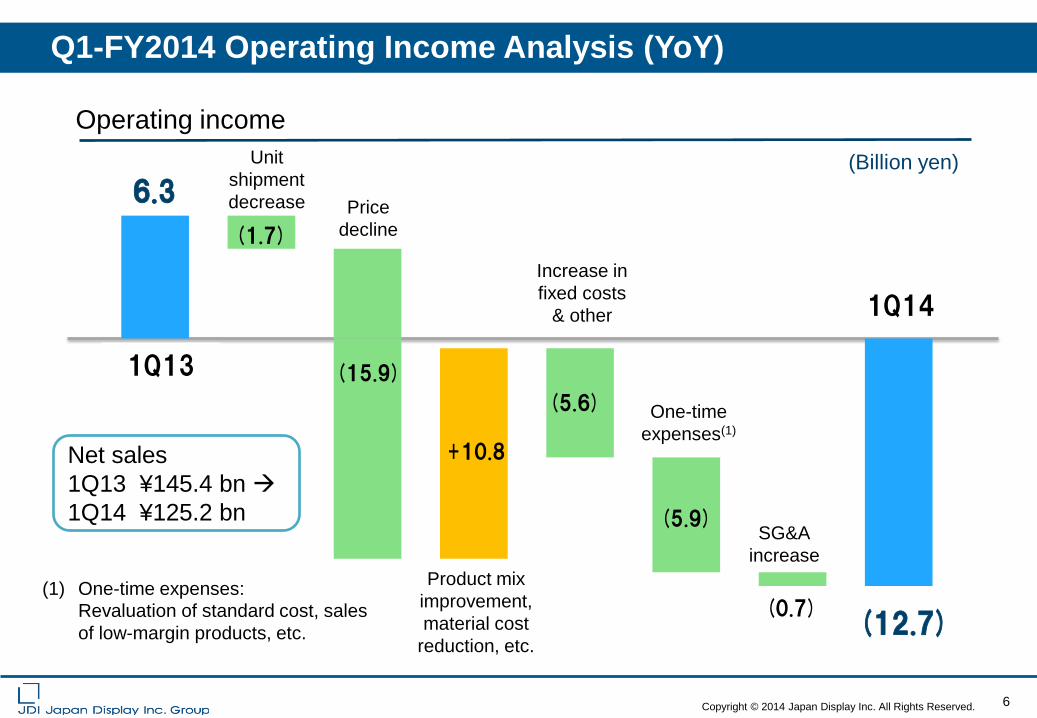
6.3
1Q14
(Billion yen)
(1.7)
(5.6)
(5.9)
(12.7)
1Q13 (15.9)
+10.8
(0.7)
Q1-FY2014 Operating Income Analysis (YoY)
Operating income Unit
shipment decrease
Increase in fixed costs
& other
One-time expenses(1)
Price decline
Product mix improvement, material cost
reduction, etc.
SG&A increase
Net sales 1Q13 ¥145.4 bn 1Q14 ¥125.2 bn
(1) One-time expenses: Revaluation of standard cost, sales of low-margin products, etc.
7 Copyright © 2014 Japan Display Inc. All Rights Reserved.
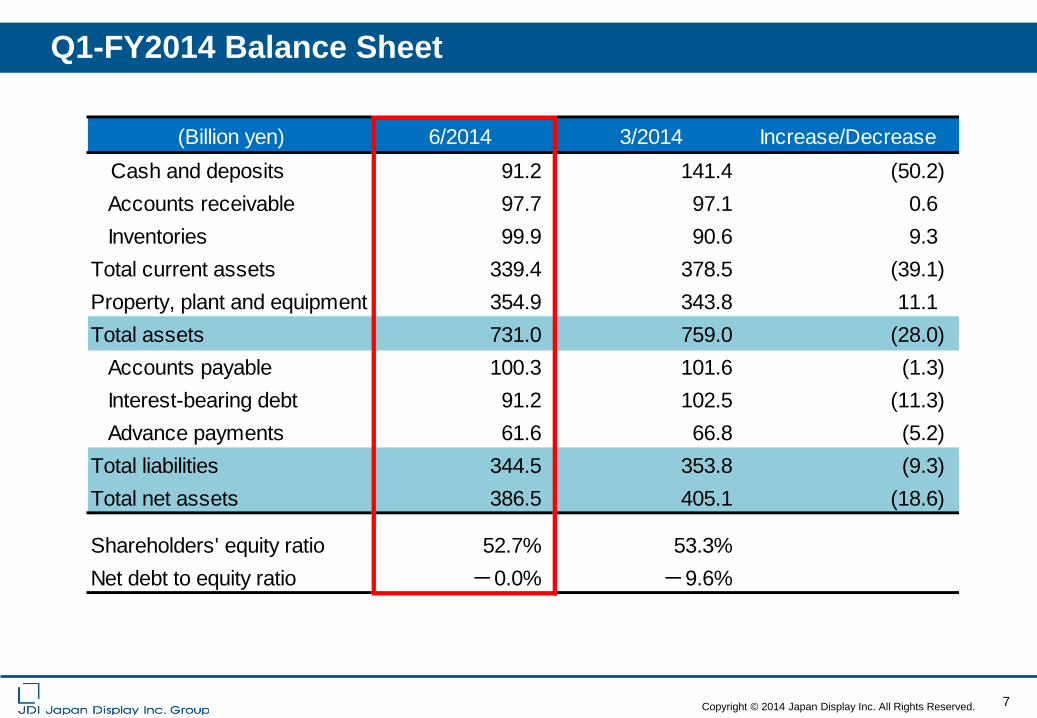
Q1-FY2014 Balance Sheet
(Billion yen) 6/2014 3/2014 Increase/Decrease Cash and deposits 91.2 141.4 (50.2) Accounts receivable 97.7 97.1 0.6 Inventories 99.9 90.6 9.3Total current assets 339.4 378.5 (39.1)Property, plant and equipment 354.9 343.8 11.1Total assets 731.0 759.0 (28.0) Accounts payable 100.3 101.6 (1.3) Interest-bearing debt 91.2 102.5 (11.3) Advance payments 61.6 66.8 (5.2)Total liabilities 344.5 353.8 (9.3)Total net assets 386.5 405.1 (18.6)
Shareholders' equity ratio 52.7% 53.3%Net debt to equity ratio -0.0% -9.6%
8 Copyright © 2014 Japan Display Inc. All Rights Reserved.
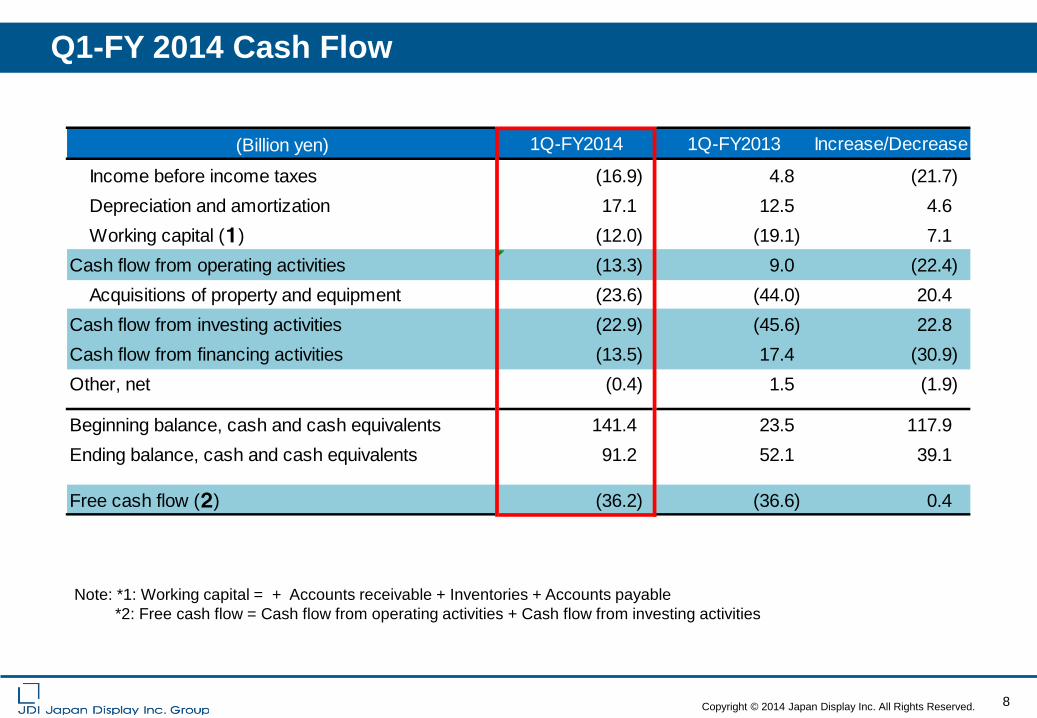
Q1-FY 2014 Cash Flow
Note: *1: Working capital = + Accounts receivable + Inventories + Accounts payable *2: Free cash flow = Cash flow from operating activities + Cash flow from investing activities
(Billion yen)
Income before income taxes (16.9) 4.8 (21.7) Depreciation and amortization 17.1 12.5 4.6 Working capital (1) (12.0) (19.1) 7.1Cash flow from operating activities (13.3) 9.0 (22.4) Acquisitions of property and equipment (23.6) (44.0) 20.4Cash flow from investing activities (22.9) (45.6) 22.8Cash flow from financing activities (13.5) 17.4 (30.9)Other, net (0.4) 1.5 (1.9)
Beginning balance, cash and cash equivalents 141.4 23.5 117.9Ending balance, cash and cash equivalents 91.2 52.1 39.1
Free cash flow (2) (36.2) (36.6) 0.4
Increase/Decrease1Q-FY2014 1Q-FY2013
9 Copyright © 2014 Japan Display Inc. All Rights Reserved.
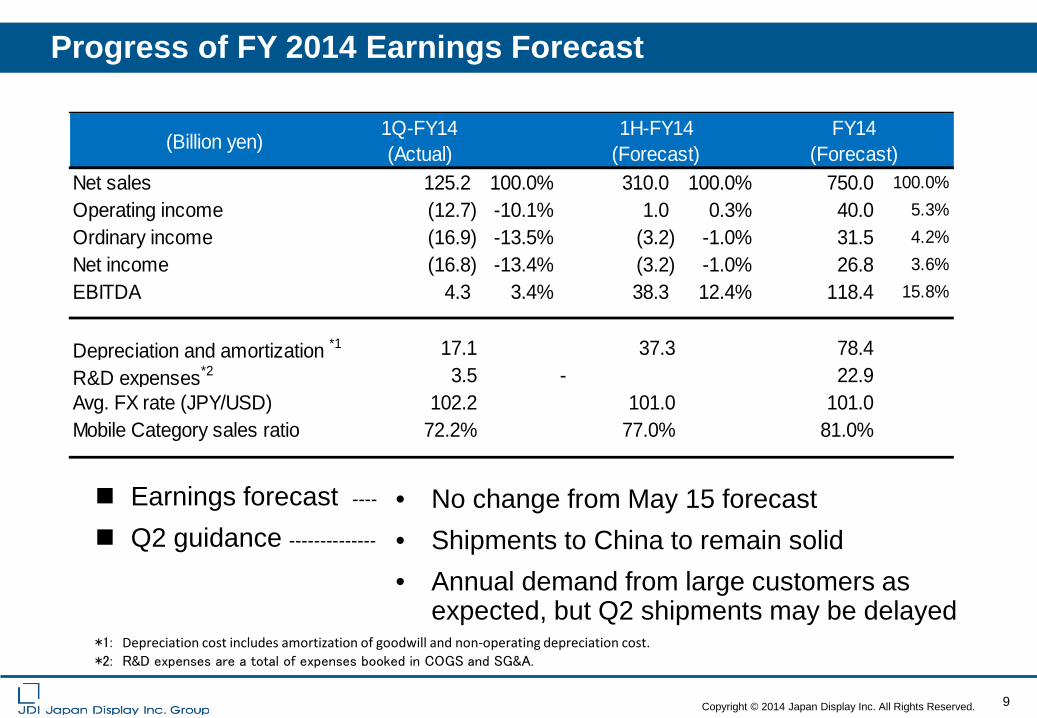
Progress of FY 2014 Earnings Forecast
*1: Depreciation cost includes amortization of goodwill and non-operating depreciation cost. *2: R&D expenses are a total of expenses booked in COGS and SG&A.
• No change from May 15 forecast • Shipments to China to remain solid • Annual demand from large customers as
expected, but Q2 shipments may be delayed
(Billion yen)1Q-FY14(Actual)
Net sales 125.2 100.0% 310.0 100.0% 750.0 100.0%Operating income (12.7) -10.1% 1.0 0.3% 40.0 5.3%Ordinary income (16.9) -13.5% (3.2) -1.0% 31.5 4.2%Net income (16.8) -13.4% (3.2) -1.0% 26.8 3.6%EBITDA 4.3 3.4% 38.3 12.4% 118.4 15.8%
Depreciation and amortization *1 17.1 37.3 78.4R&D expenses*2 3.5 - 22.9Avg. FX rate (JPY/USD) 102.2 101.0 101.0Mobile Category sales ratio 72.2% 77.0% 81.0%
1H-FY14(Forecast)
FY14(Forecast)
Earnings forecast ---- Q2 guidance -------- ------
10 Copyright © 2014 Japan Display Inc. All Rights Reserved.
1Q12 2Q12 3Q12 4Q12 1Q13 2Q13 3Q13 4Q13 1Q14 2Q14 3Q14 4Q14 (FY)
(forecast)
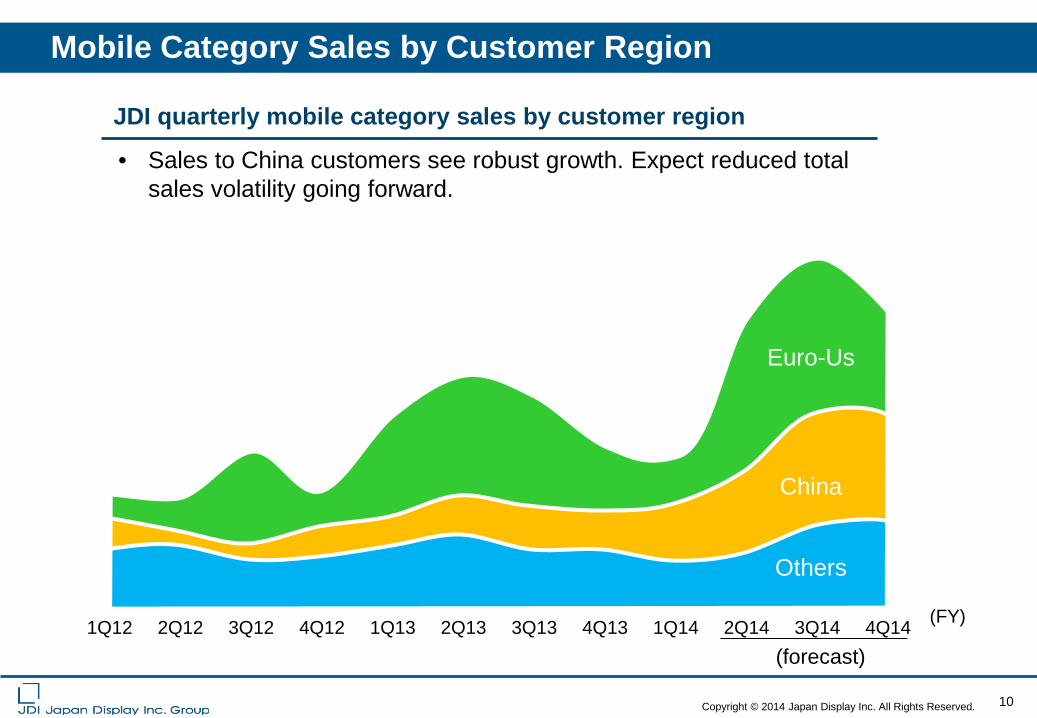
JDI quarterly mobile category sales by customer region
• Sales to China customers see robust growth. Expect reduced total sales volatility going forward.
Euro-Us
China
Others
Mobile Category Sales by Customer Region
11 Copyright © 2014 Japan Display Inc. All Rights Reserved.
1Q12 2Q12 3Q12 4Q12 1Q13 2Q13 3Q13 4Q13 1Q14 2Q14 3Q14 4Q14 (FY)
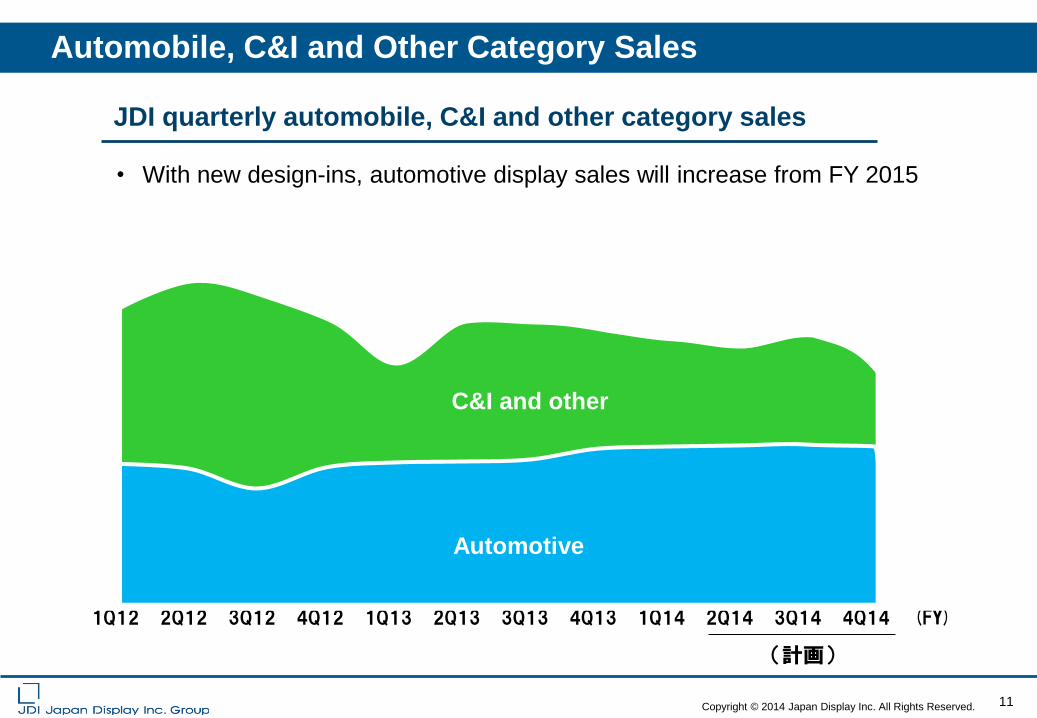
Automobile, C&I and Other Category Sales
(計画)
C&I and other
Automotive
JDI quarterly automobile, C&I and other category sales
・ With new design-ins, automotive display sales will increase from FY 2015
12 Copyright © 2014 Japan Display Inc. All Rights Reserved.
1. Q1 FY 2014 Financial Results
2. Small- to Medium-Sized Display Market Environment and JDI’s Strategy
13 Copyright © 2014 Japan Display Inc. All Rights Reserved.
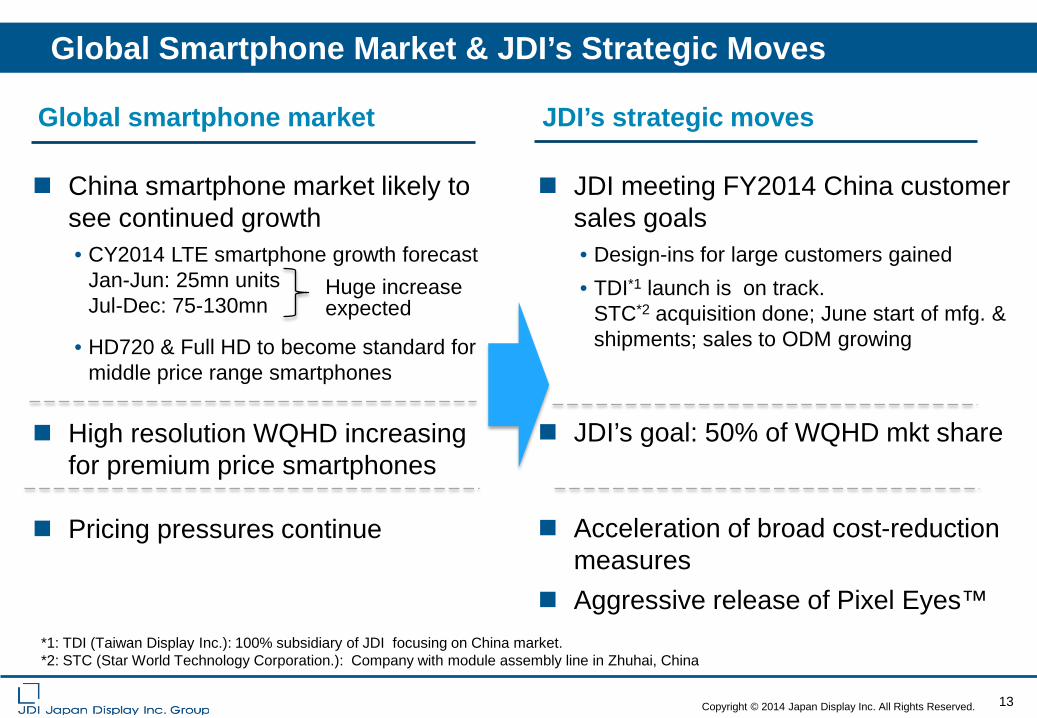
Global Smartphone Market & JDI’s Strategic Moves
JDI meeting FY2014 China customer sales goals • Design-ins for large customers gained • TDI*1 launch is on track.
STC*2 acquisition done; June start of mfg. & shipments; sales to ODM growing
JDI’s goal: 50% of WQHD mkt share
Acceleration of broad cost-reduction measures
Aggressive release of Pixel Eyes™
China smartphone market likely to see continued growth • CY2014 LTE smartphone growth forecast
Jan-Jun: 25mn units Jul-Dec: 75-130mn
• HD720 & Full HD to become standard for middle price range smartphones
High resolution WQHD increasing for premium price smartphones
Pricing pressures continue
Huge increase expected
Global smartphone market JDI’s strategic moves
*1: TDI (Taiwan Display Inc.): 100% subsidiary of JDI focusing on China market. *2: STC (Star World Technology Corporation.): Company with module assembly line in Zhuhai, China
14 Copyright © 2014 Japan Display Inc. All Rights Reserved.
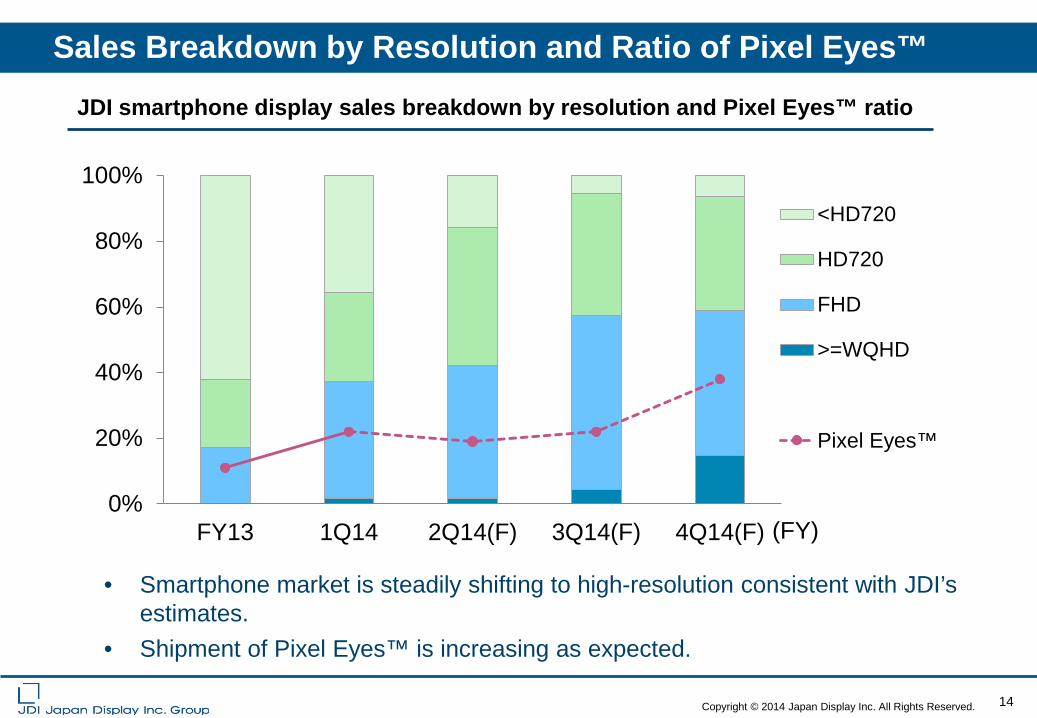
Sales Breakdown by Resolution and Ratio of Pixel Eyes™
0%
20%
40%
60%
80%
100%
FY13 1Q14 2Q14(F) 3Q14(F) 4Q14(F) (FY)
<HD720
HD720
FHD
>=WQHD
Pixel Eyes™
JDI smartphone display sales breakdown by resolution and Pixel Eyes™ ratio
• Smartphone market is steadily shifting to high-resolution consistent with JDI’s estimates.
• Shipment of Pixel Eyes™ is increasing as expected.
15 Copyright © 2014 Japan Display Inc. All Rights Reserved.
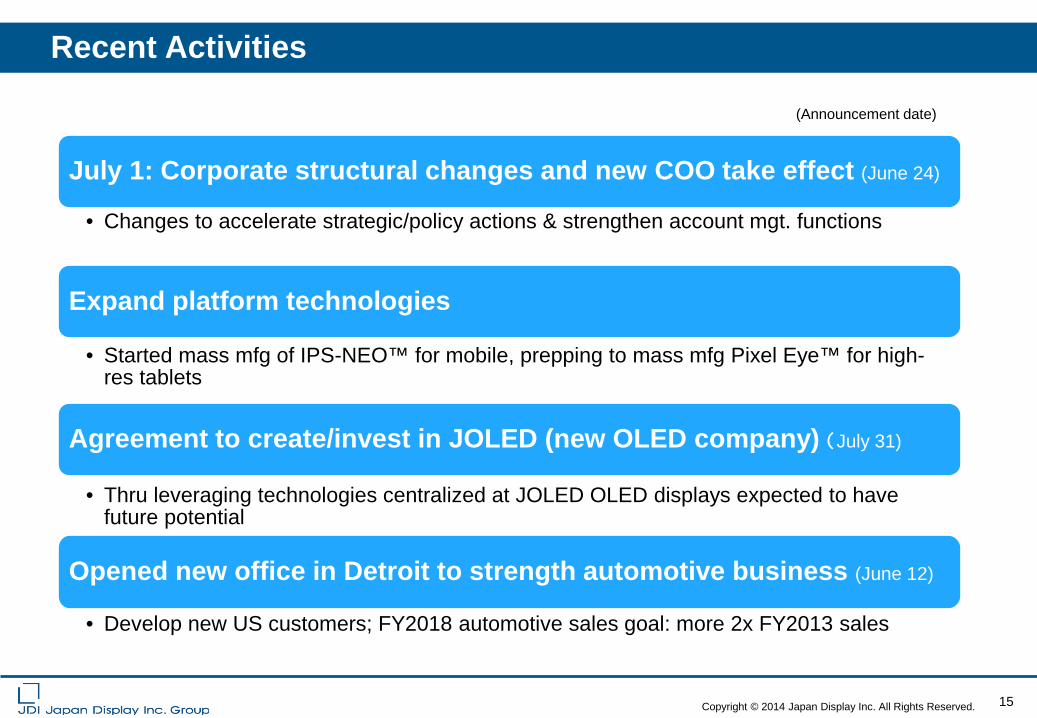
Recent Activities
July 1: Corporate structural changes and new COO take effect (June 24)
• Changes to accelerate strategic/policy actions & strengthen account mgt. functions
Expand platform technologies
• Started mass mfg of IPS-NEO™ for mobile, prepping to mass mfg Pixel Eye™ for high-res tablets
Agreement to create/invest in JOLED (new OLED company) (July 31)
• Thru leveraging technologies centralized at JOLED OLED displays expected to have future potential
Opened new office in Detroit to strength automotive business (June 12)
• Develop new US customers; FY2018 automotive sales goal: more 2x FY2013 sales
(Announcement date)
16 Copyright © 2014 Japan Display Inc. All Rights Reserved.
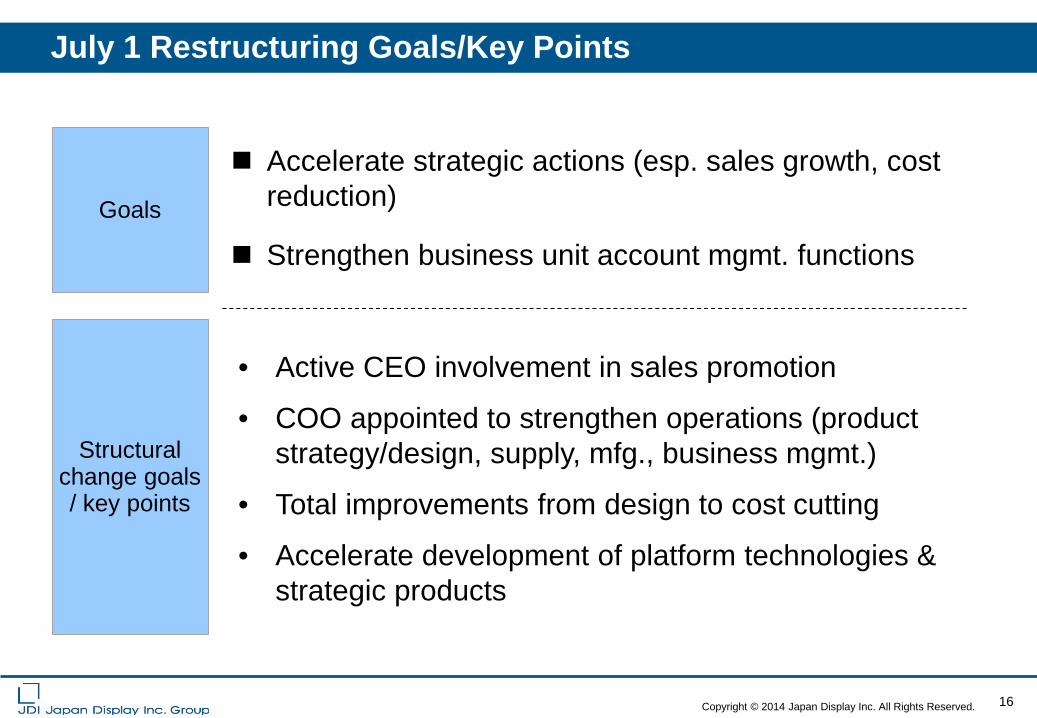
July 1 Restructuring Goals/Key Points
Accelerate strategic actions (esp. sales growth, cost reduction)
Strengthen business unit account mgmt. functions Goals
Structural change goals / key points
• Active CEO involvement in sales promotion
• COO appointed to strengthen operations (product strategy/design, supply, mfg., business mgmt.)
• Total improvements from design to cost cutting
• Accelerate development of platform technologies & strategic products
17 Copyright © 2014 Japan Display Inc. All Rights Reserved.
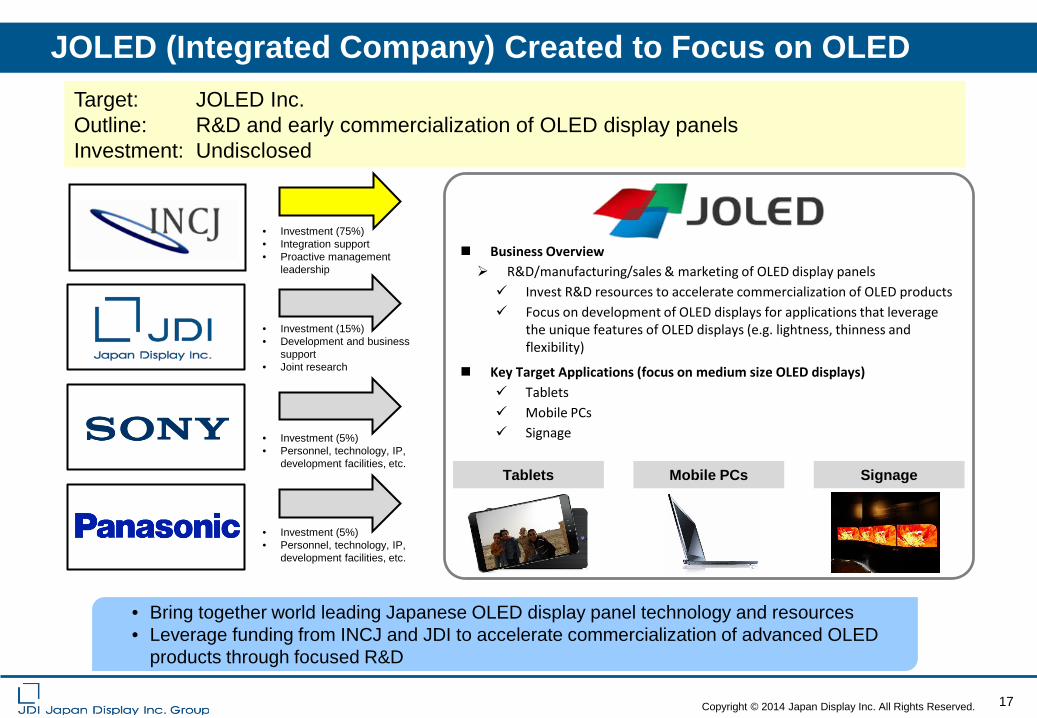
JOLED (Integrated Company) Created to Focus on OLED
Business Overview R&D/manufacturing/sales & marketing of OLED display panels Invest R&D resources to accelerate commercialization of OLED products Focus on development of OLED displays for applications that leverage
the unique features of OLED displays (e.g. lightness, thinness and flexibility)
Key Target Applications (focus on medium size OLED displays) Tablets Mobile PCs Signage
JDIロゴ
Target: JOLED Inc. Outline: R&D and early commercialization of OLED display panels Investment: Undisclosed
• Bring together world leading Japanese OLED display panel technology and resources • Leverage funding from INCJ and JDI to accelerate commercialization of advanced OLED
products through focused R&D
• Investment (75%) • Integration support • Proactive management
leadership
Tablets Mobile PCs Signage
• Investment (15%) • Development and business
support • Joint research
• Investment (5%) • Personnel, technology, IP,
development facilities, etc.
• Investment (5%) • Personnel, technology, IP,
development facilities, etc.
18 Copyright © 2014 Japan Display Inc. All Rights Reserved.
Purpose of Investment in JOLED
Comment by Shuichi Otsuka, President and CEO:
OLED presents considerable technological challenges, including difficulties in developing materials and manufacturing equipment. However, we believe this display technology contains substantial advantages for the future with respect to thinness, lightness and flexibility. Given these exciting possibilities, JDI has decided to invest in JOLED.
JOLED will centralize the world-leading OLED display technologies and resources developed over many years by Sony and Panasonic, including printing technology for OLED production, transparent amorphous oxide semiconductors, and flexible display technology. By creating a strong working relationship with JOLED, JDI will explore opportunities for development of applications that will lead to greater lightness and thinness for medium-sized displays for tablet PCs and notebook PCs, and digital signage.
Our investment in JOLED does not affect our ongoing business strategy for creating a high-resolution "LTPS World" in the small and medium-sized display market. Furthermore, our high-resolution OLED, sheet display and other development plans have not changed and will continue. In fact, we aim to accelerate our overall R&D by creating a synergy with JOLED.
(Excerpted from JDI’s July 31 press release)
19 Copyright © 2014 Japan Display Inc. All Rights Reserved.
Forward Looking-Statement: Any information related to market trends or industries mentioned in this document is based on information available at present and JDI does not guarantee that this information is accurate or complete. Any plan, estimation, calculation, quotation, evaluation, prediction, expectation or other forward-looking information in this document is based on the current assumptions and beliefs of JDI in light of the information currently available to it, and involves known and unknown risks, uncertainties, and other factors. Such risks, uncertainties and other factors may cause JDI’s actual results, performance, achievements or financial position to be materially different from any future results, performance, achievements or financial position expressed or implied by such forward-looking information. Such risks, uncertainties and other factors include, without limitation: economic conditions and individual consumption trends in Japan and overseas, currency exchange rate movements, trends in the market for smartphones and other electronic equipment, the management policies of our major business partners and fluctuations in the price of raw materials.


![World - SHINRYO · 2020. 3. 9. · 0 FY 2010 FY 2011 FY 2012 FY 2014FY 2013 [Million yen] Ù Consolidated y Ù Non-Consolidated. Table of Contents. 3 Message from the President 7](https://img.pdfslide.net/doc/110x75/611015f7d94d89120c107f76/world-shinryo-2020-3-9-0-fy-2010-fy-2011-fy-2012-fy-2014fy-2013-million.jpg)